Appendix E Geotechnical Investigation

Welcome message from author
This document is posted to help you gain knowledge. Please leave a comment to let me know what you think about it! Share it to your friends and learn new things together.
Transcript

Appendix E Geotechnical Investigation

Terraprobe Consulting Geotechnical & Environmental Engineering Construction Materials Inspection & Testing
Terraprobe Inc.Greater Toronto Hamilton – Niagara Central Ontario Northern Ontario 11 Indell Lane 903 Barton Street, Unit 22 220 Bayview Drive, Unit 25 1012 Kelly Lake Rd., Unit 1 Brampton, Ontario L6T 3Y3 Stoney Creek, Ontario L8E Barrie, Ontario L4N 4Y8 Sudbury, Ontario P3E 5P4 (905) 796-2650 Fax: 796-2250 (905) 643-7560 Fax: 643-7559 (705) 739-8355 Fax: 739-8369 (705) 670-0460 Fax: 670-0558
www.terraprobe.ca
GEOTECHNICAL INVESTIGATION
TANNERY AND WATERWORKS PARKS SHORELINE IMPROVEMENTS
OAKVILLE, ONTARIO Prepared for: Shoreplan Engineering Limited 55 Eglinton Avenue East, Suite 800 Toronto, Ontario M4P 1G8 Attention: Mr. Milo Sturm, P. Eng.
File No. 11-13-3179
May 20, 2014 ©Terraprobe Inc.
Distribution: 4 Copies - Shoreplan Engineering Limited 1 Copy - Terraprobe Inc., Brampton

Shoreplan Engineering Limited May 20, 2014
Tannery and W aterworks Parks, Oakville File No. 11-13-3179
TerraprobePage No. i
TABLE OF CONTENTS
1. INTRODUCTION . . . . . . . . . . . . . . . . . . . . . . . . . . . . . . . . . . . . . . . . . . . . . . . . . . . . . . . . . . . . 1
2. SITE AND PROJECT DESCRIPTION . . . . . . . . . . . . . . . . . . . . . . . . . . . . . . . . . . . . . . . . . . . . 1
3. FIELD PROCEDURE . . . . . . . . . . . . . . . . . . . . . . . . . . . . . . . . . . . . . . . . . . . . . . . . . . . . . . . . . . 2
4. SUBSURFACE CONDITIONS . . . . . . . . . . . . . . . . . . . . . . . . . . . . . . . . . . . . . . . . . . . . . . . . . . 34.1 Topsoil . . . . . . . . . . . . . . . . . . . . . . . . . . . . . . . . . . . . . . . . . . . . . . . . . . . . . . . . . . . . . . . 34.2 Earth Fill . . . . . . . . . . . . . . . . . . . . . . . . . . . . . . . . . . . . . . . . . . . . . . . . . . . . . . . . . . . . . 44.3 Native Soils . . . . . . . . . . . . . . . . . . . . . . . . . . . . . . . . . . . . . . . . . . . . . . . . . . . . . . . . . . . 44.4 Geotechnical Laboratory Test Results . . . . . . . . . . . . . . . . . . . . . . . . . . . . . . . . . . . . . . . 54.5 Ground Water . . . . . . . . . . . . . . . . . . . . . . . . . . . . . . . . . . . . . . . . . . . . . . . . . . . . . . . . . 7
5. DISCUSSION AND RECOMMENDATIONS . . . . . . . . . . . . . . . . . . . . . . . . . . . . . . . . . . . . . . 85.1 Slope Inspection and Mapping . . . . . . . . . . . . . . . . . . . . . . . . . . . . . . . . . . . . . . . . . . . . 85.2 Slope Stability Analysis . . . . . . . . . . . . . . . . . . . . . . . . . . . . . . . . . . . . . . . . . . . . . . . . . . 95.3 Erosion Risks . . . . . . . . . . . . . . . . . . . . . . . . . . . . . . . . . . . . . . . . . . . . . . . . . . . . . . . . . 135.4 Overlook Feature Foundation . . . . . . . . . . . . . . . . . . . . . . . . . . . . . . . . . . . . . . . . . . . . 13
6. SUMMARY . . . . . . . . . . . . . . . . . . . . . . . . . . . . . . . . . . . . . . . . . . . . . . . . . . . . . . . . . . . . . . . . 14
7. LIMITATIONS AND USE OF REPORT . . . . . . . . . . . . . . . . . . . . . . . . . . . . . . . . . . . . . . . . . 15
APPENDIXAbbreviations, Terminology and General InformationBorehole LogsSieve and Hydrometer AnalysisAtterberg Limits Test ResultsFigure 1 - Site Location PlanFigure 2 - Borehole Location and Site Features PlanFigures 3A to 3C - Slope Cross SectionsSlope Stability Analysis ResultsPhotographsInformation on Helical Pier® Foundation System

Shoreplan Engineering Limited May 20, 2014
Tannery and W aterworks Parks, Oakville File No. 11-13-3179
TerraprobePage No. 1
1. INTRODUCTION
Terraprobe Inc. was retained by Shoreplan Engineering Limited to conduct a geotechnical slope stability
investigation for the shoreline improvement works along the Tannery and Waterworks Parks located in the
Town of Oakville, Ontario. The concept plan for the revitalization of this area would primarily include
stabilization and rehabilitation of the existing shoreline protection measures, as well as improvement to the
existing and construction of a new water front trail section behind (north) the existing shoreline protection
works within Tannery Park, starting from the east-end of the site (west shore of Oakville Harbour) and
extending approximately to the west-end of Tannery Park. The new waterfront trail construction would also
include one overlook feature which would be located behind the shoreline protection works near the west-end
of Tannery Park below the existing wooden staircase.
This report encompasses the geotechnical slope stability investigation of the subject slope located along
Tannery Park West and Walker Street Promenade shoreline to determine the prevailing subsurface soil and
shallow ground water conditions, a detailed visual slope inspection to review the existing slope conditions
within the study area, and a detailed slope stability analysis. Based on the results of the investigation, review
and detailed analysis, this report provides geotechnical engineering recommendations pertaining to the long-
term stability of the subject slope as well as geotechnical design recommendations for the construction of
the proposed outlook feature (structure).
2. SITE AND PROJECT DESCRIPTION
The site is located south of Walker Street, between Oakville Harbour and Kerr Street, in the Town of
Oakville, Ontario. The study area consists of a shoreline slope located along Lake Ontario between Oakville
Harbour and Kerr Street, and is approximately 500 m long. The general location of the site is shown on
Figure 1. For the purpose of site description, Lakeshore Road is assumed to be oriented in an east-west
direction.
The existing shoreline protection at Tannery Park consists of rubble and an irregularly placed (and/or
damaged armourstone wall (revetment) along the base of a high bank, while the existing shoreline protection
for Waterworks Park consists of mostly dumped rubble fronting with an eroding relatively low-height bank.
There is also a small stone beach deposit towards the west-end of the site. A storm sewer outlet is located
at the west-end of Tannery Park that would eventually be at risk if shoreline stabilization and rehabilitation
works are not carried out. There is a walk/path (Waterfront Trail) that runs across the site located behind
the shoreline at the east-end and along the top of the shoreline slope as it extends west towards Walker Street
Promenade (Reach 2), as shown on Figure 2. A few residential houses are situated on the tableland on the
south side of Walker Street between the Wilson Street and Chisholm Street.

Shoreplan Engineering Limited May 20, 2014
Tannery and W aterworks Parks, Oakville File No. 11-13-3179
TerraprobePage No. 2
Based on the information provided by the client, it is understood that the project would include stabilization
and rehabilitation works for the shoreline (along the Tannery and Waterworks Parks) and improvement to
existing pathway/trail as well as construction of a new water front trail section behind (north) the shoreline
protection works within Tannery Park from the east-end of the site (west-shore of Oakville Harbour) and
extending approximately to the west-end of Tannery Park. The new water front trail works would also
include construction of an overlook feature behind the shoreline protection works near the west end of
Tannery Park below the existing wooden staircase.
A geotechnical investigation of the potential stability and shoreline erosion risks to the shoreline slope within
the study area was therefore carried out to provide geotechnical design recommendations and guidance for
the shoreline improvements and the trail design.
3. FIELD PROCEDURE
The field investigation was conducted on December 3 and 4, 2013 and consisted of drilling and sampling of
four (4) exploratory boreholes extending to depths varying from about 4.5 m (Borehole 4) to 12.0 m
(Borehole 1) below existing ground surface. Boreholes 1 to 3 were advanced on the tableland in a relatively
close proximity of the slope crest, while Borehole 4 was advanced at the bottom of the slope near the
shoreline at the proposed lookout feature footprint. The approximate location of the boreholes are presented
on Figure 2.
The boreholes were staked out in the field by Terraprobe. Various public utility agencies and a private utility
locate subcontractor were contacted to clear the borehole locations of possible buried utilities prior to
drilling.
The boreholes were drilled by a specialist drilling contractor using a small/compact drill rig (Mini Mole) with
power auger. The boreholes were advanced using continuous flight solid stem auger, and were sampled
generally at 0.75 m and 1.5 m intervals with a conventional 50 mm diameter split barrel sampler when the
Standard Penetration Test (SPT) was carried out (ASTM D 1586). The field work (drilling, sampling and
testing) was observed and recorded by a member of our field engineering staff, who logged the borings and
examined the samples as they were obtained.
All samples obtained during the investigation were sealed into clean plastic jars and transported to our
laboratory for detailed inspection and testing. Samples were examined (tactile) in detail by a geotechnical
engineer, and classified according to visual and index properties. Laboratory testing consisted of water
content determination on all samples; a Sieve and Hydrometer analysis on nine (9) selected soil samples
(Borehole 1, Samples 5, 13 and 15B; Borehole 2, Samples 4 and 8; Borehole 3, Samples 4 and 8; and

Shoreplan Engineering Limited May 20, 2014
Tannery and W aterworks Parks, Oakville File No. 11-13-3179
TerraprobePage No. 3
Borehole 4, Samples 3 and 5), and Atterberg Limit tests on six (6) selected soil samples (Borehole 1, Samples
5 and 15B; Borehole 2, Samples 4 and 8; Borehole 3, Sample 8 and Borehole 4, Sample 3). The measured
natural water contents of individual samples and the results of the Sieve and Hydrometer analysis and
Atterberg Limits tets are plotted on the enclosed borehole logs at respective sampling depths. The laboratory
test results are also summarized in Section 4.4 of this report, and appended.
Unstabilized water levels were monitored in the open boreholes upon completion of drilling. Piezometer
consisting of 25 mm diameter PVC tubing was installed in each borehole to facilitate shallow ground water
monitoring. The details of the piezometers are shown on the enclosed borehole logs. Water levels were also
measured in the piezometers on January 6, 2014, about five weeks following the subsurface investigation.
The results of the ground water monitoring are summarized in Section 4.5 of this report.
The borehole ground surface elevations were estimated from the topographic survey (prepared by J. H.
Gelbloom Surveying Limited, O.L.S., Project No. 07-103, received on February 4, 2014) provided by the
client . It should be noted that the borehole elevations noted on the borehole logs are approximate, and
provided only for the purpose of relating borehole soil stratigraphy. This information should not be used or
relied on for other purposes.
4. SUBSURFACE CONDITIONS
The results of the boreholes are summarized below and recorded on the accompanying Borehole Logs. This
summary is intended to correlate this data to assist in the interpretation of the subsurface conditions
encountered at the site.
It should be noted that the soil conditions are confirmed at the borehole locations only and may vary between
and beyond the borehole locations. The stratigraphic boundaries as shown on the logs represent an inferred
transition between the various strata, rather than a precise plane of geologic change.
In summary, the boreholes encountered a surficial layer of topsoil underlain by a zone of earth fill materials
which was in turn underlain by undisturbed native soil deposit extending to the full depth of investigation
at all borehole locations.
4.1 Topsoil
A surficial layer of topsoil was encountered at all borehole locations, varying in thickness from about 75 mm
(Borehole 2) to 150 mm (Borehole 3). The topsoil was dark brown to black in colour and predominantly
consisted of a clayey silt matrix.

Shoreplan Engineering Limited May 20, 2014
Tannery and W aterworks Parks, Oakville File No. 11-13-3179
TerraprobePage No. 4
It must be noted that the topsoil thickness is confirmed at the borehole locations only, and may vary between
and beyond the boreholes. Further, this information may not be sufficient for estimating topsoil quantities
present across the site.
4.2 Earth Fill
Earth fill materials were encountered at all boreholes beneath the surficial topsoil layer. The composition
of earth fill materials varied across the site from clayey silt, some sand to sandy with trace amounts of gravel;
to sand, some silt to silty with trace to some amounts of gravel and clay. Sporadic and intermittent organic
staining was observed within the earth fill materials in Boreholes 1, 2 and 4 at varying depths. Trace
amounts of ash and cinders were also noted in the earth fill materials in Borehole 1 at a depth of about 8.2
m below existing grade.
The Standard Penetration Test results (‘N’ Values) obtained from earth fill materials varied from 5 to 50
blows per 300 mm of penetration, indicating a loose to dense relative density (cohesionless soils) and a firm
to very stiff consistency (cohesive soils).
The measured moisture contents of the earth fill materials ranged from 8 to 25 percent by weight, indicating
a generally moist to locally wet condition.
4.3 Native Soils
The earth fill materials were underlain by undisturbed native soil deposit in all boreholes. In Boreholes 2,
3 and 4, a layer of cohesionless soil deposit was encountered underlying the earth fill materials which
extended to a depth of about 7.6 m (Borehole 3) to the full depth of investigation in Boreholes 2 and 4 (about
8.7 m and 4.5 m below grade, respectively). The composition of the cohesionless deposit varied from silt
with trace to some sand and trace to some clay, to sand with trace to some silt and trace amounts of clay and
gravel. Underlying the earth fill materials in Borehole 1 (at about 10.9 m below grade) and the cohesionless
deposit in Borehole 3 (at about 7.6 m below grade), a glacial till deposit was encountered. The glacial till
consisted of a cohesive clayey silt to silt and clay matrix with embedded sand and gravel particles, and
extended to the full depth of investigation (up to about 12.0 m depth below grade).
The Standard Penetration Test results (‘N’ Values) obtained from the undisturbed native soil samples varied
from 17 to 60 blows per 300 mm of penetration, and 50 blows per 15 to 100 mm of penetration, indicating
a compact to very dense relative density (cohesionless soils) and a very stiff to hard consistency (cohesive
soils).

Shoreplan Engineering Limited May 20, 2014
Tannery and W aterworks Parks, Oakville File No. 11-13-3179
TerraprobePage No. 5
The measured moisture contents of the undisturbed native soil samples ranged from 1 to 25 percent by
weight, indicating a damp to moist and locally wet condition.
Numerous shale fragments and auger refusal were encountered at deeper depth in all boreholes which may
be indicative of the presence of bedrock of Georgian Bay Formation at depths varying from about 4.5 m
(Borehole 4) to 12.0 m (Borehole 1) below existing grade. It should be noted that the bedrock confirmation
through rock coring was not included in the scope of our work.
The bedrock of the Georgian Bay Formation, typically found in the general area, is a deposit predominantly
comprising thin to medium bedded blue-grey shale of Upper Ordovician age. The bedrock contains interbeds
of grey calcareous shale, limestone/dolostone and calcareous sandstone which are discontinuous and
nominally 50 to 300 mm thick.
The augered borehole method used at this site is conventionally accepted investigative practice. However,
the augering and interval sampling method does not define the bedrock surface with precision, particularly
where the surface of the rock is weathered, weaker and easily penetrated by the auger. The auger
refusal/spoon bouncing is generally indicative of a presence of a relatively less weathered/sound shale and/or
limestone/dolostone layers. The inferred bedrock depth/elevations at the borehole locations, as noted on the
borehole logs, were inferred from the borehole augering, auger grinding, spoon sampling/refusal and
bouncing, therefore actual bedrock surface elevations may vary from the inferred elevations noted on the
borehole logs.
4.4 Geotechnical Laboratory Test Results
The geotechnical laboratory testing consisted of water content determination on all samples, while a Sieve
and Hydrometer analysis was conducted on nine (9) selected soil samples. The measured natural water
contents of individual samples are plotted on the enclosed borehole logs at the respective sampling depths.
The results of the Sieve and Hydrometer (grain size) analysis are appended and noted on the borehole logs.
A summary of the Sieve and Hydrometer (grain size) analysis results is presented as follows:

Shoreplan Engineering Limited May 20, 2014
Tannery and W aterworks Parks, Oakville File No. 11-13-3179
TerraprobePage No. 6
Borehole No.Sample No.
SamplingDepth
below Grade
Percentage (By Weight)Description
(MIT Classification System)Gravel Sand Silt Clay
Borehole 1
Sample 53.3 m 6 32 36 26 CLAYEY SILT, sandy, trace gravel
Borehole 1
Sample 139.4 m 2 72 19 7
SAND, some silt, trace clay, trace
gravel
Borehole 1
Sample 15B10.9 m 14 23 40 23 CLAYEY SILT, sandy, some gravel
Borehole 2
Sample 42.5 m 2 24 41 33 CLAYEY SILT, sandy, trace gravel
Borehole 2
Sample 85.6 m 0 11 73 16 SILT, some clay, some sand
Borehole 3
Sample 42.5 m 3 83 14 SAND, some silt, trace gravel
Borehole 3
Sample 87.8 m 0 2 52 46 SILT AND CLAY, trace sand
Borehole 4
Sample 31.8 m 10 20 43 27
CLAYEY SILT, some sand, trace
gravel
Borehole 4
Sample 53.3 m 0 70 19 11 SAND, some silt, some clay
Atterbergs Limits Tests were also carried out on six (6) selected soil samples. The results were plotted on
A-Line Graph (refer to enclosed Figures, Atterbergs Limits Test Results) and are summarized as follows:
Borehole No.Sample No.
SamplingDepthbelowGrade
LiquidLimit
(Wl) %
PlasticLimit
(Wp) %
PlasticityIndex(Ip) %
NaturalWater
Content(Wn) %
Description
Borehole 1
Sample 53.3 m 27 17 10 17 Slightly Plastic
Borehole 1
Sample 15B10.9 m 24 15 9 11 Slightly Plastic
Borehole 2
Sample 42.5 m 37 23 14 25 Slightly Plastic
Borehole 2
Sample 85.6 m 20 16 4 14
Slightly Plastic/Slight or LowCompressibility

Shoreplan Engineering Limited May 20, 2014
Tannery and W aterworks Parks, Oakville File No. 11-13-3179
Borehole No.Sample No.
SamplingDepthbelowGrade
LiquidLimit
(Wl) %
PlasticLimit
(Wp) %
PlasticityIndex(Ip) %
NaturalWater
Content(Wn) %
Description
TerraprobePage No. 7
Borehole 3Sample 8
7.8 m 32 18 14 25 Slightly Plastic
Borehole 4Sample 3
1.8 m 29 18 11 17 Slightly Plastic
4.5 Ground Water
The depth of ground water was measured in the open boreholes upon completion of drilling. Water levels
were also measured in the standpipe piezometers on January 6, 2014 installed in the boreholes, about five
weeks following the field investigation. The water level measurements taken in the open boreholes during
the field investigation and in the standpipe piezometers during our subsequent site visit are summarized as
follows:
BoreholeNo.
Depth ofBoring below
Grade
Depth to Cavebelow Grade
Water Level at theTime of Drilling
below Grade
Water Level in Piezometerbelow Grade / Elevation
on January 6, 2014
1 12.0 m open 11.3 m 11.1 / 74.7 m
2 8.7 m open dry 5.3 / 79.0 m
3 8.6 m open dry 7.6 / 77.0 m
4 4.5 m open 3.4 m 3.4 / 74.9 m
It should be noted that the ground water level may fluctuate seasonally depending on the amount of
precipitation, surface runoff and lake water level.

Shoreplan Engineering Limited May 20, 2014
Tannery and W aterworks Parks, Oakville File No. 11-13-3179
TerraprobePage No. 8
5. DISCUSSION AND RECOMMENDATIONS
The following discussion and recommendations are based on the factual data obtained from this investigation
and are intended for the use of the owner and the design engineer. Contractors bidding or providing services
on this project should review the factual data and determine their own conclusions regarding construction
methods and scheduling.
This report is provided on the basis of these terms of reference and on the assumption that the design features
relevant to the geotechnical analyses will be in accordance with applicable codes, standards and guidelines
of practice. If there are any changes to the site development features, or there is any additional information
relevant to the interpretations made of the subsurface information with respect to the geotechnical analyses
or other recommendations, then Terraprobe should be retained to review the implications of these changes
with respect to the contents of this report.
5.1 Slope Inspection and Mapping
A visual inspection of the slope area was conducted on November 13, 2013. General information pertaining
to the existing slope features such as slope profile, slope drainage, watercourse features, vegetation cover,
structures in the vicinity of the slope, erosion features and slope slide features, was obtained during this
inspection. A brief summary of the results of the visual inspection is presented below. Photographs taken
during the inspection are appended. The general location of the site features and photographs are shown on
the Borehole Location and Site Features Plan (Figure 2).
Topographic data of the site (prepared by J. H. Gelbloom Surveying Limited, OLS, Project No. 07-103,
received on February 4, 2014) was provided by the client and is enclosed (Figure 2). A total of six (6) cross
sections (Sections A-A’ to F-F’), were inferred from the topographic information provided and our field
observations to prepare slope models for the long-term slope stability analysis. The cross-sections were
selected on the basis of the slope height and inclination to represent the critical slope conditions present
within the study area. The sections included a portion of the tableland extending across the slope down to
the shoreline of Lake Ontario. The location of the selected slope cross-sections are presented on Figure 2,
and the details of the slope profiles are presented on Figures 3A to 3C.
The slope inclination within the study area varies from about 1.5 to 2.0 horizontal to 1.0 vertical with
localized steeper or flatter areas. The slope height varies from about 4 to 9 m within the study area. The
slope was noted to be generally vegetated with grass, weeds, shrubs and numerous young and mature trees
except for the easterly portion of the slope (Borehole 1) where the slope vegetation predominantly consisted
grass, weed and bushes. Although a few bent, leaning and fallen trees were noted, the tree trunk growth of
the majority of the trees was generally straight and upright. Exposed root mass and trunk base creep was also

Shoreplan Engineering Limited May 20, 2014
Tannery and W aterworks Parks, Oakville File No. 11-13-3179
TerraprobePage No. 9
noted at a few locations. There were no obvious signs of any recent slope instability such as tension cracks,
slump or scarp zones. Further, there was no evidence of surface or rill erosion, as the slope generally
included a vegetation cover with a few patchy bare areas.
There is an existing network of pathways traversing along both Waterworks and Tannery Parks. The
pathway within Waterworks Park runs in a east-west direction within the lower terrace of the shoreline, and
primarily on the tableland within Tannery Park. These two sections of the pathways are connected by a
wooden stairway situated on the slope near the west-end of Tannery Park, providing the access form the
upper pathway at Tannery Park to the lower pathway at Waterworks Park. Another walkway starting from
Walker Street, runs in a roughly north-south direction approximately through the middle of Tannery Park
and extends across the slope down to the parking lot situated at the southeast portion of the site. The
tableland between the Waterworks and Tannery Parks also includes private properties consisting of
townhouses fronting on Walker Street.
Base on the information provided by the client, the shoreline is divided into four Reaches (Reaches 1 to 4)
within the study area. Reach 1 is identified from the west-end of the site to close to Wilson Street
(Waterworks Park), the shoreline portion roughly between Wilson Street and Chisholm Street is identified
as Reach 2 (Walker Street Promenade), the shoreline across from Chisholm Street to close to the west-end
of the parking lot area is identified as Reach 3 (Tannery Park West), while the shoreline from the west-end
of the parking lot to the east-end of the site (west shore of Oakville Harbour) is identified as Reach 4
(Tannery Park East). The shoreline at Reach 1 (Waterworks Park) consists of dumped rubble (rocks and
concrete pieces), while at Reach 2 (Walker Street Promenade) and west half of Reach 3 (Tannery Park West)
it consists of armourstone revetment, while the east half of Reach 3 (Tannery Park West) and Reach 4
(Tannery Park East) the shoreline erosion protection measure primarily consists of rubble.
In general, there were no obvious signs of recent slope instability (bulges, tension cracks etc.), slope slide
or erosion features (rills, gullies etc.) within the study area. Although the slope at locations appeared to be
relatively steep but, in general, the slope overall appeared to be stable.
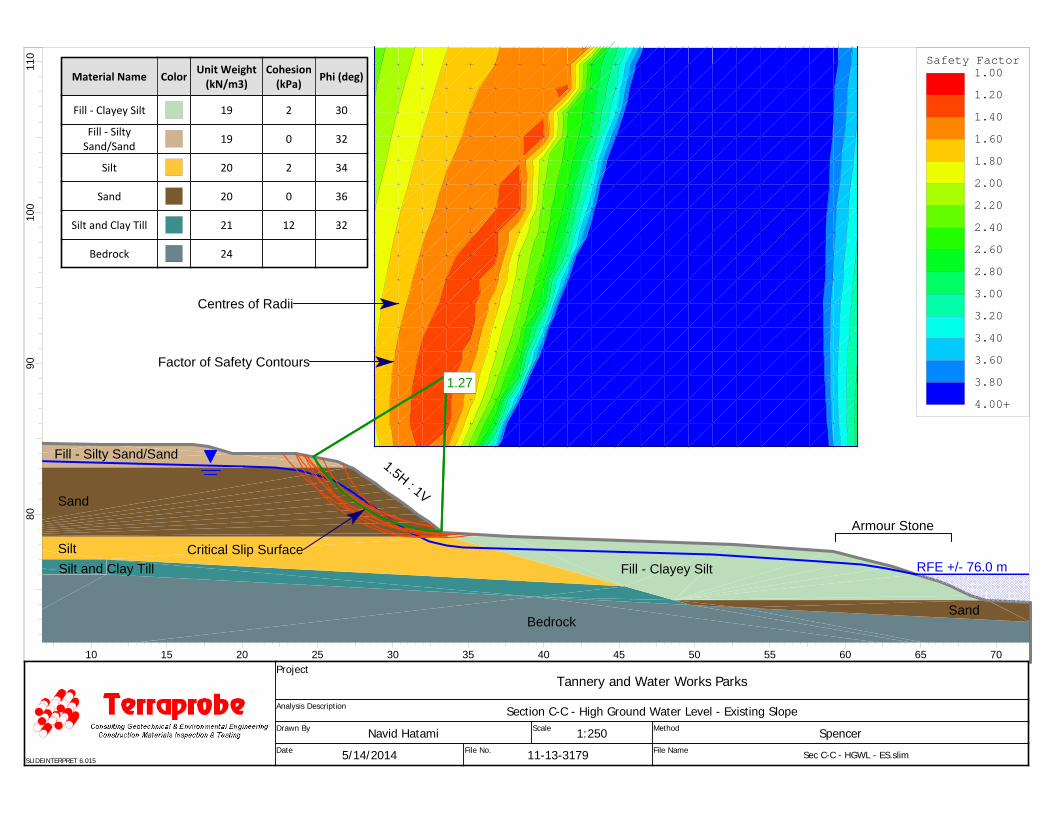
5.2 Slope Stability Analysis
A detailed engineering analysis of slope stability was carried out for the selected slope cross-sections
utilizing computer software SLIDE (version 6.0), developed by Rocscience Inc. The slope stability analyses
were based on an effective stress limit equilibrium analysis for long-term slope stability using Morgenstern-
Price, Spencer, Bishop and Janbu methods. These methods of analysis allow the calculation of Factors of
Safety for hypothetical or assumed failure surfaces through the slope. The analysis method is used to assess

Shoreplan Engineering Limited May 20, 2014
Tannery and W aterworks Parks, Oakville File No. 11-13-3179
TerraprobePage No. 10
potential for movements of large masses of soil over a specific failure surface which is often curved or
circular.
For a specific failure surface, the Factor of Safety is defined as the ratio of the available soil strength
resisting movement, divided by the gravitational forces tending to cause movement. The Factor of Safety
of 1.0 represents a "limiting equilibrium" condition where the slope is at a point of pending failure since the
soil resistance is equal to the forces tending to cause movement. The analysis involves dividing the sliding
mass into many thin slices and calculating the forces on each slice. The normal and shear forces acting on
the sides and base of each slice are calculated. It is an iterative process that converges on a solution. It is
usual to require a Factor of Safety greater than one (1) to ensure stability of the slope. The typical Factor
of Safety used for engineering design of slopes for stability ranges from about 1.3 to 1.5 for developments
situated close to the slope crest.
The analysis was carried out by preparing a model of the slope geometry and subsurface conditions and
analyzing numerous different failure surfaces through the slope in search of the minimum or critical Factor
of Safety for specific conditions. The pertinent data obtained from topographic mapping, slope profiles,
slope mapping, and the borehole information, were input for the slope stability analysis. Many calculations
were carried out to examine the Factors of Safety for varying depths for potential failure surfaces. A
graphical presentation of the results of the analysis is provided in the appendix section, and presents critical
slip surfaces and corresponding minimum factors of safety for potential slope slides. Based on the borehole
information and our experience, the following average soil properties were utilized for the soil strata in the
slope stability analysis:
StratumUnit Weight
(kN/m )3
Angle ofinternal friction
Cohesion(kPa)
Fill - Clayey 19 30° 2
Fill - Sandy 19 32° 0
Silt, trace to some clay 20 34° 2
Sand 20 36° 0
Clayey Silt/Silt and Clay Till 21 32° 12
The above soil strength parameters are based on effective stress analysis for long-term slope stability. It is
noted that the above soil parameters are conservative and actual site soils are stronger.

Shoreplan Engineering Limited May 20, 2014
Tannery and W aterworks Parks, Oakville File No. 11-13-3179
TerraprobePage No. 11
Unstabilized water levels were measured to be at depths of about 11.3 and 3.2 m below grade in Boreholes
1 and 4, while Boreholes 2 and 3 remained dry upon completion of drilling. The ground water levels
measured in the piezometers on January 6, 2013, were noted to be at about 3.4 m (Elev. 74.9 m) in Borehole
4 and to about 11.1m below grade (Elev. 74.7 m) in Borehole 1. The measured ground water level
observations were incorporated into the respective slope model for slope stability analysis.
The analysis was conducted for existing slope conditions for Sections C-C’, E-E’ and F-F’ for normal ground
water level (long-term). Conservatively, slope stability analysis was also conducted for the same sections
for elevated ground water level condition with assumed water level located to be within about 1 m of the
ground surface to model short-term, temporary and infrequent condition. The slope stability analysis results
are presented in the appendix, and are summarized below:
SectionAverage Slope Inclination
Type of Slope Slide
Minimum Factor of Safety forPotential Slope Slides
NormalGround Water
ElevatedGround Water
Section C-C’ 1.5 H : 1 V Overall Slope Slide 1.33 1.27
Section E-E’ 1.5 H : 1 V Overall Slope Slide 1.31 1.21
Section F-F’ 2.0 H : 1 V Overall Slope Slide 1.40 1.24
The computed minimum factors of safety for the analyzed sections ranged between 1.31 to 1.40 for normal,
and between 1.21 to 1.27 for elevated (short-term, temporary and infrequent) ground water conditions.
The proposed land use pertaining to the current study consists of trail construction and shoreline
improvement works which can be categorized as a “Light” land use, as per the following MNR Policy
Guidelines which allow a minimum Factor of Safety range of 1.2 to 1.3 for slope stability, as follows:

Shoreplan Engineering Limited May 20, 2014
Tannery and W aterworks Parks, Oakville File No. 11-13-3179
TerraprobePage No. 12
TYPE LAND-USESDESIGN MINIMUM
FACTOR OF SAFETY
APASSIVE: no buildings near slope; farm field, bush, forest, timberland, woods,
wasteland, badlands, tundra1.1
B
LIGHT: no habitable structures near slope; recreational parks, golf courses, buried
small utilities, tile beds, barns, garages, swimming pools, sheds, satellite dishes, dog
houses
1.2 to 1.3
C
ACTIVE: habitable or occupied structures near slopes; residential, commercial, and
industrial buildings, retaining walls, storage/warehousing of non-hazardous
substances
1.3 to 1.5
D
INFRASTRUCTURE and PUBLIC USE: public use structures and buildings (i.e.
hospitals, schools, stadiums), cemeteries, bridges, high voltage power transmission
lines, towers, storage/warehousing of hazardous materials, waste management
areas
1.4 to 1.5
The computed minimum factors of safety for the analyzed sections range between 1.31 to 1.40 for normal
ground water condition. Therefore, the minimum factors of safety obtained from the slope stability analysis,
for the sections analyzed, are considered adequate and acceptable in consideration of the MNR Guidelines
for “Light” land use.
In addition, the slope was also analyzed with an assumed (hypothetical) elevated ground water level
condition (water level assumed to be within about 1 m below ground surface), significantly higher than the
stabilized ground water level measured in the piezometers. Although the formation of this excessive high
pore water pressure (elevated water level) within the soils comprising the slope is unlikely, nevertheless, the
effect of this assumed elevated water level on the slope stability was analyzed to simulate short-term,
temporary and infrequent ground water level condition. The results of this analysis resulted in the minimum
factors of safety varying from 1.21 to 1.27 for the sections analyzed. For a short-term and temporary
condition, resulting from a potentially significantly high ground water, a minimum factor of safety of 1.2 is
recommended for “Light” land use. The computed factors of safety for sections analyzed meet and exceed
the recommended factor of safety of 1.2 for the short-term, temporary and elevated groundwater level
condition, and are considered adequate. Therefore, based on the slope stability analysis results, the site slope
is considered to be stable for both long-term and temporary/elevated ground water level conditions for the
intended “Light” land use.
We understand that the proposed shoreline improvement works would include construction of a section of
waterfront trail within Tannery Park, between the slope toe and the shoreline protection works, extending
from east-end of the site (west shore of Oakville Harbour) to the west-end of Tannery Park. The design
details of the proposed trail were not available at the time of preparing this report. We understand that the

Shoreplan Engineering Limited May 20, 2014
Tannery and W aterworks Parks, Oakville File No. 11-13-3179
TerraprobePage No. 13
proposed water front trail, especially within Reach 3 (Tannery Park West), would be situated close to the
slope due to space constraint between the shoreline protection works and the slope toe. It is recommended
that the proposed waterfront trail should be setback a minimum of 3 m from the slope crest and toe (as
applicable) for the safety of the trail users, to help protect against potential surficial soil slumping, and/or
potential tree/debris falls.
5.3 Erosion Risks
We understand that a coastal engineering assessment will be carried out as part of the detailed design of the
proposed works. Proper shoreline erosion protection measures will be incorporated and maintained in the
long-term along the waterline within the study area to prevent/minimize the shoreline erosion affecting the
subject slope toe.
Based on the above, it is our understanding that the slope toe will not be subjected to wave erosion and
therefore a toe erosion setback may not be applicable.
5.4 Overlook Feature Foundation
As noted before, the proposed water front trail works would also include construction of an overlook feature
which would be located west of Tannery Park below the existing wooden staircase. Borehole 4 was
advanced within the general area of the proposed overlook feature. This borehole encountered a surficial
layer of topsoil underlain by earth fill materials extending to a depth of about 4.0 m below the existing grade.
The composition of the earth materials varied with depth from clayey silt with some sand to sandy silt/sand.
The earth fill materials were inturn underlain by undisturbed native soil deposit comprising sand with some
silt, extending to the full depth of investigation (about 4.5 m below the existing grade) where the borehole
was terminated due to the auger refusal likely on probable/inferred bedrock.
The overlook feature can be supported on augered cast-in-situ concrete piles/caissons bearing onto the
underlying inferred bedrock. A net geotechnical reaction of 600 kPa at Serviceability Limit States (SLS) and
factored geotechnical resistance of 900 kPa at Ultimate Limit States (ULS) are recommended for the design
of augered cast-in-situ concrete piles supported on the underlying bedrock. It must be noted that the bedrock
depth at this location was not confirmed as the confirmation of the bedrock by rock coring was beyond the
scope of our works, and therefore, the depth of bedrock may vary from the estimated depth noted in the
borehole. It is recommended that all augered cast-in-situ concrete pile bases must be evaluated by a qualified
geotechnical engineer to ensure that they are founded on bedrock and the pile base subgrade conditions are
consistent with the design bearing pressure intended by the geotechnical engineer.

Shoreplan Engineering Limited May 20, 2014
Tannery and W aterworks Parks, Oakville File No. 11-13-3179
TerraprobePage No. 14
The cast-in-situ concrete piles are end bearing units and must be cleaned prior to concrete placement.
Excavation and installation of the caissons must conform to all applicable sections of the Occupational
Health and Safety Act. It must be ensured that all the foundations are provided with a minimum of 1.2 m
of soil cover for frost protection.
Consideration may also be given to support the proposed overlook feature structure on helical pier foundation
system (see enclosed information). Helical screw anchors can be drilled to sufficient depth in order to obtain
adequate resistance for required support. Screw anchors require little to no excavation and therefore, it is
generally a suitable foundation option where incompetent soils of significant thickness are present over the
deeper competent soils/bedrock, and the ground water levels are relatively high as well as excavation is
required through wet cohesionless soils for foundation construction. Helical screw anchors can be installed
with minimum ground disturbance.
There are specific companies which specialize in the helical screw anchor design and installation, and can
provide further information on the methodology, detailed design, installation and certification. The following
average soil strength parameters may be used for the site soils:
bulkSoil unit weight (( )
(kN/m )3
Angle of Internal Friction (N)
(degree)
Cohesion (c)
(kPa)
Fill - Clayey Silt 19 30 2
Fill - Silty Sand/Sand 19 32 0
Sand 20 36 0
Silt 20 34 2
Clayey Silt/Silt and Clay 21 32 12
6. SUMMARY
The borehole data indicates that the site slope consists of earth fill materials underlain by competent native
soil deposit. Based on the results of the slope stability analysis, the site slope is considered to be stable for
the proposed “Light” land use.
It is recommended that the proposed trail should be setback a minimum of 3 m from the slope crest and toe
(as applicable) for the safety of the trail users, to help protect against potential surficial soil slumping and/or
potential tree/debris falls.

Shoreplan Engineering Limited May 20, 2014
Tannery and W aterworks Parks, Oakville File No. 11-13-3179
TerraprobePage No. 15
The following general constraints on the redevelopment are recommended:
a) site development and construction activities should be conducted in a manner which do not
result in surface erosion of the slope. In particular, site grading and drainage should be
designed to prevent direct concentrated or channelized surface runoff from flowing directly
over the slope. Water drainage from road drainage/trail, and the like should not be permitted
to flow over the slope, but a minor sheet flow may be acceptable,
b) a healthy vegetative cover should be maintained on the slope. In order to promote vegetative
growth on the slope face, waste must not be discarded over the slope,
c) the configuration of the slope should not be altered without prior consultation with a
geotechnical engineer and approval from the concerned authorities. In particular, the slope
should not be steepened,
d) a temporary silt fence should be erected and maintained around the work area during
construction, and
e) all approvals and permits must be secured from concerned agencies prior to the site
construction.
It is recommended that the final site grading plan be reviewed by Terraprobe to ensure that they are
consistent with the above recommendations.
7. LIMITATIONS AND USE OF REPORT
It must be recognized that there are special risks whenever engineering or related disciplines are applied to
identify subsurface conditions. A comprehensive sampling and testing programme implemented in
accordance with the most stringent level of care may fail to detect certain conditions. Terraprobe has
assumed for the purposes of providing advice, that the conditions that exist between sampling points are
similar to those found at the sample locations. The conditions that Terraprobe has interpreted to exist
between sampling points can differ from those that actually exist. It must also be recognized that the passage
of time, natural occurrences, and direct or indirect human intervention at or near the site have the potential
to alter subsurface conditions.
The discussion and recommendations are based on the factual data obtained from the investigation and are
intended for use by the owner and its retained designers in the design phase of the project. Since the project

Shoreplan Engineering Limited May 20, 2014
Tannery and W aterworks Parks, Oakville File No. 11-13-3179
TerraprobePage No. 16
is still in the design stage, all aspects of the project relative to the subsurface conditions cannot be
anticipated. Terraprobe should review the design drawings and specifications prior to the construction. If
there are changes to the project scope and development features; the interpretations made of the subsurface
information, the geotechnical design parameters and comments relating to contractibility issues and quality
control may not be relevant to the revised project. Terraprobe should be retained to review the implications
of changes with respect to the contents of this report.
The investigation at this site was conceived and executed to provide information for project design and slope
stability analysis. It may not be possible to drill a sufficient number of boreholes or samples and report them
in a way that would provide all the subsurface information that could have an effect on construction costs,
techniques, equipment, and scheduling. Contractors bidding on or undertaking work on this project should
therefore, in this light, be directed to decide on their own investigations, as well as their own interpretations
of the factual investigation results. They should be cognizant of the risks implicit in subsurface investigation
activities so that they may draw their own conclusions as to how the subsurface conditions may affect them.
This report was prepared for the express use of Shoreplan Engineering Limited and its retained design
consultants. It is not for use by others. This report is copyright of Terraprobe Inc. and no part of this report
may be reproduced by any means, in any form, without the prior written permission of Terraprobe Inc. and
Shoreplan Engineering Limited who are the authorized users.
It is recognized that the regulatory agencies in their capacities as the planning and building authorities under
Provincial statues, will make use of, and rely upon this report, cognizant of the limitations thereof, both
expressed and implied.


APPENDIX
TERRAPROBE INC.

Terraprobe ABBREVIATIONS AND TERMINOLOGY
SAMPLING METHODS AS auger sample CORE cored sample DP direct push FV field vane GS grab sample SS split spoon ST shelby tube WS wash sample
PENETRATION RESISTANCE Standard Penetration Test (SPT) resistance ('N' values) is defined as the number of blows by a hammer weighing 63.6 kg (140 lb.) falling freely for a distance of 0.76 m (30 in.) required to advance a standard 50 mm (2 in.) diameter split spoon sampler for a distance of 0.3 m (12 in.). Dynamic Cone Test (DCT) resistance is defined as the number of blows by a hammer weighing 63.6 kg (140 lb.) falling freely for a distance of 0.76 m (30 in.) required to advance a conical steel point of 50 mm (2 in.) diameter and with 60° sides on 'A' size drill rods for a distance of 0.3 m (12 in.)."
COHESIONLESS SOILS
Compactness ‘N’ value
very loose < 4 loose 4 – 10 compact 10 – 30 dense 30 – 50 very dense > 50
COHESIVE SOILS
Consistency ‘N’ value Undrained Shear Strength (kPa)
very soft < 2 < 12 soft 2 – 4 12 – 25 firm 4 – 8 25 – 50 stiff 8 – 15 50 – 100 very stiff 15 – 30 100 – 200 hard > 30 > 200
COMPOSITION Term (e.g) % by weight
trace silt < 10 some silt 10 – 20 silty 20 – 35 sand and silt > 35
TESTS AND SYMBOLS
MH mechanical sieve and hydrometer analysis
w, wc water content
wL, LL liquid limit
wP, PL plastic limit
IP, PI plasticity index
k coefficient of permeability
γ soil unit weight, bulk
Gs specific gravity
φ’ internal friction angle
c’ effective cohesion
cu undrained shear strength
Unstabilized water level
1st water level measurement
2nd water level measurement
Most recent water level measurement
Undrained shear strength from field vane (with sensitivity)
Cc compression index
cv coefficient of consolidation
mv coefficient of compressibility
e void ratio
FIELD MOISTURE DESCRIPTIONS Damp refers to a soil sample that does not exhibit any observable pore water from field/hand inspection.
Moist refers to a soil sample that exhibits evidence of existing pore water (e.g. sample feels cool, cohesive soil is at plastic limit) but does not have visible pore water
Wet refers to a soil sample that has visible pore water

BOREHOLELOGS
TERRAPROBE INC.

SS
SS
SS
SS
SS
SS
SS
SS
SS
SS
SS
SS
SS
SS
1
2
3
4
5
6
7
8
9
10
11
12
13
14
spoon wet
6 32 36 26
2 72 19 7
8
7
13
14
11
9
14
12
17
20
21
50
23
28
78.27.6
77.68.2
100mm TOPSOIL
FILL, clayey silt, some sand to sandy,trace gravel, (sporadic organic staining),firm to very stiff, reddish brown, moist
FILL, sand and gravel, some silt,compact, reddish brown, wet
FILL, sand, some silt to silty, trace clay,trace to some gravel, trace organics,compact to dense, brown to dark brown,moist...trace ash, cinders
LiquidLimit
(continued next page)
Ele
vatio
n S
cale
(m)
85
84
83
82
81
80
79
78
77
76
Uns
tabi
lized
Wat
er L
evel
Typ
e
Dep
th S
cale
(m
)
0
1
2
3
4
5
6
7
8
9
10
Unconfined Pocket Penetrometer
Field Vane Lab VaneN
umbe
r
Undrained Shear Strength (kPa)
40 80 120 160
SOIL PROFILE
GROUND SURFACE
SAMPLES
PlasticLimit
Dynamic ConeNatural
Water Content
85.8
GRAIN SIZEDISTRIBUTION (%)
(MIT)
Moisture / Plasticity
10 20 30
PL LLMC
Lab Dataand
Comments
SP
T 'N
' Val
ue
Inst
rum
ent
Det
ails
Gra
phic
Log
ElevDepth
(m)Description
Hea
dspa
ceV
apou
r
SAGR SI CL
Project No.:
Date started :
Sheet No. :
Shoreplan Engineering Ltd.
Tannery and Waterworks Parks
Oakville, Ontario
Drilling Method : Solid stem augers
Position : E: 607836, N: 4810548 (UTM 17T)
Rig type : MINI MOLE
11-13-3179
December 3, 2013
1 of 2
Client :
Project :
Location :
Elevation Datum : Geodetic
LOG OF BOREHOLE 1li
bra
ry:
libra
ry -
ter
rapr
obe
gint
.glb
re
po
rt:
terr
apro
be s
oil l
og
file
: 11
-13-
3179
bh
logs
.gpj
Terraprobe
Penetration Test Values(Blows / 0.3m)
10 20 30 40

SS
SS
SS
SS
14
15A
15B
16
17
WATER LEVEL READINGSDate Water Depth (m) Elevation (m)
Jan 6, 2014 11.1 74.7
14 23 40 23
auger grinding veryhard
spoon wet
auger grinding veryhard
spoon bouncing
28
79 /200mm
50 /100mm
50 /15mm
74.910.9
73.812.0
FILL, sand, some silt to silty, trace clay,trace to some gravel, trace organics,compact to dense, brown to dark brown,moist (continued)
CLAYEY SILT, some sand to sandy,trace to some gravel, shale fragments,hard, grey, damp to moist(GLACIAL TILL)
END OF BOREHOLEAuger refusal on inferred bedrock
Unstabilized water level measured at11.3 m below ground surface; boreholewas open upon completion of drilling.
25 mm piezometer installed.
LiquidLimit
Ele
vatio
n S
cale
(m)
75
74
Uns
tabi
lized
Wat
er L
evel
Typ
e
Dep
th S
cale
(m
)
11
12
Unconfined Pocket Penetrometer
Field Vane Lab VaneN
umbe
r
Undrained Shear Strength (kPa)
40 80 120 160
SOIL PROFILE
(continued)
SAMPLES
PlasticLimit
Dynamic ConeNatural
Water Content
GRAIN SIZEDISTRIBUTION (%)
(MIT)
Moisture / Plasticity
10 20 30
PL LLMC
Lab Dataand
Comments
SP
T 'N
' Val
ue
Inst
rum
ent
Det
ails
Gra
phic
Log
ElevDepth
(m)Description
Hea
dspa
ceV
apou
r
SAGR SI CL
Project No.:
Date started :
Sheet No. :
Shoreplan Engineering Ltd.
Tannery and Waterworks Parks
Oakville, Ontario
Drilling Method : Solid stem augers
Position : E: 607836, N: 4810548 (UTM 17T)
Rig type : MINI MOLE
11-13-3179
December 3, 2013
2 of 2
Client :
Project :
Location :
Elevation Datum : Geodetic
LOG OF BOREHOLE 1li
bra
ry:
libra
ry -
ter
rapr
obe
gint
.glb
re
po
rt:
terr
apro
be s
oil l
og
file
: 11
-13-
3179
bh
logs
.gpj
Terraprobe
Penetration Test Values(Blows / 0.3m)
10 20 30 40

SS
SS
SS
SS
SS
SS
SS
SS
SS
SS
SS
1
2
3
4
5
6
7
8
9
10
11
WATER LEVEL READINGSDate Water Depth (m) Elevation (m)
Jan 6, 2014 5.3 79.0
auger grinding
2 24 41 33
0 11 73 16
spoon bouncing,auger grinding,refusal
11
9
50 /75mm
10
14
26
19
17
40
33
50 /15mm
80.53.8
79.74.6
75.68.7
75mm TOPSOIL
FILL, clayey silt, some sand to sandy,trace gravel, (sporadic organic staining),stiff, brown, moist
...possible stone fragments
FILL, silty sand, with clay lumps,compact, brown, moist
SILT, trace to some clay, trace to somesand, trace gravel, compact to verydense, brown, moist
...sandy
...numerous shale fragments
END OF BOREHOLEAuger refusal on inferred bedrock
Borehole was dry and open uponcompletion of drilling.
25 mm piezometer installed.
LiquidLimit
Ele
vatio
n S
cale
(m)
84
83
82
81
80
79
78
77
76
Uns
tabi
lized
Wat
er L
evel
Typ
e
Dep
th S
cale
(m
)
0
1
2
3
4
5
6
7
8
Unconfined Pocket Penetrometer
Field Vane Lab VaneN
umbe
r
Undrained Shear Strength (kPa)
40 80 120 160
SOIL PROFILE
GROUND SURFACE
SAMPLES
PlasticLimit
Dynamic ConeNatural
Water Content
84.3
GRAIN SIZEDISTRIBUTION (%)
(MIT)
Moisture / Plasticity
10 20 30
PL LLMC
Lab Dataand
Comments
SP
T 'N
' Val
ue
Inst
rum
ent
Det
ails
Gra
phic
Log
ElevDepth
(m)Description
Hea
dspa
ceV
apou
r
SAGR SI CL
Project No.:
Date started :
Sheet No. :
Shoreplan Engineering Ltd.
Tannery and Waterworks Parks
Oakville, Ontario
Drilling Method : Solid stem augers
Position : E: 607772, N: 4810496 (UTM 17T)
Rig type : MINI MOLE
11-13-3179
December 3, 2013
1 of 1
Client :
Project :
Location :
Elevation Datum : Geodetic
LOG OF BOREHOLE 2li
bra
ry:
libra
ry -
ter
rapr
obe
gint
.glb
re
po
rt:
terr
apro
be s
oil l
og
file
: 11
-13-
3179
bh
logs
.gpj
Terraprobe
Penetration Test Values(Blows / 0.3m)
10 20 30 40

SS
SS
SS
SS
SS
SS
SS
SS
SS
1
2
3
4
5
6
7
8
9
WATER LEVEL READINGSDate Water Depth (m) Elevation (m)
Jan 6, 2014 7.6 77.0
3 83 (14)
spoon slightly wet
0 2 52 46
auger slightlygrinding, spoonbouncing
5
15
45
32
27
60
22
20
80 /25mm
84.40.2
83.11.5
78.56.1
77.07.6
76.08.6
150mm TOPSOIL
FILL, sand, some silt, loose to compact,brown, moist
SAND, trace to some silt, trace gravel,compact to very dense, brown, damp tomoist
...wet
SILT, some sand, some clay, compact,brown, moist
SILT AND CLAY, trace sand, very stiff,grey, moist(GLACIAL TILL)
...numerous shale fragments
END OF BOREHOLEAuger refusal on inferred bedrock
Borehole was dry and open uponcompletion of drilling.
25 mm piezometer installed.
LiquidLimit
Ele
vatio
n S
cale
(m)
84
83
82
81
80
79
78
77
Uns
tabi
lized
Wat
er L
evel
Typ
e
Dep
th S
cale
(m
)
0
1
2
3
4
5
6
7
8
Unconfined Pocket Penetrometer
Field Vane Lab VaneN
umbe
r
Undrained Shear Strength (kPa)
40 80 120 160
SOIL PROFILE
GROUND SURFACE
SAMPLES
PlasticLimit
Dynamic ConeNatural
Water Content
84.6
GRAIN SIZEDISTRIBUTION (%)
(MIT)
Moisture / Plasticity
10 20 30
PL LLMC
Lab Dataand
Comments
SP
T 'N
' Val
ue
Inst
rum
ent
Det
ails
Gra
phic
Log
ElevDepth
(m)Description
Hea
dspa
ceV
apou
r
SAGR SI CL
Project No.:
Date started :
Sheet No. :
Shoreplan Engineering Ltd.
Tannery and Waterworks Parks
Oakville, Ontario
Drilling Method : Solid stem augers
Position : E: 607703, N: 4810457 (UTM 17T)
Rig type : MINI MOLE
11-13-3179
December 4, 2013
1 of 1
Client :
Project :
Location :
Elevation Datum : Geodetic
LOG OF BOREHOLE 3li
bra
ry:
libra
ry -
ter
rapr
obe
gint
.glb
re
po
rt:
terr
apro
be s
oil l
og
file
: 11
-13-
3179
bh
logs
.gpj
Terraprobe
Penetration Test Values(Blows / 0.3m)
10 20 30 40

SS
SS
SS
SS
SS
SS
SS
1
2
3
4
5
6A
6B
7
WATER LEVEL READINGSDate Water Depth (m) Elevation (m)
Jan 6, 2014 3.4 74.9
10 20 43 27
0 70 19 11
spoon wet
spoon bouncing,auger refusal
8
11
8
13
12
44
100 /50mm
77.50.8
75.33.1
74.34.0
73.84.5
125mm TOPSOIL
FILL, clayey silt, sandy, trace gravel,stiff, brown, moist
FILL, clayey silt, some sand to sandy,trace gravel, (sporadic organic staining),stiff, brown, moist
FILL, sand, some silt to silty, trace tosome clay, compact, brown, moist to wet
...stone fragments
SAND, some silt, dense, brown, moist towet
...numerous shale fragments
END OF BOREHOLEAuger refusal on inferred bedrock
Unstabilized water level measured at 3.2m below ground surface; borehole wasopen upon completion of drilling.
25 mm piezometer installed.
LiquidLimit
Ele
vatio
n S
cale
(m)
78
77
76
75
74
Uns
tabi
lized
Wat
er L
evel
Typ
e
Dep
th S
cale
(m
)
0
1
2
3
4
Unconfined Pocket Penetrometer
Field Vane Lab VaneN
umbe
r
Undrained Shear Strength (kPa)
40 80 120 160
SOIL PROFILE
GROUND SURFACE
SAMPLES
PlasticLimit
Dynamic ConeNatural
Water Content
78.3
GRAIN SIZEDISTRIBUTION (%)
(MIT)
Moisture / Plasticity
10 20 30
PL LLMC
Lab Dataand
Comments
SP
T 'N
' Val
ue
Inst
rum
ent
Det
ails
Gra
phic
Log
ElevDepth
(m)Description
Hea
dspa
ceV
apou
r
SAGR SI CL
Project No.:
Date started :
Sheet No. :
Shoreplan Engineering Ltd.
Tannery and Waterworks Parks
Oakville, Ontario
Drilling Method : Solid stem augers
Position : E: 607715, N: 4810416 (UTM 17T)
Rig type : MINI MOLE
11-13-3179
December 4, 2013
1 of 1
Client :
Project :
Location :
Elevation Datum : Geodetic
LOG OF BOREHOLE 4li
bra
ry:
libra
ry -
ter
rapr
obe
gint
.glb
re
po
rt:
terr
apro
be s
oil l
og
file
: 11
-13-
3179
bh
logs
.gpj
Terraprobe
Penetration Test Values(Blows / 0.3m)
10 20 30 40

SIEVE ANDHYDROMETER
ANALYSIS
TERRAPROBE INC.

0
10
20
30
40
50
60
70
80
90
100
0.00010.0010.010.1110100
Percent R
etained (%
)
Grain Size (mm)
0
10
20
30
40
50
60
70
80
90
100
Gravel (%)Depth (m) Elev. (m)
MIT SYSTEM
Sand (%) Silt (%) Clay (%)SampleHole ID
Per
cent
Pas
sing
(%
)
(Fines, %)
SS5 3.3 82.5 6 32 36 261
MIT
SY
ST
EM SAND
CLAYSILT
2µm60µm2mm
COBBLESGRAVEL
COARSE MEDIUM FINE COARSE MEDIUM FINE
Title:
11-13-3179File No.:
Terraprobe11 Indell Lane, Brampton Ontario L6T 3Y3
(905) 796-2650
GRAIN SIZE DISTRIBUTION
CLAYEY SILT, SANDY, TRACE GRAVEL

0
10
20
30
40
50
60
70
80
90
100
0.00010.0010.010.1110100
Percent R
etained (%
)
Grain Size (mm)
0
10
20
30
40
50
60
70
80
90
100
Gravel (%)Depth (m) Elev. (m)
MIT SYSTEM
Sand (%) Silt (%) Clay (%)SampleHole ID
Per
cent
Pas
sing
(%
)
(Fines, %)
SS13 9.4 76.4 2 72 19 71
MIT
SY
ST
EM SAND
CLAYSILT
2µm60µm2mm
COBBLESGRAVEL
COARSE MEDIUM FINE COARSE MEDIUM FINE
Title:
11-13-3179File No.:
Terraprobe11 Indell Lane, Brampton Ontario L6T 3Y3
(905) 796-2650
GRAIN SIZE DISTRIBUTION
SAND, SOME SILT, TRACE CLAY, TRACE GRAVEL

0
10
20
30
40
50
60
70
80
90
100
0.00010.0010.010.1110100
Percent R
etained (%
)
Grain Size (mm)
0
10
20
30
40
50
60
70
80
90
100
Gravel (%)Depth (m) Elev. (m)
MIT SYSTEM
Sand (%) Silt (%) Clay (%)SampleHole ID
Per
cent
Pas
sing
(%
)
(Fines, %)
15B 10.9 74.9 14 23 40 231
MIT
SY
ST
EM SAND
CLAYSILT
2µm60µm2mm
COBBLESGRAVEL
COARSE MEDIUM FINE COARSE MEDIUM FINE
Title:
11-13-3179File No.:
Terraprobe11 Indell Lane, Brampton Ontario L6T 3Y3
(905) 796-2650
GRAIN SIZE DISTRIBUTION
CLAYEY SILT, SANDY, SOME GRAVEL

0
10
20
30
40
50
60
70
80
90
100
0.00010.0010.010.1110100
Percent R
etained (%
)
Grain Size (mm)
0
10
20
30
40
50
60
70
80
90
100
Gravel (%)Depth (m) Elev. (m)
MIT SYSTEM
Sand (%) Silt (%) Clay (%)SampleHole ID
Per
cent
Pas
sing
(%
)
(Fines, %)
SS4 2.5 81.8 2 24 41 332
MIT
SY
ST
EM SAND
CLAYSILT
2µm60µm2mm
COBBLESGRAVEL
COARSE MEDIUM FINE COARSE MEDIUM FINE
Title:
11-13-3179File No.:
Terraprobe11 Indell Lane, Brampton Ontario L6T 3Y3
(905) 796-2650
GRAIN SIZE DISTRIBUTION
CLAYEY SILT, SANDY, TRACE GRAVEL

0
10
20
30
40
50
60
70
80
90
100
0.00010.0010.010.1110100
Percent R
etained (%
)
Grain Size (mm)
0
10
20
30
40
50
60
70
80
90
100
Gravel (%)Depth (m) Elev. (m)
MIT SYSTEM
Sand (%) Silt (%) Clay (%)SampleHole ID
Per
cent
Pas
sing
(%
)
(Fines, %)
SS8 5.6 78.7 0 11 73 162
MIT
SY
ST
EM SAND
CLAYSILT
2µm60µm2mm
COBBLESGRAVEL
COARSE MEDIUM FINE COARSE MEDIUM FINE
Title:
11-13-3179File No.:
Terraprobe11 Indell Lane, Brampton Ontario L6T 3Y3
(905) 796-2650
GRAIN SIZE DISTRIBUTION
SILT, SOME CLAY, SOME SAND

0
10
20
30
40
50
60
70
80
90
100
0.00010.0010.010.1110100
Percent R
etained (%
)
Grain Size (mm)
0
10
20
30
40
50
60
70
80
90
100
Gravel (%)Depth (m) Elev. (m)
MIT SYSTEM
Sand (%) Silt (%) Clay (%)SampleHole ID
Per
cent
Pas
sing
(%
)
(Fines, %)
SS4 2.5 82.1 3 83 (14)3
MIT
SY
ST
EM SAND
CLAYSILT
2µm60µm2mm
COBBLESGRAVEL
COARSE MEDIUM FINE COARSE MEDIUM FINE
Title:
11-13-3179File No.:
Terraprobe11 Indell Lane, Brampton Ontario L6T 3Y3
(905) 796-2650
GRAIN SIZE DISTRIBUTION
SAND, SOME SILT,TRACE GRAVEL

0
10
20
30
40
50
60
70
80
90
100
0.00010.0010.010.1110100
Percent R
etained (%
)
Grain Size (mm)
0
10
20
30
40
50
60
70
80
90
100
Gravel (%)Depth (m) Elev. (m)
MIT SYSTEM
Sand (%) Silt (%) Clay (%)SampleHole ID
Per
cent
Pas
sing
(%
)
(Fines, %)
SS8 7.8 76.8 0 2 52 463
MIT
SY
ST
EM SAND
CLAYSILT
2µm60µm2mm
COBBLESGRAVEL
COARSE MEDIUM FINE COARSE MEDIUM FINE
Title:
11-13-3179File No.:
Terraprobe11 Indell Lane, Brampton Ontario L6T 3Y3
(905) 796-2650
GRAIN SIZE DISTRIBUTION
SILT AND CLAY, TRACE SAND

0
10
20
30
40
50
60
70
80
90
100
0.00010.0010.010.1110100
Percent R
etained (%
)
Grain Size (mm)
0
10
20
30
40
50
60
70
80
90
100
Gravel (%)Depth (m) Elev. (m)
MIT SYSTEM
Sand (%) Silt (%) Clay (%)SampleHole ID
Per
cent
Pas
sing
(%
)
(Fines, %)
SS3 1.8 76.5 10 20 43 274
MIT
SY
ST
EM SAND
CLAYSILT
2µm60µm2mm
COBBLESGRAVEL
COARSE MEDIUM FINE COARSE MEDIUM FINE
Title:
11-13-3179File No.:
Terraprobe11 Indell Lane, Brampton Ontario L6T 3Y3
(905) 796-2650
GRAIN SIZE DISTRIBUTION
CLAYEY SILT, SOME SAND, TRACE GRAVEL

0
10
20
30
40
50
60
70
80
90
100
0.00010.0010.010.1110100
Percent R
etained (%
)
Grain Size (mm)
0
10
20
30
40
50
60
70
80
90
100
Gravel (%)Depth (m) Elev. (m)
MIT SYSTEM
Sand (%) Silt (%) Clay (%)SampleHole ID
Per
cent
Pas
sing
(%
)
(Fines, %)
SS5 3.3 75.0 0 70 19 114
MIT
SY
ST
EM SAND
CLAYSILT
2µm60µm2mm
COBBLESGRAVEL
COARSE MEDIUM FINE COARSE MEDIUM FINE
Title:
11-13-3179File No.:
Terraprobe11 Indell Lane, Brampton Ontario L6T 3Y3
(905) 796-2650
GRAIN SIZE DISTRIBUTION
SAND, SOME SILT, SOME CLAY

ATTERBERGLIMITS
TEST RESULTS
TERRAPROBE INC.

0
10
20
30
40
50
60
0 10 20 30 40 50 60 70 80 90 100
MHor
OH
A - Line
Depth (m) Elev. (m)SampleBorehole
Pla
stic
ity In
dex
(PI,
%)
CL
CL
CH
Very High Extremely HighHighLow
Upper Plasticity Range
ML
CL - ML
Liquid Limit (LL, %)
SS5 3.3 82.5 17 SLIGHTLY PLASTIC
MLorOL
1
LL (%) PI (%)
10
DescriptionPL (%)
27
Title:
11-13-3179File No.:
Terraprobe11 Indell Lane, Brampton Ontario L6T 3Y3
(905) 796-2650
ATTERBERG LIMITS CHART

0
10
20
30
40
50
60
0 10 20 30 40 50 60 70 80 90 100
MHor
OH
A - Line
Depth (m) Elev. (m)SampleBorehole
Pla
stic
ity In
dex
(PI,
%)
CL
CL
CH
Very High Extremely HighHighLow
Upper Plasticity Range
ML
CL - ML
Liquid Limit (LL, %)
15B 10.9 74.9 15 SLIGHTLY PLASTIC
MLorOL
1
LL (%) PI (%)
9
DescriptionPL (%)
24
Title:
11-13-3179File No.:
Terraprobe11 Indell Lane, Brampton Ontario L6T 3Y3
(905) 796-2650
ATTERBERG LIMITS CHART

0
10
20
30
40
50
60
0 10 20 30 40 50 60 70 80 90 100
MHor
OH
A - Line
Depth (m) Elev. (m)SampleBorehole
Pla
stic
ity In
dex
(PI,
%)
CL
CL
CH
Very High Extremely HighHighLow
Upper Plasticity Range
ML
CL - ML
Liquid Limit (LL, %)
SS4 2.5 81.8 23 SLIGHTLY PLASTIC
MLorOL
2
LL (%) PI (%)
14
DescriptionPL (%)
37
Title:
11-13-3179File No.:
Terraprobe11 Indell Lane, Brampton Ontario L6T 3Y3
(905) 796-2650
ATTERBERG LIMITS CHART

0
10
20
30
40
50
60
0 10 20 30 40 50 60 70 80 90 100
MHor
OH
A - Line
Depth (m) Elev. (m)SampleBorehole
Pla
stic
ity In
dex
(PI,
%)
CL
CL
CH
Very High Extremely HighHighLow
Upper Plasticity Range
ML
CL - ML
Liquid Limit (LL, %)
SS8 5.6 78.7 16 SLIGHTLY PLASTIC, SLIGHT OR LOW COMPRESSIBILITY
MLorOL
2
LL (%) PI (%)
4
DescriptionPL (%)
20
Title:
11-13-3179File No.:
Terraprobe11 Indell Lane, Brampton Ontario L6T 3Y3
(905) 796-2650
ATTERBERG LIMITS CHART

0
10
20
30
40
50
60
0 10 20 30 40 50 60 70 80 90 100
MHor
OH
A - Line
Depth (m) Elev. (m)SampleBorehole
Pla
stic
ity In
dex
(PI,
%)
CL
CL
CH
Very High Extremely HighHighLow
Upper Plasticity Range
ML
CL - ML
Liquid Limit (LL, %)
SS8 7.8 76.8 18 SLIGHTLY PLASTIC
MLorOL
3
LL (%) PI (%)
14
DescriptionPL (%)
32
Title:
11-13-3179File No.:
Terraprobe11 Indell Lane, Brampton Ontario L6T 3Y3
(905) 796-2650
ATTERBERG LIMITS CHART

0
10
20
30
40
50
60
0 10 20 30 40 50 60 70 80 90 100
MHor
OH
A - Line
Depth (m) Elev. (m)SampleBorehole
Pla
stic
ity In
dex
(PI,
%)
CL
CL
CH
Very High Extremely HighHighLow
Upper Plasticity Range
ML
CL - ML
Liquid Limit (LL, %)
SS3 1.8 76.5 18 SLIGHTLY PLASTIC
MLorOL
4
LL (%) PI (%)
11
DescriptionPL (%)
29
Title:
11-13-3179File No.:
Terraprobe11 Indell Lane, Brampton Ontario L6T 3Y3
(905) 796-2650
ATTERBERG LIMITS CHART

FIGURES
TERRAPROBE INC.


SLOPE STABILITYANALYSISRESULTS
TERRAPROBE INC.

1.331.331.331.33
Material Name Color Unit Weight(kN/m3)
Cohesion(kPa) Phi (deg)
Fill ‐ Clayey Silt 19 2 30
Fill ‐ SiltySand/Sand 19 0 32
Silt 20 2 34
Sand 20 0 36
Silt and Clay Till 21 12 32
Bedrock 24
Critical Slip Surface
Silt and Clay Till
Bedrock
Fill - Silty Sand/Sand1.5H : 1V
Centres of Radii
Factor of Safety Contours
Armour Stone
Lake Ontario
Sand
Silt
Sand
Fill - Clayey Silt
Safety Factor1.00
1.20
1.40
1.60
1.80
2.00
2.20
2.40
2.60
2.80
3.00
3.20
3.40
3.60
3.80
4.00+
110
100
9080
10 15 20 25 30 35 40 45 50 55 60 65 70
Analysis Description Section C-C - Normal Ground Water Level - Existing SlopeMethod SpencerScale 1:250Drawn By Navid HatamiFile Name Sec C-C - NGWL - ES.slimFile No. 11-13-3179Date 5/14/2014
ProjectTannery and Water Works Parks
SLIDEINTERPRET 6.015
1.271.271.271.27
Material Name Color Unit Weight(kN/m3)
Cohesion(kPa) Phi (deg)
Fill ‐ Clayey Silt 19 2 30
Fill ‐ SiltySand/Sand 19 0 32
Silt 20 2 34
Sand 20 0 36
Silt and Clay Till 21 12 32
Bedrock 24
Critical Slip Surface
Silt and Clay Till
Bedrock
1.5H : 1V
Centres of Radii
Factor of Safety Contours
Armour Stone
RFE +/- 76.0 m
Sand
Silt
Sand
Fill - Clayey Silt
Fill - Silty Sand/Sand
Safety Factor1.00
1.20
1.40
1.60
1.80
2.00
2.20
2.40
2.60
2.80
3.00
3.20
3.40
3.60
3.80
4.00+
110
100
9080
10 15 20 25 30 35 40 45 50 55 60 65 70
Analysis Description Section C-C - High Ground Water Level - Existing SlopeMethod SpencerScale 1:250Drawn By Navid HatamiFile Name Sec C-C - HGWL - ES.slimFile No. 11-13-3179Date 5/14/2014
ProjectTannery and Water Works Parks
SLIDEINTERPRET 6.015

1.311.311.311.31
Material Name Color Unit Weight(kN/m3)
Cohesion(kPa) Phi (deg)
Fill ‐ Clayey Silt 19 2 30
Fill ‐ SiltySand/Sand 19 0 32
Silt 20 2 34
Bedrock 24
Critical Slip Surface
Silt
Bedrock
Fill - Clayey Silt 1.5H : 1V
Centres of Radii
Factor of Safety Contours
Stone Beach
Lake Ontario
Fill - Silty Sand/Sand
Safety Factor1.00
1.20
1.40
1.60
1.80
2.00
2.20
2.40
2.60
2.80
3.00
3.20
3.40
3.60
3.80
4.00+
100
9590
8580
75
0 5 10 15 20 25 30 35 40 45
Analysis Description Section E-E - Normal Ground Water Level - Existing SlopeMethod SpencerScale 1:200Drawn By Navid HatamiFile Name Sec E-E - NGWL - ES.slimFile No. 11-13-3179Date 5/13/2014
ProjectTannery and Water Works Parks
SLIDEINTERPRET 6.015

1.211.211.211.21
Material Name Color Unit Weight(kN/m3)
Cohesion(kPa) Phi (deg)
Fill Clayey Silt 19 2 30
Fill SiltySand/Sand 19 0 32
Silt 20 2 34
Bedrock 24
Critical Slip SurfaceSilt
Bedrock
Fill - Clayey Silt 1.5H : 1V
Centres of Radii
Factor of Safety Contours
Stone Beach
RFE +/- 76.0 m
Fill - Silty Sand/Sand
Safety Factor1.00
1.20
1.40
1.60
1.80
2.00
2.20
2.40
2.60
2.80
3.00
3.20
3.40
3.60
3.80
4.00+
100
9590
8580
75
-5 0 5 10 15 20 25 30 35 40 45
Analysis Description Section E-E - High Ground Water Level - Existing SlopeMethod SpencerScale 1:200Drawn By Navid HatamiFile Name Sec E-E - HGWL - ES.slimFile No. 11-13-3179Date 5/20/2014
ProjectTannery and Water Works Parks
SLIDEINTERPRET 6.015

1.401.401.401.40
Material Name Color Unit Weight(kN/m3)
Cohesion(kPa) Phi (deg)
Fill ‐ Clayey Silt 19 2 30
Fill ‐ SiltySand/Sand 19 0 32
Clayey Silt Till 21 12 32
Bedrock 24
Critical Slip Surface
Clayey Silt Till
Bedrock
Fill - Clayey Silt
2H : 1V
Lake Ontario
Centres of Radii
Factor of Safety Contours
Stone BeachFill - Silty Sand/Sand
Safety Factor1.00
1.20
1.40
1.60
1.80
2.00
2.20
2.40
2.60
2.80
3.00
3.20
3.40
3.60
3.80
4.00+
110
100
9080
-10 -5 0 5 10 15 20 25 30 35 40 45 50
Analysis Description Section F-F - Normal Ground Water Level - Existing SlopeMethod SpencerScale 1:250Drawn By Navid HatamiFile Name Sec F-F - NGWL - ES.slimFile No. 11-13-3179Date 5/14/2014
ProjectTannery and Water Works Parks
SLIDEINTERPRET 6.015

1.241.241.241.24
Material Name Color Unit Weight(kN/m3)
Cohesion(kPa) Phi (deg)
Fill ‐ Clayey Silt 19 2 30
Fill ‐ SiltySand/Sand 19 0 32
Clayey Silt Till 21 12 32
Bedrock 24
Critical Slip Surface
Clayey Silt Till
Bedrock
Fill - Clayey Silt
2H : 1V
Lake Ontario
Centres of Radii
Factor of Safety Contours
Stone BeachFill - Silty Sand/Sand
Safety Factor1.00
1.20
1.40
1.60
1.80
2.00
2.20
2.40
2.60
2.80
3.00
3.20
3.40
3.60
3.80
4.00+
110
100
9080
-10 -5 0 5 10 15 20 25 30 35 40 45 50
Analysis Description Section F-F - High Ground Water Level - Existing SlopeMethod SpencerScale 1:250Drawn By Navid HatamiFile Name Sec F-F - HGWL - ES.slimFile No. 11-13-3179Date 5/20/2014
ProjectTannery and Water Works Parks
SLIDEINTERPRET 6.015

PHOTOGRAPHS
TERRAPROBE INC.

Tannery and Water Works Parks, Oakville File No. 11-13-3179
Terraprobe
Photograph 1 – Looking west along the slope crest. Slope surface is covered with tall grass and weed at the easterly portion.
Photograph 2 – Looking west towards the vegetated slope face.

Tannery and Water Works Parks, Oakville File No. 11-13-3179
Terraprobe
Photograph 3 – Looking west along the slope toe. The trail is located at the slope toe.
Photograph 4 – Looking west along the shoreline. Shoreline is lined with concrete blocks/stones.

Tannery and Water Works Parks, Oakville File No. 11-13-3179
Terraprobe
Photograph 5 – Another view of the shoreline protection consisting of concrete blocks/stones.
Photograph 6 – Looking north towards the slope. Slope is covered with young trees, shrubs, bushes, weeds and grass.
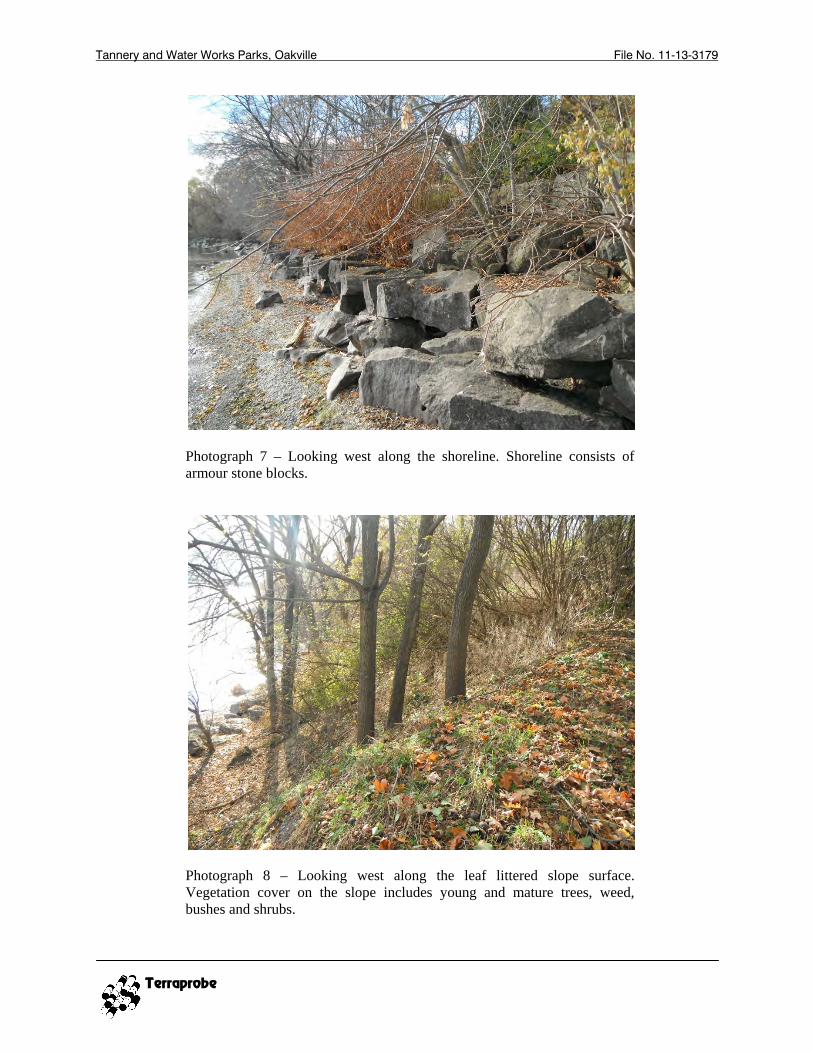
Tannery and Water Works Parks, Oakville File No. 11-13-3179
Terraprobe
Photograph 7 – Looking west along the shoreline. Shoreline consists of armour stone blocks.
Photograph 8 – Looking west along the leaf littered slope surface. Vegetation cover on the slope includes young and mature trees, weed, bushes and shrubs.

Tannery and Water Works Parks, Oakville File No. 11-13-3179
Terraprobe
Photograph 9 – Looking west, another view of the vegetated slope.
Photograph 10 – A few leaning and fallen trees are visible on the slope, however, the majority of tree trunk growth is straight and upright.

Tannery and Water Works Parks, Oakville File No. 11-13-3179
Terraprobe
Photograph 11 – Looking west along the slope crest. A wooden staircase is providing acces to the lower near-shore area. The slope vegetation includes mature trees.
Photograph 12 – Looking west, another view of the slope crest close to the houses. Tree root-mass and creep are visible.

Tannery and Water Works Parks, Oakville File No. 11-13-3179
Terraprobe
Photograph 13 – Looking west along the slope crest along the private properties (house backyards).
Photograph 14 – Looking east towards the slope face. A few leaning trees are visible on the slope.
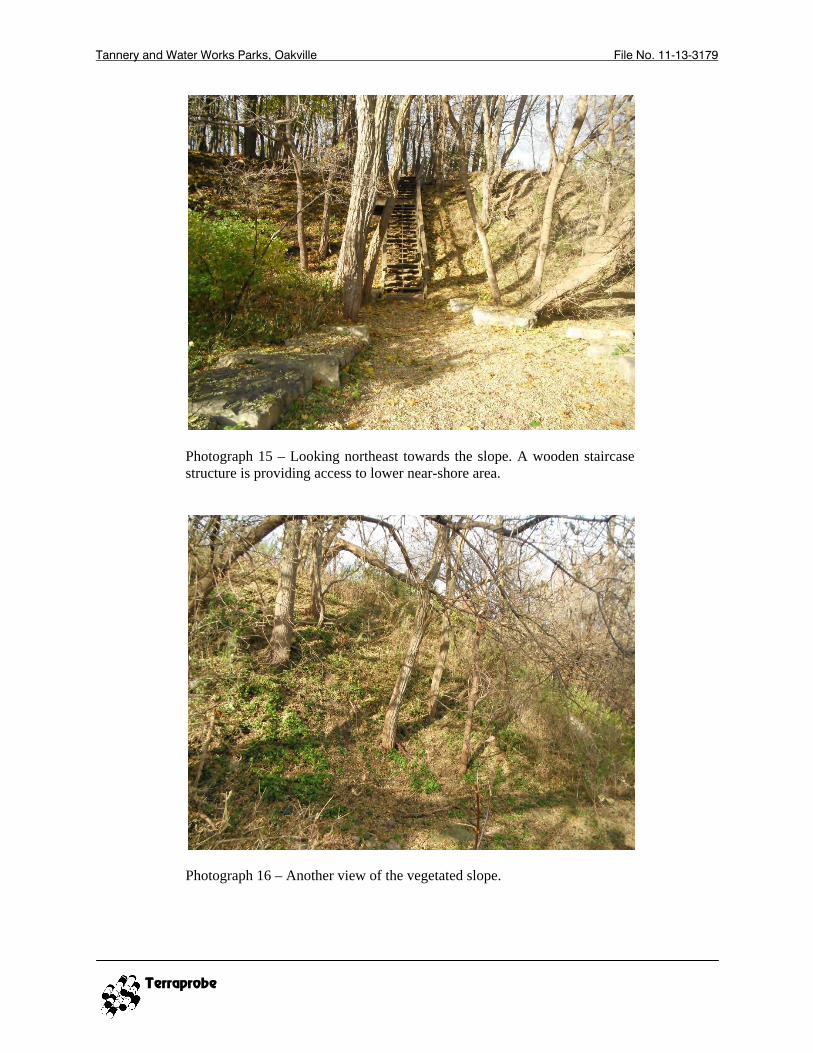
Tannery and Water Works Parks, Oakville File No. 11-13-3179
Terraprobe
Photograph 15 – Looking northeast towards the slope. A wooden staircase structure is providing access to lower near-shore area.
Photograph 16 – Another view of the vegetated slope.

Tannery and Water Works Parks, Oakville File No. 11-13-3179
Terraprobe
Photograph 17 – A sewer outfall is visible on the slope.
Photograph 18 – Looking east along the shoreline. Remenant of armour stone revetment is visible along the shoreline.

Tannery and Water Works Parks, Oakville File No. 11-13-3179
Terraprobe
Photograph 19 – Looking west along the shoreline in Reach 2. Armour stone revetment is visible in the foreground.
Photograph 20 – Looking north towards the slope behind the houses.

Tannery and Water Works Parks, Oakville File No. 11-13-3179
Terraprobe
Photograph 21 – Another view of the slope with armour stone retaining wall near the trail/path.
Photograph 22 – Looking east along the shoreline. Armour stone revetment followed by a narrow sandy gravely beach is visible.

Tannery and Water Works Parks, Oakville File No. 11-13-3179
Terraprobe
Photograph 23 – Looking west along the shoreline. Concrete pieces, big stones and logs are visible along the shoreline.
Photograph 24 – Looking east along the shoreline. Concrete pieces, big stones and logs are visible along the shoreline.

Tannery and Water Works Parks, Oakville File No. 11-13-3179
Terraprobe
Photograph 25 – Looking northeast, an outfall is located close to the shoreline.
Photograph 26 – Looking east along the shoreline containing concrete and stone blocks.

INFORMATION ONHELICAL-PIERTM
FOUNDATIONSYSTEM
TERRAPROBE INC.


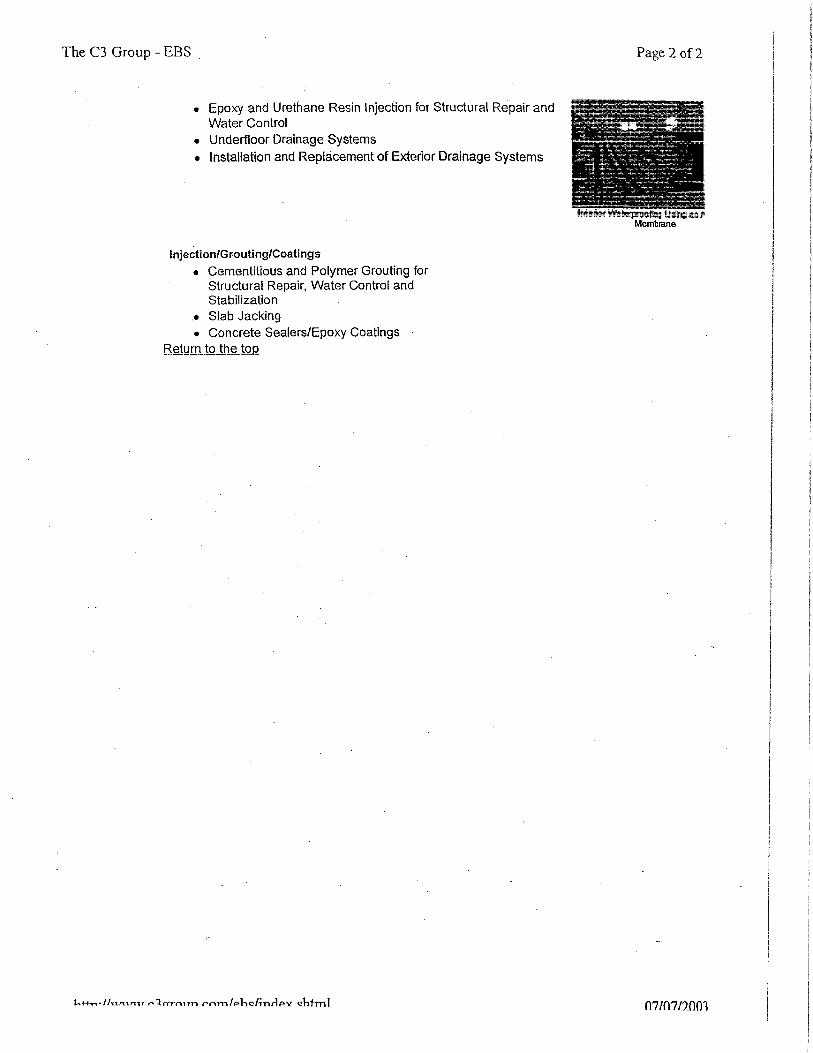
Related Documents


