Grousemount Wind Farm, Co. Kerry Environmental Impact Statement - Volume 2 of 3 August 2015 APPENDIX D.2 NOISE IMPACT MODELLING Appendix D: Noise & Vibration

Welcome message from author
This document is posted to help you gain knowledge. Please leave a comment to let me know what you think about it! Share it to your friends and learn new things together.
Transcript

Grousemount Wind Farm, Co. Kerry Environmental Impact Statement - Volume 2 of 3
August 2015
APPENDIX D.2
NOISE IMPACT MODELLING
Appendix D: Noise & Vibration

ESB Wind Development Ltd
Grousemount Wind Farm
Turbine noise modelling
00840-004-R
Version 5
28 August 2015

ESB Wind Development Ltd Grousemount Wind Farm 00840-004-R
Prevailing Ltd i 28 August 2015
Project details
Project title Grousemount Wind Farm
Client ESB Wind Development Ltd
Client contact Desmond Lalor
Report details
Report title Turbine noise modelling
Document no 00840-004-R
Confidentiality Commercial in confidence
Signatures
Name Signature
Author Bridget Brown / Stuart Baylis
Checked by Stuart Baylis / Andrew Hay
Approved by Andrew Hay
Licensing
Ordnance Survey All OSI maps reproduced by permission of Ordnance Survey Ireland, Licence
number EN 0074314 (2015).
Release history
Version Date Notes
1 27 March 2015 Original release
2 23 July 2015 Updated noise limits and dwelling locations
3 29 July 2015 Updated text, single modelling scenario and noise
constraint scheme
4 18 August 2015 Updated noise limits and revised noise constraint schemes
5 28 August 2015 Updated text
ESB Wind Development Ltd Grousemount Wind Farm 00840-004-R
Prevailing Ltd ii 28 August 2015
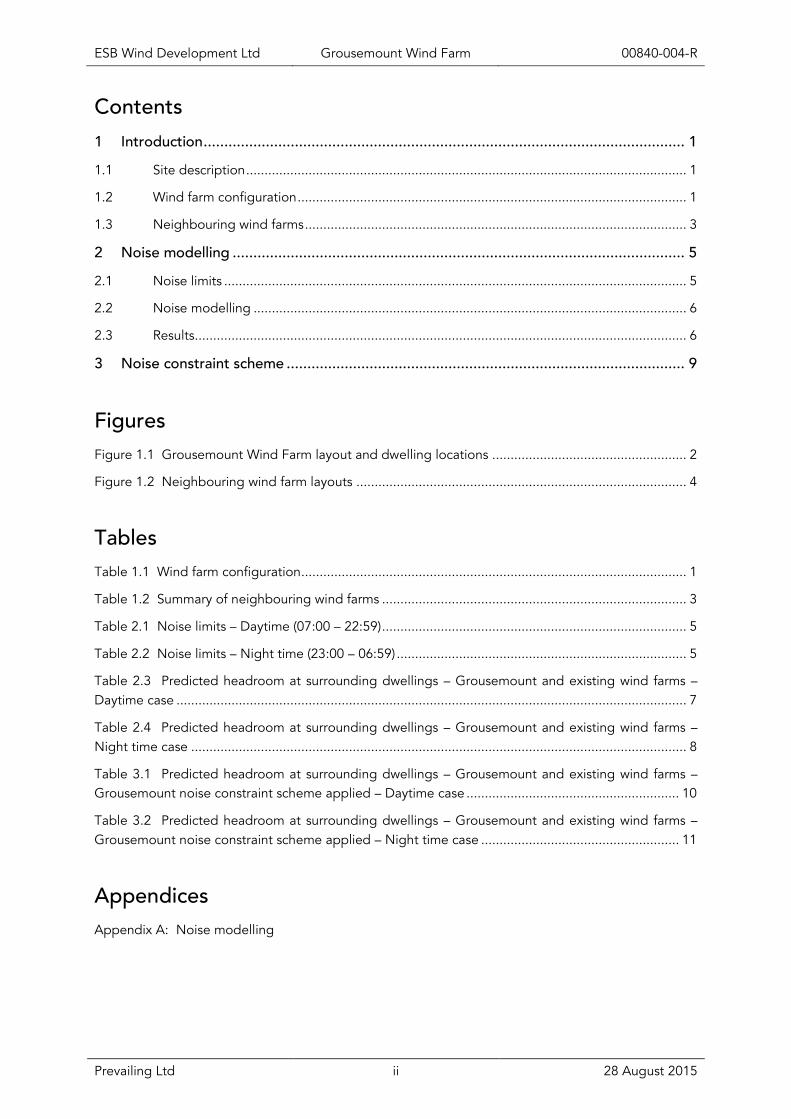
Contents
1 Introduction .................................................................................................................... 1
1.1 Site description ........................................................................................................................ 1
1.2 Wind farm configuration .......................................................................................................... 1
1.3 Neighbouring wind farms ........................................................................................................ 3
2 Noise modelling ............................................................................................................. 5
2.1 Noise limits .............................................................................................................................. 5
2.2 Noise modelling ...................................................................................................................... 6
2.3 Results...................................................................................................................................... 6
3 Noise constraint scheme ................................................................................................ 9
Figures
Figure 1.1 Grousemount Wind Farm layout and dwelling locations ..................................................... 2
Figure 1.2 Neighbouring wind farm layouts .......................................................................................... 4
Tables
Table 1.1 Wind farm configuration......................................................................................................... 1
Table 1.2 Summary of neighbouring wind farms ................................................................................... 3
Table 2.1 Noise limits – Daytime (07:00 – 22:59) ................................................................................... 5
Table 2.2 Noise limits – Night time (23:00 – 06:59) ............................................................................... 5
Table 2.3 Predicted headroom at surrounding dwellings – Grousemount and existing wind farms –
Daytime case ........................................................................................................................................... 7
Table 2.4 Predicted headroom at surrounding dwellings – Grousemount and existing wind farms –
Night time case ....................................................................................................................................... 8
Table 3.1 Predicted headroom at surrounding dwellings – Grousemount and existing wind farms –
Grousemount noise constraint scheme applied – Daytime case .......................................................... 10
Table 3.2 Predicted headroom at surrounding dwellings – Grousemount and existing wind farms –
Grousemount noise constraint scheme applied – Night time case ...................................................... 11
Appendices
Appendix A: Noise modelling
ESB Wind Development Ltd Grousemount Wind Farm 00840-004-R
Prevailing Ltd 1 28 August 2015
1 Introduction
ESB Wind Development Ltd (ESB-WD) has commissioned Prevailing to undertake an assessment of
the turbine noise emission at the Grousemount Wind Farm in Co. Kerry, Ireland.
Noise limits for surrounding dwellings have been supplied by ESB-WD. Prevailing has undertaken
noise modelling of the Grousemount and neighbouring wind farms in order to derive a curtailment
strategy for the Grousemount Wind Farm. The noise modelling undertaken as part of this analysis has
been undertaken according to industry best practice methods.
1.1 Site description
The Grousemount site comprises 38 turbines located in complex terrain. The ground cover across
the project is typical of upland moor, comprising of low-lying vegetation. The proposed wind farm
and the noise sensitive dwellings are shown in Figure 1.1.
Turbine and dwelling coordinates have been provided by ESB-WD and are presented in Appendix A.
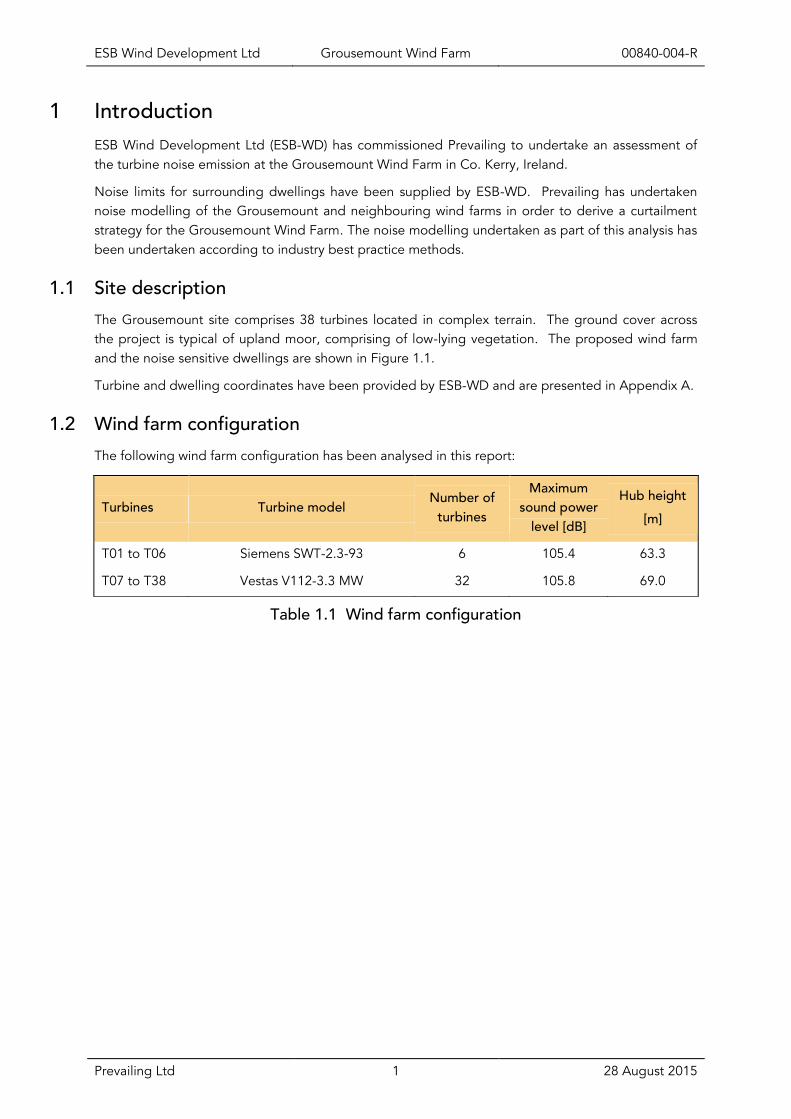
1.2 Wind farm configuration
The following wind farm configuration has been analysed in this report:
Turbines Turbine model Number of
turbines
Maximum
sound power
level [dB]
Hub height
[m]
T01 to T06 Siemens SWT-2.3-93 6 105.4 63.3
T07 to T38 Vestas V112-3.3 MW 32 105.8 69.0
Table 1.1 Wind farm configuration

ESB Wind Development Ltd Grousemount Wind Farm 00840-004-R
Prevailing Ltd 2 28 August 2015
Legend
Proposed Grousemount Wind Farm turbine
Third party dwelling
Noise measurement location
Notes
Coordinate system is ITM Irenet95 Datum.
Figure 1.1 Grousemount Wind Farm layout and dwelling locations
ESB Wind Development Ltd Grousemount Wind Farm 00840-004-R
Prevailing Ltd 3 28 August 2015
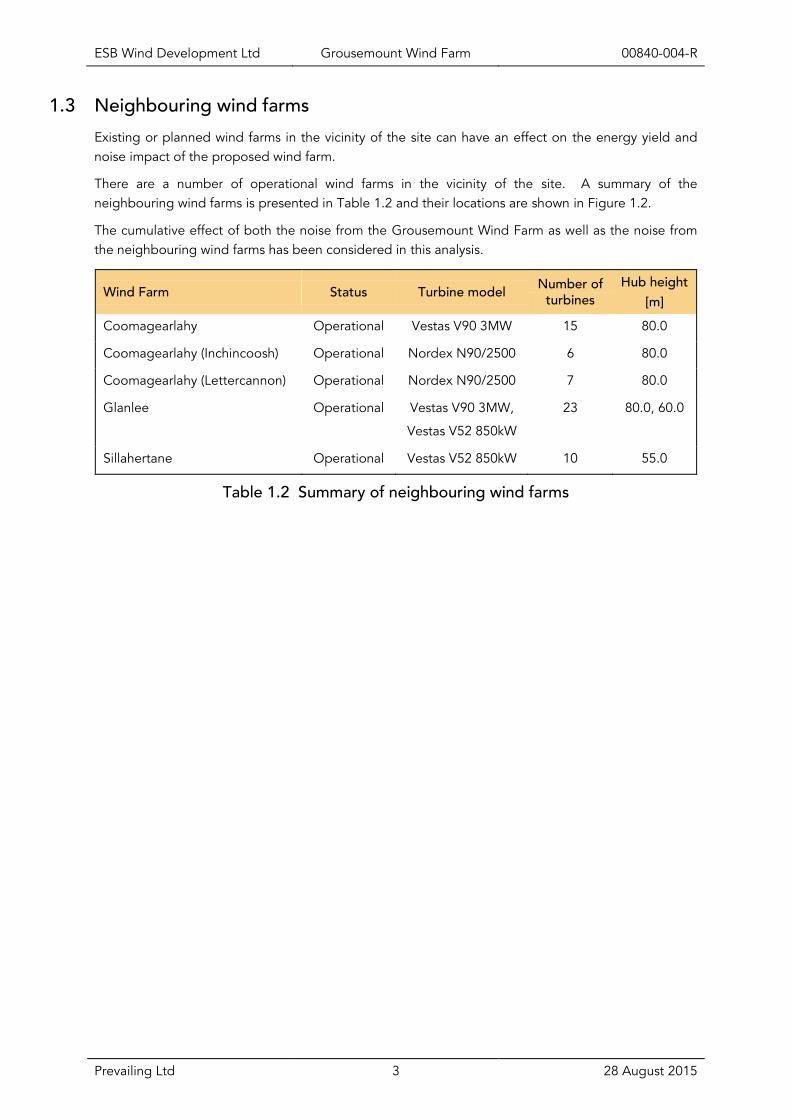
1.3 Neighbouring wind farms
Existing or planned wind farms in the vicinity of the site can have an effect on the energy yield and
noise impact of the proposed wind farm.
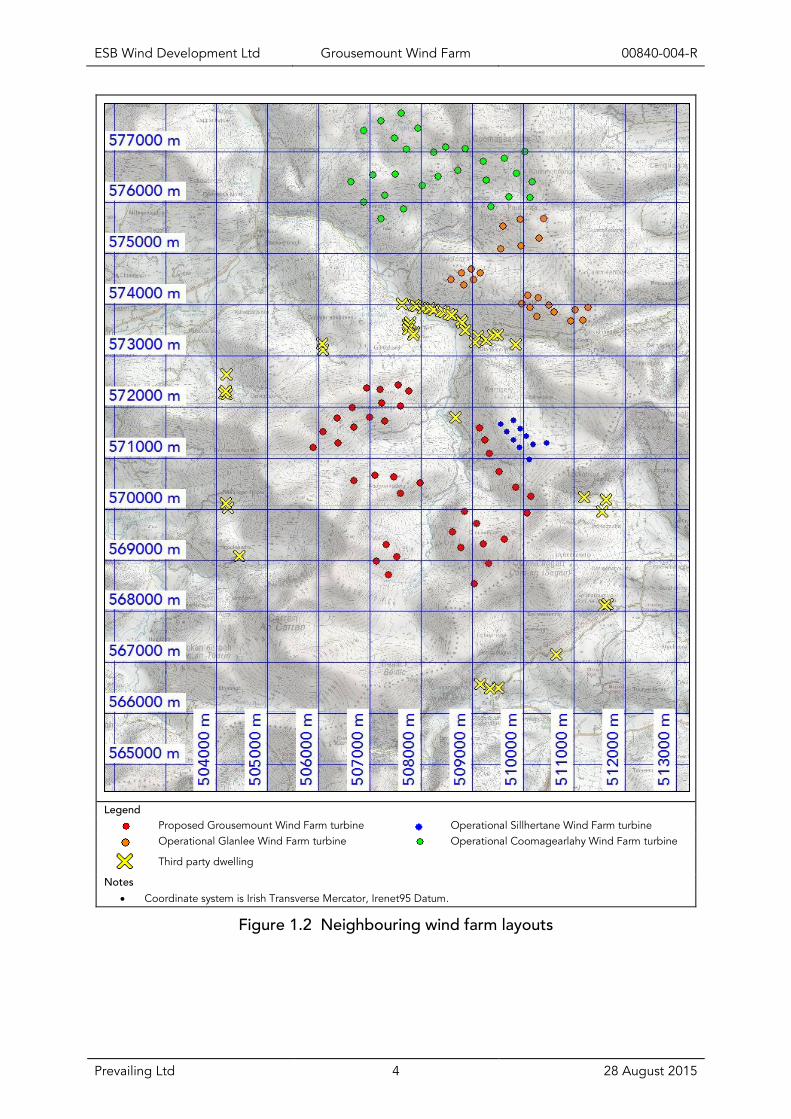
There are a number of operational wind farms in the vicinity of the site. A summary of the
neighbouring wind farms is presented in Table 1.2 and their locations are shown in Figure 1.2.
The cumulative effect of both the noise from the Grousemount Wind Farm as well as the noise from
the neighbouring wind farms has been considered in this analysis.
Wind Farm Status Turbine model Number of
turbines
Hub height
[m]
Coomagearlahy Operational Vestas V90 3MW 15 80.0
Coomagearlahy (Inchincoosh) Operational Nordex N90/2500 6 80.0
Coomagearlahy (Lettercannon) Operational Nordex N90/2500 7 80.0
Glanlee Operational Vestas V90 3MW,
Vestas V52 850kW
23 80.0, 60.0
Sillahertane Operational Vestas V52 850kW 10 55.0
Table 1.2 Summary of neighbouring wind farms
ESB Wind Development Ltd Grousemount Wind Farm 00840-004-R
Prevailing Ltd 4 28 August 2015
Legend
Proposed Grousemount Wind Farm turbine Operational Sillhertane Wind Farm turbine
Operational Glanlee Wind Farm turbine Operational Coomagearlahy Wind Farm turbine
Third party dwelling
Notes
Coordinate system is Irish Transverse Mercator, Irenet95 Datum.
Figure 1.2 Neighbouring wind farm layouts

ESB Wind Development Ltd Grousemount Wind Farm 00840-004-R
Prevailing Ltd 5 28 August 2015
2 Noise modelling
Prevailing has conducted noise modelling of the Grousemount Wind Farm. The sections below detail
the noise limits considered in this analysis, modelling methods used and predicted headroom.
2.1 Noise limits
ESB-WD has supplied assumed noise limits for surrounding dwellings based on background noise
measurements conducted by AWN Consulting1. Where necessary the noise measurements were
subjected to a filtering process by AWN Consulting to remove noise from existing turbines. The
filtering process was conducted in accordance with the IoA Guidelines.
The receptor and noise measurement locations are presented in Figure 1.1 and dwelling coordinates
are presented in Appendix A.
The dwellings, adopted measurement locations and associated noise limits are shown in Table 2.1.
Measurement
location
Noise limit per wind speed [dB(A)] (L90)
Dwelling 3 m/s 4 m/s 5 m/s 6 m/s 7 m/s 8 m/s 9 m/s 10 m/s 11 m/s 12 m/s
H1 – H27 NSL2 45.0 45.0 45.0 45.0 45.0 45.0 45.0 45.0 45.0 45.0
H28 NSL3 45.0 45.0 45.0 45.0 45.0 45.0 45.3 46.0 46.7 47.4
H29 - H31 NSL4 45.0 45.0 45.0 45.0 45.0 45.0 45.0 45.0 45.0 46.1
H32 – H37 NSL5 45.0 45.0 45.0 45.0 45.0 45.0 45.4 47.2 48.6 49.8
H38 – H40 NSL6 45.0 45.0 45.0 45.0 45.0 45.7 47.9 49.9 52.0 54.2
H41 – H44 NSL1 45.0 45.0 45.0 45.0 45.2 45.8 46.6 47.5 48.6 49.5
Table 2.1 Noise limits – Daytime (07:00 – 22:59)
Measurement
location
Noise limit per wind speed [dB(A)] (L90)
Dwelling 3 m/s 4 m/s 5 m/s 6 m/s 7 m/s 8 m/s 9 m/s 10 m/s 11 m/s 12 m/s
H1 – H27 NSL2 43.0 43.0 43.0 43.0 43.0 43.0 43.0 43.0 43.0 43.0
H28 NSL3 43.0 43.0 43.0 43.0 43.0 43.0 43.0 43.0 43.0 43.0
H29 - H31 NSL4 43.0 43.0 43.0 43.0 43.0 43.0 43.0 43.0 43.0 43.0
H32 – H37 NSL5 43.0 43.0 43.0 43.0 43.0 43.0 43.0 43.0 43.0 43.0
H38 – H40 NSL6 43.0 43.0 43.0 43.0 43.0 43.0 43.0 43.0 43.0 43.0
H41 – H44 NSL1 43.0 43.0 43.0 43.0 43.0 43.0 43.0 43.0 43.0 43.0
Table 2.2 Noise limits – Night time (23:00 – 06:59)
1 14_8169NR02a (Grousemount Wind Farm Baseline Report)_Includes Noise Limits_ISSUED 13082015.pdf
ESB Wind Development Ltd Grousemount Wind Farm 00840-004-R
Prevailing Ltd 6 28 August 2015
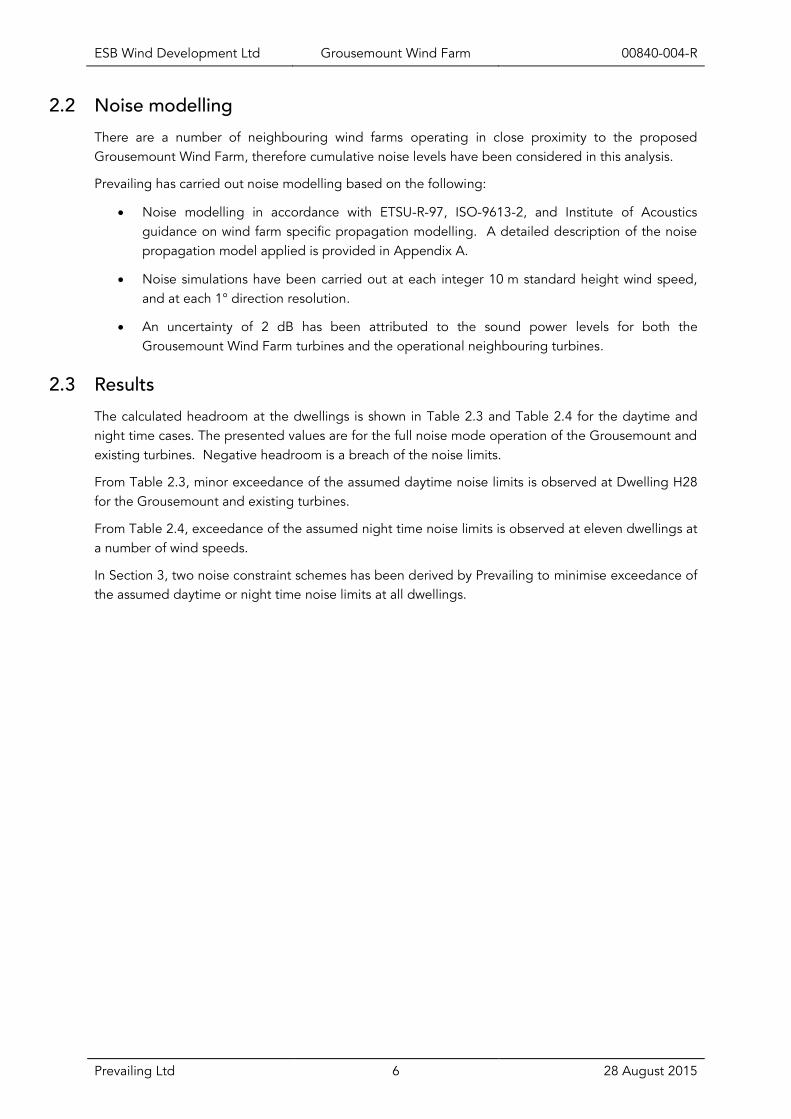
2.2 Noise modelling
There are a number of neighbouring wind farms operating in close proximity to the proposed
Grousemount Wind Farm, therefore cumulative noise levels have been considered in this analysis.
Prevailing has carried out noise modelling based on the following:
Noise modelling in accordance with ETSU-R-97, ISO-9613-2, and Institute of Acoustics
guidance on wind farm specific propagation modelling. A detailed description of the noise
propagation model applied is provided in Appendix A.
Noise simulations have been carried out at each integer 10 m standard height wind speed,
and at each 1° direction resolution.
An uncertainty of 2 dB has been attributed to the sound power levels for both the
Grousemount Wind Farm turbines and the operational neighbouring turbines.
2.3 Results
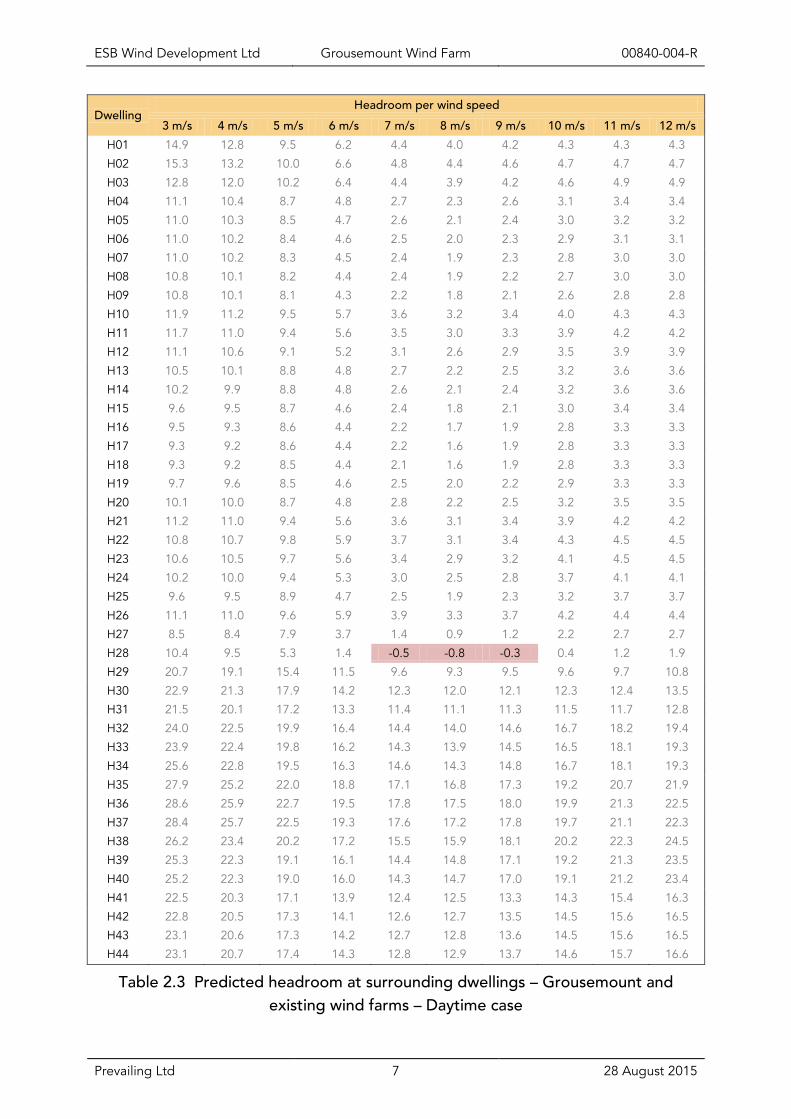
The calculated headroom at the dwellings is shown in Table 2.3 and Table 2.4 for the daytime and
night time cases. The presented values are for the full noise mode operation of the Grousemount and
existing turbines. Negative headroom is a breach of the noise limits.
From Table 2.3, minor exceedance of the assumed daytime noise limits is observed at Dwelling H28
for the Grousemount and existing turbines.
From Table 2.4, exceedance of the assumed night time noise limits is observed at eleven dwellings at
a number of wind speeds.
In Section 3, two noise constraint schemes has been derived by Prevailing to minimise exceedance of
the assumed daytime or night time noise limits at all dwellings.
ESB Wind Development Ltd Grousemount Wind Farm 00840-004-R
Prevailing Ltd 7 28 August 2015
Dwelling Headroom per wind speed
3 m/s 4 m/s 5 m/s 6 m/s 7 m/s 8 m/s 9 m/s 10 m/s 11 m/s 12 m/s
H01 14.9 12.8 9.5 6.2 4.4 4.0 4.2 4.3 4.3 4.3
H02 15.3 13.2 10.0 6.6 4.8 4.4 4.6 4.7 4.7 4.7
H03 12.8 12.0 10.2 6.4 4.4 3.9 4.2 4.6 4.9 4.9
H04 11.1 10.4 8.7 4.8 2.7 2.3 2.6 3.1 3.4 3.4
H05 11.0 10.3 8.5 4.7 2.6 2.1 2.4 3.0 3.2 3.2
H06 11.0 10.2 8.4 4.6 2.5 2.0 2.3 2.9 3.1 3.1
H07 11.0 10.2 8.3 4.5 2.4 1.9 2.3 2.8 3.0 3.0
H08 10.8 10.1 8.2 4.4 2.4 1.9 2.2 2.7 3.0 3.0
H09 10.8 10.1 8.1 4.3 2.2 1.8 2.1 2.6 2.8 2.8
H10 11.9 11.2 9.5 5.7 3.6 3.2 3.4 4.0 4.3 4.3
H11 11.7 11.0 9.4 5.6 3.5 3.0 3.3 3.9 4.2 4.2
H12 11.1 10.6 9.1 5.2 3.1 2.6 2.9 3.5 3.9 3.9
H13 10.5 10.1 8.8 4.8 2.7 2.2 2.5 3.2 3.6 3.6
H14 10.2 9.9 8.8 4.8 2.6 2.1 2.4 3.2 3.6 3.6
H15 9.6 9.5 8.7 4.6 2.4 1.8 2.1 3.0 3.4 3.4
H16 9.5 9.3 8.6 4.4 2.2 1.7 1.9 2.8 3.3 3.3
H17 9.3 9.2 8.6 4.4 2.2 1.6 1.9 2.8 3.3 3.3
H18 9.3 9.2 8.5 4.4 2.1 1.6 1.9 2.8 3.3 3.3
H19 9.7 9.6 8.5 4.6 2.5 2.0 2.2 2.9 3.3 3.3
H20 10.1 10.0 8.7 4.8 2.8 2.2 2.5 3.2 3.5 3.5
H21 11.2 11.0 9.4 5.6 3.6 3.1 3.4 3.9 4.2 4.2
H22 10.8 10.7 9.8 5.9 3.7 3.1 3.4 4.3 4.5 4.5
H23 10.6 10.5 9.7 5.6 3.4 2.9 3.2 4.1 4.5 4.5
H24 10.2 10.0 9.4 5.3 3.0 2.5 2.8 3.7 4.1 4.1
H25 9.6 9.5 8.9 4.7 2.5 1.9 2.3 3.2 3.7 3.7
H26 11.1 11.0 9.6 5.9 3.9 3.3 3.7 4.2 4.4 4.4
H27 8.5 8.4 7.9 3.7 1.4 0.9 1.2 2.2 2.7 2.7
H28 10.4 9.5 5.3 1.4 -0.5 -0.8 -0.3 0.4 1.2 1.9
H29 20.7 19.1 15.4 11.5 9.6 9.3 9.5 9.6 9.7 10.8
H30 22.9 21.3 17.9 14.2 12.3 12.0 12.1 12.3 12.4 13.5
H31 21.5 20.1 17.2 13.3 11.4 11.1 11.3 11.5 11.7 12.8
H32 24.0 22.5 19.9 16.4 14.4 14.0 14.6 16.7 18.2 19.4
H33 23.9 22.4 19.8 16.2 14.3 13.9 14.5 16.5 18.1 19.3
H34 25.6 22.8 19.5 16.3 14.6 14.3 14.8 16.7 18.1 19.3
H35 27.9 25.2 22.0 18.8 17.1 16.8 17.3 19.2 20.7 21.9
H36 28.6 25.9 22.7 19.5 17.8 17.5 18.0 19.9 21.3 22.5
H37 28.4 25.7 22.5 19.3 17.6 17.2 17.8 19.7 21.1 22.3
H38 26.2 23.4 20.2 17.2 15.5 15.9 18.1 20.2 22.3 24.5
H39 25.3 22.3 19.1 16.1 14.4 14.8 17.1 19.2 21.3 23.5
H40 25.2 22.3 19.0 16.0 14.3 14.7 17.0 19.1 21.2 23.4
H41 22.5 20.3 17.1 13.9 12.4 12.5 13.3 14.3 15.4 16.3
H42 22.8 20.5 17.3 14.1 12.6 12.7 13.5 14.5 15.6 16.5
H43 23.1 20.6 17.3 14.2 12.7 12.8 13.6 14.5 15.6 16.5
H44 23.1 20.7 17.4 14.3 12.8 12.9 13.7 14.6 15.7 16.6
Table 2.3 Predicted headroom at surrounding dwellings – Grousemount and
existing wind farms – Daytime case

ESB Wind Development Ltd Grousemount Wind Farm 00840-004-R
Prevailing Ltd 8 28 August 2015
Dwelling Headroom per wind speed
3 m/s 4 m/s 5 m/s 6 m/s 7 m/s 8 m/s 9 m/s 10 m/s 11 m/s 12 m/s
H01 12.9 10.8 7.5 4.2 2.4 2.0 2.2 2.3 2.3 2.3
H02 13.3 11.2 8.0 4.6 2.8 2.4 2.6 2.7 2.7 2.7
H03 10.8 10.0 8.2 4.4 2.4 1.9 2.2 2.6 2.9 2.9
H04 9.1 8.4 6.7 2.8 0.7 0.3 0.6 1.1 1.4 1.4
H05 9.0 8.3 6.5 2.7 0.6 0.1 0.4 1.0 1.2 1.2
H06 9.0 8.2 6.4 2.6 0.5 0.0 0.3 0.9 1.1 1.1
H07 9.0 8.2 6.3 2.5 0.4 -0.1 0.3 0.8 1.0 1.0
H08 8.8 8.1 6.2 2.4 0.4 -0.1 0.2 0.7 1.0 1.0
H09 8.8 8.1 6.1 2.3 0.2 -0.2 0.1 0.6 0.8 0.8
H10 9.9 9.2 7.5 3.7 1.6 1.2 1.4 2.0 2.3 2.3
H11 9.7 9.0 7.4 3.6 1.5 1.0 1.3 1.9 2.2 2.2
H12 9.1 8.6 7.1 3.2 1.1 0.6 0.9 1.5 1.9 1.9
H13 8.5 8.1 6.8 2.8 0.7 0.2 0.5 1.2 1.6 1.6
H14 8.2 7.9 6.8 2.8 0.6 0.1 0.4 1.2 1.6 1.6
H15 7.6 7.5 6.7 2.6 0.4 -0.2 0.1 1.0 1.4 1.4
H16 7.5 7.3 6.6 2.4 0.2 -0.4 -0.1 0.8 1.3 1.3
H17 7.3 7.2 6.6 2.4 0.1 -0.4 -0.1 0.8 1.3 1.3
H18 7.3 7.2 6.5 2.4 0.1 -0.4 -0.1 0.8 1.3 1.3
H19 7.7 7.6 6.5 2.6 0.5 0.0 0.2 0.9 1.3 1.3
H20 8.1 8.0 6.7 2.8 0.8 0.2 0.5 1.2 1.5 1.5
H21 9.2 9.0 7.4 3.6 1.6 1.1 1.4 1.9 2.2 2.2
H22 8.8 8.7 7.8 3.9 1.7 1.1 1.4 2.3 2.5 2.5
H23 8.6 8.5 7.7 3.6 1.4 0.9 1.2 2.1 2.5 2.5
H24 8.2 8.0 7.4 3.3 1.0 0.5 0.8 1.7 2.1 2.1
H25 7.6 7.5 6.9 2.7 0.5 -0.1 0.3 1.2 1.7 1.7
H26 9.1 9.0 7.6 3.9 1.9 1.3 1.7 2.2 2.4 2.4
H27 6.5 6.4 5.9 1.7 -0.6 -1.1 -0.8 0.2 0.7 0.7
H28 8.4 7.5 3.3 -0.6 -2.5 -2.8 -2.6 -2.6 -2.6 -2.6
H29 18.7 17.1 13.4 9.5 7.6 7.3 7.5 7.6 7.7 7.7
H30 20.9 19.3 15.9 12.2 10.3 10.0 10.1 10.3 10.4 10.4
H31 19.5 18.1 15.2 11.3 9.4 9.1 9.3 9.5 9.7 9.7
H32 22.0 20.5 17.9 14.4 12.4 12.0 12.2 12.5 12.6 12.6
H33 21.9 20.4 17.8 14.2 12.3 11.9 12.1 12.3 12.5 12.5
H34 23.6 20.8 17.5 14.3 12.6 12.3 12.4 12.5 12.5 12.5
H35 25.9 23.2 20.0 16.8 15.1 14.8 14.9 15.0 15.1 15.1
H36 26.6 23.9 20.7 17.5 15.8 15.5 15.6 15.7 15.7 15.7
H37 26.4 23.7 20.5 17.3 15.6 15.2 15.4 15.5 15.5 15.5
H38 24.2 21.4 18.2 15.2 13.5 13.2 13.2 13.3 13.3 13.3
H39 23.3 20.3 17.1 14.1 12.4 12.1 12.2 12.3 12.3 12.3
H40 23.2 20.3 17.0 14.0 12.3 12.0 12.1 12.2 12.2 12.2
H41 20.5 18.3 15.1 11.9 10.2 9.7 9.7 9.8 9.8 9.8
H42 20.8 18.5 15.3 12.1 10.4 9.9 9.9 10.0 10.0 10.0
H43 21.1 18.6 15.3 12.2 10.5 10.0 10.0 10.0 10.0 10.0
H44 21.1 18.7 15.4 12.3 10.6 10.1 10.1 10.1 10.1 10.1
Table 2.4 Predicted headroom at surrounding dwellings – Grousemount and
existing wind farms – Night time case
ESB Wind Development Ltd Grousemount Wind Farm 00840-004-R
Prevailing Ltd 9 28 August 2015
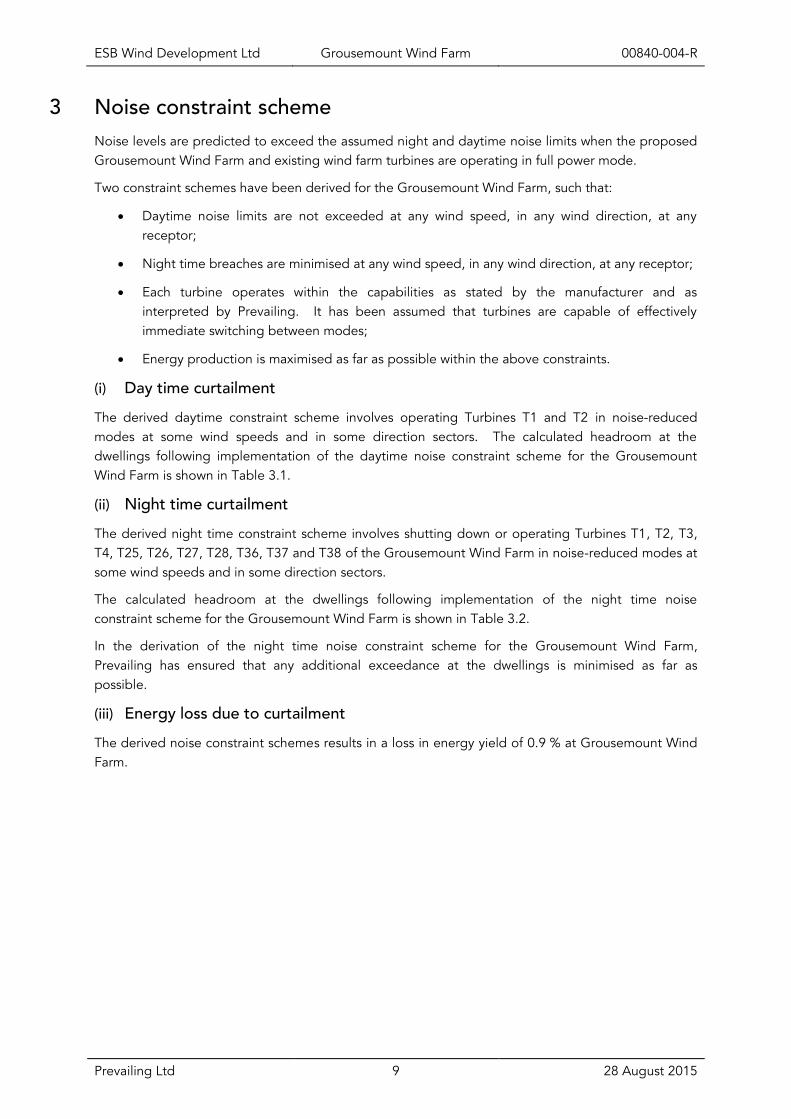
3 Noise constraint scheme
Noise levels are predicted to exceed the assumed night and daytime noise limits when the proposed
Grousemount Wind Farm and existing wind farm turbines are operating in full power mode.
Two constraint schemes have been derived for the Grousemount Wind Farm, such that:
Daytime noise limits are not exceeded at any wind speed, in any wind direction, at any
receptor;
Night time breaches are minimised at any wind speed, in any wind direction, at any receptor;
Each turbine operates within the capabilities as stated by the manufacturer and as
interpreted by Prevailing. It has been assumed that turbines are capable of effectively
immediate switching between modes;
Energy production is maximised as far as possible within the above constraints.
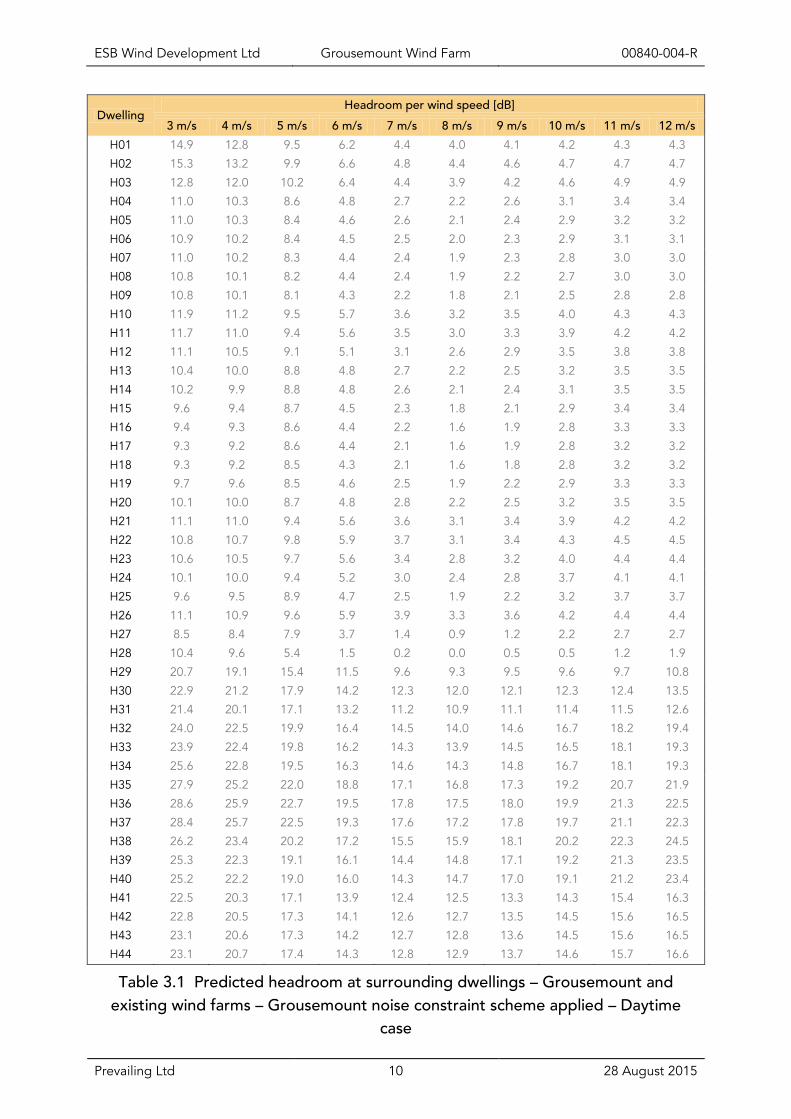
(i) Day time curtailment
The derived daytime constraint scheme involves operating Turbines T1 and T2 in noise-reduced
modes at some wind speeds and in some direction sectors. The calculated headroom at the
dwellings following implementation of the daytime noise constraint scheme for the Grousemount
Wind Farm is shown in Table 3.1.
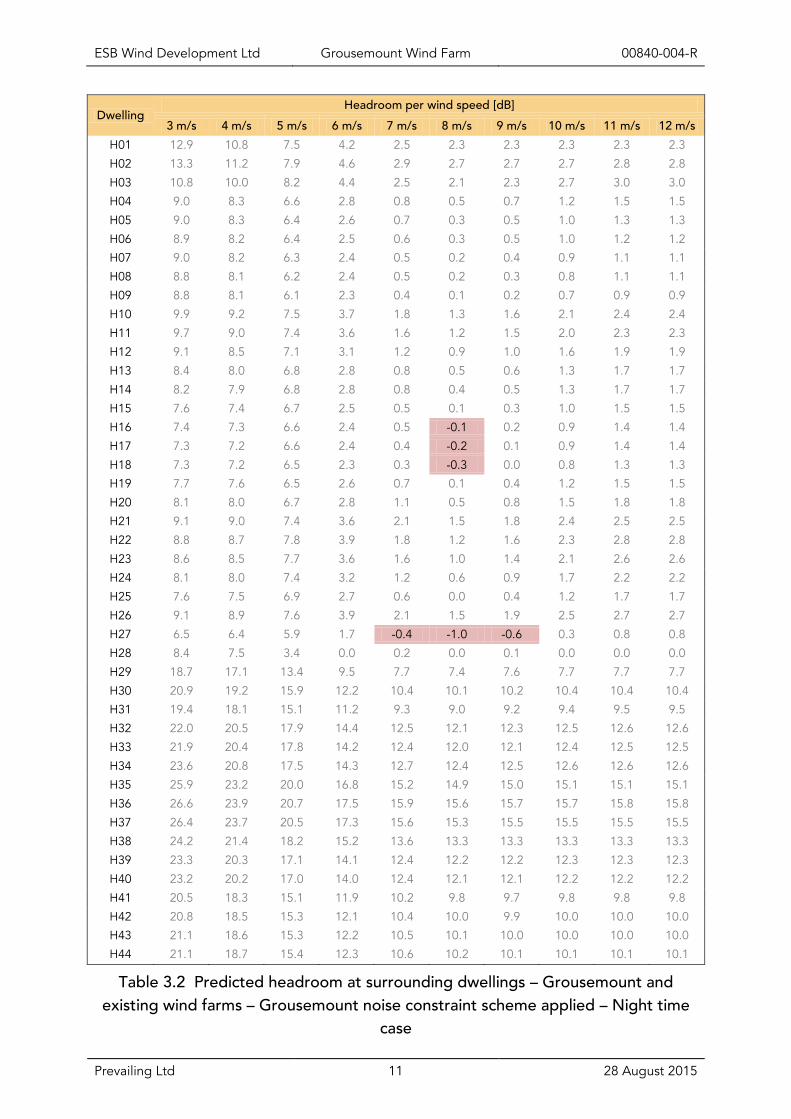
(ii) Night time curtailment
The derived night time constraint scheme involves shutting down or operating Turbines T1, T2, T3,
T4, T25, T26, T27, T28, T36, T37 and T38 of the Grousemount Wind Farm in noise-reduced modes at
some wind speeds and in some direction sectors.
The calculated headroom at the dwellings following implementation of the night time noise
constraint scheme for the Grousemount Wind Farm is shown in Table 3.2.
In the derivation of the night time noise constraint scheme for the Grousemount Wind Farm,
Prevailing has ensured that any additional exceedance at the dwellings is minimised as far as
possible.
(iii) Energy loss due to curtailment
The derived noise constraint schemes results in a loss in energy yield of 0.9 % at Grousemount Wind
Farm.
ESB Wind Development Ltd Grousemount Wind Farm 00840-004-R
Prevailing Ltd 10 28 August 2015
Dwelling Headroom per wind speed [dB]
3 m/s 4 m/s 5 m/s 6 m/s 7 m/s 8 m/s 9 m/s 10 m/s 11 m/s 12 m/s
H01 14.9 12.8 9.5 6.2 4.4 4.0 4.1 4.2 4.3 4.3
H02 15.3 13.2 9.9 6.6 4.8 4.4 4.6 4.7 4.7 4.7
H03 12.8 12.0 10.2 6.4 4.4 3.9 4.2 4.6 4.9 4.9
H04 11.0 10.3 8.6 4.8 2.7 2.2 2.6 3.1 3.4 3.4
H05 11.0 10.3 8.4 4.6 2.6 2.1 2.4 2.9 3.2 3.2
H06 10.9 10.2 8.4 4.5 2.5 2.0 2.3 2.9 3.1 3.1
H07 11.0 10.2 8.3 4.4 2.4 1.9 2.3 2.8 3.0 3.0
H08 10.8 10.1 8.2 4.4 2.4 1.9 2.2 2.7 3.0 3.0
H09 10.8 10.1 8.1 4.3 2.2 1.8 2.1 2.5 2.8 2.8
H10 11.9 11.2 9.5 5.7 3.6 3.2 3.5 4.0 4.3 4.3
H11 11.7 11.0 9.4 5.6 3.5 3.0 3.3 3.9 4.2 4.2
H12 11.1 10.5 9.1 5.1 3.1 2.6 2.9 3.5 3.8 3.8
H13 10.4 10.0 8.8 4.8 2.7 2.2 2.5 3.2 3.5 3.5
H14 10.2 9.9 8.8 4.8 2.6 2.1 2.4 3.1 3.5 3.5
H15 9.6 9.4 8.7 4.5 2.3 1.8 2.1 2.9 3.4 3.4
H16 9.4 9.3 8.6 4.4 2.2 1.6 1.9 2.8 3.3 3.3
H17 9.3 9.2 8.6 4.4 2.1 1.6 1.9 2.8 3.2 3.2
H18 9.3 9.2 8.5 4.3 2.1 1.6 1.8 2.8 3.2 3.2
H19 9.7 9.6 8.5 4.6 2.5 1.9 2.2 2.9 3.3 3.3
H20 10.1 10.0 8.7 4.8 2.8 2.2 2.5 3.2 3.5 3.5
H21 11.1 11.0 9.4 5.6 3.6 3.1 3.4 3.9 4.2 4.2
H22 10.8 10.7 9.8 5.9 3.7 3.1 3.4 4.3 4.5 4.5
H23 10.6 10.5 9.7 5.6 3.4 2.8 3.2 4.0 4.4 4.4
H24 10.1 10.0 9.4 5.2 3.0 2.4 2.8 3.7 4.1 4.1
H25 9.6 9.5 8.9 4.7 2.5 1.9 2.2 3.2 3.7 3.7
H26 11.1 10.9 9.6 5.9 3.9 3.3 3.6 4.2 4.4 4.4
H27 8.5 8.4 7.9 3.7 1.4 0.9 1.2 2.2 2.7 2.7
H28 10.4 9.6 5.4 1.5 0.2 0.0 0.5 0.5 1.2 1.9
H29 20.7 19.1 15.4 11.5 9.6 9.3 9.5 9.6 9.7 10.8
H30 22.9 21.2 17.9 14.2 12.3 12.0 12.1 12.3 12.4 13.5
H31 21.4 20.1 17.1 13.2 11.2 10.9 11.1 11.4 11.5 12.6
H32 24.0 22.5 19.9 16.4 14.5 14.0 14.6 16.7 18.2 19.4
H33 23.9 22.4 19.8 16.2 14.3 13.9 14.5 16.5 18.1 19.3
H34 25.6 22.8 19.5 16.3 14.6 14.3 14.8 16.7 18.1 19.3
H35 27.9 25.2 22.0 18.8 17.1 16.8 17.3 19.2 20.7 21.9
H36 28.6 25.9 22.7 19.5 17.8 17.5 18.0 19.9 21.3 22.5
H37 28.4 25.7 22.5 19.3 17.6 17.2 17.8 19.7 21.1 22.3
H38 26.2 23.4 20.2 17.2 15.5 15.9 18.1 20.2 22.3 24.5
H39 25.3 22.3 19.1 16.1 14.4 14.8 17.1 19.2 21.3 23.5
H40 25.2 22.2 19.0 16.0 14.3 14.7 17.0 19.1 21.2 23.4
H41 22.5 20.3 17.1 13.9 12.4 12.5 13.3 14.3 15.4 16.3
H42 22.8 20.5 17.3 14.1 12.6 12.7 13.5 14.5 15.6 16.5
H43 23.1 20.6 17.3 14.2 12.7 12.8 13.6 14.5 15.6 16.5
H44 23.1 20.7 17.4 14.3 12.8 12.9 13.7 14.6 15.7 16.6
Table 3.1 Predicted headroom at surrounding dwellings – Grousemount and
existing wind farms – Grousemount noise constraint scheme applied – Daytime
case
ESB Wind Development Ltd Grousemount Wind Farm 00840-004-R
Prevailing Ltd 11 28 August 2015
Dwelling Headroom per wind speed [dB]
3 m/s 4 m/s 5 m/s 6 m/s 7 m/s 8 m/s 9 m/s 10 m/s 11 m/s 12 m/s
H01 12.9 10.8 7.5 4.2 2.5 2.3 2.3 2.3 2.3 2.3
H02 13.3 11.2 7.9 4.6 2.9 2.7 2.7 2.7 2.8 2.8
H03 10.8 10.0 8.2 4.4 2.5 2.1 2.3 2.7 3.0 3.0
H04 9.0 8.3 6.6 2.8 0.8 0.5 0.7 1.2 1.5 1.5
H05 9.0 8.3 6.4 2.6 0.7 0.3 0.5 1.0 1.3 1.3
H06 8.9 8.2 6.4 2.5 0.6 0.3 0.5 1.0 1.2 1.2
H07 9.0 8.2 6.3 2.4 0.5 0.2 0.4 0.9 1.1 1.1
H08 8.8 8.1 6.2 2.4 0.5 0.2 0.3 0.8 1.1 1.1
H09 8.8 8.1 6.1 2.3 0.4 0.1 0.2 0.7 0.9 0.9
H10 9.9 9.2 7.5 3.7 1.8 1.3 1.6 2.1 2.4 2.4
H11 9.7 9.0 7.4 3.6 1.6 1.2 1.5 2.0 2.3 2.3
H12 9.1 8.5 7.1 3.1 1.2 0.9 1.0 1.6 1.9 1.9
H13 8.4 8.0 6.8 2.8 0.8 0.5 0.6 1.3 1.7 1.7
H14 8.2 7.9 6.8 2.8 0.8 0.4 0.5 1.3 1.7 1.7
H15 7.6 7.4 6.7 2.5 0.5 0.1 0.3 1.0 1.5 1.5
H16 7.4 7.3 6.6 2.4 0.5 -0.1 0.2 0.9 1.4 1.4
H17 7.3 7.2 6.6 2.4 0.4 -0.2 0.1 0.9 1.4 1.4
H18 7.3 7.2 6.5 2.3 0.3 -0.3 0.0 0.8 1.3 1.3
H19 7.7 7.6 6.5 2.6 0.7 0.1 0.4 1.2 1.5 1.5
H20 8.1 8.0 6.7 2.8 1.1 0.5 0.8 1.5 1.8 1.8
H21 9.1 9.0 7.4 3.6 2.1 1.5 1.8 2.4 2.5 2.5
H22 8.8 8.7 7.8 3.9 1.8 1.2 1.6 2.3 2.8 2.8
H23 8.6 8.5 7.7 3.6 1.6 1.0 1.4 2.1 2.6 2.6
H24 8.1 8.0 7.4 3.2 1.2 0.6 0.9 1.7 2.2 2.2
H25 7.6 7.5 6.9 2.7 0.6 0.0 0.4 1.2 1.7 1.7
H26 9.1 8.9 7.6 3.9 2.1 1.5 1.9 2.5 2.7 2.7
H27 6.5 6.4 5.9 1.7 -0.4 -1.0 -0.6 0.3 0.8 0.8
H28 8.4 7.5 3.4 0.0 0.2 0.0 0.1 0.0 0.0 0.0
H29 18.7 17.1 13.4 9.5 7.7 7.4 7.6 7.7 7.7 7.7
H30 20.9 19.2 15.9 12.2 10.4 10.1 10.2 10.4 10.4 10.4
H31 19.4 18.1 15.1 11.2 9.3 9.0 9.2 9.4 9.5 9.5
H32 22.0 20.5 17.9 14.4 12.5 12.1 12.3 12.5 12.6 12.6
H33 21.9 20.4 17.8 14.2 12.4 12.0 12.1 12.4 12.5 12.5
H34 23.6 20.8 17.5 14.3 12.7 12.4 12.5 12.6 12.6 12.6
H35 25.9 23.2 20.0 16.8 15.2 14.9 15.0 15.1 15.1 15.1
H36 26.6 23.9 20.7 17.5 15.9 15.6 15.7 15.7 15.8 15.8
H37 26.4 23.7 20.5 17.3 15.6 15.3 15.5 15.5 15.5 15.5
H38 24.2 21.4 18.2 15.2 13.6 13.3 13.3 13.3 13.3 13.3
H39 23.3 20.3 17.1 14.1 12.4 12.2 12.2 12.3 12.3 12.3
H40 23.2 20.2 17.0 14.0 12.4 12.1 12.1 12.2 12.2 12.2
H41 20.5 18.3 15.1 11.9 10.2 9.8 9.7 9.8 9.8 9.8
H42 20.8 18.5 15.3 12.1 10.4 10.0 9.9 10.0 10.0 10.0
H43 21.1 18.6 15.3 12.2 10.5 10.1 10.0 10.0 10.0 10.0
H44 21.1 18.7 15.4 12.3 10.6 10.2 10.1 10.1 10.1 10.1
Table 3.2 Predicted headroom at surrounding dwellings – Grousemount and
existing wind farms – Grousemount noise constraint scheme applied – Night time
case

Appendix A: Noise modelling
ESB Wind Development Ltd Grousemount Wind Farm 00840-004-R
Prevailing Ltd 28 August 2015
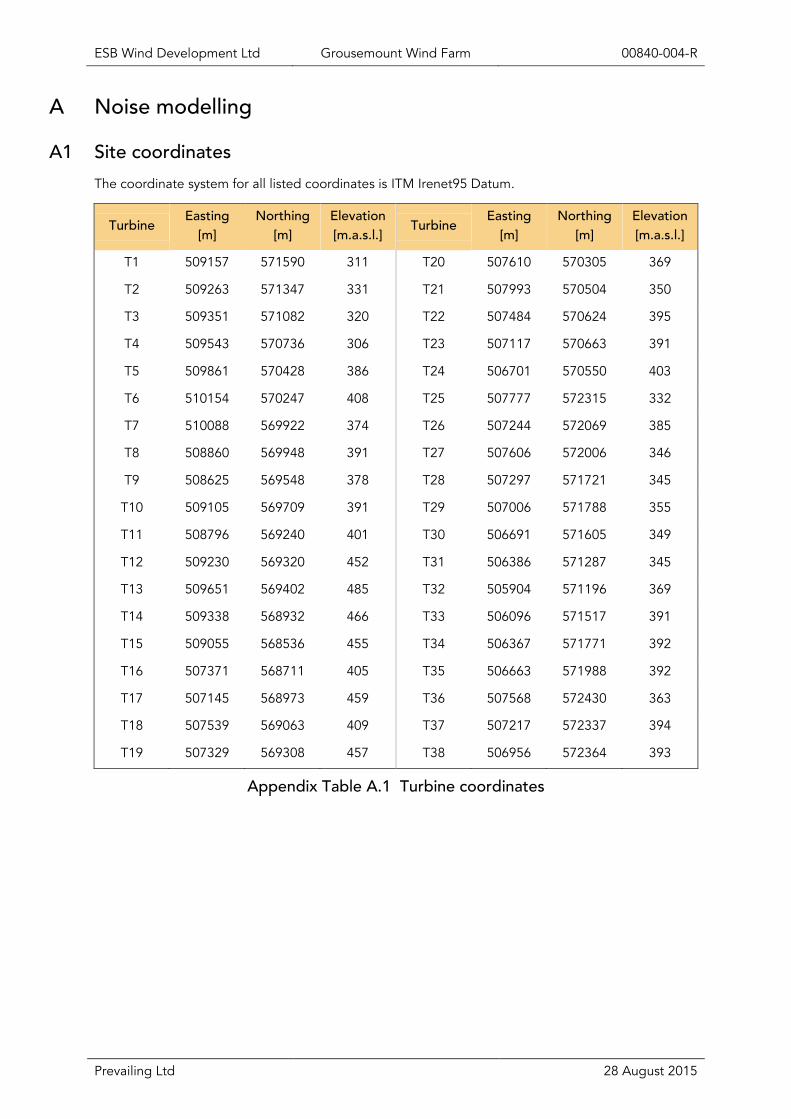
A Noise modelling
A1 Site coordinates
The coordinate system for all listed coordinates is ITM Irenet95 Datum.
Turbine Easting
[m]
Northing
[m]
Elevation
[m.a.s.l.] Turbine
Easting
[m]
Northing
[m]
Elevation
[m.a.s.l.]
T1 509157 571590 311 T20 507610 570305 369
T2 509263 571347 331 T21 507993 570504 350
T3 509351 571082 320 T22 507484 570624 395
T4 509543 570736 306 T23 507117 570663 391
T5 509861 570428 386 T24 506701 570550 403
T6 510154 570247 408 T25 507777 572315 332
T7 510088 569922 374 T26 507244 572069 385
T8 508860 569948 391 T27 507606 572006 346
T9 508625 569548 378 T28 507297 571721 345
T10 509105 569709 391 T29 507006 571788 355
T11 508796 569240 401 T30 506691 571605 349
T12 509230 569320 452 T31 506386 571287 345
T13 509651 569402 485 T32 505904 571196 369
T14 509338 568932 466 T33 506096 571517 391
T15 509055 568536 455 T34 506367 571771 392
T16 507371 568711 405 T35 506663 571988 392
T17 507145 568973 459 T36 507568 572430 363
T18 507539 569063 409 T37 507217 572337 394
T19 507329 569308 457 T38 506956 572364 393
Appendix Table A.1 Turbine coordinates
ESB Wind Development Ltd Grousemount Wind Farm 00840-004-R
Prevailing Ltd 28 August 2015
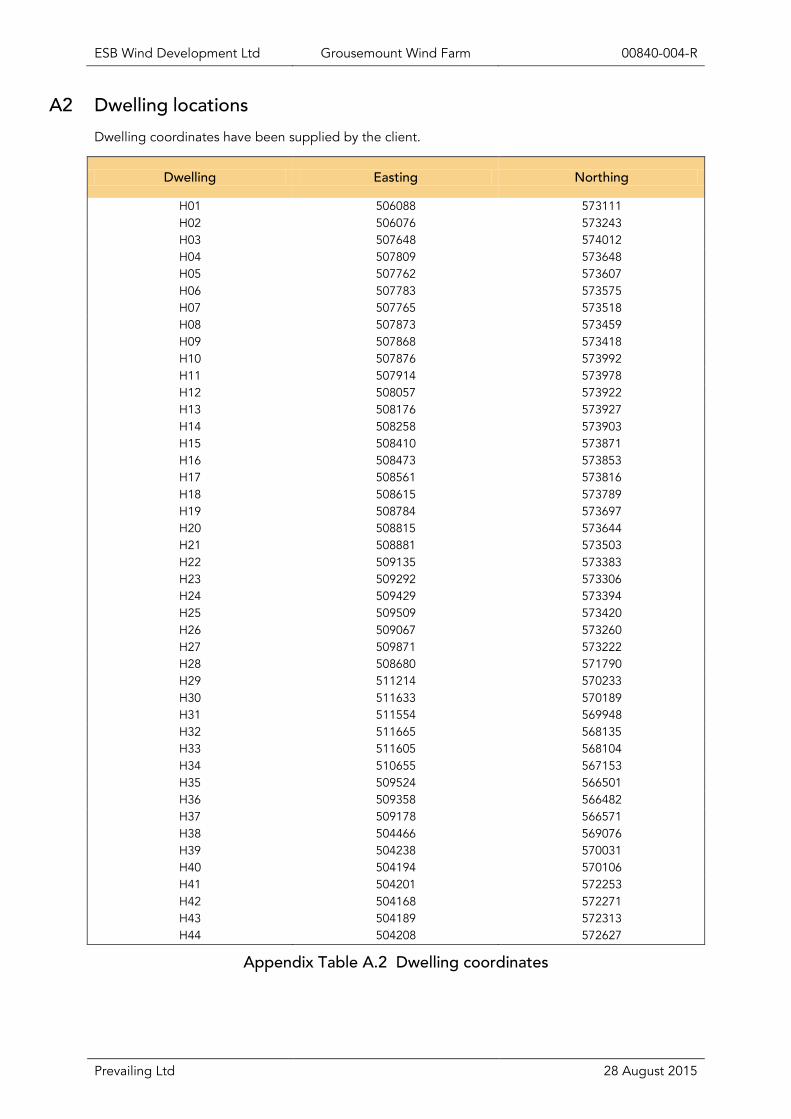
A2 Dwelling locations
Dwelling coordinates have been supplied by the client.
Dwelling Easting Northing
H01 506088 573111
H02 506076 573243
H03 507648 574012
H04 507809 573648
H05 507762 573607
H06 507783 573575
H07 507765 573518
H08 507873 573459
H09 507868 573418
H10 507876 573992
H11 507914 573978
H12 508057 573922
H13 508176 573927
H14 508258 573903
H15 508410 573871
H16 508473 573853
H17 508561 573816
H18 508615 573789
H19 508784 573697
H20 508815 573644
H21 508881 573503
H22 509135 573383
H23 509292 573306
H24 509429 573394
H25 509509 573420
H26 509067 573260
H27 509871 573222
H28 508680 571790
H29 511214 570233
H30 511633 570189
H31 511554 569948
H32 511665 568135
H33 511605 568104
H34 510655 567153
H35 509524 566501
H36 509358 566482
H37 509178 566571
H38 504466 569076
H39 504238 570031
H40 504194 570106
H41 504201 572253
H42 504168 572271
H43 504189 572313
H44 504208 572627
Appendix Table A.2 Dwelling coordinates

ESB Wind Development Ltd Grousemount Wind Farm 00840-004-R
Prevailing Ltd 28 August 2015
A3 Noise modelling
(i) Noise propagation model
The noise modelling has been carried out in accordance with the ISO 9613-2 standard. The
equivalent continuous downwind octave-band sound pressure level at a receiver location, ,
the downwind noise level, is calculated using the follow equation:
Where
is the octave-band sound power level, in decibels, produced by the point sound source
relative to a reference sound power of one picowatt.
is the directivity factor. The complex terrain directivity factors from the Institute of Acoustics
bulletin2 have been applied.
is the attenuation due to geometric divergence and is dependent on the distance from the
source to the receiver. It is calculated as follows:
Where d is the distance from the source to the receiver in metres.
is the attenuation due to atmospheric absorption. The following standard values are used at
10ºC and at a relative humidity of 70%:
Octave Band Centre Frequency
(Hz) 63 125 250 500 1k 2k 4k 8k
Atmospheric Absorption
Coefficient (dB/m)
0.00
01
0.00
04
0.00
11
0.00
23
0.00
41
0.00
87
0.02
64
0.09
37
is the attenuation due to the ground effect. Prevailing normally assumes 0.5 for mixed
ground. A receptor height of 4 m is used.
is the attenuation due to a barrier. The Institute of Acoustics bulletin guidance on appropriate
terrain blockage attenuation factors have been applied.
is the attenuation due to miscellaneous other effects. A negative attenuation (increase in noise
level) is included to account for the typical uncertainty in the sound output values of the turbines.
This uncertainty value depends on the turbine model.
ESB Wind Development Ltd Grousemount Wind Farm 00840-004-R
Prevailing Ltd 28 August 2015
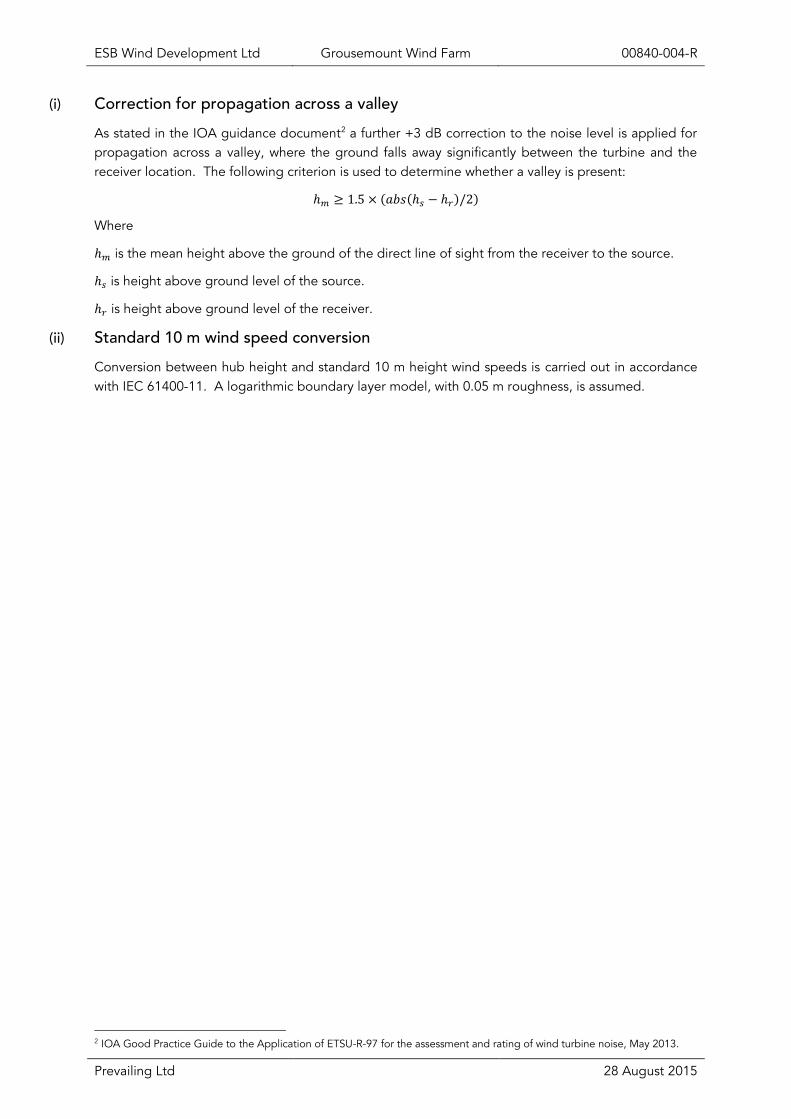
(i) Correction for propagation across a valley
As stated in the IOA guidance document2 a further +3 dB correction to the noise level is applied for
propagation across a valley, where the ground falls away significantly between the turbine and the
receiver location. The following criterion is used to determine whether a valley is present:
Where
is the mean height above the ground of the direct line of sight from the receiver to the source.
is height above ground level of the source.
is height above ground level of the receiver.
(ii) Standard 10 m wind speed conversion
Conversion between hub height and standard 10 m height wind speeds is carried out in accordance
with IEC 61400-11. A logarithmic boundary layer model, with 0.05 m roughness, is assumed.
2 IOA Good Practice Guide to the Application of ETSU-R-97 for the assessment and rating of wind turbine noise, May 2013.
Related Documents