APPENDIX D1 COASTAL ENGINEERING EVALUATION

Welcome message from author
This document is posted to help you gain knowledge. Please leave a comment to let me know what you think about it! Share it to your friends and learn new things together.
Transcript
APPENDIX D1 COASTAL ENGINEERING EVALUATION

TABLE OF CONTENTS 1 INTRODUCTION ......................................................................................................... D1-1
2 SITE DESCRIPTION ..................................................................................................... D1-2
3 WATER LEVELS ........................................................................................................... D1-4
4 WIND WAVE HINDCAST ........................................................................................... D1-5
5 INTERTIDAL CAP ARMOR SIZE ............................................................................... D1-10
6 EXTENT OF INTERTIDAL CAP ARMOR .................................................................. D1-12
7 ADDITIONAL CAP DESIGN CONSIDERATIONS ..................................................... D1-13
7.1 Optimization of Armor Rock Size for 100-year Storm Event .............................. D1-13
7.2 Impacts due to Predicted Sea Level Rise ................................................................ D1-13
8 REFERENCES .............................................................................................................. D1-15
List of Tables Table D1-1 Tide Levels for NOAA Station 9445016 ......................................................... D1-4
Table D1-2 Wind and Wave Data ...................................................................................... D1-9
Table D1-3 Stable Armor Rock Size and Projected Vertical Wave Runup in Feet ....... D1-10
Table D1-4 Extents of Intertidal Armor, Elevations in feet MLLW............................... D1-12
List of Figures Figure D1-1 Shoreline Reaches ............................................................................................ D1-3
Figure D1-2 West Point, Washington, Wind Speed Distribution (1984 to 2009) ............ D1-6
Figure D1-3 Point No Point Lighthouse Wind Speed Distribution (1985 to 1990) .......... D1-7
Appendix D1: Coastal Engineering Evaluation May 2015 Port Gamble Bay Cleanup Project D1-i 130388-01.02

1 INTRODUCTION
A coastal engineering evaluation was conducted to provide predictions of extreme wave conditions along the shoreline at Port Gamble Bay (“Site”) to inform the remedial design for the Port Gamble Bay Cleanup. Long-term wind data from a nearby wind gauge was used to estimate the 2-, 10-, 20-, 50-, and 100-year storm events for the area from a variety of wind directions. These extreme wind speeds, fetch lengths, and average depths were then used to estimate the storm waves that will impact the intertidal zone of Port Gamble. Predicted wave heights were used to estimate stable rock sizes and the extent of armoring required for the proposed intertidal cap areas. The impacts of predicted sea level rise (SLR) for the years 2050 and 2100 (NRC 2012) on predicted wave heights and proposed stable rock sizes for remedial actions are also discussed in this appendix. Possible nearshore/shoreline restoration options (i.e., coordinated with but separate from the cleanup project) were also considered as part of the overall coastal engineering evaluation. The results of this coastal evaluation were used to help inform conceptual design of proposed restoration options, as described in Appendix M of this EDR.
Appendix D1: Coastal Engineering Evaluation May 2015 Port Gamble Bay Cleanup Project D1-1 130388-01.02
2 SITE DESCRIPTION
The Port Gamble project Site is located in the northwest portion of Puget Sound at the northern end of Hood Canal. The north shoreline faces Puget Sound (Hood Canal) and the east and south shorelines face Port Gamble Bay. For the purposes of the coastal evaluation, the project shoreline was divided into four reaches, as shown in Figure D1-1, based on the adjacent waterbody and shoreline orientation. Reach 1 (shown in green in the figure) includes the shoreline reach adjacent to Puget Sound that is sheltered by the existing breakwater. This reach is exposed somewhat to waves from the north. The Reach 2 shoreline (shown in blue in the figure) is also adjacent to Puget Sound, and is partially sheltered from waves from the northwest by the existing breakwater, but is exposed to waves from the north. Reaches 3 (shown in purple in the figure) and 4 (shown in orange in the figure) include shorelines adjacent to Port Gamble Bay. Reach 3, which consists of two segments, is located behind the existing wooden breakwater0F
1 and is exposed to waves from the south and southeast. Reach 4 is located south of the existing wooden breakwater and is exposed to waves from the east, and to a lesser extent the southeast.
1 Although there is an existing wooden breakwater south of the Mill Site that currently protects the Reach 3 shoreline, this breakwater is scheduled for demolition and will not be replaced as part of the cleanup project.
Appendix D1: Coastal Engineering Evaluation May 2015 Port Gamble Bay Cleanup Project D1-2 130388-01.02

FormerFormerMill SiteMill Site
Reach 3Reach 3
Reach 2Reach 2
Reach 4Reach 4
Reach 1Reach 1
Reach 3Reach 3
Figure D1-1Shoreline Reaches
Appendix D1: Coastal Engineering EvaluationPort Gamble Bay Cleanup Project
0 200 400Feet
LEGENDReach 1: Area behind the breakwaterReach 2: Area impacted by northern wavesReach 3: Area impacted by southern wavesReach 4: 90 to 120 degrees
\\orca
s\gis\
Jobs
\0803
88-01
_Port
_Gam
ble_O
PG\M
aps\C
oasta
lAppe
ndix\
Reac
hExte
nts.m
xd e
iverso
n 10
/24/20
14 3
:22:26
PM
[
Imagery Source: Esri, DigitalGlobe, GeoEye, i-cubed, Earthstar Geographics,CNES/Airbus DS, USDA, USGS, AEX, Getmapping, Aerogrid, IGN, IGP, swisstopo, and
Coordinates are in NAD83 US State Plane WashingtonNorth, U.S. Survey Feet.

3 WATER LEVELS
National Oceanic and Atmospheric Administration (NOAA) Station 9445016 at Foulweather Bluff, located 5.75 miles north of Port Gamble, was used to estimate tides at the project Site. Table D1-1 shows the tide levels for the gage.
Table D1-1 Tide Levels for NOAA Station 9445016
Tide Type Tide Level
(feet MLLW)
Mean Higher High Water (MHHW) 10.2
Mean High Water (MHW) 9.3
Mean Tide Level (MTL) 6.0
Mean Sea Level (MSL) 6.0
Mean Low Water (MLW) 2.8
Mean Lower Low Water (MLLW) 0.0
Appendix D1: Coastal Engineering Evaluation May 2015 Port Gamble Bay Cleanup Project D1-4 130388-01.02

4 WIND WAVE HINDCAST
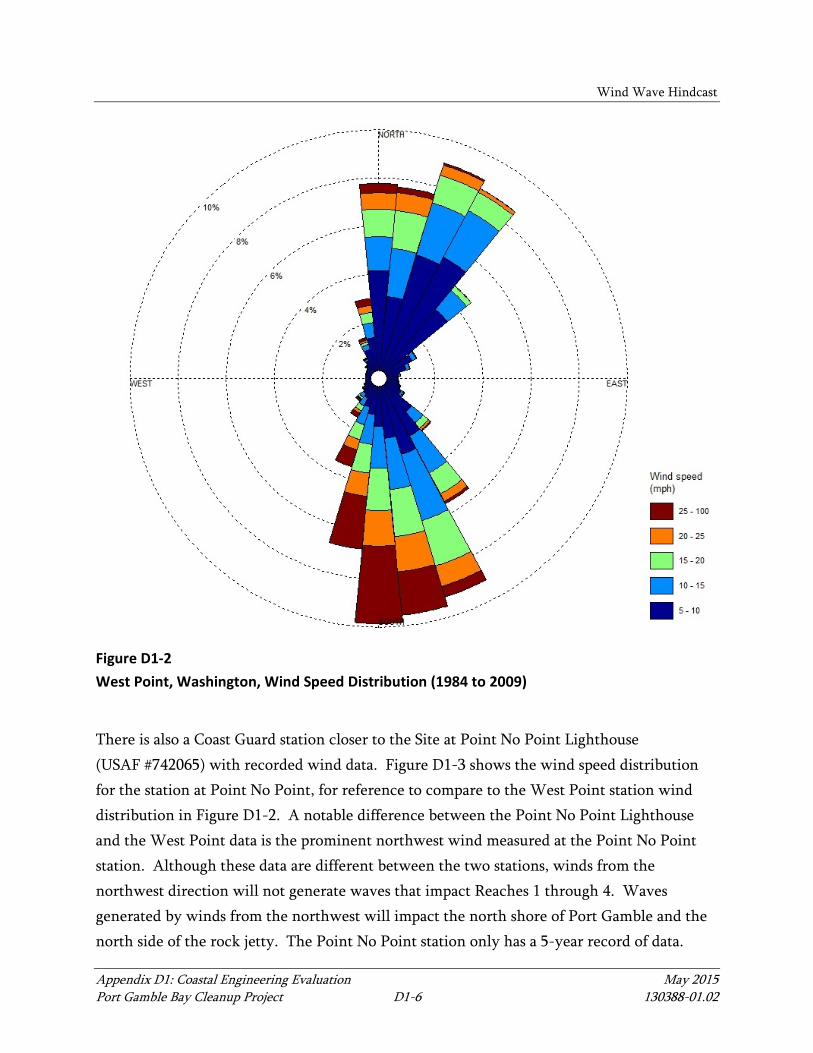
The wave conditions near Port Gamble were estimated by applying wind wave growth formulas to wind data from NOAA station WPOW1 in West Point, Washington1F
2. The wind data encompassed hourly wind speeds (2-minute averages) for the years of 1984 to 2009. Figure D1-2 shows a wind rose (frequency of occurrence based on wind speed and wind direction) for the wind data over the 25-year period of record. The wind data were used to predict extreme wind speed values for 2-, 10-, 20-, 50-, and 100-year return period storm events. The extreme wind speeds were evaluated for each 30-degree wind direction bin from true north (e.g., 0 to 30 degrees, 30 to 60 degrees, etc.). The Raleigh distribution was used to develop the extreme wind speeds with R2 values equal to or greater than 0.91 for all direction bins. The original wind data were found to have some apparent outliers, which represent significantly higher sustained wind speeds than nearby gage locations for the same time period. These data tend to skew estimates of extreme wind speeds for 150 to 210 degree directions, resulting in higher wind speeds than may be realistic. However, the original data were not altered (outliers were not removed) for this analysis, in order to be conservative.
2 NOAA station WPOW1 was selected for the wave hindcast due to its long record of data.
Appendix D1: Coastal Engineering Evaluation May 2015 Port Gamble Bay Cleanup Project D1-5 130388-01.02
Wind Wave Hindcast
Figure D1-2 West Point, Washington, Wind Speed Distribution (1984 to 2009)
There is also a Coast Guard station closer to the Site at Point No Point Lighthouse (USAF #742065) with recorded wind data. Figure D1-3 shows the wind speed distribution for the station at Point No Point, for reference to compare to the West Point station wind distribution in Figure D1-2. A notable difference between the Point No Point Lighthouse and the West Point data is the prominent northwest wind measured at the Point No Point station. Although these data are different between the two stations, winds from the northwest direction will not generate waves that impact Reaches 1 through 4. Waves generated by winds from the northwest will impact the north shore of Port Gamble and the north side of the rock jetty. The Point No Point station only has a 5-year record of data.
Appendix D1: Coastal Engineering Evaluation May 2015 Port Gamble Bay Cleanup Project D1-6 130388-01.02

Wind Wave Hindcast
Thus, considering the 25-year record of data from the West Point station, and considering that the distribution of winds (with the exception of the northwest direction) is similar between both stations, the West Point station was considered more appropriate for design purposes because of the greater statistically reliability associated with making predictions based on the longer wind record.
Figure D1-3 Point No Point Lighthouse Wind Speed Distribution (1985 to 1990)
Predicted values of extreme wind speeds from station WPOW1 were used as input into the Automated Coastal Engineering System (ACES) using the Windspeed Adjustment and Wave Growth module (fetch limited) to predict significant wave heights and peak wave periods
Appendix D1: Coastal Engineering Evaluation May 2015 Port Gamble Bay Cleanup Project D1-7 130388-01.02

Wind Wave Hindcast
generated by the extreme winds (USACE 1992). Results of the wave growth analysis are shown in Table D1-2. The highest winds and waves are from the north and south (as shown in Figure D1-2 and Table D1-2). During a 100-year storm from the north, waves are estimated to be 4.7 feet (impacting the rock jetty on the north side of shoreline Reach 1). The south side of the point (shoreline Reach 3) is estimated to have waves of 3.4 feet high during a 100-year storm. The east and west directions experience far less occurrence of high wind speeds (see Figure D1-2); however, waves from the east would be able to impact shoreline areas along Reaches 2 and 4. From the east, a 100 year storm is estimated to produce waves of 0.4 foot.
Appendix D1: Coastal Engineering Evaluation May 2015 Port Gamble Bay Cleanup Project D1-8 130388-01.02

Wind Wave Hindcast
Table D1-2 Wind and Wave Data
Direction (degrees)
Average Depth
(ft) Fetch
(miles)
2-year 10-year 20-year 50-year 100-year
Wind (mph) Height (ft) Period(s) Wind (mph) Height (ft) Period(s) Wind (mph) Height (ft) Period(s) Wind (mph) Height (ft) Period(s) Wind (mph) Height (ft) Period(s)
0-30 5 1.2 34 1.03 1.89 42 1.29 2.11 44 1.34 2.15 47 1.45 2.24 49 1.52 2.29 31-60 5 0.5 24 0.48 1.28 29 0.60 1.41 31 0.65 1.46 33 0.70 1.51 35 0.75 1.56 61-90 20 0.2 17 0.21 0.86 20 0.26 0.94 22 0.29 0.99 23 0.30 1.01 24 0.32 1.03
91-120 10 0.3 15 0.22 0.89 21 0.33 1.06 22 0.35 1.09 25 0.41 1.17 26 0.43 1.21 121-150 5 0.6 33 0.76 1.58 41 0.98 1.78 44 1.06 1.84 47 1.15 1.91 49 1.20 1.96 151-180 8 2.2 52 2.23 2.80 66 2.85 3.18 71 3.06 3.30 76 3.27 3.42 80 3.44 3.52 181-210 8 1.3 56 2.05 2.59 67 2.5 2.86 70 2.62 2.93 74 2.79 3.02 76 2.87 2.06 271-300 50 2.5 13 0.54 1.46 18 0.79 1.75 20 0.90 1.85 22 1.01 1.95 23 1.07 2.00 301-330 40 2.4 24 1.10 2.02 36 1.82 2.53 40 2.08 2.68 44 2.35 2.83 47 2.55 2.94 331-360 60 5.0 38 2.80 3.18 48 3.78 3.63 51 4.09 3.76 55 4.50 3.92 57 4.71 4.00
Notes: Although these data were found to have high-velocity outliers in the 150 to 210 degree directions, these outliers were not removed from the data set for this analysis as a conservative assumption.
Appendix D1: Coastal Engineering Evaluation May 2015 Port Gamble Bay Cleanup Project D1-9 130388-01.02

5 INTERTIDAL CAP ARMOR SIZE
The U.S. Army Corps of Engineers (USACE) ACES Rubble Mound Revetment Design module was used to estimate cap armor stone sizes, thicknesses, and gradation characteristics required, as well as runup estimates (USACE 1992). Table D1-3 provides the median (D50) rock size that would be stable (limited to no damage) for the maximum given wave conditions in Table D1-2 for each shoreline reach (Figure D1-1) for several assumed different slopes (2H:1V, 3H:1V, and 6H:1V). The waves were assumed to impact the slope head-on. Reach 4 can be impacted head-on by waves from the east; however, waves from that direction are much smaller than waves from the southeast. Therefore, stabile rock sizes for Reach 4 based on waves from the southeast were also included in Table D1-3 to be conservative. Table D1-3 also provides the vertical runup height for each slope and shoreline reach. The vertical runup represents the expected maximum runup found using the Ahrens and Heimbaugh method (USACE 1992).
Table D1-3 Stable Armor Rock Size and Projected Vertical Wave Runup in Feet
Location 2H:1V Slope 3H:1V Slope 6H:1V Slope
D50 Runup D50 Runup D50 Runup
20-year Storm Reaches 1 and 2a 0.2 1.1 0.2 0.8 0.1 0.5
Reach 3 and Reach 4b 0.9 4.9 0.7 3.8 0.5 2.3
Reach 4c 0.1 0.6 0.1 0.4 0.1 0.3
50-year Storm Reaches 1 and 2a 0.2 1.1 0.2 0.9 0.1 0.5
Reach 3 and Reach 4b 0.9 5.3 0.8 4.1 0.5 2.4
Reach 4c 0.2 0.7 0.1 0.5 0.1 0.3
100-year Storm Reaches 1 and 2a 0.2 1.2 0.2 0.9 0.1 0.5
Reach 3 and Reach 4b 1.0 5.6 0.8 4.3 0.6 2.5
Reach 4c 0.1 0.7 0.1 0.5 0.1 0.3
Notes: a. Maximum wave direction from due north; calculated for head-on waves. b. Maximum wave direction from the southeast; calculated for head-on waves. The large waves
from the southeast impact Reach 4 at oblique angles to the shoreline. However, the effect of oblique wave approach on armor layer stability has not been quantified. Existing studies suggest that there is not significant impact for waves up to a 60 degree angle of approach (Allsop 1995).
Appendix D1: Coastal Engineering Evaluation May 2015 Port Gamble Bay Cleanup Project D1-10 130388-01.02

Wind Wave Hindcast
c. Maximum wave direction from the east; calculated for head-on waves.
Appendix D1: Coastal Engineering Evaluation May 2015 Port Gamble Bay Cleanup Project D1-11 130388-01.02

6 EXTENT OF INTERTIDAL CAP ARMOR
The intertidal cap armor should extend upslope to the vertical extent of wave runup based on the water level elevation at mean higher high water (MHHW) and downslope to a depth that is no longer impacted by the breaking waves at mean lower low water (MLLW). The highest runup elevation is found by adding the runup height (shown in Table D1-3) with the elevation of MHHW at the Site (shown in Table D1-1, 10.2 feet). The lower bound elevation of the armor is found by multiplying the significant wave height by 1.5 and subtracting that number for the MLLW elevation (USACE 2002). The upper and lower bounds of the armor are shown in Table D1-4. The extent of intertidal armor in Table D1-4 refers to requirements to stabilize intertidal areas within the active surf zone due to breaking waves.
Table D1-4 Extents of Intertidal Armor, Elevations in feet MLLW
Location
2H:1V Slope 3H:1V Slope 6H:1V Slope Upper
Elevation Lower
Elevation Upper
Elevation Lower
Elevation Upper
Elevation Lower
Elevation
20-year Storm Reaches 1 and 2a 11.3 -1.0 11.0 -1.0 10.7 -1.0
Reach 3 and Reach 4b 15.1 -4.6 14.0 -4.6 12.5 -4.6
Reach 4c 10.8 -0.5 10.6 -0.5 10.5 -0.5
50-year Storm Reaches 1 and 2a 11.3 -1.1 11.1 -1.1 10.7 -1.1
Reach 3 and Reach 4b 15.5 -4.9 14.3 -4.9 12.6 -4.9
Reach 4c 10.9 -0.6 10.7 -0.6 10.5 -0.6
100-year Storm Reaches 1 and 2a 10.4 -1.1 11.1 -1.1 10.7 -1.1
Reach 3 and Reach 4b 11.2 -5.2 14.5 -5.2 12.7 -5.2
Reach 4c 10.3 -0.6 10.7 -0.6 10.5 -0.6
Notes: a. Maximum wave direction from due north; calculated for head-on waves. b. Maximum wave direction from the southeast; calculated for head-on waves. The large waves
from the southeast impact Reach 4 at oblique angles to the shoreline. This was not taken into account in estimates of vertical run-up to be conservative.
c. Maximum wave direction from the east; calculated for head-on waves.
Appendix D1: Coastal Engineering Evaluation May 2015 Port Gamble Bay Cleanup Project D1-12 130388-01.02
7 ADDITIONAL CAP DESIGN CONSIDERATIONS
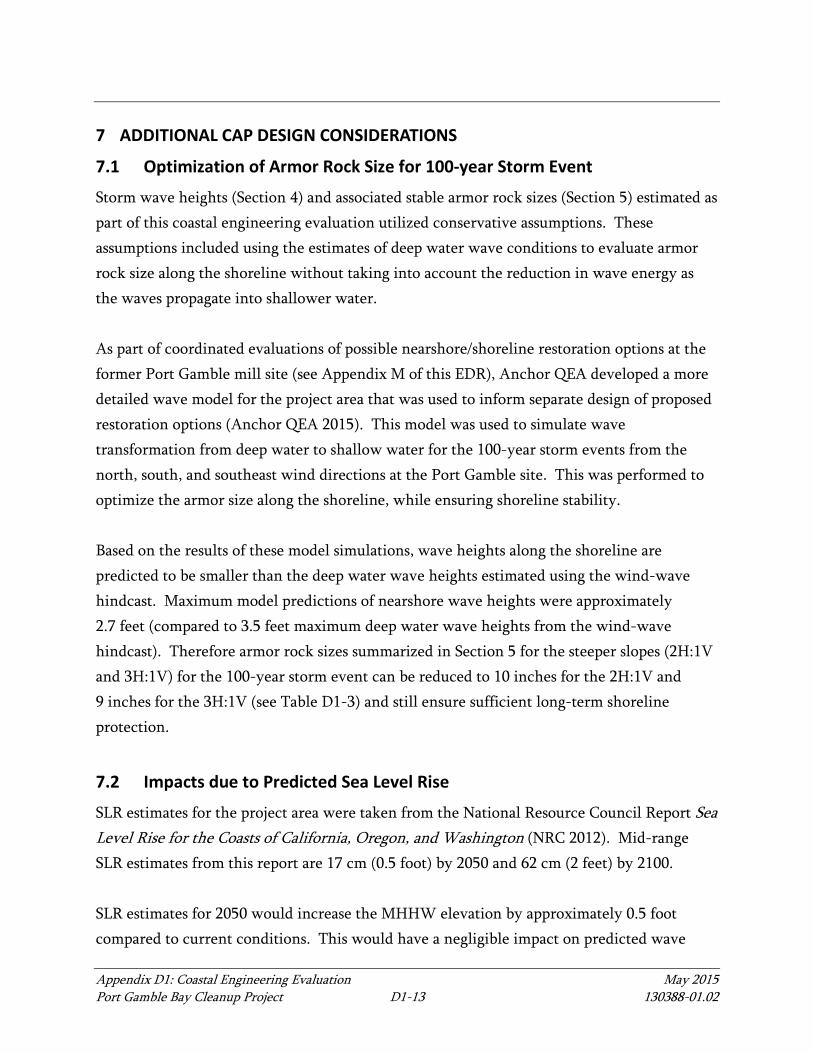
7.1 Optimization of Armor Rock Size for 100-year Storm Event
Storm wave heights (Section 4) and associated stable armor rock sizes (Section 5) estimated as part of this coastal engineering evaluation utilized conservative assumptions. These assumptions included using the estimates of deep water wave conditions to evaluate armor rock size along the shoreline without taking into account the reduction in wave energy as the waves propagate into shallower water. As part of coordinated evaluations of possible nearshore/shoreline restoration options at the former Port Gamble mill site (see Appendix M of this EDR), Anchor QEA developed a more detailed wave model for the project area that was used to inform separate design of proposed restoration options (Anchor QEA 2015). This model was used to simulate wave transformation from deep water to shallow water for the 100-year storm events from the north, south, and southeast wind directions at the Port Gamble site. This was performed to optimize the armor size along the shoreline, while ensuring shoreline stability. Based on the results of these model simulations, wave heights along the shoreline are predicted to be smaller than the deep water wave heights estimated using the wind-wave hindcast. Maximum model predictions of nearshore wave heights were approximately 2.7 feet (compared to 3.5 feet maximum deep water wave heights from the wind-wave hindcast). Therefore armor rock sizes summarized in Section 5 for the steeper slopes (2H:1V and 3H:1V) for the 100-year storm event can be reduced to 10 inches for the 2H:1V and 9 inches for the 3H:1V (see Table D1-3) and still ensure sufficient long-term shoreline protection.
7.2 Impacts due to Predicted Sea Level Rise
SLR estimates for the project area were taken from the National Resource Council Report Sea Level Rise for the Coasts of California, Oregon, and Washington (NRC 2012). Mid-range SLR estimates from this report are 17 cm (0.5 foot) by 2050 and 62 cm (2 feet) by 2100. SLR estimates for 2050 would increase the MHHW elevation by approximately 0.5 foot compared to current conditions. This would have a negligible impact on predicted wave
Appendix D1: Coastal Engineering Evaluation May 2015 Port Gamble Bay Cleanup Project D1-13 130388-01.02

Additional Cap Design Considerations
heights at the site; however, it could increase the vertical extent of wave run-up and amount of overtopping for the armored slope at the shoreline. The increase in wave run-up and overtopping based on the 0.5 foot of SLR is not anticipated to result in damage to the armored slope or changes to the slope design. SLR estimates for 2100 would increase the MHHW elevation by approximately 2 feet compared to current conditions. A 2-foot increase in mean sea levels could result in slightly higher nearshore waves along the project shorelines. In addition, increases in wave run-up and overtopping could be significant, and may require the crest elevation of the armored slope to be increased to prevent overwash damage. As discussed in the Operations, Maintenance, and Monitoring Plan (Appendix F of this EDR), the performance of the armored slope, as well as revisions to SLR estimates, will be monitored periodically over the design life of the structure to ensure its stability.
Appendix D1: Coastal Engineering Evaluation May 2015 Port Gamble Bay Cleanup Project D1-14 130388-01.02

8 REFERENCES
Allsop, 1995. Stability of Rock Armor and Riprap on Coastal Structures. River, Coastal, and Shoreline Protection: Erosion Control Using Riprap and Armourstone. John Wiley and Sons, New York, pp 213-226.
Anchor QEA, LLC, 2015. Draft Wave Modeling in Support of Restoration Design (Part 1), Port Gamble Mill Site. Developed for Port Gamble S’Klallam Tribe. April 2015.
NRC (National Research Council), 2012. Sea Level Rise for the Coasts of California, Oregon and Washington, Past, Present and Future. Committee on Sea Level Rise in California, Oregon, and Washington; Board on Earth Sciences and Resources; Ocean Studies Board; Division on Earth and Life Studies; National Research Council.
USACE (U.S. Army Corps of Engineers), 1992. Automated Coastal Engineering System.
USACE, 2002. Coastal Engineering Manual. Engineer Manual 1110-2-1100, U.S. Army Corps of Engineers, Washington, D.C. (in 6 volumes).
Appendix D1: Coastal Engineering Evaluation May 2015 Port Gamble Bay Cleanup Project D1-15 130388-01.02
APPENDIX D2 PROPELLER WASH EVALUATION, CAP EROSION PROTECTION
TABLE OF CONTENTS 1 INTRODUCTION ......................................................................................................... D2-1
2 SITE DATA ................................................................................................................... D2-2
3 PROPWASH EVALUATION........................................................................................ D2-3
4 PROPWASH RESULTS ................................................................................................. D2-7
5 REFERENCES ............................................................................................................... D2-8
List of Tables Table D2-1 Representative Vessel Specifications for Propwash ........................................... D2-3
Table D2-2 Stable Particle Sizes for Recreational Vessels ..................................................... D2-7
List of Figures Figure D2-1 Port Gamble Dock and SMA-1 ....................................................................... D2-5
Figure D2-2 Mill Site South (SMA-2) Post-Cap and -Cover Conditions ........................... D2-6
List of Attachments Attachment 1 Example Calculation Detail
Appendix D2: Propeller Wash Evaluation May 2015 Port Gamble Bay Cleanup Project D2-i 130388-01.02
LIST OF ACRONYMS AND ABBREVIATIONS D50 median particle size Ecology Washington State Department of Ecology MLLW mean lower low water propwash propeller wash SMA Sediment Management Area USEPA U.S. Environmental Protection Agency
Appendix D2: Propeller Wash Evaluation May 2015 Port Gamble Bay Cleanup Project D2-ii 130388-01.02

1 INTRODUCTION
The purpose of this appendix is to evaluate the potential effects of propeller wash (“propwash”) associated with potential vessel operations in the vicinity of the Port Gamble Bay cleanup capping areas. The cleanup requires construction of a 1- to 4-foot-thick subtidal cap within Sediment Management Areas (SMAs) 1 and 2, respectively, and a 2-foot-thick cap in intertidal areas of both SMA-1 and SMA-2, consistent with the Washington State Department of Ecology’s (Ecology’s) Final Cleanup Action Plan and Consent Decree for the cleanup. Anticipated future vessel operations were identified to evaluate stable grain sizes for proposed engineered capping areas. For SMA-1 and SMA-2, a representative vessel operations scenario was developed assuming a small craft (e.g., fishing boat or recreational boat) operating at the water surface above the cap to evaluate near-bed velocities from propwash and to determine the stable cap material sizes that would resist scour of the cap surface. In addition, for SMA-1, the future operations of an Argosy-class-sized tour boat were considered in evaluating the effects of propwash on the proposed cap. This appendix provides an overview of the vessel operations considered, the methodology employed, and the results of the propwash analyses.
Appendix D2: Propeller Wash Evaluation May 2015 Port Gamble Bay Cleanup Project D2-1 130388-01.02

2 SITE DATA
The SMA-1 subtidal cap area has existing water depths ranging from -10 to -20 feet mean lower low water (MLLW), with typical bottom elevations on the order of approximately -15 feet MLLW. The bay has an average tide range of approximately 10 feet. The SMA-2 subtidal cap area has existing water depths ranging from -23 to -25 feet MLLW, with the majority of the area deeper than -20 feet MLLW. The SMA-1 cap will be on the order of 1 foot thick. The SMA-2 cap will be on the order of 4 feet thick. After capping, the typical SMA-1 bed elevation will be approximately -14 feet MLLW and the typical SMA-2 bed elevation will range from approximately -14 feet MLLW to -32 feet MLLW (see Figures D2-1 and D2-2, respectively).
Appendix D2: Propeller Wash Evaluation May 2015 Port Gamble Bay Cleanup Project D2-2 130388-01.02

3 PROPWASH EVALUATION
Consistent with cap design guidance (e.g., Palermo et al. 1998), a design evaluation was performed to evaluate the cap particle sizes that would resist potential erosive forces on the cap from propwash. Wind- and vessel-induced waves were not specifically evaluated for subtidal capping areas because such forces are expected to be lower than propwash forces, based on similar studies completed at other sites. Propwash is the “jet” of water created by a propeller during vessel travel. There are many factors that can determine the effects of propwash including the type, size, and configuration of the propeller(s), applied horsepower, angle of thrust, vessel speed, and water depth. Typical vessel operations are anticipated to include small craft such as fishing boats 20 feet long or smaller. The representative vessel specifications and operating conditions used to evaluate propwash are summarized in Table D2-1.
Table D2-1 Representative Vessel Specifications for Propwash
Vessel Class
Representative Vessel
Evaluated Engine
Horsepower
Propeller Diameter
(feet) Number of Propellers
Propeller Shaft Depth
(feet)
Vessel Draft (feet)
Small craft
Grady White Adventure 208
250 1.25 1 1.9 1.25
In addition to recreational vessels, future operations could include tour boats accessing a future dock proposed for construction in SMA-1 (see Figure D2-1). A representative tour vessel was identified through conversations with Argosy Cruise personnel, who provided information on how an Argosy tour boat, similar in size to the Spirit of Seattle, could potentially maneuver in and out of a proposed dock in this area during tour boat operations. Given the required vessel maneuvering and space requirements for a vessel of this class size, operation at very low speeds would be necessary with the propeller facing out to Hood Canal, away from the shallower areas of the cap. Under these conditions, a preliminary assessment revealed that lower propwash forces are anticipated to be exerted on the cap
Appendix D2: Propeller Wash Evaluation May 2015 Port Gamble Bay Cleanup Project D2-3 130388-01.02

Propwash Evaluation
compared to those of recreational vessels. Thus, the propwash evaluation results were appropriately focused on the typical recreational vessels as described in Table D2-1. Stable aggregate sizes that will resist propwash were computed using the methods presented in U.S. Environmental Protection Agency’s (USEPA’s) Appendix A: Armor Layer Design for the Guidance for In-Situ Subaqueous Capping of Contaminated Sediment (Maynord 1998). These methods are based on the relationships developed by Blaauw and van de Kaa (1978) and Verhey (1983). This USEPA model considers physical vessel characteristics (e.g., propeller diameter, depth of propeller shaft, and total engine horsepower) and operating/site conditions (e.g., applied horsepower, water depth) to estimate propeller-induced bottom velocities at various distances behind the propeller. The model can be used to predict the particle size that would be stable subjected to the reasonable worst-case propwash from the representative vessel, evaluated in this case assuming the speed of the vessel is zero, resulting in maximum forces exerted on the sediment bed. The real-world condition is such that the forces are actually transient in nature, because the vessel begins moving shortly after power is applied at the propeller, and thus the evaluations assuming a stationary boat are very conservative.
Appendix D2: Propeller Wash Evaluation May 2015 Port Gamble Bay Cleanup Project D2-4 130388-01.02

0
Scale in Feet
200
M
ay 12, 2015 2:28pm
chew
ett K
:\P
rojects\0388-P
ope R
esources\P
ort G
am
ble S
edim
ent C
leanup R
I-F
S\E
ngineering D
esign R
eport\0388-E
DR
-003.dw
g D
2-1
LEGEND:
Sediment Management Area
Subtidal Dredge
Sediment/Wood Waste Deposit
with Residuals Cover
Intertidal Cap
Intertidal Excavation
Cap
Creosote Piling and Structure
Removal Area
Moderate Density Eelgrass Bed
Low to Moderate Density
Eelgrass Bed
SMA-1
AERIAL SOURCE: ESRI, 2010
SURVEY: Bathymetry by Etrac, dated August 27, 2014.
HORIZONTAL DATUM: Washington State Plane North,
NAD83, U.S. Feet.
VERTICAL DATUM: Mean Lower Low Water (MLLW).
PORT GAMBLE BAY
Figure D2-1
Port Gamble Dock and SMA-1
Appendix D2: Propeller Wash Evaluation
Port Gamble Bay Cleanup Project
Proposed Port
Gamble Dock
SMA-1
Moderate Density
Eelgrass Bed
Low to Moderate
Density Eelgrass Bed

A
pr 22, 2015 8:42am
chew
ett K
:\P
rojects\0388-P
ope R
esources\P
ort G
am
ble S
edim
ent C
leanup R
I-F
S\0388-W
K-036 (C
ap contours).dw
g F
D2-2
Figure D2-2
Mill Site South (SMA-2) Post-Cap and -Cover Conditions
Appendix D2: Propeller Wash Evaulation
Port Gamble Bay Cleanup
LEGEND:
Pre-construction Bathymetry (2'
and 10' Interval)
Former Sawmill
0 200
Scale in Feet
Proposed Eelgrass
Bench (Sand)
High Density
Eelgrass Bed
(No Dredging or
Placement)
Intertidal Excavation
and Cap Type 2 Area
(Min. 2-ft, d50 = 9-in)
Intertidal Excavation
and Cap Type 3 Area
(Min 1.5-ft, d50 = 2.5-in)
Dredging and Residuals
Management Cover Area
(Min. 6-in, Sand)
Existing Rock (No Dredging or Placement)
EMNR Thin Placement
(Min. 4-ft, Sand)
Subtidal Cap
(Min. 4-ft, Sand)
EMNR Thin Placement
(Min 4-in, Sand)
AERIAL SOURCE: ESRI, 2010
SURVEY: Upland survey by Triad Associates, dated July,
2012. Bathymetry by Etrac, dated August 27, 2014.
HORIZONTAL DATUM: Washington State Plane North,
NAD83, U.S. Feet.
VERTICAL DATUM: Mean Lower Low Water (MLLW).

4 PROPWASH RESULTS
This section summarizes the results of the propwash analysis. A detailed example calculation is included as Attachment 1. The water depths over capping areas within SMA-1 and SMA-2 were evaluated under a range of tidal conditions, from 14 feet deep at MLLW to 24 feet deep at mean higher high water. Table D2-2 presents a summary of the stable median particle sizes (D50) for various water depths and applied horsepower for the representative vessel described in Table D2-1.
Table D2-2 Stable Particle Sizes for Recreational Vessels
Vessel Class
Representative Vessel
Evaluated
Water Depth (feet)
Applied Horsepower (Percent)1
Minimum Median Particle Size D50 (inches) Particle Size Type2
Recreational Boat
Grady White Adventure 208
(20-foot)
14 10 0.20 Fine Gravel 25 0.37 Fine Gravel 50 0.59 Fine Gravel
≥24 10 0.06 Medium Sand 25 0.11 Coarse Sand 50 0.18 Coarse Sand
Notes: 1 Because caps are placed near the mill site uplands and close to shallower water areas, it is considered highly
unlikely that vessels would operate at more than 50% applied horsepower above cap areas. 2 Sediment type was classified using the Unified Soil Classification System. For the representative recreational vessel operating in SMA-1 or SMA-2 between 10% to 50% horsepower in a conservative water depth of 14 feet, the propwash analysis indicates that particle sizes in the fine gravel range (0.2 to 0.6 inch) would be stable when subjected to propwash forces. For vessels operating in SMA-1 or SMA-2 with similar horsepower at water depths of 24 feet (or greater), particles sizes in the medium to coarse sand range (0.1 to 0.2 inch) will be stable under propwash forcing.
Appendix D2: Propeller Wash Evaluation May 2015 Port Gamble Bay Cleanup Project D2-7 130388-01.02

5 REFERENCES
Blaauw and van de Kaa, 1978. Erosion of Bottom and Sloping Banks Caused by the Screw Race of Maneuvering Ships. Paper presented at the 7th International Harbour Congress, Antwerp, Belgium. May 22-26, 1978.
Maynord, S., 1998. Appendix A: Armor Layer Design for the Guidance for In-Situ Subaqueous Capping of Contaminated Sediment. Prepared for the U.S. Environmental Protection Agency.
Palermo, M., S. Maynord, J. Miller, and D. Reible, 1998. Guidance for In-Situ Subaqueous Capping of Contaminated Sediments. EPA 905-B96-004, Great Lakes National Program Office, Chicago, Illinois.
Verhey, H.J., 1983. The Stability of Bottom and Banks Subjected to the Velocities in the Propeller Jet behind Ships. Presented at the 8th International Harbour Congress Antwerp, Belgium, June 13-17, 1983.
Appendix D2: Propeller Wash Evaluation May 2015 Port Gamble Bay Cleanup Project D2-8 130388-01.02

ATTACHMENT 1 EXAMPLE CALCULATION DETAIL

CALCULATION COVER SHEET
PROJECT: Port Gamble Bay CALCULATION 1-1 SHEET 1 of 28T3
SUBJECT: Attachment 1 – Erosion Protection Assessment – Propeller Wash Assessment
Objective: To determine the propeller wash velocities from recreational vessels that may operate over the Mill Site
North (SMA-1) capping area and the resultant particle size necessary for stability of the sediment cap subject to these propeller wash flows. This document presents an example calculation for a representative recreational vessel expected to operate at the proposed Port Gamble Dock.
References Maynord, S. 1998. Appendix A: Armor Layer Design for the Guidance for In-Situ Subaqueous Capping of Contaminated Sediment. Prepared for the U.S. Environmental Protection Agency. Computation of commercial vessel propeller wash and resultant particle size(s): The following presents a detailed example calculation for a representative recreational vessel operating over the Mill Site North (SMA-1) capping area. The numbered list below outlines the general approach used for the calculation and defines specific parameters used in the calculations. Subsequent sections illustrate a step-by-step calculation for the example case. The example calculation is provided for the representative recreational vessel operating in 14 feet of water at 50 percent of the installed engine power. 1. Select representative vessel for analysis
The representative push boat selected for design was a 20-ft Grady White Adventure 208, a typical fishing boat expected to be used at the Port Gamble Dock. Based on various online sources and vessel type information, this vessel has the following characteristics:
• Number of engines: One • Propeller axis depth: 1.88 feet • Total installed engine horsepower: 250 horsepower • Propeller diameter: 1.25 feet • Number of propellers: One • Ducted propeller: No
2. Determine the maximum bottom velocities in the propeller wash of a maneuvering vessel
Equation 4 from Maynord (1998) is used to first determine the jet velocity exiting a propeller (UR0R) in feet per second (fps):
31
220
=
p
d
DPCU
where: CR2R = 9.72 for non-ducted propellers (page A-10 from Maynord 1998) PRdR = applied engine horsepower per propeller DRpR = Propeller diameter = 1.25 ft (from above)

CALCULATION SHEET SHEET 2 of 3
DESIGNER: RMP DATE: 03-06-14 CALC. NO.: 1-1 REV.NO.: 0
PROJECT: Port Gamble Bay CHECKED BY: KML CHECKED DATE: 03-10-14
SUBJECT: Attachment 1 – Erosion Protection Assessment – Propeller Wash Assessment
The armor stone resistive to propeller wash was designed under the assumption that the Grady White Adventure 208 would typically use up to 50 percent applied horsepower in the vicinity of the proposed mooring dock. For this example calculation, PRdR = (50%) x (250 hp) = 125hp. Therefore,
( ) fps9.4125.1
12572.931
2
31
220 =
=
=
pDP
CU d
The resulting maximum bottom velocities, VRb(maximum)R, in the propeller wash of a maneuvering vessel is computed using Equation 3 from Maynord (1998):
VRb(maximum) R= CR1RUR0RDRpR/HRp
where: CR1R = 0.22 for a non-ducted propeller HRpR = distance from propeller shaft to channel bottom in feet In this example calculation, the recreational vessel operating in a depth of 14 feet of water is being evaluated; therefore, HRpR = 14 feet – 1.88 feet = 12.12 feet. The maximum bottom velocity for this case is:
VRb(maximum) R= CR1RUR0RDRpR/HRpR=0.22(41.9)(1.25)/12.12=1.0 fps 3. Compute the Stable Sediment Sizes to resist the propeller wash of a maneuvering vessel
Equation 5 from Maynord (1998) is used to compute the stable sediment sizes to resist the propeller wash of a maneuvering vessel:
21
503)(max
−= DgCV
w
wsimumb γ
γγ
where: CR3R = 0.6 for minor transport only (page A-10 from Maynord 1998) DR50R = median particle size γRs R= unit weight of stone = 165 pounds per cubic foot (lbs/ftP
3P) (page A-6 of Maynord 1998)
γRw R= unit weight of salt water = 64 lbs/ftP
3 Solving for DR50R:
inches 59.0049ft .0
64641652.32
6.00.1 2
50 ==
−
=D

CALCULATION SHEET SHEET 3 of 3
DESIGNER: RMP DATE: 03-06-14 CALC. NO.: 1-1 REV.NO.: 0
PROJECT: Port Gamble Bay CHECKED BY: KML CHECKED DATE: 03-10-14
SUBJECT: Attachment 1 – Erosion Protection Assessment – Propeller Wash Assessment
The computed particle size for the Grady White Adventure 208 operating in 14 feet of water at 50 percent power is 0.59 inches (fine gravel). It should be noted that in the case of non-steady-state conditions (i.e., moving vessel), the use of this model is conservative (especially for recreational vessels) since the propwash force is transient in nature, only impacting a fixed point on the bottom for a short time.
RECORD OF REVISIONS
NO. REASON FOR REVISION BY CHECKED APPROVED/ ACCEPTED DATE
Related Documents