APPENDIX D QUALITY CONTROL PROCEDURES AND DATA m o © I r- ro © D-l 272288 iHIIIIIll 101

Welcome message from author
This document is posted to help you gain knowledge. Please leave a comment to let me know what you think about it! Share it to your friends and learn new things together.
Transcript

APPENDIX D QUALITY CONTROL PROCEDURES AND DATA
m
o © I r-ro ©
D-l
272288 iHIIIIIll 101
D.l INTRODUCTION
Quality assurance programs and quality control practices for chemical analyses in Radian's laboratories vary according to the client's needs and program objectives. Radian's basic quality control program includes procedures for calibration, sample handling, equipment maintenance, reagent preparation, and quality control test samples. To these are added any additional client requirements such as spiking studies, additional linearity evaluations, and replicate analyses. Quality assurance begins vith the preparation of the test plan and calibration of equipment and carries through sampling and analysis to the reporting of data.
Sections 2 through 4 of this Appendix briefly describe some of the routine practices used in the different areas at Radian, The aqueous data pertinent to samples for this program are presented in Section 5. Section 6
presents the special QC methods used during the prograa for air quality meS-surements and the data pertinent to these methods.
D.2 WATER QUALITY ANALYSIS
Wastewater parameters were analyzed according to standard methods of wastewater analysis as described in Standard Methods for the Examination of later and Wastewater. ASTM Water, or EPA Methods for Chemical Analysis of Water and Wastes.
Spiked sample and check standards recovery studies were used to evaluate the methods used for an analysis and to evaluate the proficiency of an analyst. It is normal water laboratory policy to analyze spiked samples and/or cheek standards at a rate of one standard or spike for every ten unknowns and determine percent recovery for each parameter determined. At a minimum, the percent recovery of one standard per day is deteaained if fewer than ten unknowns are analyzed.
D-3

For each procedure requiring a coloriaetrie calibration curve, a full set of standards plus a reagent blank vers prepared on each day of analysis. If the procedure included a distillation step, blanks, standards and spiked samples were also carried through this step. Only reagent grade chemicals were used in the analyses. Standard solutions which cannot be prepared from primary standards were standardized against a primary standard prior to use. (This includes most titrants.) .
EPA Quality Assurance samples of known concentration were analyzed when available. (Not all parameters are available and some compounds are not within the concentration limits of some procedures.) These samples were submitted as blind samples to the analyst.
D.3 FT.WMENTAT. ANALYSES
A digestion log located in the sample preparation laboratory was used for recording specific data during the digestion of a given sample. These data include sample weight, digestion type, acids used, final volume and any specific comments pertaining to that digestion. Maintenance and check logs were maintained for the low temperature ashers and each analytical balance used in the laboratory.
Instrument logs were also maintained for each atomic absorption unit. The logs include the instrasent model number, data of analysis, analyst, analyte, atomization technique and the operating parameters used during the analysis. Operating parameters on the ICPES are controlled by the computer and "stored with the data set. This information was used to deteaiine if the proper instrument conditions were maintained throughout the analyses. Calibration standards were prepared in the same matrix as the samples to be analyzed. The instrument was then calibrated and an in-lab quality cheek standard analyzed to verify the calibration curve. Certified standards were then analyzed to determine the accuracy of the technique.
D-4

Blanks and NBS certified standards were digested and analyzed alongside each batch of unknown samples with a frequency Of one blank standard for each tea samples. Digestions and analyses of duplicate unknowns were also perfoxmed at the sane frequency (1:10). This information is vital to a determination of the efficiency and effectiveness of a set of digestions and the precision and accuracy of the analyses. The results of all analyses were
" reviewed and stored in OA books for comparison to previous results and to determine the accuracy of corresponding data. If any set of quality control results fall outside the historical performance limits for an analysis, the sample set associated with those QC samples was reanalyzed.
Quality assurance samples provided by Radian's Quality Assurance Director were analyzed periodically. The results of such analyses provide information on the procedures' and long—term stability of the instrument and procedures operating.
The procedures used meet or exceed requirements set forth in "Handbook for Analytical Quality Control in later and Wastewater Laboratories," March, 1979, by the H,S. Environmental Monitoring and Support Lab, Cincinnati, Ohio.
D.4 ORGANIC ANALYSIS
Specific quality control activities employed during the organic analyses encompass the EPA priority pollutants protocol as well as additional measures developed at Radian. These techniques include:
J • Purchasing high purity distilled-ia-gl&ss solvents in
large quantities from a single lot;
e Cleaning "of glassware with chromic acid and firing in a kiln at 450°C; and
D-5

• Use of orgaaie-fzee water prepared at Radiaa by distillation over penaagaaate under a helium purge in an all-glass still.
Sadiaa's GC aad GC/MS laboratories are physically isolated from other laboratoriss at Radian. Ia order to minimize possible contamination from laboratory solvents, non-priority polintant solvents sneh as acetone, methanol or hezaae are need ia the laboratory whenever possible for eleaaiag syringes aad preparing standards. These precautions result in a relatively "clean" laboratory as indicated by the analysis of Radiaa's blaah water. Priority pollutants are seldom detected above a level of 1.0 |ig/L in blanh water samples.
Quality control measures for GC analyses began with the analysis of blanks aad standards. Generally at least two blanks were initially analyzed. The secoad blank was required to be at least as clesn ss the first. After verification of the blaak, s 10 pg/L calibration standard was analyzed. Response factors calculated from the standard were not to vary more than +50 percent in comparison to all other recorded response factors daring the course of a project. If this criterion was met* the standard was set in calibration. After calibration was cos uted, sample carryover in the analytical system was checked by analyzing an organic free water (OFW) blank.
Next, a quality control check sample was analyzed. The results were calculated immediately and compared to the,"true value" concentrations. Results were required to cheek within +10 percent for all parameters greater than 10 |ig/L and within +20 percent for all parameters below 10 |ig/L. Sample analysis was initiated only after each of the aforementioned criteria were met.
Samples were analyzed with 10 percent duplicate analyses or at least one duplicate per set. Calibration cheeks were repeated after each set of 10 samples (plus duplicate). All calibration checks during one day vore required
D-d

to agree within +10 percent. Any deviations outside the stated limits were reviewed by the laboratory manager.
For GC/MS analysis a system performance evaluation was conducted daily to demonstrate the sensitivity of the instrument. The tune of the instrument was checked by examination of the mass spectrum obtained from the injection of 10 ng of decafluorotriphenyl-phosphine. If the ion intensities of this compound were outside specified criteria, the instrument was returned. As specified in the protocol, chromatographic performance was demonstrated by analysis of 40 ng of benzidine (for base neutral extractable materials) and 100 ng of pentachlorophenol (for acid eztractable materials) prior to any sample analysis. If the instrumental response was found to be low* samples were not analyzed until the deficiency is corrected.
D.5 QC DATA SPECIFIC TO THIS PROGRAM
This section presents the quality control data generated dnring this program. It is not possible to present all the data, such as the daily standard calibration curves and the standardization of instrumentation or solutions. This information is maintained in bound volumes in the laboratory and copies are placed into a central data file for the project.
The results presented in this section include the following tables:
e QA/QC Analysis - Water Quality Parameters
• Results of Water Quality Analysis of Sample Duplicates during.the Lipari Treatability Study
e QA/QC Analysis - Trace Elements
• Results of Trace ElementAnalysis of Sample Duplicates and Spiked Duplicates from the Lipari Treatability Study
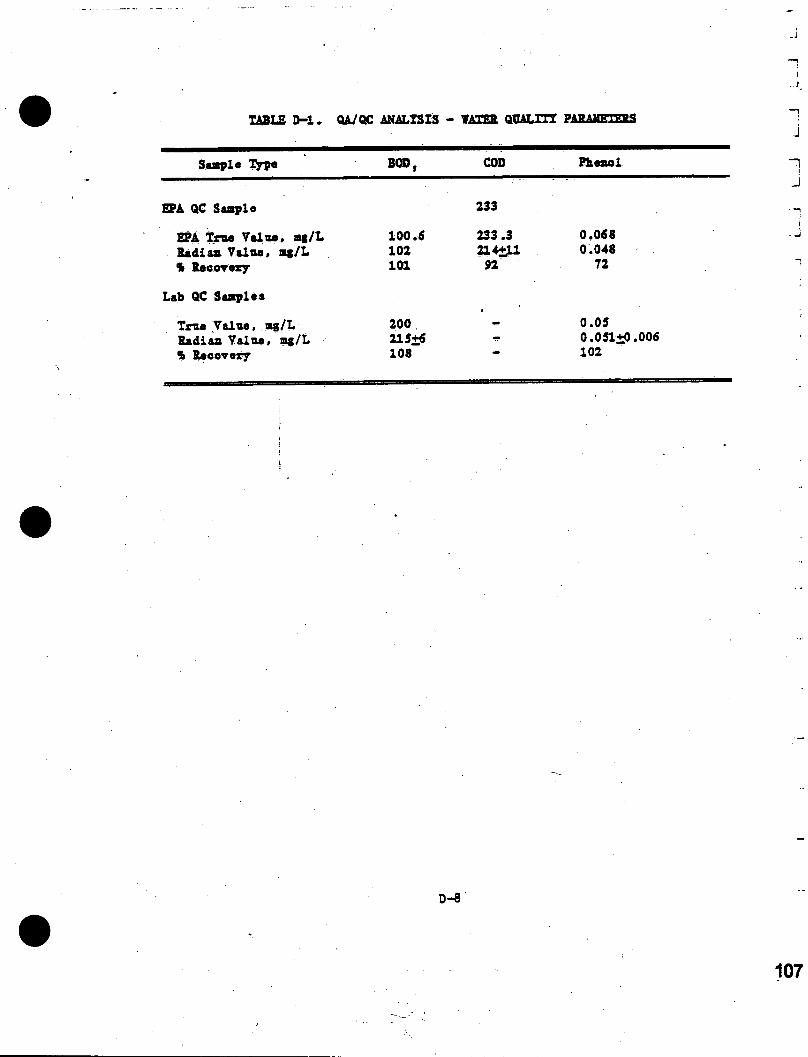
TABLE D-l. QA/QC ANALYSIS - WATER QUALITY PARAMETERS
Saaple Type BOD. COD Pbeaol
EPA QC Saaple
EPA True Value, ag/L Radian Value, ag/L % Recovery
Lab QC Sampler
True Value, ag/L Radian Value, ag/L % Recovery
100.6 102 101
200 215+5 108
233
233 .3 214+11 92
0.058 0.048 72
0.05 0.051+0.006 102
0-8
107

TABLE D-2. RESULTS OF WATER QUALITY ANALYSIS OF SAMPLE DUPLICATES DURING THE LIPABI TREATABILITY STUDY
Duplicates1 BOD, mg/L
COD mg/L
Phenol mg/L
TSS mg/L
Set 1 A 661 980 0.008' 1600 B 642 1010 <0.005 1680
Set 2 A 216 490 0.010' 4200 B ISO 402 <0.005 4100
Set 3 A 211 267 - _ 2000 Set 3 B 223 259 1750
Set 4 A 216 74 - 1720 Set 4 B 210 74 1550
Average % 6 7 - 8 Differences
'Duplicate sets were different for each parameter. 'Value less than two times the detection limit.
D-9
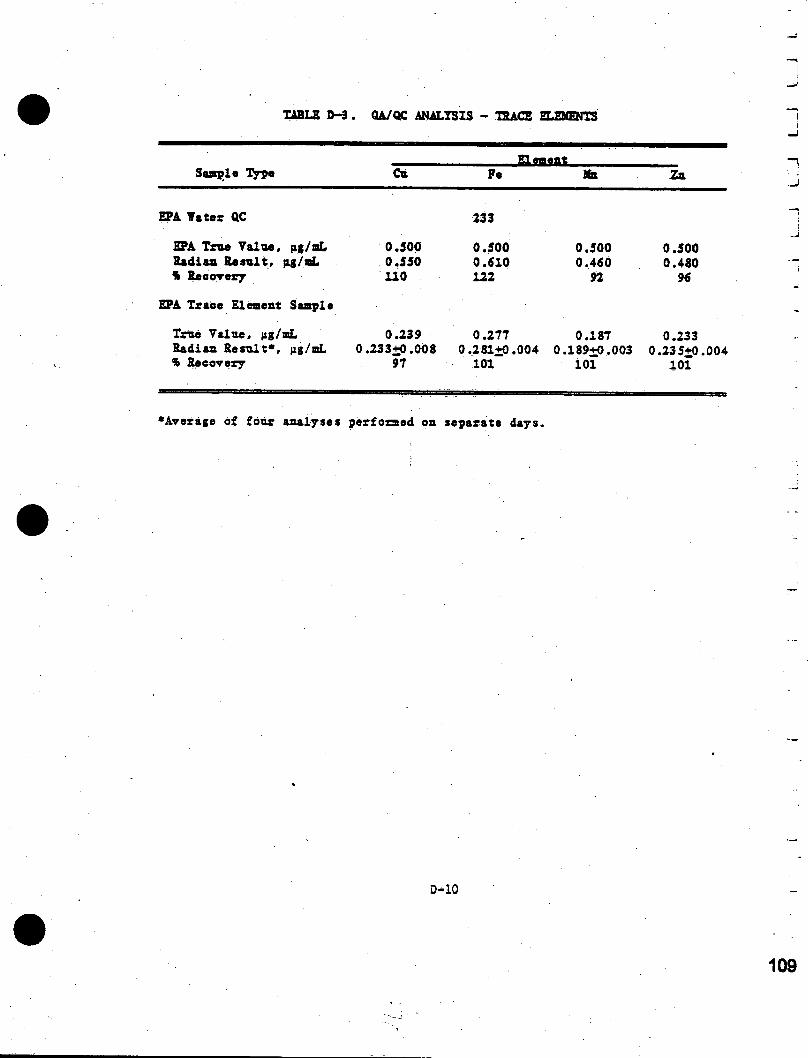
TABLE 0—3. QA/QC ANALYSIS - TRACE ELEMENTS
Saople Type Cu Element
Fe Za
EPA Water Q.C 233
EPA True Value, pg/aL Radiaa Result, ng/aL * Recovery
EPA Trace Element Sample
True Value, |ig/oL Radiaa Result", |ig/mL % Recovery
0.500 0.550 110
0.239
0.500 0.510 122
0.277
0.500 0.450 92
0.187
0.500 0.480 95
0.233 0.233+0.008 0.281+0.004 0.189+0,003 0.235+0.004
97 101 101 101
"Average of four analyses performed oa separate days.
D-10

TABLE D-4. RESULTS OF TRACE ELEMENT ANALYSTS OF SAMPLE DUPLICATES AND SPIKED DUPLICATES FROM TEE T.TPABT TREATABILITY STUDY
Element • S3 Efi . Mn Zn
Duplicates* pg/mL % fig/aL * pg/mL % pg/aL *
Set 1 A <0.001 - 0.014 - <0.001 - 0.018 B <0.001 - 0.010 - <0.001 - 0.010 C - 101 - 98 - 97 102
Set 2 A <0.01 - 0.47 - <0.001 - 0.014 B <0.001 - 0.47 - <0.001 - 0.015 C - 103 - 103 - 102 1 00
Set 3 A 0.018 - 0.72 - 0.033 - 0.12 B 0.017 - 0.72 - 0.033 - 0.12 C - 102 99 - 96 97
Set 4 A <0.001 - 1.8 - 0.008 - 0.040 B <0.001 - 1.8 - 0.009 - 0.041 G . - 104 - 105 - 98 100
Average % 6 2 10 1 6 2 22 0 Differences
•Back duplicate set consisted of a single sample split into three aliquots: A and B were analyzed as separate samples and C was spiked to a concentration of 0.25 pg/mL of an element prior to analysis.
D-ll

TABLE D-5. RESULTS QFME3HQD 602 ANLAISIS QF EPA OA SAMPLE
EPA Values
Coapouad
Theoretical Coaeeatratioa
M/l
9S% Coafideaee Iaterral
lig/L
Badiaa Aaalyzed Values
Day 1 Day 2 Ave*age % Recovery
Beazeaa 30.7 13.5-36.7 ' 21.6 33.7 90
Tolueae 4.1 1.6-7.7 7.2 4.7 145
Ethyl!) eaz eaa 11.5 7.2-12.9 8.4 10.4 82
p-Xyleae 19.5 12.4-28.8 ' 17.8 16.0 87
ar-Xy leae 42.6 33.5-60.5 43.2 62.8 125
d-Xyleae 10.6 7.7-17.1 12.7 10.3 108
D-12

• Results of Method 602 Analysis of EPA OA Sample
• Summary of Daily Analyses of Laboratory QC Samples
D.6 OTTAT.TTV CONTROL FOR AIR QPALTTT MFAgTTBFMgWPB
A quality control plan was implemented to assess the quality of data produced for air quality measurements. The specific objectives of the QC/QA procedures were to define the data variability, and to determine vhat, if any, components vera contributed to the data as a result of sampling and analysis procedures. Results of these QC procedures will be presented in this section.
Six blanh samples vere collected and analyzed during the course of this study. These were collected using the same equipment and procedures which were used for collecting samples; and analyzed in the same manner. The 6 blanks consisted of 5 ultra high purity (UEP) air samples and 1 water saar-ple. Results of the blank analyses are presented in Table D 7. Small amounts of the aromatic compounds were detected in the blanks. The highest blank concentration of an aromatic compound was 6.0 |ig/L for toluene. TNMHC values of the air blanks ranged from 24.4 to 154.6 ppbv-C. Generally, 100 ppbv-C is considered the quality control limit for blanks. One sample exceeded that level, primarily due to the amount of methylene chloride in that sample. From these analyses, it can be concluded that sampling and analytical procedures did not contribute significant levels of the compounds of interest.
A nested sampling and analysis procedure was implemented to assess data variability for observed compounds. The nested procedure involved collecting duplicate simultaneous samples, and analyzing each of these in duplicate. This procedure allowed an assessment of data variability associated with sample collection, sample analysis, and total data variability. One set of nested samples were performed on each reactor. Results of the nested analyses for Reactor 1 (samples 15 and 16) are presented in Table D-8. In this case, the only compounds which showed a total variance above 15% were
D-13

TABLB D-6. SUMMARY OF DAILY ANALYSES OF LABORATORY QC SAMPLES (EPA Method 602)
Low Standard Concentration. ua/L
Uigh Standard Concentration. ua/L
Compound Theoretical Average Found* Theoretical Average Found**
Benzene 16 14.2 ± 2.9 80 76 ± 10 Toluene 72 63.2 ±14.2 360 360 + 39
Ethyl Benzene 6 6.4 ± 0.7 30 2 9 + 6
p-Xylene 10 10.9 +1.2 SO 4 6 + 9 o-Xylene 7 7.0 + 0.7 35 3 1 + 3
*Av.erage of 6 separate analyses performed on different days. "Average of 10 separate analyses performed on different days.

TABLE I)-7. RESULTS OP SAHI'I.INC SYSTEM BLANKS
Dale Tint llBpU No. 8 topi • T»P* MoCla 1.2--Dlcbloc«r-Slb«D« lliUlloc«r o(fcyU«ll«r "Oansona Tolneat Btbyl-bttttWI atp~lylaaa a-Iylaaa Nalby batyl 1
All 09/22 16:11 0-1 21.4 21.4 ND NO 2.2 2.1 ND ND ND ND 09/22 ITtO) 0-2 42.1 10.2 NP NO ND ND ND ND 1.9 ND 10/11 14:11 0-1 24.4 NO NO ND ND NO QND ND ND ND 10/14 11:00 0-4 194.0 89.1 ND ND 4.1 6.0 ND 2.4 ND ND 10/19 11:00 0-9 62.4 91.1 NO ND
I41EI ND 1.1 1.2 2-2 ND ND
10/14 19:01 00.-1 2.1 1.1 ND 0.9 ND ND ND ND ND

TABLE D-B. RESULTS OE NESTED SAMPLE ANALYSIS ['OR REACTOR 1
Compound Varlaaoa Mo. H
Coos 1* Coua 2 Ma an KV1 Cobs 1 Cons 2 lleae tcv Coiii «lff Vifionto Msaa UV
Total Voriontf *CV
1,2-Disblorosthans 120 211 221 6.1 141 190 222 11.0 222 0.1 11.0
IHilablocostbyOstbsc Nil Nil - - ND Nil -
•iuim 24.0 21.1 21.6 1.1 26.9 21.6 24.1 11.4 24.0 2.1 1.1 Tolasas *1.6 81.6 92.6 1.1 114 91.1 106 11.6 99.1 9.1 10.1
HtbyIbeaieas 4.0 4.0 4.0 0.0 1.1 4.1 4.0 20.6 4.4 12.9 16.T
•tp-Xylana 10.2 9.0 10.0 2-8 11.0 11.1 14.1 19.1 12.1 24.1 21.0
o-Iylens 1.1 0.6 0.0 0.1 1.1 6.6 16.4 10.1
Na Iby11lobulyIts toaa 11.2 11.1 11.4 1.9 12.0 10.2 11.1 11.1 11.1 1.9 6.0
•All coaeaalratiea anils in ng/L 1B ill. »CV signlflsa sosffielsat of vsitallon.
ai i _i

ethylbenzene (17.7%), mtp-xylene (22.8%), and o—xylene (30.5%). These compounds are generally more reproducible, however low concentration* (4-10 ng/L) contributed to the.total variance. Results of the nested analyses for Reactor 2 (samples 10 and 11) are presented in Table D-9. In this ease, the only compounds which showed a total variance above 15% were benzene (18,1%) and bis(chloroethyl)etJier (36.0%).
In addition to the nested samples, one sample from reactor 2 (sample 6) was analyzed in duplicate, and an additional duplicate canister sample was collected from Reactor 1 (samples 23 and 24) and analyzed. Variance data from these samples were combined with the nested variance data using pooled coefficients of variation (CV). Combined analytical variances are presented in Table D-10. In general, variances for data collected from Reactor 1 were higher than those for Reactor 2, due to the lower concentrations encountered from reactor 1. The pooled analytical variance for Reactor 1 was 18% and fox Reactor 2 was 7.5%. The pooled analytical variance for all compounds excluding bis(chloroethyl)ether was 13.8%. Bis(chloroethyl)ether was only observed in the air in Reactor 2, with an analytical variance of 48%.
A summary of variances associated with sample collection is presented in Table D-ll. In general, these data were slightly less than analytical variances. The pooled sampling variance for all compounds was 10.2%, compared to 13.8% for the analytical variance. It should be noted that the procedure used to bteah out sampling variances also includes a portion of the analytical variances. However, it does provide an appropriate approximation.
A summary of t&c total variances for all data is presented in Table 0-12. Total variances (sampling and analysis) could only be obtained from the nested samples, using a direct coefficient of variation fox the 4 analyses. Results from Reactor 1 and Reactor 2 were then pooled. Total variances for Reactor 1 ranged from 6.8% to 30.5% with a pooled variance for all compounds of 18.0%. Total variances for Reactor 2 ranged from 1.7% to 18,1%, with a pooled variance of 9.7% (excluding bis(chloroethyl)ether). Combined total variances ranged from 6.3% to 22.5%, with a pooled variance of 14.4%. This is
D-17
116

• •
TABLE l)-9. RESULTS OE NESTED SAMPLE ANALYSIS EC)II REACTOR 2
Coapaaad 10 SaainlB 11 Fiololir Virions*
Told Virlini
Coapaaad COBS 1< > CUIID 2 Naaa *CV* COBO 1 Cooa 2 Moan «V Usaa tcv tcv
t ,2-Dlcblucoolbaoa 3010 2040 2933 3.3 2030 3020 2933 4.1 2943° 0.3 4.0
23.6 16.0 20.2 23.0 34.3 39.6 31.1 9.7 28.1 41.1 36.0
Boaaeae III 130 131 19.3 130 112 112 9.9 131 13.0 10.1
Tolasbb 313 339 336 6.0 333 361 331 6.4 334 1.0 3.3
Hi bylbooaooo 13.0 13.3 13.2 1.6 13.1 13.3 11.3 2.1 13.3 0.3 1.1
artp-lyleos 30.1 29.0 29.9 4.0 32.0 32.3 323.1 1.1 31.1 3.3 3.0
o-Iyloos 14.1 13.4 13.0 3.6 14.1 16.4 13.1 10.1 14.6 1.3 9.0
llalbylisubatyl kotooa 34.2 40.0 31.1 0.6 34.6 32 .6 31.6 2.6 32.4 1.4 3.0
'All ConctalnllM anlla arc ay/l.. •I'V tifuiMaa CMKUIOI of ntlillua.

TABLE D—10. SUMMARY OF ANALYTICAL VARIABILITY FOB ORGANIC COMPOUND DETERMINATIONS IN AIR
• Reactor l1 Reactor 2s Combined Compound C% CV)» <% CV) <% CV)
1,2-Diehloroethane 13.8 4.9 10.4
Bis(chloroethyl)ether - 48.1 48.1
Benzene 9.3 12.6 11.1
Toluene 10.3 5.7 8.3
Ethylbenxene 16.7 2.8 12.0
m»p- Xylene 27.8 3.1 19.8
©-Xylene 30.5 2.8 21.7 i
Methylisobutyl ketone 6.8 5.2 6.1
Pooled Variance4 18.0% .715% 13.8%
Result of duplicate analyses of samples 15 and 16. 'Result of duplicate analyses of samples 6, 10, and 11. 'CV signifies coefficient of Variation. 4 Re suit, excludes bis (chloroethyl) ether.
D-19

TABU D—11. SUMMAR1 OF SAMPLING VARIABILITY FOR ORGANIC COMPOUND DETERMINATIONS IN AIR
Compound Reactor lx (% CV) *
1,2-Diehloroethane 2.5
Bis (chloroe thy 1) ether -
Benzene 4.4
Toluene 7.4
Ethylbenzene 9.6
mv Xylene 17.5
Xylene 26.1
Methylisobutyl ketone 8.7
Pooled Variance4 12.6%
Reactor 2* (% CV)
0.5
41.7
15.0
1.0
0.5
5.5
7.3
7.1%
'Result of simultaneona samples 15 *• 16, «««< 23 'Result of simnltaneona samples 10-11. 'CV signifies coefficient of variation. •Result excludes bis(chloroethyl)ether.
- 24.
Combined (% CV)
1.3
41.7
11.1
5.3
6.8
13.0
13.2
6 . 6
10.2%
D-20
119

TABLE D—12. SUMMARY OF TOTAL VARIABILITY FOR ORGANIC COMPOUND DETERMINATIONS IN AIR
Compound Reactor l1 <% CV) *
Reactor 2* (% CV)
Combined (% CV)
1,2-Diciloroeth.ane 13.8
Bis(cRlofoetityl)etlier -
Benzene 9.3
Toluene 10.3
Etfcylbenzene 16.7
m*p-Xylene 27.8
o-Xylene 30.5
Metiylisobutyl ketone 6.8
Pooled Variance4 18.0%
4.0
36.0
18.1
5.5
1.7
5.0
9.0
-LA 9.7%
10.2 36.0
14.4
8.3
UJ'
19.7
22.5
-Sol 14.4%
xResult of nested samples 15 and 16. Result of nested samples 10 and 11. 1CV signifies coefficient of variation. 4Result excludes bis(ch.1 oroethy 1)ether.
D-21

the mean data variation which can be expected for any data produced during the air quality portion of the study. Hie total variation for bis(chloroethyl) ether vas 36%.
D-22
Related Documents