APPENDIX Assessment of Methods to Collect and Analyze Perfluoroalkyl and Polyfluoroalkyl Substances (PFASs) in Air, Dust and Soil Final Report Agreement Number 19RD019 Principal Investigator: Asa Bradman, PhD, MS Center for Environmental Research and Children’s Health University of California - Berkeley February 2021 Prepared for the California Air Resources Board (CARB) Report Authors Asa Bradman, PhD Rosemary Castorina, PhD Teja Pattabhiraman Anuroop Nirula Monice Wong, B.A. Sion Calabretta Center for Environmental Research and Children’s Health University of California - Berkeley 1995 University Avenue, Suite 265 Berkeley, CA 94704

Welcome message from author
This document is posted to help you gain knowledge. Please leave a comment to let me know what you think about it! Share it to your friends and learn new things together.
Transcript

APPENDIX
Assessment of Methods to Collect and Analyze Perfluoroalkyl and PolyfluoroalkylSubstances (PFASs) in Air, Dust and Soil
Final Report
Agreement Number 19RD019
Principal Investigator: Asa Bradman, PhD, MS Center for Environmental Research and Children’s Health
University of California - Berkeley
February 2021
Prepared for the California Air Resources Board (CARB)
Report Authors
Asa Bradman, PhD
Rosemary Castorina, PhD
Teja Pattabhiraman
Anuroop Nirula
Monice Wong, B.A.
Sion Calabretta
Center for Environmental Research and Children’s Health
University of California - Berkeley
1995 University Avenue, Suite 265
Berkeley, CA 94704

APPENDIX Table of Contents
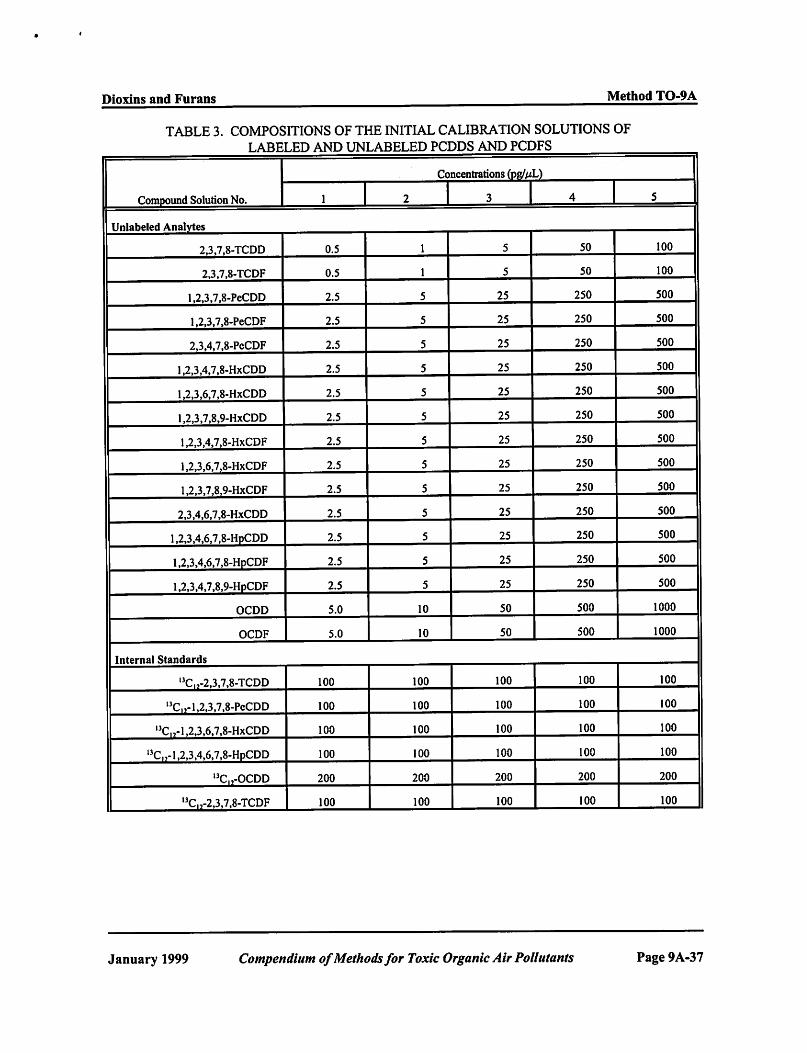
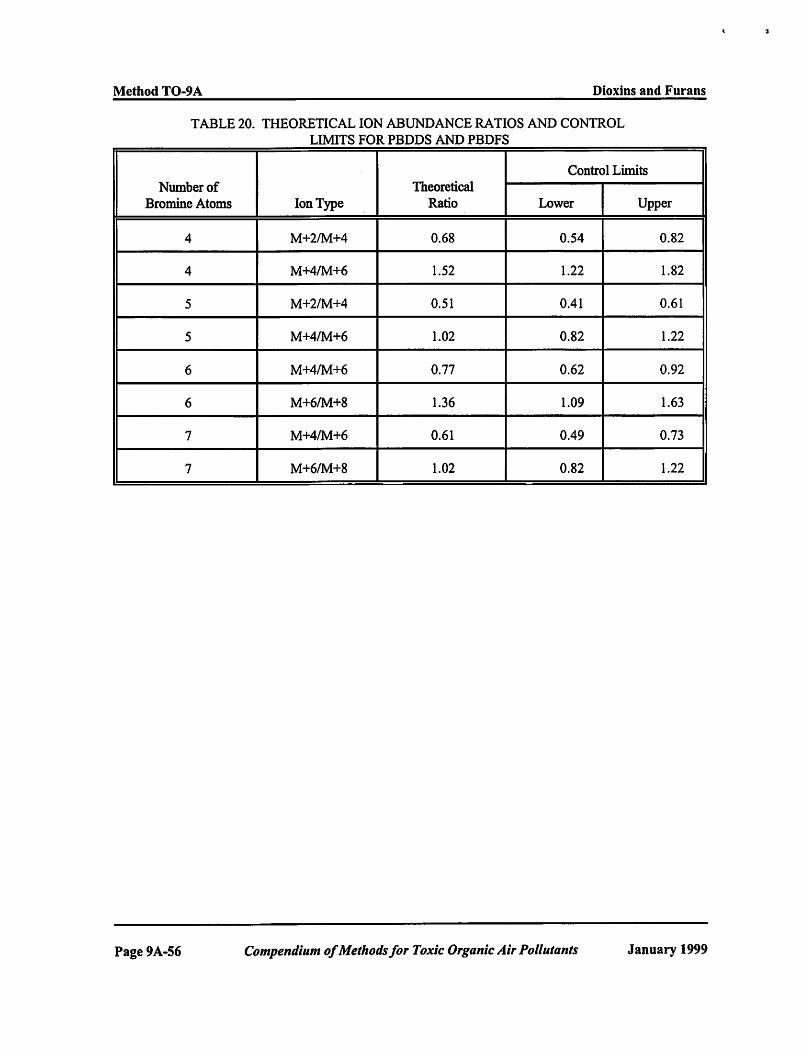
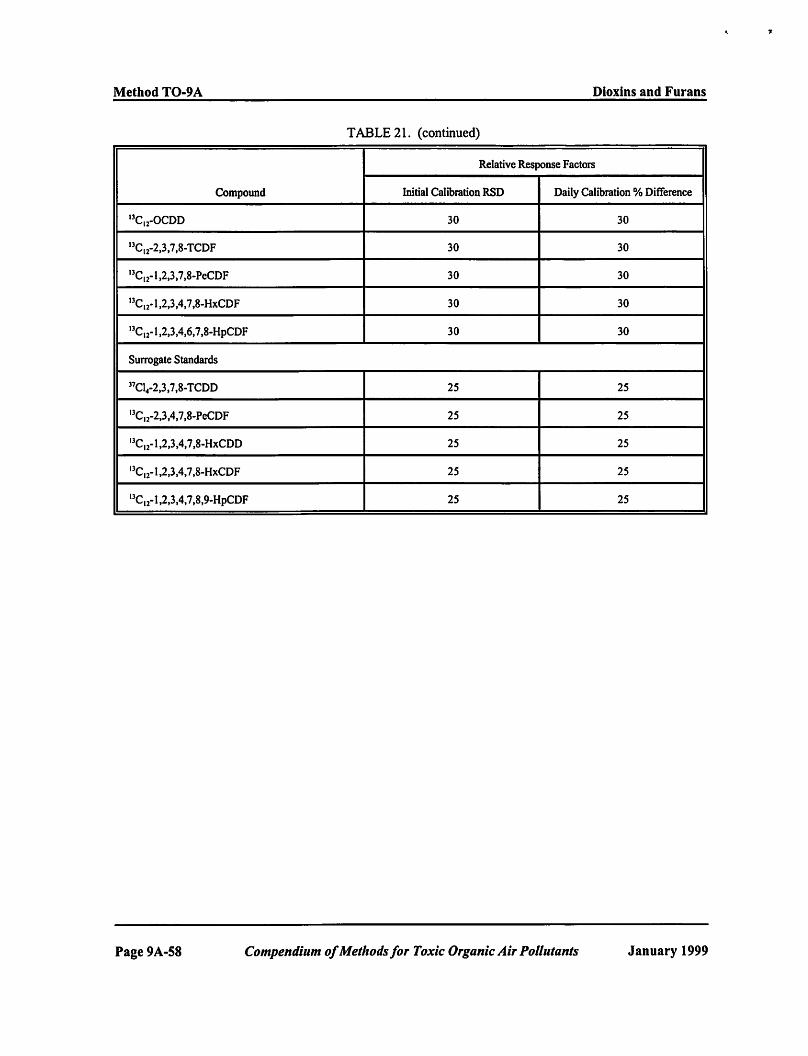
US EPA. 1999. Compendium of Methods for the Determination of Toxic Organic Compounds in Ambient Air. Second Edition. Compendium Method TO-9A. Determination of Polychlorinated, Polybrominated and Brominated/Chlorinated Dibenzo-p-Dioxins and Dibenzofurans in Ambient Air.
US EPA. 1999. Compendium of Methods for the Determination of Toxic Organic Compounds in Ambient Air. Second Edition. Compendium Method TO-13A. Determination of Polycyclic Aromatic Hydrocarbons (PAHs) in Ambient Air Using Gas Chromatography/Mass Spectrometry (GC/MS).
US EPA. 2021. Other Test Method 45 (OTM-45) Measurement of Selected Per- and Polyfluorinated Alkyl Substances from Stationary Sources


EPA/625/R-96/010b
Compendium of Methods for the Determination of
Toxic Organic Compounds in Ambient Air
Second Edition
Compendium Method TO-13A
Determination of Polycyclic Aromatic Hydrocarbons (PAHs) in Ambient Air Using Gas Chromatography/Mass Spectrometry (GC/MS)
Center for Environmental Research Information Office of Research and Development
U.S. Environmental Protection Agency Cincinnati, OH 45268
January 1999

Method TO-13A Acknowledgements
This Method was prepared for publication in the Compendium of Methods for the Determination of Toxic Organic Compounds in Ambient Air, Second Edition (EPA/625/R-96/010b), under Contract No. 68-C3-0315, WA No. 3-10, by Midwest Research Institute (MRI), as a subcontractor to Eastern Research Group, Inc. (ERG), and under the sponsorship of the U.S. Environmental Protection Agency (EPA). Justice A. Manning, John O. Burckle, and Scott R. Hedges, Center for Environmental Research Information (CERI), and Frank F. McElroy, National Exposure Research Laboratory (NERL), all in the EPA Office of Research and Development (ORD), were responsible for overseeing the preparation of this method. Additional support was provided by other members of the Compendia Workgroup, which include:
• John O. Burckle, U.S. EPA, ORD, Cincinnati, OH • James L. Cheney, Corps of Engineers, Omaha, NB • Michael Davis, U.S. EPA, Region 7, KC, KS • Joseph B. Elkins Jr., U.S. EPA, OAQPS, RTP, NC • Robert G. Lewis, U.S. EPA, NERL, RTP, NC • Justice A. Manning, U.S. EPA, ORD, Cincinnati, OH • William A. McClenny, U.S. EPA, NERL, RTP, NC • Frank F. McElroy, U.S. EPA, NERL, RTP, NC • Heidi Schultz, ERG, Lexington, MA • William T. "Jerry" Winberry, Jr., EnviroTech Solutions, Cary, NC
Method TO-13 was originally published in March of 1989 as one of a series of peer-reviewed methods in the second supplement to Compendium of Methods for the Determination of Toxic Organic Compounds in Ambient Air, EPA 600/4-89-018. In an effort to keep these methods consistent with current technology, Method TO-13 has been revised and updated as Method TO-13A in this Compendium to incorporate new or improved sampling and analytical technologies.
This method is the result of the efforts of many individuals. Gratitude goes to each person involved in the preparation and review of this methodology.
Author(s) • William T. "Jerry" Winberry, Jr., EnviroTech Solutions, Cary, NC • Greg Jungclaus, Midwest Research Institute, Kansas City, MO
Peer Reviewers • Nancy Wilson, U.S. EPA, NERL, RTP, NC • Joan Bursey, ERG, Morrisville, NC • Irene D. DeGraff, Supelco, Bellefonte, PA • Jane Chuang, Battelle Laboratories, Cincinnati, OH • Robert G. Lewis, U.S. EPA, NERL, RTP, NC • Lauren Drees, U.S. EPA, NRMRL, Cincinnati, OH
ii

Finally, recognition is given to Frances Beyer, Lynn Kaufman, Debbie Bond, Cathy Whitaker, and Kathy Johnson of Midwest Research Institute's Administrative Services staff whose dedication and persistence during the development of this manuscript has enabled its production.
DISCLAIMER
This Compendium has been subjected to the Agency's peer and administrative review, and it has been approved for publication as an EPA document. Mention of trade names or commercial products does not constitute endorsement or recommendation for use.
iii

This page intentionally left blank
iv
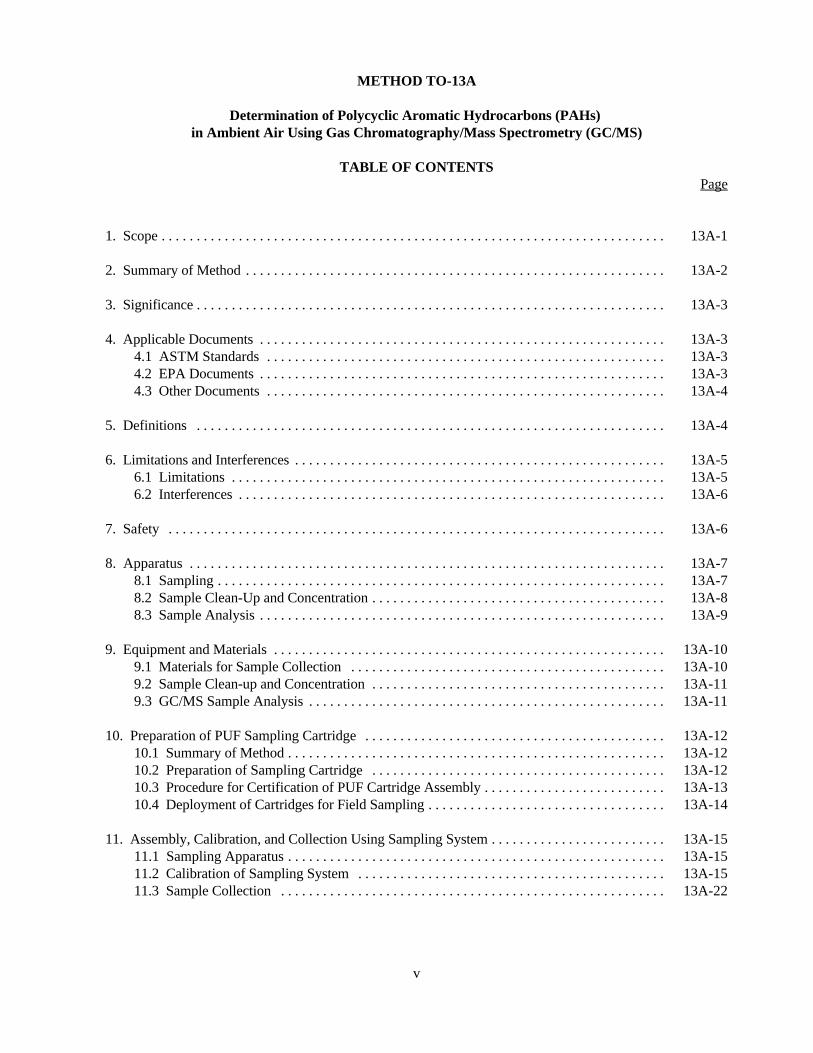
METHOD TO-13A
Determination of Polycyclic Aromatic Hydrocarbons (PAHs) in Ambient Air Using Gas Chromatography/Mass Spectrometry (GC/MS)
TABLE OF CONTENTS Page
1. Scope . . . . . . . . . . . . . . . . . . . . . . . . . . . . . . . . . . . . . . . . . . . . . . . . . . . . . . . . . . . . . . . . . . . . . . . . 13A-1
2. Summary of Method . . . . . . . . . . . . . . . . . . . . . . . . . . . . . . . . . . . . . . . . . . . . . . . . . . . . . . . . . . . . 13A-2
3. Significance . . . . . . . . . . . . . . . . . . . . . . . . . . . . . . . . . . . . . . . . . . . . . . . . . . . . . . . . . . . . . . . . . . . 13A-3
4. Applicable Documents . . . . . . . . . . . . . . . . . . . . . . . . . . . . . . . . . . . . . . . . . . . . . . . . . . . . . . . . . . 13A-3 4.1 ASTM Standards . . . . . . . . . . . . . . . . . . . . . . . . . . . . . . . . . . . . . . . . . . . . . . . . . . . . . . . . . 13A-3 4.2 EPA Documents . . . . . . . . . . . . . . . . . . . . . . . . . . . . . . . . . . . . . . . . . . . . . . . . . . . . . . . . . . 13A-3 4.3 Other Documents . . . . . . . . . . . . . . . . . . . . . . . . . . . . . . . . . . . . . . . . . . . . . . . . . . . . . . . . . 13A-4
5. Definitions . . . . . . . . . . . . . . . . . . . . . . . . . . . . . . . . . . . . . . . . . . . . . . . . . . . . . . . . . . . . . . . . . . . 13A-4
6. Limitations and Interferences . . . . . . . . . . . . . . . . . . . . . . . . . . . . . . . . . . . . . . . . . . . . . . . . . . . . . 13A-5 6.1 Limitations . . . . . . . . . . . . . . . . . . . . . . . . . . . . . . . . . . . . . . . . . . . . . . . . . . . . . . . . . . . . . . 13A-5 6.2 Interferences . . . . . . . . . . . . . . . . . . . . . . . . . . . . . . . . . . . . . . . . . . . . . . . . . . . . . . . . . . . . . 13A-6
7. Safety . . . . . . . . . . . . . . . . . . . . . . . . . . . . . . . . . . . . . . . . . . . . . . . . . . . . . . . . . . . . . . . . . . . . . . . 13A-6
8. Apparatus . . . . . . . . . . . . . . . . . . . . . . . . . . . . . . . . . . . . . . . . . . . . . . . . . . . . . . . . . . . . . . . . . . . . 13A-7 8.1 Sampling . . . . . . . . . . . . . . . . . . . . . . . . . . . . . . . . . . . . . . . . . . . . . . . . . . . . . . . . . . . . . . . . 13A-7 8.2 Sample Clean-Up and Concentration . . . . . . . . . . . . . . . . . . . . . . . . . . . . . . . . . . . . . . . . . . 13A-8 8.3 Sample Analysis . . . . . . . . . . . . . . . . . . . . . . . . . . . . . . . . . . . . . . . . . . . . . . . . . . . . . . . . . . 13A-9
9. Equipment and Materials . . . . . . . . . . . . . . . . . . . . . . . . . . . . . . . . . . . . . . . . . . . . . . . . . . . . . . . . 13A-10 9.1 Materials for Sample Collection . . . . . . . . . . . . . . . . . . . . . . . . . . . . . . . . . . . . . . . . . . . . . 13A-10 9.2 Sample Clean-up and Concentration . . . . . . . . . . . . . . . . . . . . . . . . . . . . . . . . . . . . . . . . . . 13A-11 9.3 GC/MS Sample Analysis . . . . . . . . . . . . . . . . . . . . . . . . . . . . . . . . . . . . . . . . . . . . . . . . . . . 13A-11
10. Preparation of PUF Sampling Cartridge . . . . . . . . . . . . . . . . . . . . . . . . . . . . . . . . . . . . . . . . . . . 13A-12 10.1 Summary of Method . . . . . . . . . . . . . . . . . . . . . . . . . . . . . . . . . . . . . . . . . . . . . . . . . . . . . . 13A-12 10.2 Preparation of Sampling Cartridge . . . . . . . . . . . . . . . . . . . . . . . . . . . . . . . . . . . . . . . . . . 13A-12 10.3 Procedure for Certification of PUF Cartridge Assembly . . . . . . . . . . . . . . . . . . . . . . . . . . 13A-13 10.4 Deployment of Cartridges for Field Sampling . . . . . . . . . . . . . . . . . . . . . . . . . . . . . . . . . . 13A-14
11. Assembly, Calibration, and Collection Using Sampling System . . . . . . . . . . . . . . . . . . . . . . . . . 13A-15 11.1 Sampling Apparatus . . . . . . . . . . . . . . . . . . . . . . . . . . . . . . . . . . . . . . . . . . . . . . . . . . . . . . 13A-15 11.2 Calibration of Sampling System . . . . . . . . . . . . . . . . . . . . . . . . . . . . . . . . . . . . . . . . . . . . 13A-15 11.3 Sample Collection . . . . . . . . . . . . . . . . . . . . . . . . . . . . . . . . . . . . . . . . . . . . . . . . . . . . . . . 13A-22
v

TABLE OF CONTENTS, CONTINUED
Page
12. Sample Extraction, Concentration, and Cleanup . . . . . . . . . . . . . . . . . . . . . . . . . . . . . . . . . . . . . 13A-23 12.1 Sample Identification . . . . . . . . . . . . . . . . . . . . . . . . . . . . . . . . . . . . . . . . . . . . . . . . . . . . . 13A-23 12.2 Soxhlet Extraction and Concentration . . . . . . . . . . . . . . . . . . . . . . . . . . . . . . . . . . . . . . . . 13A-24 12.3 Sample Cleanup . . . . . . . . . . . . . . . . . . . . . . . . . . . . . . . . . . . . . . . . . . . . . . . . . . . . . . . . . 13A-25
13. Gas Chromatography with Mass Spectrometry Detection . . . . . . . . . . . . . . . . . . . . . . . . . . . . . . 13A-26 13.1 General . . . . . . . . . . . . . . . . . . . . . . . . . . . . . . . . . . . . . . . . . . . . . . . . . . . . . . . . . . . . . . . . 13A-26 13.2 Calibration of GC/MS/DS . . . . . . . . . . . . . . . . . . . . . . . . . . . . . . . . . . . . . . . . . . . . . . . . . 13A-26 13.3 GC/MS Instrument Operating Conditions . . . . . . . . . . . . . . . . . . . . . . . . . . . . . . . . . . . . . 13A-29 13.4 Sample Analysis by GC/MS . . . . . . . . . . . . . . . . . . . . . . . . . . . . . . . . . . . . . . . . . . . . . . . 13A-37
14. Quality Assurance/Quality Control (QA/QC) . . . . . . . . . . . . . . . . . . . . . . . . . . . . . . . . . . . . . . . 13A-41 14.1 General System QA/QC . . . . . . . . . . . . . . . . . . . . . . . . . . . . . . . . . . . . . . . . . . . . . . . . . . . 13A-41 14.2 Process, Field, and Solvent Blanks . . . . . . . . . . . . . . . . . . . . . . . . . . . . . . . . . . . . . . . . . . 13A-42
15. References . . . . . . . . . . . . . . . . . . . . . . . . . . . . . . . . . . . . . . . . . . . . . . . . . . . . . . . . . . . . . . . . . . . 13A-42
vi

METHOD TO-13A
Determination of Polycyclic Aromatic Hydrocarbons (PAHs) in Ambient Air Using Gas Chromatography/Mass Spectrometry (GC/MS)
1. Scope
1.1 Polycyclic aromatic hydrocarbons (PAHs) have received increased attention in recent years in air pollution studies because some of these compounds are highly carcinogenic or mutagenic. In particular, benzo[a]pyrene (B[a]P) has been identified as being highly carcinogenic. To understand the extent of human exposure to B[a]P and other PAHs, reliable sampling and analytical methods are necessary. This document describes a sampling and analysis procedure for common PAHs involving the use of a combination of quartz filter and sorbent cartridge with subsequent analysis by gas chromatography with mass spectrometry (GC/MS) detection. The analytical methods are modifications of EPA Test Method 610 and 625, Methods for Organic Chemical Analysis of Municipal and Industrial Wastewater, and Methods 8000, 8270, and 8310, Test Methods for Evaluation of Solid Waste.
1.2 Fluorescence methods were among the very first methods used for detection of B[a]P and other PAHs as carcinogenic constituents of coal tar (1-7). Fluorescence methods are capable of measuring subnanogram quantities of PAHs, but tend to be fairly non-selective. The normal spectra obtained are often intense and lack resolution. Efforts to overcome this difficulty led to the use of ultraviolet (UV) absorption spectroscopy (8) as the detection method coupled with pre-speciated techniques involving liquid chromatography (LC) and thin layer chromatography (TLC) to isolate specific PAHs, particularly B[a]P. As with fluorescence spectroscopy, the individual spectra for various PAHs are unique, although portions of spectra for different compounds may be the same. As with fluorescence techniques, the possibility of spectral overlap requires complete separation of sample components to ensure accurate measurement of component levels. Hence, the use of UV absorption coupled with pre-speciation involving LC and TLC and fluorescence spectroscopy declined and was replaced with the more sensitive high performance liquid chromatography (HPLC) with UV/fluorescence detection (9) or highly sensitive and specific gas chromatography/mass spectrometry (GC/MS) for detection (10-11).
1.3 The choice of GC/MS as the recommended procedure for analysis of B[a]P and other PAHs was influenced by its sensitivity and selectivity, along with its ability to analyze complex samples.
1.4 The analytical methodology has consequently been defined, but the sampling procedures can reduce the validity of the analytical results. Recent studies (12-17) have indicated that non-volatile PAHs (vapor pressure <10-8 mm Hg) may be trapped on the filter, but post-collection volatilization problems may distribute the PAHs downstream of the filter to the back-up sorbent. A wide variety of sorbents such as Tenax®, XAD-2® and polyurethane foam (PUF) have been used to sample common PAHs. All sorbents have demonstrated high collection efficiency for B[a]P in particular. In general, XAD-2® resin has a higher collection efficiency (18-21) for volatile PAHs than PUF, as well as a higher retention efficiency. PUF cartridges, however, are easier to handle in the field and maintain better flow characteristics during sampling. Likewise, PUF has demonstrated (22) its capability in sampling organochlorine pesticides, polychlorinated biphenyls (22), and polychlorinated dibenzo-p-dioxins (23). PUF also has demonstrated a lower recovery efficiency and storage capability for naphthalene than XAD-2®. There have been no significant losses of PAHs up to 30 days of storage at room temperature (23EC) using XAD-2®. It also appears that XAD-2® resin has a higher collection efficiency for volatile PAHs than PUF, as well as a higher retention efficiency for both volatile and reactive PAHs.
January 1999 Compendium of Methods for Toxic Organic Air Pollutants Page 13A-1
Method TO-13A PAHs
Consequently, while the literature cites weaknesses and strengths of using either XAD-2® or PUF, this method includes the utilization of PUF as the primary sorbent.
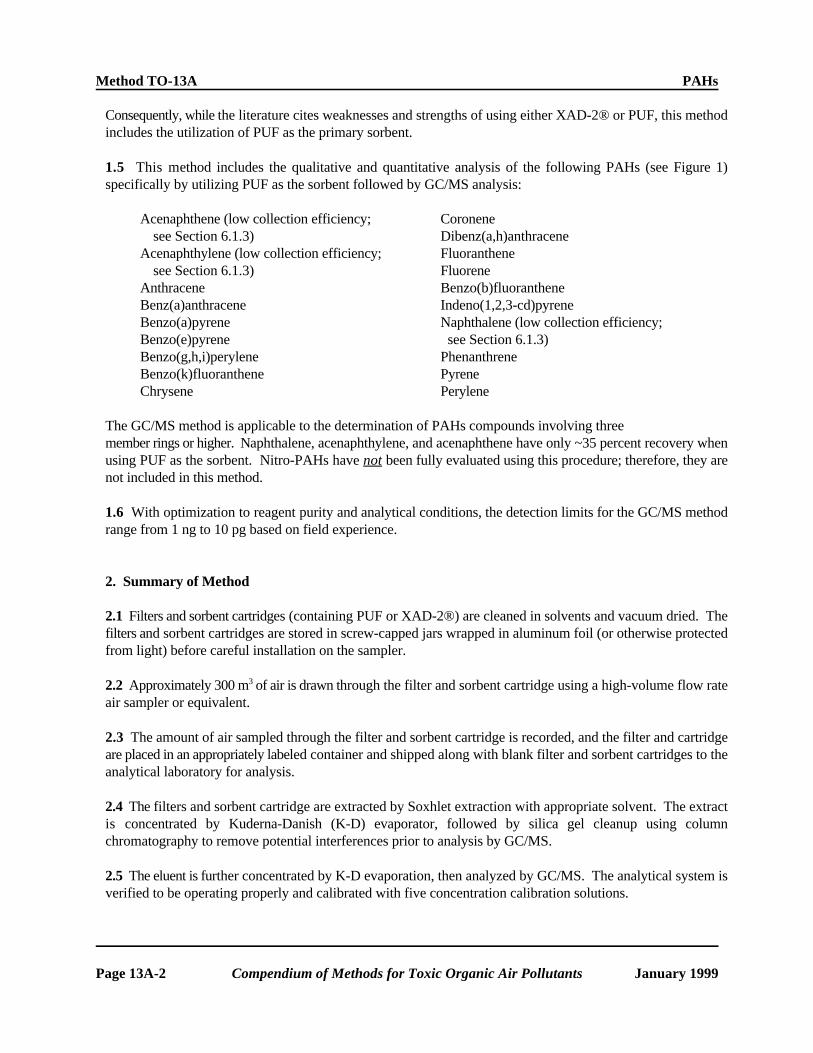
1.5 This method includes the qualitative and quantitative analysis of the following PAHs (see Figure 1) specifically by utilizing PUF as the sorbent followed by GC/MS analysis:
Acenaphthene (low collection efficiency; Coronene see Section 6.1.3) Dibenz(a,h)anthracene
Acenaphthylene (low collection efficiency; Fluoranthene see Section 6.1.3) Fluorene
Anthracene Benzo(b)fluoranthene Benz(a)anthracene Indeno(1,2,3-cd)pyrene Benzo(a)pyrene Naphthalene (low collection efficiency; Benzo(e)pyrene see Section 6.1.3) Benzo(g,h,i)perylene Phenanthrene Benzo(k)fluoranthene Pyrene Chrysene Perylene
The GC/MS method is applicable to the determination of PAHs compounds involving three member rings or higher. Naphthalene, acenaphthylene, and acenaphthene have only ~35 percent recovery when using PUF as the sorbent. Nitro-PAHs have not been fully evaluated using this procedure; therefore, they are not included in this method.
1.6 With optimization to reagent purity and analytical conditions, the detection limits for the GC/MS method range from 1 ng to 10 pg based on field experience.
2. Summary of Method
2.1 Filters and sorbent cartridges (containing PUF or XAD-2®) are cleaned in solvents and vacuum dried. The filters and sorbent cartridges are stored in screw-capped jars wrapped in aluminum foil (or otherwise protected from light) before careful installation on the sampler.
2.2 Approximately 300 m3 of air is drawn through the filter and sorbent cartridge using a high-volume flow rate air sampler or equivalent.
2.3 The amount of air sampled through the filter and sorbent cartridge is recorded, and the filter and cartridge are placed in an appropriately labeled container and shipped along with blank filter and sorbent cartridges to the analytical laboratory for analysis.
2.4 The filters and sorbent cartridge are extracted by Soxhlet extraction with appropriate solvent. The extract is concentrated by Kuderna-Danish (K-D) evaporator, followed by silica gel cleanup using column chromatography to remove potential interferences prior to analysis by GC/MS.
2.5 The eluent is further concentrated by K-D evaporation, then analyzed by GC/MS. The analytical system is verified to be operating properly and calibrated with five concentration calibration solutions.
Page 13A-2 Compendium of Methods for Toxic Organic Air Pollutants January 1999

PAHs Method TO-13A
2.6 A preliminary analysis of the sample extract is performed to check the system performance and to ensure that the samples are within the calibration range of the instrument. If the preliminary analysis indicates non-performance, then recalibrate the instrument, adjust the amount of the sample injected, adjust the calibration solution concentration, and adjust the data processing system to reflect observed retention times, etc.
2.7 The samples and the blanks are analyzed and used (along with the amount of air sampled) to calculate the concentration of PAHs in the air sample.
3. Significance
3.1 As discussed in Section 1, several documents have been published that describe sampling and analytical approaches for common PAHs. The attractive features of these methods have been combined in this procedure. Although this method has been validated in the laboratory, one must use caution when employing it for specific applications.
3.2 Because of the relatively low levels of common PAHs in the environment, the methodology suggest the use 3of high volume (0.22 m /min) sampling technique to acquire sufficient sample for analysis. However, the
volatility of certain PAHs prevents efficient collection on filter media alone. Consequently, this method utilizes both a filter and a backup sorbent cartridge, which provides for efficient collection of most PAHs involving three member rings or higher.
4. Applicable Documents
4.1 ASTM Standards
• Method D1356 Definitions of Terms Relating to Atmospheric Sampling and Analysis. • Method 4861-94 Standard Practice for Sampling and Analysis of Pesticides and Polychlorinated
Biphenyl in Air • Method E260 Recommended Practice for General Gas Chromatography Procedures. • Method E355 Practice for Gas Chromatography Terms and Relationships. • Method E682 Practice for Liquid Chromatography Terms and Relationships.
4.2 EPA Documents
• Technical Assistance Document for Sampling and Analysis of Toxic Organic Compounds in Ambient Air, U. S. Environmental Protection Agency, EPA-600/4-83-027, June 1983.
• Quality Assurance Handbook for Air Pollution Measurement Systems, U. S. Environmental Protection Agency, EPA-600/R-94-038b, May 1994.
• Compendium of Methods for the Determination of Toxic Organic Compounds in Ambient Air: Method TO-13, Second Supplement, U. S. Environmental Protection Agency, EPA-600/-4-89-018, March 1989.
January 1999 Compendium of Methods for Toxic Organic Air Pollutants Page 13A-3

Method TO-13A PAHs
4.3 Other Documents
• Existing Procedures (24-32). • Ambient Air Studies (33-50). • General Metal Works, Inc., "Operating Procedures for Model PS-1 Sampler," Village of Cleves, OH
45002 (800-543-7412). • Illinois Environmental Protection Agency, Division of Air Quality, "Chicago Air Quality: PCB Air
Monitoring Plan (Phase 2)," Chicago, IL, IEAP/APC/86/011, April 1986. • Thermo Environmental, Inc. (formerly Wedding and Associates), "Operating Procedures for the Thermo
Environmental Semi-Volatile Sampler," 8 West Forge Parkway, Franklin, MA 02038 (508-520-0430). • American Chemical Society (ACS), "Sampling for Organic Chemicals in Air," ACS Professional Book,
ACS, Washington, D.C., 1996. • International Organization for Standardization (ISO), "Determination of Gas and Particle-Phase
Polynuclear Aromatic Hydrocarbons in Ambient Air - Collected on Sorbent-Backed Filters with Gas Chromatographic/Mass Spectrometric Analysis," ISO/TC 146/SC 3/WG 17N, Case Postale 56, CH-1211, Genève 20, Switzerland.
5. Definitions
[Note: Definitions used in this document and in any user-prepared standard operating procedures (SOPs) should be consistent with ASTM Methods D1356, E260, and E255. All abbreviations and symbols are defined within this document at point of use.]
5.1 Retention time (RT)-time to elute a specific chemical from a chromatographic column. For a specific carrier gas flow rate, RT is measured from the time the chemical is injected into the gas stream until it appears at the detector.
5.2 Sampling efficiency (SE)-ability of the sampler to trap and retain PAHs. The %SE is the percentage of the analyte of interest collected and retained by the sampling medium when it is introduced into the air sampler and the sampler is operated under normal conditions for a period of time equal to or greater than that required for the intended use.
5.3 Dynamic retention efficiency-ability of the sampling medium to retain a given PAH that has been added to the sorbent trap in a spiking solution when air is drawn through the sampler under normal conditions for a period of time equal to or greater than that required for the intended use.
5.4 Polycyclic aromatic hydrocarbons (PAHs)-two or more fused aromatic rings.
5.5 Method detection limit (MDL)-the minimum concentration of a substance that can be measured and reported with confidence and that the value is above zero.
5.6 Kuderna-Danish apparatus-the Kuderna-Danish (K-D) apparatus is a system for concentrating materials dissolved in volatile solvents.
5.7 MS-SCAN-the GC is coupled to a mass spectrometer where the instrument is programmed to acquire all ion data.
Page 13A-4 Compendium of Methods for Toxic Organic Air Pollutants January 1999

PAHs Method TO-13A
5.8 Sublimation-the direct passage of a substance from the solid state to the gaseous state and back into the solid form without at any time appearing in the liquid state. Also applied to the conversion of solid to vapor without the later return to solid state, and to a conversion directly from the vapor phase to the solid state.
5.9 Surrogate standard-a chemically inert compound (not expected to occur in the environmental sample) that is added to each sample, blank, and matrix-spiked sample before extraction and analysis. The recovery of the surrogate standard is used to monitor unusual matrix effects, gross sample processing errors, etc. Surrogate recovery is evaluated for acceptance by determining whether the measured concentration falls within acceptable limits.
5.10 CAL-calibration standards are defined as five levels of calibration: CAL 1, CAL 2, CAL 3, CAL 4, and CAL 5. CAL 1 is the lowest concentration and CAL 5 is the highest concentration. CAL 3, which is the mid-level standard, is designated as the solution to be used for continuing calibrations.
5.11 Continuing calibration check-a solution of method analytes used to evaluate the mass spectrometer response over a period of time. A continuing calibration check (CCC) is performed once each 12-hour period. The CCC solution (CAL 3) is the standard of the calibration curve.
5.12 GC Response (A )-the peak area or height of analyte, x.x
5.13 Internal standard (IS)-a compound added to a sample extract in known amounts and used to calibrate concentration measurements of other compounds that are sample components. The internal standard must be a compound that is not a sample component.
6. Limitations and Interferences
6.1 Limitations
6.1.1 PAHs span a broad spectrum of vapor pressures (e.g., from 1.1 x 10⁻² kPa for naphthalene to 2 x 10-13 kPa for coronene at 25EC). PAHs that are frequently found in ambient air are listed in Table 1. Those with vapor pressures above approximately 10-8 kPa will be present in the ambient air substantially distributed between the gas and particulate phases. This method will permit the collection of both phases.
6.1.2 Particulate-phase PAHs will tend to be lost from the particle filter during sampling due to volatilization. Therefore, separate analysis of the filter will not reflect the concentrations of the PAHs originally associated with particles, nor will analysis of the sorbent provide an accurate measure of the gas phase. Consequently, this method calls for extraction of the filter and sorbent together to permit accurate measurement of total PAH air concentrations.
6.1.3 Naphthalene, acenaphthylene, and acenaphthene possess relatively high vapor pressures and may not be efficiently trapped by this method when using PUF as the sorbent. The sampling efficiency for naphthalene has been determined to be about 35 percent for PUF. The user is encouraged to use XAD-2® as the sorbent if these analytes are part of the target compound list (TCL).
6.2 Interferences
January 1999 Compendium of Methods for Toxic Organic Air Pollutants Page 13A-5

Method TO-13A PAHs
6.2.1 Method interferences may be caused by contaminants in solvents, reagents, glassware, and other sample processing hardware that result in discrete artifacts and/or elevated baselines in the detector profiles. All of these materials must be routinely demonstrated to be free from interferences under the conditions of the analysis by running laboratory reagent blanks.
6.2.2 Glassware must be scrupulously cleaned (51). All glassware should be cleaned as soon as possible after use by rinsing with the last solvent used in it and then high-purity acetone and hexane. These rinses should be followed by detergent washing with hot water and rinsing with copious amounts of tap water and several
oportions of reagent water. The glassware should then be drained dry and heated in a muffle furnace at 400 C for four hours. Volumetric glassware must not be heated in a muffle furnace; rather it should be solvent rinsed with acetone and spectrographic grade hexane. After drying and rinsing, glassware should be sealed and stored in a clean environment to prevent any accumulation of dust or other contaminants. Glassware should be stored inverted or capped with aluminum foil.
[Note: The glassware may be further cleaned by placing in a muffle furnace at 450EC for 8 hours to remove trace organics.]
6.2.3 The use of high purity water, reagents, and solvents helps to minimize interference problems. Purification of solvents by distillation in all-glass systems may be required.
6.2.4 Matrix interferences may be caused by contaminants that are coextracted from the sample. Additional clean-up by column chromatography may be required (see Section 12.3).
6.2.5 During sample transport and analysis, heat, ozone, NO , and ultraviolet (UV) light may cause sample2
degradation. Incandescent or UV-shielded fluorescent lighting in the laboratory should be used during analysis. 6.2.6 The extent of interferences that may be encountered using GC/MS techniques has not been fully
assessed. Although GC conditions described allow for unique resolution of the specific PAH compounds covered by this method, other PAH compounds may interfere. The use of column chromatography for sample clean-up prior to GC analysis will eliminate most of these interferences. The analytical system must, however, be routinely demonstrated to be free of internal contaminants such as contaminated solvents, glassware, or other reagents which may lead to method interferences. A laboratory reagent blank should be analyzed for each reagent used to determine if reagents are contaminant-free.
6.2.7 Concern about sample degradation during sample transport and analysis was mentioned above. Heat, ozone, NO , and ultraviolet (UV) light also may cause sample degradation. These problems should be addressed2
as part of the user-prepared standard operating procedure (SOP) manual. Where possible, incandescent or UV-shielded fluorescent lighting should be used during analysis. During transport, field samples should be shipped back to the laboratory chilled (~4EC) using blue ice/dry ice.
7. Safety
7.1 The toxicity or carcinogenicity of each reagent used in this method has not been precisely defined; however, each chemical compound should be treated as a potential health hazard. From this viewpoint, exposure to these chemicals must be reduced to the lowest possible level by whatever means available. The laboratory is responsible for maintaining a current awareness file of Occupational Safety and Health Administration (OSHA) regulations regarding the safe handling of the chemicals specified in this method. A reference file of material safety data sheets (MSDSs) should also be made available to all personnel involved in the chemical analysis. Additional references to laboratory safety are available and are included in the reference list (52-54).
Page 13A-6 Compendium of Methods for Toxic Organic Air Pollutants January 1999

PAHs Method TO-13A
7.2 B[a]P has been tentatively classified as a known or suspected, human or mammalian carcinogen. Many of the other PAHs have been classified as carcinogens. Care must be exercised when working with these substances. This method does not purport to address all of the safety problems associated with its use. It is the responsibility of whomever uses this method to consult and establish appropriate safety and health practices and determine the applicability of regulatory limitations prior to use. The user should be thoroughly familiar with the chemical and physical properties of targeted substances (see Table 1 and Figure 1).
7.3 All PAHs should be treated as carcinogens. Neat compounds should be weighed in a glove box. Spent samples and unused standards are toxic waste and should be disposed according to regulations. Counter tops and equipment should be regularly checked with "black light" for fluorescence as an indicator of contamination.
7.4 The sampling configuration (filter and backup sorbent) and collection efficiency for target PAHs has been demonstrated to be greater than 95 percent (except for naphthalene, acenaphthylene and acenaphthene). Therefore, no field recovery evaluation will be required as part of this procedure.
[Note: Naphthalene, acenaphthylene and acenaphthene have demonstrated significant breakthrough using PUF cartridges, especially at summer ambient temperatures. If naphthalene, acenaphthylene and acenaphthene are target PAHs, the user may want to consider replacing the PUF with XAD-2® in order to minimize breakthrough during sampling.]
8. Apparatus
[Note: This method was developed using the PS-1 semi-volatile sampler provided by General Metal Works, Village of Cleves, OH as a guideline. EPA has experience in the use of this equipment during various field-monitoring programs over the last several years. Other manufacturers' equipment should work as well; however, modifications to these procedures may be necessary if another commercially available sampler is selected.]
8.1 Sampling
8.1.1 High-volume sampler (see Figure 2). Capable of pulling ambient air through the filter/sorbent 3cartridge at a flow rate of approximately 8 standard cubic feet per minute (scfm) (0.225 std m /min) to obtain
a total sample volume of greater than 300 m3 over a 24-hour period. Major manufacturers are:
• Tisch Environmental, Village of Cleves, OH • Andersen Instruments Inc., 500 Technology Ct., Smyrna, GA • Thermo Environmental Instruments, Inc., 8 West Forge Parkway, Franklin, MA
Recent EPA studies have concluded that sample volumes less than 300 m3 still collect enough PAHs on the filter/PUF for quantitation. The user is encouraged to investigate appropriate sample volume needed to meet project specific data quality objectives.
8.1.2 Sampling module (see Figure 3). Metal filter holder (Part 2) capable of holding a 102-mm circular particle filter supported by a 16-mesh stainless-steel screen and attaching to a metal cylinder (Part 1) capable of holding a 65-mm O.D. (60-mm I.D.) x 125-mm borosilicate glass sorbent cartridge containing PUF or XAD-2®. The filter holder is equipped with inert sealing gaskets (e.g., polytetrafluorethylene) placed on either side of the
January 1999 Compendium of Methods for Toxic Organic Air Pollutants Page 13A-7

Method TO-13A PAHs
filter. Likewise, inert, pliable gaskets (e.g., silicone rubber) are used to provide an air-tight seal at each end of the glass sorbent cartridge. The glass sorbent cartridge is indented 20 mm from the lower end to provide a support for a 16-mesh stainless-steel screen that holds the sorbent. The glass sorbent cartridge fits into Part 1, which is screwed onto Part 2 until the sorbent cartridge is sealed between the silicone gaskets. Major manufacturers are:
• Tisch Environmental, Village of Cleves, OH • Andersen Instruments Inc., 500 Technology Ct., Smyrna, GA • Thermo Environmental Instruments, Inc., 8 West Forge Parkway, Franklin, MA
8.1.3 High-volume sampler calibrator. Capable of providing multipoint resistance for the high-volume sampler. Major manufacturers are:
• Tisch Environmental, Village of Cleves, OH • Andersen Instruments Inc., 500 Technology Ct., Smyrna, GA • Thermo Environmental Instruments, Inc., 8 West Forge Parkway, Franklin, MA
8.1.4 Ice chest. To hold samples at 4EC or below during shipment to the laboratory after collection. 8.1.5 Data sheets. Used for each sample to record the location and sample time, duration of sample,
starting time, and volume of air sampled.
8.2 Sample Clean-Up and Concentration (see Figure 4).
8.2.1 Soxhlet apparatus extractor (see Figure 4a). Capable of extracting filter and sorbent cartridges (5.75-cm x 12.5-cm length), 1,000 mL flask, and condenser, best source.
8.2.2 Pyrex glass tube furnace system. For activating silica gel at 180EC under purified nitrogen gas purge for an hour, with capability of raising temperature gradually, best source.
8.2.3 Glass vial. 40 mL, best source. 8.2.4 Erlenmeyer flask. 50 mL, best source.
[Note: Reuse of glassware should be minimized to avoid the risk of cross contamination. All glassware that is used must be scrupulously cleaned as soon as possible after use. Rinse glassware with the last solvent used in it and then with high-purity acetone and hexane. Wash with hot water containing detergent. Rinse with copious amounts of tap water and several portions of distilled water. Drain, dry, and heat in a muffle furnace at 400EC for 4 hours. Volumetric glassware must not be heated in a muffle furnace; rather, it should be rinsed with high-purity acetone and hexane. After the glassware is dry and cool, rinse it with hexane, and store it inverted or capped with solvent-rinsed aluminum foil in a clean environment.]
8.2.5 White cotton gloves. For handling cartridges and filters, best source. 8.2.6 Minivials. 2 mL, borosilicate glass, with conical reservoir and screw caps lined with Teflon®-faced
silicone disks, and a vial holder, best source. 8.2.7 Teflon®-coated stainless steel spatulas and spoons. Best source. 8.2.8 Kuderna-Danish (K-D) apparatus (see Figure 4b). 500 mL evaporation flask (Kontes K-570001-
500 or equivalent), 10 mL graduated concentrator tubes (Kontes K570050-1025 or equivalent) with ground-glass stoppers, 1 mL calibrated K-D concentration tubes, and 3-ball macro Snyder Column (Kontes K-570010500, K-50300-0121, and K-569001-219, or equivalent), best source.
8.2.9 Adsorption column for column chromatography (see Figure 4c). 1-cm x 10-cm with stands.
Page 13A-8 Compendium of Methods for Toxic Organic Air Pollutants January 1999

PAHs Method TO-13A
8.2.10 Glove box. For working with extremely toxic standards and reagents with explosion-proof hood for venting fumes from solvents, reagents, etc.
8.2.11 Vacuum oven. Vacuum drying oven system capable of maintaining a vacuum at 240 torr (flushed with nitrogen) overnight.
8.2.12 Concentrator tubes and a nitrogen evaporation apparatus with variable flow rate. Best source.
8.2.13 Laboratory refrigerator. Best source. 8.2.14 Boiling chips. Solvent extracted, 10/40 mesh silicon carbide or equivalent, best source. 8.2.15 Water bath. Heated, with concentric ring cover, capable of ±5EC temperature control, best source. 8.2.16 Nitrogen evaporation apparatus. Best source. 8.2.17 Glass wool. High grade, best source.
8.3 Sample Analysis
8.3.1 Gas Chromatography with Mass Spectrometry Detection Coupled with Data Processing System (GC/MS/DS). The gas chromatograph must be equipped for temperature programming, and all required accessories must be available, including syringes, gases, and a capillary column. The gas chromatograph injection port must be designed for capillary columns. The use of splitless injection techniques is recommended. On-column injection techniques can be used, but they may severely reduce column lifetime for nonchemically bonded columns. In this protocol, a 2 µL injection volume is used consistently to maximize auto sampler reproducibility. With some gas chromatograph injection ports, however, 1 µL injections may produce some improvement in precision and chromatographic separation. A 1 µL injection volume may be used if adequate sensitivity and precision can be achieved.
[Note: If 1 µL is used as the injection volume, the injection volumes for all extracts, blanks, calibration solutions and performance check samples must be 1 µL.]
All GC carrier gas lines must be constructed from stainless steel or copper tubing. Poly-tetrafluoroethylene (PTFE) thread sealants or flow controllers should only be used.
8.3.2 Gas chromatograph-mass spectrometer interface. The GC is usually coupled directly to the MS source. The interface may include a diverter valve for shunting the column effluent and isolating the mass spectrometer source. All components of the interface should be glass or glass-lined stainless steel. Glass can be deactivated by silanizing with dichorodimethylsilane. The interface components should be compatible with 320EC temperatures. Cold spots and/or active surfaces (adsorption sites) in the GC/MS interface can cause peak tailing and peak broadening. It is recommended that the GC column be fitted directly into the MS source. Graphite ferrules should be avoided in the gas chromatograph injection area since they may adsorb PAHs. Vespel® or equivalent ferrules are recommended.
8.3.3 Mass spectrometer. The MS should be operated in the full range data acquisition (SCAN) mode with a total cycle time (including voltage reset time) of one second or less (see Section 13.3.2). Operation of the MS in the SCAN mode allows monitoring of all ions, thus assisting with the identification of other PAHs beyond Compendium Method TO-13A target analyte list. In addition, operating in the SCAN mode assists the analyst with identification of possible interferences from non-target analytes due to accessibility of the complete mass spectrum in the investigative process. The MS must be capable of scanning from 35 to 500 amu every 1 sec or less, using 70 volts (nominal) electron energy in the electron impact (EI) ionization mode. The mass spectrometer must be capable of producing a mass spectrum for a 50 ng injection of decafluorotriphyenyl phosphine (DFTPP) which meets all of the response criteria (see Section 13.3.3). To ensure sufficient precision of mass spectral data, the MS scan rate must allow acquisition of at least five scans while a sample compound elutes from the GC. The
January 1999 Compendium of Methods for Toxic Organic Air Pollutants Page 13A-9
Method TO-13A PAHs
GC/MS system must be in a room with atmosphere demonstrated to be free of all potential contaminants which will interfere with the analysis. The instrument must be vented outside the facility or to a trapping system which prevents the release of contaminants into the instrument room.
8.3.4 Data system. A dedicated computer data system is employed to control the rapid multiple ion monitoring process and to acquire the data. Quantification data (peak areas or peak heights) and multi-ion detector (MID) traces (displays of intensities of each m/z being monitored as a function of time) must be acquired during the analyses. Quantifications may be reported based upon computer generated peak areas or upon measured peak heights (chart recording). The detector zero setting must allow peak-to-peak measurement of the noise on the baseline. The computer should have software that allows searching the GC/MS data file for ions of a specific mass and plotting such ion abundances versus time or scan number. This type of plot is defined as Selected Ion Current Profile (SICP). The software used must allow integrating the abundance in any SICP between specified time or scan number limits. The data system should be capable of flagging all data files that have been edited manually by laboratory personnel.
8.3.5 Gas chromatograph column. A fused silica DB-5 column (30 m x 0.32 mm I.D.) crosslinked 5 percent phenyl methylsilicone, 1.0 µm film thickness is utilized to separate individual PAHs. Other columns may be used for determination of PAHs. Minimum acceptance criteria must be determined as per Section 13.3. At the beginning of each 12-hour period (after mass resolution has been demonstrated) during which sample extracts or concentration calibration solutions will be analyzed, column operating conditions must be attained for the required separation on the column to be used for samples.
8.3.6 Balance. Mettler balance or equivalent. 8.3.7 All required syringes, gases, and other pertinent supplies. To operate the GC/MS system. 8.3.8 Pipettes, micropipettes, syringes, burets, etc. Used to make calibration and spiking solutions,
dilute samples if necessary, etc., including syringes for accurately measuring volumes such as 25 µL and 100 µL.
9. Equipment and Materials
9.1 Materials for Sample Collection (see Figure 3)
9.1.1 Quartz fiber filter. 102 millimeter binderless quartz microfiber filter, Whatman Inc., 6 Just Road, Fairfield, NJ 07004, Filter Type QMA-4.
9.1.2 Polyurethane foam (PUF) plugs (see Figure 5a). 3-inch thick sheet stock polyurethane type 3(density .022 g/cm ). The PUF should be of the polyether type used for furniture upholstery, pillows, and
mattresses. The PUF cylinders (plugs) should be slightly larger in diameter than the internal diameter of the cartridge. Sources of equipment are Tisch Environmental, Village of Cleves, OH; University Research Glassware, 116 S. Merritt Mill Road, Chapel Hill, NC; Thermo Environmental Instruments, Inc., 8 West Forge Parkway, Franklin, MA; Supelco, Supelco Park, Bellefonte, PA; and SKC Inc., 334 Valley View Road, Eighty Four, PA.
9.1.3 XAD-2® resin (optional). Supelco, Supelco Park, Bellefonte, PA. 9.1.4 Teflon® end caps (see Figure 5a). For sample cartridge; sources of equipment are Tisch
Environmental, Village of Cleves, OH; and University Research Glassware, 116 S. Merritt Mill Road, Chapel Hill, NC.
9.1.5 Sample cartridge aluminum shipping containers (see Figure 5b). For sample cartridge shipping; sources of equipment are Tisch Environmental, Village of Cleves, OH; and University Research Glassware, 116 S. Merritt Mill Road, Chapel Hill, NC.
Page 13A-10 Compendium of Methods for Toxic Organic Air Pollutants January 1999

PAHs Method TO-13A
9.1.6 Glass sample cartridge (see Figure 5a). For sample collection; sources of equipment are Tisch Environmental, Village of Cleves, OH; Thermo Environmental Instruments, Inc., 8 West Forge Parkway, Franklin, MA; and University Research Glassware, 116 S. Merritt Mill Road, Chapel Hill, NC.
9.1.7 Aluminum foil. Best source. 9.1.8 Hexane, reagent grade. Best source.
9.2 Sample Clean-up and Concentration
9.2.1 Methylene chloride (extraction solvent for XAD-2®; optional). Chromatographic grade, glass-distilled, best source.
9.2.2 Sodium sulfate-anhydrous (ACS). Granular (purified by washing with methylene chloride followed by heating at 400EC for 4 hours in a shallow tray).
9.2.3 Boiling chips. Solvent extracted or heated in a muffle furnace at 450EC for 2 hours, approximately 10/40 mesh (silicon carbide or equivalent).
9.2.4 Nitrogen. High purity grade, best source. 9.2.5 Hexane. Chromatographic grade, glass-distilled, best source (extraction solvent for PUF). 9.2.6 Glass wool. Silanized, extracted with methylene chloride and hexane, and dried. 9.2.7 Diethyl ether. High purity, glass distilled (extraction solvent for PUF). 9.2.8 Pentane. High purity, glass distilled. 9.2.9 Silica gel. High purity, type 60, 70-230 mesh.
9.3 GC/MS Sample Analysis
9.3.1 Gas cylinder of helium. Ultra high purity, best source. 9.3.2 Chromatographic-grade stainless steel tubing and stainless steel fitting. For interconnections,
Alltech Applied Science, 2051 Waukegan Road, Deerfield, IL 60015, 312-948-8600, or equivalent.
[Note: All such materials in contact with the sample, analyte, or support gases prior to analysis should be stainless steel or other inert metal. Do not use plastic or Teflon® tubing or fittings.]
9.3.3 Native and isotopically labeled PAH isomers for calibration and spiking standards. Cambridge Isotopes, 20 Commerce Way, Woburn, MA 01801 (617-547-1818). Suggested isotopically labeled PAH isomers are: D10-fluoranthene, D12 10 12 10-benzo(a)pyrene, D -fluorene, D10 -pyrene, D -perylene, D -acenaphthene, D -chrysene, D -naphthalene and D10-phenanthrene.12 8
9.3.4 Decafluorotriphenylphosphine (DFTPP). Used for tuning GC/MS, best source. 9.3.5 Native stock pure standard PAH analytes. For developing calibration curve for GC/MS analysis,
best source.
10. Preparation of PUF Sampling Cartridge
[Note: This method was developed using the PS-1 sample cartridge provider by General Metal Works, Village of Cleves, OH as a guideline. EPA has experience in use of this equipment during various field monitoring program over the last several years. Other manufacturers' equipment should work as well; however, modifications to these procedures may be necessary if another commercially available sampler is selected.]
January 1999 Compendium of Methods for Toxic Organic Air Pollutants Page 13A-11

Method TO-13A PAHs
10.1 Summary of Method
10.1.1 This part of the procedure discusses pertinent information regarding the preparation and cleaning of the filter, sorbent, and filter/sorbent cartridge assembly. The separate batches of filters and sorbents are extracted with the appropriate solvent.
10.1.2 At least one PUF cartridge assembly and one filter from each batch, or 10 percent of the batch, whichever is greater, should be tested and certified before the batch is considered for field use.
10.1.3 Prior to sampling, the cartridges are spiked with field surrogate compounds.
10.2 Preparation of Sampling Cartridge
10.2.1 Bake the Whatman QMA-4 quartz filters at 400EC for 5 hours before use. 10.2.2 Set aside the filters in a clean container for shipment to the field or prior to combining with the PUF
glass cartridge assembly for certification prior to field deployment. 10.2.3 The PUF plugs are 6.0-cm diameter cylindrical plugs cut from 3-inch sheet stock and should fit,
with slight compression, in the glass cartridge, supported by the wire screen (see Figure 5a). During cutting, rotate the die at high speed (e.g., in a drill press) and continuously lubricate with deionized or distilled water. Pre-cleaned PUF plugs can be obtained from commercial sources (see Section 9.1.2).
10.2.4 For initial cleanup, place the PUF plugs in a Soxhlet apparatus and extract with acetone for 16 hours at approximately 4 cycles per hour. When cartridges are reused, use diethyl ether/hexane (5 to 10 percent volume/volume [v/v]) as the cleanup solvent.
[Note: A modified PUF cleanup procedure can be used to remove unknown interference components of the PUF blank. This method consists of rinsing 50 times with toluene, acetone, and diethyl ether/hexane (5 to 10 percent v/v), followed by Soxhlet extraction. The extracted PUF is placed in a vacuum oven connected to a water aspirator and dried at room temperature for approximately 2 to 4 hours (until no solvent odor is detected). The extract from the Soxhlet extraction procedure from each batch may be analyzed to determine initial cleanliness prior to certification.]
10.2.5 If using XAD-2® in the cartridge, initial cleanup of the resin is performed by placing approximately 50-60 grams in a Soxhlet apparatus and extracting with methylene chloride for 16 hours at approximately 4 cycles per hour. At the end of the initial Soxhlet extraction, the spent methylene chloride is discarded and replaced with a fresh reagent. The XAD-2® resin is once again extracted for 16 hours at approximately 4 cycles per hour. The XAD-2® resin is removed from the Soxhlet apparatus, placed in a vacuum oven connected to an ultra-pure nitrogen gas stream, and dried at room temperature for approximately 2-4 hours (until no solvent odor is detected).
10.2.6 Fit a nickel or stainless steel screen (mesh size 200/200) to the bottom of a hexane-rinsed glass sampling cartridge to retain the PUF or XAD-2® sorbents, as illustrated in Figure 5a. If using XAD-2® alone, then place a small diameter (~1/4") PUF plug on top of the nickel or stainless steel screen to retain the XAD-2® in the glass cartridge. Place the Soxhlet-extracted, vacuum-dried PUF (2.5-cm thick by 6.5-cm diameter) on top of the screen in the glass sampling cartridge using polyester gloves. Place ~200 g of the clean XAD-2® inside the glass sampling cartridge on top of the small diameter PUF plug.
10.2.7 Wrap the sampling cartridge with hexane-rinsed aluminum foil, cap with the Teflon® end caps (optional), place in a cleaned labeled aluminum shipping container, and seal with Teflon® tape. Analyze at least 1 cartridge from each batch of cartridges prepared using the procedure described in Section 10.3, before the batch is considered acceptable for field use.
Page 13A-12 Compendium of Methods for Toxic Organic Air Pollutants January 1999

PAHs Method TO-13A
The acceptance level of the cartridge is for each target PAH analyte to be less than or equal to the detection limit requirements to meet the project data quality objectives. It is generally not possible to eliminate the presence of naphthalene, but the amount detected on the cleaned PUF cartridge should be less than five times the concentration of the lowest calibration standard (~500 ng). This amount is insignificant compared to the amount collected from a typical air sample.
In general, the following guidelines are provided in determining whether a cartridge is clean for field use:
• Naphthalene <500 ng/cartridge • Other PAHs <200 ng total/cartridge
10.3 Procedure for Certification of PUF Cartridge Assembly
[Note: The following procedure outlines the certification of a filter and PUF cartridge assembly. If using XAD-2® as the sorbent, the procedure remains the same, except the solvent is methylene chloride rather than 10 percent diethyl ether/hexane.]
10.3.1 Extract one filter and PUF sorbent cartridge by Soxhlet extraction and concentrate using a K-D evaporator for each lot of filters and cartridges sent to the field.
10.3.2 Assemble the Soxhlet apparatus. Charge the Soxhlet apparatus (see Figure 4a) with 700 mL of the extraction solvent (10 percent v/v diethyl ether/hexane) and reflux for 2 hours. Let the apparatus cool, disassemble it, and discard the used extraction solvent. Transfer the filter and PUF glass cartridge to the Soxhlet apparatus (the use of an extraction thimble is optional).
[Note: The filter and sorbent assembly are tested together in order to reach detection limits, to minimize cost and to prevent misinterpretation of the data. Separate analyses of the filter and PUF would not yield useful information about the physical state of most of the PAHs at the time of sampling due to evaporative losses from the filter during sampling.]
10.3.3 Add between 300 and 350 mL of diethyl ether/hexane (10 percent v/v) to the Soxhlet apparatus. Reflux the sample for 18 hours at a rate of at least 3 cycles per hour. Allow to cool, then disassemble the apparatus.
10.3.4 Assemble a K-D concentrator (see Figure 4b) by attaching a 10-mL concentrator tube to a 500-mL evaporative flask.
10.3.5 Transfer the extract by pouring it through a drying column containing about 10 cm of anhydrous granular sodium sulfate (see Figure 4c) and collect the extract in the K-D concentrator. Rinse the Erlenmeyer flask and column with 20 to 30 mL of 10 percent diethyl ether/hexane to complete the quantitative transfer.
10.3.6 Add one or two clean boiling chips and attach a 3-ball Snyder column to the evaporative flask. Pre-wet the Snyder column by adding about 1 mL of the extraction solvent to the top of the column. Place the K-D apparatus on a hot water bath (~50EC) so that the concentrator tube is partially immersed in the hot water, and the entire lower rounded surface of the flask is bathed with hot vapor. Adjust the vertical position of the apparatus and the water temperature as required to complete the concentration in 1 hour. At the proper rate of distillation, the balls of the column will actively chatter, but the chambers will not flood with condensed solvent. When the apparent volume of liquid reaches approximately 5 mL, remove the K-D apparatus from the water bath and allow it to drain and cool for at least 5 minutes. Remove the Snyder column and rinse the flask and its lower joint into the concentrator tube with 5 mL of cyclohexane. A 1-mL syringe is recommended for this operation.
10.3.7 Concentrate the extract to 5 mL and analyze using GC/MS.
January 1999 Compendium of Methods for Toxic Organic Air Pollutants Page 13A-13
Method TO-13A PAHs
10.3.8 The acceptance level of the cartridge is for each target PAH analyte to be less than or equal to the detection limit requirements to meet the project data qulity objectives. It is generally not possible to eliminate the presence of naphthalene, but the amount detected on the cleaned PUF cartridge should be less than five times the concentration of the lowest calibration standard (~500 ng). This amount is insignificant compared to the amount collected from a typical air sample.
In general, the following guidelines are provided in determining whether a cartridge is clean for field use:
• Naphthalene <500 ng/cartridge • Other PAHs <200 ng total/cartridge
Cartridges are considered clean for up to 30 days from date of certification when sealed in their containers.
10.4 Deployment of Cartridges for Field Sampling
10.4.1 Immediately prior to field deployment, add surrogate compounds (i.e., chemically inert compounds not expected to occur in an environmental sample) to the center of the PUF cartridge, using a microsyringe. Spike 20 FL of a 50 Fg/mL solution of the surrogates onto the center bed of the PUF trap to yield a final concentration of 1 Fg. The surrogate compounds must be added to each cartridge assembly. The following field surrogate compounds should be added to each PUF cartridge prior to field deployment to monitor matrix effects, breakthrough, etc.
Field Surrogate Compound Total Spiked Amount (µg)
D10-Fluoranthene D12-Benzo(a)pyrene
1 1
Fill out a "chain-of-custody" indicating cartridge number, surrogate concentration, date of cartridge certification, etc. The chain-of-custody must accompany the cartridge to the field and return to the laboratory.
10.4.2 Use the recoveries of the surrogate compounds to monitor for unusual matrix effects and gross sample processing errors. Evaluate surrogate recovery for acceptance by determining whether the measured concentration falls within the acceptance limits of 60-120 percent.
10.4.3 Cartridges are placed in their shipping containers and shipped to the field. Blank cartridges do not need to be chilled when shipping to the field until after exposure to ambient air.
11. Assembly, Calibration, and Collection Using Sampling System
[Note: This method was developed using the PS-1 semi-volatile sampler provided by General Metal Works, Village of Cleves, OH as a guideline. EPA has experience in the use of this equipment during various field monitoring programs over the last several years. Other manufacturers' equipment should work as well; however, modifications to these procedures may be necessary if another commercially available sampler is selected.]
Page 13A-14 Compendium of Methods for Toxic Organic Air Pollutants January 1999

PAHs Method TO-13A
11.1 Sampling Apparatus
The entire sampling system is diagrammed in Figure 2. This apparatus was developed to operate at a rate of 4 3 The to 10 scfm (0.114 to 0.285 std m /min) and is used by EPA for high-volume sampling of ambient air.
method write-up presents the use of this device.
The sampling module (see Figure 3) consists of a filter and a glass sampling cartridge containing the PUF utilized to concentrate PAHs from the air. A field portable unit has been developed by EPA (see Figure 6).
11.2 Calibration of Sampling System
Each sampler should be calibrated (1) when new, (2) after major repairs or maintenance, (3) whenever any audit point deviates from the calibration curve by more than 7 percent, (4) before/after each sampling event, and (5) when a different sample collection medium, other than that which the sampler was originally calibrated to, will be used for sampling.
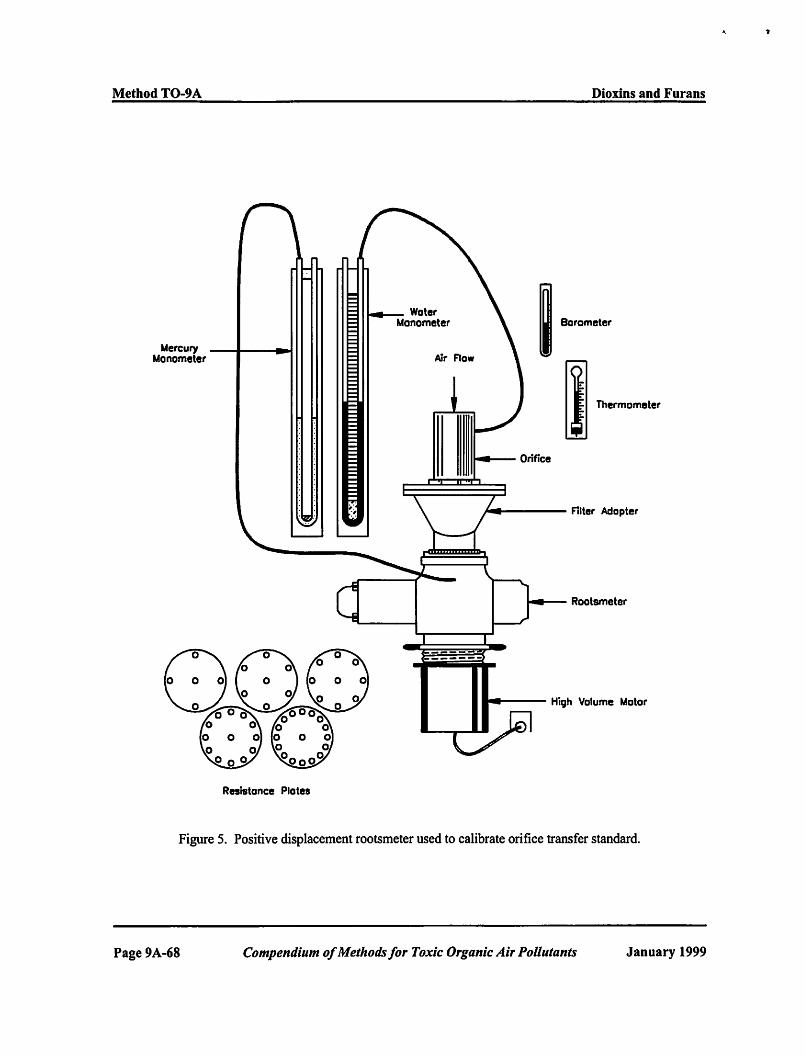
11.2.1 Calibration of Orifice Transfer Standard. Calibrate the modified high volume air sampler in the field using a calibrated orifice flow rate transfer standard. Certify the orifice transfer standard in the laboratory against a positive displacement rootsmeter (see Figure 7). Once certified, the recertification is performed rather infrequently if the orifice is protected from damage. Recertify the orifice transfer standard performed once per year utilizing a set of five multi-hole resistance plates.
[Note: The set of five multihole resistance plates is used to change the flow through the orifice so that several points can be obtained for the orifice calibration curve. The following procedure outlines the steps to calibrate the orifice transfer standard in the laboratory.]
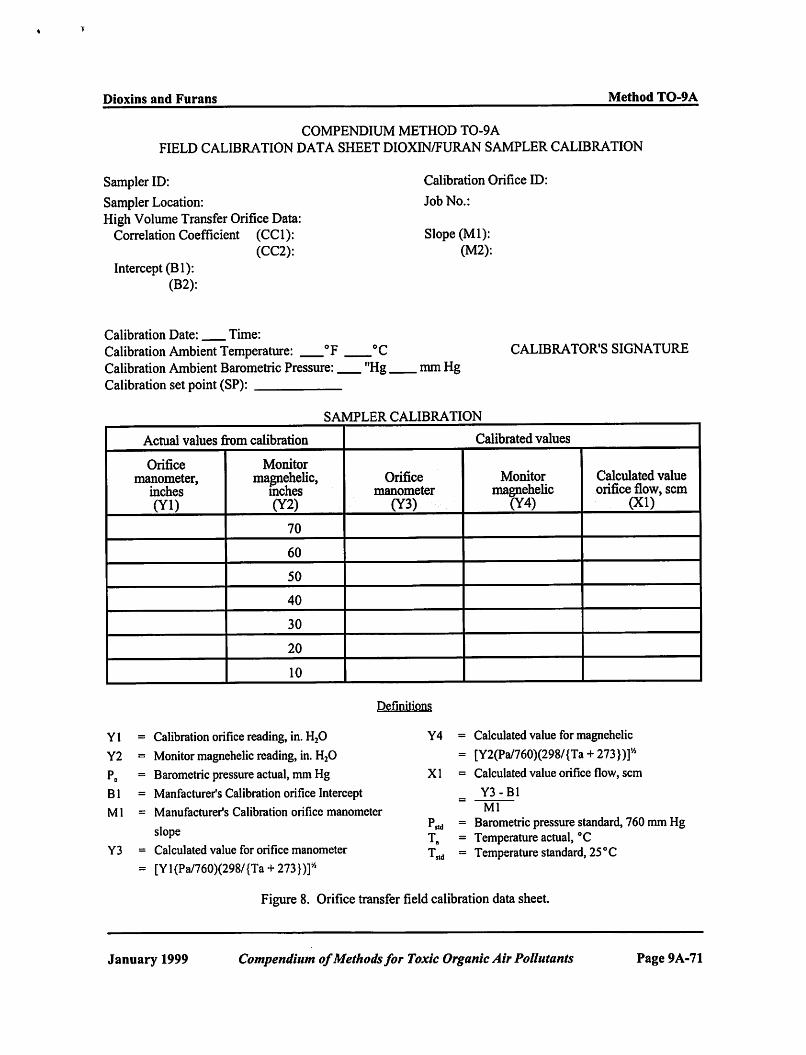
11.2.1.1 Record the room temperature (T1 in EC) and barometric pressure (Pb in mm Hg) on the Orifice Calibration Data Sheet (see Figure 8). Calculate the room temperature in K (absolute temperature) and record on Orifice Calibration Data Sheet.
T1 in K = 273E + T1 in EC
11.2.1.2 Set up laboratory orifice calibration equipment as illustrated in Figure 7. Check the oil level of the rootsmeter prior to starting. There are three oil level indicators, one at the clear plastic end, and two sight glasses, one at each end of the measuring chamber.
11.2.1.3 Check for leaks by clamping both manometer lines, blocking the orifice with cellophane tape, turning on the high-volume motor, and noting any change in the rootsmeter's reading. If the rootsmeter's reading changes, there is a leak in the system. Eliminate the leak before proceeding. If the rootsmeter's reading remains constant, turn off the hi-vol motor, remove the cellophane tape, and unclamp both manometer lines.
11.2.1.4 Install the 5-hole resistance plate between the orifice and the filter adapter. 11.2.1.5 Turn manometer tubing connectors one turn counter-clockwise. Make sure all connectors are
open. 11.2.1.6 Adjust both manometer midpoints by sliding their movable scales until the zero point corresponds
with the meniscus. Gently shake or tap to remove any air bubbles and/or liquid remaining on tubing connectors. (If additional liquid is required for the water manometer, remove tubing connector and add clean water.)
11.2.1.7 Turn on the high-volume motor and let it run for 5 minutes to set the motor brushes. Turn the motor off. Ensure manometers are set to zero. Turn the high-volume motor on.
January 1999 Compendium of Methods for Toxic Organic Air Pollutants Page 13A-15

Method TO-13A PAHs
11.2.1.8 Record the time in minutes required to pass a known volume of air (approximately 5.6 to 8.4 m3
of air for each resistance plate) through the rootsmeter by using the rootsmeter's digital volume dial and a stopwatch.
11.2.1.9 Record both manometer readings [orifice water manometer (ªH) and rootsmeter mercury manometer (ªP)] on Orifice Calibration Data Sheet (see Figure 8).
[Note: ªH is the sum of the difference from zero (0) of the two column heights.]
11.2.1.10 Turn off the high-volume motor. 11.2.1.11 Replace the 5-hole resistance plate with the 7-hole resistance plate. 11.2.1.12 Repeat Sections 11.2.1.3 through 11.2.1.11. 11.2.1.13 Repeat for each resistance plate. Note results on Orifice Calibration Data Sheet (see Figure 8).
Only a minute is needed for warm-up of the motor. Be sure to tighten the orifice enough to eliminate any leaks. Also check the gaskets for cracks.
[Note: The placement of the orifice prior to the rootsmeter causes the pressure at the inlet of the rootsmeter to be reduced below atmospheric conditions, thus causing the measured volume to be incorrect. The volume measured by the rootsmeter must be corrected.]
11.2.1.14 Correct the measured volumes on the Orifice Calibration Data Sheet:
P & ÎP a Tstd' V ( )( )Vstd m TPstd a
where: Vstd = standard volume, std m3
Vm = actual volume measured by the rootsmeter, m3
Pa = barometric pressure during calibration, mm Hg
ªP = differential pressure at inlet to volume meter, mm Hg
Pstd = 760 mm Hg
Tstd = 298 K
Ta = ambient temperature during calibration, K.
11.2.1.15 Record standard volume on Orifice Calibration Data Sheet. 11.2.1.16 The standard flow rate as measured by the rootsmeter can now be calculated using the following
formula:
VstdQstd ' 2
where: 3Qstd = standard volumetric flow rate, std m /min
2 = elapsed time, min
311.2.1.17 Record the standard flow rates to the nearest 0.01 std m /min.
Page 13A-16 Compendium of Methods for Toxic Organic Air Pollutants January 1999

PAHs Method TO-13A
11.2.1.18 Calculate and record ÎH (P1 )(298/T1) value for each standard flow rate./Pstd
11.2.1.19Plot each ÎH (P1 )(298/T1) value (y-axis) versus its associated standard flow rate (x-/Pstd
axis) on arithmetic graph paper and draw a line of best fit between the individual plotted points.
[Note: This graph will be used in the field to determine standard flow rate.]
11.2.2 Calibration of the High-Volume Sampling System Utilizing Calibrated Orifice Transfer Standard
For this calibration procedure, the following conditions are assumed in the field:
• The sampler is equipped with an valve to control sample flow rate. • The sample flow rate is determined by measuring the orifice pressure differential using a Magnehelic
gauge. 3 3• The sampler is designed to operate at a standardized volumetric flow rate of 8 ft /min (0.225 m /min), with
an acceptable flow rate range within 10 percent of this value. • The transfer standard for the flow rate calibration is an orifice device. The flow rate through the orifice
is determined by the pressure drop caused by the orifice and is measured using a "U" tube water manometer or equivalent.
• The sampler and the orifice transfer standard are calibrated to standard volumetric flow rate units (scfm or scmm).
• An orifice transfer standard with calibration traceable to NIST is used. • A "U" tube water manometer or equivalent, with a 0- to 16-inch range and a maximum scale division of
0.1 inch, will be used to measure the pressure in the orifice transfer standard. • A Magnehelic gauge or equivalent with a 9- to 100-inch range and a minimum scale division of 2 inches
for measurements of the differential pressure across the sampler's orifice is used. • A thermometer capable of measuring temperature over the range of 32E to 122EF (0E to 50EC) to ±2EF
(±1EC) and referenced annually to a calibrated mercury thermometer is used. • A portable aneroid barometer (or equivalent) capable of measuring ambient barometric pressure between
500 and 800 mm Hg (19.5 and 31.5 in. Hg) to the nearest mm Hg and referenced annually to a barometer of known accuracy is used.
• Miscellaneous handtools, calibration data sheets or station log book, and wide duct tape are available.
11.2.2.1 Set up the calibration system as illustrated in Figure 9. Monitor the airflow through the sampling system with a venturi/Magnehelic assembly, as illustrated in Figure 9. Audit the field sampling system once per quarter using a flow rate transfer standard, as described in the EPA High-Volume Sampling Method, 40 CVR 50, Appendix B. Perform a single-point calibration before and after each sample collection, using the procedures described in Section 11.2.3.
11.2.2.2 Prior to initial multi-point calibration, place an empty glass cartridge in the sampling head and activate the sampling motor. Fully open the flow control valve and adjust the voltage variator so that a sample
3flow rate corresponding to 110 percent of the desired flow rate (typically 0.20 to 0.28 m /min) is indicated on the Magnehelic gauge (based on the previously obtained multipoint calibration curve). Allow the motor to warm up for 10 min and then adjust the flow control valve to achieve the desire flow rate. Turn off the sampler. Record the ambient temperature and barometric pressure on the Field Calibration Data Sheet (see Figure 10).
11.2.2.3 Place the orifice transfer standard on the sampling head and attach a manometer to the tap on the transfer standard, as illustrated in Figure 9. Properly align the retaining rings with the filter holder and secure by tightening the three screw clamps. Connect the orifice transfer standard by way of the pressure tap to a
January 1999 Compendium of Methods for Toxic Organic Air Pollutants Page 13A-17

Method TO-13A PAHs
manometer using a length of tubing. Set the zero level of the manometer or Magnehelic. Attach the Magnehelic gauge to the sampler venturi quick release connections. Adjust the zero (if needed) using the zero adjust screw on face of the gauge.
11.2.2.4 To leak test, block the orifice with a rubber stopper, wide duct tape, or other suitable means. Seal the pressure port with a rubber cap or similar device. Turn on the sampler. Caution: Avoid running the sampler for too long a time with the orifice blocked. This precaution will reduce the chance that the motor will be overheated due to the lack of cooling air. Such overheating can shorten the life of the motor.
11.2.2.5 Gently rock the orifice transfer standard and listen for a whistling sound that would indicate a leak in the system. A leak-free system will not produce an upscale response on the sampler's magnehelic. Leaks are usually caused either by damaged or missing gaskets, by cross-threading, and/or not screwing sample cartridge together tightly. All leaks must be eliminated before proceeding with the calibration. When the sample is determined to be leak-free, turn off the sampler and unblock the orifice. Now remove the rubber stopper or plug from the calibrator orifice.
11.2.2.6 Turn the flow control valve to the fully open position and turn the sampler on. Adjust the flow control valve until a Magnehelic reading of approximately 70 in. is obtained. Allow the Magnehelic and manometer readings to stabilize and record these values on the orifice transfer Field Calibration Data Sheet (see Figure 10).
11.2.2.7 Record the manometer reading under Y1 and the Magnehelic reading under Y2 on the Field Calibration Data Sheet. For the first reading, the Magnehelic should still be at 70 inches as set above.
11.2.2.8 Set the Magnehelic to 60 inches by using the sampler's flow control valve. Record the manometer (Y1) and Magnehelic (Y2) readings on the Field Calibration Data Sheet (see Figure 10).
11.2.2.9 Repeat the above steps using Magnehelic settings of 50, 40, 30, 20, and 10 inches. 11.2.2.10 Turn the voltage variator to maximum power, open the flow control valve, and confirm that the
Magnehelic reads at least 100 inches. Turn off the sampler and confirm that the Magnehelic reads zero. 11.2.2.11 Read and record the following parameters on the Field Calibration Data Sheet. Record the
following on the calibration data sheet:
• Data, job number, and operator's signature. • Sampler serial number. • Ambient barometric pressure. • Ambient temperature.
11.2.2.12 Remove the "dummy" cartridge and replace with a sample cartridge. 11.2.2.13 Obtain the manufacturer high volume orifice calibration certificate. 11.2.2.14 If not performed by the manufacturer, calculate values for each calibrator orifice static pressure
(Column 6, inches of water) on the manufacturer's calibration certificate using the following equation:
ÎH(Pa/760)[298/(Ta % 273)]
where: Pa = the barometric pressure (mm Hg) at time of manufacturer calibration, mm Hg Ta = temperature at time of calibration, EC
11.2.2.15 Perform a linear regression analysis using the values in Column 7 of the manufacturer's High Volume Orifice Calibration Certificate for flow rate (Qstd) as the "X" values and the calculated values as the Y
Page 13A-18 Compendium of Methods for Toxic Organic Air Pollutants January 1999

PAHs Method TO-13A
values. From this relationship, determine the correlation (CC1), intercept (B1), and slope (M1) for the Orifice Transfer Standard.
11.2.2.16 Record these values on the Field Calibration Data Sheet (see Figure 10). 11.2.2.17 Using the Field Calibration Data Sheet values (see Figure 10), calculate the Orifice Manometer
Calculated Values (Y3) for each orifice manometer reading using the following equation:
Y3 Calculation
Y3 = {Y1(P /760)[298/(Ta + 273)]}½ a
11.2.2.18 Record the values obtained in Column Y3 on the Field Calibration Data Sheet (see Figure 10). 11.2.2.19 Calculate the Sampler Magnehelic Calculated Value (Y4) using the following equation:
Y4 Calculation
Y4 = {Y2(P /760)[298/(T + 273)]}½ a a
11.2.2.20 Record the value obtained in Column Y4 on the Field Calibration Data Sheet (see Figure 10). 11.2.2.21 Calculate the Orifice Flow Rate (X1) in scm using the following equation:
X1 Calculation
Y3 & B1X1 ' M1
11.2.2.22 Record the values obtained in Column X1 on the Field Calibration Data Sheet (see Figure 10). 11.2.2.23 Perform a linear regression of the values in Column X1 (as X) and the values in Column Y4 (as
Y). Record the relationship for correlation (CC2), intercept (B2), and slope (M2) on the Field Calibration Data Sheet. The correlation coefficient must be 0.990 or greater.
11.2.2.24 Using the following equation, calculate a set point (SP) for the manometer to represent a desired flow rate:
Set Point
Set point (SP) = [(Expected P )/(Expected T )(T /P )][M2 (Desired flow rate) + B2]2 a a std std
where:
P = Expected atmospheric pressure (P ), mm Hg a a
T = Expected atmospheric temperature (T ), 273 + ECa a
M2 = Slope of developed relationship B2 = Intercept of developed relationship Tstd = Temperature standard, 273 + 25EC Pstd = Pressure standard, 760 mm Hg
January 1999 Compendium of Methods for Toxic Organic Air Pollutants Page 13A-19

Method TO-13A PAHs
11.2.2.25 During monitoring, calculate a flow rate from the observed Magnehelic reading using the following equations:
Flow Rate
Y5 = [Average Magnehelic Reading (ªH) (P /T )(T /P )]½ a a std std
Y5 & B2X2 ' M2
where:
Y5 = Corrected average magnehelic reading X2 = Instant calculated flow rate, scm
11.2.2.26 The relationship in calibration of a sampling system between Orifice Transfer Standard and flow rate through the sampler is illustrated in Figure 11.
11.2.3 Single-Point Audit of the High Volume Sampling System Utilizing Calibrated Orifice Transfer Standard
Single point calibration checks are required as follows: • Prior to the start of each 24-hour test period. • After each 24-hour test period. The post-test calibration check may serve as the pre-test calibration check
for the next sampling period if the sampler is not moved. • Prior to sampling after a sample is moved.
For samplers, perform a calibration check for the operational flow rate before each 24-hour sampling event and when required as outlined in the user quality assurance program. The purpose of this check is to track the sampler's calibration stability. Maintain a control chart presenting the percentage difference between a sampler's indicated and measured flow rates. This chart provides a quick reference of sampler flow-rate drift problems and is useful for tracking the performance of the sampler. Either the sampler log book or a data sheet will be used to document flow-check information. This information includes, but is not limited to, sampler and orifice transfer standard serial number, ambient temperature, pressure conditions, and collected flow-check data.
In this subsection, the following is assumed:
• The flow rate through a sampler is indicated by the orifice differential pressure; • Samplers are designed to operate at an actual flow rate of 8 scfm, with a maximum acceptable flow-rate
fluctuation range of ±10 percent of this value; • The transfer standard will be an orifice device equipped with a pressure tap. The pressure is measured
using a manometer; and • The orifice transfer standard's calibration relationship is in terms of standard volumetric flow rate (Qstd).
Page 13A-20 Compendium of Methods for Toxic Organic Air Pollutants January 1999

PAHs Method TO-13A
11.2.3.1 Perform a single point flow audit check before and after each sampling period utilizing the Calibrated Orifice Transfer Standard (see Section 11.2.1).
11.2.3.2 Prior to single point audit, place a "dummy" glass cartridge in the sampling head and activate the sampling motor. Fully open the flow control valve and adjust the voltage variator so that a sample flow rate
3corresponding to 110 percent of the desired flow rate (typically 0.19 to 0.28 m /min) is indicated on the Magnehelic gauge (based on the previously obtained multipoint calibration curve). Allow the motor to warm up for 10 minutes and then adjust the flow control valve to achieve the desired flow rate. Turn off the sampler. Record the ambient temperature and barometric pressure on the Field Test Data Sheet (see Figure 12).
11.2.3.3 Place the flow rate transfer standard on the sampling head. 11.2.3.4 Properly align the retaining rings with the filter holder and secure by tightening the three screw
clamps. Connect the flow rate transfer standard to the manometer using a length of tubing. 11.2.3.5 Using tubing, attach one manometer connector to the pressure tap of the transfer standard. Leave
the other connector open to the atmosphere. 11.2.3.6 Adjust the manometer midpoint by sliding the movable scale until the zero point corresponds with
the water meniscus. Gently shake or tap to remove any air bubbles and/or liquid remaining on tubing connectors. (If additional liquid is required, remove tubing connector and add clean water.)
11.2.3.7 Turn on the high-volume motor and let run for 5 minutes. 11.2.3.8 Record the pressure differential indicated, ªH, in inches of water, on the Field Test Data Sheet.
Be sure a stable ªH has been established. 11.2.3.9 Record the observed Magnehelic gauge reading in inches of water on the Field Test Data Sheet.
Be sure stable ªM has been established. 11.2.3.10 Using previous established Orifice Transfer Standard curve, calculate Qxs (see
Section 11.2.2.23). 11.2.3.11 This flow should be within ±10 percent of the sampler set point, normally, 0.224 m3. If not,
perform a new multipoint calibration of the sampler. 11.2.3.12 Remove flow rate transfer standard and dummy sorbent cartridge.
11.3 Sample Collection
11.3.1 General Requirements 11.3.1.1 The sampler should be located in an unobstructed area, at least 2 meters from any obstacle to air
flow. The exhaust hose should be stretched out in the downwind direction to prevent recycling of air into the sample head.
11.3.1.2 All cleaning and sample module loading and unloading should be conducted in a controlled environment, to minimize any chance of potential contamination.
11.3.1.3 When new or when using the sampler at a different location, all sample contact areas need to be cleaned. Use triple rinses of reagent grade hexane or methylene chloride contained in Teflon® rinse bottles. Allow the solvents to evaporate before loading the PUF modules.
11.3.2 Preparing Cartridge for Sampling 11.3.2.1 Detach the lower chamber of the cleaned sample head. While wearing disposable, clean, lint-free
nylon, or cotton gloves, remove a clean glass sorbent module from its shipping container. Remove the Teflon® end caps (if applicable). Replace the end caps in the sample container to be reused after the sample has been collected.
11.3.2.2 Insert the glass module into the lower chamber and tightly reattach the lower chambers to the module.
11.3.2.3 Using clean rinsed (with hexane) Teflon®-tipped forceps, carefully place a clean conditioned fiber filter atop the filter holder and secure in place by clamping the filter holder ring over the filter. Place the
January 1999 Compendium of Methods for Toxic Organic Air Pollutants Page 13A-21

Method TO-13A PAHs
aluminum protective cover on top of the cartridge head. Tighten the 3 screw clamps. Ensure that all module connections are tightly assembled. Place a small piece of aluminum foil on the ball-joint of the sample cartridge to protect from back-diffusion of semi-volatiles into the cartridge during transporting to the site.
[Note: Failure to do so could expose the cartridge to contamination during transport.]
11.3.2.4 Place the cartridge in a carrying bag to take to the sampler. 11.3.3 Collection
11.3.3.1 After the sampling system has been assembled, perform a single point flow check as described in Sections 11.2.3.
11.3.3.2 With the empty sample module removed from the sampler, rinse all sample contact areas using reagent grade hexane in a Teflon® squeeze bottle. Allow the hexane to evaporate from the module before loading the samples.
11.3.3.3 With the sample cartridge removed from the sampler and the flow control valve fully open, turn the pump on and allow it to warm-up for approximately 5 minutes.
11.3.3.4 Attach a "dummy" sampling cartridge loaded with the exact same type of filter and PUF media to be used for sample collection.
11.3.3.5 Turn the sampler on and adjust the flow control valve to the desired flow as indicated by the Magnehelic gauge reading determined in Section 11.2.2.24. Once the flow is properly adjusted, take extreme care not to inadvertently alter its setting.
11.3.3.6 Turn the sampler off and remove the "dummy" module. The sampler is now ready for field use. 11.3.3.7 Check the zero reading of the sampler Magnehelic. Record the ambient temperature, barometric
pressure, elapsed time meter setting, sampler serial number, filter number, and PUF cartridge number on the Field Test Data Sheet (see Figure 12). Attach the loaded sampler cartridge assembly to the sampler.
11.3.3.8 Place the voltage variator and flow control valve at the settings used in Section 11.3.2, and the power switch. Activate the elapsed time meter and record the start time. Adjust the flow (Magnehelic setting), if necessary, using the flow control valve.
11.3.3.9 Record the Magnehelic reading every 6 hours during the sampling period. Use the calibration factors (see Section 11.2.2.24) to calculate the desired flow rate. Record the ambient temperature, barometric pressure, and Magnehelic reading at the beginning and during sampling period.
11.3.4 Sample Recovery 11.3.4.1 At the end of the desired sampling period, turn the power off. Carefully remove the sampling
head containing the filter and sorbent cartridge. Place the protective "plate" over the filter to protect the cartridge during transport to a clean recovery area. Also, place a piece of aluminum foil around the bottom of the sampler cartridge assembly.
11.3.4.2 Perform a final calculated sampler flow check using the calibration orifice, assembly, as described in Section 11.3.2. If calibration deviates by more than 10 percent from initial reading, mark the flow data for that sample as suspect and inspect and/or remove from service, record results on Field Test Data Sheet, Figure 12.
11.3.4.3 Transport the sampler cartridge assembly to a clean recovery area. 11.3.4.4 While wearing white cotton gloves, remove the PUF glass cartridge from the lower module
chamber and lay it on the retained aluminum foil in which the sample was originally wrapped. 11.3.4.5 Carefully remove the quartz fiber filter from the upper chamber using clean Teflon®-tipped
forceps. 11.3.4.6 Fold the filter in half twice (sample side inward) and place it in the glass cartridge atop the PUF. 11.3.4.7 Wrap the combined samples in the original hexane-rinsed aluminum foil, attach Teflon® end caps
(if applicable) and place them in their original aluminum shipping container. Complete a sample label and affix it to the aluminum shipping container.
Page 13A-22 Compendium of Methods for Toxic Organic Air Pollutants January 1999

PAHs Method TO-13A
11.3.4.8 Chain-of-custody should be maintained for all samples. Store the containers under blue ice or dry ice and protect from UV light to prevent possibly photo-decomposition of collected analytes. If the time span between sample collection and laboratory analysis is to exceed 24 hours, refrigerate sample at 4EC.
11.3.4.9 Return at least one field blank filter/PUF cartridge to the laboratory with each group of samples. Treat a field blank exactly as the sample except that air is not drawn through the filter/sorbent cartridge assembly.
11.3.4.10 Ship and store field samples chilled (<4EC) using blue ice until receipt at the analytical laboratory, after which samples should be refrigerated at less than or equal to 4EC for up to 7 days prior to extraction; extracts should be analyzed within 40 days of extraction.
12. Sample Extraction, Concentration, and Cleanup
[Note: The following sample extraction, concentration, solvent exchange and analysis procedures are outlined for user convenience in Figure 13.]
12.1 Sample Identification
12.1.1 The chilled (<4EC) samples are returned in the aluminum shipping container (containing the filter and sorbents) to the laboratory for analysis. The "chain-of-custody" should be completed.
12.1.2 The samples are logged in the laboratory logbook according to sample location, filter and sorbent cartridge number identification, and total air volume sampled (uncorrected).
12.1.3 If the time span between sample registration and analysis is greater than 24-hours, then the sample must be kept refrigerated at <4EC. Minimize exposure of samples to fluorescent light. All samples should be extracted within one week (7 days) after sampling.
12.2 Soxhlet Extraction and Concentration
[Note: If PUF is the sorbent, the extraction solvent is 10 percent diethyl ether in hexane. If XAD-2® resin is the sorbent, the extraction solvent is methylene chloride.]
12.2.1 Assemble the Soxhlet apparatus (see Figure 4a). Immediately before use, charge the Soxhlet apparatus with 700 to 750 mL of 10 percent diethyl ether in hexane and reflux for 2 hours. Let the apparatus cool, disassemble it, transfer the diethyl ether in hexane to a clean glass container, and retain it as a blank for later analysis, if required. Place the sorbent and filter together in the Soxhlet apparatus (the use of an extraction thimble is optional).
[Note: The filter and sorbent are analyzed together in order to reach detection limits, avoid questionable interpretation of the data, and minimize cost.]
12.2.1.1 Prior to extraction, add appropriate laboratory surrogate standards to the Soxhlet solvent. A surrogate standard (i.e., a chemically compound not expected to occur in an environmental sample) should be added to each sample, blank, and matrix spike sample just prior to extraction or processing. The recovery of the laboratory surrogate standard is used to monitor for unusual matrix effects, gross sample processing errors, etc. Surrogate recovery is evaluated for acceptance by determining whether the measure concentration falls within the acceptance limits. Spike 20 FL of a 50 Fg/mL solution of the surrogates onto the PUF cartridge, prior to Soxhlet extraction, to yield a final concentration of 1 Fg. The following laboratory surrogate standards have been
January 1999 Compendium of Methods for Toxic Organic Air Pollutants Page 13A-23

Method TO-13A PAHs
successfully utilized in determining Soxhlet extraction effects, sample process errors, etc., for GC/MS/DS analysis.
Laboratory Surrogate Standard
Total Spiked
Amount (µg)
D10-Fluorene D10-Pyrene
1 1
Section 13.2 outlines preparation of the laboratory surrogates. Add the laboratory surrogate compounds to the PUF cartridge. Add 700 mL of 10 percent diethyl ether in hexane to the apparatus and reflux for 18 hours at a rate of at least 3 cycles per hour. Allow to cool, then disassemble the apparatus.
12.2.1.2 Dry the extract from the Soxhlet extraction by passing it though a drying column containing about 10 grams of anhydrous sodium sulfate. Collect the dried extract in a K-D concentrator assembly. Wash the extractor flask and sodium sulfate column with 100-125 mL of 10 percent diethyl ether/hexane to complete the quantitative transfer.
12.2.2 Assemble a K-D concentrator (see Figure 4b) by attaching a 10 mL concentrator tube to a 500 mL evaporative flask.
[Note: Other concentration devices (vortex evaporator) or techniques may be used in place of the K-D as long as qualitative and quantitative recovery can be demonstrated.]
12.2.2.1 Add two boiling chips, attach a three-ball macro-Snyder column to the K-D flask, and concentrate the extract using a water bath at 60 to 65EC. Place the K-D apparatus in the water bath so that the concentrator tube is about half immersed in the water and the entire rounded surface of the flask is bathed with water vapor. Adjust the vertical position of the apparatus and the water temperature as required to complete the concentration in one hour. At the proper rate of distillation, the balls of the column actively chatter but the chambers do not flood. When the liquid has reached an approximate volume of 5 mL, remove the K-D apparatus from the water bath and allow the solvent to drain for at least 5 minutes while cooling.
12.2.2.2 Remove the Snyder column and rinse the flask and its lower joint into the concentrator tube with 5 mL of cyclohexane. A 5 mL syringe is recommended for this operation. The extract is now ready for further concentration to 1.0 mL by nitrogen blowdown.
12.2.2.3 Place the 1 mL calibrated K-D concentrator tube with an open micro-Snyder attachment in a warm water bath (30 to 3 5EC) and evaporate the solvent volume to just below 1 mL by blowing a gentle stream of clean, dry nitrogen (filtered through a column of activated carbon) above the extract.
12.2.2.4 The internal wall of the concentrator tube must be rinsed down several times with hexane during the operation.
12.2.2.5 During evaporation, the tube solvent level must be kept below the water level of the bath. the extract must never be allowed to become dry.
12.2.2.6 Bring the final volume back to 1.0 mL with hexane. Transfer the extract to a Teflon®-sealed screw-cap amber vial, label the vial, and store at 4EC (±2EC).
[Note: It is not necessary to bring the volume to exactly 1.0 mL if the extract will be cleaned up by solid phase extraction cleanup methods. Final volume is brought to 1.0 mL after cleanup.]
12.3 Sample Cleanup
Page 13A-24 Compendium of Methods for Toxic Organic Air Pollutants January 1999

PAHs Method TO-13A
12.3.1 If the extract is cloudy, impurities may be removed from the extract by solid phase extraction using activated silica gel. Clean-up procedures may not be needed for relatively clean matrix samples.
12.3.2 Approximately 10 grams of silica gel, type 60 (70-230 mesh), are extracted in a Soxhlet extractor with 10 percent diethyl ether for 6 hours (minimum rate, 3 cycles/hr) and then activated by heating in a foil-covered glass container for 16 hours at 150EC.
12.3.3 Using a disposable Pasteur pipette (7.5-mm x 14.6-cm), place a small piece of glass wool in the neck of the pipette. Prepare a slurry of activated silica gel in 10 percent diethyl ether. Place 10 grams of the activated silica gel slurry into the column using additional 10 percent diethyl ether. Finally, 1 gram of anhydrous sodium sulfate is added to the top of the silica gel. Prior to use, the column is rinsed with 10 percent diethyl ether at 1 mL/min for 1 hour to remove any trace of contaminants. It is then pre-eluted with 40 mL of pentane and the eluate discarded.
12.3.4 While the pentane pre-elutant covers the top of the column, 1 mL of the sample extract is transferred to the column, and washed on with 2 mL of n-hexane to complete the transfer. Allow to elute through the column. Immediately prior to exposure of the sodium sulfate layer the air, add 25 mL of pentane and continue the elution process. The pentane eluate is discarded.
12.3.5 The column is finally eluted at 2 mL/min with 25 mL of 10 percent diethyl ether in pentane (4:6 v/v) and collected in a 50 mL K-D flask equipped with a 5 mL concentrator tube for concentration to less than 5 mL. The concentrate is further concentrated to 1.0 mL under a gentle stream of nitrogen as previously described.
12.3.6 The extract is now ready for GC/MS analysis. Spike the extract with internal standards (ISs) before analysis. The following internal standards (ISs) have been successfully used in PAH analysis by GC/MS.
Internal Total Spiked Standard (IS) Amount (µg) D -Naphthalene 0.58
D10-Acenaphthene 0.5 D10-Phenanthrene 0.5
D12-Chrysene 0.5 D12-Perylene 0.5
Section 13.2 outlines preparation of the ISs.
13. Gas Chromatography with Mass Spectrometry Detection
13.1 General
13.1.1 The analysis of the extracted sample for benzo[a]pyrene and other PAHs is accomplished by an electron ionization gas chromatograph/mass spectrometer (EI GC/MS) in the mode with a total cycle time (including voltage reset time) of 1 second or less. The GC is equipped with an DB-5 fused silica capillary column (30-m x 0.32-mm I.D.) with the helium carrier gas for analyte separation. The GC column is temperature controlled and interfaced directly to the MS ion source.
13.1.2 The laboratory must document that the EI GC/MS system is properly maintained through periodic calibration checks. The GC/MS system should be operated in accordance with specifications outlined in Table 2.
13.1.3 The GC/MS is tuned using a 50 ng/µL solution of decafluorotriphenylphosphine (DFTPP). The DFTPP permits the user to tune the mass spectrometer on a daily basis. If properly tuned, the DFTPP key ions and ion abundance criteria should be met as outlined in Table 3.
January 1999 Compendium of Methods for Toxic Organic Air Pollutants Page 13A-25

Method TO-13A PAHs
13.1.4 The GC/MS operating conditions are outlined in Table 2. The GC/MS system should be calibrated using the internal standard technique. Figure 14 outlines the following sequence involving the GC/MS calibration.
13.2 Calibration of GC/MS/DS
13.2.1 Standard Preparation
Stock PAH Standards Including Surrogate Compounds 13.2.1.1 Prepare stock standards of B[a]P and other PAHs. The stock standard solution of B[a]P (2.0
µg/µL) and other PAHs can be user prepared from pure standard materials or can be purchased commercially. 13.2.1.2 Place 0.2000 grams of native B[a]P and other PAHs on a tared aluminum weighing disk and
weigh on a Mettler balance. 13.2.1.3 Quantitatively transfer the material to a 100 mL volumetric flask. Rinse the weighing disk with
several small portions of 10 percent diethyl ether/hexane. Ensure all material has been transferred. 13.2.1.4 Dilute to mark with 10 percent diethyl ether/hexane. 13.2.1.5 The concentration of the stock standard solution of B[a]P or other PAHs in the flask is 2.0 µg/µL.
[Note: Commercially prepared stock PAH standards may be used at any concentration if they are certified by the manufacturer or by an independent source.]
13.2.1.6 Transfer the stock standard solutions into Teflon®-sealed screw-cap bottles. Store at 4EC and protect from light. Stock standard solutions should be checked frequently for signs of degradation or evaporation, especially just prior to preparing calibration standards from them.
13.2.1.7 Stock PAH standard solutions must be replaced after 1 year or sooner if comparison with quality control check samples indicates a problem.
Mix Internal Standard (IS) Solution 13.2.1.8 For PAH analysis, deuterated internal standards are selected that are similar in analytical behavior
to the compound of interest. The following internal standards are suggested for PAH analysis:
D -Perylene D -Chrysene12 12
Benzo(e)pyrene Benz(a)anthracene Benzo(a)pyrene Chrysene Benzo(k)fluoranthene Pyrene
D10-Acenaphthene D8-Naphthalene Acenaphthene (if using XAD-2® as the sorbent) Naphthalene (if using XAD-2® as the Acenaphthylene (if using XAD-2® as the sorbent) sorbent) Fluorene Benzo(g,h,i)perylene D10-Phenanthrene Dibenz(a,h)anthracene Anthracene Indeno(1,2,3-cd)pyrene Fluoranthene Perylene Phenanthrene Benzo(b)fluoranthene Coronene
Page 13A-26 Compendium of Methods for Toxic Organic Air Pollutants January 1999

PAHs Method TO-13A
13.2.1.9 Purchase a mix IS solution containing specific IS needed for quantitation at a concentration of 2,000 ng/µL.
Mixed Stock PAH Standard Including Surrogate Compounds 13.2.1.10 Prepare a mixed stock PAH standard by taking 125 µL of the stock PAH standard(s) and
diluting to mark with hexane in a 10-mL volumetric flask. The concentration of the mixed stock PAH standard(s) is 25 ng/µL.
Calibration PAH Standards Including Surrogate Compounds 13.2.1.11 Calibration PAH standards can be generated from the stock PAH standard using serial dilution
utilizing the following equation:
C1 ' C2V1 V2
where: C1 = Concentration of stock PAH standards, ng/µL V1 = Volume of stock PAH standard solution taken to make calibration PAH standards, µL V2 = Final volume diluted to generate calibration PAH standards, µL C2 = Final concentration of calibration PAH standards, ng/µL
13.2.1.12 Using the above equation, prepare a series of calibration PAH standards which include the surrogate compounds (i.e., 2.50 ng/µL, 1.25 ng/µL, 0.50 ng/µL, 0.25 ng/µL, and 0.10 ng/µL) according to the scheme illustrated in Table 4 and described below.
• For CAL 5, transfer 1.00 mL of the mixed PAH stock standard in a 10-mL volumetric flask and dilute to 10.0 mL with hexane. The resulting concentration is 2.5 ng/µL for the PAH analytes.
• To prepare CAL 4, transfer 500 µL of the mixed PAH stock standard solution to a 10-mL volumetric flask and dilute to 10.0 mL with hexane. The resulting concentration is 1.25 ng/µL for PAH analytes.
• To prepare CAL 3, transfer 200 µL of the mixed PAH stock solution to a 10-mL volumetric flask and dilute to 10-mL with hexane. The resulting concentration is 0.50 ng/µL for PAH analytes.
• To prepare CAL 2, transfer 100 FL of the mixed PAH stock solution to a 10-mL volumetric flask and dilute to 10-mL with hexane. The resulting concentration is 0.25 ng/FL for PAH analytes.
• To prepare CAL 1, transfer 40 µL of the mixed PAH stock solution to a 10-mL volumetric flask and dilute to 10-mL with hexane. The resulting concentration is 0.10 ng/µL for PAH analytes.
13.2.2 Internal Standard Spiking 13.2.2.1 Prior to GC/MS analysis, each 1 mL aliquot of the five calibration standards is spiked with
internal standard to a final concentration of 0.5 ng/µL. To do this, first prepare a 1:40 dilution of the 2,000 ng/µL mixed internal standard solution by diluting 250 µL to a volume of 10 mL to yield a concentration of 50 ng/µL.
13.2.2.2 Each 1.0-mL portion of calibration standard and sample extract is then spiked with 10 µL of the internal standard solution prior to analysis by GC/MS/DS operated in the SCAN mode.
13.2.3 Storage, Handling, and Retention of Standards 13.2.3.1 Store the stock and mixed standard solutions at 4EC (±2EC) in Teflon®-lined screw-cap amber
bottles. Store the working standard solutions at 4EC (±2EC) in Teflon®-lined screw-cap amber bottles.
January 1999 Compendium of Methods for Toxic Organic Air Pollutants Page 13A-27

Method TO-13A PAHs
13.2.3.2 Protect all standards from light. Samples, sample extracts, and standards must be stored separately.
13.2.3.3 Stock standard solutions must be replaced every 12 months, or sooner, if comparison with quality control check samples indicates a problem. Diluted working standards are usable for 6 months. Analysis difficulties, which warrant investigation, may require preparation of new standards. All standards are securely stored at ~4EC (±2EC) but above freezing. The concentration, preparation and expiration date, and solvent are identified on standard vial labels. Each standard is uniquely identified with its laboratory notebook number and a prefix. This procedure helps provide traceability to standard preparation.
13.2.3.4 Take care to maintain the integrity of each standard. The solvent, hexane, is volatile and can easily evaporate. Make sure each vial is sealed after use, and mark the solvent level on the side of the vial. When retrieving a vial for use, if the solvent level does not match the mark, dispose of the standard and obtain a new one.
13.3 GC/MS Instrument Operating Conditions
13.3.1 Gas Chromatograph (GC). The following are the recommended GC analytical conditions, as also outlined in Table 3, to optimize conditions for compound separation and sensitivity.
Carrier Gas: Helium 3Linear Velocity: 28-29 cm /sec
Injector Temperature: 250-300EC Injector: Grob-type, splitless, 2 µL Temperature Program: Initial Temperature: 70EC Initial Hold Time: 4.0 ± 0.1 min. Ramp Rate: 10EC/min to 300EC, hold for 10 min Final Temperature: 300EC Final Hold Time: 10 min (or until all compounds of interest have eluted). Analytical Time: Approximately 50 min.
13.3.2 Mass Spectrometer. Following are the required mass spectrometer conditions for scan data acquisition:
Transfer Line Temperature: 290EC Source Temperature: According to manufacturer's specifications Electron Energy: 70 volts (nominal) Ionization Mode: EI Mass Range: 35 to 500 amu, SCAN data acquisition Scan Time: At least 5 scans per peak, not to exceed 1 second per scan
13.3.3 Instrument Performance Check for GC/MS. 13.3.3.1 Summary. It is necessary to establish that the GC/MS meet tuning and standard mass spectral
abundance criteria prior to initiating any on-going data collection, as illustrated in Figure 14. This is accomplished through the analysis of decafluorotriphenylphosphine (DFTPP).
13.3.3.2 Frequency. The instrument performance check solution of DFTPP will be analyzed initially and once per 12-hour time period of operation. Also, whenever the laboratory takes corrective action which may change or affect the mass spectral criteria (e.g., ion source cleaning or repair, column replacement, etc.), the instrument performance check must be verified irrespective of the 12-hour laboratory requirement. The 12-hour
Page 13A-28 Compendium of Methods for Toxic Organic Air Pollutants January 1999

PAHs Method TO-13A
time period for GC/MS analysis begins at the injection of the DFTPP, which the laboratory submits as documentation of a compliance tune. The time period ends after 12 hours have elapsed. To meet instrument performance check requirements, samples, blanks, and standards must be injected within 12 hours of the DFTPP injection.
13.3.3.3 Procedure. Inject 50 ng of DFTPP into the GC/MS system. DFTPP may be analyzed separately or as part of the calibration standard.
13.3.3.4 Technical Acceptance Criteria. The following criteria have been established in order to generate accurate data:
• Prior to the analysis of any samples, blanks, or calibration standards, the laboratory must establish that the GC/MS system meets the mass spectral ion abundance criteria for the instrument performance check solution containing DFTPP.
• The GC/MS system must be tuned to meet the manufacturer's specifications, using a suitable calibrant. The mass calibration and resolution of the GC/MS system are verified by the analysis of the instrument performance check solution.
• The abundance criteria listed in Table 3 must be met for a 50 ng injection of DFTPP. The mass spectrum of DFTPP must be acquired by averaging three scans (the peak apex scan and the scans immediately preceding and following the apex). Background subtraction is required, and must be accomplished using a single scan prior to the elution of DFTPP.
[Note: All ion abundance MUST be normalized to m/z 198, the nominal base peak, even though the ion abundances of m/z 442 may be up to 110 percent of m/z 198.]
• The above criteria are based on adherence to the acquisition specifications identified in Table 4 and were developed for the specific target compound list associated with this document. The criteria are based on performance characteristics of instruments currently utilized in routine support of ambient air program activities. These specifications, in conjunction with relative response factor criteria for target analytes, are designed to control and monitor instrument performance associated with the requirements if this document. As they are performance-based criteria for these specific analytical requirements, they may not be optimal for additional target compounds.
• If the mass spectrometer has the ability for autotuning, then the user may utilize this function following manufacturer's specifications. Autotune automatically adjusts ion source parameters within the detector using FC-43 (Heptacos). Mass peaks at m/z 69, 219, and 502 are used for tuning. After the tuning is completed, the FC-43 abundances at m/z 50, 69, 131, 219, 414, 502, and 614 are further adjusted such that their relative intensities match the selected masses of DFTPP.
13.3.3.5 Corrective Action. If the DFTPP acceptance criteria are not met, the MS must be retuned. It may be necessary to clean the ion source, or quadrupoles, or take other actions to achieve the acceptance criteria. DFTPP acceptance criteria MUST be met before any standards, or required blanks, are analyzed. Any standards, field samples, or required blanks analyzed when tuning criteria have not been met will require reanalysis.
13.3.4 Initial Calibration for GC/MS. 13.3.4.1 Summary. Prior to the analysis of samples and required blanks, and after tuning criteria
(instrument performance check) have been met, each GC/MS system will be initially calibrated at a minimum of five concentrations to determine instrument sensitivity and the linearity of GC/MS response for the analyte compounds and the surrogates.
13.3.4.2 Frequency. Each GC/MS system must be initially calibrated whenever the laboratory takes corrective action, which may change or affect the initial calibration criteria (e.g., ion source cleaning or repair,
January 1999 Compendium of Methods for Toxic Organic Air Pollutants Page 13A-29

Method TO-13A PAHs
column replacement, etc.), or if the continuing calibration acceptance criteria have not been met. If time still remains in the 12-hour time period after meeting the technical acceptance criteria for the initial calibration, samples may be analyzed. It is not necessary to analyze a continuing calibration standard within the 12-hour time period if the initial calibration standard (CAL 3) is the same concentration as the continuing calibration standard and both meet the continuing calibration technical acceptance criteria. Quantify all sample results using the mean of the relative response factors (RRFs) from the initial calibration.
13.3.4.3 Procedure. Perform the following activities to generate quantitative data:
• Set up the GC/MS system. • Warm all standard/spiking solutions, sample extracts, and blanks to ambient temperature (~1 hour) before
analysis. • Tune the GC/MS system to meet the technical acceptance criteria (see Section 13.3.3). • Prepare five calibration standards containing the target compounds, internal standards, and surrogate
compounds at the concentrations outlined in Table 4. • Calibrate the GC/MS by injecting 2.0 µL of each standard. If a compound saturates when the CAL 5
standard is injected, and the system is calibrated to achieve a detection sensitivity of no less than the MDL for each compound, the laboratory must document it and attach a quantitation report and chromatogram. In this instance, the laboratory must calculate the results based on a four-point initial calibration for the specific compound that saturates. Secondary ion quantitation is only allowed when there are sample interferences with the primary quantitation ion. If secondary ion quantitation is used, calculate a relative response factor using the area response from the most intense secondary ion which is free of interferences and document the reasons for the use of the secondary ion.
• Record a mass spectrum of each target compound. Figure 15(a) through 15(q) documents the mass spectrum for each of the 16 target PAHs discussed in Compendium Method TO-13A. Judge the acceptability of recorded spectra by comparing them to spectra in libraries. If an acceptable spectrum of a calibration standard component is not acquired, take necessary actions to correct GC/MS performance. If performance cannot be corrected, report sample extract data for the particular compound(s), but document the affected compound(s) and the nature of the problem.
13.3.4.4 Calculations. Perform the following calculations to generate quantitative data:
[Note: In the following calculations, the area response is that of the primary quantitation ion unless otherwise stated.]
• Relative Response Factors (RRFs). Calculate RRFs for each analyte target compound and surrogate using the following equation with the appropriate internal standard. Table 5 outlines characteristic ions for the surrogate compounds and internal standards. Table 6 outlines primary quantitation ions for each PAH. Use the following equation for RRF calculation.
A xCisRRF ' AisCx
where: Ax = area of the primary quantitation ion for the compound to be measured, counts Ais = area of the primary quantitation ion for the internal standard, counts Cis = concentration or amount of the internal standard, ng/µL
Page 13A-30 Compendium of Methods for Toxic Organic Air Pollutants January 1999

PAHs Method TO-13A
Cx = concentration or amount of the compound to be measured, ng/µL
• Percent Relative Standard Deviation (%RSD). Using the RRFs from the initial calibration, calculate the %RSD for all target compounds and surrogates using the following equations:
SDRRF%RSD ' x 100 x
and
N & x)2
j (xi'SDRRF
i'1 N & 1
where: SDRRF = standard deviation of initial response factors (per compound)
x = mean of initial relative response factors (per compound) Xi = ith RRF N = number of determinations
• Relative Retention Times (RRT). Calculate the RRTs for each target compound and surrogate over the initial calibration range using the following equation:
RT cRRT ' RTis
where: RTc = retention time of the target compound, minutes RTis = retention time of the internal standard, minutes
• Mean of the Relative Retention Times (RRT). Calculate the mean of the relative retention times (RRT) for each analyte target compound and surrogate over the initial calibration range using the following equation:
n
' j RRTiRRT ni'1
where: RRT = mean relative retention time for the target compound or surrogate for each initial calibration
standard, minutes RRT = relative retention time for the target compound or surrogate for each initial calibration standard,
minutes
January 1999 Compendium of Methods for Toxic Organic Air Pollutants Page 13A-31
Method TO-13A PAHs
• Mean Area Response (Y) for Internal Standard. Calculate the area response (Y) mean for primary quantitation ion each internal standard compound over the initial calibration range using the following equation:
n
Y ' j Yi
i'1 n
where:
Y = mean area response, counts Yi = area response for the primary quantitation ion for the internal standard for each calibration standard,
counts
• Mean of the Retention Time (RT ) For Internal Standard. Calculate the mean of the retention times (RT) for each internal standard over the initial calibration range using the following equation:
n
' j RTiRT ni'1
where: RT = mean retention time, minutes RT = retention time for the internal standard for each initial calibration standard, minutes
13.3.4.5 Technical Acceptance Criteria. All initial calibration standards must be analyzed at the concentration levels at the frequency described in Section 13.3.3 on a GC/MS system meeting the DFTPP instrument performance check criteria.
• The relative response factor (RRF) at each calibration concentration for each target compound and surrogate that has a required minimum response factor value must be greater than or equal to the minimum acceptable relative response factor (see Table 7) of the compound.
• The percent relative standard deviation (%RSD) over the initial calibration range for each target compound and surrogate that has a required maximum %RSD must be less than or equal to the required maximum value (see Table 7). For all the other target compounds, the value for %RSD must be less than or equal to 30 percent. When the value for %RSD exceeds 30 percent, analyze additional aliquots of appropriate CALs to obtain an acceptable %RSD of RRFs over the entire concentration range, or take action to improve GC/MS performance.
• The relative retention time for each of the target compounds and surrogates at each calibration level must be within ±0.06 relative retention time units of the mean relative retention time for the compound.
• The retention time shift for each of the internal standards at each calibration level must be within ±20.0 seconds compared to the mean retention time (RT) over the initial calibration range for each internal standard.
• The compounds must meet the minimum RRF and maximum %RSD criteria for the initial calibration.
13.3.4.6 Corrective Action. If the technical acceptance criteria for initial calibration are not met, the system should be inspected for problems. It may be necessary to clean the ion source, change the column, or take other corrective actions to achieve the acceptance criteria. Initial calibration technical acceptance criteria MUST
Page 13A-32 Compendium of Methods for Toxic Organic Air Pollutants January 1999

PAHs Method TO-13A
be met before any samples or required blanks are analyzed in a 12-hour time period for an initial calibration analytical sequence.
13.3.5 Continuing Calibration. 13.3.5.1 Summary. Prior to the analysis of samples and required blanks and after tuning criteria have
been met, the initial calibration of each GC/MS system must be routinely checked by analyzing a continuing calibration standard (see Table 4, CAL 3) to ensure that the instrument continues to meet the instrument sensitivity and linearity requirements of the method. The continuing calibration standard (CAL 3) shall contain the appropriate target compounds, surrogates, and internal standards.
13.3.5.2 Frequency. Each GC/MS used for analysis must be calibrated once every time period of operation. The 12-hour time period begins with injection of DFTPP. If time still remains in the 12-hour time period after meeting the technical acceptance criteria for the initial calibration, samples may be analyzed. It is not necessary to analyze a continuing calibration standard within this 12-hour time period, if the initial calibration standard that is the same concentration as the continuing calibration standard meets the continuing calibration technical acceptance criteria.
13.3.5.3 Procedure. The following activities should be performed for continuing calibration:
• Set up the GC/MS system as specified by the manufacturer. • Tune the GC/MS system to meet the technical acceptance criteria (see Section 13.3.3). • Analyze the CAL 3 standard solution containing all the target analytes, surrogate compounds, and
internal standards using the procedure listed for the initial calibration. • Allow all standard/spiking solutions and blanks to warm to ambient temperature (approximately 1 hour)
before preparation or analysis. • Start the analysis of the continuing calibration by injecting 2.0 µL of the CAL 3 standard solution.
13.3.5.4 Calculations. The following calculations should be performed:
• Relative Response Factor (RRF). Calculate a relative response factor (RRF) for each target compound and surrogate.
• Percent Difference (%D). Calculate the percent difference between the mean relative response factor (RRF) from the most recent initial calibration and the continuing calibration RRF for each analyte target compound and surrogate using the following equation:
RRF & RRFic' x 100%DRRF
RRFi
where: %D = percent difference between relative response factorsRRF
RRFi = average relative response factor from the most recent initial calibration
RRFc = relative response factor from the continuing calibration standard
13.3.5.5 Technical Acceptance Criteria. The continuing calibration standard must be analyzed for the compounds listed in concentration levels at the frequency described and on a GC/MS system meeting the DFTPP instrument performance check and the initial calibration technical acceptance criteria. The relative response factor for each target analyte and surrogate that has a required minimum relative response factor value must be greater than or equal to the compound's minimum acceptable relative response factor. For an acceptable
January 1999 Compendium of Methods for Toxic Organic Air Pollutants Page 13A-33

Method TO-13A PAHs
continuing calibration, the %D between the measured RRF for each target/surrogate compound of the CAL 3 standard and the mean value calculated during initial calibration must be within ±30 percent. If the criteria for %D are not met for the target or surrogate compounds, remedial action must be taken and recalibration may be necessary.
13.3.5.6 Corrective Action. If the continuing calibration technical acceptance criteria are not met, recalibrate the GC/MS instrument. It may be necessary to clean the ion source, change the column, or take other corrective actions to achieve the acceptance criteria. Continuing calibration technical acceptance criteria MUST be met before any samples or required blanks are analyzed in a 12-hour continuing calibration analytical sequence. Any samples or required blanks analyzed when continuing calibration criteria were not met will require reanalysis. Remedial actions, which include but are not limited to the following, must be taken if criteria are not met:
• Check and adjust GC and/or MS operating conditions. • Clean or replace injector liner. • Flush column with solvent according to manufacturers instructions. • Break off a short portion (approximately 0.33 cm) of the column. • Replace the GC column (performance of all initial calibration procedures are then required). • Adjust MS for greater or lesser resolution. • Calibrate MS mass scale. • Prepare and analyze new continuing calibration. • Prepare a new initial calibration curve.
13.3.6 Laboratory Method Blank (LMB). 13.3.6.1 Summary. The purpose of the LMB is to monitor for possible laboratory contamination.
Perform all steps in the analytical procedure using all reagents, standards, surrogate compounds, equipment, apparatus, glassware, and solvents that would be used for a sample analysis. An LMB is an unused, certified filter/cartridge assembly which is carried though the same extraction procedure as a field sample. The LMB extract must contain the same amount of surrogate compounds and internal standards that is added to each sample. All field samples must be extracted and analyzed with an associated LMB.
13.3.6.2 Frequency. Analyze an LMB along with each batch of #20 samples through the entire extraction, concentration, and analysis process. The laboratory may also analyze a laboratory reagent blanks which is the same as an LMB except that no surrogate compounds or internal standards are added. This demonstrates that reagents contain no impurities producing an ion current above the level of background noise for quantitation ions for those compounds.
13.3.6.3 Procedure. Extract and analyze a clean, unused filter and glass cartridge assembly. 13.3.6.4 Technical Acceptance Criteria. Following are the technical criteria for the LMB:
• All blanks must be analyzed on a GC/MS system meeting the DFTPP instrument performance check and initial calibration or continuing calibration technical acceptance criteria.
• The percent recovery for each of the surrogates in the blank must be within the acceptance windows. • The area response change for each of the internal standards for the blank must be within -50 percent and
+100 percent compared to the internal standards in the most recent continuing calibration analysis. • The retention time for each of the internal standards must be within ±20.0 seconds between the blank
and the most recent CAL 3 analysis. • The LMB must not contain any target analyte at a concentration greater than the MDL and must not
contain additional compounds with elution characteristics and mass spectral features that would interfere
Page 13A-34 Compendium of Methods for Toxic Organic Air Pollutants January 1999

PAHs Method TO-13A
with identification and measurement of a method analyte at its MDL. If the LMB that was extracted along with a batch of samples is contaminated, the entire batch of samples must be flagged.
13.3.6.5 Corrective Action. Perform the following if the LCBs exceed criteria:
• If the blanks do not meet the technical acceptance criteria, the analyst must consider the analytical system to be out of control. It is the analyst's responsibility to ensure that method interferences caused by contaminants in solvents, reagents, glassware, and other sample storage and processing hardware that lead to discrete artifacts and/or elevated baselines in gas chromatograms be eliminated. If contamination is a problem, the source of the contamination must be investigated and appropriate corrective measure MUST be taken and documented before further sample analysis proceeds.
• All samples processed with a method blank that is out of control (i.e., contaminated) will require data qualifiers to be attached to the analytical results.
13.3.7 Laboratory Control Spike (LCS). 13.3.7.1 Summary. The purpose of the LCS is to monitor the extraction efficiency of Compendium
Method TO-13A target analytes from a clean, uncontaminated PUF cartridge. An LCS is an unused, certified PUF that is spiked with the target analytes (1 Fg) and carried through the same extraction procedures as the field samples. The LCS must contain the same amount of surrogate compounds and internal standards that is added to each sample. All field samples must be extracted and analyzed with an associated LCS. All steps in the analytical procedure must use the same reagents, standards, surrogate compounds, equipment, apparatus, glassware, and solvents that would be used for a sample analysis.
13.3.7.2 Frequency. Analyze an LCS along with each of <20 samples through the entire extraction, concentration, and analysis. (The laboratory may also analyze a laboratory reagent blank which is the same as an LMB except that no surrogate compounds or internal standards are added. This demonstrates that reagents contain no impurities producing an ion current above the level of background noise for quantitation ions of those compounds.)
13.3.7.3 Procedure. Extract and analyze a clean, unused certified PUF cartridge assembly. 13.3.7.4 Technical Acceptance Criteria. Technical criteria for the LCS are:
• All LCSs must be analyzed on a GC/MS system meeting the DFTPP instrument performance check and initial calibration or continuing calibration technical acceptance criteria.
• The percent recovery for each of the surrogates in the LCS must be within the acceptance windows. • The area response change for each of the internal standards for the LCS must be within -50 percent and
+100 percent compared to the internal standards in the most recent continuing calibration analysis. • The retention time for each of the internal standards must be within ±20.0 seconds between the LCS and
the most recent CAL 3 analysis. • All target analytes spiked on the certified PUF cartridge must meet a percent recovery between 60-120
to be acceptable.
13.3.7.5 Corrective Action. Perform the following if the LCS exceed criteria:
• If the LCS do not meet the technical acceptance criteria, the analyst must consider the analytical system to be out of control. It is the analyst's responsibility to ensure that method interferences caused by contaminants in solvents, reagents, glassware, and other sample storage and processing hardware that lead to discrete artifacts and/or elevated baselines in gas chromatograms be eliminated. If contamination is a problem, the source of the contamination must be investigated and appropriate corrective measure MUST be taken and documented before further sample analysis proceeds.
January 1999 Compendium of Methods for Toxic Organic Air Pollutants Page 13A-35

Method TO-13A PAHs
• All samples processed with a LCS that is out of control (i.e., contaminated) will require re-analysis or data qualifiers to be attached to the analytical results.
13.4 Sample Analysis by GC/MS
13.4.1 Summary. The sample extract is analyzed by GC/MS and quantitated by the internal standard method.
13.4.2 Frequency. Before samples can be analyzed, the instrument must meet the GC/MS tuning and initial calibration or continuing calibration technical acceptance criteria. If there is time remaining in the 12-hour time period with a valid initial calibration or continuing calibration, samples may be analyzed in the GC/MS system that meet the instrument performance check criteria.
13.4.3 Procedure. For sample analysis, perform the following:
• Set up the GC/MS system. • All sample extracts must be allowed to warm to ambient temperature (~1 hour) before analysis. All sample
extracts must be analyzed under the same instrumental conditions as the calibration standards. • Add the internal standard spiking solution to the 1.0 mL extract. For sample dilutions, add an appropriate
amount of the internal standard spiking solution to maintain the concentration of the internal standards at 2 ng/µL in the diluted extract.
• Inject 2.0 µL of sample extract into the GC/MS, and start data acquisition. • When all semi-volatile target compounds have eluted from the GC, terminate the MS data acquisition and
store data files on the data system storage device. Use appropriate data output software to display full range mass spectra and SICPs. The sample analysis using the GC/MS is based on a combination of retention times and relative abundances of selected ions (see Table 6). These qualifiers should be stored on the hard disk of the GC/MS data computer and are applied for identification of each chromatographic peak. The retention time qualifier is determined to be +0.10 minute of the library retention time of the compound. The acceptance level for relative abundance is determined to be ±15% of the expected abundance. Three ions are measured for most of the PAH compounds. When compound identification is made by the computer, any peak that fails any of the qualifying tests is flagged (e.g., with an *). The data should be manually examined by the analyst to determine the reason for the flag and whether the compound should be reported as found. Although this step adds some subjective judgment to the analysis, computer-generated identification problems can be clarified by an experienced operator. Manual inspection of the quantitative results should also be performed to verify concentrations outside the expected range.
13.4.4 Dilutions. The following section provides guidance when an analyte exceeds the calibration curve.
• When a sample extract is analyzed that has an analyte target compound concentration greater than the upper limit of the initial calibration range or saturated ions from a compound excluding the compound peaks in the solvent front), the extract must be diluted and reanalyzed. Secondary ion quantitation is only allowed when there are sample interferences with the primary quantitation ion. If secondary ion quantitation is used, calculate a relative response factor using the area response for the most intense secondary ion which is free of sample interferences, and document the reasons for the use of the secondary ion.
• Calculate the sample dilution necessary to keep the semi-volatile target compounds that required dilution within the upper half of the initial calibration range so that no compound has saturated ions (excluding the compound peaks in the solvent front). Dilute the sample in hexane in a volumetric flask. Analyze the sample dilution.
Page 13A-36 Compendium of Methods for Toxic Organic Air Pollutants January 1999

PAHs Method TO-13A
• The dilution factor chosen should keep the response of the largest peak for a target compound in the upper half of the initial calibration range of the instrument.
• If the on-column concentration of any target compound in any sample exceeds the initial calibration range, that sample must be diluted, the internal standard concentration readjusted, and the sample extract reanalyzed.
• Use the results of the original analysis to determine the approximate dilution factor required to get the largest analyte peak within the initial calibration range.
13.4.5 Quantitation. This section provides guidance for quantitating PAH analytes.
• Target components identified shall be quantified by the internal standard method. The internal standards used for the target compounds are the ones nearest the retention time of a given analyte.
• The relative response factor (RRF) from the daily continuing calibration standard analysis (or RRF of CAL 3) if the sample is analyzed in the same 12-hour sequence as the initial calibration) is used to calculate the concentration in the sample. Secondary ion quantitation is allowed only when there are sample interferences with the primary ion. If secondary ion quantitation is performed, document the reasons. The area of a secondary ion cannot be substituted for the area of a primary ion unless a relative response factor is calculated using the secondary ion.
• A retention time window is calculated for each single component analyte and surrogate. Windows are established as ±0.01 RRT units of the retention time for the analyte in CAL 3 of the initial calibration or the continuing calibration.
13.4.6 Calculations. Perform the following calculations: 13.4.6.1 Calculation of Concentration. Calculate target compound concentrations using the following
equation:
A I V x s tDfConcentration, (ng/std m 3) ' RRFAisVi
where: Ax = area response for the compound to be measured, counts Ais = area response for the internal standard, counts
Is = amount of internal standard, ng/µL RRF = the mean RRF from the most recent initial calibration, dimensionless
Vi = volume of air sampled, std m3
Vt = volume of final extract, µL Df = dilution factor for the extract. If there was no dilution, D equals 1. If the sample was diluted, the Dff
is greater than 1.
The concentrations calculated can be converted to ppbv for general reference. The analyte concentration can be converted to ppbv using the following equation:
(ppb ) ' CA(ng/m 3) x 24.4/MWACA v
where:
January 1999 Compendium of Methods for Toxic Organic Air Pollutants Page 13A-37

Method TO-13A PAHs
CA = concentration of analyte calculated, ng/std. m3
MWA = molecular weight of analyte, g/g-mole 24.4 = molar volume occupied by ideal gas at standard temperature and pressure (25EC and 760 mm Hg),
L/mole.
13.4.6.2 Estimated Concentration. The equation in Section 13.4.6.1 is also used for calculating the concentrations of the non-target compounds. Total area counts (or peak heights) from the total ion chromatogram generated by the mass spectrometer for Compendium Method TO-13A PAHs (see Figure 16) are to be used for both the non-target compound to be measured (A ) and the internal standard (A ). Associate the nearest internalx is
standard free of interferences with the non-target compound to be measured. A relative response factor (RRF) of one (1) is to be assumed. The value from this quantitation shall be qualified as estimated ("J") (estimated, due to lack of a compound-specific response factor) and "N" (presumptive evidence of presence), indicating the quantitative and qualitative uncertainties associated with this non-target component. An estimated concentration should be calculated for all tentatively identified compounds (TICs) as well as those identified as unknowns.
13.4.6.3 Surrogate Percent Recovery (%R). Calculate the surrogate percent recovery using the following equation:
Qd%R ' x 100 Qa
where: Qd = Quantity determined by analysis, ng Qa = Quantity added to sample/blank, ng
The surrogate percent recovery must fall between 60-120% to be acceptable.
13.4.6.4 Percent Area Response Change (%ARC). Calculate the percent area response change (%ARC) for the sample/blank analysis compared to the most recent CAL 3 analysis for each of the internal standard compounds using the following equation:
A & A s x%ARC ' x 100 Ax
where: %ARC = percent area response change, %
As = area response of the internal standard in the sample/blank analysis, counts Ax = area response of the internal standard in the most recent CAL 3 analysis, counts
The area change for the internal standard must not exceed -50 to +100 percent.
13.4.6.5 Internal Standard Retention Time Shift (RTS). Calculate the retention time shift (RTS) between the sample/blank analysis and the most recent CAL 3 analysis for each of the internal standards using the following equation:
RTS ' RT & RTs x
where:
Page 13A-38 Compendium of Methods for Toxic Organic Air Pollutants January 1999

PAHs Method TO-13A
RTs = retention time of the IS in the sample RTx = retention time of the IS in the most recent CAL 3 analysis.
13.4.7 Technical Acceptance Criteria. The following guideline is provided as technical acceptance criteria. 13.4.7.1 All target compound concentrations must not exceed the upper limit of the initial calibration range
and no compound ion (excluding the compound peaks in the solvent front) may saturate the detector. 13.4.7.2 Internal standard responses and retention times in all samples must be evaluated during or
immediately after data acquisition. If the retention time for any internal standard changes by more than 20 seconds from the latest continuing calibration standard or CAL 3 if samples are analyzed in the same 12-hour sequence as the initial calibration, the chromatographic system must be inspected for malfunctions, and corrections made as required. The SICP of the internal standards must be monitored and evaluated for each field and QC sample. If the SICP area for any internal standard changes by more than a factor of -50 to +100 percent, the mass spectrometric system must be inspected for malfunction and corrections made as appropriate. If the analysis of a subsequent sample or standard indicates that the system is functioning properly, then corrections may not be required.
13.4.7.3 When target compounds are below the low standard, but the spectrum meets the identification criteria, report the concentration/amount with a "J." For example, if the low standard corresponds to 0.1Fg and an amount of 0.05 Fg is calculated, report as "0.05J."
13.4.8 Corrective Action. The following section provides guidance if analyte exceeds the technical criteria.
• If the sample technical acceptance criteria for the surrogates and internal standards are not met, check calculations, surrogate and internal standard solutions, and instrument performance. It may be necessary to recalibrate the instrument or take other corrective action procedures to meet the surrogate and internal standard technical acceptance criteria.
• Sample analysis technical acceptance criteria must be met before data are reported. Samples contaminated from laboratory sources, or associated with a contaminated method blank, or any samples analyzed that are not meet the technical acceptance criteria will require reanalysis.
• The samples or standards with SICP areas outside the limits must be reanalyzed. If corrections are made, then the laboratory must demonstrate that the mass spectrometric system is functioning properly. This must be accomplished by the analysis of a standard or sample that meets the SICP criteria. After corrections are made, the reanalysis of samples analyzed while the system was malfunctioning is required.
• If after reanalysis, the SICP areas for all internal standards are inside the technical acceptance limits (-50 to +100 percent), then the problem with the first analysis is considered to have been within the control of the laboratory. Therefore, submit only data from the analysis with SICPs within the technical acceptance limits. This is considered the initial analysis and must be reported as such on all data deliverables.
• If the reanalysis of the sample does not solve the problem (i.e., the SICP areas are outside the technical acceptance limits for both analyses) then the laboratory must submit the SICP data and sample data from both analyses. Distinguish between the initial analysis and the reanalysis on all data deliverables, using the sample suffixes specified.
• Tentative identification of an analyte occurs when a peak from a sample extract falls within the daily retention time window.
• If sample peaks are not detected, or all are less than full-scale deflection, the undiluted extract is acceptable for GC/MS analysis. If any sample ions are greater than the 120 percent of the initial calibration curve range, calculate the dilution necessary to reduce the major ion to between half- and full-range response.
January 1999 Compendium of Methods for Toxic Organic Air Pollutants Page 13A-39
Method TO-13A PAHs
14. Quality Assurance/Quality Control (QA/QC)
14.1 General System QA/QC
14.1.1 Each laboratory that uses Compendium Method TO-13A must operate a formal quality control program. The minimum requirements of this program consist of an initial demonstration of laboratory capability and an ongoing analysis of spiked samples to evaluate and document quality data. The laboratory must maintain records to document the quality of the data generated. Ongoing data quality checks are compared with established performance criteria to determine if the results of analyses meet the performance characteristics of the method. When results of sample spikes indicate a typical method performance, a quality control check standard must be analyzed to confirm that the measurements were performed in an in-control mode of operation.
14.1.2 Before processing any samples, the analyst should demonstrate, through the analysis of a reagent solvent blank, that interferences from the analytical system, glassware, and reagents are under control. Each time a set of samples is extracted or there is a change in reagents, a reagent solvent blank should be processed as a safeguard against chronic laboratory contamination. The blank samples should be carried through all stages of the sample preparation and measurement steps.
14.1.3 For each analytical batch (up to 20 samples), a reagent blank, matrix spike, and deuterated/surrogate samples must be analyzed (the frequency of the spikes may be different for different monitoring programs). The blank and spiked samples must be carried through all stages of the sample preparation and measurement steps.
14.1.4 The experience of the analyst performing GC/MS is invaluable to the success of the methods. Each day that analysis is performed, the daily calibration sample should be evaluated to determine if the chromatographic system is operating properly. Questions that should be asked are: Do the peaks look normal? Are the response windows obtained comparable to the response from previous calibrations? Careful examination of the standard chromatogram can indicate whether the column is still good, the injector is leaking, the injector septum needs replacing, etc. If any changes are made to the system (e.g., column changed), recalibration of the system must take place.
14.2 Process, Field, and Solvent Blanks
14.2.1 One PUF cartridge and filter from each batch of approximately 20 should be analyzed without shipment to the field for the compounds of interest to serve as a process blank. A blank level specified in Section 10.2 for each cartridge/filter assembly is considered to be acceptable.
14.2.2 During each sampling episode, at least one cartridge and filter should be shipped to the field and returned, without drawing air through the sampler, to serve as a field blank.
14.2.3 During the analysis of each batch of samples at least one solvent process blank (all steps conducted but no cartridge or filter included) should be carried through the procedure and analyzed. Blank levels should be those specified in Section 10.2 for single components to be acceptable.
14.2.4 Because the sampling configuration (filter and backup sorbent) has been tested for targeted PAHs in the laboratory in relationship to collection efficiency and has been demonstrated to be greater than 95 percent for targeted PAHs (except naphthalene, acenaphthylene, and acenaphthene), no field recovery evaluation is required as part of the QA/QC program outlined in this section.
15. References
Page 13A-40 Compendium of Methods for Toxic Organic Air Pollutants January 1999

PAHs Method TO-13A
1. Dubois, L., Zdrojgwski, A., Baker, C., and Monknao, J.L., "Some Improvement in the Determination of Benzo[a]Pyrene in Air Samples," J. Air Pollut. Contr. Assoc., 17:818-821, 1967.
2. Intersociety Committee, "Tentative Method of Analysis for Polynuclear Aromatic Hydrocarbon of Atmospheric Particulate Matter," Health Laboratory Science, 7(1):31-40, 1970.
3. Cautreels, W., and Van Cauwenberghe, K., "Experiments on the Distribution of Organic Pollutants Between Airborne Particulate Matter and Corresponding Gas Phase," Atmos. Environ., 12:1133-1141, 1978.
4. "Tentative Method of Microanalysis for Benzo[a]Pyrene in Airborne Particles and Source Effluents," American Public Health Association, Health Laboratory Science, 7(1):56-59, 1970.
5. "Tentative Method of Chromatographic Analysis for Benzo[a]Pyrene and Benzo[k]Fluoranthene in Atmospheric Particulate Matter," American Public Health Association, Health Laboratory Science, 7(1):60-67, 1970.
6. "Tentative Method of Spectrophotometric Analysis for Benzo[a]Pyrene in Atmospheric Particulate Matter," American Public Health Association, Health Laboratory Science, 7(1):68-71, 1970.
7. Jones, P.W., Wilkinson, J.E., and Strup, P.E., Measurement of Polycyclic Organic Materials and Other Hazardous Organic Compounds in Stack Gases: State-of-the-Art, U. S. Environmental Protection Agency, Research Triangle Park, NC, U.S. EPA-600/2-77-202, 1977.
8. Walling, J.F., Standard Operating Procedure for Ultrasonic Extraction and Analysis of Residual Benzo[a]Pyrene from Hi-Vol Filters via Thin-Layer Chromatography, U.S. Environmental Protection Agency, Environmental Monitoring Systems Laboratory, Methods Development and Analysis Division, Research Triangle Park, NC, EMSL/RTP-SOP-MDAD-015, December, 1986.
9. Rasor, S., Standard Operating Procedure for Polynuclear Aromatic Hydrocarbon Analysis by High Performance Liquid Chromatography Methods, Acurex Corporation, Research Triangle Park, NC, 1978.
10. Rapport, S. W., Wang, Y. Y., Wei, E. T., Sawyer, R., Watkins, B. E., and Rapport, H., "Isolation and Identification of a Direct-Acting Mutagen in Diesel Exhaust Particulates," Envir. Sci. Technol., 14:1505-1509, 1980.
11. Konlg, J., Balfanz, E., Funcke, W., and Romanowski, T., "Determination of Oxygenated Polycyclic Aromatic Hydrocarbons in Airborne Particulate Matter by Capillary Gas Chromatography and Gas Chromatography/Mass Spectrometry," Anal. Chem., 55:599-603, 1983.
12. Chuang, J. C., Bresler, W. E., and Hannan, S. W., Evaluation of Polyurethane Foam Cartridges for Measurement of Polynuclear Aromatic Hydrocarbons in Air, U.S. Environmental Protection Agency, Environmental Monitoring Systems Laboratory, Methods Development and Analysis Division, Research Triangle Park, NC, EPA-600/4-85-055, September 1985.
13. Chuang, J. C., Hannan, S. W., and Koetz, J. R., Stability of Polynuclear Aromatic Compounds Collected from Air on Quartz Fiber Filters and XAD-2 Resin, U.S. Environmental Protection Agency, Environmental Monitoring Systems Laboratory, Methods Development and Analysis Division, Research Triangle Park, NC, EPA-600/4-86-029, September 1986.
January 1999 Compendium of Methods for Toxic Organic Air Pollutants Page 13A-41

Method TO-13A PAHs
14. Feng, Y., and Bidleman, T. F., "Influence of Volatility on the Collection of Polynuclear Aromatic Hydrocarbon Vapors with Polyurethane Foam," Envir. Sci. Technol., 18:330-333, 1984.
15. Yamasaki, H., Kuwata, K., and Miyamoto, H., "Effects of Ambient Temperature on Aspects of Airborne Polycyclic Aromatic Hydrocarbons," Envir. Sci. Technol., 16:89-194, 1982.
16. Galasyn, J. F., Hornig, J. F., and Soderberg, R. H., "The Loss of PAH from Quartz Fiber High Volume Filters," J. Air Pollut. Contr. Assoc., 34:57-59, 1984.
17. You, F., and Bidleman, T. F., "Influence of Volatility on the Collection of Polynuclear Aromatic Hydrocarbon Vapors with Polyurethane Foam," Envir. Sci. Technol., 18:330-333, 1984.
18. Chuang, J. C., Hannan, S. W., and Koetz, J. R., Comparison of Polyurethane Foam and XAD-2 Resin as Collection Media for Polynuclear Aromatic Hydrocarbons in Air, U.S. Environmental Protection Agency, Environmental Monitoring Systems Laboratory, Methods Development and Analysis Division, Research Triangle Park, NC, EPA-600/4-86-034, December 1986.
19. Chuang, J. C., Mack, G. A., Mondron, P. J., and Peterson, B. A., Evaluation of Sampling and Analytical Methodology for Polynuclear Aromatic Compounds in Indoor Air, U.S. Environmental Protection Agency, Environmental Monitoring Systems Laboratory, Methods Development and Analysis Division, Research Triangle Park, NC, EPA-600/4-85-065, January 1986.
20. Lewis, R. G., Brown, A. R., and Jackson, M. D., "Evaluation of Polyurethane Foam for High-Volume Air Sampling of Ambient Levels of Airborne Pesticides, Polychlorinated Biphenyls, and Polychlorinated Naphthalenes," Anal. Chem., 49:1668-1672, 1977.
21. Lewis, R. G., and Jackson, M. D., "Modification and Evaluation of a High-Volume Air Sampler for Pesticides and Other Semi-volatile Industrial Organic Chemicals," Anal. Chem., 54:592-594, 1982.
22. Winberry, W. T., and Murphy, N. T., Supplement to Compendium of Methods for the Determination of Toxic Organic Compounds in Ambient Air, U.S. Environmental Protection Agency, Environmental Monitoring Systems Laboratory, Quality Assurance Division, Research Triangle Park, NC, EPA-600/4-87-006, September 1986.
23. Winberry, W. T., and Murphy, N. T., Second Supplement to Compendium of Methods for the Determination of Toxic Organic Compounds in Ambient Air, U.S. Environmental Protection Agency, Environmental Monitoring Systems Laboratory, Quality Assurance Division, Research Triangle Park, NC, EPA 600/4-89-018, June 1989.
24. Methods for Organic Chemical Analysis of Municipal and Industrial Wastewater, U.S. Environmental Protection Agency, Environmental Monitoring and Support Laboratory, Cincinnati, OH, EPA-600/4-82-057, July 1982.
25. ASTM Annual Book of Standards, Part 31, D 3694, "Standard Practice for Preparation of Sample Containers and for Preservation," American Society for Testing and Materials, Philadelphia, PA, p. 679, 1980.
26. Burke, J. A., "Gas Chromatography for Pesticide Residue Analysis; Some Practical Aspects," Journal of the Association of Official Analytical Chemists, 48:1037, 1965.
Page 13A-42 Compendium of Methods for Toxic Organic Air Pollutants January 1999

PAHs Method TO-13A
27. Cole, T., Riggin, R., and Glaser, J., Evaluation of Method Detection Limits: Analytical Curve for EPA Method 610 - PNAs, 5th International Symposium on Polynuclear Aromatic Hydrocarbons, Battelle, Columbus, OH, 1980.
28. Handbook of Analytical Quality Control in Water and Wastewater Laboratories, U.S. Environmental Protection Agency, Environmental Monitoring and Support Laboratory, Cincinnati, OH, EPA-600/4-79-019, March 1979.
29. ASTM Annual Book of Standards, Part 31, D 3370, "Standard Practice for Sampling Water," American Society for Testing and Materials, Philadelphia, PA, p. 76, 1980.
30. Protocol for the Collection and Analysis of Volatile POHC's (Principal Organic Hazardous Constituents) Using VOST (Volatile Organic Sampling Train), U. S. Environmental Protection Agency, Research Triangle Park, NC, EPA-600/8-84-007, March 1984.
31. Sampling and Analysis Methods for Hazardous Waste Combustion - Methods 3500, 3540, 3610, 3630, 8100, 8270, and 8310; Test Methods for Evaluating Solid Waste (SW-846), U.S. Environmental Protection Agency, Office of Solid Waste, Washington, D.C.
32. Riggin, R. M., Compendium of Methods for the Determination of Toxic Organic Compounds in Ambient Air, U.S. Environmental Protection Agency, Environmental Monitoring Systems Laboratory, Quality Assurance Division, Research Triangle Park, NC, EPA-600/4-84-041, April 1984.
33. Chuang, C. C., and Peterson, B. A., Review of Sampling and Analysis Methodology for Polynuclear Aromatic Compounds in Air from Mobile Sources, Final Report, U. S. Environmental Protection Agency, Research Triangle Park, NC, EPA-600/S4-85-045, August 1985.
34. Measurement of Polycyclic Organic Matter for Environmental Assessment, U.S. Environmental Protection Agency, Industrial Environmental Research Laboratory, Research Triangle Park, NC, EPA-600/7-79-191, August 1979.
35. Hudson, J. L., Standard Operating Procedure No. FA 113C: Monitoring for Particulate and Vapor Phase Pollutants Using the Portable Particulate/Vapor Air Sampler, U.S. Environmental Protection Agency, Region VII, Environmental Monitoring and Compliance Branch, Environmental Services Division, Kansas City, KS, March 1987.
36. Trane, K. E., and Mikalsen, A., "High-Volume Sampling of Airborne Polycyclic Aromatic Hydrocarbons Using Glass Fibre Filters and Polyurethane Foam," Atmos. Environ., 15:909-918, 1981.
37. Keller, C. D., and Bidleman, T. F., "Collection of Airborne Polycyclic Hydrocarbons and Other Organics with a Glass Fiber Filter - Polyurethane Foam System," Atmos. Environ., 18:837-845, 1984.
38. Hunt, G. T., and Pangaro, N., "Ambient Monitoring of Polynuclear Aromatic Hydrocarbons (PAHs) Employing High Volume Polyurethane Foam (PUF) Samplers," In Polynuclear Aromatic Hydrocarbons, Cooke, M., Dennis, and A. J., Eds, Battelle Press, Columbus, OH, pp. 583-608, 1985.
January 1999 Compendium of Methods for Toxic Organic Air Pollutants Page 13A-43

Method TO-13A PAHs
39. Alfeim, I., and Lindskog, A., "A Comparison Between Different High Volume Sampling Systems for Collecting Ambient Airborne Particles for Mutagenicity Testing and for Analysis of Organic Compounds," Sci. Total Environ., 34:203-222, 1984.
40. Umlauf, G., and Kaupp, H., "A Sampling Device for Semivolatile Organic Compounds in Ambient Air," Chemosphere, 27:1293-1296, 1993.
41. Hippelein, M., Kaupp, H., Dorr, G., and McLachlan, M. S., "Testing of a Sampling System and Analytical Method for Determination of Semivolatile Organic Chemicals in Air," Chemosphere, 26:2255-2263, 1993.
42. Ligocki, M. P., and Ponkow, J. F., "Assessment of Adsorption/Solvent Extraction with Polyurethane Foam and Adsorption/Thermal Desorption with Tenax-GC for Collection and Analysis of Ambient Organic Vapors," Anal. Chem., 57:1138-1144, 1985.
43. Yamasaki, H., Kuwata, K., and Miyamoto, H., "Effects of Ambient Temperature on Aspects of Airborne Polycyclic Aromatic Hydrocarbons," Envir. Sci. Technol., 16:189-194, 1982.
44. Hart, K. M., and Pankow, J. F., "High-Volume Air Sampler for Particle and Gas Sampling: Use of Backup Filters to Correct for the Adsorption of Gas-Phase Polycyclic Aromatic Hydrocarbons to the Front Filter," Envir. Sci. Technol., 28:655-661, 1994.
45. Kaupp, H., and Umlauf, G., "Atmospheric Gas-Particle Partitioning of Organic Compounds: Comparison of Sampling Methods," Atmos. Environ., 13:2259-2267, 1992.
46. Coutant, R. W., Brown, L., Chuang, J. C., Riggin, R. M., and Lewis, R. G., "Phase Distribution and Artifact Formation in Ambient Air Sampling for Polynuclear Aromatic Hydrocarbons," Atmos. Environ., 22:403-409, 1988.
47. Coutant, R. W., Callahan, P. J., Kuhlman, M. R., and Lewis, R. G., "Design and Performance of a High-Volume Compound Annular Denuder," Atmos. Environ., 23:2205-2211.
48. Lewis, R. G., Kelly, T. J., Chuang, J. C., Callahan, P. J., and Coutant, R. W., "Phase Distributions of Airborne Polycyclic Aromatic Hydrocarbons in Two U.S. Cities," In Proceedings of the 9th World Clean Air Congress & Exhibition, Montreal, Ontario, Canada, 1991, Vol., Paper IU-11E.02.
49. Kaupp, H., and Umlauf, G., "Atmospheric Gas-Particle Partitioning of Organic Compounds: Comparison of Sampling Methods," Atmos. Environ., 26A:2259-2267, 1992.
50. Riggin, R. M., Technical Assistance Document for Sampling and Analysis of Toxic Organic Compounds in Ambient Air, U.S. Environmental Protection Agency, Environmental Monitoring Systems Laboratory, Quality Assurance Division, Research Triangle Park, NC, EPA-600/4-83-027, June 1983.
51. ASTM Annual Book of Standards, Part 31, D 3694, "Standard Practice for Preparation of Sample Containers and for Preservation," American Society for Testing and Materials, Philadelphia, PA, p. 679, 1980.
52. Carcinogens - Working with Carcinogens, Department of Health, Education, and Welfare, Public Health Service, Center for Disease Control, National Institute for Occupational Safety and Health, Publication No. 77-206, August 1977.
Page 13A-44 Compendium of Methods for Toxic Organic Air Pollutants January 1999
PAHs Method TO-13A
53. OSHA Safety and Health Standards, General Industry, (29CFR1910), Occupational Safety and Health Administration, OSHA, 2206, Revised, January 1976.
54. "Safety in Academic Chemistry Laboratories," American Chemical Society Publication, Committee on Chemical Safety, 3rd Edition, 1979.
January 1999 Compendium of Methods for Toxic Organic Air Pollutants Page 13A-45

Method TO-13A PAHs
TA
BL
E 1
. FO
RM
UL
AE
AN
D P
HY
SIC
AL
PR
OPE
RT
IES
OF
SEL
EC
TE
D P
AH
s
Com
poun
d Fo
rmul
a M
olec
ular
Wei
ght
Mel
ting
Poin
t,EC
B
oilin
g Po
int,EC
V
apor
Pre
ssur
e,kP
a C
AS
RN
#
Nap
htha
lene
C
H
10
8 12
8.18
80
,2
218
1.1x
10
91-2
0-3
Ace
naph
thyl
ene
C H
12
8
152.
20
92-9
3 26
5-28
0 3.
9x10
20
8-96
-8
Ace
naph
then
e C
H
12
10
154.
20
90-9
6 27
8-27
9 2.
1x10
83
-32-
9
Fluo
rene
C
H
13
10
166.
23
116-
118
293-
295
8.7x
10
86-7
3-7
Ant
hrac
ene
C H
14
10
17
8.24
21
6-21
9 34
0 36
x10
120-
12-7
Phen
anth
rene
C
H
14
10
178.
24
96-1
01
339-
340
2.3x
10
85-0
1-8
Fluo
rant
hene
C
H
16
10
202.
26
107-
111
375-
393
6.5x
10
206-
44-0
Pyre
ne
C H
16
10
20
2.26
15
0-15
6 36
0-40
4 3.
1x10
12
9-00
-0
Ben
z(a)
anth
race
ne
C H
18
1222
8.30
15
7-16
7 43
5 1.
5x10
56
-55-
3
Chr
ysen
e C
H
18
12
228.
30
252-
256
441-
448
5.7x
10
218-
01-9
Ben
zo(b
)flu
oran
then
e C
H
20
1225
2.32
16
7-16
8 48
1 6.
7x10
20
5-99
-2
Ben
zo(k
)flu
oran
then
e C
H
20
1225
2.32
19
8-21
7 48
0-47
1 2.
1x10
20
7-08
-9
Pery
lene
C
H
20
12
252.
32
273-
278
500-
503
7.0x
10
198-
55-8
Ben
zo(a
)pyr
ene
C H
20
12
25
2.32
17
7-17
9 49
3-49
6 7.
3x10
50
-32-
8
Ben
zo(e
)pyr
ene
C H
20
12
25
2.32
17
8-17
9 49
3 7.
4x10
19
2-92
-2
Ben
zo(g
,h,i)
pery
lene
C
H
22
12276.
34
275-
278
525
1.3x
10
191-
24-2
Inde
no(1
,2,3
-cd)
pyre
ne
C H
22
12
276.
34
162-
163
--ca
.10
193-
39-5
Dib
enz(
a,h)
anth
race
ne
C H
22
14
278.
35
266-
270
524
1.3x
10
53-7
0-3
Cor
onen
e C
H
24
12
300.
36
438-
440
525
2.0x
10
191-
07-1
mpo
unds
sub
lime.
Man
y of
thes
e co
1
Page 13A-46 Compendium of Methods for Toxic Organic Air Pollutants January 1999

PAHs Method TO-13A
TABLE 2. GC-MS OPERATING CONDITIONS
Activity Conditions
Gas Chromatography
Column J&W Scientific, DB-5 crosslinked 5% phenylmethyl silicone (30 m x 0.32 mm, 1.0 µm film thickness) or equivalent
Carrier Gas 3Helium, velocity between 28-30 cm /sec at 250EC
Injection Volume 2 µL, Grob-type, splitless
Injector Temperature 290EC
Temperature Program
Initial Column Temperature 70EC
Initial Hold Time 4 ± 0.1 min.
Program 10EC/min to 300EC and hold 10 min.
Final Temperature 300EC
Final Hold Time 10 min. or until all compounds of interest have eluted
Mass Spectrometer
Transfer Line Temperature 290EC or According to Manufacturer's Specification
Source Temperature According to Manufacturer's Specifications
Electron Energy 70 volts (nominal)
Ionization Mode EI
Mass Range 35 to 500 amu, full range data acquisition (SCAN) mode
Scan Time At least 5 scans per peak, not to exceed 1 second per scan.
TABLE 3. DFTPP KEY IONS & ION ABUNDANCE CRITERIA
Mass Ion Abundance Criteria
51 30 to 60% of mass 198
68 70
Less than 2% of mass 69 Less than 2% of mass 69
127 40 to 60% of mass 198
197 198 199
Less than 2% of mass 198 Base peak, 100% relative abundance 5 to 9% of mass 198
275 10 to 30% of mass 198
365 Greater than 1.0% of mass 198
441 442 443
Present but less than mass 443 40% of mass 198 17 to 23% of mass 442
January 1999 Compendium of Methods for Toxic Organic Air Pollutants Page 13A-47

Method TO-13A PAHs
TABLE 4. COMPOSITION AND APPROXIMATE CONCENTRATION OF CALIBRATION SOLUTIONS
Concentration, ng/µL
Target Compound CAL 1 CAL 2 CAL 3 CAL 4 CAL 5
PAHs 0.10 0.25 0.50 1.25 2.50
Acenaphthene 0.10 0.25 0.50 1.25 2.50
Acenaphthylene 0.10 0.25 0.50 1.25 2.50
Anthracene 0.10 0.25 0.50 1.25 2.50
Benz(a)anthracene 0.10 0.25 0.50 1.25 2.50
Benzo(a)pyrene 0.10 0.25 0.50 1.25 2.50
Benzo(b)fluoranthene 0.10 0.25 0.50 1.25 2.50
Benzo(e)pyrene 0.10 0.25 0.50 1.25 2.50
Benzo(g,h,i)perylene 0.10 0.25 0.50 1.25 2.50
Benzo(k)fluoranthene 0.10 0.25 0.50 1.25 2.50
Chrysene 0.10 0.25 0.50 1.25 2.50
Perylene 0.10 0.25 0.50 1.25 2.50
Dibenz(a,h)anthracene 0.10 0.25 0.50 1.25 2.50
Fluoranthene 0.10 0.25 0.50 1.25 2.50
Fluorene 0.10 0.25 0.50 1.25 2.50
Indeno(1,2,3-c,d)pyrene 0.10 0.25 0.50 1.25 2.50
Naphthalene 0.10 0.25 0.50 1.25 2.50
Coronene 0.10 0.25 0.50 1.25 2.50
Phenanthrene 0.10 0.25 0.50 1.25 2.50
Pyrene 0.10 0.25 0.50 1.25 2.50
Page 13A-48 Compendium of Methods for Toxic Organic Air Pollutants January 1999

PAHs Method TO-13A
TABLE 4. (Continued)
Concentration, ng/µL
Target Compound CAL 1 CAL 2 CAL 3 CAL 4 CAL 5
SUGGESTED INTERNAL STANDARDS
D -Naphthalene8 0.5 0.5 0.5 0.5 0.5
D10-Acenaphthene 0.5 0.5 0.5 0.5 0.5
D10-Phenanthrene 0.5 0.5 0.5 0.5 0.5
D12-Chrysene 0.5 0.5 0.5 0.5 0.5
D12-Perylene 0.5 0.5 0.5 0.5 0.5
SUGGESTED SURROGATE COMPOUNDS
D10-Fluoranthene (field) 0.10 0.25 0.50 1.25 2.50
D12-Benzo[a]pyrene (field) 0.10 0.25 0.50 1.25 2.50
D10-Fluorene (lab) 0.10 0.25 0.50 1.25 2.50
D10-Pyrene (lab) 0.10 0.25 0.50 1.25 2.50
January 1999 Compendium of Methods for Toxic Organic Air Pollutants Page 13A-49

Method TO-13A PAHs
TABLE 5. CHARACTERISTIC IONS FOR SURROGATE SUGGESTED STANDARDS
Classification Primary Ion Secondary Ion
Internal Standards
D -Naphthalene8
D10-Acenaphthene D10-Phenanthrene D12-Chrysene D12-Perylene
136 164 188 240 264
68,137 162,165 94,189 120,241 260,265
Laboratory Surrogates
D10-Fluorene D10-Pyrene
176 212
88,177 106,213
Field Surrogates
D10-Fluoranthene D12-Benzo(a)pyrene
212 264
106,213 132,265
Page 13A-50 Compendium of Methods for Toxic Organic Air Pollutants January 1999
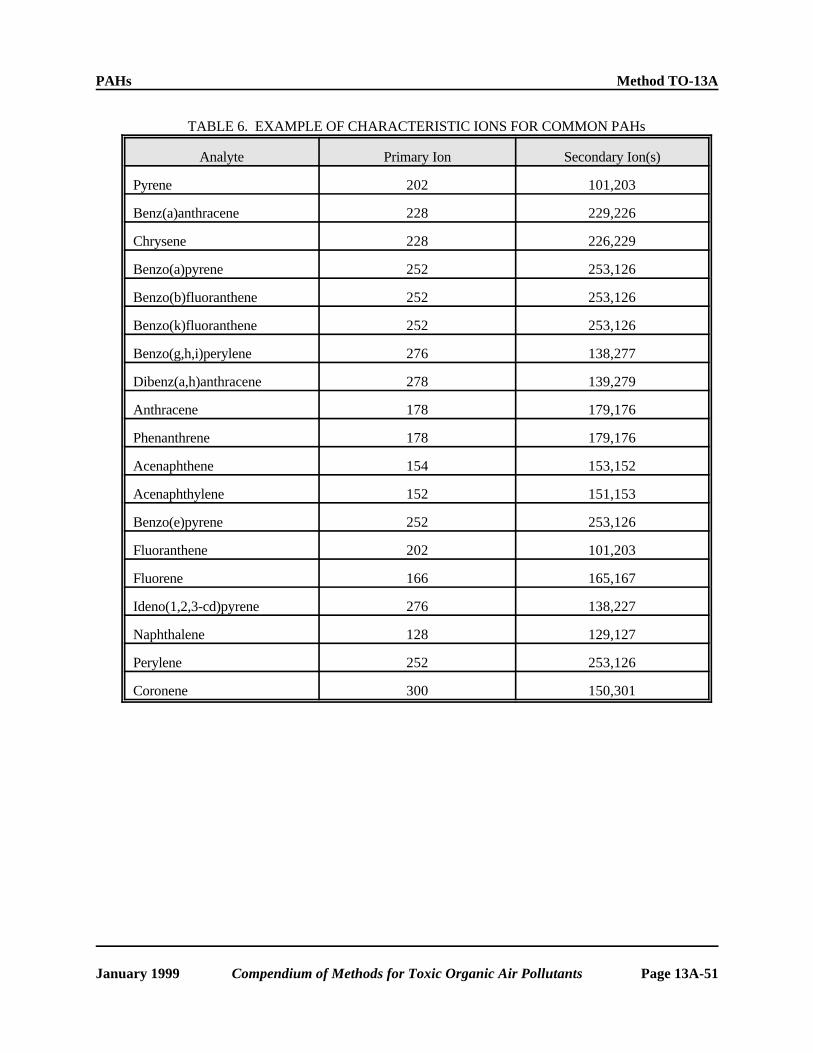
PAHs Method TO-13A
TABLE 6. EXAMPLE OF CHARACTERISTIC IONS FOR COMMON PAHs
Analyte Primary Ion Secondary Ion(s)
Pyrene 202 101,203
Benz(a)anthracene 228 229,226
Chrysene 228 226,229
Benzo(a)pyrene 252 253,126
Benzo(b)fluoranthene 252 253,126
Benzo(k)fluoranthene 252 253,126
Benzo(g,h,i)perylene 276 138,277
Dibenz(a,h)anthracene 278 139,279
Anthracene 178 179,176
Phenanthrene 178 179,176
Acenaphthene 154 153,152
Acenaphthylene 152 151,153
Benzo(e)pyrene 252 253,126
Fluoranthene 202 101,203
Fluorene 166 165,167
Ideno(1,2,3-cd)pyrene 276 138,227
Naphthalene 128 129,127
Perylene 252 253,126
Coronene 300 150,301
January 1999 Compendium of Methods for Toxic Organic Air Pollutants Page 13A-51

Method TO-13A PAHs
TABLE 7. EXAMPLE OF RELATIVE RESPONSE FACTOR CRITERIA FOR INITIAL AND CONTINUING CALIBRATION OF
COMMON SEMI-VOLATILE COMPOUNDS
Semi-volatile Compounds
Minimum RRF
Maximum %RSD
Maximum %Difference
Naphthalene 0.700 30 30
Acenaphthylene 1.300 30 30
Acenaphthene 0.800 30 30
Fluorene 0.900 30 30
Phenanthrene 0.700 30 30
Anthracene 0.700 30 30
Fluoranthene 0.600 30 30
Pyrene 0.600 30 30
Benz(a)anthracene 0.800 30 30
Chrysene 0.700 30 30
Benzo(b)fluoranthene 0.700 30 30
Benzo(k)fluoranthene 0.700 30 30
Benzo(a)pyrene 0.700 30 30
Indeno(1,2,3-cd)pyrene 0.500 30 30
Dibenz(a,h)anthracene 0.400 30 30
Benzo(g,h,i)perylene 0.500 30 30
Perylene 0.500 30 30
Coronene 0.700 30 30
Page 13A-52 Compendium of Methods for Toxic Organic Air Pollutants January 1999

PAHs Method TO-13A
TABLE 8. MINIMUM SAMPLING EQUIPMENT CALIBRATION AND ACCURACY REQUIREMENTS
Equipment Acceptance limits Frequency and method of measurement
Action if require-ments are not met
Sampler Indicated flow rate = true flow rate, ±10%.
Calibrate with certified transfer standard on receipt, after maintenance on sampler, and any time audits or flow checks deviate more than ±10% from the indicated flow rate or +10% from the design flow rate.
Recalibrate
Associated equipment
Sampler on/off timer ±30 min/24 hour Check at purchase and routinely on sample-recovery days
Adjust or replace
Elapsed-time meter ±30 min/24 hour Compare with a standard time-piece of known accuracy at receipt and at 6-month intervals
Adjust or replace
Flowrate transfer standard (orifice device)
Check at receipt for visual damage
Recalibrate annually against positive displacement standard volume meter
Adopt new calibration curve
January 1999 Compendium of Methods for Toxic Organic Air Pollutants Page 13A-53

Method TO-13A PAHs
Figure 1. Ring structure of common PAHs.
Page 13A-54 Compendium of Methods for Toxic Organic Air Pollutants January 1999

PAHs Method TO-13A
Figure 2. Typical high volume air sampler for PAHs.
January 1999 Compendium of Methods for Toxic Organic Air Pollutants Page 13A-55

Method TO-13A PAHs
102-mm
CARTRIDGE HOLDER
Figure 3. Typical absorbent cartridge assembly for sampling PAHs.
Page 13A-56 Compendium of Methods for Toxic Organic Air Pollutants January 1999

PAHs Method TO-13A
Figure 4. Apparatus used for sample clean-up and extraction.
January 1999 Compendium of Methods for Toxic Organic Air Pollutants Page 13A-57

Method TO-13A PAHs
Figure 5. Glass PUF cartridge (5a) and shipping container (5b) for use with Compendium Method TO-13A.
Page 13A-58 Compendium of Methods for Toxic Organic Air Pollutants January 1999

PAHs Method TO-13A
Figure 6. Example of a field portable high volume air sampler for sampling PAHs developed by EPA.
January 1999 Compendium of Methods for Toxic Organic Air Pollutants Page 13A-59

Method TO-13A PAHs
Figure 7. Positive displacement rootsmeter used to calibrate orifice transfer standard used in Compendium Method TO-13A.
Page 13A-60 Compendium of Methods for Toxic Organic Air Pollutants January 1999

PAHs Method TO-13A
Figu
re 8
. Exa
mpl
e of
a h
igh-
volu
me
orif
ice
calib
ratio
n da
ta s
heet
for
Com
pend
ium
Met
hod
TO
-13A
.
January 1999 Compendium of Methods for Toxic Organic Air Pollutants Page 13A-61
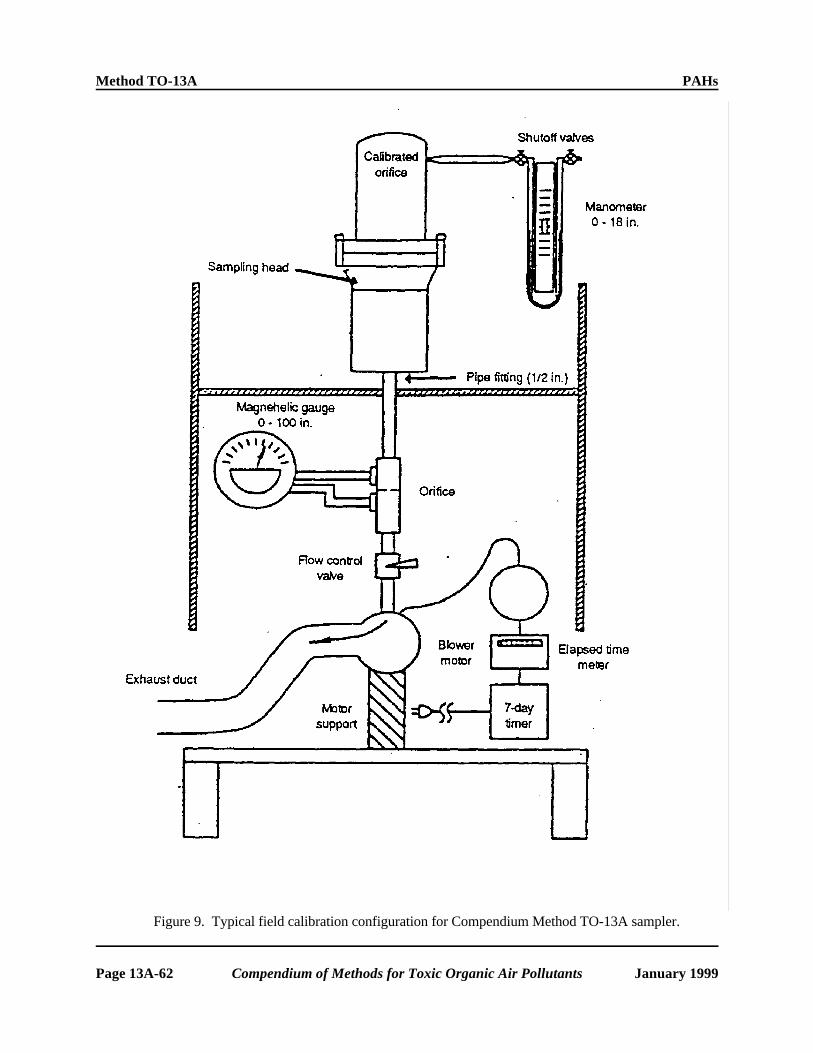
Method TO-13A PAHs
Figure 9. Typical field calibration configuration for Compendium Method TO-13A sampler.
Page 13A-62 Compendium of Methods for Toxic Organic Air Pollutants January 1999

PAHs Method TO-13A
FIELD CALIBRATION DATA SHEET FOR COMPENDIUM METHOD TO-13A PAH SAMPLER CALIBRATION
Sampler ID:
Sampler Location:
Calibration Orifice ID:
Job No.: High Volume Transfer Orifice Data:
Correlation Coefficient (CC1): Slope (M1): (CC2): (M2):
Intercept (B1): (B2):
Calibration Date: Time: Calibration Ambient Temperature: EF EC CALIBRATOR'S SIGNATURE Calibration Ambient Barometric Pressure: "Hg mm Hg Calibration set point (SP):
SAMPLER CALIBRATION
Actual values from calibration Calibrated values
Orifice manometer, inches (Y1)
Monitor magnehelic, inches (Y2)
Orifice manometer (Y3)
Monitor magnehelic (Y4)
Calculated value orifice flow, scm
(X1)
70
60
50
40
30
20
10
Definitions
Y1 = Calibration orifice reading, in. H O Y4 = Calculated value for magnehelic2
Y2 = Monitor magnehelic reading, in. H O = {Y2(Pa/760)[298/(Ta + 273)]}½ 2
Pa = Barometric pressure actual, mm Hg X1 = Calculated value orifice flow, scm
B1 = Manufacturer's Calibration orifice Intercept = (Y3 - B1)/M1
M1 = Manufacturer's Calibration orifice manometer Pstd = Barometric pressure standard, 760 mm Hg
slope Ta = Temperature actual, EC
Y3 = Calculated value for orifice manometer Tstd = Temperature standard, 25EC
= {Y1(Pa/760)[298/(Ta + 273)]}½
Figure 10. Typical orifice transfer field calibration data sheet for Compendium Method TO-13A.
January 1999 Compendium of Methods for Toxic Organic Air Pollutants Page 13A-63

Method TO-13A PAHs
X2 = (Y5-B2)/M2
Figure 11. Example of relationship between orifice transfer standard and flow rate through Compendium Method TO-13A sampler.
Page 13A-64 Compendium of Methods for Toxic Organic Air Pollutants January 1999

C CC CC
CC CC C E
C
CC
C
PAHs Method TO-13A
COMPENDIUM METHOD TO-13A FIELD TEST DATA SHEET GENERAL INFORMATION
C Sampler I.D. No.: C Operator: C Lab PUF Sample No.: C Other: C Sample location:
C PUF Cartridge Certification Date: Start Stop C Date/Time PUF Cartridge Installed: C Barometric pressure ("Hg) ________ _______ C Elapsed Timer: C Ambient Temperature (EF) ________ _______
Start C Rain Yes _____ Yes _____ Stop No _____ No _____ Diff. C Sampling time
C Sampling Start Stop
M1 B1 Diff. M2 B2
C Audit flow check within ±10 of set point _____ Yes _____ No
TIME TEMP BAROMETRIC
PRESSURE MAGNEHELIC
READING
CALCULATED FLOW RATE
3(std. m ) READ BY
Avg.
C Comments
Figure 12. Example of typical Compendium Method TO-13A field test data sheet (FTDS).
January 1999 Compendium of Methods for Toxic Organic Air Pollutants Page 13A-65

Diethyl Ether/Pentane Fraction
Method TO-13A PAHs
Diethyl Ether/Pentane Fraction
Figure 13. Sample clean-up, concentration, separation and analysis sequence for common PAHs. [Note: XAD-2 sequence is similar to PUF except methylene chloride is the solvent.]
Page 13A-66 Compendium of Methods for Toxic Organic Air Pollutants January 1999

PAHs Method TO-13A
Figure 14. Typical quality assurance specifications for GC/MS/DS operation.
January 1999 Compendium of Methods for Toxic Organic Air Pollutants Page 13A-67

Method TO-13A PAHs
Figure 15. Mass spectra of Compendium Method TO-13A compounds for (a) naphthalene and (b) acenaphthylene.
Page 13A-68 Compendium of Methods for Toxic Organic Air Pollutants January 1999

PAHs Method TO-13A
Figure 15 (Cont). Mass spectra of Compendium Method TO-13A compounds for (c) acenaphthene and (d) fluorene.
January 1999 Compendium of Methods for Toxic Organic Air Pollutants Page 13A-69

Method TO-13A PAHs
Figure 15 (Cont). Mass spectra of Compendium Method TO-13A compounds for (e) anthracene and (f) phenanthrene.
Page 13A-70 Compendium of Methods for Toxic Organic Air Pollutants January 1999
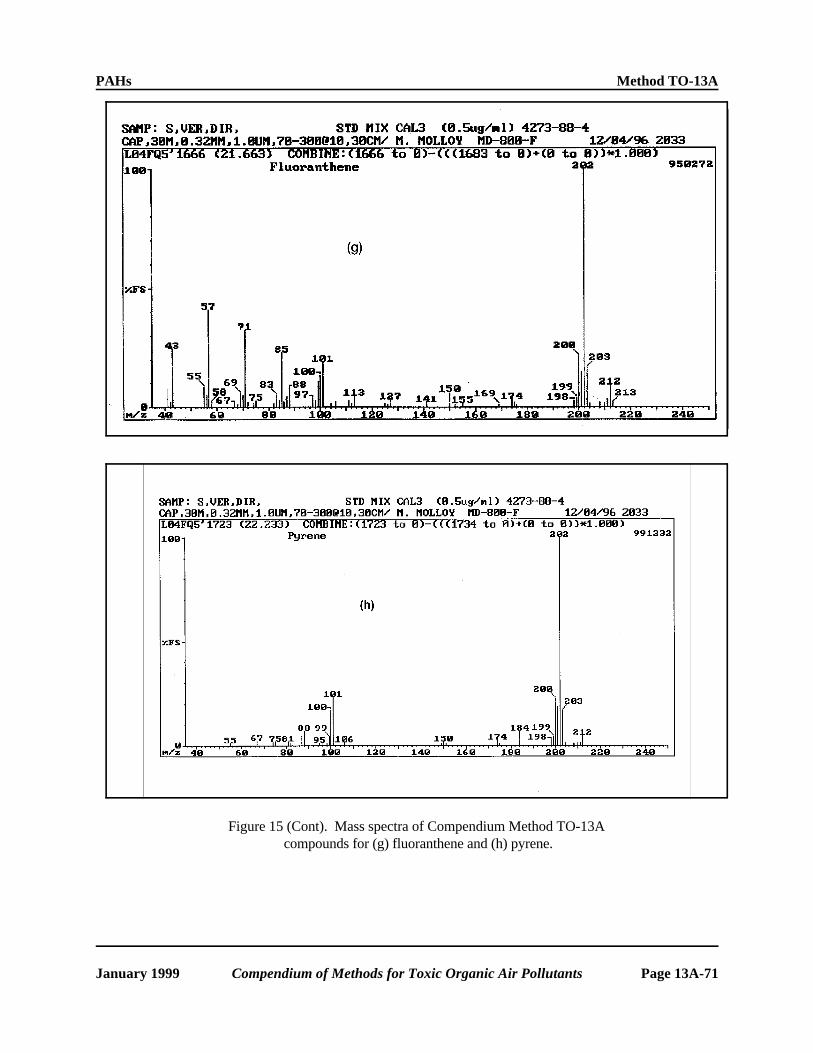
PAHs Method TO-13A
Figure 15 (Cont). Mass spectra of Compendium Method TO-13A compounds for (g) fluoranthene and (h) pyrene.
January 1999 Compendium of Methods for Toxic Organic Air Pollutants Page 13A-71

Method TO-13A PAHs
Figure 15 (Cont). Mass spectra of Compendium Method TO-13A compounds for (i) benz(a)anthracene and (j) chrysene.
Page 13A-72 Compendium of Methods for Toxic Organic Air Pollutants January 1999

PAHs Method TO-13A
Figure 15 (Cont). Mass spectra of Compendium Method TO-13A compounds for (k) benzo(b)fluoranthene and (l) benzo(k)fluoranthene.
January 1999 Compendium of Methods for Toxic Organic Air Pollutants Page 13A-73

Method TO-13A PAHs
Figure 15 (Cont). Mass spectra of Compendium Method TO-13A compounds for (m) benzo(a)pyrene and (n) benzo(e)pyrene.
Page 13A-74 Compendium of Methods for Toxic Organic Air Pollutants January 1999

PAHs Method TO-13A
Figure 15 (Cont). Mass spectra of Compendium Method TO-13A compounds for (o) benzo(g,h,i)perylene and (p) indeno(1,2,3-cd)pyrene.
January 1999 Compendium of Methods for Toxic Organic Air Pollutants Page 13A-75

Method TO-13A PAHs
Figure 15 (Cont). Mass spectra of Compendium Method TO-13A compounds for (q) dibenz(a,h)anthracene.
Page 13A-76 Compendium of Methods for Toxic Organic Air Pollutants January 1999

PAHs Method TO-13A
Figure 16. Total ion chromatogram (TIC) of Compendium Method TO-13A target PAHs.
January 1999 Compendium of Methods for Toxic Organic Air Pollutants Page 13A-77

Method TO-13A PAHs
This page intentionally left blank
Page 13A-78 Compendium of Methods for Toxic Organic Air Pollutants January 1999

Other Test Method 45 (OTM-45) Measurement of Selected Per- and Polyfluorinated Alkyl
Substances from Stationary Sources
Background on OTM-45
The posting of a test method on the Other Test Methods portion of the EMC website is neither an
endorsement by EPA regarding the validity of the test method nor a regulatory approval of the
test method. The purpose of the Other Test Methods portion of the EMC website is to promote
discussion of developing emission measurement methodologies and to provide regulatory
agencies, the regulated community, and the public at large with potentially helpful tools. Other
Test Methods are test methods which have not yet been subject to the Federal rulemaking
process. Each of these methods, as well as the available technical documentation supporting
them, have been reviewed by the EMC staff and have been found to be potentially useful to the
emission measurement community. The types of technical information reviewed include field
and laboratory validation studies; results of collaborative testing; articles from peer-reviewed
journals; peer review comments; and quality assurance (QA) and quality control (QC)
procedures in the method itself. The EPA strongly encourages the submission of additional
supporting field and laboratory data as well as comments regarding these methods.
These methods may be considered for use in federally enforceable State and local programs [e.g.,
Title V permits, State Implementation Plans (SIP)] provided they are subject to an EPA Regional
SIP approval process or permit veto opportunity and public notice with the opportunity for
comment. The methods may also be candidates to be alternative methods to meet Federal
requirements under 40 CFR Parts 60, 61, and 63. However, they must be approved as
alternatives under Parts 60.8, 61.13, or 63.7(f) before a source may use them for this purpose.
Consideration of a method's applicability for a particular purpose should be based on the stated
applicability as well as the supporting technical information. The methods are available for
application without EPA oversight for other non-EPA program uses including state permitting
programs and scientific and engineering applications. As many of these methods are submitted
by parties outside the Agency, the EPA staff may not necessarily be the technical experts on
these methods. Therefore, technical support from EPA for these methods is limited, but the table
at the end of this introduction contains contact information for the authors and developers so that
you may contact them directly. Also, be aware that these methods are subject to change based on
the review of additional validation studies or on public comment as a part of adoption as a
Federal test method, the Title V permitting process, or inclusion in a SIP.
Validated measurement methods are limited and under development for reliably identifying and
quantifying if per- and polyfluoroalkyl substances (PFAS) are released into the air from
stationary sources. The current lack of standardized methods to measure PFAS emissions and the
limited availability of data on the performance of methods to measure PFAS introduce
uncertainty in the understanding of the release of PFAS into the air from these sources. The lack
of validated stationary source measurement methods for PFAS also leads to inconsistent
findings, incomparable measurements, and lack of coordination between policy makers, facilities
and control technology development. This OTM recommends a consistent method for use by the
facilities, stationary source test teams, research laboratories, and other stakeholders to measure a
common list of PFAS compounds emitted from vents and stacks. This OTM includes
Revision 0 (1/13/2021)

performance based PFAS measurement tools and performance criteria developed through field
application of this method.
The analytical method imbedded in OTM 45 may support a variety of monitoring applications,
which include the analysis of multiple short-chain PFAS that cannot be measured by EPA
Method 537.1. This posting meets an agency commitment identified within the 2020 National
Defense Authorization Act guidance for PFAS disposal and destruction. Posting this method, in
and of itself, does not establish a requirement, although the use of this method may be specified
by the EPA or a state through independent actions. Terms such as “must” or “required,” as used
in this document, refer to procedures that are to be followed to conform with the method.
References to specific brands and catalog numbers are included only as examples and do not
imply endorsement of the products. Such reference does not preclude the use of equivalent
products from other vendors or suppliers.
OTM 45 is a draft method under evaluation that will be updated as more data from stakeholders
becomes available. Due to the urgent need for consistency, this method is being released as an
“Other Test Method (OTM)” by EPA’s Emission Measurements Center to promote consistency
with what we believe is the current best practices to sample and analyze the PFAS targets from
stationary sources. We solicit any and all feedback, comments, and additional data coming from
the application of this method as we work to adjust this method in anticipation of developing a
reference method for PFAS from air emission sources. PFAS compounds encompass a wide
variety of moiety's that can lead to different physical and chemical properties. As such this
method may not be suitable for certain PFAS compounds with unique properties, requiring
evaluation of this method for PFAS compounds that might be added later.
Note: Please submit a copy, either electronic or paper, of any test report from application
of this OTM to EPA’s Measurement Technology Group.
• Electronic copies should be submitted via email with the subject line “OTM-045” to: [email protected]
• Paper copies should be mailed to:
Measurement Technology Group
Office of Air Quality Planning and Standards
U.S. Environmental Protection Agency (Mail Code E143-02)
Research Triangle Park, NC 27711
OTM-45 Authors and Developers
Ray Merrill* OAQPS/AQAD/MTG [email protected]
Jeff Ryan* ORD/CEMM/AMCD/CSB [email protected]
Ken Krebs ORD/CEMM/AMCD/CSB [email protected]
Stephen Jackson ORD/CEMM/AMCD/CSB [email protected]
Lindsay Wickersham ORD/CEMM/AMCD/CSB [email protected]
Bob Wright ORD/CEMM/IOD [email protected]
* Primary contacts
Revision 0 (1/13/2021)

Other Test Method 45 - (OTM-45) Measurement of Selected Per- and Polyfluorinated
Alkyl Substances from Stationary Sources)
1.0 Scope and Application
1.1 Applicability. OTM-45 is a performance-based method applicable to the collection and
quantitative analysis of specific semivolatile (Boiling point > 100C) and particulate-bound per-
and polyfluorinated alkyl substances (PFAS) in air emissions from stationary sources. This
method can also be used for the collection and recovery of ionic and covalent PFAS for non-
targeted analysis (NTA) of PFAS compounds. Table 45-1 of this method lists the individual
target analytes that have been evaluated for measurement by OTM-45.
1.2 Scope. This method describes the sampling and sample recovery procedures used to measure
individual semivolatile PFAS from stationary source air emissions. OTM-45 incorporates by
reference some of the specifications (e.g., equipment and supplies) and procedures (e.g.,
sampling and sample preparation) from other methods that are essential to conducting OTM-45.
To obtain reliable samples, source sampling teams should be trained and experienced with the
following additional EPA test methods: Method 1; Method 2; Method 3; Method 4; and Method
5 of Appendices A-1, A-2, and A-3 to 40 Code of Federal Regulations (CFR) Part 60.
Laboratory analysis teams should be trained and experienced in the use of liquid chromatography
coupled with tandem mass spectrometry (LC-MS/MS) multiple reaction monitoring (MRM) as
described in EPA Method 533 and Method 537.1
1.3 Branched and Linear PFAS Isomers
Both branched and linear PFAS isomers may be found in the environment. This method includes
procedures for summing the contribution of multiple isomers to the final reported concentration.
Revision 0 (1/13/2021)

In those cases where standard materials containing multiple isomers are commercially available,
laboratories should obtain such standards for the method analytes.
1.4 Performance Based. This method provides some flexibility for analysis of PFAS by including
the addition of isotopically labeled standards in various parts of the sampling system to assess
and evaluate method performance against criteria for successful sampling and analysis
procedures. The laboratory may select LC columns, LC conditions, and MS conditions different
from those used to develop the method. At a minimum, the pre-sampling isotope spike standards
and the pre-analysis isotope spike standards specified in the method must be used. Users may
modify the method to overcome interferences or to substitute superior materials and equipment,
provided they use LC-MS/MS as the basis for separation and quantitation of method target
compounds and meet all performance criteria in this method. Section 9 of this method presents
requirements for method performance.
2.0 Summary of Method
This method identifies and determines the concentration in mass per unit gas volume sampled of
specific PFAS compounds in source emissions. Gaseous and particulate bound target pollutants
are withdrawn from the gas stream isokinetically and collected in the sample probe, on a glass
fiber or quartz filter, on a packed column of adsorbent material and in a series of impingers. The
target compounds are extracted from the individual sample collection media. The OTM-45 train
results in four (4) discreet sample extract fractions for analysis. The extracts are analyzed by LC-
MS/MS in the MRM detection mode. Quantification of each analyte is calculated using the
isotope dilution technique. For QC purposes, the percent recoveries of the pre-extraction
standards are calculated using the integrated peak areas of pre-analysis standard(s), which are
Revision 0 (1/13/2021)

added to the final extract and function as traditional internal standards, exclusively applied to the
pre-extraction standards. The use of pre-sampling standards added to XAD-2 collection media
prior to sampling and analyzed in the same manner as targeted PFAS compounds serves as an
indication of the method’s quantitative capture efficiency. This method is not intended to
differentiate between target compounds in particle or vapor fractions. This method uses
isotopically labeled standards to improve method accuracy and precision.
3.0 Definitions
3.1 Alternate Recovery Standards. A group of isotopically labeled compounds that are not
otherwise designated in this method for quality control purposes. Use alternative recovery
standards to assess the recovery of a compound class relative to a step in the sampling and
analysis procedure that is not already assessed as a mandatory part of this method.
3.2 Analysis Batch. A set of samples that are analyzed on the same instrument during a 24-hour
period that begins and ends with the analysis of the appropriate Continuing Calibration Check
(CCC) standards. Additional CCCs may be required depending on the length of the Analysis
Batch and the number of field samples.
3.3 Batch Blank Sample. A laboratory blank sample composed of a precleaned filter and XAD-2
media processed and analyzed using the same procedures as a field sample.
3.4 Calibration Standard. A solution of the method analytes, pre-extraction standards, and pre-
analysis standard(s) prepared from the Primary Dilution Standards and stock standards. The
calibration standards are used to calibrate the instrument response with respect to analyte
concentration.
Revision 0 (1/13/2021)

3.5 Continuing Calibration Check Standard (CCC). A calibration standard that is analyzed
periodically to verify the accuracy of the existing calibration. The mid-point calibration standard
is typically used to verify calibration.
3.6 Congener. An individual compound with a common structure, only differing by the number
of fluorine atoms attached to the structure.
3.7 Extraction Batch. A set of field samples (not including QC samples) extracted together using
the same lot of extraction devices, solvents, and fortifying solutions.
3.8 Field Sample Media Blank (FSMB). Also called the field trip blank. The FSMB is intended
to include and represent the sampling media (i.e., filter, XAD-2 adsorbent) and reagents (i.e.,
impinger contents, rinsing solvents) associated with the field sample collection and recovery, but
is not actually used in the field. The FSMB is treated as a sample in all respects, including
shipment to the sampling site, exposure to sampling site conditions, storage, and all analytical
procedures. The purpose of the FSMB is to determine if method analytes or other interferences
are introduced into the sample from shipping, storage, and the field environment and procedures.
3.9 Homolog. A compound belonging to a series of compounds with the same general molecular
formula, differing from each other by the number of repeating units.
3.10 Pre-extraction Standards. Pre-extraction standards are isotopically labeled analogues of the
method analytes that are added to the sample prior to extraction in a known amount.
Note: Not all target PFAS currently have an isotopically labeled analogue. In these cases, an
alternate isotopically labelled analogue (isotopologue) is used as recommended in Table 45- 1.
Revision 0 (1/13/2021)

3.11 Branched and linear isomers. Individual compounds with a common molecular formula,
differing by the position of carbon and fluorine atoms attached to the structure.
3.12 Isotope Dilution Technique. An analytical technique for measuring analyte concentration
using the ratio of the peak area of the native analyte to that of an isotopically labeled analogue,
added to the original sample in a known amount and carried through the entire analytical
procedure.
3.13 Isotopologue. An individual compound with an identical chemical formula and structure,
differing only in isotopic composition.
3.14 Laboratory Fortified Media Blanks (LFMB). Also commonly referred to as Laboratory
Control Samples. The LFMB includes and represents all the sampling media (i.e., filter, XAD-2
adsorbent) and reagents (i.e., impinger contents, rinsing solvents) associated with the field
sample collection and recovery to which known quantities of the method analytes and isotope
dilution analogues are added. The results of the LFMB verify method performance in the
absence of sample matrix.
3.15 Laboratory Sample Media Blank (LSMB). The LSMB is intended to include and represent
the sampling media (i.e., filter, XAD-2 adsorbent) and reagents (i.e., impinger contents, rinsing
solvents) associated with the field sample collection and recovery, but is not actually shipped to
the field and remains in the laboratory. The results of the LSMB verify that the sampling media
and reagents are not introducing target analyte or interfering species.
Revision 0 (1/13/2021)

3.16 Method Detection Limit (MDL). The minimum qualitatively recognizable signal in
laboratory analyses above background for a target compound with 99 percent confidence.
Procedures for determining MDL are provided in Section 9.2.1.3.
Note: MDL is typically determined following 40 CFR Part 136 appendix B and includes samples
prepared from blank media, spiked within 5 times of the expected MDL and processed in a
manner identical to field sample preparation.
3.17 Perfluorinated alkyl substances. Aliphatic substances where all of the hydrogen atoms
attached to carbon atoms have been replaced by F atoms, except those H atoms whose
substitution would modify the nature of any functional groups present.
3.18 Polyfluorinated alkyl substances. Aliphatic substances where all hydrogen atoms attached to
at least one (but not all) carbon atoms have been replaced by F atoms.
3.19 Precursor Ion. The gas-phase species corresponding to the method analyte that is produced
in the electrospray ionization interface of the LC-MS/MS. During tandem mass spectrometry, or
MS/MS, the precursor ion is mass selected and fragmented by collision-activated dissociation to
produce distinctive product ions of smaller mass to charge (m/z) ratio. For this method, the
precursor ion is usually the deprotonated molecule ([M – H]–) of the method analyte, except for
HFPO-DA. For this analyte, the precursor ion is formed by decarboxylation of HFPO-DA.
3.20 Pre-analysis Standard(s). Pre-analysis standard(s) are quality control compounds that are
added to all standard solutions and to extracts immediately prior to analysis in a known amount
and used to measure the relative response of the isotopically labelled analogues that are
Revision 0 (1/13/2021)

components of the same solution. For this method, the pre-analysis standard(s) are two
isotopically labeled analogues of the method analytes. The pre-analysis standard(s) are indicators
of instrument performance and are used to calculate the recovery of the pre-extraction standards
through the extraction procedure. In this method, the pre-analysis standard(s) are not used in the
calculation of the recovery of the native analytes. Pre-analysis standard(s) are added to every
sample (including blank, quality control sample, and calibration solutions) at a known amount.
Note: Pre-analysis standard(s) is identical to Isotope Performance Standards in Method 533.
3.23 Pre-extraction Standard(s). A group of isotopically labeled analogues of the method
analytes that are added in a known amount to all standard solutions, to each field sample
fraction: (i.e., the primary and secondary XAD-2 adsorbent traps, filter, and impinger samples)
and to laboratory blanks immediately before extraction. Used to correct the quantity of the native
target compounds present in the sample for extraction, cleanup, and concentration recovery.
Note: Not all target PFAS currently have an isotopically labelled analogue. In these cases, an
alternative isotopically labelled analogue is recommended in Table 45-1.
3.24 Pre-sampling Standard(s). A group of isotopically labeled compounds added in a known
amount to the XAD-2 adsorbent prior to sampling used to indicate the sample collection and
recovery efficiency of the method.
3.25 Pre-transport Standard(s). A group of isotopically labeled compounds added by the
laboratory into the sample containers used in the field to contain and transport probe rinse and
impinger samples. The measured concentration of the pre-transport recovery standard provides a
Revision 0 (1/13/2021)

quality check on potential probe rinse sample spillage or mishandling after sample collection and
during shipping.
3.26 Product Ions. One or more fragment ions that are produced in MS/MS by collision
activated dissociation of the precursor ion.
3.27 Quality Control Standard (QCS). A calibration standard prepared independently from the
primary calibration solutions. For this method, the QCS is a repeat of the entire dilution scheme
starting with the same stock materials (neat compounds or purchased stock solutions) used to
prepare the primary calibration solutions. Independent sources and separate lots of the starting
materials are not required, provided the laboratory has obtained the purest form of the starting
materials commercially available. The purpose of the QCS is to verify the integrity of the
primary calibration standards.
3.28 Quantitative Reporting Limit (QRL): The minimum quantitative level that can reported.
The QRL is based on the lowest concentration or level target PFAS compound used during
calibration. Being sample specific, the QRL is affected by sample size, dilution, aliquots, etc.
3.29 Relative Response Factor (RRF). The response of the mass spectrometer to a known amount
of an analyte relative to a known amount of an isotopically labeled standard.
3.30 Sampling Train Field Blank (STFB). The complete field assembly and recovery of an
OTM-45 sampling train without actual sampling, including bringing the train to sampling
location, heating and leak checks. The STFB is conducted using glassware that has been
previously used for emissions sampling as part of the current field test. The purpose of the
Revision 0 (1/13/2021)

STFB is to determine if method analytes or other interferences are introduced into the sample
from previous sample runs using previously sampled sample train glassware.
3.31 Sampling Train Proof Blank (STPB). The complete field assembly and recovery of a clean
OTM-45 sampling train without actual sampling, including bringing the train to sampling
location, heating and leak checks. The STFB is conducted using clean glassware that has not
been previously used for emissions sampling as part of the current field test. The purpose of the
STPB is to determine if method analytes or other interferences are introduced into the sample
from the clean, unused sample train glassware, train assembly, preparation and recovery,
including the field environment.
3.32 Semivolatile and Condensable PFAS. Poly and perfluoro organic compounds with boiling
points above 100C.
3.33 Stack Detection Limit (SDL). The minimum qualitatively recognizable gaseous stack
concentration above background for a target compound. The SDL is a mathematically derived
from the method detection limit (MDL) for each sample fraction, the total gaseous stack sample
volume collected, and the sample preparation steps in this method. Each sample fraction in this
method has a distinct MDL based on the sample preparation, concentration, and aliquot splitting
performed during the sample analysis procedures. Being sample specific, the SDL is affected by
stack sample volume, sample extract volume, sample concentration, sample splits, and dilution,
etc. The SDL is based on the sum of sample fractions 1-3 MDLs and the run-specific gaseous
sample volume.
4.0 Interferences
Revision 0 (1/13/2021)

4.1 Organic Compounds. Very high amounts of other organic compounds in the matrix may
interfere with the analysis. This method provides examples of extraction and cleanup procedures
to reduce, but not necessarily eliminate, matrix effects due to high concentrations of organic
compounds.
4.2 Target compound contaminants or related organics in solvents, reagents, glassware,
isotopically labeled spiking standards, and other sample processing hardware are potential
method interferences. Routinely evaluate all these materials to demonstrate that they are either
free from interferences under the conditions of the analysis, or that the interference does not
compromise the quality of the analysis results. Evaluate chemical interference through the
preparation and analysis of batch blank samples. Use high purity reagents, solvents, and
standards to minimize interference problems in sample analysis.
Note: In this method, 13C3-PFBA is used as a pre-analysis standard(s) and 13C4-PFBA is used as
an isotope dilution analogue. Both share the same product ion, m/z 172. Because the natural
abundance of 13C is 1.1%, there is a 1.1% contribution to the 13C4-PFBA area from the lone,
unlabeled 12C atom in 13C3-PFBA. Users of this method may consider this bias to the area of the
PFBA isotope dilution analogue insignificant.
4.3 PTFE products including PTFE cap liners can be a source of PFAS contamination. The use
of PTFE in this method must be avoided or the product must be tested and shown to be
contaminant free before use. Polypropylene (PP) or polyethylene (PE, HDPE) products may be
used in place of PTFE products to minimize PFAS contamination.
Revision 0 (1/13/2021)

4.4 Labeled standards may include trace quantities of native PFAS and should be screened or
certified pure before use.
4.5 Following extraction, aqueous samples should not come in contact with any glass containers
or pipettes as PFAS analytes can potentially adsorb to glass surfaces. The eluate must be
collected in a polypropylene tube prior to concentration to dryness. Concentration to dryness in
glass tubes may cause poor recovery. Standards dissolved in organic solvent may be purchased
in glass ampoules. These standards in organic solvent are acceptable and subsequent transfers
may be performed using glass syringes and pipets.
4.6 Isotopic purity of 13C3-PFBA. In this method, 13C3-PFBA is used as a pre-analysis
standard(s) and 13C4-PFBA is used as an isotope dilution analogue. Both share the same product
ion, m/z 172. Ten nanograms per liter of 13C4-PFBA is added to the sample prior to extraction
(10 ng/mL extract concentration assuming 100% recovery), and 10 ng/mL of 13C3-PFBA is
added to the final extract. Because the natural abundance of 13C is 1.1%, there is a 1.1%
contribution to the 13C4-PFBA area from the lone, unlabeled 12C atom in 13C3-PFBA. The
authors confirmed this contribution empirically. Users of this method may consider this bias to
the area of the PFBA isotope dilution analogue insignificant.
4.7 Isotopic purity of 13C4-PFBA. A trace amount of 13C3-PFBA was detected in the 13C4-
PFBA. The contribution was no greater than 1%. The contribution of the pre-analysis standard(s)
to the isotope dilution analogue is insignificant.
4.8 Telomer Sulfonates. Each of the three telomer sulfonates in the analyte list (4:2FTS, 6:2FTS,
and 8:2FTS) are referenced to their 13C2 isotope dilution analogue. The mass difference
Revision 0 (1/13/2021)

between the telomer sulfonates and the pre-extraction standards is 2 mass units. The single sulfur
atom in each of the unlabeled molecules has a naturally occurring M+2 isotope (34S) at 4.25%.
Thus, the precursor ions of the 13C2 isotopically labeled analogues and the naturally occuring 34S
analogues present in the native analytes have the same nominal masses. The product ions of the
telomer sulfonate pre-extraction standards listed in Table 45-2 would contain a small
contribution from the 34S analogue of the native telomer sulfonates. At the concentrations used in
this study, the contribution of the 34S analogue to the isotope dilution analogue was not greater
than 2.7%. Alternate product ions may be used if there is sufficient abundance.
5.0 Safety
Note: Develop a strict safety program for the handling of PFAS samples to avoid contact with
sampling media and sample recovery solutions.
5.1 Selected PFAS compounds, namely PFOS and PFOA have known aneugenic, endocrine, and
teratogenic effects in laboratory animal studies. Be aware of the potential for inhalation, skin
absorption and ingestion exposure to field personnel and laboratory analysts.
5.2 Commercial Standards. This method recommends that the laboratory purchase dilute
standard solutions of the analytes required for this method. However, if preparing primary
solutions, use a hood or glove box. Personnel handling primary solutions should wear personal
protective equipment including nitrile gloves.
5.4 Toxicity. The toxicity or carcinogenicity of other reagents or chemicals used in this method
is not precisely defined. However, treat each chemical as a potential health hazard and minimize
exposure to these chemicals. The field and laboratory staff are responsible for maintaining a
Revision 0 (1/13/2021)

current awareness file of Occupational Safety and Health Administration (OSHA) regulations
regarding the safe handling of the chemicals specified in this method. Ensure that a reference file
or list of internet sites that contain safety data sheets (SDS) is available to all personnel involved
in the sampling and chemical analysis of samples known or suspected to contain PFAS.
6.0 Equipment and Supplies
Note: Brand names, suppliers, and part numbers are for illustration purposes only and no
endorsement is implied. Apparatus and materials other than those specified in this method may
achieve equivalent performance. Meeting the performance requirements of this method is the
responsibility of the source testing team and laboratory team.
6.1 Sampling Train. Figure OTM 45-1 of this method shows a schematic of the OTM 45
sampling train. This sampling train configuration is adapted from EPA Method 5 procedures,
and, as such, the majority of the required equipment is identical to that used in EPA Method 5
determinations. The OTM 45 sampling train is very similar, but not identical to the SW-846
Method 0010 sampling train. The specific OTM 45 adaptations are: the use of condenser and
XAD-2 adsorbent module, which are used for the primary capture of PFAS compounds that pass
through the glass or quartz-fiber filter in the gas phase; a series of impingers for additional
capture of PFAS compounds that pass through the primary XAD-2 adsorbent module; and a
secondary XAD-2 adsorbent module which is to determine the breakthrough of PFAS
compounds not captured by the primary XAD-2 adsorbent module and impingers. The train is
identical to that described in section 6.1.1 of Method 5 of appendix A-3 to 40 CFR part 60 with
the following additions:
Revision 0 (1/13/2021)

6.1.1 Nozzle. The nozzle must be made of quartz or borosilicate glass or titanium. Stainless steel
nozzles should not be used.
6.1.2 Probe Liner. Use either borosilicate, or quartz glass probe liners with a heating system
capable of maintaining a probe gas temperature of 120 ± 14 °C (248 ± 25 °F) during sampling.
Use a PTFE ferrule or single-use PTFE coated O-ring to achieve the seal at the nozzle end of the
probe for stack temperatures up to about 300 °C (572 °F). Use a quartz glass liner and integrated
quartz nozzle for stack temperatures between 300 and 1,200 °C (572 and 2,192 °F).
6.1.3 Filter Holder. Use a filter holder of borosilicate glass with a PTFE frit or PTFE-coated wire
filter support. The holder design should provide a positive seal against leakage from the outside
or around the filter. The holder should be durable, easy to load, leak-free in normal applications,
and positioned immediately following the probe and cyclone bypass (or cyclone, if used) with
the active side of the filter perpendicular to the source of the flow. The filter support must be
evaluated for PFAS contamination.
6.1.4 Filter Heating System. Use any heating system capable of monitoring and maintaining the
temperature around the filter to ensure that the sample gas temperature exiting the filter is 120 ±
14 °C (248 ± 25 °F) during sampling or such other temperature as specified by an applicable
subpart of the standards or approved by the Administrator for a particular application.
6.1.5 Filter Temperature Sensor. Install a temperature sensor capable of measuring temperature
to within ± 3 °C (5.4 °F) so that the sensing tip protrudes at least 1.3 centimeters (cm) (1⁄2 in.)
into the sample gas exiting the filter. Encase the sensing tip of the sensor in glass or PTFE if
needed.
Revision 0 (1/13/2021)

6.1.6 Sample Transfer Line. The sample transfer line transports gaseous emissions from the
heated filter holder to the condenser and must be heat traced and constructed of glass or PTFE
with connecting fittings that form leak-free, vacuum-tight connections without using sealing
greases or tapes. PFA tubing may also be used for the sample transfer line. Keep the sample
transfer lines as short as possible and maintain the lines at a temperature of 120 °C ± 14 °C (248
°F ± 25 °F) using active heating when necessary. Orient the sample transfer lines with the
downstream end lower than the upstream end so that any condensate will flow away from the
filter and into the condenser.
Note: The use of a sample transfer line should be avoided if possible. If a sample transfer line is
used, it must be evaluated for PFAS contamination.
6.1.7 Condenser. Glass, water-jacketed, coil-type with compatible fittings. Orient the condenser
to cause moisture to flow down to the adsorbent module to facilitate condensate drainage. Figure
OTM 45-2 of this method shows a schematic diagram of the condenser.
6.1.8 Water Circulating Bath. Use a bath pump circulating system capable of providing chilled
water flow to the condenser and adsorbent module water jackets. Typically, a submersible pump
is placed in the impinger ice water bath to circulate the ice water contained in the bath. Verify
the function of this system by measuring the gas temperature at the entrance to the adsorbent
module. Maintain this temperature at < 20 °C (68 °F).
6.1.9 Primary and Secondary Adsorbent Module. Use a water-jacketed glass container to hold up
to 40 grams (g) of the solid adsorbent. Figure OTM 45-2 of this method shows a schematic
diagram of the adsorbent module. Other physical configurations of the adsorbent resin
Revision 0 (1/13/2021)

module/condenser assembly are acceptable if the configuration contains the requisite amount of
solid adsorbent and maintains the minimum length-to-width adsorbent bed ratio of two-to-one.
Orient the adsorbent module vertically to facilitate condensate drainage. The connecting fittings
must form leak-free, vacuum-tight seals. Include a coarse glass frit in the adsorbent module to
retain the adsorbent.
6.1.10 Impingers. Use four or five impingers connected in series with leak-free ground glass
fittings or any similar leak-free noncontaminating fittings. The first impinger is an optional water
knockout impinger and must be a short-stem (water-dropout) design or equivalent. The second,
fourth, and fifth impingers must be of the Greenburg-Smith design, modified by replacing the tip
with a 1.3 cm (1 ⁄2 in.) inside diameter (ID) glass tube extending to approximately 1.3 cm (1 ⁄2
in.) from the bottom of the flask. The third impinger must be of the Greenburg-Smith design with
the standard tip. The second, third, and fourth impingers must contain known quantities of water,
the fifth impinger is used to contain a known weight of silica gel or equivalent desiccant.
6.2 Sample Recovery Equipment.
6.2.1 Fitting Caps. Use leak-free ground glass fittings or any similar leak-free non-contaminating
fitting to cap the sections of the sampling train exposed to the sample gas.
6.2.2 Wash Bottles. Use high density polyethylene (HDPE) bottles.
6.2.3 Probe-Liner, Probe-Nozzle, and Filter-Holder Brushes. Use inert bristle brushes with
precleaned stainless steel handles. Extensions of the probe brush must be made of stainless steel
and be at least as long as the probe. Use brushes that are properly sized and shaped to remove
accumulated material from the nozzle and probe liner if used.
Revision 0 (1/13/2021)

6.2.4 Filter Storage Container. Use a sealed filter holder, wide-mouth amber glass jar with
HDPE-lined cap, or glass petri dish sealed with HDPE tape or encased in a resealable
polyethylene bag. Purchase precleaned amber glass jars and petri dishes or clean according to the
glassware cleaning procedures listed in Section 8.1.1.1 of this method.
6.2.5 Field Balance. Use a weighing device capable of measurements to an accuracy of 0.5g.
6.2.6 Aluminum Foil. Use heavy duty aluminum foil cleaned by rinsing three times with 5%
ammonium hydroxide in methanol and stored in a pre-cleaned glass petri dish or glass jar. Do
not use aluminum foil to wrap or contact filter samples due to the possibility of reaction between
the sample and the aluminum.
6.2.7 Silica Gel Storage Containers. Use an air-tight container to store silica gel.
6.2.8 Sample Storage Containers. Recover samples in high density polyethylene (HDPE) bottles,
125, 250, 500- or 1000-milliliters (mL) with leak-free polyethylene-lined caps. Either purchase
precleaned bottles or clean containers according to glassware cleaning procedures listed in
Section 8.1.1.1 of this method.
6.3 Sample Extraction Equipment.
6.3.1 Sample Containers. Use 125- and 250-mL HDPE bottles with polypropylene or
polyethylene-lined caps.
6.3.2 Test Tubes. Use polypropylene test tubes or small (e.g., 5 to 15 mL) polypropylene vials
with polypropylene screw caps.
Revision 0 (1/13/2021)

6.3.3 Nitrogen Evaporative Concentrator. Use a nitrogen evaporative concentrator equipped with
a water bath with the temperature controlled in the range of 30 to 60 °C (86 to 140 °F) (N-Evap
Organomation Associates, Inc., South Berlin, MA, or equivalent).
6.3.4 Shaker table. Use a shaker table (Eberbach Shaker Model E6013, Eberbach Corporation,
Belleville, MI, or equivalent) capable of holding samples securely and operating uninterrupted
for at least 18 hours.
6.3.5 Filter paper (0.45 µm pore size). Filter extract from “front half” probe filter before
concentration step.
6.3.6 Digestion block (“hot block”). Use a digestion block capable of reaching 55-60 °C and
securely holding digestion vessels. Used for concentration of extracts.
6.3.7 Digestion Vessels. Use polypropylene digestion vessels capable of holding 70 mL.
6.3.8 Watch Glass. Use ribbed polypropylene watch glass capable of covering digestion vessels.
6.4.1 Pasteur Pipettes. Use disposable pipettes, or glass serological pipettes typically 150 mm
long x 6 mm ID.
6.5 Solid Phase Extraction (SPE)
6.5.1 SPE Cartridge. (Waters OASIS WAX 500mg/6 cc, Waters Corporation, Milford, MA or
equivalent) SPE cartridges containing weak anion exchange, mixed-mode polymeric sorbent
(polymeric backbone and a diamino ligand), particle size approximately 33 μm. The SPE sorbent
Revision 0 (1/13/2021)
must have a pKa above 8 so that it remains positively charged during extraction. SPE cartridges
containing 500 mg sorbent.
6.5.1.1 SPE Cartridge Interferences. Solid phase extraction cartridges may be a source of
interferences. The analysis of LSMBs provides important information regarding the presence or
absence of such interferences. Each brand and lot of SPE devices must be tested as part of the
LSMB to ensure that contamination does not preclude analyte identification and quantitation.
SPE cartridges should be sealed while in storage to prevent ambient contamination of the SPE
sorbent.
6.5.2 Vacuum Extraction Manifold. Equipped with flow and vacuum control [Supelco Cat. No.
57030-U, UCT Cat. No. VMF016GL (the latter requires UCT Cat. No. VMF02116 control
valves), or equivalent systems]. Automated devices designed for use with SPE cartridges may be
used; however, all extraction and elution steps must be the same as in the manual procedure.
Care must be taken with automated SPE systems to ensure that Teflon tubing and other PTFE
components commonly used in these systems, do not contribute to unacceptable analyte
concentrations in LSMBs.
6.5.3 Sample Delivery System. Use of large volume sampling lines, constructed with
polyethylene tubing, are recommended, but not mandatory. Large volume sample transfer lines,
constructed with PTFE tubing, are commercially available for standard extraction manifolds
(Supelco Cat. No. 57275 or equivalent). The PTFE tubing can be replaced with 1/8” o.d. x 1/16”
i.d. polyethylene tubing [Freelin-Wade (McMinnville, Oregon) LLDPE or equivalent] cut to an
appropriate length. This prevents potential contamination from PTFE transfer lines. Other types
of non-PTFE tubing may be used provided it meets the LSMB and LFMB QC requirements.
Revision 0 (1/13/2021)

PTFE tubing may be used, but an LSMB must be run on each individual transfer line and the QC
requirements in Section 9.2.2.1 must be met. In the case of automated SPE, the removal of PTFE
lines may not be feasible; therefore, acceptable performance for the LSMB must be met for each
port during the IDC (Section 9.2.1). LSMBs must be rotated among the ports during routine
analyses thereafter. Plastic reservoirs are difficult to rinse during elution and their use may lead
to lower recovery.
6.6 LC-MS/MS System
6.6.1 LC System. The LC system must provide consistent sample injection volumes and be
capable of performing binary linear gradients at a constant flow rate.
Note: On some LC systems, PFAS may build up in PTFE transfer lines when the system is idle
for more than one day. To prevent long delays in purging high levels of PFAS from the LC
solvent lines, it may be useful to replace PTFE tubing with polyetheretherketone (PEEK) tubing
and the PTFE solvent frits with stainless steel frits. These modifications were not used on the LC
system used for method development. However, a delay column, HLB Direct Connect 2.1 x 30
mm (Waters 186005231), was placed in the mobile phase flow path immediately before the
injection valve. This direct connect column may have reduced the co-elution of PFAS originating
from sources prior to the sample loop from the PFAS injected in the sample. It may not be
possible to remove all PFAS background contamination.
6.6.2 Chromatography Column. C18 liquid chromatography column (2 x 50 mm) packed with 3
μm C18 solid phase particles (Phenomenex Part Number 00B-4439-B0 or equivalent).
Revision 0 (1/13/2021)

6.6.3 Electrospray Ionization Tandem Mass Spectrometer (ESI-MS/MS). The mass spectrometer
must be capable of electrospray ionization in the negative ion mode. The system must be capable
of performing MS/MS to produce unique product ions for the method analytes within specified
retention time segments. A minimum of 10 scans across the chromatographic peak is needed to
ensure adequate precision. Some ESI-MS/MS instruments may not be suitable for PFAS
analysis. For this method, the m/z 80 product ion must be used for PFOS and PFHxS to
minimize this problem and promote comparability between laboratories. Some MS/MS
instruments may not be able to scan a product ion with such a wide mass difference from the
precursor ion. These instruments may not be used for this method if PFOS or PFHxS analysis is
to be conducted.
6.6.4 MS/MS Data System. An interfaced data system is required to acquire, store, and output
MS data. The computer software must have the capability of processing stored data by
recognizing a chromatographic peak within a given retention time window. The software must
allow integration of the abundance of any specific ion between specified time or scan number
limits. The software must be able to reproducibly integrate analyte and internal standard ion
abundances in order to construct calibration curves and calculate analyte concentrations using the
internal standard technique.
7.0 Reagents, Media, and Standards
Unless otherwise indicated, all reagents must conform to the Specifications and Procedures for
Reagents and Standard-Grade Reference Materials (see
https://pubs.acs.org/isbn/9780841230460) of the American Chemical Society (ACS) Committee
on Analytical Reagents where such specifications are available. Other grades may be used if the
Revision 0 (1/13/2021)
reagent is demonstrated to be free of analytes and interferences and all requirements in Section
13 are met when using these reagents media and standards.
7.1 Sampling Media
7.1.1 Filter. Glass fiber filters, without organic binder, exhibiting at least 99.95 percent
efficiency (<0.05 percent penetration) on 0.3-micron dioctyl phthalate smoke particles.
7.1.1.1 Filter quality control check. Conduct a filter lot blank evaluation prior to the field test to
demonstrate that filters are free from contamination or interference. Perform extraction and
analysis using the same procedures used to process field samples as outlined in Section 11 of this
method on a minimum of three filters from the lot. The blank filter check analysis must meet the
performance requirements in Section 9.2.2.1 of this method.
7.1.2 Adsorbent Resin. Amberlite® XAD–2 resin. All adsorbent resin must meet the cleanliness
criteria in Section 9.2.2.1 of this method for all target compounds on the analysis list following
the same extraction, concentration, cleanup, and analysis steps as field samples. This method
recommends using the procedures provided in the Appendix to this method to clean the resin
before use, if needed. However, this method allows alternative cleanup procedures that use
automated extraction equipment if the adsorbent meets the required performance criteria in
Section 9.2.2.1 of this method.
7.1.3 Conduct a quality control check on the cleaned adsorbent. Perform extraction and analysis
using the same procedures used to process field samples as outlined in Section 11 of this method
on a quantity of the sorbent representative of the amount typically packed into a sampling
Revision 0 (1/13/2021)

module. The cleaned adsorbent must meet the criteria in Section 9.2.2.1 of this method. A batch
blank conducted on a filter and adsorbent lot combination used for a test can serve this purpose.
7.1.3.1 Storage. Store adsorbent in its original purchase container, a clean wide-mouth HDPE
container with a polypropylene or polyethylene-lined cap, or in glass adsorbent modules tightly
sealed with glass caps.
7.1.4 Glass Wool. Clean the glass wool to meet the specifications in Section 9.2.2.1 of this
method. Using sequential immersion in three clean aliquots of 5% ammonium hydroxide in
methanol, drying in a 110 °C (230 °F) oven, and storing in a 5% ammonium hydroxide in
methanol rinsed glass jar with a polypropylene or polyethylene-lined screw cap can meet these
requirements.
7.1.5 Water. Use deionized or distilled PFAS free water meeting requirements in Section 9.2.2.1
of this method and store in its original container or in a 5% ammonium hydroxide in methanol-
rinsed glass container with a polypropylene or polyethylene-lined screw cap.
7.1.6 Silica Gel. Indicating type, 6–16 mesh. If previously used, dry at 175 °C (347 °F) for two
hours. Use new silica gel as received. As an alternative, use other types of desiccants (equivalent
or better), subject to the approval of the Administrator.
7.2 Sample Recovery Reagents.
7.2.1 Methanol. CH3OH, CASRN 67-56-1, LC grade (Fisher Scientific, Cat. No. A456 or
equivalent).
Revision 0 (1/13/2021)

7.2.2 Ammonium hydroxide solution. NH4OH, CASRN 1336-21-6, approximately 56.6% in
water as ammonium hydroxide (w/w), approximately 28% in water as ammonia, approximately
14.5 N (Fisher Scientific, Cat. No. A669, Certified ACS Plus grade, or equivalent).
7.2.3 Ammonium hydroxide, 5% in methanol rinsing solution. Prepared by diluting of 50 mL
ammonium hydroxide solution into 1 L final volume in methanol.
7.3 Sample Extraction and Cleanup Reagents.
7.3.1 Ammonium hydroxide 5% in methanol extraction solution. (methanol / 5% NH4OH).
Prepared by diluting of 50 mL ammonium hydroxide solution into 1 L final volume in methanol
(see Section 7.2). This reagent is added to methanolic solutions of PFAS to prevent
esterification.
7.3.2 Ammonium hydroxide, 0.3%, in methanol (SPE extraction solution). Prepared by diluting
12 mL of ammonium hydroxide into 4L of methanol.
7.3.3 Sodium Hydroxide (NaOH), 0.1 N, in water. Prepared by diluting 400 mL of 1N NaOH in
3.6L of water for a total volume of 4L.
7.3.4 Hexane. Reagent grade.
7.4 Standard Solutions
7.4.1 Stability of Methanolic Solutions
Fluorinated carboxylic acids will esterify in anhydrous acidic methanol. To prevent
esterification, standards must be stored under basic conditions. If base is not already present, this
may be accomplished by the addition of ammonium hydroxide (approximately 4 mole
Revision 0 (1/13/2021)
equivalents) when standards are diluted in methanol. When calculating molarity for solutions
containing multiple PFAS, the molecular weight can be estimated as 250 atomic mass units
(amu). It is necessary to include ammonium hydroxide in solutions of both isotopically labeled
and native analytes. The amount of ammonium hydroxide needed may be calculated using the
following equation:
𝑇𝑜𝑡𝑎𝑙 𝑃𝐹𝐴𝑆 𝑚𝑎𝑠𝑠(𝑔)𝑥 160( 𝑔
)𝑚𝑜𝑙
𝑔 = 𝑀𝑎𝑠𝑠 𝑜𝑓 𝑁𝐻4𝑂𝐻 𝑅𝑒𝑞𝑢𝑖𝑟𝑒𝑑 (𝑔) Eq. 45-1 250( )
𝑚𝑜𝑙
7.4.2 Preparation of Standards
When a compound purity is assayed to be 96% or greater, the weight can be used without
correction to calculate the concentration of the stock standard. PFAS analyte and isotopically
labeled analogues commercially purchased in glass ampoules are acceptable; however, all
subsequent transfers or dilutions performed by the analyst must be stored in polypropylene
containers.
Solution concentrations listed in this section are included as examples. Alternate concentrations
may be used as necessary depending on instrument sensitivity and the calibration range used.
Standards for sample fortification should be prepared in the smallest volume that can be
accurately measured to minimize the addition of excess organic solvent to aqueous samples. The
analyte supplier’s guidelines are used to determine when standards need to be replaced.
7.4.3 Storage Temperatures for Standard Solutions. Store stock standards at less than 4 °C unless
the vendor recommends otherwise. The Primary Dilution Standards (PDS) may be stored at any
Revision 0 (1/13/2021)
temperature, but cold storage is recommended to prevent solvent evaporation. PDS stored at –20
°C showed no change in analyte concentrations over a period of 6 months.
7.4.4 Pre-analysis standard(s). Obtain the pre-analysis standard(s) as certified standard solutions,
if available, or as the neat compounds. Note that Chemical Abstracts Registry Numbers are not
currently available for these compounds. All the pre-analysis standard(s) listed in this section
must be used. Additional pre-analysis standard(s) may be used provided they are isotopically
labeled analytes or labeled analytes with similar functional groups as the method analytes. Linear
isomers are recommended to simplify peak integration. Method modification QC requirements
must be met (Sect. 9.3) whenever additional pre-analysis standard(s) are used. The final sample
extracts were fortified with 10 μL of the pre-analysis standard(s) to yield a concentration of 10
ng/mL for 13C3-PFBA and 13C2-PFOA.
7.4.5 Pre-analysis primary dilution standard (pre-analysis standard(s)-PDS). Prepare the pre-
analysis standard(s)-PDS in methanol and add ammonium hydroxide if not already present to
prevent esterification. The PDS concentrations for the method are listed in the Table 45-3
7.4.6 Pre-extraction Standards. Obtain the isotopically labeled analogues listed in Table 45-1 as
individual certified standard solutions or as certified standard mixes. All listed isotope dilution
analogues must be used, if available. Linear isomers are recommended to simplify peak
integration.
Note: Chemical Abstracts Registry Numbers are not currently available for these isotopically
labeled analogues.
Note: Pre-extraction standard(s) is identical to Isotope Dilution Analogues in Method 533
Revision 0 (1/13/2021)

7.4.7 Pre-extraction Primary Dilution Standard (pre-extraction standards -PDS). Prepare the pre-
extraction standards - PDS in methanol and add ammonium hydroxide if not already present to
prevent esterification as described in Section 7.4.1. The final extracts are fortified with 10 µL of
the PDS to yield concentrations of 40 – 160 ηg/sample fraction. Note that the concentrations of
sulfonates in the pre-extraction standards PDS is based on the weight of the salt. It is not
necessary to account for difference in the formula weight of the salt compared to the free acid for
sample quantitation.
7.4.8 Analyte Standard Materials. Analyte standards may be purchased as certified standard
solutions or prepared from neat materials of assayed purity. If available, the method analytes
should be purchased as technical-grade to ensure that linear and branched isomers are
represented. Standards or neat materials that contain only the linear isomer can be substituted if
technical-grade analytes are not available as quantitative standards. Stock standards are made by
dilution in methanol containing 4 mole equivalents of ammonium hydroxide, as described in
Section 7.4.2. Technical grade, quantitative PFHxS and PFOS standards containing branched and
linear isomers must be used when available.
7.4.9 Correction for Analytes Obtained in the Salt Form. This method measures all forms of the
analytes as anions while the identity of the counterion is inconsequential. Analytes may be
commercially available as neat materials or as certified stock standards as their corresponding
ammonium, sodium, or potassium salts. These salts are acceptable standards provided the
measured mass, or concentration, is corrected for the salt content. The equation for this
correction is provided below.
𝑀𝑊 𝑎𝑐𝑖𝑑 𝑚𝑎𝑠𝑠(𝑎𝑐𝑖𝑑 𝑓𝑜𝑟𝑚) = 𝑚𝑎𝑠𝑠(𝑠𝑎𝑙𝑡 𝑓𝑜𝑟𝑚)𝑥 Eq. 45-2
𝑀𝑊 𝑠𝑎𝑙𝑡
Revision 0 (1/13/2021)

7.4.10 Analyte PDS. The analyte PDS is used to prepare the calibration standards and to fortify
the laboratory fortified blanks, laboratory fortified sample matrix spikes, laboratory fortified
sample matrix spike duplicates (LFMB s, LFSMs and LFSMDs) with the method analytes.
Prepare the analyte PDS by combining and diluting the analyte stock standards in 100%
methanol and add ammonium hydroxide if not already present to prevent esterification. Select
nominal analyte concentrations for the PDS such that between 5 and 100 μL of the PDS is used
to fortify samples and prepare standard solutions. More than one PDS concentration may be
necessary to meet this requirement. Nominal analyte PDS may be prepared at an identical
concentration for all analytes of 0.5 ng/μL. The user may modify the concentrations of the
individual analytes based on the confirmed QRLs and the desired measurement range. Premixed
standards containing most of the target analytes in this method may be used as a PDS. For those
compounds not available in this mixture, a second source standard from the same vendor as the
ICAL may be used to complete the target list compounds in the PDS. If the PDS is stored cold,
warm the vials to room temperature and vortex mix prior to use.
7.4.11 Calibration Standards. Prepare a series of calibration standards of at least five levels by
diluting the analyte PDS into methanol containing 20% reagent water. The lowest calibration
standard must be at or below the QRL for each analyte. The calibration standards may also be
used as Continuing Calibration Checks (CCCs). Using the PDS solutions, add a constant amount
of the pre-analysis standard(s) and to each calibration standard. The concentration of the pre-
extraction standards should match the concentration of the analogues in sample extracts,
assuming 100% recovery through the extraction process. The nominal concentrations of the pre-
extraction standards can be 40 ng/mL in the extract for 4:2FTS, 6:2FTS and 8:2FTS, and 10
Revision 0 (1/13/2021)

ng/mL for all others. The analyte calibration ranges from approximately 0.50 ng/mL to 25
ng/mL extract concentration.
7.5 Nitrogen. 99.999 percent (ultra-high) purity used to concentrate sample extracts.
7.6 Argon. Used as collision gas in MS/MS instruments. Argon should meet or exceed
instrument manufacturer’s specifications. Nitrogen may be used as the collision gas if
recommended by the instrument manufacturer.
8.0 Sample Collection, Recovery, Preservation, and Storage
8.1 Sampling. This method involves collection and recovery of trace concentrations of
semivolatile organic compounds. Therefore, field sampling and recovery staff must be trained in
the best practices for handling and using organic solvents in field environments to recover and
protect samples from contamination.
8.1.1 Pretest Preparation.
8.1.1.1 Cleaning Glassware. Clean glassware thoroughly before using. This section provides a
recommended procedure, but any protocol that consistently results in contamination-free
glassware meeting the batch blank criteria in Section 13.2 of this method is acceptable.
8.1.1.1.1 Soak all glassware in hot soapy water (Alconox® or equivalent) at 50 °C or higher.
8.1.1.1.2 Rinse three times with hot tap water.
8.1.1.1.3 Rinse three times with deionized/distilled water.
Revision 0 (1/13/2021)

8.1.1.1.4 Rinse three times each with Acetone, dichloromethane, and methanol.
8.1.1.1.5 Bake glassware at 300 °C (572 °F) for a minimum of 2 hours
Note: Repeated baking of glassware may cause active sites on the glass surface that may
irreversibly absorb target compounds.
8.1.1.1.6 Cover glassware openings with clean glass fitting caps or cleaned aluminum (see
Section 6.2.6 of this method).
8.1.1.1.7 Rinse glassware immediately before use with 5% ammonium hydroxide in methanol.
Note: To prepare heavily soiled glassware, remove surface residuals from the glassware by
soaking in hot soapy water, rinsing with hot water, then soaking with a non-chromic acid
oxidizing cleaning reagent in a strong acid (e.g., NOCHROMIX® prepared according to
manufacturer’s directions). After the acid soak, rinse with hot water and repeat the cleaning
procedures in Section 8.1.1.1 of this method.
8.1.1.2 Adsorbent Module. Load the modules in a clean area to avoid contamination. Spike
modules before the sampling event, but do not spike the modules in the field. Fill a module with
20 to 40 g of XAD–2. Add the pre-sampling standard spike to the top quarter of the adsorbent
bed. Add sufficient spike (picograms (pg)/module) to result in the final theoretical concentrations
specified in Table 45-3 of this method. For samples with known or anticipated target compound
concentration significantly higher or lower than the specified amount in these tables, add a pre-
sampling spike amount appropriate to the expected native compound concentration, but no less
Revision 0 (1/13/2021)

than 10 times the detection limit. Follow the XAD–2 with cleaned glass wool and tightly cap
both ends of the module.
8.1.1.3 Sampling Train. Figure OTM 45-1 of this method shows the complete sampling train.
8.1.1.4 Silica Gel. Weigh several 200 to 300 g portions of silica gel in an air-tight container to
the nearest 0.5 g. Record the total weight of the silica gel plus container on the outside of each
container. As an alternative, directly weigh the silica gel in its impinger or sampling holder just
prior to sampling.
8.1.1.5 Filter. Check each filter against light for irregularities and flaws or pinhole leaks. Pack
the filters flat in a clean glass container. Do not mark filters with ink or any other contaminating
substance.
8.1.2 Preliminary Determinations. Use the procedures specified in Section 8.2 of Method 5 of
appendix A-3 to 40 CFR part 60.
8.1.2.1 Sample Volume. This method recommends sampling enough gas volume to reach a DL
sufficient to meet test objectives. Unless otherwise specified in an applicable rule, permit, or
other requirement, collect a minimum of 3.0 dry standard cubic meters of source gas.
8.1.2.2 For continuously operating processes, use the same sampling time at each traverse point.
To avoid timekeeping errors, use an integer, or an integer plus one-half minute, for each traverse
point.
8.1.2.3 For batch processes, determine the minimum operating cycle duration, dividing the
sampling time evenly between the required numbers of traverse points. After sampling all
Revision 0 (1/13/2021)

traverse points once, sample each point again for the same duration of time per sampling point in
reverse order until the operating cycle is completed. Sample all traverse points at least once
during each test run.
8.1.3 Preparation of Sampling Train. Do not use sealing greases or brominated flame retardant-
coated tape in assembling the train.
8.1.3.1 During field preparation and assembly of the sampling train, keep all train openings
sealed where contamination can enter until just prior to assembly or until sampling is about to
begin. To protect the adsorbent module from radiant heat and sunlight, you must wrap the
module with aluminum foil or other suitable material capable of shielding the module from light.
The XAD–2 adsorbent resin temperature must never exceed 50 °C (122 °F) because thermal
decomposition will occur. Clean and prepare a complete set of sampling train components that
will contact the sample for each sampling run. Include at least one complete field test proof
blank and at least one field test field blank, as described in Sections 9.1.3 and 9.1.4 of this
method.
8.1.3.2 Place approximately 100 mL of water in each of the second, third and fourth impingers
but leave the first (condensate trap) impinger empty. Transfer approximately 200 g or more of
silica gel from its container to the fifth impinger. Weigh each impinger and the adsorbent
module, including the fitting caps, to the nearest 0.5 g using the field balance and record the
weight for moisture determination. Remove the aluminum foil from the adsorbent module before
weighing. Keep the module out of direct sunlight and rewrap the module with foil immediately
after recording the module weight.
Revision 0 (1/13/2021)

8.1.3.3 Using tweezers or clean disposable surgical gloves, place a filter in the filter holder. Be
sure that the filter is properly centered, and the gasket properly placed, to prevent the sample gas
stream from circumventing the filter. Check the filter for tears after completing the assembly.
8.1.3.4 Prepare the inside of the sampling probe and nozzle by brushing each component while
rinsing three times each with methanol. Install the selected nozzle. You may use connecting
systems described in Section 6.1.2 of this method. Mark the probe with heat resistant tape or by
some other method to denote the proper distance into the stack or duct for each sampling point.
Assemble the train as shown in Figure 45–1 of this method. Orient the adsorbent module
vertically so condensed moisture drains into the first impinger. See APTD-0576 Maintenance,
Calibration, and Operation of Isokinetic Source-sampling Equipment (U.S. EPA 1972) for
details.
8.1.3.5 Turn on the recirculation pump to the adsorbent module and condenser coil and begin
monitoring the temperature of the gas entering the primary adsorbent module. Ensure proper
temperature of the gas entering the adsorbent module before proceeding.
8.1.4 Leak-Check Procedure. Same as Section 8.4 of Method 5 of appendix A-3 to 40 CFR part
60.
8.1.5 Sampling Train Operation. Same as Sections 8.5.1 through 8.5.9 of Method 5 of appendix
A-3 to 40 CFR part 60 with the exception that the probe and filter holder (and heated sample
transfer line, if used) temperature are limited to minimize the potential thermal degradation of
thermally labile PFAS compounds such as HFPO-DA which are known to decompose at
temperatures below the standard Method 5 probe and filter operating temperatures.
Revision 0 (1/13/2021)

8.1.5.1 Probe and Filter Operating Temperatures. For stack temperatures below 120 °C (248 °F),
limit the probe and filter (and heated sample transfer line, if used) temperature to approximately
10 °C (20 °F) above the sampling location stack temperature. Ensure the operating temperature is
sufficient to avoid moisture condensation in the probe and filter holder. For stack temperatures at
or above 120 °C, operate the probe and filter at 120 °C ± 14 °C (248 °F ± 25 °F). Monitor the
filter temperature sensor and record the filter temperature during sampling. A nominal filter exit
temperature of 120 °C ± 14 °C (248 °F ± 25 °F) should not be exceeded.
8.1.5.2 XAD-2 Adsorbent Module Temperatures. During testing, you must record the
temperature of the gas entering the XAD-2 adsorbent modules. The temperature of the gas must
not exceed 20 °C (68 °F) for efficient capture of the target compounds.
8.2 Sample Recovery. Begin the cleanup procedure as soon as the probe is removed from the
stack at the end of the sampling period.
8.2.1 Preparation. Allow the probe to cool. Do not cap the probe tip tightly while the sampling
train is cooling down because this will create a vacuum in the filter holder, drawing water from
the impingers into the sorbent module, When the probe can be safely handled, wipe off all
external particulate matter near the tip of the probe. Conduct a post-test leak check. Remove the
probe from the train and close off both ends. Seal off the inlet to the filter. Remove the umbilical
cord from the last impinger and cap the impinger. If a flexible line is used between the primary
sorbent module and the filter holder, disconnect the line at the filter holder and let any condensed
water or liquid drain into the organic module. Cap the filter-holder outlet and the inlet to the
organic module. Separate the sorbent trap section of the organic module from the condensate
knockout trap and the gas-conditioning section. Cap all sorbent module openings. Disconnect the
Revision 0 (1/13/2021)

sorbent module knockout trap from the impinger train inlet and cap both of these openings.
Ground-glass stoppers, Teflon tape, or other inert materials such as cleaned aluminum foil (e.g.,
rinsed with 5% ammonium hydroxide in methanol rinsing solution) may be used to seal all
openings.
8.2.2 Transfer and Inspection. Transfer the sampling train components to the cleanup area. This
method recommends cleaning and enclosing this area to minimize the chances of losing or
contaminating the sample. To avoid sample contamination and unnecessary exposure to toxic
chemicals, smoking or eating in the sample recovery area shall not be allowed. Inspect the train
prior to and during disassembly. Note and record any abnormal conditions (e.g., broken filters,
colored impinger liquid). Recover and prepare samples for shipping as follows in Sections 8.2.4
through 8.2.12 of this method.
8.2.3 Moisture Weight. Weigh the adsorbent module, impingers, and silica gel impinger to
within ± 0.5 g using the field balance and record the weights. This information is required to
calculate the moisture content of the effluent gas.
Note: Moisture measurement in the field using the OTM 45 train requires weighing the primary
adsorbent module before the sampling run described in 8.1.3.2 and after sampling as part of the
sample recovery for stack moisture determination.
8.2.4 Container No. 1 – Filter. Either seal the filter holder or carefully remove the filter from the
filter holder and place it in its identified container. If it is necessary to remove the filter, use a
pair of cleaned tweezers to handle the filter. If necessary, fold the filter such that the particulate
cake is inside the fold. Carefully transfer to the container any particulate matter and filter fibers
Revision 0 (1/13/2021)

that adhere to the filter holder gasket by using a dry inert bristle brush and a sharp-edged blade.
Seal the container and store in a thermally insulated container for transport to the laboratory.
8.2.5 Container No. 2 – Front Half Rinse. Quantitatively recover material deposited in the
nozzle, the front half of the filter holder, and the cyclone, if used, by brushing while rinsing three
times with the 5% Ammonium hydroxide in methanol rinsing solution. Collect all the rinses in
the HDPE sample bottle and label as Container No. 2. Mark the level of the liquid on the
container. Store the sample container refrigerated or on ice until laboratory shipment.
8.2.6 Container No. 3 – Primary Adsorbent Module Sample. Remove the module from the train
and tightly cover both ends. Replace the retaining clips around the glass joint. Remove the foil,
drain the recirculating water from the module, weigh and record the module weight. The
adsorbent trap module should be used as a sample transport container. Both ends should be
sealed with tightly fitting ground-glass stoppers followed by Teflon tape around the glass joint.
The sorbent trap should then be labeled, re-covered with aluminum foil, and packaged on ice for
transport to the laboratory.
Note: The XAD-2 resin modules (primary and breakthrough) are shipped back from the field as
separate fractions for analysis. As more data is collected from the use of this method the
requirement of analysis of the XAD-2 module as a separate fraction may change.
8.2.7 Container No. 4 – Back Half Rinse. All sampling train components located between the
back half of the filter holder and the inlet of the primary adsorbent module, including the
condenser if a separate condenser and adsorbent module are used, and the heated sample transfer
line connecting the filter outlet to the condenser (if used) shall be triple rinsed with 5%
Revision 0 (1/13/2021)
ammonium hydroxide in methanol rinsing solution. Collect all the rinses in the HDPE sample
bottle and label as Container No. 4. Mark the level of the liquid on the container. Store the
sample container refrigerated or on ice until laboratory shipment.
8.2.9 Container No. 5 – Condensate and Impinger Water. After weighing the impingers,
quantitatively recover the impinger water samples, including the contents of the knockout
impinger (if used), in the HDPE sample bottle and label as Container No. 5 Mark the level of
the liquid on the container. Store the sample container refrigerated or on ice until laboratory
shipment.
Note: Make sure that no ammonium hydroxide in methanol rinsing solution is transferred to the
container No. 5 sample. Doing so may compromise the sample for analysis.
8.2.10 Container 6 – Impingers Rinse. Rinse impingers 1-4 three times with the 5% ammonium
hydroxide in methanol rinsing solution. Collect all the rinses in the HDPE sample bottle and
label as Container No. 6. Mark the level of the liquid on the container. Store the sample
container refrigerated or on ice until laboratory shipment. If impingers are used in a subsequent
sampling run they must be rinsed three times with reagent water to remove residual ammonium
hydroxide in methanol.
8.2.11 Container 7 – Secondary Adsorbent Module Sample. Remove the module from the train
and tightly cover both ends. Replace the retaining clips around the glass joint. Remove the foil,
drain the recirculating water from the module, weigh and record the module weight. The
adsorbent trap module should be used as a sample transport container. Both ends should be
sealed with tightly fitting ground-glass stoppers followed by Teflon tape around the glass joint.
Revision 0 (1/13/2021)

The sorbent trap should then be labeled, re-covered with aluminum foil, and packaged on ice for
transport to the laboratory.
8.2.10 Silica Gel. Note the color of the indicating silica gel to determine if it has been completely
spent and report its condition on the field data sheet.
8.2.11 Field Sample Handling, Preservation, Storage, and Transport. Store all field samples, with
the exception of the particulate filter, temporarily on ice (approximately 4°C) and dark
conditions prior to transport to the laboratory. The particulate filters should be shipped in a
thermally insulated container and may remain unrefrigerated. Ship samples on ice, shielded
from ultraviolet light. The particulate filters should be shipped unrefrigerated. In addition, follow
the procedures in ASTM D6911-15 (Guide for Packaging and Shipping Environmental Samples
for Laboratory Analysis) for all samples, where appropriate. To avoid contamination of the
samples, pay special attention to cleanliness during transport, field handling, sampling, recovery,
and laboratory analysis, as well as during preparation of the adsorbent cartridges.
Prior to shipment, recheck all sample containers to ensure that the caps are well secured. Seal the
lids of all containers around the circumference with Teflon tape. Ship all liquid samples upright
on ice and all particulate filters with the particulate catch facing upward.
8.2.12 Sample Custody. Proper procedures and documentation for sample chain of custody are
critical to ensuring data integrity. Follow the chain of custody procedures in ASTM D4840-99
(2018)e1 (Standard Guide for Sampling Chain-of-Custody Procedures) for all samples (including
field samples and blanks).
8.3 Laboratory Sample Storage Conditions and Laboratory Hold Times.
Revision 0 (1/13/2021)

8.3.1 Table 45-4 of this method summarizes the sample storage conditions and laboratory hold
times.
8.3.2 Store sampling train rinses and filter samples in the dark at 6 °C (43 °F) or less from the
time the laboratory receives the samples until extraction but not longer than 28 days from date of
collection
8.3.3 You may store adsorbent samples prior to extraction in the dark at 6 °C (43 °F) or less for
up to one year from the time the laboratory receives the samples.
8.3.4 Samples must be extracted within 28 days of collection. Extracts are stored at room
temperature and must be analyzed within 28 days of extraction.
8.3.6 You may store archived extracted samples in the dark at refrigerator temperature of
approximately 6 °C (43 °F) for up to one year.
9.0 Quality Control
It is the testing team’s responsibility to establish the conditions for optimum sample collection,
extraction, cleanup, and concentration to meet the performance criteria in this method. However,
you may not change the fundamental procedures of isokinetic sampling with an adsorbent
collection media followed by sample extraction, and LC-MS/MS with isotopic dilution
quantification. This method requires performing a media blank (i.e., batch blank) assessment to
evaluate an individual laboratory’s performance against the performance criteria in this method.
In recognition of advances that are occurring in sampling and analytical technology for PFAS
measurement, and to allow the test team to overcome analyte sensitivity and matrix
Revision 0 (1/13/2021)
interferences, this method allows certain options to increase sample collection volume and to
improve separations and the quality of the analysis results for target analytes.
QC procedures include the Initial Demonstration of Capability (IDC) and ongoing quality control
(QC) requirements. This section describes each QC parameter, its required frequency, and the
performance criteria that must be met in order to satisfy method objectives. The analysis QC
criteria discussed in the following sections are summarized in Table 45-5. These QC
requirements are considered the minimum for an acceptable QC program. Laboratories are
encouraged to institute additional QC practices to meet their specific needs. At a minimum,
laboratories must evaluate changes within the alternatives allowed in this method using a media
blank sample to re-demonstrate that the performance criteria are achieved.
9.1 Sampling Quality Control.
9.1.1 Sampling System. Same as Sections 8.4 and 9.2 of Method 5 of appendix A-3 to 40 CFR
part 60.
9.1.2 Field Sample Media Blank (FSMB). Also called the field trip blank. The FSMB is intended
to include and represent the sampling media (i.e., filter, XAD-2 adsorbent) and reagents (i.e.,
impinger contents, rinsing solvents) associated with the field sample collection and recovery, but
is not actually used in the field. The FSMB is treated as a sample in all respects, including
shipment to the sampling site, exposure to sampling site conditions, storage, and all analytical
procedures. The purpose of the FSMB is to determine if method analytes or other interferences
are introduced into the sample from shipping, storage, and the field environment. Analysis of the
FSMBs should be compared to the background level criteria in 9.2.2.1. Failure to meet these
Revision 0 (1/13/2021)

levels does not invalidate data. However, the measured target compound mass in each fraction
will need to be reported and used to interpret sample results.
9.1.3 Sample Train Proof Blank (STPB). A STPB must be submitted with the samples collected
at each sampling site. At a minimum, conduct at least one sample train proof blank for each test
series at a single facility. A sample train proof blank train consists of a fully assembled train at
the sampling site using glassware that has been cleaned, but not yet used for sampling. Prepare
and assemble the proof blank train in a manner identical to that described in Section 8.1.3 and
8.1.4 of this method. The STPB is taken to the sampling area, and leak checked at the beginning
and end of the testing (or for the same total number of times as the actual test train). The filter
housing and probe of the blank train will be heated during the sample test. No gaseous sample
will be passed through the sampling train. Recover the proof blank train as an actual train
described in Section 8.2 of this method. Follow all subsequent steps used for actual field train
samples including sample preparation, analysis and data reporting. Table 45-5 of this method
includes the performance criteria for field train proof blank assessment samples. Failure to meet
these levels does not invalidate data. However, the measured target compound mass in each
fraction will need to be reported and used to interpret sample results
9.1.4 Sample Train Field Blank. STFBs must be submitted with the samples collected at each
sampling site. At a minimum, conduct at least one sample train field blank for each test series at
a single facility. A sample train field blank train consists of a fully assembled train at the
sampling site using glassware that has been previously used for sampling. Prepare and assemble
the proof blank train in a manner identical to that described in Section 8.1.3 and 8.1.4 of this
method. The STFB is taken to the sampling area, and leak checked at the beginning and end of
Revision 0 (1/13/2021)

the testing (or for the same total number of times as the actual test train). The filter housing and
probe of the blank train will be heated during the sample test. No gaseous sample will be passed
through the sampling train. The train will be recovered as if it were an actual test sample.
Recover the proof blank train as an actual train described in Section 8.2 of this method. Follow
all subsequent steps for blank train sample preparation and analysis used for field train samples
including data reporting. Table 45-5 of this method includes the performance criteria for field
train proof blank assessment samples. Failure to meet these levels does not invalidate data.
However, the measured target compound mass in each fraction will need to be reported and used
to interpret sample results.
9.1.5 Pre-sampling Standard Recoveries. Pre-sampling standard XAD-2 adsorbent spike
recoveries must demonstrate on a per sample basis that recovery of the labeled standards achieve
the requirements in Table 45-5 of this method. Recoveries below the acceptable range of 70-
130% for the pre-sampling standard spikes may require a root cause evaluation of the cause for
poor recovery. If the recovery of all the pre-sampling standard adsorbent spikes is below 70%,
but, greater than 50%, the results have not met the recoveries experienced during method
development but may still be acceptable. Flag recoveries that are between 50 and 70% and
describe their potential impact on results. If the pre-sampling standard recoveries are less than
50%, the data for that train are not considered valid.
Note: The Pre-sampling standard recoveries include the sum of the analytical results of Fractions
2 and 3. (The pre-sampling standard may have migrated from the XAD-2 to the impingers).
9.1.6 Secondary XAD-2 Breakthrough. Determine the relative breakthrough (BT) of PFAS
through the OTM-45 train. For each PFAS target compound, calculate breakthrough.
Revision 0 (1/13/2021)

(𝐹𝑟𝑎𝑐𝑡𝑖𝑜𝑛 4 𝑚𝑎𝑠𝑠)𝐵𝑇(%) = 𝑥 100% Eq. 45-3
(𝐹𝑟𝑎𝑐𝑡𝑜𝑛 1+2+3 𝑚𝑎𝑠𝑠)
BT should be less than 30%. For any BT greater than 10%, add the Fraction 4 mass to the total
sample mass for emissions calculations. Failure to meet breakthrough requirements may
invalidate reported results and require repeat sampling.
9.2 Analysis Quality Control
9.2.1 Initial Demonstration of Capability (IDC). The IDC must be successfully performed prior
to analyzing field samples by meeting the QC requirements in Table 45-6. The IDC must be
repeated if changes are made to analytical parameters not previously validated during the IDC.
This may include, for example, changing the sample volume, selecting alternate quantitation
ions, extending the calibration range, adding additional pre-analysis standard(s), or adding
additional pre-extraction standards. Prior to conducting the IDC, the analyst must meet the
calibration requirements outlined in Section 10. The same calibration range used during the IDC
must be used for the analysis of field samples.
9.2.1.1 Perform initial calibration following the procedures in Section 10.4 The lowest
calibration standard used to establish the initial calibration (as well as the low-level CCC) must
be within two to ten times the estimated detection limit.
9.2.1.2 Demonstration of Low System Background. Analyze an LSMB immediately after
injecting the highest calibration standard in the selected calibration range. Confirm that the blank
is free from contamination as defined in Section 9.2.2.1. If an automated extraction system is
used, an LSMB must be extracted on each port to fulfil this requirement.
Revision 0 (1/13/2021)

9.2.1.3 Initial MDL Determination. Perform an MDL determination for each sample media
fraction (filter, XAD-2, and impinger solution) following the requirements in 40 CFR Part 136
Appendix B. The MDL determination includes seven LSMB and seven LFMB that are prepared
from blank media, spiked within 2 to 10 times of the expected MDL, and processed in a manner
identical to field sample preparation. The MDL study establishes the lowest detectable
concentrations for each sampling train fraction. Sample specific MDLs are reported inclusive of
sample-specific dilutions, final volumes, aliquots, etc.
9.2.1.4 MDL Confirmation. Prepare a LSMB for each sampling media by spiking each media
with native target compounds at the MDL and pre-extraction isotopic labeled standards at the
concentration used to analyze field samples. Prepare and analyze the spiked LSMB and confirm
target compounds meet the qualitative identification criteria in Section 12.3.2 of this method.
9.2.1.5 Demonstration of Precision. Prepare, extract, and analyze seven replicate LFMBs in a
valid Extraction Batch (seven LFMBs and an LSMB). Fortify the LFMBs near the midpoint of
the initial calibration curve. The percent relative standard deviation (%RSD) of the
concentrations from the replicate analyses must be less than 20% for all method analytes.
9.2.1.6 Demonstration of Accuracy. Using the same set of replicate data generated for Section
9.2.1.5, calculate the average percent recovery. The average recovery for each analyte must be
within a range of 70–130%.
9.2.1.7 Lowest Calibration Concentration Confirmation. Establish a target concentration for the
lowest calibration standard based on the intended use of the method. The lowest calibration
concentration may be established by a laboratory for their specific purpose or may be set by a
Revision 0 (1/13/2021)

regulatory agency. If there is a regulatory or programmatic lowest quantitative reporting
requirement, the laboratory calibration curve must be set at or below this level. In doing so, one
should consider that establishing the lowest calibration concentration too low may cause repeated
failure of ongoing QC requirements.
9.2.1.7.1 Prepare and Analyze LFMB Samples. Fortify, extract, and analyze seven replicate
LFMBs at the proposed lowest calibration concentration.
9.2.1.7.2 Calculate Lowest Calibration Statistics. Calculate the mean and standard deviation for
each analyte in these replicates. Determine the Half Range for the Prediction Interval of Results
(HRPIR) using the following equation:
𝐻RPIR = 3.963𝑆 Eq. 45-4
Where,
S = the standard deviation
3.963 is a constant value for seven replicates.1
9.2.1.7.3 Calculate the Upper and Lower Limits for the Prediction Interval of Results (PIR =
Mean ± HRPIR) as shown below. These equations are only defined for seven replicate samples.
(𝑀𝑒𝑎𝑛+𝐻𝑅𝑝𝑖𝑟)𝑈𝑃𝐼𝑅 = [ ] 100% Eq. 45-5
𝐹𝑜𝑟𝑡𝑖𝑓𝑖𝑒𝑑 𝐶𝑜𝑛𝑐𝑒𝑛𝑡𝑟𝑎𝑡𝑖𝑜𝑛
(𝑀𝑒𝑎𝑛− 𝐻𝑅𝑝𝑖𝑟)𝐿𝑃𝐼𝑅 = [ ] 100% Eq. 45-6
𝐹𝑜𝑟𝑡𝑖𝑓𝑖𝑒𝑑 𝐶𝑜𝑛𝑐𝑒𝑛𝑡𝑟𝑎𝑡𝑖𝑜𝑛
9.2.1.7.4 Lowest Calibration Point Acceptance Criteria. The laboratory’s ability to measure
analyte concentrations down to the lowest calibration point is confirmed if the Upper PIR Limit
is less than, or equal to, 150%; and the Lower PIR Limit is greater than, or equal to, 50%. If
Revision 0 (1/13/2021)

these criteria are not met, the lowest calibration point has been set too low and must be
confirmed again at a higher concentration.
9.2.1.8 Calibration Verification. Analyze a QCS (Sect. 9.2.2.12) to confirm the accuracy of the
primary calibration standards.
9.2.2 Ongoing QC Requirements. This section describes the ongoing QC elements that must be
included when processing and analyzing field samples.
9.2.2.1 Blanks and Background Levels. The quantitative measurement of various blanks and
sampling media background levels is required. Unless otherwise stated, estimated quantitative
measurement, and therefore acceptable blank and background levels for these samples should be
at or below the MDLs established in Section 9.2.1.3. Ideally, estimated quantitative limits, and
therefore acceptable blank and background levels, should be below the established MDLs, but no
greater than the MDL.
9.2.2.1.1 Sampling Media Background Level Checks. When performing cleanliness checks prior
to field sampling on the sampling media (i.e., filters, XAD-2, reagents, solvents, etc), acceptable
levels should be below one third of the established MDLs, but no greater than the MDL. If levels
are found above the MDL, further clean the sampling media until levels are below MDL.
9.2.2.1.2 Laboratory Sample Media Blank (LSMB). Analyze at least one LSMB during an
analytical sequence or every 24 hours, whichever is shorter. Sampling media and reagents are
fortified with the pre-extraction standards and processed identically to a field sample of the same
media. LSMBs for each sampling media and reagent (i.e., filter, XAD-2, water, rinsing solutions)
are included in each Extraction Batch to determine if the method analytes or other interferences
Revision 0 (1/13/2021)

are introduced from the laboratory environment, the reagents, glassware, or extraction apparatus.
Acceptable levels should be below the established MDLs, but no greater than the MDL. If
method analytes are detected in the LSMB at concentrations greater than or equal to this level the
results should be flagged accordingly. Resolve the source of contamination before proceeding
with additional analyses.
9.2.2.2 Estimating Background Concentrations.
Although data below the lowest calibration concentration may not be accurate enough for
quantitative data reporting, such data are useful in determining the magnitude of background
interference. Therefore, the analyte concentrations in the LSMB may be estimated by
extrapolation when results are below the lowest calibration concentration.
9.2.2.2.1 Influence of Background on Selection of MDLs. Because background contamination
can be a significant problem, some MDLs may be background limited.
9.2.2.2.2 Evaluation of Background when Analytes Exceed the Calibration Range. After analysis
of a sample in which method analytes exceed the calibration range, one or more LSMBs must be
analyzed (to detect potential carryover) until the system meets the LSMB acceptance criteria. If
this occurs during an automated sequence, examine the results of samples analyzed following the
sample that exceeded the calibration range. If the analytes that exceeded the calibration range in
the previous sample are detected at, or above, the MDL, these samples are invalid. If the affected
analytes do not exceed the MDL, these subsequent samples may be reported.
9.2.2.3 Calibration Acceptance Criteria. Evaluate the initial calibration by calculating the
concentration of each analyte as an unknown against its regression equation. (See Section 10.4)
Revision 0 (1/13/2021)

For calibration levels, the result for each analyte should be within 90 – 110% of their true value.
If these criteria cannot be met, the analyst could have difficulty meeting ongoing QC criteria. In
this case, corrective action is recommended such as reanalyzing the calibration standards,
restricting the range of calibration, or performing instrument maintenance. If the cause for failure
to meet the criteria is due to contamination or standard degradation, prepare fresh calibration
standards and repeat the initial calibration.
9.2.2.3.1 Continuing Calibration Check (CCC). Analyze CCC standards at the beginning of each
Analysis Batch, after every tenth field sample, and at the end of the Analysis Batch. (See Section
10.5) CCCs must be within 70-130% of true value. If the CCC fails because concentration is
>130% (150% for low-level CCC) and field sample extracts show no concentrations above the
MDL for that analyte, non-detects can be reported without re-analysis.
9.2.2.4 Laboratory Fortified Media Blanks. Duplicate low level and high level LFMBs are
required with each extraction batch for each media fraction (i.e., filter, XAD-2, water).
9.2.2.4.1 LFMB Concentration Requirements. Fortify the low concentration LFMB no more than
two times the lowest calibration point. Fortify the high level LFMBs at a concentration between
the mid and high-level calibration points.
9.2.2.4.2 Evaluate Analyte Recovery. Calculate the percent recovery (%R) using the equation:
(𝐴−𝐵)%𝑅 = 𝑥 100 Eq. 45-7
𝐶
Where,
Revision 0 (1/13/2021)

A = measured concentration in the fortified sample,
B = measured concentration in the unfortified sample, and
C = fortification concentration.
Note: In order to obtain meaningful percent recovery results, correct the measured values in the
LFSM and LFSMD for the native levels in the unfortified samples, even if the native values are
less than the lowest calibration concentration.
Results for analytes fortified at concentrations near or at the lowest calibration point (within a
factor of two times the lowest calibration concentration) must be within 50–150% of the true
value. Results for analytes fortified at higher concentrations must be within 70–130% of the true
value. If the LFMB results do not meet these criteria, then report all data for the problem
analytes in the Extraction Batch with a note that the LFMB accuracy criteria were not met. The
laboratory must investigate the root cause for this failure and report their findings and corrective
action.
9.2.2.5 Pre-analysis Standard(s) Areas. The analyst must monitor the peak areas of the pre-
analysis standard(s) in all injections of the Analysis Batch. The pre-analysis standard(s) (as
indicated by peak area) in any chromatographic run must be within 50–150% of the average area
measured during the initial calibration. Random evaporation losses have been observed with the
polypropylene caps causing high-biased pre-analysis standard(s) areas. If a pre-analysis
standard(s) standard area for a single sample in an analysis batch does not meet these criteria,
reanalyze the extract in a subsequent analysis batch. If the pre-analysis standard(s) area fails to
meet the acceptance criteria in the repeat analysis, or if multiple samples in a batch fail to meet
Revision 0 (1/13/2021)

the pre-analysis spike criteria, perform corrective action and reanalyze the failed samples.
extract.
9.2.2.6 Pre-extraction Standard Recoveries. Pre-extraction standard recoveries determined during
the analysis of samples must demonstrate on a per sample basis that recovery of the labeled
standard achieved the 20-130% recovery requirements summarized in Table 45-5. Calculate the
percent recovery (%R) for each analogue as follows:
𝑀𝑒𝑎𝑠𝑢𝑟𝑒𝑑 𝐶𝑜𝑛𝑐𝑒𝑛𝑡𝑟𝑎𝑡𝑖𝑜𝑛 𝑜𝑓 𝑡ℎ𝑒 𝑃𝑟𝑒−𝑒𝑥𝑡𝑟𝑎𝑐𝑡𝑖𝑜𝑛 𝐼𝑠𝑜𝑡𝑜𝑝𝑒 𝑎𝑛𝑎𝑙𝑜𝑔𝑢𝑒 %𝑅 = 𝑥 100 Eq. 45-8
𝐹𝑜𝑟𝑡𝑖𝑓𝑖𝑐𝑎𝑡𝑖𝑜𝑛 𝑐𝑜𝑛𝑐𝑒𝑛𝑡𝑟𝑎𝑡𝑖𝑜𝑛 𝑜𝑓 𝑡ℎ𝑒 𝑃𝑟𝑒−𝑒𝑥𝑡𝑟𝑎𝑐𝑡𝑜𝑖𝑛 𝐼𝑠𝑜𝑡𝑜𝑝𝑒 𝑎𝑛𝑎𝑙𝑜𝑔𝑢𝑒
Recoveries below the acceptable range for pre-extraction spikes are an indication that sample
preparation procedures did not adequately address sample and or sample matrix processing to
recover native target compounds. Compounds that fail this criterion should be flagged and
reported as not quantitative because of QC failure. If this failure involves target compounds that
are critical to the test objectives, this is a failure that requires root cause investigation and may
require a repeat field sampling effort.
9.2.2.7 Calibration Verification using QCS. A QCS must be analyzed during the IDC, and then
quarterly thereafter. For this method, the laboratory is not required to obtain standards from a
source independent of the primary calibration standards. Instead, the laboratory should acquire
the best available quantitative standards and use these to prepare both the primary calibration
standards and the QCS. The QCS must be an independent dilution beginning with the common
starting materials. Preparation by a second analyst is recommended. The acceptance criterion for
the QCS is 70–130% of the true value. If the accuracy for any analyte fails the recovery criterion,
prepare fresh standard dilutions and repeat the Calibration Verification.
Revision 0 (1/13/2021)

9.3 Method Modification QC Requirements
The analyst is permitted to modify the chromatographic and MS/MS conditions. Examples of
permissible method modifications include alternate LC columns, MRM transitions, and
additional QC analytes proposed for use with the method. Any method modifications must be
within the scope of the established method flexibility and must retain the basic chromatographic
elements of this method. The following are required after a method modification.
9.3.1 Repeat the IDC. Establish an acceptable initial calibration using the modified conditions.
Repeat the procedures of the IDC.
9.3.2 Document Performance in Representative Sample Matrices. The analyst is also required to
evaluate and document method performance for the modifications in an archived field sample
treated as a matrix spike.
9.4 Record and Report Requirements
Record and report data and information that will allow an independent reviewer to validate the
determination of each target compound concentration. At a minimum, record and report the data
as described in Sections 9.4.1 through 9.4.7 of this method.
9.4.1 Sample numbers and other sample identifiers. Each sample must have a unique identifier.
9.4.2 Field sample volume.
9.4.3 Field sampling date.
9.4.4 Extraction dates.
Revision 0 (1/13/2021)
9.4.5 Analysis dates and times.
9.4.6 Analysis sequence/run chronology.
9.4.7 Quantitation Reports.
10.0 Calibration and Standardization
10.1 Sampling System. Same as Sections 6.1 and 10.1 through 10.7 of Method 5 of appendix A-
3 to 40 CFR part 60.
10.2 MS/MS Optimization.
10.2.1 MS Parameters. Instrumental parameters are optimized for the precursor and product ions
listed in Table 45-2. Product ions other than those listed may be selected; however, the analyst
should avoid using ions with lower mass or common ions that may not provide enough
discrimination between the analytes of interest and co-eluting interferences.
10.2.2 Precursor Ion. Optimize the response of the precursor ion ([M – H]– or [M – CO2 – H]–)
for each analyte following instrument manufacturer’s guidance. Optimization may be performed
at analyte concentrations of 1.0 μg/mL Vary the MS parameters (source voltages, source and
desolvation temperatures, gas flows, etc.) until optimal analyte responses are determined. The
analytes may have different optimal parameters, requiring some compromise on the final
operating conditions.
Revision 0 (1/13/2021)
10.2.3 Product Ion. Optimize the product ion for each analyte following the instrument
manufacturer’s guidance. Typically, the carboxylic acids have similar MS/MS conditions and the
sulfonic acids have similar MS/MS conditions.
10.3 Chromatographic Conditions. Establish LC operating parameters that optimize resolution
and peak shape. Example LC starting conditions can be found in Table 45-7. Modifying the
solvent composition of the standard or extract by increasing the aqueous content to better focus
early eluting compounds on the column is not permitted. A decrease in methanol concentration
could lead to lower or imprecise recovery of the more hydrophobic method analytes, while
higher methanol concentration could lead to the precipitation of salts in some extracts. The peak
shape of the early eluting compounds may be improved by increasing the volume of the injection
loop or increasing the aqueous content of the initial mobile phase composition.
10.3.1 Minimizing PFAS Background. LC system components, as well as the mobile phase
constituents, may contain many of the analytes in this method. These PFAS may build up on the
head of the LC column during mobile phase equilibration. To minimize the background PFAS
peaks and to keep baseline levels constant, the time the LC column sits at initial conditions must
be kept constant and as short as possible (while ensuring reproducible retention times). In
addition, priming the mobile phase and flushing the column with at least 90% methanol before
initiating a sequence may reduce background contamination.
10.3.2 Establishing Branched vs. Linear Isomer Profiles. Prepare and analyze the technical-grade
standard of PFOA at a mid- to high-level concentration. Identify the retention times of the
branched isomers of PFOA present in the technical-grade PFOA standard. When PFOA is
chromatographed on a reversed-phase column, the branched isomers elute prior to the linear
Revision 0 (1/13/2021)

isomer. Repeat the procedure in this section for technical grade PFHxS and PFOS, and any other
analytes for which technical-grade standards have been acquired. The branched isomer
identification checks must be repeated any time chromatographic changes occur that alter analyte
retention times.
10.3.3 Establish LC-MS/MS Retention Times and MRM Segments. Inject a mid- to high-level
calibration standard under optimized LC-MS/MS conditions to obtain the retention times of each
method analyte. Divide the chromatogram into segments that contain one or more
chromatographic peaks. For maximum sensitivity, minimize the number of MRM transitions that
are simultaneously monitored within each segment. Both primary and secondary product ions
may need to be monitored to quantitate selected PFAS. Ensure that the retention time window
used to collect data for each analyte is of sufficient width to detect earlier eluting branched
isomers.
10.4 Initial Calibration. This method has two pre-analysis standard(s) that are used as reference
compounds for the internal standard quantitation of the pre-extraction standards. The pre-
extraction standards are used as reference compounds to quantitate the native analyte
concentrations. The pre-extraction standard references for the native analytes are listed in Table
45-1.
10.4.1 Calibration Standards. Prepare a set of at least five calibration standards as described in
Section 7.4.11. The analyte concentrations in the lowest calibration standard must not be within
two to ten times the MDL. Suggested calibration standard concentrations for native target
compounds are shown in Table 45-8. Suggested calibration standard concentrations for pre-
extraction isotopic labeled compounds are shown in Table 45-9.
Revision 0 (1/13/2021)
10.4.2 Calibration Curves of Native Analytes. Quantitate the native analytes using the internal
standard calibration technique. The internal standard technique calculates concentration based on
the ratio of the peak area of the native analyte to that of the isotope dilution analogue. Calibrate
the LC-MS/MS and fit the calibration points with either a linear or quadratic regression.
Weighting may be used.
Note: Forcing the calibration curve through the origin may improve the estimate of the
background levels of method analytes which are an important consideration for this method.
Note: The MS/MS instrument used during method development was calibrated using weighted
(1/x) quadratic regression with forced zero.
10.4.3 Calibration of pre-extraction standards. The pre-extraction standards are quantified using
the pre-analysis calibration technique. Because these isotopes are added at a single concentration
to the calibration standards, calibrate for each of these using an average response factor.
10.4.4 Calibration of pre-analysis standard(s). Because pre-analysis standard(s) are added at a
single concentration to the calibration standards, calibrate for each of these using an average
response factor.
10.4.5 Calibration Acceptance Criteria. Evaluate the initial calibration by calculating the
concentration of each analyte as an unknown against its regression equation. All calibration
points should be within 90 – 110% of their true value. If these criteria cannot be met, the analyst
could have difficulty meeting ongoing QC criteria. In this case, corrective action is
recommended such as reanalyzing the calibration standards, restricting the range of calibration,
or performing instrument maintenance. If the cause for failure to meet the criteria is due to
Revision 0 (1/13/2021)

contamination or standard degradation, prepare fresh calibration standards and repeat the initial
calibration.
10.5 Continuing Calibration. Analyze a CCC to verify the initial calibration at the beginning of
each Analysis Batch, after every tenth field sample, and at the end of each Analysis Batch. The
beginning CCC for each Analysis Batch must be at, or below, the MDL for each analyte. This
CCC verifies instrument sensitivity prior to the analysis of samples. If standards have been
prepared such that all low calibration levels are not in the same solution, it may be necessary to
analyze two standards to meet this requirement. Alternatively, the nominal analyte
concentrations in the analyte PDS may be customized to meet these criteria. Alternate
subsequent CCCs between the mid and high calibration levels. Verify that the CCC meets the
criteria in the following sections.
10.5.1 CCC- Pre-analysis standard(s) Responses. The absolute area of the quantitation ion for
each of the two pre-analysis standard(s) must be within 50–150% of the average area measured
during the initial calibration. If these limits are exceeded, corrective action is necessary (Section
10.5).
10.5.2 CCC Isotope Dilution Analogue Recovery. Using the average response factor determined
during the initial calibration and the internal standard calibration technique, calculate the percent
recovery of each isotope dilution analogue in the CCC. The recovery for each analogue must be
within a range of 70–130%. If these limits are exceeded, corrective action is necessary (Section
10.5).
Revision 0 (1/13/2021)

10.5.3 CCC Analyte Responses. Calculate the concentration of each method analyte in the CCC.
Each analyte fortified at a level less than or equal to the QRL must be within 50–150% of the
true value. The concentration of the analytes in CCCs fortified at all other levels must be within
70–130%. If these limits are exceeded, then all data for the failed analytes must be considered
invalid. Any field samples analyzed since the last acceptable CCC that are still within holding
time must be reanalyzed after an acceptable calibration has been restored.
10.5.3.1 Exception for High Recovery. If the CCC fails because the calculated concentration is
greater than 130% (150% for the low-level CCC) for a method analyte, and field sample extracts
show no concentrations above the MDL for that analyte, non-detects may be reported without re-
analysis.
10.6 Corrective Action. Failure to meet the CCC QC performance criteria requires corrective
action. Following a minor remedial action, such as servicing the autosampler or flushing the
column, check the calibration with a mid-level CCC and a CCC at the QRL, or recalibrate
according to Section 10.4 of this method. If pre-analysis standard(s) and calibration failures
persist, maintenance may be required, such as servicing the LC-MS/MS system or replacing the
LC column. These latter measures constitute major maintenance and the analyst must return to
the initial calibration step.
10.7 Calibration Range Flexibility. The calibration ranges for native PFAS target compounds in
Tables 45-8 are provided as an example. Calibration solutions are prepared by diluting the
appropriate amounts of calibration stock solutions in 80 percent methanol/water. The actual
ICAL concentration used for each sample batch will depend upon the quantitation limit
requirements of the program. The concentration of pre-extraction isotopically labeled
Revision 0 (1/13/2021)

compounds used for isotopic dilution quantitation are kept constant and will depend upon the
quantitation limit requirements of the test program.
11.0 Analysis Procedure
11.1 Sample Extraction. The OTM-45 sampling train (Figure 45-1) currently results in seven (7)
containers that are extracted and analyzed as four (4) discreet analytical fractions. Figure OTM
45-4 provides a flow chart showing how the respective sample containers are combined,
extracted, and concentrated for analysis.
11.1.1 Fraction 1 Particulate Filter and FH Rinse (Containers 1 and 2). Place the particulate filter
into an appropriate size HDPE bottle. Spike the filter with the appropriate pre-extraction
recovery standard solution. Add front-half sample rinsate (Container 2) to each respective filter
container. If there is less than 50 mL of rinsate, add extraction solvent for a total of 50 mL.
Extract samples on a shaker table for a minimum of 18 hours. Measure and record the final
volume. After extraction, the solvent is divided: half of the volume used in the extraction is
measured for concentration; the remaining portion is archived. This is achieved by filtering into
separate, appropriately sized HDPE containers by placing a filter paper in a disposable
polypropylene funnel and pouring the sample extracts through the funnels and into the HDPE
containers.
11.1.2 Fraction 2 Primary XAD-2 Adsorbent and Back-Half (BH) Rinse (Containers 3 and 4).
11.1.2.1 Spike the XAD-2 in the module with the appropriate pre-extraction recovery standard
solution (Table 45-3). Empty the module contents into an HDPE wide mouth bottle. Rinse the
inside of the module with 5% ammonium hydroxide in methanol and add to the HDPE bottle.
Revision 0 (1/13/2021)

11.1.2.2 Add up to 180 mL of the back-half sample rinsate (Container 4) to the respective XAD
container. If there is less than 180 mL of rinsate, add 5% ammonium hydroxide in methanol for a
total of 180 mL. If there is excess rinsate, you may add up to half of the volume and save the
remaining half for the second extraction described in 11.1.2.5.
11.1.2.3 Extract the samples on a shaker table for a minimum of 18 hours.
11.1.2.4 Decant the extraction solvent into a new HDPE container leaving the XAD-2 in the
extraction container.
11.1.2.5 Add any unused rinsate to the XAD- HDPE extraction container. If there is less than
180 mL of sample rinsate remaining, add 5% ammonium hydroxide in methanol for a total of
180 mL. Extract the sample a second time on a shaker table for a minimum of 18 hours. After the
second extraction is completed, the extraction solvent is decanted into the container with the first
extract leaving the XAD-2 in the extraction container. Measure and record the final volume.
Divide extract with half of the volume going for concentration (Section 11.2) and archive the
remaining half.
11.1.3 Fraction 3 Condensate/Impinger Water and Impinger Rinses (Containers 5 and 6). The
sample is brought up to 500 mL in a Nalgene bottle with DI water. If the amount of sample is
more than 500 mL, the entire sample is prepared (no additional DI water is added). Spike each
sample with 1.0 mL of the IDA solution. The water sample is divided: 250 mL (or half the
sample if more than 500 mL was received) is measured for analysis in an appropriately sized
Nalgene bottle; the remaining half is archived in an appropriately sized Nalgene bottle.
Revision 0 (1/13/2021)

11.1.3.1 Solid Phase Extraction (SPE) of Aqueous Samples. Wash the SPE cartridges with 5.0
mL 0.3% NH4OH/methanol. Wash with 5.0 mL of 0.1 N NaOH/water. Close valve when ~ 200
uL remains on top to keep columns wet. After this step, ensure the columns do not go dry until
the completion of loading and rinsing samples. Label and add the reservoir to the column. Add
sample to the column. Using a vacuum, pull the entire sample through the cartridge at a rate of 2-
5 drops per second. After the entire sample has been loaded onto the column, rinse the Nalgene
bottle twice with 5 mL of reagent water and pour onto the column reservoir. After the final
loading of the sample but before completely passed through the cartridge, allow the column to
dry well with vacuum for 15 minutes.
11.1.3.2 SPE Column Wash with Hexane. Load 5 mL of hexane to the column and soak for five
minutes. Elute to waste. Load an additional 5 mL of hexane and elute to waste without a soaking
period. Allow the column to dry completely with vacuum for 5 to 10 minutes.
11.1.3.3 SPE Elution. Rinse Nalgene bottle with 4 mL of 0.3% NH4OH/methanol. Pour rinse
into the column reservoir onto the cartridge. Allow the solution to soak for 5 minutes and then
elute into a polypropylene container large enough to contain volume from 11.1.3.4. Repeat rinse
with an additional 4 mL of 0.3% NH4OH/methanol. The total collection should be
approximately 8 mL. Measure and record the final volume.
11.1.3.4 Combine with Container 6 (Impinger Rinse). Measure and record the Container 6 rinse
volume. Transfer half to a HDPE container for sample archive. Combine with half of the SPE
eluent. Cap, seal with Teflon tape, mark the level and store refrigerated at approximately 4 C.
Combine the remaining Container 6 rinse with the remaining SPE eluent and concentrate as
described in 11.2.
Revision 0 (1/13/2021)

11.1.3.4 Final volume for extract. Add 0.5 mL of IS 50 ng/mL concentration and 2 mL of water
to the extract. This will create an extract with a final solvent composition of 80:20
methanol:water. Transfer a portion of the extract to a 300 uL polypropylene autosampler vial.
Archive the rest of the extracts for re-injection and dilution. Seal the vial with a polypropylene
screw cap.
11.1.4 Fraction 4 Breakthrough XAD-2 Adsorbent (Container 7).
11.1.4.1 Spike the XAD-2 in the module with the appropriate pre-extraction recovery standard
solution. Empty the module contents into an HDPE wide mouth bottle. Rinse the module with
5% ammonium hydroxide and add to HDPE bottle.
11.1.4.2 Add 5% ammonium hydroxide in methanol for a total volume of 180 mL
11.1.4.3 Extract the samples on a shaker table for a minimum of 18 hours.
11.1.4.4 Decant the extraction solvent into an HDPE container leaving the XAD-2 in the
extraction container.
11.1.4.5 Add 180 mL of 5% ammonium hydroxide in methanol to the XAD extraction container.
Extract the sample a second time on a shaker table for a minimum of 18 hours. After the second
extraction is completed, the extraction solvent is decanted into the container with the first extract
leaving the XAD-2 in the extraction container. Divide extract with half of the volume going for
concentration (Section 11.2) and archive the remaining half.
11.2 Sample Concentration
Revision 0 (1/13/2021)

11.2.1 Pour extract into a polypropylene digestion vessel and insert into a digestion block heated
between 55-60 ⁰C. Rinse container three times with small portions of 5% ammonium hydroxide
in methanol and add to digestion vessel. Cover each vessel with a ribbed polypropylene watch
glass.
11.2.1.1To accommodate large volumes, the extract and rinsate can either be concentrated in
multiple digestion vessels until concentrated to a level that allows recombination (with proper
rinsing) OR additional extract can be added to a digestion vessel as volume is reduced during the
concentration step. Concentrate the sample to below 10 mL, but not to dryness. Transfer to a 10
mL polypropylene tube, rinsing the digestion vessel adequately.
11.2.2 Blow down remaining volume to below 2 mL, but not to dryness, with an N-EVAP at 55-
60 °C. Bring up volume to 2 mL with DI water or 5% ammonium hydroxide in methanol. Cap
snugly and ensure there are no leaks. Store refrigerated at approximately 4 C until analysis.
Analyze within 28 days of extracting.
11.3 Sample Analysis.
Note: Sample analysis for this method is fashioned after EPA’s Method 533 with modifications
to accommodate the various fractions recovered from the stationary source sampling train.
11.3.1 Establish LC-MS/MS Operating Conditions. Establish MS/MS operating conditions per
the procedures in Section 10.2 and chromatographic conditions per Section 10.3. Establish a
valid initial calibration following the procedures in Section 10.3 or confirm that the existing
calibration is still valid by analyzing a low-level CCC. If establishing an initial calibration for the
Revision 0 (1/13/2021)

first time, complete the IDC prior to analyzing field samples. Analyze field and QC samples in a
properly sequenced Analysis Batch as described in Section 11.4.
11.3.2 Verify Retention Time Windows. The analyst must ensure that each method analyte elutes
entirely within the assigned window during each Analysis Batch. Make this observation by
viewing the quantitation ion for each analyte in the CCCs analyzed during an Analysis Batch. If
an analyte peak drifts out of the assigned window, then data for that analyte is invalid in all
injections acquired since the last valid CCC. In addition, all peaks representing multiple isomers
of an analyte must elute entirely within the same MRM window.
11.4 Analysis Batch Sequence. An Analysis Batch is a sequence of samples, analyzed within a
24-hour period, of no more than 20 field samples and includes all required QC samples (LSMB,
CCCs, the LFSM and LFSMD (or FD)). The required QC samples are not included in counting
the maximum field sample total of 20. LC-MS/MS conditions for the Analysis Batch must be the
same as those used during calibration.
11.4.1 Analyze Initial CCC. After a valid calibration is established, begin every Analysis Batch
by analyzing an initial low-level CCC at or below the QRL. This initial CCC must be within 50–
150% of the true value for each method analyte and must pass both the pre-analysis standard(s)
area response criterion (Section 9.2.2.4) and the pre-extraction isotope recovery criterion
(Section 9.2.2.6). The initial CCC confirms that the calibration is still valid. Failure to meet the
QC criteria may indicate that recalibration is required prior to analyzing samples.
11.4.2 Analyze Field and QC Samples. After the initial CCC, continue the Analysis Batch by
analyzing an LSMB, followed by the field samples and QC samples. Analyze a mid- or high-
Revision 0 (1/13/2021)

level CCC after every ten field samples and at the end of each Analysis Batch. Do not count QC
samples (LSMBs, FDs, LFSMs, LFSMDs) when calculating the required frequency of CCCs.
11.4.3 Analyze Final CCC. The last injection of the Analysis Batch must be a mid- or high-level
CCC. The acquisition start time of the final CCC must be within 24 hours of the acquisition start
time of the low-level CCC at the beginning of the Analysis Batch. More than one Analysis Batch
within a 24-hour period is permitted. An Analysis Batch may contain field and QC samples from
multiple extraction batches.
11.4.4 Initial Calibration Frequency. A full calibration curve is not required before starting a new
Analysis Batch. A previous calibration can be confirmed by running an initial, low-level CCC
followed by an LSMB. If a new calibration curve is analyzed, an Analysis Batch run
immediately thereafter must begin with a low-level CCC and an LSMB.
12.0 Data Analysis and Calculations
12.1 Calculation Nomenclature
As = the area of the characteristic mass for the compound in the continuing calibration
verification sample.
Ais = the area of the characteristic mass of the pre-extraction isotopically labeled standard in the
continuing calibration verification sample.
Cis = the concentration of the pre-extraction isotopically labeled standard (pg/µL).
Cs = the concentration of the native compound in the continuing calibration standard (pg/µL).
Ai = Integrated ion current for the isotopically labeled compound.
An = Integrated ion current for the target native compound.
Revision 0 (1/13/2021)

Ci = The concentration of the labeled compound used to perform isotope recovery correction,
pg/μL.
Cn = The concentration of the target native compound, pg/μL.
Cndscm = Concentration of target native compound i in the emission gas, pg/dscm.
Cnext = Concentration of target native compound i in the extract, pg.
D = Difference in the RRF of the continuing calibration verification compared to the average
RRF of the initial calibration, percent (%).
dscm = Dry standard cubic meters of gas volume sample measured by the dry gas meter,
corrected to standard conditions.
R* = Recovery of labeled compound standards, %.
RSD = Relative standard deviation, in this case, of RRFs over the five calibration levels, %.
SDRRF = Standard deviation of initial calibration RRFs.
Vext = Extract volume, μL.
12.2 Source gas volume calculations. Carry out calculations for stack gas velocity, volumetric
flow rate, sampling volume, moisture, isokinetic variation following the procedures in Section 12
of Method 5 of appendix A-3 to 40 CFR part 60, with the following additions.
12.3 Qualitative Identification of Target Compounds
12.3.1 Qualitative Identity of Peaks by Retention Times. At the conclusion of analysis data
acquisition, use the same software settings established during the calibration procedure to
qualitatively identify analyte peaks in the predetermined retention time windows. Confirm the
identity of each analyte by comparison of its retention time with that of the corresponding
analyte peak in an initial calibration standard or CCC.
Revision 0 (1/13/2021)

12.3.2 Qualitative Identity by Confirming the Parent and Product ions. Confirm that the native
and pre-extraction isotope parent and product ions are consistent with the continuing calibration
results. The signals for all characteristic masses shall be present and shall maximize within the
same two consecutive scans. The retention time difference between the native analyte and its
labeled analog shall agree within ±6 scans or ±6 seconds (whichever is greater) of this difference
in the continuing calibration standard.
12.4 Recovery of Labeled Compound Standards. Use the following equation to determine the
recovery of any labeled compounds, including pre-sampling spikes, pre-extraction filter spike,
pre-extraction spikes, pre-analysis spikes. Verify and report the percent recovery of the pre-
extraction isotopic labeled spike. The recovery performance criteria and actions if performance
criteria are not met for these spikes is in Section 9. of this method.
𝑐𝑜𝑛𝑐. 𝑓𝑜𝑢𝑛𝑑 𝑅∗ = 𝑥 100% Eq. 45-9
𝑐𝑜𝑛𝑐. 𝑠𝑝𝑖𝑘𝑒𝑑
12.5 Quantitative Determination of Target Compounds by Isotope Dilution. Isotope dilution in
this method is performed by adding a known amount of a labeled compound to every sample
prior to extraction. Correction for recovery of the pollutant can be made because the pollutant
and its labeled analog exhibit the same effects upon extraction, concentration, and
chromatography.
Because quantitative native standards and isotopically labeled analogs are not currently available
for all of the PFAS that may be target compounds in this procedure as originally written or in the
future, integration and quantitation of the PFAS is dependent on the type of isotopically labeled
Revision 0 (1/13/2021)
standard and native compound materials available. Procedures in this section must be followed
to identify and report the identity and quantity of PFAS found in source gas samples.
12.5.1 PFOA Quantification. For PFOA, identify the branched and linear isomers by analyzing a
technical-grade standard that includes both linear and branched isomers as directed and ensure
that all isomers elute within the same acquisition segment. Quantitate field samples and fortified
matrix samples by integrating the total response, accounting for peaks that are identified as linear
and branched isomers. Quantitate based on the quantitative PFOA standard containing just the
linear isomer.
12.5.2 PFHxS, PFOS, and other Analytes with Technical-Grade Standards. Multiple
chromatographic peaks, representing branched and linear isomers, have been observed for
current standards of PFHxS and PFOS using the LC conditions in this method. For PFHxS and
PFOS, all the chromatographic peaks observed in the standard must be integrated and the areas
summed. Chromatographic peaks in all field samples and QC samples must be integrated in the
same way as the calibration standard for analytes with quantitative standards containing the
branched and linear isomers.
12.5.3 Calculate the concentration of each of the target compounds in each of the sample
fractions using the multipoint calibration and the measured sample volume including
compensation for archived splits of the sample following the procedures in this section.
Calculations must use all available digits of precision, but final reported concentrations should be
rounded to an appropriate number of significant figures (one digit of uncertainty), typically two,
and not more than three significant figures. Results must be reported individually for the filter,
sorbent, impinger, and backup sorbent fractions. Report all results as total mass per media
Revision 0 (1/13/2021)

fraction corrected for sample aliquot, sample dilution, and sample concentration.as described in
the following sections of this method.
12.5.3.1 Sample Concentrations Below the Lowest Calibration Standard. It is important to
estimate the concentrations of target PFAS compounds below the lowest calibration standard
concentration as well as below the MDL whenever possible. Samples may be concentrated and
reanalyzed, or calibration curves may be extended to lower concentrations as necessary if initial
concentration determination shows results below the lowest calibration standard. Concentrations
may be estimated using the calibration equation or by other accepted approaches (e.g., using the
RRF for the lowest calibration standard. The lowest calibration point may not be lower than
three times the MDL.
12.5.3.1.1 Concentrations Between the QRL and MDL. Report concentrations between the
detecton limit (MDL) and the QRL for target compounds in each fraction with a J flag and
explain the meaning of the J flag in your laboratory report, including the approach for estimating
concentrations below the lowest calibration standard.
12.5.3.1.2 Concentrations below the MDL. Report results below the detection limit (MDL) with
a BDL flag, and explain the meaning of the BDL flag in your laboratory report, including the
approach for estimating concentrations below the lowest calibration standard.
12.5.4 Sample Concentrations Above the Highest Calibration Standard. Report concentrations of
analytes that exceeded the calibration range in the original sample based on measurement in a
diluted sample. Incorporate the dilution factor into final concentration calculations.
12.6 Quantitation Formulas.
Revision 0 (1/13/2021)

12.6.1 Response Factors. Calculate daily response factors for each of the target analytes in the
continuing calibration verification sample using the following equation:
(𝐴𝑠)(𝐶𝑖𝑠)𝑅𝐹 = Eq. 45-10
(𝐴𝑖𝑠)(𝐶𝑠)
Where,
Ais = the area of the characteristic mass of the pre-extraction isotopically labeled standard in the
continuing calibration verification sample.
As = the area of the characteristic mass for the native compound in the continuing calibration
verification sample.
Cis = the concentration of the pre-extraction isotopically labeled analog in the standard (pg/µL).
Cs = the concentration of the native compound in the continuing calibration standard (pg/µL).
Confirm that the daily response factors for each target analyte meet the QC criteria in Section 9
of this method.
12.6.2 Isotope Dilution Quantification of Target Compounds in Sample Extracts
12.6.2.1 Proceed with target compound quantitation based on the type of isotopic labeled
standard available used for each method analyte. If standards containing the branched and linear
isomers cannot be purchased (i.e., only the linear isomer is available), only the linear isomer can
be identified and quantitated in field samples and QC samples. Target analytes and branched
isomers that do not have corresponding isotopic labels must be reported separately showing
which native and isotopic labels were used to generate semiquantitative results for the analytes
and isomers.
Revision 0 (1/13/2021)

12.6.2.2 The response of each target compound (RR) relative to its labeled analog is determined
using the area responses for each calibration standard, as follows:
(𝐴𝑛)(𝐶𝑖)𝑅𝑅 = Eq. 45-11
(𝐴𝑖)(𝐶𝑛)
Where,
An = The areas of the characteristic m/z for the target compound(s).
Ai = The areas of the peak representing the primary m/z for the labeled compound.
Ci = The concentration of the labeled compound in the calibration standard.
Cn = The corresponding concentration of the native compound in the calibration standard.
12.6.2.3 Calculate the Concentration of Individual Target Compound in the Extract by Isotope
Dilution (pg/μL). This equation corrects for the target native compound recovery by its labeled
pre-extraction spike analog. To accomplish this the pre-extraction spike, labeled compound
concentrations must remain constant. Compute the concentration in the extract using the
following equation:
𝜌𝑔 (𝐴𝑛 )(𝐶𝑖)𝐶𝑒𝑥 (𝜇𝐿
) = Eq. 45-12 (𝐴𝑖)(𝑅𝑅)
Where:
Cex = the concentration of the target compound in the extract in pg/µL.
Ci = The concentration of the labeled compound in the calibration standard in pg/µL.
Revision 0 (1/13/2021)

Cn = The concentration of the native compound in the calibration standard in pg/µL.
12.6.2.4 Total Mass of the Individual Target Compounds in the Sample Extract (pg). Calculate
the mass for each target compound in each sample fraction using the concentration of the
compound in the extract and the volume of extract, including any dilution, aliquots and/or
archiving.
(𝐶𝑒𝑥 )(𝑉𝑒𝑥𝑡) = Eq. 45-13𝑀𝑡𝑜𝑡𝑎𝑙 𝑓
Where,
f = the fraction of the original sample extract before concentration taken for analysis (volume
extracted/volume concentrated).
Cex = The concentration of the compound in the extract in pg/µL.
Vext = The final extract volume after concentration and/or dilution in mL
12.6.3 Concentration of the Individual Target Compound or in the Emission Gas (pg/dscm).
Calculate the gaseous emission concentration for each target compound based on the sum of the
measured mass for each sample train fraction where PFAS were detected.
𝑀𝑠𝑢𝑚 𝑡𝑜𝑡𝑎𝑙 = Eq. 45-14𝐶𝑑𝑠𝑐𝑚 𝑑𝑠𝑐𝑚
Where,
dscm = the standard dry cubic meters of gas collected in the sampling run.
12.6.3.1 In-stack Detectable Limit (DL). Calculate the gaseous emission, in-stack DL (pg/dscm)
for each target compound based the sum of the sample-specific MDL masses for sample train
fractions 1, 2 and 3, divided by the standard dry cubic meters of gas collected in the sampling
run.]
Revision 0 (1/13/2021)

𝑀𝑀𝐷𝐿𝑆𝑢𝑚 𝐷𝐿 = Eq. 45-15 𝑑𝑠𝑐𝑚
Where,
MMDLSum = sum of the sample-specific MDL masses for sample train fractions 1, 2 and 3.
12.7 Data Reporting. Report the following data in the emissions test reports.
12.7.1 Analytical Data. Include the following data and information in analytical data reports and
emissions data test report.
12.7.1.1 Calibration Data. Include the number of calibration points and associated
concentrations, including the lowest point in the calibration curve. Provide the calibration
information used to derive the quantitative relationship and the approach used. Report the
agreement between the calculated value and known value for each calibration point (See Section
10.4.5 calibration criteria).
12.7.1.2 MDL Study Data. Report the results for the MDL study identified and described in
Section 9.2.1.3.
12.7.1.2.1 MDL Concentration and Mass for Each Fraction. Report the study’s individual MDLs
established for Fractions 1 – 3. Include the overall mass for each analyte as well as the associated
volumetric concentration (pg/µL) used for determining the MDL mass specific to a collected
emissions sample.
12.7.1.2.2 MDL Accuracy Data. Report the accuracy data from the MDL study and Section
9.2.1.6.
Revision 0 (1/13/2021)
12.7.1.2.3 MDL Precision Data. Report the precision data from the MDL study and Section
9.2.1.5.
12.7.1.3 Laboratory Fortified Media Blank Samples Data. Report the results of the dual level
LFMB samples from Section 9.2.2.4.
12.7.1.4 Laboratory Blanks. Report the target PFAS compound masses for all laboratory blanks.
12.7.1.5 Sample Train Analytical Data. Report all field sample analytical data, including blanks.
12.7.1.5.1 Sample-Specific Concentration and Mass for Each Fraction. Report the sample-
specific analytical mass/volume (liquid) concentration and associated mass for each PFAS target
compound and each fraction, inclusive of sample-specific final extract volumes, archive
volumes, dilutions, etc.
12.7.1.4.2 Sample-Specific MDL Mass for Each Fraction. Report the sample-specific analytical
MDL mass/volume (liquid) concentration and associated mass for each PFAS target compound
and each fraction, inclusive of total sample-specific final extract volumes, archive volumes,
dilutions, etc.
12.7.1.4.3 Sample-Specific QRL Mass for Each Fraction. Report the sample-specific analytical
QRL mass/volume (liquid) concentration and associated mass for each PFAS target compound
and each fraction, inclusive of total sample-specific final extract volumes, archive volumes,
dilutions, etc.
12.7.1.4.4 Pre-extraction Standard Recoveries for Each Fraction. Report the pre-extraction
standard recoveries for each standard, for each fraction.
Revision 0 (1/13/2021)

12.7.1.4.5 Pre-Sampling Standard Mass and Recoveries. Report PSS mass for Fractions 2
(primary XAD-2 adsorbent and rinses) and 3 (condensate/impingers and rinse) and individual
and combined recoveries.
Note: The Pre-sampling standard recoveries include both Fractions 2 and 3 and the pre-sampling
standard may have migrated from the XAD-2 to the impingers.
12.7.2 Sampling and Emissions Data. Include the following data and information in the
emissions data test report.
12.7.2.1 Emissions Data. For each run, report the target compound masses measured for each
fraction. Indicate whether reported masses are in the quantitative range, estimated, or non-
detect. Report the associated gaseous concentration for that run, based on the sum of detected
fractions and the gaseous sample volume collected for that run.
12.7.2.2 In-stacks DLs. For each run, report the sample-specific, in-stack DLs, based on run-
specific QRL and MDL masses (sum of fractions 1-3) and the gaseous sample volume collected
for that run.
13.0 Method Performance
Data to support OTM-45 Method Performance to date is limited. This method has been
developed based on a combination of empirical knowledge and data as well as incorporation of
procedures and concepts adapted from other methods and measurement practices. EPA/ORD
research, including field evaluation testing, has resulted in data that support the specified OTM-
45 method performance criteria, including pre-extraction standard and pre-sampling standard
isotopic label recovery criteria. Moreover, these performance criteria are further confirmed by
Revision 0 (1/13/2021)

communications with and data shared by commercial analytical laboratories. Tables 45-9 and 45-
10 present the pre-sampling standard recoveries and pre-extraction standard recoveries achieved
as part of an ORD OTM-45 field evaluation. An average pre-sampling standard recovery of
100.3% was observed for PFOA, while an average pre-sampling standard recovery of 73.0% was
observed for PFOS. Additional pre-sampling standard candidate compounds are needed to better
represent overall measurement performance. Candidates are limited to PFOA and PFOS at this
time due to the lack of additional PFAS compounds with necessary multiple isotopologues. The
pre-extraction standard recoveries presented in Table 45-10 also support OTM-45 performance
criteria. In general, pre-extraction standard recoveries for Fractions 1 (Filter) and 3 (Impingers)
were greater than for Fraction 2 (XAD-2).
Table 45-11 presents the calculated in-stack detection levels, based on both QRLs and MDLs
and a nominal 3 m3 sample volume. The values represent the sum of Fractions 1, 2, and 3. The
in-stack detection levels reported indicate that measurements in the pg/m3 range are possible for
the majority of OTM-45 targeted PFAS compounds.
The preparation and release of this method is intended to further establish data to support
refinement of these initial performance criteria.
The collection of blanks, in replicate and representing multiple forms, is particularly important to
data interpretation and validation. Managing PFAS contamination from a variety of sources,
particularly XAD-2, has been a critical and acknowledged factor to collecting emissions data of
known and acceptable quality. The recent application of PFAS emissions testing has resulted in
advancements to minimizing PFAS contamination. However, the comprehensive collection of
Revision 0 (1/13/2021)

laboratory and field sampling blank samples remains critical to identifying sources of
contamination and an inherent component to interpret results from this method.
14.0 Pollution Prevention
The target compounds used as standards in this method are prepared in extremely small amounts
and pose little threat to the environment when managed properly. Prepare standards in volumes
consistent with laboratory use to minimize the disposal of excess volumes of expired standards.
15.0 Waste Management
15.1 The laboratory is responsible for complying with all federal, state, and local regulations
governing waste management, particularly the hazardous waste identification rules and land
disposal restrictions, and for protecting the air, water, and land by minimizing and controlling all
releases from fume hoods and bench operations. The laboratory must also comply with any
sewage discharge permits and regulations. The EPA’s Environmental Management Guide for
Small Laboratories (EPA 233-B-98-001) provides an overview of requirements.
15.2 For further information on waste management, consult The Waste Management Manual for
Laboratory Personnel and Less is Better-Laboratory Chemical Management for Waste
Reduction, available from the American Chemical Society's Department of Government
Relations and Science Policy, 1155 16th Street N.W., Washington, D.C. 20036.
Revision 0 (1/13/2021)

16.0 Bibliography
1) EPA Method 533
https://www.epa.gov/sites/production/files/2019-12/documents/method-533-815b19020.pdf
2) EPA Method 537.1
https://cfpub.epa.gov/si/si_public_record_Report.cfm?dirEntryId=343042&Lab=NERL
3) EPA Method 5. 40 CFR Part 60 Appendix A-3
4) SW-846 Method 0010
https://www.epa.gov/hw-sw846/sw-846-test-method-0010-modified-method-5-sampling-train.
5) Shoemaker, J. and Dan Tettenhorst. Method 537.1: Determination of Selected Per- and
Polyfluorinated Alkyl Substances in Drinking Water by Solid Phase Extraction and Liquid
Chromatography/Tandem Mass Spectrometry (LC/MS/MS). Version 2.0, U.S. Environmental
Protection Agency, Office of Research and Development, Center for Environmental Solutions
and Emergency Response, Cincinnati, OH, EPA Document #: EPA/600/R-20/006, 2020.
6) Rosenblum, L. and Wendelken, S. C. Method 533: Determination of Per- and
Polyfluorinated Alkyl Substances in Drinking Water by Isotope Dilution Anion Exchange Solid
Phase Extraction and Liquid Chromatography/Tandem Mass Spectrometry. U.S. Environmental
Protection Agency, Office of Ground Water and Drinking Water, Standards and Risk
Management Division, Cincinnati, OH, EPA Document No. 815-B-19-020, 2019.
7) Tyner, T, and Francis, J. ACS reagent chemicals: specifications and procedures for
reagents and standard-grade reference materials. American Chemical Society,
http://pubs.acs.org/isbn/9780841230460, 2017.
8) U.S. Environmental Protection Agency. Office of Air Programs Publication No. APTD-
0576: Maintenance, Calibration, and Operation of Isokinetic Source Sampling Equipment.
Research Triangle Park, NC. March 1972.
9) US EPA. Statistical Protocol for the Determination of the Single-Laboratory Lowest
Concentration Minimum Reporting Level (LCMRL) and Validation of Laboratory Performance
at or Below the Minimum Reporting Level (MRL); EPA 815-R-05-006; Office of Water:
Cincinnati, OH, November 2004.
10) US EPA. Technical Basis for the Lowest Concentration Minimum Reporting Level
(LCMRL) Calculator; EPA 815-R-11-001; Office of Water: Cincinnati, OH, December 2010.
Revision 0 (1/13/2021)

17.0 Tables, Diagrams, Flowcharts, and Validation Data
Table 45-1 PFAS Target Analytes Common Namea Abbreviated
Name
CASb Registry
Number
Isotopic Pre-
Extraction
Pair
Perfluoroalkylcarboxylic acids (PFCAs)
Perfluorobutanoic acid1,3,4 PFBA 375-22-4 13C4-PFBA Perfluoropentanoic acid1,3,4 PFPeA 2706-90-3 13C5-PFPeA Perfluorohexanoic acid1,2,3,4 PFHxA 307-24-4 13C2-PFHxA Perfluoroheptanoic acid1,2,3,4 PFHpA 375-85-9 13C4-PFHpA Perfluorooctanoic acid1,2,3,4 PFOA 335-67-1 13C4-PFOA Perfluorononanoic acid1,2,3,4 PFNA 375-95-1 13C5-PFNA Perfluorodecanoic acid1,2,3,4 PFDA 335-76-2 13C2-PFDA Perfluoroundecanoic acid1,2,3,4 PFUnDA 2058-94-8 13C2-PFUndA Perfluorododecanoic acid1,2,3,4 PFDoA 307-55-1 13C2-PFDoA Perfluorotridecanoic acid2,3,4 PFTrDA 72629-94-8 13C2-PFDoA Perfluorotetradecanoic acid2,3,4 PFTeDA 376-06-7 13C2-PFTeDA Perfluoro-n-hexadecanoic acid PFHxDA 67905-19-5 13C2-PFHxDA Perfluoro-n-octadecanoic acid PFODA 16517-11-6 13C2-PFDoA
Perfluorinated sulfonic acids (PFSAs)
Perfluoro-1-butanesulfonic acid1,2,3,4 PFBS 375-73-5 13C3- PFBS Perfluoro-1-pentanesulfonic acid1,3 PFPeS 2706-91-4 13C3-PFHxS
Or 13C3-PFBS
Perfluoro-1 -hexanesulfonic acid1,2,3,4 PFHxS 355-46-4 18O2-PFHxS
or 13C3-PFHxS
Perfluoro-1-heptanesulfonic acid1,3 PFHpS 375-92-8 13C4-PFHpA Perfluoro-1-octanesulfonic acid1,2,3,4 PFOS 1763-23-1 13C4-PFOS Perfluoro-1-nonanesulfonic acid3 PFNS 68259-12-1 13C4-PFOS Perfluoro-1-decanesulfonic acid3 PFDS 335-77-3 13C4-PFOS Perfluorododecane sulfonate PFDoS 79780-39-5 13C4-PFOS
Perfluorinated sulfonamides (FOSAs) Perfluoro-1-octanesulfonamide3,5 FOSA 754-91-6 13C8-FOSA
N-Methylperfluorooctanesulfonamide 5 MeFOSA 31506-32-8 d3-MeFOSA
N-ethylperfluorooctanesulfonamide 5 EtFOSA 4151-50-2 d5-EtFOSA
Perfluorinated sulfonamide ethanols (FOSEs)
2-(N-methylperfluoro-1-octanesulfonamido)-ethanol 5 N-MeFOSE 24448-09-7 d7-N-
MeFOSE
2-(N-ethylperfluoro-1-octanesulfonamido)-ethanol 5 N-EtFOSE 1691-99-2 d9-N-EtFOSE
Perfluorinated sulfonamidoacetic acids (FOSAAs)
N-methyl perfluorooctanesulfonamidoacetic acid2,3 MeFOSAA 2355-31-9 d3-MeFOSAA N-ethyl perfluorooctanesulfonamidoacetic acid2,3 EtFOSAA 2991-50-6 d5-EtFOSAA
Revision 0 (1/13/2021)

Fluorotelomer sulfonates (FTS)
1H,1H,2H,2H-Perfluorohexane sulfonic acid1,3 4:2 FTS 757124-72-4 M2-4:2 FTS 1H,1H,2H,2H -Perfluorooctane sulfonic acid1,3 6:2 FTS 27619-97-2 M2-6:2 FTS 1H,1H,2H,2H -Perfluorodecane sulfonic acid1,3 8:2 FTS 39108-34-4 M2-8:2 FTS 1H,1H,2H,2H-perfluorododecane sulfonate (10:2) 10:2 FTS 120226-60-0 M2-10:2 FTS
Fluorinated Replacement Chemicals
4,8-Dioxa-3H-perfluorononanoic acid ADONA1 919005-14-4 13C4-PFOS
Hexafluoropropylene Oxide Dimer Acid HFPO-DA
(GenX)1
13252-13-6 13C3-HFPO-DA
9-Chlorohexadecafluoro-3-oxanonane-1-sulfonic acid 9Cl-PF3ONS
(F-53B Major)1
756426-58-1 13C4-PFOS
11-Chloroeicosafluoro-3-oxaundecane-1-sulfonic acid
OR
11-Chloroeicosafluoro-3-oxaundecane-1-sulfonatea
11Cl-PF3OUdS
(F-53B Minor)1
763051-92-9
83329-89-9
13C4-PFOS
Additional Targets
Nonafluoro-3,6-dioxaheptanoic acid1,5 NFDHA 151772-58-6 13C5-PFHxA
Perfluoro(2-ethoxyethane)sulfonic acid1,5 PFEESA 113507-82-7 13C3-PFBS
Sodium perfluoro-1-dodecanesulfonate5 PFDoS 1260224-54-1 13C4-PFOS
Perfluoro-4-methoxybutanoic acid1,5 PFMBA 863090-89-5 13C5-PFPeA
Perfluoro-3-methoxypropanoic acid1,5 PFMPA 377-73-1 13C4-PFBA
Decafluoro-4-(pentafluoroethyl)cyclohexanesulfonate)4 PFecHS 67584-42-3 18O2-PFHxS
2H-perfluoro-2-decenoic acid4 8:2 FTUCA or
FOUEA
70887-84-2 13C2-FOUEA
2-perfluorodecyl ethanoic acid4 10:2 FDEA 53826-13-4 13C2-FDEA
2-perfluorooctyl ethanoic acid4 8:2 FTA or FOEA 27854-31-5 13C2-FOEA
2H-perfluoro-2-octenoic acid4 6:2 FHUEA 70887-88-6 13C2-FHUEA
2-perfluorohexyl ethanoic acid4 6:2FTCA or 6:2
FHEA
53826-12-3 13C2-FHEA
3:3 Fluorotelomer carboxylic acid 5 3:3 FTCA 356-02-5 13C2-FHEA
5:3 Fluorotelomer carboxylic acid 5 5:3 FTCA 914637-49-3 13C2-FHEA
7:3 Fluorotelomer carboxylic acid or 3-perfluoropheptyl
propanoic acid4, 5
7:3 FTCA or
FHpPA 812-70-4 13C2-FOEA
a Some PFAS are commercially available as ammonium, sodium, and potassium salts. This method measures all
forms of the analytes as anions while the identity of the counterion is inconsequential. Analytes may be purchased as
acids or as any of the corresponding salts b Chemical Abstract Service. 1 Compound targeted in EPA Method 533 2 Compound targeted in EPA Method 537.1 3 Compound targeted in EPA Method 8327 4 Compound targeted in ASTM Method D7968 5 Compound targeted in DoD Isotope Dilution Method
Revision 0 (1/13/2021)

Table 45-2 MS/MS Conditions and Characteristic Ions
Analyte Precursor
Ion (m/z)
Primary
Product Ion
(m/z)
Secondary
Product Ion
(m/z)
PFBA 213 169 13C3-PFBA 216 172 13C4-PFBA 217 172
PFPeA 263 219 13C5-PFPeA 268 223
PFHxA 313 269 119 13C5-PFHxA 318 273
PFHpA 363 319 169 13C4-PFHpA 367 322
PFOA 413 369 169 13C2-PFOA 415 370 13C8-PFOA 421 376
PFNA 463 419 169 13C9-PFNA 472 427
PFDA 513 469 169 13C6-PFDA 519 474
PFUnA 563 519 169 13C7-PFUnA 570 525
PFDoA 613 569 169 13C2-PFDoA 615 570
PFTrDA 663 619 169
PFTeDA 713 169 219
PFHxDA 813 769 169
PFODA 913 869 169
PFBS 299 80 99 13C3-PFBS 302 80 83
PFPeS 349 80 99
PFHxS 399 80 99 13C3-PFHxS 402 80
PFHpS 449 80 99
PFOS 499 80 99 13C4-PFOS 503 80 13C8-PFOS 507 80
PFNS 549 80 99
PFDS 599 80 99
PFDoS 699 80 99
FOSA 498 78
MeFOSA 512 169
EtFOSA 526 169
N-MeFOSE 616 59
N-EtFOSE 630 59
MeFOSAA 570 419 512
EtFOSAA 584 419 526
4:2FTS 327 307
Revision 0 (1/13/2021)

13C2-4:2FTS 329 309 81
6:2FTS 427 407 13C2-6:2FTS 429 409 81
8:2FTS 527 507 13C2-8:2FTS 529 509 81
10:2FTS 627 607 80
ADONA 377 251
HFPO-DA 285 169 13C3-HFPO-DA 287 169
9Cl-PF3ONS 531 351
11Cl-PF3OUdS 631 451
NFDHA 295 201
PFEESA 315 135
PFDoS 699 80 99
PFMBA 279 85
PFMPA 229 85
PFecHS 461 381 99
8:2 FTUCA or
FOUEA
457 393
10:2 FDEA 577 493
8:2 FTA or
FOEA
477 393
6:2 FHUEA 357 293
6:2FTCA or 6:2
FHEA
377 243
3:3 FTCA 241 177 117
5:3 FTCA 341 237 217
7:3 FTCA or
FHpPA
441 337 317
Revision 0 (1/13/2021)
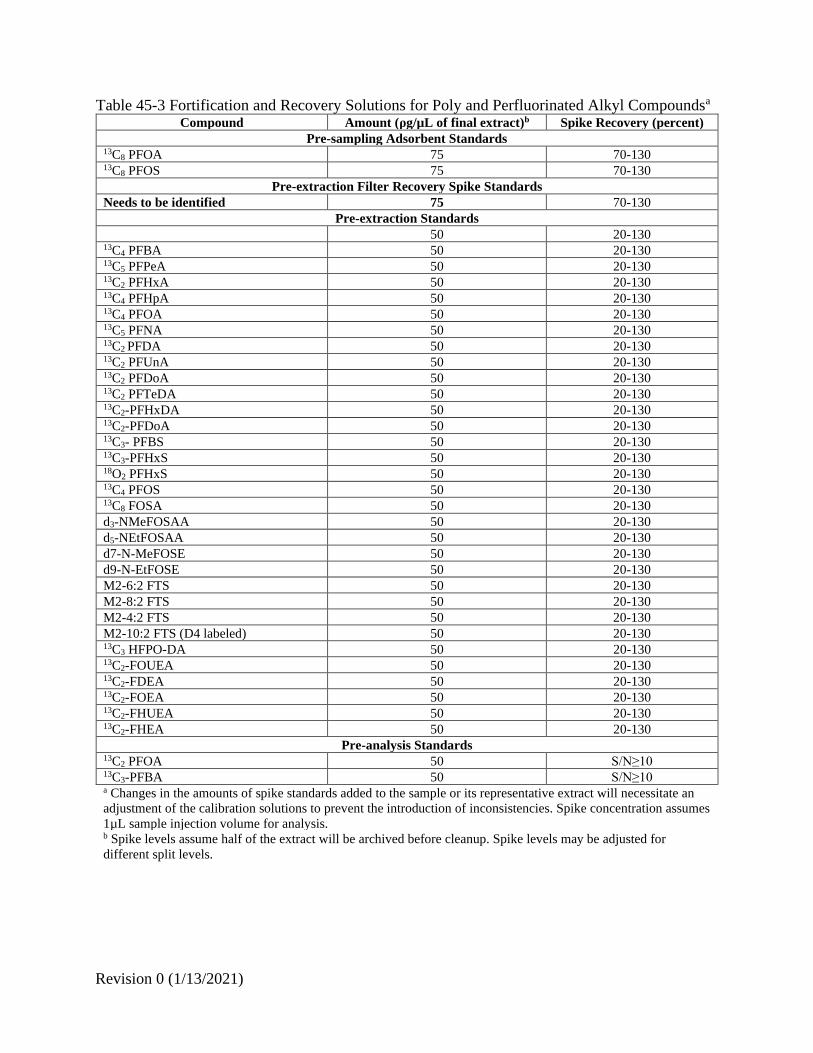
Table 45-3 Fortification and Recovery Solutions for Poly and Perfluorinated Alkyl Compoundsa
Compound Amount (ρg/µL of final extract)b Spike Recovery (percent)
Pre-sampling Adsorbent Standards 13C8 PFOA 75 70-130 13C8 PFOS 75 70-130
Pre-extraction Filter Recovery Spike Standards
Needs to be identified 75 70-130
Pre-extraction Standards
50 20-130 13C4 PFBA 50 20-130 13C5 PFPeA 50 20-130 13C2 PFHxA 50 20-130 13C4 PFHpA 50 20-130 13C4 PFOA 50 20-130 13C5 PFNA 50 20-130 13C2 PFDA 50 20-130 13C2 PFUnA 50 20-130 13C2 PFDoA 50 20-130 13C2 PFTeDA 50 20-130 13C2-PFHxDA 50 20-130 13C2-PFDoA 50 20-130 13C3- PFBS 50 20-130 13C3-PFHxS 50 20-130 18O2 PFHxS 50 20-130 13C4 PFOS 50 20-130 13C8 FOSA 50 20-130
d3-NMeFOSAA 50 20-130
d5-NEtFOSAA 50 20-130
d7-N-MeFOSE 50 20-130
d9-N-EtFOSE 50 20-130
M2-6:2 FTS 50 20-130
M2-8:2 FTS 50 20-130
M2-4:2 FTS 50 20-130
M2-10:2 FTS (D4 labeled) 50 20-130 13C3 HFPO-DA 50 20-130 13C2-FOUEA 50 20-130 13C2-FDEA 50 20-130 13C2-FOEA 50 20-130 13C2-FHUEA 50 20-130 13C2-FHEA 50 20-130
Pre-analysis Standards 13C2 PFOA 50 S/N≥10 13C3-PFBA 50 S/N≥10 a Changes in the amounts of spike standards added to the sample or its representative extract will necessitate an
adjustment of the calibration solutions to prevent the introduction of inconsistencies. Spike concentration assumes
1µL sample injection volume for analysis. b Spike levels assume half of the extract will be archived before cleanup. Spike levels may be adjusted for
different split levels.
Revision 0 (1/13/2021)

Table 45- 4 Sample Storage Conditionsa and Laboratory Hold Times
Stage Type Storage Conditions Laboratory Holding
time
Field collection
Particulate Filter
≤ 20 ± 3 °C, 68 ± 5 °F
Store cool but NOT on
ice N/A
All other Field
samples Store on Ice (4°C)
Particulate Filter Ship unrefrigerated.
N/A Shipping/Transport All other Field
samples
Ship on Ice (4°C).
Follow procedures in
ASTM D6911-15
Laboratory Storage: Before
Extraction
All Sampling train
Rinses and Particulate
Filter Samples
≤6 °C (43°F)
≤ 28 days from date of
collection; Extract
within 28 days of
collection
Adsorbent samples
(XAD-2) ≤6 °C (43°F)
≤1 year from received
date; Extract within 28
days of collection
Laboratory Storage: After
Extraction (archived)
All archived extracted
samples at ≤6 °C (43°F) ≤ 1 year
a All samples must be stored in the dark after collection.
Revision 0 (1/13/2021)

Table 45-5. General QA/QC Requirements for OTM-45
Section Requirement Specification and
Frequency
Acceptance
Criteria
Consequences and
Corrective Actions
Sampling Quality Controls (Section 9.1)
9.1.2 Field Sampling
Media Blank
(FSMB)
Represents the
sampling media
and reagents
associated with
field sample
collection. One per each test series.
Levels should be ≤
compound MDL
Analysis of the FSMBs should
be compared to the
background level criteria in
Section 9.2.2.1. Failure to
meet these levels does not
invalidate the sampling run. If
> MDL, flag data. The
measured target compound
mass in each fraction will need
to be reported and used to
interpret sample assess impact
on results.
.
9.1.3 Sample Train
Proof Blank
(STPB)
At least one STPB
per each test
series.
Levels ≤10% of actual samples
If >10%, flag data and assess
impact on results
9.1.4 Sample Train
Field Blank
(STFB)
At least one STPB
per each test series
Levels ≤10% of actual samples
If >10%, flag data and assess
impact on results
9.1.5 Pre-Sampling
Standards
Added to each
XAD-2 adsorbent
cartridge prior to
sampling.
Indicates sample
collection and
recovery
efficiency.
≥70% and ≤130%
recovery of all spike
standards as the sum
of the recovery of
sampling train
fractions 2 and 3.
Recoveries below the
acceptable range of 70-130%
for the pre-sampling standard
spikes may require a root
cause evaluation. If the
recovery of all the pre-
sampling standard adsorbent
spikes is below 70%, but,
greater than 50%, the results
have not met the recoveries
experienced during method
development but may still be
acceptable. Flag recoveries
that are between 50 and 70%
and describe their potential
impact on results. If the pre-
sampling standard recoveries
are less than 50%, the data for
that train are not considered
valid.
Revision 0 (1/13/2021)

9.1.6 Secondary
XAD-2
Breakthrough
Determines the
relative
breakthrough (BT)
of each target
through the OTM-
45 train.
≤30% BT for each target compound.
.
For any BT ≥ 10%, add the
fraction 4 mass to the total
sample mass for emissions
calculations
If >30%, flag data and assess
impact on results. Failure may
invalidate reported results and
require repeat sampling.
Ongoing Quality Control Requirements (Section 9.2.2)
9.2.2.1.1 Sampling Media
Background
Level Checks
Confirm sample
media background
before use for
sampling
Levels should be ≤ compound MDL
If >MDL, further clean
sampling media until levels are
≤ MDL
9.2.2.1.2 Laboratory
Sample Media
Blank (LSMB)
Analyze a LSMB
for each sampling
medium and
reagent with each
extraction batch
and
≥1 LSMB when method analytes
exceed the
calibration range.
Levels should be ≤ compound MDL
If >MDL, flag data and assess
impact on results Resolve
source of contamination before
proceeding to additional
analyses.
9.2.2.3 Calibration
Acceptance
Criteria
Evaluate the initial
concentration of
each analyte as an
unknown against
its regression
equation (Section
10.4)
Between 90-110%
of each analyte true
value.
Reanalyze the calibration
standards, restrict the range of
calibration, or perform
instrument maintenance. If
failure is due to contamination
or standard degradation,
prepare fresh calibration
standards and repeat initial
calibration
9.2.2.3.1 Continuing
Calibration
Check (CCC)
Analyze CCC at
the beginning of
each analysis
batch, after every
tenth field sample,
and at the end of
the analysis batch.
Beginning CCC
must be ≤ MDL for each analyte.
Must be within 70-
130% of true value
If the CCC fails because
concentration is >130% (150%
for low-level CCC) and field
sample extracts show no
concentrations above the MDL
for that analyte, non-detects
can be reported without re-
analysis
See Section 10.6 for
Corrective Action.
Revision 0 (1/13/2021)

9.2.2.4 Laboratory
Fortified Media
Blanks (LFMB)
Duplicate low and
high LFMBs are
required with each
extraction batch
for each fraction.
Analytes fortified
near or at the lowest
calibration point
must be within 50-
150% of the true
value.
Analytes fortified at
all other
concentrations must
be within 70–130%
of the true value.
If the LFMB results do not
meet these criteria, the
laboratory must investigate the
cause for this failure, report
their findings and corrective
action.
Then report all data for the
problem analytes with a note
that LFMB accuracy criteria
were not met.
9.2.2.5 Pre-Analysis
Standard(s)
Areas
The analysist must
monitor the peak
areas of the pre-
analysis standards
in all injections of
the analysis batch.
The pre-analysis
standards (as
indicated by peak
area) in any
chromatographic
run must be within
50-150% of the
average area
measured during in
the initial
calibration.
If criteria is not met, reanalyze
the extract in a subsequent
analysis batch. If the pre-
analysis standard(s) area fails
to meet the acceptance criteria
in the repeat analysis, or if
multiple samples in a batch fail
to meet the pre-analysis spike
criteria, perform corrective
action and reanalyze the failed
samples extract.
9.2.2.6 Pre-Extraction
Isotope Dilution
For each sample
fraction, calculate
the concentration
and percent
recovery of each
isotope dilution
analogue in field
and QC samples
using the average
area in the initial
calibration and
internal standard
Percent recovery
must be within a
range of 20-130%
Recoveries below the
acceptable range for pre-
extraction spikes are an
indication that sample
preparation procedures did not
adequately address sample and
or sample matrix processing to
recover native target
compounds. Compounds that
fail this criterion should be
flagged and reported as not
quantitative because of QC
failure. If this failure involves
target compounds that are
critical to the test objectives,
this is a failure that requires
root cause investigation and
may require a repeat field
sampling effort.
9.2.2.78 Calibration
Verification
using Quality
Control
Standards
(QCS)
Perform a
calibration
verification during
the IDC and at
least quarterly
after
Results must be
within 70-130% pf
the true value
If accuracy fails, prepare fresh
standard dilutions and repeat
the calibration verification
9.3 Method
Modification
QC
Requirements
Perform after
modifying
chromatographic
and MS/MS
conditions
Must pass IDC
criteria. Must
evaluate and
document method
performance in an
archived field
sample
Repeat until IDC is passed.
Revision 0 (1/13/2021)
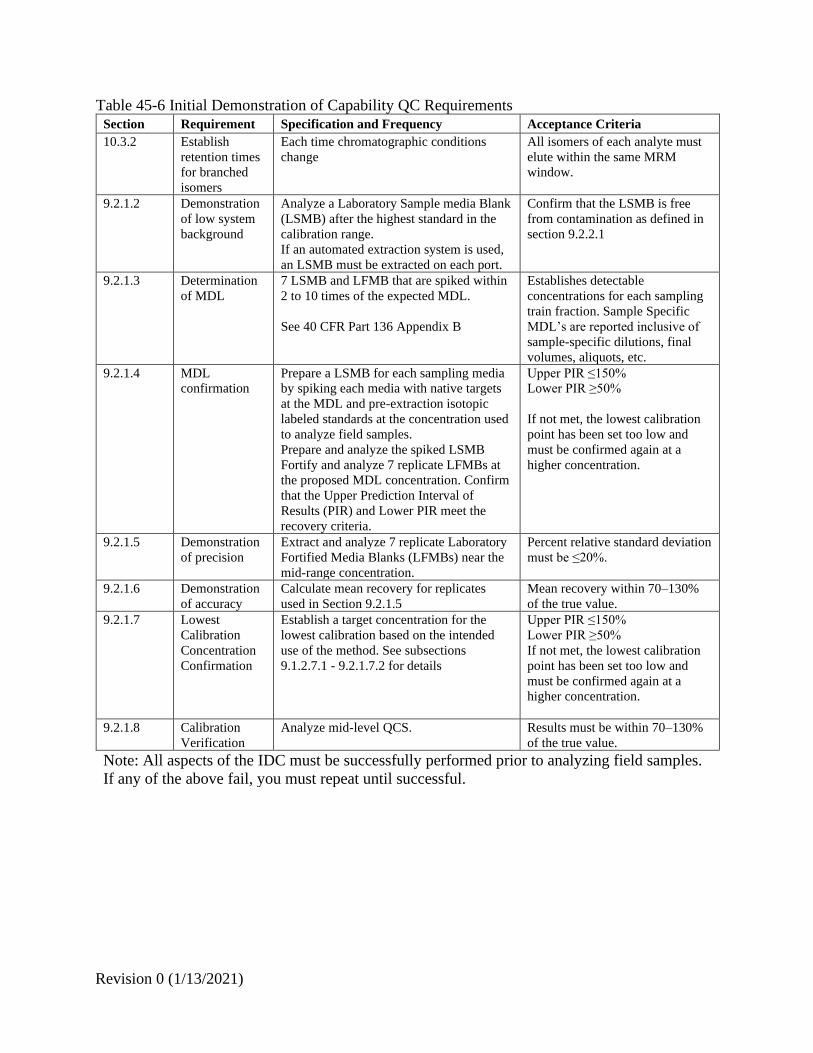
Table 45-6 Initial Demonstration of Capability QC Requirements Section Requirement Specification and Frequency Acceptance Criteria
10.3.2 Establish
retention times
for branched
isomers
Each time chromatographic conditions
change
All isomers of each analyte must
elute within the same MRM
window.
9.2.1.2 Demonstration
of low system
background
Analyze a Laboratory Sample media Blank
(LSMB) after the highest standard in the
calibration range.
If an automated extraction system is used,
an LSMB must be extracted on each port.
Confirm that the LSMB is free
from contamination as defined in
section 9.2.2.1
9.2.1.3 Determination
of MDL
7 LSMB and LFMB that are spiked within
2 to 10 times of the expected MDL.
See 40 CFR Part 136 Appendix B
Establishes detectable
concentrations for each sampling
train fraction. Sample Specific
MDL’s are reported inclusive of sample-specific dilutions, final
volumes, aliquots, etc.
9.2.1.4 MDL
confirmation
Prepare a LSMB for each sampling media
by spiking each media with native targets
at the MDL and pre-extraction isotopic
labeled standards at the concentration used
to analyze field samples.
Prepare and analyze the spiked LSMB
Fortify and analyze 7 replicate LFMBs at
the proposed MDL concentration. Confirm
that the Upper Prediction Interval of
Results (PIR) and Lower PIR meet the
recovery criteria.
Upper PIR ≤150%
Lower PIR ≥50%
If not met, the lowest calibration
point has been set too low and
must be confirmed again at a
higher concentration.
9.2.1.5 Demonstration
of precision
Extract and analyze 7 replicate Laboratory
Fortified Media Blanks (LFMBs) near the
mid-range concentration.
Percent relative standard deviation
must be ≤20%.
9.2.1.6 Demonstration
of accuracy
Calculate mean recovery for replicates
used in Section 9.2.1.5
Mean recovery within 70–130%
of the true value.
9.2.1.7 Lowest
Calibration
Concentration
Confirmation
Establish a target concentration for the
lowest calibration based on the intended
use of the method. See subsections
9.1.2.7.1 - 9.2.1.7.2 for details
Upper PIR ≤150%
Lower PIR ≥50%
If not met, the lowest calibration
point has been set too low and
must be confirmed again at a
higher concentration.
9.2.1.8 Calibration
Verification
Analyze mid-level QCS. Results must be within 70–130%
of the true value.
Note: All aspects of the IDC must be successfully performed prior to analyzing field samples.
If any of the above fail, you must repeat until successful.
Revision 0 (1/13/2021)

Table 45-7 Example HPLC Method Conditions
Time (min) % 20 mM Ammonium
acetate
% Methanol
Initial 95.0 5.0
0.5 95.0 5.0
3.0 60.0 40.0
16.0 20.0 80.0
18.0 20.0 80.0
20.0 5.0 95.0
22.0 5.0 95.0
25.0 95.0 5.0
35.0 95.0 5.0
Revision 0 (1/13/2021)

Table 45-8 Recommended Initial Calibration (ICAL) (pg/uL) Compound CS-1 CS-2 CS-3 CS-4 CS-5 CS-6 CS-7
Perfluoroalkylcarboxylic acids (PFCAs)
PFBA 0.25 0.50 1 2.5 5 20 100
PFPeA 0.25 0.50 1 2.5 5 20 100
PFHxA 0.25 0.50 1 2.5 5 20 100
PFHpA 0.25 0.50 1 2.5 5 20 100
PFOA 0.25 0.50 1 2.5 5 20 100
PFNA 0.25 0.50 1 2.5 5 20 100
PFDA 0.25 0.50 1 2.5 5 20 100
PFUnDA 0.25 0.50 1 2.5 5 20 100
PFDoA 0.25 0.50 1 2.5 5 20 100
PFTrDA 0.25 0.50 1 2.5 5 20 100
PFTeDA 0.25 0.50 1 2.5 5 20 100
PFHxDA 0.25 0.50 1 2.5 5 20 100
PFODA 0.25 0.50 1 2.5 5 20 100
Perfluorinated sulfonic acids (PFSAs)
PFBS 0.25 0.50 1 2.5 5 20 100
PFPeS 0.25 0.50 1 2.5 5 20 100
PFHxS 0.25 0.50 1 2.5 5 20 100
PFHpA 0.25 0.50 1 2.5 5 20 100
PFOS 0.25 0.50 1 2.5 5 20 100
PFNS 0.25 0.50 1 2.5 5 20 100
PFDS 0.25 0.50 1 2.5 5 20 100
PFDoS 0.25 0.50 1 2.5 5 20 100
Perfluorinated sulfonamides (FOSAs)
FOSA 0.25 0.50 1 2.5 5 20 100
EtFOSA 0.25 0.50 1 2.5 5 20 100
MeFOSA 0.25 0.50 1 2.5 5 20 100
Perfluorinated sulfonamide ethanols (FOSEs)
MeFOSE 0.25 0.50 1 2.5 5 20 100
EtFOSE 0.25 0.50 1 2.5 5 20 100
Perfluorinated sulfonamidoacetic acids (FOSAAs)
EtFOSAA 0.25 0.50 1 2.5 5 20 100
MeFOSAA 0.25 0.50 1 2.5 5 20 100
Fluorotelomer sulfonates (FTS)
4:2 FTS 0.25 0.50 1 2.5 5 20 100
6:2 FTS 0.25 0.50 1 2.5 5 20 100
8:2 FTS 0.25 0.50 1 2.5 5 20 100
10:2 FTS 0.25 0.50 1 2.5 5 20 100
Fluorinated Replacement Chemicals
ADONA1 0.25 0.50 1 2.5 5 20 100
HFPO-DA (GenX)1 0.25 0.50 1 2.5 5 20 100 9Cl-PF3ONS (F-53B Major)1 0.25 0.50 1 2.5 5 20 100
F-53B Minor
(11Cl-PF3OUdS)1
0.25 0.50 1 2.5 5 20 100
F5B minor
(11Cl-PF3OUdS)
0.25 0.50 1 2.5 5 20 100
Additional Targets
NFDHA 0.25 0.50 1 2.5 5 20 100
PFEESA 0.25 0.50 1 2.5 5 20 100
PFDoS 0.25 0.50 1 2.5 5 20 100
PFMBA 0.25 0.50 1 2.5 5 20 100
Revision 0 (1/13/2021)

PFMPA 0.25 0.50 1 2.5 5 20 100
PFecHS 0.25 0.50 1 2.5 5 20 100
8:2 FTUCA or FOUEA 0.25 0.50 1 2.5 5 20 100
10:2 FDEA 0.25 0.50 1 2.5 5 20 100
8:2 FTA or FOEA 0.25 0.50 1 2.5 5 20 100
6:2 FHUEA 0.25 0.50 1 2.5 5 20 100
6:2FTCA or 6:2 FHEA 0.25 0.50 1 2.5 5 20 100
3:3 FTCA 0.25 0.50 1 2.5 5 20 100
5:3 FTCA 0.25 0.50 1 2.5 5 20 100
7:3 FTCA Or FHpPA 0.25 0.50 1 2.5 5 20 100
Revision 0 (1/13/2021)

Table 45-8 Isotopic Dilution Pairs Initial Calibration (ICAL) Concentration (pg/uL) Compound CS-1 CS-2 CS-3 CS-4 CS-5 CS-6 CS-7
Perfluoroalkylcarboxylic acids (PFCAs) 13C4-PFBA 2.5 2.5 2.5 2.5 2.5 2.5 2.5 13C5-PFPeA 2.5 2.5 2.5 2.5 2.5 2.5 2.5 13C2-PFHxA 2.5 2.5 2.5 2.5 2.5 2.5 2.5 13C4-PFHpA 2.5 2.5 2.5 2.5 2.5 2.5 2.5 13C4-PFOA 2.5 2.5 2.5 2.5 2.5 2.5 2.5 13C5-PFNA 2.5 2.5 2.5 2.5 2.5 2.5 2.5 13C2-PFDA 2.5 2.5 2.5 2.5 2.5 2.5 2.5 13C2-PFUdA 2.5 2.5 2.5 2.5 2.5 2.5 2.5 13C2-PFDoA 2.5 2.5 2.5 2.5 2.5 2.5 2.5 13C2-PFTeDA 2.5 2.5 2.5 2.5 2.5 2.5 2.5
Perfluorinated sulfonic acids (PFSAs) 13C3- PFBS 2.5 2.5 2.5 2.5 2.5 2.5 2.5 13C3-PFHxS (533) Or 13C3-
PFBS
2.5 2.5 2.5 2.5 2.5 2.5 2.5
18O2-PFHxS 2.5 2.5 2.5 2.5 2.5 2.5 2.5 13C
4-PFHpA 2.5 2.5 2.5 2.5 2.5 2.5 2.5 13C4-PFOS 2.5 2.5 2.5 2.5 2.5 2.5 2.5
Perfluorinated sulfonamides (FOSAs) 13C8-FOSA 2.5 2.5 2.5 2.5 2.5 2.5 2.5
d5-EtFOSA 2.5 2.5 2.5 2.5 2.5 2.5 2.5
d3-MeFOSA 2.5 2.5 2.5 2.5 2.5 2.5 2.5
Perfluorinated sulfonamide ethanols (FOSEs)
d7-N-MeFOSE 2.5 2.5 2.5 2.5 2.5 2.5 2.5
d9-N-EtFOSE 2.5 2.5 2.5 2.5 2.5 2.5 2.5
Perfluorinated sulfonamidoacetic acids (FOSAAs)
d5-EtFOSAA 2.5 2.5 2.5 2.5 2.5 2.5 2.5
d3-MeFOSAA 2.5 2.5 2.5 2.5 2.5 2.5 2.5
Fluorotelomer sulfonates (FTS)
M2-4:2 FTS 2.5 2.5 2.5 2.5 2.5 2.5 2.5
M2-6:2 FTS 2.5 2.5 2.5 2.5 2.5 2.5 2.5
M2-8:2 FTS 2.5 2.5 2.5 2.5 2.5 2.5 2.5
2.5 2.5 2.5 2.5 2.5 2.5 2.5
Fluorinated Replacement Chemicals 13C4-PFOS 2.5 2.5 2.5 2.5 2.5 2.5 2.5
13C3-HFPO-DA 2.5 2.5 2.5 2.5 2.5 2.5 2.5 13C4-PFOS 2.5 2.5 2.5 2.5 2.5 2.5 2.5 13C4-PFOS 2.5 2.5 2.5 2.5 2.5 2.5 2.5
2.5 2.5 2.5 2.5 2.5 2.5 2.5
Pre-analysis Spiking Standard
13C2-PFOA 2.5 2.5 2.5 2.5 2.5 2.5 2.5
Revision 0 (1/13/2021)

Table 45-8 Continued Isotopic Dilution Pairs Initial Calibration (ICAL) Concentration (pg/uL)
13C5-PFHxA 2.5 2.5 2.5 2.5 2.5 2.5 2.5 13C3-PFBS 2.5 2.5 2.5 2.5 2.5 2.5 2.5 13C4-PFOS 2.5 2.5 2.5 2.5 2.5 2.5 2.5 13C5-PFPeA 2.5 2.5 2.5 2.5 2.5 2.5 2.5 13C4-PFBA 2.5 2.5 2.5 2.5 2.5 2.5 2.5
13C2-FOUEA 2.5 2.5 2.5 2.5 2.5 2.5 2.5 13C2-FDEA 2.5 2.5 2.5 2.5 2.5 2.5 2.5 13C2-FOEA 2.5 2.5 2.5 2.5 2.5 2.5 2.5 13C2-FHUEA 2.5 2.5 2.5 2.5 2.5 2.5 2.5 13C2-FHEA 2.5 2.5 2.5 2.5 2.5 2.5 2.5
Revision 0 (1/13/2021)

Table 45-9 Pre-Sampling Standard Recoveries
Percent (%) Recovery
Pre-Sampling Standard Avg RSD Max Min
13C8 PFOA 100.3 9.2% 111.0 89.0
13C8 PFOS 73.0 18.6% 85.0 58.0
Table 45-10 Pre-Extraction Standard Recoveries
Fraction 1 (Filter)
Percent (%) Recovery
Fraction 2 (XAD-2)
Percent (%) Recovery
Fraction 3 (Impingers)
Percent (%) Recovery
Pre-Extraction
Standard Avg RSD Max Min Avg RSD Max Min Avg RSD Max Min
13C2 PFDA 98 6.8% 107 92 72 16.9% 83 55 112 8.2% 124 102
13C2 PFDoA 98 5.3% 102 90 84 25.7% 105 54 114 12.6% 132 98
13C2 PFHxA 98 7.1% 108 92 85 7.0% 93 80 106 7.4% 115 97
13C2 PFTeDA 93 9.9% 104 82 75 31.8% 107 50 113 12.2% 127 94
13C2 PFUnA 101 7.9% 110 91 80 21.4% 94 55 112 9.7% 126 100
13C3 HFPO-DA 79 6.3% 84 74 72 12.0% 79 60 104 11.3% 121 96
13C4 PFBA 94 6.7% 103 89 56 12.5% 65 49 102 8.4% 114 94
13C4 PFHpA 100 4.8% 106 95 76 5.6% 81 71 111 9.4% 124 99
13C4 PFOA 99 6.9% 108 92 88 10.3% 99 78 108 10.0% 120 94
13C4 PFOS 92 4.7% 98 89 82 19.2% 94 59 108 9.1% 120 96
13C5 PFNA 99 6.1% 106 92 81 14.5% 93 65 114 10.0% 128 100
13C5 PFPeA 93 6.9% 101 86 64 6.5% 68 60 101 7.5% 111 93
13C8 FOSA 89 8.7% 99 80 55 48.0% 89 25 108 8.1% 120 99
18O2 PFHxS 105 4.1% 111 101 81 9.8% 86 69 119 10.4% 135 105
d3-NMeFOSAA 83 13.1% 93 68 77 25.7% 100 52 94 9.4% 106 85
d5-NEtFOSAA 104 8.2% 111 93 84 28.6% 108 51 97 16.1% 118 82
M2-4:2 FTS 110 13.8% 129 92 156 11.8% 174 131 110 21.1% 131 80
M2-6:2 FTS 118 18.8% 144 91 143 25.6% 186 97 130 28.4% 176 86
M2-8:2 FTS 121 29.3% 167 82 89 25.0% 105 57 113 17.5% 135 87
Revision 0 (1/13/2021)

Table 45-11. In-Stack Detection Limits
Analyte Description
Perfluorobutanoic acid (PFBA)
Perfluoropentanoic acid (PFPeA)
Perfluorohexanoic acid (PFHxA)
Perfluoroheptanoic acid (PFHpA)
Perfluorooctanoic acid (PFOA)
Perfluorononanoic acid (PFNA)
Perfluorodecanoic acid (PFDA)
Perfluoroundecanoic acid (PFUnA)
Perfluorododecanoic acid (PFDoA)
Perfluorotridecanoic acid (PFTriA)
Perfluorotetradecanoic acid (PFTeA)
Perfluorobutanesulfonic acid (PFBS)
Perfluoropentanesulfonic acid (PFPeS)
Perfluorohexanesulfonic acid (PFHxS)
Perfluoroheptanesulfonic Acid (PFHpS)
Perfluorooctanesulfonic acid (PFOS)
Perfluorononanesulfonic acid (PFNS)
Perfluorodecanesulfonic acid (PFDS)
Perfluorooctanesulfonamide (FOSA)
N-methylperfluorooctanesulfonamidoacetic acid
(NMeFOSAA)
N-ethylperfluorooctanesulfonamidoacetic acid
(NEtFOSAA)
4:2 FTS
6:2 FTS
8:2 FTS
4,8-Dioxa-3H-perfluorononanoic acid (ADONA)
HFPO-DA (GenX)
F-53B Major
F-53B Minor
RL: Reporting Limit MDL: Method Detection Limit PPQ: Parts Per Quadrillion
CAS Number
375-22-4 12.60 6.25 4.20 2.08 471.75 234.00
2706-90-3 1.80 0.59 0.60 0.20 54.63 17.88
307-24-4 2.40 0.92 0.80 0.31 61.24 23.42
375-85-9 1.70 0.62 0.57 0.21 37.42 13.63
335-67-1 2.50 1.28 0.83 0.43 48.38 24.69
375-95-1 1.50 0.46 0.50 0.15 25.90 7.87
335-76-2 1.50 0.39 0.50 0.13 23.38 6.02
2058-94-8 2.00 0.99 0.67 0.33 28.41 14.11
307-55-1 1.50 0.36 0.50 0.12 19.57 4.67
72629-94-8 1.50 0.35 0.50 0.12 18.10 4.20
376-06-7 1.50 0.58 0.50 0.19 16.83 6.49
375-73-5 1.50 0.51 0.50 0.17 40.06 13.62
2706-91-4 1.50 0.43 0.50 0.14 34.33 9.82
355-46-4 1.70 0.82 0.57 0.27 34.05 16.50
375-92-8 1.50 0.25 0.50 0.08 26.71 4.52
1763-23-1 2.40 1.06 0.80 0.35 38.46 16.98
68259-12-1 1.50 0.42 0.50 0.14 21.85 6.16
335-77-3 1.50 0.51 0.50 0.17 20.03 6.86
754-91-6 2.00 0.82 0.67 0.27 32.11 13.23
2355-31-9 2.40 1.21 0.80 0.40 33.67 16.92
2991-50-6 2.40 1.18 0.80 0.39 32.86 16.14
757124-72-4 1.50 0.59 0.50 0.20 36.63 14.43
27619-97-2 2.00 0.87 0.67 0.29 37.43 16.21
39108-34-4 1.70 0.81 0.57 0.27 25.79 12.23
919005-14-4 1.60 0.41 0.53 0.14 33.91 8.61
13252-13-6 16.60 8.30 5.53 2.77 403.05 201.62
756426-58-1 1.50 0.51 0.50 0.17 22.57 7.61
763051-92-9 1.50 0.55 0.50 0.18 19.00 6.93
QRL
(ng/train)
MDL
(ng/train)
QRL
(ng/m3)
MDL
(ng/m3)
QRL MDL
(PPQ) (PPQ)
Revision 0 (1/13/2021)

Figure OTM-45-1. Sampling Train
Revision 0 (1/13/2021)

Condenser
Flow
Silanized
Glass Wool
Water
Jaclket
Coarse
Glass
Frit
Figure OTM 45–2. Condenser and Adsorbent Module
Revision 0 (1/13/2021)

Figure OTM 45–3. Sample Preparation Flow Chart
Revision 0 (1/13/2021)
APPENDIX
PREPARATION OF XAD-2 ADSORBENT RESIN
1.0 Scope and Application
XAD-2® resin, as supplied by the original manufacturer, is impregnated with a bicarbonate
solution to inhibit microbial growth during storage. Remove both the salt solution and any residual
extractable chemicals used in the polymerization process before use. Prepare the resin by a series
of water and organic extractions, followed by careful drying.
2.0 Extraction
2.1 You may perform the extraction using a Soxhlet extractor or other apparatus that generates
resin meeting the requirements in Section 13.14 of OTM 45. Use an all-glass thimble containing
an extra-coarse frit for extraction of the resin. The frit is recessed 10-15 mm above a crenellated
ring at the bottom of the thimble to facilitate drainage. Because the resin floats on methylene
chloride, carefully retain the resin in the extractor cup with a glass wool plug and stainless-steel
screen. This process involves sequential extraction with the following recommended solvents in
the listed order.
• Water initial rinse: Place resin in a suitable container, soak for approximately 5 min with
Type II water, remove fine floating resin particles and discard the water. Fill with Type II
water a second time, let stand overnight, remove fine floating resin particles and discard
the water.
• Hot water: Extract with water for 8 hr.
• Methyl alcohol: Extract for 22 hr.
• Methylene chloride: Extract for 22 hr.
• 5% ammonium hydroxide in methanol: Extract for 22 hr.
Note: You may store the resin in a sealed glass container filled with 5% ammonium hydroxide in
methanol prior to the final extraction.
2.2 You may use alternative extraction procedures to clean large batches of resin. Any size
extractor may be constructed; the choice depends on the needs of the sampling programs. The
resin is held in a glass or stainless-steel cylinder between a pair of coarse and fine screens.
Spacers placed under the bottom screen allow for even distribution of clean solvent. Clean
solvent is circulated through the resin for extraction. A flow rate is maintained upward through
the resin to allow maximum solvent contact and prevent channeling.
2.2.1 Experience has shown that 1 mL/g of resin extracted is the minimum necessary to extract
and clean the resin. The aqueous rinse is critical to the subsequent organic rinses and may be
accomplished by simply flushing the canister with about 1 liter of distilled water for every 25 g
Revision 0 (1/13/2021)

of resin. A small pump may be useful for pumping the water through the canister. You should
perform the water extraction at the rate of about 20 to 40 mL/min.
2.2.2 All materials of construction are glass, PTFE, or stainless steel. Pumps, if used, should not
contain extractable materials.
3.0 Drying
3.1 Dry the adsorbent of extraction solvent before use. This section provides a recommended
procedure to dry adsorbent that is wet with solvent. However, you may use other procedures if
the cleanliness requirements in Sections 13.2 and 13.14 are met.
3.2 Drying Column. A simple column with suitable retainers, as shown in Figure A–2, will hold
all the XAD-2 from the extractor shown in Figure A–1 or the Soxhlet extractor, with sufficient
space for drying the bed while generating a minimum backpressure in the column.
3.3 Drying Procedure: Dry the adsorbent using clean inert gas. Liquid nitrogen from a standard
commercial liquid nitrogen cylinder has proven to be a reliable source of large volumes of gas
free from organic contaminants. You may use high-purity tank nitrogen to dry the resin.
However, you should pass the high-purity nitrogen through a bed of activated charcoal
approximately 150 mL in volume prior to entering the drying apparatus.
3.3.1 Connect the gas vent of a liquid nitrogen cylinder or the exit of the activated carbon
scrubber to the column by a length of precleaned copper tubing (e.g., 0.95 cm ID) coiled to pass
through a heat source. A convenient heat source is a water bath heated from a steam line. The
final nitrogen temperature should only be warm to the touch and not over 40 °C.
3.3.2 Allow the solvent to drain from the resin prior to placing the resin in the drying apparatus.
3.3.3 Flow nitrogen through the drying apparatus at a rate that does not fluidize or agitate the
resin. Continue the nitrogen flow until the residual solvent is removed.
Note: Experience has shown that about 500 g of resin may be dried overnight by consuming a
full 160-L cylinder of liquid nitrogen.
4.0 Quality Control Procedures
4.1 Report quality control results for the batch. Re-extract the batch if the residual extractable
organics fail the criteria in Section 9.
4.2 Residual Quality Check. If adsorbent resin is cleaned or recleaned by the laboratory, perform
a quality control check for residual PFAS. Analyze a portion of each batch of cleaned XAD-2 as
you would a laboratory sample matrix blank (LSMB) in OTM 45. If the adsorbent exceeds the
QC criteria the batch must be re-extracted with 4 % ammonium hydroxide in methanol, dried and
reanalyzed.
Revision 0 (1/13/2021)

Gas take off
Figure A–1. XAD-2 fluidized-bed drying apparatus
Revision 0 (1/13/2021)
Related Documents