Appendix B Conversion Technology Materials and Energy Balance Models

Welcome message from author
This document is posted to help you gain knowledge. Please leave a comment to let me know what you think about it! Share it to your friends and learn new things together.
Transcript

Appendix B
Conversion Technology Materials and Energy Balance Models

2
Conversion Technology Draft Final Report
Concentrated Technology Assessment Task 1.33A March 1, 2004

i
Table of Contents Conversion Technology Draft....................................................................................................................... 2 Final Report .................................................................................................................................................. 2 Table of Contents........................................................................................................................................... i Introduction................................................................................................................................................... 1 Design Basis.................................................................................................................................................. 1 ASPEN Plus® Implementation..................................................................................................................... 4
Components............................................................................................................................................ 4 Physical Property Option Sets ................................................................................................................ 4 Flowsheet................................................................................................................................................ 4
Material and Energy Balance Results ........................................................................................................... 5 Economic Analysis ..................................................................................................................................... 10
Capital Costs......................................................................................................................................... 10 Operating Costs .................................................................................................................................... 11
Summary and Conclusions ......................................................................................................................... 13 Abbreviations and Acronyms ..................................................................................................................... 15 Bibliography ............................................................................................................................................... 16

1
Introduction A preliminary material and energy balance has been conducted for the concentrated acid process. Initial capital and operating costs based on these balances have also been developed. The results are summarized below.
Design Basis The model was developed using ASPEN Plus®, a steady-state process simulation tool. The model is based on earlier work by NREL on the Arkenol process. The original model was based on Arkenol patent 5,782,982 and previous NREL analyses. The current model was designed based on the Masada patents 6,267,309 B1 and 6,419,828 B1 and discussions with Masada personnel1.
Comparing the patents, several significant differences between the processes are noted.
• Number of hydrolysis stages – Masada has a single hydrolysis step, whereas Arkenol has two hydrolysis stages.
• Focus on MSW – Masada has developed their technology specifically for MSW, whereas Arkenol has a more general feedstock emphasis.
• Sugar concentrating step – Masada has a sugar concentrating step using reverse osmosis prior to fermentation and Arkenol does not.
• Acid/sugar separation step – Arkenol uses a strongly acidic ion exchange column that retains the sugar and elutes the acid. Masada uses an exchange column with the reverse, which provides an acid stream with a higher concentration.
• Acid recycle scheme – Due to the above differences, the acid recycle scheme also differs.
Detailed information on the ultimate analysis for each fraction of the MSW was provided by RTI. In order to model the concentrated acid process, however, the impurity content of the MSW feed (e.g., % glass) and the carbohydrate analyses of each fraction are required. RTI specified that 95 percent of the impurities (e.g., glass, metals) would be removed during the upfront processing.
NREL conducted a literature search for this information and could not find the carbohydrate content for each MSW fraction listed in the feedstock provided by RTI. Thus, the feedstock fractions were grouped into four major categories and each category was assigned a carbohydrate composition obtained from the literature search.
Table 1 summarizes the feedstock categorization.

2
Table 1: Feedstock Ultimate Analysis
Feedstock Grouping Original Feedstock Fractions
Percentage of Conversion Technology
Feedstock, Dry basis
Representative Feedstock
Cardboard/Newspaper Cardboard, Newspaper
16.99 Newspaper
Paper Office paper, miscellaneous paper, phone books, etc.
36.19 Coated paper
Organic – Food Food 17.2 Wheat straw Organic – Yard trimmings
Leaves and grass, prunings and trimmings, branches and stumps, etc.
26.56 Tree prunings
Mixed Residue Mixed residue 3.06 Lumber
The representative feedstocks align well with each feedstock grouping, with the exception of wheat straw for food. A better carbohydrate analysis should be obtained for this component.
Using this assumed composition and the carbohydrate composition of each representative feedstock, an overall carbohydrate composition was determined (dry basis):
C-6 Carbohydrates
• Glucan 41.05%
• Mannan 2.35%
• Galactan 0.79
C-5 Carbohydrates
• Xylan 12.35%
• Arabinan 1.50%
• Lignin 24.15%
• Ash 12.11%
• Soluble Solids 5.69%
This overall composition was then compared to the ultimate analysis (dry basis) calculated from the information provided by RTI. All metals are assumed to be present in the ash.
• % Carbon 42.92
• % Hydrogen 5.81
3
• % Oxygen 36.01
• % Nitrogen 1.05
• % Chlorine 0.56
• % Sulfur 0.31
• % Ash 13.34
The composition of both lignin and soluble solids was estimated to reconcile the two analyses, and an overall elemental balance was achieved. Both lignin and soluble solids (extractives) vary with the type of feedstock.
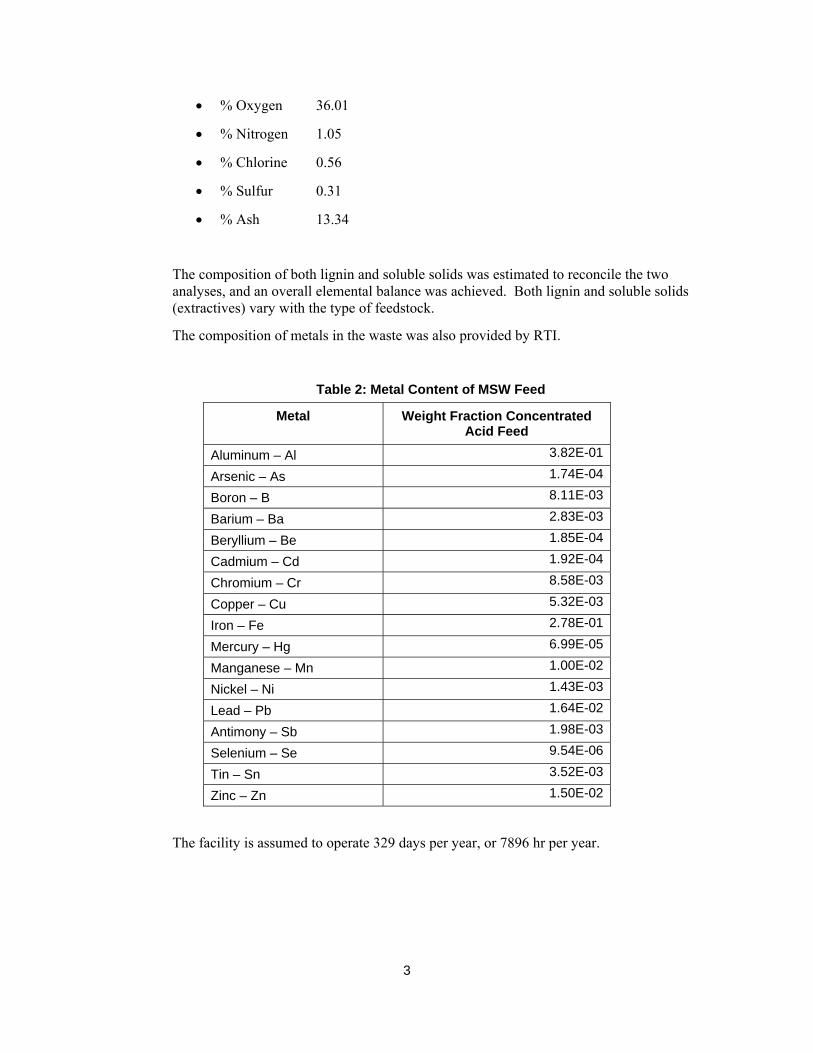
The composition of metals in the waste was also provided by RTI.
Table 2: Metal Content of MSW Feed
Metal Weight Fraction Concentrated Acid Feed
Aluminum – Al 3.82E-01
Arsenic – As 1.74E-04
Boron – B 8.11E-03
Barium – Ba 2.83E-03
Beryllium – Be 1.85E-04
Cadmium – Cd 1.92E-04
Chromium – Cr 8.58E-03
Copper – Cu 5.32E-03
Iron – Fe 2.78E-01
Mercury – Hg 6.99E-05
Manganese – Mn 1.00E-02
Nickel – Ni 1.43E-03
Lead – Pb 1.64E-02
Antimony – Sb 1.98E-03
Selenium – Se 9.54E-06
Tin – Sn 3.52E-03
Zinc – Zn 1.50E-02
The facility is assumed to operate 329 days per year, or 7896 hr per year.

4
ASPEN Plus® Implementation The process was modeled using ASPEN Plus®, a steady-state process simulator. ASPEN Plus® is composed of physical property and unit operation models that are combined into a process model. The simulation can be broken into three major sections: components (i.e., chemical species), physical property option sets (e.g., what set of physical property models to use), and the flowsheet (i.e., the series of unit operations). Each of these sections is described in more detail below.
Components Over 50 components were modeled in the simulation. The components were modeled as conventional (e.g., water), and conventional solids (e.g., MSW). Conventional components exist in the mixed substream, wheras conventional solids exist in the cisolid substream.
• Conventional
o CO, CO2, NO2, O2, N2, water, ethanol, gasoline
• Conventional solids
o Cellulose, xylan, ash
Using this result, the standard solid heat of formation was calculated as -23.936 kcal/gmol. The heat capacity and density were assumed the same as cellulose2. Ash was modeled as SiO2; physical properties for this component were available in the ASPEN Plus® databanks. Both components were assumed to be in the cisolid substream and were thus not expected to participate in vapor/liquid equilibrium.
Physical Property Option Sets
The primary physical property option set was ideal gas. In addition, the simulation used PURE11, SOLIDS, INORGANIC, STEAMTA and ASPENPCD physical property sets.
Flowsheet Nine flowsheets were developed for the process: Feed Handling (A100), Hydrolysis (A200), Fermentation (A300), Acid Recovery (A400), Distillation/Dehydration (A500), Wastewater Treatment (A600), Storage (A700), Power Production (A800), and Utilities (A9000).
Each of these areas was modeled in ASPEN Plus®. In some cases, such as feed handling (A100), none of the unit operations are modeled and only the power requirements are estimated. In other areas such as distillation, rigorous models were employed.
The next section is hydrolysis (A200) and is one of the most complex. Here, the feedstock is dried to 10 percent moisture before being mixed with 70 percent acid in the cooker (M202) and heated. Following washing, the solids are split (S203) from the sugar/acid mix (255). The solids are washed again (M203), and the resulting wash water is recycled within the process. The solids are then sent to the gasifier.

5
The sugar/acid mix is cooled (H200) before being sent to an ion exchange column. The recovered sugar is further concentrated using a reverse-osmosis system. It is then neutralized, and any solids are removed. The concentrated, cleaned sugar stream is sent on to fermentation and the acid is sent to acid recovery.
The fermentation area is modeled in A300. Common brewer’s yeast is assumed to be the fermentative organism; thus, only C-6 carbon sugars will likely be converted to ethanol. The model assumes that 95 percent of the glucose present in fermentation will be converted to ethanol. Although some C-5 sugars (e.g., xylose) may be converted, they were conservatively assumed to pass through fermentation unaffected.
Acid recovery (A400) is a crucial part of the concentrated acid process. In this model, a triple effect evaporator was used to concentrate the acid from roughly 10 percent to 70 percent for recycle. The amount of steam to each effect is controlled to maintain equal heat transfer areas.
The distillation/dehydration system (A500) is standard technology. A beer column concentrates the ethanol to roughly 40 percent and sends it to the rectification column, which concentrates it to just below the azeotrope. The concentrated ethanol is then dewatered in a molecular sieve.
Wastewater treatment (A600) is the next area. The wastewater treatment system is composed of anaerobic digestion followed by aerobic treatment. The methane-rich off-gas from the anaerobic digestion is sent to the boiler to generate steam. The effluent from aerobic treatment can be sent to a POTW or recycled within the process.
The storage area (A700) is also modeled. The process requires several raw materials – acid, lime, nutrients, and denaturant. The product ethanol is denatured and stored in this area. The demand for each is tracked in this flowsheet, and the pumping requirements are determined.
The power generation area is divided into two sections: process side (A800) and steam side (A810). The process side tracks the fuel and air streams into the boiler and their emissions. The water, heat recovery, steam, and power generation is modeled in A810. A staged-air fluidized bed gasifier is used to combust the solid, liquid, and gaseous fuel streams. The gasifier produces 950 psig steam, which is let down in a turbogenerator to generate electricity. The turbogenerator has several extraction points to supply steam for the process. The turbogenerator is a condensing turbine with an outlet pressure of 1.5 psig.
The final area modeled are the utilities (A900). The model tracks all of the steam, water, electricity, cooling water, and chilled water demands in this area.
Material and Energy Balance Results A block flow diagram, shown in Figure 6, was developed to show all of the inputs and outputs for the gasification process. Many internal streams (e.g., water recycle) are modeled within the ASPEN Plus® simulation, but because they have no impact outside the process boundaries, they are not included here. Only major process stream flows and those crossing the system boundaries are shown.

6
Figure 6: Concentrated Acid Block Flow Diagram
A summary of the inputs and outputs are contained below in Tables 3 and 4, respectively.
Sulfuric acid
Sorted MSW
Lime Water
Water
Gypsum
VOC Emissions Water
CO2, VOCEmissions
Nutrients (CSL) Cooling TowerLosses
Ammonia
BiogasAir Emissions Steam for
Electricity for Internal UseInternal Use
WWT Air
Air Ash ElectricityWWT Chemicals Treated water VOC Emissions Air Catalysts Emissions Spent to Grid
to POTW (Criteria, toxics CatalystDenaturant and metals)
Ethanol Product
Concentrated Acid Hydrolysis Block Flow Diagram
Air Pollution Control
FeedHandling
Mixer Hydrolysis Reactor Filter Press Washer
SeparatorAcid/Sugar Separation
EvaporationNeutrali-zation
Filtering
Fermentation Distillation
Ethanol Storage
Boiler Steam Turbine
Wastewater Treatment
Reverse Osmosis

7
Table 3: Overall Concentrated Acid Inputs (lb/hr)
Total Mass In: 543,114 lb/hr
Sorted MSW
Sulfuric Acid Lime Water
WWT Chemicals
Nutrients (CSL) Denaturant Ammonia Catalysts
Combustion Air
Aerobic WWT Air
IN/OUT IN IN IN IN IN IN IN IN IN IN INBFD Stream No. 1 2 3 4 5 6 7 8 9 10 11ASPEN Stream 101 211 745 903 630 735 701 717 804 626
Component (lb/hr) (lb/hr) (lb/hr) (lb/hr) (lb/hr) (lb/hr) (lb/hr) (lb/hr) (lb/hr) (lb/hr) (lb/hr)Total Flow 68,564 4,762 619 94,987 267 66 321 47 0 165,250 208,230
Components GLUCOSE 0 0 0 0 0 0 0 0 0 0 0XYLOSE 0 0 0 0 0 0 0 0 0 0 0SOLSLDS 2,621 0 0 0 0 0 0 0 0 0 0ARABINOS 0 0 0 0 0 0 0 0 0 0 0GALACTOS 0 0 0 0 0 0 0 0 0 0 0MANNOSE 0 0 0 0 0 0 0 0 0 0 0LGNSOL 0 0 0 0 0 0 0 0 0 0 0ETHANOL 0 0 0 0 0 0 0 0 0 0 0H2O 26,904 1,429 0 94,987 0 0 0 0 0 2,148 0FURFURAL 0 0 0 0 0 0 0 0 0 0 0HMF 0 0 0 0 0 0 0 0 0 0 0H2SO4 0 3,333 0 0 0 0 0 0 0 0 0CO2 0 0 0 0 0 0 0 0 0 0 0O2 0 0 0 0 0 0 0 0 0 37,744 43,728N2 0 0 0 0 0 0 0 0 0 125,360 164,500NH3 0 0 0 0 0 0 0 47 0 0 0LACID 0 0 0 0 0 0 0 0 0 0 0AACID 0 0 0 0 0 0 0 0 0 0 0DENATURANT 0 0 0 0 0 0 321 0 0 0 0CSL 0 0 0 0 0 66 0 0 0 0 0SUCCINIC ACID 0 0 0 0 0 0 0 0 0 0 0CELLULOS 16,846 0 0 0 0 0 0 0 0 0 0XYLAN 5,548 0 0 0 0 0 0 0 0 0 0LIGNIN 10,076 0 0 0 0 0 0 0 0 0 0YEAST 0 0 0 0 0 0 0 0 0 0 0GYPSUM 0 0 0 0 0 0 0 0 0 0 0ARABINAN 734 0 0 0 0 0 0 0 0 0 0MANNAN 1,074 0 0 0 0 0 0 0 0 0 0GALACTAN 480 0 0 0 0 0 0 0 0 0 0TAR 0 0 0 0 0 0 0 0 0 0 0CAH2O2 0 0 619 0 0 0 0 0 0 0WWT NUTRIENTS 0 0 0 0 267 0 0 0 0 0 0NOx 0 0 0 0 0 0 0 0 0 0 0CH4 0 0 0 0 0 0 0 0 0 0 0SO2 0 0 0 0 0 0 0 0 0 0 0CO 0 0 0 0 0 0 0 0 0 0 0ASH 4,283 0 0 0 0 0 0 0 0 0 0 Silica 4,280 0 0 0 0 0 0 0 0 0 0 Al 1.23E-02 0.00E+00 0.00E+00 0.00E+00 0.00E+00 0.00E+00 0.00E+00 0.00E+00 0.00E+00 0.00E+00 0.00E+00 As 5.59E-06 0.00E+00 0.00E+00 0.00E+00 0.00E+00 0.00E+00 0.00E+00 0.00E+00 0.00E+00 0.00E+00 0.00E+00 B 2.61E-04 0.00E+00 0.00E+00 0.00E+00 0.00E+00 0.00E+00 0.00E+00 0.00E+00 0.00E+00 0.00E+00 0.00E+00 Ba 9.10E-05 0.00E+00 0.00E+00 0.00E+00 0.00E+00 0.00E+00 0.00E+00 0.00E+00 0.00E+00 0.00E+00 0.00E+00 Be 5.94E-06 0.00E+00 0.00E+00 0.00E+00 0.00E+00 0.00E+00 0.00E+00 0.00E+00 0.00E+00 0.00E+00 0.00E+00 Cd 6.18E-06 0.00E+00 0.00E+00 0.00E+00 0.00E+00 0.00E+00 0.00E+00 0.00E+00 0.00E+00 0.00E+00 0.00E+00 Cr 2.75E-04 0.00E+00 0.00E+00 0.00E+00 0.00E+00 0.00E+00 0.00E+00 0.00E+00 0.00E+00 0.00E+00 0.00E+00 Cu 1.71E-04 0.00E+00 0.00E+00 0.00E+00 0.00E+00 0.00E+00 0.00E+00 0.00E+00 0.00E+00 0.00E+00 0.00E+00 Fe 8.92E-03 0.00E+00 0.00E+00 0.00E+00 0.00E+00 0.00E+00 0.00E+00 0.00E+00 0.00E+00 0.00E+00 0.00E+00 Hg 2.24E-06 0.00E+00 0.00E+00 0.00E+00 0.00E+00 0.00E+00 0.00E+00 0.00E+00 0.00E+00 0.00E+00 0.00E+00 Mn 3.22E-04 0.00E+00 0.00E+00 0.00E+00 0.00E+00 0.00E+00 0.00E+00 0.00E+00 0.00E+00 0.00E+00 0.00E+00 Ni 4.59E-05 0.00E+00 0.00E+00 0.00E+00 0.00E+00 0.00E+00 0.00E+00 0.00E+00 0.00E+00 0.00E+00 0.00E+00 Pb 5.26E-04 0.00E+00 0.00E+00 0.00E+00 0.00E+00 0.00E+00 0.00E+00 0.00E+00 0.00E+00 0.00E+00 0.00E+00 Sb 6.36E-05 0.00E+00 0.00E+00 0.00E+00 0.00E+00 0.00E+00 0.00E+00 0.00E+00 0.00E+00 0.00E+00 0.00E+00 Se 3.06E-07 0.00E+00 0.00E+00 0.00E+00 0.00E+00 0.00E+00 0.00E+00 0.00E+00 0.00E+00 0.00E+00 0.00E+00 Sn 1.13E-04 0.00E+00 0.00E+00 0.00E+00 0.00E+00 0.00E+00 0.00E+00 0.00E+00 0.00E+00 0.00E+00 0.00E+00 Zn 4.83E-04 0.00E+00 0.00E+00 0.00E+00 0.00E+00 0.00E+00 0.00E+00 0.00E+00 0.00E+00 0.00E+00 0.00E+00
Concentrated Acid Input Streams
8
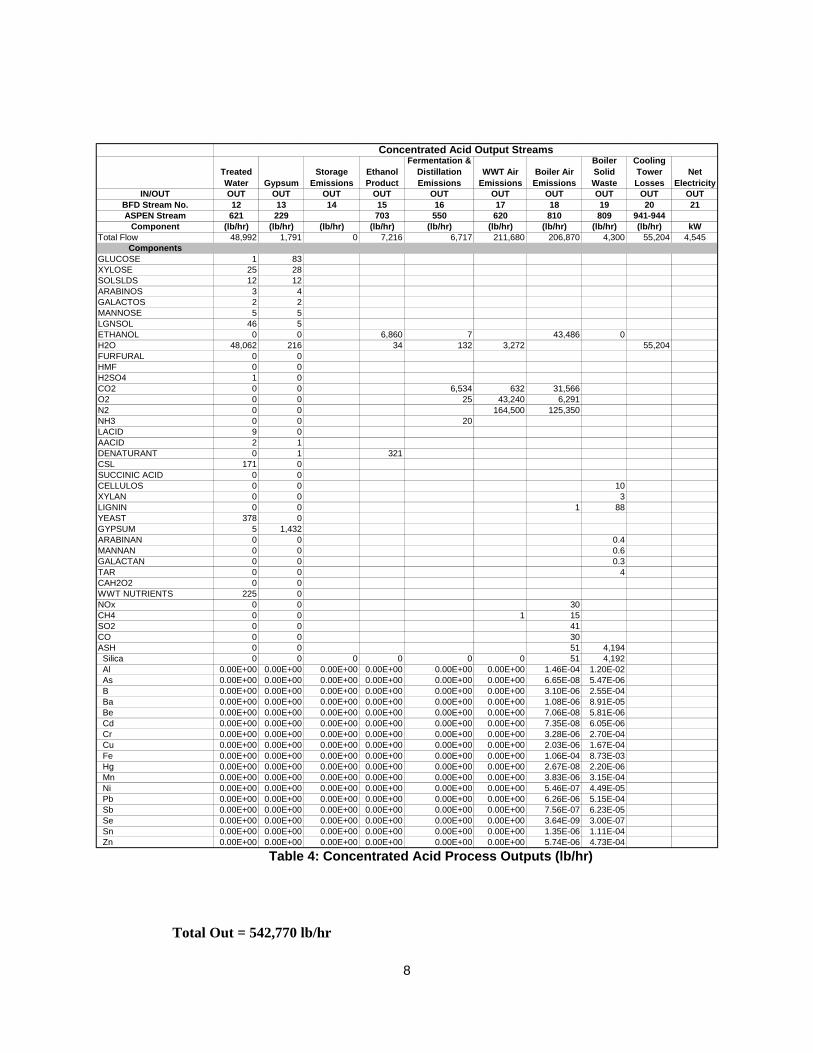
Table 4: Concentrated Acid Process Outputs (lb/hr)
Total Out = 542,770 lb/hr
Treated Water Gypsum
Storage Emissions
Ethanol Product
Fermentation & Distillation Emissions
WWT Air Emissions
Boiler Air Emissions
Boiler Solid Waste
Cooling Tower Losses
Net Electricity
IN/OUT OUT OUT OUT OUT OUT OUT OUT OUT OUT OUTBFD Stream No. 12 13 14 15 16 17 18 19 20 21ASPEN Stream 621 229 703 550 620 810 809 941-944
Component (lb/hr) (lb/hr) (lb/hr) (lb/hr) (lb/hr) (lb/hr) (lb/hr) (lb/hr) (lb/hr) kWTotal Flow 48,992 1,791 0 7,216 6,717 211,680 206,870 4,300 55,204 4,545
Components GLUCOSE 1 83XYLOSE 25 28SOLSLDS 12 12ARABINOS 3 4GALACTOS 2 2MANNOSE 5 5LGNSOL 46 5ETHANOL 0 0 6,860 7 43,486 0H2O 48,062 216 34 132 3,272 55,204FURFURAL 0 0HMF 0 0H2SO4 1 0CO2 0 0 6,534 632 31,566O2 0 0 25 43,240 6,291N2 0 0 164,500 125,350NH3 0 0 20 LACID 9 0AACID 2 1DENATURANT 0 1 321CSL 171 0SUCCINIC ACID 0 0CELLULOS 0 0 10XYLAN 0 0 3LIGNIN 0 0 1 88YEAST 378 0GYPSUM 5 1,432ARABINAN 0 0 0.4MANNAN 0 0 0.6GALACTAN 0 0 0.3TAR 0 0 4CAH2O2 0 0WWT NUTRIENTS 225 0NOx 0 0 30 CH4 0 0 1 15 SO2 0 0 41CO 0 0 30ASH 0 0 51 4,194 Silica 0 0 0 0 0 0 51 4,192 Al 0.00E+00 0.00E+00 0.00E+00 0.00E+00 0.00E+00 0.00E+00 1.46E-04 1.20E-02 As 0.00E+00 0.00E+00 0.00E+00 0.00E+00 0.00E+00 0.00E+00 6.65E-08 5.47E-06 B 0.00E+00 0.00E+00 0.00E+00 0.00E+00 0.00E+00 0.00E+00 3.10E-06 2.55E-04 Ba 0.00E+00 0.00E+00 0.00E+00 0.00E+00 0.00E+00 0.00E+00 1.08E-06 8.91E-05 Be 0.00E+00 0.00E+00 0.00E+00 0.00E+00 0.00E+00 0.00E+00 7.06E-08 5.81E-06 Cd 0.00E+00 0.00E+00 0.00E+00 0.00E+00 0.00E+00 0.00E+00 7.35E-08 6.05E-06 Cr 0.00E+00 0.00E+00 0.00E+00 0.00E+00 0.00E+00 0.00E+00 3.28E-06 2.70E-04 Cu 0.00E+00 0.00E+00 0.00E+00 0.00E+00 0.00E+00 0.00E+00 2.03E-06 1.67E-04 Fe 0.00E+00 0.00E+00 0.00E+00 0.00E+00 0.00E+00 0.00E+00 1.06E-04 8.73E-03 Hg 0.00E+00 0.00E+00 0.00E+00 0.00E+00 0.00E+00 0.00E+00 2.67E-08 2.20E-06 Mn 0.00E+00 0.00E+00 0.00E+00 0.00E+00 0.00E+00 0.00E+00 3.83E-06 3.15E-04 Ni 0.00E+00 0.00E+00 0.00E+00 0.00E+00 0.00E+00 0.00E+00 5.46E-07 4.49E-05 Pb 0.00E+00 0.00E+00 0.00E+00 0.00E+00 0.00E+00 0.00E+00 6.26E-06 5.15E-04 Sb 0.00E+00 0.00E+00 0.00E+00 0.00E+00 0.00E+00 0.00E+00 7.56E-07 6.23E-05 Se 0.00E+00 0.00E+00 0.00E+00 0.00E+00 0.00E+00 0.00E+00 3.64E-09 3.00E-07 Sn 0.00E+00 0.00E+00 0.00E+00 0.00E+00 0.00E+00 0.00E+00 1.35E-06 1.11E-04 Zn 0.00E+00 0.00E+00 0.00E+00 0.00E+00 0.00E+00 0.00E+00 5.74E-06 4.73E-04
Concentrated Acid Output Streams

9
Based on this balance, the total mass closure is 100 percent.
High-level material and energy balances were obtained for both the Masada and Arkenol processes. These balances were then compared to that obtained with the current ASPEN Plus® model. Due to the lack of detail (e.g., water content of products) in the balances provided by Masada and Arkenol, as well as differences in process design (e.g., combustion of lignin vs. shipping lignin off-site), direct comparison of the entire mass balance was not possible. However, several parameters were compared and are summarized in Table 5.
Table 4: Comparison of NREL, Masada and Arkenol Mass Balances
Parameter NREL Model Arkenol Masada
Ethanol yield (gal/dry ton) 49.9 67.1
50.5
Acid Use (lb/100 lb dry feed) 8.0 3.1
4.8
Lime Use (lb/100 lb dry feed)1.5 1.6
Not provided
Gypsum (lb/100 lb dry feed) 4.3 6.5
17.6a
Water Use (lb/100 lb dry feed) 228 5.4
252
a – “Recyclable materials”. This likely includes gypsum and other recyclables.
The NREL and Masada balances agree well in terms of ethanol yield and water use. The model also lines up well with the Arkenol process in terms of lime and gypsum production. The NREL model had significantly higher acid requirements than the other processes. The reasons for this discrepancy are two-fold: 1) assumed losses in the cooking and evaporation steps where the acid reacts with other solubles to form ash,and 2) higher losses in separation steps. These discrepancies will be further evaluated.
Water use varied widely among the three processes, but there was good agreement between the NREL model and Masada. The difference between these processes and the Arkenol process are likely due to the definition of “water” (e.g., process water vs. cooling tower requirements vs. boiler losses),as well as different water recycle rates. In the NREL model, the water use includes all water uses, including process water, cooling water make-up and CIP/CS make-up.

10
Economic Analysis Both capital and operating costs were developed for the concentrated acid technology. Feedstock costs were not included in the analysis,and all costs were based on 2003$. No financial analyses were performed as they are outside the scope of this effort.
Capital Costs Using the mass balance derived above, equipment costs were developed for all of the major unit operations in the simulation. Most of the equipment was costed using ASPEN ICARUS Questimate® 11.1 cost estimating software. Installation factors were applied for each component type based on previous analyses (Ruth, 2003). Specialized equipment, such as the fluidized bed boiler or equipment not in Questimate® (e.g., fermentors), were estimated using vendor quotes3 or earlier NREL analyses4. Each of these instances is discussed in greater detail below.
The equipment costs were increased by 15 percent to cover any omitted equipment and the uncertainty inherent in a conceptual analysis. However, this contingency is lower than with the other studies due to the detail provided in the equipment costs. The resulting costs by area are provided below in Table 6.
Table 6: Installed Equipment Costs
Equipment Area Installed Cost
A1000 – Feed Handling $248,047A2000 – Hydrolysis $8,849,581A3000 – Fermentation $3,216,439A4000 – Acid Recovery $5,943,607A5000 – Distillation $879,715A6000 – Wastewater Treatment $913,216A7000 – Storage $1,561,116A8000 – Power Production $12,317,883A9000 – Utilities $1,581,664Contingency $5,289,483Total Installed Equipment $40,552,706
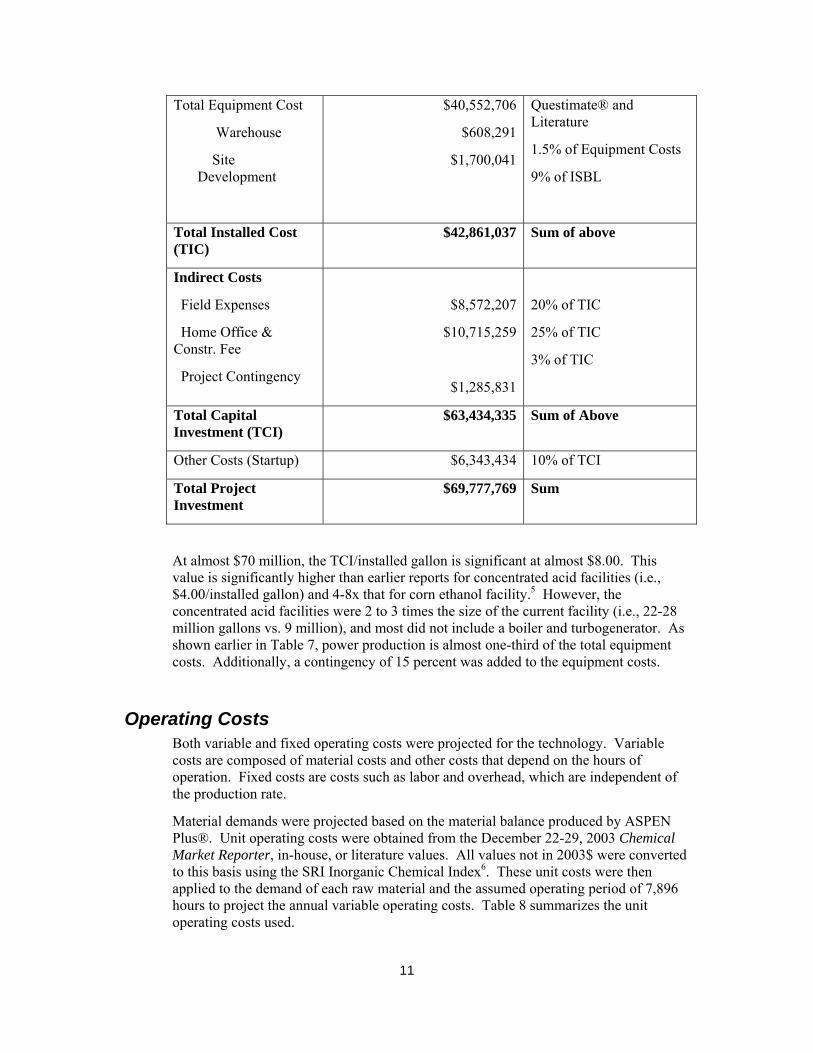
Using this installed equipment cost, the total project investment of almost $70 million was determined using a standard factor methodology. Table 7 summarizes the total project investment for the facility.
Table 7: Total Project Investment
Component Value Basis
11
Total Equipment Cost
Warehouse
Site Development
$40,552,706
$608,291
$1,700,041
Questimate® and Literature
1.5% of Equipment Costs
9% of ISBL
Total Installed Cost (TIC)
$42,861,037 Sum of above
Indirect Costs
Field Expenses
Home Office & Constr. Fee
Project Contingency
$8,572,207
$10,715,259
$1,285,831
20% of TIC
25% of TIC
3% of TIC
Total Capital Investment (TCI)
$63,434,335 Sum of Above
Other Costs (Startup) $6,343,434 10% of TCI
Total Project Investment
$69,777,769 Sum
At almost $70 million, the TCI/installed gallon is significant at almost $8.00. This value is significantly higher than earlier reports for concentrated acid facilities (i.e., $4.00/installed gallon) and 4-8x that for corn ethanol facility.5 However, the concentrated acid facilities were 2 to 3 times the size of the current facility (i.e., 22-28 million gallons vs. 9 million), and most did not include a boiler and turbogenerator. As shown earlier in Table 7, power production is almost one-third of the total equipment costs. Additionally, a contingency of 15 percent was added to the equipment costs.
Operating Costs Both variable and fixed operating costs were projected for the technology. Variable costs are composed of material costs and other costs that depend on the hours of operation. Fixed costs are costs such as labor and overhead, which are independent of the production rate.
Material demands were projected based on the material balance produced by ASPEN Plus®. Unit operating costs were obtained from the December 22-29, 2003 Chemical Market Reporter, in-house, or literature values. All values not in 2003$ were converted to this basis using the SRI Inorganic Chemical Index6. These unit costs were then applied to the demand of each raw material and the assumed operating period of 7,896 hours to project the annual variable operating costs. Table 8 summarizes the unit operating costs used.

12
Table 8: Unit Operating Costs
Inputs Unit Cost Source Sulfuric Acid $52.50/ton, 93% purity Chemical Market
Reporter
Lime $67/ton Chemical Market Reporter
Corn Steep Liquor $0.07/lb NREL
Water $0.13/1000 lb NREL experience
SCR Catalyst $400/ft3 ONSITE SYCOM Energy
Outputs Unit Cost Source Ethanol Credit $1.15/gallon Oxy-Fuel News
Electricity Credit $0.042/kWh NREL
Wastewater $0.01/lb NREL experience
Solid waste $0.01/lb NREL experience
Three types of wastes will be generated by the facility: treated wastewater, ash, and gypsum. The solid wastes can be disposed of for $0.01/lb. It is assumed that the on-site water treatment (i.e., anaerobic digestion and aerobic treatment) is sufficient and no further treatment will be required, and thus, no costs incurred.
The most significant product from the facility is ethanol. Spot prices of ethanol have been highly variable over the past 18 months, ranging from less than $1.10/gal to almost $1.80/gal7. For this analysis, a conservative price of $1.15/gallon was used.
In addition to the ethanol, the facility produces about 7 MW of power with a net output of 4.5 MW. Assuming a value of $0.042/kWh, this results in a revenue stream of $1.5 million.
Fixed operating costs, composed of labor, maintenance, overhead, taxes and insurance, were also determined. The number, expertise, and salaries of personnel required to operate the facility was estimated based on NREL experience. Salaries were scaled from earlier NREL work8 using the Bureau of Labor Statistics’ labor index for Chemical and Allied Trade Workers9.
Table 9 summarizes the salaries and number of employees required, which results in a total labor cost of $1 million.

13
Table 9: Employee Requirements
Employee Number Required Annual Salary
Plant/General Manager 1 $121,600 Plant Engineer 1 $79,000 Maintenance Supervisor 1 $72,940 Lab Manager/Chemist 1 $60,780 Shift Supervisor 4 $45,000 Maintenance Tech 3 $34,000 Shift Operators 12 $30,400 Administrative Assistants 1 $24,300
The remaining fixed operating costs were calculated as percentages of labor or capital investment. Overhead is estimated at $600,000, with maintenance at $800,000 and insurance at just over $1 million. The total fixed operating costs are thus $3.5 million.
The facility is projected to have a net positive cash flow of $6.4 million (excluding capital charges or feedstock costs), due primarily to the ethanol produced. Table 10 provides a break down of these costs.
Table 10: Cash Cost Summary
Cost Value
Raw Materials (excl. feedstock) $1,068,495 Waste Streams $495,948 Product Credits ($10,295,352) Labor $1,005,420 Other Fixed Operating Costs $2,460,973 Total Cash Cost ($6,401,485)
Summary and Conclusions A material and energy balance and economic analysis was conducted for a concentrated acid process based on the Masada OxyNol® process.
The facility will process 500 dtpd of preprocessed MSW, converting it to ethanol and electricity. The total project investment for the facility was estimated at almost $70 million, with a positive cash flow (excluding capital charges and feedstock costs) of over $6 million, excluding feedstock costs or profits. The projected costs should be a conservative assessment of the actual costs of the facility because a 15 percent

14
contingency was applied to a detailed equipment list. The capital cost of the facility is almost $8.00/installed gallon. This is double that shown for other concentrated acid facilities. However, these facilities were three times larger than that in this study and most did not have on-site power generation.

15
Abbreviations and Acronyms
CO – carbon monoxide
CT – conversion technology
DAF – dry ash free
NOx – nitrogen oxides (i.e., NO and NO2)
SCR – selective catalytic reduction
VOC – volatile organic compound

16
Bibliography Arkenol, 2003. UC_Davis-CIWMB_Survey.doc, October 30.
Bureau of Labor Statistics , U.S. Department of Labor, Career Guide to Industries, 2002-03 Edition, Chemicals Manufacturing, Except Drugs, on the Internet at http://www.bls.gov/oco/cg/cgs008.htm (Accessed January 5, 2004).
Chemical Market Reporter, December 22-29, 2003.
Chieffalo, R. and G. Lightsey, 2001. “Municipal Solid Waste Processing Facility and Commercial Ethanol Production Process”, U.S. Patent 6,267,309 B1.
Douglas, J.M. Conceptual Design of Chemical Processes, McGraw-Hill Book Company, New York, 1988.
Kadam, K. and M. Yancey. 1997. “Biomass to Ethanol Facility Design, Cost Estimate, and Financial Evaluation”, Volume I, NREL, 1997.
Masada Resource Group, undated. “Project Background and Beneficial Use of the CES OxyNol TM Process”, City of Middletown, Orange County, New York.
Onsite Sycom Energy Corporation. 1999. “Cost Analysis of NOx Control Alternatives for Stationary Gas Turbines”, Contract No. DE-FC02-97CHIO877, Prepared for U.S. Department of Energy, November 5.
Oxy-Fuel News. 2004. “Fuel Ethanol Terminal Market Price – 18-Month History”, http://www.energy.ca.gov/gasoline/graphs/ethanol_18-month.html, Accessed March 18, 2004.
Russo Jr., L. 2002. “Method for the Separation of Acid from Sugars”, U.S. Patent 6,419,828 B1, July 16.
Ruth, M. 1999. “Process & Economic model of Immobilized enzyme (with concentrated acid hydrolysis), C Milestone Completion Report”, June 1.
Wooley, R. and V. Putsche. 1996. “Development of an ASPEN PLUS Physical Property Database for Biofuels Components”, NREL/TP-425-20685, April.

Conversion Technology Final Report
Gasification Technology Assessment Task 1.33C May 31, 2004

i
Table of Contents Conversion Technology Final Report ........................................................................................................... 1 Table of Contents........................................................................................................................................... i Introduction................................................................................................................................................... 1 Design Basis.................................................................................................................................................. 1 ASPEN Plus® Implementation..................................................................................................................... 4
Components............................................................................................................................................ 5 Physical Property Option Sets ................................................................................................................ 5 Flowsheet................................................................................................................................................ 5
Material and Energy Balance Results ......................................................................................................... 12 Economic Analysis ..................................................................................................................................... 14
Capital Costs......................................................................................................................................... 15 Operating Costs .................................................................................................................................... 16
Summary and Conclusions ......................................................................................................................... 18 Abbreviations and Acronyms ..................................................................................................................... 19 Bibliography ............................................................................................................................................... 20

1
Introduction A preliminary mass and energy balance has been completed for the MSW gasification facility. The design is based primarily on the Brightstar Synfuels Company (“Brightstar”) questionnaire10, a Brightstar technical presentation11, and communication with Brightstar12 13.
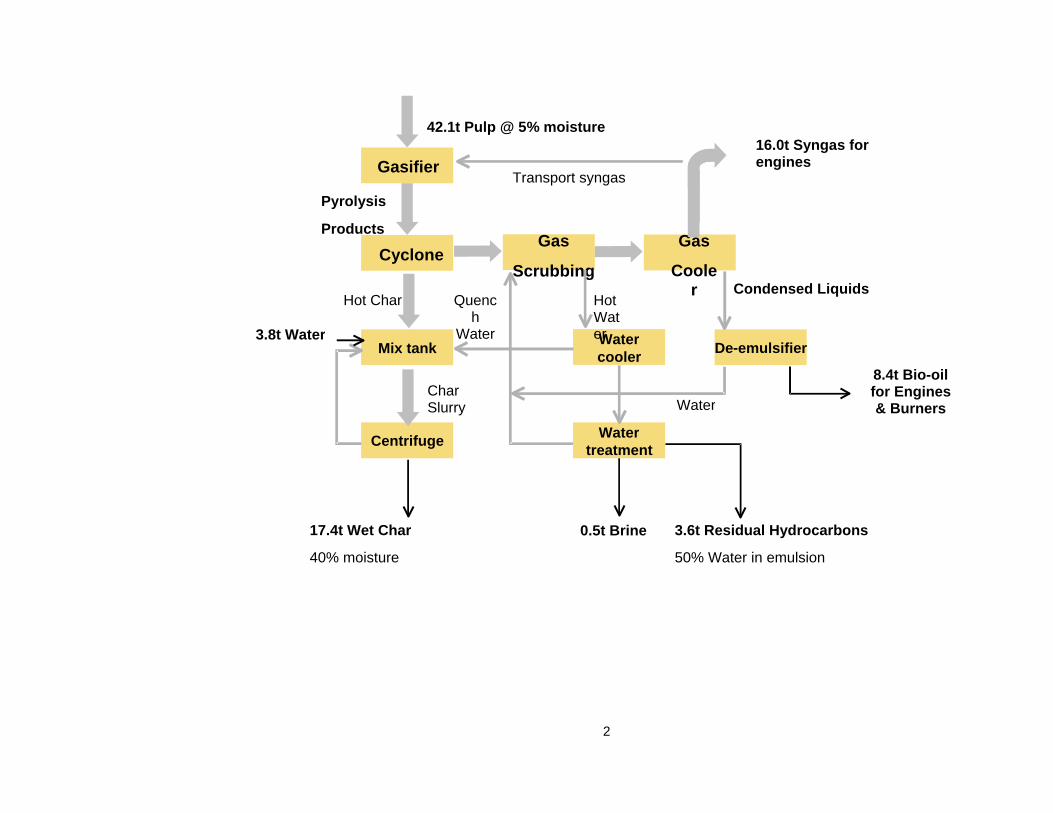
Design Basis The facility is designed to process 500 dtpd (41,667 lb/hr) of dry, preprocessed MSW. The process produces syngas and light bio-oils that are combusted to generate electricity. Heavy bio-oils are also produced and are recycled within the process to heat the gasifier reformer. Waste heat is used to generate steam for use in the MRF and in the reformer. Figure 1, provided by Brightstar, is an overall diagram of the process14.
Feedstock information for both Los Angeles15 and San Francisco16 were obtained from RTI. For this initial base case analysis, the San Francisco data were used. The composition of each major waste fraction was determined and then the projected removal efficiencies in the MRF were projected, resulting in the final composition. Brightstar projects that the post-MRF feedstock will contain 5% moisture17. The data provided by RTI had a higher moisture content (~ 35%), but it was assumed that the actual feedstock to the conversion technology facility would have a 5% moisture content and so the components were ratioed accordingly.
Based on this methodology, the overall ultimate analysis of the feed to the gasifier was determined and is summarized in Table 1.
Table 1: Ultimate Analysis for Feedstock to Gasifier
Parameter Value
% Carbon 43.39 % Hydrogen 5.9 % Oxygen 29.71 % Nitrogen 0.96 % Chlorine 0.95 % Sulfur 0.28 % Ash 13.81 % Moisture 5
RTI provided information on the trace metal content of the feed after passing through the MRF (and with a moisture content of 35%). It was assumed that the feed to the gasification conversion technology would have 5% moisture and that none of the metals would be lost during the drying operation so the metals were concentrated in the feed to the gasifier. Table 2 provides the metals content of the feed to the gasifier.
2
42.1t Pulp @ 5% moisture
Gasifier
Cyclone
Pyrolysis
ProductsGas
ScrubbingHot Char
Mix tank
Char Slurry
Centrifuge
17.4t Wet Char
40% moisture
Gas
Cooler
Transport syngas
16.0t Syngas for engines
Water cooler
Hot Water
Water treatment
Quench
WaterDe-emulsifier
Condensed Liquids
Water
8.4t Bio-oil for Engines & Burners
0.5t Brine 3.6t Residual Hydrocarbons
50% Water in emulsion
3.8t Water

3
Table 2: Metal Content of the MSW Feed to the Gasifier
Metal Weight Fraction in Pre-processed MSW
(lb/lb dry feed)
Aluminum – Al 6.73E-3 Arsenic – As 3.43E-5 Boron – B 1.08E-4 Barium – Ba 3.34E-5 Beryllium – Be 1.41E-6 Cadmium – Cd 5.65E-6 Chromium – Cr 5.16E-5 Copper – Cu 8.27E-5 Iron – Fe 3.79E-3 Mercury – Hg 3.64E-7 Manganese – Mn 1.29E-4 Nickel – Ni 8.23E-6 Lead – Pb 8.93E-5 Antimony – Sb 2.01E-5 Selenium – Se 1.18E-7 Tin – Sn 3.27E-5 Zinc – Zn 2.03E-4
The Brightstar gasifier has a unique design in that it doesn’t add air or steam. All oxygen and water are provided with the incoming feed. In addition, it uses recycled syngas to transport the feed. Some of the syngas may also be used to heat the reformer. The specific design of the Brightstar gasifier is proprietary and is not available. In addition, the material and energy balance provided by Brightstar18 is on a facility-level, rather than around the gasifier. Thus, the gasifier itself was modeled as a “black-box”. The reforming and syngas recycling processes are not explicitly modeled, just the overall results. Brightstar also provided the composition of the treated syngas and light bio-oil by-product.
Based on this information as well as the inlet MSW composition, yields for the gasifier were determined. Since the heavy bio-oil composition was not provided, it was assumed that it was equivalent to the heavier (i.e., C9+) components in the light bio-oil fraction. The sulfur in the feed was assumed to apportion between the syngas as hydrogen sulfide and sulfur in the oils, based on the relative amount of product and the concentration of sulfur in those products. Hydrogen sulfide was assumed to be part of the “ethylene plus hydrocarbon” fraction of the syngas and the yield of ethylene was adjusted accordingly. Sulfur and metals yield were based on a material balance and the char yield was adjusted to compensate.
Using this methodology, the elemental balance will not necessarily close. Brightstar did not provide a relationship between feed composition and products for this to be feasible. However,

4
the actual elemental balance closes to within 5% for all elements. In addition, environmentally-sensitive compounds such as ash (with chlorine), sulfur and the metals were all balanced.
Table 3 provides the overall gasification yields as well as the specific component yields based on the methodology outlined above.
Table 3: Gasification Yields
Component Yield (lb/lb MSW, as received)
Syngas Hydrogen Methane Ethylene + Hydrocarbons Carbon Monoxide Carbon Dioxide Hydrogen Sulfide
0.3800 1.90E-3 9.92E-2 1.14E-1 6.50E-2 1.00E-1 7.41E-5
Bio-Oils (Heavy and light) Benzene Toluene Styrene Ethylbenzene Xylenes C9 Aromatics C10-C14 Aromatics C15-C28 Aromatics C29-C36 Aromatics
0.1995 0.084
3.03E-2 1.53E-2 3.19E-3 2.79E-3 1.88E-2 2.57E-2 1.58E-2 3.59E-3
Residual Hydrocarbon Emulsion
0.0855
Brine 0.0119 Wet Char 0.32304
The facility is assumed to operate 329 days/year or 7,896 hr/yr.
ASPEN Plus® Implementation The process was modeled using ASPEN Plus®, a steady-state process simulator. ASPEN Plus® is composed of physical property and unit operation models that are combined into a process model. The simulation can be broken into three major sections: components (i.e., chemical species), physical property option sets (e.g., what set of physical property models to use), and the flowsheet (i.e., the series of unit operations). Each of these sections is described in more detail below.

5
Components Over forty components were modeled in the simulation. The components were modeled as conventional (e.g., water), and conventional solids (e.g., MSW).
• Conventional
o CO, CO2, NO2, O2, N2, H2, C2H2, C2H4, C2H6, CH4, H2S, sulfur, metals, light bio-oils (toluene, xylene, benzene, styrene, ethylbenzene), heavy bio-oils (C9 aromatics – C33 aromatics), emulsified bio-oil
• Conventional solids
o MSW, ash, char
As noted earlier, the ultimate analysis of the mixed MSW stream was determined from the information provided by RTI. From this, the waste stream was divided into three components: water, ash and MSW. The MSW is based on the dry, ash free (DAF) analysis from Table 1 and has a chemical composition of CH1.6324O8.222 N0.266S 0.0769 with a MW of 22.209. From this composition, the higher heating value (HHV) was determined using an ASME correlation19:
HHV (IGT) = 146.58C + 568.78H - 51.53(O+N) - 6.58A + 29.45S in Btu/lb
Where:
C – weight % carbon
H – weight % hydrogen
O – weight% oxygen
N – weight% nitrogen
A – weight% ash
S – weight% sulfur
Using this result, the standard solid heat of formation was calculated as -23.936 kcal/gmol. The heat capacity and density were assumed the same as cellulose20. Ash was modeled as SiO2; physical properties for this component were available in the ASPEN Plus® databanks. Both components were assumed to be in the cisolid substream and were thus not expected to participate in vapor/liquid equilibrium.
Physical Property Option Sets
The primary physical property option set was ideal gas. In addition, the simulation used PURE11, SOLIDS, INORGANIC, STEAMTA and ASPENPCD physical property sets.
Flowsheet Four flowsheets were developed for the process: Gasification (A2000), Product Recovery (A3000), Power Generation (A4000), and Utilities (A9000). Feed handling and processing are handled in the specially-designed MRF and are not covered here.

6
Each of these areas will be briefly discussed and flow diagrams from ASPEN Plus® will be presented. The flow diagrams show only those unit operations modeled in ASPEN Plus®. Equipment used for operations such as conveyance, size reduction, and storage are generally not included in the model and are thus not shown. Similarly, certain complex unit operations (e.g., gasifier/reformer) require several ASPEN Plus® models (e.g., reactors, heat exchangers).
The power requirements of all the equipment, whether included in the model or modeled as several models, are included and are modeled as work streams in the utility section, A9000. Also, costs for all of the equipment are included in the economic analysis.
As shown in Figure 2, feed (1001) enters the gasifier (GS-2001) along with heat stream QCB-2001 from the reactor, CB-2001. The gasifier is modeled as two unit operations: gasification and heat recovery. The gasification process is modeled as an RSTOIC reactor using the data presented in Table 3. Heat is recovered in a heat exchanger (HX-2003) to generate 50 psi steam for use in the MRF. The steam side of the heat exchanger is shown in A9000, the utility flowsheet.
The combustor, CB-2001, is an RSTOIC model that combusts recycled heavy bio-oils (3021 and 3022) to maintain the reaction temperature (1120 K) in the gasifier (GS-2001). The combustor operates at atmospheric pressure and an excess air rate of 15-20%. Air (2003) is supplied to the combustor through a combustion fan (CP-2002). Selective non-catalytic reduction (SNCR) is used to control NOx emissions from the combustor.
NOx emissions were estimated at 23 ppm, assuming no NOx emissions control.21
The last unit operation in A2000 is the cyclone, CY-2001. Here, hot char is separated from the gases and bio-oils. All of the ash and char, along with 90% of the sulfur and metals are assumed to be removed (2115). The cleaned gases (2013) and solid stream (2115) go to Product Recovery (A3000) for further processing.
Product Recovery (Figure 3) is a series of unit operations designed to recover and clean up all of the useful products. The recovered solids from gasification (2115) are sent to a tank (T-3001) and combined with recycled (3003 and 3008) and fresh (3001) process water for cooling. The amount of process water added is controlled by a FORTRAN block, WATADD, based on the material balance provided by Brightstar22. Water is removed from the cooled solids in a centrifuge (CF-3001) and the recovered water (3003) is recycled back to the mixing tank. The dewatered solids (3004) are sent out of the facility for disposal.
The rest of the flowsheet is dedicated to processing the liquid and gaseous products. The mix of gases and aerosols from the cyclone (2013) are sent to a quench (AB-3001) to remove the heavier liquids via contact with water (3018). The resulting liquid (3006) is cooled (HX-3001+) with chilled water, which is shown in A9000. Water is recovered in SP-3001 and sent to the solids mixing tank (T-3001). Char and brine (3024) are also recovered and sent for disposal. Bio-oils (3009) are sent to another separator (SP-3002) to separate the light (3023) from the heavy (3024) bio-oils. The heavy bio-oils are recycled back to the combustor in A2000 while the light oils are sent to the engines (EN-4001) in A4000 for power generation.
The light end products from the quench (3005) are cooled with chilled water and flashed to separate the gases (3014) from the bio-oils (3015). The remaining cleanup is effected in a series of separators where the remaining gases (3016) and light bio-oil (3020) are separated from the heavy bio-oil (3021). The recovered heavy bio-oil is sent to A2000 to provide heat for gasification. The two gaseous streams, 3014 and 3016, are sent to blower, CP-4001, in the Power Generation flowsheet, A4000. The light bio-oil streams, 3023 and 3020, are sent directly to the engine, EN-4001.

7
Power Generation, A4000, is depicted in Figure 4. The engine is modeled as an RSTOIC combustor that combusts the light bio-oil and syngas with air (4002) supplied at ~15% excess by a blower (CP-4002). The calculated heat from the combustion process, QEN-4001, is converted to power in the FORTRAN block MISCPOW using a 25% thermal-to-power efficiency, which is at the low end of published efficiencies23 24. This conservative value was assumed because of the non-standard fuels (i.e., syngas and bio-oils). The engine operates at atmospheric pressure and 515 ºC based on literature values25. The resulting kWh/dry ton value (800) is less than that projected by Brightstar (900)26, but the exported power ratio is higher. The reason for the discrepancy may be due to the low efficiency selected.
Also included in this area are SNCR for NOx control and a CO-catalyst for carbon monoxide control. Ammonia is added for the SCR system at a 1:1 ammonia: NOx molar ratio to reduce NOx to elemental nitrogen. Ammonia was not included in the model, but it is included in the overall material balance and economic analysis.
Uncontrolled emissions are projected based on vendor data27. Uncontrolled NOx emissions were projected to be 100 ppm with controlled values are based at 55 ppm, based on 45% removal efficiency.28 Controlled CO emissions were estimated to be 7 lb/hr, assuming 95% removal.
Although the engine is modeled as a single unit operation, a facility would have several engines, with each engine likely having a dedicated fuel type (i.e., bio-oil or syngas). For modeling purposes, however, a single unit operation is sufficient.
The second part of the engine, heat recovery, is modeled with a heat exchanger, HX-4001+. Steam (50 psi) for export to the MRF is generated in A9000.
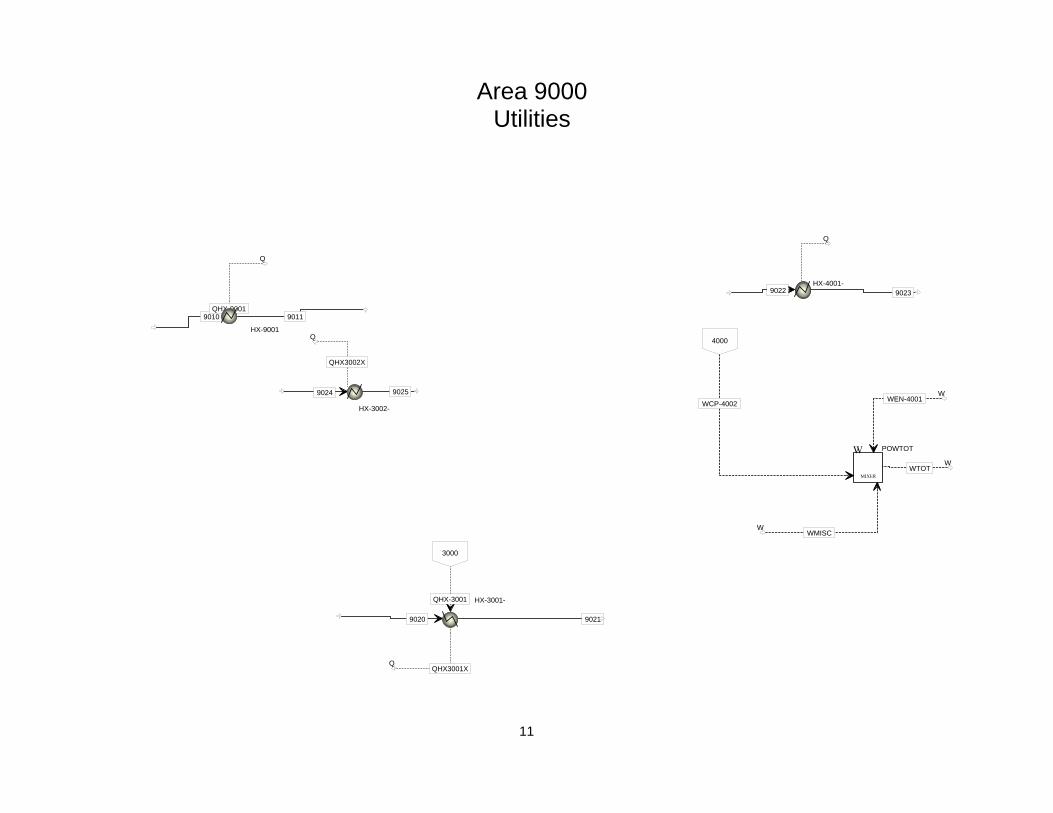
Utilities (A9000) consist of power, cooling water, power, steam and plant/instrument air. This flowsheet basically sums up the utility (i.e., power, chilled water, cooling water) demands from all of the other flowsheets.
Power requirements and production are summed in POWTOT. All of the compressors and pumps modeled in the other flowsheets have their power requirements directed to this block. Similarly, unit operations that are not modeled (e.g., screw feeder) have their power requirements calculated the FORTRAN block MISCPOW based on the overall efficiencies (i.e., Power Consumed/Power Produced)29. The net power for the facility, WTOT, is the sum of all the power produced and used. This value is used in the economic analysis as a credit.
Cooling water is required for the engine cooling water. The cooling tower was not modeled, but the total cooling water demand is calculated to size the cooling tower. The cooling water has a 16 ºC allowable temperature rise.
Chilled water is required in product recovery for condensing bio-oils in HX-3001 and HX-3001. The total demand (9024 + 9020) is used to size the chilled water system. The plant/instrument air was not modeled. The costs for both systems were included in the economic analysis.
The final utility is the 50 psi steam generated from waste heat from the gasifier and the engine. This steam would be available for use in the MRF.

8
Area 2000 Gasification
2004
3021 3000
3022
3000
2005
QCB-2001
20102012
QHX-1001
9000
2006
QHX-2001
2003
WCP-2002
W
1001
QGS-2001Q
2115 3000
2013
3000
CB-2001
HX-2003
HX-2001+CP-2002
GS-2001CY-2001

9
Area 3000 Product Recovery
3021 20003022 2000
21152000
2000
3001
30083003
3002
3006
3007
9000
3004
3018
3005
90004000
30153012
WP-3001 9000
3017
3020
4000
3016
4000
3023 4000
3024
MIXER
MX-3001
HX-3001+
CF-3001
AB-3001
HX-3002+
FL-3001
P-3001
SP-3004
SP-3003
SP-3002
SP-3001

10
3014
3000
3020
3000
3016
3000
3023
3000
4001
WCP-4001
9000
4003
4004
QEN-4001Q
4005
9000
4002
WCP-4002
9000
CP-4001
EN-4001
HX-4001+
CP-4002
Area 4000 Power Production
11
QHX-3001
3000
WCP-4002
4000
9010 9011QHX-9001
Q
WMISCW
WEN-4001W
WTOTW
9024
QHX3002X
Q
9025
9022
Q
9023
9020 9021
QHX3001XQ
HX-9001
W
MIXER
POWTOT
HX-3002-
HX-4001-
HX-3001-
Area 9000 Utilities

12
Material and Energy Balance Results A block flow diagram, shown in Figure 6, was developed to show all of the inputs and outputs for the gasification process. Many internal streams (e.g., water recycle) are modeled within the ASPEN Plus® simulation, but since they have no impact outside the process boundaries, they are not included here. Only major process stream flows and those crossing the system boundaries are shown.
Figure 6
A summary of the inputs and outputs are contained below in Tables 4 and 5, respectively.
Combustion Emissions50 psi steamto MRF
Pre-processed MSW
BrineReformer CombustionAir
ResidualHydrocarbons
Boiler Feedwater
SpentChar
Mix TankWater
Steam CombustionHot Water Emissions
Electricity for Internal Use
Electricity Feedwater Ammonia
CombustionAir
Brightstar Gasification Block Flow Diagram
Air Pollution Control
Gasifier/Reformer Cyclone Gas
Scrubbing
Waste heat recovery
Engine Gen-set
Gas CoolerMix TankCentrifugeDe-emulsifier
Water Cooler/Treatment

Table 4: Overall Gasification Inputs (lb/hr)
Pre-processed MSW
Reformer Combustion Air
Boiler Feedwater
Mix Tank Water
Engine Feedwater
Engine Combustion Air Ammonia
IN/OUT IN IN IN IN IN IN INBFD Stream No. 1 2 3 4 5 6 7ASPEN Stream 1001 2003 9010 3001 9022 4002 NA
Component (lb/hr) (lb/hr) (lb/hr) (lb/hr) (lb/hr) (lb/hr) (lb/hr)Total Flow 43,860 70,000 3,400 3,959 3,924 257,280 25
Components H2 0 0 0 0 CO 0 0 0 0 CO2 0 0 0 0 CH4 0 0 0 0 C2H6 0 0 0 0 C2H4 0 0 0 0 C2H2 0 0 0 0 O2 0 16,304 0 59,925 N2 0 53,696 0 197,355 H2O 2,193 0 3,400 3,959 3,924 0 BENZENE 0 0 0 0 TOLUENE 0 0 0 0 STYRENE 0 0 0 0 EB 0 0 0 0 XYLENE 0 0 0 0 C9AROS 0 0 0 0 C12AROS 0 0 0 0 C22AROS 0 0 0 0 C33AROS 0 0 0 0 EMULS 0 0 0 0 MSW 35,609 0 0 0 CHAR 0 0 0 0 ASH 5,587 0 0 0 H2S 0 0 0 0 SO2 0 0 0 0 NOx 0 0 0 0 0 NH3 0 0 0 0 0 0 25 AS 1.43E+00 AL 2.80E+02 B 4.50E+00 BA 1.39E+00 BE 5.88E-02 CD 2.35E-01 CR 2.15E+00 CU 3.45E+00 FE 1.58E+02 HG 1.52E-02 MN 5.38E+00 NI 3.43E-01 PB 3.72E+00 SB 8.38E-01 SE 4.92E-03 SN 1.36E+00 ZN 8.46E+00
Gasification Input Streams

14
Table 5: Gasification Cracking Process Outputs (lb/hr)
Economic Analysis Both capital and operating costs were developed for the gasification technology. Feedstock costs were not included in the analysis and all costs were based on 2003$. No financial analyses were performed as they are outside the scope of this effort.
Gasification Output Streams
Engine Emissions
Residual Hydrocarbons and
Brine50 psi Steam
Reformer Combustion Emissions Spent Char
Engine 50 psi Steam Electricity
IN/OUT OUT OUT OUT OUT OUT OUT OUTBFD Stream No. 8 9 10 11 12 13 14ASPEN Stream 4004 3024 9011 2005 3004 9023 NA
Component (lb/hr) (lb/hr) (lb/hr) (lb/hr) (lb/hr) (lb/hr) (kW)Total Flow 278,799 4,219 3,400 74,228 18,058 3,924 14,583
Components H2 0 0 0 0 CO 0 0 0 0 CO2 51,932 0 13,775 0 CH4 0 0 0 0 C2H6 0 0 0 0 C2H4 0 0 0 0 C2H2 0 0 0 0 O2 9,021 0 3,064 0 N2 197,339 0 53,692 0 H2O 20,273 600 3,400 3,625 3,959 3,924 BENZENE 0 0 0 0 TOLUENE 0 0 0 0 STYRENE 0 0 0 0 EB 0 0 0 0 XYLENE 0 0 0 0 C9AROS 0 0 0 0 C12AROS 0 0 0 0 C22AROS 0 0 0 0 C33AROS 0 0 0 0 EMULS 0 3,750 0 0 MSW 0 0 0 0 CHAR 0 0 0 8,053 ASH 195 3 52 5,337 H2S 0 0 0 0 SO2 6 0 11 0 NOx 16 0 4 0 NH3 1 0 0 1 0 AS 4.98E-02 7.55E-04 1.33E-02 1.37E+00 AL 9.78E+00 1.48E-01 2.61E+00 2.68E+02 B 1.57E-01 2.38E-03 4.18E-02 4.30E+00 BA 4.85E-02 7.35E-04 1.29E-02 1.33E+00 BE 2.05E-03 3.10E-05 5.46E-04 5.61E-02 CD 8.21E-03 1.24E-04 2.19E-03 2.25E-01 CR 7.50E-02 1.14E-03 2.00E-02 2.05E+00 CU 1.20E-01 1.82E-03 3.20E-02 3.29E+00 FE 5.51E+00 8.34E-02 1.47E+00 1.51E+02 HG 5.29E-04 8.01E-06 1.41E-04 1.45E-02 MN 1.87E-01 2.84E-03 4.99E-02 5.13E+00 NI 1.20E-02 1.81E-04 3.19E-03 3.28E-01 PB 1.30E-01 1.96E-03 3.46E-02 3.55E+00 SB 2.92E-02 4.42E-04 7.78E-03 8.00E-01 SE 1.71E-04 2.60E-06 4.57E-05 4.70E-03 SN 4.75E-02 7.20E-04 1.27E-02 1.30E+00 ZN 2.95E-01 4.47E-03 7.86E-02 8.08E+00
15
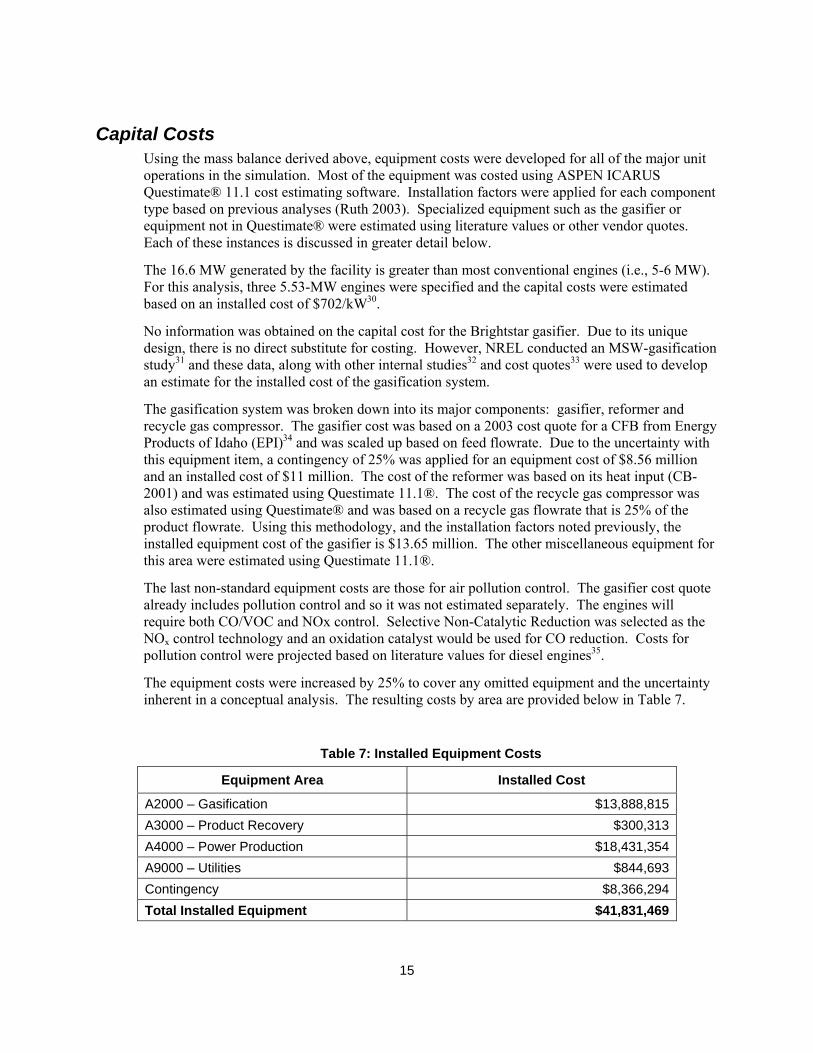
Capital Costs Using the mass balance derived above, equipment costs were developed for all of the major unit operations in the simulation. Most of the equipment was costed using ASPEN ICARUS Questimate® 11.1 cost estimating software. Installation factors were applied for each component type based on previous analyses (Ruth 2003). Specialized equipment such as the gasifier or equipment not in Questimate® were estimated using literature values or other vendor quotes. Each of these instances is discussed in greater detail below.
The 16.6 MW generated by the facility is greater than most conventional engines (i.e., 5-6 MW). For this analysis, three 5.53-MW engines were specified and the capital costs were estimated based on an installed cost of $702/kW30.
No information was obtained on the capital cost for the Brightstar gasifier. Due to its unique design, there is no direct substitute for costing. However, NREL conducted an MSW-gasification study31 and these data, along with other internal studies32 and cost quotes33 were used to develop an estimate for the installed cost of the gasification system.
The gasification system was broken down into its major components: gasifier, reformer and recycle gas compressor. The gasifier cost was based on a 2003 cost quote for a CFB from Energy Products of Idaho (EPI)34 and was scaled up based on feed flowrate. Due to the uncertainty with this equipment item, a contingency of 25% was applied for an equipment cost of $8.56 million and an installed cost of $11 million. The cost of the reformer was based on its heat input (CB-2001) and was estimated using Questimate 11.1®. The cost of the recycle gas compressor was also estimated using Questimate® and was based on a recycle gas flowrate that is 25% of the product flowrate. Using this methodology, and the installation factors noted previously, the installed equipment cost of the gasifier is $13.65 million. The other miscellaneous equipment for this area were estimated using Questimate 11.1®.
The last non-standard equipment costs are those for air pollution control. The gasifier cost quote already includes pollution control and so it was not estimated separately. The engines will require both CO/VOC and NOx control. Selective Non-Catalytic Reduction was selected as the NOx control technology and an oxidation catalyst would be used for CO reduction. Costs for pollution control were projected based on literature values for diesel engines35.
The equipment costs were increased by 25% to cover any omitted equipment and the uncertainty inherent in a conceptual analysis. The resulting costs by area are provided below in Table 7.
Table 7: Installed Equipment Costs
Equipment Area Installed Cost
A2000 – Gasification $13,888,815A3000 – Product Recovery $300,313A4000 – Power Production $18,431,354A9000 – Utilities $844,693Contingency $8,366,294Total Installed Equipment $41,831,469

16
Using this installed equipment cost, the total project investment was determined using a standard factor methodology. Table 8 summarizes the total project investment for the facility.
Table 8: Total Project Investment
Component Value Basis Total Equipment Cost
Warehouse
Site Development
$41,831,469
$627,472
$2,935,843
Questimate® and Literature
1.5% of Equipment Costs
9% of ISBL
Total Installed Cost (TIC)
$45,394,784 Sum of above
Indirect Costs
Field Expenses
Home Office & Constr. Fee
Project Contingency
$9,078,957
$11,348,696
$1,361,844
20% of TIC
25% of TIC
3% of TIC
Total Capital Investment (TCI)
$67,184,281 Sum of Above
Other Costs (Startup) $6,718428 10% of TCI
Total Project Investment
$73,902,709 Sum
The installed capital cost is thus >$4,000/kW. This cost is significantly higher than that projected (~$1,000-1,500/kW) for other biomass gasification facilities36. This increased cost is likely due to several factors including the scale of the facility (i.e., 500 dtpd vs. 2000 dtpd), the use of engines in a simple cycle mode instead of a gas turbine combined-cycle plant, the high char losses, and the high contingency factors employed.
Operating Costs Both variable and fixed operating costs were projected for the technology. Variable costs are composed of material costs and other costs that depend on the hours of operation. Fixed costs are costs such as labor and overhead, which are independent of the production rate.
Material demands were projected based on the material balance produced by ASPEN Plus®. Unit operating costs were obtained from the December 22-29, 2003 Chemical Market Reporter, in-house, or literature values. All values not in 2003$ were converted to this basis using the SRI Inorganic Chemical Index37. These unit costs were then applied to the demand of each raw material and the assumed operating period of 7,896 hours to project the annual variable operating costs.

17
Three types of wastes will be generated by the facility: wastewater (i.e., brine and residual hydrocarbons) from water treatment, spent char, and spent SCR catalyst. The wastewater and non-hazardous cracking catalyst can be disposed of for $0.01/lb.
Table 8: Unit Operating Costs
Inputs Unit Cost Source Ammonia $265/ton Chemical Market Reporter
Water $0.13/1000 lb NREL experience
Outputs Unit Cost SourceElectricity credit $0.15/kWh RTI
Wastewater $0.01/lb NREL experience
Solid waste $0.01/lb NREL experience
Based on these factors and the material and energy balance, it the variable operating costs of the facility are estimated at $1.8 million. The largest cost at $1.43 million is char disposal; wastewater disposal is estimated at roughly $350,000. These costs are more than off-set by electricity sales of $17 million.
Fixed operating costs, composed of labor, maintenance, overhead, taxes and insurance were also determined. The number, expertise and salaries of personnel required to operate the facility was estimated based on NREL experience. Salaries were scaled from earlier NREL work38 using the Bureau of Labor Statistics’ labor index for Chemical and Allied Trade Workers39.
Table 9 summarizes the salaries and number of employees required, which results in a total labor cost of just over $1 million.
Table 9: Employee Requirements
Employee Number Required Annual Salary
Plant/General Manager 1 $121,600 Plant Engineer 1 $79,000 Maintenance Supervisor 1 $72,940 Lab Manager/Chemist 1 $60,780 Shift Supervisor 4 $45,000 Maintenance Tech 3 $34,000 Shift Operators 12 $30,400 Administrative Assistants 1 $24,300
The remaining fixed operating costs were calculated as percentages of labor or capital investment. Overhead is estimated at $600,000 with maintenance at $840,000 and insurance at $1.1 million. The total fixed operating costs are thus $3.5 million.
The overall cash cost for the facility is estimated to be a net positive of $11.9 million. Table 10 provides a break down of these costs.

18
Table 10: Cash Cost Summary
Cost Value
Raw Materials (excl. feedstock) $37,710 Waste Streams $1,769,512 Electricity by-product ($17,272,397) Labor $1,005,420 Other Fixed Operating Costs $2,548,422 Total Cash Cost (Credit) $(11,911,435)
Summary and Conclusions A material and energy balance and economic analysis was conducted for a Brightstar gasification facility based on information provided by Brightstar. In general, due to the conceptual stage of the analysis, conservative assumptions regarding the performance and economics of the facility were employed.
The facility will process 500 dtpd of pre-processed MSW, converting it to syngas, bio-oils and char. The facility combusts the heavy bio-oils to run the reformer; the syngas and light bio-oils are converted to electricity in a gas engine. The process will be self-sufficient in both energy and power. Inputs and outputs to the system were quantified for use in a life cycle analysis.
The total project investment for the facility was estimated at almost $75 million with a cash cost of just under $12 million, excluding feedstock costs or profits.
The total project investment for the facility (i.e., $/kW) was 2-3x higher than other biomass gasification facilities. The causes of this discrepancy are likely the conservative contingency factors in this conceptual analysis, higher efficiencies with combined cycle plants versus the simple cycle facility in this design and the small facility size (500 dtpd). If further information is obtained from Brightstar, the design can be modified and some of the conservative assumptions may be changed.

19
Abbreviations and Acronyms
Brightstar - Brightstar Synfuels Company
CO – carbon monoxide
CT – Conversion Technology
DAF – dry ash free
NOx – nitrogen oxides (i.e., NO and NO2)
SCR – selective catalytic reduction
VOC – volatile organic compound

20
Bibliography ASME 1987
Bautista, P. 1999. “Developments in Reciprocating Engines and Industrial Gas Turbines”, ONSITE SYCOM Energy Corporation, Joint IMC-CMC Meeting, November 9.
Bureau of Labor Statistics , U.S. Department of Labor, Career Guide to Industries, 2002-03 Edition, Chemicals Manufacturing, Except Drugs, on the Internet at http://www.bls.gov/oco/cg/cgs008.htm (Accessed January 5, 2004).
California Energy Commission. 2004. “Distributed Energy Resources”, http://www.energy.ca.gov/distgen/equipment/reciprocating_engines/performance.html (Accessed March 3, 2004).
Chemical Market Reporter, December 22-29, 2003.
Douglas, J.M. Conceptual Design of Chemical Processes, McGraw-Hill Book Company, New York, 1988.
Krishnan, R. 2001. “SCR Economics for Diesel Engines”, Diesel & Gas Turbine Worldwide, Jul-August, pp. 62-63.
Mann, M.K. and P.L. Spath. 1997. “Life Cycle Assessment of a Biomass Gasification Combined-Cycle System”, NREL/TP-430-23076, December.
Menville, Jr. R.. 2003. “UC Davis Questionnaire”.
Menville, Jr. R. 2004. Teleconference with V. Putsche (NREL), M. Bahner (RTI), January 15.
Menville, Jr. R. 2004a “re: FW: Final questions for Ron Menville of Brightstar”, email, January 15.
Niessen et al. 1996. “Evaluation of Gasification and Novel Thermal Processes for the Treatment of Municipal Solid Waste”, NREL/TP-430-21612, August.
Onsite Sycom Energy Corporation. 1999. “Cost Analysis of NOx Control Alternatives for Stationary Gas Turbines”, Contract No. DE-FC02-97CHIO877, Prepared for U.S. Department of Energy, November 5.
Putsche, V. 1999. “Complete process and economic model of syngas fermentation to ethanol”, C-Milestone Completion Report, August 16.
USEPA. “NOx Control Techniques Applicable to Municipal Waste Combustion”, http://www.epa.gov/ORD/WebPubs/projsum/600sr94208.pdf.
Wartsila. 2002. “Reciprocating Engines in Distributed Energy and CHP Applications”, 3rd Annual National CHP Roadmap Workshop DER & CHP in Federal Facilities”, Boston, October 23-25.
Wooley, R. and V. Putsche. 1996. “Development of an ASPEN PLUS Physical Property Database for Biofuels Components”, NREL/TP-425-20685, April.

Conversion Technology Final Report
Catalytic Cracking Technology Assessment Task 1.3.3B May 31, 2004

i
Table of Contents Conversion Technology Final Report ............................................................................................................ i Table of Contents........................................................................................................................................... i Introduction................................................................................................................................................... 1 Design Basis.................................................................................................................................................. 1 ASPEN Plus® Implementation..................................................................................................................... 3
Components............................................................................................................................................ 3 Physical Property Option Sets ................................................................................................................ 5 Flowsheet................................................................................................................................................ 5
Material and Energy Balance Results ......................................................................................................... 13 Economic Analysis ..................................................................................................................................... 16
Capital Costs......................................................................................................................................... 16 Operating Costs .................................................................................................................................... 17
Summary and Conclusions ......................................................................................................................... 19 Abbreviations and Acronyms ..................................................................................................................... 21 Bibliography ............................................................................................................................................... 22 Source Reference Notes ............................................................................................................................. 23
1
Introduction A material and energy balance has been completed for the plastics catalytic cracking facility. The design is based primarily on the H.Smart patent40, the Plastics LLC questionnaire41, and communication with Plastics LLC personnel42.
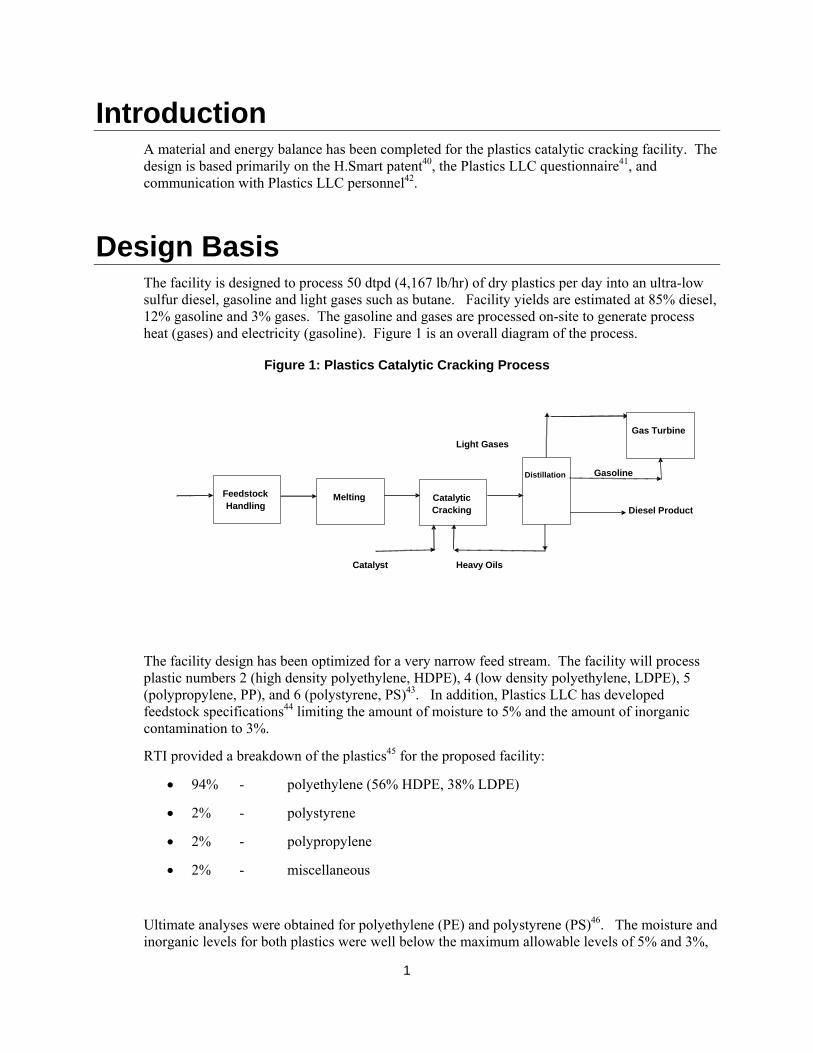
Design Basis The facility is designed to process 50 dtpd (4,167 lb/hr) of dry plastics per day into an ultra-low sulfur diesel, gasoline and light gases such as butane. Facility yields are estimated at 85% diesel, 12% gasoline and 3% gases. The gasoline and gases are processed on-site to generate process heat (gases) and electricity (gasoline). Figure 1 is an overall diagram of the process.
Figure 1: Plastics Catalytic Cracking Process
Light Gases
Gasoline
Diesel Product
Catalyst Heavy Oils
Melting Catalytic Cracking
Feedstock Handling
Distillation
Gas Turbine
The facility design has been optimized for a very narrow feed stream. The facility will process plastic numbers 2 (high density polyethylene, HDPE), 4 (low density polyethylene, LDPE), 5 (polypropylene, PP), and 6 (polystyrene, PS)43. In addition, Plastics LLC has developed feedstock specifications44 limiting the amount of moisture to 5% and the amount of inorganic contamination to 3%.
RTI provided a breakdown of the plastics45 for the proposed facility:
• 94% - polyethylene (56% HDPE, 38% LDPE)
• 2% - polystyrene
• 2% - polypropylene
• 2% - miscellaneous
Ultimate analyses were obtained for polyethylene (PE) and polystyrene (PS)46. The moisture and inorganic levels for both plastics were well below the maximum allowable levels of 5% and 3%,

2
respectively. In order to provide a conservative design of the facility, however, both the moisture and inorganic contents were assumed to be at the maximum levels. The ultimate analysis of polypropylene was estimated based on its molecular formula. Miscellaneous plastics were assumed to be equally distributed between polypropylene and polystyrene.
Using these assumptions, the ultimate analysis of the feedstock is summarized in Table 1.
Table 1: Feedstock Ultimate Analysis
Parameter Value
% Carbon 79.01 % Hydrogen 12.99 % Oxygen 0 % Nitrogen 0.18 % Sulfur 0.07 % Chlorine 0 % Ash 2.75 % Moisture 5
The inorganic fraction of the feedstock will contain metals. RTI provided an estimate of the metal content of the feed47. Although the metal content of the feed was very low (i.e., < 0.5%), the trace metals were included as they can be environmentally significant. The remaining inorganic portion of the feed was assumed to be silicon dioxide (SiO2).
Table 2 summarizes the metal content of the feed.

3
Table 2: Metal Content of Plastic Feed to Catalytic Cracking Unit
Metal Weight Fraction in Plastic, Dry
Aluminum – Al 1.578E-3 Arsenic – As 4.063E-3 Boron – B 2.273E-5 Barium – Ba 5.647E-5 Beryllium – Be 3.286E-6 Cadmium – Cd 7.497E-6 Chromium – Cr 2.519E-5 Copper – Cu 2.434E-5 Iron – Fe 2.428E-3 Mercury – Hg 1.642E-7 Manganese – Mn 3.914E-5 Nickel – Ni 7.556E-6 Lead – Pb 6.46E-5 Antimony – Sb 4.295E-5 Selenium – Se 4.337E-8 Tin – Sn 1.125E-5 Zinc – Zn 1.413E-4
The facility is assumed to operate 329 days/year or 7896 hr/yr.
ASPEN Plus® Implementation The process was modeled using ASPEN Plus®, a steady-state process simulator. ASPEN Plus® is composed of physical property and unit operation models that are combined into a process model. The simulation can be broken into three major sections: components (i.e., chemical species), physical property option sets (e.g., what set of physical property models to use), and the flowsheet (i.e., the series of unit operations). Each of these sections is described in more detail below.
Components Over thirty components were modeled in the simulation. The components were modeled as conventional (e.g., water), conventional solids (e.g., PE) and pseudocomponents (e.g., diesel).
• Conventional
o CO, CO2, NO2, O2, N2, VOC, ammonia, butane, water
• Conventional solids

4
o PE, PP, PS, PE-L, PP-L, PS-L, metals, ash (SiO2)
• Pseudocomponents
o PC275F, PC100F, etc.
Since gasoline and diesel are not specific compounds, but are complex mixtures of hydrocarbons, these mixtures were modeled as a series of pseudocomponents based on the boiling point of each fraction. Pseudocomponents are components used to simulate a mixture of organic compounds (usually hydrocarbons) using composite properties (e.g., MW, boiling point) of the fraction.
The following distillation curve of the product and its density (0.786 g/cm3) from the Smuda patent48 was used to describe the simulation product.
Table 3: Product Distillation Curve
Fraction Volume (%) Temperature ( ºC)
0 48 5 77 7.5 100 10 115 20 153 30 186 40 242 50 265 60 325 70 365 80 372 90 375
From this curve and the density, ASPEN Plus® then defined 40 pseudocomponents based on the boiling points of each fraction, ranging from 100-1000 ºF. Each pseudocomponent is based on a fraction of the hydrocarbons in this boiling range, using the lowest temperature of the boiling range. For example, PC100F are those hydrocarbons that boil between 100 ºF and the lower limit of the next range, 125 ºF (i.e., PC125F). ASPEN Plus® estimates the physical properties of each cut or pseudocomponent including density, MW, heat of formation, etc. and the composite properties of the range are used as if the entire range was composed of a single component (i.e., a pseudocomponent).
As noted earlier, the plastic feed was modeled as three components: polyethylene, polypropylene and polystyrene. None of these components is available in the ASPEN Plus® databanks and so the pertinent physical property data for each was specified. Each component was assumed to be in the cisolid substream and was thus not expected to participate in vapor/liquid equilibrium.
Each polymer was assumed to have a chain length of 577.5. Heat of combustion and heat of fusion data were obtained for each component from Van Krevelen49 and were used to calculate the solid heat of formation for solid (e.g., PE) and melted plastics (PE-L), respectively. Van Krevelen was also the source for the Gibbs Free Energy of Formation estimation methodology50.

5
Heat capacity data were obtained from the ATHAS database51 and the standard density of each polymer was obtained from The Polymer Handbook.52
Table 4 summarizes the physical properties used for the plastic feed components.
Table 4: Plastics Physical Properties
Property PE PP PS
Heat of Combustion, HHV (kJ/kg) 46,500 46,500
41,500
Solid Heat of Formation at 298.15 K (kJ/kg)
-1927 -1927
299.5 Solid Density (kg/m3) 868 900 1119 Solid Heat Capacity (J/kg K) 1.38 2.85
2.72
Solid Gibbs Free Energy of Formation at 298.15 K (kJ/kg)
5.859 3.573
2.48 Heat of Fusion (kJ/g) 0.259 0.207 0.096
Physical Property Option Sets Physical property sets were solids for the solids processing, BK10 for the petroleum section and ideal gas for the remaining sections. Physical property sets used in the simulation were PURE11, SOLIDS, INORGANIC and ASPENPCD.
Flowsheet Five flowsheets were developed for the process: Feedstock Handling (A1000), Catalytic Cracking (A2000), Product Recovery (A3000), Power Generation (A3200), Storage (A5000), and Utilities (A9000). Each of these areas will be briefly discussed and flow diagrams from ASPEN Plus® will be presented. The flow diagrams show only those unit operations modeled in ASPEN Plus®. Equipment used for operations such as conveyance, size reduction, and storage are generally not included in the model and are thus not shown. Similarly, certain complex unit operations (e.g., gas turbine) require several ASPEN Plus® models (e.g., compressors, reactors, heat exchangers). The power requirements of all the equipment, whether included in the model or modeled as several models, are included and are modeled as work streams in the utility section, A9000. Also, costs for all of the equipment are included in the economic analysis.
In the feedstock handling area (Figure 2), the baled feed is received and shredded to < 3 inches53. In the ASPEN model, the power requirements of the shredder and feed handling equipment are calculated based on the feed rate. The wash water is added (M101) at 150% of the feed by the FORTRAN block WWATR. The excess water is removed via centrifugation (SP1001). The wash water and any impurities are sent off the flowsheet (1006).

6
Figure 2: Area 100 Feedstock Handling
1001
1003
1004 A2000
1006
1002
WP1001W
SP1001
P1001

7
As shown in Figure 3, the first operation in the catalytic cracking area (A2000) is the plastic melter (RX2001), modeled as an RYIELD reactor. Here the plastic is heated to 185 ◦C and melted, mixing continuously. Each plastic component is transformed to its liquid counterpart (e.g., PE → PE-L). The heat requirement for this endothermic process is represented in QRX2001.
The melted plastic is then pumped (P2001) to the cracker (RX2002) where it is mixed with a metal silicate catalyst (2007) such as ferrous silicate. Catalyst requirements were assumed to be 7.5% of the feed rate, midrange of the 5-10% specified in the patent54 with catalyst losses being 0.5%55 of the catalyst feed. Only the make-up catalyst is modeled and it is controlled with design-spec CATADD.
During the melting process, ash is broken into its components: sulfur, nitrogen, metals and SiO2 based on the ultimate analysis of the feed. Sulfur in the ash is assumed converted to elemental sulfur; nitrogen is assumed converted to nitrogen gas.
The plastics and catalyst are continually mixed in the cracker and heated to reaction temperature of 385 ºF56. The cracker is also modeled as an RYIELD reactor. Plastics Energy LLC projects the product yields as 3% light ends, 12% gasoline and 85% diesel57. Although the product distillation curve predicts some heavy waxy fractions (i.e., > PC675F), it was assumed that none of these fractions would be produced. This assumption is reasonable as Plastics Energy LLC recycles any waxy products to ensure complete conversion. The light ends are assumed to be butane.
The yields of gasoline and diesel were apportioned among the various pseudocomponents estimated by ASPEN Plus®. The yield of each pseudocomponent was calculated based on its relative percentage calculated from the distillation curve and its projected yield of either gasoline or diesel. For example, component PC100F (hydrocarbon fraction with the lower boiling point of 100 ºF) is present at 4.51% of the product mixture or 20.2% of the mixture, assuming only gasoline and diesel. Thus, it will be present at 2.43% (0.202*12%) in the reaction products.
Most (i.e., 99%) of the impurities (e.g., sulfur, trace metals) in the feed are removed from the reactor with the catalyst (2004) in SP2001. The heat demand for the reactor (QRX2002) is combined with the heat demand from RX2001 in MX2001 to determine the overall heat demand for the process, QRX2000. The cracked gaseous product (2005) is continually withdrawn from the reactor and condensed in (HX2001) with cooling water (9001). The condensed product is sent to A3000, Product Separation.

8
Figure 3: Area 2000 Catalytic Cracking
1004A10002002
2007 2003
QRX2002
2005 2006 A3000
QHX2001
2001
WP2001
WQRX2001
9001 9002
QHX201X
Q
QRX2000Q
2004
RX2002
HX2001+P2001RX2001
HX2001-
QMIXER
MX2001
SP2001

9
The condensed product (2006) is sent to a flash tank (FL3001) where any gases (e.g., butane) are released (3000) and sent to the gas turbine in A3200. The liquid stream (3001) is pumped (P3001) to the distillation column, D3000 as shown in Figure 4.
The column was rigorously modeled in ASPEN Plus® as a RADFRAC model. An atmospheric column with a 0.5 psi pressure drop per stage and a full condenser was assumed for the simulation.
It was assumed that gasoline consisted of those compounds boiling at 300 ºF and above while diesel was composed of compounds boiling below this temperature. To effect the separation, the bottoms rate (i.e., diesel) was specified with a calculator block, DSTLYD, at 85% of the mass of inlet dry, ash-free plastic. These assumptions resulted in 100% recovery of PC275F and below and 99.8% of PC300F in the distillate. PC325F is split almost equally between the distillate (55.3%) and bottoms (44.7%) with 100% recovery of the heavier components in the bottoms.
Table 5 summarizes the results for D3000.
Table 5: Distillation Column Results
Parameter Value
Molar Reflux Ratio 0.58038 Number of Trays 28 Condensor Duty (Btu/hr) 264,290 Reboiler Duty (Btu/hr) 930,240 Feed Tray 20 Temperature Profile Top Tray Temperature (ºF) Bottom Tray Temperature (ºF)
88.3
508.9 Pressure Profile Top Tray Pressure (psi) Bottom Tray Pressure (psi)
16
29.5
A3200, Power Production, is the most complex flowsheet in the simulation and is depicted in Figure 5. This model is used to simulate an AVCO Lycoming T53 turbine by Combustion Associates International (CAI) as specified by Plastics Energy LLC. When operating in simple cycle mode, the T53 has a nominal output of 1 MW58. The required inputs are fuel (3201) and combustion air (3203). The airflow is varied to meet the combustion requirements of the incoming fuel and the power produced is determined. Air enters the first compressor stage (CP-32-01) where it is compressed to 25 psi. It is further compressed to 45 psi (CP-32-02) and then to 135 psi (CP-32-03). The booster compressor (CP-32-04) completes the compression to 200 psi. Small amounts of air are withdrawn from each compressor, except the booster, and are diverted to maintain the gas turbine firing temperature of roughly 1700 °F. This diversion is controlled by the calculator block AIRCOOL; the amount of air withdrawn as well as the firing temperature are machine-specific.

10
Figure 4: Area 3000 Product Recovery
2006A2000
3000 A4000
3001
3002
WP3001
W
3003
A3200
3004
QD3000
Q
3005
W
FL3001
P3001
D3000
P3002

11
3003
A3000
3203 3204
WCP-3201
3205
3206
3207
WCP-3202
3208
3209
3210
WCP-3203
3211
3213
3212
3217
QRX-3201
QRX3201LQ
QRX3201RA4000
3219
3218
QFL-3201Q
3220
WCP-3205
32223223
A4000
3214
QHX-3201
Q
3215
WCP-3204W
WGT-3201
WGTPOWERW
WGTLOST
W
WPLANT
W
WP3202
W
CC-32-01
CP-32-01 SP-32-01
CP-32-02 SP-32-02
CP-32-03 SP-32-03
MX-32-02 RX-32-01
QSP-32-04
FL-32-01
CP-32-05
MIXER
MX-32-03
CP-32-06
MIXER
MX-32-04
HX-32-01
CP-32-04
W
MIXER
MX-32-05
W
SP-32-05
P3202
Figure 5: Area 3200 Gas Turbine
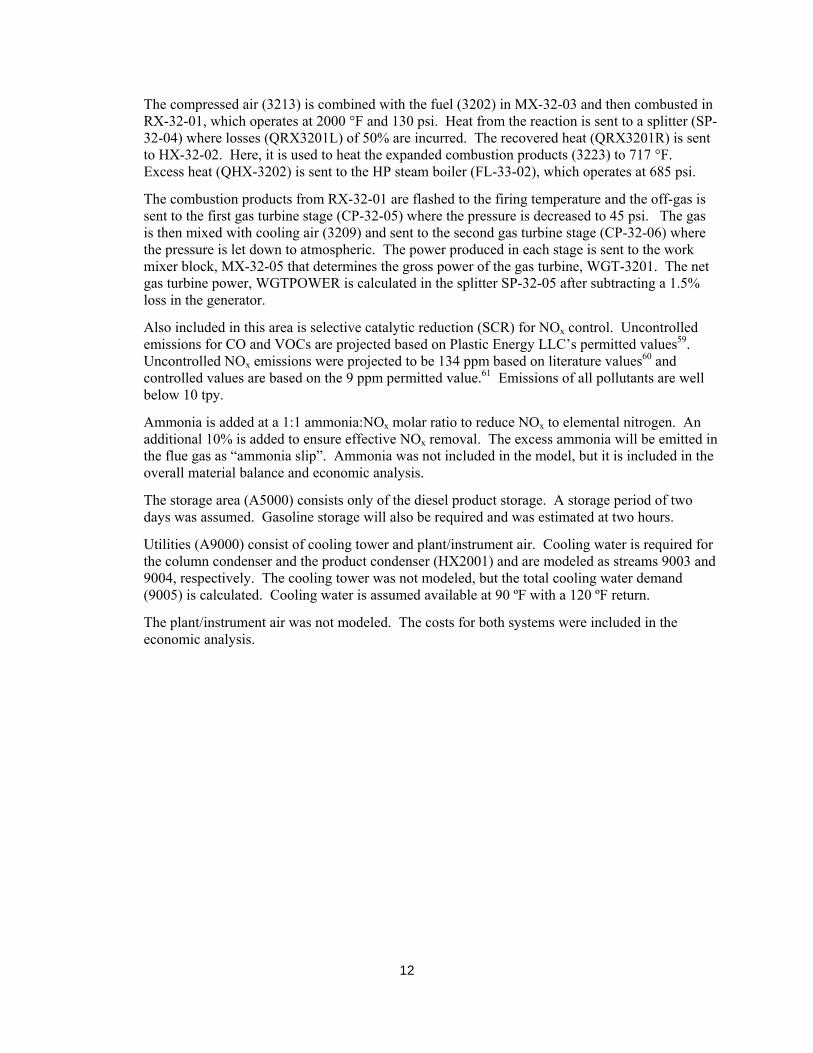
12
The compressed air (3213) is combined with the fuel (3202) in MX-32-03 and then combusted in RX-32-01, which operates at 2000 °F and 130 psi. Heat from the reaction is sent to a splitter (SP-32-04) where losses (QRX3201L) of 50% are incurred. The recovered heat (QRX3201R) is sent to HX-32-02. Here, it is used to heat the expanded combustion products (3223) to 717 °F. Excess heat (QHX-3202) is sent to the HP steam boiler (FL-33-02), which operates at 685 psi.
The combustion products from RX-32-01 are flashed to the firing temperature and the off-gas is sent to the first gas turbine stage (CP-32-05) where the pressure is decreased to 45 psi. The gas is then mixed with cooling air (3209) and sent to the second gas turbine stage (CP-32-06) where the pressure is let down to atmospheric. The power produced in each stage is sent to the work mixer block, MX-32-05 that determines the gross power of the gas turbine, WGT-3201. The net gas turbine power, WGTPOWER is calculated in the splitter SP-32-05 after subtracting a 1.5% loss in the generator.
Also included in this area is selective catalytic reduction (SCR) for NOx control. Uncontrolled emissions for CO and VOCs are projected based on Plastic Energy LLC’s permitted values59. Uncontrolled NOx emissions were projected to be 134 ppm based on literature values60 and controlled values are based on the 9 ppm permitted value.61 Emissions of all pollutants are well below 10 tpy.
Ammonia is added at a 1:1 ammonia:NOx molar ratio to reduce NOx to elemental nitrogen. An additional 10% is added to ensure effective NOx removal. The excess ammonia will be emitted in the flue gas as “ammonia slip”. Ammonia was not included in the model, but it is included in the overall material balance and economic analysis.
The storage area (A5000) consists only of the diesel product storage. A storage period of two days was assumed. Gasoline storage will also be required and was estimated at two hours.
Utilities (A9000) consist of cooling tower and plant/instrument air. Cooling water is required for the column condenser and the product condenser (HX2001) and are modeled as streams 9003 and 9004, respectively. The cooling tower was not modeled, but the total cooling water demand (9005) is calculated. Cooling water is assumed available at 90 ºF with a 120 ºF return.
The plant/instrument air was not modeled. The costs for both systems were included in the economic analysis.

13
Material and Energy Balance Results A block flow diagram, shown in Figure 7, was developed to show all of the inputs and outputs for the plastics catalytic cracking process. Internal streams (e.g., flow from melter to cracker) are modeled within the ASPEN Plus® simulation, but since they have no impact outside the process boundaries, they are not included here.
Figure 6
A summary of the inputs and outputs are contained below in Tables 5 and 6, respectively.
Water Wastewater Catalyst
Baled Plastic Spent Catalyst &Contaminants
Water
Combustion VOCEmissions Emissions
ElectricityBoiler for InternalBlowdown Use
VOCEmissions
Process Steam
Compressor ElectricityCatalysts Spent Catalyst Losses
Diesel ProductAmmonia Combustion
Air
Plastics Catalytic Cracking Block Flow Diagram
Waste Heat Recovery Boiler
FeedShredding
FeedCleaning Melting Cracker
Distillation
DieselStorage
Air Pollution Control
GasTurbine/Heater

Table 6: Overall Catalytic Cracking Inputs (lb/hr)
Total Mass In: 47,184 lb/hr
Baled Plastic Water
Cracking Catalyst
Combustion Air Ammonia
SCR Catalyst
Boiler Water
IN/OUT IN IN IN IN IN IN INBFD Stream No. 1 2 3 4 5 6 7ASPEN Stream 1001 1002 2007 3203 NA NA NA
Component (lb/hr) (lb/hr) (lb/hr) (lb/hr) (lb/hr) (ft3/hr) (lb/hr)Total Flow 4,386 625 2 42,108 2 1 61
Components BUTANE 0.00 0.00 0.00 0 CO2 0.00 0.00 0.00 21 CO 0.00 0.00 0.00 0 O2 0.00 0.00 0.00 9,720 N2 0.00 0.00 0.00 32,101 H2 0.00 0.00 0.00 0 AR 0.00 0.00 0.00 0 NO2 0.00 0.00 0.00 0 SO2 0.00 0.00 0.00 0 VOC 0.00 0.00 0.00 0 H2O 219.30 625.05 0.00 265 GASOLINE 0.00 0.00 0.00 0 60.64 DIESEL 0.00 0.00 0.00 0 PE 3793.28 0.00 0.00 0 PP 121.06 0.00 0.00 0 PS 121.06 0.00 0.00 0 PE-L 0.00 0.00 0.00 0 PP-L 0.00 0.00 0.00 0 PS-L 0.00 0.00 0.00 0 0.63 FE-SI 0.00 0.00 1.67 0 1.52 S 0.00 0.00 0.00 0 ASH 131.59 0.00 0.00 0 AL 6.58E+00 AS 1.69E+01 B 9.47E-02 BA 2.35E-01 BE 1.37E-02 CD 3.12E-02 CR 1.05E-01 CU 1.01E-01 FE 1.01E+01 HG 6.84E-04 MN 1.63E-01 NI 3.15E-02 PB 2.69E-01 SB 1.79E-01 SE 1.81E-04 SN 4.69E-02 ZN 5.89E-01
Catalytic Cracking Inputs

15
Table 7: Catalytic Cracking Process Outputs (lb/hr)
Total Out = 47,182 lb/hr
Based on this balance, the total mass closure is 100%. Storage emissions are minimal and were calculated based on AP-42 emission methods using the TANKS 4.0 program62 Due their small mass relative to the process, they were not included in the simulation; however, they can be added in the next revision. Distillation emissions were zero based on the ASPEN Plus® simulation.
Most (90%) of the trace metals in the feed were assumed to leave the process with the spent catalyst. The remaining 10% was assumed to leave with the diesel product.
As noted earlier, the CAI turbine selected by Plastics Energy LLC has an output of roughly 1 MW, when operating on natural gas. Plastics LLC personnel have stated that the facility will produce roughly 1 MW and import 500 kW from the grid.63 The ASPEN Plus® simulation shows good agreement with these projections and currently estimates a turbine output of 1.1 MW.
The process has three steam demands: melting in RX2001 (0.44 MM Btu/hr), cracking (1.27 MM Btu/hr) and distillation (0.93 MM Btu/hr). As noted earlier, 150 psig steam (425 ºF superheat) is generated from combustion of the gasoline fraction and heat recovery from the gas turbine exhaust. By cooling the exhaust gases of the turbine to 676 ºF, the heat demands of the
Catalytic Cracking Output Streams
Combustion Emissions Wastewater
Spent Catalyst Distillation Storage
Diesel Product Electricity
Spent SCR
CatalystBoiler
BlowdownCompressor
LossesIN/OUT OUT OUT OUT OUT OUT OUT OUT(IN) OUT OUT OUT
BFD Stream No. 8 9 10 11 12 13 14 15 16ASPEN Stream 4003 1006 2004 NA NA 3005 WGTPOWER NA NA 3215
Component (lb/hr) (lb/hr) (lb/hr) (lb/hr) (lb/hr) (lb/hr) (kW) (lb/hr) (lb/hr) (lb/hr)Total Flow 40,780 967 121 0 0.02 3,260 -500 1 61 1,994
Components BUTANE 0.00 0.00 0.00 0.00 0.00 CO2 2046.03 0.00 0.00 0.00 0.00 CO 1.29 0.00 0.00 0.00 0.00 O2 6954.62 0.00 0.00 0.00 0.00 N2 30588.76 0.00 0.00 0.00 H2 0.00 0.00 0.00 0.00 0.00 AR 0.00 0.00 0.00 0.00 1.01 NO2 0.28 0.00 0.00 0.00 0.00 SO2 0.00 460.32 VOC 0.34 0.00 0.00 0.00 1520.25 H2O 1188.22 84.43 0.00 0.00 0.00 GASOLINE 0.00 0.00 0.00 0.47 60.64 0.00 DIESEL 0.28 0.00 0.00 0.02 3258.13 0.00 PE 0.00 0.00 0.00 0.00 0.00 PP 0.00 0.00 0.00 0.00 0.00 PS 0.00 0.00 0.00 0.00 0.00 PE-L 0.00 0.00 0.00 0.00 0.00 PP-L 0.00 0.00 0.00 0.00 0.00 PS-L 0.00 0.00 0.00 0.00 0.63 0.00 FE-SI 0.00 0.00 1.67 0.00 0.00 S 0.00 0.00 0.00 0.00 0.00 ASH 0.00 1.32 98.19 0.99 0.00 AL 6.32E+00 6.38E-02 0.00 AS 1.63E-03 1.64E-05 0.00 B 9.09E-02 9.18E-04 0.00 BA 2.26E-01 2.29E-03 0.00 BE 1.32E-02 1.33E-04 0.00 CD 3.00E-02 3.03E-04 0.00 CR 1.01E-01 1.02E-03 0.00 CU 9.73E-02 9.83E-04 0.00 FE 9.72E+00 9.82E-02 0.00 HG 0.00E+00 0.00E+00 0.00 MN 1.57E-01 1.58E-03 0.00 NI 3.03E-02 3.06E-04 0.00 PB 2.59E-01 2.61E-03 0.00 SB 1.72E-01 1.74E-03 0.00 SE 1.74E-04 1.76E-06 0.00 SN 4.48E-02 4.53E-04 0.00 ZN 5.66E-01 5.72E-03 0.00

16
facility are readily met. This exhaust temperature will be sufficient (e.g., above dew point) for the facility stack.
The facility also has cooling demands for the column condenser (0.26 MM Btu/hr) and for the product condenser (1.8 MM Btu/hr). Approximately 110 gpm of cooling water with a 30 ºF temperature differential is required.
Economic Analysis Both capital and operating costs were developed for the plastics catalytic cracking technology. Feedstock costs were not included in the analysis and all costs were based on 2003$. No financial analyses were performed as they are outside the scope of this effort.
Capital Costs Using the mass balance derived above, equipment costs were developed for all of the major unit operations in the simulation. Most of the equipment was estimated using ASPEN ICARUS Questimate® cost estimating software. The cost for the plastic shredder was obtained from Eurohansa64, a vendor of plastic shredders and the cost for the SCR system was estimated from literature65.
The equipment costs were increased by 25% to cover any omitted equipment and the uncertainty inherent in a conceptual analysis. Although the facility will be a first of its kind in the U.S., a similar facility has been operating for several years in Poland and most of the equipment (e.g., distillation, plastics melting) is mature technology. Thus, no further contingency was assessed.
The resulting costs by area are provided below in Table 8.
Table 8: Installed Equipment Costs
Equipment Area Installed Cost
A1000 - Feed Handling $905,621A2000 - Catalytic Cracking $2,878,714A3000 – Product Recovery $231,939A3200 – Power Production $3,588,982A5000 – Storage $173,459A9000 – Utilities $121,322Contingency $1,975,010Total Installed Equipment $9,875,046
Using this installed equipment cost, the total project investment was determined using a standard factor methodology. Table 9 summarizes the total project investment for the facility.

17
Table 9: Total Project Investment
Component Value Basis
Total Equipment Cost Warehouse Site Development
$9,875,046$148,126$361,465
Questimate®, Literature and Vendors 1.5% of Equipment Costs 9% of ISBL
Total Installed Cost (TIC) $10,384,636 Sum of above Indirect Costs Field Expenses Home Office & Constr. Fee Project Contingency
$2,076,927$2,596,159
$311,539
20% of TIC 25% of TIC 3% of TIC
Total Capital Investment (TCI) $15,369,261 Sum of Above Other Costs (Startup) $1,536,926 10% of TCI Total Project Investment $16,906,187 Sum
Plastics LLC has stated that the warehouse and other costs will be higher than that projected. However, to keep the CT assessments on a consistent basis, the factored method used in the other studies was also used for this study.
Operating Costs Both variable and fixed operating costs were projected for the technology. Variable costs are composed of material costs and other costs that depend on the hours of operation. Fixed costs are costs such as labor and overhead, which are independent of the production rate.
Material demands were projected based on the material balance produced by ASPEN Plus®. Unit operating costs were obtained from the December 22-29, 2003 Chemical Market Reporter, in-house, or literature values. All values not in 2003$ were converted to this basis using the SRI Inorganic Chemical Index66. These unit costs were then applied to the demand of each raw material and the assumed operating period of 7986 hours to project the annual variable operating costs.
Two types of catalyst are used in the process: metal silicates for cracking and an SCR catalyst. The lifetime of the SCR catalyst is estimated at 7 years and the amount of catalyst replacement required is 30 m3/MW annually67. Plastics Energy LLC estimates that 1100 lbs of catalyst/month (0.04%) is fouled and must be replaced68. This replacement rate is highly dependent upon the level of impurities in the feed.
Three types of wastes will be generated by the facility: wastewater from feed washing, spent cracking catalyst and spent SCR catalyst. The wastewater and non-hazardous cracking catalyst can be disposed of for $0.01/lb. Disposal of the SCR catalyst will be more expensive and was estimated at $0.10/lb ($15/ft3) based on literature values69.

18
Table 10: Unit Operating Costs
Inputs Unit Cost Source
Ammonia $265/ton Chemical Market Reporter Water $0.13/1000 lb NREL experienceCracking Catalyst $9-50/lb NREL experience70
SCR Catalyst $400/ft3 ONSITE SYCOM EnergyElectricity $0.15/kWh RTI
Outputs Unit Cost Source
Diesel Credit $0.94/gal EIA – Weekly Petroleum Status Report
Wastewater $0.01/lb NREL experienceSolid waste $0.01/lb NREL experienceSCR catalyst waste $0.10/lb ($15/ft3, 143.5
lb/ft3)ONSITE SYCOM Energy
As noted in the table, the cost of the cracking catalyst can range from $9/lb for a very large facility to $50/lb for small facilities. Catalyst prices are generally vendor secrets, negotiated for each application, and are not available in the literature. Since this facility is relatively small and is the first of its kind in the U.S., the high end of the range was conservatively selected.
Based on these factors and the material and energy balance, it is estimated that the variable operating costs of the facility are $755,000. The largest costs at $658,000 and $592,000 are the cracking catalyst and electricity, respectively. As noted above, the cost of the cracking catalyst could be considerably less (e.g., $120,000/yr), depending on the size of the facility and the agreement reached with the catalyst vendor.
These operating costs are more than off-set by the revenue generated from diesel fuel ($3.4 million). Thus, the overall variable operating cost for the facility is actually a net revenue of $2.1 million.
Fixed operating costs, composed of labor, maintenance, overhead, taxes and insurance were also determined. The number, expertise and salaries of personnel required to operate the facility was estimated based on NREL experience. Salaries were scaled from earlier NREL work71 using the Bureau of Labor Statistics’ labor index for Chemical and Allied Trade Workers72.

19
Table 11 summarizes the salaries and number of employees required, resulting in an annual cost of $887,500.
Table 11: Employee Requirements
Employee Number Required Annual Salary
Plant/General Manager 1 $121,600 Plant Engineer/Maintenance Supervisor
1 $79,000
Lab Manager/Chemist 1 $60,780 Shift Supervisor 3 $45,000 Maintenance Tech 3 $34,000 Shift Operators 12 $30,400 Administrative Assistants 1 $24,300
The remaining fixed operating costs were calculated as percentages of the total labor or capital costs (e.g., equipment). Overhead/maintenance is factored at 60% of labor while maintenance and insurance/taxes are each 2% of equipment and TPI, respectively for a total of almost $1 million.
The overall cash cost for the facility is thus projected to be a net credit of $194,124. Table 12 provides a break down of these costs.
Table 12: Cash Cost Summary
Cost Value
Raw Materials (excl. feedstock) $662,390 Waste Streams $93,237 Electricity $592,200 Product Credits ($3,413,013) Labor $887,480 Other Fixed Operating Costs $981,749 Total Cash Cost ($194,124)
Summary and Conclusions A material and energy balance and economic analysis was conducted for a plastics catalytic cracking facility. The facility design was based primarily on the Smuda technology, as defined in U.S. Patent 6,255,547 and information from Plastics Energy LLC.

20
The facility will process 50 dtpd of polyolefin plastic, converting the plastic to light gases (3%), gasoline (12%) and low-sulfur diesel (85%). The facility will combust the gases and gasoline for process heat and power using a dual-fired gas turbine. The process will be self-sufficient in both energy, but will need to import roughly 500 KW of power. Inputs and outputs to the system were quantified for use in a life cycle analysis.
The total capital investment for the facility was estimated at almost $17 million with a net revenue of almost $200,000, excluding feedstock costs and capital charges.

21
Abbreviations and Acronyms
CAI – Combustion Associates International
CO – carbon monoxide
dtpd – dry tons per day
HDPE – high density polyethylene
ISBL – inside battery limits
LDPE – low density polyethylene
NOx – nitrogen oxides (i.e., NO and NO2)
PE – polyethylene
PE-L – melted polyethylene
PP – polypropylene
PP-L – melted polypropylene
PS – polystyrene
PS-L – melted polystyrene
SCR – selective catalytic reduction
TCI – total capital investment
TIC – total installed capital
TPI – total project investment
VOC – volatile organic compound

22
Bibliography ATHAS. 2003. Advanced Thermal Analysis System, http://web.utk.edu/~athas/, Accessed December 9, 2003.
Brandrup, J., E. Immergut, E. Grulke (eds.). 1999. The Polymer Handbook, 4th ed., Wiley, New York.
Buckle, L. 2003. Personal communication, December 12.
Bureau of Labor Statistics , U.S. Department of Labor, Career Guide to Industries, 2002-03 Edition, Chemicals Manufacturing, Except Drugs, on the Internet at http://www.bls.gov/oco/cg/cgs008.htm (visited January 5, 2004).
Chemical Market Reporter, December 22-29, 2003.
Douglas, J.M. Conceptual Design of Chemical Processes, McGraw-Hill Book Company, New York, 1988.
Eurohansa. 2004. “Quotation No.: 15237, ZENO Low Noise, Single-Shaft Shredder”, from Mark Reid, Sales Manager to V. Putsche, NREL, February 11.
Onsite Sycom Energy Corporation. 1999. “Cost Analysis of NOx Control Alternatives for Stationary Gas Turbines”, Contract No. DE-FC02-97CHIO877, Prepared for U.S. Department of Energy, November 5.
Plastics Energy LLC. Undated. “Plastics Feedstock Specification”, obtained December 2003.
Plastics Energy LLC. 2003. “UC-Davis Questionnaire”.
Smuda, H. 2001. “Method of Obtaining Liquid Fuels from Polyoloefine Wastes, United States Patent 6,255,547 B1, July 3.
Tillman, D.A. 1991. The Combustion of Solid Fuels and Wastes, Academic Press Inc., San Diego.
U.S. EPA. 1998. “Compilation of Air Pollutant Emission Factors, AP-42, Fifth Edition, Volume I: Stationary Point and Area Sources”, http://ww.epa.gov/ttn/chief/ap42/, accessed January 16, 2004.
Van Krevelen, D.W. 1997. Properties of Polymers, 3rd edition, Elsevier, Amsterdam.
Zapata, A. 2004. “CatalyticCrack_Waste_ElementalComposition.xls” in “Catalytic cracking feedstock”, Email to V. Putsche of NREL, February 3.

23
Source Reference Notes

24
Source Reference Notes

25
Source Reference Notes
1 Personal communication with Tim Judge, Masada, February 24. 2 Wooley, R. and V. Putsche. 1996., pg. 29. 3 Energy Products of Idaho. 2003. Proposal #1392, from M. Murphy to L. Montague,
Harris Group Inc. May 16. 4 Ruth, M. 1999. “Process & Economic model of Immobilized enzyme (with
concentrated acid hydrolysis), C Milestone Completion Report”, June 1. 5 Kadam, K. and M. Yancey. 1997. “Biomass to Ethanol Facility Design, Cost Estimate,
and Financial Evaluation”, Volume I, NREL, 1997. 6 SRI Chemical Economics Handbook. 1997. 7 Oxy-Fuel News. 2004. “Fuel Ethanol Terminal Market Price – 18-Month History”,
http://www.energy.ca.gov/gasoline/graphs/ethanol_18-month.html, Accessed March 18, 2004. 8 Ruth, M. 1999. “Process & Economic model of Immobilized enzyme (with
concentrated acid hydrolysis), C Milestone Completion Report”, June 1. 9 Bureau of Labor Statistics , U.S. Department of Labor, Career Guide to Industries, 2002-03 Edition, Chemicals Manufacturing, Except Drugs, on the Internet at http://www.bls.gov/oco/cg/cgs008.htm (visited January 5, 2004).

26
10 Menville, Jr. R. 2003. “UC-Davis Questionnaire”. 11 Menville, Jr. R. SWERF ME Powerpoint presentation, undated. 12 Menville, Jr. R.. 2004. Personal communication, January 15. 13 Menville, Jr. R. 2004. “Re: FW: Final questions for Ron Menville of Brightstar. 14 SWERF ME. 15 Los Angeles Waste Composition 16 San Francisco Waste Composition 17 SWERF ME, pg. 2. 18 SWERF ME. 19 ASME 1987 20 Wooley, R. and V. Putsche. 1996., pg. 29. 21 Information from Brightstar Environmental. 2004. 22 SWERF ME. 23 Bautista, P. 1999. “Developments in Reciprocating Engines and Industrial Gas
Engines”, ONSITE SYCOM Energy Corporation, November 9, pg. 10. 24 Wartsila. 2002. “Reciprocating Engines in Distributed Energy and CHP Applications”,
3rd Annual National CHP Roadmap Workshop”, Boston, October 23-25, pg. 5. 25 Ibid., pg. 2. 26 SWERF ME, “Electrical Output Sensitivity”, pg. 5. 27 Information from Brightstar Environmental. 2004. 28 “NOx Control Techniques Applicable to Municipal Waste Combustion”,
http://www.epa.gov/ORD/WebPubs/projsum/600sr94208.pdf. 29 SWERF ME, “Electrical Output Sensitivity”, pg. 5. 30 Wartsila presentation 31 Niessen et al. 1996. “Evaluation of Gasification and Novel Thermal Processes for the
Treatment of Municipal Solid Waste”, NREL/TP-430-21612, August. 32 Putsche, V. 1999. “Complete process and economic model of syngas fermentation to
ethanol”, NREL C-Milestone Completion Report, August 16.
33 Energy Products of Idaho.2003. “NREL Budget Quote for Fluid Bed Boiler”, Proposal #1392, May 16.

27
34 Ibid., pg. 4-2. 35 Krishnan, R. 2001. “SCR Economics for Diesel Engines”, Diesel & Gas Turbine
Worldwide, July-August, pp. 62-63. 36 Mann, M.K. and P.L. Spath. 1997. “Life Cycle Assessment of a Biomass Gasification Combined-Cycle System”, NREL/TP-430-23076, December, pg. 22.
37 SRI Chemical Economics Handbook. 1997. 38 Ruth, M. 1999. “Process & Economic model of Immobilized enzyme (with
concentrated acid hydrolysis), C Milestone Completion Report”, June 1. 39 Bureau of Labor Statistics , U.S. Department of Labor, Career Guide to Industries, 2002-03 Edition, Chemicals Manufacturing, Except Drugs, on the Internet at http://www.bls.gov/oco/cg/cgs008.htm (visited January 5, 2004).
40 Smuda, 2001. “Method of Obtaining Liquid Fuels from Polyoloefine Wastes, United
States Patent 6,255,547 B1, July 3. 41 Plastics Energy LLC. 2003. “UC-Davis Questionnaire”. 42 Buckle, L. 2003. Personal communication, December 12. 43 Plastics Energy LLC Questionnaire, pg. 1 44 Plastics Energy LLC Feedstock Specification 45 Alexandra Zapata, “Catalytic cracking feedstock”,
CatalyticCrack_Waste_ElementalComposition.xls. 46 David Tillman, The Combustion of Solid Wastes, pg. 237. 47 LA County Feedstock. RTI. 2004. 48 Smuda, 2001. Table No. 3. 49 Van Krevelen. 1990. Table 5.6 50 Ibid. Table IX. 51 ATHAS. 2003. Advanced Thermal Analysis System, http://web.utk.edu/~athas/,
Accessed December 9, 2003. 52 Brandrup, J., E. Immergut, E. Grulke (eds.). 1999. The Polymer Handbook, 4th ed.,
Wiley, New York. 53 Plastics LLC Questionnaire 54 Smuda, 2001. column 4. 55 Personal communication with Larry Buckle of Plastics LLC, December 12, 2003.
Based on 1100 lbs/catalyst replaced/month, 7.5% of feed rate catalyst demand, 330 days of operation per year.

28
56 Smuda, 2001. Column 2. 57 Plastics LLC Questionnaire 58 Combustion Associates, Inc. 2004. http://www.cai3.com/1mwtg/overview.html,
accessed 01/19/04. 59 Personal communication with L. Buckle, Plastic LLC, 60 ONSITE SYCOM. 1999., pg. 61 Personal communication with Larry Buckle of Plastics Energy LLC, December 12,
2003. 62 U.S. EPA. 1995. “Compilation of Air Pollutant Emission Factors, AP-42, Fifth Edition,
Volume I: Stationary Point and Area Sources”, http://www.epa.gov/ttn/chief/ap42/ 63 Personal communication with Larry Buckle of Plastics Energy LLC, December 12,
2003. 64 Eurohansa. 2004. “Quotation No.: 15237, ZENO Low Noise, Single-Shaft Shredder”,
from Mark Reid, Sales Manager to V. Putsche, NREL, February 11. 65 Onsite SYCOM. 1999. 66 SRI Chemical Economics Handbook. 1997. 67 Onsite SYCOM. 1999. 68 Personal communication with Larry Buckle of Plastics LLC, December 12, 2003.
Based on 1100 lbs/catalyst replaced/month, 7.5% of feed rate catalyst demand, 330 days of operation per year.
69 Onsite SYCOM. 1999. 70 Personal communication with J. Jechura and Kim Magrini-Bair of NREL, January 30,
2003. 71 Ruth, M. 1999. “Process & Economic model of Immobilized enzyme (with
concentrated acid hydrolysis), C Milestone Completion Report”, June 1. 72 Bureau of Labor Statistics , U.S. Department of Labor, Career Guide to Industries, 2002-03 Edition, Chemicals Manufacturing, Except Drugs, on the Internet at http://www.bls.gov/oco/cg/cgs008.htm (visited January 5, 2004).
Related Documents