A-1 Adopted 14 June 2011 / Amended 28 January 2014 / Amended 24 March 2020 Regulating Code Glossary Appendix A Regulating Code Glossary Purpose This section provides definitions of terms and phrases used in the Regulating Code that are technical or specialized, or that may not reflect common usage. If a definition in this section conflicts with a definition in another provision of the Municipal Code, these definitions shall control for the purposes of this Regulating Code. If a word or phrase used in this Regulating Code is not defined in this section, or in the City of King Municipal Code, the Director shall determine the correct definition, giving deference to common usage. Definitions of Specialized Terms and Phrases As used in this Regulating Code, the following terms and phrases shall have the meaning ascribed to them in this section, unless the context in which they are used clearly requires otherwise. Adverse Impact: The negative consequences of the use of a building on adjacent lots, usually as a result of noise, vibration, odor, pollution, or socioeconomic disruption. The noise level emanating from the building, as measured at the property line, shall not exceed that of 25 mph traffic noise. Negative consequences resulting from the use of the building and confined within the lot boundary are not considered to create Adverse Impact. Alcoholic Beverage Sales - Off-Premise: The retail sale of beer, wine, and/or spirits in sealed containers for off-site consumption, either as part of another retail use, or as a primary business activity. Alcoholic Beverage Sales - On-Premise: The sale of beer, wine, and/or spirits for on-site consumption, limited to premises that contain a kitchen or food-servicing area in which a variety of food is prepared and cooked. The primary use of the premises shall be for sit-down food service to patrons. The premises shall serve food to patrons during all hours the establishment is open for customers. No alcoholic beverages, including beer or wine shall be sold or dispensed for consumption beyond the premises. The premises shall be defined as a “bona fide public eating place” by the State of California Department of Alcoholic Beverage Control. Arcade: A Frontage Type created by projecting a building’s upper floors above the sidewalk while aligning the ground floor facade with the property line. Arcades typically contain ground-floor storefronts, making this frontage type is ideal for retail use. A colonnade structurally and visually supports the building mass that encroaches into the public right-of-way. See Section 3.5. ATM: An automated teller machine (computerized, self-service machine used by banking customers for financial transactions, including deposits, withdrawals and fund transfers, without face-to-face contact with financial institution personnel), located outdoors at a bank, or in another location. Does not include drive-up ATMs, which are instead included under the definition of “Drive-Through Retail.” Automotive - Sales, Parts, Repair, Storage: Any facility that sells automobiles or automobile parts, provides general repair services to automobiles (including body repairs, engine overhaul, upholstery work, parts rebuilding and like activities), or provides long-term vehicle storage. Awning: A lightweight roof structure typically constructed of fabric on a supporting framework that projects from and is supported by the exterior wall of a building. Canvas awnings may cover balconies or Shopfronts, but only in shed configurations. Quarter sphere or quarter cylinder configurations are not permitted. Bank, Financial Services: Financial institutions including: banks and trust companies, credit agencies, holding (but not primarily operating) companies, lending and thrift institutions, other investment companies, securities/commodity contract brokers and dealers, security and commodity exchanges, vehicle finance (equity) leasing agencies. See also, “ATM” Does not include check cashing stores, which are instead defined under “Personal Services - Restricted.” Bar, Tavern, Night Club: Bar, Tavern: A business where alcoholic beverages are sold for on-site consumption, which are not part of a larger restaurant. Includes bars, taverns, pubs, and similar establishments where any food service is subordinate to the sale of alcoholic beverages. May also include beer brewing as part of a microbrewery (“brew-pub”), and other beverage tasting facilities.

Welcome message from author
This document is posted to help you gain knowledge. Please leave a comment to let me know what you think about it! Share it to your friends and learn new things together.
Transcript
A-1
Adopted 14 June 2011 / Amended 28 January 2014 / Amended 24 March 2020
Regulating Code Glossary
Appendix A
Regulating Code Glossary
Purpose
This section provides definitions of terms and phrases used in the Regulating Code that are technical or specialized, or that may not reflect common usage. If a definition in this section conflicts with a definition in another provision of the Municipal Code, these definitions shall control for the purposes of this Regulating Code. If a word or phrase used in this Regulating Code is not defined in this section, or in the City of King Municipal Code, the Director shall determine the correct definition, giving deference to common usage.
Definitions of Specialized Terms and Phrases
As used in this Regulating Code, the following terms and phrases shall have the meaning ascribed to them in this section, unless the context in which they are used clearly requires otherwise.
Adverse Impact: The negative consequences of the use of a building on adjacent lots, usually as a result of noise, vibration, odor, pollution, or socioeconomic disruption. The noise level emanating from the building, as measured at the property line, shall not exceed that of 25 mph traffic noise. Negative consequences resulting from the use of the building and confined within the lot boundary are not considered to create Adverse Impact.
Alcoholic Beverage Sales - Off-Premise: The retail sale of beer, wine, and/or spirits in sealed containers for off-site consumption, either as part of another retail use, or as a primary business activity.
Alcoholic Beverage Sales - On-Premise: The sale of beer, wine, and/or spirits for on-site consumption, limited to premises that contain a kitchen or food-servicing area in which a variety of food is prepared and cooked. The primary use of the premises shall be for sit-down food service to patrons. The premises shall serve food to patrons during all hours the establishment is open for customers. No alcoholic beverages, including beer or wine shall be sold or dispensed for consumption beyond the premises. The premises shall be defined as a “bona fide public eating place” by the State of California Department of Alcoholic Beverage Control.
Arcade: A Frontage Type created by projecting a building’s upper floors above the sidewalk while aligning the ground floor facade with the property line. Arcades typically contain ground-floor storefronts, making this frontage type is ideal for retail use. A colonnade structurally and visually supports the building mass that encroaches into the public right-of-way. See Section 3.5.
ATM: An automated teller machine (computerized, self-service machine used by banking customers for financial transactions, including deposits, withdrawals and fund transfers, without face-to-face contact with financial institution personnel), located outdoors at a bank, or in another location. Does not include drive-up ATMs, which are instead included under the definition of “Drive-Through Retail.”
Automotive - Sales, Parts, Repair, Storage: Any facility that sells automobiles or automobile parts, provides general repair services to automobiles (including body repairs, engine overhaul, upholstery work, parts rebuilding and like activities), or provides long-term vehicle storage.
Awning: A lightweight roof structure typically constructed of fabric on a supporting framework that projects from and is supported by the exterior wall of a building. Canvas awnings may cover balconies or Shopfronts, but only in shed configurations. Quarter sphere or quarter cylinder configurations are not permitted.
Bank, Financial Services: Financial institutions including: banks and trust companies, credit agencies, holding (but not primarily operating) companies, lending and thrift institutions, other investment companies, securities/commodity contract brokers and dealers, security and commodity exchanges, vehicle finance (equity) leasing agencies.
See also, “ATM” Does not include check cashing stores, which are instead defined under “Personal Services - Restricted.”
Bar, Tavern, Night Club:
Bar, Tavern: A business where alcoholic beverages are sold for on-site consumption, which are not part of a larger restaurant. Includes bars, taverns, pubs, and similar establishments where any food service is subordinate to the sale of alcoholic beverages. May also include beer brewing as part of a microbrewery (“brew-pub”), and other beverage tasting facilities.
Downtown Addition Specific Plan
City of King, CaliforniaA-2
Regulating Code Glossary
Appendix A
Night Club: A facility serving alcoholic beverages for on-site consumption, and providing entertainment, examples of which include live music and/or dancing, comedy, etc. Does not include adult oriented businesses.
Bed and Breakfast Inn: A single-family, owner-occupied detached dwelling which provides only transient lodging in not more than five rooms with a maximum stay of fourteen consecutive nights. A bed and breakfast inn may provide no food or beverage service for the transient guests other than breakfast provided in the areas of the dwelling commonly used by the resident family for the consumption of food.
Building Type: The structure defined by the combination of configuration, disposition and function.
Build-to Line: A line appearing graphically on the regulating plan or stated as a setback dimension, along which a building facade shall be placed.
Bungalow Court: An arrangement of four or more detached single-family houses around a shared courtyard or greenway, which provides direct access to all houses that do not directly front on a street.
Business Support Service: An establishment within a building that provides services to other businesses. Examples of these services include:
computer-related services (rental, repair), copying, quick printing, and blueprinting services, film processing and photofinishing (retail), mailing and mail box services.
Café, Coffee Shop, Delicatessen (no alcoholic beverages
sales): A retail business selling ready-to-eat food and/or beverages for on- or off-premise consumption. These include eating establishments where customers are served from a walk-up ordering counter for either on- or off-premise consumption (“counter service”); and establishments where customers are served food at their tables for on-premise consumption (“table service”), that may also provide food for take-out, but does not include drive-through services, which are separately defined and regulated.
Carriage Unit: A carriage unit is an auxiliary housing unit located above or adjacent to the garage of the primary housing unit on the lot, with the front door and access directed towards an alley or side street on a corner lot. A carriage unit constitutes a residential second unit in compliance with the Government Code Section 65852.2 and, as provided by the
Government Code, is not included in the maximum density limitations established by this Specific Plan. Carriage units shall be between 375 square feet and 700 square feet in floor area, and shall be provided with off-street parking per Section 3.10 of this Regulating Code.
Child Day Care: Facilities that provide non-medical care and supervision of minor children for periods of less than 24 hours. These facilities include the following, all of which are required to be licensed by the California State Department of Social Services.
Day Care Center: Commercial or non-profit child day care facilities designed and approved to accommodate 15 or more children. Includes infant centers, preschools, sick-child centers, and school-age day care facilities. These may be operated in conjunction with a school or church facility, or as an independent land use.
Family Day Care Home: As defined by Health and Safety Code Section 1596.78, a home that regularly provides care, protection, and supervision for 14 or fewer children, in the provider’s own home, for periods of less than 24 hours per day, while the parents or guardians are away, and is either a large family day care home or a small family day care home.
Large Family Day Care Home: As defined by Health and Safety Code Section 1596.78, a day care facility in a single-family dwelling where an occupant of the residence provides family day care for seven to 14 children, inclusive, including children under the age of 10 years who reside in the home.
Small Family Day Care Home: As defined by Health and Safety Code Section 1596.78, a day care facility in a single-family residence where an occupant of the residence provides family day care for eight or fewer children, including children under the age of 10 years who reside in the home.
Civic: A term defining not-for-profit organizations, dedicated to arts, culture, education, religious activities, government, transit, municipal parking facilities and clubs.
Civic Building: Civic Buildings are designed for occupancy by public or quasi public uses that provide important services to the community. A Civic Building contributes significantly to the quality of a place and often is the focal point of a public open space. For that reason, the architectural quality of a Civic
A-3
Adopted 14 June 2011 / Amended 28 January 2014 / Amended 24 March 2020
Regulating Code Glossary
Appendix A
Building shall exceed the quality of the surrounding buildings. Civic Buildings may be publicly owned and operated, semi-public, or privately owned and operated (see Section 3.6).
Clinic - Outpatient: An organized outpatient health facility for human patients who remain therein less than 24 hours.
Colonnade: A structure consisting of a row of evenly spaced columns.
Commercial: A term defining workplace, office and retail use collectively.
Commercial Building: A Commercial Building is designed for occupancy by commercial uses such as retail, restaurant, personal service or office uses. Commercial Buildings are typically single-story structures but may also accommodate two-story commercial spaces. A Commercial Building may be occupied by a single user or may be subdivided into multiple smaller commercial units, each with a separate entrance (see Section 3.6).
Common Yard: A Frontage Type created by substantially setting back the building facades from the property line. Common Yards remain unfenced and are visually continuous with adjacent yards, supporting a common landscape. Porches or stoops that provide access to the buildings may encroach into the setback. See Section 3.5.
Congregate Care Housing Facility: A multi-family residential facility with shared kitchen facilities, deed-restricted or restricted by an agreement approved by the City for occupancy by low or moderate income households, designed for occupancy for periods of six months or longer, providing services which may include meals, housekeeping and personal care assistance as well as common areas for residents of the facility.
Convenience/Mini-Market (up to 5,000 sq.ft.): A neighborhood serving retail store of 5,000 square feet or less in gross floor area, primarily offering food products, which may also carry a range of merchandise oriented to daily convenience shopping needs, and may be combined with food service (e.g., delicatessen).
Courtyard Housing: An arrangement of stacked and/or attached dwelling units around one or more common courtyards, which provide direct access to all dwelling units that do not directly front on a street. The courtyard is intended to be a semi-public space that functions as an extension of the public realm into the private lot.
Cornice: Any projecting ornamental molding that finishes or crowns the top of a building, wall, door or window.
Design Review: The comprehensive evaluation of a development and its impact on neighboring properties and the community as a whole, from the standpoint of site and landscape design, architecture, materials, colors, lighting, and signs, in accordance with the criteria and standards contained in the Specific Plan. This compliance evaluation is conducted through a discretionary permit decision by the Planning Commission or sub-committee following submittal of an application containing the information specified in Chapter 17.50 on the Municipal Code.
Director: The Community Development Director of the City of King, or his/her duly appointed representative.
Dooryard: A Frontage Type consisting of an elevated yard or terrace between the street and the building. Dooryards are enclosed by low garden walls at or near the property line, with a few steps leading from the sidewalk to the elevated yard. Building facades are set back from the property line. Buildings are accessed directly from the Dooryards. See Section 3.5.
Drive-Through Retail: An restaurant that serves food to motorists in their vehicles for off-premise consumption, and/or an automated teller machine (ATM), bank, or pharmacy dispensary where services may be obtained by motorists without leaving their vehicles.
Dry Cleaner (without on-site cleaning facility): A business which offers retail laundry service, but at which no dry cleaning services are performed on the premises.
Duet: The Duet is a single-family house that shares a common wall with one adjacent unit in a single structure, creating the appearance of a large house (see Section 3.6).
Dwelling
Single Family: A residential structure containing a single dwelling unit. Includes for the purposes of this Regulating Code: Large Lot Houses, Sideyard Houses, Rearyard Houses, Duets, Rowhouses, and Live-Work Buildings. See Section 3.6 (Building Type Standards) for definitions of each of these types.
Downtown Addition Specific Plan
City of King, CaliforniaA-4
Regulating Code Glossary
Appendix A
Two, Three, Multiple Family: A residential structure containing two or more dwelling units, including Multigeneration House, Triplex, Quadplex, Villa, Courtyard Housing, and Mixed-Use Building. See Section 3.6 (Building Type Standards) for definitions of each of these dwelling types.
Equipment Rental, Sales, Service: An establishment selling, renting and servicing equipment, including construction equipment, contractor supplies, power tools, appliances, and vehicles.
Facade: The vertical surface of a building that is set parallel to a Frontage Line and facing a street. Building walls containing garage doors are not classified as facades, and may not be located on lots where facades are permitted and/or required by this Code.
Fitness/Athletic Club: A fitness center, gymnasium, health and athletic club, which may include any of the following:
exercise machines, weight facilities, group exercise rooms, sauna, spa or hot tub facilities; indoor tennis, handball, racquetball, archery and shooting ranges and other indoor sports activities, indoor or outdoor pools.
Flat: A dwelling unit that occupies only part of a building and is organized on a single floor.
Forecourt: A Frontage Type created by setting back a portion of a buildings facade, typically the middle, to create a small entry square. Forecourts often provide access to a central lobby of a larger building, but may also be combined with other frontage types that provide direct access to the portions of the facade that are close to the sidewalk. Forecourts may be landscaped or paved, depending on the ground floor uses of the building. See Section 3.5.
Frontage Line: The property line(s) of a lot fronting a street or other public way, such as a park, green or paseo.
Frontage Type: See Section 3.5 (Frontage Type Standards).
Front Yard: The portion of a lot between the building facade and the front property line. The size of the front yard is determined by applicable setback requirements (see Section 3.4). Additional requirements for Front Yards are set forth in Sections 3.5, 3.6 and 3.9.
Gallery: A Frontage Type created by attaching a colonnade to a building facade that is aligned with or near the property line. Galleries typically contain ground-floor storefronts, making this frontage type ideal for retail use. Galleries may be two-story structures, providing a covered balcony for the upper story uses. The Gallery projects over the sidewalk and encroaches into the public right-of-way.
Garden Wall: A low masonry wall enclosing a yard or portions of a yard, typically located at or near the property line. See Sections 3.5 and 3.7 for detailed requirements
General Retail: Stores and shops intended to serve the City as destination retail, rather than convenience shopping. Examples of these stores and lines of merchandise include:
art galleries, retail, art supplies, including framing services, books, magazines, and newspapers, cameras and photographic supplies, clothing, shoes, and accessories, collectibles (cards, coins, comics, stamps, etc.), drug stores and pharmacies, dry goods, fabrics and sewing supplies, furniture and appliance stores, hobby materials, home and office electronics, jewelry, luggage and leather goods, musical instruments and-carried), parts, accessories, small wares, specialty grocery store, specialty shops, sporting goods and equipment, stationery, toys and games, variety stores, videos, DVDs, records, CDs, including rental stores.
Groceries/Market (up to 50,000 sq.ft.): A retail store larger than 5,000 square feet in gross floor area with more than 60 percent of its floor area devoted to food products. This type of use is limited to 50,000 square feet in gross floor area.
Height: A limit to the vertical extent of a building. Height limits do not apply to masts, belfries, clock towers, chimney flues, water tanks, elevator bulkheads, and similar structures, which may be of any height approved by the Director.
Home Occupation: Residential premises used for the transaction of business or the supply of professional services. Home occupation shall be limited to the following: agent, architect, artist, broker, consultant, draftsman, dressmaker, engineer, interior decorator, lawyer, notary public, teacher, and other similar occupations, as determined by the Director. Such use shall not simultaneously employ more than 1 person in addition to residents of the dwelling. The total gross area of the home occupation use shall not exceed 25 percent of the gross square footage of the residential unit. The home occupation use shall not disrupt the generally residential character of
A-5
Adopted 14 June 2011 / Amended 28 January 2014 / Amended 24 March 2020
Regulating Code Glossary
Appendix A
the neighborhood. The Director shall review the nature of a proposed home occupation use at the time of review of a business license for such use, and may approve, approve with conditions, continue or deny the application. See also City of King Municipal Code, Chapter 17.04.250.
Hotel: An establishment which is open to transient guests, and which provides customary hotel services including maid service, the furnishing and laundering of linen, telephone and secretarial or desk service, and where no individual kitchen facilities are provided.
Large Lot House: A detached single-family house built on a lot large enough for substantial yard space on all four sides. The larger lot allows for a variety of building configurations, floor plan layouts and orientations. Large Lot Houses are typically bigger in footprint and floor area than other house types. In addition to the primary house a carriage unit may be built at the rear of lots (see Section 3.6).
Laundromat: An establishment providing washing and drying machines on the premises for rental use to the general public for laundering of clothes.
Library: A building or institution, open to the public, which maintains a collection of information, sources, and resources, including but not limited to books, magazines, CDs and DVDs, and lends these items, allowing users to take books and other materials off the premises free of charge.
Live-Work Building: An integrated housing unit and working space, occupied and utilized by a single household in a structure that has been designed or structurally modified to accommodate joint residential occupancy and work activity, and which includes:
1. Complete kitchen space and sanitary facilities incompliance with the Building Code; and
2. Working space reserved for and regularly used by one ormore occupants of the unit.
Commercial Component: The “work” or commercialcomponent of a live-work unit is secondary to itsresidential use, and may include only commercial activities and pursuits that are compatible with the character of aquiet residential environment (see Section 3.6).
Residential Component: The residential component is the owner-occupied dwelling of the live-work building and islocated above and/or behind the street facing work space.
Loft: A dwelling unit that occupies only part of a building and is not partitioned into rooms.
Maisonette: A two-level dwelling unit that occupies only part of a building. The two adjoining floors of the unit are connected by an internal staircase.
Master Developer/Builder: The Master Developer/Builder controls or owns the site, is responsible for managing the development and disposition of the property from initiation and design of the master plan or specific plan that guides development for the entire site to final buildout, obtains financing and approvals, oversees site preparation and infrastructure development, controls and contracts for of the phased implementation of the plan by specialized builders /developers with experience in each product type required to complete the approved plan. The Master Developer/Builder may or may not be involved in the construction of buildings, but performs design review to insure quality control of proposals by specialized builder(s)/developer(s) implementing the Master Plan or Specific Plan.
Master Developer/Builder Design Review Committee: A committee assembled by the Master Developer/Builder to review design submittals by Neighborhood Builders/Developers.
Master Plot Plan Review: The comprehensive evaluation of a site layout diagram of an entire proposed development project or major phase or sub-phase, in accordance with the criteria and standards contained in the Specific Plan from the standpoint of the mix and fit of buildings within the development. This review is conducted through a discretionary permit decision by the Planning Commission or sub-committee pursuant to the procedures specified in Chapter 17.50 on the Municipal Code following submittal of an application containing information which shows: the plan type and elevation, architectural style, plan orientation (normal or reverse), building outline, overall dimensions, and number of stories, location of the primary building, secondary building and other structures, porches, terraces, steps, raised decks, patio covers, retaining walls, fences, garages, walks, driveways, and other permanent improvements on each lot.
Downtown Addition Specific Plan
City of King, CaliforniaA-6
Regulating Code Glossary
Appendix A
Meeting Facility, Public or Private: A facility for public or private meetings, including:
community centers, religious assembly facilities (e.g., churches, mosques, synagogues, etc.), civic and private auditoriums, Grange halls, union halls, meeting halls for clubs and other membership organizations, etc.
Also includes functionally related internal facilities such as kitchens, multi-purpose rooms, and storage. Does not include conference and meeting rooms accessory and incidental to another primary use, and which are typically used only by on-site employees and clients, and occupy less floor area on the site than the offices they support. Does not include:
cinemas, performing arts theaters, indoor commercial sports assembly or other commercial entertainment facilities.
Related on-site facilities such as day care centers and schools are separately defined, and separately regulated by this Regulating Code.
Mixed-Use: Multiple functions within the same building or the same general area through superimposition or within the same area through adjacency.
Mixed-Use Building: A Mixed-Use Building is designed for occupancy by a minimum of two different uses that may be vertically or horizontally demised. See Section 3.6.
Commercial Component: The portions of a mixed-use building dedicated to uses generating visitor or customer traffic (such as retail, restaurants, personal services). These uses shall be located on the ground floor facing the sidewalk.
Residential Component: The portions of a mixed-use building dedicated to residential uses. Residential units may consist of flats, maisonettes, and lofts. Residential uses shall be located on upper floors or behind street fronting commercial uses.
Multifamily: see Dwelling.
Multigeneration House: The Multigeneration House provides living space for larger families where multiple generations live under one roof. Rather than one unit with multiple bedrooms, the Multigeneration House is an assembly of up to three
attached dwelling units on one lot that provide sufficient privacy for each generation while preserving the street appearance of a single-family house (see Section 3.6).
Museum: A building or institution, open to the public, which is dedicated to the acquisition, conservation, study, exhibition, and educational interpretation of objects having scientific, historical, cultural or artistic value.
Neighborhood Builder / Developer: Someone who purchases land from or contracts with the Master Developer/Builder to build a specific Neighborhood or portion of a Neighborhood contained in the Master Plan or Specific Plan.
Newspaper Rack: A self-service coin-operated box, container, storage unit or other dispenser designed, used or maintained for the display or sale of any written or printed material, including newspapers, news periodicals, magazines, books, pictures, photographs and records.
Noxious: Harmful to health or physical well-being.
Office: Business, Administrative, Medical or Professional.
Business/Service: Establishments providing direct services to consumers. Examples of these uses include employment agencies, insurance agent offices, real estate offices, travel agencies, utility company offices, elected official satellite offices, etc. This use does not include “Bank, Financial Services,” which are separately defined.
Medical: A facility for examining, consulting with, and treating patients with medical, dental, or optical problems on an out-patient basis.
Professional/Administrative: Office-type facilities occupied by businesses that provide professional services, or are engaged in the production of intellectual property. Examples of these uses include:
accounting, auditing and bookkeeping services, advertising agencies, attorneys, business associations, chambers of commerce, commercial art and design services, construction contractors (office facilities only), counseling services, court reporting services, design services including architecture, engineering, landscape architecture, urban planning, detective agencies and similar services, doctors, educational, scientific and research organizations, financial management and investment counseling, literary and talent agencies, management and public relations services, media postproduction
A-7Adopted 14 June 2011 / Amended 28 January 2014 / Amended 24 March 2020
Regulating Code Glossary
Appendix A
services, news services, photographers and photography studios, political campaign headquarters, psychologists, secretarial, stenographic, word processing, and temporary clerical employee services, security and commodity brokers, writers and artists offices.
Parking Determination: A number of land uses are not assigned a specific parking requirement but require the Director to make a Parking Determination, identifying the number and location of required parking spaces. Tables 3-1 and 3-9 identify the land uses that require a Parking Determination.
Parking District: An area where parking has rules and restrictions that are commonly managed by an entity.
Parking Facility, Public or Commercial: Parking lots or structures operated by the City, or a private entity providing parking for a fee. Does not include towing impound and storage facilities.
Parking Spaces: Off-street parking spaces shall be a minimum of 9 feet by 19 feet, except that in parking lots of 10 spaces or more up to 30 percent of the spaces may be a minimum of 8 feet by 16 feet. The paved parking stall length may be decreased by up to 2 feet by providing an equivalent vehicle overhang into landscaped areas, or over paved walkways. Pairs of on-site parking spaces for use by employees of a single business, or for use by residents of a single dwelling unit, may be provided in tandem configuration (one behind the other) when approved by the Director. See also Section 3.10.
Paseo: A pedestrian alley located and designed to reduce the required walking distance within a neighborhood.
Personal Services (barber, beauty, nails, etc.): Establishments that provide non-medical services to individuals as a primary use. Examples of these uses include:
barber and beauty shops, clothing rental, massage (licensed, therapeutic, non-sexual), nail salons, pet grooming with no boarding, tanning salons.
These uses may also include accessory retail sales of products related to the services provided.
Porch, Front: A roofed structure that is not enclosed and attached to the facade of a building (see Section 3.5).
Porch and Fence: A Frontage Type consisting of a porch that encroaches into the front setback, and an optional fence that delineates the property line. See Section 3.5.
Porte-Cochère: A roofed porch-like structure covering a driveway at the side entrance of a front-accessed house to provide shelter while entering or leaving a vehicle. A porte-cochère is open on three sides and supported by columns or posts, rather than walls. Porte-cochères are different from carports in which vehicles are parked; at a porte-cochère the vehicle passes through to a garage or carport located at the rear of the lot, stopping only for a passenger to get out. A porte-cochère may have habitable space at the second floor level, in which case the structure shall not encroach into the applicable side setback (see Section 3.4.4)
Primary Building: A building that accommodates the primary use of the site.
Primary Street: The Primary Street abuts the frontage of a lot. At corner lots the building frontage and main entrance are typically oriented toward and face the Primary Street, although multi-dwelling buildings may have entrances on both Primary and Side Streets. At corner lots, alleys intersect the Side Street. See Side Street.
Prohibited Uses: The following are examples of uses not permitted anywhere within the Downtown Addition: animal hatcheries; boarding houses; chemical manufacturing, storage, or distribution; any commercial use in where patrons remain in their automobiles while receiving goods or services; enameling, painting, or plating of materials, except artist’s studios; kennels; the manufacture, storage, or disposal of hazardous waste materials; mini-storage warehouses; outdoor advertising or billboards; packing houses; prisons or retention centers, except as accessory to a police station; drug and alcohol treatment and rehab centers; thrift stores; soup kitchens and charitable food distribution centers; sand, gravel, or other mineral extraction; scrap yards; tire vulcanizing and retreading; vending machines, except within a commercial building; uses providing goods or services of a predominantly adult-only or sexual nature, such as adult book or video stores or sex shops; and other similar uses as determined by the Director.
Public Access Easement: A public access easement is a legally binding agreement that grants to the public in general a right-of-way to use the real property of an individual owner for access purposes only. The terms of the easement are defined in the easement documentation. In the Downtown Addition, public access easements include sidewalks, which may encroach into private properties along specific street sections, and alleys (see Section 3.8, Thoroughfare Standards).
Downtown Addition Specific Plan
City of King, CaliforniaA-8
Regulating Code Glossary
Appendix A
Quadplex: A small multi-dwelling structure containing four separate units on a single lot, each with its own entrance. The dwelling units within a Quadplex may be arranged side by side or one on top of the other, or a combination thereof.
Rearyard House: A detached single-family house with a clear distinction between the public, street facing side, and the private side which is oriented to the yard behind the building. This configuration requires an alley and makes the Rearyard House suitable for a range of lot sizes, including lots that are quite narrow to mid-sized lots. A carriage unit may be built at the rear of the lot (see Section 3.6).
Recreation Facility - Indoor: An establishment providing indoor amusement and entertainment services for a fee or admission charge, including:
bowling alleys, coin-operated amusement arcades, electronic game arcades (video games, pinball, etc.), ice skating and roller skating, pool and billiard rooms as primary uses.
This use does not include sex oriented businesses. Four or more electronic games or amusement devices (e.g., pool or billiard tables, pinball machines, etc.) in any establishment, or a premises where 50 percent or more of the floor area is occupied by electronic games or amusement devices, are considered a commercial recreation facility; three or fewer machines or devices are not considered a land use separate from the primary use of the site.
Repair (leather, luggage, shoes, etc.): An establishment providing repair services to individuals, including:
home electronics and small appliance repair, locksmiths, shoe repair shops, tailors.
These uses may also include accessory retail sales of products related to the services provided.
Residential: Premises used primarily for human habitation. Units shall not be less than 375 square feet in net area.
Restaurant (without drive through): An establishment where food and drink are prepared, served, and consumed primarily within the principal building.
Rowhouse: A building with two or more single-family dwellings located side by side, with common walls on the side lot lines, the facades reading in a continuous plan (see Section 3.6).
School: Includes the following facilities.
Elementary, Middle, Secondary: A public or private academic educational institution, including elementary (kindergarten through 6th grade), middle and junior high schools (7th and 8th grades), secondary and high schools (9th through 12th grades), and facilities that provide any combination of those levels. May also include any of these schools that also provide room and board.
Specialized Education/Training: A school that provides education and/or training, including tutoring, or vocational training, in limited subjects. Examples of these schools include:
art school, ballet and other dance school, business, secretarial, and vocational school, computers and electronics school, drama school, driver education school, establishments providing courses by mail, language school, martial arts, music school, professional school (law, medicine, etc.), seminaries/religious ministry training facility
Does not include pre-schools and child day care facilities (see “Day Care”). See also the definition of “Studio - Art, Dance, Martial Arts, Music, etc.” for smaller-scale facilities offering specialized instruction.
Secondary Building: A building that accommodates the secondary use of the site.
Service Station: A retail business selling gasoline and/or other motor vehicle fuels, and related products.
Setback: The mandatory distance between a property line and a building or appurtenance. This area shall be left free of structures that are higher than 3 feet except as noted in the Urban Standards (Section 3.4). On lots where the sidewalk encroaches into the lot front and/or side setbacks shall be measured from the back of the sidewalk, rather than the property line.
Shared Parking: Any parking spaces assigned to more than one use, where persons utilizing the spaces are unlikely to need the spaces at the same time of day. See Section 3.10 for further detail.
Shed Roof: A roof having only one slope or pitch.
A-9Adopted 14 June 2011 / Amended 28 January 2014 / Amended 24 March 2020
Regulating Code Glossary
Appendix A
Side Street: The side street abuts the side of a lot. At corner lots the building frontage and main entrance are typically oriented toward and face the Primary Street, although multi-dwelling buildings may have entrances on both Primary and Side Streets. At corner lots, alleys intersect the Side Street. See Primary Street.
Sideyard House: A detached single-family house that is oriented toward a usable yard along one side of the building. This yard side is the “active” side of the building and may provide the main entrance, whereas the opposite building side is the “passive” side, typically located near the adjacent property line. A carriage unit may be built at the rear of the lot (see Section 3.6).
Sidewalk Encroachment: Describes the lawful encroachment of building elements (such as signs, awnings, roof overhangs) into the public sidewalk. Encroachment shall be limited as determined in this Regulating Code.
Single-Family: see Dwelling.
Shopfront: The portion of a building at the ground floor of a Commercial or Mixed-Use Building that is made available for retail or other commercial use. Shopfronts shall be directly accessible from the sidewalk, with no intervening step. See Shopfront and Awning below, and Section 3.7 (Architectural Standards) for further detail
Shopfront and Awning: A Frontage Type created by inserting storefronts with large transparent windows into the ground floor facade of a building. The facade is aligned with the property line, although partially recessed storefronts, such as recessed entrances, are also common. The building entrance is at sidewalk grade and provides direct access to a non-residential ground floor use. Shopfronts are composed of storefronts, entrances, awnings or sheds, signage, lighting, cornices, and other architectural elements. Awnings or sheds may encroach into the public right-of-way and cover the sidewalk to within two feet of the curb. See Section 3.5.
Stoop: A Frontage Type consisting of an exterior stair with a landing that provides access to building placed close to the property line. Building facades are set back just enough to provide space for the Stoop. The exterior stair of a Stoop may be perpendicular or parallel to the sidewalk. A Stoop’s landing may be covered or uncovered. See Section 3.5.
Storefront (or storefront infill assembly): The portion of a Shopfront that is composed of the display window and/or entrance and its components including windows, doors, transoms and sill pane that is inserted into the Shopfront. It does not include the wall and piers that are a part of the Shopfront facade, in which the display window assembly is set. See Section 3.7 (Architectural Standards) for further detail.
Story: A habitable floor level within a building, typically 8 to 12 feet high from floor to ceiling. Individual spaces, such as lobbies and foyers may exceed one story in height. In Shopfront spaces, the ceiling height of the first story may be as high as 16 feet.
Studio - Art, Dance, Martial Arts, Music, etc: Small scale facilities, typically accommodating no more than two groups of students at a time, in no more than two instructional spaces. Larger facilities are included under the definition of “Schools - Specialized Education and Training.” Examples of these facilities include:
individual and group instruction and training in the arts; production rehearsal; photography, and the processing of photographs produced only by users of the studio facilities; martial arts training studios; gymnastics instruction, and aerobics and gymnastics studios with no other fitness facilities or equipment.
Also includes production studios for individual musicians, painters, sculptors, photographers, and other artists.
Substantial Conformance: It occurs when physical improvements to the existing development site are completed which constitute the greatest degree of compliance with current development provisions.
Telecommunications Facility: Public, commercial and private electromagnetic and photoelectrical transmission, broadcast, repeater and receiving stations for radio, television, telegraph, telephone, data network, and wireless communications, including commercial earth stations for satellite-based communications. Includes antennas, commercial satellite dish antennas, and equipment buildings. Does not include telephone, telegraph and cable television transmission facilities utilizing hard-wired or direct cable connections.
Terminated Vistas: A building or portion thereof designated to terminate a view through or along a street centerline.
Downtown Addition Specific Plan
City of King, CaliforniaA-10
Regulating Code Glossary
Appendix A
Theater - Cinema, Performing Arts: An indoor facility for group entertainment, other than sporting events. Includes indoor movie theaters, performing arts centers, etc.
Tower: A portion of a building that is at least one story higher than the rest of the building. Its massing shall have vertical proportions, i.e. its height to the eave shall be greater than any of its horizontal exterior dimensions. The purpose of a tower is generally to access a view which is distant or otherwise blocked.
Town Architect: The Town Architect’s role is to review all projects within the Project Area to ensure that they are consistent with the Regulating Code and Architectural Standards that were established as part of the Specific Plan. The role may be performed by a full-time resident-town architect or a part-time outside professional. The Town Architect meets with builders, architects/designers, and clients as necessary to discuss and mark up design drawings. Unlike a conventional review process that only indicates non-compliance with the standards, the Town Architect explains the principles behind the problems in a collaborative setting, thus helping to improve the quality of the designs over time. The Town Architect’s fees are paid for by the builders.
Triplex: A small multi-dwelling structure containing three separate units on a single lot, each with its own entrance. The dwelling units within a Triplex may be arranged side by side or one on top of the other, or a combination thereof.
Utility Facility: A fixed-base structure or facility serving as a junction point for transferring electric utility services from one transmission voltage to another or to local distribution and service voltages, and similar facilities for water supply and natural gas distribution. These uses include any of the following facilities that are not exempted from land use permit requirements by Government Code Section 53091:
electrical substations and switching stations, natural gas regulating and distribution facilities, public water system wells, pump stations, treatment plants and storage, telephone switching facilities, wastewater treatment plants, settling ponds and disposal fields
These uses do not include office or customer service centers (classified in “Offices”). “Utility Facilities” do not include uses defined under “Utility Infrastructure” below.
Utility Infrastructure: Pipelines for water, natural gas, and sewage collection and disposal; and facilities for the transmission of electrical energy for sale, including transmission lines for a public utility company. Also includes telephone, telegraph, cable television and other communications transmission facilities utilizing direct physical conduits. Does not include offices or service centers (see “Offices”), storage tanks, well sites, pump stations, or distribution substations (see “Utility Facility”). “Utility Infrastructure” does not include uses defined under “Utility Facility” above.
Villa: A small multi-dwelling building with one common main entrance and designed to have the appearance of a large house. The dwelling units within a Villa may be arranged side by side or one on top of the other, or a combination thereof.
Vine Pocket: A small planting area within a larger paved area, such as a sidewalk, allowing the planting of a vine in the ground. Vine pockets are often attached to a wall or column
Zoning Ordinance: The City of King Zoning Ordinance, Title 17 of the King City Municipal Code.
B-1Adopted 14 June 2011 / Amended 28 January 2014 / Amended 24 March 2020
General Plan Consistency Review
Appendix B
General Plan Consistency ReviewThis Specific Plan has been designed so to provide for the systematic implementation of the objectives, policies, general land use and programs of the City of King General Plan (KCGP), including the creation of public parks, public facilities, affordable housing, appropriate infrastructure provisions, and environmental mitigation measures. The General Plan serves as the “constitution for all development” in the City. The following discussion reviews the consistency of the Downtown Addition Specific Plan (DASP) to the City’s 1998 General Plan. To be consistent the Specific Plan considering all its aspects must further the objectives, policies, general land uses and programs specified in the General Plan and not obstruct their attainment.
Relevant Land Use Element Policies and ProgramLand Use Policy 1.1.1 – Beneficial Land Uses – “The City shall main tain a land use diagram – Figures LU–3A and LU–3B – that distin guishes residential, commercial, industrial and other land uses in order to minimize land use conflicts, provide sufficient land area to meet the demand for urban land and discourage premature and scattered development.”
The DASP area is within the City limits and is designated for urban development in the KCGP. The Regulating Code distinguishes residential, commercial, and other land uses in order to minimize land use conflicts, provide sufficient land area to meet the demand for urban land, and discourage premature and scattered development.
Land Use Program 1.1.2.4 – “With respect to future residential neigh borhoods, wherever possible, low density residential districts shall be buffered from medium or high density districts by public streets or other compatible land uses, such as schools, parks or public facilities.”
The DASP carefully balances the needs of the neighborhood. Each of the zones in the Regulating Code identifies the appropriate mix of housing and/or commercial uses in a compatible and complimentary layout. Zones are buffered by streets, parks, and mixed-use development as appropriate.
Land Use Program 1.1.2.5 – “With any large-scale development project, the City shall require phasing of the project in order to maintain bal anced development. Phasing shall be required for any project containing more than 50 multifamily units, or more than 100 single-family units”.
A Phasing Plan for the proposed Downtown Addition
development can be found in Section 5 (Implementation). Eight major phases have been established to ensure the orderly development of the infrastructure and the neighborhood. Based on market conditions these major phases may be implemented by a number of smaller sub-phases.
Land Use Policy 1.2.1 –Adequate Services – “New development shall assure that adequate services and facilities are or will be available within a reasonable time.”
The DASP assures that adequate services and facilities, including sanitary sewer, water, storm drain, gas, electric, telephone, and cable TV, are or will be available within a reasonable amount of time. The development of the Downtown Addition requires the extension of these utilities into and throughout the project site within a reasonable time prior to the construction of residential and commercial buildings. Services and facilities will be phased in a manner to ensure that adequate services are available consistent with the rate of construction of residential units and commercial square footage.
Land Use Program 1.2.1.1 – “The City shall make findings in approving any discretionary project (e.g., annexation, general plan amendment, zoning, subdivision, or use permit approval) that adequate services exist within a reasonable time to meet the projected demand from the new development”.
Information sufficient for the City to make the required findings is included within the DASP and supporting technical studies, which assures that adequate services and facilities to meet the project demand from new development will be available in a reasonable time frame. The development of the Downtown Addition requires the extension of these utilities into and throughout the project site prior to the construction of residential and commercial buildings on a phase by phase basis.
Land Use Program 1.2.1.5 – “The City shall require fiscal impact sections in all environmental documents which address proposed develop ment projects where it appears that the existing demands upon public facilities or services are close to, or in excess of their capacity.”
A fiscal impact section is included within Appendix F of the Specific Plan (bound separately).
Land Use Program 1.2.2.1 – “The City shall consider such issues as noise, air quality, traffic, land use conflicts, agricultural lands, natural hazards, and biological resources, in reviewing
Downtown Addition Specific Plan
City of King, CaliforniaB-2
General Plan Consistency Review
Appendix B
proposed developments.”
An Environmental Impact Report (“EIR”) has been prepared and certified for the development of the DASP Planning Area. Technical studies have been identified and supplemental reports have been prepared. These technical reports and studies have been incorporated as Appendices to the EIR, and the DASP as necessary. Impacts such as noise, traffic, air quality, land uses, agricultural land impacts, natural resources, and biological resources have been addressed in detail in the EIR and these supplemental documents and mitigated, to the extent possible, to a level of less than significant. The DASP Appendices G and H are part of the DASP and their incorporation will ensure that all mitigation measures set forth in the Environmental Impact Report will be implemented as part of the development of the DASP area.
Land Use Policy 1.2.2 – “In order to promote orderly growth, the city shall evaluate proposed developments to determine if there are provisions for an adequate level of services and facilities, such as water, sewer, fire and police protection, transportation and schools. The City shall require mitigation to the extent prescribed by law, and may require additional mitigation to the extent allowed by law. Projects with significant unmitigated environmental impacts shall not be approved unless:
A) The City determines that a statement of overridingconsiderations is warranted and supported by findings;and
B) The project is otherwise consistent with General Planpolicies”.
An EIR has been prepared and certified for the development of the DASP Planning Area. Technical studies have been identified and supplemental reports have been prepared. These technical reports and studies have been incorporated as Appendices to the EIR, and the DASP, as necessary. Impacts such as noise, traffic, air quality, land uses, agricultural land impacts, natural resources, and biological resources have been addressed in detail in the EIR. Identified potentially significant impacts are mitigated, to the extent possible, to a level of less than significant. Any impact which has been identified which is significant and unavoidable has been determined to warrant a statement of overriding considerations and the City has adopted supporting findings. The DASP will ensure that all mitigation measures set forth in the Environmental Impact
Report will be implemented as part of the development of the DASP area. All mitigation measures are incorporated in Appendix H – Mitigation Monitoring and Reporting Program (MMRP) and will be implemented as part of the DASP.
Land Use Objective 1.3 – “To develop a balanced range of land uses within the Planning Area consistent with the City’s desired character and environmental, social, and economic goals.”
The DASP is consistent with this objective because the proposed project includes a range of land uses, such as public parks, civic, commercial, and a wide range of residential building types, which have been specifically calibrated to the desired character of the City.
Land Use Policy 1.3.1 – Balanced Land Uses – “The City shall assure that adequate sites are available for development of both market rate housing and housing affordable to low and moderate income house holds, for the existing and projected population.”
The DASP is founded on the principle that a wide and balanced range of housing types be provided. Consistent with the requirements of the City of King Housing Element 2002-2007 dated (January 2003) and the Inclusionary Housing Ordinance (Ordinance No. 637) which is codified at Chapter 17.19 of the City of King Municipal Code. The DASP includes the framework and requirements of the Housing Program (Appendix C) and upon adoption the approved Housing Plan will explicitly detail the implementation of affordable housing. As set forth in Appendix C and in DASP Table 5-4 the Housing Program shall be adopted prior to final action on the Tentative Subdivision Map. Upon adoption the Housing Program shall be incorporated into the DASP as part of Appendix C. The Housing Program requires that at least 15 percent of the housing will be affordable to very low, low, and moderate-income households.
Land Use Policy 1.3.2 – “The City shall assure that adequate sites are available for both new and existing commercial land uses to provide space for retail uses, business services, offices, and visitor serving uses.”
Based on a commercial market assessment, the Downtown Addition site is suitable for local convenience retail and neighborhood retail. Local convenience retail is small and convenience-oriented, typically relying on small purchases form nearby residents. Tenants can include convenience stores, dry cleaners, and restaurants. Local retail centers typically do
B-3Adopted 14 June 2011 / Amended 28 January 2014 / Amended 24 March 2020
General Plan Consistency Review
Appendix B
not exceed 30,000 square feet in size. Neighborhood retail typically has a major grocery or grocery/drug anchor and serves a larger area than convenience retail. Neighborhood retail centers range from 50,000 to 150,000 square feet. To meet this potential demand, the DASP designates nearly 14 acres for commercial development (Neighborhood Center (NC) Zone), which can accommodate up to 148,060 square feet of commercial space. The NC Zone is pedestrian-oriented and is intended to be occupied primarily by mixed-use buildings that may accommodate retail or office uses on ground floors, and offices and residential units on upper floors. The DASP allows for up to 15,167 square feet of flex/commercial space in live-work buildings in the NC zone. Up to 15,060 square feet of the general commercial space may be transferred as flex/commercial space in live-work buildings in the Neighborhood General 3 (NG-3) zone.The DASP also contains two alternative plan layouts which will accommodate the establishment of the South County Courthouse if the court selects this location. Preliminary design studies have determined that a 47,223 sq. ft. court facility along with auxiliary court office and other business services and offices can be accommodated with the 148,060 square feet of commercial space programmed in the DASP.
Land Use Policy 1.3.4 – “The City shall meet its housing construction goals is a proportionate manner. The City shall work to maintain sufficient housing opportunities in all income categories, and shall seek to avoid disproportionate growth in any one housing income category that would shift economic balance of the community. Where necessary, the City may decline approval of a housing project where there are deemed to be insufficient supply of housing units in other income categories.”
The DASP strives to create a vibrant mixed-income community by providing housing that is affordable to lower income households and by providing a wide variety of housing types.
Land Use Program 2.1.1.3 – “Where possible and appropriate, the City shall integrate commercial uses in order to provide neighborhood services.”
The DASP establishes the NC Zone specifically for the purpose of integrating commercial uses into a pedestrian-oriented neighborhood and is intended to provide neighborhood service. The NC Zone shall be occupied primarily by mixed-use buildings that may accommodate retail or office uses on ground floors, and offices and residential units on upper floors. The DASP calls for up to 148,060 square feet of
commercial space. In addition, the DASP allows for up to 15,167 square feet of flex/commercial space in live-work buildings in the NC zone. Up to 15,060 square feet of the general commercial space may be transferred as flex/commercial space in live-work buildings in the NG-3 zone.
Land Use Objective 2.2 – Residential Compatibility – “Ensure compat ibility between residential development and surrounding land uses.”
The DASP carefully balances the needs of the neighborhood by establishing neighborhood zones that provide for a transition from higher intensity and commercial uses along Broadway Street and closest to downtown to lower intensity residential uses closest to San Lorenzo Creek and the agricultural land to the east. Within that gradation of development intensities, each of the zones in the Regulating Plan identifies a n a ppropriate mix of residential and/or commercial uses in a compatible and complementary layout. This approach ensures that abutting uses are compatible with one another. The neighborhood zones provide appropriate buffers f or r esidences f rom B itterwater Road (through a greenway) and the railroad (through the mixed-use areas), and provide a park buffer b etween u rban development and San Lorenzo Creek. At buildout, Oak Avenue (San Antonio Extension) will also serve as a buffer. As needed, a 200 foot agricultural buffer w ill b e p rovided s eparating any agricultural operations on the adjacent property to the northeast, the Smith-Monterey, LLC-Eastern Extension, The Eastern Extension property is under the same ownership (Smith-Monterey, LLC) as the Downtown Addition. The Eastern Extension has been proposed for annexation since it is the next logical increment of development as the City grows to the east beyond its current boundaries as set forth in the King City Smart Growth Study (2001).
Land Use Policy 2.2.2 – “The City shall encourage development that provides adequate yards and open space areas within and along the perimeter of residential areas in order to buffer them from busy streets and/or from adjacent non-residential land uses.”
Every lot type planned for the DASP site includes an appropriately sized front, rear, and side yard zone to provide adequate spacing between houses as well as from houses to streets. Due to its proximity to the historic downtown and the potential of a future train station, the Downtown Addition is planned as a compact, walkable, traditional neighborhood development which upon the establishment of the train station will also serve also as a transit-oriented development. It is the
gis1
Cross-Out
Downtown Addition Specific Plan
City of King, CaliforniaB-4
General Plan Consistency Review
Appendix B
intention of the DASP that a mix of different types and sizes of open space areas be provided within the neighborhood based on the proximity to the commercial core. A generous amount of public space is incorporated into the neighborhood in the form of parks and open space.
Land Use Policy 2.2.3 – “The City will work with residential and non residential developers to encourage site planning and design that provides adequate open-space buffers between residential land uses and other uses.”
Each of the zones in the Regulating Plan identifies the appropriate mix of housing and/or commercial uses in a compatible and complimentary layout. Zones are buffered by streets, parks, and mixed-use development as appropriate. The DASP also incorporates significant open space buffers along San Lorenzo Creek and Bitterwater Road. In addition, commercial space buffers the railroad tracks along First Street from residential areas within the neighborhood.
During the phased construction process, rolling buffers of at least 200 feet will be maintained between any continuing agricultural operations on the site and new development. As needed, a 200-foot agricultural buffer will be provided separating any agricultural operations on the adjacent property to the northeast, the Smith-Monterey, LLC - Eastern Extension. The Eastern Extension property is under the same ownership (Smith-Monterey, LLC) as the Downtown Addition.
Land Use Goal 3 – Commercial Land Use – “To provide adequate area for commercial land uses to meet the service needs of residents, businesses, and visitors and to encourage development of retail commercial, service commercial... that are compatible with surrounding land uses.”
Based on a commercial market assessment, the Downtown Addition site is suitable for local convenience retail and neighborhood retail. Local convenience retail is small and convenience-oriented, typically relying on small purchases form nearby residents. Tenants can include convenience stores, dry cleaners, and restaurants. Local retail centers typically do not exceed 30,000 square feet in size. Neighborhood retail typically has a major grocery or grocery/drug anchor and serves a larger area than convenience retail. Neighborhood retail centers range from 50,000 to 150,000 square feet. To meet this potential demand, the DASP designates over 14 acres for commercial development (NC Zone), which can accommodate up to 148,060 square feet of commercial space. The NC zone is pedestrian-
oriented and is intended to be occupied primarily by mixed-use buildings that may accommodate retail or office uses on ground floors, and offices and residential units on upper floors. In addition, the DASP allows for up to 15,167 square feet of flex/commercial space in live-work buildings in the NC zone. Up to 15,060 square feet of the general commerical space may be transferred as flex/commercial space in live-work buildings in the NG-3 zone.The DASP also contains two alternative plan layouts which will accommodate the establishment of the South County Courthouse if the court selects this location. Preliminary design studies have determine that a 47,223 sq. ft. court facility along with auxiliary court office and other business services and offices can be accommodated with the 148,060 square feet of commercial space provided for in the DASP.
Land Use Policy 3.1.1 – “The City shall designate five types of commercial uses... Within these land use categories the City shall promote the availability of commercial sites to accommodate a mix of retailing, wholesaling, dining and entertainment...”
The NC Zone is pedestrian-oriented and is intended to be occupied primarily by mixed-use buildings that may accommodate a mix of retail or office uses on ground floors, and offices an d re sidential un its on up per flo ors. Th e int ent of the NC Zone is to accommodate a variety of retailing, wholesaling, dining, and entertainment options. The DASP calls for up to 148,060 square feet of commercial space. In addition, the DASP allows for up to 15,167 square feet of flex/commercial space in live-work buildings in the NC zone. Up to 15,060 square feet of the general commercial space may be transferred as flex/commercial space in live-work buildings in the NG-3 zone.
Land Use Objective 3.2 – Compatible Commercial Uses – “Ensure com patibility between commercial development and surrounding land uses.”
The DASP carefully balances the needs of the neighborhood by establishing neighborhood zones that provide for a transition from higher intensity and commercial uses along Broadway Street and closest to downtown to lower intensity residential uses closest to San Lorenzo Creek and the agricultural land to the east. Within that gradation of development intensities, each of the zones in the Regulating Plan identifies a n a ppropriate mix of residential and/or commercial uses in a compatible and complementary layout. This approach ensures that abutting uses are compatible with one another. Commercial development along the railroad tracks is positioned to minimize
gis1
Cross-Out
B-5Adopted 14 June 2011 / Amended 28 January 2014 / Amended 24 March 2020
General Plan Consistency Review
Appendix B
the noise from the railroad tracks to both the commercial uses and to the residential areas just beyond the neighborhood commercial.
Land Use Policy 3.2.1 – “The City shall provide for the maximum flexibility in interpreting allowable uses in order to encourage good retailing design and shall encourage a mix of residential and commercial uses where appropriate.”
The NC Zone is pedestrian-oriented and is intended to be occupied primarily by mixed-use buildings that may accommodate retail or office uses on ground floors, and offices and residential units on upper floors. T he R egulating C ode mandates good design of proposed buildings to ensure that the benefits of mixed-use development are fully realized and the potential negative impacts of one use upon another are minimized.
Land Use Goal 5 – Open Space and Agricultural Lands – “To protect and provide open space lands to satisfy the needs of the community... to preserve viable, prime agricultural lands within the Planning Area which are not designated for future urban growth.”
The DASP is within the City limits and was designated for urban development in the 1998 City of King General Plan. Additionally, the DASP includes approximately 234 acres of open space and parkland that buffers habitat areas, such as San Lorenzo Creek, and provides additional parks and open space for the proposed subdivision and the existing city. The DASP exceeds the City’s requirements for parkland under Ordinance No. 622.
Land Use Policy 5.1.2 – Open Space Lands in the Urban Area – “The City shall continue to require that new subdivisionsdedicate park land and/or park in lieu fees that enable the purchase of park land, and/or to provide recreational facilities.”
As shown in Table 5-3 new residential development will be subject to the City’s parkland fees in the amount of $2.39 Million. The DASP includes approximately 23 acres of open space and parkland which will be dedicated and improved, thus providing open space for the DASP area and the existing city.
Land Use Policy 5.1.4. – Open Space and Agriculture– “In reviewing proposed plans for new development proposed along major thoroughfares, particularly entrances to King City, the City shall encourage appropriate site planning,
design, building materials, landscaping and signage to enhance the scenic quality of these thoroughfares.”
Throughout the entire DASP building materials, landscaping and design have been carefully chosen to enhance the scenic quality of the city. Additional consideration has been given to all setbacks, open space buffers, landscaping, screening, materials, and other amenities along major thoroughfares in order to preserve the historic character of the City and to promote architectural quality.
Land Use Program 5.1.4.1 – “The Planning Commission shall evaluate site plans, elevations, and landscaping plans of new development proposals visible from major thoroughfares, including Highway 101, Broadway Street, San Antonio Drive, First Street, and Metz Road. This evaluation shall consider; but not be limited to, appropriate set backs, open space buffers, landscaping, screening techniques, exterior colors and materials, street furniture, and other amenities.”
As set forth in DASP Section 5.7 and Table 5-4 the Planning Commission will evaluate development within the DASP pursuant to the provisions of KCMC Chapter 17.50. Because the Downtown Addition neighborhood will be visible from Bitterwater Road, Broadway Street, Metz Road, San Antonio Drive and First Street, attention has been given to integrating the new neighborhood with the existing urban fabric. Careful consideration has been given to all setbacks, open space buffers, landscaping, screening, materials, and other amenities to preserve the historic character of the City and to promote architectural quality. The DASP contains specific mandatory design standards regarding setbacks, open space buffers, landscaping, screening techniques, exterior colors and materials, street furniture, and other amenities.
Land Use Policy 5.2.3 – Protect Prime Agricultural Lands – “The City shall require that new, non–agricultural development proposals adjacent to agricultural operations incorporate buffer areas to minimize incom patibilities, and mitigate against the effects of agricultural operations on adjacent land uses.”
The DASP incorporates appropriate open space buffer areas between residential land uses and other uses. Significant open space buffers of at least 200 feet are called for along San Lorenzo Creek.
During the phased construction process, rolling buffers of at least 200 feet will be maintained between any continuing
gis1
Cross-Out
Downtown Addition Specific Plan
City of King, CaliforniaB-6
General Plan Consistency Review
Appendix B
agricultural operations on the site and new development. As needed, a 200-foot agricultural buffer will be provided separating any agricultural operations on the adjacent property to the northeast, the Smith-Monterey, LLC- Eastern Extension. The Eastern Extension property is under the same ownership (Smith-Monterey, LLC) as the Downtown Addition.
Land Use Objective 6.1–Urban Reserve-Agriculture Areas–“Prevent urban sprawl by assuring that as new neighborhoods develop adjacent to King City, they are annexed to the community and developed with an orderly framework that regulates densities properly, integrates their street systems and utilities, and provides for adequate protection of the environment both for existing as well as future residents and for neighboring land uses.”
The Downtown Addition Specific Plan will help prevent urban sprawl by directing development to land already subdivided and located directly adjacent to the historic downtown area. The Specific Plan includes a Regulating Code to control density, integrate the existing urban framework, and utilize the natural layout of the site.
Land Use Objective 7.1 – Planned Development– “Assure that development policies and regulations for larger properties in strategic locations will generate land uses, site plans, and building designs that reflect high quality and strong urban design.”
The Downtown Addition neighborhood generates land uses, site plans, and building designs that reflect high quality and strong urban design. The Regulating Code calls for:
Creating a compact, walkable mixed-use/mixed-income community;
Creating a pedestrian-friendly network of streets and public open spaces; and
Integrating a wide mix of housing types into the neighborhood consistent with the desired character of the City.
Policy 7.1.2 Smith-Hobson Property– “Agricultural use is encouraged to continue for as long as possible on this property, until demand for industrial or service commercial uses would warrant conversion. A Specific Plan shall be required prior to development. This property may be developed for a combination of service commercial and light industrial uses. Residential uses shall be discouraged unless
the odor problem from neighboring industrial uses to the north and west can be overcome.”
The odor problem referred to in Policy 7.1.2 was based on the adverse impact (odor) of the tomato processing plant, which is no longer in operation. ConAgra Foods, a garlic processing plant, is no longer in operation. The application for the Specific Plan and related General Plan amendment will amend this policy in the General Plan.
Land Use Policy 8.3.4 – Police Protection Services – “The City shall require that all new development proposals and/or changes in land use be referred to the Police Department for law enforcement evaluation.”
The design of the DASP was formulated with police protection in mind. The Police Department was contacted and interviewed early in the process. In addition, the DASP has been referred to the Police Department for evaluation as a participant in the City’s Project Review Committee.
Land Use Policy 8.4.2 – Fire Department – “The City shall require that all new development proposals and/or changes in land use be referred to the Fire Department for safety evaluation.”
The design of the DASP was formulated with fire protection in mind, fire sprinkler systems are required throughout. The Fire Department was contacted and interviewed early in the process. The DASP has been referred to the Fire Department for evaluation as a participant in the City’s Project Review Committee. The Fire Chief has stated that he has reviewed and approved the street designs contained in the DASP.
Land Use Policy 8.7.1 – Drainage – “Reduce the risks and damage associated with flooding within the City by developing and maintaining a comprehensive storm drainage system.”
The DASP includes provisions for the provision of stormwater drainage. The stormwater drainage system has been designed based on a detailed hydrology study. All urban development proposed in the DASP is outside the 100-year flood zone.
Land Use Policy 8.10.3 – Public Utilities – “The City shall require the extension of new power transmission lines, power distribution lines, and communication lines to be placed underground.”
B-7
Adopted 14 June 2011 / Amended 28 January 2014 / Amended 24 March 2020
General Plan Consistency Review
Appendix B
The DASP includes provisions for the extension of utilities to the site. The Regulating Code requires that all utilities be installed underground to secure such utilities from damage.
Land Use Policy 8.11.1 – Educational Facilities – “As part of the envi ronmental review process, the City shall evaluate new residential developments for their potential impact upon current enrollment conditions of the school system.”
The DASP project will provide approximately $4.3 million in school impact fees based on an average unit size of 1,700 square feet and $4.2 per square foot of finished residential construc-tion. (The DASP proposes a maximum of 710 residential units.)
Land Use Objective 8.14– Parks and Recreation – “Continue to develop and adequately maintain a coordinated system of parks and recreational facilities within the City.”
The Downtown Addition parks are intended to complement the existing park system in King City. Currently, the existing system of parks is com prised of active recreational uses that serve the broader community and focus on organized sports for youth as well as adults. The Downtown Addition park and open space system includes several neighborhood parks, a community park, the Bitterwater Greenway, and a significant linear park and open space area along San Lorenzo Creek. The amount of parks and open space provided in the Downtown Addition exceeds the City’s open space and parkland requirement set forth in Ordinance No. 622.
Streets with comfortable sidewalks and planted parkways are the backbone of the Downtown Addition neighborhood. Small greens and squares are placed strategically throughout the area as passive recreation areas and powerful focal points. The larger open spaces include San Lorenzo Creek with hiking trails and a large grassy park on the creek’s western edge. The Downtown Addition’s parks and open space plans allow pedestrians to move freely throughout the neighborhoods.
Land Use Policy 8.14.1 – “The City shall plan and maintain a park sys tem that serves the residential, commercial, and industrial segments of the community.”
The DASP includes parks that address both informal and formal recreation uses for all ages and sexes within the community. Both the community park and open space along San Lorenzo Creek contain diverse uses, including pavilions for neigh-borhood gatherings, playgrounds, open space, court games, and space for field games, all within a convenient, safe walking
distance for all residents. The system is intended to serve all segments of the community.
The parks will be dedicated to the City. A separate entity, such as a community facilities district, a landscape and lighting district, or a homeowners association, will be established for maintenance and management of the parks and public open spaces.
Land Use Policy 8.14.4 – “Park and recreation areas shall be planned, developed, and used in a manner which is compatible with adjacent land uses”
The DASP includes parks that address both informal and formal recreation uses. The community and neighborhood parks compliment the residential neighborhoods, and the open space along San Lorenzo Creek buffers development from potential flooding.
Relevant Circulation Element PoliciesCirculation Element Policy 2.1 – “Through the administration of its zoning and subdivision regulations, the City shall require that each major development demonstrate, to the satisfaction of the appropriate review body, that traffic resulting from the projects will not reduce the level of service of existing City streets below a Level of Service “C” Where LOS is estimated to fall below LOS “C” the City shall require improvements to be in place prior to project occupancy to maintain LOS “C” conditions. Where this is not possible or reasonable because of cumulative traffic, extended development phasing, or other factors, developers shall be required to post bonds or other guarantees in a proportionate amount to assure that sufficient findings for the necessary improvements will be available within five years.”
The Traffic Impact Analysis – Vol. 1 (April, 2007) and the Supplemental Analysis – Vol. 2 (May, 2009), and the First Street Bypass Traffic Impact Analysis – Vol. 3 (June, 2009) forecast that the circulation system within the Downtown Addition and the existing City will operate at LOS C or better with the proposed mitigation identified in the traffic reports.
Circulation Element Policy 2.2 – “The City shall maintain engineering standards to assure appropriate development of circulation facilities, including streets, pedestrian access, and bicycle routes. These standards shall regulate such matters as street width, pavement and base materials, curbs/gutters/sidewalks, handicapped access, turning radii, street tree placement, underground utility placements and
Downtown Addition Specific Plan
City of King, CaliforniaB-8
General Plan Consistency Review
Appendix B
other matters. Such standards shall seek to maintain an appropriate balance between facilitating vehicular traffic and assuring pedestrian amenity and neighbor hood quality.”
The DASP in Section 3.8 (Thoroughfare Standards) includes section drawings illustrating each street type proposed for the development. Section drawings include dimensions indicating the right-of-way width, street width, parking, sidewalk width, bicycle lanes, and street tree placement. Turning radii, design speed and other data are listed in a table for each street type.
Circulation Goal 3 – “To provide a street and highway system that accommodates existing and projected traffic volumes within the planning area.”
The traffic study and the supplemental First Street Bypass Study indicate that the circulation system within the Downtown Addition and the existing City will operate at LOS C or better with the proposed mitigation identified in the traffic report.
Circulation Policy 3.1 – “The City shall establish and maintain a street and highway system that serves the existing and planned land uses within the Planning Area efficiently.”
The DASP street system is designed to handle the projected traffic volumes within the planning area. Additionally, the traffic study and the supplemental First Street Bypass Study indicate that the circulation system within the Downtown Addition and the existing City will operate at LOS C or better with the proposed mitigation identified in the traffic report.
Circulation Policy 3.2 – “The City shall maintain its basic gridded street system within the core area providing easy pedestrian and vehicular access between residential and neighborhoods, commercial shopping areas, and industrial districts.”
The DASP is designed based on the existing gridded network of underlying dedicated but unimproved streets. This gridded street network was established for the DASP Planning Area many years ago by the recording of the 1908 Spreckels Addition Tract Map (Figure 1-3). The DASP Planning Area since 1908 has been planned and subdivided to be part of the core area. This is clearly shown in Figure 1-5 (The 1908 Tract Map of King City). The DASP identifies Broadway Street as the historic and current spine of the downtown and proposes its eastward extension across the railroad right-of-way into the Downtown Addition. The DASP proposes an eastward continuation of the City’s fine-grained gridded street system, similar to the one present in the historic downtown area. This internal circulation system
would connect to the existing City at Broadway Street, Pearl Street, and at four points along Bitterwater Road, including an extension of San Antonio Drive. This provides for circulation within the neighborhood and ready access by residents to the neighborhood parks, recreational spaces, commercial shopping, and other amenities located in within the Downtown Addition. All locations within the Downtown Addition are within a five-minute walk of Broadway Street where a train station and regional transit location could be accessed in the future.
The circulation system effectively connects all parts of the neighborhood with one another and with the surrounding community. Thoroughfares are designed to provide efficient traffic flow through and within the neighborhood along with attractive views. The circulation system also includes a multi-use trail, pedestrian trails, paseos, and bicycle lanes.
Circulation Element Policy 3.3 –“Arterial streets such as San Antonio Road and the future alignment of the First Street bypass shall be designed primarily to serve through traffic, and shall provide limited access to abutting property.
The DASP proposes a southward continuation of San Antonio Drive (as Oak Avenue) through the Downtown Addition. Oak Avenue would allow for a future extension across San Lorenzo Creek to operate as the First Street Bypass. DASP Section 3.8.2.4 Oak Avenue (San Antonio Extension) establishes a roadway design which allows for future widening to a cross-section which contains up to four travel lanes (See Figure 3-37). Oak Avenue (San Antonio Extension) is designed primarily to serve through traffic, and limits access to abutting property. Curb cuts along Oak Avenue are limited to street and alley intersections, with no private driveway access. The DASP also proposes an at-grade crossing of the railroad tracks at First and Broadway Streets for accessing the new neighborhood and continuing the existing grid street pattern of the City. Broadway Street would connect with Oak Avenue and provide additional capacity parallel to Bitterwater Road. Due to the Downtown Addition’s pedestrian-oriented layout traffic models of the project show that the neighborhood does not require widening of First Street between Bitterwater Road to Division Street. In addition, widening of First Street is not recommended because it is an important connector with the City’s historic downtown and additional lanes would discourage pedestrians from crossing it.
B-9Adopted 14 June 2011 / Amended 28 January 2014 / Amended 24 March 2020
General Plan Consistency Review
Appendix B
Circulation Element Policy 3.4 – “Collector streets shall be designed to collect traffic generated by minor streets and transfer it to arterials, or between neighborhoods and nearby commercial areas. In areas where large amounts of truck traffic are expected, collector streets should typically be designed to accommodate the additional weight and turning requirements of commercial trucks.”
The DASP proposes a hierarchical circulation system consisting of primary and secondary through streets collecting the traffic generated by local streets. Primary and secondary through streets connect with the existing street system at six points, two off of First Street (at-grade crossings of the railroad tracks) and four off of Bitterwater Road to allow traffic to travel to and from the development area. These connections would provide more than adequate access into and out of the area. Primary through streets are designed to accommodate truck traffic with ease, whereas secondary through streets are designed for periodic truck traffic. Local streets are primarily intended for cars but are dimensioned to occasionally accommodate large vehicles, such as moving or fire trucks.
Any required street improvements to Bitterwater Road, Oak Avenue (San Antonio Extension) and First Street will be designed to accommodate the additional weight of large truck which services the adjacent industrial area. In addition, the DASP proposes a southward continuation of San Antonio Drive (as Oak Avenue) through the Downtown Addition. Oak Avenue would allow for a future extension across San Lorenzo Creek to operate as a potential bypass street that would accommodate truck traffic. Oak Avenue is designed to allow future widening and accommodate up to four travel lanes.
Circulation Element Policy 3.5 – “Local streets shall be designed to provide direct access to abutting properties, to discourage through traffic, and to serve the internal needs of residential neighborhoods or small commercial or industrial districts.”
The DASP proposes a hierarchical circulation system consisting of primary and secondary through streets collecting the traffic generated by local streets. Local streets are intended for lower traffic speeds and volumes. They are designed with appropriately scaled travel lanes which are specifically calibrated to the adjacent land use. As designed the streets tend to consist of short uninterrupted stretches to encourage slow speeds and discourage cut-through traffic. The primary function of local streets is local access. In addition, they
provide an opportunity to establish significant amount of on-street parking for residents and visitors. Parking access to most properties is provided by alleys which typically are accessed from local streets.
Circulation Element Policy 3.6 – “As traffic patterns shift in accordance with the land use changes anticipated by the Land Use Element, the City shall consider appropriate methods to regulate traffic speeds or volumes to assure safety and to protect the quality of life of residential neighborhoods or the pedestrian amenity of the downtown. Such methods may include street trees, “bulb-outs” wider sidewalks, tighter turning radii at the curb corners, street furniture such as benches, special street lighting, or other reasonable measures.“
The DASP proposes a thoroughfare system that regulates traffic speeds through a range of methods that are calibrated to each thoroughfare’s classification and its location within the neighborhood. Methods utilized to regulate traffic and provide pedestrian safety and amenities in the Downtown Addition include: a range of travel lane widths and corner turn radii calibrated to the street hierarchy and the design speed; bike lanes on streets with higher traffic volumes and speeds; on-street parking on all streets that provides a buffer between moving vehicles and pedestrians; landscaped medians that visually narrow down wider streets; street trees in tree wells or continuous parkways depending on the location, intended to provide shade and visually narrow the perceived street width; sidewalks of varying widths calibrated to the adjacent land uses, including very wide sidewalks in the neighborhood center with room for outdoor merchandise displays or café seating; street lighting spacing and fixture size calibrated to its location; and a system of proposed traffic calming measures that include curb extensions (or bulb outs) at intersections and mid-block crosswalks.
Circulation Element Policy 3.7– “The City shall seek opportunities to enhance the ‘gateway areas’ of the City, and at key entry points for its neighborhoods. Where opportunities are presented, the City shall consider requiring developers to install identity signs, special paving for pedestrian crosswalks, light fixtures, or landscape features to identify the entry or gateway function.”
The DASP identifies the key points of entry in to the neighborhood and the Regulating Code contains enhanced design standards and criteria consistent with their importance
Downtown Addition Specific Plan
City of King, CaliforniaB-10
General Plan Consistency Review
Appendix B
as entry or gateways into the neighborhood. The DASP anticipates the redevelopment of the easterly edge of First Street by others, including the intersections of First Street and Pearl Street and, eventually First Street and Broadway Street. This redevelopment will promote an intensification of uses that are pedestrian oriented. While the First Street corridor west of the Union Pacific Railroad corridor is not in the planning area, it is recommended that it be given a similar urban design treatment as the DASP to promote a “Main Street” look and feel. The City as part of its downtown revitalization program should consider adopting the urban design and architectural design standard contained in the DASP for the First Street Corridor.
In addition the Bitterwater Greenway on the northern edge of the Downtown Addition includes extensive landscaping and improved pedestrian improvements at the Bitterwater and San Antonio Street intersection and at the Bitterwater and Chestnut Avenue intersection.
Circulation Goal 4 – “To establish and maintain adequate on-site and off-street parking as required by new development and existing uses.”
Circulation Element Policy 4.2 – “As new commercial development occurs within the community the City shall continue to implement the parking, and off-street parking requirements within the zoning ordinance.”
Vehicular parking in the Downtown Addition will be provided on streets, in public parking lots, and on private lots. Parking for residents and for employees of businesses will be provided off-street, at the rear of the lot, and generally accessed by alleys. Parking for guests of residents will be provided on the streets abutting and nearby the lot. Parking for customers of businesses will be provided on the streets abutting and nearby the business, to the extent possible, with supplemental off-street parking provided in parking lots or parking structures behind the buildings and accessed by alleys.
The off-street parking requirements for residences and businesses within the DASP are detailed in Section 3.10 Parking Standards.
Circulation Element Policy 6.1– “The City shall ensure that new large-scale development accommodates and encourages the use of bicycles and walking through appropriate design of bicycle and pedestrian facilities.”
The proposed thoroughfare system includes multi-use
paths and bicycle lanes (Figure 3-39). All locations within the Downtown Addition are within a five-minute walk of Broadway Street where a regional transit location could be accessed. Thoroughfares in the DASP are designed to regulate traffic speed by design and with amenities, such as street trees, wide sidewalks, and on-street parking.
Circulation Element Policy 6.2– “New arterial and collector streets shall provide for bike lanes wherever necessary, particularly First Street, Canal Street, and San Antonio Road. Sidewalks shall be provided in all street sections on both sides of the street right-of-way.
Circulation Element Policy 6.3– “Separate bicycle and pedestrian paths shall be provided in parks, open space, or greenbelts areas where public access is to be encouraged.”
The arterial and collector streets within and adjacent to the DASP Planning Area (Bitterwater Road, Broadway Street and Oak Avenue (San Antonio Extension) provide for dedicated bike lanes (Figure 3-39). In addition, the proposed thoroughfare system includes sidewalks in all street sections on both sides of the street right-of-way, with the exception of the following thoroughfares: Oak Avenue (Figure 3-35) is proposed with a sidewalk on the west side only (east side sidewalk to be completed upon development of the Smith-Monterey, LLC - Eastern Extension in the future); Creekfront Drive (Figure 3-42) is proposed with a sidewalk on the building side only, with a pedestrian trail on the south side within the adjacent park; alleys do not provide separate sidewalks. In addition to the sidewalks a multi-use trail (Figure 3-46) along San Lorenzo Creek, a pedestrian trail network in the various parks, a number of paseos (Figure 3-45), and bicycle lanes on Broadway Street and Oak Avenue (southbound only as part of the Downtown Addition) are provided.
Circulation Element Policy 6.4– “Off-site street improvements, where required to provide access for any new residential development, shall provide adequate pedestrian as well as vehicular access to connect the new neighborhood with the community. These requirements shall include, at a minimum, concrete sidewalks on a least one side.”
Pedestrian activity is highly encouraged in the DASP with a pedestrian oriented grid thoroughfare pattern with sidewalks and other traffic-calming amenities. Any “off-site” street
B-11Adopted 14 June 2011 / Amended 28 January 2014 / Amended 24 March 2020
General Plan Consistency Review
Appendix B
improvements required to implement the Downtown Addition Specific Plan shall be designed to provide adequate pedestrian and vehicular access to the neighborhood.
Relevant Housing Element PoliciesHousing Element Policy 1.1 – “Encourage the development of a range in types and prices of housing to facilitate housing production commensurate with the City regional share, and address the City’s job–based housing demand through 2007.”
The DASP in founded on design principles that establish a wide range of housing types and corresponding prices by creating a vibrant mixed-housing and mixed-income community. The DASP will help the City to meet its regional share of housing production.
Housing Element Policy 1.2 – Regulate the development of large tracts through the Specific Plan process to ensure quality projects and provide for a range in types and prices of housing.”
The Downtown Addition neighbor hood generates land uses, site plans, and building designs that reflect high quality and strong urban design. The Regulating Code of this Specific Plan calls for:
Creating a compact, walkable mixed-use/mixed-income community;
Creating a pedestrian-friendly network of streets and public open spaces; and
Integrating affordable and workforce housing into neighborhoods.
To integrate affordable and workforce housing into the neighborhood, the Downtown Addition Specific Plan (DASP) contains a detailed form-based Regulating Code which is designed to ensure the establishment of a quality project and a wide variety of housing types and a range of housing prices. This Regulating Code proposes 12 different housing types and densities to help ensure a range of housing sizes and prices. In addition to a range of lot and house sizes, secondary buildings are permitted allowing a small accessory dwelling on the same lot as a primary residence. Such units are inherently affordable due to their size, design, location, and the additional rental revenue can cut mortgage costs for the primary homeowner.
Housing Element Policy 1.4– ‘Ensure the provision of adequate infrastructure, public services, and facilities needed to support new housing units.”
The DASP is designed to be consistent with Land Use, Public Services, Circulation, and Open Space goals, policies, and programs in the KCGP, which were intended to address these infrastructure, public service, and facilities needs of new development.
Housing Element Policy 1.5 –Regulate land uses and housing design to minimize the consumption of water and energy usage and encourage the design and construction of high quality housing products.”
The DASP promotes the efficient use of water and energy through water conserving design and equipment in construction, drought tolerant landscaping, natural drainage, solar orientation, and other methods. The form-based Regulating Code requires the design and construction of high quality housing products.
Housing Element Goal 3 – “To provide equal housing opportunities for very low, low, and moderate income households.”
The DASP provides housing that is affordable to lower income households by requiring a wide variety of housing types and housing which is “affordable by design”. In addition, it includes an Inclusionary Housing Program Outline and Framework (Appendix C) which upon adoption of the legal agreement will establish the details on the implementation of affordable housing within the DASP. This Inclusionary Housing Program Outline and Framework requires that at least 15 percent of the housing will be affordable to very low, low, and moderate-income households.
Housing Element Policy 3.1 – “Encourage the construction of affordable ownership housing and affordable rental housing for very low, low, and moderate income households.”
The DASP is founded on the principle that true neighborhoods provide a wide range of housing types. The Regulating Code promotes innovative building types which are “affordable by design”. These building types include: mixed-use buildings (residential units over commercial), live-work buildings, rowhouses, courtyard housing, villas, quadplexes, triplexes, duets, bungalow courts, multigeneration, sideyard and rearyard houses, and carriage units. This wide range of building types will result in the establishment of an innovative development plan that will result much greater affordability of housing.
Downtown Addition Specific Plan
City of King, CaliforniaB-12
General Plan Consistency Review
Appendix B
While the different housing types and lot sizes are designed to appeal to a range of income levels and thus to foster a stable, mixed-income neighborhood, close attention has been paid to ensuring that the development will also provide an important source of affordable housing for very low to low-income households.
The DASP has been developed in conformance with the City of King Housing Element 2002-2007 dated (January 2003) and will be consistent with the Inclusionary Housing Ordinance (Ordinance No. 637) which is codified at Chapter 17.19 of the City of King Municipal Code. It has been noted that under the 2002-2007 Housing Element one property within the Specific Plan Area was subject to a prior application for farm worker housing. The Casitas de Salcido project a 43-unit SRO was proposed in the M-1 zone near the southwest corner Chestnut Avenue and Bitterwater Road. Even though, the Casitas de Salcido project was abandoned by the project proponent, vestiges remain in the narrative and tabulator descriptions in the 2002-2007 Housing Element. The City has prepared an updated Housing Element (2007 – 2014) a draft is currently under review by the California Department of Housing & Community Development (HCD). The pending Draft Housing Element removes the vestiges of the abandoned Casitas de Salcido project. While it is expected that the 2007 – 2014 Housing Element will be adopted prior to City Council public hearings on the Specific Plan, if not, an amendment to the 2002-2007 Housing Element will be made by the City of King to amend these vestiges of the abandoned Casitas de Salcido Project in the Housing Element to the extent required.
A Housing Program will be formulated as part of the DASP in with consultation with the City and other housing agencies. The Housing Program will provide that at least 15 percent of the project’s residential units will be made available to low-to-moderate income households. Since the DASP is a phased project the Housing Program will indicate the minimum number of affordable housing units required will be met at the completion of each phase.
Housing Element Policy 3.2 – Promote innovative development plans (e.g., planned development, cluster development, zero-lot-line housing concepts, etc) that will help to increase the number of affordable housing units.
The DASP promotes several building types, such mixed-
use buildings (residential units over commercial), live-work buildings, courtyard housing, villas, duets, triplexes, quadplexes, and carriage units to increase the number of affordable housing units. House prices will be linked to house and lot sizes and will vary wide ly throughout the DASP area.
While the different housing types and lot sizes are designed to appeal to a range of income levels and thus to foster a stable, mixed-income neighborhood, close attention has been paid to ensuring that the development will also provide an important source of affordable housing for very low to low-income households. The architectural style, character, and quality of below-market-rate units will be indistinguishable from market-rate houses in order to have them meld harmoniously into the overall fabric of the new neighborhood.
Housing Element Policy 3.4–“Offer regulatory incentives and concessions for affordable housing, such as relief from development standards, density bonuses, or fee waivers where deemed appropriate.”
The DASP provides that housing that is affordable to lower income households by requiring a wide variety of housing types and housing which is “affordable by design”. In addition, an Inclusionary Housing Program (Appendix C) will be formulated with consultation with the City and other housing agencies. Upon adoption the Housing Program will be incorporated as part of the DASP. The Housing Program will provide that at least 15 percent of the project’s residential units will be made available to low-to-moderate income households. Since the DASP is a phased project the Housing Program will indicate the minimum number of affordable housing units required will be met at the completion of each phase.
Housing Element Policy 4.3 – “Encourage housing opportunities for those residents who have special housing needs such as farm workers large families, elderly, disabled persons, and other identified special needs groups.”
The DASP promotes several building types, such mixed-use buildings (residential units over commercial), live-work buildings, courtyard housing, duets, triplexes, quadplexes, and multigeneration houses, which can inherently meet the needs of various households. In addition, all units will meet the requirements of all relevant codes and standards governing visitability and accessibility.
B-13Adopted 14 June 2011 / Amended 28 January 2014 / Amended 24 March 2020
General Plan Consistency Review
Appendix B
Relevant Noise Element PoliciesNoise Element Policy 3.2.1 – Environmental Impact Reporting – “Pur suant to provisions of the California Public Resources Code, the City of King adopted an ordinance requiring Environmental Impact Assessments or report for most projects... As part of the Environmental Impact Report procedure the project must be analyzed in respect to any adverse effects which may be results of noise generated...”
A Noise Assessment Report has been prepared as a part of the environmental review process.
Noise Element Policy 3.2.2 – Zoning Ordinance Regulations – “The zoning ordinance contains general performancestandards which specify dBA levels/or residential, commercial, and industrial uses.”
No land uses are proposed within the Downtown Area Specific Plan that would create noise decibel levels in excess of the acceptable levels specified in the zoning ordinance for residential and commercial areas. Noise impacts are identified in the project’s Environmental Impact Report and, to the extent required, any mitigation measures for noise impacts will be conditions of approval.
Relevant Conservation Element PoliciesConservation Element Policy 1.1.1 – Water Resources – “The City shall preserve and protect all groundwater recharge areas from sources of pollution.”
Conservation Element Policy 1.1.2 – Water Resources – “The City shall regulate development that takes place on groundwater recharge areas to assure that recharge capabilities are not significantly diminished.”
The Downtown Addition has been designed to integrate the practice of sustainable stormwater management known as “Low Impact Development (LID)”. Unlike a conventional system that would simply pipe uncleansed stormwater into San Lorenzo Creek, the Downtown Addition will instead employ a multi-layered LID system of distributed BMP measures to collect, infiltrate and cleanse rainwater as close to the source as feasible. This system includes: measures on individual lots, such as flow-through planters, rain gardens and biofiltration basins and vegetated swales; measures along the Downtown Addition streets, alleys and parking lots include: measures such as biofiltration basins and vegetated swales and permeable alleys, sidewalks and parking lots; and potential filtration areas in the parks and greenways. In the Neighborhood Center zone storm drain filters (Filterra, Vortechs, or equivalent units) are
proposed due to design characteristics that are ideal for urban settings: they are extremely space efficient, have a minimal impact on site design, and can be contained within the right-of way, so to treat stormwater runoff from roads, buildings, and parking lots. A water quality filtration basin is proposed at the south-west end of the San Lorenzo Creek Linear Park for cleansing, infiltration and retention of stormwater runoff from commercial areas, with an overflow pipe or channel that releases cleansed stormwater into San Lorenzo Creek.
The area along the San Lorenzo Creek is designated as open space. No structures or other encroachments are proposed in the creek channel. The San Lorenzo Creek channel will be restored to prevent soil erosion and sedimentation, provide native habitat and help improve the water quality within the creek. In addition, a linear park provides a substantial buffer between the proposed urban development and the San Lorenzo Creek open space area.
Conservation Element Policy 1.1.3 – Water Resources – “Due to their primary function in recharging the Valley’s groundwater the City shall not permit development to encroach upon the main channels of the Salinas River and San Lorenzo Creek.”
The proposed Downtown Addition Specific Plan is located approximately 2 miles east of the Salinas River and abuts the San Lorenzo Creek. The area along the San Lorenzo Creek is designated as open space. No structures or other encroachments are proposed in the creek channel. In addition, a linear park provides a substantial buffer between the proposed urban development and the San Lorenzo Creek open space area.
Conservation Element Policy 1.1.4 – Water Resources – “Full buildout of this general plan shall not exceed the long-term estimated supply of groundwater resources.”
California Water Company provides potable water service in the City of King. The source of this water is groundwater. California Senate Bills 610 and 221 require a water assessment and verification of water supply for subdivisions of 500 units or more. An analysis was prepared by California Water Company dated October 13, 2006, includes the detailed analysis of the location and amount of groundwater required to meet the demands of the project. The water assessment concluded that adequate water supply is available for the project and that a “can and will serve” letter will be issued at the appropriate time.
Downtown Addition Specific Plan
City of King, CaliforniaB-14
General Plan Consistency Review
Appendix B
Conservation Element Policy 1.4.1 – Energy Resources – “The City shall encourage energy-efficient designs within new homes, commercial and industrial buildings, and public facilities.
The Downtown Addition will be designed to include energy conservation by incorporating low-flow fixtures, Energy Star appliances, compact design, adaptability, reduced solar loading, cross ventilation, recycled materials, and sustainably produced materials. Houses in the Downtown Addition will meet and exceed all existing Title 24 energy codes.
Relevant Open Space and Safety Element Policies Open Space Element Policy 2.1.1 – Environmentally Sensitive Lands –“The City shall assure that environmentally sensitive lands which are unique, limited, and fragile natural areas, are protected wherever possi ble.”
The proposed development is entirely on a site current ly in agricultural use but is designated for urban development in the 1998 General Plan. The site abuts San Lorenzo Creek. An adequate setback of at least 50 feet is proposed along the main creek channel to protect these natural areas.
Open Space Element Policy 2.3.3 – Farmlands Protection – “The City shall require that new, non-agriculturaldevelopment proposals adjacent to agricultural operations incorporate buffer areas to minimize incom patibilities, and to mitigate against the effects of agricultural operations on adjacent land uses.”
Open Space Element Program 2.3.3.1 – Farmlands Protection –“As part of its review and zoning, subdivision, and use permit approvals, the City shall require that buffer areas be provided as part of any non-agricultural development located adjacent to agricultural land uses. These buffer areas shall be of sufficient size to protect residential development from any significant adverse effects of agricultural operations, including noise, dust, and pesticide applications. The City shall consult with the Monterey County Agricultural Commissioner in the design and management of such buffer areas.”
The Downtown Addition includes a 200-foot wide buffer zone along San Lorenzo Creek to minimize any incompatibili ties between land uses and to mitigate the effects on both the residential area and the adjacent agricultural operations to the northeast.
During the phased construction process, rolling buffers of at least 200 feet will be maintained between any continuing
agricultural operations on the site and new development. As needed, a 200-foot agricultural buffer will be provided separating any agricultural operations on the adjacent property to the northeast, the Smith-Monterey, LLC - Eastern Extension. The Eastern Extension property is under the same ownership (Smith-Monterey, LLC), as the Downtown Addition.
Open Space Element Goal 2.4 – Scenic Resources and Landscape Protection “To assure that new development does not destroy or significantly impair the City’s scenic resources”
The DASP is located on a site most of which is currently in agricultural use but is designated for urban development in the 1998 General Plan. The site abuts San Lorenzo Creek. An adequate setback of at least 50 feet is proposed along the main creek channel to protect these natural areas.
Open Space Element Policy 2.4.1 – Scenic Resources and Landscape Protection “In reviewing plans for new development proposed along major thoroughfares, particularly entrances to King City, the City shall encourage appropriate site planning, design, building materials, landscaping, and signage to enhance the scenic quality of these thoroughfares.
The DASP is consistent with this goal and policy because the proj ect is designed to have a uniform palette of streetscape amenities and landscape features that will define its edges and create a unique identity for the community. The palette will also include identity signage, decorative street lighting, designated crosswalks with decorative paving, and uniform street tree plantings to enhance all thoroughfares in the neighborhood.
Open Space Element Goal 2.5 – Historical and Archaeological Sites –“To assure that new development does not destroy significant examples of the history or pre-history of the community...”
The proposed development is entirely on a highly disturbed site currently in agricultural use but designated for urban development in the 1998 General Plan. An assessment of archeological resources is contained in the project’s EIR. There are no historical or archeological sites of record on the property.
Open Space Element Program 2.6.1.1 – Parks and Recreational Facili ties – “The City shall coordinate park development with population increases and areas of significant new growth within the city.”
The DASP calls for approximately 234 acres of parkland and open space in the form of neighborhood parks, a
community
gis1
Cross-Out
B-15Adopted 14 June 2011 / Amended 28 January 2014 / Amended 24 March 2020
General Plan Consistency Review
Appendix B
park, greenways, and open space. The amount of parks and open space provided in the Downtown Addition exceeds the City’s open space requirement stated in Ordinance 622.
Open Space Element Policy 2.6.2 – Parks and Recreational Facilities –“The City shall continue to require that new subdivisions dedicate park land and/or park in-lieu fees that enable the purchase land and in lieu that enable the purchase of park land and/or provide recreational facilities.”
The DASP includes parks and open space distributed throughout the site to serve the residents of the new neighborhood. The State of California Quimby Act requires parkland at a ratio of at least three acres per 1,000 residents; in the City of King, that requirement has been increased to 3.38 acres per 1,000 residents (Ord. 622). For this project, the park acreage necessary to meet this requirement works out to be approximately 7.5 acres. The DASP exceeds the City of King’s required parkland set-aside.
Open Space Element Program 2.6.6.1 – Parks and Recreational Facilities- “Locate and design proposed parks and recreation areas to provide for ease of access to pedestrians and bicyclist by incorporating trails, paths side-walks/and or bicycle lanes. This program should be incorporated into a master park and recreation plan.”
The DASP proposed parks provide for ease of pedestrian access as well as connections to the community as a whole. The parks are dispersed so that all residents are within a quarter-mile, or five-minute, walk ing distance from any given park space. The parks are connected by an integrated system of sidewalks and multi-use paths within the neighborhood. Safe crossing areas are provided at key intersection points to adjacent neighborhoods to access schools, commercial areas, and other parks within King City.
The proposed park acreage exceeds the acreage required by state law based on three acres per 1,000 residents as well as the City’s higher allocation requirement of 3.38 acres per 1,000 residents.
Open Space Program 2.6.6.2 – Parks and Recreational Facilities-“Wind breaks shall be considered for new park and recreational projects in areas determined to be susceptible to prevailing wind. Design and sitting of windbreaks shall be reviewed and approved during the development review process.
Year-round, evergreen windbreak plantings will be integrated into the agricultural buffer park along San Lorenzo Creek and the along Bitterwater Greenway. These buffers located along the perimeter of the neighborhood are integrated with a meandering trail and will be major amenities. The landscape palette will consist of grasses, shrubs, and tree plantings.
Safety Element Goal 3.3 – Public Safety Facilities – “To provide police and fire protection at levels adequate for the protection of life and property.”
Site development has proceeded with police and fire protection in mind. The Police and Fire Departments were contacted in the development of the DASP and have reviewed the plan for a safety evaluation. The Police and Fire Departments are part of a Project Review Committee and will further review the project as it moves forward. In addition development fees in the amount of approximately $831,529 will be collected for law enforcement and fire protection (See Table 5-3).
Safety Element Policy 3.3.6 – Public Safety Facilities – “The City shall require that all new development proposals and/or changes in land use be referred to the Fire Department for safety evaluation.
The Fire Department was contacted in the development of the DASP and has reviewed the plan for a safety evaluation. The Fire Department will further review the project as it moves forward and to review and approve the fire sprinkler systems required throughout the DASP.
Downtown Addition Specific Plan
City of King, CaliforniaB-16
General Plan Consistency Review
Appendix B
Airport Land Use Plan (Mesa Del Rey Airport Master Plan)
Background
The Mesa Del Rey Airport, a general aviation airport which is owned and operated by the City, is located over 2,000 feet northeast of the closest portion of the Downtown Addition Specific Plan Area. This airport has no control tower, one north-south runway and is the home field of approximately 31 aircraft –- 25 single engine planes, 4 twin-engine planes, and 2 helicopters. On average, there are approximately 22 flight operations per day, and, as the airport is attended only during the hours of 8 a.m. to 5 P.M., most operations are assumed to occur during these hours. In a study prepared by Kimberly-Horn & Associates (10/06) for the City, it was estimated the Airport had approximately 7,862 annual aircraft operations, predominately general aviation.
The Monterey County Airport Land Use Commission’s (ALUC) has jurisdiction for the orderly development of land surrounding the Mesa Del Rey Airport. Pursuant to this authority, the ALUC has adopted a Comprehensive Land Use Plan for the Mesa Del Rey Airport. The current ALUC is the Amended Comprehensive Land Use Plan for the Mesa Del Rey Airport adopted on February 16, 1978 by Resolution No. 78-3. The Downtown Addition Specific Plan Area is not within the boundaries of City Airport Master Plan and the ACLUP.
Clear Zone and Approach Areas
The City has adopted Airport clear and approach safety zones of the extended centerline of the Airport runway in its current Airport Master Plan. The location of the runway protection zones are specified in the current Master Plan For Mesa Del Rey Airport, adopted by the City of King on January 11, 1978 (Resolution No. 1474), and the “Amended Comprehensive Land Use Plan For the Mesa Del Rey Airport” adopted by the Airport Land Use Commission of the County of Monterey, on February 16, 1978 (Resolution No. 78-3).
The Downtown Addition Specific Plan Area is located over 2,000 feet away from the Mesa Del Rey Airport, and is outside both the boundaries of the Airport Land Use Plan and the runway protection zone but is located within the traffic pattern of the airport. The DASP would also not interfere with aircraft or the adopted runway protection zones, and is located outside
the normal takeoff and landing patterns for aircraft. There are no approved or contemplated expansion plans for the airport; future operations are expected to continue to use the current flight paths and patterns, although the number of flights is expected to increase over time. The project’s proximity to the airport thus would not create safety hazards for people living or working in the project area, and would not have a potential to restrict future expansion of the airport or of runway protection safety zones.
The California Airport Land Use Planning Handbook (Handbook) provides planning guidance to Airport Land Use Commissions, airport proprietors, and counties and cities with jurisdiction over airport area land uses. The purpose of the Handbook is to support the purposes of the State Aeronautics Act. The Handbook allows jurisdictions flexibility in determining air safety zones that represent areas of assumed accident potential. Under the Handbook, the safety compatibility zone examples for the City Airport show that the Downtown Addition Specific Plan Area would be located in the Traffic Pattern Zone for the City Airport. The Handbook safety compatibility criteria guidelines in Table 9C recommends no limits on residential density for projects located in the Traffic Pattern Zone. Based on the location within the Traffic Pattern Zone the DASP includes the following mitigation measures:
No. 1: Due to the fact that some aircraft flight tracks from the City Airport pass over the Downtown Addition Specific Plan Area, the City shall require that the Applicant grant an aviation easement to the City in the form contained in Appendix D to the Caltrans Airport Land Use Planning Handbook.
No.2: Due to the fact that some aircraft flight tracks from the City Airport pass over the Downtown Addition Specific Plan Area, the City shall require that the Applicant shall record a deed notice to give Downtown Addition Project property buyers notice of aircraft in the vicinity in the form contained in Appendix D to the Caltrans Airport Land Use Planning Handbook.
In addition, the Federal Aviation Administration (FAA) regulates airspace and certain runway protection zones off the extended centerline of runways of airports, including the Mesa Del Rey Airport. The Downtown Addition Specific Plan Area is located in an area that will not be incompatible with any FAA airspace areas or runway protection zones for the City Airport
B-17Adopted 14 June 2011 / Amended 28 January 2014 / Amended 24 March 2020
General Plan Consistency Review
Appendix B
Specific Areas
Until an Ordinance compatible with Airport Approaches Zoning Ordinance #1856 or its successor is adopted by a local agency, proposed uses beneath the imaginary surfaces described in said ordinance shall be referred to the Commission for review and report if they may:
1. Release steam, dust smoke or other matter whichcould impair an aviator’s visibility;
2. Produce light emissions, either direct or by reflection,which could impair an aviator’s visibility;
3. Produce electrical emissions, which could interferewith communication or navigation aids.
The DASP does not propose any uses which would produce, steam, dust smoke, light or electrical emissions which would impair an aviator’s visibility or interfere with communication of navigation aids.
Height
New construction shall be referred to the ALUC if the heights of the structures exceed the allowable heights of Airport Approaches Zoning Ordinance #1856, or its successor, and the local agency does not have a similar ordinance. The DASP does not propose any uses, which will exceed the allowable heights.
The maximum height of all project buildings pursuant to the regulations contained in the proposed DASP would be limited to a maximum eave height above grade of: 36 feet in the NC zone; 234 feet in the NG-3 zone; and 20 feet in the NG-1 and NG-2 zone. Due to these height limitations, site buildings would not interfere with takeoffs and landings at the airport. In addition, according to the Mesa Del Rey Airport Master Plan, the Downtown Addition Specific Plan Area falls outside of the runway protection zone.
Noise
New Construction shall be referred to the ALUC if it is proposed within the comprehensive land use plan’s 1995 65 CNEL noise level contour and the local agency has not adopted a procedure to determine if noise insulation is required.
The level of aircraft noise depends on the types of aircraft, frequency of flights, aircraft take-offs and landings, airport flight tracks, and the distance from the aircraft noise source. The current City Airport Master Plan concluded that the 65
CNEL contour for airport operations falls entirely within the airport property because the mix of aircraft is not significant and the low volume of activity.
In addition, according to the City of King general plan, CNEL contours are not required for the City of King Airport, and sound measurements at the airport indicated that flying operations create no significant noise intrusions on the King City environment. This conclusion is based on measurements taken on Bitterwater Road, between Airport drive and the Soil Services facilities for the 1975 Noise Element and 1996 Noise Element Update. The measurements show the area’s L10 level to be 68 dBA. Though both aircraft and truck traffic contribute to this level, it is important to note that during the measurement period a passing truck caused the highest recorded noise level (83dBA), and none of the noise levels cause by the passage of overhead aircraft exceed 80 dBA. Measurements and observations made for the 1996 update of the General Plan Noise element confirm that for the most part the noise caused form traffic and other noise sources is indistinguishable from Aircraft noise.
gis1
Cross-Out

Downtown Addition Specific Plan
City of King, CaliforniaB-18
General Plan Consistency Review
Appendix B
This page intentionally left blank.
C-1Adopted 14 June 2011 / Amended 28 January 2014 / Amended 24 March 2020
Inclusionary Housing Program Outline and Framework
Appendix C
Inclusionary Housing Program Outline and FrameworkIn conformance with the City of King Housing Element 2002-2007 dated (January 2003) and the Inclusionary Housing Ordinance (Ord. No. 637) which is codified at Chapter 17.19 of the City of King Municipal Code, an Inclusionary Housing Program (“Housing Program”) shall be developed for the Downtown Addition Specific Plan. This Housing Program will be formulated in consultation with the City and other housing agencies. Pursuant to KCMC Section 17.19.030 (a) (2) no development shall occur until the City Council approves the Housing Program, including methods to assure continued provision of affordable housing units. Such approval shall be discretionary with the City Council. As shown in the Entitlement and Decision Making Process (Table 5-4) the Housing Program shall be processed concurrently with the Tentative Subdivision Map. Action on the Housing Program shall take place in advance of any action by the Planning Commission and City Council on the Tentative Subdivision Map. The Housing Program will describe the specific efforts that the developer of the Downtown Addition will take to promote low-to-moderate income housing construction in the city.
Background
In 2003, the City adopted an inclusionary housing ordinance which requires that prior to any approval of a development project having more than 30 units; the City must have approved an inclusionary housing program requiring the developer to provide at least 15 percent of their project for low to moderate income households. Affordable units must be developed on the project site and the developers must provide guarantees that the units will remain affordable or be replaced elsewhere in the City.
Program
So to contribute to the City housing goal for affordable housing the Downtown Addition Specific Plan Inclusionary Housing Program and corresponding legal agreement will outline the proposed technique or combination of techniques meeting the equivalent of the city low-to-moderate income housing goal.
The Housing Program will:
moderate income households;
required under the City Inclusionary Housing Ordinance;
be met at the completion of each residential phase. The affordable housing units shall be constructed concurrently with or prior to the corresponding phase of non-affordable housing units;
units will remain as low or moderate income housing. These devices include but are not limited to: deed restrictions, wrap-around financing, land sales contracts, first right of refusal vested in the city, and other similar strategies which will ensure the perpetuation of the low or moderate income housing;
the provisions of the City Inclusionary Ordinance;
be affordable;
made of income eligibility and how the program will be enforced and affordability monitored;
restrictions;
Downtown Addition Specific Plan
City of King, CaliforniaC-2
Inclusionary Housing Program Outline and Framework
Appendix C
1) contribution in the form of new residential units;
2) residential land;
3) financial assistance; or
4) a combination thereof that will contribute directlyto the construction of affordable low-to-moderateincome housing to the community;
work within the city;
those provided by state law for the production of affordable housing. This may include the use of the low- and moderate-income housing set aside funds from the community development agency; and
partner in the development of the required affordable housing.
Housing Program Agreement
The Housing Program Agreement Upon adoption shall be attached herein and incorporated as a component of the Downtown Addition Specific Plan.
D-1Adopted 14 June 2011 / Amended 28 January 2014 / Amended 24 March 2020
Master Developer/Builder Design Review
Appendix D
Master Developer/Builder Design Review
Four Step Project Approval and Permitting / Design Review Process
General
1. Submittals to the Master Developer/Builder DesignReview Committee must be by the Neighborhood Builder/Developer or authorized agent. Submittals are requiredwhenever any improvements or changes are proposed forany portion of the project (site, building exterior etc).
2. Submittals to, and approvals by, the Master Developer/Builder Design Review Committee must occur before anyArchitectural Plans, Plotting Plans or Tentative or FinalSubdivision Maps, Improvement Plans, Landscape Plans,Building Plans, or Site Plan are submitted to the City ofKing.
3. All submittals must be delivered to the Master Developer/Builder at the location of the current office or at a locationdesignated by the Master Developer/Builder.
4. Building plans must be prepared by a California registeredarchitect.
5. Site plans must be prepared by a California registeredarchitect or landscape architect.
6. Landscape plans must be prepared by a Californiaregistered landscape architect.
7. Include lot and tract numbers on all plans and otherdocuments submitted for review.
8. Any incomplete submittal (required number of copies,required information or payment of fees) will not beaccepted and will be returned to the NeighborhoodBuilder or authorized agent.
Procedure
Approval of plan submittals by the Master Developer/Builder Design Review Committee is required by purchase agreements. The Master Developer/Builder Design Review Committee must review submittals in four steps as follows:
Step 1: Concept Site Plan Alternatives/Architecture
Step 2: Refined Site Plan/Building Design
Step 3: Site Plan Package/Finalized Product Design/ Technology Drawings
Step 4: Construction Document Package
General Materials Required for Submittals
The required materials for the four submittal steps are described below. Please submit only items that are complete.
1. ¼” elevations of all building types
2. All sheet size to be 30” x 42”
3. Multifamily composite plans to be 1/8” scale
4. No mounted drawings will be accepted
5. Packages required:
Only” Rolled separately
Rolled separately
Only” Rolled separately
Engineering) labeled “Master Developer/Builder”
Builder’s full set scanned to at least 300 dpi resolution
6. In order to ensure that new development within theDowntown Addition Specific Plan does not exceed thedevelopment potential listed in Table 2-1 (Land UseSummary), the Master Developer shall be responsible fortracking the amount of proposed development by landuse and by zone and shall submit with each developmentapplication an accounting of proposed development andremaining development potential.
9.
100 percent of the housing units are dedicated to a special needs community (e.g. senior citizens,
farmworkers) as identified in the City's Housing Element. Up to one of each 50 units may be designated for a
caretaker or manager.
Housing projects meeting the the first or second criteria
are exempt from the Master Developer/Builder design
review process:
50 percent of the housing units are restricted to
households of less than 80 percent of the median family
income, per federal Housing and Urban Development standards.
Downtown Addition Specific Plan
City of King, CaliforniaD-2
Master Developer/Builder Design Review
Appendix D
Step 1: Concept Site Plan/Architecture
The Neighborhood Builder/Developer should prepare site plans and architecture, at a refined level, for the site in conformance with the Regulating Code (Section 3). Submittal MUST include conceptual grades, density, product square footage range by land use (commercial, live-work, residential) and zone, unit count by zone, edge condition grading and setback criteria. Proposed storm drain and sewer connection points must also be reflected.
Initial product concepts, architectural plans, elevations styles and roof plans should also be submitted for review at this time.
Step 1 Package Submittals:
Demonstrate consistency with applicable goals, policies and programs in Section 1.8 and conformance with allowed development potential listed in Table 2-1 (Land Use Summary) through the following documents:
1. Neighborhood Concept Diagrams, identifyingneighborhood design elements, such as:
Standards)
2. Individual unit floor plans, including:
all utility entrances and meters, and all trash and recycling receptacles
(square feet), number of bedrooms, number of bathrooms, proposed parking for each plan type (garage/open), and number of each per plan type
a description of the style elements that make up each style as they relate to design themes
(elevate all sides) - on one submittal sheet. See example.
open space
3. Site plan alternatives, at 1”=40’, including:
applicable street types and Section 3.4 (Urban Standards)
Standards and Figure 3-21 (Thoroughfare Type Diagram)
edges
conceptual grading analysis
unit count by zone, number of units by zone, density, unit mix by zone, product square footage range by land use (commercial, live-work, residential) and zone
4. Landscape concept plan:
enhancements
D-3Adopted 14 June 2011 / Amended 28 January 2014 / Amended 24 March 2020
Master Developer/Builder Design Review
Appendix D
Step 2: Refined Site Plan/Product Design
Refined neighborhood site plan design at 1”=40’. Finalize preliminary floor plan and building foot prints. Continued development of Step 1 preliminary building elevations (4 sides). Refine plotting and grading design, including engineering review. Establish elevation style elements and details.
Step 2 Submittal Requirements
Demonstrate consistency with applicable goals, policies and programs in Section 1.8 and conformance with allowed development potential listed in Table 2-1 (Land Use Summary) through the following documents:
1. Refined preliminary floor plans and building types; list plan number and size (square feet) on the plan
2. Refined building footprint/plot plans, including yardand setback dimensions and private open space.
3. Continued elevation refinement of all styles requiredfor all building elevations (4 sides) and number ofbuilding types, if applicable, and roof plans. Includedevelopment drawings of style details.
4. Site plan; include:
interior street spot elevations
Development Standards
Standards and Figure 3-21 (Thoroughfare Type Diagram)
conceptual grading analysis
unit count by zone, number of units by zone, density, unit mix by zone, product square footage range by land use (commercial, live-work, residential) and zone
5. Concept Landscape Plan
of intended amenities/furnishings
intended amenities/furnishings
minimum sizes, detail of vine trellises
sizes enhancements
hardscape design and tree placements. Architectural character of each home to be identified on the plan
conservation and solar orientation
Once Step 2 is approved the Community Landscape Standards will be distributed.
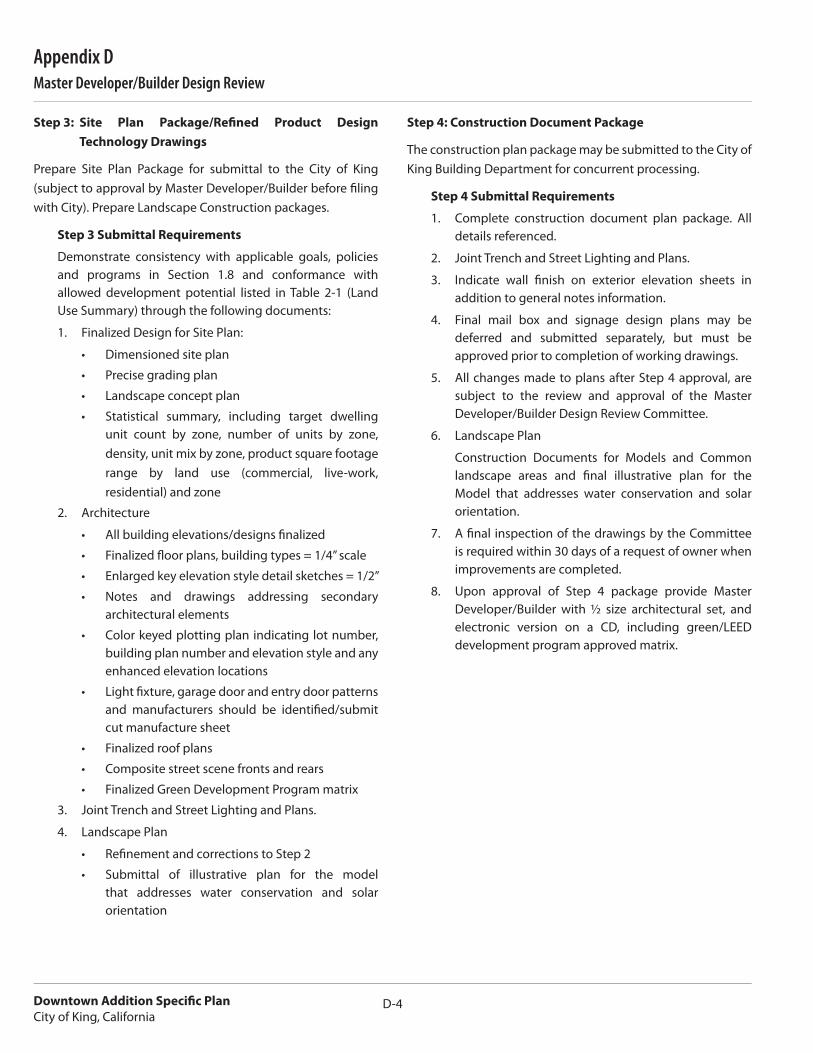
Downtown Addition Specific Plan
City of King, CaliforniaD-4
Master Developer/Builder Design Review
Appendix D
Step 3: Site Plan Package/Refined Product Design
Technology Drawings
Prepare Site Plan Package for submittal to the City of King (subject to approval by Master Developer/Builder before filing with City). Prepare Landscape Construction packages.
Step 3 Submittal Requirements
Demonstrate consistency with applicable goals, policies and programs in Section 1.8 and conformance with allowed development potential listed in Table 2-1 (Land Use Summary) through the following documents:
1. Finalized Design for Site Plan:
unit count by zone, number of units by zone, density, unit mix by zone, product square footage range by land use (commercial, live-work, residential) and zone
2. Architecture
architectural elements
building plan number and elevation style and any enhanced elevation locations
and manufacturers should be identified/submit cut manufacture sheet
3. Joint Trench and Street Lighting and Plans.
4. Landscape Plan
that addresses water conservation and solar orientation
Step 4: Construction Document Package
The construction plan package may be submitted to the City of King Building Department for concurrent processing.
Step 4 Submittal Requirements
1. Complete construction document plan package. Alldetails referenced.
2. Joint Trench and Street Lighting and Plans.
3. Indicate wall finish on exterior elevation sheets inaddition to general notes information.
4. Final mail box and signage design plans may bedeferred and submitted separately, but must beapproved prior to completion of working drawings.
5. All changes made to plans after Step 4 approval, aresubject to the review and approval of the MasterDeveloper/Builder Design Review Committee.
6. Landscape Plan
Construction Documents for Models and Commonlandscape areas and final illustrative plan for theModel that addresses water conservation and solarorientation.
7. A final inspection of the drawings by the Committeeis required within 30 days of a request of owner whenimprovements are completed.
8. Upon approval of Step 4 package provide MasterDeveloper/Builder with ½ size architectural set, andelectronic version on a CD, including green/LEEDdevelopment program approved matrix.
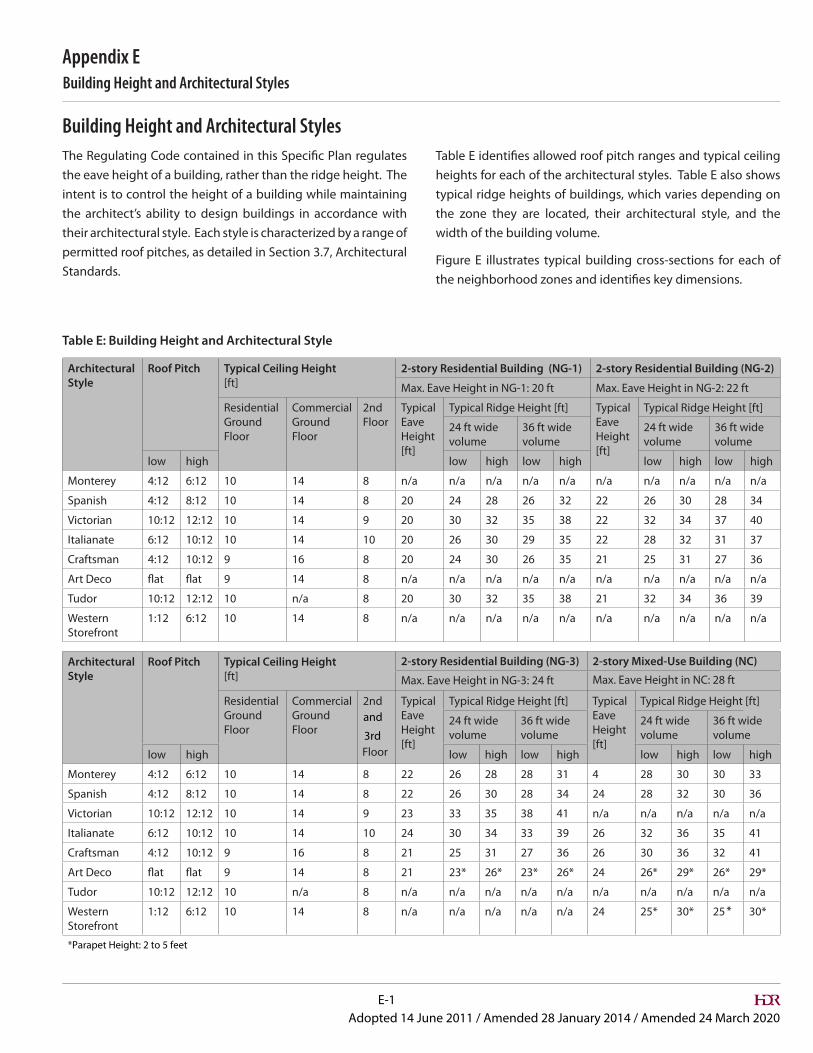
E-1Adopted 14 June 2011 / Amended 28 January 2014 / Amended 24 March 2020
Building Height and Architectural Styles
Appendix E
Architectural
Style
Roof Pitch Typical Ceiling Height
[ft]2-story Residential Building (NG-1) 2-story Residential Building (NG-2)
Max. Eave Height in NG-1: 20 ft Max. Eave Height in NG-2: 22 ft
Residential Ground Floor
Commercial Ground Floor
2nd Floor
Typical Eave Height[ft]
Typical Ridge Height [ft] Typical Eave Height[ft]
Typical Ridge Height [ft]
24 ft wide volume
36 ft wide volume
24 ft wide volume
36 ft wide volume
low high low high low high low high low high
Monterey 4:12 6:12 10 14 8 n/a n/a n/a n/a n/a n/a n/a n/a n/a n/a
Spanish 4:12 8:12 10 14 8 20 24 28 26 32 22 26 30 28 34
Victorian 10:12 12:12 10 14 9 20 30 32 35 38 22 32 34 37 40
Italianate 6:12 10:12 10 14 10 20 26 30 29 35 22 28 32 31 37
Craftsman 4:12 10:12 9 16 8 20 24 30 26 35 21 25 31 27 36
Art Deco flat flat 9 14 8 n/a n/a n/a n/a n/a n/a n/a n/a n/a n/a
Tudor 10:12 12:12 10 n/a 8 20 30 32 35 38 21 32 34 36 39
Western Storefront
1:12 6:12 10 14 8 n/a n/a n/a n/a n/a n/a n/a n/a n/a n/a
Architectural
Style
Roof Pitch Typical Ceiling Height
[ft]2-story Residential Building (NG-3)
Max. Eave Height in NG-3: 24 ft
2-story Mixed-Use Building (NC)
Max. Eave Height in NC: 28 ft
Residential Ground Floor
Commercial Ground Floor
2nd
Floor
Typical Eave Height[ft]
Typical Ridge Height [ft] Typical Eave Height[ft]
Typical Ridge Height [ft]
24 ft wide volume
36 ft wide volume
24 ft wide volume
36 ft wide volume
low high low high low high low high low high
Monterey 4:12 6:12 10 14 8 22 26 28 28 31 4 28 30 30 33
Spanish 4:12 8:12 10 14 8 22 26 30 28 34 24 28 32 30 36
Victorian 10:12 12:12 10 14 9 23 33 35 38 41 n/a n/a n/a n/a n/a
Italianate 6:12 10:12 10 14 10 24 30 34 33 39 26 32 36 35 41
Craftsman 4:12 10:12 9 16 8 21 25 31 27 36 26 30 36 32 41
Art Deco flat flat 9 14 8 21 23* 26* 23* 26* 24 26* 29* 26* 29*
Tudor 10:12 12:12 10 n/a 8 n/a n/a n/a n/a n/a n/a n/a n/a n/a n/a
Western Storefront
1:12 6:12 10 14 8 n/a n/a n/a n/a n/a 24 25* 30* 25 * 30*
* Parapet Height: 2 to 5 feet
Building Height and Architectural StylesThe Regulating Code contained in this Specific Plan regulates the eave height of a building, rather than the ridge height. The intent is to control the height of a building while maintaining the architect’s ability to design buildings in accordance with their architectural style. Each style is characterized by a range of permitted roof pitches, as detailed in Section 3.7, Architectural Standards.
Table E: Building Height and Architectural Style
Table E identifies allowed roof pitch ranges and typical ceiling heights for each of the architectural styles. Table E also shows typical ridge heights of buildings, which varies depending on the zone they are located, their architectural style, and the width of the building volume.
Figure E illustrates typical building cross-sections for each of the neighborhood zones and identifies key dimensions.
and
3rd
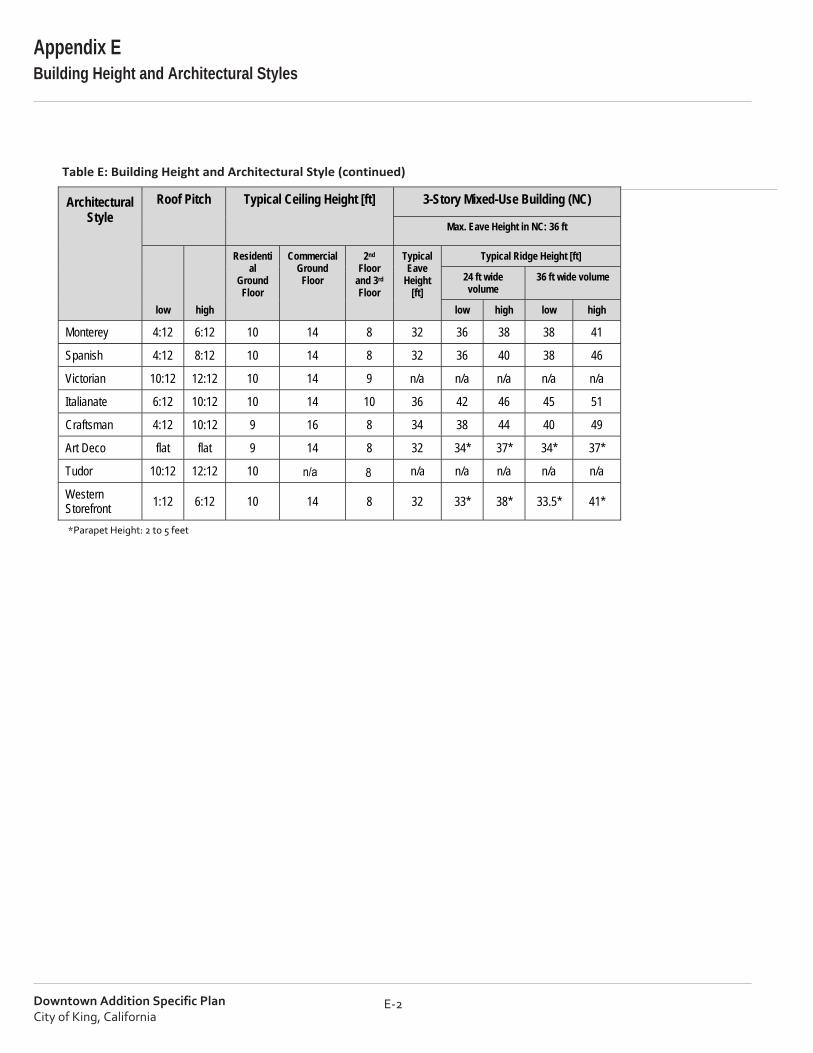
Downtown Addition Specific Plan City of King, California
E‐2
Appendix E Building Height and Architectural Styles
Table E: Building Height and Architectural Style (continued)
Architectural Style
Roof Pitch Typical Ceiling Height [ft] 3-Story Mixed-Use Building (NC)
Max. Eave Height in NC: 36 ft
low high
Residential
Ground Floor
Commercial Ground
Floor
2nd Floor
and 3rd Floor
Typical Eave
Height [ft]
Typical Ridge Height [ft]
24 ft wide volume
36 ft wide volume
low high low high
Monterey 4:12 6:12 10 14 8 32 36 38 38 41
Spanish 4:12 8:12 10 14 8 32 36 40 38 46
Victorian 10:12 12:12 10 14 9 n/a n/a n/a n/a n/a
Italianate 6:12 10:12 10 14 10 36 42 46 45 51
Craftsman 4:12 10:12 9 16 8 34 38 44 40 49
Art Deco flat flat 9 14 8 32 34* 37* 34* 37*
Tudor 10:12 12:12 10 n/a n/a n/a n/a n/a
Western Storefront 1:12 6:12 10 14 8 32 33* 38* 33.5* 41*
*Parapet Height: 2 to 5 feet
n/a 8
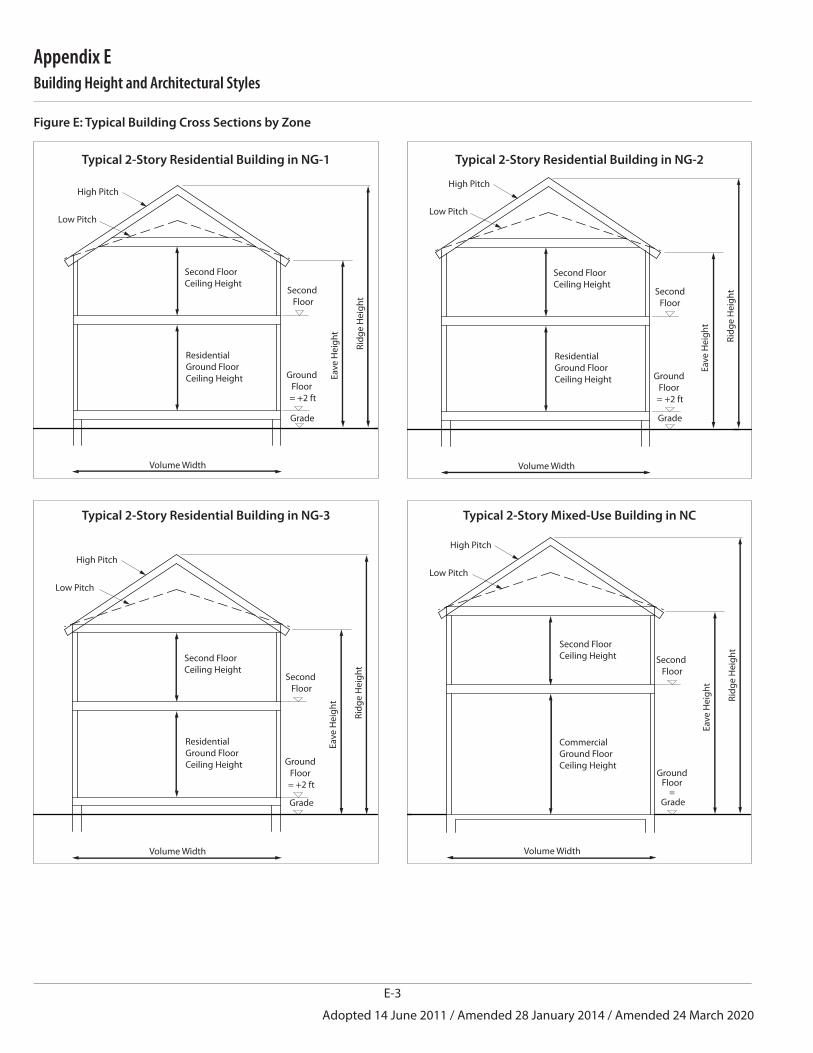
Adopted 14 June 2011 / Amended 28 January 2014 / Amended 24 March 2020
E-3
Building Height and Architectural Styles
Appendix E
High Pitch
Low Pitch
ResidentialGround FloorCeiling Height
Second FloorCeiling Height
Volume Width
Ground Floor = +2 ft
Second Floor
Grade
Ridg
e H
eigh
t
Eave
Hei
ght
High Pitch
Low Pitch
ResidentialGround FloorCeiling Height
Second FloorCeiling Height
Volume Width
Ground Floor = +2 ft
SecondFloor
Grade
Ridg
e H
eigh
t
Eave
Hei
ght
High Pitch
Low Pitch
Ground Floor = +2 ft
Volume Width
Second Floor
ResidentialGround FloorCeiling Height
Second FloorCeiling Height
Grade
Ridg
e H
eigh
t
Eave
Hei
ght Ri
dge
Hei
ght
Eave
Hei
ght
High Pitch
Low Pitch
Second Floor
CommercialGround FloorCeiling Height
Second FloorCeiling Height
Ground Floor
= Grade
Volume Width
Typical 2-Story Residential Building in NG-1
Figure E: Typical Building Cross Sections by Zone
Typical 2-Story Residential Building in NG-2
Typical 2-Story Residential Building in NG-3 Typical 2-Story Mixed-Use Building in NC
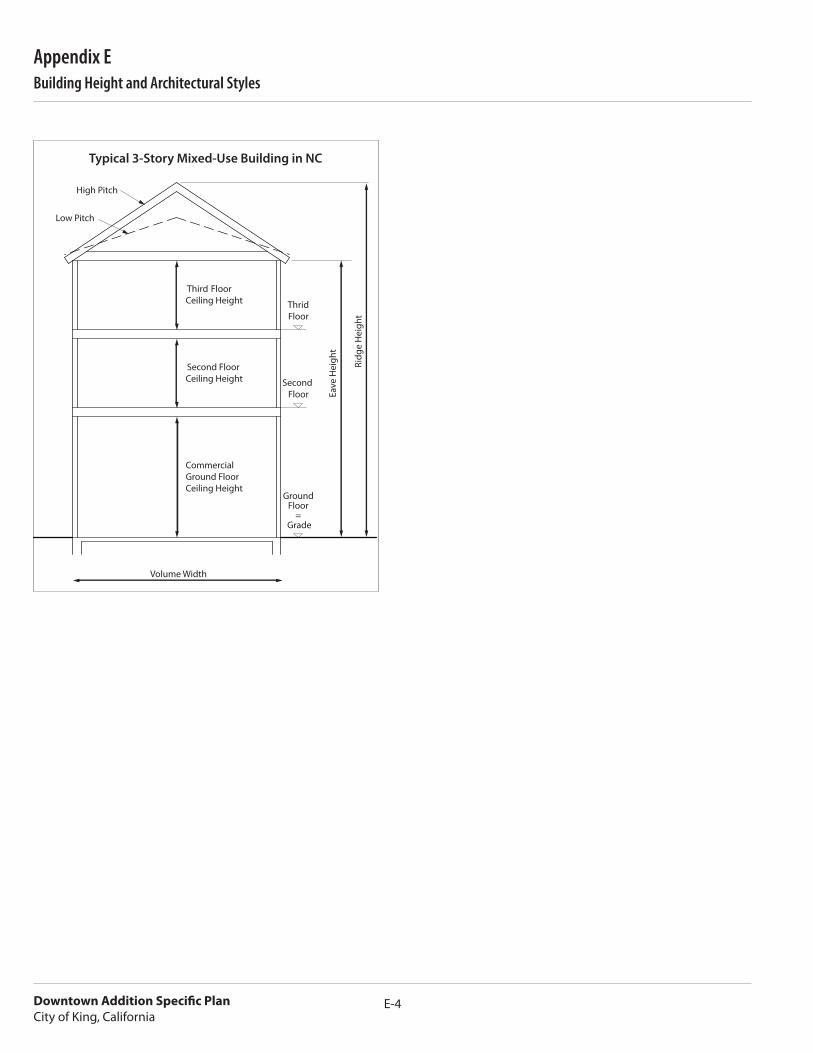
City of King, CaliforniaE-4
Building Height and Architectural StylesAppendix E
Ridg
e H
eigh
t
Eave
Hei
ght
High Pitch
Low Pitch
Second Floor
CommercialGround FloorCeiling Height
Second FloorCeiling Height
ThridFloor
Ground Floor
= Grade
Third FloorCeiling Height
Volume Width
Typical 3-Story Mixed-Use Building in NC
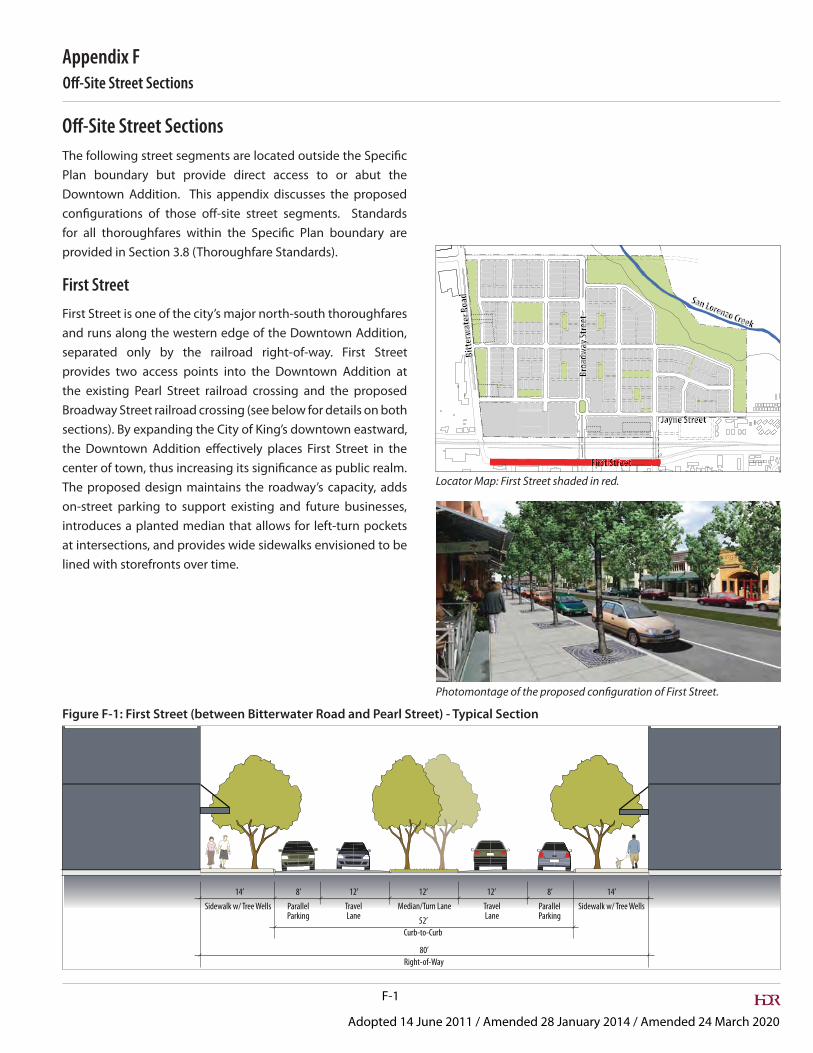
F-1
Adopted 14 June 2011 / Amended 28 January 2014 / Amended 24 March 2020
O�-Site Street SectionsAppendix F
O�-Site Street Sections
Plan boundary but provide direct access to or abut the Downtown Addition. This appendix discusses the proposed
provided in Section 3.8 (Thoroughfare Standards).
First StreetFirst Street is one of the city’s major north-south thoroughfares and runs along the western edge of the Downtown Addition, separated only by the railroad right-of-way. First Street provides two access points into the Downtown Addition at the existing Pearl Street railroad crossing and the proposed Broadway Street railroad crossing (see below for details on both sections). By expanding the City of King’s downtown eastward,
The proposed design maintains the roadway’s capacity, adds on-street parking to support existing and future businesses, introduces a planted median that allows for left-turn pockets at intersections, and provides wide sidewalks envisioned to be lined with storefronts over time.
Broa
dway
Stre
et
Jayne Street
San Lorenzo Creek
First StreetBi
tter
wate
r Roa
dFFFFFFF ttttsttssrsrsrrirsttiiiii SSSSSSSttttttttr tttteeteetteeteeettetteeeee
Locator Map: First Street shaded in red.
TravelLane
12’
TravelLane
12’8’
52’Curb-to-Curb
80’Right-of-Way
12’
Median/Turn Lane
14’
Sidewalk w/ Tree Wells
14’
Sidewalk w/ Tree WellsParallelParking
8’
ParallelParking
Figure F-1: First Street (between Bitterwater Road and Pearl Street) - Typical Section
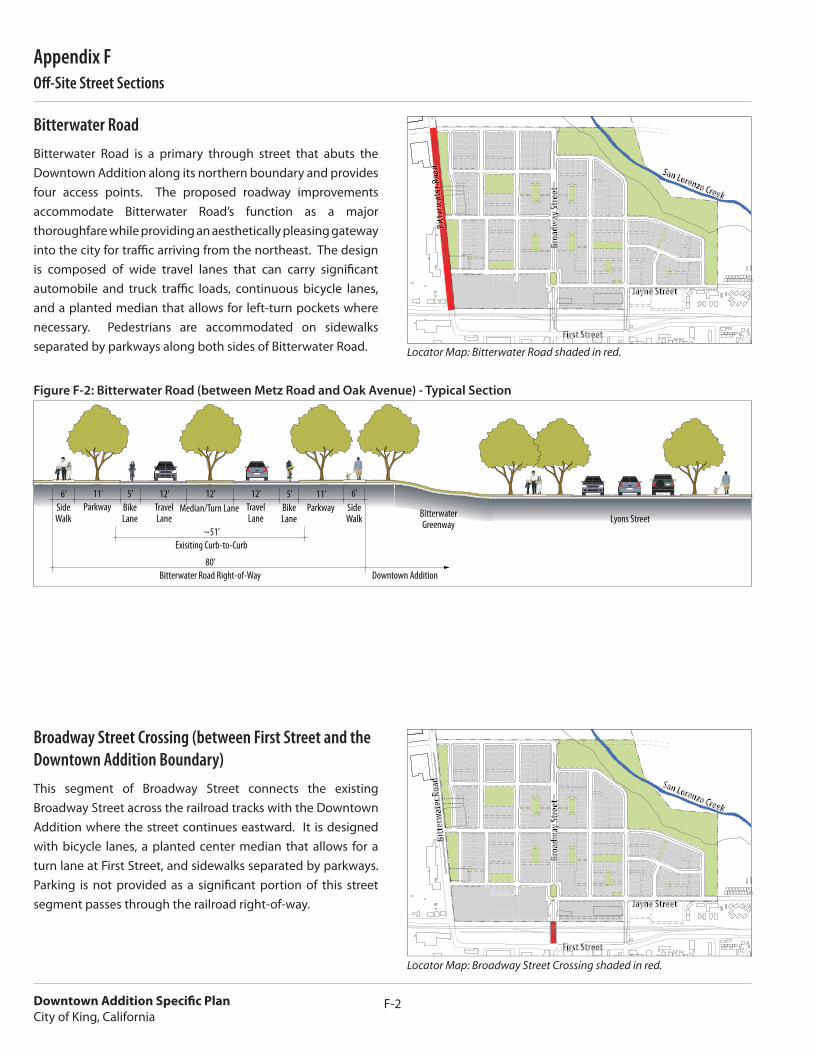
City of King, CaliforniaF-2
O�-Site Street SectionsAppendix F
Bitterwater RoadBitterwater Road is a primary through street that abuts the Downtown Addition along its northern boundary and provides four access points. The proposed roadway improvements accommodate Bitterwater Road’s function as a major thoroughfare while providing an aesthetically pleasing gateway
and a planted median that allows for left-turn pockets where necessary. Pedestrians are accommodated on sidewalks separated by parkways along both sides of Bitterwater Road.
Broadway Street Crossing (between First Street and the Downtown Addition Boundary)This segment of Broadway Street connects the existing Broadway Street across the railroad tracks with the Downtown Addition where the street continues eastward. It is designed with bicycle lanes, a planted center median that allows for a turn lane at First Street, and sidewalks separated by parkways.
segment passes through the railroad right-of-way.
B roa
dway
S tre
et
Jayne Street
San Lorenzo Creek
First Street
Bitt
erwa
ter R
oad
Locator Map: Broadway Street Crossing shaded in red.
Broa
d wa y
Stre
et
Jayne Street
San Lorenzo Creek
First Street
Bitt
erwa
ter R
oad
Bitt
errrrwwwwwwwwwwwwwwwwwwwwwwaaaaaaaaaaa
ttttttttttttteeeeeeeeer er er er errrrrrr RrRrRrRrRRRRRRRRRRRR
oooRoRooooooooooaoaoaoaoaa
dadadadadaaaaddddddddd
Locator Map: Bitterwater Road shaded in red.
Figure F-2: Bitterwater Road (between Metz Road and Oak Avenue) - Typical Section
80’noitiddA nwotnwoDyaW-fo-thgiR daoR retawrettiB
~51’Exisiting Curb-to-Curb
TravelLane
12’ 11’Parkway
5’BikeLane
6’SideWalk
TravelLane
12’BikeLane
11’ 5’Parkway
6’SideWalk
12’Median/Turn Lane
Lyons Street BitterwaterGreenway
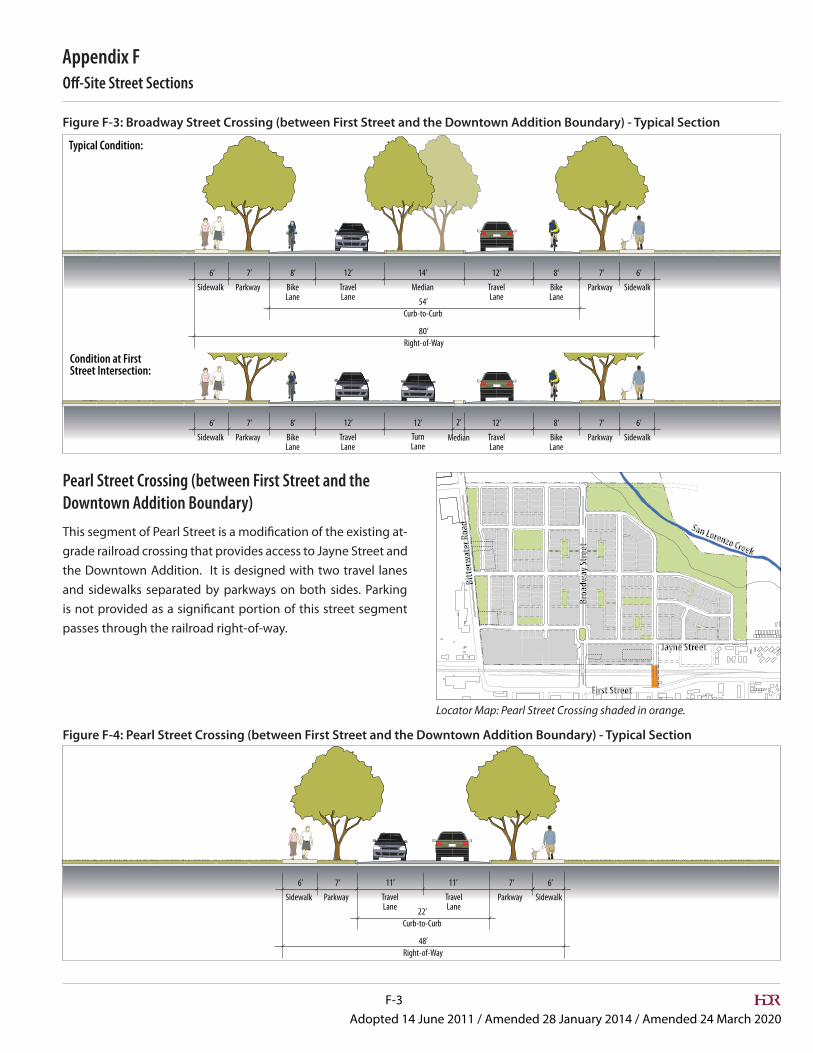
F-3Adopted 14 June 2011 / Amended 28 January 2014 / Amended 24 March 2020
O�-Site Street SectionsAppendix F
TravelLane
12’
TravelLane
12’8’
54’Curb-to-Curb
80’Right-of-Way
14’
Median BikeLane
8‘6’ 7’
Sidewalk Parkway
6’7’
SidewalkParkwayBikeLane
TravelLane
TurnLane
12’
TravelLane
12’8’ 12’ 2’
Median BikeLane
8‘6’ 7’
Sidewalk Parkway
6’7’
SidewalkParkwayBikeLane
Typical Condition:
Condition at First Street Intersection:
Pearl Street Crossing (between First Street and the Downtown Addition Boundary)
grade railroad crossing that provides access to Jayne Street and the Downtown Addition. It is designed with two travel lanes and sidewalks separated by parkways on both sides. Parking
passes through the railroad right-of-way.
Figure F-4: Pearl Street Crossing (between First Street and the Downtown Addition Boundary) - Typical Section
Figure F-3: Broadway Street Crossing (between First Street and the Downtown Addition Boundary) - Typical Section
TravelLane
11’
TravelLane
11’
22’Curb-to-Curb
48’Right-of-Way
6’ 7’
Sidewalk Parkway
6’7’
SidewalkParkway
Locator Map: Pearl Street Crossing shaded in orange.
Broa
dwa y
Stre
et
Jayne Street
San Lorenzo Creek
First Street
Bitt
erwa
ter R
oad

Downtown Addition Specific Plan
City of King, CaliforniaF-4
Off-Site Street Sections
Appendix F
This page intentionally left blank.
G-1Adopted 14 June 2011 / Amended 28 January 2014 / Amended 24 March 2020
Fiscal Impact Analysis
Appendix G
Fiscal Impact AnalysisAppendix G contains the following documents:
Fiscal Impact Analysis (“Fiscal Neutrality Study”) – January 28, 2014
Letter to the Community Development Director – February 8, 2011
Revised Fiscal and Economic Impact Analysis Memorandum – May 22, 2007
Fiscal and Economic Impact Analysis – February 19, 2007

Downtown Addition Specific Plan
City of King, CaliforniaG-2
Fiscal Impact Analysis
Appendix G
This page intentionally left blank.
2991 SHATTUCK AVENUE #203 | BERKELEY, CALIFORNIA 94705 | P: 510.647.5291 | F: 510.647.5295 | STRATEGICECONOMICS.COM
Date: January 28, 2014
To: Michael Powers, City Manager, City of King John M. Baucke, President and CEO, New Urban Realty Advisors, Inc.
From: Sarah Graham, Senior Associate Derek W. Braun, Associate II Alison Nemirow, Associate II
Project: Downtown Addition
Subject: Downtown Addition Fiscal Impact Analysis ("Fiscal Neutrality Study")
This memorandum presents the findings of Strategic Economics’ fiscal impact and fiscal neutrality analysis of four development scenarios for the Downtown Addition area of King City. Strategic Economics was hired by development team Smith-Monterey KC, LLC and New Urban Realty Advisors, Inc. (hereafter referred to as the “development team”) to update Strategic Economics’ 2007 report to the City of King, “King City Downtown Addition: Fiscal and Economic Impact Analysis.” The City of King requested this update due to changing market conditions, the continued evolution of the Downtown Addition development program, and changing fiscal conditions – including the dissolution of the City’s Community Development Agency ("CDA'). The adoption of the Downtown Addition Specific Plan on May 14, 2011 requires that this development in the Specific Plan Area be fiscally neutral so not to negatively impact General Fund finances (Condition of Approval No. 28). The purpose of this study is to determine the fiscal impacts from this development and assist the City and development team in determining what methods and measures are needed to ensure fiscal neutrality. The fiscal impact analysis only analyzes the development of the Smith-Monterey KC, LLC portion of the Downtown Addition Specific Plan area (the areas contained in Vested Map 2013-001).
This memorandum includes the following sections:
General description of fiscal impact analysis, its uses, and its limitations
Description of the analyzed development
Description of the analyzed property tax revenue scenarios
Summary of results
Alternative funding mechanisms
Detailed descriptions of the assumptions and methodology used for analysis
Appendices showing summaries of results by scenario and full phasing and valuation for eachscenario
MEMORANDUM
Downtown Addition Fiscal Impact Analysis | January 28, 2014
2
FISCAL IMPACT ANALYSIS DEFINITION, USES, AND LIMITATIONS Fiscal impact analysis measures the impact of new development and associated municipal services on a city’s budget. New residents and businesses create demand for city services (such as police and fire services) and facilities (such as parks and streets), but also provide sales tax, property tax, fee income, and other revenues. This fiscal impact analysis is focused on the ongoing operating and maintenance impacts of new development on King City’s General Fund, which is the primary operating fund for the City. As such, the analysis does not include estimates of one-time capital expenses such as infrastructure or facilities that may be required to accommodate new development. The analysis also excludes impacts on districts and agencies that are funded independently of the General Fund, such as school districts, community college districts, and the successor agency to the King City Community Development Agency. This is a “dynamic” fiscal impact analysis, which measures General Fund impacts over time as new development is assumed to be completed; in contrast, a “static” fiscal impact analysis only measures the impacts of the fully built-out development project.
As with all fiscal impact analyses, the assumptions drive the results. Strategic Economics created its assumptions based upon all available data, City input, and appropriate industry standards, but unforeseeable deviations in actual future conditions can alter the fiscal impact outcomes. As a result, fiscal impact analysis is a tool best used to understand the major revenue and expense generators associated with the Downtown Addition development scenarios, the magnitude of likely net revenues/losses, and to understand how the Downtown Addition development scenarios will alter the City’s balance between revenue sources and uses. The analysis is particularly useful for comparing the relative fiscal impacts of the development scenarios and gauging the magnitude of alternative financing mechanisms to achieve King City’s required neutral fiscal impact of the development on its General Fund.
This analysis does not incorporate any revenues or costs generated by properties that are not owned by Smith-Monterey KC, LLC yet are located within the Downtown Addition Specific Plan Area. The excluded area (the "Outparcels”) is designated to include 74 residential units and 50,400 square feet of commercial retail development. However, the fiscal impact analysis allocated nearly all infrastructure maintenance responsibilities for the entire Downtown Addition Specific Plan Area to the Smith-Monterey KC, LLC properties. Accordingly, the fiscal impact analysis results are likely conservative since the costs to maintain the shared infrastructure would be shared by future development that could occur on these outparcels.
DEVELOPMENT SCENARIOS The development team provided four scenarios for analysis under two different revenue assumptions, described below. The scenarios describe potential development on properties owned by Smith-Monterey KC, LLC within the Downtown Addition Specific Plan area (the areas contained in Vested Map 2013-001). The properties are located within the boundaries of the King City Downtown Addition Specific Plan, but do not include all properties within the plan area. The Specific Plan describes development of a mixed-use neighborhood northeast of First Street, between Bitterwater Road and San Lorenzo Creek.
All the scenarios include a mix of commercial and residential uses. They incorporate a well-connected traditional street grid, open spaces and parks, and a mix of uses within easy walking distance of each other. The amounts of included park land, open space, and streets are nearly equal in all scenarios. Development of all scenarios is assumed to commence in mid-2019 and finish in mid-2035.
Downtown Addition Fiscal Impact Analysis | January 28, 2014
3
The scenarios differ in the number and mix of included housing units, the amount of commercial square feet, and the timing or inclusion of extending Broadway Street east across existing railroad tracks into the Downtown Addition area. Each scenario is described below and summarized in the following table; detailed descriptions of the scenarios are found in Appendix B.
Scenario 1: No Broadway Extension, 2-Story Neighborhood Commercial Center, 581 Housing Units Scenario 1 assumes that Broadway Street is never extended across the existing railroad tracks due to potential factors such as a Public Utilities Commission denial, Union Pacific Railroad refusal, abandonment of pursuing construction of a train station, inability to obtain right-of-way, etc. Instead, under Scenario 1 Pearl Street is improved as the permanent access to 1st Street. Commercial development is relatively limited due to isolation from the existing Downtown commercial district along Broadway; instead, a higher number of housing units are included.
Scenario 2 (“The Project”): Pearl Street Entry Developed before Broadway, 2-Story Neighborhood Commercial Center, 528 Housing Units Scenario 2 assumes that the Pearl Street entry to the Downtown Addition is improved with interim improvements during the first year of construction and continues as the primary access to the Downtown Addition until the extension of Broadway is operational. The commercial square footage is higher than Scenario 1 due to the inclusion of a Broadway extension in a later phase; fewer housing units are included due to the additional commercial space.
Scenario 2 is “The Project," as set forth in the adopted Specific Plan, with the extension of Broadway in the later phases of the project (Phase 6 of 7) (shown in the phasing guide in Figure 5-1 of the Downtown Specific Plan). The more detailed 15 year phasing program prepared for this study includes the construction and extension of Broadway into the project as part of the 13th year of construction out of 15 total years. The adopted Specific Plan envisions that in the long term, Broadway Street would be extended from the existing downtown into the Site, crossing the railroad tracks at-grade.
Scenario 3: Broadway Extended and Developed in Phase/Year One, 2-Story Neighborhood Commercial Center, 528 Housing Units Scenario 3 assumes that the Broadway Street at-grade extension is approved by the Public Utilities Commission prior to project development, and then constructed as part of infrastructure improvements in the first year of Downtown Addition construction. This allows the commercial uses along Broadway Street to develop earlier than in Scenario 2 (“The Project”), although the development team believes current underwriting requirement of bonds required to finance the construction of the Broadway improvements and other financial feasibility and regulatory challenges make this outcome speculative.
Scenario 4: Broadway Extended and Developed in Phase/Year One, 3-Story Neighborhood Commercial Center, 576 Housing Units As with Scenario 3, Scenario 4 assumes that Broadway Street is extended and developed in the first year of construction, prior to improvement and development at the Pearl Street entrance. Scenario 4 also assumes that the mixed-use neighborhood commercial center features greater density and height, resulting in a higher number of housing units. Again, the development team believes that regulatory, financial feasibility and funding challenges make it uncertain that Broadway Street can be extended in phase one.
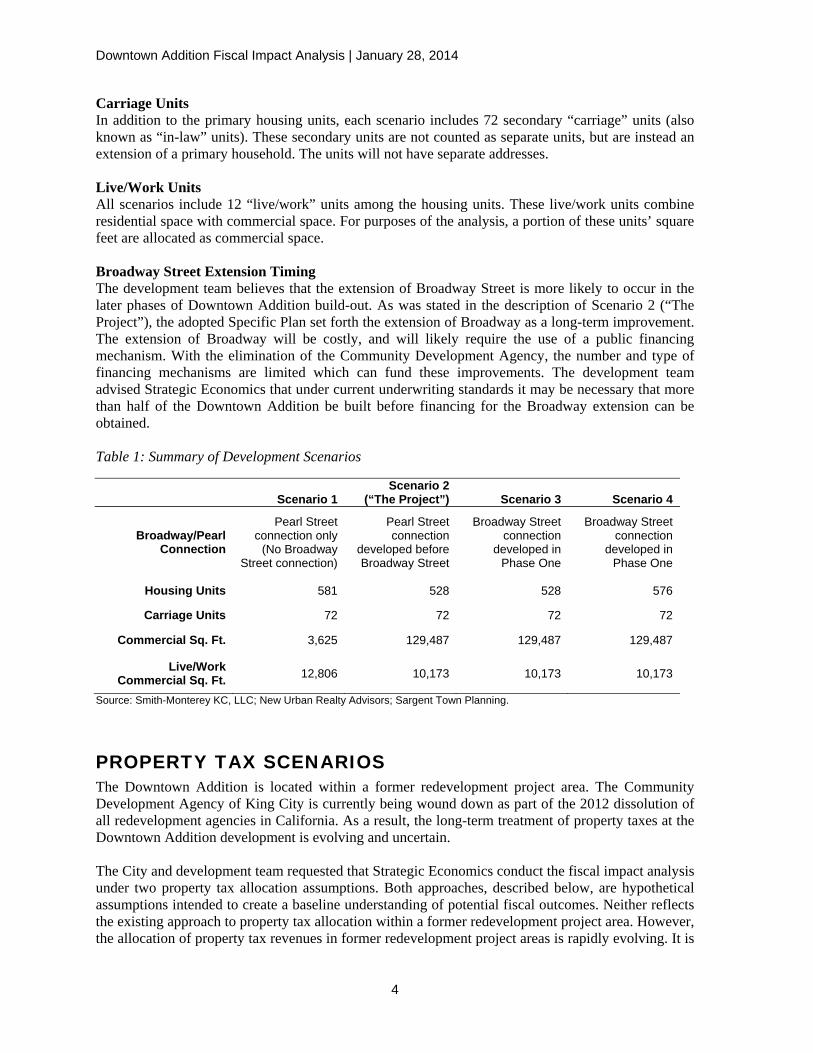
Downtown Addition Fiscal Impact Analysis | January 28, 2014
4
Carriage Units In addition to the primary housing units, each scenario includes 72 secondary “carriage” units (also known as “in-law” units). These secondary units are not counted as separate units, but are instead an extension of a primary household. The units will not have separate addresses.
Live/Work Units All scenarios include 12 “live/work” units among the housing units. These live/work units combine residential space with commercial space. For purposes of the analysis, a portion of these units’ square feet are allocated as commercial space.
Broadway Street Extension Timing The development team believes that the extension of Broadway Street is more likely to occur in the later phases of Downtown Addition build-out. As was stated in the description of Scenario 2 (“The Project”), the adopted Specific Plan set forth the extension of Broadway as a long-term improvement. The extension of Broadway will be costly, and will likely require the use of a public financing mechanism. With the elimination of the Community Development Agency, the number and type of financing mechanisms are limited which can fund these improvements. The development team advised Strategic Economics that under current underwriting standards it may be necessary that more than half of the Downtown Addition be built before financing for the Broadway extension can be obtained.
Table 1: Summary of Development Scenarios
Scenario 1 Scenario 2
(“The Project”) Scenario 3 Scenario 4
Broadway/Pearl Connection
Pearl Street connection only
(No Broadway Street connection)
Pearl Street connection
developed before Broadway Street
Broadway Street connection
developed in Phase One
Broadway Street connection
developed in Phase One
Housing Units 581 528 528 576
Carriage Units 72 72 72 72
Commercial Sq. Ft. 3,625 129,487 129,487 129,487
Live/Work Commercial Sq. Ft. 12,806 10,173 10,173 10,173
Source: Smith-Monterey KC, LLC; New Urban Realty Advisors; Sargent Town Planning.
PROPERTY TAX SCENARIOS The Downtown Addition is located within a former redevelopment project area. The Community Development Agency of King City is currently being wound down as part of the 2012 dissolution of all redevelopment agencies in California. As a result, the long-term treatment of property taxes at the Downtown Addition development is evolving and uncertain.
The City and development team requested that Strategic Economics conduct the fiscal impact analysis under two property tax allocation assumptions. Both approaches, described below, are hypothetical assumptions intended to create a baseline understanding of potential fiscal outcomes. Neither reflects the existing approach to property tax allocation within a former redevelopment project area. However, the allocation of property tax revenues in former redevelopment project areas is rapidly evolving. It is
Downtown Addition Fiscal Impact Analysis | January 28, 2014
5
therefore not possible to predict the actual property tax approach that will be in place in the Downtown Addition project area in 2020.
The first property tax approach assumes that property tax revenues from the Downtown Addition are treated in a similar manner as any non-redevelopment area of the City. That is, the City receives its share – after ordinary deductions – of the one percent property tax levied on properties within the Downtown Addition’s Monterey County “tax rate area” number 002-009. This approach provides a basic understanding of the Downtown Addition’s potential fiscal impact on the General Fund, but does not account for the current “Redevelopment Property Tax Trust Fund” process of using property tax increment to pay off existing redevelopment bond obligations, then distributing funds to other taxing agencies and disbursing a portion of the remaining revenue to the City.
The second property tax allocation approach treats the Downtown Addition Affordable Housing Agreement and Owner Participation Agreement as enforceable obligations recognized by the California Department of Finance. Under that circumstance, property tax increment would be diverted to the Successor Agency of the Community Development Agency of King City. This property tax allocation approach assumes that zero property tax revenue would flow to the King City General Fund as a result of the Downtown Addition development during the 15-year term of the analysis. This study did not attempt to allocate the tax increment under these enforceable obligations to the public improvements set forth in the agreements (e.g. Broadway at-grade crossing, train station, etc).
SUMMARY OF RESULTS Non-redevelopment Scenarios 2 (“The Project”), 3, and 4 have a positive fiscal impact on the General Fund upon completion of full build-out; all others are negative. Non-redevelopment Scenarios 2 (“The Project”), 3, and 4 result in positive annual net revenue to the General Fund upon full build-out of the Downtown Addition development. These scenarios generate significant property and sales tax revenues at full build-out.
All scenarios in which property taxes are diverted to a redevelopment successor agency result in a negative fiscal impact on the General Fund, both throughout the entire build-out period and upon completion of build-out. The redevelopment taxation approach diverts property tax revenue from the General Fund. Property tax is one of the top two drivers of revenue in most non-redevelopment scenarios. Elimination of this key revenue source from the General Fund results in ongoing negative fiscal impacts throughout the build-out period and upon completion.
All scenarios have a negative fiscal impact on the General Fund at some point during build-out. Although some scenarios are positive upon build-out and/or generate net positive General Fund revenue over the entire build-out period, all scenarios are negative at some point during the build-out period. This is generally attributable to the timing of commercial development, since this retail space generates sales tax revenue.
Non-redevelopment Scenario 3 has a net positive fiscal impact on the General Fund when all annual net revenues are summed for the build-out period. Scenario 3 results in a positive annual fiscal impact on the General Fund upon completion and also generates positive total net revenue during the build-out period.
Due to its limited commercial space (and therefore sales tax generation), Scenario 1 results in the lowest net revenues under both the redevelopment and non-redevelopment approaches. Scenario 1 significantly lags all scenarios for revenue generation due to its limited amount of sales tax generating commercial space.
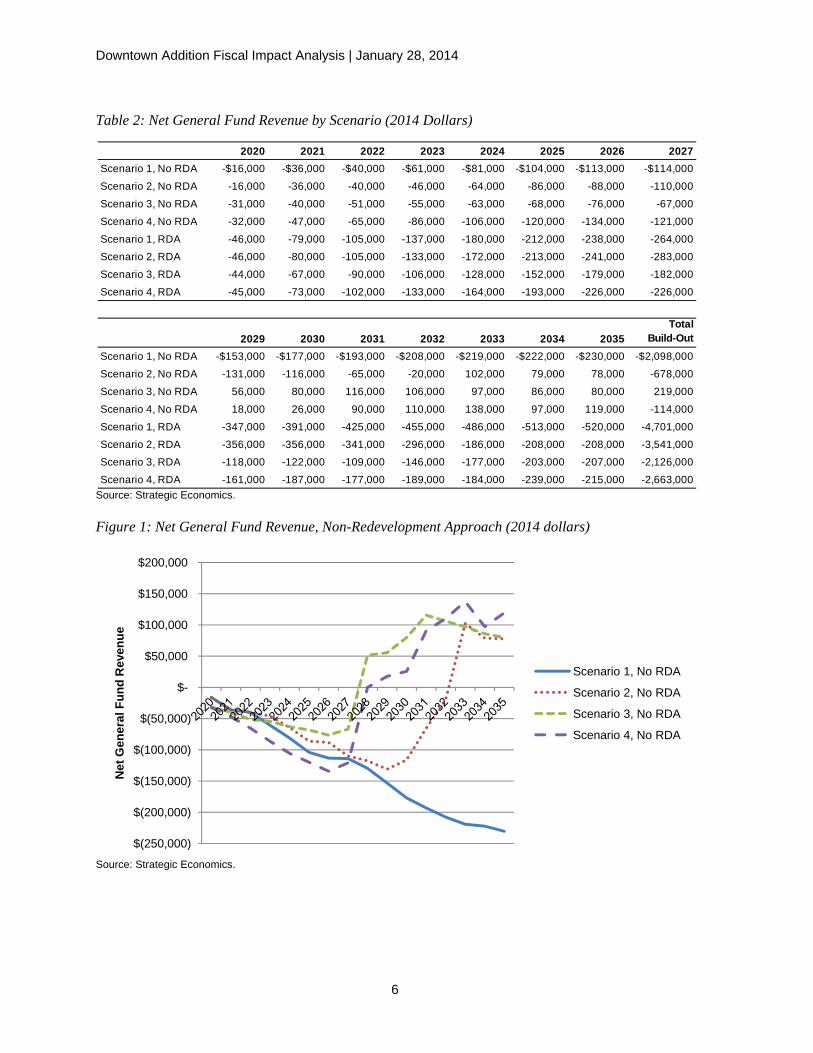
Downtown Addition Fiscal Impact Analysis | January 28, 2014
6
Table 2: Net General Fund Revenue by Scenario (2014 Dollars)
Source: Strategic Economics.
Figure 1: Net General Fund Revenue, Non-Redevelopment Approach (2014 dollars)
Source: Strategic Economics.
2020 2021 2022 2023 2024 2025 2026 2027Scenario 1, No RDA -$16,000 -$36,000 -$40,000 -$61,000 -$81,000 -$104,000 -$113,000 -$114,000
Scenario 2, No RDA -16,000 -36,000 -40,000 -46,000 -64,000 -86,000 -88,000 -110,000
Scenario 3, No RDA -31,000 -40,000 -51,000 -55,000 -63,000 -68,000 -76,000 -67,000
Scenario 4, No RDA -32,000 -47,000 -65,000 -86,000 -106,000 -120,000 -134,000 -121,000
Scenario 1, RDA -46,000 -79,000 -105,000 -137,000 -180,000 -212,000 -238,000 -264,000Scenario 2, RDA -46,000 -80,000 -105,000 -133,000 -172,000 -213,000 -241,000 -283,000
Scenario 3, RDA -44,000 -67,000 -90,000 -106,000 -128,000 -152,000 -179,000 -182,000
Scenario 4, RDA -45,000 -73,000 -102,000 -133,000 -164,000 -193,000 -226,000 -226,000
2029 2030 2031 2032 2033 2034 2035Total
Build-OutScenario 1, No RDA -$153,000 -$177,000 -$193,000 -$208,000 -$219,000 -$222,000 -$230,000 -$2,098,000
Scenario 2, No RDA -131,000 -116,000 -65,000 -20,000 102,000 79,000 78,000 -678,000
Scenario 3, No RDA 56,000 80,000 116,000 106,000 97,000 86,000 80,000 219,000
Scenario 4, No RDA 18,000 26,000 90,000 110,000 138,000 97,000 119,000 -114,000
Scenario 1, RDA -347,000 -391,000 -425,000 -455,000 -486,000 -513,000 -520,000 -4,701,000
Scenario 2, RDA -356,000 -356,000 -341,000 -296,000 -186,000 -208,000 -208,000 -3,541,000Scenario 3, RDA -118,000 -122,000 -109,000 -146,000 -177,000 -203,000 -207,000 -2,126,000
Scenario 4, RDA -161,000 -187,000 -177,000 -189,000 -184,000 -239,000 -215,000 -2,663,000
$(250,000)
$(200,000)
$(150,000)
$(100,000)
$(50,000)
$-
$50,000
$100,000
$150,000
$200,000
Net
Gen
eral
Fun
d R
even
ue
Scenario 1, No RDA
Scenario 2, No RDA
Scenario 3, No RDA
Scenario 4, No RDA
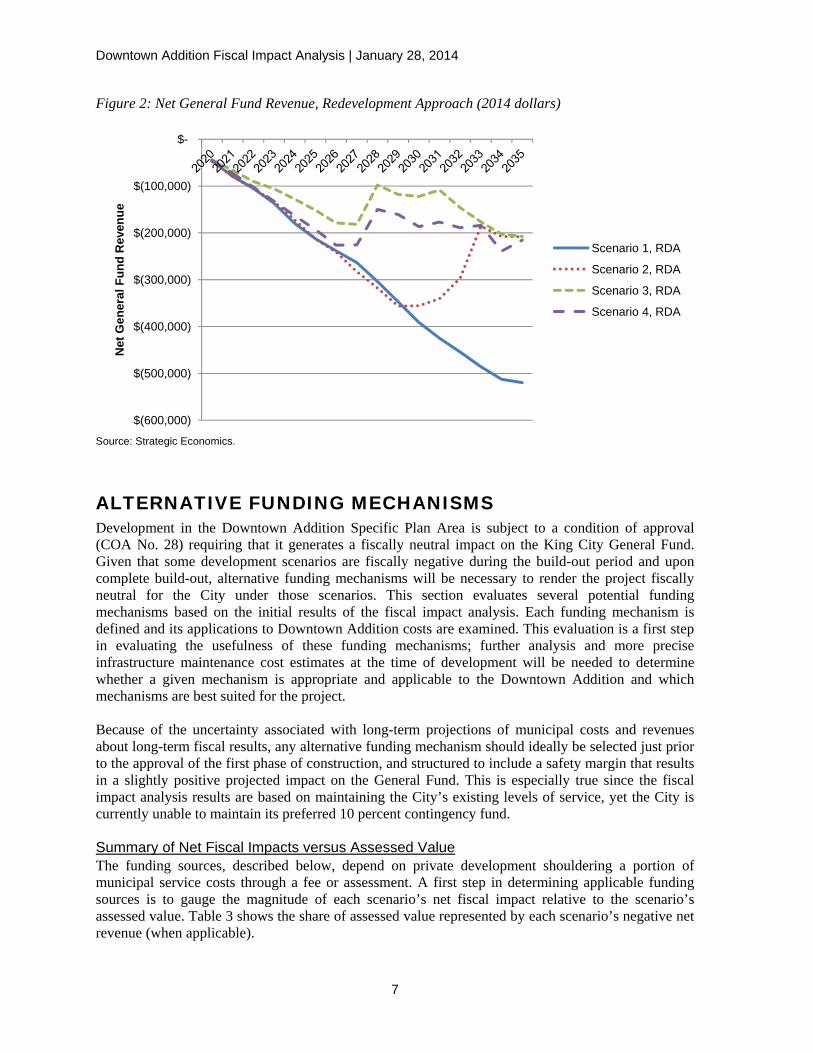
Downtown Addition Fiscal Impact Analysis | January 28, 2014
7
Figure 2: Net General Fund Revenue, Redevelopment Approach (2014 dollars)
Source: Strategic Economics.
ALTERNATIVE FUNDING MECHANISMS Development in the Downtown Addition Specific Plan Area is subject to a condition of approval (COA No. 28) requiring that it generates a fiscally neutral impact on the King City General Fund. Given that some development scenarios are fiscally negative during the build-out period and upon complete build-out, alternative funding mechanisms will be necessary to render the project fiscally neutral for the City under those scenarios. This section evaluates several potential funding mechanisms based on the initial results of the fiscal impact analysis. Each funding mechanism is defined and its applications to Downtown Addition costs are examined. This evaluation is a first step in evaluating the usefulness of these funding mechanisms; further analysis and more precise infrastructure maintenance cost estimates at the time of development will be needed to determine whether a given mechanism is appropriate and applicable to the Downtown Addition and which mechanisms are best suited for the project.
Because of the uncertainty associated with long-term projections of municipal costs and revenues about long-term fiscal results, any alternative funding mechanism should ideally be selected just prior to the approval of the first phase of construction, and structured to include a safety margin that results in a slightly positive projected impact on the General Fund. This is especially true since the fiscal impact analysis results are based on maintaining the City’s existing levels of service, yet the City is currently unable to maintain its preferred 10 percent contingency fund.
Summary of Net Fiscal Impacts versus Assessed Value The funding sources, described below, depend on private development shouldering a portion of municipal service costs through a fee or assessment. A first step in determining applicable funding sources is to gauge the magnitude of each scenario’s net fiscal impact relative to the scenario’s assessed value. Table 3 shows the share of assessed value represented by each scenario’s negative net revenue (when applicable).
$(600,000)
$(500,000)
$(400,000)
$(300,000)
$(200,000)
$(100,000)
$-
Net
Gen
eral
Fun
d R
even
ue
Scenario 1, RDA
Scenario 2, RDA
Scenario 3, RDA
Scenario 4, RDA
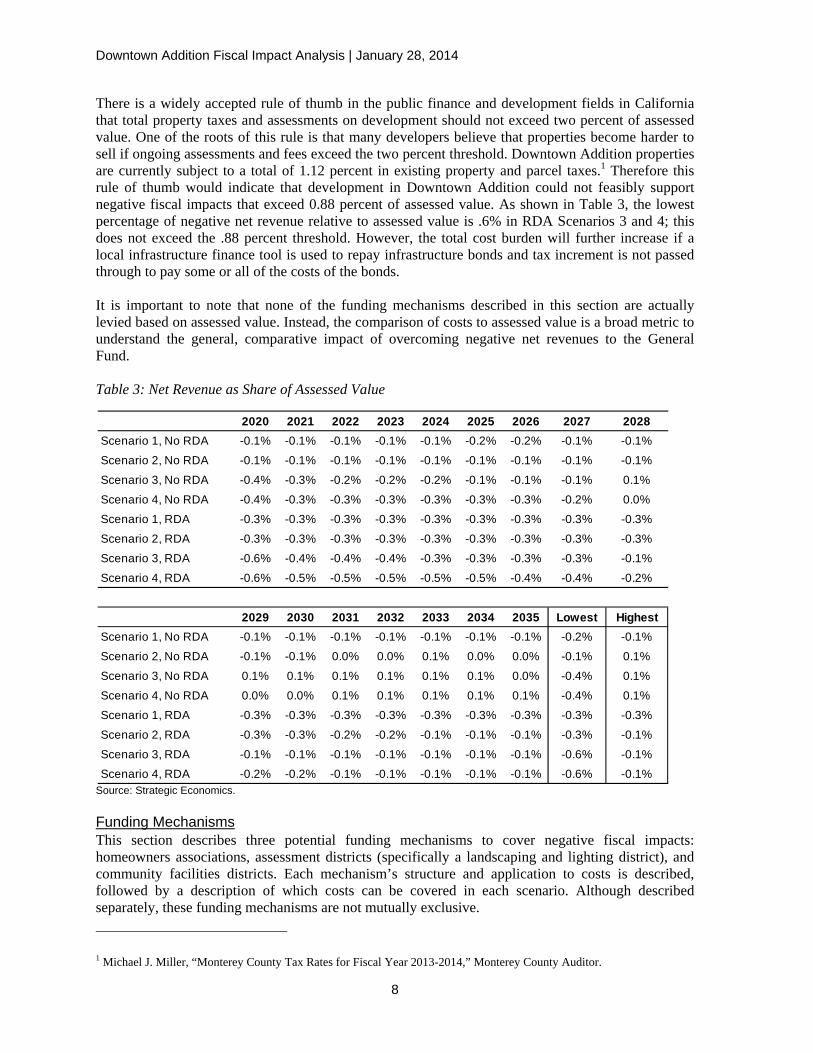
Downtown Addition Fiscal Impact Analysis | January 28, 2014
8
There is a widely accepted rule of thumb in the public finance and development fields in California that total property taxes and assessments on development should not exceed two percent of assessed value. One of the roots of this rule is that many developers believe that properties become harder to sell if ongoing assessments and fees exceed the two percent threshold. Downtown Addition properties are currently subject to a total of 1.12 percent in existing property and parcel taxes.1 Therefore this rule of thumb would indicate that development in Downtown Addition could not feasibly support negative fiscal impacts that exceed 0.88 percent of assessed value. As shown in Table 3, the lowest percentage of negative net revenue relative to assessed value is .6% in RDA Scenarios 3 and 4; this does not exceed the .88 percent threshold. However, the total cost burden will further increase if a local infrastructure finance tool is used to repay infrastructure bonds and tax increment is not passed through to pay some or all of the costs of the bonds.
It is important to note that none of the funding mechanisms described in this section are actually levied based on assessed value. Instead, the comparison of costs to assessed value is a broad metric to understand the general, comparative impact of overcoming negative net revenues to the General Fund.
Table 3: Net Revenue as Share of Assessed Value
Source: Strategic Economics.
Funding Mechanisms This section describes three potential funding mechanisms to cover negative fiscal impacts: homeowners associations, assessment districts (specifically a landscaping and lighting district), and community facilities districts. Each mechanism’s structure and application to costs is described, followed by a description of which costs can be covered in each scenario. Although described separately, these funding mechanisms are not mutually exclusive.
1 Michael J. Miller, “Monterey County Tax Rates for Fiscal Year 2013-2014,” Monterey County Auditor.
2020 2021 2022 2023 2024 2025 2026 2027 2028Scenario 1, No RDA -0.1% -0.1% -0.1% -0.1% -0.1% -0.2% -0.2% -0.1% -0.1%Scenario 2, No RDA -0.1% -0.1% -0.1% -0.1% -0.1% -0.1% -0.1% -0.1% -0.1%
Scenario 3, No RDA -0.4% -0.3% -0.2% -0.2% -0.2% -0.1% -0.1% -0.1% 0.1%
Scenario 4, No RDA -0.4% -0.3% -0.3% -0.3% -0.3% -0.3% -0.3% -0.2% 0.0%Scenario 1, RDA -0.3% -0.3% -0.3% -0.3% -0.3% -0.3% -0.3% -0.3% -0.3%
Scenario 2, RDA -0.3% -0.3% -0.3% -0.3% -0.3% -0.3% -0.3% -0.3% -0.3%Scenario 3, RDA -0.6% -0.4% -0.4% -0.4% -0.3% -0.3% -0.3% -0.3% -0.1%
Scenario 4, RDA -0.6% -0.5% -0.5% -0.5% -0.5% -0.5% -0.4% -0.4% -0.2%
2029 2030 2031 2032 2033 2034 2035 Lowest HighestScenario 1, No RDA -0.1% -0.1% -0.1% -0.1% -0.1% -0.1% -0.1% -0.2% -0.1%Scenario 2, No RDA -0.1% -0.1% 0.0% 0.0% 0.1% 0.0% 0.0% -0.1% 0.1%
Scenario 3, No RDA 0.1% 0.1% 0.1% 0.1% 0.1% 0.1% 0.0% -0.4% 0.1%
Scenario 4, No RDA 0.0% 0.0% 0.1% 0.1% 0.1% 0.1% 0.1% -0.4% 0.1%Scenario 1, RDA -0.3% -0.3% -0.3% -0.3% -0.3% -0.3% -0.3% -0.3% -0.3%
Scenario 2, RDA -0.3% -0.3% -0.2% -0.2% -0.1% -0.1% -0.1% -0.3% -0.1%
Scenario 3, RDA -0.1% -0.1% -0.1% -0.1% -0.1% -0.1% -0.1% -0.6% -0.1%Scenario 4, RDA -0.2% -0.2% -0.1% -0.1% -0.1% -0.1% -0.1% -0.6% -0.1%
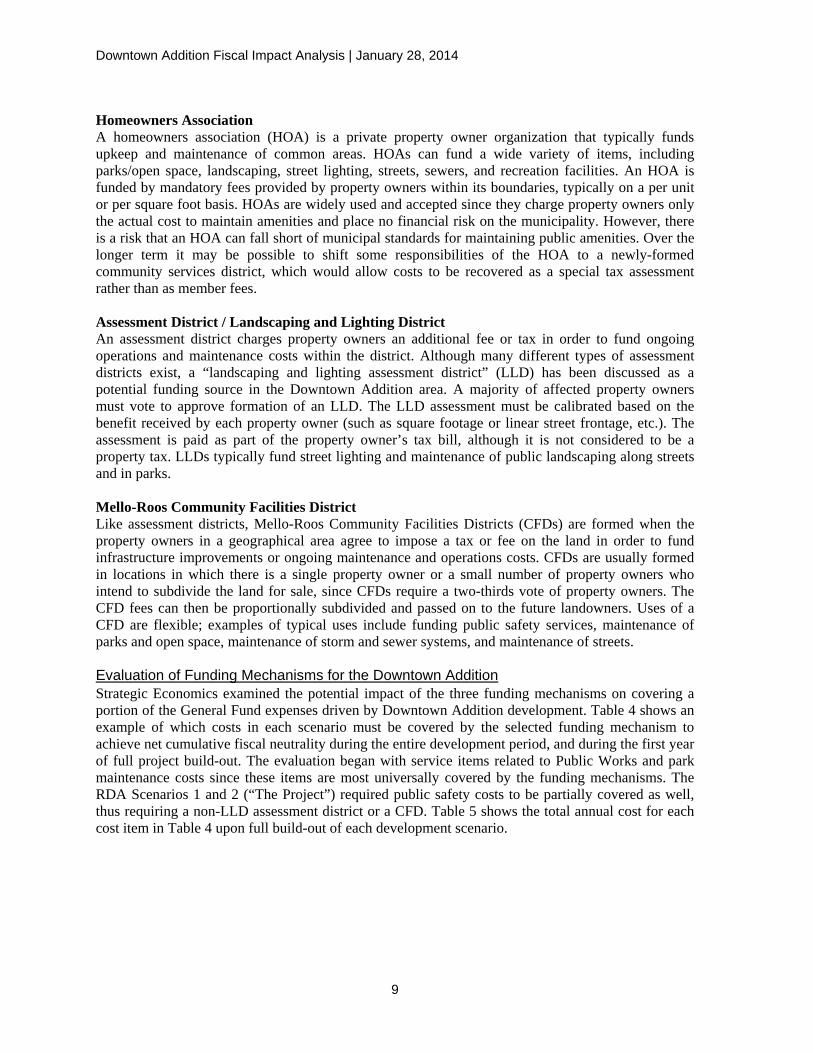
Downtown Addition Fiscal Impact Analysis | January 28, 2014
9
Homeowners Association A homeowners association (HOA) is a private property owner organization that typically funds upkeep and maintenance of common areas. HOAs can fund a wide variety of items, including parks/open space, landscaping, street lighting, streets, sewers, and recreation facilities. An HOA is funded by mandatory fees provided by property owners within its boundaries, typically on a per unit or per square foot basis. HOAs are widely used and accepted since they charge property owners only the actual cost to maintain amenities and place no financial risk on the municipality. However, there is a risk that an HOA can fall short of municipal standards for maintaining public amenities. Over the longer term it may be possible to shift some responsibilities of the HOA to a newly-formed community services district, which would allow costs to be recovered as a special tax assessment rather than as member fees.
Assessment District / Landscaping and Lighting District An assessment district charges property owners an additional fee or tax in order to fund ongoing operations and maintenance costs within the district. Although many different types of assessment districts exist, a “landscaping and lighting assessment district” (LLD) has been discussed as a potential funding source in the Downtown Addition area. A majority of affected property owners must vote to approve formation of an LLD. The LLD assessment must be calibrated based on the benefit received by each property owner (such as square footage or linear street frontage, etc.). The assessment is paid as part of the property owner’s tax bill, although it is not considered to be a property tax. LLDs typically fund street lighting and maintenance of public landscaping along streets and in parks.
Mello-Roos Community Facilities District Like assessment districts, Mello-Roos Community Facilities Districts (CFDs) are formed when the property owners in a geographical area agree to impose a tax or fee on the land in order to fund infrastructure improvements or ongoing maintenance and operations costs. CFDs are usually formed in locations in which there is a single property owner or a small number of property owners who intend to subdivide the land for sale, since CFDs require a two-thirds vote of property owners. The CFD fees can then be proportionally subdivided and passed on to the future landowners. Uses of a CFD are flexible; examples of typical uses include funding public safety services, maintenance of parks and open space, maintenance of storm and sewer systems, and maintenance of streets.
Evaluation of Funding Mechanisms for the Downtown Addition Strategic Economics examined the potential impact of the three funding mechanisms on covering a portion of the General Fund expenses driven by Downtown Addition development. Table 4 shows an example of which costs in each scenario must be covered by the selected funding mechanism to achieve net cumulative fiscal neutrality during the entire development period, and during the first year of full project build-out. The evaluation began with service items related to Public Works and park maintenance costs since these items are most universally covered by the funding mechanisms. The RDA Scenarios 1 and 2 (“The Project”) required public safety costs to be partially covered as well, thus requiring a non-LLD assessment district or a CFD. Table 5 shows the total annual cost for each cost item in Table 4 upon full build-out of each development scenario.
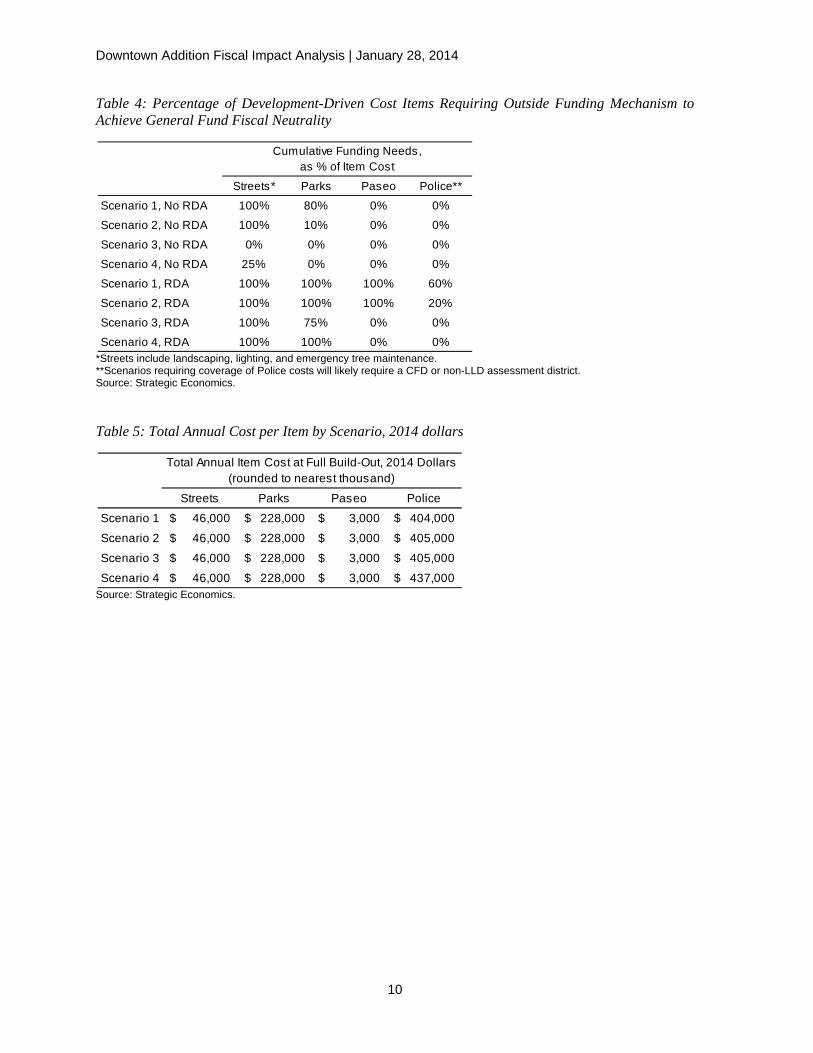
Downtown Addition Fiscal Impact Analysis | January 28, 2014
10
Table 4: Percentage of Development-Driven Cost Items Requiring Outside Funding Mechanism to Achieve General Fund Fiscal Neutrality
*Streets include landscaping, lighting, and emergency tree maintenance.**Scenarios requiring coverage of Police costs will likely require a CFD or non-LLD assessment district. Source: Strategic Economics.
Table 5: Total Annual Cost per Item by Scenario, 2014 dollars
Source: Strategic Economics.
Streets* Parks Paseo Police**
Scenario 1, No RDA 100% 80% 0% 0%
Scenario 2, No RDA 100% 10% 0% 0%
Scenario 3, No RDA 0% 0% 0% 0%
Scenario 4, No RDA 25% 0% 0% 0%
Scenario 1, RDA 100% 100% 100% 60%
Scenario 2, RDA 100% 100% 100% 20%
Scenario 3, RDA 100% 75% 0% 0%
Scenario 4, RDA 100% 100% 0% 0%
Cumulative Funding Needs, as % of Item Cost
Streets Parks Paseo Police
Scenario 1 46,000$ 228,000$ 3,000$ 404,000$
Scenario 2 46,000$ 228,000$ 3,000$ 405,000$
Scenario 3 46,000$ 228,000$ 3,000$ 405,000$
Scenario 4 46,000$ 228,000$ 3,000$ 437,000$
Total Annual Item Cost at Full Build-Out, 2014 Dollars (rounded to nearest thousand)
Downtown Addition Fiscal Impact Analysis | January 28, 2014
11
ASSUMPTIONS AND METHODOLOGY This section details the assumptions and methodology underlying the analysis. The section is divided into five parts:
Base assumptions
Key land use assumptions
Change over time assumptions (phasing/absorption, inflation, appreciation, etc.)
Revenue assumptions
Expenditure assumptions
Base Assumptions
General Fund impact: This analysis estimates potential impacts to the city’s General Fund. Impacts on non-General Fund revenues and expenditures (such as the City’s Sewer Operations Fund, Streets & Transportation Fund, school district, and other enterprise funds, special revenue funds, and independent districts) were not evaluated.
Dynamic analysis of fiscal impacts over time: The analysis is “dynamic,” as opposed to “static.” It analyzes the year-by-year fiscal impacts of the Downtown Addition construction period, rather than a single analysis of fiscal impact upon full build-out.
Ongoing operations, maintenance, and service costs: The analysis evaluates the costs associated with providing ongoing City services such as police, fire, and operations and maintenance of infrastructure under the development scenarios. The analysis does not assess the costs of capital improvements (i.e., new infrastructure and facilities) required to support development. The analysis is based on maintaining existing service levels and therefore does not incorporate a contingency; the City attempts to maintain a 10 percent General Fund contingency, but has been unable to do so in recent years.
2014 dollars: All results are reported in 2014 dollars.
Existing service population: To calculate certain costs and revenues on a per capita basis, an existing service population – or “daytime population” of residents and workers – must be established. The California Department of Finance estimates that King City had a residential population of 13,073 as of January 1, 2013. The U.S. Census Bureau’s Longitudinal Employer-Household Dynamics program estimated that 4,395 workers were employed in the City in 2011, the most recent year for which data were available.
Employee factor: Each worker is counted as producing 0.30 of the impacts of a resident for analytical purposes, since workers spend approximately a third of the time of a resident in the city, and are assumed to require fewer services in general (library, parks, etc.). This falls within industry-standard practices of counting employees as 0.25 to 0.5 of a resident for service needs. Table 6 shows the existing service population, which totals 14,392.
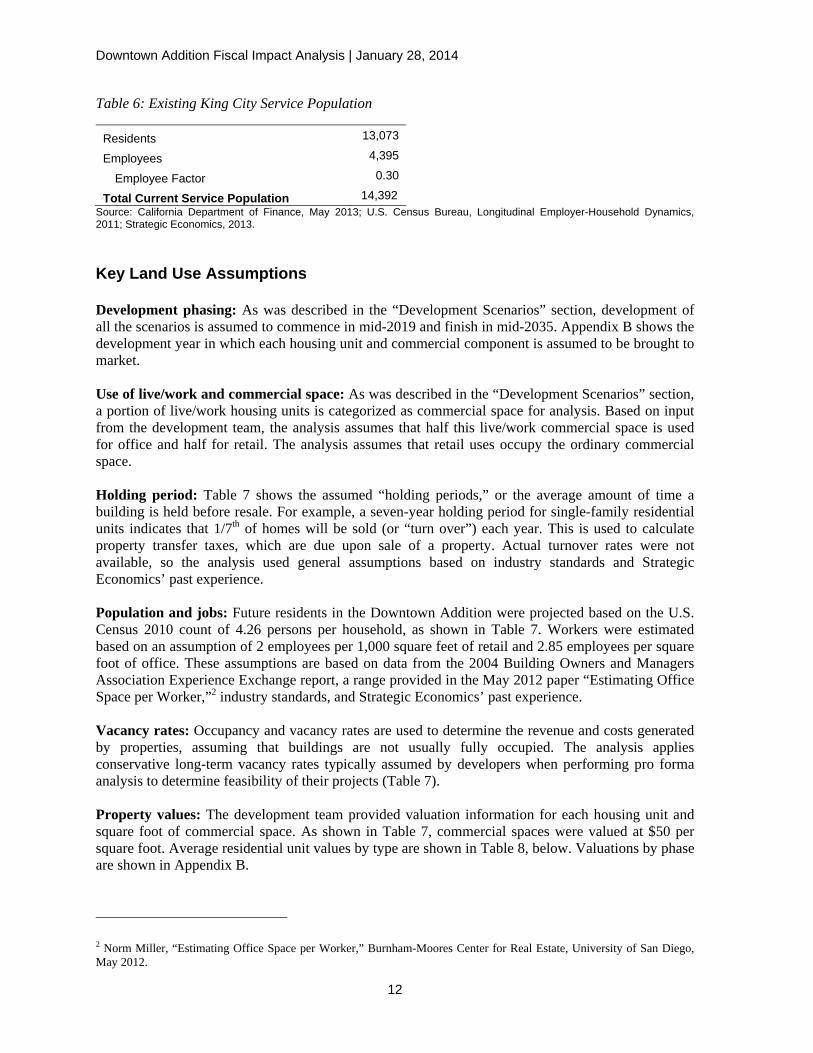
Downtown Addition Fiscal Impact Analysis | January 28, 2014
12
Table 6: Existing King City Service Population
Residents 13,073
Employees 4,395
Employee Factor 0.30
Total Current Service Population 14,392 Source: California Department of Finance, May 2013; U.S. Census Bureau, Longitudinal Employer-Household Dynamics, 2011; Strategic Economics, 2013.
Key Land Use Assumptions
Development phasing: As was described in the “Development Scenarios” section, development of all the scenarios is assumed to commence in mid-2019 and finish in mid-2035. Appendix B shows the development year in which each housing unit and commercial component is assumed to be brought to market.
Use of live/work and commercial space: As was described in the “Development Scenarios” section, a portion of live/work housing units is categorized as commercial space for analysis. Based on input from the development team, the analysis assumes that half this live/work commercial space is used for office and half for retail. The analysis assumes that retail uses occupy the ordinary commercial space.
Holding period: Table 7 shows the assumed “holding periods,” or the average amount of time a building is held before resale. For example, a seven-year holding period for single-family residential units indicates that 1/7th of homes will be sold (or “turn over”) each year. This is used to calculate property transfer taxes, which are due upon sale of a property. Actual turnover rates were not available, so the analysis used general assumptions based on industry standards and Strategic Economics’ past experience.
Population and jobs: Future residents in the Downtown Addition were projected based on the U.S. Census 2010 count of 4.26 persons per household, as shown in Table 7. Workers were estimated based on an assumption of 2 employees per 1,000 square feet of retail and 2.85 employees per square foot of office. These assumptions are based on data from the 2004 Building Owners and Managers Association Experience Exchange report, a range provided in the May 2012 paper “Estimating Office Space per Worker,”2 industry standards, and Strategic Economics’ past experience.
Vacancy rates: Occupancy and vacancy rates are used to determine the revenue and costs generated by properties, assuming that buildings are not usually fully occupied. The analysis applies conservative long-term vacancy rates typically assumed by developers when performing pro forma analysis to determine feasibility of their projects (Table 7).
Property values: The development team provided valuation information for each housing unit and square foot of commercial space. As shown in Table 7, commercial spaces were valued at $50 per square foot. Average residential unit values by type are shown in Table 8, below. Valuations by phase are shown in Appendix B.
2 Norm Miller, “Estimating Office Space per Worker,” Burnham-Moores Center for Real Estate, University of San Diego, May 2012.
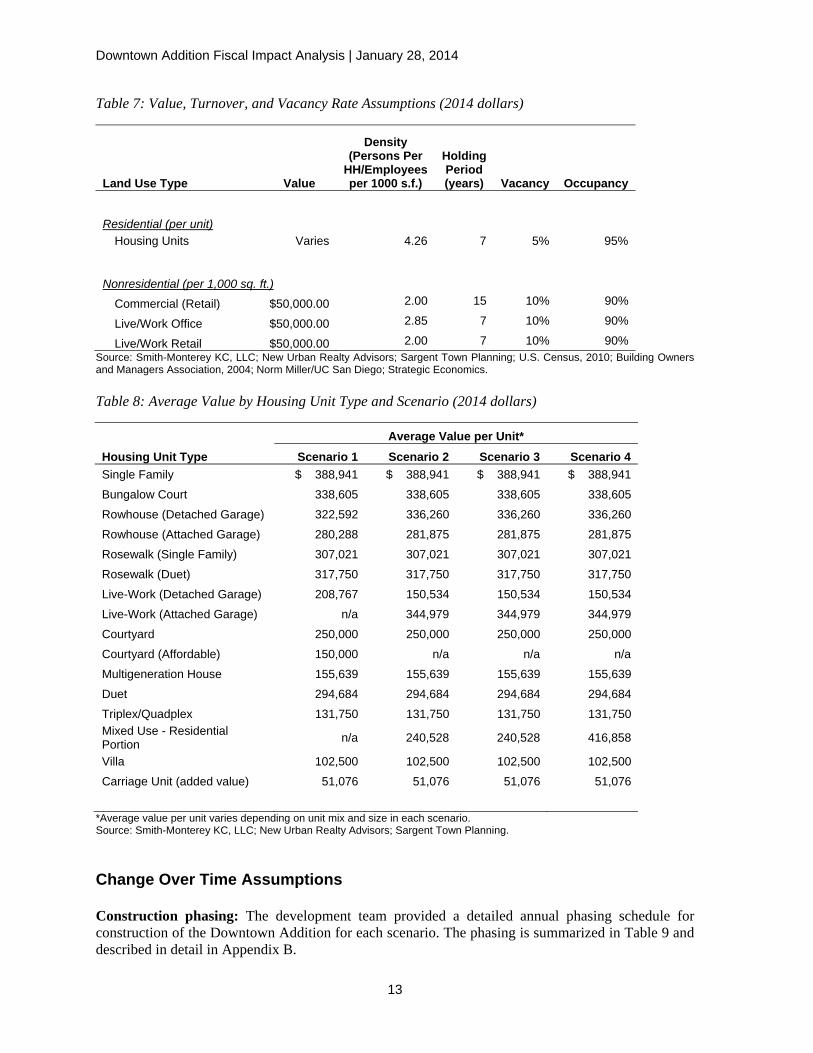
Downtown Addition Fiscal Impact Analysis | January 28, 2014
13
Table 7: Value, Turnover, and Vacancy Rate Assumptions (2014 dollars)
Land Use Type Value
Density (Persons Per
HH/Employees per 1000 s.f.)
Holding Period (years) Vacancy Occupancy
Residential (per unit)
Housing Units Varies 4.26 7 5% 95%
Nonresidential (per 1,000 sq. ft.)
Commercial (Retail) $50,000.00 2.00 15 10% 90%
Live/Work Office $50,000.00 2.85 7 10% 90%
Live/Work Retail $50,000.00 2.00 7 10% 90% Source: Smith-Monterey KC, LLC; New Urban Realty Advisors; Sargent Town Planning; U.S. Census, 2010; Building Owners and Managers Association, 2004; Norm Miller/UC San Diego; Strategic Economics.
Table 8: Average Value by Housing Unit Type and Scenario (2014 dollars)
Average Value per Unit* Housing Unit Type Scenario 1 Scenario 2 Scenario 3 Scenario 4 Single Family $ 388,941 $ 388,941 $ 388,941 $ 388,941
Bungalow Court 338,605 338,605 338,605 338,605
Rowhouse (Detached Garage) 322,592 336,260 336,260 336,260
Rowhouse (Attached Garage) 280,288 281,875 281,875 281,875
Rosewalk (Single Family) 307,021 307,021 307,021 307,021
Rosewalk (Duet) 317,750 317,750 317,750 317,750
Live-Work (Detached Garage) 208,767 150,534 150,534 150,534
Live-Work (Attached Garage) n/a 344,979 344,979 344,979
Courtyard 250,000 250,000 250,000 250,000
Courtyard (Affordable) 150,000 n/a n/a n/a
Multigeneration House 155,639 155,639 155,639 155,639
Duet 294,684 294,684 294,684 294,684
Triplex/Quadplex 131,750 131,750 131,750 131,750 Mixed Use - Residential Portion n/a 240,528 240,528 416,858
Villa 102,500 102,500 102,500 102,500
Carriage Unit (added value) 51,076 51,076 51,076 51,076
*Average value per unit varies depending on unit mix and size in each scenario.Source: Smith-Monterey KC, LLC; New Urban Realty Advisors; Sargent Town Planning.
Change Over Time Assumptions
Construction phasing: The development team provided a detailed annual phasing schedule for construction of the Downtown Addition for each scenario. The phasing is summarized in Table 9 and described in detail in Appendix B.
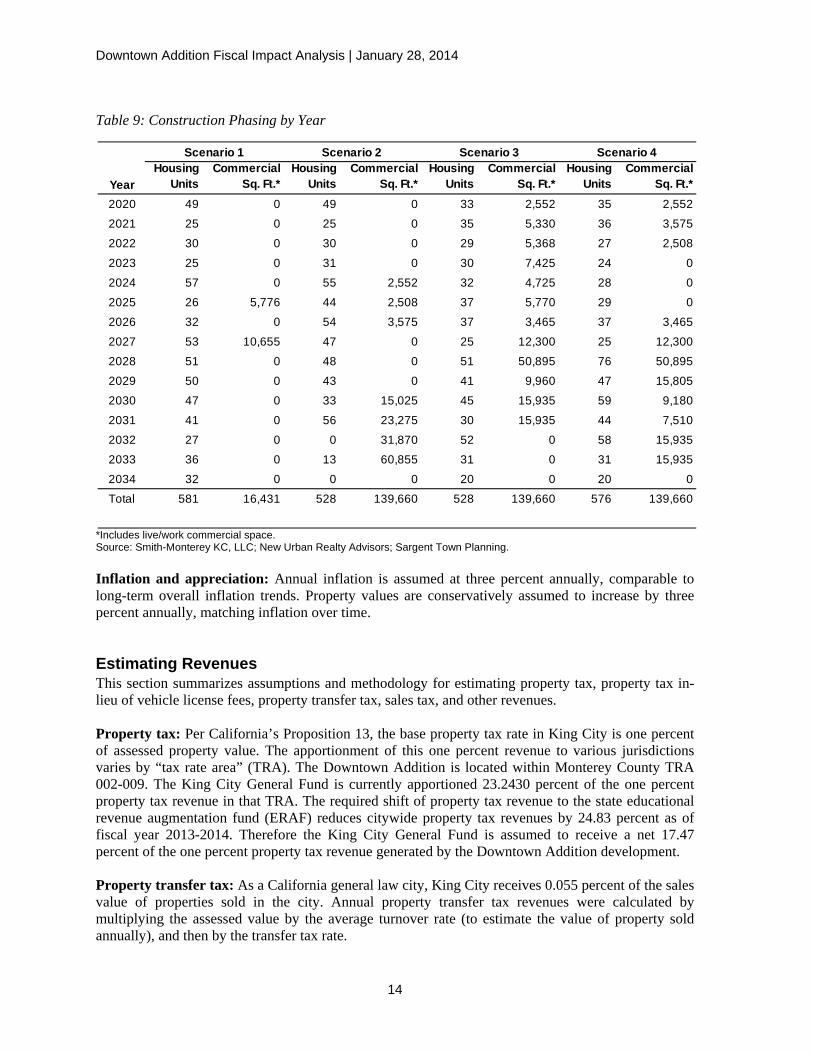
Downtown Addition Fiscal Impact Analysis | January 28, 2014
14
Table 9: Construction Phasing by Year
*Includes live/work commercial space.Source: Smith-Monterey KC, LLC; New Urban Realty Advisors; Sargent Town Planning.
Inflation and appreciation: Annual inflation is assumed at three percent annually, comparable to long-term overall inflation trends. Property values are conservatively assumed to increase by three percent annually, matching inflation over time.
Estimating Revenues This section summarizes assumptions and methodology for estimating property tax, property tax in-lieu of vehicle license fees, property transfer tax, sales tax, and other revenues.
Property tax: Per California’s Proposition 13, the base property tax rate in King City is one percent of assessed property value. The apportionment of this one percent revenue to various jurisdictions varies by “tax rate area” (TRA). The Downtown Addition is located within Monterey County TRA 002-009. The King City General Fund is currently apportioned 23.2430 percent of the one percent property tax revenue in that TRA. The required shift of property tax revenue to the state educational revenue augmentation fund (ERAF) reduces citywide property tax revenues by 24.83 percent as of fiscal year 2013-2014. Therefore the King City General Fund is assumed to receive a net 17.47 percent of the one percent property tax revenue generated by the Downtown Addition development.
Property transfer tax: As a California general law city, King City receives 0.055 percent of the sales value of properties sold in the city. Annual property transfer tax revenues were calculated by multiplying the assessed value by the average turnover rate (to estimate the value of property sold annually), and then by the transfer tax rate.
YearHousing
UnitsCommercial
Sq. Ft.*Housing
UnitsCommercial
Sq. Ft.*Housing
UnitsCommercial
Sq. Ft.*Housing
UnitsCommercial
Sq. Ft.*2020 49 0 49 0 33 2,552 35 2,552
2021 25 0 25 0 35 5,330 36 3,575
2022 30 0 30 0 29 5,368 27 2,508
2023 25 0 31 0 30 7,425 24 0
2024 57 0 55 2,552 32 4,725 28 0
2025 26 5,776 44 2,508 37 5,770 29 0
2026 32 0 54 3,575 37 3,465 37 3,465
2027 53 10,655 47 0 25 12,300 25 12,300
2028 51 0 48 0 51 50,895 76 50,895
2029 50 0 43 0 41 9,960 47 15,805
2030 47 0 33 15,025 45 15,935 59 9,180
2031 41 0 56 23,275 30 15,935 44 7,510
2032 27 0 0 31,870 52 0 58 15,935
2033 36 0 13 60,855 31 0 31 15,935
2034 32 0 0 0 20 0 20 0
Total 581 16,431 528 139,660 528 139,660 576 139,660
Scenario 1 Scenario 2 Scenario 3 Scenario 4
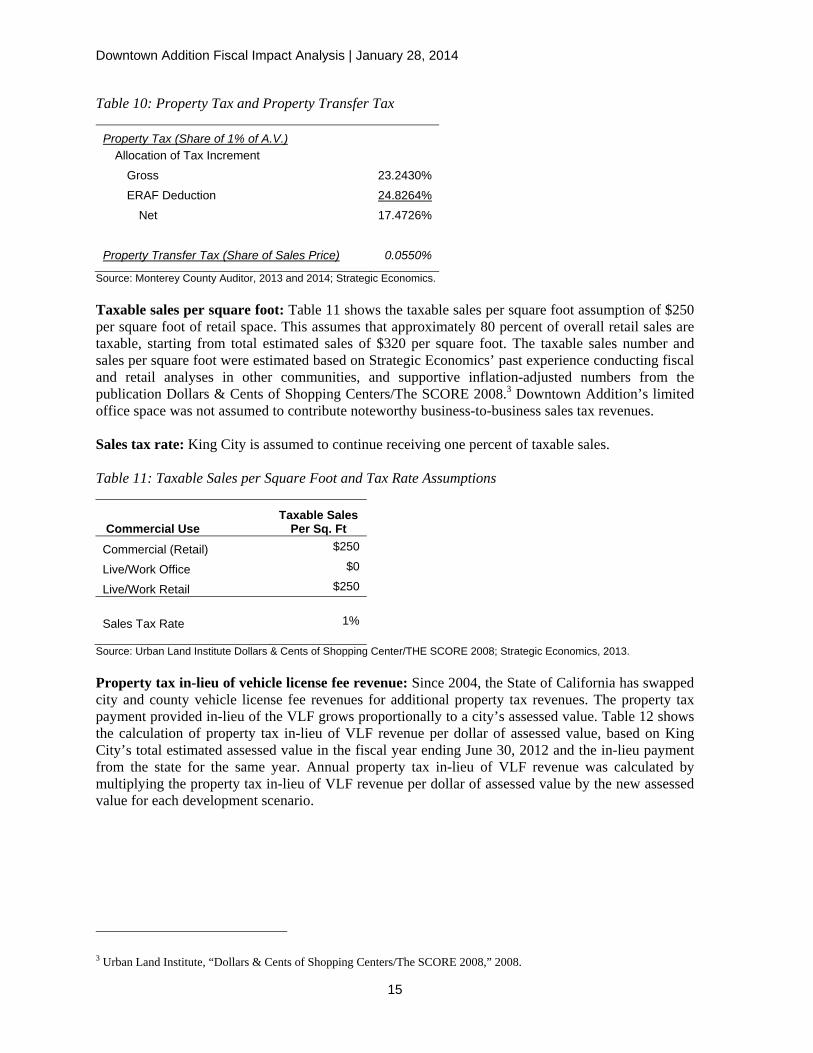
Downtown Addition Fiscal Impact Analysis | January 28, 2014
15
Table 10: Property Tax and Property Transfer Tax
Property Tax (Share of 1% of A.V.)
Allocation of Tax Increment
Gross 23.2430%
ERAF Deduction 24.8264%
Net 17.4726%
Property Transfer Tax (Share of Sales Price) 0.0550%
Source: Monterey County Auditor, 2013 and 2014; Strategic Economics.
Taxable sales per square foot: Table 11 shows the taxable sales per square foot assumption of $250 per square foot of retail space. This assumes that approximately 80 percent of overall retail sales are taxable, starting from total estimated sales of $320 per square foot. The taxable sales number and sales per square foot were estimated based on Strategic Economics’ past experience conducting fiscal and retail analyses in other communities, and supportive inflation-adjusted numbers from the publication Dollars & Cents of Shopping Centers/The SCORE 2008.3 Downtown Addition’s limited office space was not assumed to contribute noteworthy business-to-business sales tax revenues.
Sales tax rate: King City is assumed to continue receiving one percent of taxable sales.
Table 11: Taxable Sales per Square Foot and Tax Rate Assumptions
Commercial Use Taxable Sales
Per Sq. Ft Commercial (Retail) $250
Live/Work Office $0
Live/Work Retail $250
Sales Tax Rate 1%
Source: Urban Land Institute Dollars & Cents of Shopping Center/THE SCORE 2008; Strategic Economics, 2013.
Property tax in-lieu of vehicle license fee revenue: Since 2004, the State of California has swapped city and county vehicle license fee revenues for additional property tax revenues. The property tax payment provided in-lieu of the VLF grows proportionally to a city’s assessed value. Table 12 shows the calculation of property tax in-lieu of VLF revenue per dollar of assessed value, based on King City’s total estimated assessed value in the fiscal year ending June 30, 2012 and the in-lieu payment from the state for the same year. Annual property tax in-lieu of VLF revenue was calculated by multiplying the property tax in-lieu of VLF revenue per dollar of assessed value by the new assessed value for each development scenario.
3 Urban Land Institute, “Dollars & Cents of Shopping Centers/The SCORE 2008,” 2008.
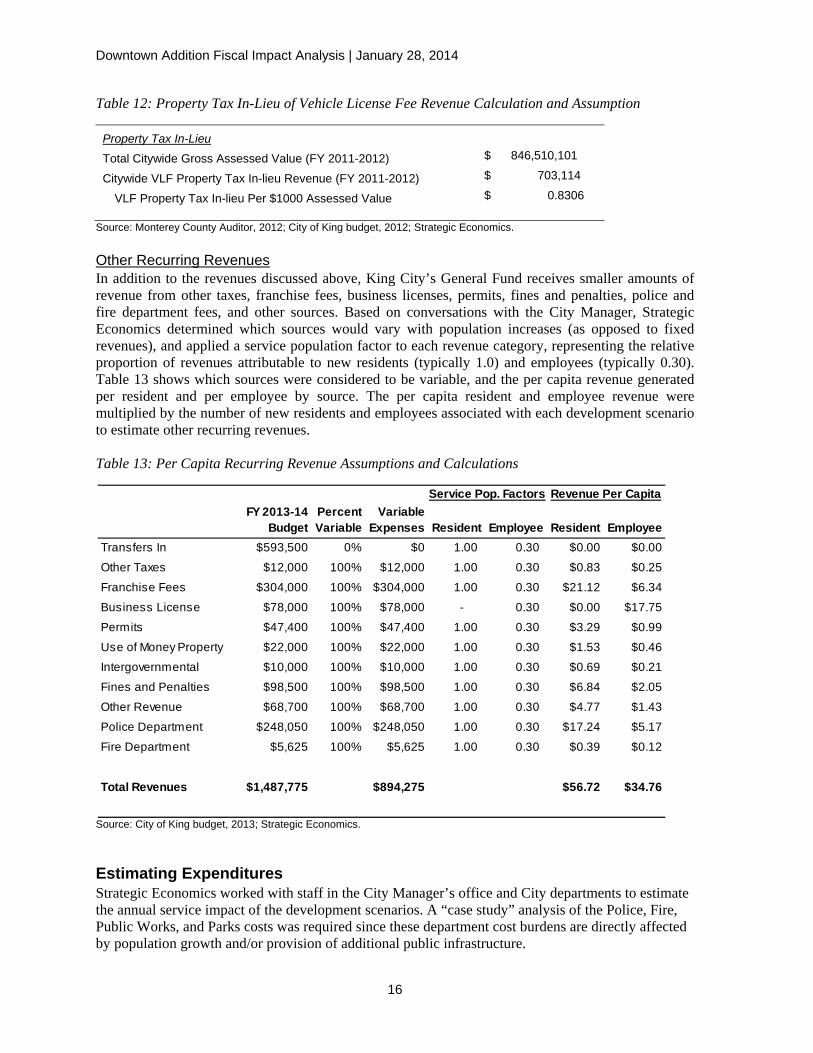
Downtown Addition Fiscal Impact Analysis | January 28, 2014
16
Table 12: Property Tax In-Lieu of Vehicle License Fee Revenue Calculation and Assumption
Property Tax In-Lieu
Total Citywide Gross Assessed Value (FY 2011-2012) $ 846,510,101
Citywide VLF Property Tax In-lieu Revenue (FY 2011-2012) $ 703,114
VLF Property Tax In-lieu Per $1000 Assessed Value $ 0.8306
Source: Monterey County Auditor, 2012; City of King budget, 2012; Strategic Economics.
Other Recurring Revenues In addition to the revenues discussed above, King City’s General Fund receives smaller amounts of revenue from other taxes, franchise fees, business licenses, permits, fines and penalties, police and fire department fees, and other sources. Based on conversations with the City Manager, Strategic Economics determined which sources would vary with population increases (as opposed to fixed revenues), and applied a service population factor to each revenue category, representing the relative proportion of revenues attributable to new residents (typically 1.0) and employees (typically 0.30). Table 13 shows which sources were considered to be variable, and the per capita revenue generated per resident and per employee by source. The per capita resident and employee revenue were multiplied by the number of new residents and employees associated with each development scenario to estimate other recurring revenues.
Table 13: Per Capita Recurring Revenue Assumptions and Calculations
Source: City of King budget, 2013; Strategic Economics.
Estimating Expenditures Strategic Economics worked with staff in the City Manager’s office and City departments to estimate the annual service impact of the development scenarios. A “case study” analysis of the Police, Fire, Public Works, and Parks costs was required since these department cost burdens are directly affected by population growth and/or provision of additional public infrastructure.
FY 2013-14 Budget
Percent Variable
Variable Expenses Resident Employee Resident Employee
Transfers In $593,500 0% $0 1.00 0.30 $0.00 $0.00
Other Taxes $12,000 100% $12,000 1.00 0.30 $0.83 $0.25
Franchise Fees $304,000 100% $304,000 1.00 0.30 $21.12 $6.34
Business License $78,000 100% $78,000 - 0.30 $0.00 $17.75
Permits $47,400 100% $47,400 1.00 0.30 $3.29 $0.99
Use of Money Property $22,000 100% $22,000 1.00 0.30 $1.53 $0.46Intergovernmental $10,000 100% $10,000 1.00 0.30 $0.69 $0.21
Fines and Penalties $98,500 100% $98,500 1.00 0.30 $6.84 $2.05
Other Revenue $68,700 100% $68,700 1.00 0.30 $4.77 $1.43
Police Department $248,050 100% $248,050 1.00 0.30 $17.24 $5.17
Fire Department $5,625 100% $5,625 1.00 0.30 $0.39 $0.12
Total Revenues $1,487,775 $894,275 $56.72 $34.76
Service Pop. Factors Revenue Per Capita
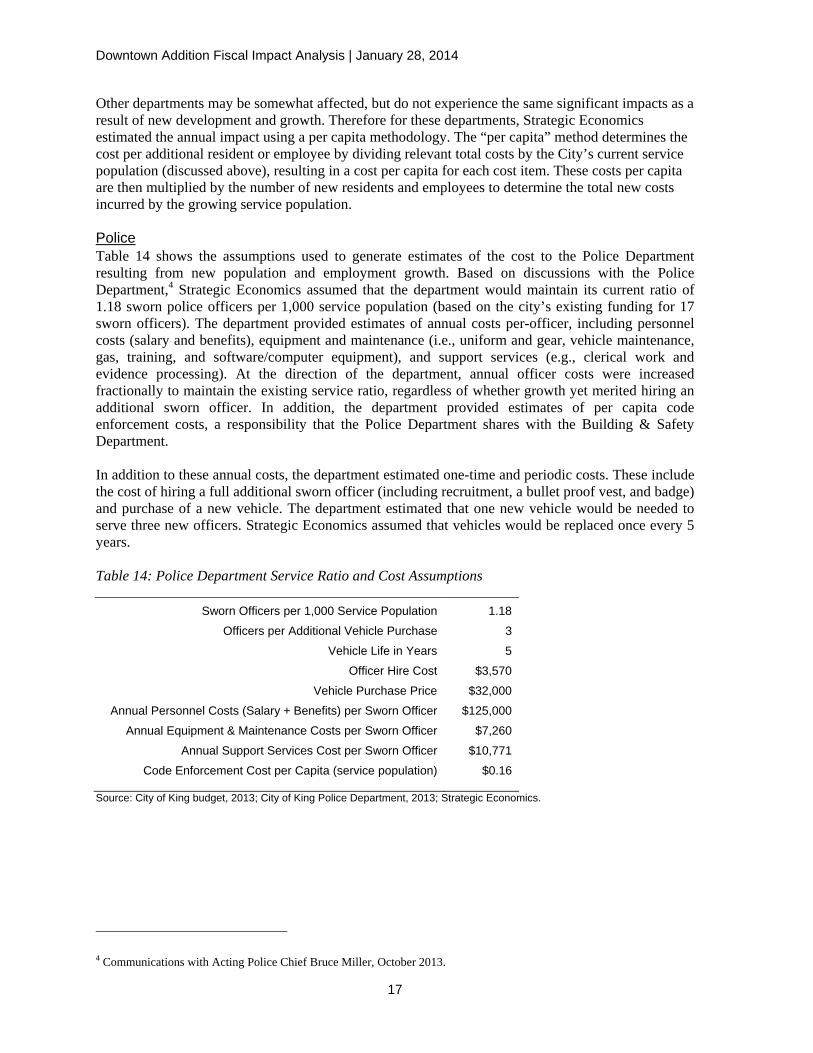
Downtown Addition Fiscal Impact Analysis | January 28, 2014
17
Other departments may be somewhat affected, but do not experience the same significant impacts as a result of new development and growth. Therefore for these departments, Strategic Economics estimated the annual impact using a per capita methodology. The “per capita” method determines the cost per additional resident or employee by dividing relevant total costs by the City’s current service population (discussed above), resulting in a cost per capita for each cost item. These costs per capita are then multiplied by the number of new residents and employees to determine the total new costs incurred by the growing service population.
Police Table 14 shows the assumptions used to generate estimates of the cost to the Police Department resulting from new population and employment growth. Based on discussions with the Police Department,4 Strategic Economics assumed that the department would maintain its current ratio of 1.18 sworn police officers per 1,000 service population (based on the city’s existing funding for 17 sworn officers). The department provided estimates of annual costs per-officer, including personnel costs (salary and benefits), equipment and maintenance (i.e., uniform and gear, vehicle maintenance, gas, training, and software/computer equipment), and support services (e.g., clerical work and evidence processing). At the direction of the department, annual officer costs were increased fractionally to maintain the existing service ratio, regardless of whether growth yet merited hiring an additional sworn officer. In addition, the department provided estimates of per capita code enforcement costs, a responsibility that the Police Department shares with the Building & Safety Department.
In addition to these annual costs, the department estimated one-time and periodic costs. These include the cost of hiring a full additional sworn officer (including recruitment, a bullet proof vest, and badge) and purchase of a new vehicle. The department estimated that one new vehicle would be needed to serve three new officers. Strategic Economics assumed that vehicles would be replaced once every 5 years.
Table 14: Police Department Service Ratio and Cost Assumptions
Sworn Officers per 1,000 Service Population 1.18
Officers per Additional Vehicle Purchase 3
Vehicle Life in Years 5
Officer Hire Cost $3,570
Vehicle Purchase Price $32,000
Annual Personnel Costs (Salary + Benefits) per Sworn Officer $125,000
Annual Equipment & Maintenance Costs per Sworn Officer $7,260
Annual Support Services Cost per Sworn Officer $10,771
Code Enforcement Cost per Capita (service population) $0.16
Source: City of King budget, 2013; City of King Police Department, 2013; Strategic Economics.
4 Communications with Acting Police Chief Bruce Miller, October 2013.
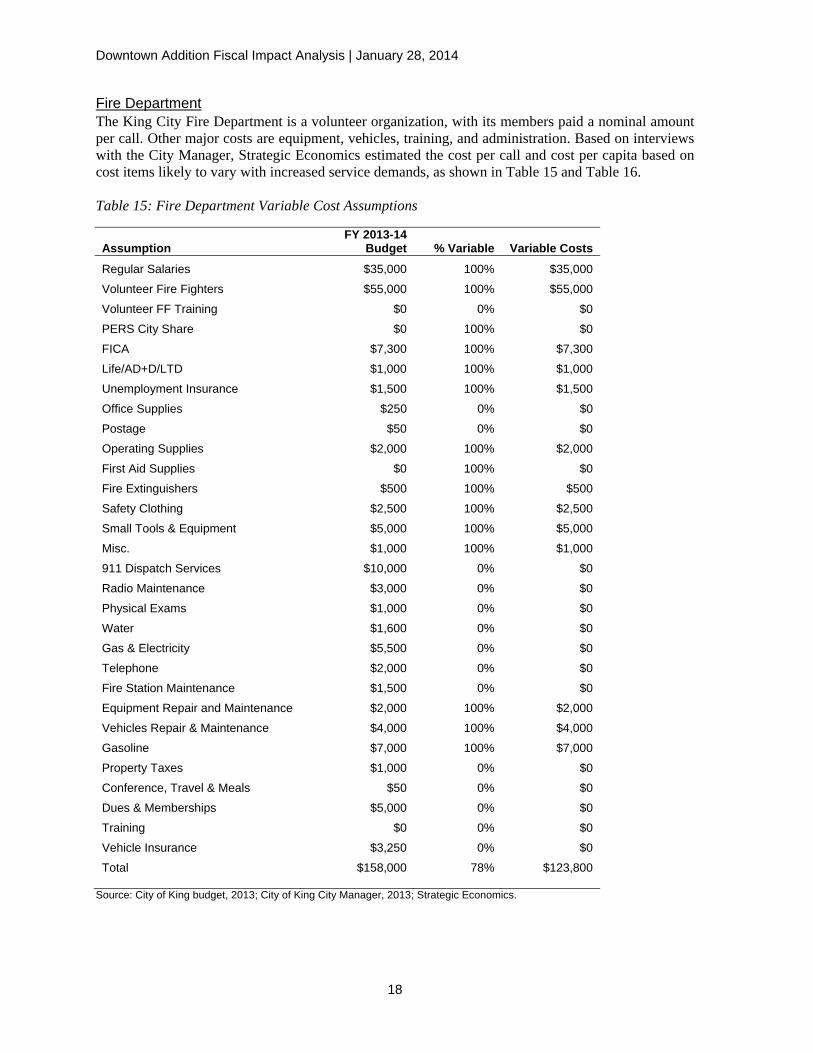
Downtown Addition Fiscal Impact Analysis | January 28, 2014
18
Fire Department The King City Fire Department is a volunteer organization, with its members paid a nominal amount per call. Other major costs are equipment, vehicles, training, and administration. Based on interviews with the City Manager, Strategic Economics estimated the cost per call and cost per capita based on cost items likely to vary with increased service demands, as shown in Table 15 and Table 16.
Table 15: Fire Department Variable Cost Assumptions
Assumption FY 2013-14
Budget % Variable Variable Costs
Regular Salaries $35,000 100% $35,000
Volunteer Fire Fighters $55,000 100% $55,000
Volunteer FF Training $0 0% $0
PERS City Share $0 100% $0
FICA $7,300 100% $7,300
Life/AD+D/LTD $1,000 100% $1,000
Unemployment Insurance $1,500 100% $1,500
Office Supplies $250 0% $0
Postage $50 0% $0
Operating Supplies $2,000 100% $2,000
First Aid Supplies $0 100% $0
Fire Extinguishers $500 100% $500
Safety Clothing $2,500 100% $2,500
Small Tools & Equipment $5,000 100% $5,000
Misc. $1,000 100% $1,000
911 Dispatch Services $10,000 0% $0
Radio Maintenance $3,000 0% $0
Physical Exams $1,000 0% $0
Water $1,600 0% $0
Gas & Electricity $5,500 0% $0
Telephone $2,000 0% $0
Fire Station Maintenance $1,500 0% $0
Equipment Repair and Maintenance $2,000 100% $2,000
Vehicles Repair & Maintenance $4,000 100% $4,000
Gasoline $7,000 100% $7,000
Property Taxes $1,000 0% $0
Conference, Travel & Meals $50 0% $0
Dues & Memberships $5,000 0% $0
Training $0 0% $0
Vehicle Insurance $3,250 0% $0
Total $158,000 78% $123,800
Source: City of King budget, 2013; City of King City Manager, 2013; Strategic Economics.
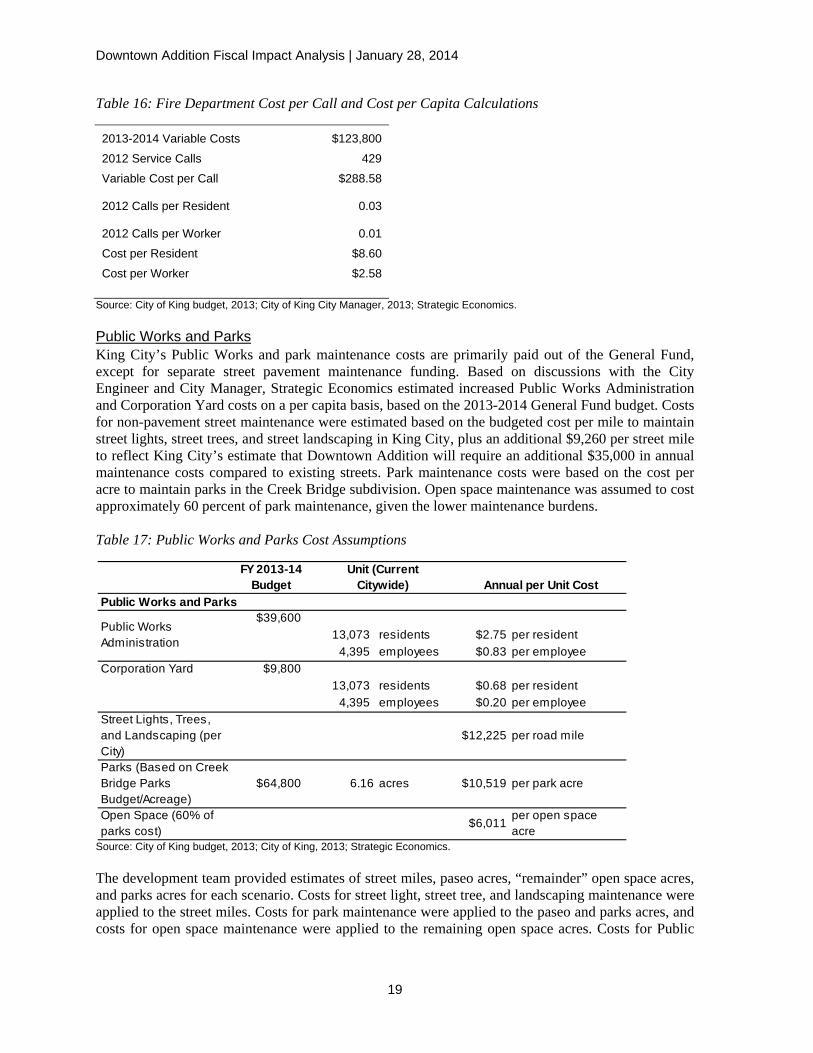
Downtown Addition Fiscal Impact Analysis | January 28, 2014
19
Table 16: Fire Department Cost per Call and Cost per Capita Calculations
2013-2014 Variable Costs $123,800
2012 Service Calls 429
Variable Cost per Call $288.58
2012 Calls per Resident
0.03
2012 Calls per Worker
0.01
Cost per Resident $8.60
Cost per Worker $2.58
Source: City of King budget, 2013; City of King City Manager, 2013; Strategic Economics. Public Works and Parks King City’s Public Works and park maintenance costs are primarily paid out of the General Fund, except for separate street pavement maintenance funding. Based on discussions with the City Engineer and City Manager, Strategic Economics estimated increased Public Works Administration and Corporation Yard costs on a per capita basis, based on the 2013-2014 General Fund budget. Costs for non-pavement street maintenance were estimated based on the budgeted cost per mile to maintain street lights, street trees, and street landscaping in King City, plus an additional $9,260 per street mile to reflect King City’s estimate that Downtown Addition will require an additional $35,000 in annual maintenance costs compared to existing streets. Park maintenance costs were based on the cost per acre to maintain parks in the Creek Bridge subdivision. Open space maintenance was assumed to cost approximately 60 percent of park maintenance, given the lower maintenance burdens. Table 17: Public Works and Parks Cost Assumptions
Source: City of King budget, 2013; City of King, 2013; Strategic Economics. The development team provided estimates of street miles, paseo acres, “remainder” open space acres, and parks acres for each scenario. Costs for street light, street tree, and landscaping maintenance were applied to the street miles. Costs for park maintenance were applied to the paseo and parks acres, and costs for open space maintenance were applied to the remaining open space acres. Costs for Public
FY 2013-14 Budget
Public Works and Parks$39,600
13,073 residents $2.75 per resident4,395 employees $0.83 per employee
Corporation Yard $9,80013,073 residents $0.68 per resident
4,395 employees $0.20 per employeeStreet Lights, Trees, and Landscaping (per City)
$12,225 per road mile
Parks (Based on Creek Bridge Parks Budget/Acreage)
$64,800 6.16 acres $10,519 per park acre
Open Space (60% of parks cost)
$6,011per open space acre
Public Works Administration
Unit (Current Citywide) Annual per Unit Cost
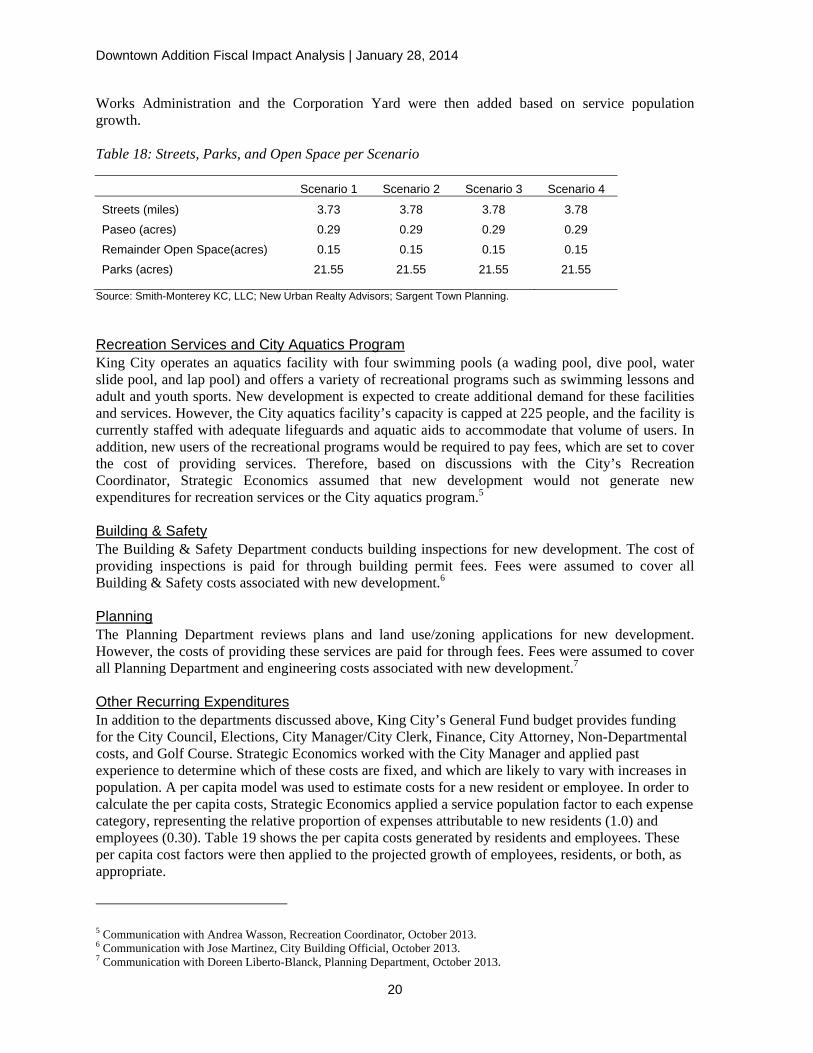
Downtown Addition Fiscal Impact Analysis | January 28, 2014
20
Works Administration and the Corporation Yard were then added based on service population growth.
Table 18: Streets, Parks, and Open Space per Scenario
Scenario 1 Scenario 2 Scenario 3 Scenario 4
Streets (miles) 3.73 3.78 3.78 3.78
Paseo (acres) 0.29 0.29 0.29 0.29
Remainder Open Space(acres) 0.15 0.15 0.15 0.15
Parks (acres) 21.55 21.55 21.55 21.55
Source: Smith-Monterey KC, LLC; New Urban Realty Advisors; Sargent Town Planning.
Recreation Services and City Aquatics Program King City operates an aquatics facility with four swimming pools (a wading pool, dive pool, water slide pool, and lap pool) and offers a variety of recreational programs such as swimming lessons and adult and youth sports. New development is expected to create additional demand for these facilities and services. However, the City aquatics facility’s capacity is capped at 225 people, and the facility is currently staffed with adequate lifeguards and aquatic aids to accommodate that volume of users. In addition, new users of the recreational programs would be required to pay fees, which are set to cover the cost of providing services. Therefore, based on discussions with the City’s Recreation Coordinator, Strategic Economics assumed that new development would not generate new expenditures for recreation services or the City aquatics program.5
Building & Safety The Building & Safety Department conducts building inspections for new development. The cost of providing inspections is paid for through building permit fees. Fees were assumed to cover all Building & Safety costs associated with new development.6
Planning The Planning Department reviews plans and land use/zoning applications for new development. However, the costs of providing these services are paid for through fees. Fees were assumed to cover all Planning Department and engineering costs associated with new development.7
Other Recurring Expenditures In addition to the departments discussed above, King City’s General Fund budget provides funding for the City Council, Elections, City Manager/City Clerk, Finance, City Attorney, Non-Departmental costs, and Golf Course. Strategic Economics worked with the City Manager and applied past experience to determine which of these costs are fixed, and which are likely to vary with increases in population. A per capita model was used to estimate costs for a new resident or employee. In order to calculate the per capita costs, Strategic Economics applied a service population factor to each expense category, representing the relative proportion of expenses attributable to new residents (1.0) and employees (0.30). Table 19 shows the per capita costs generated by residents and employees. These per capita cost factors were then applied to the projected growth of employees, residents, or both, as appropriate.
5 Communication with Andrea Wasson, Recreation Coordinator, October 2013. 6 Communication with Jose Martinez, City Building Official, October 2013. 7 Communication with Doreen Liberto-Blanck, Planning Department, October 2013.
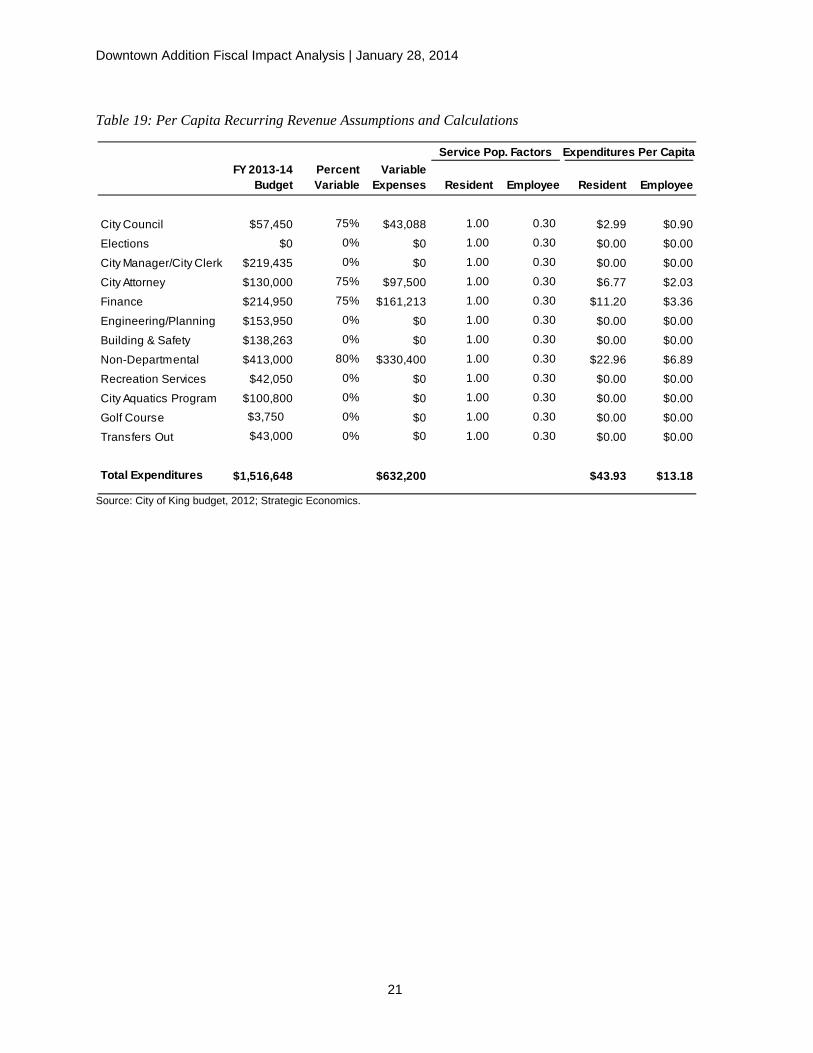
Downtown Addition Fiscal Impact Analysis | January 28, 2014
21
Table 19: Per Capita Recurring Revenue Assumptions and Calculations
Source: City of King budget, 2012; Strategic Economics.
FY 2013-14 Budget
Percent Variable
Variable Expenses Resident Employee Resident Employee
City Council $57,450 75% $43,088 1.00 0.30 $2.99 $0.90
Elections $0 0% $0 1.00 0.30 $0.00 $0.00
City Manager/City Clerk $219,435 0% $0 1.00 0.30 $0.00 $0.00
City Attorney $130,000 75% $97,500 1.00 0.30 $6.77 $2.03
Finance $214,950 75% $161,213 1.00 0.30 $11.20 $3.36
Engineering/Planning $153,950 0% $0 1.00 0.30 $0.00 $0.00
Building & Safety $138,263 0% $0 1.00 0.30 $0.00 $0.00
Non-Departmental $413,000 80% $330,400 1.00 0.30 $22.96 $6.89
Recreation Services $42,050 0% $0 1.00 0.30 $0.00 $0.00
City Aquatics Program $100,800 0% $0 1.00 0.30 $0.00 $0.00
Golf Course $3,750 0% $0 1.00 0.30 $0.00 $0.00
Transfers Out $43,000 0% $0 1.00 0.30 $0.00 $0.00
Total Expenditures $1,516,648 $632,200 $43.93 $13.18
Service Pop. Factors Expenditures Per Capita
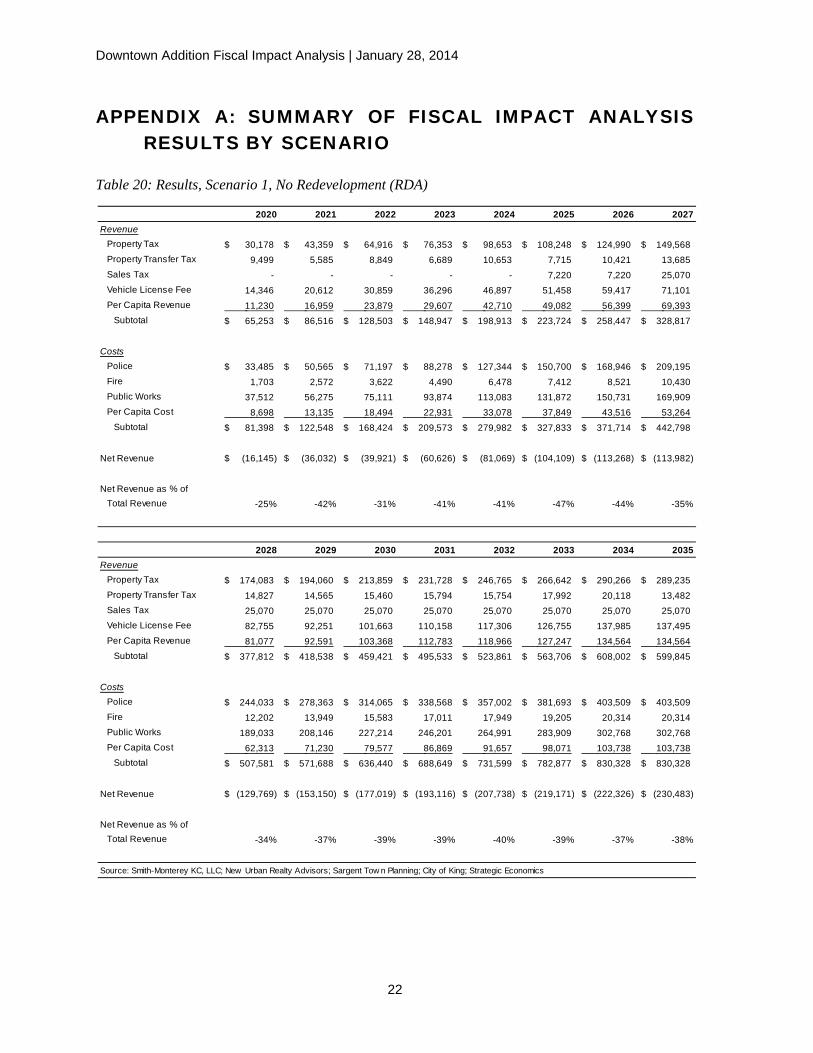
Downtown Addition Fiscal Impact Analysis | January 28, 2014
22
APPENDIX A: SUMMARY OF FISCAL IMPACT ANALYSIS RESULTS BY SCENARIO
Table 20: Results, Scenario 1, No Redevelopment (RDA)
2020 2021 2022 2023 2024 2025 2026 2027Revenue
Property Tax 30,178$ 43,359$ 64,916$ 76,353$ 98,653$ 108,248$ 124,990$ 149,568$ Property Transfer Tax 9,499 5,585 8,849 6,689 10,653 7,715 10,421 13,685 Sales Tax - - - - - 7,220 7,220 25,070 Vehicle License Fee 14,346 20,612 30,859 36,296 46,897 51,458 59,417 71,101 Per Capita Revenue 11,230 16,959 23,879 29,607 42,710 49,082 56,399 69,393
Subtotal 65,253$ 86,516$ 128,503$ 148,947$ 198,913$ 223,724$ 258,447$ 328,817$
Costs
Police 33,485$ 50,565$ 71,197$ 88,278$ 127,344$ 150,700$ 168,946$ 209,195$ Fire 1,703 2,572 3,622 4,490 6,478 7,412 8,521 10,430 Public Works 37,512 56,275 75,111 93,874 113,083 131,872 150,731 169,909 Per Capita Cost 8,698 13,135 18,494 22,931 33,078 37,849 43,516 53,264
Subtotal 81,398$ 122,548$ 168,424$ 209,573$ 279,982$ 327,833$ 371,714$ 442,798$
Net Revenue (16,145)$ (36,032)$ (39,921)$ (60,626)$ (81,069)$ (104,109)$ (113,268)$ (113,982)$
Net Revenue as % of Total Revenue -25% -42% -31% -41% -41% -47% -44% -35%
2028 2029 2030 2031 2032 2033 2034 2035Revenue
Property Tax 174,083$ 194,060$ 213,859$ 231,728$ 246,765$ 266,642$ 290,266$ 289,235$ Property Transfer Tax 14,827 14,565 15,460 15,794 15,754 17,992 20,118 13,482 Sales Tax 25,070 25,070 25,070 25,070 25,070 25,070 25,070 25,070 Vehicle License Fee 82,755 92,251 101,663 110,158 117,306 126,755 137,985 137,495 Per Capita Revenue 81,077 92,591 103,368 112,783 118,966 127,247 134,564 134,564
Subtotal 377,812$ 418,538$ 459,421$ 495,533$ 523,861$ 563,706$ 608,002$ 599,845$
Costs
Police 244,033$ 278,363$ 314,065$ 338,568$ 357,002$ 381,693$ 403,509$ 403,509$ Fire 12,202 13,949 15,583 17,011 17,949 19,205 20,314 20,314 Public Works 189,033 208,146 227,214 246,201 264,991 283,909 302,768 302,768 Per Capita Cost 62,313 71,230 79,577 86,869 91,657 98,071 103,738 103,738
Subtotal 507,581$ 571,688$ 636,440$ 688,649$ 731,599$ 782,877$ 830,328$ 830,328$
Net Revenue (129,769)$ (153,150)$ (177,019)$ (193,116)$ (207,738)$ (219,171)$ (222,326)$ (230,483)$
Net Revenue as % of Total Revenue -34% -37% -39% -39% -40% -39% -37% -38%
Source: Smith-Monterey KC, LLC; New Urban Realty Advisors; Sargent Tow n Planning; City of King; Strategic Economics
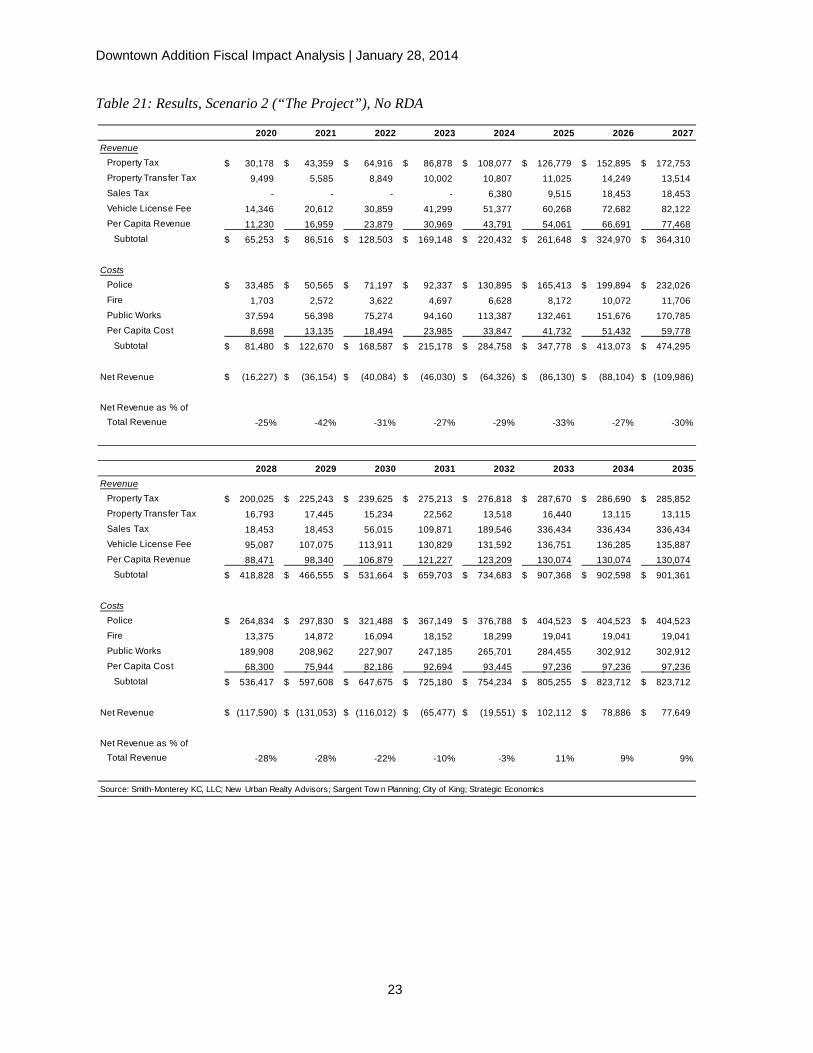
Downtown Addition Fiscal Impact Analysis | January 28, 2014
23
Table 21: Results, Scenario 2 (“The Project”), No RDA
2020 2021 2022 2023 2024 2025 2026 2027Revenue
Property Tax 30,178$ 43,359$ 64,916$ 86,878$ 108,077$ 126,779$ 152,895$ 172,753$ Property Transfer Tax 9,499 5,585 8,849 10,002 10,807 11,025 14,249 13,514 Sales Tax - - - - 6,380 9,515 18,453 18,453 Vehicle License Fee 14,346 20,612 30,859 41,299 51,377 60,268 72,682 82,122 Per Capita Revenue 11,230 16,959 23,879 30,969 43,791 54,061 66,691 77,468
Subtotal 65,253$ 86,516$ 128,503$ 169,148$ 220,432$ 261,648$ 324,970$ 364,310$
Costs
Police 33,485$ 50,565$ 71,197$ 92,337$ 130,895$ 165,413$ 199,894$ 232,026$ Fire 1,703 2,572 3,622 4,697 6,628 8,172 10,072 11,706 Public Works 37,594 56,398 75,274 94,160 113,387 132,461 151,676 170,785 Per Capita Cost 8,698 13,135 18,494 23,985 33,847 41,732 51,432 59,778
Subtotal 81,480$ 122,670$ 168,587$ 215,178$ 284,758$ 347,778$ 413,073$ 474,295$
Net Revenue (16,227)$ (36,154)$ (40,084)$ (46,030)$ (64,326)$ (86,130)$ (88,104)$ (109,986)$
Net Revenue as % of Total Revenue -25% -42% -31% -27% -29% -33% -27% -30%
2028 2029 2030 2031 2032 2033 2034 2035Revenue
Property Tax 200,025$ 225,243$ 239,625$ 275,213$ 276,818$ 287,670$ 286,690$ 285,852$ Property Transfer Tax 16,793 17,445 15,234 22,562 13,518 16,440 13,115 13,115 Sales Tax 18,453 18,453 56,015 109,871 189,546 336,434 336,434 336,434 Vehicle License Fee 95,087 107,075 113,911 130,829 131,592 136,751 136,285 135,887 Per Capita Revenue 88,471 98,340 106,879 121,227 123,209 130,074 130,074 130,074
Subtotal 418,828$ 466,555$ 531,664$ 659,703$ 734,683$ 907,368$ 902,598$ 901,361$
Costs
Police 264,834$ 297,830$ 321,488$ 367,149$ 376,788$ 404,523$ 404,523$ 404,523$ Fire 13,375 14,872 16,094 18,152 18,299 19,041 19,041 19,041 Public Works 189,908 208,962 227,907 247,185 265,701 284,455 302,912 302,912 Per Capita Cost 68,300 75,944 82,186 92,694 93,445 97,236 97,236 97,236
Subtotal 536,417$ 597,608$ 647,675$ 725,180$ 754,234$ 805,255$ 823,712$ 823,712$
Net Revenue (117,590)$ (131,053)$ (116,012)$ (65,477)$ (19,551)$ 102,112$ 78,886$ 77,649$
Net Revenue as % of Total Revenue -28% -28% -22% -10% -3% 11% 9% 9%
Source: Smith-Monterey KC, LLC; New Urban Realty Advisors; Sargent Tow n Planning; City of King; Strategic Economics
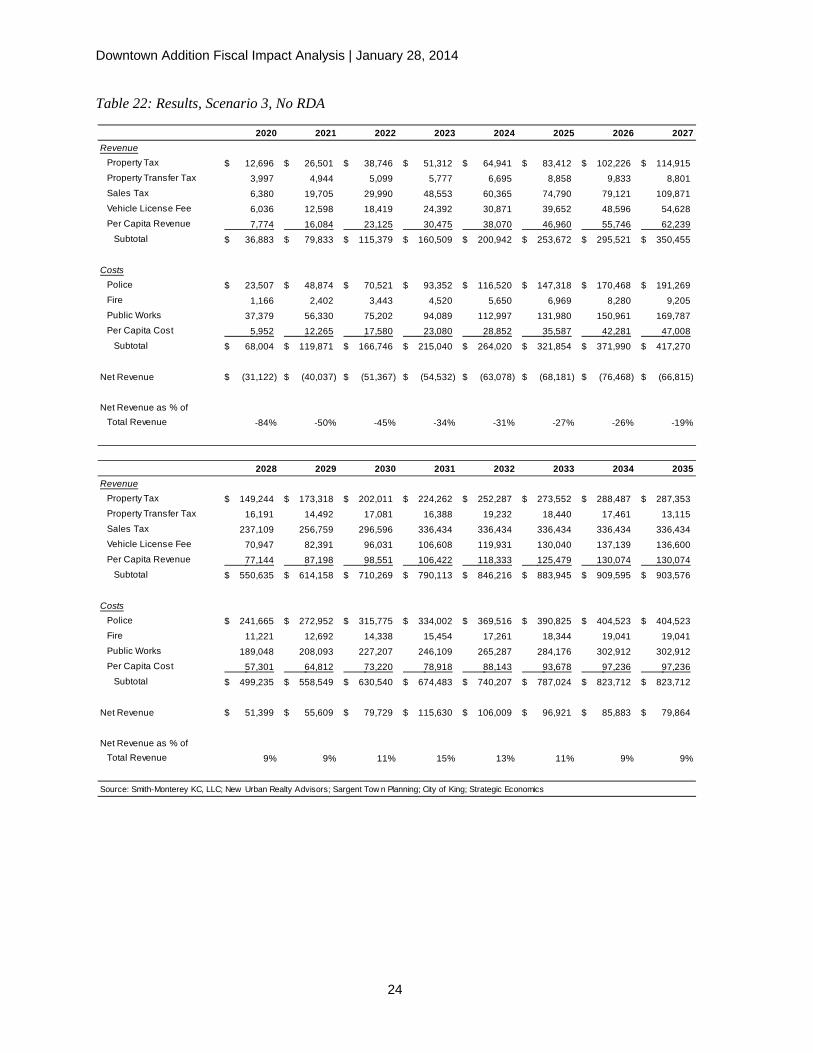
Downtown Addition Fiscal Impact Analysis | January 28, 2014
24
Table 22: Results, Scenario 3, No RDA
2020 2021 2022 2023 2024 2025 2026 2027Revenue
Property Tax 12,696$ 26,501$ 38,746$ 51,312$ 64,941$ 83,412$ 102,226$ 114,915$ Property Transfer Tax 3,997 4,944 5,099 5,777 6,695 8,858 9,833 8,801 Sales Tax 6,380 19,705 29,990 48,553 60,365 74,790 79,121 109,871 Vehicle License Fee 6,036 12,598 18,419 24,392 30,871 39,652 48,596 54,628 Per Capita Revenue 7,774 16,084 23,125 30,475 38,070 46,960 55,746 62,239
Subtotal 36,883$ 79,833$ 115,379$ 160,509$ 200,942$ 253,672$ 295,521$ 350,455$
Costs
Police 23,507$ 48,874$ 70,521$ 93,352$ 116,520$ 147,318$ 170,468$ 191,269$ Fire 1,166 2,402 3,443 4,520 5,650 6,969 8,280 9,205 Public Works 37,379 56,330 75,202 94,089 112,997 131,980 150,961 169,787 Per Capita Cost 5,952 12,265 17,580 23,080 28,852 35,587 42,281 47,008
Subtotal 68,004$ 119,871$ 166,746$ 215,040$ 264,020$ 321,854$ 371,990$ 417,270$
Net Revenue (31,122)$ (40,037)$ (51,367)$ (54,532)$ (63,078)$ (68,181)$ (76,468)$ (66,815)$
Net Revenue as % of Total Revenue -84% -50% -45% -34% -31% -27% -26% -19%
2028 2029 2030 2031 2032 2033 2034 2035Revenue
Property Tax 149,244$ 173,318$ 202,011$ 224,262$ 252,287$ 273,552$ 288,487$ 287,353$ Property Transfer Tax 16,191 14,492 17,081 16,388 19,232 18,440 17,461 13,115 Sales Tax 237,109 256,759 296,596 336,434 336,434 336,434 336,434 336,434 Vehicle License Fee 70,947 82,391 96,031 106,608 119,931 130,040 137,139 136,600 Per Capita Revenue 77,144 87,198 98,551 106,422 118,333 125,479 130,074 130,074
Subtotal 550,635$ 614,158$ 710,269$ 790,113$ 846,216$ 883,945$ 909,595$ 903,576$
Costs
Police 241,665$ 272,952$ 315,775$ 334,002$ 369,516$ 390,825$ 404,523$ 404,523$ Fire 11,221 12,692 14,338 15,454 17,261 18,344 19,041 19,041 Public Works 189,048 208,093 227,207 246,109 265,287 284,176 302,912 302,912 Per Capita Cost 57,301 64,812 73,220 78,918 88,143 93,678 97,236 97,236
Subtotal 499,235$ 558,549$ 630,540$ 674,483$ 740,207$ 787,024$ 823,712$ 823,712$
Net Revenue 51,399$ 55,609$ 79,729$ 115,630$ 106,009$ 96,921$ 85,883$ 79,864$
Net Revenue as % of Total Revenue 9% 9% 11% 15% 13% 11% 9% 9%
Source: Smith-Monterey KC, LLC; New Urban Realty Advisors; Sargent Tow n Planning; City of King; Strategic Economics

Downtown Addition Fiscal Impact Analysis | January 28, 2014
25
Table 23: Results, Scenario 4, No RDA
2020 2021 2022 2023 2024 2025 2026 2027Revenue
Property Tax 12,696$ 25,880$ 36,988$ 46,368$ 57,939$ 72,983$ 91,871$ 104,625$ Property Transfer Tax 3,997 4,749 4,715 4,700 5,836 7,480 9,406 8,374 Sales Tax 6,380 15,318 18,453 18,453 18,453 18,453 22,784 53,534 Vehicle License Fee 6,036 12,303 17,583 22,042 27,543 34,694 43,673 49,736 Per Capita Revenue 8,228 16,661 23,074 28,576 34,985 41,621 50,407 56,900
Subtotal 37,336$ 74,909$ 100,812$ 120,138$ 144,755$ 175,231$ 218,141$ 273,169$
Costs
Police 24,860$ 50,396$ 69,845$ 86,249$ 105,359$ 125,145$ 155,435$ 172,667$ Fire 1,234 2,497 3,456 4,291 5,263 6,269 7,580 8,506 Public Works 37,407 56,368 75,208 93,998 112,843 131,701 150,682 169,508 Per Capita Cost 6,304 12,753 17,651 21,912 26,876 32,015 38,710 43,437
Subtotal 69,805$ 122,014$ 166,159$ 206,449$ 250,340$ 295,131$ 352,407$ 394,117$
Net Revenue (32,468)$ (47,105)$ (65,347)$ (86,311)$ (105,585)$ (119,900)$ (134,266)$ (120,948)$
Net Revenue as % of Total Revenue -87% -63% -65% -72% -73% -68% -62% -44%
2028 2029 2030 2031 2032 2033 2034 2035Revenue
Property Tax 150,159$ 178,312$ 212,383$ 267,403$ 299,135$ 321,452$ 336,086$ 334,695$ Property Transfer Tax 19,274 15,865 19,044 27,243 22,516 21,031 19,643 15,297 Sales Tax 180,771 215,034 237,984 256,759 296,596 336,434 336,434 336,434 Vehicle License Fee 71,382 84,765 100,961 127,117 142,201 152,810 159,767 159,106 Per Capita Revenue 77,568 89,388 103,500 114,082 128,385 136,483 141,077 141,077
Subtotal 499,155$ 583,363$ 673,872$ 792,604$ 888,833$ 968,210$ 993,006$ 986,609$
Costs
Police 240,313$ 277,518$ 327,782$ 353,112$ 397,590$ 423,633$ 465,759$ 437,332$ Fire 11,393 13,105 15,202 16,769 18,863 20,013 20,710 20,710 Public Works 189,117 208,257 227,551 246,634 265,926 284,842 303,578 303,578 Per Capita Cost 58,179 66,921 77,631 85,635 96,327 102,200 105,758 105,758
Subtotal 499,002$ 565,801$ 648,166$ 702,150$ 778,706$ 830,689$ 895,805$ 867,378$
Net Revenue 153$ 17,563$ 25,706$ 90,454$ 110,127$ 137,520$ 97,201$ 119,232$
Net Revenue as % of Total Revenue 0% 3% 4% 11% 12% 14% 10% 12%
Source: Smith-Monterey KC, LLC; New Urban Realty Advisors; Sargent Tow n Planning; City of King; Strategic Economics

Downtown Addition Fiscal Impact Analysis | January 28, 2014
26
Table 24: Results, Scenario 1, RDA
2020 2021 2022 2023 2024 2025 2026 2027Revenue
Property Tax -$ -$ -$ -$ -$ -$ -$ -$ Property Transfer Tax 9,499 5,585 8,849 6,689 10,653 7,715 10,421 13,685 Sales Tax - - - - - 7,220 7,220 25,070 Vehicle License Fee 14,346 20,612 30,859 36,296 46,897 51,458 59,417 71,101 Per Capita Revenue 11,230 16,959 23,879 29,607 42,710 49,082 56,399 69,393
Subtotal 35,075$ 43,156$ 63,587$ 72,593$ 100,260$ 115,476$ 133,457$ 179,249$
Costs
Police 33,485$ 50,565$ 71,197$ 88,278$ 127,344$ 150,700$ 168,946$ 209,195$ Fire 1,703 2,572 3,622 4,490 6,478 7,412 8,521 10,430 Public Works 37,512 56,275 75,111 93,874 113,083 131,872 150,731 169,909 Per Capita Cost 8,698 13,135 18,494 22,931 33,078 37,849 43,516 53,264
Subtotal 81,398$ 122,548$ 168,424$ 209,573$ 279,982$ 327,833$ 371,714$ 442,798$
Net Revenue (46,323)$ (79,391)$ (104,836)$ (136,980)$ (179,722)$ (212,357)$ (238,257)$ (263,550)$
Net Revenue as % of Total Revenue -132% -184% -165% -189% -179% -184% -179% -147%
2028 2029 2030 2031 2032 2033 2034 2035Revenue
Property Tax -$ -$ -$ -$ -$ -$ -$ -$ Property Transfer Tax 14,827 14,565 15,460 15,794 15,754 17,992 20,118 13,482 Sales Tax 25,070 25,070 25,070 25,070 25,070 25,070 25,070 25,070 Vehicle License Fee 82,755 92,251 101,663 110,158 117,306 126,755 137,985 137,495 Per Capita Revenue 81,077 92,591 103,368 112,783 118,966 127,247 134,564 134,564
Subtotal 203,729$ 224,478$ 245,561$ 263,805$ 277,095$ 297,064$ 317,737$ 310,610$
Costs
Police 244,033$ 278,363$ 314,065$ 338,568$ 357,002$ 381,693$ 403,509$ 403,509$ Fire 12,202 13,949 15,583 17,011 17,949 19,205 20,314 20,314 Public Works 189,033 208,146 227,214 246,201 264,991 283,909 302,768 302,768 Per Capita Cost 62,313 71,230 79,577 86,869 91,657 98,071 103,738 103,738
Subtotal 507,581$ 571,688$ 636,440$ 688,649$ 731,599$ 782,877$ 830,328$ 830,328$
Net Revenue (303,852)$ (347,210)$ (390,878)$ (424,844)$ (454,503)$ (485,813)$ (512,592)$ (519,718)$
Net Revenue as % of Total Revenue -149% -155% -159% -161% -164% -164% -161% -167%
Source: Smith-Monterey KC, LLC; New Urban Realty Advisors; Sargent Tow n Planning; City of King; Strategic Economics
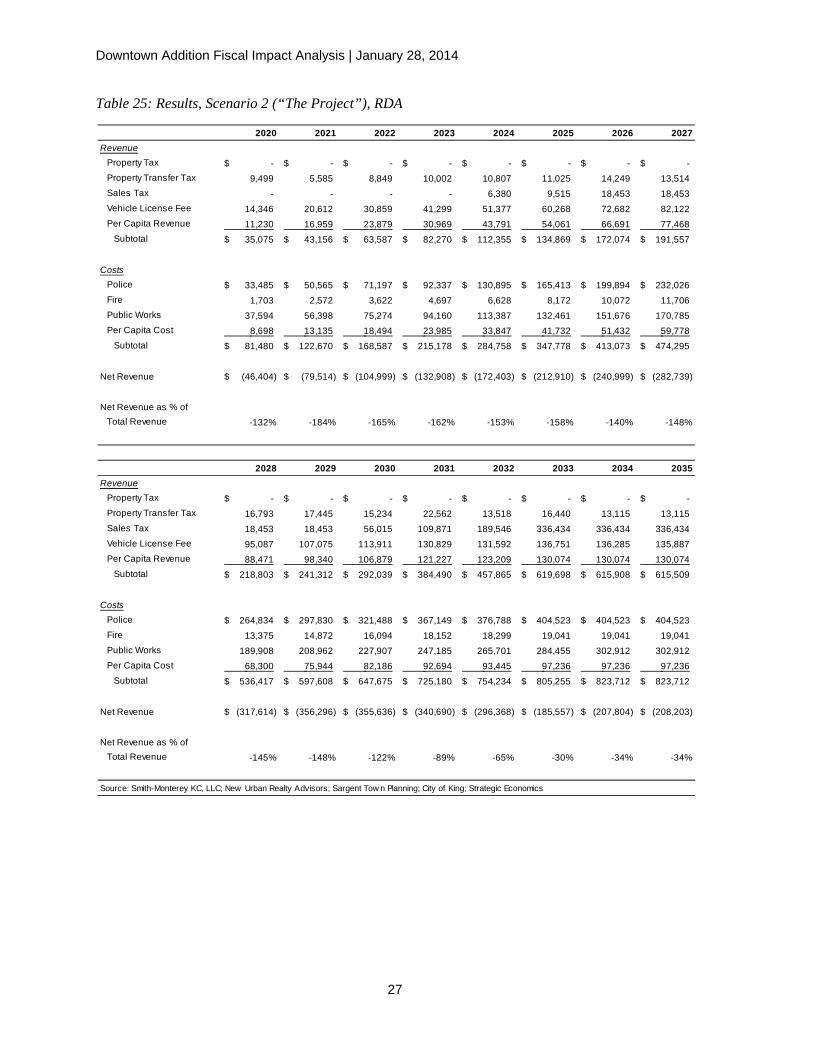
Downtown Addition Fiscal Impact Analysis | January 28, 2014
27
Table 25: Results, Scenario 2 (“The Project”), RDA
2020 2021 2022 2023 2024 2025 2026 2027Revenue
Property Tax -$ -$ -$ -$ -$ -$ -$ -$ Property Transfer Tax 9,499 5,585 8,849 10,002 10,807 11,025 14,249 13,514 Sales Tax - - - - 6,380 9,515 18,453 18,453 Vehicle License Fee 14,346 20,612 30,859 41,299 51,377 60,268 72,682 82,122 Per Capita Revenue 11,230 16,959 23,879 30,969 43,791 54,061 66,691 77,468
Subtotal 35,075$ 43,156$ 63,587$ 82,270$ 112,355$ 134,869$ 172,074$ 191,557$
Costs
Police 33,485$ 50,565$ 71,197$ 92,337$ 130,895$ 165,413$ 199,894$ 232,026$ Fire 1,703 2,572 3,622 4,697 6,628 8,172 10,072 11,706 Public Works 37,594 56,398 75,274 94,160 113,387 132,461 151,676 170,785 Per Capita Cost 8,698 13,135 18,494 23,985 33,847 41,732 51,432 59,778
Subtotal 81,480$ 122,670$ 168,587$ 215,178$ 284,758$ 347,778$ 413,073$ 474,295$
Net Revenue (46,404)$ (79,514)$ (104,999)$ (132,908)$ (172,403)$ (212,910)$ (240,999)$ (282,739)$
Net Revenue as % of Total Revenue -132% -184% -165% -162% -153% -158% -140% -148%
2028 2029 2030 2031 2032 2033 2034 2035Revenue
Property Tax -$ -$ -$ -$ -$ -$ -$ -$ Property Transfer Tax 16,793 17,445 15,234 22,562 13,518 16,440 13,115 13,115 Sales Tax 18,453 18,453 56,015 109,871 189,546 336,434 336,434 336,434 Vehicle License Fee 95,087 107,075 113,911 130,829 131,592 136,751 136,285 135,887 Per Capita Revenue 88,471 98,340 106,879 121,227 123,209 130,074 130,074 130,074
Subtotal 218,803$ 241,312$ 292,039$ 384,490$ 457,865$ 619,698$ 615,908$ 615,509$
Costs
Police 264,834$ 297,830$ 321,488$ 367,149$ 376,788$ 404,523$ 404,523$ 404,523$ Fire 13,375 14,872 16,094 18,152 18,299 19,041 19,041 19,041 Public Works 189,908 208,962 227,907 247,185 265,701 284,455 302,912 302,912 Per Capita Cost 68,300 75,944 82,186 92,694 93,445 97,236 97,236 97,236
Subtotal 536,417$ 597,608$ 647,675$ 725,180$ 754,234$ 805,255$ 823,712$ 823,712$
Net Revenue (317,614)$ (356,296)$ (355,636)$ (340,690)$ (296,368)$ (185,557)$ (207,804)$ (208,203)$
Net Revenue as % of Total Revenue -145% -148% -122% -89% -65% -30% -34% -34%
Source: Smith-Monterey KC, LLC; New Urban Realty Advisors; Sargent Tow n Planning; City of King; Strategic Economics
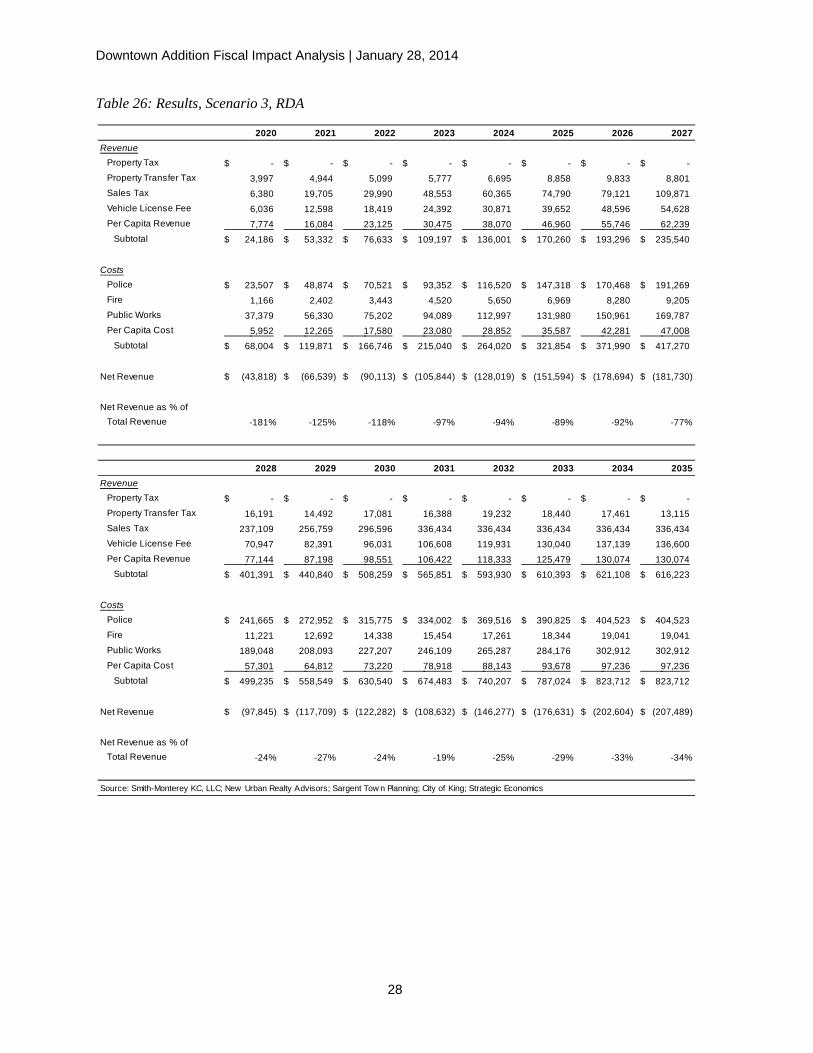
Downtown Addition Fiscal Impact Analysis | January 28, 2014
28
Table 26: Results, Scenario 3, RDA
2020 2021 2022 2023 2024 2025 2026 2027Revenue
Property Tax -$ -$ -$ -$ -$ -$ -$ -$ Property Transfer Tax 3,997 4,944 5,099 5,777 6,695 8,858 9,833 8,801 Sales Tax 6,380 19,705 29,990 48,553 60,365 74,790 79,121 109,871 Vehicle License Fee 6,036 12,598 18,419 24,392 30,871 39,652 48,596 54,628 Per Capita Revenue 7,774 16,084 23,125 30,475 38,070 46,960 55,746 62,239
Subtotal 24,186$ 53,332$ 76,633$ 109,197$ 136,001$ 170,260$ 193,296$ 235,540$
Costs
Police 23,507$ 48,874$ 70,521$ 93,352$ 116,520$ 147,318$ 170,468$ 191,269$ Fire 1,166 2,402 3,443 4,520 5,650 6,969 8,280 9,205 Public Works 37,379 56,330 75,202 94,089 112,997 131,980 150,961 169,787 Per Capita Cost 5,952 12,265 17,580 23,080 28,852 35,587 42,281 47,008
Subtotal 68,004$ 119,871$ 166,746$ 215,040$ 264,020$ 321,854$ 371,990$ 417,270$
Net Revenue (43,818)$ (66,539)$ (90,113)$ (105,844)$ (128,019)$ (151,594)$ (178,694)$ (181,730)$
Net Revenue as % of Total Revenue -181% -125% -118% -97% -94% -89% -92% -77%
2028 2029 2030 2031 2032 2033 2034 2035Revenue
Property Tax -$ -$ -$ -$ -$ -$ -$ -$ Property Transfer Tax 16,191 14,492 17,081 16,388 19,232 18,440 17,461 13,115 Sales Tax 237,109 256,759 296,596 336,434 336,434 336,434 336,434 336,434 Vehicle License Fee 70,947 82,391 96,031 106,608 119,931 130,040 137,139 136,600 Per Capita Revenue 77,144 87,198 98,551 106,422 118,333 125,479 130,074 130,074
Subtotal 401,391$ 440,840$ 508,259$ 565,851$ 593,930$ 610,393$ 621,108$ 616,223$
Costs
Police 241,665$ 272,952$ 315,775$ 334,002$ 369,516$ 390,825$ 404,523$ 404,523$ Fire 11,221 12,692 14,338 15,454 17,261 18,344 19,041 19,041 Public Works 189,048 208,093 227,207 246,109 265,287 284,176 302,912 302,912 Per Capita Cost 57,301 64,812 73,220 78,918 88,143 93,678 97,236 97,236
Subtotal 499,235$ 558,549$ 630,540$ 674,483$ 740,207$ 787,024$ 823,712$ 823,712$
Net Revenue (97,845)$ (117,709)$ (122,282)$ (108,632)$ (146,277)$ (176,631)$ (202,604)$ (207,489)$
Net Revenue as % of Total Revenue -24% -27% -24% -19% -25% -29% -33% -34%
Source: Smith-Monterey KC, LLC; New Urban Realty Advisors; Sargent Tow n Planning; City of King; Strategic Economics

Downtown Addition Fiscal Impact Analysis | January 28, 2014
29
Table 27: Results, Scenario 4, RDA
2020 2021 2022 2023 2024 2025 2026 2027Revenue
Property Tax -$ -$ -$ -$ -$ -$ -$ -$ Property Transfer Tax 3,997 4,749 4,715 4,700 5,836 7,480 9,406 8,374 Sales Tax 6,380 15,318 18,453 18,453 18,453 18,453 22,784 53,534 Vehicle License Fee 6,036 12,303 17,583 22,042 27,543 34,694 43,673 49,736 Per Capita Revenue 8,228 16,661 23,074 28,576 34,985 41,621 50,407 56,900
Subtotal 24,640$ 49,030$ 63,825$ 73,770$ 86,816$ 102,248$ 126,270$ 168,545$
Costs
Police 24,860$ 50,396$ 69,845$ 86,249$ 105,359$ 125,145$ 155,435$ 172,667$ Fire 1,234 2,497 3,456 4,291 5,263 6,269 7,580 8,506 Public Works 37,407 56,368 75,208 93,998 112,843 131,701 150,682 169,508 Per Capita Cost 6,304 12,753 17,651 21,912 26,876 32,015 38,710 43,437
Subtotal 69,805$ 122,014$ 166,159$ 206,449$ 250,340$ 295,131$ 352,407$ 394,117$
Net Revenue (45,165)$ (72,984)$ (102,334)$ (132,679)$ (163,523)$ (192,883)$ (226,137)$ (225,573)$
Net Revenue as % of Total Revenue -183% -149% -160% -180% -188% -189% -179% -134%
2028 2029 2030 2031 2032 2033 2034 2035Revenue
Property Tax -$ -$ -$ -$ -$ -$ -$ -$ Property Transfer Tax 19,274 15,865 19,044 27,243 22,516 21,031 19,643 15,297 Sales Tax 180,771 215,034 237,984 256,759 296,596 336,434 336,434 336,434 Vehicle License Fee 71,382 84,765 100,961 127,117 142,201 152,810 159,767 159,106 Per Capita Revenue 77,568 89,388 103,500 114,082 128,385 136,483 141,077 141,077
Subtotal 348,996$ 405,051$ 461,489$ 525,201$ 589,698$ 646,758$ 656,921$ 651,914$
Costs
Police 240,313$ 277,518$ 327,782$ 353,112$ 397,590$ 423,633$ 465,759$ 437,332$ Fire 11,393 13,105 15,202 16,769 18,863 20,013 20,710 20,710 Public Works 189,117 208,257 227,551 246,634 265,926 284,842 303,578 303,578 Per Capita Cost 58,179 66,921 77,631 85,635 96,327 102,200 105,758 105,758
Subtotal 499,002$ 565,801$ 648,166$ 702,150$ 778,706$ 830,689$ 895,805$ 867,378$
Net Revenue (150,006)$ (160,750)$ (186,677)$ (176,949)$ (189,008)$ (183,932)$ (238,885)$ (215,464)$
Net Revenue as % of Total Revenue -43% -40% -40% -34% -32% -28% -36% -33%
Source: Smith-Monterey KC, LLC; New Urban Realty Advisors; Sargent Tow n Planning; City of King; Strategic Economics
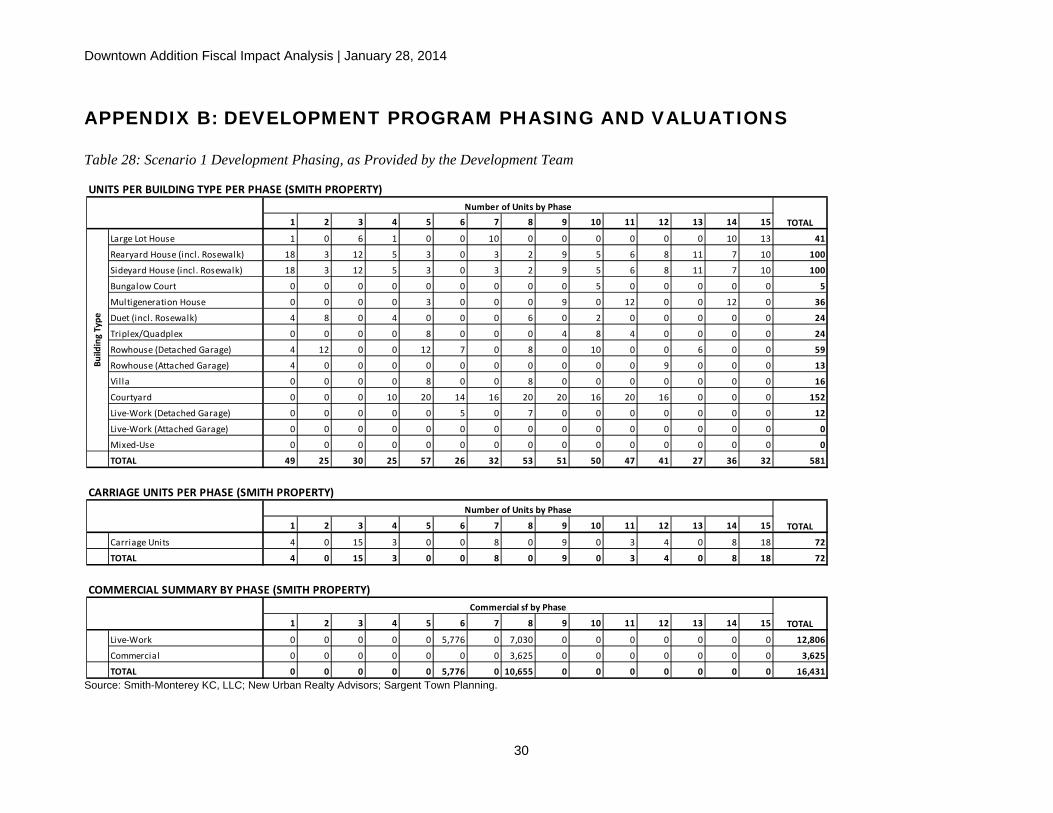
Downtown Addition Fiscal Impact Analysis | January 28, 2014
30
APPENDIX B: DEVELOPMENT PROGRAM PHASING AND VALUATIONS
Table 28: Scenario 1 Development Phasing, as Provided by the Development Team
Source: Smith-Monterey KC, LLC; New Urban Realty Advisors; Sargent Town Planning.
UNITS PER BUILDING TYPE PER PHASE (SMITH PROPERTY)
1 2 3 4 5 6 7 8 9 10 11 12 13 14 15
Large Lot House 1 0 6 1 0 0 10 0 0 0 0 0 0 10 13 41
Rearyard House (incl. Rosewalk) 18 3 12 5 3 0 3 2 9 5 6 8 11 7 10 100
Sideyard House (incl. Rosewalk) 18 3 12 5 3 0 3 2 9 5 6 8 11 7 10 100
Bungalow Court 0 0 0 0 0 0 0 0 0 5 0 0 0 0 0 5
Multigeneration House 0 0 0 0 3 0 0 0 9 0 12 0 0 12 0 36
Duet (incl. Rosewalk) 4 8 0 4 0 0 0 6 0 2 0 0 0 0 0 24
Triplex/Quadplex 0 0 0 0 8 0 0 0 4 8 4 0 0 0 0 24
Rowhouse (Detached Garage) 4 12 0 0 12 7 0 8 0 10 0 0 6 0 0 59
Rowhouse (Attached Garage) 4 0 0 0 0 0 0 0 0 0 0 9 0 0 0 13
Villa 0 0 0 0 8 0 0 8 0 0 0 0 0 0 0 16
Courtyard 0 0 0 10 20 14 16 20 20 16 20 16 0 0 0 152
Live‐Work (Detached Garage) 0 0 0 0 0 5 0 7 0 0 0 0 0 0 0 12
Live‐Work (Attached Garage) 0 0 0 0 0 0 0 0 0 0 0 0 0 0 0 0
Mixed‐Use 0 0 0 0 0 0 0 0 0 0 0 0 0 0 0 0
TOTAL 49 25 30 25 57 26 32 53 51 50 47 41 27 36 32 581
CARRIAGE UNITS PER PHASE (SMITH PROPERTY)
1 2 3 4 5 6 7 8 9 10 11 12 13 14 15
Carriage Units 4 0 15 3 0 0 8 0 9 0 3 4 0 8 18 72
TOTAL 4 0 15 3 0 0 8 0 9 0 3 4 0 8 18 72
COMMERCIAL SUMMARY BY PHASE (SMITH PROPERTY)
1 2 3 4 5 6 7 8 9 10 11 12 13 14 15
Live‐Work 0 0 0 0 0 5,776 0 7,030 0 0 0 0 0 0 0 12,806
Commercial 0 0 0 0 0 0 0 3,625 0 0 0 0 0 0 0 3,625
TOTAL 0 0 0 0 0 5,776 0 10,655 0 0 0 0 0 0 0 16,431
Commercial sf by Phase
TOTAL
TOTAL
TOTAL
Building Type
Number of Units by Phase
Number of Units by Phase
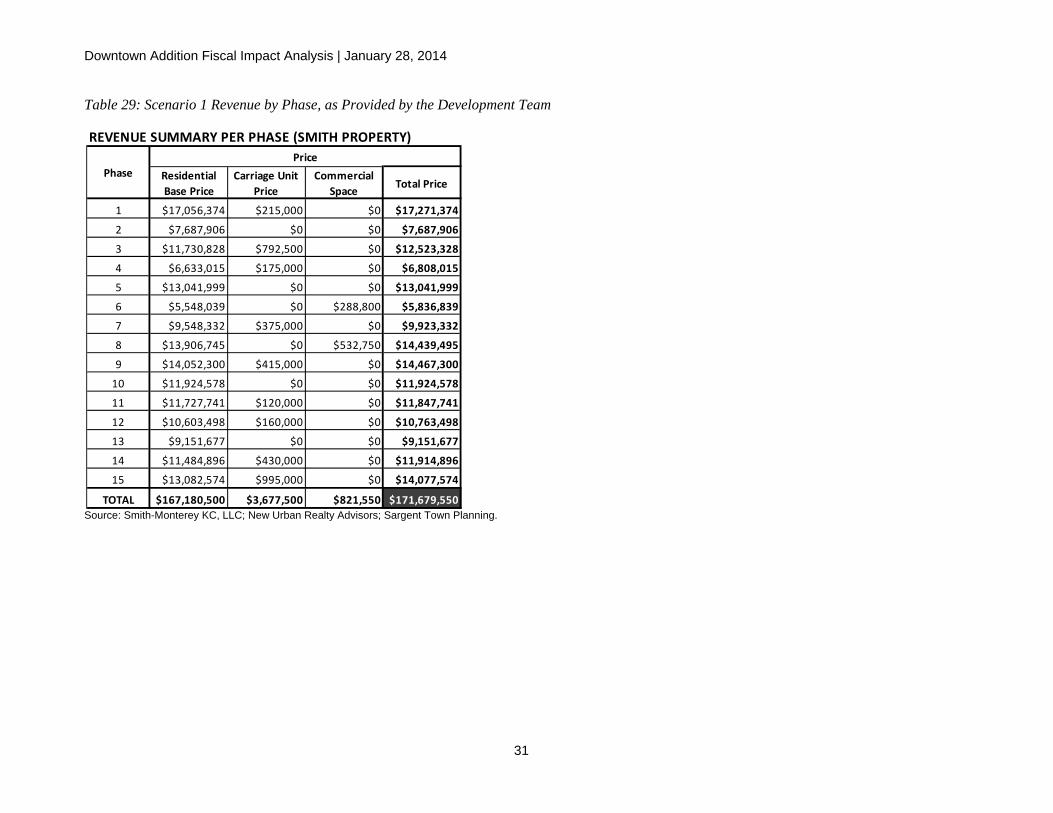
Downtown Addition Fiscal Impact Analysis | January 28, 2014
31
Table 29: Scenario 1 Revenue by Phase, as Provided by the Development Team
Source: Smith-Monterey KC, LLC; New Urban Realty Advisors; Sargent Town Planning.
REVENUE SUMMARY PER PHASE (SMITH PROPERTY)
Residential Base Price
Carriage Unit Price
Commercial Space Total Price
1 $17,056,374 $215,000 $0 $17,271,374
2 $7,687,906 $0 $0 $7,687,906
3 $11,730,828 $792,500 $0 $12,523,328
4 $6,633,015 $175,000 $0 $6,808,015
5 $13,041,999 $0 $0 $13,041,999
6 $5,548,039 $0 $288,800 $5,836,839
7 $9,548,332 $375,000 $0 $9,923,332
8 $13,906,745 $0 $532,750 $14,439,495
9 $14,052,300 $415,000 $0 $14,467,300
10 $11,924,578 $0 $0 $11,924,578
11 $11,727,741 $120,000 $0 $11,847,741
12 $10,603,498 $160,000 $0 $10,763,498
13 $9,151,677 $0 $0 $9,151,677
14 $11,484,896 $430,000 $0 $11,914,896
15 $13,082,574 $995,000 $0 $14,077,574
TOTAL $167,180,500 $3,677,500 $821,550 $171,679,550
PhasePrice
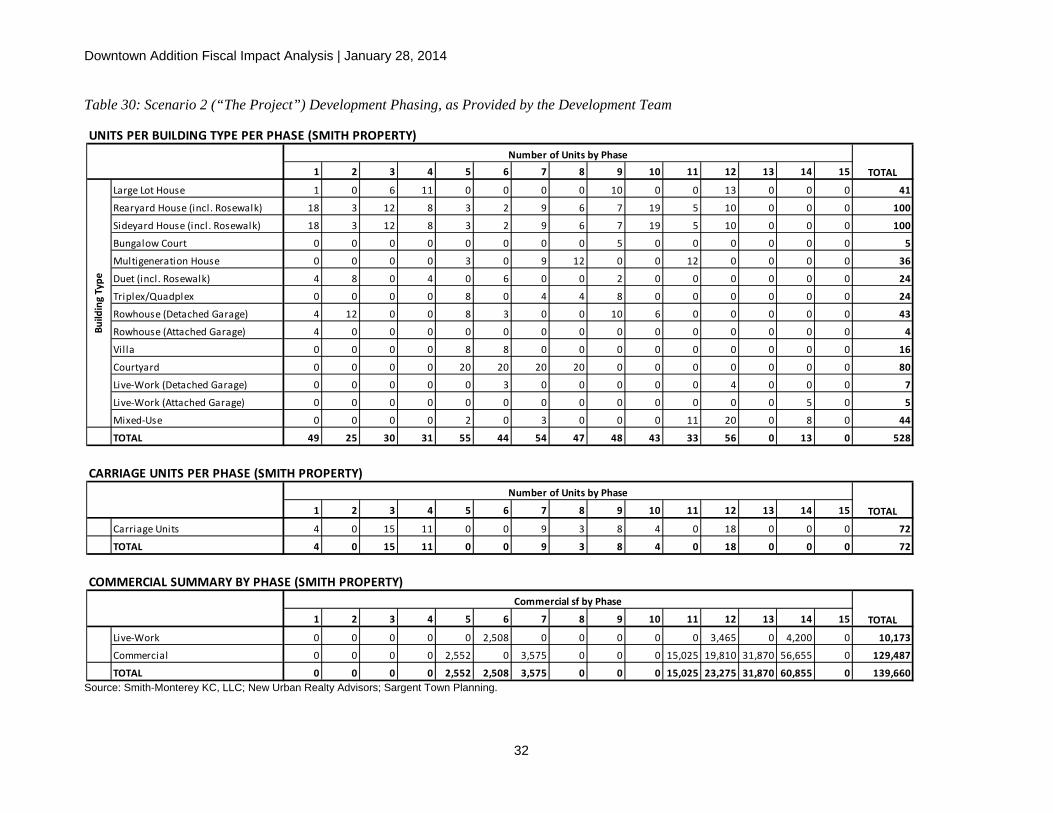
Downtown Addition Fiscal Impact Analysis | January 28, 2014
32
Table 30: Scenario 2 (“The Project”) Development Phasing, as Provided by the Development Team
Source: Smith-Monterey KC, LLC; New Urban Realty Advisors; Sargent Town Planning.
UNITS PER BUILDING TYPE PER PHASE (SMITH PROPERTY)
1 2 3 4 5 6 7 8 9 10 11 12 13 14 15
Large Lot House 1 0 6 11 0 0 0 0 10 0 0 13 0 0 0 41
Rearyard House (incl. Rosewalk) 18 3 12 8 3 2 9 6 7 19 5 10 0 0 0 100
Sideyard House (incl. Rosewalk) 18 3 12 8 3 2 9 6 7 19 5 10 0 0 0 100
Bungalow Court 0 0 0 0 0 0 0 0 5 0 0 0 0 0 0 5
Multigeneration House 0 0 0 0 3 0 9 12 0 0 12 0 0 0 0 36
Duet (incl. Rosewalk) 4 8 0 4 0 6 0 0 2 0 0 0 0 0 0 24
Triplex/Quadplex 0 0 0 0 8 0 4 4 8 0 0 0 0 0 0 24
Rowhouse (Detached Garage) 4 12 0 0 8 3 0 0 10 6 0 0 0 0 0 43
Rowhouse (Attached Garage) 4 0 0 0 0 0 0 0 0 0 0 0 0 0 0 4
Villa 0 0 0 0 8 8 0 0 0 0 0 0 0 0 0 16
Courtyard 0 0 0 0 20 20 20 20 0 0 0 0 0 0 0 80
Live‐Work (Detached Garage) 0 0 0 0 0 3 0 0 0 0 0 4 0 0 0 7
Live‐Work (Attached Garage) 0 0 0 0 0 0 0 0 0 0 0 0 0 5 0 5
Mixed‐Use 0 0 0 0 2 0 3 0 0 0 11 20 0 8 0 44
TOTAL 49 25 30 31 55 44 54 47 48 43 33 56 0 13 0 528
CARRIAGE UNITS PER PHASE (SMITH PROPERTY)
1 2 3 4 5 6 7 8 9 10 11 12 13 14 15
Carriage Units 4 0 15 11 0 0 9 3 8 4 0 18 0 0 0 72
TOTAL 4 0 15 11 0 0 9 3 8 4 0 18 0 0 0 72
COMMERCIAL SUMMARY BY PHASE (SMITH PROPERTY)
1 2 3 4 5 6 7 8 9 10 11 12 13 14 15
Live‐Work 0 0 0 0 0 2,508 0 0 0 0 0 3,465 0 4,200 0 10,173
Commercial 0 0 0 0 2,552 0 3,575 0 0 0 15,025 19,810 31,870 56,655 0 129,487
TOTAL 0 0 0 0 2,552 2,508 3,575 0 0 0 15,025 23,275 31,870 60,855 0 139,660
Commercial sf by Phase
TOTAL
Number of Units by Phase
TOTAL
Number of Units by Phase
TOTAL
Building Type
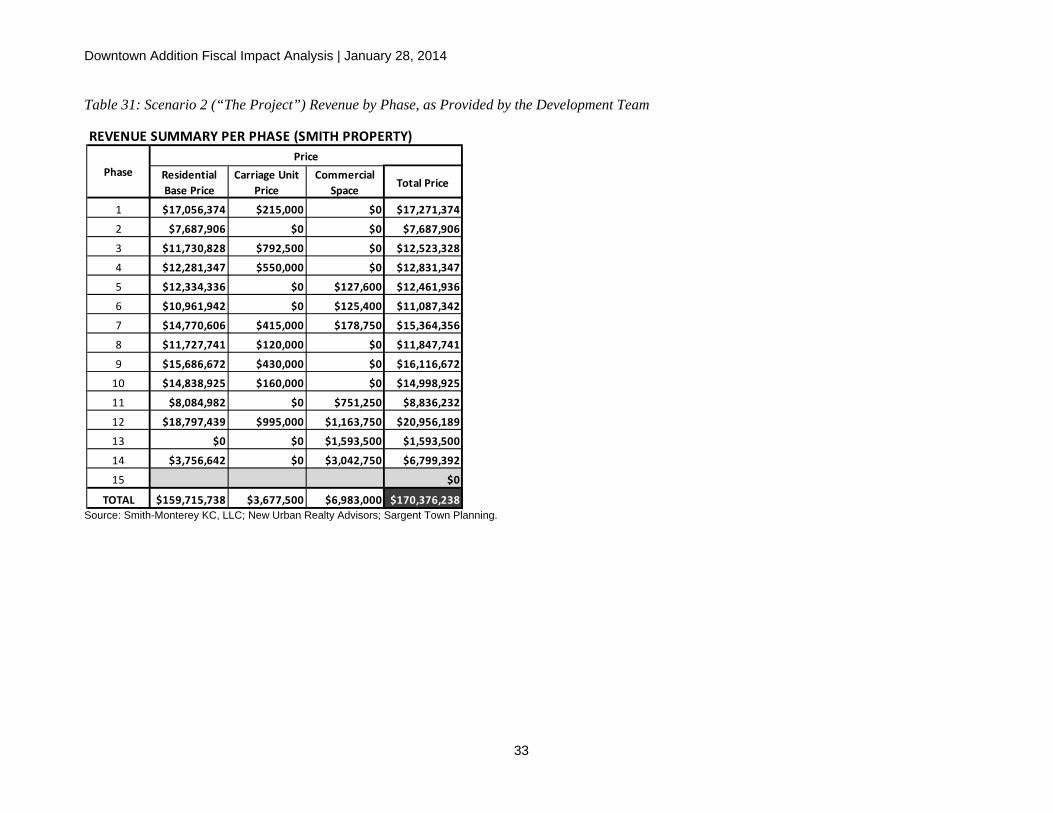
Downtown Addition Fiscal Impact Analysis | January 28, 2014
33
Table 31: Scenario 2 (“The Project”) Revenue by Phase, as Provided by the Development Team
Source: Smith-Monterey KC, LLC; New Urban Realty Advisors; Sargent Town Planning.
REVENUE SUMMARY PER PHASE (SMITH PROPERTY)
Residential Base Price
Carriage Unit Price
Commercial Space Total Price
1 $17,056,374 $215,000 $0 $17,271,374
2 $7,687,906 $0 $0 $7,687,906
3 $11,730,828 $792,500 $0 $12,523,328
4 $12,281,347 $550,000 $0 $12,831,347
5 $12,334,336 $0 $127,600 $12,461,936
6 $10,961,942 $0 $125,400 $11,087,342
7 $14,770,606 $415,000 $178,750 $15,364,356
8 $11,727,741 $120,000 $0 $11,847,741
9 $15,686,672 $430,000 $0 $16,116,672
10 $14,838,925 $160,000 $0 $14,998,925
11 $8,084,982 $0 $751,250 $8,836,232
12 $18,797,439 $995,000 $1,163,750 $20,956,189
13 $0 $0 $1,593,500 $1,593,500
14 $3,756,642 $0 $3,042,750 $6,799,392
15 $0
TOTAL $159,715,738 $3,677,500 $6,983,000 $170,376,238
PricePhase
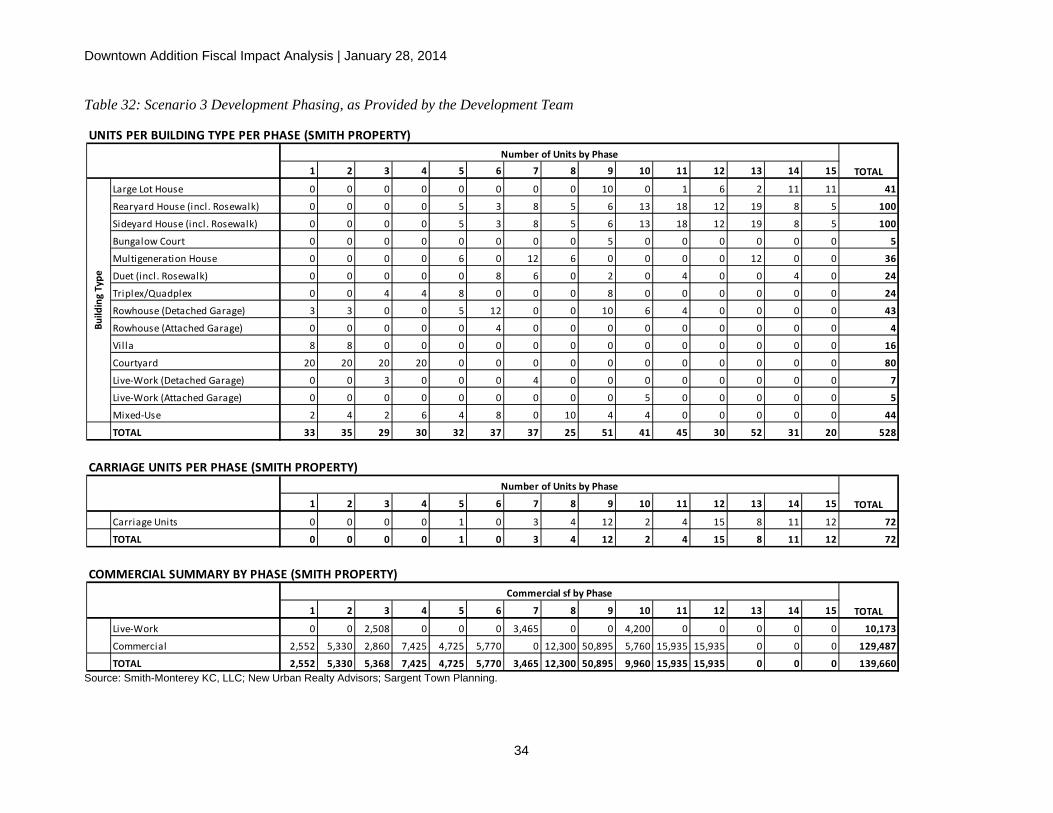
Downtown Addition Fiscal Impact Analysis | January 28, 2014
34
Table 32: Scenario 3 Development Phasing, as Provided by the Development Team
Source: Smith-Monterey KC, LLC; New Urban Realty Advisors; Sargent Town Planning.
UNITS PER BUILDING TYPE PER PHASE (SMITH PROPERTY)
1 2 3 4 5 6 7 8 9 10 11 12 13 14 15
Large Lot House 0 0 0 0 0 0 0 0 10 0 1 6 2 11 11 41
Rearyard House (incl. Rosewalk) 0 0 0 0 5 3 8 5 6 13 18 12 19 8 5 100
Sideyard House (incl. Rosewalk) 0 0 0 0 5 3 8 5 6 13 18 12 19 8 5 100
Bungalow Court 0 0 0 0 0 0 0 0 5 0 0 0 0 0 0 5
Multigeneration House 0 0 0 0 6 0 12 6 0 0 0 0 12 0 0 36
Duet (incl. Rosewalk) 0 0 0 0 0 8 6 0 2 0 4 0 0 4 0 24
Triplex/Quadplex 0 0 4 4 8 0 0 0 8 0 0 0 0 0 0 24
Rowhouse (Detached Garage) 3 3 0 0 5 12 0 0 10 6 4 0 0 0 0 43
Rowhouse (Attached Garage) 0 0 0 0 0 4 0 0 0 0 0 0 0 0 0 4
Villa 8 8 0 0 0 0 0 0 0 0 0 0 0 0 0 16
Courtyard 20 20 20 20 0 0 0 0 0 0 0 0 0 0 0 80
Live‐Work (Detached Garage) 0 0 3 0 0 0 4 0 0 0 0 0 0 0 0 7
Live‐Work (Attached Garage) 0 0 0 0 0 0 0 0 0 5 0 0 0 0 0 5
Mixed‐Use 2 4 2 6 4 8 0 10 4 4 0 0 0 0 0 44
TOTAL 33 35 29 30 32 37 37 25 51 41 45 30 52 31 20 528
CARRIAGE UNITS PER PHASE (SMITH PROPERTY)
1 2 3 4 5 6 7 8 9 10 11 12 13 14 15
Carriage Units 0 0 0 0 1 0 3 4 12 2 4 15 8 11 12 72
TOTAL 0 0 0 0 1 0 3 4 12 2 4 15 8 11 12 72
COMMERCIAL SUMMARY BY PHASE (SMITH PROPERTY)
1 2 3 4 5 6 7 8 9 10 11 12 13 14 15
Live‐Work 0 0 2,508 0 0 0 3,465 0 0 4,200 0 0 0 0 0 10,173
Commercial 2,552 5,330 2,860 7,425 4,725 5,770 0 12,300 50,895 5,760 15,935 15,935 0 0 0 129,487
TOTAL 2,552 5,330 5,368 7,425 4,725 5,770 3,465 12,300 50,895 9,960 15,935 15,935 0 0 0 139,660
Commercial sf by Phase
TOTAL
TOTAL
TOTAL
Building Type
Number of Units by Phase
Number of Units by Phase
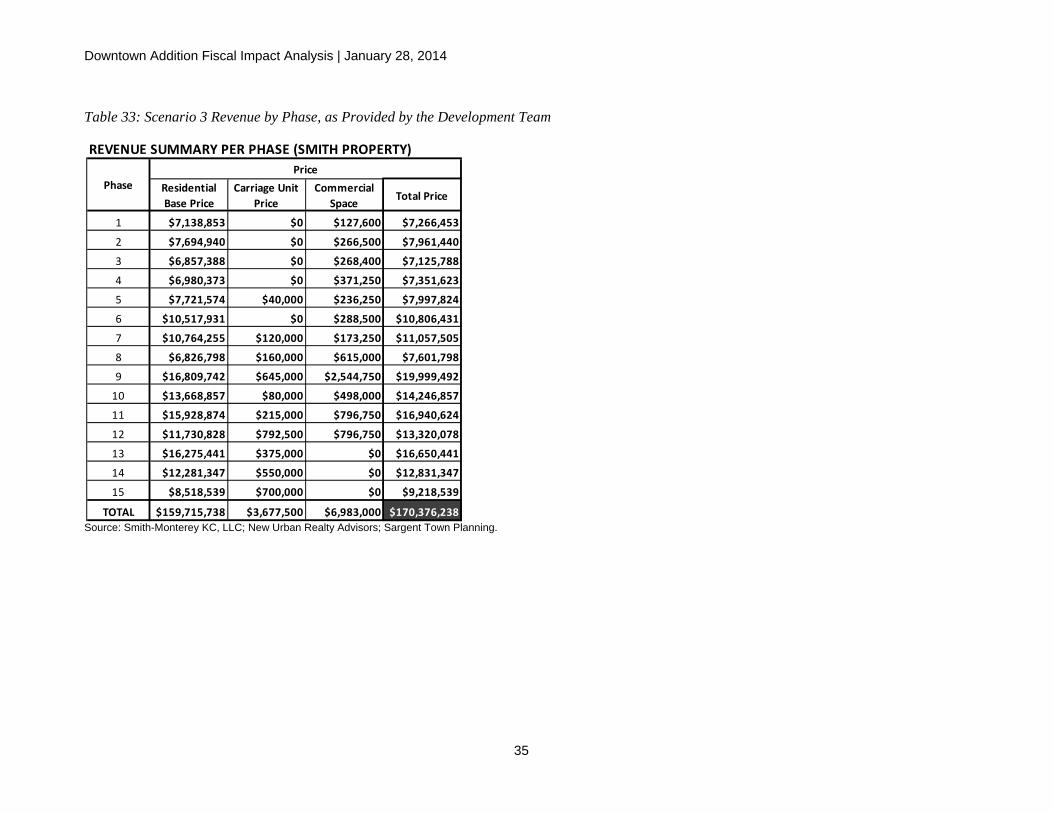
Downtown Addition Fiscal Impact Analysis | January 28, 2014
35
Table 33: Scenario 3 Revenue by Phase, as Provided by the Development Team
Source: Smith-Monterey KC, LLC; New Urban Realty Advisors; Sargent Town Planning.
REVENUE SUMMARY PER PHASE (SMITH PROPERTY)
Residential Base Price
Carriage Unit Price
Commercial Space Total Price
1 $7,138,853 $0 $127,600 $7,266,453
2 $7,694,940 $0 $266,500 $7,961,440
3 $6,857,388 $0 $268,400 $7,125,788
4 $6,980,373 $0 $371,250 $7,351,623
5 $7,721,574 $40,000 $236,250 $7,997,824
6 $10,517,931 $0 $288,500 $10,806,431
7 $10,764,255 $120,000 $173,250 $11,057,505
8 $6,826,798 $160,000 $615,000 $7,601,798
9 $16,809,742 $645,000 $2,544,750 $19,999,492
10 $13,668,857 $80,000 $498,000 $14,246,857
11 $15,928,874 $215,000 $796,750 $16,940,624
12 $11,730,828 $792,500 $796,750 $13,320,078
13 $16,275,441 $375,000 $0 $16,650,441
14 $12,281,347 $550,000 $0 $12,831,347
15 $8,518,539 $700,000 $0 $9,218,539
TOTAL $159,715,738 $3,677,500 $6,983,000 $170,376,238
PhasePrice
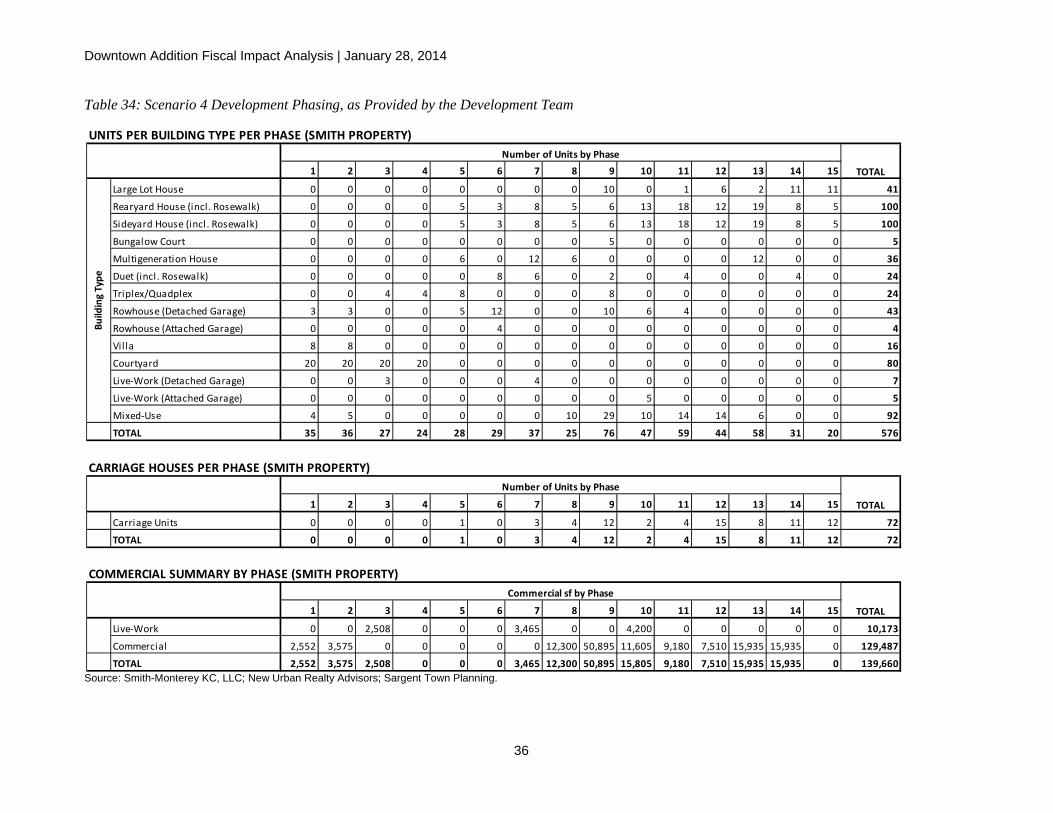
Downtown Addition Fiscal Impact Analysis | January 28, 2014
36
Table 34: Scenario 4 Development Phasing, as Provided by the Development Team
Source: Smith-Monterey KC, LLC; New Urban Realty Advisors; Sargent Town Planning.
UNITS PER BUILDING TYPE PER PHASE (SMITH PROPERTY)
1 2 3 4 5 6 7 8 9 10 11 12 13 14 15
Large Lot House 0 0 0 0 0 0 0 0 10 0 1 6 2 11 11 41
Rearyard House (incl. Rosewalk) 0 0 0 0 5 3 8 5 6 13 18 12 19 8 5 100
Sideyard House (incl. Rosewalk) 0 0 0 0 5 3 8 5 6 13 18 12 19 8 5 100
Bungalow Court 0 0 0 0 0 0 0 0 5 0 0 0 0 0 0 5
Multigeneration House 0 0 0 0 6 0 12 6 0 0 0 0 12 0 0 36
Duet (incl. Rosewalk) 0 0 0 0 0 8 6 0 2 0 4 0 0 4 0 24
Triplex/Quadplex 0 0 4 4 8 0 0 0 8 0 0 0 0 0 0 24
Rowhouse (Detached Garage) 3 3 0 0 5 12 0 0 10 6 4 0 0 0 0 43
Rowhouse (Attached Garage) 0 0 0 0 0 4 0 0 0 0 0 0 0 0 0 4
Vil la 8 8 0 0 0 0 0 0 0 0 0 0 0 0 0 16
Courtyard 20 20 20 20 0 0 0 0 0 0 0 0 0 0 0 80
Live‐Work (Detached Garage) 0 0 3 0 0 0 4 0 0 0 0 0 0 0 0 7
Live‐Work (Attached Garage) 0 0 0 0 0 0 0 0 0 5 0 0 0 0 0 5
Mixed‐Use 4 5 0 0 0 0 0 10 29 10 14 14 6 0 0 92
TOTAL 35 36 27 24 28 29 37 25 76 47 59 44 58 31 20 576
CARRIAGE HOUSES PER PHASE (SMITH PROPERTY)
1 2 3 4 5 6 7 8 9 10 11 12 13 14 15
Carriage Units 0 0 0 0 1 0 3 4 12 2 4 15 8 11 12 72
TOTAL 0 0 0 0 1 0 3 4 12 2 4 15 8 11 12 72
COMMERCIAL SUMMARY BY PHASE (SMITH PROPERTY)
1 2 3 4 5 6 7 8 9 10 11 12 13 14 15
Live‐Work 0 0 2,508 0 0 0 3,465 0 0 4,200 0 0 0 0 0 10,173
Commercial 2,552 3,575 0 0 0 0 0 12,300 50,895 11,605 9,180 7,510 15,935 15,935 0 129,487
TOTAL 2,552 3,575 2,508 0 0 0 3,465 12,300 50,895 15,805 9,180 7,510 15,935 15,935 0 139,660
Commercial sf by Phase
TOTAL
TOTAL
TOTAL
Building Type
Number of Units by Phase
Number of Units by Phase
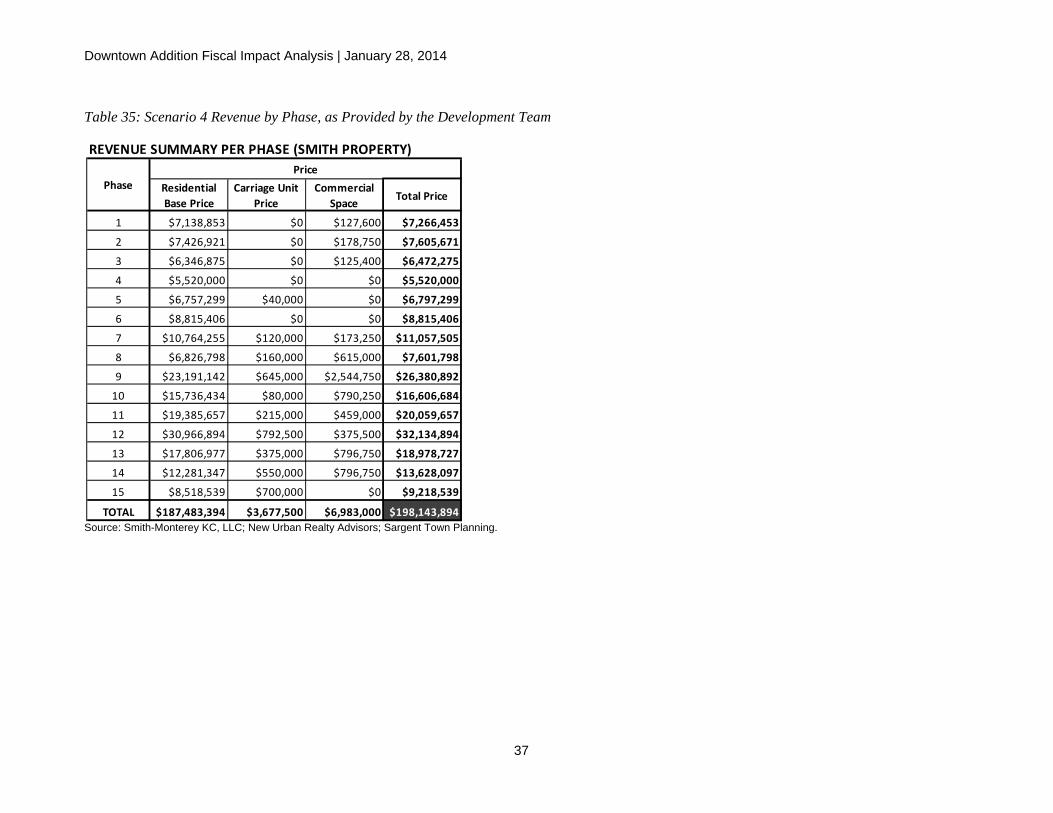
Downtown Addition Fiscal Impact Analysis | January 28, 2014
37
Table 35: Scenario 4 Revenue by Phase, as Provided by the Development Team
Source: Smith-Monterey KC, LLC; New Urban Realty Advisors; Sargent Town Planning.
REVENUE SUMMARY PER PHASE (SMITH PROPERTY)
Residential Base Price
Carriage Unit Price
Commercial Space Total Price
1 $7,138,853 $0 $127,600 $7,266,453
2 $7,426,921 $0 $178,750 $7,605,671
3 $6,346,875 $0 $125,400 $6,472,275
4 $5,520,000 $0 $0 $5,520,000
5 $6,757,299 $40,000 $0 $6,797,299
6 $8,815,406 $0 $0 $8,815,406
7 $10,764,255 $120,000 $173,250 $11,057,505
8 $6,826,798 $160,000 $615,000 $7,601,798
9 $23,191,142 $645,000 $2,544,750 $26,380,892
10 $15,736,434 $80,000 $790,250 $16,606,684
11 $19,385,657 $215,000 $459,000 $20,059,657
12 $30,966,894 $792,500 $375,500 $32,134,894
13 $17,806,977 $375,000 $796,750 $18,978,727
14 $12,281,347 $550,000 $796,750 $13,628,097
15 $8,518,539 $700,000 $0 $9,218,539
TOTAL $187,483,394 $3,677,500 $6,983,000 $198,143,894
PhasePrice

Downtown Addition Fiscal Impact Analysis | January 28, 2014
38
Appendix C: Condition of Approval 28 (Fiscal Neutrality) has been removed as a result of the 2020 Specific Plan Amendments.lishment of Districts, Associationsand or other
gis1
Typewritten Text
gis1
Typewritten Text
gis1
Typewritten Text
gis1
Typewritten Text
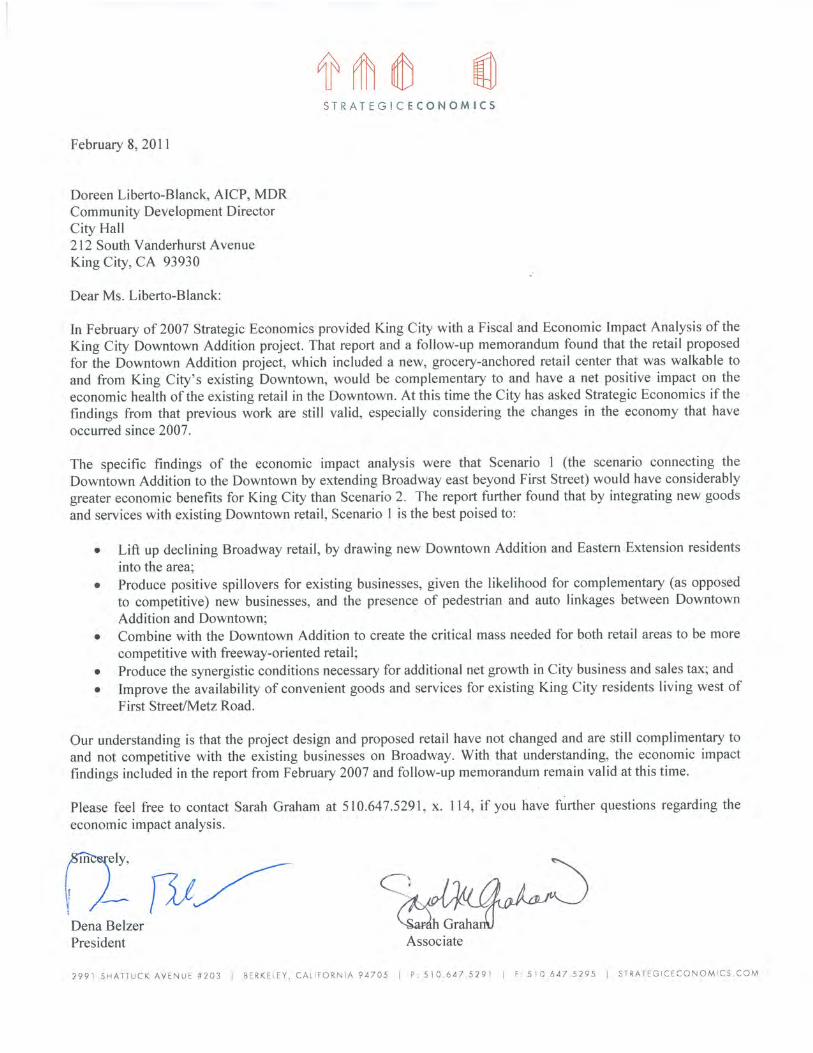

This page intentionally left blank.
Date: May 22, 2007
To: Michael Powers – City of King City
John Baucke – New Urban Realty Advisors, Inc.
From: Robert Hickey – Strategic Economics
Subject: Revised Fiscal and Economic Impact Analysis
At the request of King City staff, Strategic Economics refined its fiscal analysis for Downtown Addition based on input and suggestions from staff, and conducted additional research on what it will take to ensure new retail compliments existing Broadway businesses. This memo summarizes the results of this analysis and research.
Revised Fiscal Analysis
Issues Addressed
The most significant change to the fiscal impact analysis was to revise assumptions about additional public service costs that would be triggered by the proposed Downtown Addition development.
1) Change the base year for expenditure analysis from FY 2005-06 to FY 2002-03.
In previous analysis, Strategic Economics had used FY 2005-06 as the base year for estimatingexpenditure needs for such services as Police, Fire, Parks and Public Works. King City staffasked that FY 2002-03 be used instead, in order to better represent a “normal” year for the City inwhich expenditures were less constrained by the recent fiscal crisis. The fiscal analysisincorporates this change, with costs inflated to current dollars.
MEMORANDUM
-2-
2) Anticipate a higher annual growth rate in salary and benefit costs.
In previous analysis, Strategic Economics inflated service costs from a base year onward using adifferential rate – 2.5 percent for non-salary costs (such as police vehicles and road resurfacingmaterials) and 4.0 percent for salary costs (including health and other benefits).
King City staff asked that the annual inflation rate for salary costs be increased to 8-9 percent, tobetter reflect the escalating costs of health insurance and workman’s compensation, in addition toregular promotions.
Strategic Economics conducted a case study of changing Patrol and Field Operation labor costsbetween 1997 and 2006 to determine if an 8-9 percent growth rate could be substantiated. ThePolice Department employed a constant 13 officers during this time period, making costcomparisons possible.
SE found that salary and benefits per officer increased at an annual growth rate of 7.63 percentbetween FY 2001 and FY 2006 (6.92 percent between FY 1997 and 2006). A labor cost growthrate of 8.0 percent over the next 10 years would be a supportable assumption for PoliceDepartment employees. But this appears to be an overly aggressive assumption for non-policestaff, who do not currently receive as great a yearly increase in salary costs (3.5 percent vs. 5percent for police department staff). Accordingly, a rate of 6.5 percent was used for non-Policestaff for this round of fiscal analysis.
Table 1: Patrol and Field Operation Costs (FY 1997-2006), City of King City
Fiscal Year 2001 2002 2003 2004 2005 2006 Total Salary/Benefit Costs $860,037 $863,904 $1,050,751 $983,682 $926,658 $1,242,344 Officers 13 13 13 13 13 13
Annual Growth Rate (2001-2006) – 7.63%
Sources: City of King City, CA Department of Finance.
3) Broaden and revise the road maintenance cost analysis.
Staff raised three concerns about the cost estimates used in the previous analysis for maintainingnew Downtown Addition streets.
First, staff asked Strategic Economics to examine the impact of new road maintenanceexpenditures on not just the General Fund, but also other special funds dedicated totransportation-related maintenance. King City staff argued that it is inaccurate to focusexclusively on General Fund expenditures when analyzing street and sidewalk maintenance costs,since much of these expenses are handled by special, dedicated funds.
Second, staff noted that some maintenance happens on a less-than-annual basis, meaning thatchoosing a single fiscal year to represent typical expenditure need can be very difficult.
-3-
Third, staff argued that street maintenance cost estimates shouldn’t overlook the additional workload that road maintenance projects generate for Public Works staff – even when actual maintenance costs are covered by General Fund or dedicated funds.
To respond to these concerns, Strategic Economics revised its street maintenance cost estimate as follows:
• Since pavement maintenance is the primary form of street-related maintenance that is notconducted on a yearly basis, Strategic Economics consulted City engineer Octavio Hurtado toestimate pavement maintenance costs on an annualized per-square-foot basis (rather thanlook at actual expenditures from a given fiscal year). Other road maintenance costs – streetlights, trees, landscaping and street cleaning – were estimated as before, using actual, per-mile expenditures recorded in FY 2002-03.
• To develop a fuller picture of ongoing street-related costs, SE looked at expenditures madefrom the City’s Local Transportation Fund, State Gasoline Tax Fund and AB 2928/Prop 42Fund (Funds 20, 22 and 26), in addition to the General Fund. Street lights, street trees,landscaping and street cleaning were funded exclusively by the General Fund in FY 2003.However, “street maintenance” costs were handled by multiple funds.
• To better account for the impact of new street maintenance projects on the Public Worksmanagement workload, SE increased from 10 to 33 percent the estimated portion of PublicWorks Administration costs deemed variable – i.e. directly affected by growth in population,employment or infrastructure.
• An attempt was made to project revenues for street maintenance costs from multiple sources,including the state gasoline tax, revenue allocated by the Transportation Authority ofMonterey County (LTF and RSTP funds), and future Prop 1B funds. However at presenttime, there is not yet adequate information available to develop reliable estimates for any ofthese sources. Consequently it will be difficult for now (if not misleading) to develop preciseestimates of any gap between street maintenance costs (estimated on an annualized, per-square-foot basis) and revenues.
Tables 2 and 3 contrast the new expenditure assumptions with those used in the previous fiscal analysis. For reasons described above, a significantly higher expenditure rate is now used for most service costs. However, the per-daytime-person cost of police services actually dropped using the FY 2002-03 base year – even after adjusting for eight percent annual inflation in salary costs, and increasing the variable cost percentage. This is due to much higher outlays in FY 2006, perhaps to make up for frozen pay levels and other deferred costs of prior years.
The largest jump in service costs occur for Street Maintenance and Public Works Administration expenses.
Many of the variable cost rates also increased. Recreation was an exception. The variable cost rate declined from 90 to 50 percent, based on a more careful examination of costs offset by user fees for this round of fiscal analysis.
-4-
Table 2: New Expenditure Assumptions (figures in 2007 dollars)
Service Category Annual Rate
per… Percent variable(reflected in rate)
Police $90.56 Daytime population
86%
Fire $11.78 Daytime population
64%
Parks $6,980 Park acre 100%Open Space $3,988 Open space
acre 100%
Street Trees, Lighting, Sweeping and Landscaping
$9,882 Road miles 100%
Pavement Maintenance $0.37 Square foot 100%
Total Street Maintenance (assuming 30ft. avg. road width)
$68,827 Road mile 100%
PW Admin $2.81 Daytime population
33%
Recreation $18.61 Capita 50%Government Admin $8.26 Capita 10% Planning and Building $3.24 Capita 10%
Table 3: Previous Expenditure Assumptions (figures in 2007 dollars)
Service Category Annual Rate
per… Percent variable(reflected in rate)
Police $112.03 Daytime population
79%
Fire $5.19 Daytime population
54%
Parks $5,384 Park acre 88%
Open Space $3,076 Open space acre
88%
Total Street Maintenance $1,253 Road miles 100%
PW Admin $0.24 Daytime population
10%
Recreation $10.99 Capita 90%
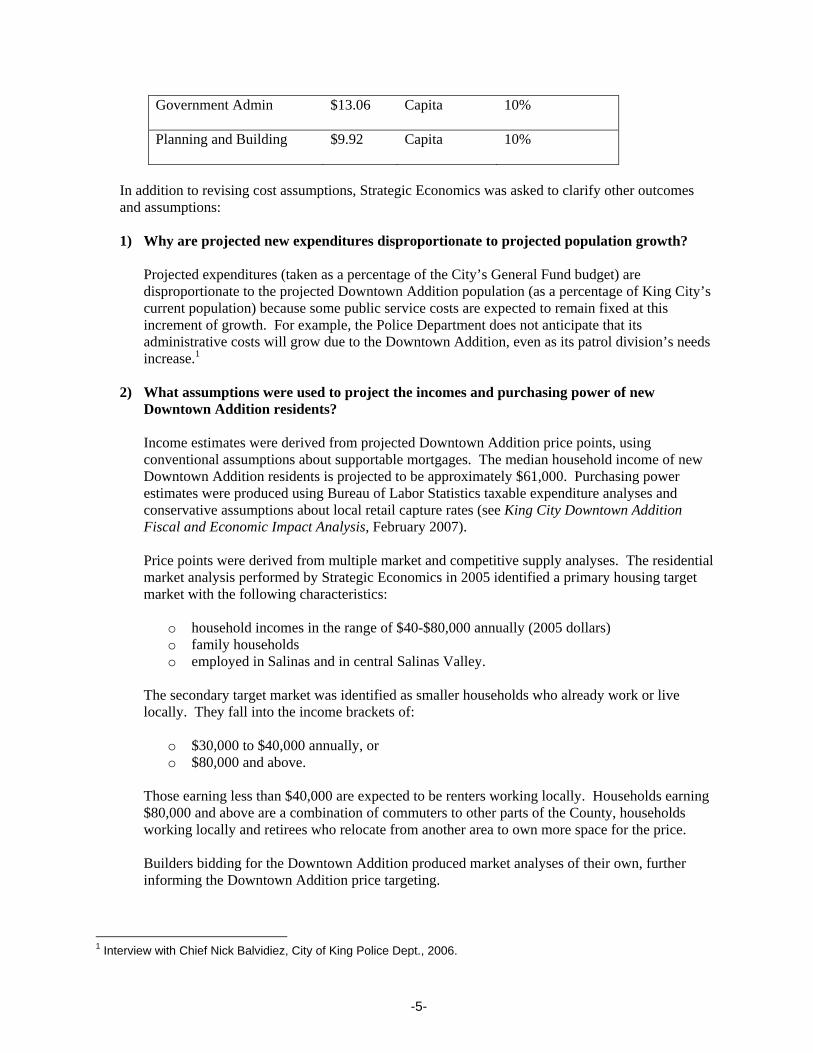
-5-
Government Admin $13.06 Capita 10%
Planning and Building $9.92 Capita 10%
In addition to revising cost assumptions, Strategic Economics was asked to clarify other outcomes and assumptions:
1) Why are projected new expenditures disproportionate to projected population growth?
Projected expenditures (taken as a percentage of the City’s General Fund budget) aredisproportionate to the projected Downtown Addition population (as a percentage of King City’scurrent population) because some public service costs are expected to remain fixed at thisincrement of growth. For example, the Police Department does not anticipate that itsadministrative costs will grow due to the Downtown Addition, even as its patrol division’s needsincrease.1
2) What assumptions were used to project the incomes and purchasing power of newDowntown Addition residents?
Income estimates were derived from projected Downtown Addition price points, usingconventional assumptions about supportable mortgages. The median household income of newDowntown Addition residents is projected to be approximately $61,000. Purchasing powerestimates were produced using Bureau of Labor Statistics taxable expenditure analyses andconservative assumptions about local retail capture rates (see King City Downtown AdditionFiscal and Economic Impact Analysis, February 2007).
Price points were derived from multiple market and competitive supply analyses. The residentialmarket analysis performed by Strategic Economics in 2005 identified a primary housing targetmarket with the following characteristics:
o household incomes in the range of $40-$80,000 annually (2005 dollars)o family householdso employed in Salinas and in central Salinas Valley.
The secondary target market was identified as smaller households who already work or live locally. They fall into the income brackets of:
o $30,000 to $40,000 annually, oro $80,000 and above.
Those earning less than $40,000 are expected to be renters working locally. Households earning $80,000 and above are a combination of commuters to other parts of the County, households working locally and retirees who relocate from another area to own more space for the price.
Builders bidding for the Downtown Addition produced market analyses of their own, further informing the Downtown Addition price targeting.
1 Interview with Chief Nick Balvidiez, City of King Police Dept., 2006.
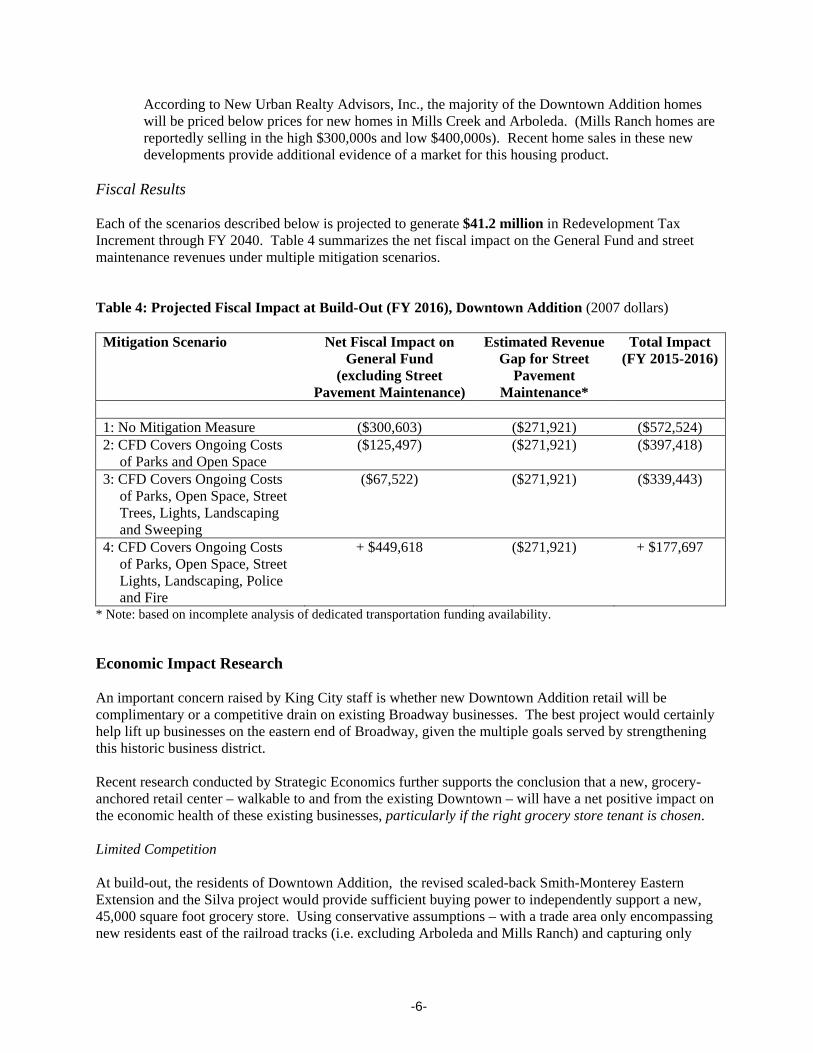
-6-
According to New Urban Realty Advisors, Inc., the majority of the Downtown Addition homes will be priced below prices for new homes in Mills Creek and Arboleda. (Mills Ranch homes are reportedly selling in the high $300,000s and low $400,000s). Recent home sales in these new developments provide additional evidence of a market for this housing product.
Fiscal Results
Each of the scenarios described below is projected to generate $41.2 million in Redevelopment Tax Increment through FY 2040. Table 4 summarizes the net fiscal impact on the General Fund and street maintenance revenues under multiple mitigation scenarios.
Table 4: Projected Fiscal Impact at Build-Out (FY 2016), Downtown Addition (2007 dollars)
Mitigation Scenario Net Fiscal Impact on General Fund
(excluding Street Pavement Maintenance)
Estimated Revenue Gap for Street
Pavement Maintenance*
Total Impact (FY 2015-2016)
1: No Mitigation Measure ($300,603) ($271,921) ($572,524)2: CFD Covers Ongoing Costs
of Parks and Open Space ($125,497) ($271,921) ($397,418)
3: CFD Covers Ongoing Costs of Parks, Open Space, Street Trees, Lights, Landscaping and Sweeping
($67,522) ($271,921) ($339,443)
4: CFD Covers Ongoing Costs of Parks, Open Space, Street Lights, Landscaping, Police and Fire
+ $449,618 ($271,921) + $177,697
* Note: based on incomplete analysis of dedicated transportation funding availability.
Economic Impact Research
An important concern raised by King City staff is whether new Downtown Addition retail will be complimentary or a competitive drain on existing Broadway businesses. The best project would certainly help lift up businesses on the eastern end of Broadway, given the multiple goals served by strengthening this historic business district.
Recent research conducted by Strategic Economics further supports the conclusion that a new, grocery-anchored retail center – walkable to and from the existing Downtown – will have a net positive impact on the economic health of these existing businesses, particularly if the right grocery store tenant is chosen.
Limited Competition
At build-out, the residents of Downtown Addition, the revised scaled-back Smith-Monterey Eastern Extension and the Silva project would provide sufficient buying power to independently support a new, 45,000 square foot grocery store. Using conservative assumptions – with a trade area only encompassing new residents east of the railroad tracks (i.e. excluding Arboleda and Mills Ranch) and capturing only
-7-
80% of household grocery store purchases – the supermarket would be expected to generate just over $18 million in annual sales. This would be sufficient for supporting over 50,000 square foot in GLA, using typical sales/sf targets for stores like Safeway.
Not only will it be unnecessary for this grocery to take customers from existing grocers on Broadway, but it is unlikely. Small, Latino-oriented grocers on Broadway offer a distinctive product mix that is not available at Safeway, Vons and similar stores that tend to locate in areas matching the Downtown Addition’s trade area and demographics. Nor do these larger grocery stores generally have the relationships with Latino shoppers or the product-line nimbleness of locally operated, employee-owned grocers.
Crucially, a predominantly Hispanic trade-area population tends to allow both chain and independent grocers to coexist in the same location. According to a recent study by the Chicago-based Food Marketing Institute, Hispanic shoppers are far more likely to frequent multiple grocery stores, since they generally have difficultly purchasing everything at one retailer. Eighty-two percent of non-Hispanic shoppers shop at one retailer for all of their groceries as compared to only 68 percent of Hispanic shoppers. Hispanic shoppers were also found to spend more on groceries than non-Hispanics -- $133 per week as compared to $92 per week. The discrepancy is attributed to their larger family size and greater inclination to eat at home.
Whether this ability to support multiple grocery stores will hold for King City depends on the choice of the grocery store tenant for the Downtown Addition. Latino-oriented, chain grocers – such as Publix Sabor, Fiesta Mart, Fiesta Foods, HEB and Vallarta Supermarkets – are showing growing ability to compete on prepared foods and other specialty groceries provided at independent, Hispanic grocers. It would be preferable, then, to lease with a grocer such as Vons, which offers a very different product mix.
Hispanic shoppers were also found to spend more on groceries on average than Non-Hispanics; $133 a week as compared to $92 a week. The discrepancy is attributed to their larger family size and greater inclination to eat at home.
Elaborating on Positive Spillovers
While locally appropriate, quantitative data on the sales revenue advantages of walkable retail districts is difficult to obtain, it has long been observed that “agglomeration” economies of scale come into play at retail centers where multiple shopping trips can be handled without having to park the car more than once. Grocery-anchored retail centers in particular have considerable spillover effects, because they generate so many trips from which nearby stores can benefit.
Of all retail uses, grocery stores generate the most trips per capita (69 trips per capita per year).2 In Hispanic communities, this trip generation impact is substantially greater. According to the Chicago-based Food Marketing Institute, Hispanic shoppers visit a grocery store 26 times a month –compared to 7 times a month for non-Hispanics. Placing a large grocery store near other businesses that benefit from foot traffic can have a substantial, positive impact on smaller businesses that struggle to generate high numbers of trips on their own, particularly in a city like King City with a large Hispanic population.
The Downtown Addition’s other retail tenants are expected to include a mix of routine, household-serving businesses, such as a dry cleaner, and small restaurants that offer different cuisine than the Grill and
2 www.usda.gov/foodretailing
-8-
Broadway’s current mix of low-priced Mexican restaurants and pizza offerings. These are not expected to directly compete with existing Broadway businesses.
The integration of new and existing retail along an extended Broadway holds the promise of creating sufficient “critical mass” at the eastern edge of Broadway to reorient some shopping patterns eastward. It is difficult, however, to demonstrate whether this would result in a net boost for the City, given the likelihood that existing residents’ disposable income is likely to stay fixed and merely be divided up somewhat more evenly among retail districts. Additional restaurants in the Downtown Addition could help capture more sales tax revenue that presently leaks outside the City, resulting in a net gain for the City. But it is too soon to say whether specialty retailers would also be drawn to the Downtown Addition in sufficient number to make a significant difference on sales leakage for that retail category.
King City Downtown Addition Fiscal and Economic Impact Analysis
February 19, 2007
Prepared for:
King City
On behalf of:
Smith-Monterey, LLC New Urban Realty Advisors, Inc.

This page intentionally left blank.
I. EXECUTIVE SUMMARY
The King City Downtown Addition Specific Plan proposes a mixed-use neighborhood northeast of First Street, between Bitterwater Road and San Lorenzo Creek. This memo compares the fiscal and economic impacts of two development scenarios for the Downtown Addition – the proposed scenario (Scenario 1) and an alternate scenario (Scenario 2), in which neither Broadway nor any other road connects the Downtown Addition to Downtown.
Scenario 1 Proposed development of the Downtown Addition would phase in 650 housing units, 125,000 square feet of retail and just over 65,000 square feet of live/work commercial space over nine years, with complete build-out by FY 2016. Employing best practices of New Urbanism, the Downtown Addition would revive the historical, traditional neighborhood street pattern established by the Spreckel’s Sugar Company Official Map in 1908. The neighborhood would encourage walking, and integrate new stores and restaurants with existing retail in the Downtown by extending Broadway east beyond First Street. The Downtown Addition would also create 17 acres of recreational open space and greenway, and an additional six acres of neighborhood parks. The cost of maintaining these parks and open space would be covered by a new Landscaping and Lighting Assessment District.
Scenario 2 An alternate development scenario – prepared for CEQA review of the Downtown Addition – would eliminate Broadway’s extension across First Street, curtailing road access to the project and separating the project’s new commercial development from Downtown retail. Total housing units would remain constant under this scenario, but the new traffic pattern would significantly affect the market potential of the project’s retail, shifting it to the intersection of Bitterwater and East San Antonio Road, and dramatically scaling back its size to 12,000 square feet. Scenario 2 also has a different housing product mix, with significantly more apartment units. As with Scenario 1, the cost of maintaining new parks and open space would be covered by a Landscaping and Lighting Assessment District.
Table E1: Downtown Addition Development at Build-Out (FY 2016) – Scenarios 1 and 2 SCENARIO 1 SCENARIO 2
Residential 650 units 650 units Single-family detached 175 units 207 units Single-family attached 346 units 327 units Multifamily (rental) 8 units 104 units
Mixed use (condo over retail) 121 units 12 units
Commercial 190,060 sf 25,500 sf Retail 125,000 sf 10,000 sf Live/Work commercial space 65,060 sf 15,500 sf
Park/Open Space 23.1 acres 23.1 acres Neighborhood and community park 13.7 acres 13.7 acres Open space 9.4 acres 9.4 acres
Total Estimated Daytime Population 2609 daytime persons 2564 daytime persons Residential 2526 residents 2556 residents Commercial 83 employees (1) 8 employees (1)
(1) Daytime population is calculated by summing total residents and one third of total employees.
Sources: Smith-Monterey LLC, Strategic Economics.
King City Downtown Addition -- Fiscal Impact Analysis February 19, 2007
1
COMPARING FISCAL IMPACTS
Development Scenarios 1 and 2 differ both in their impact on King City’s General Fund, and in the quantity of property tax increment generated for the City Redevelopment Project Area. Since the Downtown Addition falls within Redevelopment Project Area boundaries, all property tax revenues will be retained by the King City Community Development Agency for expenditure within the Project Area, given the City’s new Redevelopment tax increment (TI) cap of $400m, through FY 2040.1
The impacts of Scenarios 1 and 2 are summarized in Table 2 below.
Table E2: Fiscal Impacts of Alternate Development Scenarios for the Downtown Addition
Scenario General Fund Impact at Build-Out: FY 2016
(2007 dollars)
Redevelopment Tax Increment Generated
through FY 2040 (2007 dollars)
1. Original Configuration(Broadway extendedacross First Street) + $48,085 $41.2 million
2. Alternate Configuration(no Broadway extension) - $119,308 $39.2 million
Sources: Strategic Economics, Urban Analytics LLC.
While Scenario 1 will have a positive impact at build-out (FY 2016), assuming the creation of a Landscape and Lighting Assessment District for new parks, Scenario 2’s impact would be negative. This difference stems almost entirely from Scenario 1’s additional retail, and therefore greater sales tax revenue. There are several reasons for Scenario 1’s stronger ability to support retail, including:
(1) broader accessibility and convenience for existing residents, particularly those looking to combine shopping errands in the commute trip home;
(2) stronger ability to compete for a grocery store anchor, which in turn draws multiple retail tenants into a concentrated shopping center, where stores can reap synergies from co-location;
(3) potential to contribute to and benefit from a pedestrian-oriented “Main Street” retail environment, where customers are often persuaded to linger longer and spend more; and
(4) appeal to restaurants and specialty retailers like small furniture stores, who are demonstrating preference for “Main Street” locations (particularly near new residential development).
While Scenario 1 incurs slightly greater service costs, particularly police costs due to its additional daytime population, these costs are more than made up for by additional sales tax revenue.
Looking at impacts on the King City Redevelopment Area, Scenario 1 is expected to generate $41.2 million in property tax increment over the life of the Project Area.2 This is $2 million more than under Scenario 2, in large part due to Scenario 1’s greater commercial property tax.
1 This also assumes, conservatively, that the City does not opt to receive an “AB 1290” property tax pass-through from development within the Project Area. Should the City opt to receive this pass-through, the impact of Scenario 1 development on the City’s General Fund is considerably more positive, while Scenario 2 remains negative. 2 The King City Redevelopment Project Area is projected to generate property tax increment through FY 2040, after which the Area will reach its $400 million cap, and property tax revenues will again flow to the City’s General Fund.
King City Downtown Addition -- Fiscal Impact Analysis 2 February 19, 2007
King City Downtown Addition -- Fiscal Impact Analysis 3 February 19, 2007
COMPARING ECONOMIC IMPACTS
Scenarios 1 and 2 differ most in the impacts they will have on the city’s overall economy and retail sector. Two of King City’s primary economic development goals are (1) “to retain [the] city’s role as the retail hub of the South County,” and (2) “integrating new retail commercial development with the existing local retail centers”3 Evaluated in light of these goals, as well as a third criterion – (3) the ability to improve the availability of goods and services for existing King City residents – Scenario 1 is the clearly preferable configuration for King City.
Scenario 1 presents an opportunity to positively impact existing, underperforming retail along the Broadway commercial corridor, build a critical mass of retail in Downtown, and better serve residents living west of First Street. In contrast, Scenario 2 is not expected to have a substantial positive impact on other city retail, makes new retail inconvenient to most existing residents, and wastes an opportunity to capture the retail spending power of several thousand new residents to invigorate the existing Downtown.
While home to many specialty stores catering to a regional Hispanic customer base, King City’s Downtown Broadway commercial strip has been slowly declining for many years. Property values have been stagnant for more than a decade, increasing only at the rate of inflation.4 By integrating new goods and services with existing Broadway retail, Scenario 1 is the best poised to:
• Lift up declining Broadway retail, by drawing new Downtown Addition and Eastern Extensionresidents into the area;
• Produce positive spillovers for existing businesses, given the potential for complementary (asopposed to competitive) new businesses, and the presence of pedestrian and auto linkagesbetween Downtown Addition and Downtown;
• Combine with the Downtown Addition to create the critical mass needed for both retail areas tobe more competitive with freeway-oriented retail;
• Produce the synergistic conditions necessary for additional net growth in City business and salestax; and
• Improve the availability of convenient goods and services for existing King City residents livingwest of First Street/Metz Road.
3 King City General Plan Economic Development Element, 1998, p.8. 4 Keyser Marston Associates, Preliminary Report for the Third Amendment to the Redevelopment Plan, 9/2006, p.19.
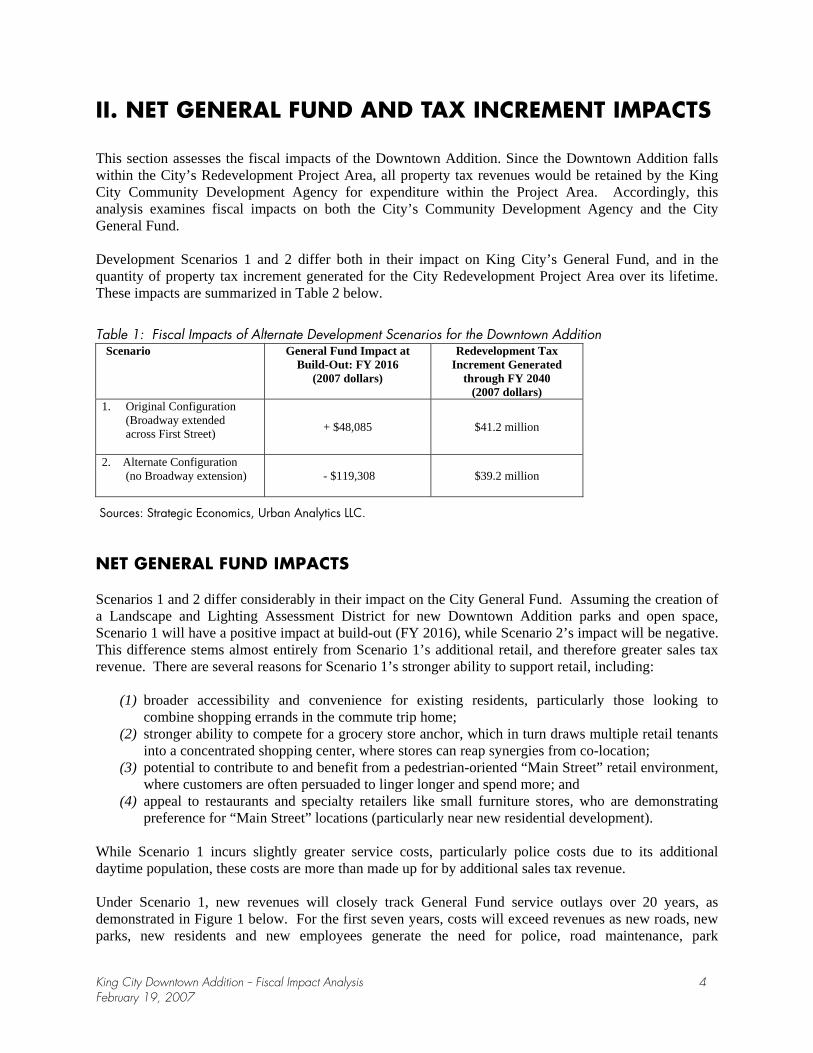
II. NET GENERAL FUND AND TAX INCREMENT IMPACTS
This section assesses the fiscal impacts of the Downtown Addition. Since the Downtown Addition falls within the City’s Redevelopment Project Area, all property tax revenues would be retained by the King City Community Development Agency for expenditure within the Project Area. Accordingly, this analysis examines fiscal impacts on both the City’s Community Development Agency and the City General Fund.
Development Scenarios 1 and 2 differ both in their impact on King City’s General Fund, and in the quantity of property tax increment generated for the City Redevelopment Project Area over its lifetime. These impacts are summarized in Table 2 below.
Table 1: Fiscal Impacts of Alternate Development Scenarios for the Downtown Addition
Scenario General Fund Impact at Build-Out: FY 2016
(2007 dollars)
Redevelopment Tax Increment Generated
through FY 2040 (2007 dollars)
1. Original Configuration(Broadway extendedacross First Street) + $48,085 $41.2 million
2. Alternate Configuration(no Broadway extension) - $119,308 $39.2 million
Sources: Strategic Economics, Urban Analytics LLC.
NET GENERAL FUND IMPACTS
Scenarios 1 and 2 differ considerably in their impact on the City General Fund. Assuming the creation of a Landscape and Lighting Assessment District for new Downtown Addition parks and open space, Scenario 1 will have a positive impact at build-out (FY 2016), while Scenario 2’s impact will be negative. This difference stems almost entirely from Scenario 1’s additional retail, and therefore greater sales tax revenue. There are several reasons for Scenario 1’s stronger ability to support retail, including:
(1) broader accessibility and convenience for existing residents, particularly those looking to combine shopping errands in the commute trip home;
(2) stronger ability to compete for a grocery store anchor, which in turn draws multiple retail tenants into a concentrated shopping center, where stores can reap synergies from co-location;
(3) potential to contribute to and benefit from a pedestrian-oriented “Main Street” retail environment, where customers are often persuaded to linger longer and spend more; and
(4) appeal to restaurants and specialty retailers like small furniture stores, who are demonstrating preference for “Main Street” locations (particularly near new residential development).
While Scenario 1 incurs slightly greater service costs, particularly police costs due to its additional daytime population, these costs are more than made up for by additional sales tax revenue.
Under Scenario 1, new revenues will closely track General Fund service outlays over 20 years, as demonstrated in Figure 1 below. For the first seven years, costs will exceed revenues as new roads, new parks, new residents and new employees generate the need for police, road maintenance, park
King City Downtown Addition -- Fiscal Impact Analysis 4 February 19, 2007
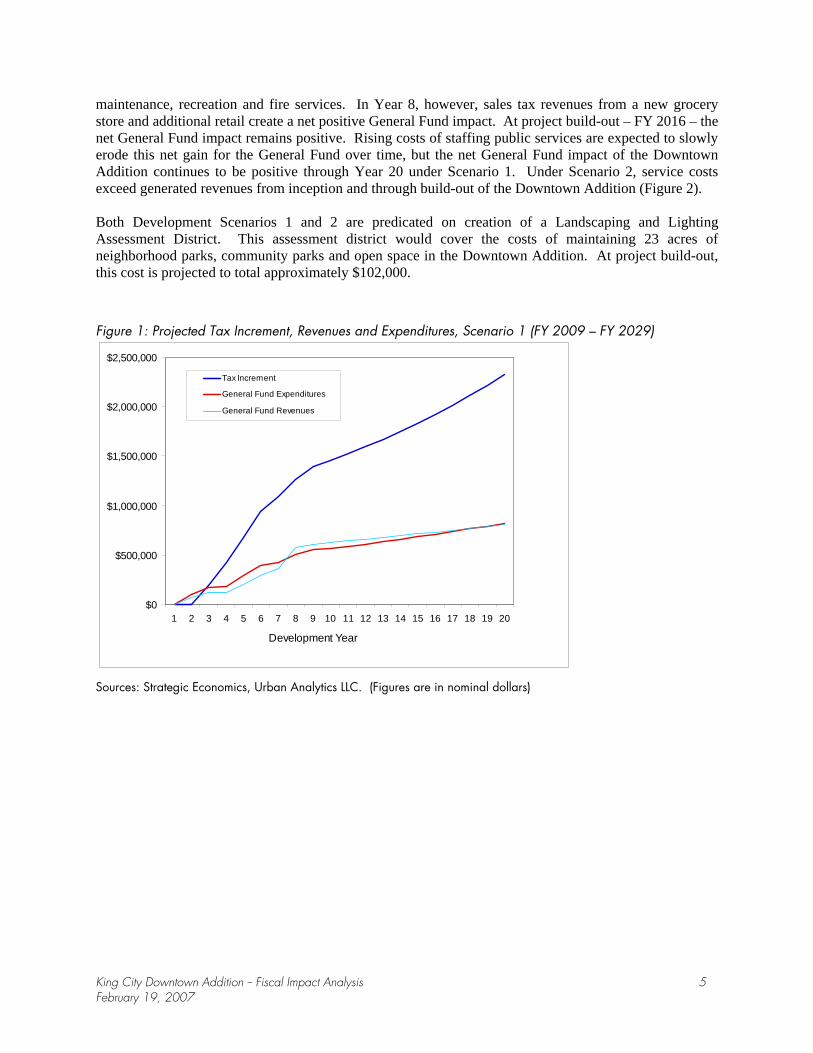
maintenance, recreation and fire services. In Year 8, however, sales tax revenues from a new grocery store and additional retail create a net positive General Fund impact. At project build-out – FY 2016 – the net General Fund impact remains positive. Rising costs of staffing public services are expected to slowly erode this net gain for the General Fund over time, but the net General Fund impact of the Downtown Addition continues to be positive through Year 20 under Scenario 1. Under Scenario 2, service costs exceed generated revenues from inception and through build-out of the Downtown Addition (Figure 2).
Both Development Scenarios 1 and 2 are predicated on creation of a Landscaping and Lighting Assessment District. This assessment district would cover the costs of maintaining 23 acres of neighborhood parks, community parks and open space in the Downtown Addition. At project build-out, this cost is projected to total approximately $102,000.
Figure 1: Projected Tax Increment, Revenues and Expenditures, Scenario 1 (FY 2009 – FY 2029)
$0
$500,000
$1,000,000
$1,500,000
$2,000,000
$2,500,000
1 2 3 4 5 6 7 8 9 10 11 12 13 14 15 16 17 18 19 20
Tax Increment
General Fund Expenditures
General Fund Revenues
Development Year
Sources: Strategic Economics, Urban Analytics LLC. (Figures are in nominal dollars)
King City Downtown Addition -- Fiscal Impact Analysis 5 February 19, 2007
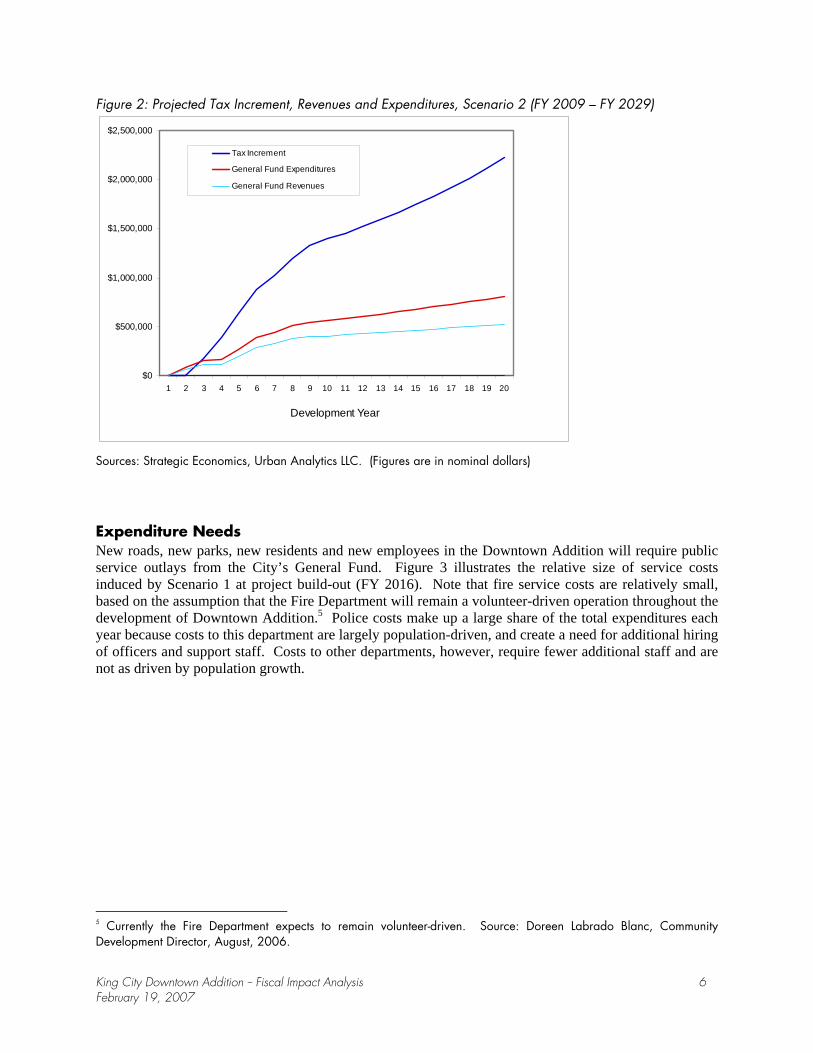
Figure 2: Projected Tax Increment, Revenues and Expenditures, Scenario 2 (FY 2009 – FY 2029)
$0
$500,000
$1,000,000
$1,500,000
$2,000,000
$2,500,000
1 2 3 4 5 6 7 8 9 10 11 12 13 14 15 16 17 18 19 20
Tax Increment
General Fund Expenditures
General Fund Revenues
Development Year
Sources: Strategic Economics, Urban Analytics LLC. (Figures are in nominal dollars)
Expenditure Needs New roads, new parks, new residents and new employees in the Downtown Addition will require public service outlays from the City’s General Fund. Figure 3 illustrates the relative size of service costs induced by Scenario 1 at project build-out (FY 2016). Note that fire service costs are relatively small, based on the assumption that the Fire Department will remain a volunteer-driven operation throughout the development of Downtown Addition.5 Police costs make up a large share of the total expenditures each year because costs to this department are largely population-driven, and create a need for additional hiring of officers and support staff. Costs to other departments, however, require fewer additional staff and are not as driven by population growth.
5 Currently the Fire Department expects to remain volunteer-driven. Source: Doreen Labrado Blanc, Community Development Director, August, 2006.
King City Downtown Addition -- Fiscal Impact Analysis 6 February 19, 2007
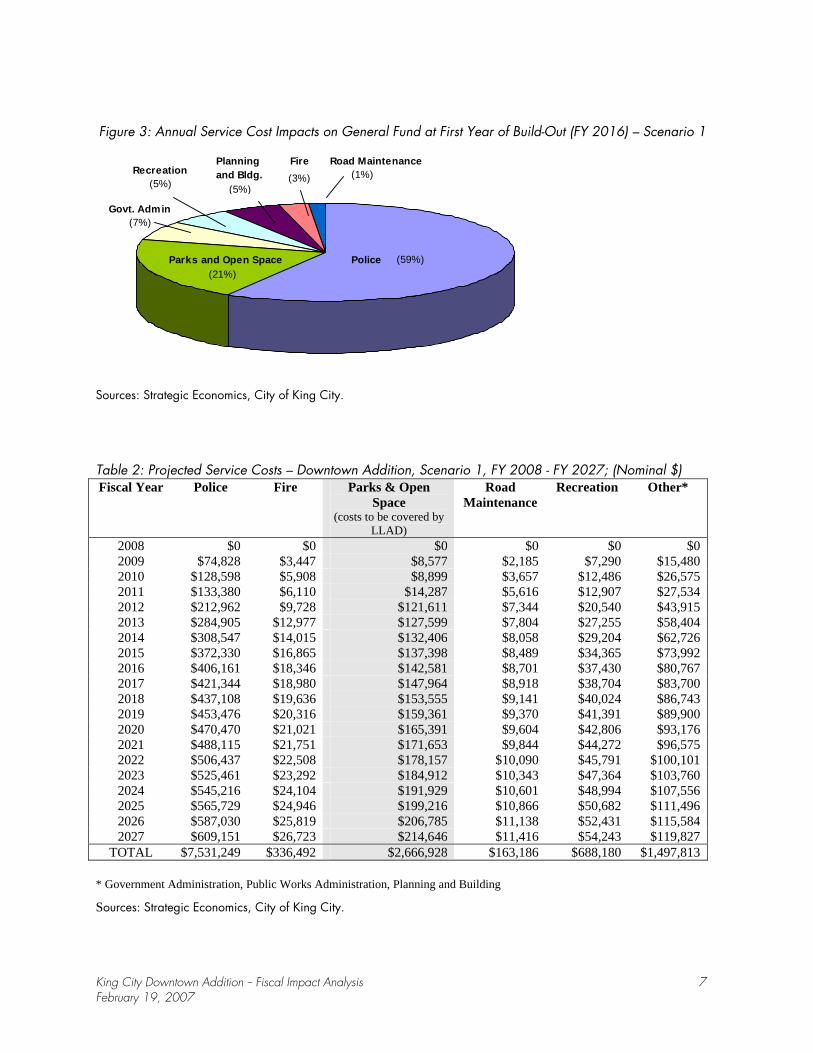
Figure 3: Annual Service Cost Impacts on General Fund at First Year of Build-Out (FY 2016) – Scenario 1
Police Parks and Open Space
Recreation (5%)
Road MaintenanceFire
(59%)(21%)
(3%) (1%)
Govt. Admin(7%)
Planningand Bldg.
(5%)
Sources: Strategic Economics, City of King City.
Table 2: Projected Service Costs – Downtown Addition, Scenario 1, FY 2008 - FY 2027; (Nominal $) Fiscal Year Police Fire Parks & Open
Space (costs to be covered by
LLAD)
Road Maintenance
Recreation Other*
2008 $0 $0 $0 $0 $0 $02009 $74,828 $3,447 $8,577 $2,185 $7,290 $15,480 2010 $128,598 $5,908 $8,899 $3,657 $12,486 $26,575 2011 $133,380 $6,110 $14,287 $5,616 $12,907 $27,534 2012 $212,962 $9,728 $121,611 $7,344 $20,540 $43,915 2013 $284,905 $12,977 $127,599 $7,804 $27,255 $58,404 2014 $308,547 $14,015 $132,406 $8,058 $29,204 $62,726 2015 $372,330 $16,865 $137,398 $8,489 $34,365 $73,992 2016 $406,161 $18,346 $142,581 $8,701 $37,430 $80,767 2017 $421,344 $18,980 $147,964 $8,918 $38,704 $83,700 2018 $437,108 $19,636 $153,555 $9,141 $40,024 $86,743 2019 $453,476 $20,316 $159,361 $9,370 $41,391 $89,900 2020 $470,470 $21,021 $165,391 $9,604 $42,806 $93,176 2021 $488,115 $21,751 $171,653 $9,844 $44,272 $96,575 2022 $506,437 $22,508 $178,157 $10,090 $45,791 $100,101 2023 $525,461 $23,292 $184,912 $10,343 $47,364 $103,760 2024 $545,216 $24,104 $191,929 $10,601 $48,994 $107,556 2025 $565,729 $24,946 $199,216 $10,866 $50,682 $111,496 2026 $587,030 $25,819 $206,785 $11,138 $52,431 $115,584 2027 $609,151 $26,723 $214,646 $11,416 $54,243 $119,827
TOTAL $7,531,249 $336,492 $2,666,928 $163,186 $688,180 $1,497,813
* Government Administration, Public Works Administration, Planning and Building
Sources: Strategic Economics, City of King City.
King City Downtown Addition -- Fiscal Impact Analysis 7 February 19, 2007
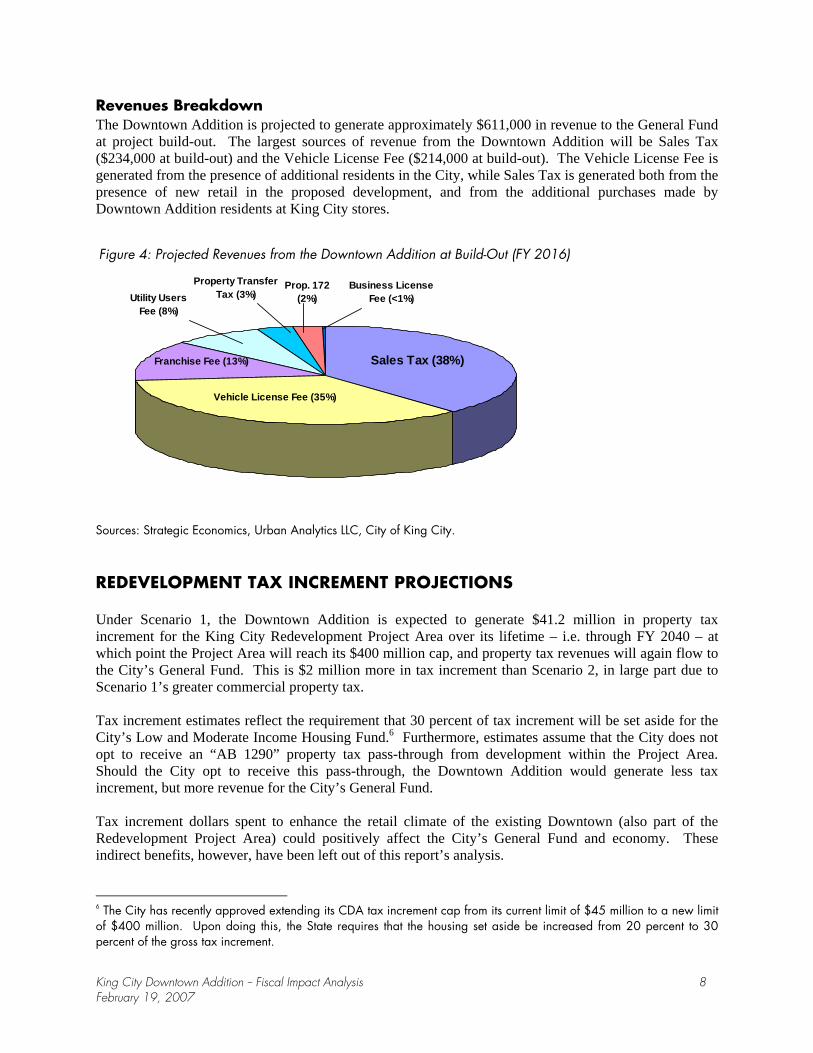
Revenues Breakdown The Downtown Addition is projected to generate approximately $611,000 in revenue to the General Fund at project build-out. The largest sources of revenue from the Downtown Addition will be Sales Tax ($234,000 at build-out) and the Vehicle License Fee ($214,000 at build-out). The Vehicle License Fee is generated from the presence of additional residents in the City, while Sales Tax is generated both from the presence of new retail in the proposed development, and from the additional purchases made by Downtown Addition residents at King City stores.
Sales Tax (38%)
Vehicle License Fee (35%)
Franchise Fee (13%)
Utility UsersFee (8%)
Property TransferTax (3%)
Business LicenseFee (<1%)
Prop. 172(2%)
Figure 4: Projected Revenues from the Downtown Addition at Build-Out (FY 2016)
Sources: Strategic Economics, Urban Analytics LLC, City of King City.
REDEVELOPMENT TAX INCREMENT PROJECTIONS
Under Scenario 1, the Downtown Addition is expected to generate $41.2 million in property tax increment for the King City Redevelopment Project Area over its lifetime – i.e. through FY 2040 – at which point the Project Area will reach its $400 million cap, and property tax revenues will again flow to the City’s General Fund. This is $2 million more in tax increment than Scenario 2, in large part due to Scenario 1’s greater commercial property tax.
Tax increment estimates reflect the requirement that 30 percent of tax increment will be set aside for the City’s Low and Moderate Income Housing Fund.6 Furthermore, estimates assume that the City does not opt to receive an “AB 1290” property tax pass-through from development within the Project Area. Should the City opt to receive this pass-through, the Downtown Addition would generate less tax increment, but more revenue for the City’s General Fund.
Tax increment dollars spent to enhance the retail climate of the existing Downtown (also part of the Redevelopment Project Area) could positively affect the City’s General Fund and economy. These indirect benefits, however, have been left out of this report’s analysis.
6 The City has recently approved extending its CDA tax increment cap from its current limit of $45 million to a new limit of $400 million. Upon doing this, the State requires that the housing set aside be increased from 20 percent to 30 percent of the gross tax increment.
King City Downtown Addition -- Fiscal Impact Analysis 8 February 19, 2007
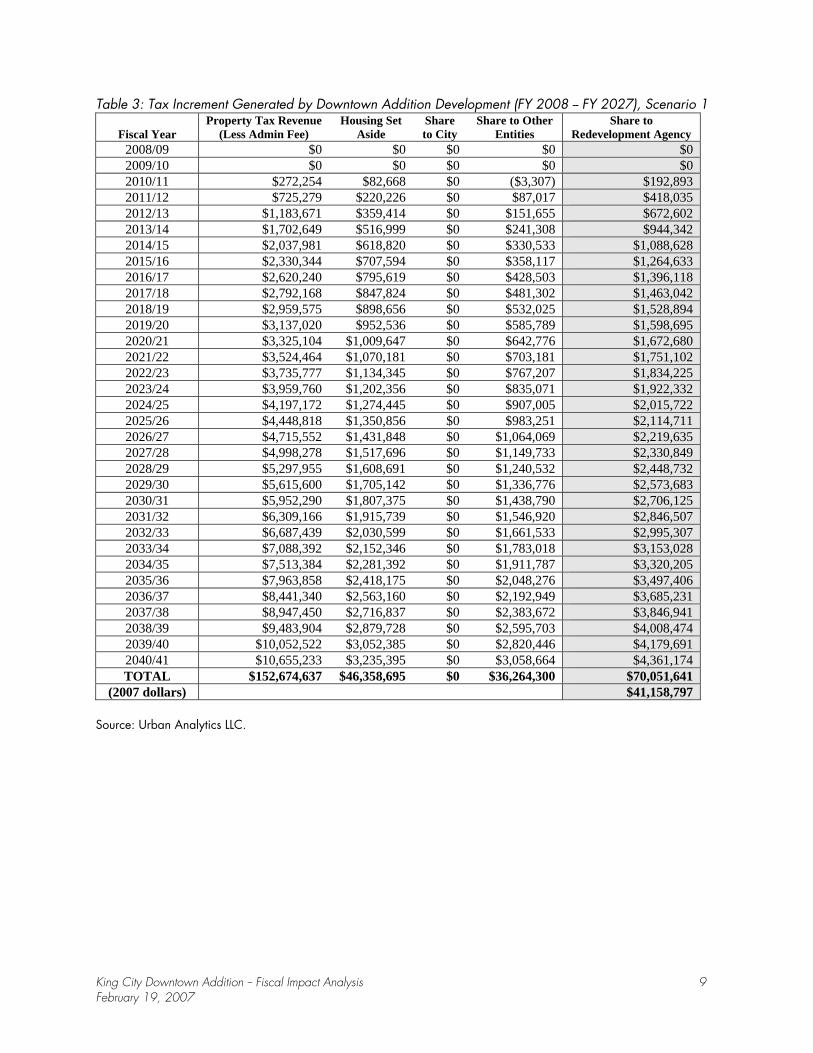
Table 3: Tax Increment Generated by Downtown Addition Development (FY 2008 -- FY 2027), Scenario 1
Fiscal Year Property Tax Revenue
(Less Admin Fee) Housing Set
Aside Share to City
Share to Other Entities
Share to Redevelopment Agency
2008/09 $0 $0 $0 $0 $0 2009/10 $0 $0 $0 $0 $0 2010/11 $272,254 $82,668 $0 ($3,307) $192,893 2011/12 $725,279 $220,226 $0 $87,017 $418,035 2012/13 $1,183,671 $359,414 $0 $151,655 $672,602 2013/14 $1,702,649 $516,999 $0 $241,308 $944,342 2014/15 $2,037,981 $618,820 $0 $330,533 $1,088,628 2015/16 $2,330,344 $707,594 $0 $358,117 $1,264,633 2016/17 $2,620,240 $795,619 $0 $428,503 $1,396,118 2017/18 $2,792,168 $847,824 $0 $481,302 $1,463,042 2018/19 $2,959,575 $898,656 $0 $532,025 $1,528,894 2019/20 $3,137,020 $952,536 $0 $585,789 $1,598,695 2020/21 $3,325,104 $1,009,647 $0 $642,776 $1,672,680 2021/22 $3,524,464 $1,070,181 $0 $703,181 $1,751,102 2022/23 $3,735,777 $1,134,345 $0 $767,207 $1,834,225 2023/24 $3,959,760 $1,202,356 $0 $835,071 $1,922,332 2024/25 $4,197,172 $1,274,445 $0 $907,005 $2,015,722 2025/26 $4,448,818 $1,350,856 $0 $983,251 $2,114,711 2026/27 $4,715,552 $1,431,848 $0 $1,064,069 $2,219,635 2027/28 $4,998,278 $1,517,696 $0 $1,149,733 $2,330,849 2028/29 $5,297,955 $1,608,691 $0 $1,240,532 $2,448,732 2029/30 $5,615,600 $1,705,142 $0 $1,336,776 $2,573,683 2030/31 $5,952,290 $1,807,375 $0 $1,438,790 $2,706,125 2031/32 $6,309,166 $1,915,739 $0 $1,546,920 $2,846,507 2032/33 $6,687,439 $2,030,599 $0 $1,661,533 $2,995,307 2033/34 $7,088,392 $2,152,346 $0 $1,783,018 $3,153,028 2034/35 $7,513,384 $2,281,392 $0 $1,911,787 $3,320,205 2035/36 $7,963,858 $2,418,175 $0 $2,048,276 $3,497,406 2036/37 $8,441,340 $2,563,160 $0 $2,192,949 $3,685,231 2037/38 $8,947,450 $2,716,837 $0 $2,383,672 $3,846,941 2038/39 $9,483,904 $2,879,728 $0 $2,595,703 $4,008,474 2039/40 $10,052,522 $3,052,385 $0 $2,820,446 $4,179,691 2040/41 $10,655,233 $3,235,395 $0 $3,058,664 $4,361,174 TOTAL $152,674,637 $46,358,695 $0 $36,264,300 $70,051,641
(2007 dollars) $41,158,797
Source: Urban Analytics LLC.
King City Downtown Addition -- Fiscal Impact Analysis 9 February 19, 2007
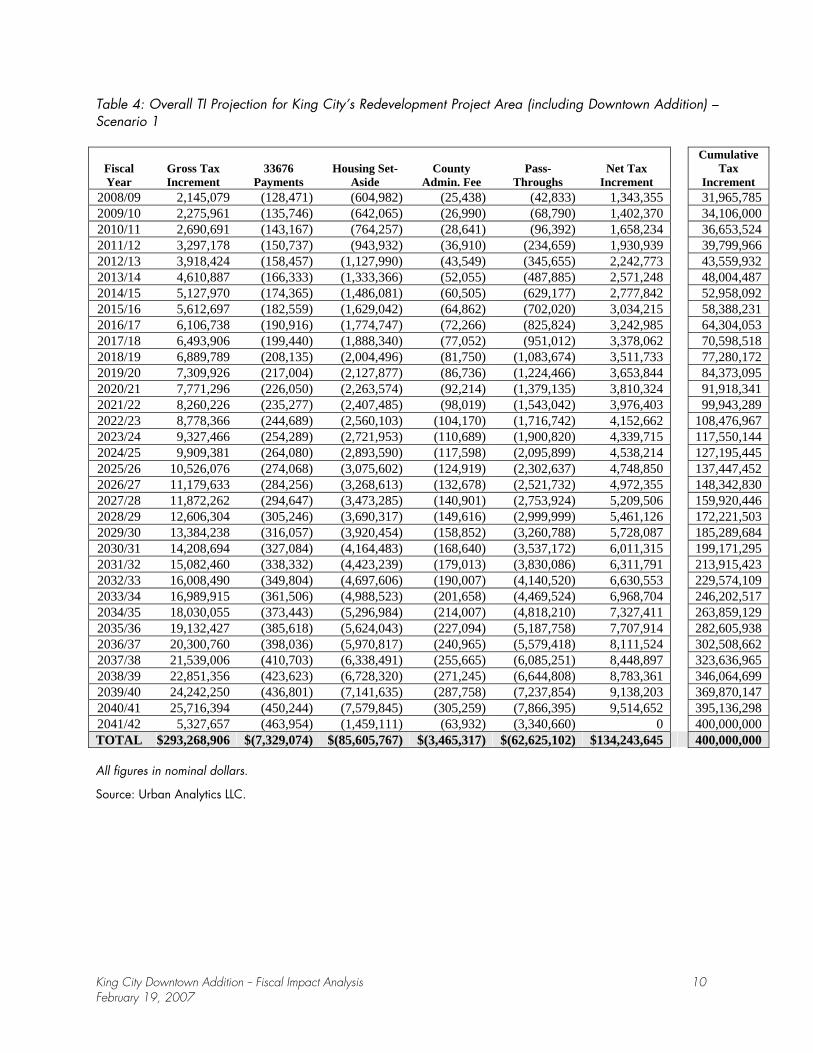
Table 4: Overall TI Projection for King City’s Redevelopment Project Area (including Downtown Addition) – Scenario 1
Fiscal Year
Gross Tax Increment
33676 Payments
Housing Set-Aside
County Admin. Fee
Pass-Throughs
Net Tax Increment
Cumulative Tax
Increment 2008/09 2,145,079 (128,471) (604,982) (25,438) (42,833) 1,343,355 31,965,785 2009/10 2,275,961 (135,746) (642,065) (26,990) (68,790) 1,402,370 34,106,000 2010/11 2,690,691 (143,167) (764,257) (28,641) (96,392) 1,658,234 36,653,524 2011/12 3,297,178 (150,737) (943,932) (36,910) (234,659) 1,930,939 39,799,966 2012/13 3,918,424 (158,457) (1,127,990) (43,549) (345,655) 2,242,773 43,559,932 2013/14 4,610,887 (166,333) (1,333,366) (52,055) (487,885) 2,571,248 48,004,487 2014/15 5,127,970 (174,365) (1,486,081) (60,505) (629,177) 2,777,842 52,958,092 2015/16 5,612,697 (182,559) (1,629,042) (64,862) (702,020) 3,034,215 58,388,231 2016/17 6,106,738 (190,916) (1,774,747) (72,266) (825,824) 3,242,985 64,304,053 2017/18 6,493,906 (199,440) (1,888,340) (77,052) (951,012) 3,378,062 70,598,518 2018/19 6,889,789 (208,135) (2,004,496) (81,750) (1,083,674) 3,511,733 77,280,172 2019/20 7,309,926 (217,004) (2,127,877) (86,736) (1,224,466) 3,653,844 84,373,095 2020/21 7,771,296 (226,050) (2,263,574) (92,214) (1,379,135) 3,810,324 91,918,341 2021/22 8,260,226 (235,277) (2,407,485) (98,019) (1,543,042) 3,976,403 99,943,289 2022/23 8,778,366 (244,689) (2,560,103) (104,170) (1,716,742) 4,152,662 108,476,967 2023/24 9,327,466 (254,289) (2,721,953) (110,689) (1,900,820) 4,339,715 117,550,144 2024/25 9,909,381 (264,080) (2,893,590) (117,598) (2,095,899) 4,538,214 127,195,445 2025/26 10,526,076 (274,068) (3,075,602) (124,919) (2,302,637) 4,748,850 137,447,452 2026/27 11,179,633 (284,256) (3,268,613) (132,678) (2,521,732) 4,972,355 148,342,830 2027/28 11,872,262 (294,647) (3,473,285) (140,901) (2,753,924) 5,209,506 159,920,446 2028/29 12,606,304 (305,246) (3,690,317) (149,616) (2,999,999) 5,461,126 172,221,503 2029/30 13,384,238 (316,057) (3,920,454) (158,852) (3,260,788) 5,728,087 185,289,684 2030/31 14,208,694 (327,084) (4,164,483) (168,640) (3,537,172) 6,011,315 199,171,295 2031/32 15,082,460 (338,332) (4,423,239) (179,013) (3,830,086) 6,311,791 213,915,423 2032/33 16,008,490 (349,804) (4,697,606) (190,007) (4,140,520) 6,630,553 229,574,109 2033/34 16,989,915 (361,506) (4,988,523) (201,658) (4,469,524) 6,968,704 246,202,517 2034/35 18,030,055 (373,443) (5,296,984) (214,007) (4,818,210) 7,327,411 263,859,129 2035/36 19,132,427 (385,618) (5,624,043) (227,094) (5,187,758) 7,707,914 282,605,938 2036/37 20,300,760 (398,036) (5,970,817) (240,965) (5,579,418) 8,111,524 302,508,662 2037/38 21,539,006 (410,703) (6,338,491) (255,665) (6,085,251) 8,448,897 323,636,965 2038/39 22,851,356 (423,623) (6,728,320) (271,245) (6,644,808) 8,783,361 346,064,699 2039/40 24,242,250 (436,801) (7,141,635) (287,758) (7,237,854) 9,138,203 369,870,147 2040/41 25,716,394 (450,244) (7,579,845) (305,259) (7,866,395) 9,514,652 395,136,298 2041/42 5,327,657 (463,954) (1,459,111) (63,932) (3,340,660) 0 400,000,000 TOTAL $293,268,906 $(7,329,074) $(85,605,767) $(3,465,317) $(62,625,102) $134,243,645 400,000,000
All figures in nominal dollars.
Source: Urban Analytics LLC.
King City Downtown Addition -- Fiscal Impact Analysis 10 February 19, 2007
III. ECONOMIC IMPACTS
Whether or not Broadway is extended has significant implications for King City’s Downtown and the City’s overall economy. Two of King City’s primary economic development goals are (1) “to retain [the] city’s role as the retail hub of the South County,” and (2) “integrating new retail commercial development with the existing local retail centers”7 Evaluated in light of these goals, as well as a third criterion – (3) the ability to improve the availability of goods and services for existing King City residents – Development Scenario 1 is the clearly preferable configuration for King City.
Scenario 1 presents an opportunity to positively impact existing, underperforming retail along the Broadway commercial corridor, build a critical mass of retail in Downtown, and better serve residents living west of First Street. In contrast, Scenario 2 is not expected to have a substantial positive impact on other city retail, makes new retail inconvenient to most existing residents, and wastes an opportunity to capture the retail spending power of several thousand new residents to invigorate the existing Downtown.
RECENT ECONOMIC FINDINGS IN DOWNTOWN KING CITY While home to many specialty stores catering to a regional Hispanic customer base, King City’s Downtown Broadway commercial strip has been slowly declining for many years. Property values have been stagnant for more than a decade, increasing only at the rate of inflation.8 Those retailers who are capable of paying higher rents are drawn to locations further west on Broadway and near Highway 101, where larger lots, substantial parking and highway visibility provide competitive advantages. The types of retailers that normally would be drawn to the pedestrian-oriented nature of the Downtown’s retail corridor – small specialty stores, restaurants, and entertainment venues – are dissuaded by the area’s small existing trade area and low average traffic counts, which fall below the rule-of-thumb threshold for sustaining retail businesses.9 Key informant interviews suggest Downtown Broadway businesses also struggle against ingrained shopping patterns of King City residents, who commonly frequent restaurants and entertainment venues elsewhere in the Salinas Valley and western towns in Monterey County.
CREATING CRITICAL MASS TO HELP DOWNTOWN COMPETE To reignite shopping in the Downtown, King City needs an infusion of new investment that generates increased foot traffic, including an anchor such as a grocery store and other daily retail. The Scenario 1 configuration for Downtown Addition provides the large parcels and integrated retail needed to draw these customer generators and create critical mass. Under Scenario 1, the Downtown Addition would provide up to 125,000 square feet of retail space along an extended Broadway, anchored by a 45,000-square-foot grocery store at First Street and Broadway. The Downtown Addition, linked to the Downtown with deliberate foot and auto connections, would create the counter-weight needed to begin shifting customer attention back toward the eastern end of Broadway. The resulting integration of new and existing retail will enable businesses on both sides of First Street to attract more customers than any one segment could on its own. The whole becomes truly greater than the sum of the parts.
In contrast, Scenario 2 diffuses new retail by placing it at East San Antonio Drive and Bitterwater Road. The distance from Broadway (Downtown) is significant enough that the two retail districts will function
7 King City General Plan Economic Development Element, 1998, p.8. 8 Keyser Marston Associates, Preliminary Report for the Third Amendment to the Redevelopment Plan, 9/2006, p.19. 9 The rule of thumb traffic count for retail is 25,000 average daily travelers. Keyser Marston Associates, Preliminary Report for the Third Amendment to the Redevelopment Plan, 9/2006, p.15.
King City Downtown Addition -- Fiscal Impact Analysis 11 February 19, 2007
independently. Separated, both the existing Downtown and Downtown Addition retail will compete less effectively with locations offering greater highway visibility.
PRODUCING POSITIVE SPILLOVERS FOR EXISTING DOWNTOWN BUSINESSES Under the design proposal of Scenario 1, foot and auto traffic generated by Downtown Addition retail can have positive spillovers for existing Broadway retail. This occurs because patrons of the proposed retail node at Chestnut/Jayne and Broadway are provided meaningful pedestrian and auto links to the rest of Downtown. The cluster of a new grocery store and other businesses provide the draw for the area by catering to the daily needs of households living east of First Street. Once they have arrived, the design of Scenario 1 encourages patrons to get out of their cars, linger, and encounter existing businesses west of First Street. The resulting foot and auto traffic can provide existing Downtown businesses with a larger customer base.
Positive spillovers between existing Broadway and Downtown Addition retail are predicated on two conditions: (1) that new businesses do not compete with existing businesses for customers, and that (2) existing businesses appeal to new residents. Both conditions are found to hold for the Downtown Addition. The tenants anticipated in Scenarios 1 and 2 – a grocery store, supporting retail and household-serving businesses like a dry cleaner – are not expected to compete directly with Broadway’s prepared foods, clothing, and special event merchandise. An anchor grocery store, for example, will likely emphasize different products than Broadway’s smaller specialty food and prepared food stores, which cater to a Hispanic market. A new restaurant would be expected to offer a different cuisine or price range than the casual Mexican restaurants that are common on Broadway. Newer retail will largely respond to a different demographic than that which currently patronizes the existing Downtown, meaning new retail will fill niches rather than directly compete with existing Broadway businesses.
Additionally, prospective homebuyers in the Downtown Addition are expected to include larger Hispanic households migrating south from Salinas and even Greenfield who would be inclined to patronize Broadway’s existing specialty food and specialty event establishments. They will provide a potential market for existing Broadway businesses. But it will be important that these establishments are convenient for Downtown Addition residents. Scenario 1 allows existing specialty businesses to be conveniently added to a multi-purpose shopping trip.
By creating the conditions under which many of Downtown Addition’s new residents can be expected to patronize existing Broadway businesses, Scenario 1 effectively boosts the trade area population for the existing Downtown, and allows it to benefit from some of the new spending power of new residents.
By placing new retail out at East San Antonio and Bitterwater on the edge of King City’s new residential development, Scenario 2 leaves little potential for these kind of spillovers. Residents will have little reason to look toward Downtown, and will be able to completely bypass it. Even with households inclined to purchase goods at businesses specializing in prepared foods or specialty event merchandise, Scenario 2 creates the need for a separate trip to the Downtown, likely reducing its frequency. As a result, new residents are not expected to boost the trade area of the existing Downtown under Scenario 2.
BETTER SERVING EXISTING RESIDENTS Residents living in the heart of King City, north and south of the eastern end of Broadway, would benefit from retail, particularly well served by grocery and household-serving retail and services. The Scenario 1 configuration for Downtown Addition helps address this need, making more daily goods and services convenient to this population. In contrast, Scenario 2 retail will not be convenient to residents living west
King City Downtown Addition -- Fiscal Impact Analysis 12 February 19, 2007
King City Downtown Addition -- Fiscal Impact Analysis 13 February 19, 2007
of First Street/Metz Road: patronizing retail at San Antonio and Bitterwater Road would require going out of one’s way, as the location is not on the way to 101 or other key destinations.
SUMMARY OF ECONOMIC IMPACTS Scenario 1 would have considerably greater economic benefits for King City than Scenario 2. By integrating new goods and services with existing Broadway retail, Scenario 1 is the best poised to:
• Lift up declining Broadway retail, by drawing new Downtown Addition and Eastern Extensionresidents into the area;
• Produce positive spillovers for existing businesses, given the likelihood for complementary (asopposed to competitive) new businesses, and the presence of pedestrian and auto linkagesbetween Downtown Addition and Downtown;
• Combine with the Downtown Addition to create the critical mass needed for both retail areas tobe more competitive with freeway-oriented retail;
• Produce the synergistic conditions necessary for additional net growth in City business and salestax; and
• Improve the availability of convenient goods and services for existing King City residents livingwest of First Street/Metz Road.

This page intentionally left blank.
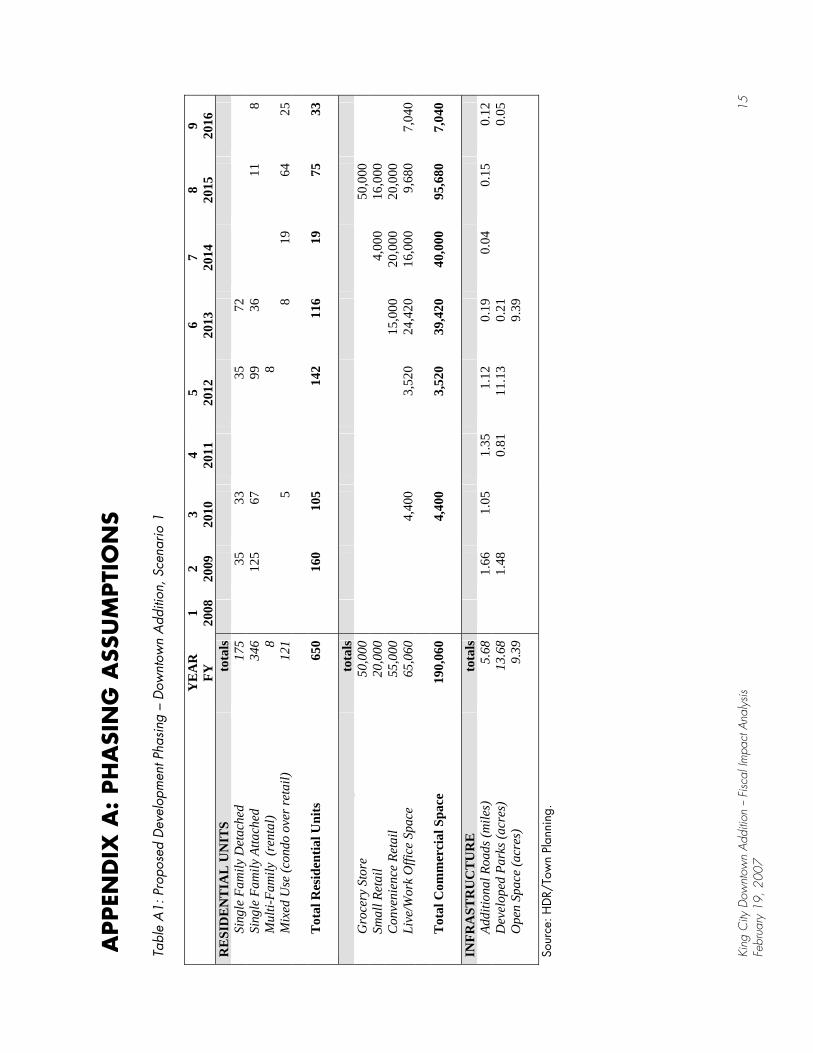
APPEN
DIX
A:
PH
ASI
NG
ASS
UM
PTI
ON
S
Tabl
e A
1: P
ropo
sed
Dev
elop
men
t Pha
sing
– D
ownt
own
Add
ition
, Sce
nario
1
Y
EA
R1
23
45
67
89
FY20
08
2009
2010
2011
2012
2013
2014
2015
2016
RE
SID
EN
TIA
L U
NIT
S to
tals
Si
ngle
Fam
ily D
etac
hed
175
35
3335
72Si
ngle
Fam
ily A
ttach
ed
346
125
6799
3611
8M
ulti-
Fam
ily (
rent
al)
8 8
Mix
ed U
se (c
ondo
ove
r ret
ail)
121
5
819
6425
Tot
al R
esid
entia
l Uni
ts
650
160
105
142
116
19
75
33
CO
MM
ER
CIA
L S
PAC
E (s
quar
e fe
et)
tota
ls
Gro
cery
Sto
re
50,0
00
50,
000
Smal
l Ret
ail
20,0
00
4
,000
1
6,00
0 Co
nven
ienc
e Re
tail
55,
000
15,
000
20,
000
20,
000
Live
/Wor
k O
ffice
Spa
ce
65,0
60
4,4
00
3
,520
2
4,42
0 1
6,00
0
9,6
80
7,0
40
Tot
al C
omm
erci
al S
pace
19
0,06
0
4,
400
3,52
039
,420
40,0
0095
,680
7,04
0
INFR
AST
RU
CT
UR
E
tota
ls
Addi
tiona
l Roa
ds (m
iles)
5.
68
1.
661.
051.
351.
120.
190.
040.
15
0.1
2D
evel
oped
Par
ks (a
cres
) 13
.68
1.48
0.
81
11.1
3 0.
21
0.0
5 O
pen
Spac
e (a
cres
) 9.
39
9.39
Sour
ce: H
DR/
Tow
n Pl
anni
ng.
King
City
Dow
ntow
n A
dditi
on --
Fisc
al Im
pact
Ana
lysis
Fe
brua
ry 1
9, 2
007
1 5
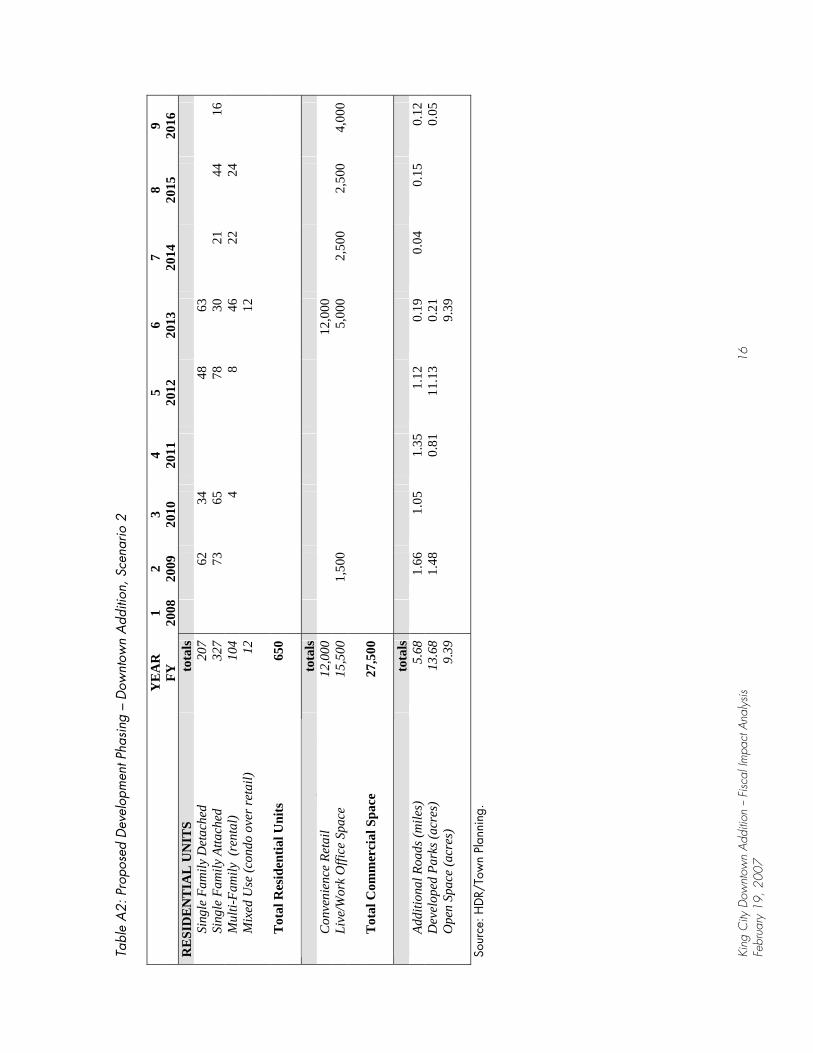
Tabl
e A
2: P
ropo
sed
Dev
elop
men
t Pha
sing
– D
ownt
own
Add
ition
, Sce
nario
2
Y
EA
R1
23
45
67
89
FY20
08
2009
2010
2011
2012
2013
2014
2015
2016
RE
SID
EN
TIA
L U
NIT
S to
tals
Si
ngle
Fam
ily D
etac
hed
207
62
3448
63Si
ngle
Fam
ily A
ttach
ed
327
73
65
7830
2144
16M
ulti-
Fam
ily (
rent
al)
104
48
4622
24M
ixed
Use
(con
do o
ver r
etai
l) 12
12
Tot
al R
esid
entia
l Uni
ts
650
CO
MM
ER
CIA
L S
PAC
E (s
quar
e fe
et)
tota
ls
Conv
enie
nce
Reta
il 12
,000
12,0
00Li
ve/W
ork
Offi
ce S
pace
15
,500
1,50
0
5,
000
2,50
02,
500
4,00
0
Tot
al C
omm
erci
al S
pace
27
,500
INFR
AST
RU
CT
UR
E
tota
ls
Addi
tiona
l Roa
ds (m
iles)
5.
68
1.
661.
051.
351.
120.
190.
040.
15
0.1
2D
evel
oped
Par
ks (a
cres
) 13
.68
1.48
0.
81
11.1
3 0.
21
0.0
5 O
pen
Spac
e (a
cres
) 9.
39
9.39
Sour
ce: H
DR/
Tow
n Pl
anni
ng.
King
City
Dow
ntow
n A
dditi
on --
Fisc
al Im
pact
Ana
lysis
16
Febr
uary
19,
200
7
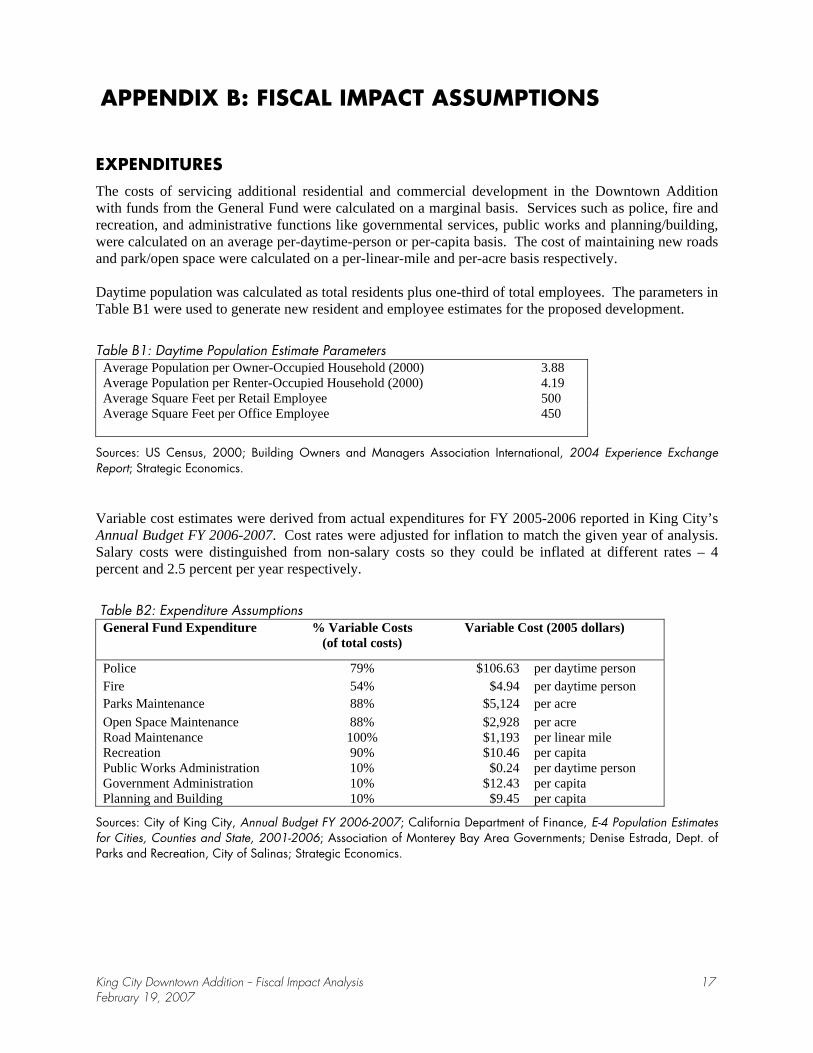
APPENDIX B: FISCAL IMPACT ASSUMPTIONS
EXPENDITURES The costs of servicing additional residential and commercial development in the Downtown Addition with funds from the General Fund were calculated on a marginal basis. Services such as police, fire and recreation, and administrative functions like governmental services, public works and planning/building, were calculated on an average per-daytime-person or per-capita basis. The cost of maintaining new roads and park/open space were calculated on a per-linear-mile and per-acre basis respectively.
Daytime population was calculated as total residents plus one-third of total employees. The parameters in Table B1 were used to generate new resident and employee estimates for the proposed development.
Table B1: Daytime Population Estimate Parameters Average Population per Owner-Occupied Household (2000) 3.88 Average Population per Renter-Occupied Household (2000) 4.19 Average Square Feet per Retail Employee 500 Average Square Feet per Office Employee 450
Sources: US Census, 2000; Building Owners and Managers Association International, 2004 Experience Exchange Report; Strategic Economics.
Variable cost estimates were derived from actual expenditures for FY 2005-2006 reported in King City’s Annual Budget FY 2006-2007. Cost rates were adjusted for inflation to match the given year of analysis. Salary costs were distinguished from non-salary costs so they could be inflated at different rates – 4 percent and 2.5 percent per year respectively.
Table B2: Expenditure Assumptions General Fund Expenditure % Variable Costs
(of total costs) Variable Cost (2005 dollars)
Police 79% $106.63 per daytime person Fire 54% $4.94 per daytime person Parks Maintenance 88% $5,124 per acre Open Space Maintenance 88% $2,928 per acre Road Maintenance 100% $1,193 per linear mile Recreation 90% $10.46 per capitaPublic Works Administration 10% $0.24 per daytime person Government Administration 10% $12.43 per capita Planning and Building 10% $9.45 per capita
Sources: City of King City, Annual Budget FY 2006-2007; California Department of Finance, E-4 Population Estimates for Cities, Counties and State, 2001-2006; Association of Monterey Bay Area Governments; Denise Estrada, Dept. of Parks and Recreation, City of Salinas; Strategic Economics.
King City Downtown Addition -- Fiscal Impact Analysis February 19, 2007
17
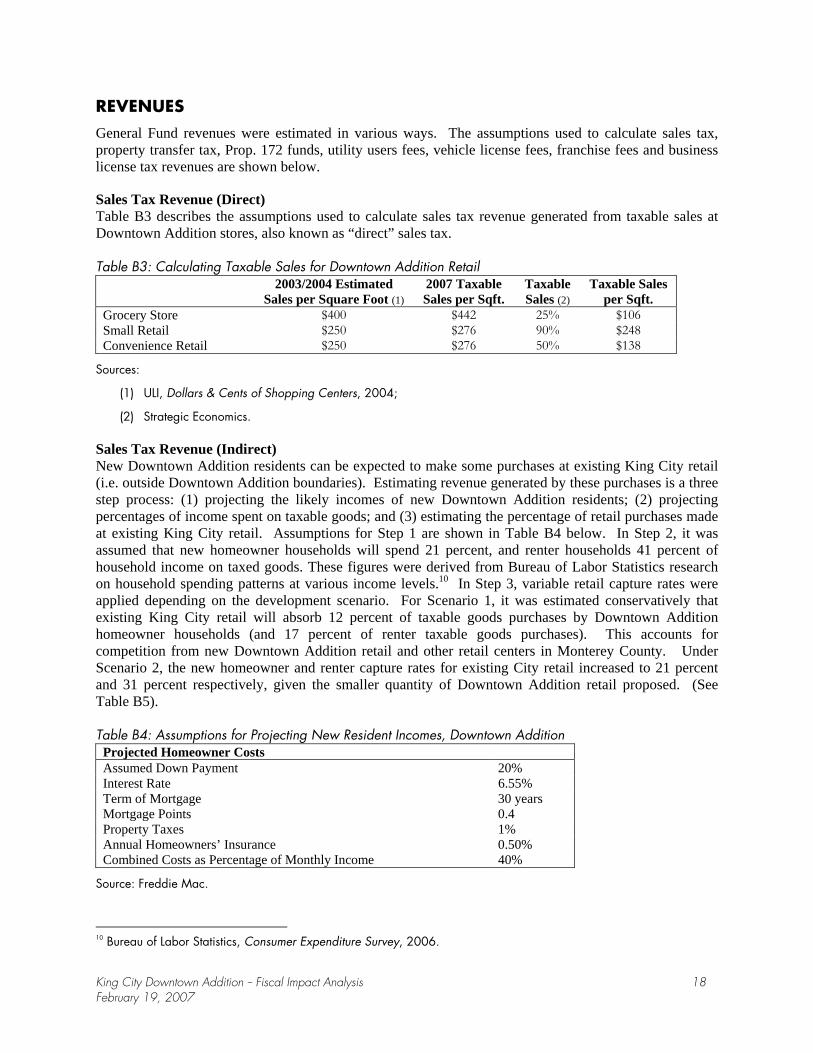
REVENUES General Fund revenues were estimated in various ways. The assumptions used to calculate sales tax, property transfer tax, Prop. 172 funds, utility users fees, vehicle license fees, franchise fees and business license tax revenues are shown below.
Sales Tax Revenue (Direct) Table B3 describes the assumptions used to calculate sales tax revenue generated from taxable sales at Downtown Addition stores, also known as “direct” sales tax.
Table B3: Calculating Taxable Sales for Downtown Addition Retail 2003/2004 Estimated
Sales per Square Foot (1) 2007 Taxable Sales per Sqft.
Taxable Sales (2)
Taxable Sales per Sqft.
Grocery Store $400 $442 25% $106Small Retail $250 $276 90% $248Convenience Retail $250 $276 50% $138
Sources:
(1) ULI, Dollars & Cents of Shopping Centers, 2004;
(2) Strategic Economics.
Sales Tax Revenue (Indirect) New Downtown Addition residents can be expected to make some purchases at existing King City retail (i.e. outside Downtown Addition boundaries). Estimating revenue generated by these purchases is a three step process: (1) projecting the likely incomes of new Downtown Addition residents; (2) projecting percentages of income spent on taxable goods; and (3) estimating the percentage of retail purchases made at existing King City retail. Assumptions for Step 1 are shown in Table B4 below. In Step 2, it was assumed that new homeowner households will spend 21 percent, and renter households 41 percent of household income on taxed goods. These figures were derived from Bureau of Labor Statistics research on household spending patterns at various income levels.10 In Step 3, variable retail capture rates were applied depending on the development scenario. For Scenario 1, it was estimated conservatively that existing King City retail will absorb 12 percent of taxable goods purchases by Downtown Addition homeowner households (and 17 percent of renter taxable goods purchases). This accounts for competition from new Downtown Addition retail and other retail centers in Monterey County. Under Scenario 2, the new homeowner and renter capture rates for existing City retail increased to 21 percent and 31 percent respectively, given the smaller quantity of Downtown Addition retail proposed. (See Table B5).
Table B4: Assumptions for Projecting New Resident Incomes, Downtown Addition Projected Homeowner Costs Assumed Down Payment 20% Interest Rate 6.55% Term of Mortgage 30 years Mortgage Points 0.4 Property Taxes 1% Annual Homeowners’ Insurance 0.50% Combined Costs as Percentage of Monthly Income 40%
Source: Freddie Mac.
10 Bureau of Labor Statistics, Consumer Expenditure Survey, 2006.
King City Downtown Addition -- Fiscal Impact Analysis 18 February 19, 2007
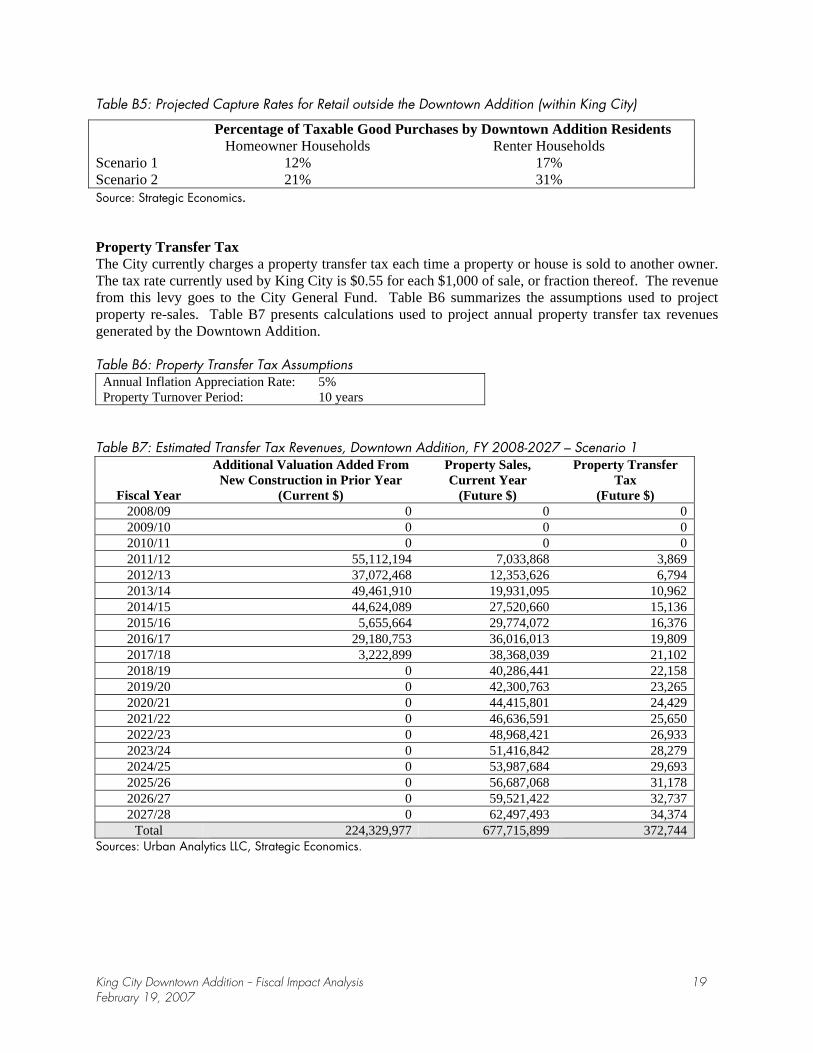
Table B5: Projected Capture Rates for Retail outside the Downtown Addition (within King City)
Percentage of Taxable Good Purchases by Downtown Addition Residents Homeowner Households Renter Households
Scenario 1 12% 17% Scenario 2 21% 31% Source: Strategic Economics.
Property Transfer Tax The City currently charges a property transfer tax each time a property or house is sold to another owner. The tax rate currently used by King City is $0.55 for each $1,000 of sale, or fraction thereof. The revenue from this levy goes to the City General Fund. Table B6 summarizes the assumptions used to project property re-sales. Table B7 presents calculations used to project annual property transfer tax revenues generated by the Downtown Addition.
Table B6: Property Transfer Tax Assumptions Annual Inflation Appreciation Rate: 5% Property Turnover Period: 10 years
Table B7: Estimated Transfer Tax Revenues, Downtown Addition, FY 2008-2027 – Scenario 1
Fiscal Year
Additional Valuation Added From New Construction in Prior Year
(Current $)
Property Sales, Current Year
(Future $)
Property Transfer Tax
(Future $) 2008/09 0 0 02009/10 0 0 02010/11 0 0 02011/12 55,112,194 7,033,868 3,8692012/13 37,072,468 12,353,626 6,7942013/14 49,461,910 19,931,095 10,9622014/15 44,624,089 27,520,660 15,1362015/16 5,655,664 29,774,072 16,3762016/17 29,180,753 36,016,013 19,8092017/18 3,222,899 38,368,039 21,1022018/19 0 40,286,441 22,1582019/20 0 42,300,763 23,2652020/21 0 44,415,801 24,4292021/22 0 46,636,591 25,6502022/23 0 48,968,421 26,9332023/24 0 51,416,842 28,2792024/25 0 53,987,684 29,6932025/26 0 56,687,068 31,1782026/27 0 59,521,422 32,7372027/28 0 62,497,493 34,374
Total 224,329,977 677,715,899 372,744 Sources: Urban Analytics LLC, Strategic Economics.
King City Downtown Addition -- Fiscal Impact Analysis 19 February 19, 2007
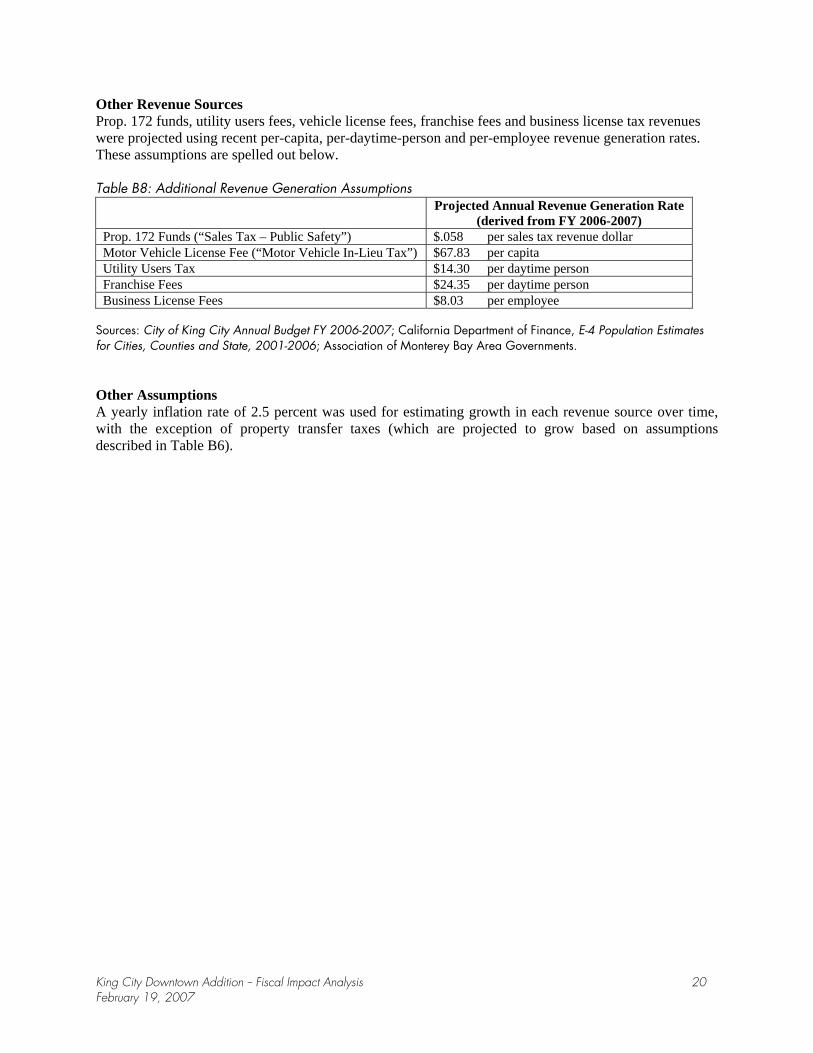
King City Downtown Addition -- Fiscal Impact Analysis 20 February 19, 2007
Other Revenue Sources Prop. 172 funds, utility users fees, vehicle license fees, franchise fees and business license tax revenues were projected using recent per-capita, per-daytime-person and per-employee revenue generation rates. These assumptions are spelled out below.
Table B8: Additional Revenue Generation Assumptions Projected Annual Revenue Generation Rate
(derived from FY 2006-2007) Prop. 172 Funds (“Sales Tax – Public Safety”) $.058 per sales tax revenue dollar Motor Vehicle License Fee (“Motor Vehicle In-Lieu Tax”) $67.83 per capita Utility Users Tax $14.30 per daytime person Franchise Fees $24.35 per daytime person Business License Fees $8.03 per employee
Sources: City of King City Annual Budget FY 2006-2007; California Department of Finance, E-4 Population Estimates for Cities, Counties and State, 2001-2006; Association of Monterey Bay Area Governments.
Other Assumptions A yearly inflation rate of 2.5 percent was used for estimating growth in each revenue source over time, with the exception of property transfer taxes (which are projected to grow based on assumptions described in Table B6).
H-1Adopted 14 June 2011 / Amended 28 January 2014 / Amended 24 March 2020
Adopting Resolutions and Ordinances
Appendix H
Adopting Resolutions and OrdinancesAppendix H contains the following documents:
• City Council Ordinance No. 2013-704 – January 28, 2014
• City Council Resolution No. 2013-4428 – January 14, 2014
• City Council Ordinance No. 2011-697 – June 14, 2011
• City Council Resolution No. 2011-4355 – May 24, 2011
• Planning Commission Resolution No. 2011-82 – March 1, 2011
• Planning Commission Resolution No. 2011-83 – March 1, 2011
• Planning Commission Resolution No. 2020-275 – March 3, 2020
•
•
Planning Commission Resolution No. 2020-276 – March 3, 2020
City Council Resolution No. 2020-4752 – March 10, 2020

Downtown Addition Specific Plan
City of King, CaliforniaH-2
Adopting Resolutions and Ordinances
Appendix H
This page intentionally left blank.
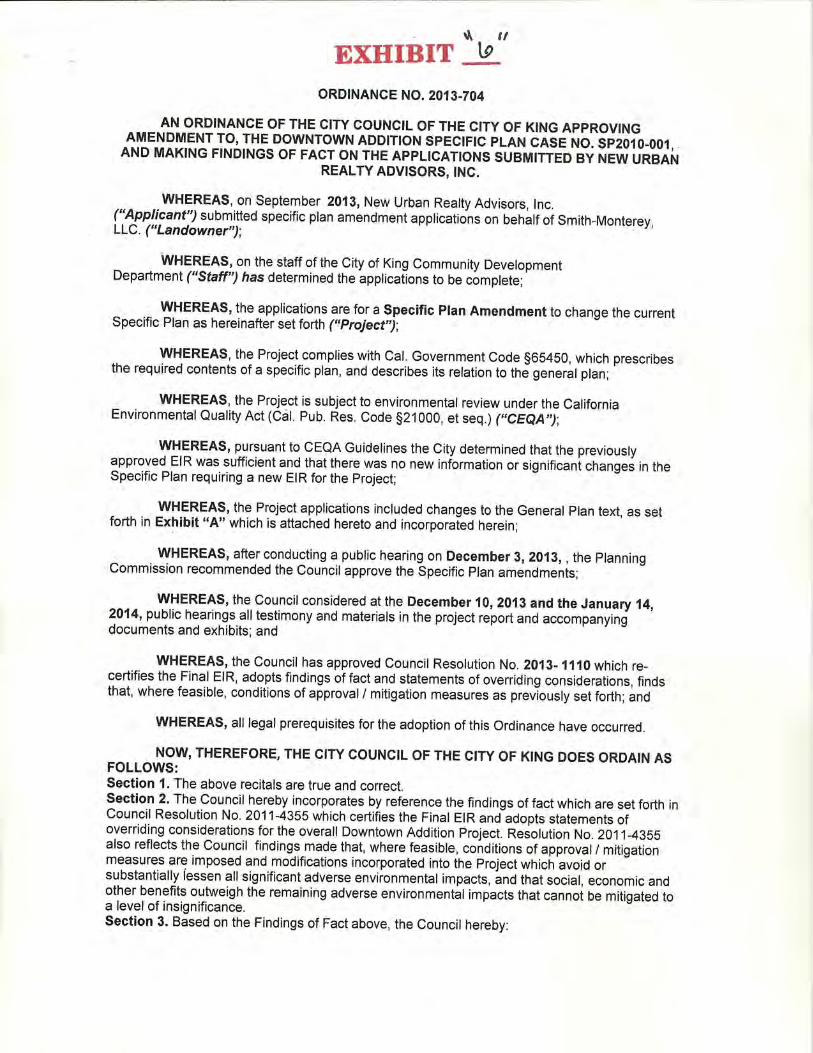
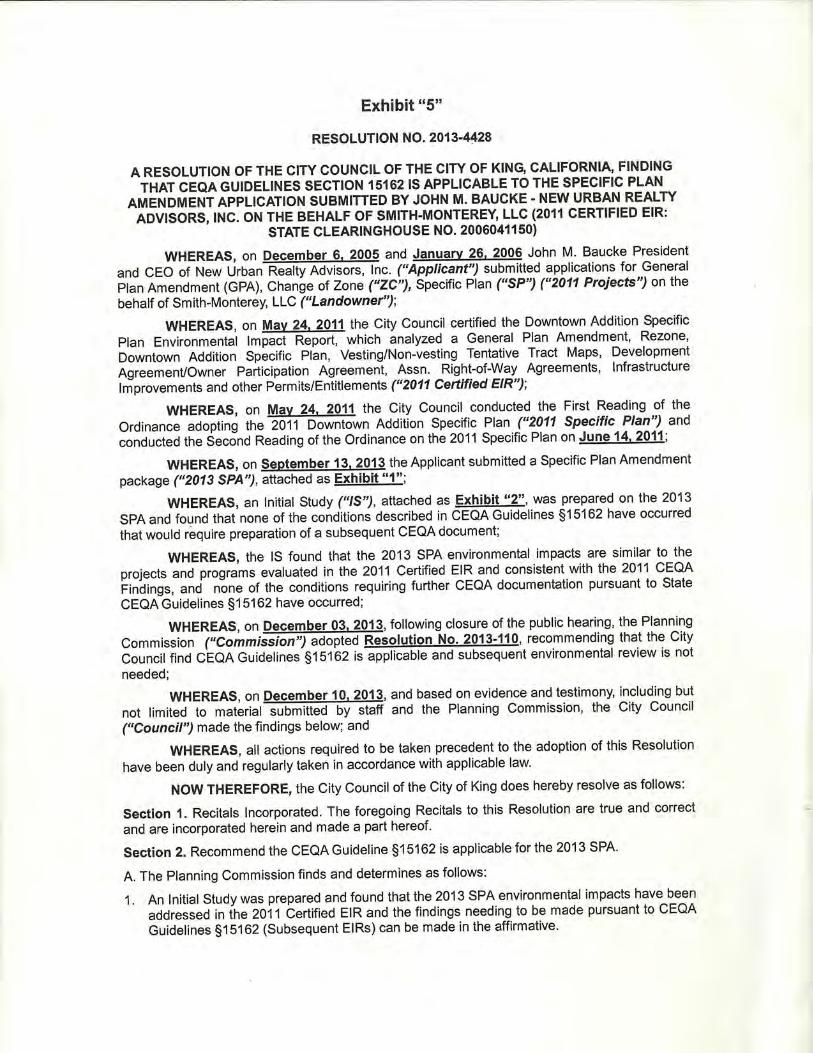
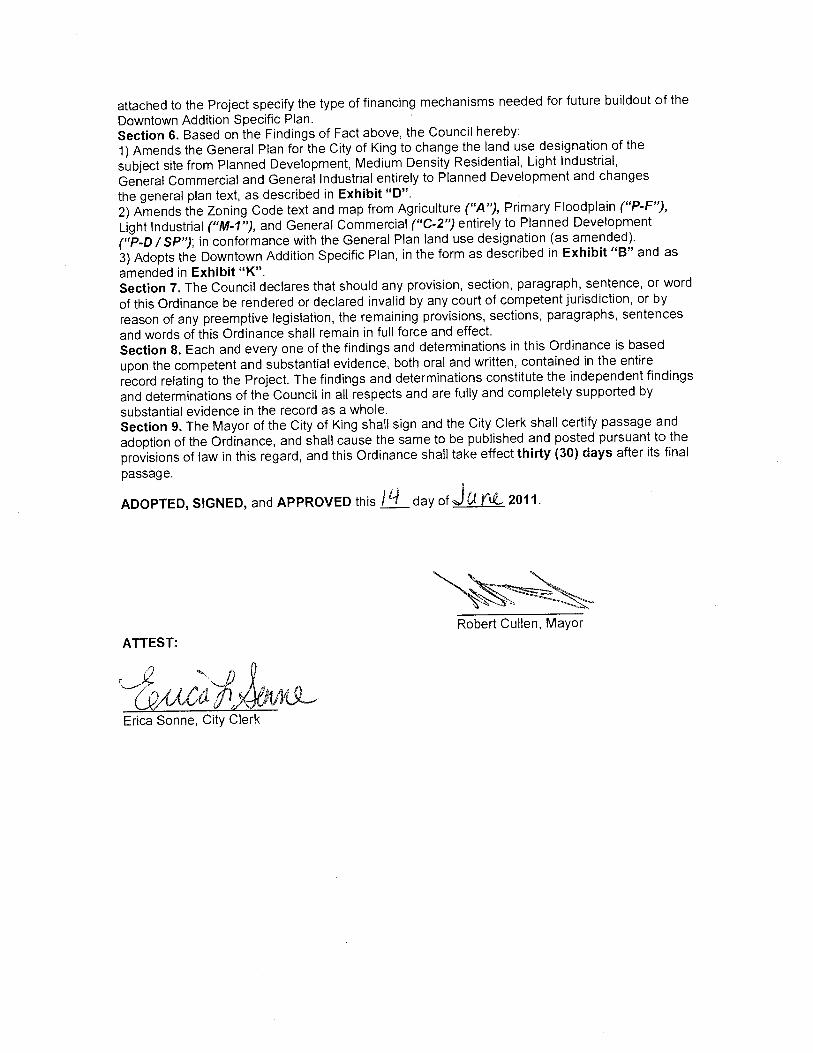


This page intentionally left blank.
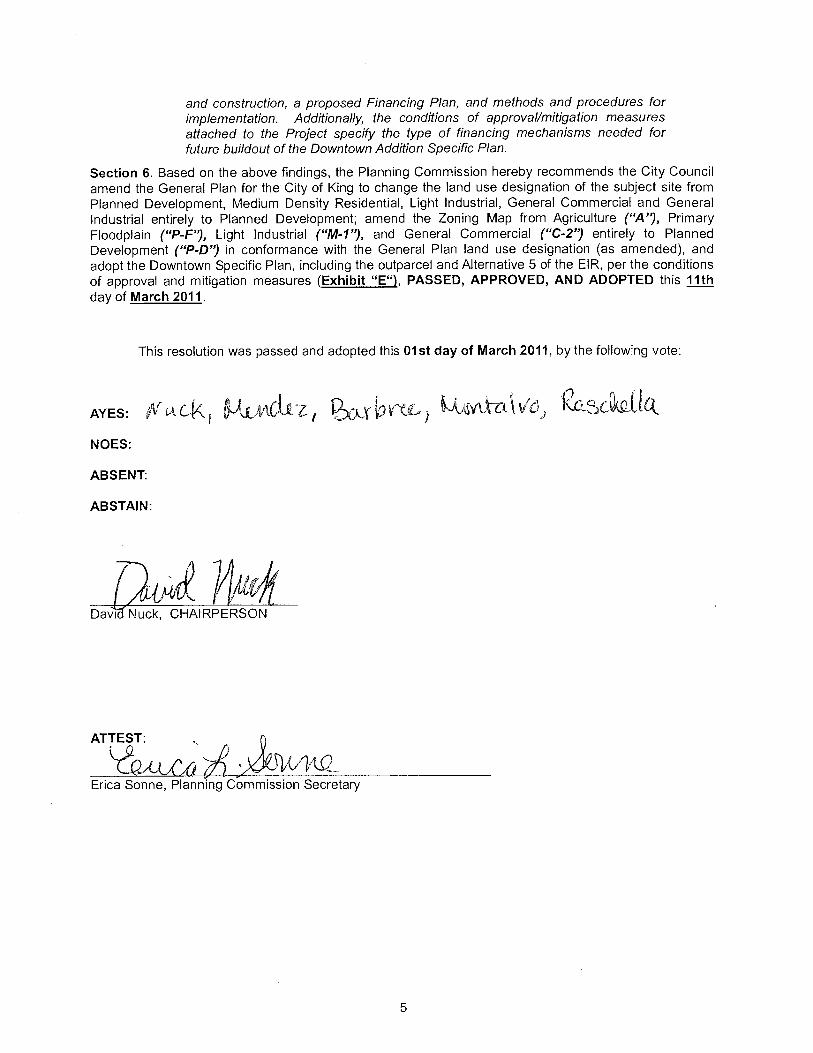

This page intentionally left blank.
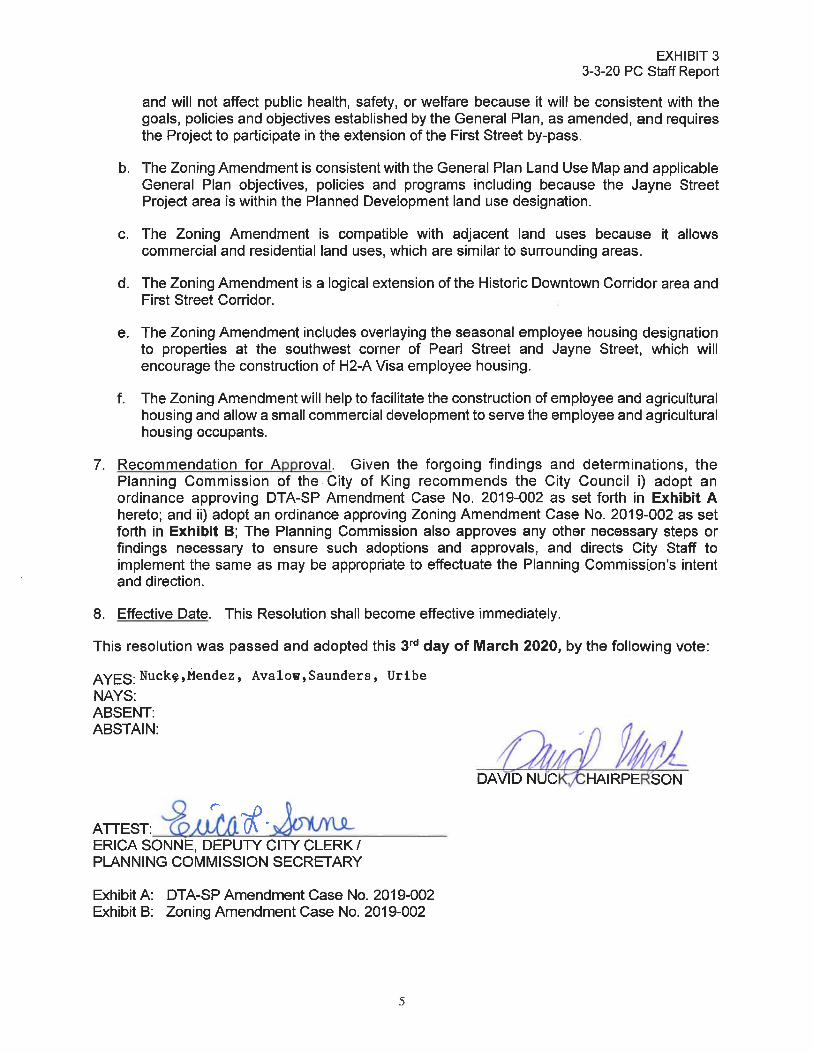

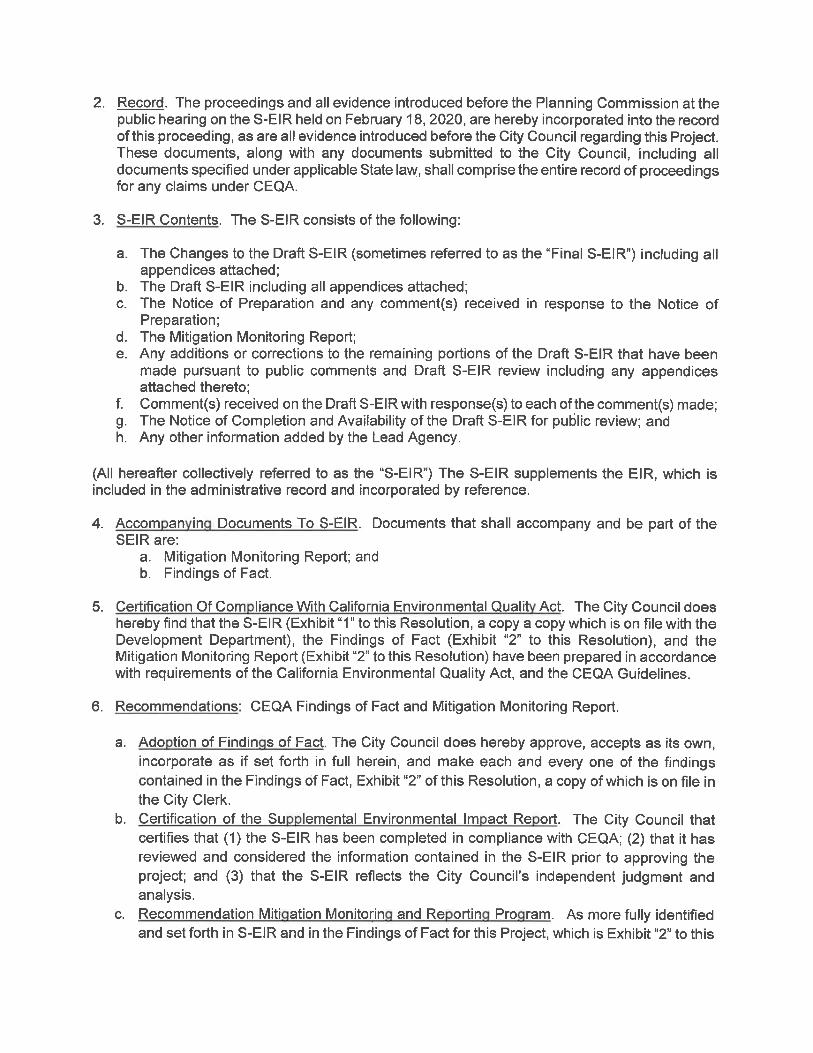
I-1Adopted 14 June 2011 / Amended 28 January 2014 / Amended 24 March 2020
Mitigation Monitoring and Reporting Program (MMRP)
Appendix I
Mitigation Monitoring and Reporting Program (MMRP)Appendix I contains the following documents:
Mitigation Monitoring Report - March 2020
Attachment “1” - Mitigation Monitoring Report (MMR) Worksheet - March 10, 2020
Downtown Addition Specific Plan
City of King, CaliforniaI-2
Mitigation Monitoring and Reporting Program (MMRP)
Appendix I
This page intentionally left blank.
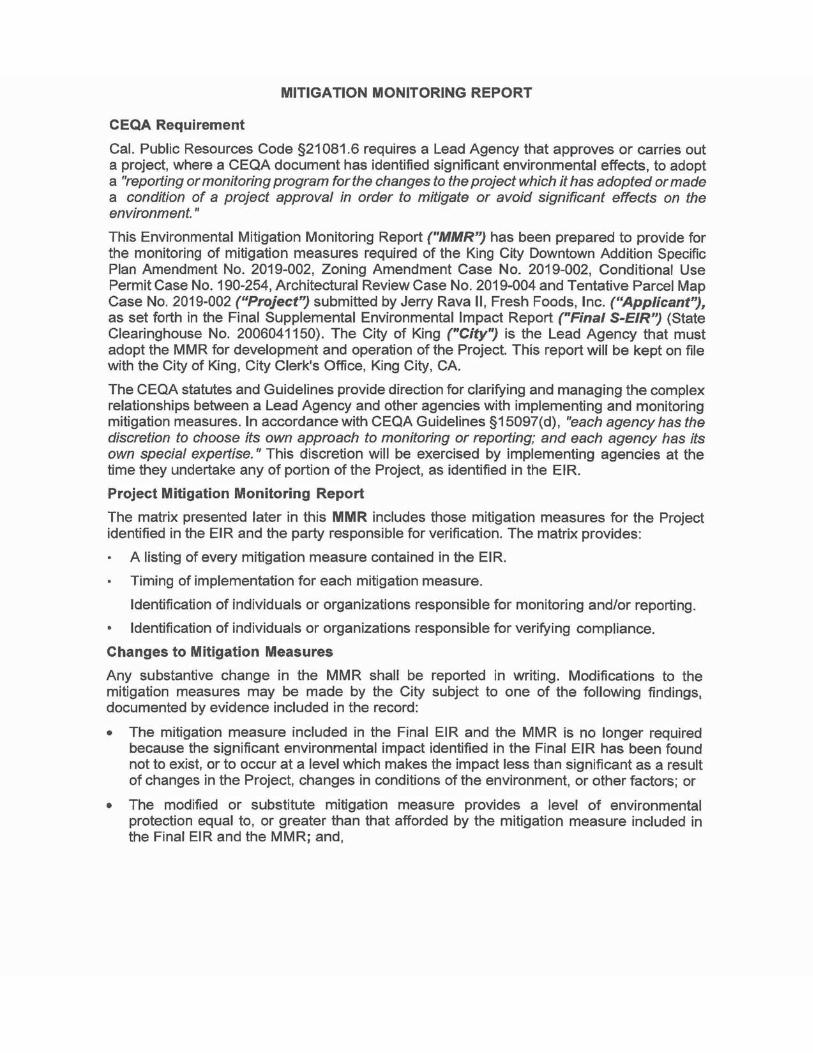
• The modified or substitute mitigation measure or measures do not have significant adverse effects on the environment in addition to or greater than those which were considered by the responsible hearing bodies in their decisions on the Final EIR and the proposed Project; and,
• The modified or substitute mitigation measures are feasible, and the City, through measures included in the MMR or other City procedures, can ensure implementation.
Support Documentation
Findings and related documentation supporting the findings involving modifications to mitigation measures shall be maintained in the Project file with the MMR and shall be made available to the public upon request. Attachment "1" is the MMR Worksheet which is to remain in the Community Development Department file and be signed off by responsible parties.
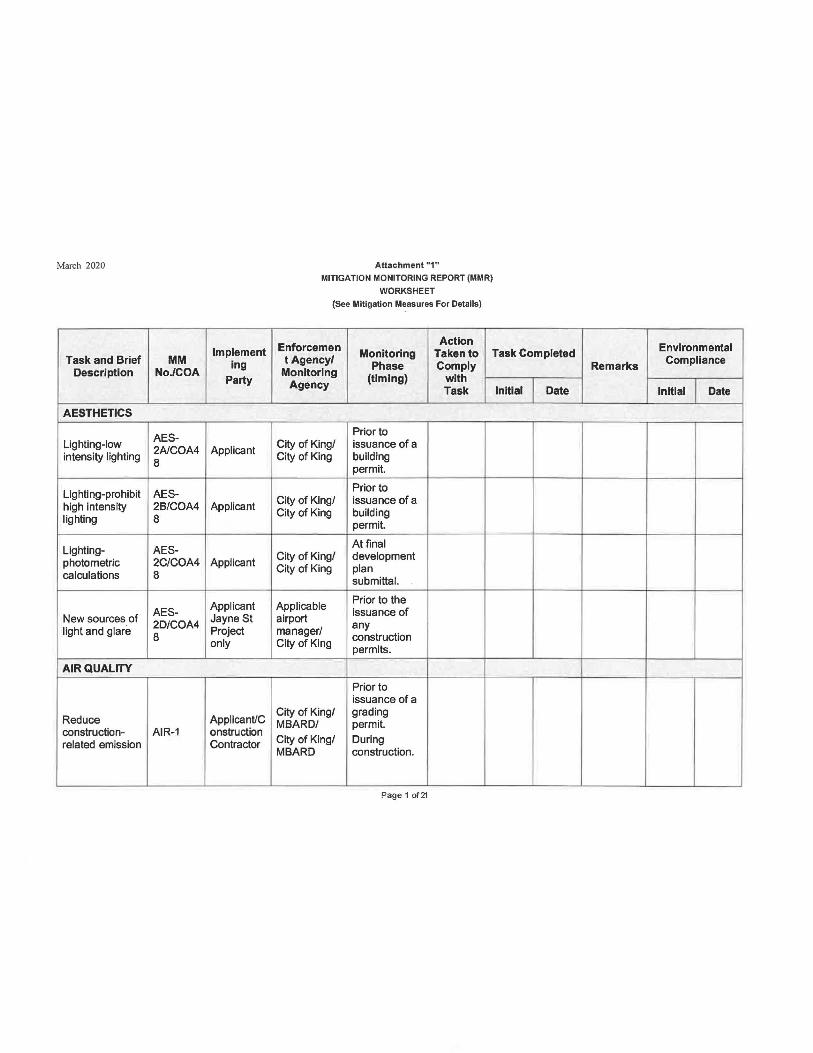
March 2020
Implement Task and Brief MM
Description No./COA ing
Party
AESTHETICS
Lighting-low AES-2AJCOA4 Applicant intensity lighting 8
Lighting-prohibit AES-high intensity 2B/COA4 Applicant lighting 8
Lighting- AES-photometric 2C/COA4 Applicant calculations 8
AES- Applicant New sources of 2D/COA4 Jayne St light and glare 8 Project
only
AIR QUALITY
Reduce Applicant/C construction- AIR-1 onstruction related emission Contractor
Attachment "1"
MITIGATION MONITORING REPORT (MMR)
WORKSHEET
(See Mitigation Measures For Details)
Action Enforce men
t Agency/ Monitoring Taken to Task Completed
Monitoring Phase Comply
Agency (timing) with Task Initial Date
Prior to City of King/ issuance of a City of King building
permit.
Prior to City of King/ issuance of a City of King building
permit.
At final City of King/ development City of King plan
submittal.
Applicable Prior to the
airport issuance of
manager/ any
City of King construction permits.
Prior to issuance of a
City of King/ grading MBARD/ permit.
City of King/ During MBARD construction.
Page 1 of21
Environmental
Remarks Compliance
Initial Date
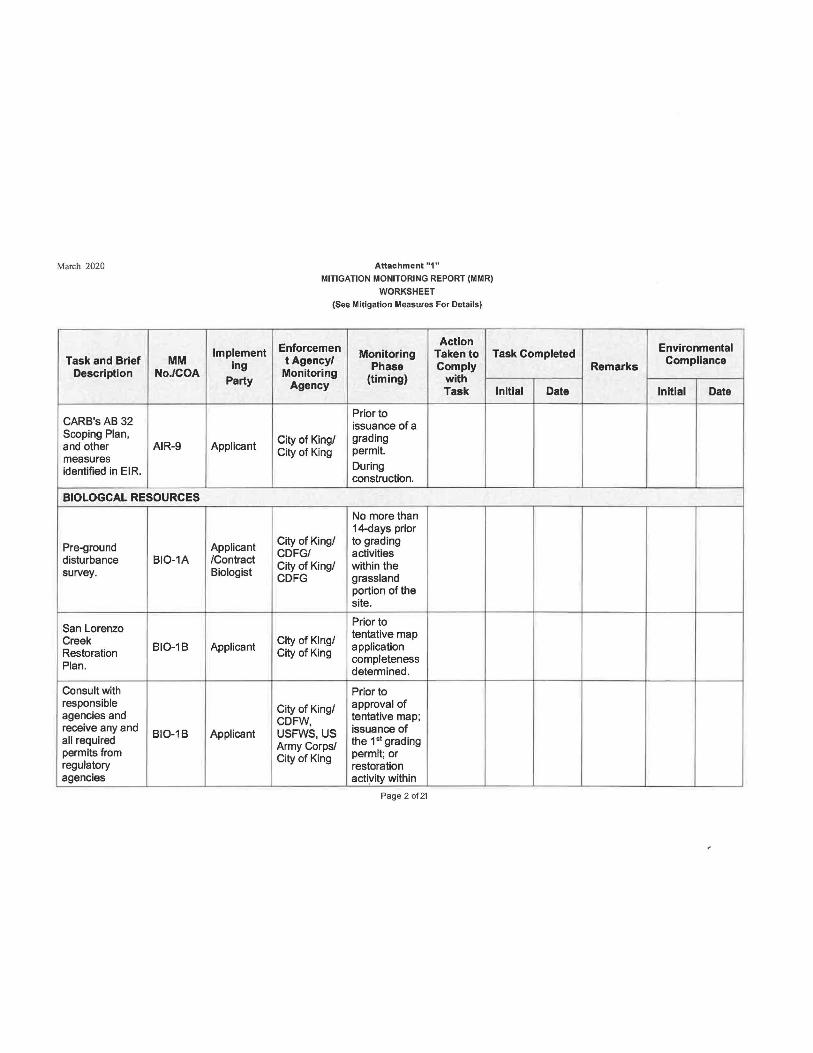
Man:h 2020
Implement Task and Brief MM
Description No./COA ing
Party
CARB'sAB 32 Scoping Plan, and other AIR-9 Applicant measures identified in EIR.
BIOLOGCAL RESOURCES
Pre-ground Applicant disturbance BI0-1A /Contract survey. Biologist
San Lorenzo Creek
BI0-1B Restoration Applicant
Plan.
Consult with responsible agencies and receive any and all required
BI0-1B Applicant
permits from regulatory agencies
Attachment "1"
MITIGATION MONITORING REPORT (MMR)
WORKSHEET
(See Mitigation Measures For Details)
Action Enforcemen
t Agency/ Monitoring Taken to Task Completed
Monitoring Phase Comply
Agency (timing) with
Task Initial Date
Prior to issuance of a
City of King/ grading City of King permit.
During construction.
No more than 14-days prior
City of King/ to grading CDFG/ activities City of King/ within the CDFG grassland
portion of the site.
Prior to
City of King/ tentative map
City of King application completeness determined.
Prior to
City of King/ approval of
CDFW, tentative map;
USFWS, US Issuance of
Army Corps/ the 1•1 grading
City of King permit; or restoration actl:vity within
Page 2 of21
Environmental
Remarks Compliance
Initial Date
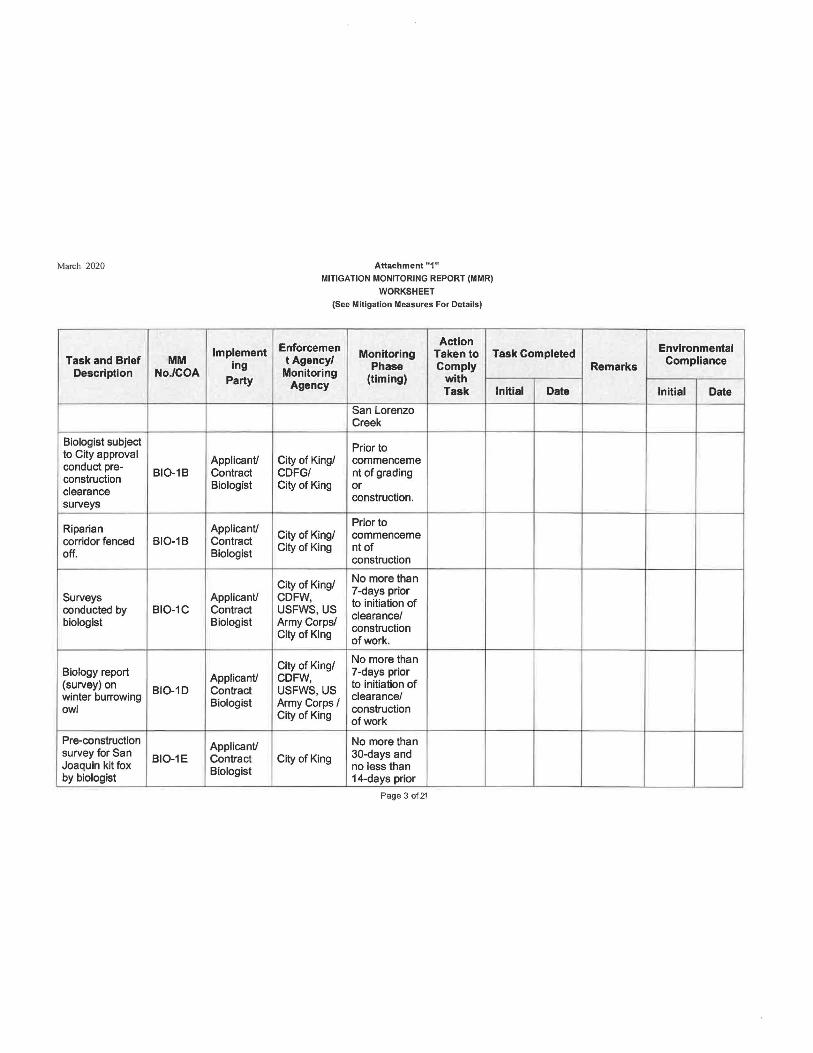
March 2020
Implement Task and Brief MM
Description NoJCOA ing
Party
Biologist subject to City approval conduct pre-
Applicant/
construction BI0-1B Contract
clearance Biologist
surveys
Riparian Applicant/ corridor fenced BI0-1B Contract off. Biologist
Surveys Applicant/ conducted by BI0-1C Contract biologist Biologist
Biology report (survey) on
Applicant/
winter burrowing BI0-10 Contract
owl Biologist
Pre-construction Applicant/ survey for San Joaquin kit fox
BI0-1E Contract
by biologist Biologist
Attachment "1"
MITIGATION MONITORING REPORT (MMR)
WORKSHEET
(See Mitigation Measures For Details)
Action Enforcemen t Agency/
Monitoring Taken to Task Completed
Monitoring Phase Comply
Agency (timing) with
Task Initial Date
San Lorenzo Creek
Prior to City of King/ commenceme CDFG/ nt of grading City of King or
construction.
Prior to City of King/ commenceme City of King nt of
construction
City of King/ No more than
CDFW, 7-days prior
USFWS, US to initiation of
Army Corps/ clearance/
City of King construction of work.
City of King/ No more than
CDFW, 7-days prior
USFWS, US to initiation of
Army Corps I clearance/
City of King construction of work
No more than
City of King 30-days and no less than 14-days prior
Page 3 of21
Environmental
Remarks Compliance
Initial Date
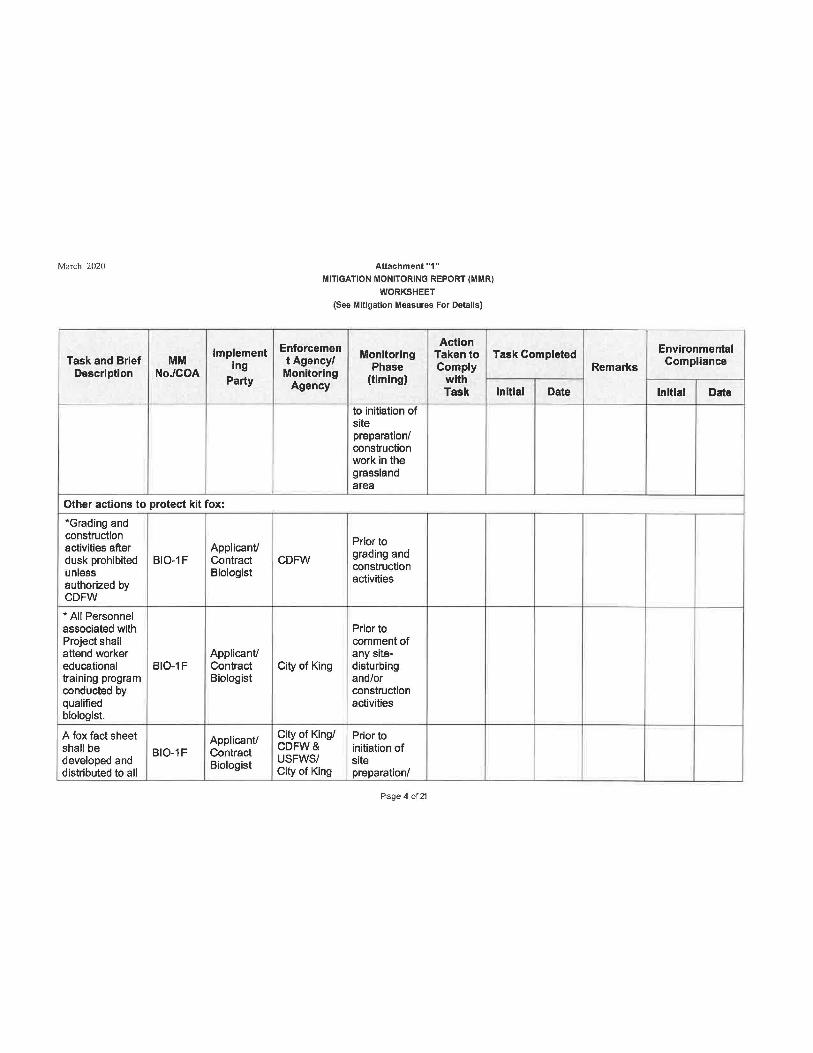
March 2020
Implement Task and Brief MM ing
Description No./COA Party
Other actions to protect kit fox:
*Grading and construction activities after Applicant/ dusk prohibited BI0-1F Contract unless Biologist authorized by CDFW
* All Personnel associated with Project shall attend worker Applicant/ educational BI0-1 F Contract training program Biologist conducted by qualified biologist.
A fox fact sheet Applicant/ shall be BI0-1F Contract developed and Biologist distributed to all
Attachment "1"
MITIGATION MONITORING REPORT (MMR)
WORKSHEET
(See Mitigation Measures For Details)
Action Enforce men Monitoring Taken to Task Completed tAgency/
Phase Comply Monitoring (timing) with
Agency Task Initial Date
to initiation of site preparation/ construction work in the grassland area
Prior to grading and
CDFW construction activities
Prior to comment of any site-
City of King disturbing and/or construction activities
City of King/ Prior to CDFW& initiation of USFWS/ site City of King preparation/
Page 4 of21
Environmental
Remarks Compliance
Initial Date
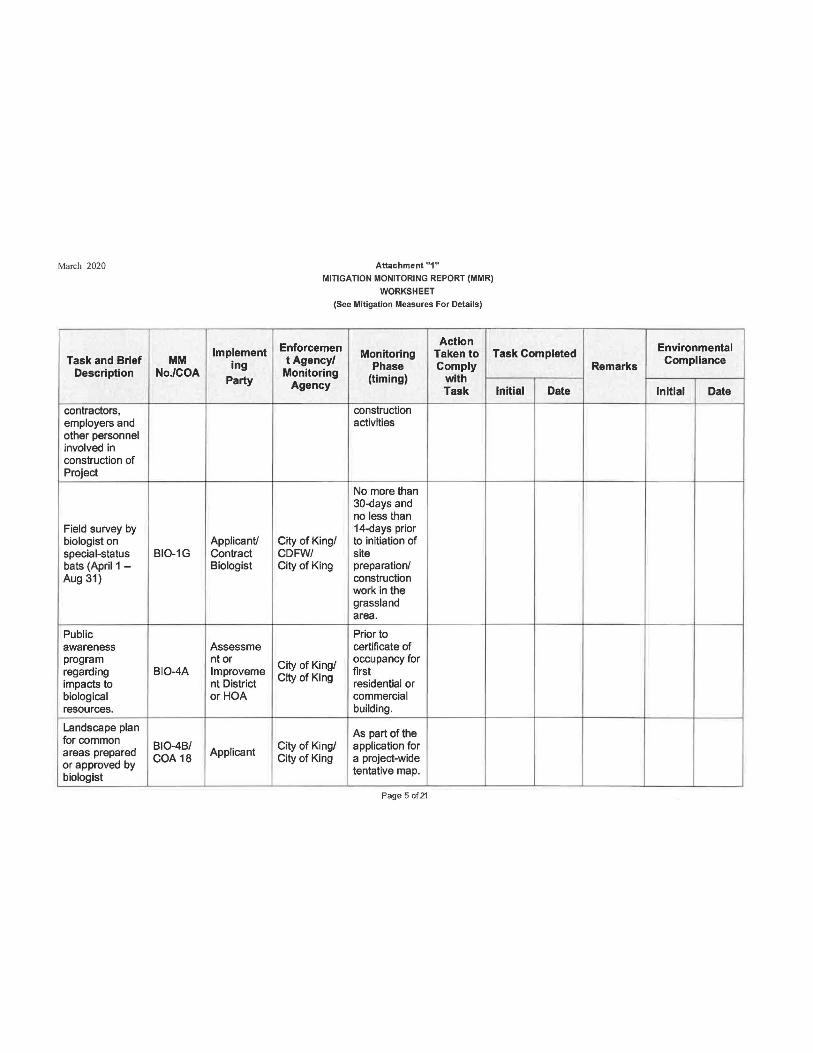
March 2020
Implement Task and Brief MM Ing
Description No./COA Party
contractors, employers and other personnel involved in construction of Project
Field survey by biologist on Applicant/ special-status BI0-1G Contract bats (April 1 - Biologist Aug 31)
Public awareness Assess me program nt or regarding BI0-4A lmproveme impacts to nt District biological or HOA resources.
Landscape plan for common
810-48/ areas prepared
COA18 Applicant
or approved by biologist
Attachment "1"
MITIGATION MONITORING REPORT (MMR)
WORKSHEET
(See Mitigation Measures For Details)
Action Enforcemen Monitoring Taken to Task Completed t Agency/
Phase Comply Monitoring (timing) with
Agency Task Initial Date
construction activities
No more than 30-days and no less than 14-days prior
City of King/ to initiation of CDFW/ site City of King preparation/
construction work in the grassland area.
Prior to certificate of
City of King/ occupancy for
City of King first residential or commercial building.
As part of the City of King/ application for City of King a project-wide
tentative map.
Page 5 of21
Environmental
Remarks Compliance
Initial Date
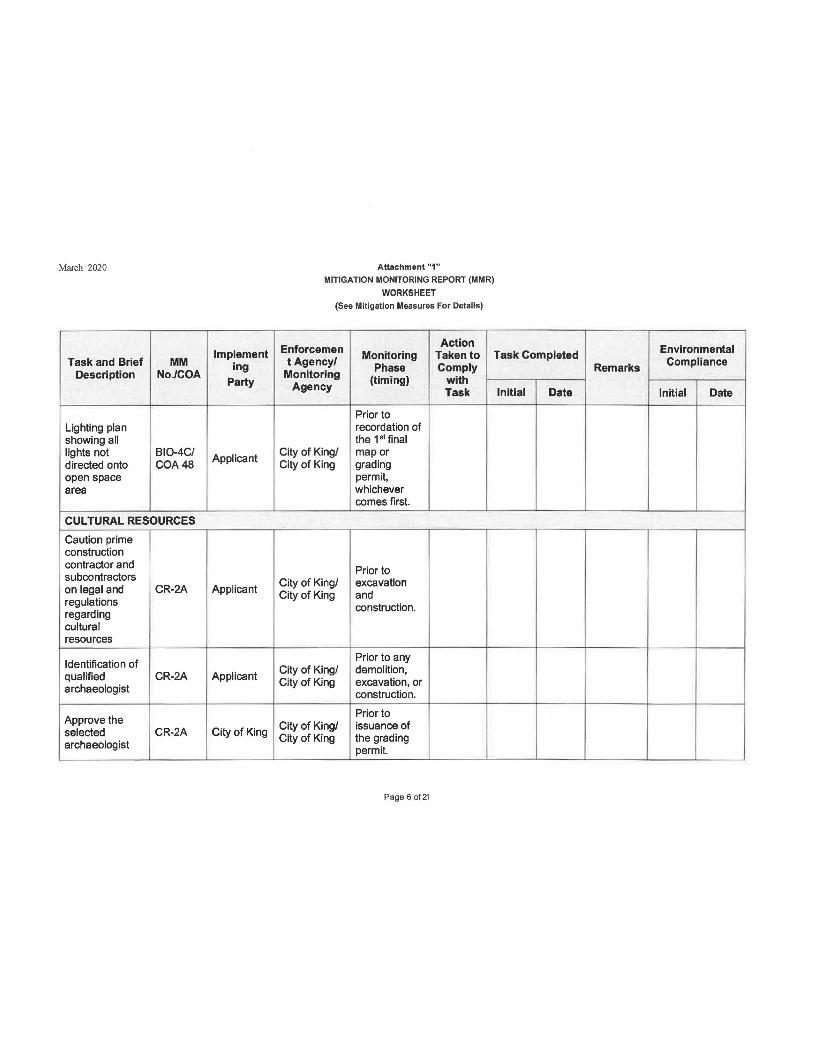
March 2020
Implement Task and Brief MM
Description No./COA ing
Party
Lighting plan showing all lights not BI0-4C/ Applicant directed onto COA48 open space area
CULTURAL RESOURCES
Caution prime construction contractor and subcontractors on legal and CR-2A Applicant regulations regarding cultural resources
Identification of qualified CR-2A Applicant archaeologist
Approve the selected CR-2A City of King archaeologist
Attachment "1" MITIGATION MONITORING REPORT (MMR)
WORKSHEET
(See Mitigation Measures For Details)
Action Enforce men
t Agency/ Monitoring Taken to Task Completed
Monitoring Phase Comply
Agency (timing) with
Task Initial Date
Prior to recordation of the 1•1 final
City of King/ map or City of King grading
permit, whichever comes first.
Prior to City of King/ excavation City of King and
construction.
Prior to any City of King/ demolition, City of King excavation, or
construction.
Prior to City of King/ issuance of City of King the grading
permit.
Page 6 of21
Environmental
Remarks Compliance
Initial Date
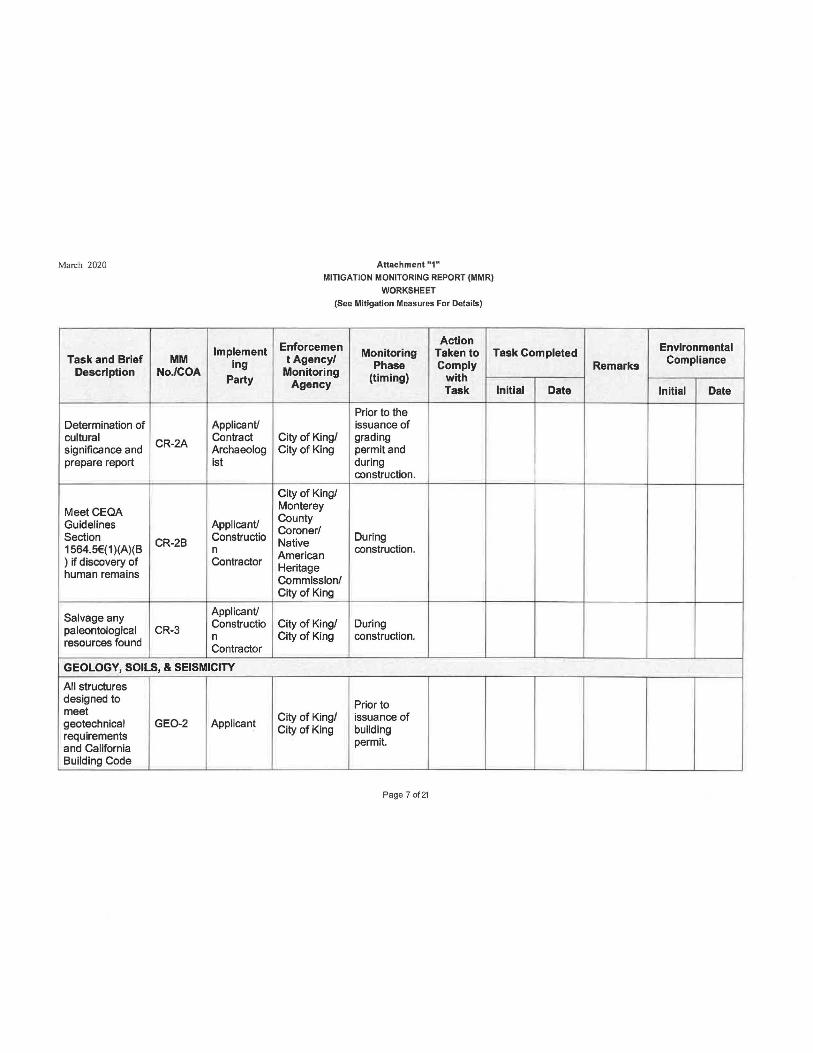
March 2020
Implement Task and Brief MM
Description No./COA Ing
Party
Determination of Applicant/ cultural CR-2A Contract significance and Archaeolog prepare report ist
MeetCEQA Guidelines Applicant/ Section Constructio 1564. 5€( 1 )(A)(B
CR-28 n
) if discovery of Contractor human remains
Salvage any Applicant/
paleontological CR-3 Constructio
resources found n Contractor
GEOLOGY, SOILS, & SEISMICITY
All structures designed to meet geotechnical GE0-2 Applicant requirements and California Building Code
Attachment "1"
MITIGATION MONITORING REPORT (MMR)
WORKSHEET
(See Mitigation Measures For Details)
Action Enforce men
t Agency/ Monitoring Taken to Task Completed
Monitoring Phase Comply
Agency (timing) with
Task Initial Date
Prior to the issuance of
City of King/ grading City of King permit and
during construction.
City of King/ Monterey County Coroner/
During Native American
construction.
Heritage Commission/ City of King
City of King/ During City of King construction.
Prior to City of King/ issuance of City of King building
permit.
Page 7 of 21
Environmental
Remarks Compliance
Initial Date
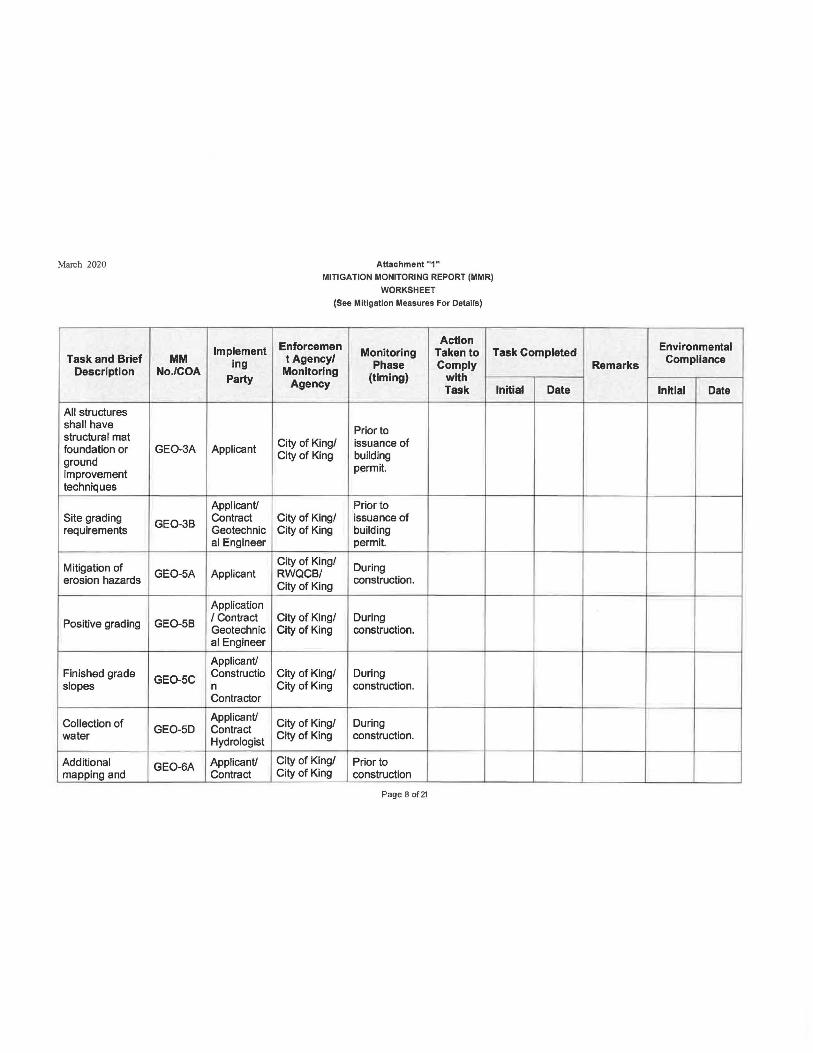
March 2020
Implement Task and Brief MM ing
Description No./COA Party
All structures shall have structural mat foundation or GE0-3A Applicant ground improvement techniques
Applicant/ Site grading GE0-38 Contract requirements Geotechnlc
al Engineer
Mitigation of GE0-5A Applicant erosion hazards
Application
Positive grading GE0-58 I Contract Geotechnlc al Engineer
Applicant/ Finished grade GE0-5C
Constructio slopes n
Contractor
Collection of Applicant/
GE0-50 Contract water Hydrologist
Additional GE0-6A Applicant/ mapping and Contract
Attachment "1"
MITIGATION MONITORING REPORT (MMR)
WORKSHEET
(See Mitigation Measures For Details)
Action Enforcemen Monitoring Taken to Task Completed
t Agency/ Phase Comply
Monitoring (timing) with
Agency Task Initial Date
Prior to City of King/ issuance of City of King building
permit.
Prior to City of King/ issuance of City of King building
permit.
City of King/ During RWQC8/
City of King construction.
City of King/ During City of King construction.
City of King/ During City of King construction.
City of King/ During City of King construction.
City of King/ Prior to City of King construction
Page 8 of21
Environmental
Remarks Compliance
Initial Date
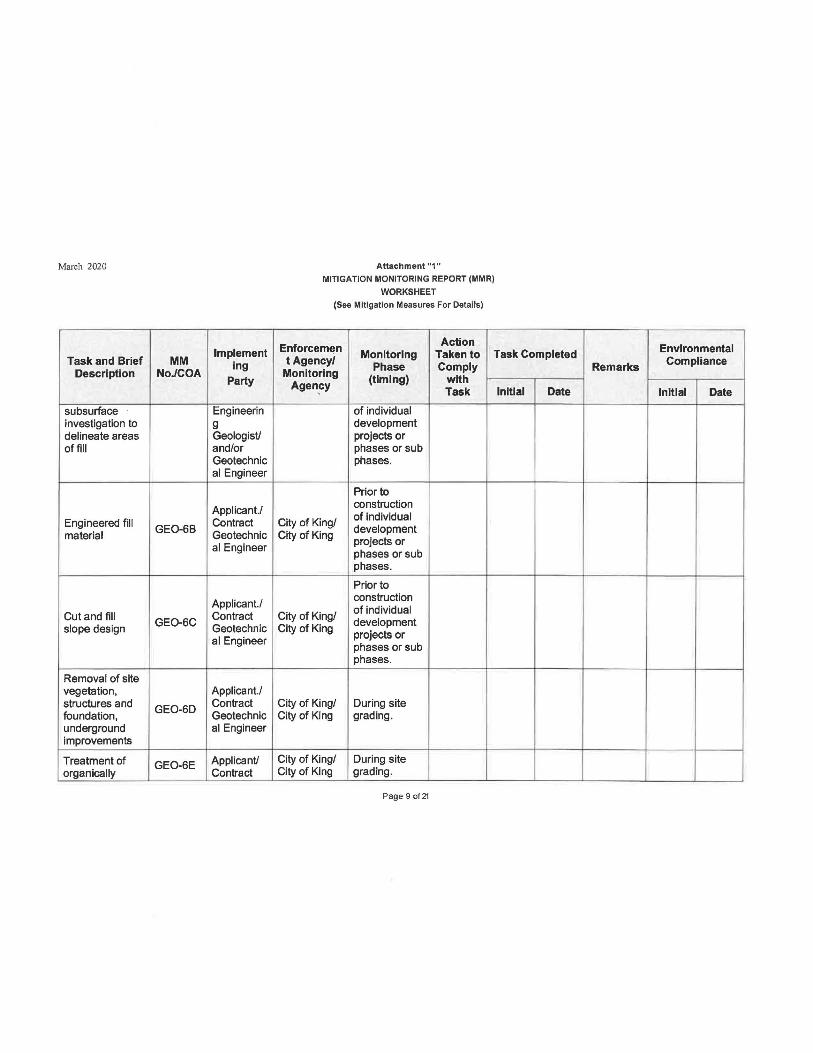
March 2020
Implement Task and Brief MM ing
Description No./COA Party
subsurface Engineerin investigation to g delineate areas Geologist/ offifl and/or
Geotechnic al Engineer
Applicant./ Engineered fill
GE0-6B Contract
material Geotechnic al Engineer
Applicant./ Cut and fill GE0-6C
Contract slope design Geotechnic
al Engineer
Removal of site vegetation, Applicant./ structures and GE0-6D Contract foundation, Geotechnic underground al Engineer Improvements
Treatment of GE0-6E Applicant/ organically Contract
Attachment "1" MITIGATION MONITORING REPORT (MMR)
WORKSHEET
(See Mitigation Measures For Details)
Action Enforcemen Monitoring Taken to Task Completed t Agency/
Phase Comply Monitoring (timing) with Agen~y Task Initial Date
of individual development projects or phases or sub phases.
Prior to construction of individual City of King/ development City of King projects or phases or sub phases.
Prior to construction of individual
City of King/ development City of King projects or phases or sub phases.
City of King/ During site City of King grading.
City of King/ During site City of King grading.
Page 9 of21
Environmental
Remarks Compliance
Initial Date
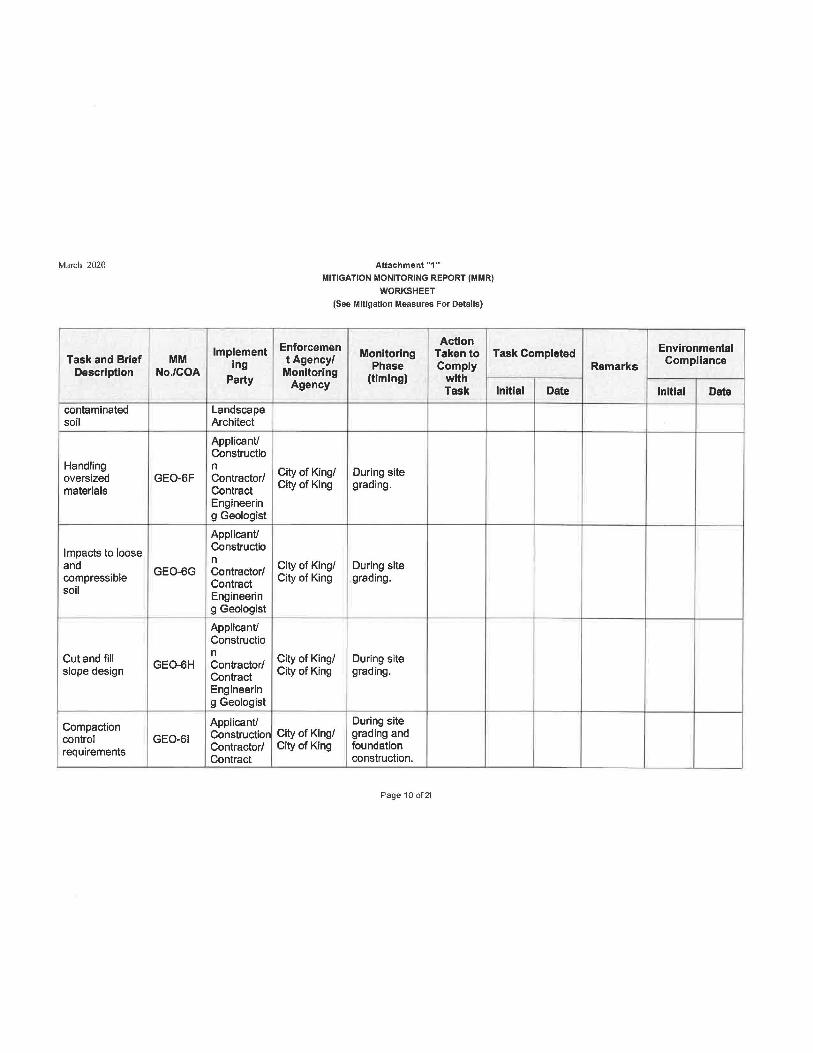
March 2020
Implement Task and Brief MM
Description No./COA ing
Party
contaminated Landscape soil Architect
Applicant/ Constructio
Handling n oversized GE0-6F Contractor/ materials Contract
Engineerin g Geologist
Applicant/
Impacts to loose Constructio
and n
compressible GE0-6G Contractor/
soil Contract Engineerin g Geologist
Applicant/ Constructio
Cut and fill n
slope design GE0-6H Contractor/
Contract Engineerin g Geologist
Compaction Applicant/
control GE0-61 Construction
requirements Contractor/ Contract
Attachment "1"
MITIGATION MONITORING REPORT (MMR)
WORKSHEET
(See Mitigation Measures For Details)
Action Enforcemen tAgency/ Monitoring Taken to Task Completed
Monitoring Phase Comply
Agency (timing) with
Task Initial Date
City of King/ During site City of King grading.
City of King/ During site City of King grading.
City of King/ During site City of King grading.
During site City of King/ grading and City of King foundation
construction.
Page 10 of21
Environmental
Remarks Compliance
Initial Date
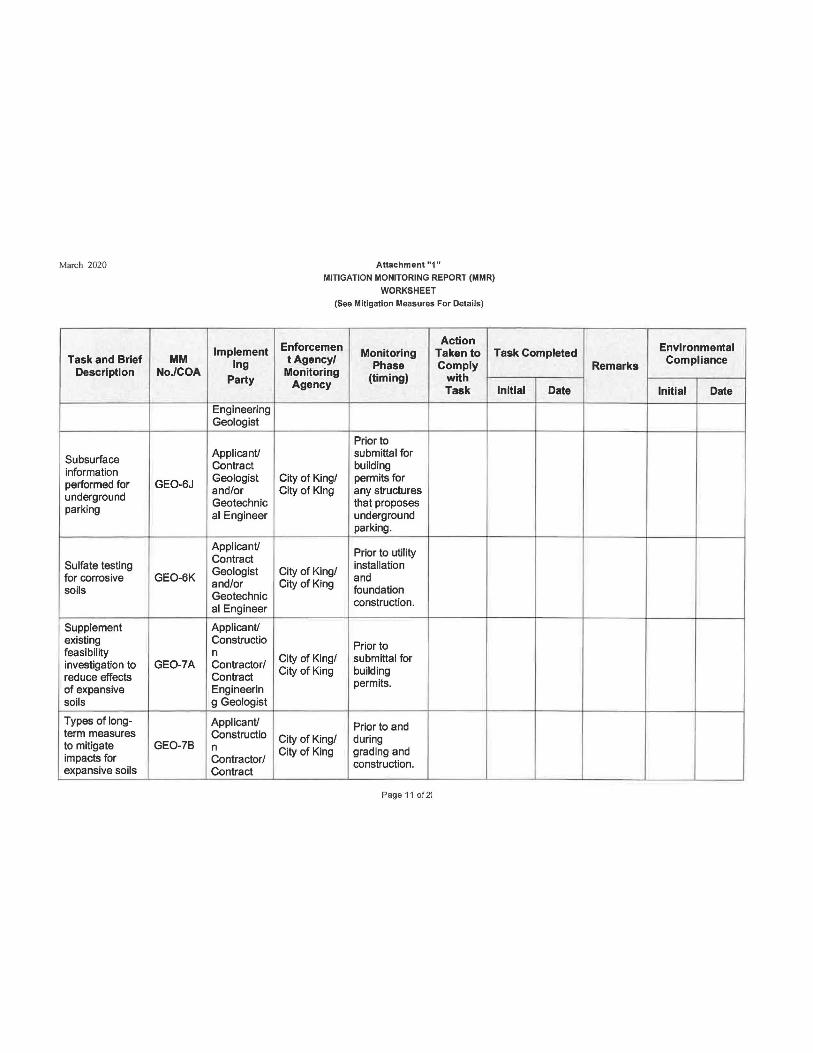
March 2020
Implement Task and Brief MM
Description No./COA Ing
Party
Engineering Geologist
Subsurface Applicant/
information Contract
performed for GE0-6J Geologist
underground and/or
parking Geotechnic al Engineer
Applicant/
Sulfate testing Contract Geologist
for corrosive GE0-6K soils
and/or Geotechnic al Engineer
Supplement Applicant/ existing Constructio feasibility n investigation to GE0-7A Contractor/ reduce effects Contract of expansive Engineerln soils g Geologist
Types of long- Applicant/ term measures Constructio to mitigate GE0-78 n impacts for Contractor/ expansive soils Contract
Attachment "1"
MITIGATION MONITORING REPORT (MMR)
WORKSHEET
(See Mitigation Measures For Details)
Action Enforcemen
t Agency/ Monitoring Taken to Task Completed
Monitoring Phase Comply
Agency (timing) with
Task Initial Date
Prior to submittal for building
City of King/ permits for City of King any structures
that proposes underground parking.
Prior to utility
City of King/ installation and City of King foundation construction.
Prior to City of King/ submittal for City of King building
permits.
Prior to and City of King/ during City of King grading and
construction.
Page 11 of21
Environmental
Remarks Compliance
Initial Date
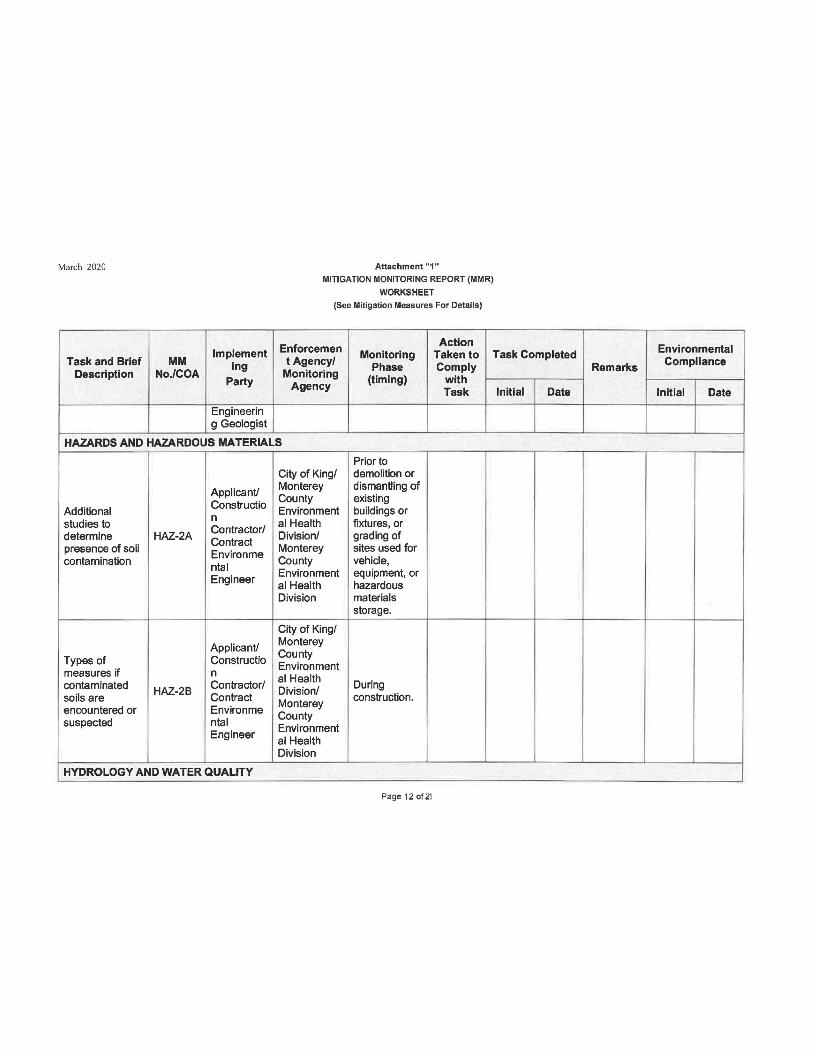
March 2020
Implement Task and Brief MM ing
Description No./COA Party
Engineerin g Geologist
Attachment "1"
MITIGATION MONITORING REPORT (MMR)
WORKSHEET
(See Mitigation Measures For Details)
Action Enforce men Monitoring Taken to Task Completed
t Agency/ Phase Comply Monitoring (timing) with
Agency Task Initial Date
HAZARDS AND HAZARDOUS MATERIALS
Prior to City of King/ demolition or
ApplicanV Monterey dismantling of County existing
Additional Constructio Environment buildings or
studies to n al Health fixtures, or Contractor/
determine HAZ-2A Contract Division/ grading of
presence of soil Environ me Monterey sites used for
contamination ntal County vehicle,
Engineer Environment equipment, or al Health hazardous Division materials
storage.
City of King/
ApplicanV Monterey
Types of Constructio County Environment
measures if n al Health contaminated HAZ-28 Contractor/ Division/ During soils are Contract Monterey
construction. encountered or Environ me suspected ntal
County Environment
Engineer al Health Division
HYDROLOGY AND WATER QUALITY
Page12of21
Environmental
Remarks Compliance
Initial Date
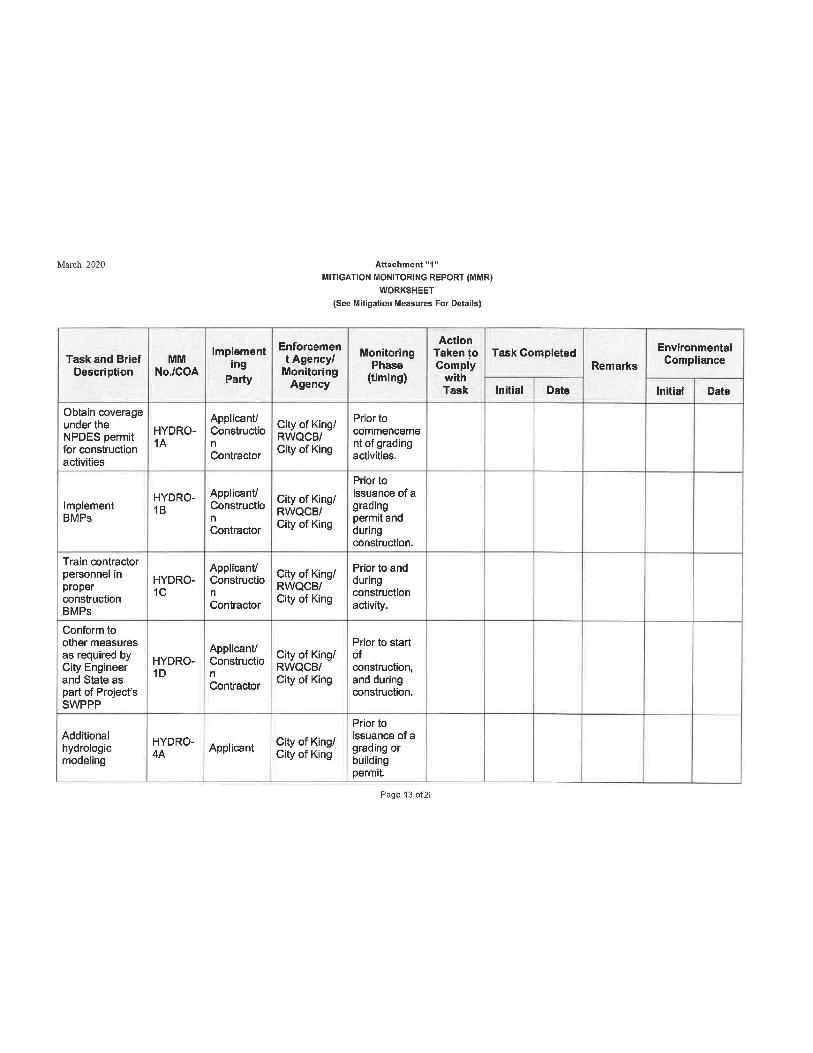
March 2020
Implement Task and Brief MM ing
Description No./COA Party
Obtain coverage ApplicanU under the HYDRO- Constructio NPDES permit 1A n for construction Contractor activities
HYDRO- ApplicanU Implement 18 Constructio BMPs n
Contractor
Train contractor ApplicanU personnel in HYDRO- Constructio proper 1C n construction
Contractor BMPs
Conform to other measures ApplicanU as required by
HYDRO- Constructio City Engineer 1D n
and State as Contractor part of Project's SWPPP
Additional HYDRO-hydrologic Applicant modeling 4A
Attachment "1"
MITIGATION MONITORING REPORT (MMR)
WORKSHEET
(See Mitigation Measures For Details)
Action Enforcemen Monitoring Taken ~o Task Completed tAgency/ Phase Comply
Monitoring (timing) with Agency
Task Initial Date
Prior to City of King/ commenceme RWQCB/ nt of grading City of King activities.
Prior to
City of King/ issuance of a
RWQCB/ grading
City of King permit and during construction.
Prior to and City of King/ during RWQCB/ construction City of King
activity.
Prior to start City of King/ of RWQCB/ construction, City of King and during
construction.
Prior to
City of King/ issuance of a grading or
City of King building permit.
Page 13 of21
Environmental
Remarks Compliance
Initial Date
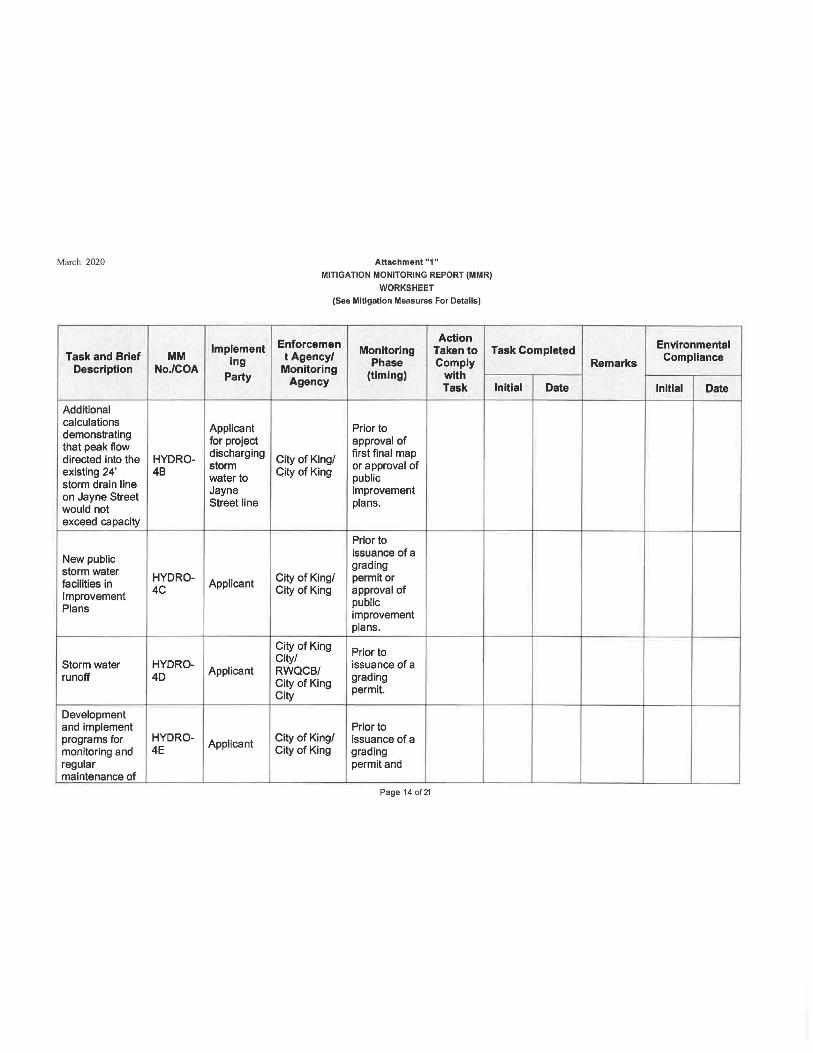
March 2020
Implement Task and Brief MM
Description No./COA ing
Party
Additional calculations demonstrating Applicant
that peak flow for project
directed into the HYDRO-discharging
existing 24' 48 storm
storm drain line water to
on Jayne Street Jayne
would not Street line
exceed capacity
New public storm water HYDRO-facilities in Applicant Improvement 4C
Plans
Storm water HYDRO-runoff 4D Applicant
Development and implement programs for HYDRO-
Applicant monitoring and 4E regular maintenance of
Attachment "1"
MITIGATION MONITORING REPORT (MMR)
WORKSHEET
(See Mitigation Measures For Details)
Action Enforcemen
t Agency/ Monitoring Taken to Task Completed
Monitoring Phase Comply
Agency (timing) with
Task Initial Date
Prior to approval of
City of King/ first final map
City of King or approval of public improvement plans.
Prior to issuance of a grading
City of King/ permit or City of King approval of
public improvement plans.
City of King Prior to
City/ issuance of a
RWQCB/ City of King grading
City permit.
Prior to City of King/ issuance of a City of King grading
permit and
Page 14 of21
Environmental
Remarks Compliance
Initial Date
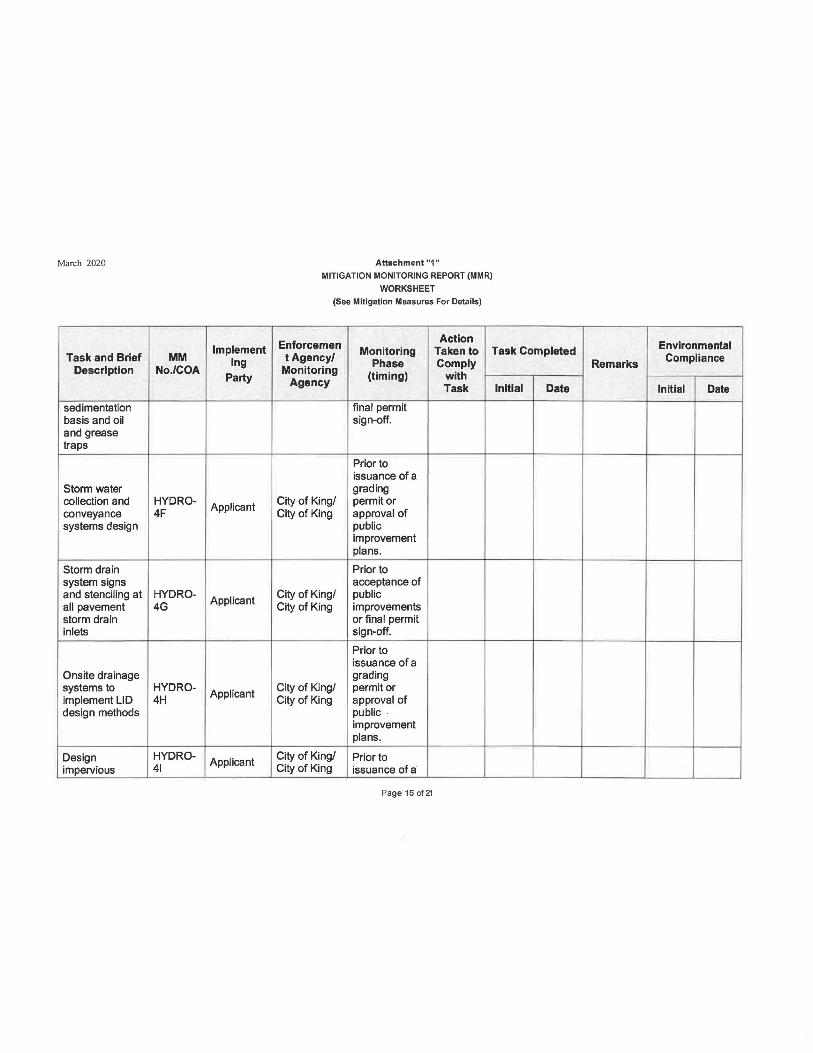
March 2020
Implement Task and Brief MM Ing
Description No./COA Party
sedimentation basis and oil and grease traps
Storm water collection and HYDRO-
Applicant conveyance 4F systems design
Storm drain system signs and stenciling at HYDRO- Applicant all pavement 4G storm drain inlets
Onsite drainage systems to HYDRO-
Applicant implement LID 4H design methods
Design HYDRO-Applicant
impervious 41
Attachment "1"
MITIGATION MONITORING REPORT (MMR)
WORKSHEET
(See Mitigation Measures For Details)
Action Enforcemen Monitoring Taken to Task Completed
t Agency/ Phase Comply Monitoring (timing) with
Agency Task Initial Date
final permit sign-off.
Prior to issuance of a grading
City of King/ permit or City of King approval of
public improvement plans.
Prior to acceptance of
City of King/ public City of King improvements
or final permit sign-off.
Prior to issuance of a grading
City of King/ permit or City of King approval of
public improvement plans.
City of King/ Prior to City of King issuance of a
Page 15 of 21
Environmental
Remarks Compliance
Initial Date
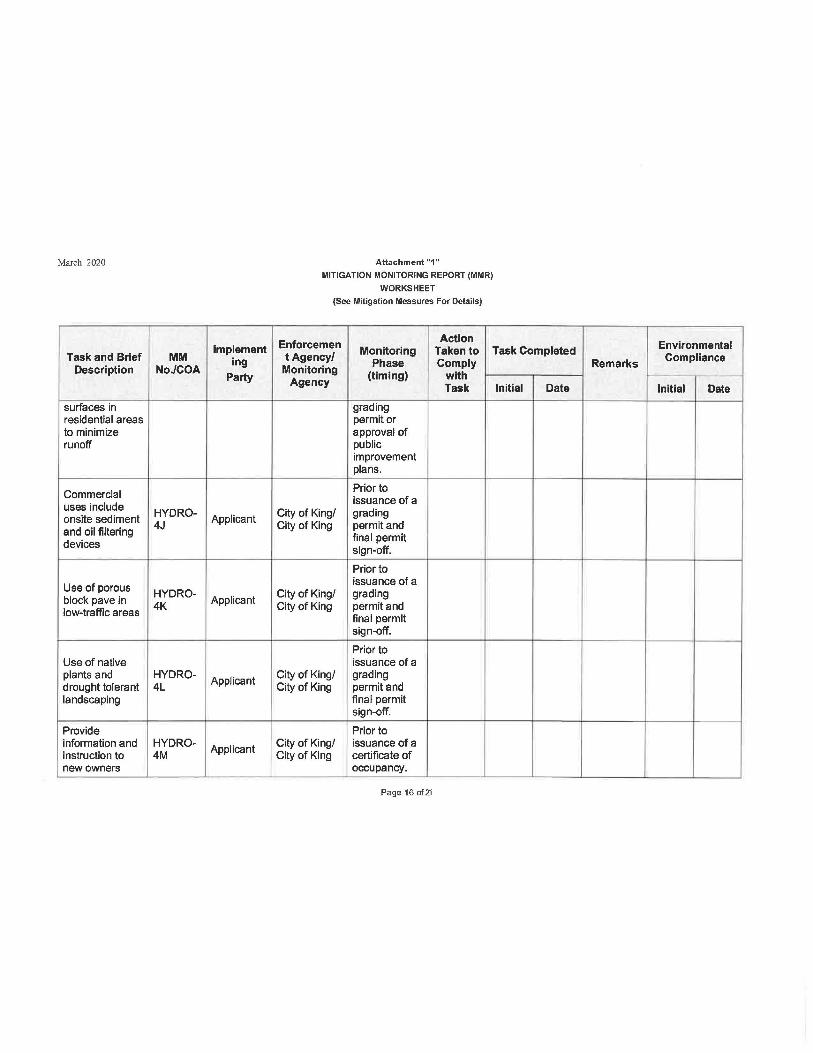
March 2020
Implement Task and Brief MM ing
Description No./COA Party
surfaces in residential areas to minimize runoff
Commercial uses include HYDRO-onsite sediment Applicant and oil filtering 4J
devices
Use of porous HYDRO-block pave in 4K
Applicant low-traffic areas
Use of native plants and HYDRO-
Applicant drought tolerant 4L landscaping
Provide information and HYDRO- Applicant instruction to 4M new owners
Attachment "1"
MITIGATION MONITORING REPORT (MMR)
WORKSHEET
(See Mitigation Measures For Details)
Action Enforcemen Monitoring Taken to Task Completed
t Agency/ Phase Comply Monitoring (timing) with
Agency Task Initial Date
grading permit or approval of public improvement plans.
Prior to issuance of a
City of King/ grading City of King permit and
final permit sign-off.
Prior to issuance of a
City of King/ grading City of King permit and
final permit sign-off.
Prior to issuance of a
City of King/ grading City of King permit and
final permit sign-off.
Prior to City of King/ issuance of a City of King certificate of
occupancy.
Page 16 of21
Environmental
Remarks Compliance
Initial Date
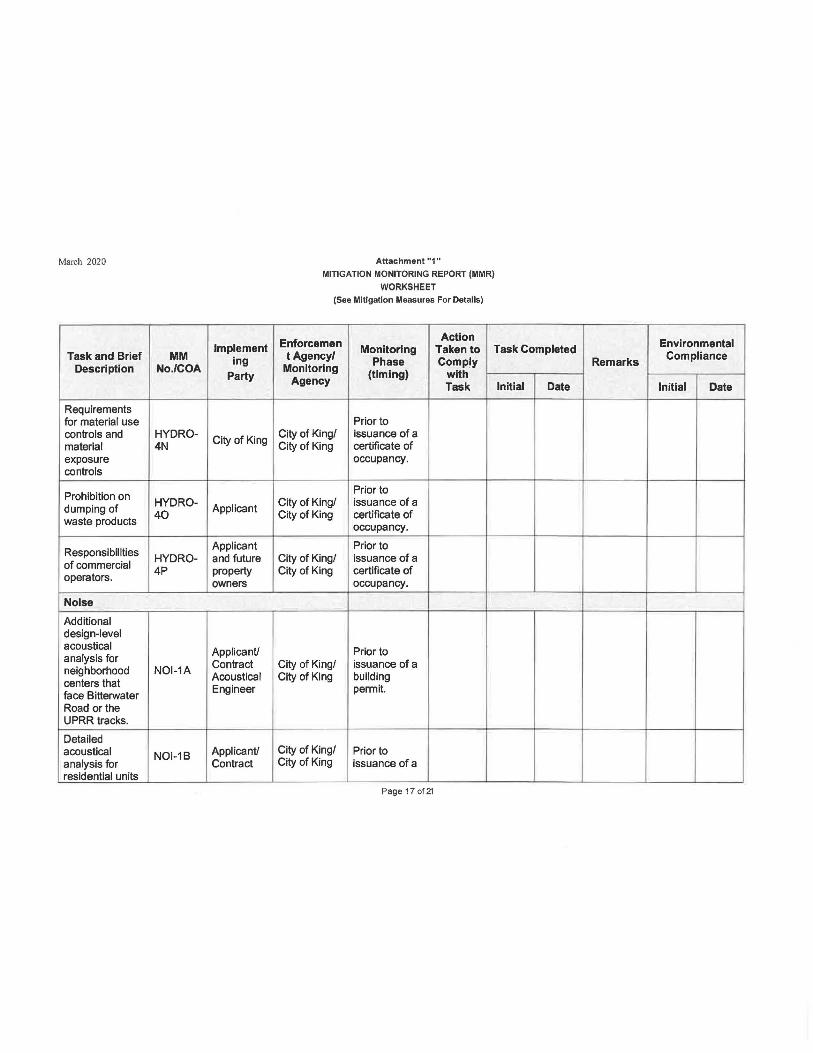
March 2020
Implement Task and Brief MM
Description No./COA ing
Party
Requirements for material use controls and HYDRO-
City of King material 4N exposure controls
Prohibition on dumping of
HYDRO- Applicant waste products
40
Responsibilities Applicant
of commercial HYDRO- and future
operators. 4P property owners
Noise
Additional design-level acoustical analysis for
ApplicanU
neighborhood NOl-1A Contract
centers that Acoustical
face Bitterwater Engineer
Road or the UPRR tracks.
Detailed acoustical NOl-18 ApplicanU analysis for Contract residential units
Attachment "1"
MITIGATION MONITORING REPORT (MMR)
WORKSHEET
(See Mitigation Measures For Details)
Action Enforcemen
t Agency/ Monitoring Taken to Task Completed
Monitoring Phase Comply
Agency (timing) with
Task Initial Date
Prior to City of King/ issuance of a City of King certificate of
occupancy.
Prior to City of King/ issuance of a City of King certificate of
occupancy.
Prior to City of King/ issuance of a City of King certificate of
occupancy.
Prior to City of King/ issuance of a City of King building
permit.
City of King/ Prior to City of King issuance of a
Page 17 of21
Environmental
Remarks Compliance
Initial Date
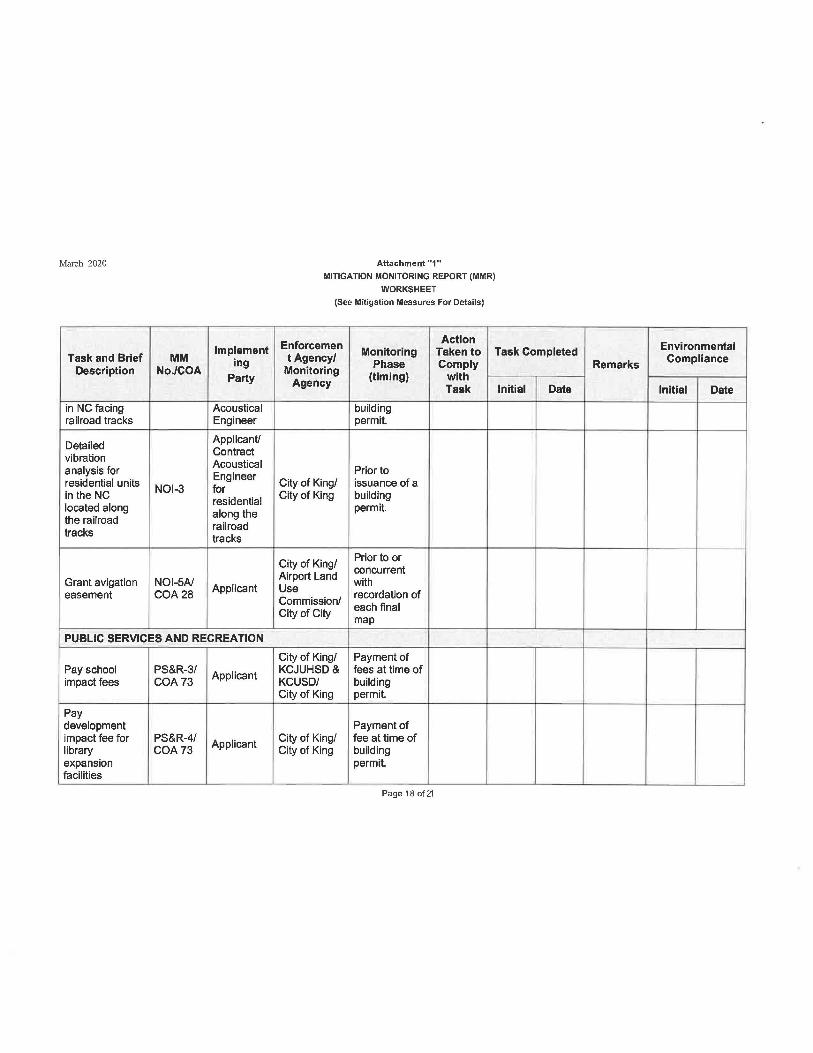
March 2020
Implement Task and Brief MM ing
Description No./COA Party
in NC facing Acoustical railroad tracks Engineer
Detailed Applicant/
vibration Contract Acoustical
analysis for Engineer residential units NOl-3 for in the NC residential located along
along the the railroad tracks
railroad tracks
Grant avigation NOi-SA/ easement COA28
Applicant
PUBLIC SERVICES AND RECREATION
Pay school PS&R-3/ Applicant impact fees COA73
Pay development impact fee for PS&R-4/
Applicant library COA 73 expansion facilities
Attachment "1"
MITIGATION MONITORING REPORT (MMR)
WORKSHEET
(See Mitigation Measures For Details)
Action Enforcemen Monitoring Taken to Task Completed t Agency/
Phase Comply Monitoring (timing) with
Agency Task Initial Date
building permit.
Prior to City of King/ issuance of a City of King building
permit.
City of King/ Prior to or concurrent
Airport Land with Use recordation of Commission/ each final City of City map
City of King/ Payment of KCJUHSD& fees at time of KCUSD/ building City of King permit.
Payment of City of King/ fee at time of City of King building
permit.
Page 18 of21
Environmental
Remarks Compliance
Initial Date
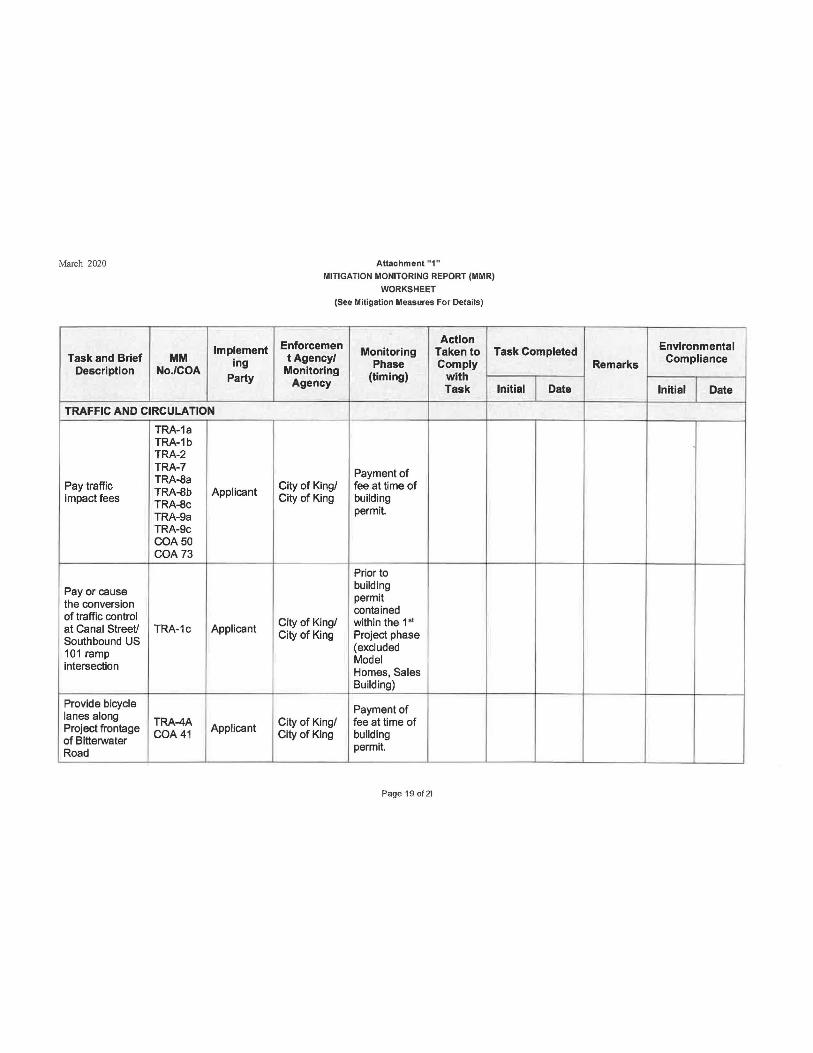
March 2020
Implement Task and Brief MM
Description No./COA ing
Party I
TRAFFIC AND CIRCULATION
TRA-1a TRA-1b TRA-2 TRA-7
Pay traffic TRA-8a TRA-8b Applicant
impact fees TRA-8c TRA-9a TRA-9c COA50 COA 73
Pay or cause the conversion of traffic control at Canal Street/ TRA-1c Applicant Southbound US 101 ramp intersection
Provide bicycle lanes along
TRA-4A Project frontage Applicant of Bltterwater
COA41
Road
Attachment "1"
MITIGATION MONITORING REPORT (MMR)
WORKSHEET
{See Mitigation Measures For Details)
Action Enforcemen tAgency/ Monitoring Taken to Task Completed
Monitoring Phase Comply
Agency (timing) with Initial I Task Date
Payment of City of King/ fee at time of City of King building
permit.
Prior to building permit contained
City of King/ within the 1 •1
City of King Project phase (excluded Model Homes, Sales Building)
Payment of City of King/ fee at time of City of King building
permit.
Page 19 of 21
Environmental
Remarks Compliance
Initial I Date
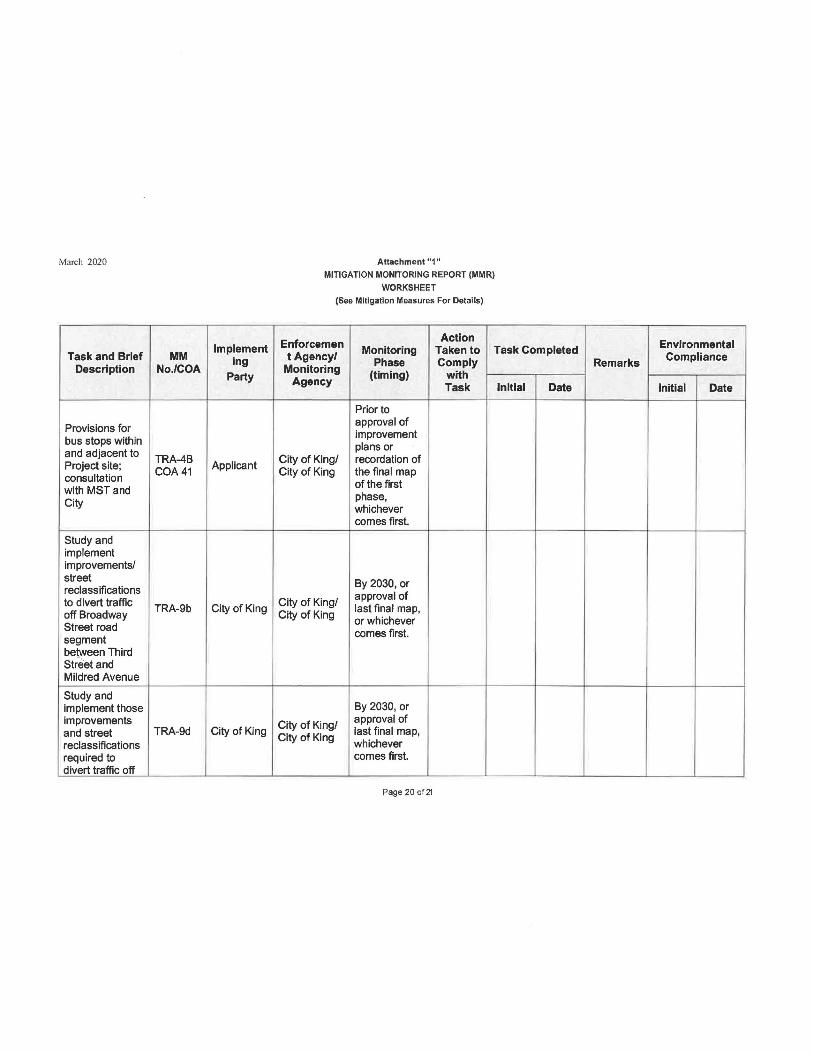
March 2020
Implement Task and Brief MM
Description No./COA ing
Party
Provisions for bus stops within and adjacent to
TRA-4B Project site; Applicant consultation
COA41
with MST and City
Study and implement improvements/ street reclassifications to d Ive rt traffic
TRA-9b City of King off Broadway Street road segment between Third Street and Mildred Avenue
Study and implement those improvements and street TRA-9d City of King reclassifications required to divert traffic off
Attachment "1"
MITIGATION MONITORING REPORT (MMR)
WORKSHEET
(See Mitigation Measures For Details)
Action Enforcemen
t Agency/ Monitoring Taken to Task Completed
Monitoring Phase Comply
Agency {timing) with
Task Initial Date
Prior to approval of improvement plans or
City of King/ recordation of City of King the final map
of the first phase, whichever comes first.
By 2030, or
City of King/ approval of
City of King last final map, or whichever comes first.
By 2030, or
City of King/ approval of last final map,
City of King whichever comes first.
Page 20 of21
Environmental
Remarks Compliance
Initial Date
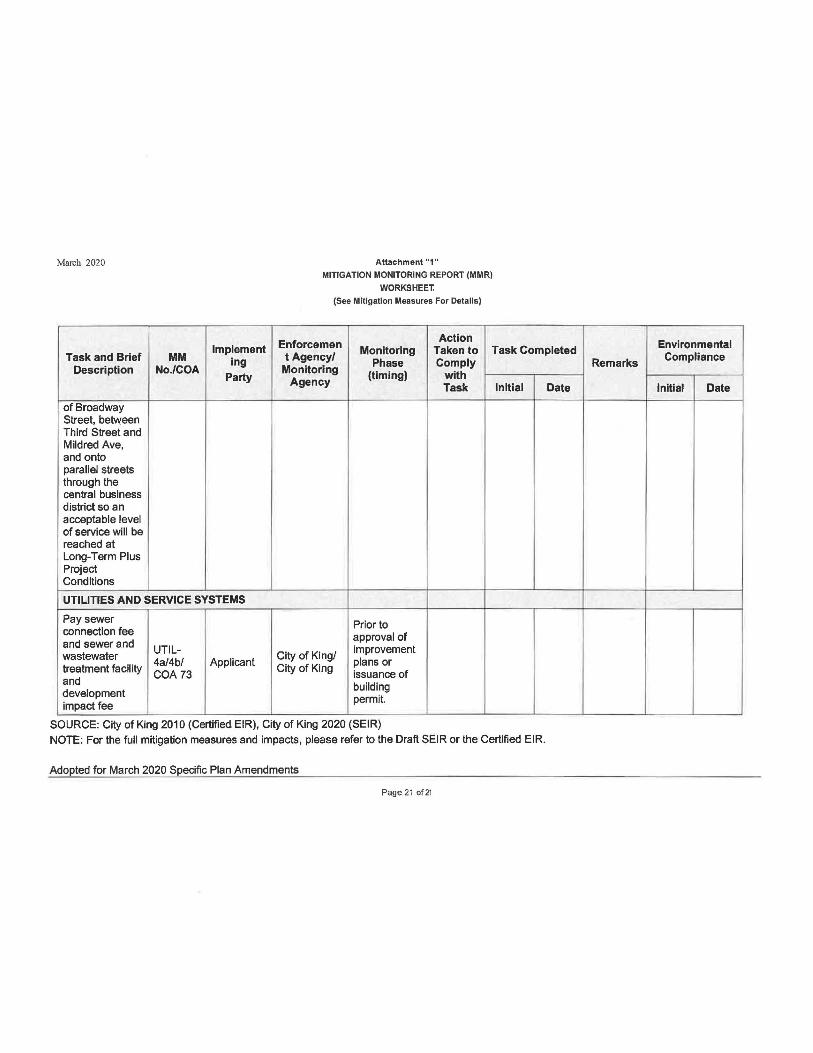
March 2020 Attachment "1 "
MITIGATION MONITORING REPORT (MMR)
WORKSHEET.
(See Mitigation Measures For Details)
Action Enforcemen Implement Monitoring Taken to Task Completed Task and Brief MM tAgency/ ing Phase Comply
Description No./COA Party
Monitoring (timing) with Agency Task Initial Date
of Broadway Street, between Third Street and Mildred Ave, and onto parallel streets through the central business district so an acceptable level of service will be reached at Long-Term Plus Project Conditions
UTILITIES AND SERVICE SYSTEMS
Pay sewer Prior to connection fee approval of and sewer and wastewater
UTIL- City of King/ improvement
treatment facility 4a/4b/ Applicant
City of King plans or
COA 73 issuance of and building development impact fee
permit.
SOURCE: City of King 2010 (Certified. EIR), City of King 2020 (SEIR)
NOTE: For the full mitigation measures and impacts, please refer to the Draft SEIR or the Certified EIR.
Adopted for March 2020 Specific Plan Amendments
Page 21 of21
Environmental
Remarks Compliance
Initial Date

J-1Adopted 14 June 2011 / Amended 28 January 2014 / Amended 24 March 2020
Precise Description of Specific Plan Area Boundary
Appendix J
Precise Description of Specific Plan Area Boundary Appendix J contains the following documents:
“ Exhibit A” - Description for the King City Downtown Addition Specific Plan - July 18, 2019
“ Exhibit A" - Plot to Accompany Description for the King City Downtown Addition Specific Plan - July 18, 2019

Downtown Addition Specific Plan
City of King, CaliforniaJ-2
Precise Description of Specific Plan Area Boundary
Appendix J
This page intentionally left blank.
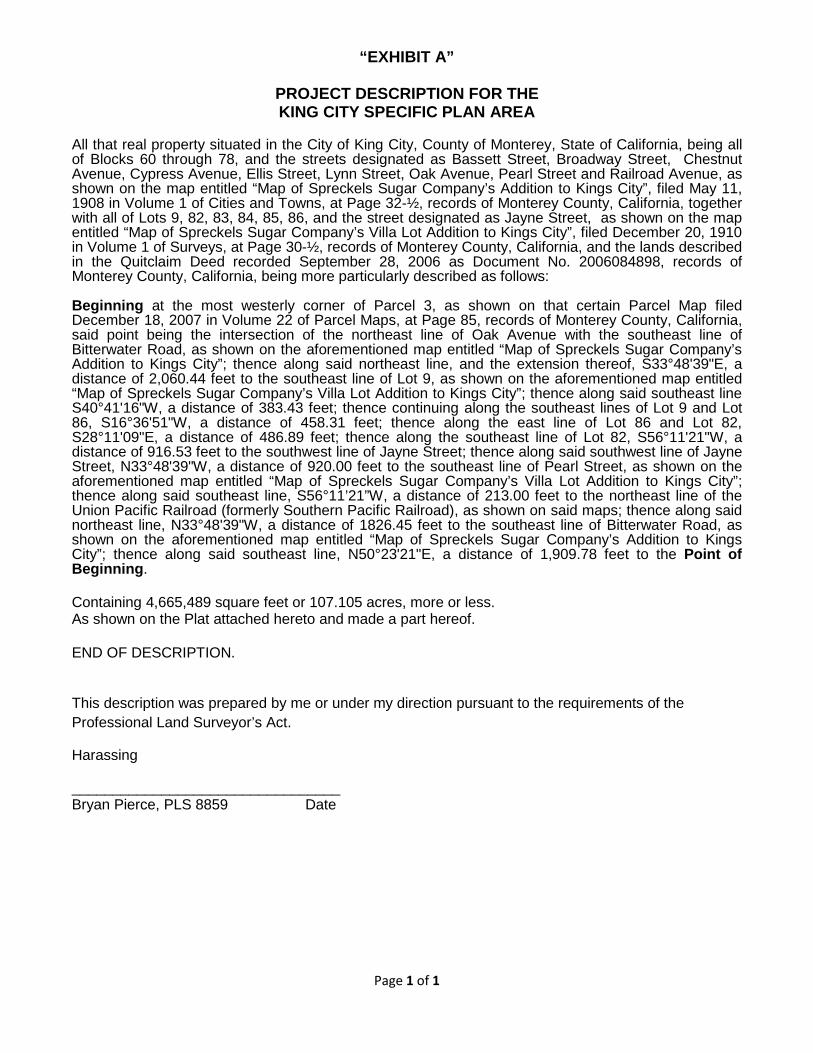
“EXHIBIT A”
PROJECT DESCRIPTION FOR THE KING CITY SPECIFIC PLAN AREA
All that real property situated in the City of King City, County of Monterey, State of California, being all of Blocks 60 through 78, and the streets designated as Bassett Street, Broadway Street, Chestnut Avenue, Cypress Avenue, Ellis Street, Lynn Street, Oak Avenue, Pearl Street and Railroad Avenue, as shown on the map entitled “Map of Spreckels Sugar Company’s Addition to Kings City”, filed May 11, 1908 in Volume 1 of Cities and Towns, at Page 32-½, records of Monterey County, California, together with all of Lots 9, 82, 83, 84, 85, 86, and the street designated as Jayne Street, as shown on the map entitled “Map of Spreckels Sugar Company’s Villa Lot Addition to Kings City”, filed December 20, 1910 in Volume 1 of Surveys, at Page 30-½, records of Monterey County, California, and the lands described in the Quitclaim Deed recorded September 28, 2006 as Document No. 2006084898, records of Monterey County, California, being more particularly described as follows:
Beginning at the most westerly corner of Parcel 3, as shown on that certain Parcel Map filed December 18, 2007 in Volume 22 of Parcel Maps, at Page 85, records of Monterey County, California, said point being the intersection of the northeast line of Oak Avenue with the southeast line of Bitterwater Road, as shown on the aforementioned map entitled “Map of Spreckels Sugar Company’s Addition to Kings City”; thence along said northeast line, and the extension thereof, S33°48'39"E, a distance of 2,060.44 feet to the southeast line of Lot 9, as shown on the aforementioned map entitled “Map of Spreckels Sugar Company’s Villa Lot Addition to Kings City”; thence along said southeast line S40°41'16"W, a distance of 383.43 feet; thence continuing along the southeast lines of Lot 9 and Lot 86, S16°36'51"W, a distance of 458.31 feet; thence along the east line of Lot 86 and Lot 82, S28°11'09"E, a distance of 486.89 feet; thence along the southeast line of Lot 82, S56°11'21"W, a distance of 916.53 feet to the southwest line of Jayne Street; thence along said southwest line of Jayne Street, N33°48'39"W, a distance of 920.00 feet to the southeast line of Pearl Street, as shown on the aforementioned map entitled “Map of Spreckels Sugar Company’s Villa Lot Addition to Kings City”; thence along said southeast line, S56°11’21”W, a distance of 213.00 feet to the northeast line of the Union Pacific Railroad (formerly Southern Pacific Railroad), as shown on said maps; thence along said northeast line, N33°48'39"W, a distance of 1826.45 feet to the southeast line of Bitterwater Road, as shown on the aforementioned map entitled “Map of Spreckels Sugar Company’s Addition to Kings City”; thence along said southeast line, N50°23'21"E, a distance of 1,909.78 feet to the Point of Beginning.
Containing 4,665,489 square feet or 107.105 acres, more or less. As shown on the Plat attached hereto and made a part hereof.
END OF DESCRIPTION.
This description was prepared by me or under my direction pursuant to the requirements of the Professional Land Surveyor’s Act.
Harassing
_________________________________ Bryan Pierce, PLS 8859 Date
Page 1 of 1
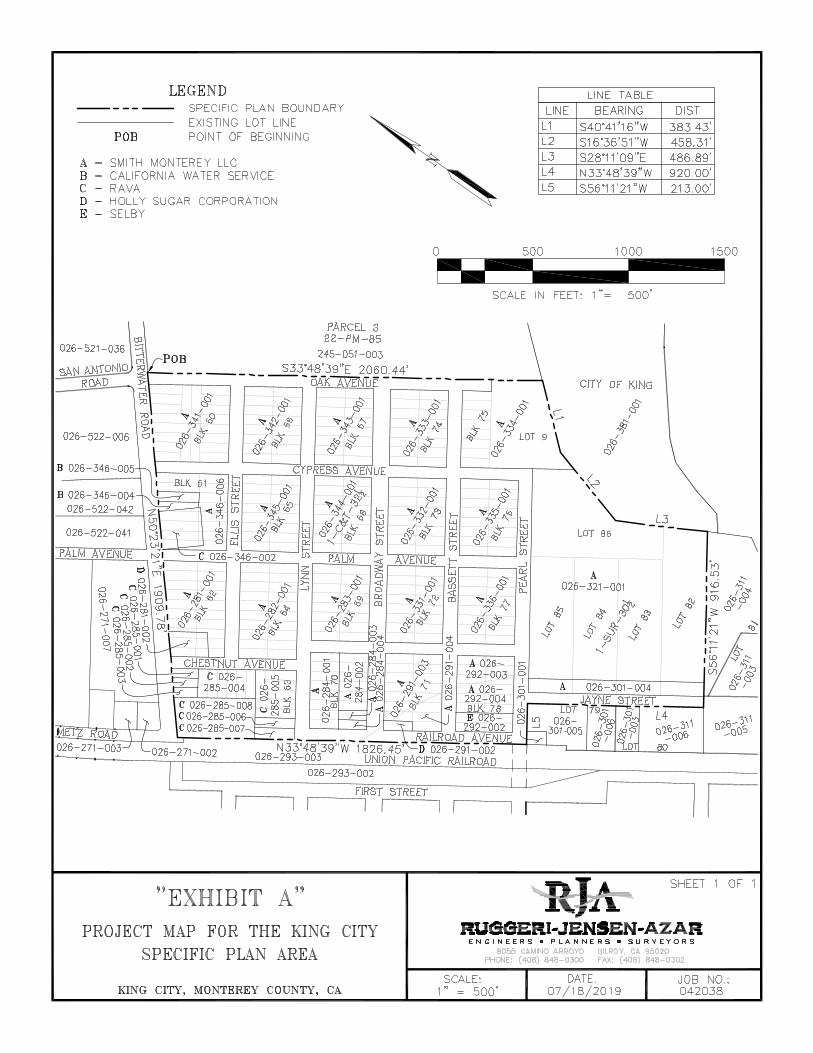
Related Documents