APPENDIX 8 PG SLURRY PARTICLE SIZING RESULTS Page 322

Welcome message from author
This document is posted to help you gain knowledge. Please leave a comment to let me know what you think about it! Share it to your friends and learn new things together.
Transcript

APPENDIX 8
PG SLURRY PARTICLE SIZING RESULTS
Page 322

Grain size bin (microns)
From
1.8 4.86 5.9 7.16 8.7 10.56 12.83 15.58 18.91 22.97 27.89 33.87 41.13 49.95 60.65 73.66 89.44 108.61 131.9 160.17 194.5 236.19 286.82 348.29 422.95 513.61 623.7 757.38 919.73 1116.87 1356.26 1646.98To 4.86 5.9 7.16 8.7 10.56 12.83 15.58 18.91 22.97 27.89 33.87 41.13 49.95 60.65 73.66 89.44 108.61 131.9 160.17 194.5 236.19 286.82 348.29 422.95 513.61 623.7 757.38 919.73 1116.87 1356.26 1646.98 2000
3894-01 0.92 2.08 2.68 2.63 2.17 1.71 1.6 2.04 3.01 4.19 5.29 6.29 7.07 7.56 7.74 7.61 7.22 6.65 5.82 4.7 3.44 2.33 1.56 1.09 0.78 0.62 0.54 0.43 0.21 0 0 0 99.983894-02 1.04 2.29 2.91 2.79 2.18 1.53 1.2 1.4 2.09 2.98 3.84 4.68 5.49 6.31 7.14 7.87 8.28 8.24 7.53 6.13 4.31 2.62 1.46 0.88 1.01 1.03 1.22 1 0.52 0.05 0 0 100.02
3926-01 1.3 2.89 3.7 3.62 3.02 2.46 2.39 3.02 4.24 5.46 6.26 6.81 7.17 7.39 7.35 6.86 5.98 4.9 3.78 2.77 1.92 1.33 1.03 0.91 0.86 0.82 0.77 0.63 0.35 0.01 0 0 1003926-02 1.34 2.97 3.82 3.74 3.11 2.49 2.37 3.01 4.27 5.65 6.77 7.73 8.51 9 8.88 7.95 6.4 4.64 3.02 1.74 0.87 0.39 0.23 0.18 0.25 0.21 0.23 0.16 0.06 0 0 0 99.993959-01 0.96 2.25 2.96 2.97 2.51 2.01 1.86 2.3 3.35 4.73 6.17 7.68 9.04 9.9 9.96 9.12 7.65 5.9 4.12 2.47 1.15 0.31 0 0 0.01 0.12 0.19 0.19 0.11 0 0 0 99.993959-02 0.77 1.79 2.33 2.3 1.89 1.44 1.27 1.56 2.34 3.43 4.61 5.92 7.2 8.22 8.72 8.6 7.98 7.09 6 4.75 3.5 2.49 1.82 1.34 0.92 0.63 0.48 0.38 0.21 0 0 0 99.984038-01 1.38 3.02 3.81 3.61 2.8 1.96 1.53 1.75 2.54 3.49 4.25 4.88 5.35 5.68 5.82 5.72 5.41 5 4.49 3.88 3.26 2.8 2.65 2.72 2.85 2.94 2.79 2.22 1.23 0.19 0 0 100.024038-02 1.32 2.9 3.69 3.53 2.78 1.98 1.61 1.87 2.7 3.68 4.47 5.1 5.56 5.91 6.16 6.28 6.24 6.04 5.56 4.75 3.71 2.74 2.09 1.75 2.1 1.88 1.65 1.24 0.64 0.08 0 0 100.01
4071-01 0.83 1.91 2.49 2.46 2.04 1.57 1.38 1.66 2.4 3.41 4.5 5.7 6.88 7.81 8.23 7.99 7.23 6.23 5.14 4.05 3.06 2.37 2.08 1.96 1.79 1.56 1.28 1.01 0.68 0.3 0 0 1004071-02 0.98 2.23 2.89 2.82 2.26 1.63 1.32 1.55 2.34 3.45 4.66 5.93 7.09 7.89 8.1 7.66 6.81 5.83 4.87 3.98 3.18 2.59 2.28 2.07 1.77 1.39 1.04 0.75 0.48 0.18 0 0 100.024109-01 2.69 6.51 8.65 8.69 7.18 5.17 3.65 3.08 3.36 3.92 4.39 4.73 4.8 4.59 4.26 4.09 4.22 4.41 4.27 3.55 2.35 1.13 0.33 0 0 0 0 0 0 0 0 0 100.024109-02 2.96 6.94 9.07 8.88 7 4.62 2.8 2.08 2.39 3.21 4.06 4.77 5.13 5.09 4.8 4.6 4.63 4.71 4.47 3.68 2.43 1.18 0.39 0.09 0 0 0 0 0 0 0 0 99.984171-01 1.97 4.6 6.01 5.94 4.85 3.54 2.72 2.7 3.37 4.19 4.76 5.05 4.99 4.63 4.19 4 4.23 4.68 4.95 4.74 3.98 2.97 2.2 1.74 1.32 0.89 0.51 0.23 0.04 0 0 0 99.994171-02 2.58 5.72 7.3 6.97 5.35 3.49 2.29 2.17 2.96 4.02 4.79 5.18 5.11 4.69 4.18 3.95 4.11 4.47 4.67 4.44 3.72 2.76 1.98 1.42 0.92 0.5 0.22 0.07 0 0 0 0 100.034198-01 2.41 5.29 6.7 6.32 4.73 2.93 1.81 1.79 2.82 4.35 5.8 6.94 7.42 7.07 6.09 5.08 4.48 4.27 4.12 3.65 2.72 1.61 0.81 0.4 0.2 0.1 0.05 0.02 0 0 0 0 99.984198-02
3.18 6.83 8.43 7.75 5.69 3.48 2.09 1.87 3.1 4.47 5.65 6.47 6.69 6.28 5.48 4.75 4.35 4.15 3.77 2.93 1.76 0.7 0.14 0 0 0 0 0 0 0 0 0 100.01
4289-01 1.36 3.01 3.84 3.65 2.76 1.74 1.06 0.98 1.43 2.09 2.68 3.11 3.29 3.26 3.14 3.11 3.3 3.61 3.85 3.89 3.75 3.67 4.01 4.81 5.59 6.04 5.96 5.27 3.97 1.77 0 0 1004289-02 1.71 3.53 4.34 3.95 2.78 1.56 0.88 0.98 1.8 2.89 3.79 4.42 4.67 4.56 4.27 4.07 4.13 4.32 4.36 4.07 3.48 2.94 2.88 3.38 3.99 4.34 4.26 3.73 2.76 1.15 0 0 99.994310-01 1.06 2.42 3.16 3.12 2.56 1.92 1.59 1.76 2.35 3.03 3.56 3.9 4.04 4.05 4.15 4.57 5.43 6.49 7.31 7.45 6.68 5.33 4.11 3.25 2.54 1.88 1.27 0.75 0.28 0 0 0 100.014310-02 0.76 1.89 2.55 2.61 2.22 1.71 1.34 1.27 1.45 1.73 1.95 2.11 2.17 2.19 2.26 2.54 3.08 3.75 4.31 4.57 4.53 4.49 4.96 6.09 7.3 7.98 7.46 5.65 3.45 1.58 0.08 0 100.03
4363-01 1.46 3.43 4.51 4.47 3.64 2.61 1.98 2.05 2.82 3.95 5.09 6.1 6.72 6.83 6.56 6.25 6.14 6.07 5.72 4.83 3.44 1.99 1.03 0.63 0.5 0.44 0.37 0.26 0.11 0 0 0 1004363-02
1.36 3.21 4.22 4.21 3.47 2.58 2.05 2.18 2.9 3.89 4.83 5.65 6.16 6.28 6.14 6.01 6.1 6.24 6.06 5.26 3.88 2.34 1.27 0.82 0.93 0.71 0.48 0.55 0.21 0 0 0 99.99
PG001A 0.57 1.32 1.73 1.75 1.52 1.32 1.38 1.83 2.65 3.61 4.46 5.15 5.54 5.62 5.43 5.16 5.03 5.1 5.24 5.26 5.04 4.71 4.43 4.1 3.58 2.98 2.36 1.75 1.05 0.35 0 0 100.02PG001B 0.66 1.58 2.11 2.17 1.95 1.75 1.88 2.5 3.59 4.88 6.09 7.11 7.72 7.79 7.28 6.39 5.4 4.56 3.88 3.28 2.67 2.1 1.65 1.32 1.16 1.29 1.7 2.15 2.16 1.22 0 0 99.99 1.48 3.36 4.33 4.21 3.35 2.38 1.84 1.98 2.76 3.78 4.70 5.48 5.99 6.19 6.10 5.84 5.58 5.31 4.89 4.20 3.28 2.41 1.89 1.71 1.68 1.60 1.45 1.19 0.77 0.29 0.00 0.00 100.00
mean
standard deviation
skewness kurtosis mode1 mode2 mode3 mode4 mode5
25th percent
50th percent 75th percent
96.82 118.59 3.53 17.11 68 7 30 62 119119.52 152.52 3.28 12.88 108 7 694 485 35 78 141
86.02 131.71 3.93 18.54 59 7 21 47 9260.24 75.62 5.8 49.83 59 7 21 44 7664.91 72.46 6.55 66.77 61 7 27 51 84101.7 118.12 3.41 16.31 71 7 35 68 123
160.47 220.07 2.13 4.24 68 7 570 27 69 181129.37 177.78 2.68 7.93 85 7 477 26 67 147126.58 175.45 3.09 11.18 69 7 34 68 133118.66 160.22 3.11 11.91 64 7 32 65 130
50.6 59.55 1.71 2.58 7 43 126 8 24 7153.19 61.46 1.69 2.78 7 49 118 8 28 7791.17 122.33 2.58 8.66 7 40 149 11 42 12579.04 104.05 2.44 7.88 7 40 146 9 37 10962.31 72.54 2.62 11.35
46 7 10 39 81
49.07 53.33 1.71 2.9 7 44 8 31 67288.22 315.68 1.15 0.38 611 7 166 48 35 150 481221.96 284.03 1.62 1.84 47 7 137 605 29 89 318146.89 160.79 2.03 5.16 166 7 31 99 200324.68 307.27 0.95 0.13 580 185 7 56 227 529
82.97 103.39
3.67 20.37 52 7 20 52 11094.11 123.1 3.46 16.28 54 122 7 468 816 21 55 122
179.31 213.23 2.03 4.42 52 165 7 38 93 239148.79 242.53 2.78 7.31 51
927 7
30 58 129
122.36 151.08 2.83 12.86 71.67 25.08 68.46 161.83
Page 323

APPENDIX 9
PG MICROPROBE REPORTS
Page 324

SUBJECT OF REPORT
Microprobe analysis of gypsum samples
AdvancedAnalyticalCentre
James Cook UniversityTownsvilleQueensland 4811Australia
Telephone (07) 4781 4599International Telephone 61 7 4781 4599Facsimile (07) 4781 5550International Facsimile 61 7 4781 5550
Requested by: Susan Dippel Date:16/08/02Written by:Kevin Blake Job No:4691-02Checked by:Alan Chappell Account Code:N/AApproved by:Alan Chappell Unit:EM

Advanced Analytical Centre Job No. 4691-02
1. PROCEDURE
Three (3) samples were received into the Advanced Analytical Centre (AAC) in labelled plastic jars.The samples were given AAC run numbers and relabelled accordingly.
Members of the Advanced Analytical Centre took no part in the initial sampling procedure.
It was requested that the samples be analysed by electron microprobe to determine the chemistry ofthe grains present.
2. METHOD
2.1 Sample PreparationThe samples were dries then mounted onto Al stubs and carbon coated in order to provide anelectrically conductive surface necessary for analysis by electron microprobe.
2.2 Instrumentation
The samples were analysed using a JEOL JXA 840A electron probe microanalyser operating at 15kVaccelerating voltage. The samples were examined initially in backscatter electron mode (meanatomic number contrast) in order to determine the overall homogeneity of the material present. Usingthis technique areas of the sample with a higher atomic number will appear brighter. Where differentbackscatter areas were identified elemental analysis was performed using energy dispersivespectrometry (EDS). It should be noted that with rough surfaces the backscatter image will also beaffected by the morphology of the sample as the electrons produced are scattered away from thedetector producing an image which is a combination of mean atomic number and grain morphology.
3. RESULTS
All three samples demonstrated similar grain morphology and a mix of grain chemistries. Thedominant mineralogy was of a calcium-sulphur bearing phase (presumed gypsum) with an intermixedsilicon phase (presumed quartz). The silicon (quartz) phase was found both as fine grains within thegypsum and as large discrete grain. Fine particles (typically 2 to 10 microns across) of a chromium-iron phase were seen as rare grains (forming less than 0.5% of the sample).
The following figures display secondary electron (morphology), backscatter electron (mean atomicnumber contrast) images of the three samples and representative energy dispersive spectra (EDS).
Energy Dispersive Spectra - from sample GYP-N - illustrated in image above(A=bulk of sample, gypsum; B=large quartz grains; C=Cr-Fe particles)
A CB
Sample GYP-Nsecondary electron image of typicalgypsum morphology
Sample GYP-Nbackscatter electron image - showslittle/no variation in average chemistry
Sample GYP-Nbackscatter electron image of quartz (B) grainwith gypsum (A) and Cr-Fe grains (C)(progressively lighter in greyscale)
Figure 1Sample GYP-N
AC
B
20microns
50microns
50microns
Advanced Analytical Centre Job No. 4691-02

D
E
F
G
D
F
Energy Dispersive Spectra - from sampleGYP-O - illustrated in image above(D=bulk of sample, gypsum; E=fine grainedgypsum +phosphorous and quartz) grains;F=quartz; G=Cr-Fe particles). - Illustrated inimages above.
Sample GYP- Osecondary electron image of typicalgypsum morphology with minor quartzand P-bearing Ca-S phase.
Sample GYP-Osecondary electron image - shows large,angular quartz grains (F) and matrixgypsum (D).
Sample GYP-Obackscatter electron image of gypsum withand Cr-Fe grains (G)
Figure 2Sample GYP-O
25microns
25microns
500microns
Advanced Analytical Centre Job No. 4691-02

25microns
Figure 3Sample HEMIBackscatter electron images showing the three main phases (as seen in previous samples) darkest =quartz, mid-grey=gypsum and bright grains in center= Cr-Fe. The latter is shown in the energydispersive spectra. Note the grains are very small and the Si peak is due to the fact that the quartzthe Fe grains are sitting on is also analysed.
Advanced Analytical Centre Job No. 4691-02
James Cook University Advanced
Analytical Centre
Townsville Queensland 4811 Australia Telephone (07) 4781 4599International Telephone 61 7 4781 4599Facsimile (07) 4781 5550International Facsimile 61 7 4781 5550
SUBJECT OF REPORT
Electron Microprobe study of gypsum
samples
Requested by: Susan Dippel Date:09/09/03 Written by:K.L.Blake Job No:5637-03 Checked by:Alan Chappell Account Code:N/A Approved by:Alan Chappell Unit:Electron Microscopy

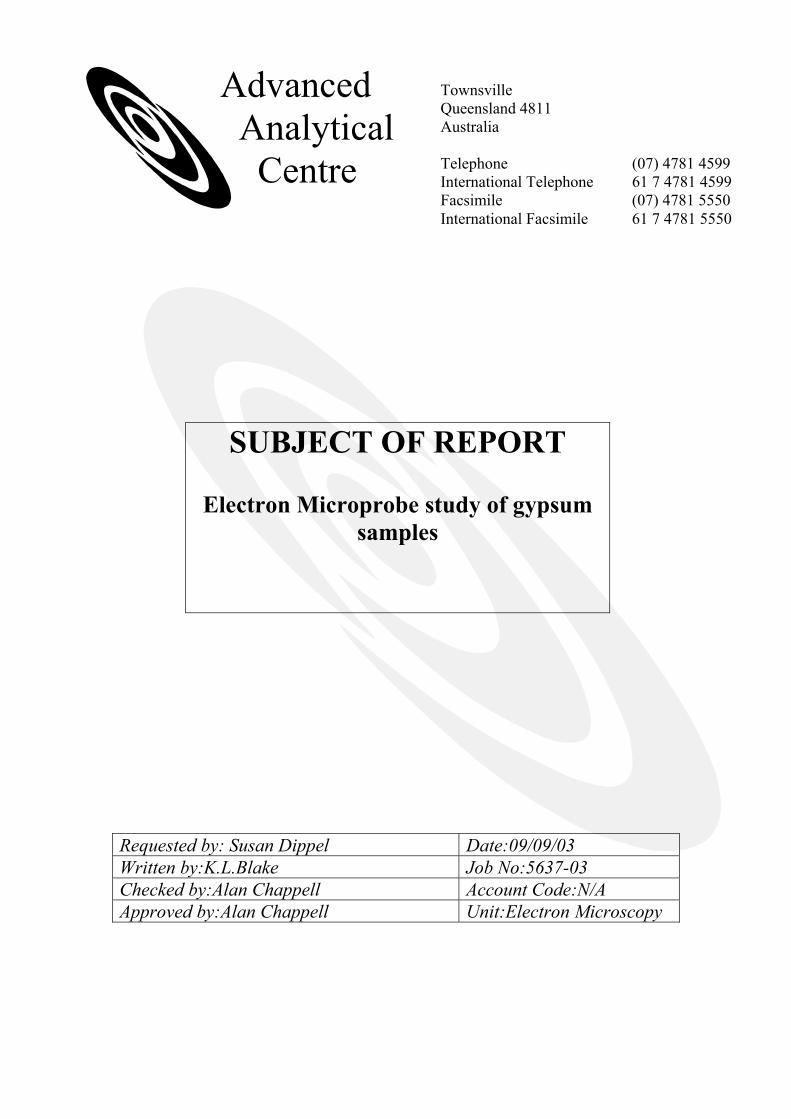
Advanced Analytical Centre - Job No5637-03 ___________________________________________________________________________________ 1. PROCEDURE 5 samples were received into the Advanced Analytical Centre (AAC) in labelled containers. The samples were given AAC run numbers and relabelled accordingly. Members of the Advanced Analytical Centre took no part in the sampling procedure. Work requested: To determine, by electron microprobe, any phases present, other than gypsum. 2. METHOD 2.1 Sample Preparation The samples were dried and cast as a resin block. This was then cut to provide a cross-section through the sample and the surface polished. The polished blocks were carbon coated in order to provide an electrically conductive surface necessary for analysis by electron microprobe. 2.2 Instrumentation The samples were analysed using a JEOL JXA 8200 EPMA operating at 15kV accelerating voltage, images collected were saved in a bitmap format. 3. Results Analyses of the five samples showed them to have similar properties and are thus described together. Much of the original gypsum material was lost during cutting and polishing of the sample due to it’s relative softness. The bulk of the remaining material is comprised of quartz. The samples were reviewed using backscatter electron imagery. Backscattered electron images vary in greyscale according to mean atomic number contrast (thus atomically heavier grains appear brighter). Using this technique areas of apparently different chemistry were analysed using energy dispersive x-ray spectrometry (EDS). These are illustrated in figure 1. In addition to quartz a number of relatively minor phases were identified, mainly within the quartz grains. By far the most common was an iron-bearing phase (most likely as an oxide) and a calcium-phosphorous phase. These were seen most commonly as minor inclusions within quartz. In a few places the iron phase had minor manganese. One sample (GO-MS) also showed an isolated grain of a barium sulphate. In order to further demonstrate this an element map was produced from one sample (GO-BS). The results area shown in figure 2. As would be expected silicon dominates the area reflecting the high proportion of quartz grains. Fine grained gypsum is dispersed through the resin matrix and is seen as a direct correlation between Ca and S distribution. Some discrete high concentrations of Ca correlate to similar highs in P as inclusions in quartz. Similarly minor highs in Fe concentration reflect discrete inclusions of iron in quartz.
Page. 1 Author – Dr K.L.Blake
Advanced Analytical Centre - Job No5637-03 ___________________________________________________________________________________
Quartz
Ca, P
Fe
Fe (minor Mn)
Quartz
Ca, PBa, S
Quartz
Page. 2 Author – Dr K.L.Blake

Advanced Analytical Centre - Job No5637-03 ___________________________________________________________________________________ Figure 1. Backscatter electron images showing quartz grains and associated inclusions.
Figure 2. Element distribution map (sample GO-BS) – Note: elements are displayed separately and shown by their symbol, CP image is a backscatter image of the sample. Sample shows gypsum distributed through matrix (Ca and S); high Ca spots correlate to high phosphorous as inclusions in quartz; minor high spots of Fe also seen in quartz.
Page. 3 Author – Dr K.L.Blake

APPENDIX 10
XRF STANDARDS AND REPRODUCIBILITY DATA
Page 334

Reproducibility Data
Sample Date SiO2 (%) TiO2 (%)
Al2O3 (%) Fe2O3 (%)
MnO (%) MgO (%) CaO (%) Na2O (%) K2O (%) P2O5 (%) SO3 (%) F (%) CO2 (%) Sum (%) GYP-D 11/10/2002 10:43 0.0688.603 2.455 0.0281.059 1.672 28.142 0.115 0.539 0.034 36.274 0.752 100.5620.82GYP-D 15/08/2002 11:47 0.0698.601 2.456 0.0281.055 1.682 28.283 0.133 0.54 0.035 36.316 0.567 100.58520.82GYP-D-010330 30/03/2001 16:54 8.627 0.065 1.958 1.053 0.029 1.61 28.444 0.473 0.531 0.029 35.3 0.287 99.22620.82GYP-D-010831 31/08/2001 16:46 8.582 0.068 2.011 1.048 0.029 1.669 28.109 0.129 0.54 0.035 36.414 0.556 100.01
20.82
GYP-DA 09/02/2001 13:58 0.0688.45 1.976 0.0291.079 1.692 28.125 0.062 0.529 0.042 35.871 1.035 20.82GYP-DA-010621 21/06/2001 13:39 8.583 0.068 2.01 1.05 0.028 1.649 28.081 0.064 0.536 0.032 36.444 0.614 20.82 99.98GYP-DB 09/02/2001 14:05 0.0688.55 2.008 0.0281.055 1.642 28.238 0.083 0.53 0.028 36.252 0.228 20.82GYP-DB-010913 13/09/2001 23:59 8.606 0.068 2.042 1.048 0.029 1.672 28.287 0.104 0.538 0.036 36.374 0.606 100.23120.82gyp-d 17/05/2001 18:28 0.0698.605 1.0592.038 0.028 1.667 28.433 0.08 0.537 0.034 36.458 0.391 100.2220.82gyp-d-b 04/04/2001 17:35 0.0688.581 2.03 0.0281.05 1.666 28.315 0.087 0.535 0.03 36.205 0.465 99.8820.82gyp-d-b 03/04/2001 14:40 0.0688.591 2.007 0.0281.052 1.646 28.197 0.075 0.535 0.03 36.119 0.337 99.50720.82gyp-da 12/03/2001 14:44 0.0688.542 2.015 0.0291.079 1.72 28.152 0.096 0.534 0.041 35.954 1.246 100.29420.82gyp-db 05/09/2001 15:38 0.0688.618 2.064 0.0271.052 1.672 28.253 0.119 0.541 0.036 36.378 0.613 100.26120.82gyp-db 03/09/2001 9:36 0.0678.605 1.0522.026 0.028 1.661 28.191 0.118 0.534 0.035 36.203 0.471 99.8120.82gyp-db 31/07/2001 13:02 0.0688.578 2.013 0.0281.056 1.662 28.162 0.097 0.536 0.034 36.315 0.528 99.897
20.82
Average 8.5814667 0.067867 1.056466672.07393333 0.0282667 1.6654667 28.22747 0.1223333 0.535667 0.0340667 36.1918 0.57973 20.82Std Dev. 0.0430114 0.000915 0.009753140.15696154 0.0005936 0.0245003 0.110102 0.099553 0.003677 0.0039725 0.299173 0.26941 3.68E-15R.S.D 0.5012127 1.348932 0.923185177.56830191 2.1000596 1.4710796 0.390052 81.378514 0.686523 11.661031 0.826631 46.4718
CertifiedGYP-D
100.19 8.7 0.084
1.082.03 0.03 1.73 28.2 0.07 0.54 0.025 36.7 N.S. 20.82
Standards Used for Calibration
Sum(%) SiO2(%) Al2O3(%)TiO2(%) Fe2O3(%) MnO(%) MgO(%) CaO(%) Na2O(%) K2O(%) P2O5(%) SO3(%) SrO(%) F(%) CO2(%)GBW03109 100.22 0.27 0.002 0.016 0.015 T 1.02 40.7 0.018 0.016 T 55.63 0.23 T 2.3 GBW03111 100.05 4.16 0.058 1.14 0.38 T 3.19 30.28 0.014 0.23 T 37.64 0.077 T 22.88GYP-D 100.19 8.7 0.084 2.03 1.08 0.03 1.73 28.2 0.07 0.54 0.025 36.7 0.18 T 20.82GYP1 100 14.79 0.07 1.89 1.01 0.03 1.61 26.32 0.07 0.5 0.03 34.25 T T 19.43GYP2 99.92 12.12 0.05 1.17 0.65 0.02 2.33 35.14 0.05 0.31 0.03 19.62 T T 28.43GYP3 99.99 26.96 0.06 1.62 0.86 0.02 1.38 22.56 0.06 0.43 0.02 29.36 T T 16.66GYP4 99.96 25.18 0.05 1.14 0.63 0.02 1.86 28.44 0.04 0.3 0.03 19.61 T T 22.66GYP5 100 8.12 0.07 1.89 1.01 0.03 1.61 26.32 0.07 0.5 4.14 34.25 T T 21.99GYP6 100 6.47 0.06 1.51 0.8 0.02 1.29 20.97 0.05 0.4 15.84 27.29 T T 25.3GYP7 100 6.83 0.06 1.59 0.85 0.02 1.36 22.13 0.05 0.42 13.31 28.8 T T 24.58GYP8 100.22 9.01 0.09 2.7 2.82 0.22 1.7 27.59 0.14 0.56 0.04 34.29 T 0.57 20.49GYP9 100.67 9.632 0.098 4.044 6.304 0.6 1.652 26.36 0.282 0.608 0.074 29.476 T 1.72 19.816SDO-1 100 49.28 0.71 12.27 9.34 T 1.54 1.05 0.38 3.35 0.11 13.36 0.009 T 8.601
Mixtures of standards with high purity chemicals Standard Materials
Page 335

APPENDIX 11
INDEPENDENT ANALYSIS OF SLURRY SAMPLE PG008A UNDERTAKEN BY SIETRONICS PTY. LIMITED, SEPTEMBER 2004
Page 336

Trace: C:\scans\4109-01.cpb Comment: PG008A Results: Contrast Corrected Weight % # ID Phase Weight%
2 26 Gypsum 55.7 1 1 Quartz 17.1 6 152 Hornblende 16.4 0.3=W 3 80 Anhydrite 6 4 68 Bassanite 2.1 7 116 Illite 1 1.9 5 23 Vermiculite 0.4 8 82 Muscovite 0.3
Trace: C:\scans\4109-01.cpb Comment: PG008A Results: Contrast Corrected Weight % # ID Phase Weight%
2 26 Gypsum 55.8 1 1 Quartz 17.2 6 152 Hornblende 16.1 0.4=W 3 80 Anhydrite 6 4 68 Bassanite 2.1 7 116 Illite 1 2 8 82 Muscovite 0.4 5 23 Vermiculite 0.4
Page 337
Related Documents