Appendix 6 Geotechnical Engineering Report VANTAGEPOINT CHURCH Project No. PLN15-1174 INITIAL STUDY

Welcome message from author
This document is posted to help you gain knowledge. Please leave a comment to let me know what you think about it! Share it to your friends and learn new things together.
Transcript

Appendix 6 Geotechnical Engineering Report
VANTAGEPOINT CHURCH Project No. PLN15-1174
INITIAL STUDY


UPDATED GEOTECHNICAL INVESTIGATION, PROPOSED VANTAGE POINT CHURCH,
8500 ARCHIBALD AVENUE, CITY OF EASTVALE, CALIFORNIA
Prepared For:
VANTAGE POINT CHURCH 5171 Edison Avenue, Suite C
Chino, California 91710
Project No. 10640.001
November 17, 2016

November 17, 2016
Project No. 10640.001 To: Vantage Point Church
5171 Edison Avenue, Suite C
Chino, California 91710 Attention: Mr. Tom Lanning Subject: Updated Geotechnical Investigation, Proposed Vantage Point Church, 8500
Archibald Avenue, City of Eastvale, California In response to your request, Leighton and Associates, Inc. (Leighton) has conducted a geotechnical investigation for the proposed Vantage Point Church to be located at 8500 Archibald Avenue in the City of Eastvale. The purpose of this study has been to evaluate the general geotechnical conditions at the site with respect to the proposed improvements and provide preliminary geotechnical recommendations for design and construction. Based on this investigation, construction of the proposed development is feasible from a geotechnical standpoint. The most significant geotechnical issues at the site are those related to the potential for strong seismic shaking, compressible soils, and slope stability. Good planning and design of the project can limit the impact of these constraints. This report presents our preliminary findings, conclusions, and geotechnical recommendations for the project.

10640.001
- 2 -
We appreciate the opportunity to work with you on the development of this project. If you have any questions regarding this report, please call us at your convenience. Respectfully submitted, LEIGHTON AND ASSOCIATES, INC.
Jason D. Hertzberg, GE 2711 Principal Engineer
Philip A. Buchiarelli, CEG 1715 Principal Geologist
BPT/PB/JDH/rsm Distribution: (2) Addressee

10640.001
-i-
TABLE OF CONTENTS Section Page 1.0 INTRODUCTION .................................................................................................... 1 1.1 Site Location and Description ......................................................................... 1 1.2 Proposed Development .................................................................................. 1 1.3 Purpose of Investigation ................................................................................. 2 1.4 Scope of Investigation .................................................................................... 2 2.0 FINDINGS .............................................................................................................. 5 2.1 Regional Geologic Conditions ........................................................................ 5 2.2 Subsurface Soil Conditions ............................................................................ 5 2.2.1 Compressible and Collapsible Soil ...................................................... 6 2.2.2 Expansive Soils ................................................................................... 6 2.2.3 Sulfate Content .................................................................................... 6 2.2.4 Resistivity, Chloride and pH ................................................................ 7 2.3 Groundwater .................................................................................................. 7 2.4 Slope Stability ................................................................................................ 7 2.5 Faulting and Seismicity .................................................................................. 8 2.6 Secondary Seismic Hazards .......................................................................... 9 2.6.1 Liquefaction Potential .......................................................................... 9 2.6.2 Seismically Induced Settlement ......................................................... 10 3.0 CONCLUSIONS AND RECOMMENDATIONS .................................................... 11 3.1 General Earthwork and Grading ................................................................... 11 3.1.1 Site Preparation ................................................................................. 11 3.1.2 Removal of Uncontrolled Artificial Fill ................................................. 11 3.1.3 Overexcavation and Recompaction ................................................... 12 3.1.4 Fill Placement and Compaction ......................................................... 13 3.1.5 Import Fill Soil .................................................................................... 14 3.1.6 Shrinkage and Subsidence ................................................................ 14 3.1.7 Rippability and Oversized Material .................................................... 15
3.2 Slope Stability/Slope Creep .......................................................................... 15 3.3 Foundation Recommendations .................................................................... 17 3.3.1 Conventional Foundations ................................................................. 17 3.3.2 Lateral Resistance of Shallow Foundations ....................................... 18 3.3.3 Settlement ......................................................................................... 18 3.3.4 Recommendations for Slabs-On-Grade ............................................ 18 3.4 Seismic Design Parameters ......................................................................... 20
3.5 Retaining Walls ............................................................................................ 21 3.6 Infiltration/Percolation Testing ...................................................................... 22

10640.001
-ii-
TABLE OF CONTENTS Section Page
3.7 Pavement Design ......................................................................................... 24
3.8 Temporary Excavations................................................................................ 25 3.9 Trench Backfill .............................................................................................. 25 3.10 Surface Drainage ......................................................................................... 26 3.11 Sulfate Attack and Corrosion Protection ...................................................... 27 3.12 Additional Geotechnical Services ................................................................. 27 4.0 LIMITATIONS ....................................................................................................... 28 Appendices Appendix A - References Appendix B - Geotechnical Boring Logs and Infiltration Test Results Appendix C - Laboratory Test Results Appendix D - Summary of Seismic Hazard Analysis Appendix E - Slope Stability Analysis Appendix F - Infiltration Test Results Appendix G - General Earthwork and Grading Specifications Figures (Rear of Text) Figure 1 - Site Location Map Figure 2 - Exploration Location Map Figure 3 - Cross-section A-A’ Figure 4 - Cross-section B-B’ Figure 5 - Retaining Wall Backfill and Subdrain Detail

10640.001
- 1 -
1.0 INTRODUCTION 1.1 Site Location and Description
The subject property consists of approximately 10.4 acres located at 8500 Archibald Avenue in the City of Eastvale, California. The property is currently occupied by a modular home, storage shed and other out buildings and was formerly used for horse training. Edison electrical transmission lines cross from northwest to southeast across the central portion of the property, generally dividing the property into northeast and southwest sections. The remainder of the property is largely vacant. Based on a review of historical aerial photographs, the site was vacant and/or used for agriculture before 1967. In 1980, the property was still vacant; however, the outline of a future track for horse racing/training could be observed onsite. In 2002, the horse track was more developed and structures were visible onsite. It appears the electrical transmission lines were constructed sometime before 1957. The Santa Ana River lies approximately 130 to 200 yards to the east of the project site, and slopes descend about 40 feet at gradients of about 1.6:1 (horizontal to vertical) from the level area of the site to the river flood plain. The eastern side of the property extends to near the toe of the slope on the north, but roughly corresponds to the top of slope in the central portion. In the southern portion, during the period from about 1994 to 2005, uncontrolled fill was placed over the top of the slope, which resulted in extending the level pad area and moving the top of the slope eastward and offsite. Thus, in the southern portion of the property, the top of the slope descending to the river is now 40 to 60 feet beyond the eastern property line. The modular house onsite appears to straddle the eastern property line.
1.2 Proposed Development
We understand that the intention of the church development is to provide facilities for both church and community use. In general, the development concept includes construction of about 45,000 square feet of buildings, including meeting and services areas, classrooms, offices, workshops and storage areas. Current plans include a main sanctuary and administration building, and children’s and preschool buildings. Other proposed improvements include parking areas, an entry garden baptistery, children’s play area, as well as drainage, utility, street, sidewalk, landscape and associated improvements.

10640.001
- 2 -
The main building and the children’s and preschool building are to be located in the eastern portion of the site, with parking areas generally along Archibald Avenue to the west.
1.3 Purpose of Investigation
The purpose of this study has been to evaluate the general geotechnical conditions at the site with respect to the proposed development and to provide preliminary geotechnical recommendations for design and construction. Our geotechnical exploration included hollow-stem auger soil borings, test pit excavations, laboratory testing and geotechnical analysis to evaluate existing conditions and develop the recommendations contained in this report. We also conducted infiltration testing to evaluate general infiltration characteristics for water quality basin design.
1.4 Scope of Investigation The scope of our study has included the following tasks:
• Background Review: We reviewed available, relevant geotechnical and geologic maps and reports and aerial photographs available from our in-house library. This included a review of geotechnical reports previously prepared for nearby sites.
• Utility Coordination: We contacted Underground Service Alert (USA) prior to
excavating borings so that utility companies could mark utilities onsite. We also coordinated our work with you and the property representative.
• Field Exploration: A total of 9 exploratory soil borings (LB-1 through LB-5 and
WP-1 through WP-4) were logged and sampled onsite to evaluate subsurface conditions.
The borings were drilled to depths ranging from 21.5 to 51.5 feet below
the existing ground surface (bgs) by a subcontracted drill rig operator. The borings were logged by our field representative during drilling. Relatively undisturbed soil samples were obtained at selected intervals within the borings using a California Ring Sampler. Standard Penetration Tests (SPT) were conducted at selected depths and samples were

10640.001
- 3 -
obtained. Representative bulk soil samples were also collected at shallow depths from the borings.
Well permeameter tests were conducted within 4 of the borings (WP-1
through WP-4) to evaluate general infiltration rates of the subsurface soils at the depths and locations tested. The well permeameter tests were conducted based on the USBR-89 method. Tests were conducted at depths of about 1.5 to 7 feet bgs to estimate the infiltration rate for the planned water quality facilities.
All excavations were backfilled with the soil cuttings. Logs of the
geotechnical borings and the well permeameter test results are presented in Appendix B. Approximate boring and well permeameter test locations are shown on the accompanying Exploration Location Map, Figure 2.
Seven backhoe test pits (TP-1 through TP-7) were excavated, logged, and
sampled to establish limits of uncontrolled fill. The backhoe test pits were excavated to depths ranging from 2 to 5.2 feet below the existing ground surface by a subcontracted backhoe operator. Each test pit was logged by a member of our technical staff. Logs of the backhoe test pits are provided in Appendix B. Test pit locations are shown on the accompanying Test Location Map, Figure 2.
• Geotechnical Laboratory Testing: Geotechnical laboratory tests were
conducted on selected relatively undisturbed and bulk soil samples obtained during our field investigation. The laboratory testing program was designed to evaluate engineering characteristics of site soils. Laboratory tests conducted during this investigation include:
- In situ moisture content and dry density - Sieve analysis for grain-size distribution - Direct shear - Expansion Index - Water-soluble sulfate concentration - Resistivity, chloride content and pH
The in situ moisture content and dry density test results are shown on the boring logs, Appendix B. The other laboratory test results are presented in Appendix C.

10640.001
- 4 -
• Engineering Analysis: Data obtained from our background review, field exploration and geotechnical laboratory testing was evaluated and analyzed to develop geotechnical conclusions and provide preliminary recommendations presented in this report.
• Report Preparation: Results of our preliminary geotechnical investigation have been summarized in this report, presenting our findings, conclusions and preliminary geotechnical recommendations for design and construction of the proposed development.

10640.001
- 5 -
2.0 FINDINGS
2.1 Regional Geologic Conditions
The site is located within the Chino Basin in the northern portion of the Peninsular Range geomorphic province of California. Major structural features surround this region, including the Cucamonga fault and the San Gabriel Mountains to the north, the Chino fault and Puente/Chino Hills to the west, and the San Jacinto fault to the east. This is an area of large-scale crustal disturbance as the relatively northwestward-moving Peninsular Range Province collides with the Transverse Range Province (San Gabriel and San Bernardino Mountains) to the north. Several active or potentially active faults have been mapped in the region and are believed to accommodate compression associated with this collision. The site is underlain by older alluvial soil deposits eroded from the mountains surrounding the basin and deposited in the site vicinity.
2.2 Subsurface Soil Conditions Based upon our review of pertinent geotechnical literature and our subsurface exploration, the site is underlain by very old alluvial channel deposits (Map Symbol Qvoa, Morton and Gray, 2002). The alluvial soil encountered within our excavations generally consisted of combinations of sand and silt, with some gravel and clay interspersed. The soil was generally slightly moist and dense to very dense. The in-situ moisture content within the upper approximately 15 feet generally ranged from 5 to 20 percent. More detailed descriptions of the subsurface soil are presented on the boring logs. Uncontrolled artificial fill is present adjacent to the southeast side of the project and contains soil, broken concrete, construction debris and pockets of manure and organic-rich soil (see the logs of Boring LB-3 and Test Pit TP-1 through TP-7). The uncontrolled fill was encountered to a depth of approximately 30 feet in Boring LB-3. In aerial photographs reviewed, it appears that a swale or drainage area was filled in with uncontrolled fill and fill placement resulted in expanding the level pad area and extending eastward the slope that descends from the level area to the river. The deepest area of the fill onsite appears to be slightly to the south of Boring LB-3, so it is possible that uncontrolled fill deeper than 30 feet may be present onsite. It appears that the fill was placed between about 1994 and 2005.

10640.001
- 6 -
The fill is loose and dry and contains significant amounts of organic material. The fill is not suitable for support of structures.
2.2.1 Compressible and Collapsible Soil
Soil compressibility refers to a soil’s potential for settlement when subjected to increased loads as from a fill surcharge. Based on our investigation, the uncontrolled artificial fill is considered highly compressible. Complete removal of this material under structures is recommended. The native soil encountered is generally considered slightly compressible. Partial removal and recompaction of this material under shallow foundations is recommended to reduce the potential for adverse total and differential settlement of the proposed improvements. Collapse potential refers to the potential settlement of a soil under existing stresses upon being wetted. Based on the fluvial origin of the onsite native soil, it is anticipated that the hydrocollapse potential of this soil is minor.
2.2.2 Expansive Soils
Expansive soils contain significant amounts of clay particles that swell considerably when wetted and shrink when dried. Foundations constructed on these soils are subjected to large uplifting forces caused by the swelling. Without proper measures taken, heaving and cracking of building foundations and slabs-on-grade could result. Laboratory testing of a near surface soil sample yielded an expansion index of 52. Based on this test and our site observations, the near surface soil is generally expected to have a low to medium expansion potential.
2.2.3 Sulfate Content
Water-soluble sulfates in soil can react adversely with concrete. However, concrete in contact with soil containing sulfate concentrations of less than 0.1 percent by weight is considered to have negligible sulfate exposure based on the American Concrete Institute (ACI) publication 318-14, Section 19.3 (ACI, 2014), adopted by the 2013 CBC (Section 1904A.2).

10640.001
- 7 -
A near-surface soil sample was tested during this investigation for soluble sulfate content. The results of this test indicate a sulfate content of less than 0.01 percent by weight, indicating negligible sulfate exposure.
2.2.4 Resistivity, Chloride and pH
Soil corrosivity to ferrous metals can be estimated by the soil’s electrical resistivity, chloride content and pH. In general, soil having a minimum resistivity less than 1,000 ohm-cm is considered severely corrosive. Soil with a chloride content of 500 parts-per-million (ppm) or more is considered corrosive to ferrous metals. As a screening for potentially corrosive soil, representative soil samples were tested during this investigation to determine minimum resistivity, chloride content, and pH. The tests indicated a minimum resistivity of 1,525 ohm-cm, chloride content of 42 ppm, and pH of 6.2. Based on the minimum resistivity, the onsite soil is considered corrosive to ferrous metals.
2.3 Groundwater
Groundwater was encountered in two of our borings, LB-2 and LB-3. In LB-2, groundwater was encountered at approximately 44 feet below the existing ground surface (bgs); in LB-3, groundwater was encountered at approximately 50 feet bgs. Historical groundwater mapping indicates that the historic high groundwater was approximately 15 feet bgs (Riverside County, 2004).
2.4 Slope Stability The site is generally level. However, a major slope descends from near the southeast side of the site to the Santa Ana River bed to the east. The natural portions of this slope are expected to be underlain by dense, very old alluvial soil. We conducted slope stability analysis of the slope using the Rocscience program SLIDE 6.0 on cross-section line A-A’, shown on Figure 3. Strength parameters used in our analysis were based on the results of direct shear testing on a sample of older alluvium collected from Boring B-1 and from sample descriptions and sampling blow counts. For the static stability analysis, we selected the ultimate shear strength from the direct shear test for the shallow, silty, older alluvium consisting of 130 psf for cohesion and friction angle of 28 degrees, and for the deeper sandy very dense alluvial soils we selected shear strength parameters of

10640.001
- 8 -
100 psf cohesion and 36 degrees friction angle. For the seismic condition, we selected peak shear strengths of 200 and 100 psf for cohesion (shallow and deeper soils, respectively) and a friction angle of 36 degrees. Calculations for stability were developed by searching for the minimum factor of safety for circular slip surfaces at varying depths. The minimum acceptable factor of safety criteria used in our stability analysis was a factor of safety of 1.5 for the static case and 1.1 for the seismic case. Homogeneous soil materials and arcuate failure surfaces were assumed. Based on our findings, the existing natural slopes are considered grossly unstable in their current condition. However, with an assumed slope lay-back to a slope ratio of 2:1 (horizontal to vertical), our analysis indicates that the slope is grossly stable. Stability analysis is provided in Appendix E. The slopes that descend from the site are located adjacent to the Santa Ana River flood plain and may be susceptible to scour. In addition, the near surface soils on the slope may be subject to weathering, and the surface of the slope may be susceptible to surficial instability and shallow failures on the outer 2 to 5 feet from the slope face.
2.5 Faulting and Seismicity
Our review of available in-house literature indicates that there are no known active or potentially active faults traversing the site. The closest known active or potentially active fault is the Chino-Elsinore fault, located approximately 3 miles southwest of the site. The principal seismic hazard that could affect the site is ground shaking resulting from an earthquake occurring along several major active or potentially active faults in southern California. The known regional active and potentially active faults that could produce the most significant ground shaking at the site include the Chino-Elsinore, Whittier, Elsinore-Glen Ivy, San Jose, Cucamonga, Sierra Madre, Elysian Park Thrust, and San Jacinto-San Bernardino. Based on ASCE 7-10 Equation 11.8-1, the FPGA is 1, the PGA is 0.565g, and the PGAM is 0.565g. As an added check, PGA and hazard deaggregation were also estimated using the United States Geologic Survey’s (USGS) interactive Deaggregations utility. The results of this analysis indicate that the predominant

10640.001
- 9 -
modal earthquake has a PGA of 0.70g with a magnitude of approximately 7.0 (MW) at a distance on the order of 9 kilometers for the Maximum Considered Earthquake (2% probability of exceedance in 50 years); results are included in Appendix D. This is not an exhaustive site-specific analysis, yet is useful in evaluating the general seismic potential at the site as an added check. Based on the above, we have selected a design PGA of 0.565g for seismic analysis of the onsite soils (seismic settlement).
2.6 Secondary Seismic Hazards
In general, secondary seismic hazards for sites in the region could include soil liquefaction, earthquake-induced settlement, lateral displacement, landsliding, and earthquake-induced flooding. The potential for secondary seismic hazards at the site is discussed below.
2.6.1 Liquefaction Potential
Liquefaction is the loss of soil strength or stiffness due to a buildup of pore-water pressure during severe ground shaking. Liquefaction is associated primarily with loose (low density), saturated, fine-to-medium grained, cohesionless soils. As the shaking action of an earthquake progresses, the soil grains are rearranged and the soil densifies within a short period of time. Rapid densification of the soil results in a buildup of pore-water pressure. When the pore-water pressure approaches the total overburden pressure, the soil reduces greatly in strength and temporarily behaves similarly to a fluid. Effects of liquefaction can include sand boils, settlement, and bearing capacity failures below structural foundations.
The State of California has not prepared liquefaction hazard maps for this area. Seismic hazard maps prepared by the County of Riverside show the site is located in an area with a high potential for liquefaction. However, the soil at the site is generally dense to very dense, which strongly decreases the chance of liquefaction occurring. We conducted liquefaction analysis at the site assuming a groundwater level of 15 feet bgs. We have performed liquefaction analysis using the computer program LiquefyPro by CivilTech Software (2008). Due to dense nature of the onsite soil, our analysis indicates that there is a low potential for

10640.001
- 10 -
liquefaction (after removal of uncontrolled artificial fill). A summary of liquefaction analysis is presented in Appendix D.
2.6.2 Seismically Induced Settlement
During a strong seismic event, seismically induced settlement can occur within loose to moderately dense, dry or saturated granular soil. Settlement caused by ground shaking is often nonuniformly distributed, which can result in differential settlement. We have performed analyses to estimate the seismically induced settlement using LiquefyPro. The results of our analyses suggest that, following removal of the potentially compressible uncontrolled artificial fill (Boring LB-3), the onsite soils are susceptible to less than 1 inch of seismic settlement based for the design earthquake. Differential settlement due to seismic loading is assumed to be about half the total settlement over a horizontal distance of 40 feet. A summary of seismic settlement analysis is included in Appendix D.

10640.001
- 11 -
3.0 CONCLUSIONS AND RECOMMENDATIONS Based on this investigation, construction of the proposed development is feasible from a geotechnical standpoint. No severe geologic or soils related issues were identified that would preclude development of the site for the proposed improvements. The most significant geotechnical issues at the site are the presence of deep uncontrolled fill, compressible soils, slope stability and the potential for strong seismic shaking. Good planning and design of the project can limit the impact of these constraints. Remedial recommendations for these and other geotechnical issues are provided in the following sections. Although not identified during this investigation, abandoned septic tanks, seepage pits, or other buried structures, trash pits, or items related to past site uses may be present. Such items encountered during grading will require further evaluation and special consideration. 3.1 General Earthwork and Grading All grading should be performed in accordance with the General Earthwork and
Grading Specifications presented in Appendix F, unless specifically revised or amended below or by future recommendations based on final development plans.
3.1.1 Site Preparation
Prior to construction, the site should be cleared of vegetation, trash and debris, which should be disposed of offsite. Any underground obstructions should be removed, as should large trees and their root systems. Resulting cavities should be properly backfilled and compacted. Efforts should be made to locate existing utility lines. Those lines should be removed or rerouted if they interfere with the proposed construction, and the resulting cavities should be properly backfilled and compacted.
3.1.2 Removal of Uncontrolled Artificial Fill
The uncontrolled fill present in the southeast portion of the site is prone to significant long-term settlement and should be completely removed to native material in the area of proposed improvements. In general, we would recommend that uncontrolled fill be removed under the site improvements and extending out on a 1:1 (horizontal to vertical) projection

10640.001
- 12 -
beyond those improvements. This recommendation would necessitate complete removal of the uncontrolled fill to at least 30 feet (equal to the depth of the removal) horizontally beyond the property limits, since improvements such as the baptistery, playground hardscape, and parking are planned near the property line. In the absence of such removals, these hardscape and other improvements will be prone to future settlement. Because the uncontrolled artificial fill extends offsite to the adjacent property, complete removal under the onsite improvements may not be accomplished unless offsite grading on the adjacent property to the east is available. Removal of uncontrolled fill east of the proposed children’s building up to the property line will be required. The building is located about 40 feet from the property line, and it will be difficult to achieve removal of the uncontrolled fill to at least 30 feet outside the building footprint unless offsite grading is available. If offsite grading is not allowed, we recommend the excavation for removals of uncontrolled fill at the site’s eastern property line near the proposed children’s building be constructed with a 5-foot vertical cut from the surface at the property line, continuing with a 1:1 (horizontal:vertical) gradient cut down towards the children’s building to approximately 7 feet above the excavation bottom, and finally cutting vertically approximately 7 feet to the excavation bottom (see Cross-section B-B’, Figure 4). If suitable removals of uncontrolled fill within the area of influence below the structure cannot be accomplished, a design alternative would be to construct the building on deep foundations extending to firm native soil. However, the improvements around the structure would be anticipated to experience settlement. The uncontrolled fill contains soil, construction debris and organic material. Clean soil, and broken concrete may be placed onsite as compacted fill. However, metal, plastic, organic material and deleterious debris should be removed from the fill and disposed of offsite.
3.1.3 Overexcavation and Recompaction
To reduce the potential for adverse differential settlement of the proposed improvements, the underlying subgrade soil should be prepared in such a

10640.001
- 13 -
manner that a uniform response to the applied loads is achieved. For structures with shallow foundations, we recommend that onsite alluvial soils be overexcavated and recompacted to a minimum depth of 3 feet below the bottom of the proposed footings or 5 feet below existing grade, whichever is deeper. Overexcavation and recompaction should extend a minimum horizontal distance of 5 feet from perimeter edges of the proposed footings. Local conditions may require that deeper overexcavation be performed; such areas should be evaluated by Leighton during grading. For the future children’s building, the depth of uncontrolled fill removal is expected to be approximately 30 feet. To reduce the potential for differential settlement, we recommend the remaining portions of the building be overexcavated a minimum of 15 feet and replaced with compacted fill. If a deep foundation system is proposed for the building, the depth of overexcavation should be evaluated based on the design.
Areas outside these overexcavation limits planned for asphalt or concrete pavement, flatwork, and site walls, and areas to receive fill should be overexcavated to a minimum depth of 24 inches below the existing ground surface or 24 inches below the proposed subgrade, whichever is deeper. After completion of the overexcavation, and prior to fill placement, the exposed surfaces should be scarified to a minimum depth of 6 inches, moisture conditioned to or slightly above optimum moisture content, and recompacted to a minimum 90 percent relative compaction, relative to the ASTM D 1557 laboratory maximum density. These recommendations should be reviewed once a grading plan and foundation design information is available.
3.1.4 Fill Placement and Compaction
Onsite soil to be used for compacted structural fill should be free of debris (wood, metal, plastics, trash, etc.), oversized material (greater than 8 inches in largest dimension), and organic material. Any soil to be placed as fill, whether onsite or imported material, should be reviewed and possibly tested by Leighton. Broken concrete may be incorporated into the fill, provided it is reduced in size, or buried in deeper fill areas and is mixed with

10640.001
- 14 -
native soils so that adequate compaction can be achieved. Uncontrolled fill present onsite may be used as compacted fill, provided it meets the above criteria and is processed as described below.
All fill soil should be placed in thin, loose lifts, moisture conditioned, as necessary, and compacted to a minimum 90 percent relative compaction. Relative compaction should be determined in accordance with ASTM Test Method D1557. Aggregate base for pavement should be compacted to a minimum of 95 percent relative compaction.
3.1.5 Import Fill Soil
Import soil to be placed as fill should be geotechnically accepted by Leighton. Preferably at least 3 working days prior to proposed import to the site, the contractor should provide Leighton pertinent information of the proposed import soil, such as location of the soil, whether stockpiled or native in place, and pertinent geotechnical reports if available. We recommend that a Leighton representative visit the proposed import site to observe the soil conditions and obtain representative soil samples. Potential issues may include soil that is more expansive than onsite soil, soil that is too wet, soil that is too rocky or too dissimilar to onsite soils, oversize material, organics, debris, etc.
3.1.6 Shrinkage and Subsidence The change in volume of excavated and recompacted soil varies
according to soil type and location. This volume change is represented as a percentage increase (bulking) or decrease (shrinkage) in volume of fill after removal and recompaction. Subsidence occurs as in-place soil (e.g., natural ground) is moisture-conditioned and densified to receive fill, such as in processing an overexcavation bottom. Subsidence is in addition to shrinkage due to recompaction of fill soil. Field and laboratory data used in our calculations included laboratory-measured maximum dry densities for soil types encountered at the subject site, the measured in-place densities of soils encountered and our experience. We preliminarily estimate the following earth volume changes will occur during grading:

10640.001
- 15 -
Shrinkage Approximately 10-15% Alluvium Approximately 20-25% Afu
Subsidence (overexcavation bottom processing)
Approximately 0.15 foot
These estimates do not consider removal of trash, debris, or organic material from the uncontrolled fill. The level of fill compaction, variations in the dry density of the existing soils and other factors influence the amount of volume change. Some adjustments to earthwork volume should be anticipated during grading of the site.
3.1.7 Rippability and Oversized Material
Oversized material (rock or rock fragments greater than 8 inches in dimension) was not observed during our investigation. However, oversize concrete rubble may be present in the uncontrolled fill. If encountered, oversized material may be reduced in size or placed in deeper fills in accordance with the recommendations provided in the General Earthwork and Grading and Specifications (Appendix F).
3.2 Slope Stability/Slope Creep
Portions of the natural slope descending from near the east side of the property
to the Santa Ana River flood plain are expected to be grossly unstable in their current configuration, subject to shallow failures, and are expected to be susceptible to erosion and surficial slope failures. To reduce the potential for damage to structures associated with erosion and surficial slope instability, we recommend that all structural foundations be setback from the slope per California Building Code (CBC) requirements (H/3, where H is the slope height), assuming a 2:1 (horizontal to vertical) projection up from the toe of the slope. The portion of the slope above a 2:1 projection from the toe of slope should be ignored in terms of building support and structural setback. If the potential for scour at the toe of slope is identified by the project civil engineer, the depth of potential scour may also need to be considered in structural setbacks.
Slope creep, lateral extension, erosion and surficial settlement could occur near the top of the slope. Hardscape improvements near the top of the slope (within roughly 20 feet from the top of slope) may experience movement over time. This lateral extension does not indicate impending slope failure, but is a predictable

10640.001
- 16 -
phenomenon (Noorany and Scheyhing, 2015). In addition, as lateral extension occurs near the top of slope, cracks/separations develop, which can allow water to infiltrate into the cracks, causing additional wetting-induced volume change/lateral extension.
As such, we recommend that where the parking lot, access road, hardscape, or
appurtenant features are located within roughly 20 feet from the top of slope, the designs of these improvements should factor in lateral movement, such that the movement will not be obvious or cause structural damage. “A carefully planned hardscape-landscape layout with bands of vegetation parallel to the slope and with segmental hardscape such as pavers will accommodate lateral stretching and reduce the impact of [lateral extension] on hardscape. Designing…walls in sections with joints and with overlapping details at joints would accommodate stretching at joints and help to reduce structural and aesthetic damage resulting from [lateral extension]” (Noorany and Scheyhing, 2015). Repairs should be anticipated to be needed for improvements immediately adjacent to the top of slope during the life of the project.
In addition, for the road and other hardscape adjacent to the top of slope, we
recommend that these areas be graded with 2 to 3 percent drainage away from the slope, to reduce water from infiltrating into cracks/separations that may develop near the top of slope. The proposed area drains immediately adjacent to the top of slope on the southeast side of the access road should be moved to the northwest side of the road. Our observations on similar sites in older developments indicate that hardscape and improvements and walls located near the tops of slopes tend to tilt and separate excessively over time as a result of slope creep. The time required to develop significant tilt or other associated distress depends in part on the amount of seasonal moisture change, the soil expansion/shrinkage potential and the slope steepness and height. Although fences, walls and hardscape improvements are often considered nonstructural elements with little attention given to their foundation design, some options are available to reduce the effect of slope creep or lateral extension where these improvements are near the tops of slopes. One option (the preferred) is to design fences or free-standing walls so that tilting or cracking will be less visually obvious, or so that they may be economically repaired or replaced. Another option is to deepen their footings such as for a retaining wall.

10640.001
- 17 -
Another option that appears to be effective is to support the fences or free-standing walls near the top of slopes on a pier-and-grade-beam system. The piers normally consist of minimum 12-inch-diameter, cast-in-drilled-hole piers, spaced at a maximum of 8 feet, on center, and connected together by a minimum 12-inch-thick grade beam at shallow depth. The piers are typically at least 7 feet deep for low expansive soil and at least 10 feet deep for medium or highly expansive soil. The steel reinforcement for the system should be designed with consideration of the wall/fence type and loading conditions. Walls or fences aligned essentially perpendicular to the top of the slope are normally supported on a pier-and-grade-beam system for at least that part of the wall that is within 15 or 20 feet from the top of slope. For hardscape improvements, we recommend the subgrade soils be overexcavated and recompacted per our overexcavation recommendations and that frequent crack control joints be provided. We also suggest that a deepened foundation be constructed along the edge of the hardscape to resist lateral movement toward the top of the slope. Alternatively, it may be necessary to monitor lateral movement at the top of slope and provide regular maintenance to repair erosion, fill cracks in concrete, control erosion over the slope and take other measures to limit distress. Slope protection should be provided and care should be taken to limit the flow of water over the slope.
3.3 Foundation Recommendations
Shallow foundations may be used for the main building, the preschool building, and for the children’s building, provided adequate removal of uncontrolled fill is performed for that building (see Section 3.1). Overexcavation and recompaction of the footing subgrade soil should be performed as detailed in Section 3.1.
3.3.1 Conventional Foundations
For conventional foundations, an effective plasticity index of 15 should be assumed for soils with a low to medium expansion potential. Exterior footings for conventional foundations should have a minimum embedment depth of 18 inches. Interior footing depth and width should be designed per CBC requirements. An allowable bearing pressure of 2,000 psf may

10640.001
- 18 -
be used based on an embedment depth of 18 inches and width of 12 or 24 inches for continuous and isolated footings, respectively. The allowable bearing value may be increased by 300 psf per foot increase in depth or width to a maximum allowable bearing pressure of 3,000 psf. The allowable bearing pressures are for the total dead load and frequently applied live loads. The allowable bearing pressure may be increased by one third when considering loads of short duration, such as those imposed by wind and seismic forces.
3.3.2 Lateral Resistance of Shallow Foundations
The soil resistance available to withstand lateral loads on a shallow foundation is a function of the frictional resistance along the base of the footing and the passive resistance that may develop as the face of the structure tends to move into the soil. The allowable frictional resistance between the base of the foundation and the subgrade soil may be computed using a coefficient of friction of 0.30. This value may be increased by one third when considering loads of short duration, such as those imposed by wind and seismic forces. The allowable passive resistance may be computed using an allowable equivalent fluid pressure of 240 pcf, assuming there is constant contact between the footing and undisturbed soil.
3.3.3 Settlement
The recommended allowable bearing pressure for shallow footings is generally based on a post-construction static settlement of 1 inch. Differential settlement is estimated to be on the order of ½ inch over a horizontal distance of 30 feet for shallow footings. Since settlement is a function of footing size and contact bearing pressure, differential settlement can be expected between adjacent columns or walls where a large differential loading condition exists.
3.3.4 Recommendations for Slabs-On-Grade
Concrete slabs-on-grade should be designed by the structural engineer in accordance with the current CBC for a soil with a low or medium expansion potential. Where conventional light floor loading conditions

10640.001
- 19 -
exist, the following minimum recommendations should be used. Slabs-on-grade should have the following minimum recommended components:
• Subgrade Moisture Conditioning: The subgrade soil for the lots onsite
should be moisture conditioned to at least 2 percent above optimum moisture content to a minimum depth of 18 inches prior to placing steel or concrete.
• Moisture Vapor Retarder: A minimum of a 10-mil vapor retarder
should be placed below slabs where moisture-sensitive floor coverings or equipment is planned. Since moisture will otherwise be transmitted up from the soil through the concrete, it is important that an intact vapor retarder be installed. We recommend that the vapor retarder intended for the specific conditions present can be used. We recommend that the vapor retarder meet the requirements of ASTM E1745 and be installed per ASTM E1643. If sand is placed on top of the vapor retarder, the contractor should not allow the sand to become wet prior to concrete placement (e.g., sand should not be placed if rain is expected). Sharp objects, such as gravel or other protruding objects that could puncture the moisture retarder should be removed from the subgrade prior to placing the vapor retarder, or a stronger vapor retarder intended for the specific conditions present can be used.
• Concrete Thickness: Slabs-on-grade should be at least 4 inches thick
for conventional slabs for conventional slabs, reinforcing steel should be designed by the structural engineer, but as a minimum should be No. 4 rebar placed at 18 inches on center, each direction, mid-depth in the slab.
Minor cracking of the concrete as it cures, due to drying and shrinkage is normal and should be expected. However, cracking is often aggravated by a high water/cement ratio, high concrete temperature at the time of placement, small nominal aggregate size, and rapid moisture loss due to hot, dry, and/or windy weather conditions during placement and curing. Cracking due to temperature and moisture fluctuations can also be expected. Low slump concrete can reduce the potential for shrinkage cracking. Additionally, our experience indicates that reinforcement in slabs and foundations can generally reduce the potential for concrete cracking.

10640.001
- 20 -
The structural engineer should consider these components in slab design and specifications. Moisture retarders can reduce, but not eliminate moisture vapor rise from the underlying soils up through the slab. Floor covering manufacturers should be consulted for specific recommendations. Leighton does not practice in the field of moisture vapor transmission evaluation, since this is not specifically a geotechnical issue. Therefore, we recommend that a qualified person, such as the flooring subcontractor and/or structural engineer, be consulted with to evaluate the general and specific moisture vapor transmission paths and any impact on the proposed construction. That person should provide recommendations for mitigation of potential adverse impact of moisture vapor transmission on various components of the structures as deemed appropriate.
3.4 Seismic Design Parameters
Seismic parameters presented in this report should be considered during project design. In order to reduce the effects of ground shaking produced by regional seismic events, seismic design should be performed in accordance with the most recent edition of the California Building Code (CBC). The following data should be considered for the seismic analysis of the subject site:
2016 CBC Categorization/Coefficient Design Value
Site Longitude (decimal degrees) -117.593
Site Latitude (decimal degrees) 33.9346
Site Class Definition (ASCE 7 Table 20.3-1) D
Mapped Spectral Response Acceleration at 0.2s Period, Ss (Figure 1613.3.1(1)) 1.517 g
Mapped Spectral Response Acceleration at 1s Period, S1 (Figure 1613.3.1(2)) 0.600 g
Short Period Site Coefficient at 0.2s Period, Fa (Table 1613.3.3(1)) 1.0
Long Period Site Coefficient at 1s Period, Fv (Table 1613.3.3(2) 1.5
Adjusted Spectral Response Acceleration at 0.2s Period, SMS (Eq. 16-37) 1.517 g
Adjusted Spectral Response Acceleration at 1s Period, SM1 (Eq. 16-38) 0.900 g
Design Spectral Response Acceleration at 0.2s Period, SDS (Eq. 16-39) 1.012 g
Design Spectral Response Acceleration at 1s Period, SD1 (Eq. 16-40) 0.600 g

10640.001
- 21 -
3.5 Retaining Walls
We recommend that retaining walls be backfilled with select, very low expansive soil and constructed with a backdrain in accordance with the recommendations provided on Figure 5 (rear of text). Using expansive soil as retaining wall backfill will result in higher lateral earth pressures exerted on the wall. Based on these recommendations, the following parameters may be used for the design of conventional retaining walls:
Static Equivalent Fluid Weight (pcf) Condition Level Backfill
Active 40 pcf At-Rest 65 pcf
Passive (flat ground in front of the wall)
210 pcf (allowable) (Maximum of 3,500 psf)
Passive (2:1 descending slope in
front of the wall)
115 pcf (allowable)
The above values do not contain an appreciable factor of safety unless noted, so the structural engineer should apply the applicable factors of safety and/or load factors during design, as specified by the California Building Code. Cantilever walls that are designed to yield at least 0.001H, where H is equal to the wall height, may be designed using the active condition. Rigid walls and walls braced at the top should be designed using the at-rest condition.
Passive pressure is used to compute soil resistance to lateral structural movement. In addition, for sliding resistance, a frictional resistance coefficient of 0.3 may be used at the concrete and soil interface. The lateral passive resistance should be taken into account only if it is ensured that the soil providing passive resistance, embedded against the foundation elements, will remain intact with time.
For walls with a retained height over 6 feet, or as required by Code or deemed appropriate by the structural engineer, we recommend that the wall designs be checked seismically using an additive seismic Equivalent Fluid Pressure (EFP) of 19 pcf, which is added to the active EFP. Such walls that are to be designed in the static case assuming the at-rest condition should be checked seismically

10640.001
- 22 -
using this additive seismic EFP added to the active condition (i.e., the additive seismic EFP is not added to the at-rest EFP). The additive seismic EFP should be applied with a standard EFP pressure distribution (i.e., it is not an inverted triangle). In addition to the above lateral forces due to retained earth, surcharge due to improvements, such as an adjacent structure or traffic loading, should be considered in the design of the retaining wall. Loads applied within a 1:1 projection from the surcharging structure on the stem of the wall should be considered in the design. Retaining walls with a descending slope below the wall should have deepened footings such that the bottom of the footing is a minimum of 7 feet horizontally from the slope face. A soil unit weight of 120 pcf may be assumed for calculating the actual weight of the soil over the wall footing.
3.6 Infiltration/Percolation Testing
Four well permeameter tests (WP-1 through WP-4) were conducted to estimate the infiltration rate in various parts of the site. Well permeameter tests were conducted at depths between 1.5 and 7 feet below ground surface. A well permeameter test is useful for field measurements of soil infiltration rates, and is suited for testing when the design depth of the basin is deeper than current existing grades. The test consists of excavating a boring to the depth of the test (or deeper if it is partially backfilled with soil and a bentonite plug with a thin soil covering is placed just below the design test elevation). A layer of clean sand is placed in the boring bottom to support a float mechanism and temporary perforated well casing pipe. In addition, sand is poured around the outside of the well casing within the test zone to prevent the boring from caving/collapsing or eroding when water is added. The float mechanism, placed inside the casing, adds water stored in barrels at the top of the hole to the boring as water infiltrates into the soil, while maintaining a constant water head in the boring. The volume percolated during timed intervals is converted to an incremental infiltration velocity, or infiltration rate, such as inches per hour. The percolation rate was converted to an estimate of infiltration rate using the Porchet Method (aka,

10640.001
- 23 -
Inverse Borehole Method). The test was conducted based on the USBR 7300-89 test method. Infiltration rates were measured at the 4 well permeameter locations and ranged from approximately 0.1 to 0.9 inch per hour (no factor of safety or correction factors applied). These are very low to marginal infiltration rates. Infiltration may not be suitable in some areas. Additional testing to help identify suitable areas should be conducted if infiltration is pursued. These infiltration rates are for a clean, unsilted percolation surface in native alluvial soil. This value will be reduced over time as silting of the facilities occurs. Infiltration facilities should not be completed if there is a risk of silt entering the facility prior to completion (such as before landscape and other improvements are in place). Furthermore, if the basin bottom is allowed to be compacted by heavy equipment, this value is expected to be significantly reduced. Infiltration of water through soil is highly dependent on such factors as grain size distribution of the soil particles, particle shape, clay content, and density. Small changes in soil conditions, including density, can cause large differences in observed infiltration rates. The results of the infiltration testing are provided in Appendix B. Further testing may be warranted after a design has been selected for an infiltration facility, since infiltration rates varied across the site. It should be noted that during periods of prolonged precipitation, the underlying soils tend to become saturated to greater and greater depths/extents. Therefore, infiltration rates tend to decrease with prolonged rainfall. It is important to consider the impact that infiltration facilities can play on nearby subterranean structures, such as basement walls, or open excavations. Any such nearby features should be identified and evaluated as to whether infiltrating water can impact these.
The periodic flow into the basin of water carrying sediments, plus the introduction of wind-blown sediments and sediments from erosion of the basin side walls, will eventually cause the bottom of the basin to accumulate a layer of silt, which has the potential of significantly reducing the overall infiltration rate of the basin. Therefore, as a part of basin maintenance, we recommend that accumulated silt soil be removed from the basin. Vegetation within the basin bottoms and sides is expected to help reduce erosion and help maintain infiltration rates.

10640.001
- 24 -
3.7 Pavement Design
Based on the design procedures outlined in the current Caltrans Highway Design Manual, and using an assumed design R-value of 50, flexible pavement sections may consist of the following for the Traffic Indices indicated. Final pavement design should be based on the Traffic Index determined by the project civil engineer and R-value testing provided near the end of grading.
Asphalt Pavement Section Thickness, Type I Subgrade Soil
Traffic Index Asphaltic Concrete (AC)
Thickness (inches) Class 2 Aggregate Base
Thickness (inches)
Total Pavement Section
Thickness (inches)
5 or less 3 4 7
6 3 4.5 7.5
7 4 4.5 8.5
In areas where rigid concrete pavement is planned and trucks may drive on this pavement, we recommend 7 inches of Portland Cement Concrete (PCC) with a 28-day compressive strength of 4,000 psi over 4 inches of aggregate base placed on prepared subgrade soil (see Section 3.1). Reinforcement should be specified by the structural engineer, but should be a minimum of #3 rebar at 18 inches on center each way. The PCC pavement sections should be provided with crack-control joints spaced no more than 13 feet on center each way. If sawcuts are used, they should have a minimum depth of ¼ of the slab thickness and made within 24 hours of concrete placement. We recommend that sections be as nearly square as possible. PCC sidewalks should be at least 4 inches thick over prepared subgrade soil, with construction joints no more than 8 feet on center each way, with sections as nearly square as possible. Use of reinforcing, such as welded-wire mesh, will help reduce severity of cracking. All pavement construction should be performed in accordance with the Standard Specifications for Public Works Construction or Caltrans Specifications. Field observations and periodic testing, as needed during placement of the base course materials, should be undertaken to ensure that the requirements of the standard specifications are fulfilled.

10640.001
- 25 -
Prior to placement of aggregate base, the subgrade soil should be processed to a minimum depth of 6 inches, moisture-conditioned, as necessary, and recompacted to a minimum of 90 percent relative compaction. Aggregate base should be moisture conditioned, as necessary, and compacted to a minimum of 95 percent relative compaction. If the pavement is to be constructed prior to construction of the structures, we recommend that the full depth of the pavement section be placed in order to support heavy construction traffic.
3.8 Temporary Excavations All temporary excavations, including utility trenches, retaining wall excavations
and other excavations should be performed in accordance with project plans, specifications and all OSHA requirements.
No surcharge loads should be permitted within a horizontal distance equal to the
height of cut or 5 feet, whichever is greater from the top of the slope, unless the cut is shored appropriately. Excavations that extend below an imaginary plane inclined at 45 degrees below the edge of any adjacent existing site foundation should be properly shored to maintain support of the adjacent structures.
Cantilever shoring should be designed based on an active equivalent fluid
pressure of 40 pcf. If excavations are braced at the top and at specific design intervals, the active pressure may then be approximated by a rectangular soil pressure distribution with the pressure per foot of width equal to 25H, where H is equal to the depth of the excavation being shored.
During construction, the soil conditions should be regularly evaluated to verify
that conditions are as anticipated. The contractor should be responsible for providing the "competent person" required by OSHA, standards to evaluate soil conditions. Close coordination between the competent person and the geotechnical engineer should be maintained to facilitate construction while providing safe excavations.
3.9 Trench Backfill
Utility-type trenches onsite can be backfilled with onsite material, provided it is free of debris, significant organic material and oversized material (greater than 3

10640.001
- 26 -
inches for trench backfill within 3 feet of a pipe, and 6 inches for trench backfill above). Prior to backfilling the trench, pipes should be bedded and shaded in a granular material that has a sand equivalent of 30 or greater. We recommend that open-graded crushed rock or similar material not be used as bedding material, unless special provisions are implemented to limit the migration of surrounding soil into the open-graded material, including the use of filter fabric around the open-graded material. The bedding material should extend 12 inches above the top of the pipe. The bedding/shading sand should be densified in-place by mechanical means, or in areas where the trench walls and bottom soil have a minimum sand equivalent of 15, the bedding sand may be jetted. Bedding sand should be placed in accordance with the Standard Specifications for Public Works Construction – Greenbook (Public Works Standard, Inc., 2015), current edition. The native soil fill should be placed in loose layers, moisture conditioned, as necessary, and mechanically compacted using a minimum standard of 90 percent relative compaction based on ASTM D 1557. The thickness of layers should be based on the compaction equipment used in accordance with the current Greenbook.
3.10 Surface Drainage In no case should runoff be allowed to drain over the top of the slope descending to the east. Inadequate control of runoff water and/or poorly controlled irrigation can cause the onsite soils to expand and/or shrink, producing heaving and/or settlement of foundations, flatwork, walls, and other improvements. Maintaining adequate surface drainage, proper disposal of runoff water, and control of irrigation should help reduce the potential for future soil moisture problems.
Positive surface drainage should be designed to be directed away from
foundations and toward approved drainage devices, such as gutters, paved drainage swales, or watertight area drains and collector pipes. Surface drainage should be provided to prevent ponding of water adjacent to the structures. In general, the area around the buildings should slope away from the building. We recommend that unpaved landscaped areas adjacent to the buildings be avoided. Roof runoff should be carried to suitable drainage outlets by watertight drain pipes or over paved areas.

10640.001
- 27 -
3.11 Sulfate Attack and Corrosion Protection Based on the results of laboratory testing, concrete structures in contact with the
onsite soil will have negligible exposure to water-soluble sulfates in the soil. Type II cement may be used for concrete construction. The concrete should be designed in accordance with Table 4.3.1 of the American Concrete Institute ACI 318-08 provisions (ACI, 2008).
Based on our laboratory testing, the onsite soil is considered corrosive to ferrous metals. Corrosion information presented in this report should be provided to your underground utility subcontractors. Additional testing and evaluation by a corrosion engineer may be warranted if corrosion protection is considered critical to the project.
3.12 Additional Geotechnical Services The preliminary geotechnical recommendations presented in this report are
based on subsurface conditions as interpreted from limited subsurface explorations and limited laboratory testing. Our preliminary geotechnical recommendations provided in this report are based on information available at the time the report was prepared and may change as plans are developed. Additional geotechnical investigation and analysis may be required based on final improvement plans. Leighton should review the site and grading plans when available and comment further on the geotechnical aspects of the project. Geotechnical observation and testing should be conducted during excavation and all phases of grading operations. Our conclusions and preliminary recommendations should be reviewed and verified by Leighton during construction and revised accordingly if geotechnical conditions encountered vary from our preliminary findings and interpretations.
Geotechnical observation and testing should be provided:
• After completion of site clearing. • During overexcavation of compressible soil. • During compaction of all fill materials. • After excavation of all footings and prior to placement of concrete. • During utility trench backfilling and compaction. • During pavement subgrade and base preparation. • When any unusual conditions are encountered.

10640.001
- 28 -
4.0 LIMITATIONS This report was based in part on data obtained from a limited number of observations, site visits, soil excavations, samples, and tests. Such information is, by necessity, incomplete. The nature of many sites is such that differing soil or geologic conditions can be present within small distances and under varying climatic conditions. Changes in subsurface conditions can and do occur over time. Therefore, our findings, conclusions, and recommendations presented in this report are based on the assumption that Leighton and Associates, Inc. will provide geotechnical observation and testing during construction. This report was prepared for the sole use of Vantage Point Church for application to the design of the proposed development in accordance with generally accepted geotechnical engineering practices at this time in California. See the GBA insert on the following page for important information about this geotechnical engineering report.

Geotechnical-Engineering ReportImportant Information about This
Subsurface problems are a principal cause of construction delays, cost overruns, claims, and disputes.
While you cannot eliminate all such risks, you can manage them. The following information is provided to help.
The Geoprofessional Business Association (GBA) has prepared this advisory to help you – assumedly a client representative – interpret and apply this geotechnical-engineering report as effectively as possible. In that way, clients can benefit from a lowered exposure to the subsurface problems that, for decades, have been a principal cause of construction delays, cost overruns, claims, and disputes. If you have questions or want more information about any of the issues discussed below, contact your GBA-member geotechnical engineer. Active involvement in the Geoprofessional Business Association exposes geotechnical engineers to a wide array of risk-confrontation techniques that can be of genuine benefit for everyone involved with a construction project.
Geotechnical-Engineering Services Are Performed for Specific Purposes, Persons, and ProjectsGeotechnical engineers structure their services to meet the specific needs of their clients. A geotechnical-engineering study conducted for a given civil engineer will not likely meet the needs of a civil-works constructor or even a different civil engineer. Because each geotechnical-engineering study is unique, each geotechnical-engineering report is unique, prepared solely for the client. Those who rely on a geotechnical-engineering report prepared for a different client can be seriously misled. No one except authorized client representatives should rely on this geotechnical-engineering report without first conferring with the geotechnical engineer who prepared it. And no one – not even you – should apply this report for any purpose or project except the one originally contemplated.
Read this Report in FullCostly problems have occurred because those relying on a geotechnical-engineering report did not read it in its entirety. Do not rely on an executive summary. Do not read selected elements only. Read this report in full.
You Need to Inform Your Geotechnical Engineer about ChangeYour geotechnical engineer considered unique, project-specific factors when designing the study behind this report and developing the confirmation-dependent recommendations the report conveys. A few typical factors include: • the client’s goals, objectives, budget, schedule, and risk-management preferences; • the general nature of the structure involved, its size, configuration, and performance criteria; • the structure’s location and orientation on the site; and • other planned or existing site improvements, such as retaining walls, access roads, parking lots, and underground utilities.
Typical changes that could erode the reliability of this report include those that affect:• the site’s size or shape;• the function of the proposed structure, as when it’s changed from a parking garage to an office building, or from a light-industrial plant to a refrigerated warehouse;• the elevation, configuration, location, orientation, or weight of the proposed structure;• the composition of the design team; or• project ownership.
As a general rule, always inform your geotechnical engineer of project changes – even minor ones – and request an assessment of their impact. The geotechnical engineer who prepared this report cannot accept responsibility or liability for problems that arise because the geotechnical engineer was not informed about developments the engineer otherwise would have considered.
This Report May Not Be ReliableDo not rely on this report if your geotechnical engineer prepared it:• for a different client;• for a different project;• for a different site (that may or may not include all or a portion of the original site); or • before important events occurred at the site or adjacent to it; e.g., man-made events like construction or environmental remediation, or natural events like floods, droughts, earthquakes, or groundwater fluctuations.
Note, too, that it could be unwise to rely on a geotechnical-engineering report whose reliability may have been affected by the passage of time, because of factors like changed subsurface conditions; new or modified codes, standards, or regulations; or new techniques or tools. If your geotechnical engineer has not indicated an “apply-by” date on the report, ask what it should be, and, in general, if you are the least bit uncertain about the continued reliability of this report, contact your geotechnical engineer before applying it. A minor amount of additional testing or analysis – if any is required at all – could prevent major problems.
Most of the “Findings” Related in This Report Are Professional OpinionsBefore construction begins, geotechnical engineers explore a site’s subsurface through various sampling and testing procedures. Geotechnical engineers can observe actual subsurface conditions only at those specific locations where sampling and testing were performed. The data derived from that sampling and testing were reviewed by your geotechnical engineer, who then applied professional judgment to form opinions about subsurface conditions throughout the site. Actual sitewide-subsurface conditions may differ – maybe significantly – from those indicated in this report. Confront that risk by retaining your geotechnical engineer to serve on the design team from project start to project finish, so the individual can provide informed guidance quickly, whenever needed.

This Report’s Recommendations Are Confirmation-DependentThe recommendations included in this report – including any options or alternatives – are confirmation-dependent. In other words, they are not final, because the geotechnical engineer who developed them relied heavily on judgment and opinion to do so. Your geotechnical engineer can finalize the recommendations only after observing actual subsurface conditions revealed during construction. If through observation your geotechnical engineer confirms that the conditions assumed to exist actually do exist, the recommendations can be relied upon, assuming no other changes have occurred. The geotechnical engineer who prepared this report cannot assume responsibility or liability for confirmation-dependent recommendations if you fail to retain that engineer to perform construction observation.
This Report Could Be MisinterpretedOther design professionals’ misinterpretation of geotechnical-engineering reports has resulted in costly problems. Confront that risk by having your geotechnical engineer serve as a full-time member of the design team, to: • confer with other design-team members, • help develop specifications, • review pertinent elements of other design professionals’ plans and specifications, and • be on hand quickly whenever geotechnical-engineering guidance is needed. You should also confront the risk of constructors misinterpreting this report. Do so by retaining your geotechnical engineer to participate in prebid and preconstruction conferences and to perform construction observation.
Give Constructors a Complete Report and GuidanceSome owners and design professionals mistakenly believe they can shift unanticipated-subsurface-conditions liability to constructors by limiting the information they provide for bid preparation. To help prevent the costly, contentious problems this practice has caused, include the complete geotechnical-engineering report, along with any attachments or appendices, with your contract documents, but be certain to note conspicuously that you’ve included the material for informational purposes only. To avoid misunderstanding, you may also want to note that “informational purposes” means constructors have no right to rely on the interpretations, opinions, conclusions, or recommendations in the report, but they may rely on the factual data relative to the specific times, locations, and depths/elevations referenced. Be certain that constructors know they may learn about specific project requirements, including options selected from the report, only from the design drawings and specifications. Remind constructors that they may
perform their own studies if they want to, and be sure to allow enough time to permit them to do so. Only then might you be in a position to give constructors the information available to you, while requiring them to at least share some of the financial responsibilities stemming from unanticipated conditions. Conducting prebid and preconstruction conferences can also be valuable in this respect.
Read Responsibility Provisions CloselySome client representatives, design professionals, and constructors do not realize that geotechnical engineering is far less exact than other engineering disciplines. That lack of understanding has nurtured unrealistic expectations that have resulted in disappointments, delays, cost overruns, claims, and disputes. To confront that risk, geotechnical engineers commonly include explanatory provisions in their reports. Sometimes labeled “limitations,” many of these provisions indicate where geotechnical engineers’ responsibilities begin and end, to help others recognize their own responsibilities and risks. Read these provisions closely. Ask questions. Your geotechnical engineer should respond fully and frankly.
Geoenvironmental Concerns Are Not CoveredThe personnel, equipment, and techniques used to perform an environmental study – e.g., a “phase-one” or “phase-two” environmental site assessment – differ significantly from those used to perform a geotechnical-engineering study. For that reason, a geotechnical-engineering report does not usually relate any environmental findings, conclusions, or recommendations; e.g., about the likelihood of encountering underground storage tanks or regulated contaminants. Unanticipated subsurface environmental problems have led to project failures. If you have not yet obtained your own environmental information, ask your geotechnical consultant for risk-management guidance. As a general rule, do not rely on an environmental report prepared for a different client, site, or project, or that is more than six months old.
Obtain Professional Assistance to Deal with Moisture Infiltration and MoldWhile your geotechnical engineer may have addressed groundwater, water infiltration, or similar issues in this report, none of the engineer’s services were designed, conducted, or intended to prevent uncontrolled migration of moisture – including water vapor – from the soil through building slabs and walls and into the building interior, where it can cause mold growth and material-performance deficiencies. Accordingly, proper implementation of the geotechnical engineer’s recommendations will not of itself be sufficient to prevent moisture infiltration. Confront the risk of moisture infiltration by including building-envelope or mold specialists on the design team. Geotechnical engineers are not building-envelope or mold specialists.
Copyright 2016 by Geoprofessional Business Association (GBA). Duplication, reproduction, or copying of this document, in whole or in part, by any means whatsoever, is strictly prohibited, except with GBA’s specific written permission. Excerpting, quoting, or otherwise extracting wording from this document is permitted only with the express written permission of GBA, and only for purposes of scholarly research or book review. Only members of GBA may use this document or its wording as a complement to or as an element of a report of any
kind. Any other firm, individual, or other entity that so uses this document without being a GBA member could be committing negligent
Telephone: 301/565-2733e-mail: [email protected] www.geoprofessional.org

Copyright:© 2013 National Geographic Society, i-cubed, Esri, HERE,DeLorme, MapmyIndia, © OpenStreetMap contributors
³000,4000,20
Feet
Figure 1
Scale:
Leighton
Base Map: ESRI ArcGIS Online 2015Thematic Information: Leighton
1 " = 2,000 '
Project: 10640.001 Eng/Geol: JDH/PB
Map Saved as P:\Drafting\10640\001\maps\10640-001_F01_SLM_20151007.mxd on 9/4/2015 3:54:47 PM
Author: Leighton Geomatics (btran)
Date: November 2016SITE LOCATION MAP
Vantage Point Church8500 Archibald Avenue
Eastvale, California
ApproximateSite Boundary

App
roxi
mat
e bo
ring
loca
tion,
show
ing
tota
l dep
th,
dept
h of
Arti
ficia
l fill
,an
d de
pth
to g
roun
dwat
er
LEG
END
Geo
logi
c cr
oss
sect
ion
AA
'
SC
ALE
FEE
T
V:\D
RA
FTIN
G\1
0640
\001
\CA
D\1
0640
-001
_F02
_BLM
_201
6-11
-02.
DW
G (1
1-02
-16
1:55
:47P
M)
Plo
tted
by: b
tran
Pro
j: 10
640.
001
BO
RIN
G L
OC
AT
ION
MA
PV
anta
ge P
oint
Chu
rch
8500
Arc
hiba
ld A
venu
eE
astv
ale,
Cal
iforn
ia Eng
/Geo
l: JD
H/P
B
Sca
le: 1
"=10
0'D
ate:
Nov
embe
r 201
6D
rafte
d B
y: M
AM
Che
cked
By:
Figu
re 2
Leig
hton
App
roxi
mat
e bo
ring
and
wel
l per
mio
met
er lo
catio
n
Unc
ontro
lled
Arti
ficia
l fill
Ver
y ol
d A
lluvi
um
App
roxi
mat
e lim
its o
f Unc
ontro
lled
fill
Afu
Qvo
c
200
100
0
App
roxi
mat
e te
st p
it lo
catio
n
Riv
er

Qvoa
Existin
g
Pro
file
⅊
⅊
2:1
P
ro
je
ctio
n
52
0
56
0
60
0
ELEVATION (FEET)
52
0
56
0
60
0
ELEVATION (FEET)
AA
'
Fig
ure
3
Le
ig
hto
n
V
:\D
RA
FT
IN
G\1
06
40
\0
01
\C
AD
\O
F_
20
15
-0
9-0
4\1
06
40
-0
01
_F
03
-0
4_
CS
_2
01
6-1
1-0
8.D
WG
(1
1-0
8-1
6 3
:2
0:2
7P
M) P
lo
tte
d b
y: b
tra
n
Proj: 10640.001
GE
OT
EC
HN
ICA
L C
RO
SS
SE
CT
ION
A-A
'V
an
ta
ge
P
oin
t C
hu
rch
85
00
A
rch
ib
ald
A
ve
nu
e
Ea
stva
le
, C
alifo
rn
ia
Eng/G
eol: JD
H/P
B
Scale: 1"=
40'
Date: N
ovem
ber 2016
Reference:

Fig
ure
4
Le
ig
hto
n
V
:\D
RA
FT
IN
G\1
06
40
\0
01
\C
AD
\O
F_
20
15
-0
9-0
4\1
06
40
-0
01
_F
03
-0
4_
CS
_2
01
6-1
1-0
8.D
WG
(1
1-0
8-1
6 3
:2
0:5
7P
M) P
lo
tte
d b
y: b
tra
n
Proj: 10640.001
GE
OT
EC
HN
ICA
L C
RO
SS
SE
CT
ION
B-B
'V
an
ta
ge
P
oin
t C
hu
rch
85
00
A
rch
ib
ald
A
ve
nu
e
Ea
stva
le
, C
alifo
rn
ia
Eng/G
eol: JD
H/P
B
Scale: 1"=
40'
Date: N
ovem
ber 2016
Reference:
BB
'
Existin
g
Pro
file
Pro
po
se
d
Bu
ild
in
g
Qvoa
Qvoa
Afu
⅊L
B-3
1
:
1
52
0
56
0
60
0
ELEVATION (FEET)
52
0
56
0
60
0
ELEVATION (FEET)
TP
-7
TP
-6
1
:
1
5'
7'

Figure 5

APPENDIX A
REFERENCES

10640.001
A-1
APPENDIX A
References
American Concrete Institute (ACI), 2008, Building Code Requirements for Structural Concrete (ACI 318-08) and Commentary (ACI 318R-08), an ACI Standard, 2008.
American Society of Civil Engineers (ASCE), ASCE Standard/SEI 7-10, an ASCE
Standard, 2010. Bryant, W.A., Hart, E.W., 2007, Fault Rupture Hazard Zones in California, Interim
Revision 2007, CGS Special Publication 42, Interim Revision 2007 California Building Standards Commission, 2016, 2016 California Building Code,
California Code of Regulations, Title 24, Part 2, Volume 2 of 2, Based on 2015 International Building Code, Effective January 1, 2017.
California Geological Survey (formerly California Division of Mines and Geology), 2000,
CD-ROM containing digital images of Official Maps of Alquist-Priolo Earthquake Fault Zones that affect the Southern Region, DMG CD 2000-003 2000.
CivilTech Software, 2008, LiquefyPro, Version 5.5j Martin, G. R., and Lew, M., ed., 1999, “Recommended Procedures for Implementation
of DMG Special Publication 117, Guidelines for Analyzing and Mitigating Liquefaction Hazards in California,” Southern California Earthquake Center, dated March 1999.
Morton, D.M., and Gray Jr., 2002, C. H., Geologic map of the Corona North 7.5 Minute
Quadrangle, Riverside and San Bernardino Counties, California Californiua geologic Survet Open File Report 02-22
Noorany and Scheyhing, 2015, Lateral Extension of Compacted-fill Slopes in Expansive
Soils, Journal of Geotechnical and Geoenvironmental Engineering, Volume 141 Issue 1, January 2015.
Public Works Standard, Inc., 2015, Greenbook, Standard Specifications for Public
Works Construction: BNI Building News, Anaheim, California.
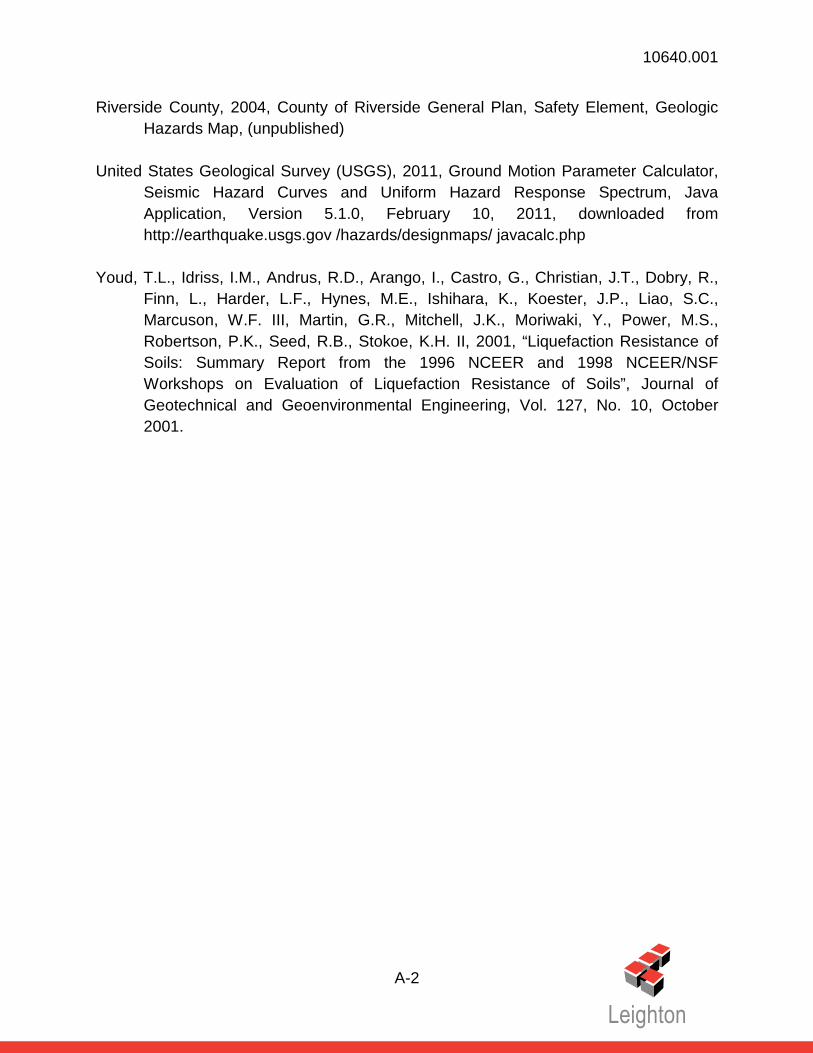
10640.001
A-2
Riverside County, 2004, County of Riverside General Plan, Safety Element, Geologic Hazards Map, (unpublished)
United States Geological Survey (USGS), 2011, Ground Motion Parameter Calculator,
Seismic Hazard Curves and Uniform Hazard Response Spectrum, Java Application, Version 5.1.0, February 10, 2011, downloaded from http://earthquake.usgs.gov /hazards/designmaps/ javacalc.php
Youd, T.L., Idriss, I.M., Andrus, R.D., Arango, I., Castro, G., Christian, J.T., Dobry, R.,
Finn, L., Harder, L.F., Hynes, M.E., Ishihara, K., Koester, J.P., Liao, S.C., Marcuson, W.F. III, Martin, G.R., Mitchell, J.K., Moriwaki, Y., Power, M.S., Robertson, P.K., Seed, R.B., Stokoe, K.H. II, 2001, “Liquefaction Resistance of Soils: Summary Report from the 1996 NCEER and 1998 NCEER/NSF Workshops on Evaluation of Liquefaction Resistance of Soils”, Journal of Geotechnical and Geoenvironmental Engineering, Vol. 127, No. 10, October 2001.

APPENDIX B
GEOTECHNICAL BORING LOGS AND INFILTRATION TEST RESULTS
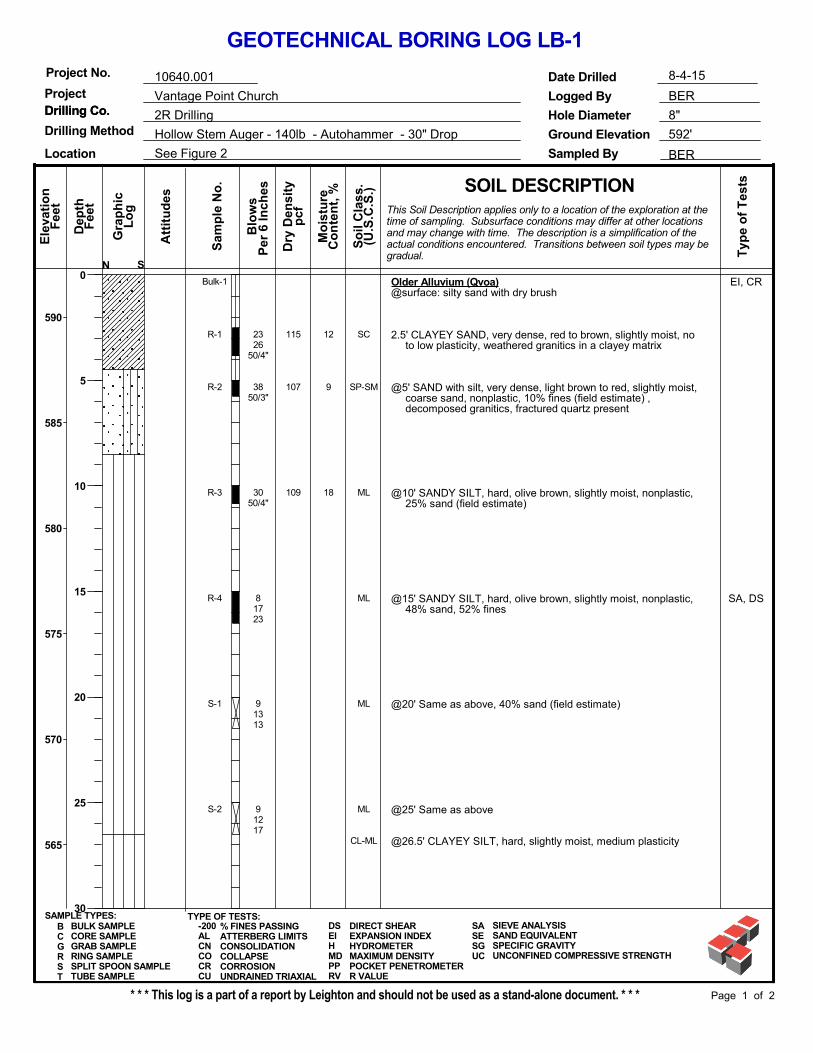
Older Alluvium (Qvoa)@surface: silty sand with dry brush
2.5' CLAYEY SAND, very dense, red to brown, slightly moist, noto low plasticity, weathered granitics in a clayey matrix
@5' SAND with silt, very dense, light brown to red, slightly moist,coarse sand, nonplastic, 10% fines (field estimate) ,decomposed granitics, fractured quartz present
@10' SANDY SILT, hard, olive brown, slightly moist, nonplastic,25% sand (field estimate)
@15' SANDY SILT, hard, olive brown, slightly moist, nonplastic,48% sand, 52% fines
@20' Same as above, 40% sand (field estimate)
@25' Same as above
@26.5' CLAYEY SILT, hard, slightly moist, medium plasticity
12
9
18
SC
SP-SM
ML
ML
ML
ML
CL-ML
EI, CR
SA, DS
115
107
109
Bulk-1
R-1
R-2
R-3
R-4
S-1
S-2
2326
50/4"
3850/3"
3050/4"
81723
91313
91217
592'
BULK SAMPLECORE SAMPLEGRAB SAMPLERING SAMPLESPLIT SPOON SAMPLETUBE SAMPLE
BCGRST
BER
Hollow Stem Auger - 140lb - Autohammer - 30" Drop
0
5
10
15
20
25
30
So
il C
lass
.
8-4-15
SOIL DESCRIPTION
Sampled By
Drilling Co.Drilling Co.Project
Project No.
See Figure 2
Vantage Point Church
10640.001
Drilling Method8"
Sam
ple
No
.
Fee
t
Hole Diameter
Mo
istu
re
Ground Elevation
Dep
th
Blo
ws
Ele
vati
on
Per
6 In
ches
Page 1 of 2
Att
itu
des
SAMPLE TYPES:
2R Drilling
Co
nte
nt,
%
GEOTECHNICAL BORING LOG LB-1
Logged By
Date Drilled
590
585
580
575
570
565
* * * This log is a part of a report by Leighton and should not be used as a stand-alone document. * * *
BER
Fee
t
S
(U.S
.C.S
.)
Lo
g
Typ
e o
f T
ests
Gra
ph
ic
pcf
Location
Dry
Den
sity
N
This Soil Description applies only to a location of the exploration at thetime of sampling. Subsurface conditions may differ at other locationsand may change with time. The description is a simplification of theactual conditions encountered. Transitions between soil types may begradual.
TYPE OF TESTS:-200ALCNCOCRCU
% FINES PASSINGATTERBERG LIMITSCONSOLIDATIONCOLLAPSECORROSIONUNDRAINED TRIAXIAL
DSEIHMDPPRV
DIRECT SHEAREXPANSION INDEXHYDROMETERMAXIMUM DENSITYPOCKET PENETROMETERR VALUE
SASESGUC
SIEVE ANALYSISSAND EQUIVALENTSPECIFIC GRAVITYUNCONFINED COMPRESSIVE STRENGTH

@30' SAND, very dense, brown to red, slightly moist, coarsesand, nonplastic
@35' Same as above, light brown, only 1" of recovery
@40' SAND, very dense, light brown, slightly moist, coarsesand, nonplastic
@45' SAND with gravel, very dense, light gray, slightly moist,nonplastic, 1/2" gravel maximum, only 4" of recovery
@50' Same as above, only 4" of recovery, fractured quartzpresent
Total Depth: 51.5'No ground waterBackfilled with soil cuttings
SP
SP
SP
SP
SP
S-3
S-4
S-5
S-6
S-7
222348
2550/3"
3550/6"
50/6"
50/6"
592'
BULK SAMPLECORE SAMPLEGRAB SAMPLERING SAMPLESPLIT SPOON SAMPLETUBE SAMPLE
BCGRST
BER
Hollow Stem Auger - 140lb - Autohammer - 30" Drop
30
35
40
45
50
55
60
So
il C
lass
.
8-4-15
SOIL DESCRIPTION
Sampled By
Drilling Co.Drilling Co.Project
Project No.
See Figure 2
Vantage Point Church
10640.001
Drilling Method8"
Sam
ple
No
.
Fee
t
Hole Diameter
Mo
istu
re
Ground Elevation
Dep
th
Blo
ws
Ele
vati
on
Per
6 In
ches
Page 2 of 2
Att
itu
des
SAMPLE TYPES:
2R Drilling
Co
nte
nt,
%
GEOTECHNICAL BORING LOG LB-1
Logged By
Date Drilled
560
555
550
545
540
535
* * * This log is a part of a report by Leighton and should not be used as a stand-alone document. * * *
BER
Fee
t
S
(U.S
.C.S
.)
Lo
g
Typ
e o
f T
ests
Gra
ph
ic
pcf
Location
Dry
Den
sity
N
This Soil Description applies only to a location of the exploration at thetime of sampling. Subsurface conditions may differ at other locationsand may change with time. The description is a simplification of theactual conditions encountered. Transitions between soil types may begradual.
TYPE OF TESTS:-200ALCNCOCRCU
% FINES PASSINGATTERBERG LIMITSCONSOLIDATIONCOLLAPSECORROSIONUNDRAINED TRIAXIAL
DSEIHMDPPRV
DIRECT SHEAREXPANSION INDEXHYDROMETERMAXIMUM DENSITYPOCKET PENETROMETERR VALUE
SASESGUC
SIEVE ANALYSISSAND EQUIVALENTSPECIFIC GRAVITYUNCONFINED COMPRESSIVE STRENGTH

Older Alluvium (Qvoa)@surface: silty sand with minor brush
@2.5' SANDY SILT, hard, brown to red, slightly moist,nonplastic, 10% sand (field estimate)
@5' Same as above
@10' Same as above, slightly plastic
@15' SILTY SAND, very dense, light gray, slightly moist,nonplastic, 20% fines (field estimate)
@20' SILTY SAND, dense, light gray, slightly moist, nonplastic,30% fines (field estimate)
@25' SAND, very dense, light gray, slightly moist, coarse sand,nonplastic
8
22
18
ML
ML
ML
SM
SM
SP
103
102
106
Bulk-1
R-1
R-2
R-3
R-4
S-1
S-2
171617
91212
61428
223348
6916
203143
582'
BULK SAMPLECORE SAMPLEGRAB SAMPLERING SAMPLESPLIT SPOON SAMPLETUBE SAMPLE
BCGRST
BER
Hollow Stem Auger - 140lb - Autohammer - 30" Drop
0
5
10
15
20
25
30
So
il C
lass
.
8-4-15
SOIL DESCRIPTION
Sampled By
Drilling Co.Drilling Co.Project
Project No.
See Figure 2
Vantage Point Church
10640.001
Drilling Method8"
Sam
ple
No
.
Fee
t
Hole Diameter
Mo
istu
re
Ground Elevation
Dep
th
Blo
ws
Ele
vati
on
Per
6 In
ches
Page 1 of 2
Att
itu
des
SAMPLE TYPES:
2R Drilling
Co
nte
nt,
%
GEOTECHNICAL BORING LOG LB-2
Logged By
Date Drilled
580
575
570
565
560
555
* * * This log is a part of a report by Leighton and should not be used as a stand-alone document. * * *
BER
Fee
t
S
(U.S
.C.S
.)
Lo
g
Typ
e o
f T
ests
Gra
ph
ic
pcf
Location
Dry
Den
sity
N
This Soil Description applies only to a location of the exploration at thetime of sampling. Subsurface conditions may differ at other locationsand may change with time. The description is a simplification of theactual conditions encountered. Transitions between soil types may begradual.
TYPE OF TESTS:-200ALCNCOCRCU
% FINES PASSINGATTERBERG LIMITSCONSOLIDATIONCOLLAPSECORROSIONUNDRAINED TRIAXIAL
DSEIHMDPPRV
DIRECT SHEAREXPANSION INDEXHYDROMETERMAXIMUM DENSITYPOCKET PENETROMETERR VALUE
SASESGUC
SIEVE ANALYSISSAND EQUIVALENTSPECIFIC GRAVITYUNCONFINED COMPRESSIVE STRENGTH
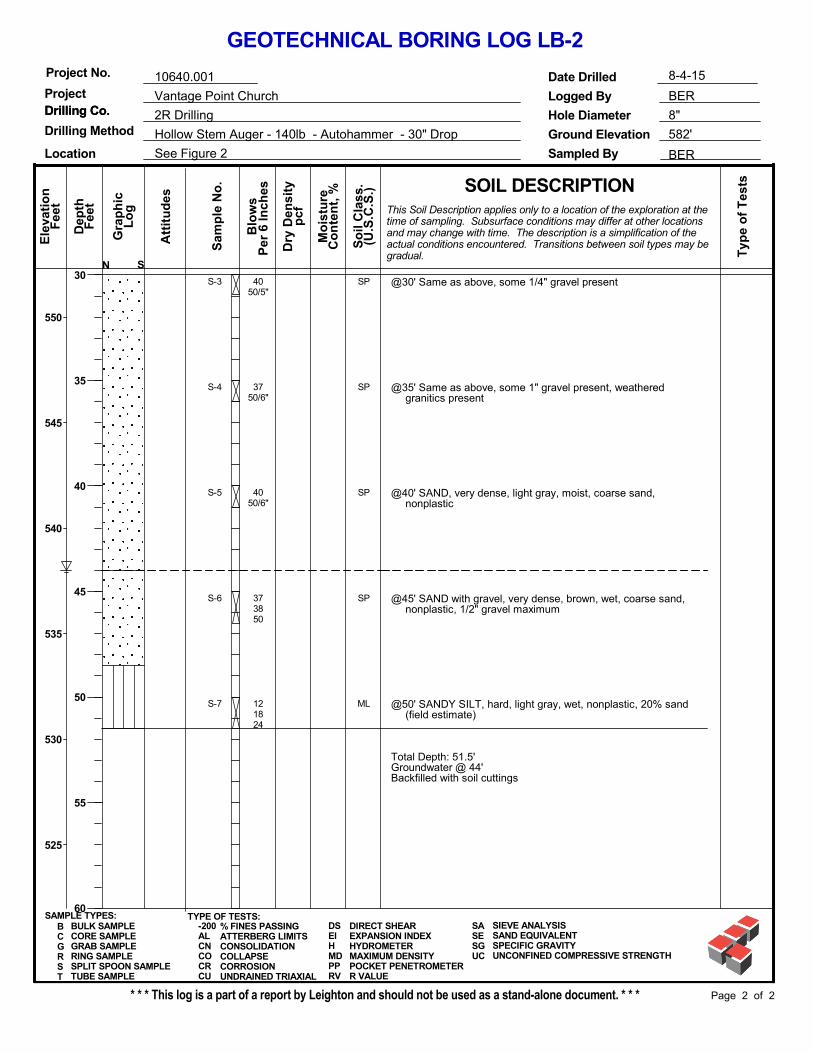
@30' Same as above, some 1/4" gravel present
@35' Same as above, some 1" gravel present, weatheredgranitics present
@40' SAND, very dense, light gray, moist, coarse sand,nonplastic
@45' SAND with gravel, very dense, brown, wet, coarse sand,nonplastic, 1/2" gravel maximum
@50' SANDY SILT, hard, light gray, wet, nonplastic, 20% sand(field estimate)
Total Depth: 51.5'Groundwater @ 44'Backfilled with soil cuttings
SP
SP
SP
SP
ML
S-3
S-4
S-5
S-6
S-7
4050/5"
3750/6"
4050/6"
373850
121824
582'
BULK SAMPLECORE SAMPLEGRAB SAMPLERING SAMPLESPLIT SPOON SAMPLETUBE SAMPLE
BCGRST
BER
Hollow Stem Auger - 140lb - Autohammer - 30" Drop
30
35
40
45
50
55
60
So
il C
lass
.
8-4-15
SOIL DESCRIPTION
Sampled By
Drilling Co.Drilling Co.Project
Project No.
See Figure 2
Vantage Point Church
10640.001
Drilling Method8"
Sam
ple
No
.
Fee
t
Hole Diameter
Mo
istu
re
Ground Elevation
Dep
th
Blo
ws
Ele
vati
on
Per
6 In
ches
Page 2 of 2
Att
itu
des
SAMPLE TYPES:
2R Drilling
Co
nte
nt,
%
GEOTECHNICAL BORING LOG LB-2
Logged By
Date Drilled
550
545
540
535
530
525
* * * This log is a part of a report by Leighton and should not be used as a stand-alone document. * * *
BER
Fee
t
S
(U.S
.C.S
.)
Lo
g
Typ
e o
f T
ests
Gra
ph
ic
pcf
Location
Dry
Den
sity
N
This Soil Description applies only to a location of the exploration at thetime of sampling. Subsurface conditions may differ at other locationsand may change with time. The description is a simplification of theactual conditions encountered. Transitions between soil types may begradual.
TYPE OF TESTS:-200ALCNCOCRCU
% FINES PASSINGATTERBERG LIMITSCONSOLIDATIONCOLLAPSECORROSIONUNDRAINED TRIAXIAL
DSEIHMDPPRV
DIRECT SHEAREXPANSION INDEXHYDROMETERMAXIMUM DENSITYPOCKET PENETROMETERR VALUE
SASESGUC
SIEVE ANALYSISSAND EQUIVALENTSPECIFIC GRAVITYUNCONFINED COMPRESSIVE STRENGTH

Uncontrolled Artificial Fill@surface: tilled sandy silt
@2.5' SILTY SAND, loose, olive brown, slightly moist,nonplastic, 35% fines (field estimate)
@5' SILTY SAND with gravel, loose, dark brown, slightly moist,nonplastic, 15% fines (field estimate), 1/2" gravel maximum,rock fragments present, 1.5" rock maximum, 2.5" rockfragment in tip
@10' SANDY SILT with gravel, hard, dark brown, slightly moist,nonplastic, 25% sand (field estimate), 1/4" gravel maximum,smells organic, woody debris visible, intermixed with graveland concrete fragments, 2" concrete maximum
@15' SANDY SILT, stiff, gray, slightly moist, nonplastic, 10%sand (field estimate), no debris present
@20' CONCRETE DEBRIS, light gray
@25' ORGANICS, manure, black to dark brown, grass present,organic odor, stiff
SM
SM
ML
ML
Bulk-1
R-1
R-2
R-3
R-4
S-1
S-2
334
336
71425
356
18193
445
589'
BULK SAMPLECORE SAMPLEGRAB SAMPLERING SAMPLESPLIT SPOON SAMPLETUBE SAMPLE
BCGRST
BER
Hollow Stem Auger - 140lb - Autohammer - 30" Drop
0
5
10
15
20
25
30
So
il C
lass
.
8-4-15
SOIL DESCRIPTION
Sampled By
Drilling Co.Drilling Co.Project
Project No.
See Figure 2
Vantage Point Church
10640.001
Drilling Method8"
Sam
ple
No
.
Fee
t
Hole Diameter
Mo
istu
re
Ground Elevation
Dep
th
Blo
ws
Ele
vati
on
Per
6 In
ches
Page 1 of 2
Att
itu
des
SAMPLE TYPES:
2R Drilling
Co
nte
nt,
%
GEOTECHNICAL BORING LOG LB-3
Logged By
Date Drilled
585
580
575
570
565
560
* * * This log is a part of a report by Leighton and should not be used as a stand-alone document. * * *
BER
Fee
t
S
(U.S
.C.S
.)
Lo
g
Typ
e o
f T
ests
Gra
ph
ic
pcf
Location
Dry
Den
sity
N
This Soil Description applies only to a location of the exploration at thetime of sampling. Subsurface conditions may differ at other locationsand may change with time. The description is a simplification of theactual conditions encountered. Transitions between soil types may begradual.
TYPE OF TESTS:-200ALCNCOCRCU
% FINES PASSINGATTERBERG LIMITSCONSOLIDATIONCOLLAPSECORROSIONUNDRAINED TRIAXIAL
DSEIHMDPPRV
DIRECT SHEAREXPANSION INDEXHYDROMETERMAXIMUM DENSITYPOCKET PENETROMETERR VALUE
SASESGUC
SIEVE ANALYSISSAND EQUIVALENTSPECIFIC GRAVITYUNCONFINED COMPRESSIVE STRENGTH

@30' SAND with ORGANICS, coarse sand intermixed withorganics, very dense
Older Alluvium (Qvoa)@31' SAND, very dense, light gray, slightly moist, coarse sand,
nonplastic
@35' SAND, very dense, light brown, moist, coarse sand,nonplastic, some 1/4" gravel present
@40' SAND with gravel, very dense, brown, moist, nonplastic,1.5" gravel maximum
@45' SAND with gravel, very dense, light brown, slightly moist,coarse sand, nonplastic, 1/2" gravel maximum, only 13" ofrecovery
@50' SAND, very dense, gray, very moist, coarse sand,nonplastic
Total Depth: 51.5'Groundwater @ 50'Backfilled with soil cuttings
SP
SP
SP
SP
SP
SP
S-3
S-4
S-5
S-6
S-7
91440
50/6"
50/6"
3450/5"
3450/6"
589'
BULK SAMPLECORE SAMPLEGRAB SAMPLERING SAMPLESPLIT SPOON SAMPLETUBE SAMPLE
BCGRST
BER
Hollow Stem Auger - 140lb - Autohammer - 30" Drop
30
35
40
45
50
55
60
So
il C
lass
.
8-4-15
SOIL DESCRIPTION
Sampled By
Drilling Co.Drilling Co.Project
Project No.
See Figure 2
Vantage Point Church
10640.001
Drilling Method8"
Sam
ple
No
.
Fee
t
Hole Diameter
Mo
istu
re
Ground Elevation
Dep
th
Blo
ws
Ele
vati
on
Per
6 In
ches
Page 2 of 2
Att
itu
des
SAMPLE TYPES:
2R Drilling
Co
nte
nt,
%
GEOTECHNICAL BORING LOG LB-3
Logged By
Date Drilled
555
550
545
540
535
530
* * * This log is a part of a report by Leighton and should not be used as a stand-alone document. * * *
BER
Fee
t
S
(U.S
.C.S
.)
Lo
g
Typ
e o
f T
ests
Gra
ph
ic
pcf
Location
Dry
Den
sity
N
This Soil Description applies only to a location of the exploration at thetime of sampling. Subsurface conditions may differ at other locationsand may change with time. The description is a simplification of theactual conditions encountered. Transitions between soil types may begradual.
TYPE OF TESTS:-200ALCNCOCRCU
% FINES PASSINGATTERBERG LIMITSCONSOLIDATIONCOLLAPSECORROSIONUNDRAINED TRIAXIAL
DSEIHMDPPRV
DIRECT SHEAREXPANSION INDEXHYDROMETERMAXIMUM DENSITYPOCKET PENETROMETERR VALUE
SASESGUC
SIEVE ANALYSISSAND EQUIVALENTSPECIFIC GRAVITYUNCONFINED COMPRESSIVE STRENGTH

Older Alluvium (Qvoa)@surface: silty sand
@2.5' SAND with fractured rock, very dense, light brown, slightlymoist, coarse sand, nonplastic, 3" rock maximum
@5' SAND, very dense, light brown, slightly moist, coarse sand,nonplastic
@10' Same as above
@15' Same as above
@20' Same as above
Total Depth: 21.5'No ground waterBackfilled with soil cuttings
5
7
10
SP
SP
SP
SP
SP
103
109
110
R-1
R-2
R-3
R-4
S-1
1550/3"
2850/6"
343649
2850/5"
183037
590'
BULK SAMPLECORE SAMPLEGRAB SAMPLERING SAMPLESPLIT SPOON SAMPLETUBE SAMPLE
BCGRST
BER
Hollow Stem Auger - 140lb - Autohammer - 30" Drop
0
5
10
15
20
25
30
So
il C
lass
.
8-4-15
SOIL DESCRIPTION
Sampled By
Drilling Co.Drilling Co.Project
Project No.
See Figure 2
Vantage Point Church
10640.001
Drilling Method8"
Sam
ple
No
.
Fee
t
Hole Diameter
Mo
istu
re
Ground Elevation
Dep
th
Blo
ws
Ele
vati
on
Per
6 In
ches
Page 1 of 1
Att
itu
des
SAMPLE TYPES:
2R Drilling
Co
nte
nt,
%
GEOTECHNICAL BORING LOG LB-4
Logged By
Date Drilled
590
585
580
575
570
565
560
* * * This log is a part of a report by Leighton and should not be used as a stand-alone document. * * *
BER
Fee
t
S
(U.S
.C.S
.)
Lo
g
Typ
e o
f T
ests
Gra
ph
ic
pcf
Location
Dry
Den
sity
N
This Soil Description applies only to a location of the exploration at thetime of sampling. Subsurface conditions may differ at other locationsand may change with time. The description is a simplification of theactual conditions encountered. Transitions between soil types may begradual.
TYPE OF TESTS:-200ALCNCOCRCU
% FINES PASSINGATTERBERG LIMITSCONSOLIDATIONCOLLAPSECORROSIONUNDRAINED TRIAXIAL
DSEIHMDPPRV
DIRECT SHEAREXPANSION INDEXHYDROMETERMAXIMUM DENSITYPOCKET PENETROMETERR VALUE
SASESGUC
SIEVE ANALYSISSAND EQUIVALENTSPECIFIC GRAVITYUNCONFINED COMPRESSIVE STRENGTH

Older Alluvium (Qvoa)@surface: silty sand
@2.5' SILTY SAND, very dense, dark brown, slightly moist,nonplastic, 25% fines (field estimate)
@2.75' WEATHERED GRANITICS
@5' SAND with gravel, very dense, light brown to white, slightlymoist, nonplastic, 1/2" gravel maximum, weathered granitics,only 4" of recovery
@10' SILTY SAND, very dense, light brown, slightly moist,nonplastic, 15% fines (field estimate)
@15' SAND, very dense, light brown, slightly moist, coarsesand, nonplastic
@20' Same as above
Total Depth: 21.5'No ground waterBackfilled with soil cuttings
7
4
14
SM
SP
SM
SP
SP
118
100
109
R-1
R-2
R-3
R-4
S-1
3750/4"
50/3"
102731
222730
102528
589'
BULK SAMPLECORE SAMPLEGRAB SAMPLERING SAMPLESPLIT SPOON SAMPLETUBE SAMPLE
BCGRST
BER
Hollow Stem Auger - 140lb - Autohammer - 30" Drop
0
5
10
15
20
25
30
So
il C
lass
.
8-4-15
SOIL DESCRIPTION
Sampled By
Drilling Co.Drilling Co.Project
Project No.
See Figure 2
Vantage Point Church
10640.001
Drilling Method8"
Sam
ple
No
.
Fee
t
Hole Diameter
Mo
istu
re
Ground Elevation
Dep
th
Blo
ws
Ele
vati
on
Per
6 In
ches
Page 1 of 1
Att
itu
des
SAMPLE TYPES:
2R Drilling
Co
nte
nt,
%
GEOTECHNICAL BORING LOG LB-5
Logged By
Date Drilled
585
580
575
570
565
560
* * * This log is a part of a report by Leighton and should not be used as a stand-alone document. * * *
BER
Fee
t
S
(U.S
.C.S
.)
Lo
g
Typ
e o
f T
ests
Gra
ph
ic
pcf
Location
Dry
Den
sity
N
This Soil Description applies only to a location of the exploration at thetime of sampling. Subsurface conditions may differ at other locationsand may change with time. The description is a simplification of theactual conditions encountered. Transitions between soil types may begradual.
TYPE OF TESTS:-200ALCNCOCRCU
% FINES PASSINGATTERBERG LIMITSCONSOLIDATIONCOLLAPSECORROSIONUNDRAINED TRIAXIAL
DSEIHMDPPRV
DIRECT SHEAREXPANSION INDEXHYDROMETERMAXIMUM DENSITYPOCKET PENETROMETERR VALUE
SASESGUC
SIEVE ANALYSISSAND EQUIVALENTSPECIFIC GRAVITYUNCONFINED COMPRESSIVE STRENGTH

Older Alluvium (Qvoa)@surface: tilled silty sand
@2.5' SILTY SAND, very stiff, brown to red, slightly moist,nonplastic, 30% fines (field estimate)
@5' Same as above
@10' SANDY CLAY, hard, brown to red, 44% sand, 56% fines
@10.9' SILTY SAND, hard, brown to red, slightly moist,nonplastic, 20% fines (field estimate),
@15' SAND, dense, light brown, slightly moist, coarse sand,nonplastic, fractured quartz present
@20' Same as above
@25' Same as above
Total Depth: 26.5'No ground waterBackfilled with soil cuttings
SM
SM
CL
SM
SP
SP
SP
SA
S-1
S-2
S-3
S-4
S-5
S-6
654
557
81718
102020
1027
50/5"
4350/5"
578'
BULK SAMPLECORE SAMPLEGRAB SAMPLERING SAMPLESPLIT SPOON SAMPLETUBE SAMPLE
BCGRST
BER
Hollow Stem Auger - 140lb - Autohammer - 30" Drop
0
5
10
15
20
25
30
So
il C
lass
.
8-4-15
SOIL DESCRIPTION
Sampled By
Drilling Co.Drilling Co.Project
Project No.
See Figure 2
Vantage Point Church
10640.001
Drilling Method8"
Sam
ple
No
.
Fee
t
Hole Diameter
Mo
istu
re
Ground Elevation
Dep
th
Blo
ws
Ele
vati
on
Per
6 In
ches
Page 1 of 1
Att
itu
des
SAMPLE TYPES:
2R Drilling
Co
nte
nt,
%
GEOTECHNICAL BORING LOG WP-1
Logged By
Date Drilled
575
570
565
560
555
550
* * * This log is a part of a report by Leighton and should not be used as a stand-alone document. * * *
BER
Fee
t
S
(U.S
.C.S
.)
Lo
g
Typ
e o
f T
ests
Gra
ph
ic
pcf
Location
Dry
Den
sity
N
This Soil Description applies only to a location of the exploration at thetime of sampling. Subsurface conditions may differ at other locationsand may change with time. The description is a simplification of theactual conditions encountered. Transitions between soil types may begradual.
TYPE OF TESTS:-200ALCNCOCRCU
% FINES PASSINGATTERBERG LIMITSCONSOLIDATIONCOLLAPSECORROSIONUNDRAINED TRIAXIAL
DSEIHMDPPRV
DIRECT SHEAREXPANSION INDEXHYDROMETERMAXIMUM DENSITYPOCKET PENETROMETERR VALUE
SASESGUC
SIEVE ANALYSISSAND EQUIVALENTSPECIFIC GRAVITYUNCONFINED COMPRESSIVE STRENGTH

Older Alluvium (Qvoa)@surface: tilled silty sand
@2.5' SILTY SAND, very stiff, brown to red, slightly moist,nonplastic, 66% sand, 34% fines
@5', Same as above, 30% fines (field estimate)
@10' SILTY SAND, very stiff, brown, slightly moist, nonplastic,15% fines (field estimate)
@15' SAND, medium dense, light brown, slightly moist, coarsesand, nonplastic
@20' Same as above, dense, fractured quartz present
Total Depth: 21.5'No ground waterBackfilled with soil cuttings
SM
SM
SM
SP
SP
SAS-1
S-2
S-3
S-4
S-5
161713
131211
71016
967
71028
584'
BULK SAMPLECORE SAMPLEGRAB SAMPLERING SAMPLESPLIT SPOON SAMPLETUBE SAMPLE
BCGRST
BER
Hollow Stem Auger - 140lb - Autohammer - 30" Drop
0
5
10
15
20
25
30
So
il C
lass
.
8-4-15
SOIL DESCRIPTION
Sampled By
Drilling Co.Drilling Co.Project
Project No.
See Figure 2
Vantage Point Church
10640.001
Drilling Method8"
Sam
ple
No
.
Fee
t
Hole Diameter
Mo
istu
re
Ground Elevation
Dep
th
Blo
ws
Ele
vati
on
Per
6 In
ches
Page 1 of 1
Att
itu
des
SAMPLE TYPES:
2R Drilling
Co
nte
nt,
%
GEOTECHNICAL BORING LOG WP-2
Logged By
Date Drilled
580
575
570
565
560
555
* * * This log is a part of a report by Leighton and should not be used as a stand-alone document. * * *
BER
Fee
t
S
(U.S
.C.S
.)
Lo
g
Typ
e o
f T
ests
Gra
ph
ic
pcf
Location
Dry
Den
sity
N
This Soil Description applies only to a location of the exploration at thetime of sampling. Subsurface conditions may differ at other locationsand may change with time. The description is a simplification of theactual conditions encountered. Transitions between soil types may begradual.
TYPE OF TESTS:-200ALCNCOCRCU
% FINES PASSINGATTERBERG LIMITSCONSOLIDATIONCOLLAPSECORROSIONUNDRAINED TRIAXIAL
DSEIHMDPPRV
DIRECT SHEAREXPANSION INDEXHYDROMETERMAXIMUM DENSITYPOCKET PENETROMETERR VALUE
SASESGUC
SIEVE ANALYSISSAND EQUIVALENTSPECIFIC GRAVITYUNCONFINED COMPRESSIVE STRENGTH

Older Alluvium (Qvoa)@surface: tilled silty sand
@2.5', SILTY-CLAYEY SAND, hard, brown to red, slightly moist,nonplastic, 1% gravel, 60% sand, 39% fines
@5' Same as above, 30% fines (field estimate), slightly plastic
@10' SANDY SILT, hard, brown, nonplastic, 15% sand (fieldestimate)
@15' SILTY SAND, hard, light gray, slightly moist, nonplastic,30% fines (field estimate)
@20' SAND, very dense, light gray, slightly moist, coarse sand,nonplastic
Total Depth: 21.5'No ground waterBackfilled with soil cuttings
SC-SM
SC-SM
ML
SM
SP
SAS-1
S-2
S-3
S-4
S-5
101215
101827
101016
71222
213140
581'
BULK SAMPLECORE SAMPLEGRAB SAMPLERING SAMPLESPLIT SPOON SAMPLETUBE SAMPLE
BCGRST
BER
Hollow Stem Auger - 140lb - Autohammer - 30" Drop
0
5
10
15
20
25
30
So
il C
lass
.
8-4-15
SOIL DESCRIPTION
Sampled By
Drilling Co.Drilling Co.Project
Project No.
See Figure 2
Vantage Point Church
10640.001
Drilling Method8"
Sam
ple
No
.
Fee
t
Hole Diameter
Mo
istu
re
Ground Elevation
Dep
th
Blo
ws
Ele
vati
on
Per
6 In
ches
Page 1 of 1
Att
itu
des
SAMPLE TYPES:
2R Drilling
Co
nte
nt,
%
GEOTECHNICAL BORING LOG WP-3
Logged By
Date Drilled
580
575
570
565
560
555
* * * This log is a part of a report by Leighton and should not be used as a stand-alone document. * * *
BER
Fee
t
S
(U.S
.C.S
.)
Lo
g
Typ
e o
f T
ests
Gra
ph
ic
pcf
Location
Dry
Den
sity
N
This Soil Description applies only to a location of the exploration at thetime of sampling. Subsurface conditions may differ at other locationsand may change with time. The description is a simplification of theactual conditions encountered. Transitions between soil types may begradual.
TYPE OF TESTS:-200ALCNCOCRCU
% FINES PASSINGATTERBERG LIMITSCONSOLIDATIONCOLLAPSECORROSIONUNDRAINED TRIAXIAL
DSEIHMDPPRV
DIRECT SHEAREXPANSION INDEXHYDROMETERMAXIMUM DENSITYPOCKET PENETROMETERR VALUE
SASESGUC
SIEVE ANALYSISSAND EQUIVALENTSPECIFIC GRAVITYUNCONFINED COMPRESSIVE STRENGTH
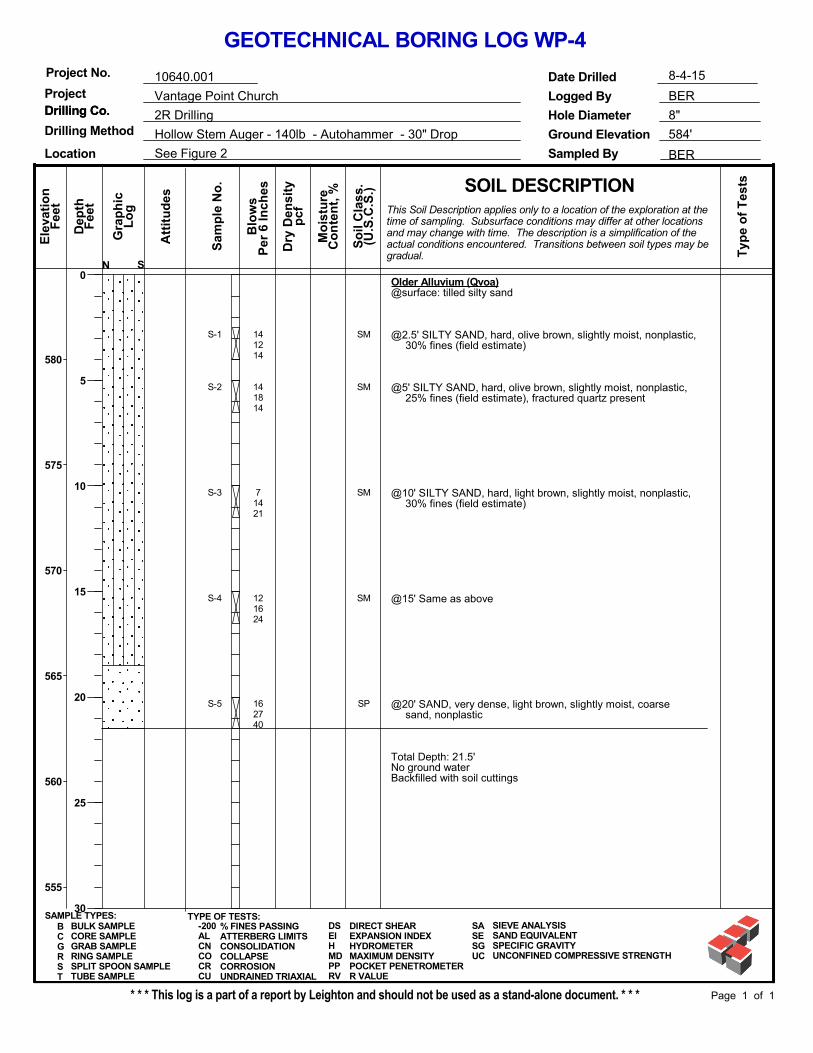
Older Alluvium (Qvoa)@surface: tilled silty sand
@2.5' SILTY SAND, hard, olive brown, slightly moist, nonplastic,30% fines (field estimate)
@5' SILTY SAND, hard, olive brown, slightly moist, nonplastic,25% fines (field estimate), fractured quartz present
@10' SILTY SAND, hard, light brown, slightly moist, nonplastic,30% fines (field estimate)
@15' Same as above
@20' SAND, very dense, light brown, slightly moist, coarsesand, nonplastic
Total Depth: 21.5'No ground waterBackfilled with soil cuttings
SM
SM
SM
SM
SP
S-1
S-2
S-3
S-4
S-5
141214
141814
71421
121624
162740
584'
BULK SAMPLECORE SAMPLEGRAB SAMPLERING SAMPLESPLIT SPOON SAMPLETUBE SAMPLE
BCGRST
BER
Hollow Stem Auger - 140lb - Autohammer - 30" Drop
0
5
10
15
20
25
30
So
il C
lass
.
8-4-15
SOIL DESCRIPTION
Sampled By
Drilling Co.Drilling Co.Project
Project No.
See Figure 2
Vantage Point Church
10640.001
Drilling Method8"
Sam
ple
No
.
Fee
t
Hole Diameter
Mo
istu
re
Ground Elevation
Dep
th
Blo
ws
Ele
vati
on
Per
6 In
ches
Page 1 of 1
Att
itu
des
SAMPLE TYPES:
2R Drilling
Co
nte
nt,
%
GEOTECHNICAL BORING LOG WP-4
Logged By
Date Drilled
580
575
570
565
560
555
* * * This log is a part of a report by Leighton and should not be used as a stand-alone document. * * *
BER
Fee
t
S
(U.S
.C.S
.)
Lo
g
Typ
e o
f T
ests
Gra
ph
ic
pcf
Location
Dry
Den
sity
N
This Soil Description applies only to a location of the exploration at thetime of sampling. Subsurface conditions may differ at other locationsand may change with time. The description is a simplification of theactual conditions encountered. Transitions between soil types may begradual.
TYPE OF TESTS:-200ALCNCOCRCU
% FINES PASSINGATTERBERG LIMITSCONSOLIDATIONCOLLAPSECORROSIONUNDRAINED TRIAXIAL
DSEIHMDPPRV
DIRECT SHEAREXPANSION INDEXHYDROMETERMAXIMUM DENSITYPOCKET PENETROMETERR VALUE
SASESGUC
SIEVE ANALYSISSAND EQUIVALENTSPECIFIC GRAVITYUNCONFINED COMPRESSIVE STRENGTH

Results of Well Permeameter, from USBR 7300-89 Method. LeightonProject: Vantage Point Church Infil #10640.001 Approx Ht from water surface to top of float assembly (in.): #N/A
Exploration #/Location: WP-1 Approx float assem length (w/out extension), in.: #N/A
Depth Boring drilled to (ft): 7 a.* b.*Tested by: BER Initial estimated Depth to Water Surface (in.): #N/A #N/A
USCS Soil Type: Initial est. depth of water in well, "h" (in.): #N/A #N/A
Weather (start to finish) Clear, sunny approx. h/r (prelim): #N/A #N/A
Liquid Used/pH: Well Water Tu (Fig. 8): #N/A
Diameter of barrel (in.): 22.5 Tu>3h?: #N/A
No. of Supply barrels: 1 397.4 Total Area of barrels (in.^2): *a. Est. by measurements from top of float assm.
Measured boring diameter 8 in. 4 Well Radius, "r" *b. Est. by measurements from top of sand
Approx Depth to GW below GS 100 ftWell Prep:
ft in. (total)Depth to Bot of well (or top of soil over Bentonite) 7. ft 84 Data Logger Info:Depth to top of dry sand before casing install 6. ft 0. in. 72 12 sand thickness Data Logger: Track-It DL1
Length of casing 0 Sensor: S1a
Casing stickup (+ is above ground) 0 55 sand thickness DL Channel (1 or 2): 1
Depth to Top of Sand from top of casing 2. ft 5. in. 29 29 0 check by casing length Height of sensor above bottom of barrel: 0.1Pilot Tube stickup (+ is above ground) 0. ft 50. in. 50 Density of H2O (psf): 62.4
Depth to top of float assembly from top of pilot tube 4. ft 10. in. 58 8 Depth below GS (in.) Time correction (shift field t. to match DL t.), min.: 0
Float Assembly ID AFloat assembly Extension length (in.) 0
Field Data Calculations
Comments
Start Date Start time: from barrels
from h
Total
8/5/2015 9:43 AM ft in.
- #N/A #N/A <--est. from setup measurements
8/5/15 9:43 27.75 7.40 79 0 38.8 45.2 #N/A #N/A #N/A ###### ##### ####### 0.8 #VALUE! #VALUE!
8/5/15 10:21 24 7.22 83 38 38 36.6 47.4 2.16 46 1490 -53 1438 38 2270 0.8 0.29 1.50
8/5/15 11:19 20 7.23 88 58 96 36.8 47.2 -0.12 47 1590 3 1593 27 1647 0.8 0.20 1.02
8/5/15 12:21 16.125 7.25 90 62 158 37.0 47.0 -0.24 47 1540 6 1546 25 1496 0.8 0.18 0.91
8/5/15 13:06 13.125 7.26 92 45 203 37.1 46.9 -0.12 47 1192 3 1195 27 1594 0.7 0.19 0.96
203 37.1 46.9 0 47 0 ###### ##### ####### 0.7 #VALUE! #VALUE!
203 37.1 46.9 0 47 0 ###### ##### ####### 0.7 #VALUE! #VALUE!
203 37.1 46.9 0 47 0 ###### ##### ####### 0.7 #VALUE! #VALUE!
203 37.1 46.9 0 47 0 ###### ##### ####### 0.7 #VALUE! #VALUE!
203 37.1 46.9 0 47 0 ###### ##### ####### 0.7 #VALUE! #VALUE!
V (Fig 9)
K20, Coef. Of Perme-ability at 20 deg C
(in./hr)
InfiltrationRate
[flow/surfarea] (in./hr)
(FS=1)
(or "y" for DL interpre-tation)
Straight drill
Vol Change (in.^3) Flow (in^3/ min)
q,Flow
(in^3/ hr)
Total Elapsed
Time (min.)
Depth to WL in
well (in.)
h, Height of Water in Well (in.)
h (in.) Avg. h
Date Time WaterLevel in SupplyBarrel(in.)
Depth to WL in Boring (measured from top of pilot
tube)
Water Temp
(deg F)
t (min)

Results of Well Permeameter, from USBR 7300-89 Method. LeightonProject: Vantage Point Church Infil #10640.001 Approx Ht from water surface to top of float assembly (in.): #N/A
Exploration #/Location: WP-2 Approx float assem length (w/out extension), in.: #N/A
Depth Boring drilled to (ft): 3 a.* b.*Tested by: BER Initial estimated Depth to Water Surface (in.): #N/A #N/A
USCS Soil Type: Initial est. depth of water in well, "h" (in.): #N/A #N/A
Weather (start to finish) Clear, sunny approx. h/r (prelim): #N/A #N/A
Liquid Used/pH: Well Water Tu (Fig. 8): #N/A
Diameter of barrel (in.): 22.5 Tu>3h?: #N/A
No. of Supply barrels: 1 397.4 Total Area of barrels (in.^2): *a. Est. by measurements from top of float assm.
Measured boring diameter 8 in. 4 Well Radius, "r" *b. Est. by measurements from top of sand
Approx Depth to GW below GS 100 ftWell Prep:
ft in. (total)Depth to Bot of well (or top of soil over Bentonite) 3. ft 36 Data Logger Info:Depth to top of dry sand before casing install 2. ft 8. in. 32 4 sand thickness Data Logger: Track-It DL1
Length of casing 0 Sensor: S1a
Casing stickup (+ is above ground) 0 36 sand thickness DL Channel (1 or 2): 1
Depth to Top of Sand from top of casing 0. in. 0 0 0 check by casing length Height of sensor above bottom of barrel: 0.1Pilot Tube stickup (+ is above ground) 1. ft 12 Density of H2O (psf): 62.4
Depth to top of float assembly from top of pilot tube 17. in. 17 5 Depth below GS (in.) Time correction (shift field t. to match DL t.), min.: 0
Float Assembly ID EFloat assembly Extension length (in.)
Field Data Calculations
Comments
Start Date Start time: from barrels
from h
Total
8/5/2015 9:53 AM ft in.
- #N/A #N/A <--est. from setup measurements
8/5/15 9:53 30 3.38 78 0 28.6 7.4 #N/A #N/A #N/A ###### ##### ####### 0.9 #VALUE! #VALUE!
8/5/15 10:31 29.5 3.28 82 38 38 27.4 8.6 1.2 8 199 -29 170 4 268 0.8 0.38 0.86
8/5/15 11:27 29 3.29 85 56 94 27.5 8.5 -0.12 9 199 3 202 4 216 0.8 0.32 0.64
8/5/15 12:19 28.625 3.29 87 52 146 27.5 8.5 0 9 149 0 149 3 172 0.8 0.25 0.50
8/5/15 13:04 28.125 3.28 89 45 191 27.4 8.6 0.12 9 199 -3 196 4 261 0.8 0.37 0.75
191 27.4 8.6 0 9 0 ###### ##### ####### 0.8 #VALUE! #VALUE!
8/5/15 13:33 27.25 2.41 90 220 16.9 19.1 10.44 14 -254 ###### ##### ####### 0.8 #VALUE! #VALUE!
8/5/15 13:44 26.75 2.35 91 11 231 16.2 19.8 0.72 19 199 -18 181 16 988 0.7 0.44 1.37
8/5/15 14:02 26.25 2.33 91 18 249 16.0 20.0 0.24 20 199 -6 193 11 643 0.7 0.28 0.87
8/5/15 14:20 25.75 2.33 92 18 267 16.0 20.0 0 20 199 0 199 11 662 0.7 0.29 0.89
8/5/15 14:31 25.5 2.34 92 11 278 16.1 19.9 -0.12 20 99 3 102 9 558 0.7 0.25 0.75
8/5/15 14:57 24.75 2.35 94 26 304 16.2 19.8 -0.12 20 298 3 301 12 695 0.7 0.31 0.93
8/5/15 15:10 24.375 2.35 93 13 317 16.2 19.8 0 20 149 0 149 11 688 0.7 0.31 0.93
8/5/15 15:28 24 2.35 93 18 335 16.2 19.8 0 20 149 0 149 8 497 0.7 0.22 0.67
335 16.2 19.8 0 20 0 ###### ##### ####### 0.7 #VALUE! #VALUE!
335 16.2 19.8 0 20 0 ###### ##### ####### 0.7 #VALUE! #VALUE!
335 16.2 19.8 0 20 0 ###### ##### ####### 0.7 #VALUE! #VALUE!
335 16.2 19.8 0 20 0 ###### ##### ####### 0.7 #VALUE! #VALUE!
335 16.2 19.8 0 20 0 ###### ##### ####### 0.7 #VALUE! #VALUE!
Straight drill
V (Fig 9)
K20, Coef. Of Perme-ability at 20 deg C
(in./hr)
InfiltrationRate
[flow/surfarea] (in./hr)
(FS=1)
(or "y" for DL interpre-tation)
Vol Change (in.^3) Flow (in^3/ min)
q,Flow
(in^3/ hr)
Total Elapsed
Time (min.)
Depth to WL in
well (in.)
h, Height of Water in Well (in.)
h (in.) Avg. ht (min)
Date Time WaterLevel in SupplyBarrel(in.)
Depth to WL in Boring (measured from top of pilot
tube)
Water Temp
(deg F)

Results of Well Permeameter, from USBR 7300-89 Method. LeightonProject: Vantage Point Church Infil #10640.001 Approx Ht from water surface to top of float assembly (in.): #N/A
Exploration #/Location: WP-3 Approx float assem length (w/out extension), in.: #N/A
Depth Boring drilled to (ft): 3.166667 a.* b.*Tested by: BER Initial estimated Depth to Water Surface (in.): #N/A #N/A
USCS Soil Type: Initial est. depth of water in well, "h" (in.): #N/A #N/A
Weather (start to finish) Clear, sunny approx. h/r (prelim): #N/A #N/A
Liquid Used/pH: Well Water Tu (Fig. 8): #N/A
Diameter of barrel (in.): 22.5 Tu>3h?: #N/A
No. of Supply barrels: 1 397.4 Total Area of barrels (in.^2): *a. Est. by measurements from top of float assm.
Measured boring diameter 8 in. 4 Well Radius, "r" *b. Est. by measurements from top of sand
Approx Depth to GW below GS 100 ftWell Prep:
ft in. (total)Depth to Bot of well (or top of soil over Bentonite) 3. ft 2. in. 38 Data Logger Info:Depth to top of dry sand before casing install 3. ft 36 2 sand thickness Data Logger: Track-It DL1
Length of casing 0 Sensor: S1a
Casing stickup (+ is above ground) 0 38 sand thickness DL Channel (1 or 2): 1
Depth to Top of Sand from top of casing 0. in. 0 0 0 check by casing length Height of sensor above bottom of barrel: 0.1Pilot Tube stickup (+ is above ground) 10. in. 10 Density of H2O (psf): 62.4
Depth to top of float assembly from top of pilot tube 9.5 in. 9.5 0.5 Depth below GS (in.) Time correction (shift field t. to match DL t.), min.: 0
Float Assembly ID BFloat assembly Extension length (in.)
Field Data Calculations
Comments
Start Date Start time: from barrels
from h
Total
8/5/2015 9:46 AM ft in.
- #N/A #N/A <--est. from setup measurements
8/5/15 9:46 29.125 2.82 79 0 23.8 14.2 #N/A #N/A #N/A ###### ##### ####### 0.8 #VALUE! #VALUE!
8/5/15 10:24 29 2.75 83 38 38 23.0 15.0 0.84 15 50 -20 29 1 46 0.8 0.03 0.09
8/5/15 11:22 28.75 2.71 86 58 96 22.5 15.5 0.48 15 99 -12 88 2 91 0.8 0.06 0.16
8/5/15 12:23 28.5 2.68 89 61 157 22.2 15.8 0.36 16 99 -9 91 1 89 0.8 0.06 0.15
8/5/15 13:08 28.375 2.68 90 45 202 22.2 15.8 0 16 50 0 50 1 66 0.8 0.04 0.11
202 22.2 15.8 0 16 0 ###### ##### ####### 0.8 #VALUE! #VALUE!
202 22.2 15.8 0 16 0 ###### ##### ####### 0.8 #VALUE! #VALUE!
202 22.2 15.8 0 16 0 ###### ##### ####### 0.8 #VALUE! #VALUE!
202 22.2 15.8 0 16 0 ###### ##### ####### 0.8 #VALUE! #VALUE!
202 22.2 15.8 0 16 0 ###### ##### ####### 0.8 #VALUE! #VALUE!
202 22.2 15.8 0 16 0 ###### ##### ####### 0.8 #VALUE! #VALUE!
Straight drill
V (Fig 9)
K20, Coef. Of Perme-ability at 20 deg C
(in./hr)
InfiltrationRate
[flow/surfarea] (in./hr)
(FS=1)
(or "y" for DL interpre-tation)
Vol Change (in.^3) Flow (in^3/ min)
q,Flow
(in^3/ hr)
Total Elapsed
Time (min.)
Depth to WL in
well (in.)
h, Height of Water in Well (in.)
h (in.) Avg. ht (min)
Date Time WaterLevel in SupplyBarrel(in.)
Depth to WL in Boring (measured from top of pilot
tube)
Water Temp
(deg F)

Results of Well Permeameter, from USBR 7300-89 Method. LeightonProject: Vantage Point Church Infil #10640.001 Approx Ht from water surface to top of float assembly (in.): #N/A
Exploration #/Location: WP-4 Approx float assem length (w/out extension), in.: #N/A
Depth Boring drilled to (ft): 3.333333 a.* b.*Tested by: BER Initial estimated Depth to Water Surface (in.): #N/A #N/A
USCS Soil Type: Initial est. depth of water in well, "h" (in.): #N/A #N/A
Weather (start to finish) Clear, sunny approx. h/r (prelim): #N/A #N/A
Liquid Used/pH: Well Water Tu (Fig. 8): #N/A
Diameter of barrel (in.): 22.5 Tu>3h?: #N/A
No. of Supply barrels: 1 397.4 Total Area of barrels (in.^2): *a. Est. by measurements from top of float assm.
Measured boring diameter 8 in. 4 Well Radius, "r" *b. Est. by measurements from top of sand
Approx Depth to GW below GS 100 ftWell Prep:
ft in. (total)Depth to Bot of well (or top of soil over Bentonite) 3. ft 4. in. 40 Data Logger Info:Depth to top of dry sand before casing install 3. ft 36 4 sand thickness Data Logger: Track-It DL1
Length of casing 0 Sensor: S1a
Casing stickup (+ is above ground) 0 40 sand thickness DL Channel (1 or 2): 1
Depth to Top of Sand from top of casing 0. in. 0 0 0 check by casing length Height of sensor above bottom of barrel: 0.1Pilot Tube stickup (+ is above ground) 10. in. 10 Density of H2O (psf): 62.4
Depth to top of float assembly from top of pilot tube 19.5 in. 19.5 9.5 Depth below GS (in.) Time correction (shift field t. to match DL t.), min.: 0
Float Assembly ID DFloat assembly Extension length (in.)
Field Data Calculations
Comments
Start Date Start time: from barrels
from h
Total
8/5/2015 9:50 AM ft in.
- #N/A #N/A <--est. from setup measurements
8/5/15 9:50 30.75 3.15 77 0 27.8 12.2 #N/A #N/A #N/A ###### ##### ####### 0.9 #VALUE! #VALUE!
8/5/15 10:26 30.625 3.14 80 36 36 27.7 12.3 0.12 12 50 -3 47 1 78 0.8 0.08 0.18
8/5/15 11:24 30.5 3.15 83 58 94 27.8 12.2 -0.12 12 50 3 53 1 54 0.8 0.05 0.12
8/5/15 12:25 30.375 3.16 85 61 155 27.9 12.1 -0.12 12 50 3 53 1 52 0.8 0.05 0.11
8/5/15 13:10 30.25 3.16 87 45 200 27.9 12.1 0 12 50 0 50 1 66 0.8 0.06 0.14
200 27.9 12.1 0 12 0 ###### ##### ####### 0.8 #VALUE! #VALUE!
200 27.9 12.1 0 12 0 ###### ##### ####### 0.8 #VALUE! #VALUE!
V (Fig 9)
K20, Coef. Of Perme-ability at 20 deg C
(in./hr)
InfiltrationRate
[flow/surfarea] (in./hr)
(FS=1)
(or "y" for DL interpre-tation)
Straight drill
Vol Change (in.^3) Flow (in^3/ min)
q,Flow
(in^3/ hr)
Total Elapsed
Time (min.)
Depth to WL in
well (in.)
h, Height of Water in Well (in.)
h (in.) Avg. h
Date Time WaterLevel in SupplyBarrel(in.)
Depth to WL in Boring (measured from top of pilot
tube)
Water Temp
(deg F)
t (min)

APPENDIX C
LABORATORY TEST RESULTS

Project Name: Vantage Point Church Tested By: G. Bathala Date: 08/13/15Project No.: 10640.001 Checked By: J. WardBoring No.: Sample Type: RingSample No.: Depth (ft.): 15.0Soil Identification:
2.415 2.415 2.4151.000 1.000 1.000187.94 190.84 192.7443.19 41.97 43.18
Before Shearing210.10 210.10 210.10181.32 181.32 181.3239.54 39.54 39.540.0000 0.2724 0.2670-0.0039 0.2778 0.2826
After Shearing184.68 188.47 188.40155.98 161.47 160.1837.75 37.97 38.522.70 2.70 2.7062.43 62.43 62.43
Sample Diameter(in):
Water Density(pcf):Specific Gravity (Assumed):Weight of Container(gm):Weight of Dry Sample+Cont.(gm):
Weight of Ring(gm):
Weight of Container(gm):Weight of Dry Sample+Cont.(gm):Weight of Wet Sample+Cont.(gm):
Weight of Wet Sample+Cont.(gm):
Vertical Rdg.(in): FinalVertical Rdg.(in): Initial
DIRECT SHEAR TESTConsolidated Undrained
Sample Thickness(in.):Weight of Sample + ring(gm):
R-4LB-1
Light olive brown sandy silt s(ML)
DS LB-1, R-4 @ 15

Normal Stress (kip/ft²)Peak Shear Stress (kip/ft²)Shear Stress @ End of Test (ksf)Deformation Rate (in./min.)
Initial Sample Height (in.)Diameter (in.)Initial Moisture Content (%)Dry Density (pcf)Saturation (%)Soil Height Before Shearing (in.)Final Moisture Content (%)
103.4
1.0002.41520.30
Boring No.Sample No.Depth (ft)
LB-1R-415
85.90.994621.9
Soil Identification: 20.30102.9
20.30100.1
1.1440.0500
4.0003.8952.2420.0500
1.0001.5440.6790.0500
1.0002.415
1.0002.415
2.0002.987
80.10.996124.3
Vantage Point ChurchDIRECT SHEAR TEST RESULTS
Consolidated Undrained
87.00.984423.2
08-15
Project No.: 10640.001
Sample Type:
Ring
Light olive brown sandy silt s(ML)
0.00
1.00
2.00
3.00
4.00
5.00
0 0.1 0.2 0.3
She
ar S
tress
(ksf
)
Horizontal Deformation (in.)
0.00
1.00
2.00
3.00
4.00
5.00
0.00 1.00 2.00 3.00 4.00 5.00 6.00 7.00 8.00 9.00 10.00
Shea
r Stre
ss (k
sf)
Normal Stress (ksf)
DS LB-1, R-4 @ 15

Normal Stress (kip/ft²)Peak Shear Stress (kip/ft²)Shear Stress @ End of Test (ksf)
Sample Type: Ring Deformation Rate (in./min.)
Initial Sample Height (in.)Diameter (in.)Initial Moisture Content (%)
Strength Parameters Dry Density (pcf)C (psf) (o) Saturation (%)
Peak 1090.0 36.4 Soil Height Before Shearing (in.)Ultimate 130.0 27.7 Final Moisture Content (%)
08-15
Project No.: 10640.001
80.10.9961
1.000
24.3
Vantage Point ChurchDIRECT SHEAR TEST RESULTS
Consolidated Undrained
1.0001.5440.6790.0500
20.30100.1
2.415Soil Identification:
0.9844
20.30
23.2
1.0002.415
0.994621.9
103.4
1.0002.415
85.9
20.30102.9
0.0500
4.0003.8952.2420.0500
87.0
2.000
Light olive brown sandy silt s(ML)
Boring No.Sample No.Depth (ft)
LB-1R-415
2.9871.144
0.00
1.00
2.00
3.00
4.00
5.00
0 0.1 0.2 0.3
She
ar S
tress
(ksf
)
Horizontal Deformation (in.)
0.0
1.0
2.0
3.0
4.0
5.0
0.0 1.0 2.0 3.0 4.0 5.0
She
ar S
tress
(ksf
)
Normal Stress (ksf)
DS LB-1, R-4 @ 15

Project Name: Vantage Point Church Tested By : G.Berdy Date: 08/14/15
Project No. : 10640.001 Data Input By: J. Ward Date: 08/28/15
Boring No. LB-1
Sample No. B-1
Sample Depth (ft) 2-5
225.96
216.75
58.56
5.82
100.23
60
14
850
11:00/11:35
35
19.3223
19.3202
0.0021
86.41
92
ml of Extract For Titration (B) 30
ml of AgNO3 Soln. Used in Titration (C) 0.6
PPM of Chloride (C -0.2) * 100 * 30 / B 40
PPM of Chloride, Dry Wt. Basis 42
6.17
23.0
TESTS for SULFATE CONTENTCHLORIDE CONTENT and pH of SOILS
SULFATE CONTENT, DOT California Test 417, Part II
Soil Identification:
Moisture Content (%)
Temperature °C
pH Value
pH TEST, DOT California Test 643
CHLORIDE CONTENT, DOT California Test 422
Time In / Time Out
Weight of Soaked Soil (g)
Brown SC
Wt. of Crucible + Residue (g)
Wet Weight of Soil + Container (g)
Dry Weight of Soil + Container (g)
Weight of Container (g)
Duration of Combustion (min)
Beaker No.
Crucible No.
Furnace Temperature (°C)
PPM of Sulfate (A) x 41150
PPM of Sulfate, Dry Weight Basis
Wt. of Crucible (g)
Wt. of Residue (g) (A)

Project Name: Tested By : G.Berdy Date:
Project No. : Data Input By: J. Ward Date:
Boring No.: Depth (ft.) :
Sample No. :
Dry Wt. of Soil + Cont. (g)
4000
Soil Identification:**California Test 643 requires soil specimens to consist only of portions of samples passing through the No. 8 US Standard Sieve before resistivity testing. Therefore, this test method may not be representative for coarser materials.
Wt. of Container (g)13.93 4000
5.82
225.96
Moisture Content (%) (MCi)
Wet Wt. of Soil + Cont. (g)Specimen
No.
1
2
Water Added (ml)
(Wa)
10
Adjusted Moisture Content
(MC)
DOT CA Test 643
1.000
Chloride Content(ohm-cm)
38.27
Moisture Content Sulfate Content
5
Min. Resistivity
DOT CA Test 643DOT CA Test 417 Part II DOT CA Test 422
(%) (ppm) (ppm)
4
20
30
40
130.473 175030.15
1700
1525 24.6 92 42 6.17 23.0
SOIL RESISTIVITY TESTDOT CA TEST 643
Temp. (°C)pH
Soil pH
1700
1750
216.75
58.56
MC =(((1+Mci/100)x(Wa/Wt+1))-1)x100
Vantage Point Church 08/18/15
08/28/15
2-5
10640.001
LB-1
B-1
Container No.
Initial Soil Wt. (g) (Wt)
Box Constant2000 2000
Brown SC
Resistance Reading (ohm)
22.04
Soil Resistivity (ohm-cm)
1000
1500
2000
2500
3000
3500
4000
4500
10.0 15.0 20.0 25.0 30.0 35.0 40.0
Soil
Res
istiv
ity (o
hm-c
m)
Moisture Content (%)

Tested By: S. Felter Date: 08/14/15Checked By: J. Ward Date: 08/28/15Depth (ft.):
Dry Wt. of Soil + Cont. (g)Wt. of Container No. (g)Dry Wt. of Soil (g)Weight Soil Retained on #4 SievePercent Passing # 4
SPECIMEN INUNDATION in distilled water for the period of 24 h or expansion rate < 0.0002 in./h
Project No.: 10640.001Boring No.:
EXPANSION INDEX of SOILSASTM D 4829
Project Name: Vantage Point Church
LB-1
1000.000.00
1000.000.00
2-5Sample No.: B-1Soil Identification: Brown clayey sand (SC)
Specimen Diameter (in.) 4.01 4.01
100.00
MOLDED SPECIMEN Before Test After Test
Specimen Height (in.) 1.0000 1.0515Wt. Comp. Soil + Mold (g) 571.80 441.51Wt. of Mold (g) 173.50 0.00Specific Gravity (Assumed) 2.70 2.70Container No. O OWet Wt. of Soil + Cont. (g) 787.90 615.01Dry Wt. of Soil + Cont. (g) 713.10 533.93Wt. of Container (g) 0.00 173.50Moisture Content (%) 10.49 22.50Wet Density (pcf) 120.1 126.7Dry Density (pcf) 108.7 103.4Void Ratio 0.550 0.630Total Porosity 0.355 0.387Pore Volume (cc) 73.5 84.2Degree of Saturation (%) [ S meas] 51.5 96.3
Date Time Pressure (psi)Elapsed Time
(min.)Dial Readings
(in.)
1008/14/15 10:30 1.0 0 0.1260
0.125508/14/15 10:40Add Distilled Water to the Specimen
08/14/15 13:56 1.0 196 0.1750
1.0
0.177508/15/15 7:56 1.0 1276 0.177508/15/15 6:22 1.0 1182
Expansion Index (EI meas) = ((Final Rdg - Initial Rdg) / Initial Thick.) x 1000 52

Project Name: Tested By: S. Felter Date: 08/12/15
Project No.: 10640.001 Checked By: J. Ward Date: 08/28/15
Boring No.: WP-3 Depth (feet): 2.5
Sample No.: S-1
Soil Identification: Brown silty, clayey sand (SC-SM)
D-7 0.00
925.3 0.00
206.5 1.00
718.8 0.00
D-7
656.0
206.5
449.5
(in.) (mm.)
6" 152.400
3" 75.000
1 1/2 37.500
3/4" 19.000
3/8" 9.500
#4 4.750
#8 2.360
#16 1.180
#30 0.600
#50 0.300
#100 0.150
#200 0.075
GRAVEL: 1 %SAND: 60 %FINES: 39 %GROUP SYMBOL: SC-SM
Remarks:
PARTICLE-SIZE DISTRIBUTION (GRADATION)
ASTM D 6913
Container No.:
Vantage Point Church
of SOILS USING SIEVE ANALYSIS
Dry Wt. of Soil (g)
Cumulative Weight Dry Soil Retained (g)
Moisture Content (%)
Wt. of Container (g)
Moisture Content of Total Air - Dry Soil
Wt. of Container No._____ (g)
Wt. of Air-Dried Soil + Cont.(g)
Cu = D60/D10 =
Cc = (D30)²/(D60*D10) =
4.0
5.3
100.0
U. S. Sieve SizePercent Passing (%)
Wt. of Air-Dry Soil + Cont. (g)
After Wet SieveWt. of Dry Soil + Container (g)
Wt. of Container (g)
Dry Wt. of Soil Retained on # 200 Sieve (g)
Wt. of Dry Soil + Cont. (g)
Container No.
439.7
83.3
PAN
119.7
96.624.7
10.8
38.8
316.2 56.0
99.4
99.3
98.5
99.06.9
0.0

1:
60:
39
S-1
08/2
8/15
Borin
g N
o.:
Dep
th (
feet
):2.
5So
il Ty
pe :
Proj
ect
Nam
e:
PA
RTI
CLE
- S
IZE
DIS
TRIB
UTI
ON
A
STM
D 6
913
Soil
Iden
tific
atio
n:Br
own
silty
, cla
yey
sand
(SC
-SM
)SC-S
M
GR
:SA
:FI
: (%
)
Vant
age
Poin
t Ch
urch
Proj
ect
No.
:W
P-3
Sam
ple
No.
:10
640.
001
SAN
DSI
LT
F
INE
HYD
ROM
ETER
3.
0"
1
1/2"
3/
4"
3
/8"
#4
#8
#16
#30
#
50
#
100
#
200
U.S
. STA
ND
ARD
SIE
VE O
PEN
ING
U.S
. STA
ND
ARD
SIE
VE N
UM
BER
GRA
VEL
FIN
ESFI
NE
CLAY
CO
ARSE
COAR
SEM
EDIU
M
0102030405060708090100
0.00
10.
010
0.10
01.
000
10.0
0010
0.00
0
PERCENT FINER BY WEIGHT
PAR
TIC
LE -
SIZE
(mm
)
"
SA
WP
-3, S
-1 @
2.5
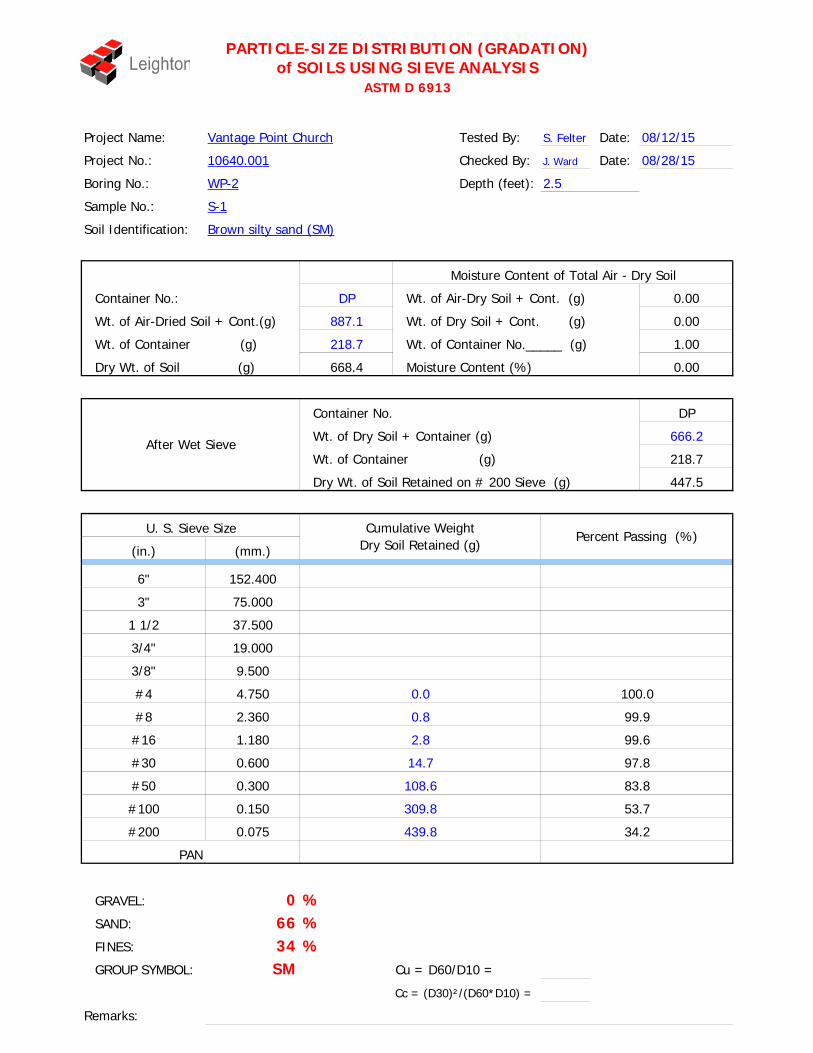
Project Name: Tested By: S. Felter Date: 08/12/15
Project No.: 10640.001 Checked By: J. Ward Date: 08/28/15
Boring No.: WP-2 Depth (feet): 2.5
Sample No.: S-1
Soil Identification: Brown silty sand (SM)
DP 0.00
887.1 0.00
218.7 1.00
668.4 0.00
DP
666.2
218.7
447.5
(in.) (mm.)
6" 152.400
3" 75.000
1 1/2 37.500
3/4" 19.000
3/8" 9.500
#4 4.750
#8 2.360
#16 1.180
#30 0.600
#50 0.300
#100 0.150
#200 0.075
GRAVEL: 0 %SAND: 66 %FINES: 34 %GROUP SYMBOL: SM
Remarks:
PARTICLE-SIZE DISTRIBUTION (GRADATION)
ASTM D 6913
Container No.:
Vantage Point Church
of SOILS USING SIEVE ANALYSIS
Dry Wt. of Soil (g)
Cumulative Weight Dry Soil Retained (g)
Moisture Content (%)
Wt. of Container (g)
Moisture Content of Total Air - Dry Soil
Wt. of Container No._____ (g)
Wt. of Air-Dried Soil + Cont.(g)
Cu = D60/D10 =
Cc = (D30)²/(D60*D10) =
0.0
U. S. Sieve SizePercent Passing (%)
Wt. of Air-Dry Soil + Cont. (g)
After Wet SieveWt. of Dry Soil + Container (g)
Wt. of Container (g)
Dry Wt. of Soil Retained on # 200 Sieve (g)
Wt. of Dry Soil + Cont. (g)
Container No.
439.8
83.8
PAN
108.6
97.814.7
2.8
34.2
309.8 53.7
100.0
99.6
99.90.8

0:
66:
34
S-1
08/2
8/15
Borin
g N
o.:
Dep
th (
feet
):2.
5So
il Ty
pe :
Proj
ect
Nam
e:
PA
RTI
CLE
- S
IZE
DIS
TRIB
UTI
ON
A
STM
D 6
913
Soil
Iden
tific
atio
n:Br
own
silty
san
d (S
M)
SM
GR
:SA
:FI
: (%
)
Vant
age
Poin
t Ch
urch
Proj
ect
No.
:W
P-2
Sam
ple
No.
:10
640.
001
SAN
DSI
LT
F
INE
HYD
ROM
ETER
3.
0"
1
1/2"
3/
4"
3
/8"
#4
#8
#16
#30
#
50
#
100
#
200
U.S
. STA
ND
ARD
SIE
VE O
PEN
ING
U.S
. STA
ND
ARD
SIE
VE N
UM
BER
GRA
VEL
FIN
ESFI
NE
CLAY
CO
ARSE
COAR
SEM
EDIU
M
0102030405060708090100
0.00
10.
010
0.10
01.
000
10.0
0010
0.00
0
PERCENT FINER BY WEIGHT
PAR
TIC
LE -
SIZE
(mm
)
"
SA
WP
-2, S
-1 @
2.5

Project Name: Tested By: S. Felter Date: 08/12/15
Project No.: 10640.001 Checked By: J. Ward Date: 08/28/15
Boring No.: WP-1 Depth (feet): 10.0
Sample No.: S-3
Soil Identification: Brown sandy lean clay s(CL)
PHD 0.00
586.6 0.00
215.4 1.00
371.2 0.00
PHD
383.3
215.4
167.9
(in.) (mm.)
6" 152.400
3" 75.000
1 1/2 37.500
3/4" 19.000
3/8" 9.500
#4 4.750
#8 2.360
#16 1.180
#30 0.600
#50 0.300
#100 0.150
#200 0.075
GRAVEL: 0 %SAND: 44 %FINES: 56 %GROUP SYMBOL: s(CL)
Remarks:
PARTICLE-SIZE DISTRIBUTION (GRADATION)
ASTM D 6913
Container No.:
Vantage Point Church
of SOILS USING SIEVE ANALYSIS
Dry Wt. of Soil (g)
Cumulative Weight Dry Soil Retained (g)
Moisture Content (%)
Wt. of Container (g)
Moisture Content of Total Air - Dry Soil
Wt. of Container No._____ (g)
Wt. of Air-Dried Soil + Cont.(g)
Cu = D60/D10 =
Cc = (D30)²/(D60*D10) =
0.0
U. S. Sieve SizePercent Passing (%)
Wt. of Air-Dry Soil + Cont. (g)
After Wet SieveWt. of Dry Soil + Container (g)
Wt. of Container (g)
Dry Wt. of Soil Retained on # 200 Sieve (g)
Wt. of Dry Soil + Cont. (g)
Container No.
162.7
84.1
PAN
59.1
94.819.3
4.8
56.2
118.2 68.2
100.0
98.7
99.80.6

0:
44:
56
S-3
08/2
8/15
Borin
g N
o.:
Dep
th (
feet
):10
.0So
il Ty
pe :
Proj
ect
Nam
e:
PA
RTI
CLE
- S
IZE
DIS
TRIB
UTI
ON
A
STM
D 6
913
Soil
Iden
tific
atio
n:Br
own
sand
y le
an c
lay
s(CL
)
s(CL
)
GR
:SA
:FI
: (%
)
Vant
age
Poin
t Ch
urch
Proj
ect
No.
:W
P-1
Sam
ple
No.
:10
640.
001
SAN
DSI
LT
F
INE
HYD
ROM
ETER
3.
0"
1
1/2"
3/
4"
3
/8"
#4
#8
#16
#30
#
50
#
100
#
200
U.S
. STA
ND
ARD
SIE
VE O
PEN
ING
U.S
. STA
ND
ARD
SIE
VE N
UM
BER
GRA
VEL
FIN
ESFI
NE
CLAY
CO
ARSE
COAR
SEM
EDIU
M
0102030405060708090100
0.00
10.
010
0.10
01.
000
10.0
0010
0.00
0
PERCENT FINER BY WEIGHT
PAR
TIC
LE -
SIZE
(mm
)
"
SA
WP
-1, S
-3 @
10

Project Name: Tested By: G. Bathala Date: 08/17/15
Project No.: 10640.001 Checked By: J. Ward Date: 08/28/15
Boring No.: LB-1 Depth (feet): 15.0
Sample No.: R-4
Soil Identification: Light olive brown sandy silt s(ML)
VO 0.00
740.6 0.00
235.4 1.00
505.2 0.00
VO
530.5
235.4
295.1
(in.) (mm.)
6" 152.400
3" 75.000
1 1/2 37.500
3/4" 19.000
3/8" 9.500
#4 4.750
#8 2.360
#16 1.180
#30 0.600
#50 0.300
#100 0.150
#200 0.075
GRAVEL: 0 %SAND: 48 %FINES: 52 %GROUP SYMBOL: s(ML)
Remarks:
PARTICLE-SIZE DISTRIBUTION (GRADATION)
ASTM D 6913
Container No.:
Vantage Point Church
of SOILS USING SIEVE ANALYSIS
Dry Wt. of Soil (g)
Cumulative Weight Dry Soil Retained (g)
Moisture Content (%)
Wt. of Container (g)
Moisture Content of Total Air - Dry Soil
Wt. of Container No._____ (g)
Wt. of Air-Dried Soil + Cont.(g)
Cu = D60/D10 =
Cc = (D30)²/(D60*D10) =
U. S. Sieve SizePercent Passing (%)
Wt. of Air-Dry Soil + Cont. (g)
After Wet SieveWt. of Dry Soil + Container (g)
Wt. of Container (g)
Dry Wt. of Soil Retained on # 200 Sieve (g)
Wt. of Dry Soil + Cont. (g)
Container No.
240.7
92.4
PAN
38.5
98.76.6
0.5
52.4
119.3 76.4
99.9
100.00.0

0:
48:
52
R-4
08/2
8/15
Borin
g N
o.:
Dep
th (
feet
):15
.0So
il Ty
pe :
Proj
ect
Nam
e:
PA
RTI
CLE
- S
IZE
DIS
TRIB
UTI
ON
A
STM
D 6
913
Soil
Iden
tific
atio
n:Li
ght
oliv
e br
own
sand
y si
lt s(
ML)s(
ML)
GR
:SA
:FI
: (%
)
Vant
age
Poin
t Ch
urch
Proj
ect
No.
:LB
-1Sa
mpl
e N
o.:
1064
0.00
1
SAN
DSI
LT
F
INE
HYD
ROM
ETER
3.
0"
1
1/2"
3/
4"
3
/8"
#4
#8
#16
#30
#
50
#
100
#
200
U.S
. STA
ND
ARD
SIE
VE O
PEN
ING
U.S
. STA
ND
ARD
SIE
VE N
UM
BER
GRA
VEL
FIN
ESFI
NE
CLAY
CO
ARSE
COAR
SEM
EDIU
M
0102030405060708090100
0.00
10.
010
0.10
01.
000
10.0
0010
0.00
0
PERCENT FINER BY WEIGHT
PAR
TIC
LE -
SIZE
(mm
)
"
SA
LB
-1, R
-4 @
15
APPENDIX D
SUMMARY OF SECONDARY SEISMIC HAZARD ANALYSIS

Liqu
efyP
ro
C
ivilT
ech
Softw
are
USA
w
ww
.civ
iltec
h.co
m
CivilTech Corporation
LIQUEFACTION ANALYSISVantage Church
10640.001 Plate A-2
Hole No.=LB-2 Water Depth=15 ft Magnitude=7.0Acceleration=0.565g
(ft)0
10
20
30
40
50
60
70
Shear Stress Ratio
CRR CSR fs1Shaded Zone has Liquefaction Potential
0 1Soil DescriptionFactor of Safety
0 51Settlement
SaturatedUnsaturat.
S = 0.03 in.
0 (in.) 1
fs1=1.30

Liqu
efyP
ro
C
ivilT
ech
Softw
are
USA
w
ww
.civ
iltec
h.co
m
CivilTech Corporation
LIQUEFACTION ANALYSISVantage Church
10640.001 Plate A-3
Hole No.=LB-3 Water Depth=15 ft Magnitude=7.0Acceleration=0.565g
(ft)0
10
20
30
40
50
60
70
Shear Stress Ratio
CRR CSR fs1Shaded Zone has Liquefaction Potential
0 1Soil DescriptionFactor of Safety
0 51Settlement
SaturatedUnsaturat.
S = 2.39 in.
0 (in.) 10
fs1=1.30
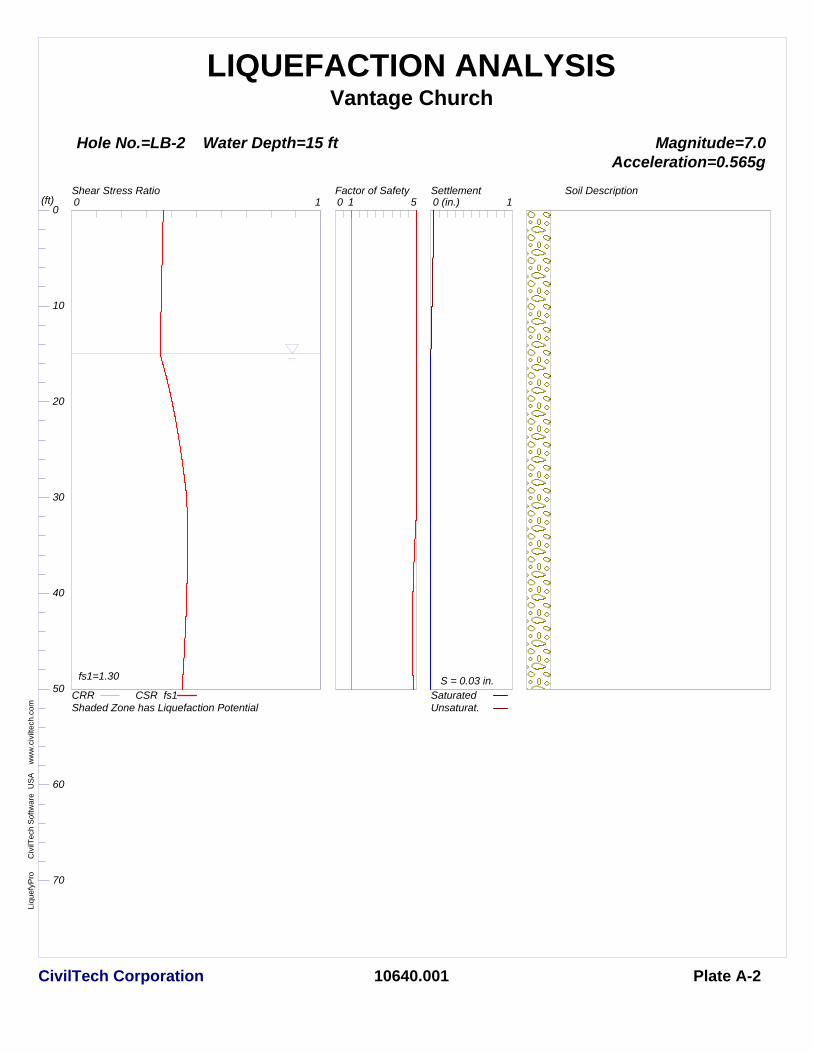
Liqu
efyP
ro
C
ivilT
ech
Softw
are
USA
w
ww
.civ
iltec
h.co
m
CivilTech Corporation
LIQUEFACTION ANALYSISVantage Church
10640.001 Plate A-2
Hole No.=LB-2 Water Depth=15 ft Magnitude=7.0Acceleration=0.565g
(ft)0
10
20
30
40
50
60
70
Shear Stress Ratio
CRR CSR fs1Shaded Zone has Liquefaction Potential
0 1Soil DescriptionFactor of Safety
0 51Settlement
SaturatedUnsaturat.
S = 0.03 in.
0 (in.) 1
fs1=1.30
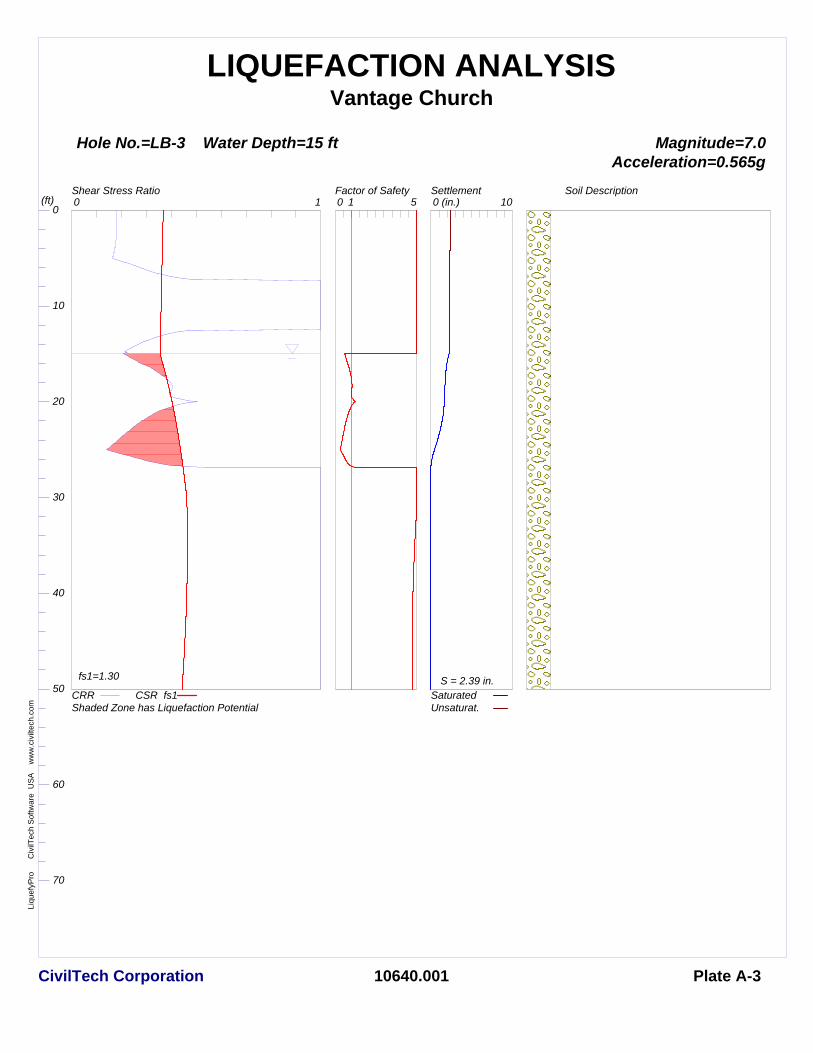
Liqu
efyP
ro
C
ivilT
ech
Softw
are
USA
w
ww
.civ
iltec
h.co
m
CivilTech Corporation
LIQUEFACTION ANALYSISVantage Church
10640.001 Plate A-3
Hole No.=LB-3 Water Depth=15 ft Magnitude=7.0Acceleration=0.565g
(ft)0
10
20
30
40
50
60
70
Shear Stress Ratio
CRR CSR fs1Shaded Zone has Liquefaction Potential
0 1Soil DescriptionFactor of Safety
0 51Settlement
SaturatedUnsaturat.
S = 2.39 in.
0 (in.) 10
fs1=1.30

LB-3 with 25' of compacted fill.

APPENDIX E
SLOPE STABILITY ANALYSIS

Base
Fric
tion
Angl
e: 2
8
Base
Fric
tion
Angl
e: 3
5
Base
Fric
tion
Angl
e: 2
8
Base
Fric
tion
Angl
e: 3
5
Material N
ame
Color
Unit W
eight
(lbs/
3)Strength Type
Cohe
sion
(psf)
Phi
(deg)
Silt
120
Moh
r‐Cou
lomb
130
28
Sand
120
Moh
r‐Cou
lomb
100
35
Met
hod:
spe
ncer
Fact
or o
f Saf
ety:
1.3
34A
xis
Loca
tion:
610
.827
, 653
.209
Left
Slip
Sur
face
End
poin
t: 53
4.42
4, 5
99.7
16R
ight
Slip
Sur
face
End
poin
t: 60
7.77
9, 5
59.9
92
46.0
00
81.5
00
650 600 550
425
450
475
500
525
550
575
600
625
650
675
700
P:\I
NFO
CUS
PRO
JECT
S\10
500-
\106
40 V
anta
ge P
oint
e Ch
uch\
001\
Anal
yses
\SLI
DE\
Nor
ther
n En
d Cr
oss
Sect
ion
- Re
v 4.
slim
Bloc
k Se
arch
for
Dee
per
Failu
re S
urfa
ce
Nor
ther
n C
ross
Sec
tion
- N
ativ
e C
onfi
gura
tion
1064
0.00
1
Scal
e1:
350
Units
feet
Anal
yzed
By
J. D
upre
Cond
ition
Stat
icD
ate
Oct
ober
201
5
Proj
ect
Vant
age
Poin
t Ch
urch
Slo
pe S
tabi
lity
SLID
EIN
TERP
RET
6.03
6

Base
Fric
tion
Angl
e: 2
8
Base
Fric
tion
Angl
e: 3
5
Base
Fric
tion
Angl
e: 2
8
Base
Fric
tion
Angl
e: 3
5
Material N
ame
Color
Unit W
eight
(lbs/
3)Strength Type
Cohe
sion
(psf)
Phi
(deg)
Silt
120
Moh
r‐Cou
lomb
130
28
Sand
120
Moh
r‐Cou
lomb
100
35
Met
hod:
spe
ncer
Fact
or o
f Saf
ety:
1.5
33A
xis
Loca
tion:
604
.851
, 664
.094
Left
Slip
Sur
face
End
poin
t: 52
3.32
0, 5
99.3
11R
ight
Slip
Sur
face
End
poin
t: 60
7.75
9, 5
59.9
99
79.7
09
39.4
84
26.5
4°
650 600 550
400
425
450
475
500
525
550
575
600
625
650
675
P:\I
NFO
CUS
PRO
JECT
S\10
500-
\106
40 V
anta
ge P
oint
e Ch
uch\
001\
Anal
yses
\SLI
DE\
Nor
ther
n En
d Cr
oss
Sect
ion
- Re
v 6.
slim
Bloc
k Se
arch
for
Dee
per
Failu
re S
urfa
ce
Nor
ther
n C
ross
Sec
tion
- A
ssum
e 2:
1 La
ybac
k
1064
0.00
1
Scal
e1:
350
Units
feet
Anal
yzed
By
J. D
upre
Cond
ition
Stat
icD
ate
Oct
ober
201
5
Proj
ect
Vant
age
Poin
t Ch
urch
Slo
pe S
tabi
lity
SLID
EIN
TERP
RET
6.03
6

Base
Fric
tion
Angl
e: 3
6
Base
Fric
tion
Angl
e: 3
6
Base
Fric
tion
Angl
e: 3
6
Base
Fric
tion
Angl
e: 3
6
Material N
ame
Color
Unit W
eight
(lbs/
3)Strength Type
Cohe
sion
(psf)
Phi
(deg)
Silt
120
Moh
r‐Cou
lomb
200
36
Sand
120
Moh
r‐Cou
lomb
100
36
Met
hod:
spe
ncer
Fact
or o
f Saf
ety:
1.5
70A
xis
Loca
tion:
604
.851
, 664
.094
Left
Slip
Sur
face
End
poin
t: 52
3.32
0, 5
99.3
11R
ight
Slip
Sur
face
End
poin
t: 60
7.75
9, 5
59.9
99
79.7
09
39.4
84
26.5
4°
0.1
5
650 600 550 500
400
425
450
475
500
525
550
575
600
625
650
675
P:\I
NFO
CUS
PRO
JECT
S\10
500-
\106
40 V
anta
ge P
oint
e Ch
uch\
001\
Anal
yses
\SLI
DE\
Nor
ther
n En
d Cr
oss
Sect
ion
- Re
v 6
PS.s
lim
Seis
mic
Ana
lysi
s of
Fai
lure
Sur
face
Nor
ther
n C
ross
Sec
tion
- A
ssum
e 2:
1 La
ybac
k
1064
0.00
1
Scal
e1:
350
Units
feet
Anal
yzed
By
J. D
upre
Cond
ition
Pseu
dost
atic
Dat
eO
ctob
er 2
015
Proj
ect
Vant
age
Poin
t Ch
urch
Slo
pe S
tabi
lity
SLID
EIN
TERP
RET
6.03
6

APPENDIX F
GENERAL EARTHWORK AND GRADING SPECIFICATIONS

1 3030.495
LEIGHTON AND ASSOCIATES, INC.
GENERAL EARTHWORK AND GRADING SPECIFICATIONS FOR ROUGH GRADING
Table of Contents Section Page 1.0 GENERAL 1 1.1 Intent 1 1.2 The Geotechnical Consultant of Record 1 1.3 The Earthwork Contractor 2 2.0 PREPARATION OF AREAS TO BE FILLED 2 2.1 Clearing and Grubbing 2 2.2 Processing 3 2.3 Overexcavation 3 2.4 Benching 3 2.5 Evaluation/Acceptance of Fill Areas 3 3.0 FILL MATERIAL 4 3.1 General 4 3.2 Oversize 4 3.3 Import 4 4.0 FILL PLACEMENT AND COMPACTION 4 4.1 Fill Layers 4 4.2 Fill Moisture Conditioning 4 4.3 Compaction of Fill 5 4.4 Compaction of Fill Slopes 5 4.5 Compaction Testing 5 4.6 Frequency of Compaction Testing 5 4.7 Compaction Test Locations 5 5.0 SUBDRAIN INSTALLATION 6 6.0 EXCAVATION 6 7.0 TRENCH BACKFILLS 6 7.1 Safety 6 7.2 Bedding and Backfill 6 7.3 Lift Thickness 6 7.4 Observation and Testing 6

1 3030.495
LEIGHTON AND ASSOCIATES, INC. General Earthwork and Grading Specifications 1.0 General 1.1 Intent: These General Earthwork and Grading Specifications are for the grading and
earthwork shown on the approved grading plan(s) and/or indicated in the geotechnical report(s). These Specifications are a part of the recommendations contained in the geotechnical report(s). In case of conflict, the specific recommendations in the geotechnical report shall supersede these more general Specifications. Observations of the earthwork by the project Geotechnical Consultant during the course of grading may result in new or revised recommendations that could supersede these specifications or the recommendations in the geotechnical report(s).
1.2 The Geotechnical Consultant of Record: Prior to commencement of work, the
owner shall employ the Geotechnical Consultant of Record (Geotechnical Consultant). The Geotechnical Consultants shall be responsible for reviewing the approved geotechnical report(s) and accepting the adequacy of the preliminary geotechnical findings, conclusions, and recommendations prior to the commencement of the grading.
Prior to commencement of grading, the Geotechnical Consultant shall review the
"work plan" prepared by the Earthwork Contractor (Contractor) and schedule sufficient personnel to perform the appropriate level of observation, mapping, and compaction testing.
During the grading and earthwork operations, the Geotechnical Consultant shall
observe, map, and document the subsurface exposures to verify the geotechnical design assumptions. If the observed conditions are found to be significantly different than the interpreted assumptions during the design phase, the Geotechnical Consultant shall inform the owner, recommend appropriate changes in design to accommodate the observed conditions, and notify the review agency where required. Subsurface areas to be geotechnically observed, mapped, elevations recorded, and/or tested include natural ground after it has been cleared for receiving fill but before fill is placed, bottoms of all "remedial removal" areas, all key bottoms, and benches made on sloping ground to receive fill.
The Geotechnical Consultant shall observe the moisture-conditioning and
processing of the subgrade and fill materials and perform relative compaction testing of fill to determine the attained level of compaction. The Geotechnical Consultant shall provide the test results to the owner and the Contractor on a routine and frequent basis.

2 3030.495
LEIGHTON AND ASSOCIATES, INC. General Earthwork and Grading Specifications 1.3 The Earthwork Contractor: The Earthwork Contractor (Contractor) shall be
qualified, experienced, and knowledgeable in earthwork logistics, preparation and processing of ground to receive fill, moisture-conditioning and processing of fill, and compacting fill. The Contractor shall review and accept the plans, geotechnical report(s), and these Specifications prior to commencement of grading. The
Contractor shall be solely responsible for performing the grading in accordance with
the plans and specifications. The Contractor shall prepare and submit to the owner and the Geotechnical
Consultant a work plan that indicates the sequence of earthwork grading, the number of "spreads" of work and the estimated quantities of daily earthwork contemplated for the site prior to commencement of grading. The Contractor shall inform the owner and the Geotechnical Consultant of changes in work schedules and updates to the work plan at least 24 hours in advance of such changes so that appropriate observations and tests can be planned and accomplished. The Contractor shall not assume that the Geotechnical Consultant is aware of all grading operations.
The Contractor shall have the sole responsibility to provide adequate equipment and
methods to accomplish the earthwork in accordance with the applicable grading codes and agency ordinances, these Specifications, and the recommendations in the approved geotechnical report(s) and grading plan(s). If, in the opinion of the Geotechnical Consultant, unsatisfactory conditions, such as unsuitable soil, improper moisture condition, inadequate compaction, insufficient buttress key size, adverse weather, etc., are resulting in a quality of work less than required in these specifications, the Geotechnical Consultant shall reject the work and may recommend to the owner that construction be stopped until the conditions are rectified.
2.0 Preparation of Areas to be Filled 2.1 Clearing and Grubbing: Vegetation, such as brush, grass, roots, and other
deleterious material shall be sufficiently removed and properly disposed of in a method acceptable to the owner, governing agencies, and the Geotechnical Consultant.
The Geotechnical Consultant shall evaluate the extent of these removals depending
on specific site conditions. Earth fill material shall not contain more than 1 percent of organic materials (by volume). No fill lift shall contain more than 5 percent of organic matter. Nesting of the organic materials shall not be allowed.

3 3030.495
LEIGHTON AND ASSOCIATES, INC. General Earthwork and Grading Specifications If potentially hazardous materials are encountered, the Contractor shall stop work in
the affected area, and a hazardous material specialist shall be informed immediately for proper evaluation and handling of these materials prior to continuing to work in that area.
As presently defined by the State of California, most refined petroleum products
(gasoline, diesel fuel, motor oil, grease, coolant, etc.) have chemical constituents that are considered to be hazardous waste. As such, the indiscriminate dumping or spillage of these fluids onto the ground may constitute a misdemeanor, punishable by fines and/or imprisonment, and shall not be allowed.
2.2 Processing: Existing ground that has been declared satisfactory for support of fill by
the Geotechnical Consultant shall be scarified to a minimum depth of 6 inches. Existing ground that is not satisfactory shall be overexcavated as specified in the following section. Scarification shall continue until soils are broken down and free of large clay lumps or clods and the working surface is reasonably uniform, flat, and free of uneven features that would inhibit uniform compaction.
2.3 Overexcavation: In addition to removals and overexcavations recommended in the
approved geotechnical report(s) and the grading plan, soft, loose, dry, saturated, spongy, organic-rich, highly fractured or otherwise unsuitable ground shall be overexcavated to competent ground as evaluated by the Geotechnical Consultant during grading.
2.4 Benching: Where fills are to be placed on ground with slopes steeper than 5:1
(horizontal to vertical units), the ground shall be stepped or benched. Please see the Standard Details for a graphic illustration. The lowest bench or key shall be a minimum of 15 feet wide and at least 2 feet deep, into competent material as evaluated by the Geotechnical Consultant. Other benches shall be excavated a minimum height of 4 feet into competent material or as otherwise recommended by the Geotechnical Consultant. Fill placed on ground sloping flatter than 5:1 shall also be benched or otherwise overexcavated to provide a flat subgrade for the fill.
2.5 Evaluation/Acceptance of Fill Areas: All areas to receive fill, including removal
and processed areas, key bottoms, and benches, shall be observed, mapped, elevations recorded, and/or tested prior to being accepted by the Geotechnical Consultant as suitable to receive fill. The Contractor shall obtain a written acceptance from the Geotechnical Consultant prior to fill placement. A licensed surveyor shall provide the survey control for determining elevations of processed areas, keys, and benches.

4 3030.495
LEIGHTON AND ASSOCIATES, INC. General Earthwork and Grading Specifications 3.0 Fill Material 3.1 General: Material to be used as fill shall be essentially free of organic matter and
other deleterious substances evaluated and accepted by the Geotechnical Consultant prior to placement. Soils of poor quality, such as those with unacceptable gradation, high expansion potential, or low strength shall be placed in areas acceptable to the Geotechnical Consultant or mixed with other soils to achieve satisfactory fill material.
3.2 Oversize: Oversize material defined as rock, or other irreducible material with a
maximum dimension greater than 8 inches, shall not be buried or placed in fill unless location, materials, and placement methods are specifically accepted by the Geotechnical Consultant. Placement operations shall be such that nesting of oversized material does not occur and such that oversize material is completely surrounded by compacted or densified fill. Oversize material shall not be placed within 10 vertical feet of finish grade or within 2 feet of future utilities or underground construction.
3.3 Import: If importing of fill material is required for grading, proposed import
material shall meet the requirements of Section 3.1. The potential import source shall be given to the Geotechnical Consultant at least 48 hours (2 working days) before importing begins so that its suitability can be determined and appropriate tests performed.
4.0 Fill Placement and Compaction 4.1 Fill Layers: Approved fill material shall be placed in areas prepared to receive fill
(per Section 3.0) in near-horizontal layers not exceeding 8 inches in loose thickness. The Geotechnical Consultant may accept thicker layers if testing indicates the grading procedures can adequately compact the thicker layers. Each layer shall be spread evenly and mixed thoroughly to attain relative uniformity of material and moisture throughout.
4.2 Fill Moisture Conditioning: Fill soils shall be watered, dried back, blended, and/or
mixed, as necessary to attain a relatively uniform moisture content at or slightly over optimum. Maximum density and optimum soil moisture content tests shall be performed in accordance with the American Society of Testing and Materials (ASTM Test Method D1557-91).

5 3030.495
LEIGHTON AND ASSOCIATES, INC. General Earthwork and Grading Specifications 4.3 Compaction of Fill: After each layer has been moisture-conditioned, mixed, and
evenly spread, it shall be uniformly compacted to not less than 90 percent of maximum dry density (ASTM Test Method D1557-91). Compaction equipment shall be adequately sized and be either specifically designed for soil compaction or of proven reliability to efficiently achieve the specified level of compaction with uniformity.
4.4 Compaction of Fill Slopes: In addition to normal compaction procedures specified
above, compaction of slopes shall be accomplished by backrolling of slopes with sheepsfoot rollers at increments of 3 to 4 feet in fill elevation, or by other methods producing satisfactory results acceptable to the Geotechnical Consultant. Upon completion of grading, relative compaction of the fill, out to the slope face, shall be at least 90 percent of maximum density per ASTM Test Method D1557-91.
4.5 Compaction Testing: Field tests for moisture content and relative compaction of the
fill soils shall be performed by the Geotechnical Consultant. Location and frequency of tests shall be at the Consultant's discretion based on field conditions encountered. Compaction test locations will not necessarily be selected on a random basis. Test locations shall be selected to verify adequacy of compaction levels in areas that are judged to be prone to inadequate compaction (such as close to slope faces and at the fill/bedrock benches).
4.6 Frequency of Compaction Testing: Tests shall be taken at intervals not exceeding
2 feet in vertical rise and/or 1,000 cubic yards of compacted fill soils embankment. In addition, as a guideline, at least one test shall be taken on slope faces for each 5,000 square feet of slope face and/or each 10 feet of vertical height of slope. The Contractor shall assure that fill construction is such that the testing schedule can be accomplished by the Geotechnical Consultant. The Contractor shall stop or slow down the earthwork construction if these minimum standards are not met.
4.7 Compaction Test Locations: The Geotechnical Consultant shall document the
approximate elevation and horizontal coordinates of each test location. The Contractor shall coordinate with the project surveyor to assure that sufficient grade stakes are established so that the Geotechnical Consultant can determine the test locations with sufficient accuracy. At a minimum, two grade stakes within a horizontal distance of 100 feet and vertically less than 5 feet apart from potential test locations shall be provided.

6 3030.495
LEIGHTON AND ASSOCIATES, INC. General Earthwork and Grading Specifications 5.0 Subdrain Installation Subdrain systems shall be installed in accordance with the approved geotechnical report(s),
the grading plan, and the Standard Details. The Geotechnical Consultant may recommend additional subdrains and/or changes in subdrain extent, location, grade, or material depending on conditions encountered during grading. All subdrains shall be surveyed by a land surveyor/civil engineer for line and grade after installation and prior to burial. Sufficient time should be allowed by the Contractor for these surveys.
6.0 Excavation Excavations, as well as over-excavation for remedial purposes, shall be evaluated by the
Geotechnical Consultant during grading. Remedial removal depths shown on geotechnical plans are estimates only. The actual extent of removal shall be determined by the Geotechnical Consultant based on the field evaluation of exposed conditions during grading. Where fill-over-cut slopes are to be graded, the cut portion of the slope shall be made, evaluated, and accepted by the Geotechnical Consultant prior to placement of materials for construction of the fill portion of the slope, unless otherwise recommended by the Geotechnical Consultant.
7.0 Trench Backfills 7.1 Safety: The Contractor shall follow all OHSA and Cal/OSHA requirements for
safety of trench excavations. 7.2 Bedding and Backfill: All bedding and backfill of utility trenches shall be done in
accordance with the applicable provisions of Standard Specifications of Public Works Construction. Bedding material shall have a Sand Equivalent greater than 30 (SE>30). The bedding shall be placed to 1 foot over the top of the conduit and densified by jetting. Backfill shall be placed and densified to a minimum of 90 percent of maximum from 1 foot above the top of the conduit to the surface.
The Geotechnical Consultant shall test the trench backfill for relative compaction.
At least one test should be made for every 300 feet of trench and 2 feet of fill. 7.3 Lift Thickness: Lift thickness of trench backfill shall not exceed those allowed in
the Standard Specifications of Public Works Construction unless the Contractor can demonstrate to the Geotechnical Consultant that the fill lift can be compacted to the minimum relative compaction by his alternative equipment and method.
7.4 Observation and Testing: The jetting of the bedding around the conduits shall be
observed by the Geotechnical Consultant.

Related Documents