Cricket Valley Energy Project – Dover, NY Draft Environmental Impact Statement Appendix 5-E: Well Test Report

Welcome message from author
This document is posted to help you gain knowledge. Please leave a comment to let me know what you think about it! Share it to your friends and learn new things together.
Transcript

Cricket Valley Energy Project – Dover, NY
Draft Environmental
Impact Statement
Appendix 5-E: Well Test Report

Cricket Valley Energy Ground Water Well Test Report
Table of Contents Introduction Page 1
Geology Page 2
Test Well Drilling Page 5
Off-Site Monitoring Page 5
On-Site Monitoring Wells Page 7
Pumping Test Program Page 9
Weather during Monitoring/Test Period Page 10
Pumping Test Results Page 10
On-Site Monitoring Results Page 11
Off-Site Monitoring Results Page 11
Conclusions Page 12
Figures Figure 1, Bedrock Geology Page 3
Figure 2, Surficial Geology Page 4
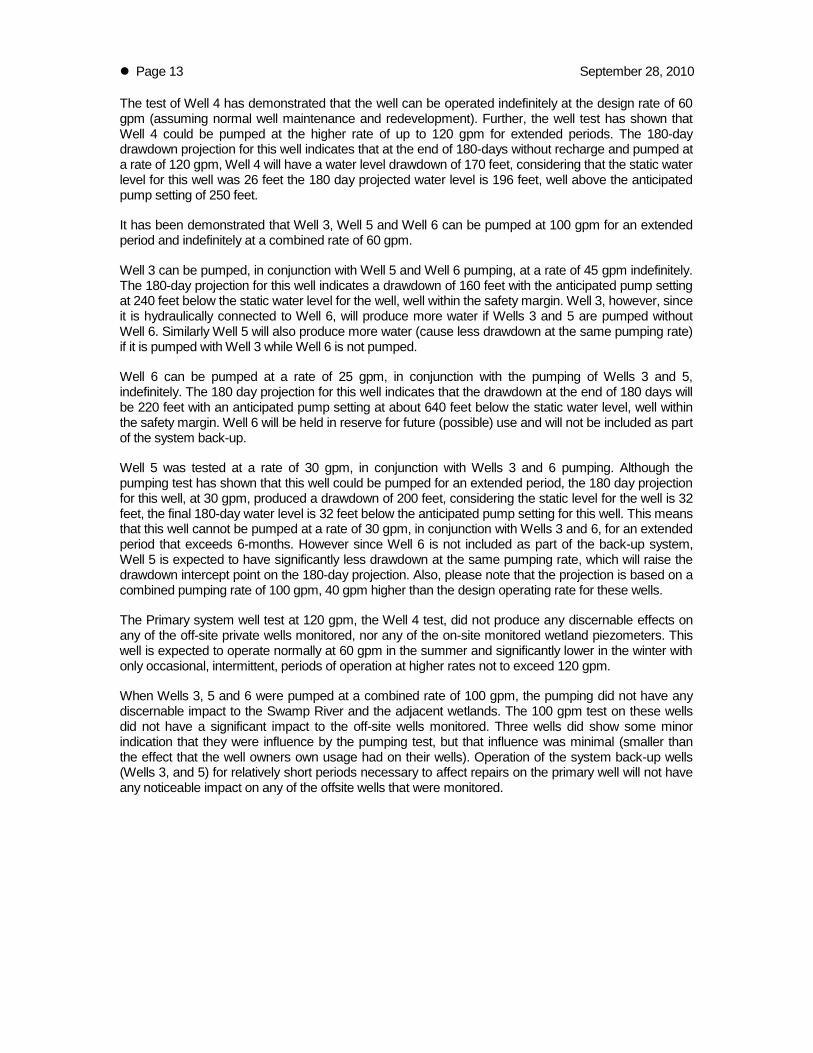
Figure 3, Off-Site Monitoring Locations Page 6
Figure 4, On-Site Monitoring Locations Page 8
Figure 5, Test Well Locations Page 9
Figure 6, Climate Chart Page 10
Figures 7 through 36, Pumping Test and Monitoring Data After Page 13
Tables Table 1, Test Well Completion Page 5
Table 2, Off-Site Wells Page 6

Cricket Valley Energy Ground Water Well Test Report
Introduction
The Cricket Valley Energy project (CVE) has been planned to significantly minimize water demand through the use of air cooling, and a zero-liquid discharge (ZLD) system, which eliminates the need for wastewater discharge in part by maximizing water recycling and reuse. Given these features, it is anticipated that the summer nominal water needs will be approximately 72,000-86,400 gallons per day (gpd) of water, the equivalent of 50-60 gallons per minute (gpm) for 24 hours. Short term, instantaneous supply rate of up to 120 gpm may be required for the facility during operational transient or unexpected upset conditions, such as startups, well supply system maintenance, boiler chemistry upsets, or emergencies.
The CVE project plans to utilize a roof-top rain capture system, implemented to manage stormwater rain quantities per the New York State Stormwater Management Design Manual, as supplemental water supply. The nominal annual rainfall in the Ten Mile Watershed and Dutchess County is approximately 44 and 41 inches, respectively. Using the lower Dutchess County precipitation rate of 41 inches, the CVE roof-top rain capture system can nominally yield up to approximately 7.2 gpm or 10,400 gpd of supplemental water supply. But for the purpose of conservatism, the water yield from roof-top rain capture will not be considered in this analysis.
CVE considered various options for the project’s water supply source, such as long distance municipally-supplied water, water withdrawal from the adjacent Swamp River, or the development of on-site wells. It was determined that the preferred approach would be to develop an on-site bedrock well system to meet project water needs. Review of aquifer mapping and surficial field reconnaissance confirmed appropriate subsurface conditions, and six well locations were identified to be drilled and tested on the site.
Bedrock test wells were drilled in July/August 2009 and February 2010 to determine if adequate and reliable water supply is available for CVE. Two of the wells, (Wells 1 and 2) had unsuitably low yields (less than 5 gpm), and were therefore removed from consideration for project water supplies. These wells were instead used as monitoring wells during subsequent pump testing.
Initial test yields from the remaining four wells (Wells 3, 4, 5, and 6) were found to be productive enough to warrant longer-term testing, the subject of this report. The testing program was intended to demonstrate that the completed wells had sufficient production to supply a continuous 60 gallons per minute, the anticipated summer water demand, and a short-term supply of 120 gpm, the maximum amount required during operational transients and unanticipated upset conditions.
An important consideration of the pumping test program was to demonstrate that the extraction of up to 120 gpm from the bedrock aquifer would not have an adverse impact on private well supplies in the areas surrounding CVE (up to 2,500 feet from the Project Development Area), the wetlands within and adjacent to the CVE Property, and the Swamp River. The pumping test program required the installation and monitoring of several piezometers within and adjacent to the wetlands and Swamp River located within the Property. In addition, inquiries were made to neighboring well owners to allow for the monitoring of their wells during the pumping test program. In total, requests were made to 17 nearby well owners within 2,500 feet of the Property, of whom 8 chose to participate in the test.
SSEC Hydrogeology, Geology, Environmental Invest igat ion
4 Deer Trail, Cornwall New York 12518 (845) 534 3816 FAX (866) 334 1883 [email protected]

Page 2 September 28, 2010
Geology
The CVE site is located within the Stockbridge Marble unit, dolomitic marble that ranges from white to pink to light gray, Figure 1. Since the Stockbridge Marble is a carbonate rock (marble is a metamorphosed limestone or dolostone), it has a tendency to form solution cavities. However the solution cavities that form in marble bedrock tend to be small and free of iron oxide mud that is typical of solution cavities that form in limestone. Therefore water drawn from marble bedrock wells tend not to have the colloidal turbidity common in limestone bedrock wells. Unlike limestone, marble tends to degrade to fine calcareous sand that is evident when a marble bedrock well is first drilled and developed. Under constant, even, pumping, with time the amount of sand produced by these wells diminishes and disappears. Agitation of the well, such turning the pump on an off at full power, could cause short-term production of sand. Therefore, a slow start [variable rate] pump is preferred for such wells.
The overlying geologic materials in the main part of the Project Development Area are ground moraine, commonly called glacial till, which is composed of materials derived from the grinding of bedrock by advancing glaciers. Glacial till typically has a low permeability, primarily consisting of compressed rock flour with sand, gravel, and cobbles imbedded within the finer materials.
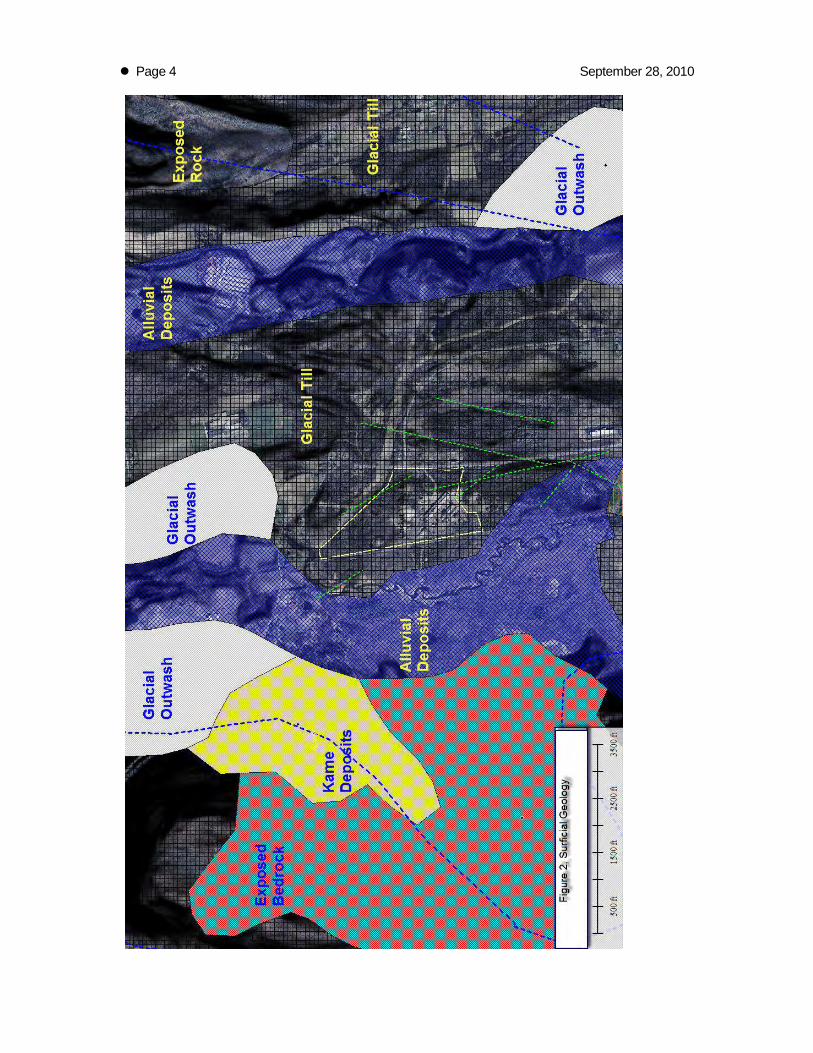
The western side of the Property (i.e., west of the Metro-North railroad line) is underlain by alluvial deposits related to the adjacent Swamp River. The alluvial deposits are associated with the flood plain of the Swamp River and adjacent wetlands and are generally fine silty sand with occasional gravel lenses. Possibly present within the CVE site, specifically the northwestern portion of the site, are underlying glacial outwash deposits that have been mapped by the New York State Museum (Cadwell). The possible presence of such deposits would indicate an increased ability to recharge the underlying bedrock aquifer because the higher permeability sand and gravel deposits allow more water to pass into the bedrock aquifer than would lower permeability materials such as silts and clays, Figure 2.

Page 3 September 28, 2010
Page 4 September 28, 2010

Page 5 September 28, 2010
Test Well Drilling
Wells 1 through 4 were drilled during the period of July 28, 2009 to August 6, 2009 under the guidance of ARCADIS U.S., while wells 5 and 6 were completed under SSEC’s oversight between February 8 and 22, 2010. All wells were drilled by Boyd Artesian Well Co. Wells 1 and 2 were drilled to depths of 855 and 630 feet, and produced insufficient water to be considered for testing (less than 5 gpm). Wells 3 and 4 were drilled to depths of 805 feet and 605 feet and produced 44 and 70 gpm during preliminary tests. The yields of Wells 3 and 4, although significant, were not considered sufficiently productive to meet the project’s reliability and backup criteria and therefore two additional wells were drilled, Wells 5 and 6. Wells 5 and 6 were drilled to depths of 957 and 1109 feet and produced an additional 30 and 12 gallons per minute. The four test wells (Wells 3, 4, 5, and 6) were further developed using a standard surging technique to remove sediment from the bedrock fractures and improve connectivity to the aquifer.
Table 1, Test Well Completion Table
Off-site Monitoring
Requests for the voluntary participation of nearby property owners in an off-site monitoring program were mailed to property owners within approximately 2,500 feet of the test wells. The request was sent in the form of a letter (sent by mail or hand delivered) detailing the test procedure and including a questionnaire. Letters were sent to 17 well owners with 8 well owners agreeing to take part in the voluntary monitoring program. Additionally, the two closest wells at the Knolls of Dover project were also monitored during the pumping test. Table 2 and Figure 3 list the off-site monitoring well locations.
Data loggers (an instrument that contains a water level measuring device and an on-board computer to store water level measurements) were installed to collect water level information from the neighboring wells, with the initial intention of monitoring water levels for a minimum of 48 hours prior to the start of the pumping test and for a minimum period of 24 hours after the conclusion of the test. However, given the delay in the start of pumping test, data loggers were installed in early May and monitored until late June, thus providing a robust data set of ten-minute intervals for comparison.
Well Dat
e C
om
ple
ted
Cas
ing
amo
un
t in
fee
t
Tota
l Dep
th in
fee
t
Dep
th (
ft)/
Yiel
d (
gpm
) o
f p
rod
uct
ive
Frac
ture
s
Stat
ic W
ater
Lev
el in
fee
t b
elo
w t
op
Test
ed Y
ield
in g
pm
Tota
l Dra
wd
ow
n in
fee
t
Pro
ject
ed 1
80
dra
wd
ow
n in
Fee
t
3 8/6/2009 51 805 30 /30 , 410 /15, 455/25 46 45 152 160
4 8/3/2009 51 605 65/30 , 255/20 , 335/20 26 120/60 132/20 180/30
5 2/9/2010 51 959 200/30 32 30 102 210
6 2/22/2010 51 1109 640/7, 800/5 49 25 195 220

Page 6 September 28, 2010
Table 2, Off-site wells
Homeowner Address Monitoring Period
Distance from
Test Wells
(mid-point)
MacEntee 7 Cricket Hill Rd. 5-18-10 to 6-26-10 907 feet
Cablevison 2238 Route 22 5-19-10 to 6-26-10 558 feet
Vincent 2300 Route 22 5-19-10 to 6-26-10 2067 feet
Baker 14 Dover Furnace Rd 5-19-10 to 6-26-10 1987 feet
Gast 87 Dover Furnace Rd 5-19-10 to 6-26-10 3022 feet
Nast 81 Cricket Hill Rd 6-11-10 to 6-26-10 2263 feet
Mills 206 Cricket Hill Rd 5-19-10 to 6-26-10 5000 feet
Wilson 50 N. Chippewalla Rd. 5-18-10 to 6-26-10 2772 feet
Knolls at Dover Well 1 Wingdale Mnt Rd 6-13-10 to 6-26-10 2.17 miles
Knolls at Dover Well 2 Wingdale Mnt Rd 6-13-10 to 6-26-10 2.23 miles

Page 7 September 28, 2010
On-Site Monitoring Wells (Piezometers)
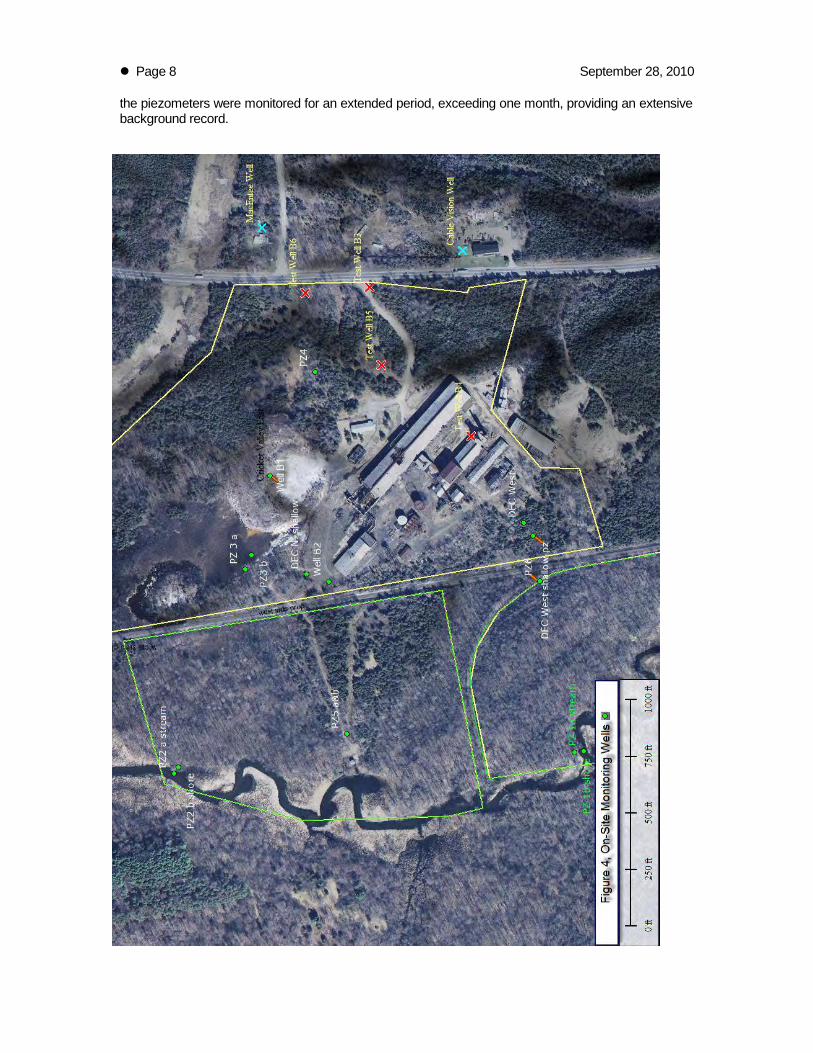
Given the project’s proximate location to the Swamp River and its associated wetlands, concerns were raised that project water withdrawal may have an adverse impact on the system of wetlands within the project area, including wetlands associated with the Swamp River. To address this issue, a series of temporary piezometers were installed in monitoring wells to record water level changes in the wetlands and Swamp River. The piezometers were installed in nested well pairs at most locations to allow for the differential monitoring of surface and subsurface water. In locations where existing on-site wells were available (i.e., NYSDEC monitoring wells installed for prior site uses), shallow monitoring wells were installed adjacent to them to allow for differential monitoring of nested well pairs.
The purpose of the nested well pairs was to determine if the withdrawal of ground water from the bedrock aquifer has a differential influence on the lower portion of the water table above the bedrock. In general the sediments east of the Metro-North tracks are less than 10 feet thick with areas immediately north of the existing buildings having less than 2 feet of sediment overlying the bedrock (bedrock outcrops along the railroad tracks). The water table that underlies the CVE site is the saturated portion of alluvial and till sediments. On the east side of the Metro-North tracks the depth of this overburden tends to be thin and in many places was dry during the monitoring period. Therefore the water table did not exist, at those times, within the overburden. However, in places where the overburden thickened, towards the west, it was possible to monitor the water table. The piezometer intake screens are limited to 6-inchess in length so where the sediment is sufficiently thick , multiple screens can be installed at different depths. If a direct hydraulic connection exists between the bedrock aquifer and the wetland sediments or overburden water table, the effect of the bedrock pumping test would manifest itself as a greater drawdown in the deeper piezometers of the nested pair. This effect requires that there is sufficiently low hydraulic conductivity in the sediments to allow for the differential drawdown in the wells. This effect is also more evident in a thicker sediment body than a thinner one. However since the alluvial deposits found on the western side of the property have a relatively good hydraulic conductivity, and the sediments on the eastern side of the property tend to be thin, less than 5 feet, any differential drawdown effects were difficult to detect.
During the installation of the piezometers, it was determined that the on-site geology east of the tracks comprises only a thin glacial till covering over the bedrock. The installation of water table monitoring wells in this area therefore required several attempts to locate sufficiently thick overburden that contained monitor-able ground water. Monitoring points were eventually found at locations within the Property, including one NYSDEC monitoring well location (DEC West) that had been installed for prior uses. The DEC well was used in conjunction with a newly installed shallow monitoring well, to create a nested well pair without the need to drill into the bedrock aquifer. Well 2, located in the area of DEC North, was used as the deep well at that location. The locations of the piezometers and the DEC monitoring well are shown in Figure 4.
The CVE site contains several wetlands (see Appendix X). Regulatory agency concerns about the extraction of ground water from the bedrock aquifer, and the possible effects of that withdrawal on the on-site wetlands, were addressed by the installation of several shallow monitoring points in selected on-site wetlands. The monitoring points were hand installed in pairs with one point located in the water table at the edge of the wetland and the second point in the standing water within the wetlands. Some point locations within the wetlands had no standing water due to the dry weather (June 2010). All pumping test water was discharged to the northernmost part of the property and downstream (with respect to the Swamp River stream direction) of the monitoring area, using about 5,000 feet of discharge line. The shallow piezometers and the well discharge point are shown in Figures 3 and 4.
The piezometers were installed using a truck mounted auger where access was available and by hand auger in areas that did not have access to motorized vehicles. NYSDEC wetland access permits were obtained prior to the installation of the piezometers.
Digital data loggers were installed in the piezometers during the second week of May 2010 in anticipation of a pumping test start within one week. The pumping test was started mid-June, therefore
Page 8 September 28, 2010
the piezometers were monitored for an extended period, exceeding one month, providing an extensive background record.

Page 9 September 28, 2010
Pumping Test Program
The Cricket Valley Energy well system will be required to produce as much as 60 gpm continuously during warm weather, with as much as 120 gpm required for periods of up to 168 hours during unanticipated upset conditions. The pumping test plan was to produce 120 gpm from the primary well system and at least 60 gpm from the back-up well system for a period of 72-hours. Wells 4 and 5 were initially selected for testing as the primary wells and Wells 3 and 6 as the back-up wells.
The pumping test was started with Well 4 running at 90 gpm and Well 5 running at 30 gpm. It became clear within several hours of the test start that Well 4 had improved considerably, due to the well development, and it was not significantly stressed at the 90 gpm rate. Therefore, at the 24-hour point in the test, Well 5 was shut down (re-designated as a back-up well) and the pumping rate for Well 4 was increased to 120 gpm. The test was extended by 24-hours so that the 120 gpm rate could be maintained for a 72-hours test. At the end of the 96-hour test period (June 14-18, 2010) the Well 4 pump was shut down for three days to allow full recovery. The back-up well set (Wells 3, 5, and 6) was then tested simultaneously for 72-hours from June 21-24, 2010. Well 3 was tested at 45 gpm, Well 5 was tested at 30 gpm, and Well 6 was tested at 25 gpm, for a total of 100 gpm. Well 4 was not pumped during the second test. After the completion of the back-up well test, Well 4 was tested at 60 gpm to determine the well’s behavior during normal summer operation.
Page 10 September 28, 2010
Weather During Monitoring/Test Period
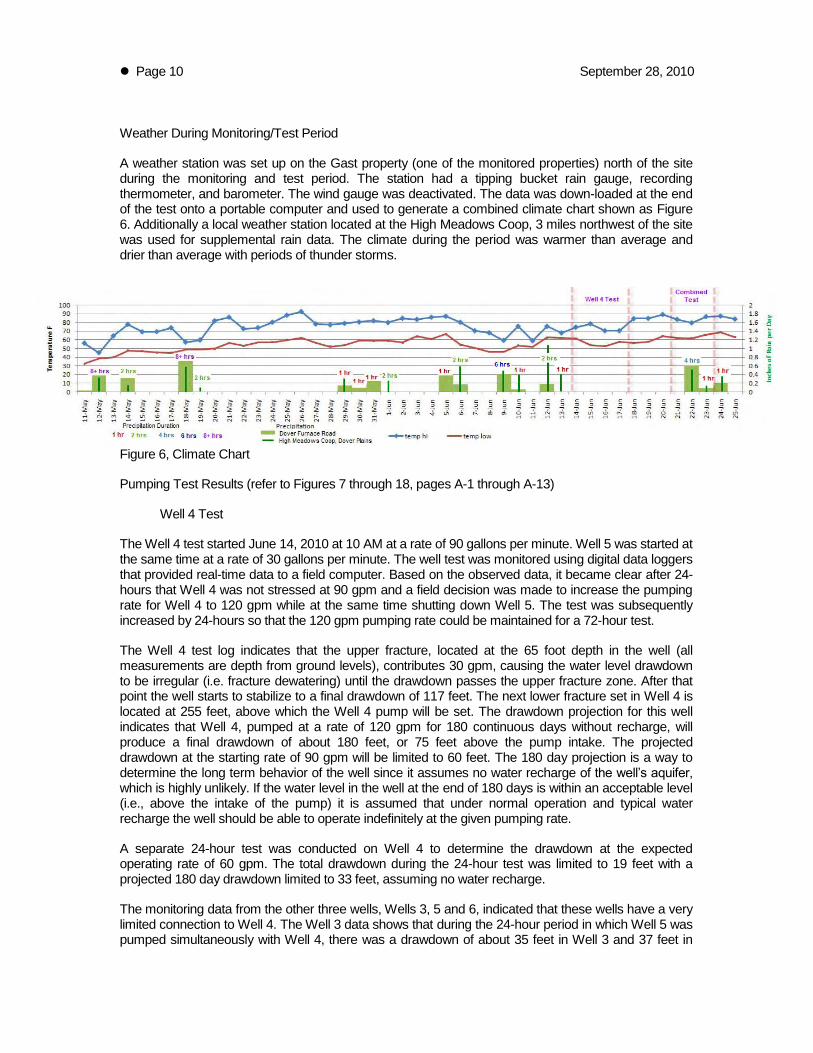
A weather station was set up on the Gast property (one of the monitored properties) north of the site during the monitoring and test period. The station had a tipping bucket rain gauge, recording thermometer, and barometer. The wind gauge was deactivated. The data was down-loaded at the end of the test onto a portable computer and used to generate a combined climate chart shown as Figure 6. Additionally a local weather station located at the High Meadows Coop, 3 miles northwest of the site was used for supplemental rain data. The climate during the period was warmer than average and drier than average with periods of thunder storms.
Figure 6, Climate Chart
Pumping Test Results (refer to Figures 7 through 18, pages A-1 through A-13)
Well 4 Test
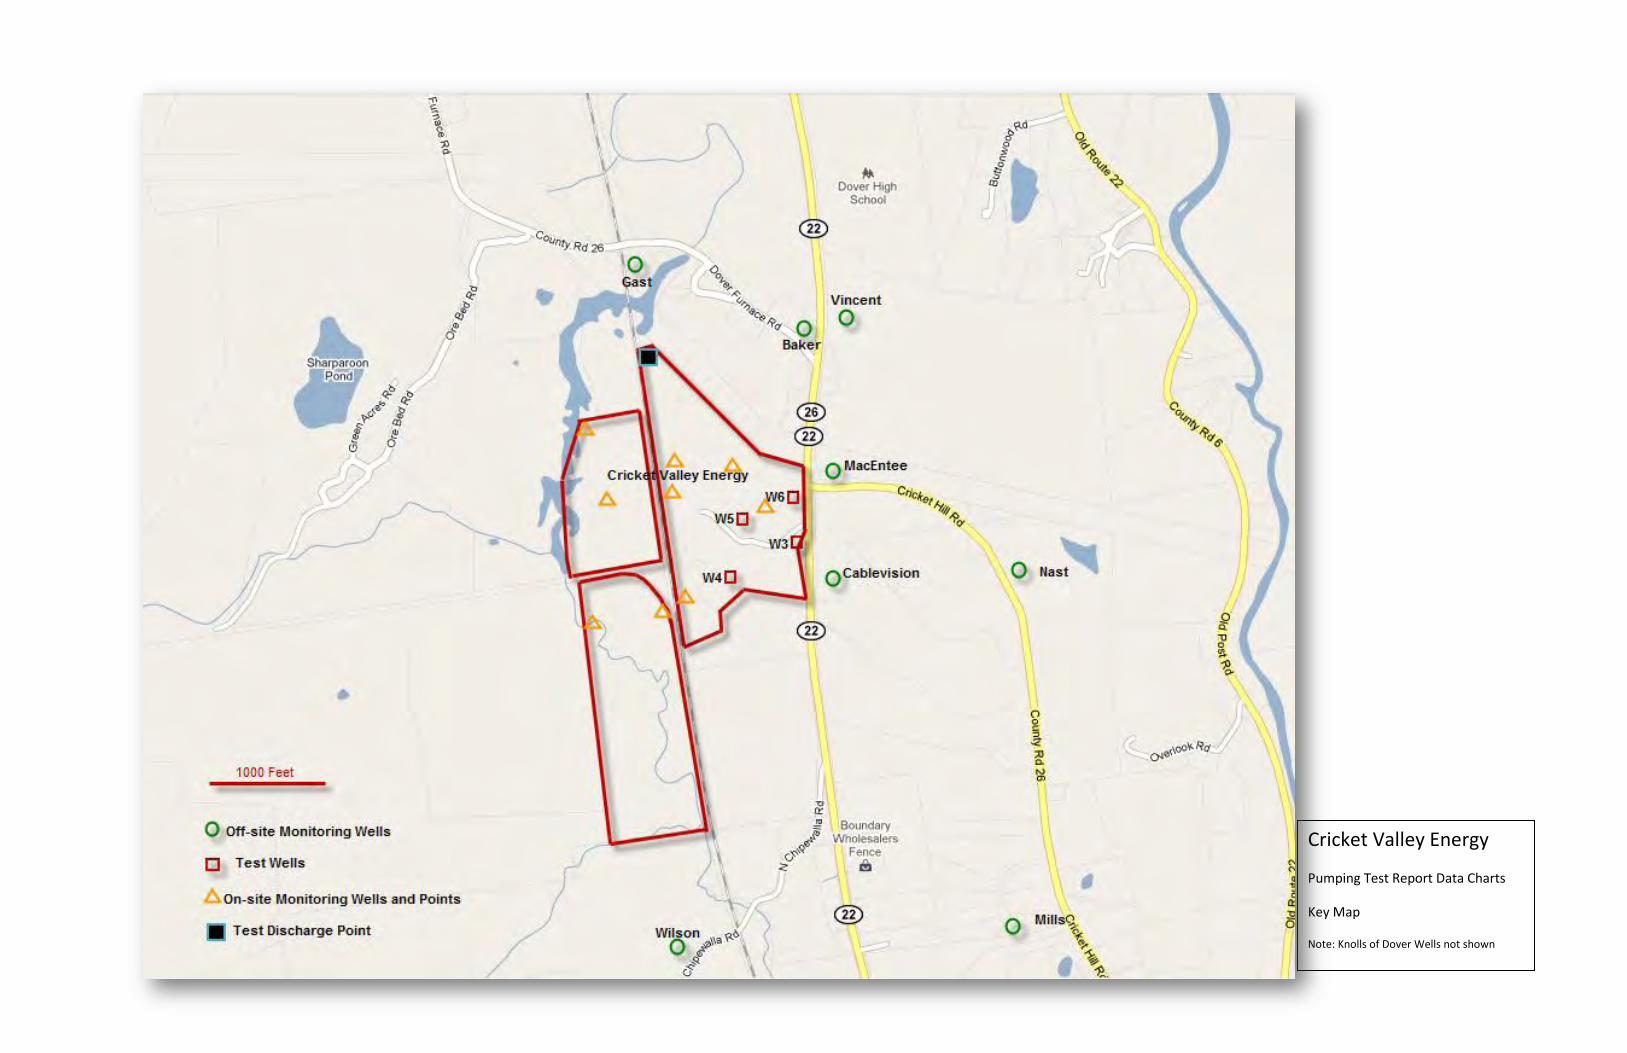
The Well 4 test started June 14, 2010 at 10 AM at a rate of 90 gallons per minute. Well 5 was started at the same time at a rate of 30 gallons per minute. The well test was monitored using digital data loggers that provided real-time data to a field computer. Based on the observed data, it became clear after 24-hours that Well 4 was not stressed at 90 gpm and a field decision was made to increase the pumping rate for Well 4 to 120 gpm while at the same time shutting down Well 5. The test was subsequently increased by 24-hours so that the 120 gpm pumping rate could be maintained for a 72-hour test.
The Well 4 test log indicates that the upper fracture, located at the 65 foot depth in the well (all measurements are depth from ground levels), contributes 30 gpm, causing the water level drawdown to be irregular (i.e. fracture dewatering) until the drawdown passes the upper fracture zone. After that point the well starts to stabilize to a final drawdown of 117 feet. The next lower fracture set in Well 4 is located at 255 feet, above which the Well 4 pump will be set. The drawdown projection for this well indicates that Well 4, pumped at a rate of 120 gpm for 180 continuous days without recharge, will produce a final drawdown of about 180 feet, or 75 feet above the pump intake. The projected drawdown at the starting rate of 90 gpm will be limited to 60 feet. The 180 day projection is a way to determine the long term behavior of the well since it assumes no water recharge of the well’s aquifer, which is highly unlikely. If the water level in the well at the end of 180 days is within an acceptable level (i.e., above the intake of the pump) it is assumed that under normal operation and typical water recharge the well should be able to operate indefinitely at the given pumping rate.
A separate 24-hour test was conducted on Well 4 to determine the drawdown at the expected operating rate of 60 gpm. The total drawdown during the 24-hour test was limited to 19 feet with a projected 180 day drawdown limited to 33 feet, assuming no water recharge.
The monitoring data from the other three wells, Wells 3, 5 and 6, indicated that these wells have a very limited connection to Well 4. The Well 3 data shows that during the 24-hour period in which Well 5 was pumped simultaneously with Well 4, there was a drawdown of about 35 feet in Well 3 and 37 feet in

Page 11 September 28, 2010
Well 6. However, when the Well 5 pump was shut off, both Wells (Well 3 and Well 6) recovered nearly to the static levels within XXX hours. Well 3 had a drawdown of about 5 feet during the 120 gpm phase of the Well 4 test while Well 6 had a drawdown of about 3 feet during the 120 gpm phase of the Well 4 test. Well 5 recovered to a level of 2.4 feet below the starting level.
On-Site Monitoring Including Wetlands and Stream Monitoring (Refer to Figures 28 through 35)
The set of well monitors (piezometers) described earlier in the report were monitored for an extended period prior to the start of the pumping tests. The data shows that for the surficial deposit wells and the surface water monitoring points, the range of daily fluctuation in water level change was limited to less than 0.75 feet, most likely due to diurnal temperature and barometric fluctuations. The longer term fluctuations generally appear to be related to the sporadic rainfall during the monitoring period.
The piezometers that monitored the bedrock aquifer, DEC West, Well 1, and Well 2, showed a gradual water level decline through the monitoring period that mirrored water levels in several of the private wells that were monitored. The seasonal transition from spring to summer includes warmer temperatures and increased evapotranspiration that translates into reduced recharge.
The tests on the project wells do not appear to have had any significant impact on the on-site piezometers or off-site private wells. A review of the on-site monitoring charts shows that at the end of the second pumping test there is an upward deflection of the water level in most of the charts. This deflection could indicate that the shutting down of the pumping test resulted in a general water level rise. However, closer inspection shows that the same upward deflection exists in the upstream Swamp River chart indicating that the rise in water level is separate from the pumping test since the pumping test could not have influenced the upstream portion of the Swamp River to the observed level of 0.2 feet.
The climate chart attached to the on-site monitoring charts (see Figures 29 through 36) shows that there were short-term, highly sporadic rain events at the end of the pumping test period. Those rain events were short-term summer storms that produce highly isolated rain patterns. A strong localized summer storm can easily produce the rise in water level observed on the monitoring charts, as these storms produce greater amounts of runoff than would a more gentile rainfall. Since CVE is at the bottom of the recharge basin, rapid rainfall runoff would have a greater impact on short-term water level rise in the receiving wetlands and the Swamp River. Furthermore, similar upward water level deflections were observed in the two Knolls of Dover charts (Figures 27 and 28). These wells are located more than 2 miles from the test wells and could not instantaneously register a pumping test secession response, indicating that the water level rise is not pumping test related, but is instead related to irregular rainfall on June 24, 2010. Additionally, the observed slope of the water level rise which coincides with the end of the test period is significantly steeper than any observed downward water level slope. Should these observed slope changes have been due to the pumping test, the drawdown slope should mirror the recovery slope, which is not the case here. Furthermore, water level recovery (increase) from drawdown in the wetlands and Swamp River, if occurring due to cessation of pumping, would be expected to be greatest near the pumping wells (where the greatest vertical hydraulic stress was which would induce the greatest amount of drawdown and subsequently the greatest amount of recovery or water level rise after cessation of pumping) and decrease away from the wells. However, water level increases in the wetlands and the Swamp River after cessation of pumping generally range from 0.2 to 0.35 feet with no apparent decreasing trend away from the pumping wells which does not indicate drawdown caused by the pumping wells and subsequent water level recovery but rather suggests that climatic conditions are the cause of these water level changes.
Offsite Well Monitoring (Refer to Figures 19 to 28, Pages A-14 through A-23)
The offsite monitoring program started in mid-May, several weeks before the start of the pumping tests on the project production wells. Generally, all of the wells monitored showed a seasonal decline ranging from about 2 feet (for most wells) to as much as 16 feet for the Wilson and MacEntee wells (Figures 20 and 21). During the pumping test period, there appeared to be no significant impacts on
Page 12 September 28, 2010
the offsite wells due to the testing. Review of the monitoring charts shows that there were no effects on the offsite wells monitored during the 120 gpm Well 4 test. During the second test (i.e., Wells 3, 5 and 6 at 100 gpm), there appeared to be a downward deflection (water level lowering) on three of the off-site well charts: the Cablevision, Wilson and MacEntee charts (Figures 19, 20 and 21). The MacEntee and Cable Vision wells are the closest wells to the east while the Wilson well is the closest well to the south (Figure 3).
The Wilson and MacEntee charts show that these two wells are sensitive to climatic changes with both wells showing a significant downward trend during the entire monitoring period, a period of transition from spring’s cool and wet weather to summer‘s warm and dry weather. Further, the downward deflection associated with the second pumping test actually starts before the test and is likely associated with the very warm weather during the period. However, the downward deflection appears to increase during the test in these two wells possibly indicating some degree of connection to Wells 3, 5, and 6.
The Cablevision well, the closest well to the test wells, is less sensitive to the climatic changes, but also shows a downward deflection in water level during the second test period. This would tend to confirm that there is a degree of connection between the Cablevision well and Wells 3, 5, and 6. In all three cases (MacEntee, Wilson and Cablevision), however, the degree of well interference is minor with a total drawdown limited to less than 2 feet in the Cablevision and MacEntee wells. The deflection is greater in the Wilson well but most of that deflection appears to be due to climatic response rather than a response to the pumping test, since, as mentioned above, the downward slope of the water level trace starts before the actual start of the pumping test. All three wells deflect upwards after the test, again probably due to the rain at the end of the test period. Again, that upward deflection is seen in most wells (with no apparent increase or decrease in amplitude with distance from the pumping wells), even wells that were not impacted by the test and, therefore, cannot be attributed to the pumping test.
In all three cases, Wilson, Cablevision and MacEntee, the water level decline (associated with the second pumping test) actually starts before the start of the second pumping test indicating that the water level decline is not caused by the pumping test. However, during the second pumping test period (active pumping) there appears to be an increase in the already downward slope in the Wilson and Cablevision wells, possibly suggesting some contribution to the water level decline by the pumping test.
The first test, the test on Well 4 at 120 gpm, did not produce any discernable effects on any of the off-site wells monitored. The second test, the test on the system back-up wells at 100 gpm, may have produced some minor effects on the Wilson, Cablevision and MacEntee wells. However, those impacts cannot be considered significant since, in all cases, the water level changes were less than those caused by the owner’s use of the well. Typical private well pumps operate using a pressure switch in the home’s water pressure/storage tank. The switch is generally set to turn the pump on when the pressure in the tank falls below 30 pounds per square inch [psi] and turns the pump off when the pressure reaches 70 psi. (These are general settings and can differ from home to home). The on-off cycling of the pump depends on the size of the storage tank in the home and the amount of water usage in the home. The pump cycling can be observed on the private well’s charts as the individual, short term cycles (many per day). In all three of the wells that had possible hydraulic connection to the pumping test wells, the amount of possible effect on the wells due to the test is significantly less than the individual (homeowner pump) cycle amplitude, showing that the CVE back-up well’s effect on the off-site, private, wells will be within the current usage range of the private wells and, therefore, should not adversely affect the private wells and not be noticed by the homeowners. Additionally, the back-up wells are not expected to be used for normal operation except under emergency conditions or Well 4 maintenance and for short periods.
Conclusions
The Cricket Valley Energy well system is comprised of four wells. Well 4 is the primary well with Wells 3 and 5 acting as the system back-up wells and Well 6 held in reserve.
Page 13 September 28, 2010
The test of Well 4 has demonstrated that the well can be operated indefinitely at the design rate of 60 gpm (assuming normal well maintenance and redevelopment). Further, the well test has shown that Well 4 could be pumped at the higher rate of up to 120 gpm for extended periods. The 180-day drawdown projection for this well indicates that at the end of 180-days without recharge and pumped at a rate of 120 gpm, Well 4 will have a water level drawdown of 170 feet, considering that the static water level for this well was 26 feet the 180 day projected water level is 196 feet, well above the anticipated pump setting of 250 feet.
It has been demonstrated that Well 3, Well 5 and Well 6 can be pumped at 100 gpm for an extended period and indefinitely at a combined rate of 60 gpm.
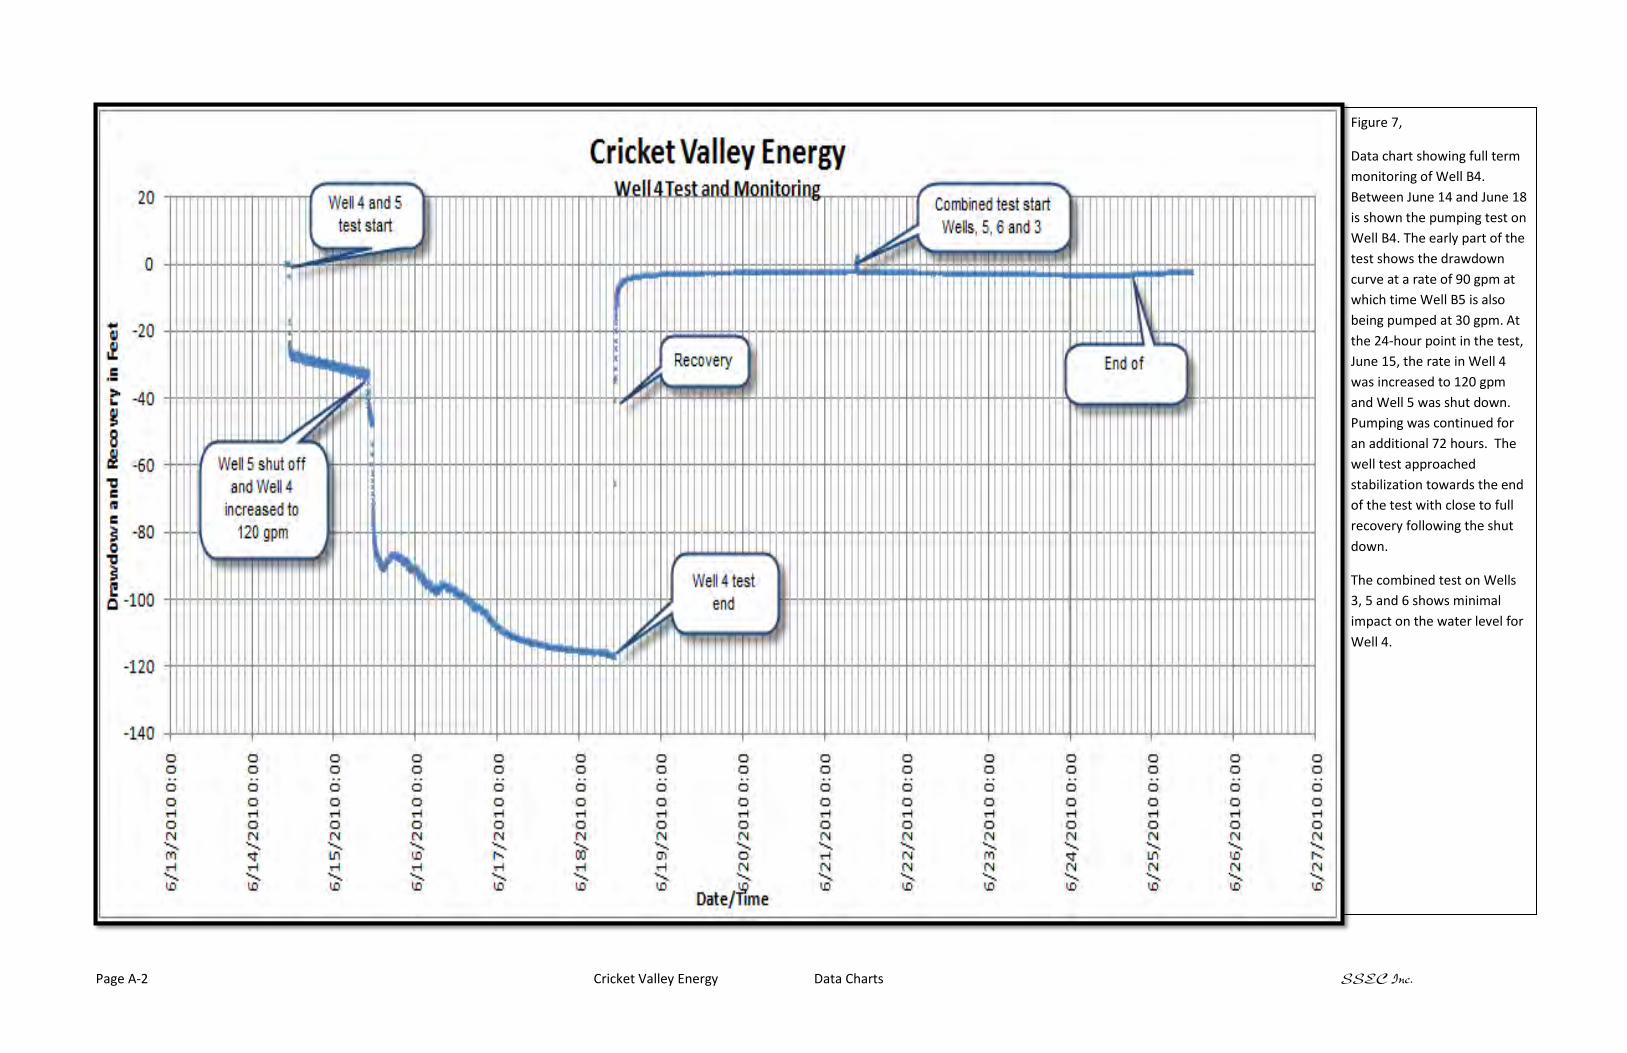
Well 3 can be pumped, in conjunction with Well 5 and Well 6 pumping, at a rate of 45 gpm indefinitely. The 180-day projection for this well indicates a drawdown of 160 feet with the anticipated pump setting at 240 feet below the static water level for the well, well within the safety margin. Well 3, however, since it is hydraulically connected to Well 6, will produce more water if Wells 3 and 5 are pumped without Well 6. Similarly Well 5 will also produce more water (cause less drawdown at the same pumping rate) if it is pumped with Well 3 while Well 6 is not pumped.
Well 6 can be pumped at a rate of 25 gpm, in conjunction with the pumping of Wells 3 and 5, indefinitely. The 180 day projection for this well indicates that the drawdown at the end of 180 days will be 220 feet with an anticipated pump setting at about 640 feet below the static water level, well within the safety margin. Well 6 will be held in reserve for future (possible) use and will not be included as part of the system back-up.
Well 5 was tested at a rate of 30 gpm, in conjunction with Wells 3 and 6 pumping. Although the pumping test has shown that this well could be pumped for an extended period, the 180 day projection for this well, at 30 gpm, produced a drawdown of 200 feet, considering the static level for the well is 32 feet, the final 180-day water level is 32 feet below the anticipated pump setting for this well. This means that this well cannot be pumped at a rate of 30 gpm, in conjunction with Wells 3 and 6, for an extended period that exceeds 6-months. However since Well 6 is not included as part of the back-up system, Well 5 is expected to have significantly less drawdown at the same pumping rate, which will raise the drawdown intercept point on the 180-day projection. Also, please note that the projection is based on a combined pumping rate of 100 gpm, 40 gpm higher than the design operating rate for these wells.
The Primary system well test at 120 gpm, the Well 4 test, did not produce any discernable effects on any of the off-site private wells monitored, nor any of the on-site monitored wetland piezometers. This well is expected to operate normally at 60 gpm in the summer and significantly lower in the winter with only occasional, intermittent, periods of operation at higher rates not to exceed 120 gpm.
When Wells 3, 5 and 6 were pumped at a combined rate of 100 gpm, the pumping did not have any discernable impact to the Swamp River and the adjacent wetlands. The 100 gpm test on these wells did not have a significant impact to the off-site wells monitored. Three wells did show some minor indication that they were influence by the pumping test, but that influence was minimal (smaller than the effect that the well owners own usage had on their wells). Operation of the system back-up wells (Wells 3, and 5) for relatively short periods necessary to affect repairs on the primary well will not have any noticeable impact on any of the offsite wells that were monitored.
Cricket Valley Energy
Pumping Test Report Data Charts
Key Map
Note: Knolls of Dover Wells not shown
Page A-2 Cricket Valley Energy Data Charts SSEC Inc.
Figure 7,
Data chart showing full term
monitoring of Well B4.
Between June 14 and June 18
is shown the pumping test on
Well B4. The early part of the
test shows the drawdown
curve at a rate of 90 gpm at
which time Well B5 is also
being pumped at 30 gpm. At
the 24-hour point in the test,
June 15, the rate in Well 4
was increased to 120 gpm
and Well 5 was shut down.
Pumping was continued for
an additional 72 hours. The
well test approached
stabilization towards the end
of the test with close to full
recovery following the shut
down.
The combined test on Wells
3, 5 and 6 shows minimal
impact on the water level for
Well 4.

Page A-3 Cricket Valley Energy Data Charts SSEC Inc.
Figure 8.
Chart of the 96 hour test
period for Well B4 plus a 24-
hour recovery period. See
figure 7 for details.

Page A-4 Cricket Valley Energy Data Charts SSEC Inc.
Figure 9.
The 180 day drawdown
projection for Well B4
without recharge. The 90
gpm portion of the curve as
well as the 120 gpm portion
of the curve was projected
to 180 days. The projections
indicate that at 90 gpm the
drawdown at the end of 180
days will be limited to about
60 feet while the 120 gpm
projection indicates that the
well drawdown will be
limited to 170 feet. This
well is expected to be
pumped, on a continuous
basis, at a rate of 60 gpm
[summer] and about 15 gpm
during the winter. The
maximum rate of 120 gpm
will be required for short
term period of up to one
week during emergencies
such as boiler chemistry
upsets and short term
operation transients for
start-up.
Static water level for this
well is 26 feet [June].
Therefore the 180 day
drawdown plus 26 feet
equals 196 feet, which is
well above the pump setting
of 250 feet.
Page A-5 Cricket Valley Energy Data Charts SSEC Inc.
Figure 10.
Full term monitoring of
Well B3 during the test
period. The early part of the
test, between June 14 and
June 15 shows the
drawdown interference
from Well B5. At the 24-
hour point, when B5 was
shutdown and B4 was
increased to 120 gpm from
90 gpm, the chart shows
almost complete recovery
indicating that Well B4 has
little connection to Well B3.
The degree of connection
between the two wells is
indicated by the portion of
the curve between the
shutdown of Well B5 and
June 18 at the shutdown of
Well B4. This portion of the
curve shows an interference
impact to Well B3 from the
Well B4 pumping of only
about 5 feet of drawdown.
The chart shows the
drawdown from the
combined pumping test for
Wells B3, B5 and B6. The
drawdown in Well B3 was
limited to little over 100 feet
of drawdown.
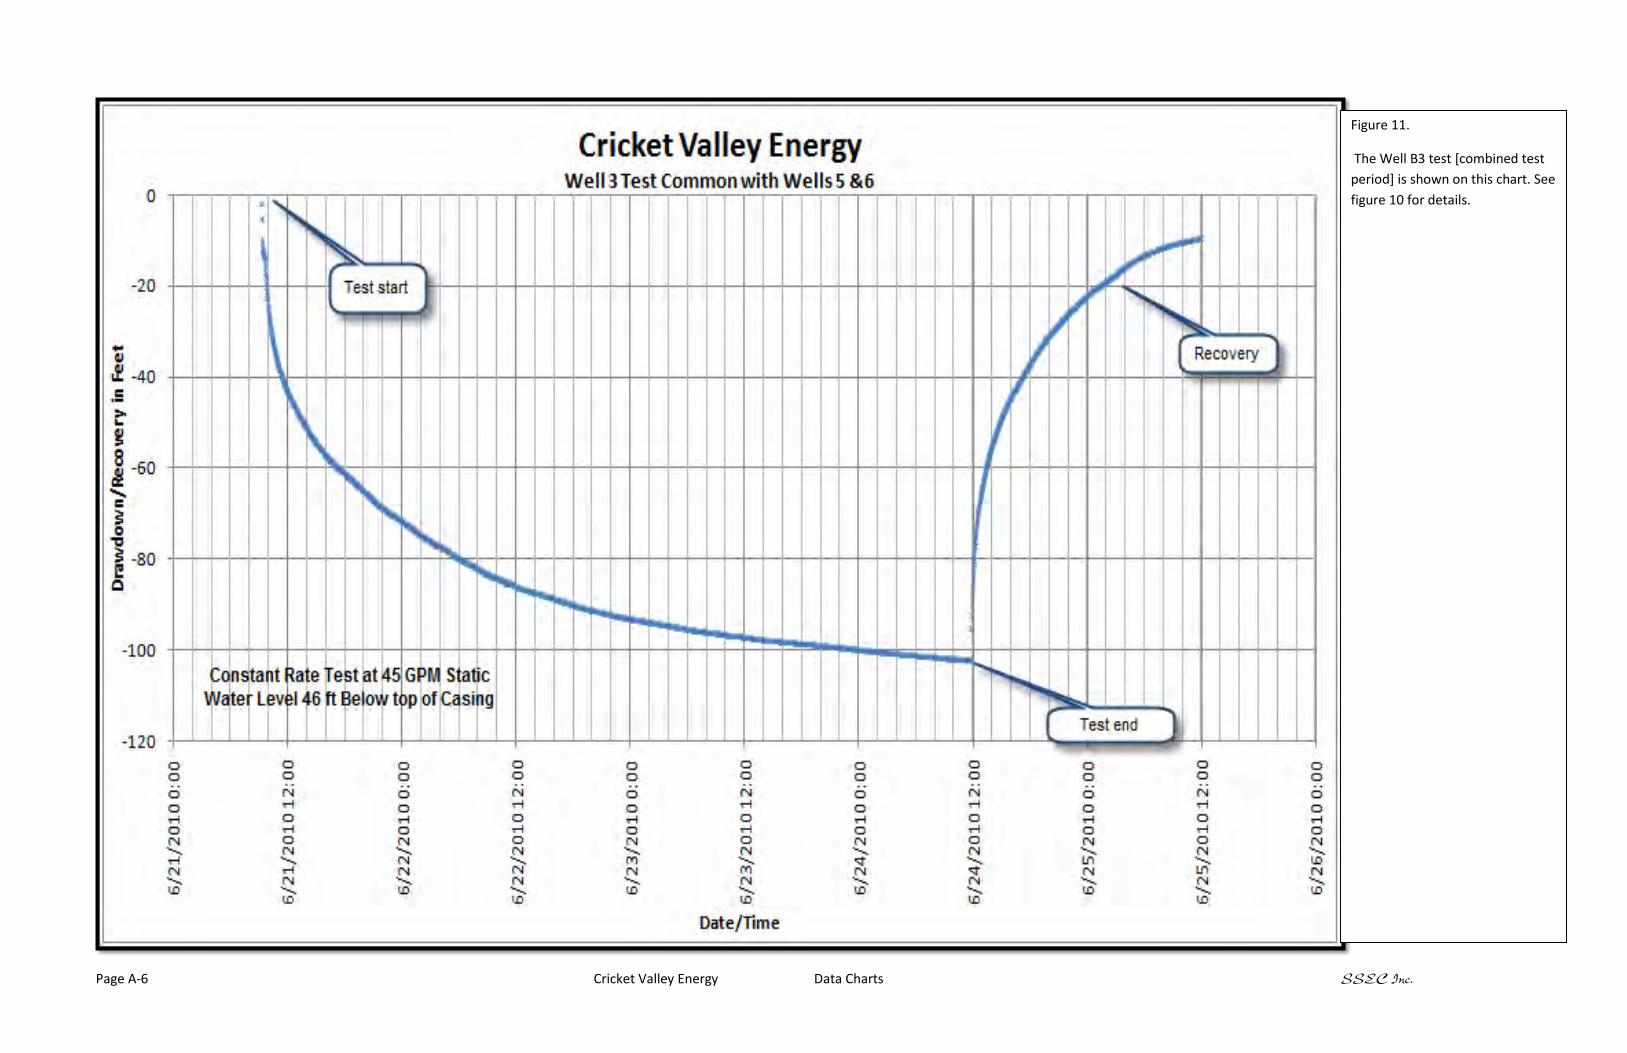
Page A-6 Cricket Valley Energy Data Charts SSEC Inc.
Figure 11.
The Well B3 test [combined test
period] is shown on this chart. See
figure 10 for details.

Page A-7 Cricket Valley Energy Data Charts SSEC Inc.
Figure 12.
The drawdown projection
[during combined test] for the
Well B3 test shows a 180 day
drawdown projection limited to
160 feet. This Well is part of the
Cricket Valley Energy back-up
well system, which includes Well
B5, and is not expected to be
operated for more than several
days at any one time when
needed. Although Well B6 was
included in the testing, it will be
held in reserve and will not be
used as part of the backup
system.
Static water level for this well is
46 feet [June]. Therefore the 180
day drawdown plus 46 feet
equals 199 feet, which is well
above the pump setting of 410
feet.

Page A-8 Cricket Valley Energy Data Charts SSEC Inc.
Figure 13.
Full term monitoring of Well B5
during the test period. The early
part of the test, between June 14
and June 15 shows the drawdown
of Well B5 at a rate of 30 gpm. At
the 24-hour point, when B5 was
shutdown and B4 was increased
to 120 gpm from 90 gpm, the
chart shows almost complete
recovery indicating that Well B4
has little connection to Well B5.
The degree of connection
between the two wells is
indicated by the portion of the
curve between the shutdown of
Well B5 and June 18 at the
shutdown of Well B4. This portion
of the curve shows an
interference impact to Well B5
from the Well B4 pumping of only
about 5 feet of drawdown. The
chart shows the drawdown from
the combined pumping test for
Wells B3, B5 and B6. The
drawdown in Well B5 was limited
to little over 150 feet of
drawdown.

Page A-9 Cricket Valley Energy Data Charts SSEC Inc.
Figure 14.
The Well B5 data during the
Combined test on Wells B3, B5
and B6 is shown in this figure. See
figure 13 for details.

Page A-10 Cricket Valley Energy Data Charts SSEC Inc.
Figure 15.
The Well B5 test projection to
180 days indicates a drawdown
of 200 feet. The drawdown
projection indicates that it will
reach below the anticipated
pump setting and therefore this
well should not be pumped for
periods extending beyond
several months. However since
this is part of the back-up well
system, this well will not be
pumped at the 30 gpm rate for
more than several days at any
one time. Additionally this
drawdown project was on the
data for the combined test. Well
6, although it was included in the
testing, will not be part of the
backup system and, therefore,
the interference effects of Well 6
on Well 5 will be illuminated.
Static water level for this well is
32 feet [June]. Therefore the 180
day drawdown plus 32 feet
equals 232 feet, which is below
the pump setting of 200 feet.
Page A-11 Cricket Valley Energy Data Charts SSEC Inc.
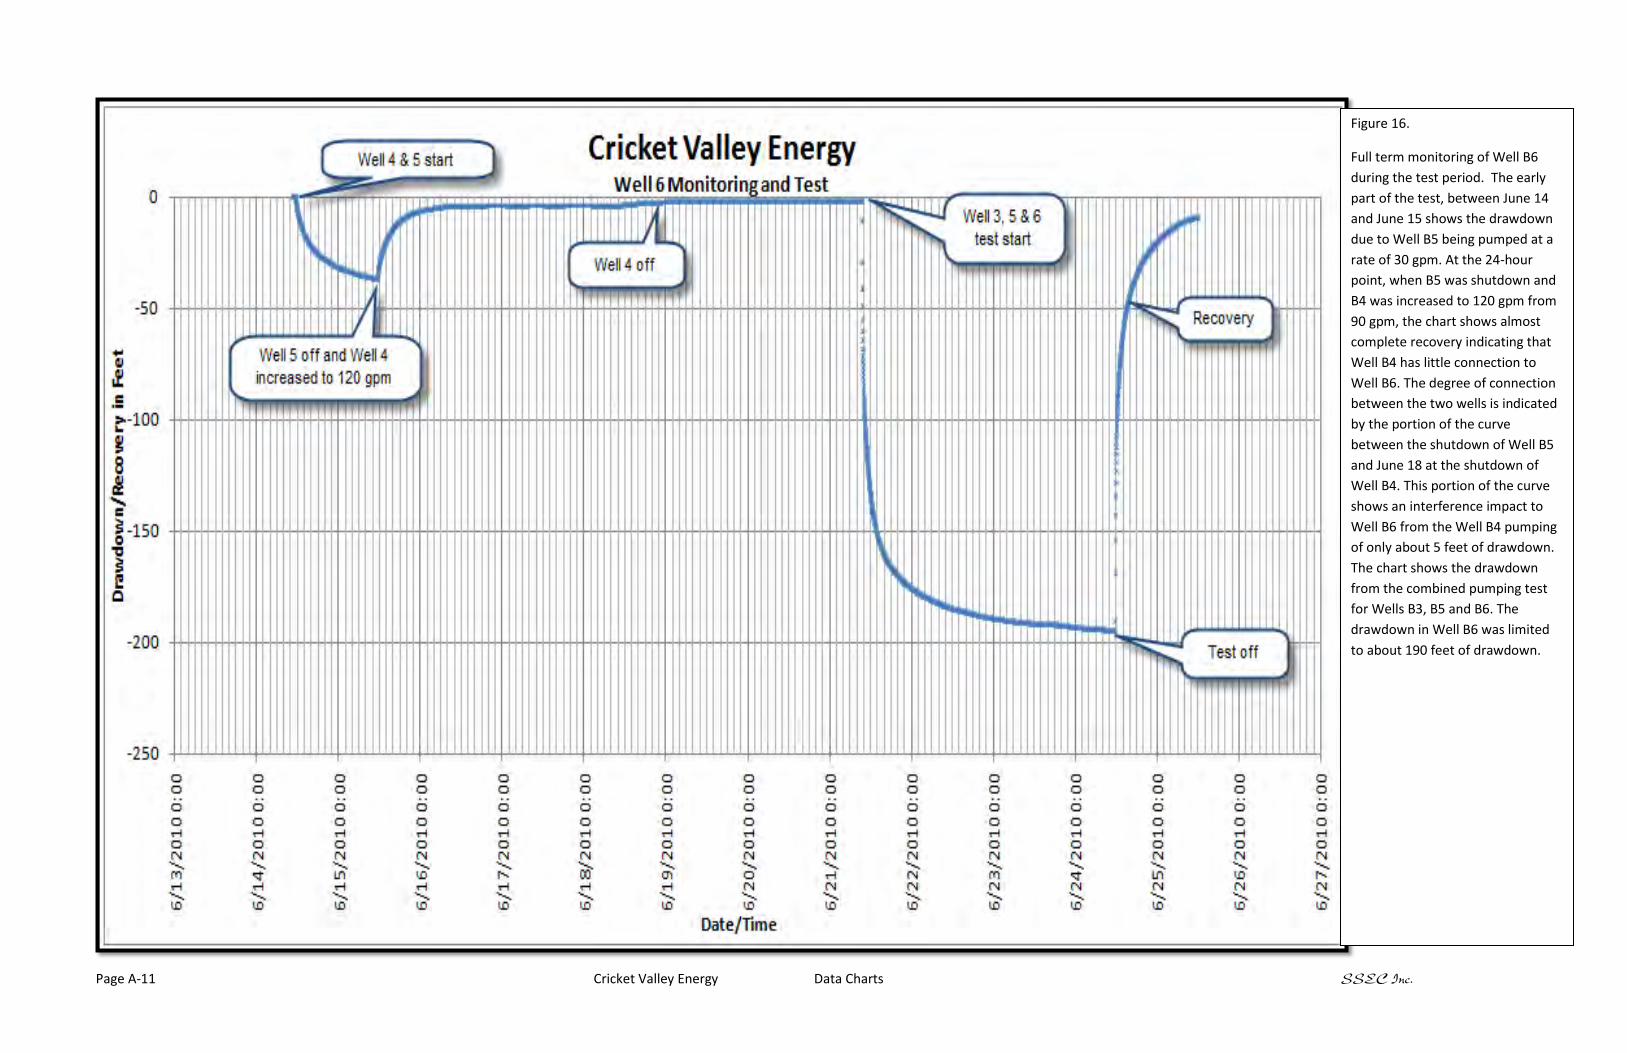
Figure 16.
Full term monitoring of Well B6
during the test period. The early
part of the test, between June 14
and June 15 shows the drawdown
due to Well B5 being pumped at a
rate of 30 gpm. At the 24-hour
point, when B5 was shutdown and
B4 was increased to 120 gpm from
90 gpm, the chart shows almost
complete recovery indicating that
Well B4 has little connection to
Well B6. The degree of connection
between the two wells is indicated
by the portion of the curve
between the shutdown of Well B5
and June 18 at the shutdown of
Well B4. This portion of the curve
shows an interference impact to
Well B6 from the Well B4 pumping
of only about 5 feet of drawdown.
The chart shows the drawdown
from the combined pumping test
for Wells B3, B5 and B6. The
drawdown in Well B6 was limited
to about 190 feet of drawdown.
Page A-12 Cricket Valley Energy Data Charts SSEC Inc.
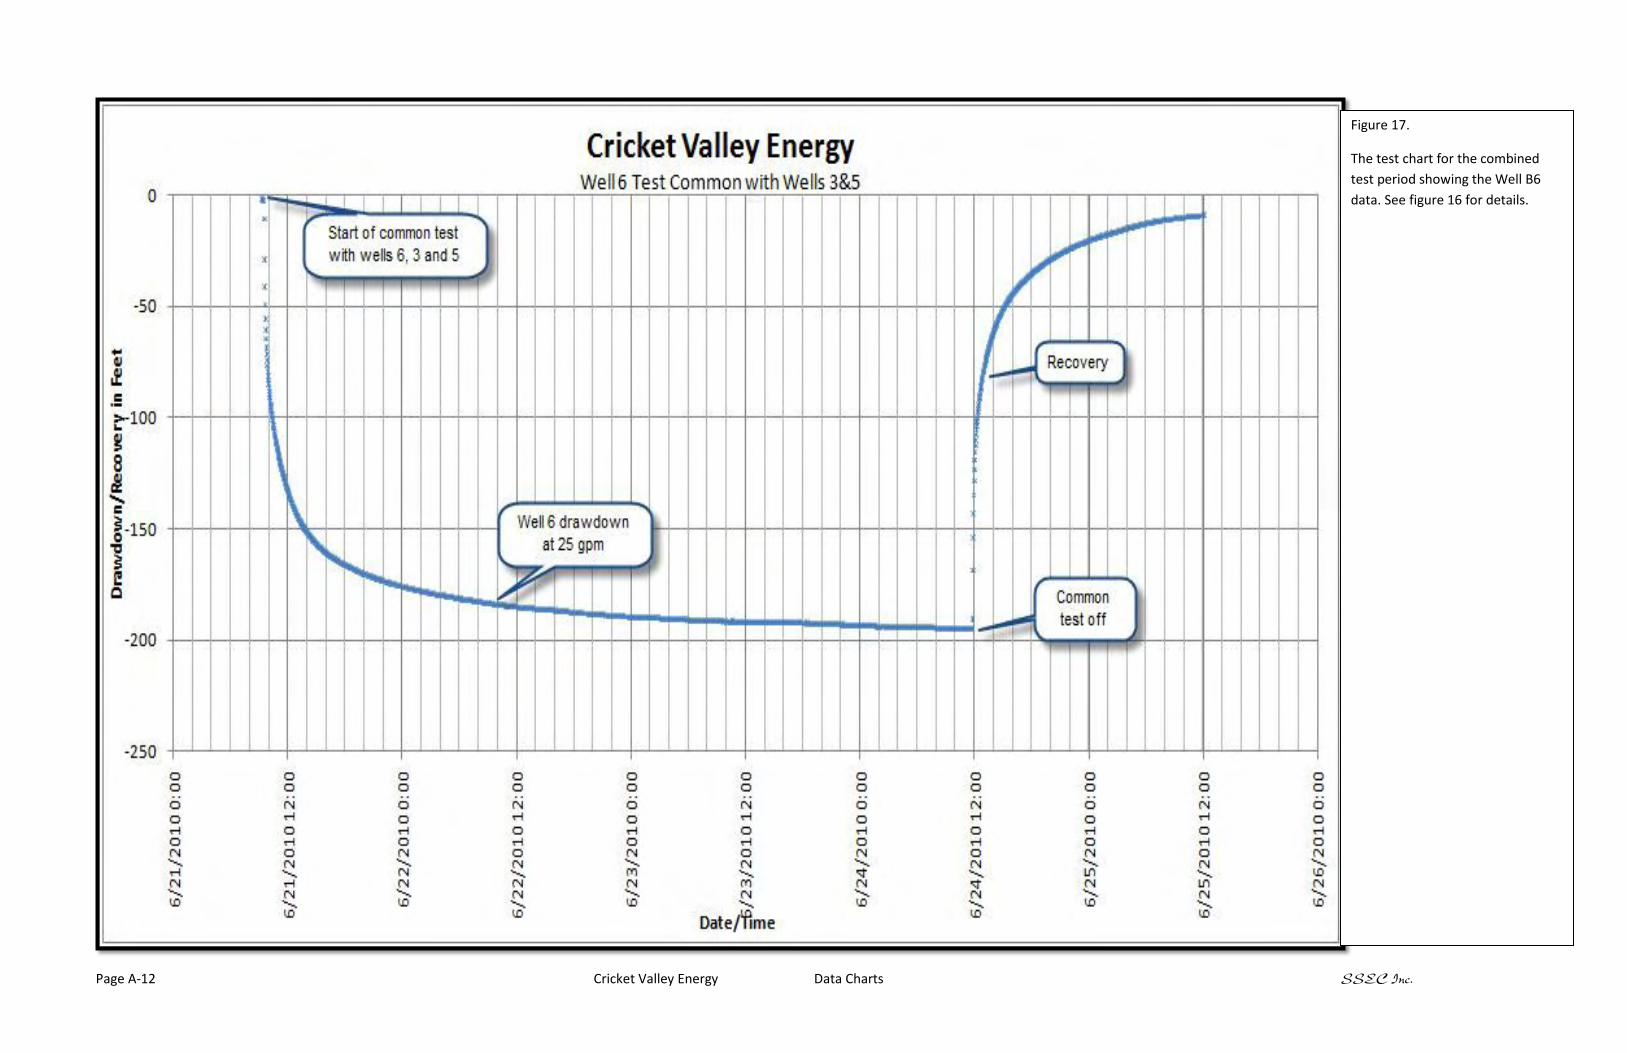
Figure 17.
The test chart for the combined
test period showing the Well B6
data. See figure 16 for details.

Page A-13 Cricket Valley Energy Data Charts SSEC Inc.
Figure 18.
The Well B6 180 day projection
indicates that the well drawdown at
the end of that period will be 220 feet
at a rate of 25 gpm. Since this well
has deep source water bearing
fractures, the 220 foot projected
drawdown is well within the safety
margin for this well.
Static water level for this well is 49
feet [June]. Therefore the 180 day
drawdown plus 49 feet equals 262
feet, which is well above the pump
setting of 640 feet.
Page A-14 Cricket Valley Energy Data Charts SSEC Inc.
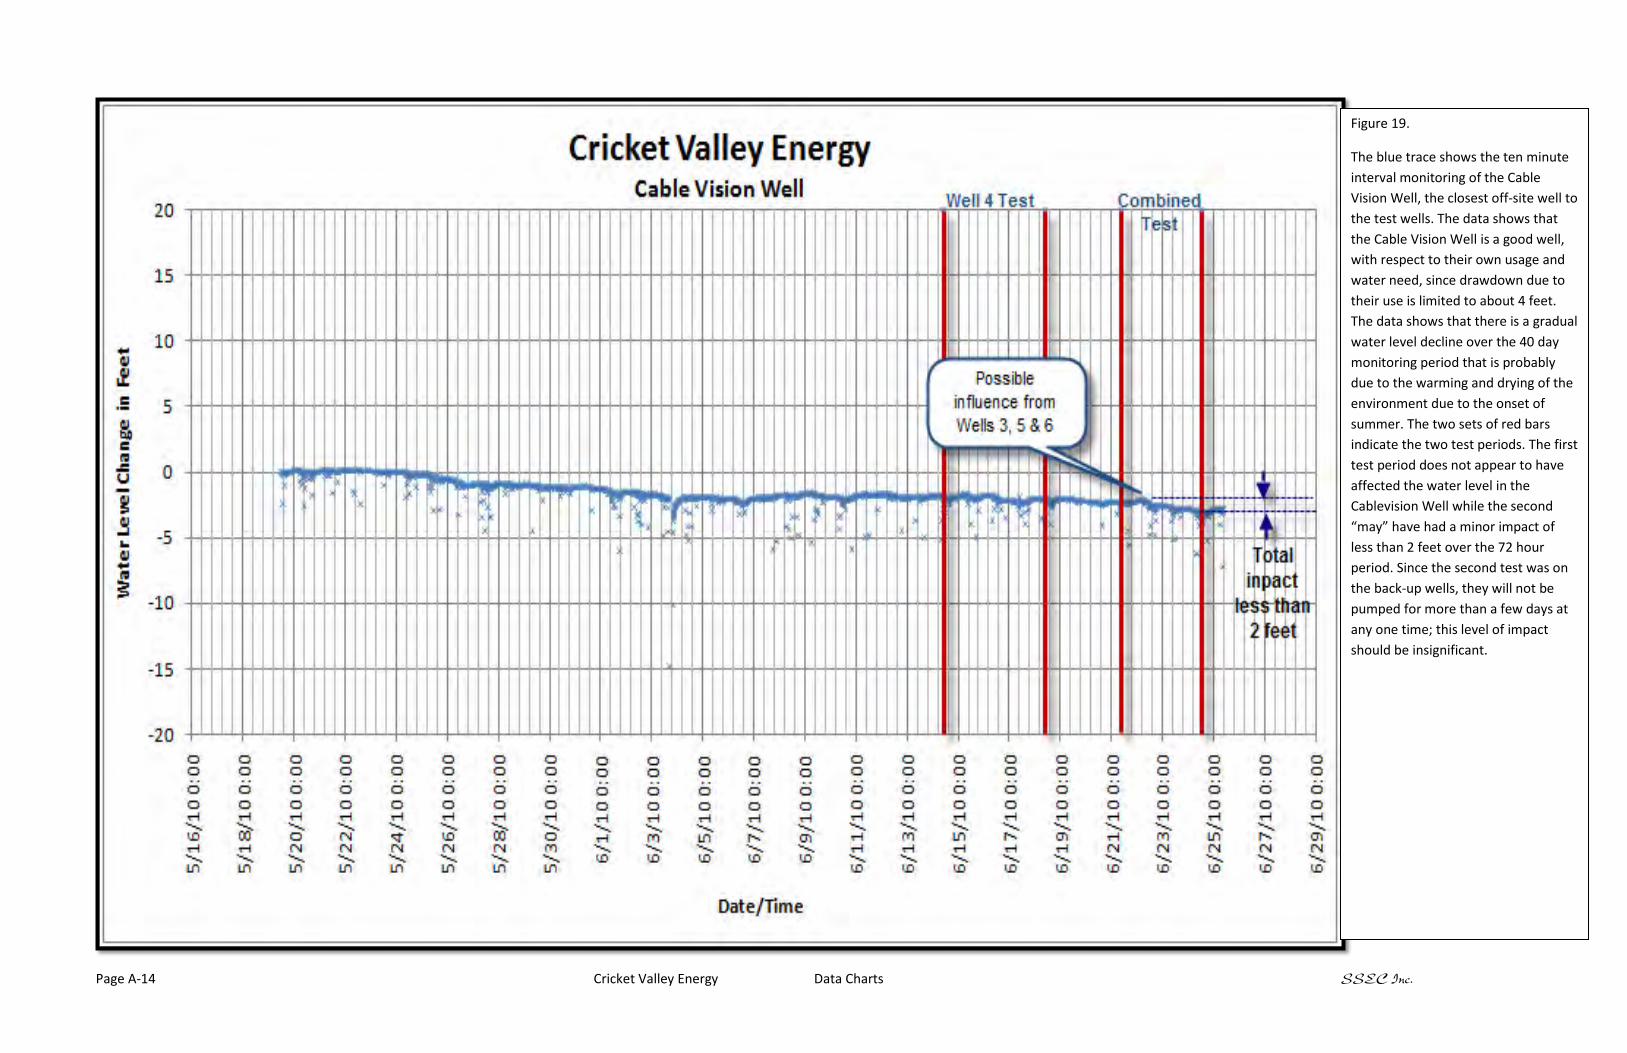
Figure 19.
The blue trace shows the ten minute
interval monitoring of the Cable
Vision Well, the closest off-site well to
the test wells. The data shows that
the Cable Vision Well is a good well,
with respect to their own usage and
water need, since drawdown due to
their use is limited to about 4 feet.
The data shows that there is a gradual
water level decline over the 40 day
monitoring period that is probably
due to the warming and drying of the
environment due to the onset of
summer. The two sets of red bars
indicate the two test periods. The first
test period does not appear to have
affected the water level in the
Cablevision Well while the second
“may” have had a minor impact of
less than 2 feet over the 72 hour
period. Since the second test was on
the back-up wells, they will not be
pumped for more than a few days at
any one time; this level of impact
should be insignificant.
Related Documents