Appendix 4 Format for Final Technical Report (FTR) Your Final Technical Report should be received by the Programme Manager on the last contractual date of your project. Your report will be peer reviewed, and, depending on the review, it is possible you might be asked to make some amendments. Once the review (and any amendments) have been completed, a copy of the FTR will be sent to DFID. Please send 3 copies of the report to the Programme Manager, including one electronic version Environmental variability and productivity of semi-arid grazing systems Environmental Variability Phase 2 R6984 / R8476 / ZC0291 Executive Summary A very brief summary of the purpose of the project, the research activities, the outputs of the project, and the contribution of the project towards DFID’s development goals. (Up to 500 words). Adaptation to climate change under diminishing (and therefore increasingly variable) rainfall scenarios requires livestock breeders to find strategies for coping with periods when forage supply is critically limited. Livestock breeders must choose between fixed stocking rates to minimise risk of loss in drought on the one hand and opportunistic selling as an alternative to bearing high mortality in drought on the other. They must also determine how access to forage is constrained by the availability of drinking water and other constraints on range use, choose what resources to use in which season, and when and how much supplementation is required. Policy analysis of this type can be conducted using the SimSAGS Decision Support System devised under this LPP program. Previous phases have concentrated on the underlying scientific content of the model, synthesizing the new technology developed by the SimSAGS team, and making its application accessible through a practical graphical user interface, essential for a positive user experience. This final phase has seen closure on the development of the model with extension (further development) of some crucial aspects of the model, such as the fire dynamics module, and construction of a vital help system with dedicated user support. The other part of this phase involves delivery of the model to target institutions. This phase can therefore be summed up in three words: Development, Dissemination, Delivery. SimSAGS models the effects of climatic and spatial variation on livestock systems. Its strengths lie in its adaptability, over a very wide geographical zone, as a decision support simulation tool in application to real world scenarios. The user can specify a wide range of inputs, such as land type and area, rainfall, and livestock management policy, then run the simulation for a given number of years. The model simulates animal population dynamics from vegetation biomass dynamics, which is driven by soil type and daily rainfall data. Spatial heterogeneity is represented by a chosen number and size of cells in a grid. For each cell, soil, vegetation and altitude can be specified, and water points can be located.

Welcome message from author
This document is posted to help you gain knowledge. Please leave a comment to let me know what you think about it! Share it to your friends and learn new things together.
Transcript
Appendix 4 Format for Final Technical Report (FTR) Your Final Technical Report should be received by the Programme Manager on the last contractual date of your project. Your report will be peer reviewed, and, depending on the review, it is possible you might be asked to make some amendments. Once the review (and any amendments) have been completed, a copy of the FTR will be sent to DFID. Please send 3 copies of the report to the Programme Manager, including one electronic version
Environmental variability and productivity of semi-arid grazing systems Environmental Variability Phase 2
R6984 / R8476 / ZC0291 Executive Summary
A very brief summary of the purpose of the project, the research activities, the outputs of the project, and the contribution of the project towards DFID’s development goals. (Up to 500 words). Adaptation to climate change under diminishing (and therefore increasingly variable) rainfall scenarios requires livestock breeders to find strategies for coping with periods when forage supply is critically limited. Livestock breeders must choose between fixed stocking rates to minimise risk of loss in drought on the one hand and opportunistic selling as an alternative to bearing high mortality in drought on the other. They must also determine how access to forage is constrained by the availability of drinking water and other constraints on range use, choose what resources to use in which season, and when and how much supplementation is required. Policy analysis of this type can be conducted using the SimSAGS Decision Support System devised under this LPP program. Previous phases have concentrated on the underlying scientific content of the model, synthesizing the new technology developed by the SimSAGS team, and making its application accessible through a practical graphical user interface, essential for a positive user experience. This final phase has seen closure on the development of the model with extension (further development) of some crucial aspects of the model, such as the fire dynamics module, and construction of a vital help system with dedicated user support. The other part of this phase involves delivery of the model to target institutions. This phase can therefore be summed up in three words: Development, Dissemination, Delivery.
SimSAGS models the effects of climatic and spatial variation on livestock systems. Its strengths lie in its adaptability, over a very wide geographical zone, as a decision support simulation tool in application to real world scenarios. The user can specify a wide range of inputs, such as land type and area, rainfall, and livestock management policy, then run the simulation for a given number of years. The model simulates animal population dynamics from vegetation biomass dynamics, which is driven by soil type and daily rainfall data. Spatial heterogeneity is represented by a chosen number and size of cells in a grid. For each cell, soil, vegetation and altitude can be specified, and water points can be located.

SimSAGS is now a world-leading product and in demand. It is currently being used to answer questions towards improving the livelihoods of the Maasai in Kitengela (Kenya), Mongolian pastoralists and Australian cattle farmers, while in each case accounting for conservation issues that conflict with aspects of these lifestyles. SimSAGS is easy to parameterise and use, and has excellent predictive ability. Uptake will be, as at present, via researchers, consultants, NGOs and local extension agencies, although the model can easily be adapted to any user’s needs and therefore is not exclusive to expert users. Workshops and site visits provide opportunities for collaboration, delivery and application of the model.
Background Information should include a description of the importance of the researchable constraint(s) that the project sought to address and a summary of any significant research previously carried out. Also, some reference to how the demand for the project was identified. The SAGS (Semi-Arid Grazing Systems) Project is a long-term research project at the University of Edinburgh, UK. The primary objective of modelling semi-arid grazing systems was to find out how far the existing knowledge of the underlying processes could account for and replicate the dynamics of the system. The main objective is the prediction of animal performance in response to variation in rainfall and to stocking rate, and the effects of animal type and vegetation conditions on system performance. Modelling was used to assess the components and processes to which the system is most sensitive, and identified inadequacies in current knowledge which limit our understanding and ability to predict system performance. The model was designed to run on a daily iteration interval and to use daily rainfall data to calculate vegetation growth and its allocation to plant parts, the selection and intake of these by animals, the animals' consequent energy and protein balances, body growth, reproduction and mortality. It therefore simulates animal population dynamics mechanistically, i.e., by coupling them to vegetation biomass dynamics. The model can be run without animal sales, in which case the ecological carrying capacity of the system is expressed (as the size of the animal population maintained by intake-dependent birth and mortality, without offtake), or with a range of animal sales policies. A detailed description of the animal component of the model has been presented by Illius and Gordon (1999), with an outline of the plant component. They also presented results showing that the model gives reasonable predictions of the relationship between the long-term mean ecological carrying capacity and mean annual rainfall (Fritz and Duncan, 1994). The model structure is addressed by Derry (1998), with a more detailed description in Derry (2004) and in preparation. Spatial aspects of the model include topography, soil nutrient distribution, surface water dynamics, plant distribution, drinking water location and animal spatial foraging behaviour. Previous approaches to modelling grazing systems (i.e., large ecosystems models) are widely recognised as being difficult and time consuming to parameterise. In part, this created the demand that SimSAGS is designed to meet. It became necessary to respond to the need for a help system from user groups wanting to use the model software. Previously, application of the model depended on a member of the development team being involved to parameterise and operate the model, and analyse the output. This is not a desirable situation because it relies too heavily on an individual and does not offer autonomy to the decision support system’s end user communities targeted by DFID through this and the other LPP projects. A comprehensive help system including a detailed user guide was the only way that the full potential of this software could be realized. LPP had already funded the development of the scientific content of the model and the user interface to the model’s software. The previous work involved research and development of the scientific and technical components of the model as described in previous reports to LPP. Thus, the modelling system was essentially complete, but without a help system the modelling system is not a decision support system, because it lacked the information needed to guide the user through the processes that apply the model to a particular context and result in predictions relating to resource poor farming. The purpose of this extension application was to deliver the material required to enable those end user communities to parameterise and operate the model, and analyse the output. This was LPP’s long term goal for this project, and a

recommendation from review of the previous FTR, to deliver the decision support system to desktops across the geographic focus. This report describes completion of work carried out as the final phase of development of the SimSAGS decision support system for management and study of semi-arid grazing systems in the program’s geographic focus. Derry, J.F. (1998) Modelling ecological interaction despite object-oriented modularity. Ecological
Modelling, 107, 145-158.
Derry, J.F. (2004) Piospheres in semi-arid rangeland: consequences of spatially constrained plant-herbivore interactions. PhD thesis, University of Edinburgh. Available from http://hdl.handle.net/1842/600
Fritz, H. & Duncan, P. (1994) On the carrying capacity for large ungulates of African savanna ecosystems. Proceedings of the Royal Society of London, 256, 77-82.
Illius, A.W. & Gordon, I.J. (1999) Scaling up from functional response to numerical response in vertebrate herbivores. In Herbivores: Between Plants and Predators. Olff, H., Brown, V.K. & Drent, R.H. (eds.). Blackwell Science.

Project Purpose The purpose of the project and how it addressed the identified development opportunity or identified constraint to development. Baskets of new technologies, decision support strategies and policies developed to improve survival and productivity of livestock species kept by resource-poor livestock keepers, taken-up and promoted by target institutions. This translates into the following action statement. To develop the model from the prototype stage to be readily useable for policy analysis and the prediction of carrying capacity. Climatic variability is the single largest cause of poverty in pastoral societies, and ways need to be found to buffer it by exploiting spatial heterogeneity, and by managing the use of key resources. Amelioration of nutritional bottlenecks requires assessment of carrying capacity under conditions of environmental variability and quantification of seasonal forage supply: the model is designed to achieve this. Development of a Help system is critical to allow users to realise the full potential of the model and its predictive power. We have attempted fully to meet more the stipulation from review of the previous FTR that we “Make techniques and models widely available to potential end users”.
Research Activities This section should include detailed descriptions of all the research activities (research studies, surveys etc.) conducted to achieve the outputs of the project. Information on any facilities, expertise and special resources used to implement the project should also be included. Indicate any modification to the proposed research activities, and whether planned inputs were achieved. 1. Development - Core programming
A number of additional features had been identified that would benefit end-users in applying the model to their specific livelihood contexts, and in enhancing the software’s usability. This final phase of decision support system development has therefore involved some core programming activity to implement these various model extensions and introduce a socio-economic module for household decisions about livestock management. These include:
• Inclusion of boma locations for livestock herders. Water and Boma distributions may be separately defined if there are sufficient temporal and spatial differences between their utilization.
• GIS input (to represent, e.g., temporal constraints on animal foraging, sequences of water visits through herding, seasonal water sources and variable burning policies).
• Bimodal vegetation growth for areas with two distinct growing seasons. • Vegetation height with constraints on foraging height for differences between
small/large browsers using estimated maximum foraging height by animal species at which height foraging is constrained. It was thought desirable to describe the vertical partitioning of browse resources and the limitations of browsing height which are related to herbivore body size. Modifications to the foraging component of the model were made using standard allometric techniques (further details on project website).
• Predatory (e.g., lion) and competing species (e.g., zebra) that affect livestock production. • Accidental fires and controlled burning determined by grass fuel load, fuel moisture, air
temperature, relative humidity, wind speed, slope and firebrands (wind- and air current-born burning material). Explicit woody plant response (e.g., structural effects / topping - height reduction)
• Integrate PHEWS (Pastoralist Household Economics and Welfare Simulator) data sharing with household model and feedback of livestock management decisions.
• Original soil water model extended to include spatial soil fertility which has been found to be an influential factor in determining plant growth.
• ESRI Shapefile compatibility. • Partition invertebrate defoliation to separately account for consumption by army worms. • Various user-interface enhancements for data management and input, including, a GIS
translation progress bar as a visual indicator of translation algorithm, "Update in ___ min / sec" for improved user action feedback, GIS colours/hues to improve GIS display.
2. Dissemination – the help system and online resources including a user forum
In addition to the core programming of the model software, it was established that the decision support system would not realise its potential for the end-user without provision of detailed documentation about the model, the science and how to use the software. Development of this help system has absorbed most of the time available during this phase and has culminated with publication of the system as an online (web) resource. Online

resources have the advantage of being “live” and able to evolve into more what the user needs as a support mechanism than what the developer may consider the user needs. The best format to implement such a user-directed system is as a Wiki which is “a piece of server software that allows users to freely create and edit Web page content using any Web browser. Wiki supports hyperlinks and has a simple text syntax for creating new pages and crosslinks between internal pages on the fly” (wiki.org/wiki.cgi?WhatIsWiki). It is as yet not common (but it is on the increase) for Wikis to be used as user support forums, where both administration and user can provide information, engage in question and answer sessions with immediate feedback, and between them compile a self-organising database. The Wiki concept was attempted for the SimSAGS Help System and although an administration difficulty within the university that hosts the domain has delayed its implementation, it does remain a future prospect. Meanwhile, a fully integrated online help system has been developed, that is growing daily but, unlike Wikis, only through the efforts of the system developers. The vital feedback element has been retained through the user’s forum, which instead of being a Wiki has taken on the more usual format of a standard bulletin board. Hence the website’s status is “in development” because it is designed as an interactive and expanding resource for users of the model software. The help system was developed as web content which is accepted as the optimal format for information resources of this type. Throughout W3C web standards for Internet accessibility were adhered to necessitating coding the pages in XHTML and CSS. Page scripting was validated in liaison with a W3C web standards expert and by using online validation services. Web standards confer longevity to a website (this will be the acceptable format in the future), facilitate accessibility for all users, and facilitate additions such as alternative language versions. The website structure was designed on a hierarchical plan. Its highest division is into external and internal documentation. External documents are the user guide and intended for all users. It includes information for software installation, configuration and use, model parameterisation and navigation, model performance, project file handling, and output display and analysis. Internal documentation is available to all but it is likely that only more technical users will be interested in the description of software architecture and the development history therein. Scientific information is also housed there including a library of collected literature and other documents. Website components were designed to appear seamless as the user navigates their way through each of these sections. The user’s forum is a resource for sharing collective knowledge about related science and modelled contexts which is hosted on another server but its general appearance is in keeping with the main site.
3. Delivery – scientific advances, case studies, past and future visits
An important part of the extension is the needs-led application of the model to provide useful decision support in the user’s context. This acts to develop the user community and introduce the model by promoting it to the target institutions in specific locations. Visits for dissemination and delivery have been made to Kenya, Mongolia and Australia during this extension, but notably not at a cost to the extension budget. Guidance for data collection is provided via a “live” data menu that helps users to track their project progress (see below). Other
dissemination visits for delivery of the decision support system were budgeted for during this final phase but were not carried through at request of LPP. These travel funds remain in the extension budget and will be used at the discretion of LPP.
A wide range of applications of the model are becoming apparent. These opportunities will be pursued and new opportunities developed as they become available. New opportunities may be encouraged by dissemination of the model and its use to a broader audience via the visits to specific locations plus visitors to the website. Where possible, end user communities should be directly integrated with resource-poor farmers. Demonstration, presentation and tailoring of the model required purchase of a new laptop computer. The computer has performed well and has proved a vital part of the travelling SimSAGS Decision Support System.
An important project output from the previous phase was the evaluation of management policies and interventions as techniques for increasing economic output and coping with climatic variability. The original scope for application and validation of the model ranged across a rainfall gradient running between Zimbabwe, South Africa and Botswana. It was confirmed that the model was capable of replicating the main features of semi-arid system dynamics. Its predictions of carrying capacity were found to be in broad agreement with carrying capacities reported in the literature. Subsequently, the model has also been successful predicting optimal strategies for responding to market fluctuations under variable climate in Namibia, and most recently has illustrated the benefits of a modelling approach in assessing the tradeoffs between resource-poor livestock farming and conservation programmes. Resource-poor farmers have been implicated in efforts to protect the Mongolian Gazelle and towards an assessment of the damage being caused to the Great Barrier Reef through silt deposition resulting from the Queensland cattle industry. In Kenya Maasai settlements are fragmenting wildlife migration routes. The issues in these cases are both complicated and sensitive. Applying the SimSAGS Decision Support System is helping to provide some answers to the hypothetical questions that people are naturally asking in difficult situations with a lot of unknowns. The model will continue its usefulness in Africa, Mongolia and Australia while it is subsequently being considered for application to livestock and mixed livestock/wildlife systems in India.

Each project has a “live” data menu that helps users to track their project progress. This example is from an application of SimSAGS model to assess wildlife conflicts with Maasai livelihoods.
(time) (geography) (yes/no) (person) (resolution) (date) (path)category data item units drange location spatial source scale elivery fileSITE area hectares n/a kitengela no ILRI na 04/04/2005 \area\area.txtTOPOGRAPHY altitude meters n/a kitengela yes ILRI 1:50,000 04/04/2005 \topography\kitedem.imgCLIMATE daily rainfall mm 1960-1987 (- 2003) kitengela no KMD daily 04/04/2005 \climate\Rainfall\kitengela.constructed.43y.rai
rainfall distribution 0…1 1960's…1980's kitengela yes ACT LT mean+mon 04/04/2005ATMOSPHERIC temperature 0C 1998…2004 no Mpala Researcn/a 04/04/2005 http://striweb.si.edu/esp/physical_monitoring/descrip_mpala.htm
realtive humidity % 1998…2004 no Mpala Researcn/a 04/04/2005 http://striweb.si.edu/esp/physical_monitoring/descrip_mpala.htmpressure mb n/a mpala no Mpala Researcn/a 04/04/2005 http://striweb.si.edu/esp/physical_monitoring/descrip_mpala.htmminimum temperature 0C no ACT mean monthly 04/04/2005maximum temperature 0C no ACT mean monthly 04/04/2005radiation W m-2 1998…2004 no Mpala Researcn/a 04/04/2005 http://striweb.si.edu/esp/physical_monitoring/descrip_mpala.htmwind speed m s-1 n/a mpala no Mpala Researcn/a 04/04/2005 http://striweb.si.edu/esp/physical_monitoring/descrip_mpala.htmvapour pressure deficit kg kg-1 no
SOIL Fertility 1,2,3,4,5 kitengela yes NOAA / Kenya Soil Survey 04/04/2005Depth cm n/a kitengela yes Kenya Soil Sur1:1000000 04/04/2005 \soils\soildepth.imgType (e.g. clay=1.5, loam=3.5, sand=7.5) kitengela yes Kenya Soil Survey 04/04/2005Surface resistance m s-1 no
PLANTS Canopy resistance m s-1 nobiomass distribution kg ha-1 yesminimum height m yes \plants\maximum height m yes \plants\growth season start date nogrowth season end date noarmy worm damage kg ha-1 noother invertebrate damage kg ha-1 no
ANIMALS disease mortality : MCF % per annum yesdisease mortality : other % per annum nowildebeest calf survival % per annum nowildebeest number # nowildebeest youngest breeding yr nowildebeest birth ratio : nowildebeest fecundity # nothompson's gazelle number # nothompson's gazelle birth ratio : nothompson's gazelle fecundity # nozebra number # nozebra birth ratio : nozebra fecundity # nolion predation rate % per annum no
HOUSEHOLD cattle herds # nocattle herd sizes # nocattle birth ratio : nocattle fecundity # nosheep / goat herds # nosheep / goat herd sizes # nosheep / goat birth ratio : nosheep / goat fecundity # no
FIRE events dates noimpact % clearance no
SETTLEMENT bomas - yes ILRI\Shem 25/04/2005 \infrastructure\fencing - yes ILRI\Shem 26/04/2005 \infrastructure\watering points - yes ILRI\Shem 27/04/2005 \infrastructure\quarries yes ILRI\Shem 28/04/2005 \infrastructure\

An aspect of the SimSAGS Decision Support System’s role is also as a tool for academic research. Simulation studies to test hypotheses about management practices, ecological relationships and animal behaviour have proved complimentary to real world case studies (e.g., Illius et al. 1998). In this last phase the SimSAGS model has been used to investigate the consequences of drinking water location for intake and survival, resource heterogeneity and optimal foraging. Cumming, D.H.M. and Cumming, G.S. (2003) Ungulate community structure and ecological
processes: body size, hoof area and trampling in African savannas. Oecologia, 134, 560-568.
Dziba, L. E., Scogings, P. F, Gordon., I. J. and Raats, J. G. (2003) The feeding height preferences of two goat breeds fed Grewia occidentalis L. (Tiliaceae) in the Eastern Cape, South Africa. Small Ruminant Research, 47, 31-38.
Illius, A.W., Derry, J.F. and Gordon, I.J. (1998) Evaluation of strategies for tackling climatic variation in semi-arid grazing systems. Agricultural Systems, 57, 381-398.
Woolnough, A. and du Toit, J. (2001) Vertical zonation of browse quality in tree canopies exposed to a size-structured guild of African browsing ungulates. Oecologia, 129, 585-590.

Outputs The research results and products achieved by the project. Were all the anticipated outputs achieved and if not what were the reasons? Research results should be presented as tables, graphs or sketches rather than lengthy writing, and provided in as quantitative a form as far as is possible. The outputs from this phase of the project build on a long publication record by the development team that extends back beyond the beginning of the project but is directly related to the scientific and technological innovations harnessed within the SimSAGS Decision Support System. The modules within the model dealing with animal metabolism and population dynamics are based on work by Andrew Illius and Iain Gordon (e.g., Illius and Gordon 1987, 1991, 1992, 1993, 1999, Gordon and Illius 1988, 1996). Derry (1998) described application of a computing technique new to ecological modelling. Further innovations under the project in modelling spatial foraging are reported in Derry (2004a) and are being prepared for publication elsewhere. This final phase of the project sees publication of
1. a help system for the decision support software 2. a dedicated website http://sags.bio.ed.ac.uk/ 3. a user’s forum 4. a user’s mailing list 5. further model extensions 6. information for decision support through application of the model 7. scientific results through application of the model 8. further dissemination of scientific content and findings as papers in
peer-reviewed journal articles plus wider dissemination to prospective new end users at different locations. This all equates to our successful delivery on contractual obligations plus real term delivery of beneficial contributions to research into pastoralist systems involving resource-poor farmers within and outside the program geographic focus. The help system and online resources
This section of the report is a description of the online resources, highlighting the website components, their design and format, and how these positively influence the user’s experience of them. Advanced techniques for design of information architecture have been employed towards optimal user experience. These include Requirement Analysis (user expectations), Audience Definition (user profiles and user groups, e.g., experienced and novice users), User Scenarios (projected user site navigation pathways), Content Survey (assessment of material types and categories), Process Flows (operation sequences), Site Map (visual representation of site architecture and contents) and Wire Frames (design mock-up), and Web 2.0 concepts.
The online version of the help system is hosted by the University of Edinburgh under Apache/2.0.52 (UNIX) PHP/4.3.9 Server on port 80, the standard channel for HTTP. The main portal is at http://sags.bio.ed.ac.uk/. The version packaged with the laptop also runs on a pc version of Apache 2.0.55 (Win32) including full functionality of the elements linked to external resources with an appropriate internet connection.
The tour begins with a site overview before a closer look at some of the separate sections.

The SimSAGS website design is defined by User Scenarios, the pathway that a user will most likely wish to explore the use and usefulness of the SimSAGS model software. On entering the site through the homepage (‘HOME’), the user needs quick access to the main sections of the website (thick lines) that will tell them what the software does (‘ABOUT’), what they need to use it (‘REQUIREMENTS’), how to get it (‘DOWNLOAD’), how to use it (‘USER GUIDE’), and more detailed information on all aspects of the science and technology involved in the software’s development as required (‘DOCUMENTATION’). The user can’t get lost even when “following their nose” deep into a section because this menu of the main sections is available from all pages in the website. This plan also serves as the SimSAGS website’s clickable site map (‘SITE MAP’) that can also be used as a navigation aid. The last menu item takes the user to the support forum (‘FORUM’) for additional information and support. Pictorial representations of information systems are more intuitive and therefore easier to use than lists of unrelated section and subsection names. This site map is also accessible from the main section menu available at the top of each page.
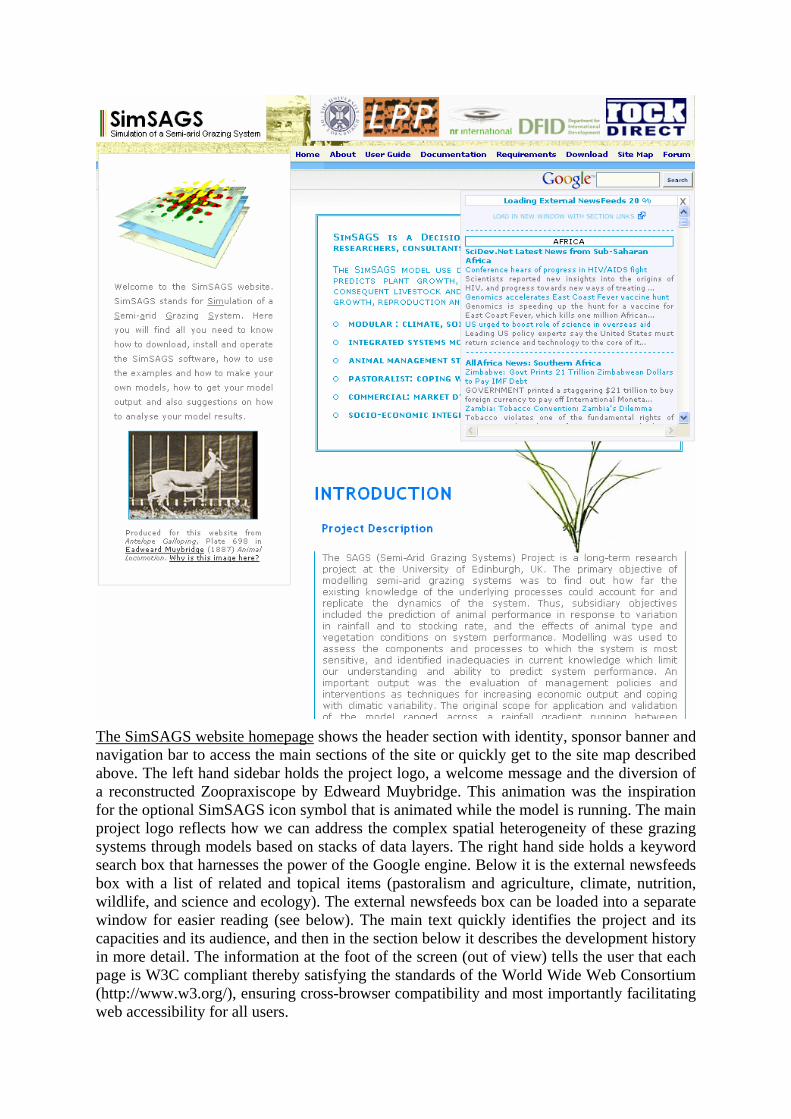
The SimSAGS website homepage shows the header section with identity, sponsor banner and navigation bar to access the main sections of the site or quickly get to the site map described above. The left hand sidebar holds the project logo, a welcome message and the diversion of a reconstructed Zoopraxiscope by Edweard Muybridge. This animation was the inspiration for the optional SimSAGS icon symbol that is animated while the model is running. The main project logo reflects how we can address the complex spatial heterogeneity of these grazing systems through models based on stacks of data layers. The right hand side holds a keyword search box that harnesses the power of the Google engine. Below it is the external newsfeeds box with a list of related and topical items (pastoralism and agriculture, climate, nutrition, wildlife, and science and ecology). The external newsfeeds box can be loaded into a separate window for easier reading (see below). The main text quickly identifies the project and its capacities and its audience, and then in the section below it describes the development history in more detail. The information at the foot of the screen (out of view) tells the user that each page is W3C compliant thereby satisfying the standards of the World Wide Web Consortium (http://www.w3.org/), ensuring cross-browser compatibility and most importantly facilitating web accessibility for all users.

The SimSAGS website homepage with collapsed newsfeed box. For narrow screens where the external newsfeeds box obscures the main text, the box can be collapsed using the x in the top right corner, and expanded again using the +, and with cookies switched on, browsers will remember this choice for the next visit. The grass shown is Panicum maximum, a species with which many farmers and researchers will be very familiar. Information about this common grass appears in a popup tooltip when the user places their mouse cursor over the image. A new species appears each time the user visits the website. The user is guided to more background information about the SimSAGS Decision Support System before being invited to navigate to the downloads section having first checked the hardware and operating system requirements for running the software.

The downloads section is password-protected and requires the user to register with the website administrator to obtain the necessary account information. The reasoning for this is that while we do not wish to inhibit distribution of the software, the benefits of knowing who has a copy include being able to follow up the user’s registration with an offer of support and to answer any initial queries. The download link invokes this login dialog box,
Providing the wrong information results in this message,
Having obtained their copy of the software, the user now needs to know how to get started using it. The user guide leads them through every aspect of using the SimSAGS Decision Support System, starting with the basics and leading them into more detailed sections on, e.g., parameterization of their model. The documentation section of the SimSAGS website holds detailed information of the scientific content of the model, the software technology and architecture, and a library of related literature. This will probably be the section that users return to discover more detail about the model over a long period following their initial visit during which they are more likely to make initial discoveries about the SimSAGS Decision Support System and even get as far as registering for a copy of the software. Someone who has already been working with their model may navigate straight to the parameters section, whereas the novice user will appreciate being led through the opening stages in constructing their model. One pathway available to them is the parameterization wizard, a sequence of pages that builds their model according to the options that they select. When they have reached the end of this sequence the user will be ready to fine tune their model with the information held in the detailed parameter section.

The SimSAGS website includes a detailed parameter section for the user’s model. Here the user wants to find out about the dynamic market element in the model where optimal sale conditions are predicted based on historical market fluctuations and long-term live weight gain trends for their livestock. The user’s model can be parameterized with their own data to tailor it to their own personal experience and conditions. The screen has the familiar SimSAGS website design including the main navigation menu, making it seamless with the other sections. Instructions on how to use this section of the user guide are provided at the top of the screen. The parameter list is navigated via the tree view on the left common to many graphical user interfaces because of its intuitive organisation of voluminous information categories. Clicking on the desired category brings the associated parameter information into the panel on the right, within which there are more links to supplementary information provided for parameters requiring lengthy explanations. The information at the foot of the screen is the same as all of the others on the website and tells the user that each page is W3C compliant thereby satisfying the standards of the World Wide Web Consortium (http://www.w3.org/), ensuring cross-browser compatibility and most importantly facilitating web accessibility for all users.

The SimSAGS website external newsfeeds page. Showing the index which is created automatically after the newsfeeds have loaded. The subject areas reflect the interests, countries and target countries of the potential users if the SimSAGS decision support system; pastoralism and agriculture, climate, nutrition, wildlife, and science and ecology. Newsfeeds of teaching courses, scholarships and jobs in the UK are included to promote training opportunities for overseas professionals.
Newsfeeds contribute to the user’s feeling that their online resource is “live” and up-to-date. Their reason for revisiting the website may be more to delve into the detailed documentation section, but they can also catch up on some news on the way. This approach is part of the growing Web 2.0 concept, a second phase “vision of the Web in which information is broken up into ‘microcontent’ units that can be distributed over dozens of domains.”

The SimSAGS website external newsfeeds page. This view is scrolled down from the previous view of the index. The relevance and value of including newsfeeds on the website are immediately obvious from the content for just this one day (19 Feb. 06) where headlines include “From Landless to Landowners - the Benefits of Land Reform” and (further down the page) “Drought-Affected Farmers And Pastoralists in Southeastern Ethiopia Face Crisis”. When the user is searching for answers that they cannot find on the main website, or they want to interact with and share their experiences with the user community, they have the SimSAGS user forum which they can easily access from the main site menu.

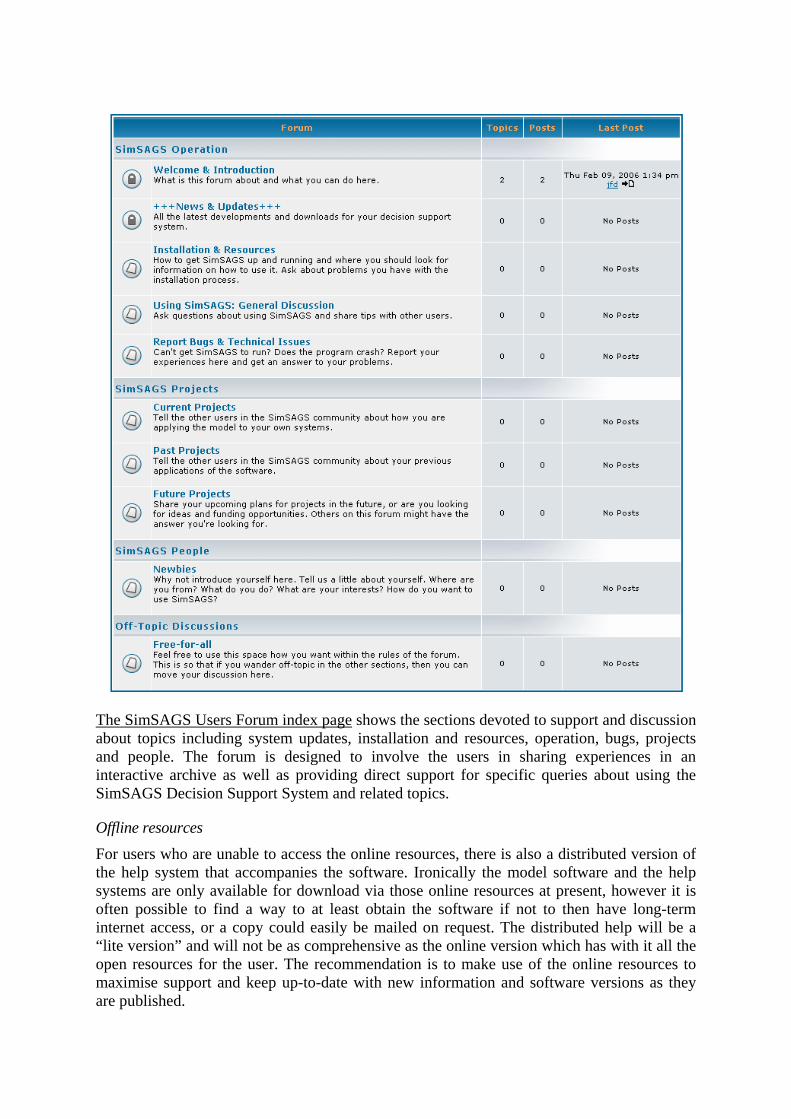
The SimSAGS Users Forum index page shows the sections devoted to support and discussion about topics including system updates, installation and resources, operation, bugs, projects and people. The forum is designed to involve the users in sharing experiences in an interactive archive as well as providing direct support for specific queries about using the SimSAGS Decision Support System and related topics.
Offline resources
For users who are unable to access the online resources, there is also a distributed version of the help system that accompanies the software. Ironically the model software and the help systems are only available for download via those online resources at present, however it is often possible to find a way to at least obtain the software if not to then have long-term internet access, or a copy could easily be mailed on request. The distributed help will be a “lite version” and will not be as comprehensive as the online version which has with it all the open resources for the user. The recommendation is to make use of the online resources to maximise support and keep up-to-date with new information and software versions as they are published.

Information for decision support Case Study: Kenya
This application is in participation with the Maasai herders based in Kitengela Wildlife Dispersal Area, to the south of Nairobi, Kenya. The model is being used to assess the impact of increased urbanisation on Maasai household livelihoods through livestock production and projected trade-off scenarios with transient wildlife populations (Derry 2004b). The model is well suited to being used to investigate the ecological consequences of land use change, reduction of grazing lands and habitat fragmentation. The capacity of the model is being augmented by development of a “Pastoral Household and Economic Welfare Simulator” that will dynamically relate household income and daily decisions to livestock health, forage and water resources. Livestock ownership remains a major source of wealth, although there is livelihood diversification in response to pressures that make livestock keeping more difficult, for example, supplemental income from wildlife. Most important is the incremental restriction by land use change of traditional coping mechanisms to survive drought. The model is being used to assess such trends through realistic scenario building.
Preliminary stages are attempting to simulate the seasonal movement of wildebeest from Nairobi National Park to the calving grounds in the south of the region. The diagram above shows that the model is successful in recreating this movement (wildebeest in green) through the increasingly fragmented dispersal area using seasonal spatial variation in rainfall and temperature alone to predict the temporal variations in plant growth that determine the animal movements. The next stage will refine the resolution of the grid for more accurate prediction scales. Disease transmission from wildebeest to cattle is a major issue in the region and hugely affects pastoral livelihoods as the cattle holders actively avoid the better grazing grounds occupied

during the wildlife migration. The SimSAGS Decision Support System is being applied to questions about pastoral livelihoods in the context of this mixing of livestock and wildlife, and disease spread. The diagram below shows a preliminary result of mostly the wildebeest (green) and goats (blue) mixing across the migration path of the wildlife and avoidance of the way south by cattle (orange).
Subsequent stages will introduce household scale decisions making for livestock management and herding practices. Case Study: Mongolia The welfares of subsistence smallstock farmers on the Eastern Steppe of Outer Mongolia are being threatened by conservation plans to protect the threatened IUCN listed Mongolian Gazelle. Development of infrastructure, particularly building of the Chinese Millennium Road and extension of the railway network through the Eastern Steppe, will reduce livestock grazing lands and transect the migration routes of the Mongolian Gazelle. The internal political climate in Mongolia is sensitive to external pressure and whole communities are due to be evicted. SimSAGS is providing information for an otherwise speculative debate biased by historical regional differences (Derry 2004c, 2004d). The diagram below shows simulation results for the region that predict the winter range of the Mongolian Gazelle is not compromised by livestock keeping activities. The blue contour lines show density of gazelle and they correspond closely with the historical estimates of the winter range. Livestock are not affecting gazelle foraging range at the current numbers. This is a valuable example of how the SimSAGS Decision Support System can mediate opposing arguments with rational evidence.
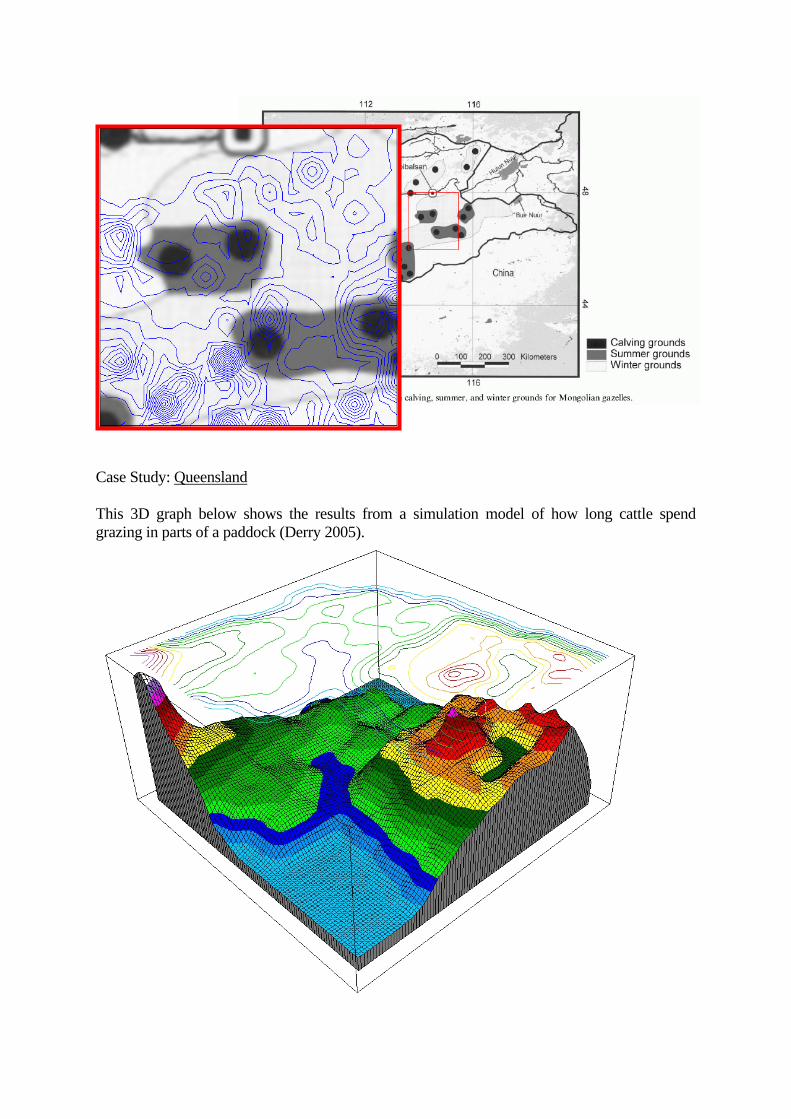
Case Study: Queensland This 3D graph below shows the results from a simulation model of how long cattle spend grazing in parts of a paddock (Derry 2005).

The higher the peaks, the longer the time spent. How long a cow spends in an area is a good estimate of how much they will eat there and so tells us how much the cattle impact the grass. A lot of time spent usually means very little grass remains and this can cause degradation by soil erosion particularly on slopes because there is no grass to stop rainfall washing the top soil away into streams, then rivers and eventually the sea. This is a big problem for farmers in drier countries, for example, Africa, India and parts of Australia, where there is typically not enough grass to cover the entire soil surface and the rain falls infrequently but so intensely that you get sheets of waters cascading over the soil surface. So, simulation results like these can help farmers to use their grazing land optimally by revealing areas susceptible to degradation. Conservation efforts can identify livestock keeping activities as causing damage to natural resources. The paddock in the graph is Virginia Park which is near Charters Towers in Queensland and that places it within the Burdekin Catchment which is estimated to discharge 22 million tons of sediment into the sea each year, mostly from the large number of paddocks that make up the Queensland cattle industry. Tragically a lot of this soil is carried by currents to settle on the nearby Great Barrier Reef where the coral and all the life forms dependent on the reef are harmed by the loss of sunlight which is unable to penetrate the muddy waters. So there is a strong link between cattle grazing and the survival of the Great Barrier Reef and these and other results are helping to work out how much damage is being done by cattle farming, and what can be done to improve that farming to benefit the cattle, the farmers and the Great Barrier Reef. Scientific results The project maintains its contributions towards new technologies made through academic research towards the application of new knowledge in the sustainable management of livestock.. In this phase the SimSAGS model has been used to investigate the consequences of drinking water location for animal intake and survival, and the interaction of resource heterogeneity with optimal foraging. The consequences of drinking water location
The location of animal drinking water has been identified as an important factor in determining patterns of rangeland use, and yet models that include it in this role are scarce. Ecosystem modelling efforts tend to concentrate on the prediction of animal distributions, as a simple function of distance from water. Although animal movement may be based on simple rules, complexity is evident in the pattern of rangeland response to animal impacts about water (otherwise known as the “piosphere”) and the consequences that this will have on animal utilisation of rangeland. Animal distribution models that do account for water location fail to account for piosphere dynamics, confining grazing impacts to within appropriate limits. Models that do simulate spatial impacts have not investigated the significance of the many other factors that may be contributing to the grazing pattern, including animal response, and assume a gradient of grazing intensity to be a sufficient predictor of piosphere generation and dynamics. On the other hand, the SimSAGS approach is wholly mechanistic. The following specific research questions and objectives were posed,
1. How does resource spatial heterogeneity become organised into a utilisation gradient?
a. What is the role of water dependency in dictating foraging range during the dry season?
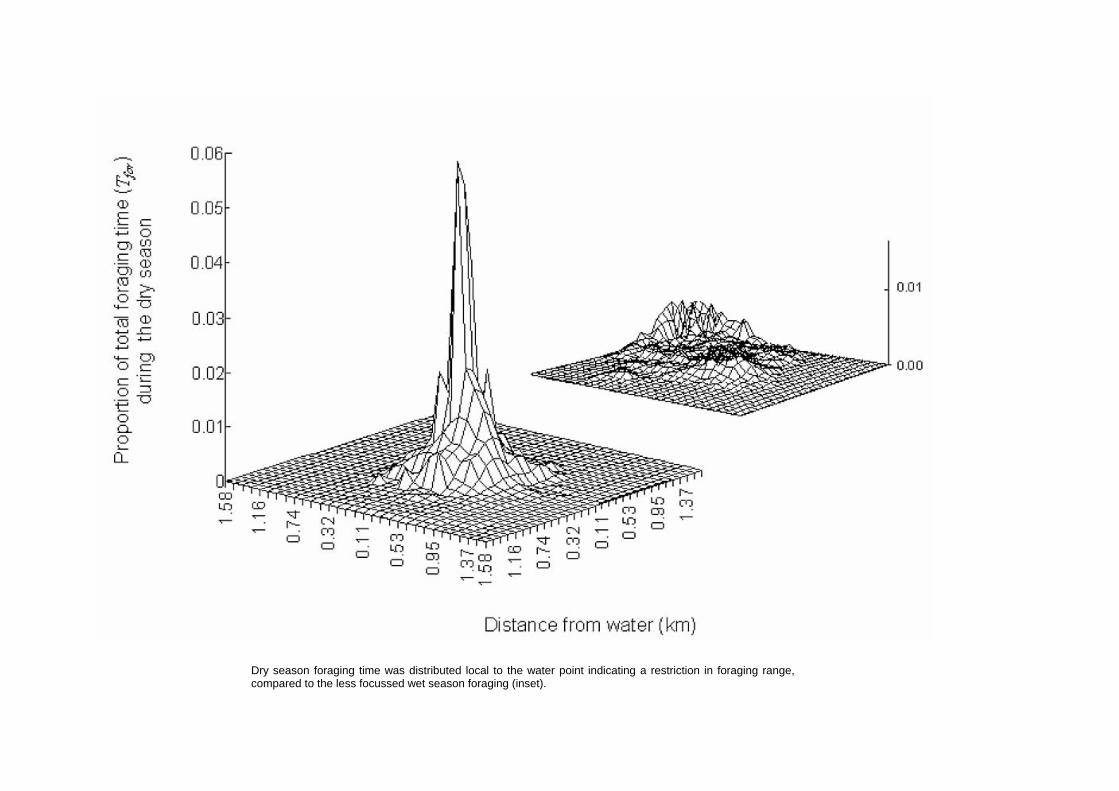
Dry season foraging time was distributed local to the water point indicating a restriction in foraging range, compared to the less focussed wet season foraging (inset).

b. Are the impacts distributed actively as a function of animal foraging patterns, or alternatively, are the impacts distributed passively in relation to landscape geometry? How can the processes that lead to the spatial distribution of impacts into a utilisation gradient be characterised?
2. Do utilisation gradients affect animal intake? If so, then are there consequences for animal reproduction and survival? Is there a subsequent effect on population size?
Additionally, initial investigations had to assess the model’s capacity for accurate prediction of this piosphere response. The sole modification made for dry season foraging behaviour was that animal populations must start each daily foraging bout at the water location (Derry 2004a). During the wet season with no water point their movements are entirely unconstrained assuming sufficient ephemeral water sources. The figure above shows the effect of introducing this rule on SimSAGS model predictions for spatial distributions of foraging by a herd of goats.
Corresponding results showed that the daily dry matter intake per kilogram of animal (W-1) was less during the dry season in the simulation with a water point than in the simulation without (means = 0.0070 kg/ha/W-1 and 0.0067 kg/ha/W-1, F1,38 = 4.77, P = 0.034). It is thus implied that the herd was unable to maintain levels of intake during the dry season because they were unable to expand their foraging range by visiting more cells than those visited in the simulation without a water point (means = 9.2 cells and 6.9 cells, F1,38 = 23.89, P < 0.001) nor by increasing their pathway to include more profitable areas (pooled means = 921.1 km/year, F1,38 = 0.76, P = 0.390). This is also indicated by the spatial distribution of dry season foraging time focussed about the water point (above), suggesting that areas were regrazed more often, reducing forage biomass and, therefore, intake. From this it is clear that SimSAGS is able to generate realistically different responses in seasonal animal foraging behaviour.
Next, are piospheres the result of animal foraging decisions? The reasons for piosphere generation needed testing. Animal water metabolism would be expected to determine watering frequency, which in turn would be expected to determine the opportunity for foraging between drinking events. Piosphere generation would be expected to be faster with increased use of a water point. Perkins (1991) had already identified the likely cause of piospheres as the decrease in available foraging area on nearing water. Lange's (1969) initial work had attempted a measure of herbivore intensity (tracks) and Georgiadis (1987) (and others, including Perkins 1991) provided further animal-based evidence (e.g., dung). However, it doesn't follow from this that spatial impacts are being distributed according to available foraging area mainly because these are only indicators of animal location and not forage utilisation. Stronger evidence came from measurements of affected vegetation and soil properties (e.g., Andrew and Lange 1986a, Andrew & Lange 1986b), but the link with animal foraging effort was not made. It is an important consideration for foraging science whether animals are actively determining the use of their environment. The alternative is that passive (external) processes dominate.
Consequently, the "active" model predicts a distribution of spatial impacts independent of available foraging area. The null hypothesis is a "neutral" model that predicts piospheres result from a proportional depletion of resources per unit area towards water and is defined by the (geometric) increase in available foraging area with the square of distance from water.

Model output of four variables against distance from water; mean forage biomass, mean potential energy intake rate (ER), mean percentage Process 4 (see text for details) and accumulated dry season time spent per goat. Feeding was assumed synchronous, so the time spent per individual animal was equal to the time for the herd. Conditions were parameterized for four simulations; the Basic Grid using local and global estimates of G*, then repeated for the Runway. Each simulation was run at three levels of travel cost multiplier, c=0.01, 1.0 and 10.0. Each simulation started with 29 days of dry season followed by 210 days of wet season. The second dry season started on day 240. Results are shown for c=1 on days 0, 250, 300 and 365.

A 1000 ha perennial grass paddock was represented by a square spatial grid comprising 900 cells (“Basic Grid”). A single water point was centrally located in the grid. To test the neutral model simulations were repeated for a linear paddock (“Runway”). The 30 cell linear paddock did not have the geometry of the square grid for a water point placed centrally in its length. Runway area was scaled to give the same area per cell as the grid, and animal number was reduced accordingly, to give the same Constant 0.14 LE/ha (livestock equivalents, LE. Illius et al. 1998) stocking rate of goats. The spatial scale that animals assess the net profitability of their forage resources (G*) was set to be either “Local” or “Global”. An option to test energetic costs was switched off (c=1). The results shown above show development of the utilization gradient (piosphere response) and include a measure of the source of constraint on intake; “% Process 4” is simply a measure of how much intake rate is slowed by the need to digest previously ingested food. The comparison between a point water source in the Basic Grid and a Runway serves to show that piospheres can be explained as a function of available foraging area alone. Where Basic Grid results showed development of the piosphere pattern, Runway simulation results showed no development of the gradient. There was a weak slope for the Runway using Local G* generated by utilisation that was initially close to water, but by the end of the simulation, utilisation is comparable with the Global G* Runway results where foraging activity was distributed uniformly so that all distances were utilized equally. These and corresponding results show that animals select what to eat (active matching), but their dry season defoliation impacts accumulate over time to mirror the space available (passive matching), so the "neutral" model of a passive distribution of foraging impacts is applicable to piosphere pattern generation.
0
0.1
0.2
0.3
0.4
0.5
0.6
0.7
0.8
0.9
1
0 0.5 1 1.5 2
Distance from water (km)
Pro
porti
onal
ER
ij
year 0year 1year 2year 3year 4year 5
Development of the piosphere pattern in potential energy intake rate (ER
ij, KJ/s) over the course of the first 5 years of simulation, recorded at midsummer peak vegetation biomass.
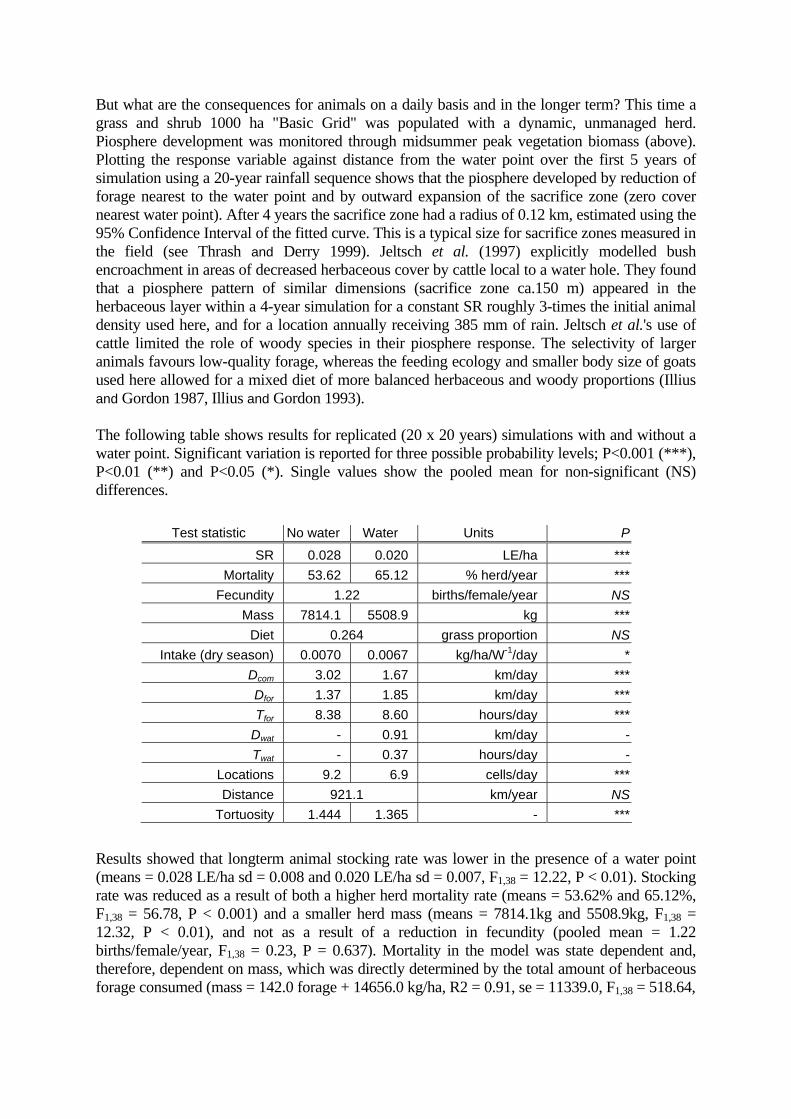
But what are the consequences for animals on a daily basis and in the longer term? This time a grass and shrub 1000 ha "Basic Grid" was populated with a dynamic, unmanaged herd. Piosphere development was monitored through midsummer peak vegetation biomass (above). Plotting the response variable against distance from the water point over the first 5 years of simulation using a 20-year rainfall sequence shows that the piosphere developed by reduction of forage nearest to the water point and by outward expansion of the sacrifice zone (zero cover nearest water point). After 4 years the sacrifice zone had a radius of 0.12 km, estimated using the 95% Confidence Interval of the fitted curve. This is a typical size for sacrifice zones measured in the field (see Thrash and Derry 1999). Jeltsch et al. (1997) explicitly modelled bush encroachment in areas of decreased herbaceous cover by cattle local to a water hole. They found that a piosphere pattern of similar dimensions (sacrifice zone ca.150 m) appeared in the herbaceous layer within a 4-year simulation for a constant SR roughly 3-times the initial animal density used here, and for a location annually receiving 385 mm of rain. Jeltsch et al.'s use of cattle limited the role of woody species in their piosphere response. The selectivity of larger animals favours low-quality forage, whereas the feeding ecology and smaller body size of goats used here allowed for a mixed diet of more balanced herbaceous and woody proportions (Illius and Gordon 1987, Illius and Gordon 1993). The following table shows results for replicated (20 x 20 years) simulations with and without a water point. Significant variation is reported for three possible probability levels; P<0.001 (***), P<0.01 (**) and P<0.05 (*). Single values show the pooled mean for non-significant (NS) differences.
Test statistic No water Water Units P
SR 0.028 0.020 LE/ha *** Mortality 53.62 65.12 % herd/year ***
Fecundity 1.22 births/female/year NS Mass 7814.1 5508.9 kg ***
Diet 0.264 grass proportion NS Intake (dry season) 0.0070 0.0067 kg/ha/W-1/day *
Dcom 3.02 1.67 km/day *** Dfor 1.37 1.85 km/day *** Tfor 8.38 8.60 hours/day ***
Dwat - 0.91 km/day - Twat - 0.37 hours/day -
Locations 9.2 6.9 cells/day *** Distance 921.1 km/year NS
Tortuosity 1.444 1.365 - ***
Results showed that longterm animal stocking rate was lower in the presence of a water point (means = 0.028 LE/ha sd = 0.008 and 0.020 LE/ha sd = 0.007, F1,38 = 12.22, P < 0.01). Stocking rate was reduced as a result of both a higher herd mortality rate (means = 53.62% and 65.12%, F1,38 = 56.78, P < 0.001) and a smaller herd mass (means = 7814.1kg and 5508.9kg, F1,38 = 12.32, P < 0.01), and not as a result of a reduction in fecundity (pooled mean = 1.22 births/female/year, F1,38 = 0.23, P = 0.637). Mortality in the model was state dependent and, therefore, dependent on mass, which was directly determined by the total amount of herbaceous forage consumed (mass = 142.0 forage + 14656.0 kg/ha, R2 = 0.91, se = 11339.0, F1,38 = 518.64,

Deviation from IFD predictions (dotted line) shown by Generalised Linear Models (GLMs) of proportional resource utilisation rate against proportional mean resource delivery rate (solid line) for simulated dry and wet seasons with a central water point a) absent and b) present.

P < 0.001). Thus, in the simulation without a water point, 34% more grass was consumed than in the simulation with (F1,98 = 5.91, P = 0.017), and 49% more shrub (F1,98 = 16.95, P < 0.001). However, this was not sufficient to significantly affect the proportions of these components, with the overall diet being consistently dominated by woody shrub (pooled means = 73.6%, F1,38 = 0.07, P = 0.787). To understand the mechanisms that lead to the compromise in intake we can compare the herd’s foraging efficiency (intake yield compared to available forage) with water point present and then absent (above), without the water point animals were able to distribute their foraging activity in proportion with the spatial distribution of forage. They matched the Ideal Free Distribution (IFD, Fretwell and Lucas 1970) which predicts that herbivore densities should reflect resource distribution in a heterogeneous environment, assuming that animals have perfect (“ideal”) knowledge of resource profitability and are “free” to move between resource sites. However, comparing the figures above it can be seen that introducing a water point caused undermatching of the IFD by compromising energy intake during the dry season. Therefore, animals were unable to match their intake to the available resources because of the spatial constraints on foraging that water dependency and the need to return to drink water impose on how far they can travel from water in order to access more abundant resources at the outer limits of the utilization gradient.
Fitted planes from multiple regressions showing the switching of primary influences on bite rate from bite density in the dry season (shaded) to bite size in the wet season. Linear transformation of the line of intersection for the two planes reveals the relationship between bite size and bite density that produces optimal bite rates under constant conditions (dashed line).

But what is constraining intake within the limits of the piosphere? Multiple regression analysis showed that bite density accounted for 90.1% of the variation in bite rate during the dry season in the water point simulation, with bite size accounting for a further 4.6% of the variation (rate = 0.331 + 9.74x10⁻⁴ density - 2.78x10⁻⁴ size, R2 = 0.95, se = 0.0041, F2,17 = 171.00, P < 0.001). During the wet season, bite size accounted for 91.3% of the variation in bite rate, and bite density accounted for 1.4% of the variation (rate = 0.951 - 2.23x10⁻³ size - 2.89x10⁻⁴ density, R2 = 0.93, se = 0.020, F2,17 = 120.78, P < 0.001). The corresponding simulation without a water point showed that bite rate was determined entirely by bite size during the wet season (rate = 0.8005 - 0.001733 size, R2 = 0.90, se = 0.026, F1,18 = 173.68, P < 0.001). Bite density accounted for 83.2% and bite size accounted for 6.2% of the variation in bite rate during the dry season (rate = 0.450 + 9.82x10⁻³ density - 8.02x10⁻⁴ size, R2 = 0.89, se = 0.010, F2,17 = 76.58, P < 0.001). The switching between foraging processes across seasons is a function of standing crop, and ultimately plant growth. Additionally, bite density is sensitive to defoliation intensity because selective foragers do not uniformly utilize their forage resources. At the scale of the individual bite, the reason for this is that animals select the largest bites to eat first when distinct bites are on offer (Illius et al. 2002, Derry 2004a). The multiple regressions for the water point simulation describe two planes (above) which intersect along a line that can be described by vectors. This line of intersection is a hypothetical optimum for bite rate under constant conditions (that would otherwise vary between seasons) for the determinants of bite rate. Linear transformation of the intersection upon rate = 0 gives size = 317.623 - 0.647 density, the relationship between bite density and bite size that produces those optimal bite rates. These findings reinforce the importance of dry season forage. It determines the rate of utilisation of body fat reserves generated during the wet season and the subsequent rates of survival and reproduction in livestock and in wild animal populations. These are tangible academic findings that can be delivered to the real contexts of resource-poor farmers through decision support. Andrew, M. and Lange, R.T. (1986a) Development of a new piosphere in arid chenopod shrubland
grazed by sheep. 1. Changes to the soil surface. Australian Journal of Ecology, 11, 395-409.
Andrew, M. and Lange, R.T. (1986b) Development of a new piosphere in arid chenopod shrubland grazed by sheep. 2. Changes to the vegetation. Australian Journal of Ecology, 11, 411-424.
Derry, J.F. (1998) Modelling ecological interaction despite object-oriented modularity. Ecological Modelling, 107, 145-158.
Derry, J.F. (2004a) Piospheres in semi-arid rangeland: consequences of spatially constrained plant-herbivore interactions. PhD thesis, University of Edinburgh. Available from http://hdl.handle.net/1842/600
Derry, J.F. (2004b) Contribution to ILRI Annual Report of the 'Belgian Project': Modelling Component. University of Edinburgh.
Derry, J.F. (2004c) Presentation of LPP Project R6984 Model to 2004 Symposium/Workshop on Conservation and Management of Mongolian Gazelles. University of Edinburgh.
Derry, J.F. (2004d) Report on attendance of 2004 Symposium/Workshop on Conservation and Management of Mongolian Gazelles. University of Edinburgh.
Derry, J.F. (2005) Report on modelling exercises carried out for CSIRO (Townsville). University of Edinburgh.
Fretwell, S.D. and Lucas, H.L., Jr. (1970) On territorial behaviour and other factors influencing habitat distribution in birds. I. Theoretical development. Acta Biotheoretica, 19, 16-36.

Georgiadis, N.J. (1987) Responses of savanna grasslands to extreme use by pastoralist livestock. PhD dissertation, Syracuse University, New York.
Gordon, I.J. and Illius, A.W. (1988) Incisor arcade structure and diet selection in ruminants. Functional Ecology, 2, 15-22.
Gordon, I.J. & Illius, A.W. (1996) The nutritional ecology of African ruminants: a reinterpretation. Journal of Animal Ecology, 65, 18-28.
Illius, A.W., Duncan, P., Richard, C. and Mesochina, P. (2002) Mechanisms of functional response and resource exploitation in browsing roe deer. Journal of Animal Ecology, 71, 723-734.
Illius, A.W., Derry, J.F. and Gordon, I.J. (1998) Evaluation of strategies for tackling climatic variation in semi-arid grazing systems. Agricultural Systems, 57, 381-398.
Illius, A.W. and Gordon, I.J. (1987) The allometry of food intake in grazing ruminants. Journal of Animal Ecology, 56, 989-999.
Illius, A.W. and Gordon, I.J. (1991) Prediction of intake and digestion in ruminants by a model of rumen kinetics integrating animal size and plant characteristics. Journal of Agricultural Science, 116, 145-157.
Illius, A.W. and Gordon, I.J. (1992) Modelling the nutritional ecology of ungulate herbivores: evolution of body size and competitive interactions. Oecologia, 89, 428-434.
Illius, A.W. and Gordon, I.J. (1993) Diet selection in mammalian herbivores: Constraints and tactics. In Diet Selection: An Interdisciplinary Approach to Foraging Behaviour. Hughes, R.N. (ed.). Blackwell Scientific Publications.
Illius, A.W. and Gordon, I.J. (1999) Scaling up from functional response to numerical response in vertebrate herbivores. In Herbivores: Between Plants and Predators. Olff, H., Brown, V.K. & Drent, R.H. (eds.). Blackwell Science.
Jeltsch, F., Milton, S.J., Dean, W.R.J. and Van Rooyen, N. (1997) Simulated pattern formation around artificial waterholes in the semi-arid Kalahari. Journal of Vegetation Science, 8, 177-188.
Lange, R.T. (1969) The piosphere, sheep track and dung patterns. Journal of Range Management, 22, 396-400.
Perkins, J.S. (1991) The impact of borehole dependent cattle grazing on the environment and society of the eastern Kalahari sandveld, Central District, Botswana. Pages 357. Unpublished PhD thesis. University of Sheffield, UK.
Thrash, I. and Derry, J.F. (1999) The nature and modelling of piospheres: a review. Koedoe, 42, 73-94. Pretoria. ISSN 0075-6458.
Contribution of Outputs Programme Purpose (= project goal): Benefits for discreet groups of landed and landless livestock keepers generated by the application of new knowledge on the sustainable management of livestock in semi-arid, agro-pastoral, forest-agriculture, high potential and peri-urban production systems within an enabling environment. Include information on how the outputs will contribute towards DFID’s developmental goals and the identified promotion pathways to target institutions and beneficiaries. What follow up action/research is necessary to promote the findings of the work to achieve their development benefit? This should include a list of publications, plans for further dissemination, as appropriate. For projects aimed at developing a device, material or process specify: This phase of the project has been all about maximizing the benefits to the target institutions and beneficiaries of the work accumulated throughout the SimSAGS project’s history. The element sure to have the largest impact is undoubtedly going to be the help system in conjunction with the online resources. It simply means that one does not have to be an expert to parameterized and apply the model. Now with the guidance of the help system, the extensive information accessible on the website plus the support network in place via the user forum and their mailing list, anyone who can download and install the software can be their own expert. There is nothing in the hardware requirements or operation of the software to suppose that the SimSAGS Decision Support System cannot be made accessible to poor livestock producers. In fact, provision has already been made for community representatives in Kitengela to become familiar with the model, use it towards their own investigations regarding Maasai livelihood issues, and provide a direct avenue to the decision support system for the rest of their community. The Maasai consider education important enough to dedicate a large part of household income to sending their children to school and higher education. It is likely that such people are more than capable of understanding the concepts underlying the model that is after all attempting to capture the behaviour of their natural environment. Programming activities during this phase have extended important areas of the SimSAGS model making it a flexible and intelligent tool, providing the suite of parameter categories and simulation components that the user would hope to find when attempting to build their models for their own specific contexts. Research using SimSAGS model continues to contribute to our understanding of grazing systems and the ways that animals find their food. Temporal heterogeneity is how food resources vary in time and spatial heterogeneity is how they vary in space. In dry places like eastern Africa the way that rain is distributed around savanna landscapes by flowing on the soil’s surface dictates when and where plants do and don’t grow, and so where the animals have to go to eat. The ability to predict animal movements is vital when, say, helping the Maasai to feed their cattle. Conceptual advances are equally important. It is now possible to resolve the spatial extent of a system into regions that do not influence animal population dynamics and regions that do strongly influence animal population dynamics. The SimSAGS team has been at the forefront of this progress and SimSAGS model has played a central role to ask questions of animal survival during the dry season.

a. What further market studies need to be done? The online resources have been designed to be interactive, there are all the mechanisms required for the user to ask questions and request support. Monitoring the use of the web site and the use of the user forum and the number of registrations (needed to access the download area and obtain a copy of the software) will be the best way to monitor uptake. Dialogs can be opened as soon as the user makes contact and direct requests for feedback can be made as required. b. How the outputs will be made available to intended users? An important aspect of dissemination continues to be the few projects with which the SimSAGS development team has some involvement. Resource-poor farmers in Kenya, Mongolia and Australia are all benefiting from including SimSAGS Decision Support System as an analytical element in the assessment of their circumstances. It is common to these projects that the activities of resource-poor farmers are attracting attention for what is being claimed is conflictive with conservation programs. SimSAGS is being used to either test these assertions or help assess the important factors at play and therefore clarify what is happening in those systems and indeed clarify the role of the resource-poor farmer. Publicity also comes from another source: there has been recent recognition of SimSAGS through official entry into The Register of Ecological Models (REM) the definitive meta-database for existing mathematical models in ecology. (http://eco.wiz.uni-kassel.de/ecobas.html) for which there is an element of peer review for acceptance into the database. c. What further stages will be needed to develop, test and establish manufacture of a product? It is important to maintain the online resources for the SimSAGS Decision Support System now that they are up and running. Dissemination visits could continue given the funding; this seems to be no doubt that there is a call for using SimSAGS. d. How and by whom, will the further stages be carried out and paid for? Undefined at present.
Related Documents


