1 APPENDICES TO “CAPITALISM REASSESSED” TABLE OF CONTENTS 2-1: Etymology of “Capitalism” 2-2: Measuring Modern Capitalism and Political Freedom 3-1: Measurement of Early Capitalism 3-2: Data Sources for Table 3-2 3-3: A Short Note on the Brenner Thesis 3-4: Democracy/Autocracy and Origins of Capitalism 7-1: Statistics from the Principal Component Analysis 7-2: Underlying Data for the Determinants of Happiness Bibliography for Appendices APPENDIX TABLES A-1: Measurement of Legally Protected and Substantial Private Ownership of the Means of Production A-2: Measurement of Competitive Markets A-3: Measurement of Economic Freedom A-4: The Three Elements of Capitalism Combined A-5: Measurement of Political Freedom A-6: Measurements of Capitalism and Political Freedom in 2000 A-7: Democracy/Autocracy Measures for Early Capitalist Countries and “Capitalist Threshold Year” (CTY) A-8: Loadings of Principal Components A-9: Component Scores of Possible Determinants for Happiness for Each Country

Welcome message from author
This document is posted to help you gain knowledge. Please leave a comment to let me know what you think about it! Share it to your friends and learn new things together.
Transcript

1
APPENDICES TO “CAPITALISM REASSESSED”
TABLE OF CONTENTS 2-1: Etymology of “Capitalism”
2-2: Measuring Modern Capitalism and Political Freedom
3-1: Measurement of Early Capitalism
3-2: Data Sources for Table 3-2
3-3: A Short Note on the Brenner Thesis
3-4: Democracy/Autocracy and Origins of Capitalism
7-1: Statistics from the Principal Component Analysis
7-2: Underlying Data for the Determinants of Happiness
Bibliography for Appendices
APPENDIX TABLES
A-1: Measurement of Legally Protected and Substantial Private Ownership of the Means of
Production
A-2: Measurement of Competitive Markets
A-3: Measurement of Economic Freedom
A-4: The Three Elements of Capitalism Combined
A-5: Measurement of Political Freedom
A-6: Measurements of Capitalism and Political Freedom in 2000
A-7: Democracy/Autocracy Measures for Early Capitalist Countries and “Capitalist
Threshold Year” (CTY)
A-8: Loadings of Principal Components
A-9: Component Scores of Possible Determinants for Happiness for Each Country

2
APPENDIX 2-1: ETYMOLOGY OF “CAPITALISM” “Capitalism,” of course, is derived from “capital.” The latter word comes from the Latin
words capitalis, capitale, which in Western Europe in the Middle Ages designated, among other
things, “property” and “wealth.” (Berger, 1986: pp. 17-18).
In classical Latin, however, “property” was designated by a different word, namely caput.
The Thesaurus Linguae Latinae (1906-12, vol. 3: 43-34) provides examples of this usage: for in-
stance, around 30 B.C., Horace employed it to indicate “property” in his Satire 1 (Book 2, line
14). Several decades after Horace, Livy also employed the word with roughly the same meaning.
A common derivation linking “capital” to “head of cattle” (hence wealth) appears to be incorrect.
Berger also claims the word “capitalism,” designating owners of capital, seems to have
first appeared in the seventeenth century, although other scholars place the origins of this word a
century later. For instance, the Oxford English Dictionary claims that the first use of the English
word “capitalism” can be found in William Makepeace Thackeray’s novel The Newcomes (1855,
vol. 2: p. 45), where it seemed to refer to money-making activities and not an economic system.
The Centre national de la recherche scientifique (1977, vol. 5: 143) cites the first usage of the
word “capitalisme” in French in 1753; but at that time the word seemed also to refer to an eco-
nomic activity, not to an economic system. According to Passow (1927: 2) the first German us-
age of “Kapitalismus” was in Nazional-Oekonomie (1805) by Friedrich Julius Heinrich von So-
den, who referred to “capitalistic production,” again in the sense of an activity, rather than an
economic system.
For most of the nineteenth century scholars seldom employed the word “capitalism,” and
even Karl Marx used the term infrequently, although he sometimes spoke of “capitalist produc-
tion”. By the latter part of the nineteenth century the word was, however, widely used in the

3
popular press, usually for polemical purposes; and with the publication of Werner Sombart’s Der
moderne Kapitalismus in 1902, other scholars began to employ the word with increasing fre-
quency. Passow (1927) records many scores of different and conflicting meanings for “capital-
ism” by the 1920s, few of which lead to easy quantification.
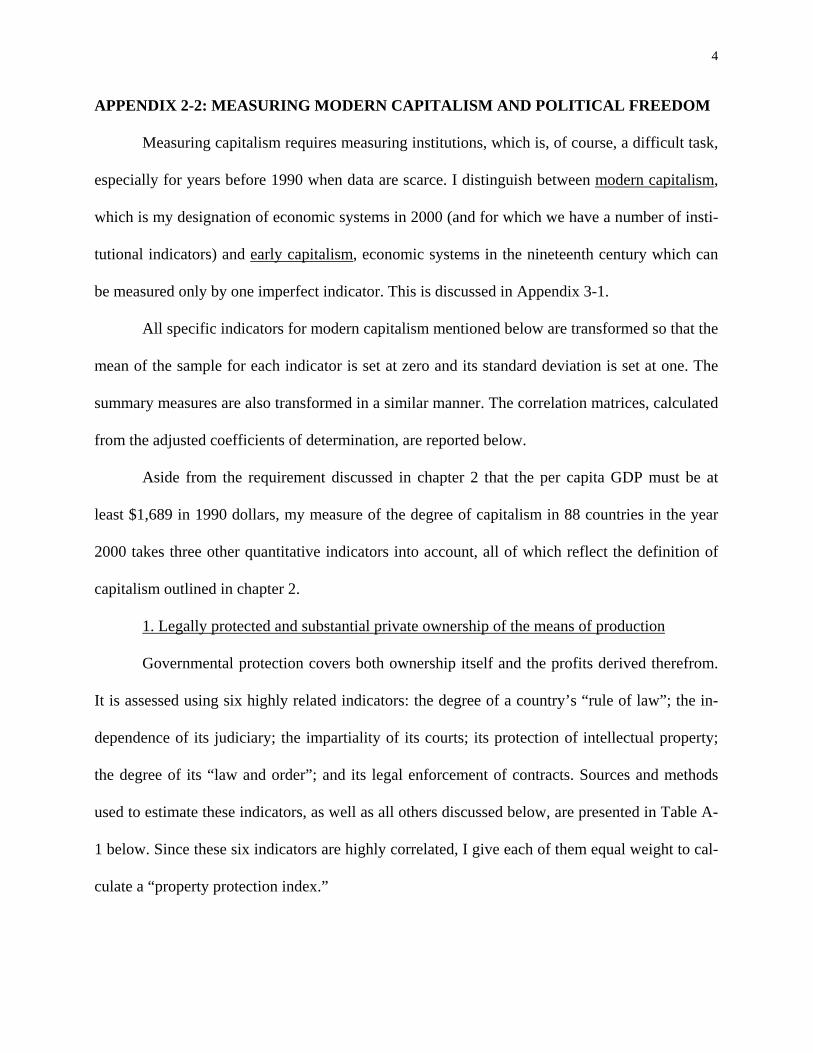
4
APPENDIX 2-2: MEASURING MODERN CAPITALISM AND POLITICAL FREEDOM Measuring capitalism requires measuring institutions, which is, of course, a difficult task,
especially for years before 1990 when data are scarce. I distinguish between modern capitalism,
which is my designation of economic systems in 2000 (and for which we have a number of insti-
tutional indicators) and early capitalism, economic systems in the nineteenth century which can
be measured only by one imperfect indicator. This is discussed in Appendix 3-1.
All specific indicators for modern capitalism mentioned below are transformed so that the
mean of the sample for each indicator is set at zero and its standard deviation is set at one. The
summary measures are also transformed in a similar manner. The correlation matrices, calculated
from the adjusted coefficients of determination, are reported below.
Aside from the requirement discussed in chapter 2 that the per capita GDP must be at
least $1,689 in 1990 dollars, my measure of the degree of capitalism in 88 countries in the year
2000 takes three other quantitative indicators into account, all of which reflect the definition of
capitalism outlined in chapter 2.
1. Legally protected and substantial private ownership of the means of production
Governmental protection covers both ownership itself and the profits derived therefrom.
It is assessed using six highly related indicators: the degree of a country’s “rule of law”; the in-
dependence of its judiciary; the impartiality of its courts; its protection of intellectual property;
the degree of its “law and order”; and its legal enforcement of contracts. Sources and methods
used to estimate these indicators, as well as all others discussed below, are presented in Table A-
1 below. Since these six indicators are highly correlated, I give each of them equal weight to cal-
culate a “property protection index.”
5
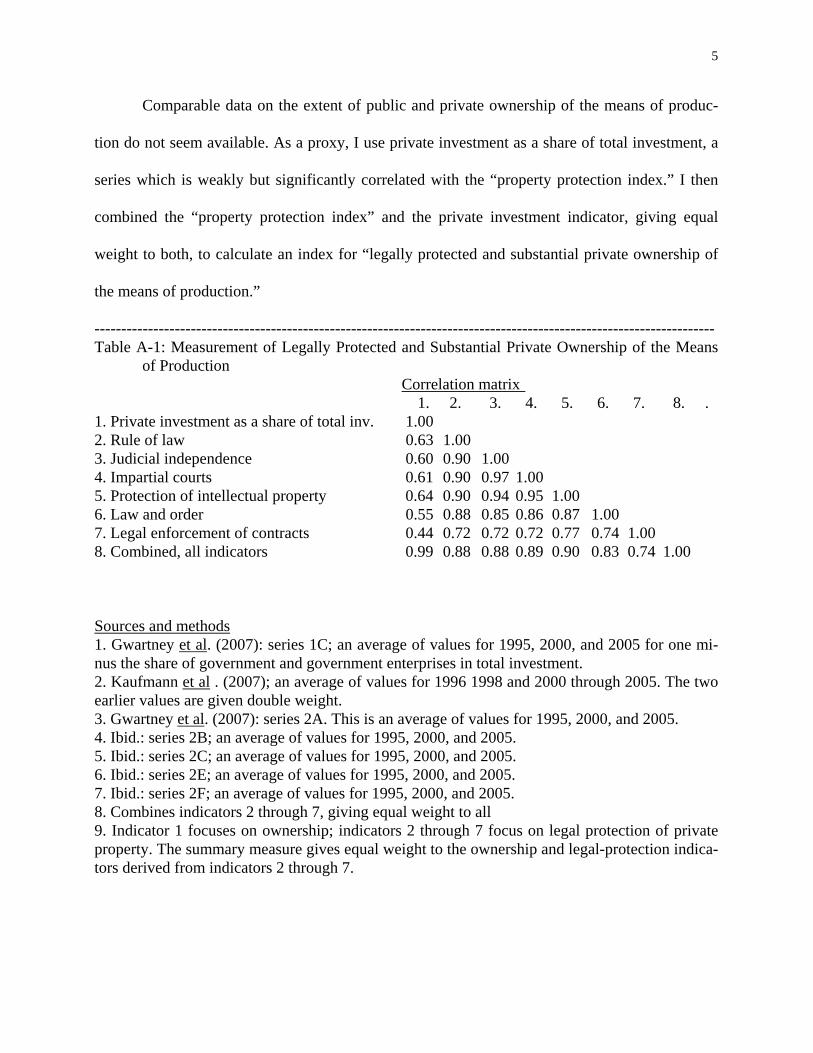
Comparable data on the extent of public and private ownership of the means of produc-
tion do not seem available. As a proxy, I use private investment as a share of total investment, a
series which is weakly but significantly correlated with the “property protection index.” I then
combined the “property protection index” and the private investment indicator, giving equal
weight to both, to calculate an index for “legally protected and substantial private ownership of
the means of production.”
-------------------------------------------------------------------------------------------------------------------- Table A-1: Measurement of Legally Protected and Substantial Private Ownership of the Means
of Production Correlation matrix 1. 2. 3. 4. 5. 6. 7. 8. . 1. Private investment as a share of total inv. 1.00 2. Rule of law 0.63 1.00 3. Judicial independence 0.60 0.90 1.00 4. Impartial courts 0.61 0.90 0.97 1.00 5. Protection of intellectual property 0.64 0.90 0.94 0.95 1.00 6. Law and order 0.55 0.88 0.85 0.86 0.87 1.00 7. Legal enforcement of contracts 0.44 0.72 0.72 0.72 0.77 0.74 1.00 8. Combined, all indicators 0.99 0.88 0.88 0.89 0.90 0.83 0.74 1.00 Sources and methods 1. Gwartney et al. (2007): series 1C; an average of values for 1995, 2000, and 2005 for one mi-nus the share of government and government enterprises in total investment. 2. Kaufmann et al . (2007); an average of values for 1996 1998 and 2000 through 2005. The two earlier values are given double weight. 3. Gwartney et al. (2007): series 2A. This is an average of values for 1995, 2000, and 2005. 4. Ibid.: series 2B; an average of values for 1995, 2000, and 2005. 5. Ibid.: series 2C; an average of values for 1995, 2000, and 2005. 6. Ibid.: series 2E; an average of values for 1995, 2000, and 2005. 7. Ibid.: series 2F; an average of values for 1995, 2000, and 2005. 8. Combines indicators 2 through 7, giving equal weight to all 9. Indicator 1 focuses on ownership; indicators 2 through 7 focus on legal protection of private property. The summary measure gives equal weight to the ownership and legal-protection indica-tors derived from indicators 2 through 7.

6
2. Competitive markets
“Competitive” means that buyers and sellers in the markets for factors of production and
for goods and services must have free entry and exit, and must be able to compete against each
other. This implies that an economy of monopolies is not capitalistic, nor is one in which barriers
to market entry or exit are significant.
The indicators used to estimate competition are: a “business freedom” index (incorporat-
ing information on procedures, days required and fees to the government for starting or closing a
business); the extent of price controls; competition in domestic banking; and whether collective
bargaining is carried out at the central level or locally. Although a direct measure of monopoly
would be useful to include in this index of competition, comparable data are not available. The
relationships of these four indicators are shown in Appendix Table A-2.
Table A-2: Measurement of Competitive Markets
Correlation matrix
1 2 3 4 5 1. Business freedom 1.00 2. Price controls 0.67 1.00 3. Competition in domestic banking 0.42 0.57 1.00 4. Collective bargaining at central level 0.20 0.42 0.29 1.00 5. Combined: all indicators 0.81 0.81 0.82 0.62 1.00 Sources and methods 1. Heritage Foundation (2008); average for 1995, 2000, and 2005. See also Beach and Kane (2008). 2. Gwartney et al. (2007): series 5Ci. an average of values for 1995, 2000, and 2005. 3. Gwartney et al. (2007): series 5Aii, an average of values for 1995, 2000, and 2005. 4. Gwartney et al. (2007): series 5Biii, an average of values for 1995, 2000, and 2005. 5. An average with all indicators given equal weight.

7
3. Economic Freedom
This concept refers to governmental laissez faire, or the degree to which the government
does not interfere in the workings of the economy. This implies that aside from providing goods
and services to the economy that private individuals cannot supply (such as infrastructure or pro-
tection of property) and enforcing anti-trust regulations, quality standards, and safety regulations,
governments do not take other microeconomic measures influencing market activities. If a gov-
ernment regulates some prices or quantities, limits entry into occupations by licenses, provides
social security payments and redistributes income, drafts soldiers into the armed forces (rather
than setting military pay high enough to encourage voluntary enlistments), or make other sub-
stantial interventions into the economy, it must be deemed to have moved away from a capitalist
economic system.
My measure of economic freedom includes five indicators: trade freedom, investment
freedom, financial freedom, labor freedom, and lack of interest rate regulations. Their interrela-
tions are shown in Appendix Table A-3.
-------------------------------------------------------------------------------------------------------------------- Table A-3: Measurement of Economic Freedom Correlation matrix 1 2 3 4 5 6 1. Lack of interest rate regulation 1.00 2. Trade freedom 0.63 1.00 3. Investment freedom 0.43 0.65 1.00 4. Financial freedom 0.54 0.73 0.84 1.00 5. Labor freedom 0.58 0.47 0.08 0.46 1.00 6. Combined, all indicators 0.80 0.87 0.83 0.89 0.73 1.00 Sources and methods: 1. Gwartney et al. (2007): series 5Aiv; average of values for 1995, 2000, and 2005. 2. Heritage Foundation (2008); average for 1995, 2000, and 2005. See also Beach and Kane (2008). 3. Heritage Foundation (2008); average for 1995, 2000, and 2005. See also Beach and Kane (2008).

8
4. Heritage Foundation (2008); average for 1995, 2000, and 2005. See also Beach and Kane (2008). 5. Heritage Foundation (2008); average for 1995, 2000, and 2005. See also Beach and Kane (2008). 6. An average with all indicators given equal weight. -------------------------------------------------------------------------------------------------------------------- 4. The Overall Index of Capitalism Table A-4 presents the three elements of capitalism and also the combined total, where
each of the three elements is given equal weight.
-------------------------------------------------------------------------------------------------------------------- Table A-4: The Three Elements of Capitalism Combined
Correlation matrix
1 2 3 4 1. Property protection, and rule of law 1.00 2. Competitive markets 0.42 1.00 3. Economic freedom 0.70 0.67 1.00 4. Degree of capitalism 0.92 0.59 0.92 1.00 Sources and methods Data for (1), (2), and (3) come from Tables A-1, A-2, and A-3. For calculating the “degree of capitalism,” all three elements above are given equal weights. ---------------------------------------------------------------------------------------------------------------------
9
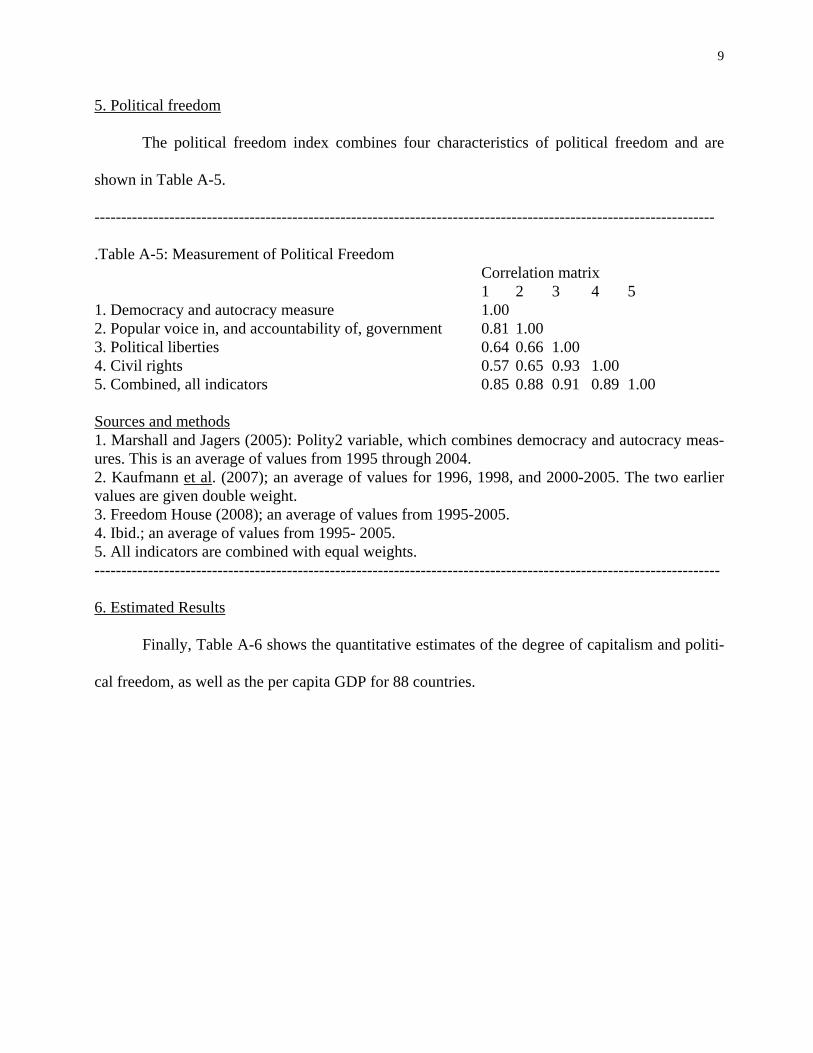
5. Political freedom The political freedom index combines four characteristics of political freedom and are
shown in Table A-5.
--------------------------------------------------------------------------------------------------------------------
.Table A-5: Measurement of Political Freedom Correlation matrix
1 2 3 4 5 1. Democracy and autocracy measure 1.00 2. Popular voice in, and accountability of, government 0.81 1.00 3. Political liberties 0.64 0.66 1.00 4. Civil rights 0.57 0.65 0.93 1.00 5. Combined, all indicators 0.85 0.88 0.91 0.89 1.00 Sources and methods 1. Marshall and Jagers (2005): Polity2 variable, which combines democracy and autocracy meas-ures. This is an average of values from 1995 through 2004. 2. Kaufmann et al. (2007); an average of values for 1996, 1998, and 2000-2005. The two earlier values are given double weight. 3. Freedom House (2008); an average of values from 1995-2005. 4. Ibid.; an average of values from 1995- 2005. 5. All indicators are combined with equal weights. --------------------------------------------------------------------------------------------------------------------- 6. Estimated Results Finally, Table A-6 shows the quantitative estimates of the degree of capitalism and politi-
cal freedom, as well as the per capita GDP for 88 countries.

10
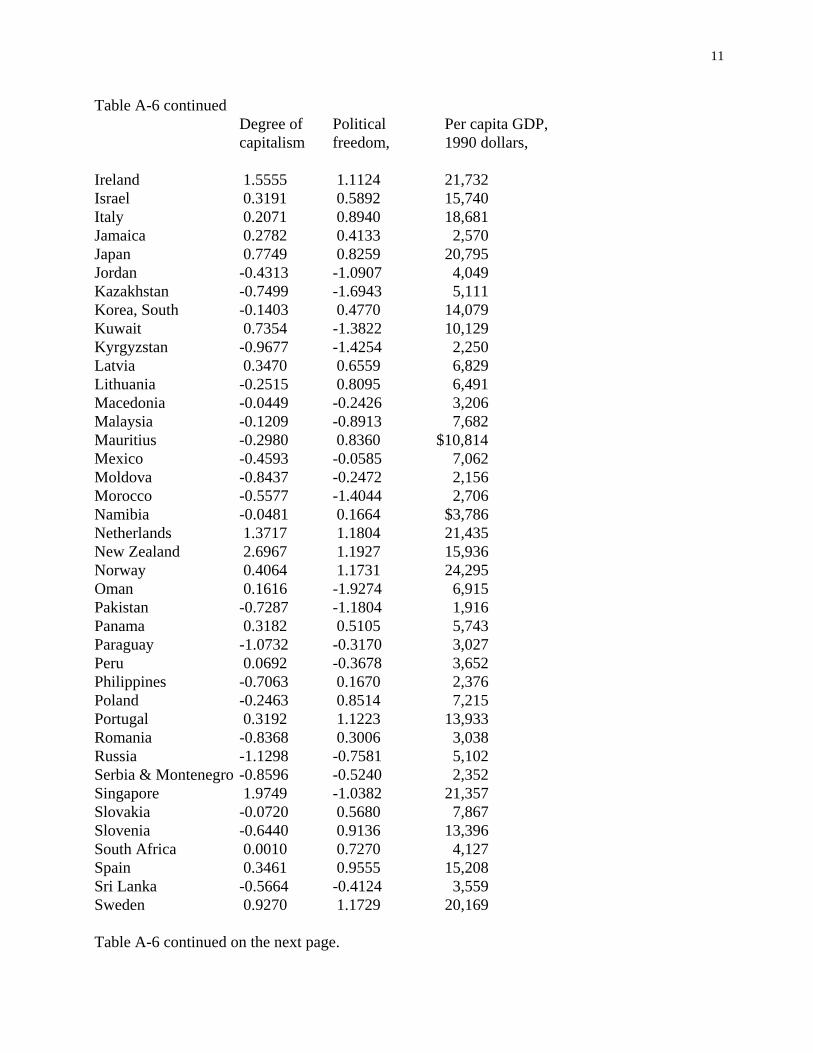
Appendix Table A-6: Measurements of Capitalism and Political Freedom in 2000 Degree of Political Per capita GDP, capitalism freedom, 1990 dollars, Albania -0.5810 -0.4950 $2,650 Algeria -1.7867 -1.7128 2,793 Argentina -0.0289 0.1967 8,464 Armenia 0.2504 -0.8269 4,375 Australia 1.4816 1.1349 21,498 Austria 0.5408 1.1210 19,961 Azerbaijan -0.6614 -1.7697 2,529 Belgium 0.6951 1.0100 20,550 Bolivia -0.5298 0.2289 2,565 Bosnia-Herzegovina -0.6478 -0.9640 2,786 Botswana 0.5911 0.5693 4,309 Brazil -0.5054 0.0490 5,506 Bulgaria -0.4859 0.3910 5,354 Canada 1.4874 1.1754 21,983 Chile 1.5561 0.6154 9,793 China -1.6310 -2.3364 3,422 Colombia -0.4519 -0.5111 5,075 Costa Rica 0.0472 0.8860 6,149 Croatia -0.4637 -0.3058 6,640 Czech Republic 0.7977 0.8546 9,050 Denmark 1.9367 1.1785 22,862 Dominican Republic -0.6929 0.1366 3,575 Ecuador -1.1578 -0.0267 3,554 Egypt -0.9221 -1.8777 2,917 El Salvador 1.0558 0.0578 2,712 Estonia 1.0611 0.6616 10,837 Finland 1.1007 1.1767 $19,895 France 0.3627 0.8906 20,666 Gabon -1.4922 -1.2255 3,944 Georgia 0.0090 -0.5501 3,080 Germany 0.8154 1.0038 18,450 United Kingdom 2.0267 0.9741 19,745 Greece -0.1165 0.7303 12,042 Guatemala -0.3003 -0.4001 3,376 Honduras -1.0450 -0.1249 1,943 Hungary 0.7582 0.9183 7,111 Indonesia -1.1281 -1.0429 3,189 Iran -2.3492 -1.7382 4,731 Table A-6 continued on next page
11
Table A-6 continued Degree of Political Per capita GDP, capitalism freedom, 1990 dollars, Ireland 1.5555 1.1124 21,732 Israel 0.3191 0.5892 15,740 Italy 0.2071 0.8940 18,681 Jamaica 0.2782 0.4133 2,570 Japan 0.7749 0.8259 20,795 Jordan -0.4313 -1.0907 4,049 Kazakhstan -0.7499 -1.6943 5,111 Korea, South -0.1403 0.4770 14,079 Kuwait 0.7354 -1.3822 10,129 Kyrgyzstan -0.9677 -1.4254 2,250 Latvia 0.3470 0.6559 6,829 Lithuania -0.2515 0.8095 6,491 Macedonia -0.0449 -0.2426 3,206 Malaysia -0.1209 -0.8913 7,682 Mauritius -0.2980 0.8360 $10,814 Mexico -0.4593 -0.0585 7,062 Moldova -0.8437 -0.2472 2,156 Morocco -0.5577 -1.4044 2,706 Namibia -0.0481 0.1664 $3,786 Netherlands 1.3717 1.1804 21,435 New Zealand 2.6967 1.1927 15,936 Norway 0.4064 1.1731 24,295 Oman 0.1616 -1.9274 6,915 Pakistan -0.7287 -1.1804 1,916 Panama 0.3182 0.5105 5,743 Paraguay -1.0732 -0.3170 3,027 Peru 0.0692 -0.3678 3,652 Philippines -0.7063 0.1670 2,376 Poland -0.2463 0.8514 7,215 Portugal 0.3192 1.1223 13,933 Romania -0.8368 0.3006 3,038 Russia -1.1298 -0.7581 5,102 Serbia & Montenegro -0.8596 -0.5240 2,352 Singapore 1.9749 -1.0382 21,357 Slovakia -0.0720 0.5680 7,867 Slovenia -0.6440 0.9136 13,396 South Africa 0.0010 0.7270 4,127 Spain 0.3461 0.9555 15,208 Sri Lanka -0.5664 -0.4124 3,559 Sweden 0.9270 1.1729 20,169 Table A-6 continued on the next page.

12
Table A-6 continued Degree of Political Per capita GDP, capitalism freedom, 1990 dollars Switzerland 1.5032 1.1482 $21,910 Syria -2.9161 -2.5248 7,506 Taiwan 0.4010 0.5869 16,228 Thailand -0.1585 0.2091 6,280 Trinidad & Tobago 0.2546 0.5454 13,600 Tunisia -0.2909 -1.5974 4,545 Turkey 0.1651 -0.5604 6,289 Ukraine -0.6079 -0.4565 2.769 United Arab Emirates 0.5925 -1.8031 16.340 United States 2.1239 1.0988 27.824 Uruguay 0.0462 0.8788 7.813 Venezuela -1.7424 -0.2302 8.403 a. Both the degree of capitalism and the political freedom variables are standardized so that for the sample as a whole, their means are zero and their standard deviations are one. The per capita GDP are in international Geary-Khamis dollars. They represent average values for 1999-2001 and come from Maddison (2003).
13
APPENDIX 3-1: MEASUREMENT OF EARLY CAPITALISM
When we turn to early capitalism, that is, the economic systems of nations in the nine-
teenth century, data comparable to those measuring modern capitalism are not available. Although
central governmental regulations of the economy was relatively unimportant (because these gov-
ernments found it difficult to enforce their will except in the area of foreign trade), local regula-
tions by both government and guilds were sometimes considerable and difficult to assess. Measur-
ing the protection of property in the various nations is also problematic. Although in most coun-
tries government ownership of the means of production was low, it is difficult to assess the degree
of monopoly and the extent of competition..
To identify the nations that were capitalist in the nineteenth century, I start with the esti-
mates of Irma Adelman and Cynthia Taft Morris (1978) of the degree to which the transfer of
goods, labor, land, and finance passed through the market. Since this marketization measure
proves highly correlated with per capita GDP, I was able to extend their estimates to cover a few
extra nations. Such a calculation, of course, must be regarded as yielding only tentative results
about early capitalism; but as shown in chapter 3, they yield some important insights into the ori-
gins of capitalism.
Twenty-four countries passed the “capitalism threshold” before 1900, that is, they reached
a point where an average of at least 50 percent of the exchange of goods, labor, land, and finance
were carried out through markets. Belgium and the area now called the United Kingdom were the
first, followed by the USA and Netherlands. By 1900 only four countries outside of Europe and
North America, had high enough marketization to indicate the arrival of capitalism, namely Ar-
gentina, Australia, Chile, and New Zealand. Table 3-1 in the text presents those nations in the
nineteenth century that passed the capitalist threshold and the years they reached this level.
14
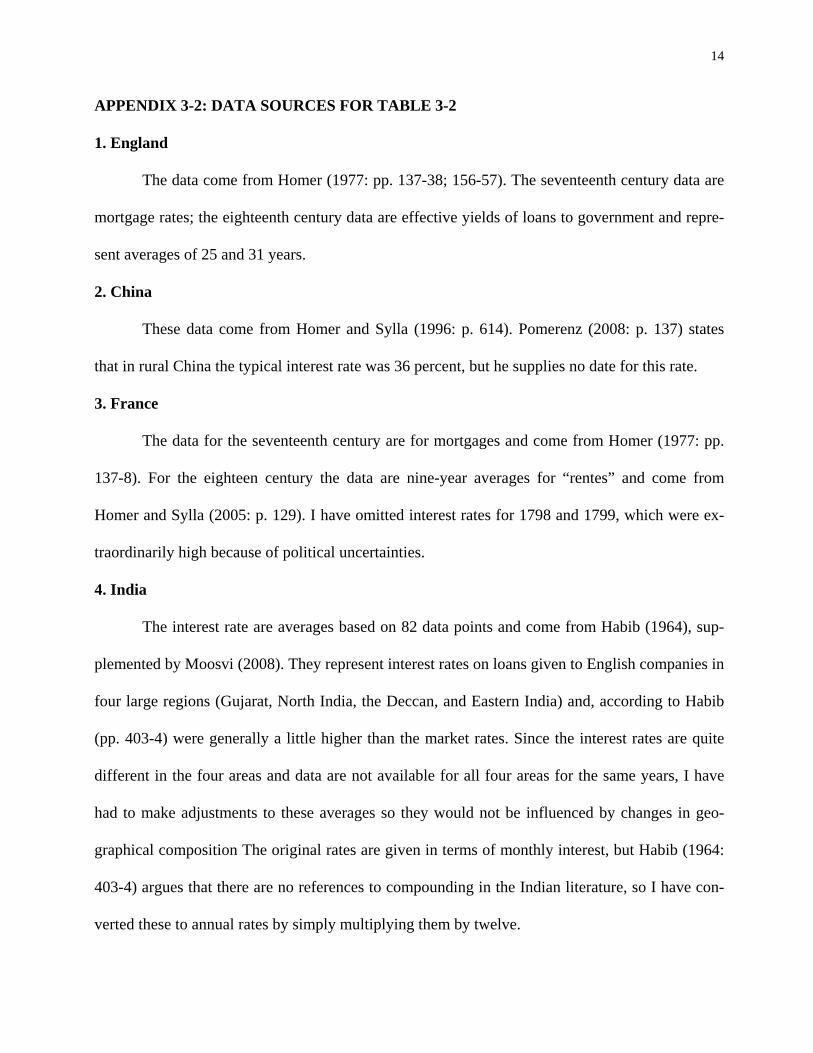
APPENDIX 3-2: DATA SOURCES FOR TABLE 3-2
1. England
The data come from Homer (1977: pp. 137-38; 156-57). The seventeenth century data are
mortgage rates; the eighteenth century data are effective yields of loans to government and repre-
sent averages of 25 and 31 years.
2. China
These data come from Homer and Sylla (1996: p. 614). Pomerenz (2008: p. 137) states
that in rural China the typical interest rate was 36 percent, but he supplies no date for this rate.
3. France
The data for the seventeenth century are for mortgages and come from Homer (1977: pp.
137-8). For the eighteen century the data are nine-year averages for “rentes” and come from
Homer and Sylla (2005: p. 129). I have omitted interest rates for 1798 and 1799, which were ex-
traordinarily high because of political uncertainties.
4. India
The interest rate are averages based on 82 data points and come from Habib (1964), sup-
plemented by Moosvi (2008). They represent interest rates on loans given to English companies in
four large regions (Gujarat, North India, the Deccan, and Eastern India) and, according to Habib
(pp. 403-4) were generally a little higher than the market rates. Since the interest rates are quite
different in the four areas and data are not available for all four areas for the same years, I have
had to make adjustments to these averages so they would not be influenced by changes in geo-
graphical composition The original rates are given in terms of monthly interest, but Habib (1964:
403-4) argues that there are no references to compounding in the Indian literature, so I have con-
verted these to annual rates by simply multiplying them by twelve.
15
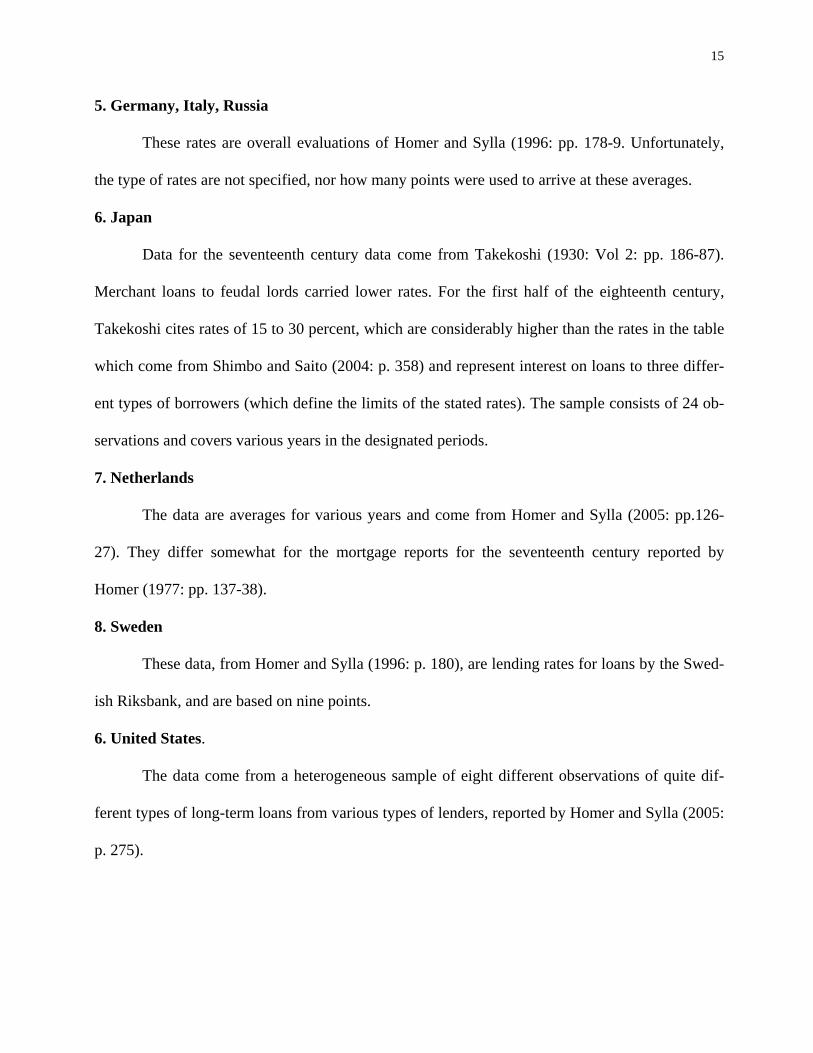
5. Germany, Italy, Russia
These rates are overall evaluations of Homer and Sylla (1996: pp. 178-9. Unfortunately,
the type of rates are not specified, nor how many points were used to arrive at these averages.
6. Japan
Data for the seventeenth century data come from Takekoshi (1930: Vol 2: pp. 186-87).
Merchant loans to feudal lords carried lower rates. For the first half of the eighteenth century,
Takekoshi cites rates of 15 to 30 percent, which are considerably higher than the rates in the table
which come from Shimbo and Saito (2004: p. 358) and represent interest on loans to three differ-
ent types of borrowers (which define the limits of the stated rates). The sample consists of 24 ob-
servations and covers various years in the designated periods.
7. Netherlands
The data are averages for various years and come from Homer and Sylla (2005: pp.126-
27). They differ somewhat for the mortgage reports for the seventeenth century reported by
Homer (1977: pp. 137-38).
8. Sweden
These data, from Homer and Sylla (1996: p. 180), are lending rates for loans by the Swed-
ish Riksbank, and are based on nine points.
6. United States.
The data come from a heterogeneous sample of eight different observations of quite dif-
ferent types of long-term loans from various types of lenders, reported by Homer and Sylla (2005:
p. 275).

16
APPENDIX 3-3: A SHORT NOTE ON THE BRENNER THESIS
Brenner’s thesis requires a number of assumptions, for instance, that the tenant farmers
responded to economic incentives to increase productivity, and that their large farms became
much more productive than small farms. This thesis has given rise to enormous controversy
among historians. For instance, some like Croot and Parker (1987), support Brenner by claiming
that only large, centrally-managed farms could carry out such productivity-enhancing steps as the
floating of water-meadows or certain reclamation projects, while others point out that small farms
could carry out many other improvements such as new rotation schemes, planting new crops, and
introducing new husbandry projects. Still others, such as Pryor (2005a: p. 151), also point out that
industrialization in the countries now composing the OECD was unrelated to concentration of
land into large farms in the nineteenth century.
Rather than review the vast literature on the Brenner thesis, it seems more useful to point
out that the debate focuses on the wrong question. To me, three crucial issues seem more impor-
tant for understanding the role of agriculture in the development of capitalism.
a) How did the concept of ownership change, so that property rights in land were
not only private but exclusive? This means that overlapping rights were eliminated and the own-
ers could do with the property as they wanted. The most famous example of this movement was,
of course, the enclosure movement in England and the extinction of customary use rights on this
land.
b) Who directly benefited from productivity improvements? If the tenant farmer,
who made the improvements, found the landlord increasing his rent or charging extra fees or if
government agents began to extract higher taxes, then clearly the incentives for making such im-
provements were low.

17
c) How were the profits from increased agricultural productivity used? If the prof-
its of higher agricultural productivity were obtained by the government and spent on war, or by
the landlord or tenant farmer and spent on imported luxury items, then the development of a capi-
talistic rural sector would be doubtful. As Jones and Woolf (1969:1) have argued, “One of the less
palatable lessons of history is that technically advanced and physically productive agriculture do
not inevitably bring along sustained growth in per capita real income . . .” and they use ancient
China, Rome, and the Mayans as examples to argue their case
Trade between the urban and rural sectors can only develop when agricultural productivity
is sufficiently high that the farmers have a surplus over their own needs to sell and there are urban
dwellers willing to buy this produce by increasing production of goods wanted by the rural sector.
Otherwise, as noted in the text, the terms of trade will turn against agricultural products and will
no longer be useful to the farmers. As the expression goes, it takes two to tango, and we cannot
say that the dance originated with just one of the partners.

18
APPENDIX 3-4: DEMOCRACY/AUTOCRACY AND ORIGINS OF CAPITALISM
Table A-7: Democracy/Autocracy Measures for Early Capitalist Countries and “Capitalist Threshold Year (CTY) Country CTY From 1800 20 year per- 20 year per- From 20 Signi- to 20 years iod before iod after years after ficance before CTY CTY CTY CTY to 1920 tests Column nos. 1 2 3 4 5 6 7 8 Avg. s.d. Avg. s.d. Avg. s.d. Avg. s.d. Great Britain 1816 -2.00 0.00 -1.00 2.05 5.30 2.29 e,f Belgium 1829 -4.00 0.00 5.73 2.15 f USA 1832 5.25 2.26 9.00 0.00 9.25 0.44 9.49 0.87 Netherlands 1833 -6.00 0.00 -5.55 1.67 -1.81 3.04 France 1838 -7.11 1.71 -2.80 1.51 -2.40 4.87 4.50 5.43 c Switzerland 1847 10.00 0.00 10.00 0.00 f Germany 1855 -9.37 0.27 -8.14 0.64 -6.02 1.42 -0.07 2.89 b,c,e Austria 1855 -10.00 0.00 -8.60 1.96 -4.50 0.89 -3.47 2.19 Sweden 1864 -8.43 0.87 -6.10 1.02 -4.25 0.44 -0.50 5.30 b Denmark 1869 -9.69 0.47 1.55 1.10 -3.00 0.00 2.45 5.25 b,c,d Canada 1875 4.00 0.00 6.00 2.51 9.00 0.00 e Australia 1875 10.00 0.00 Italy 1878 -4.00 0.00 -4.00 0.00 -1.14 0.64 d,e,f Spain 1881 -5.38 3.05 -2.65 3.36 -4.36 0.69 6.00 0.00 c,e,f Chile 1882 -3.75 2.19 1.20 1.51 3.30 0.73 3.00 0.00 b,c New Zealand 1884 10.00 0.00 9.35 1.11 9.60 0.50 10.00 0.00 c Norway 1886 -7.00 0.00 -4.85 1.73 3.40 6.13 10.00 0.00 c,e Hungary 1887 -4.00 0.00 -4.00 0.00 -4.15 1.34 d Argentina 1889 -4.25 0.97 -1.20 2.04 1.00 0.00 1.82 0.40 b,c Japan 1893 -8.49 3.38 1.00 0.00 1.00 0.00 1.00 0.00 a,b,c Mexico 1894 -2.78 1.25 -8.30 1.38 -7.20 3.69 -0.67 0.52 a,e Romania 1894 -4.00 3.38 -7.00 0.00 -5.75 1.12 -4.00 0.00 e Greece 1897 -5.95 5.28 9.85 0.37 9.50 2.12 a,b South Africa 1899 4.00 0.00 Average, total sample -4.73 -1.48 0.04 3.29 Notes: The criteria for classifying a country as capitalist are discussed in the text. The data on political freedom come from the Polity2 variable in the Polity IV ratings of democracy (Mar-shall and Jaggers 2005); they run from -10 (autocracy) to +10 (democracy). The significance tests are t-tests of differences between the means of various columns and the designations are: a = col-umns B and D; b = columns B and F; c = columns B and H; d = columns D and F; e = columns D and ; and f = columns F and H. The total sample statistics give equal weight to the data for each country. The blanks in the table denote years for which there are data for political freedom, mostly because the nation was a colony of another country or was at war, either internal or exter-nal.
19
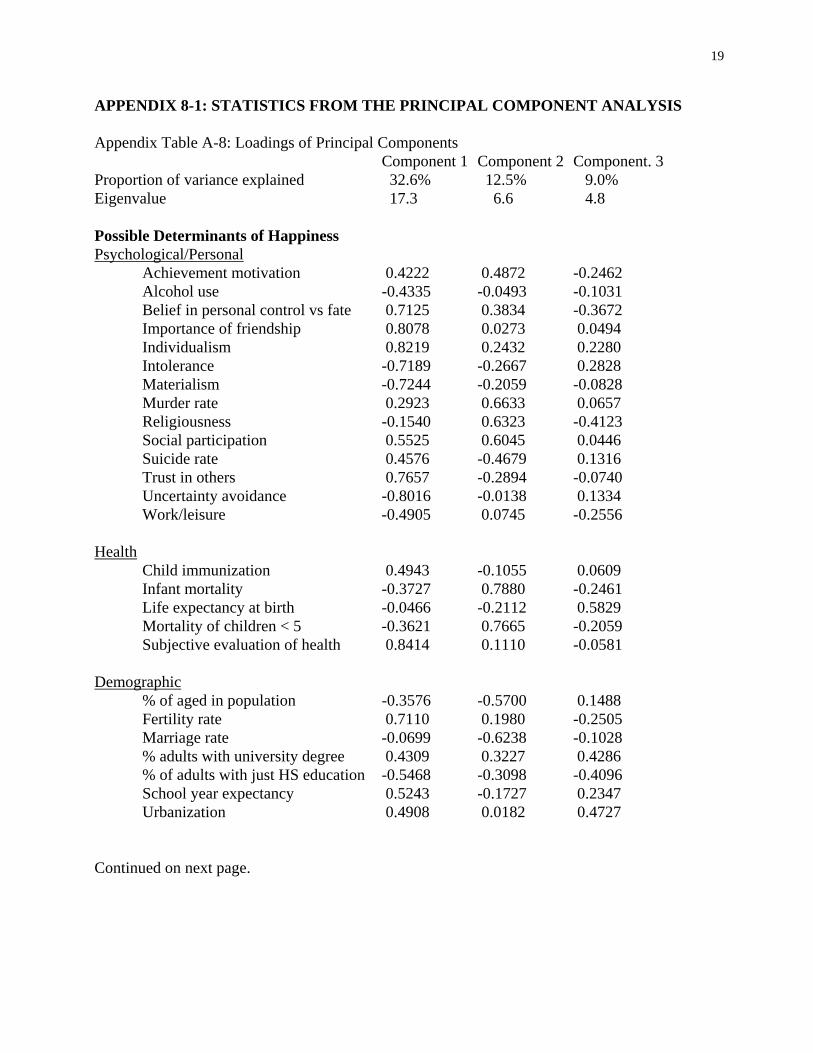
APPENDIX 8-1: STATISTICS FROM THE PRINCIPAL COMPONENT ANALYSIS Appendix Table A-8: Loadings of Principal Components Component 1 Component 2 Component. 3 Proportion of variance explained 32.6% 12.5% 9.0% Eigenvalue 17.3 6.6 4.8 Possible Determinants of Happiness Psychological/Personal Achievement motivation 0.4222 0.4872 -0.2462 Alcohol use -0.4335 -0.0493 -0.1031 Belief in personal control vs fate 0.7125 0.3834 -0.3672 Importance of friendship 0.8078 0.0273 0.0494 Individualism 0.8219 0.2432 0.2280 Intolerance -0.7189 -0.2667 0.2828 Materialism -0.7244 -0.2059 -0.0828 Murder rate 0.2923 0.6633 0.0657 Religiousness -0.1540 0.6323 -0.4123 Social participation 0.5525 0.6045 0.0446 Suicide rate 0.4576 -0.4679 0.1316 Trust in others 0.7657 -0.2894 -0.0740 Uncertainty avoidance -0.8016 -0.0138 0.1334 Work/leisure -0.4905 0.0745 -0.2556 Health Child immunization 0.4943 -0.1055 0.0609 Infant mortality -0.3727 0.7880 -0.2461 Life expectancy at birth -0.0466 -0.2112 0.5829 Mortality of children < 5 -0.3621 0.7665 -0.2059 Subjective evaluation of health 0.8414 0.1110 -0.0581 Demographic % of aged in population -0.3576 -0.5700 0.1488 Fertility rate 0.7110 0.1980 -0.2505 Marriage rate -0.0699 -0.6238 -0.1028 % adults with university degree 0.4309 0.3227 0.4286 % of adults with just HS education -0.5468 -0.3098 -0.4096 School year expectancy 0.5243 -0.1727 0.2347 Urbanization 0.4908 0.0182 0.4727 Continued on next page.

20
Appendix Table A-8 continued. Component 1 Component 2 Component 3 Economic conditions GDP per capita 0.5702 -0.1099 0.4550 Growth rate, GDP per capita -0.2025 -0.0663 -0.4482 Per capita GDP stability -0.3221 0.0290 0.1029 Inflation -0.5627 0.3606 -0.3639 Income inequality -0.4197 0.7353 -0.1211 Pollution -0.0643 -0.2535 0.2412 Regulation quality 0.7397 0.0887 -0.3658 Shadow economy importance -0.6920 -0.1000 -0.1285 Strikes and lockout rate 0.1311 0.2272 0.1104 Unemployment rate -0.3217 0.0164 -0.0154 Political conditions Civil liberties 0.7416 -0.0500 -0.2763 Confidence in government 0.6309 -0.2489 -0.1527 Control of corruption 0.9317 -0.1566 -0.1554 Federal type government 0.2805 0.3186 0.3563 Government effectiveness 0.8692 -0.1296 0.0598 Political stability 0.6733 -0.4008 -0.2611 Proportl representation: lower house -0.1105 -0.4826 -0.4677 Rule of law 0.9001 -0.2344 -0.0080 Voice in, accountability of govt. 0.8780 -0.2310 -0.2164 Social Ethnic heterogeneity 0.2148 0.4543 0.3406 Gender inequality 0.8378 -0.1428 -0.1263 Linguistic heterogeneity 0.3596 0.1025 0.4932 Social/power hierarchy -0.6574 0.0664 0.4871 Religious heterogeneity 0.4306 0.4825 0.4849 Other Historically Protestant 0.8267 0.1206 -0.0948 Population density -0.2379 -0.3168 0.5422 Population size -0.2396 0.3888 0.6584

21
Appendix Table A-9: Component Scores of Possible Determinants for Happiness for Each Coun-try Principal Principal Principal component 1 component 2 component 3 Australia 13.892 5.341 0.691 Austria -2.424 -3.839 -3.660 Belgium -8.201 -4.744 7.302 Canada 15.456 8.813 4.232 Denmark 12.920 -5.371 -3.440 Finland 13.956 -6.449 -4.170 France -11.999 -4.769 4.032 Germany -1.877 -1.846 3.115 Greece -36.246 7.645 -2.603 Ireland -2.329 -0.141 -10.076 Italy -26.658 1.405 0.571 Japan -18.400 -5.060 9.106 Netherlands 14.523 -3.365 3.231 New Zealand 16.019 6.943 -3.694 Norway 14.686 -7.158 -2.594 Portugal -26.827 1.864 -8.542 Spain -19.341 -0.266 1.658 Sweden 18.864 -7.647 -1.401 Switzerland 13.367 -2.461 2.159 United Kingdom 3.944 2.037 1.525 USA 16.676 19.068 2.557 Note: These data show the national scores of each country for each of the first three prin-cipal components and are used in Table 7-2 to isolate the impact of the economic system. They represent the sum of the values of each of the fifty-three possible determinant of happiness of each nation multiplied by the factor loadings shown in Appendix Table A-8.
22
APPENDIX 7-2: UNDERLYING DATA FOR THE DETERMINANTS OF HAPPINESS Personal/Psychological Achievement motivation. Percentage of adults who say that the ability to achieve some-thing is important in a job. Data are from Inglehart et al. (2004), variable C018. Alcohol use. Ratio of liters of alcohol purchased to population 15 and over, averaged for 1994-96. Data are from OECD (2000, 2007). Belief in control versus belief in fate. Percentage of adults in the 1990 and 2000 interview waves who believe that people have free choice and control over their lives, in contrast to those who believe that they have no real effect on what happens to them. Data are from Inglehart, et al. (2004), variable A173. Importance of friendships. Percentage of adults who say that having friends is very impor-tant in their lives. Data are from Inglehart, et al. (2004), variable A002. Individualism. An average of two standardized measures of individualism (mean = 0, stan-dard deviation = 1), which are significantly related to each other. The first comes from Hofstede (2001: 500) using a 1967-73 sample of executives; the second was calculated by Harry C. Trian-dis for the 1980s and is reported in Diener, Diener, and Diener (1995). Intolerance. Percentage of people who would not like to have as neighbors people of a dif-ferent race, Muslims, immigrants, or Jews. Data are from Inglehart et al. (2004), variables A125, A128, A129, A133. Materialism. Percentage of people in the 1990 and 2000 waves who were rated as having materialist orientation, based on their answers to questions relating to national policy goals. Data come from Inglehart et al. (2004), variable Y002. Murder rate. Murders per 100,000 population, 1990-2000. Data are from OECD (2000, 2007). Religiousness. Average of three percentages: those who attend religious services more than once a month; those who claim to be religious; and those who believe in life after death. Data are from Inglehart et al. (2004), variables F028, F034, and F051. Social participation. Percentage of adults in each country carrying out unpaid voluntary work in 14 different organizations (average of 1990 and 2000 waves). Data are from Inglehart et al. (2004), variables A081-A092, A094,A096. Suicide. Suicides per 100,000 population, averaged for each country from 1990-2000. Data are from OECD (2000, 2007). Trust. Percentage of adults in each country saying that, generally speaking, most people can be trusted (averages of 1990 and 2000 waves). Data are from Inglehart et al. (2004), variable A165. Uncertainty avoidance. A psychological measure from Hofstede (2001: 500), who uses a sample from 1967-73. Work values. An average of two measures of work values (standardized with mean = 0 and standard deviation = 1). Both series come from Inglehart et al. (2004) and are significantly related to each other. The first variable, C041, is the percentage of people who strongly agree or disagree with the statement "Work should always come first, even if it means less spare time." The second variable, A003 and A005, is the percentage of people agreeing with the statement "Leisure is important in my life," subtracted from the percentage of people agreeing with the statement "Work is not important in my life." For the six countries for which no data were avail-able of characteristic C041, only the second characteristic was used.
23
Health Child immunization. Average percentage of children aged 12-23 months who have been immunized for measles and DPD, 1990 through 2000. Data are from World Bank (2008). Infant mortality. Average for 1993-97. Data are from World Bank (2008). Life expectancy at birth. Average for 1990-2000. Data are from World Bank (2008). Mortality of children under 5. Average for 1993-97. The data are from World Bank (2008). Subjective health. Percentage of adult population rating current state of health as good or very good. Data are from Inglehart et al. (2004), variable A009. Greece is estimated as average of Italy, Portugal, and Spain, the other nations with a Southern European economic system. Demographic Aged population. Percentage of population over 64 in 1995. Data are from World Bank (2008). Fertility. The number of children per woman averaged for 1990-2000; Data are from World Bank (2008). Marriage rate. Marriages as a percentage of population aged 15 through 64 averaged for 1993-97. Data on marriages come from United Nations (1998, 2000); data on population aged 15-64, from OECD (2004). Percentage of adult population with a university degree. Averages for 1994-96. Data are from OECD (2000). Percentage of adult population with only a primary or secondary education. Averages for 1994-96. Data are from OECD (2000). School years expectancy. For population from 25 through 64, averaged for 1994-96. Data are from OECD (2000). Urbanization. Data are for 1995 and come from World Bank (2008). Economic conditions GDP per capita. Average for 1993-97 in constant international dollars. Data are from World Bank (2008). GDP per capita: average annual growth. Calculated from a regression of value per capita GDP in constant local currency for 1985-2000. Data are from World Bank (2008). GDP per capita: stability of growth. Coefficients of determination from regressions to de-termine average annual growth of per capita GDP for 1985-2000. Data are from World Bank (2008). Income inequality. For all but three countries, an average of the Gini coefficients of size-adjusted family disposable income for the period 1990-2000. Data are from the Luxembourg Income Study (2008). For Japan and Portugal, data are from Brandolini and Smeeding (n.d.), for 1992 and 2000 respectively. For New Zealand, data are from Blaiklock, et al. (2002). Data for Ja-pan and Portugal are based on the same methodology as the LIS data; the New Zealand data ap-pear roughly comparable as well. Inflation. Average annual rise in cost of living from 1985-2000. Data for Germany covers only the former West Germany and come from Germany, Statistisches Bundesamt (2005: p. 512); for all other countries, data come from World Bank (2008).

24
Pollution. Metric tons of SO2 and NOx per million persons per square kilometer in 1995. Pollution data are from World Resources Institute (2008); population and area data are from World Bank (2008). Regulatory quality. A composite series calculated by Kaufmann, Kraay, and Mastruzzi (2005). Ratings for 1996, 1998, and 2000 are averaged with the 1996 rating given a triple weight to take account of earlier years. Shadow economy. Ratios of the shadow economy to the GDP are calculated from six se-ries of the shadow economy for 1990-2000, five based on a "cash approach," one on an "electric-ity approach." Data are from Schneider and Enste (2002: 35, 38). For each of the six series, an average was calculated for the countries for which data were available for all six series, and then for each series each country was then calculated as a percent of this average. These latter percent-ages were then averaged across all six series and multiplied by the average of the average for the six series. Strikes and lockouts. Days lost per 1000 workers for 1993-98. Data are from International Labour Office (2002, Tables 2A and 9C). For Greece, the days lost were estimated from the num-ber of workers participating in strikes and lockouts and the average days lost per worker in strikes and lockouts in Italy, Portugal, and Spain, the other nations with the Southern European economic system. For the U.S. data were adjusted upward by 25 percent to take into account strikes and lockouts involving less than 1000 workers. Unemployment. Average unemployment rates for 1990-2000. Data are from World Bank (2008). Political conditions Civil rights. Average for 1990-2000 of the civil liberties scores of Freedom House (2008), but with the scale reversed so that a high score represents high levels of civil liberties. Confidence in government. The percentage of adults in the 1990 and 2000 interview waves who have "quite a lot" or a "great deal" of confidence in police, parliament, and govern-ment. Data are from Inglehart, et al. (2004), variables E074-E076, and E079. Control of corruption. A composite series calculated by Kaufmann, Kraay, and Mastruzzi (2003). Ratings for 1996, 1998, and 2000 are averaged with the 1996 rating given a triple weight. Federalism in contrast to a unitary state These data cover the period 1990-2000, with 1 designating a federal state. Data are from Anon (2008). Government effectiveness. A composite series calculated by Kaufmann, Kraay, and Mas-truzzi (2003). Ratings for 1996, 1998, and 2000 are averaged, with the 1996 rating given a triple weight to take into account earlier years. Political stability. A composite series calculated by Kaufmann, Kraay, and Mastruzzi (2003). Ratings for 1996, 1998, and 2000 are averaged, with the 1996 rating given a triple weight. Proportional representation in the lower parliamentary house. Data are from Persson and Tabellini (2003. 84-87). Rule of law. A composite series calculated by Kaufmann, Kraay, and Mastruzzi (2003). Data for 1996, 1998, and 2000 are averaged, with the 1996 rating given a triple weight. Voice in, and accountability, of government. A composite series calculated by Kaufmann, Kraay, and Mastruzzi (2003). Ratings for 1996, 1998, and 2000 are averaged, with the 1996 rating given a triple weight.

25
Social Gender inequality. The gender empowerment measure from United Nations Development Programme (1998. pp. 134-35) for the mid-1990s. Ethnic heterogeneity. This series is one minus a Herfindahl index of the shares of each ethnic group, in most cases for the 1990s. Data are from Alesina et al. (2003). Linguistic heterogeneity. This series is one minus a Herfindahl index of the shares of peo-ple speaking each languages in 2001. Data are from Alesina et al. (2003). Religious heterogeneity. This series is one minus a Herfindahl index of the shares of peo-ple with each religion in 2001. Data are from Alesina, et al. (2003). Social/power hierarchy. A psychological measure of the social distance between people with different degrees of power. Data are from by Hofstede (2001: p. 500), using a 1967-73 sam-ple. Other Historically Protestant. Percentage of Protestants in 1900 and 1970. A strongly Protestant population was rated 1; but if the population was roughly evenly split between Protestant and non-protestant in the two years, the rating was 0.5. Data are from Barrett (1982). Population size. Logarithm of population in 1995. Data are from World Bank (2008). Population density. People per square kilometer in 1995. Data are from World Bank (2008).
26
BIBLIOGRAPHY TO APPENDICES Adelman, Irma, and Cynthia Taft Morris. 1978. “Patterns of Market Expansion in the Nine-
teenth Century: A Quantitative Study.” Pp. 231-325 in George Dalton, ed. Research in Economic Anthropology vol.1. Greenwich, CT: JAI Press.
Alesina, Alberto, Arnaud Devleeschauwer, William Easterly, Sergio Kurlat, and Romain Wacziarg. 2003. “Fractionalization.” Journal of Economic Growth 8, no. 2: 155-94.
Anon. 2008. “Unitary State,” Wikipedia” <http://en.wikipedia.org/wiki/Unitary_state>. Aston, Trevor Henry, and C.H.E. Philpin.1985. The Brenner Debate: Agrarian Class Structure
and Economic Development in Pre-Industrial Europe. New York: Cambridge University Press.
Barrett, David B., ed. 1982. World Christian Encyclopedia. New York: Oxford University Press. Blaiklock, Alison J., et al. 2002. “When the Invisible Hand Rocks the Cradle.” Innocenti Work-
ing Papers no. 93. <www.unicef-icdc.org/publications/pdf/iwp93.pdf>. Brandolini, Andrea, and Timothy M. Smeeding. n.d. “Inequality: International Evidence” <www.unicatt.it/Dottorati/Defap/Allegati/Inequality_international_evidence.pdf>. Brenner, Robert. 1985. “Agrarian Class Structure and Economic Development in Pre-Industrial
Europe.” Pp. 10-63 in Aston and Philpin, eds. Croot, Patricia, and David Parker. 1985. “Agrarian Class Structure and the Development of
Capitalism: France and England Compared.” Pp. 79-91 in Aston and Philpin.eds. Diener, Ed, Marissa Diener, and Carol Diener. 1995. “Factors Predicting the Subjective Well-
Being of Nations.” Journal of Personality and Social Psychology 69, no. 5: pp. 851-64. Freedom House. 2008. Freedom in the World. <www.freedomhouse.org>. Germany, Statistisches Bundesamt. 2005. Statistisches Jahrbuch 2005 für die Bundesrepublik
Deutschlands. Wiesbaden: Statistisches Bundesamt. Gwartney, James, Robert Lawson, Russell S. Sobel, and Peter T. Leeson. 2007. Economic
Freedom of the World: 2007 Annual Report <www.freetheworld.com/datasets_efw.html>.
. Habib, Irfan, 1964. “Usury in Medieval India.” Comparative Studies in Society and History 6, no. 4 (July): pp. 393-419.
Heritage Foundation. 2008. 2008 Index of Economic Freedom. <http://www.heritage.org/Index> Hofstede, Geert. 2001. Culture’s Consequences: Comparing Values, Behaviors, Organizations,
and Organizations across Nations, 2nd edition. Thousand Oaks, CA: Sage Publication. Homer, Sidney. 1977. A History of Interest Rates, 2nd edition. New Brunswick: Rutgers
University Press. Homer, Sidney and Richard Sylla. 1996. A History of Interest Rates, 3rd edition. New Bruns-
wick: Rutgers University Press. ---. 2005. A History of Interest Rates, 4th edition. New Brunswick: Rutgers University Press. Inglehart, Ronald, Miguel Basáñez, Jaime Díez-Medrano, Loek Halman, and Ruud Luijkx.
2004. Human Beliefs and Values: A Cross-Cultural Sourcebook Based on the 1999-2002 Values Surveys. Mexico City: Siglo XXI Editores.
International Labour Office. Annual. Yearbook of Labour Statistics. Geneva: ILO. Jones, Eric L. and Stuart J. Woolf. 1969. “The Historical Role of Agrarian Change in Economic
Development.” Pp. 10-23 in Jones and Woolf, eds., Agrarian Change and Economic De-velopment. London: Methuen & Co.

27
Kaufmann, Daniel, Aart Kraay, and Massimo Mastruzzi. 2005. “Government Matters VI: Ag-gregate and Individual Governance Indicators, 1996-2004.” World Bank Policy Research Working Paper Series, no. 3630.
---. 2007. “Governance Matters VI: Aggregate and Individual Governance Indicators.” World Bank Policy Research Working Paper 4280 <www.worldbank.org>.
Luxembourg Income Study. 2008. “Key Figures” <www.lisproject.org/keyfigures.htm>. Maddison, Angus.2003. The World Economy: Historical Statistics. Paris: OECD. Marshall, Monty G., and Keith Jaggers. 2005. Polity IV Project: Political Regime Characteris-
tics and Transitions, 1800-2004 <www.cidem.umd.edu/polity>. Macfarlane, Alan. 1979. The Origins of English Individualism. New York: Cambridge Univer-
sity Press. Moosvi, Shireen 2008. People, Taxation, and Trade in Mughal India. New York: Oxford. Organization of Economic Cooperation and Development. 2000. OECD Health Data 2000. CD
ROM. Paris: OECD. ---. 2004. Labour Force Statistics, 1983-2003. Paris: OECD. ---. 2007. OECD Health Data 2007. CD ROM. Paris: OECD. Persson, Torsten, and Guido Tabellini. 2003. The Economic Effects of Constitutions. Cam-
bridge, MA: MIT Press. . Pomeranz, Kenneth.2008. “Land Markets in Late Imperial and Republican China,” Continuity
and Change 23, no. 1: pp. 101-50 Pryor, Frederic L. 2005a. Economic Systems of Foraging, Agricultural, and Industrial Societies.
New York: Cambridge University Press. Schneider, Friedrich, and Dominik Enste. 2000. The Shadow Economy: An International Sur-
vey. New York: Cambridge University Press. Shimbo, Hiroshi and Osamu Saitô. 2004. “The Economy on the Eve of Industrialization.” Pp
337-68 in Akira Hayami, Osamu Saitô, and Ronald P. Toby.2004. The Economic History of Japan: 1600-1990, vol. 1. New York: Oxford University Press.
Takekoshi, Yosoburo. 1930. The Economic Aspects of the History of the Civilization of Japan. New York: Macmillan.
Thackeray, William Makepeace. 1855. The Newcomes: Memoirs of a Most Respectable Fam-ily. New York: Harper & Bros.
United Nations. Annual. Demographic Yearbook. New York: United Nations. United Nations Development Programme. 1998. Human Development Report 1998. New York:
Oxford University Press. World Bank. 2008. World Development Indicators <www.worldbank.org>. World Resources Institute. 2008 <http://earthtrends.wri.org/searchable_db/index.php?theme=3>.
Related Documents