104 IRAS Annual Report 2006/07 GROWING A NATION, GROWING WITH THE NATION, GROWING WITH YOU. APPENDICES

Welcome message from author
This document is posted to help you gain knowledge. Please leave a comment to let me know what you think about it! Share it to your friends and learn new things together.
Transcript
104 IRAS Annual Report 2006/07 GROWING A NATION, GROWING WITH THE NATION, GROWING WITH YOU.
APPENDICES
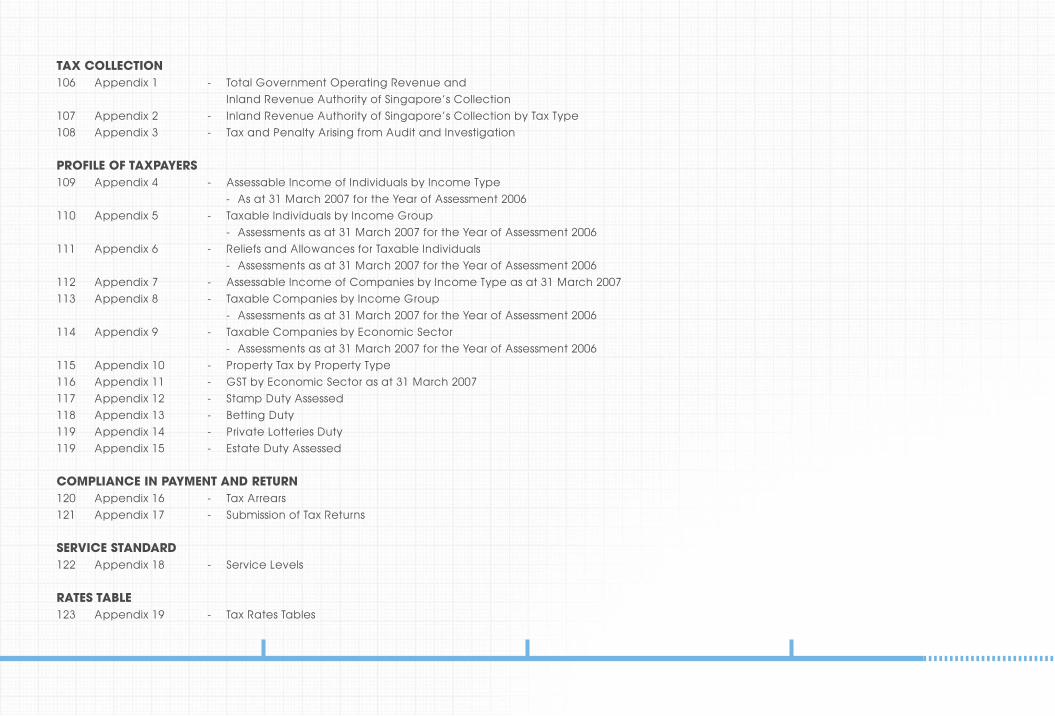
TAX COLLECTION106 Appendix 1 - Total Government Operating Revenue and Inland Revenue Authority of Singapore’s Collection107 Appendix 2 - Inland Revenue Authority of Singapore’s Collection by Tax Type108 Appendix 3 - Tax and Penalty Arising from Audit and Investigation
PROFILE OF TAXPAYERS109 Appendix 4 - Assessable Income of Individuals by Income Type - As at 31 March 2007 for the Year of Assessment 2006110 Appendix 5 - Taxable Individuals by Income Group - Assessments as at 31 March 2007 for the Year of Assessment 2006111 Appendix 6 - Reliefs and Allowances for Taxable Individuals - Assessments as at 31 March 2007 for the Year of Assessment 2006112 Appendix 7 - Assessable Income of Companies by Income Type as at 31 March 2007113 Appendix 8 - Taxable Companies by Income Group - Assessments as at 31 March 2007 for the Year of Assessment 2006 114 Appendix 9 - Taxable Companies by Economic Sector - Assessments as at 31 March 2007 for the Year of Assessment 2006115 Appendix 10 - Property Tax by Property Type116 Appendix 11 - GST by Economic Sector as at 31 March 2007117 Appendix 12 - Stamp Duty Assessed 118 Appendix 13 - Betting Duty119 Appendix 14 - Private Lotteries Duty119 Appendix 15 - Estate Duty Assessed
COMPLIANCE IN PAYMENT AND RETURN120 Appendix 16 - Tax Arrears 121 Appendix 17 - Submission of Tax Returns
SERVICE STANDARD122 Appendix 18 - Service Levels
RATES TABLE123 Appendix 19 - Tax Rates Tables
106 IRAS Annual Report 2006/07 GROWING A NATION, GROWING WITH THE NATION, GROWING WITH YOU.
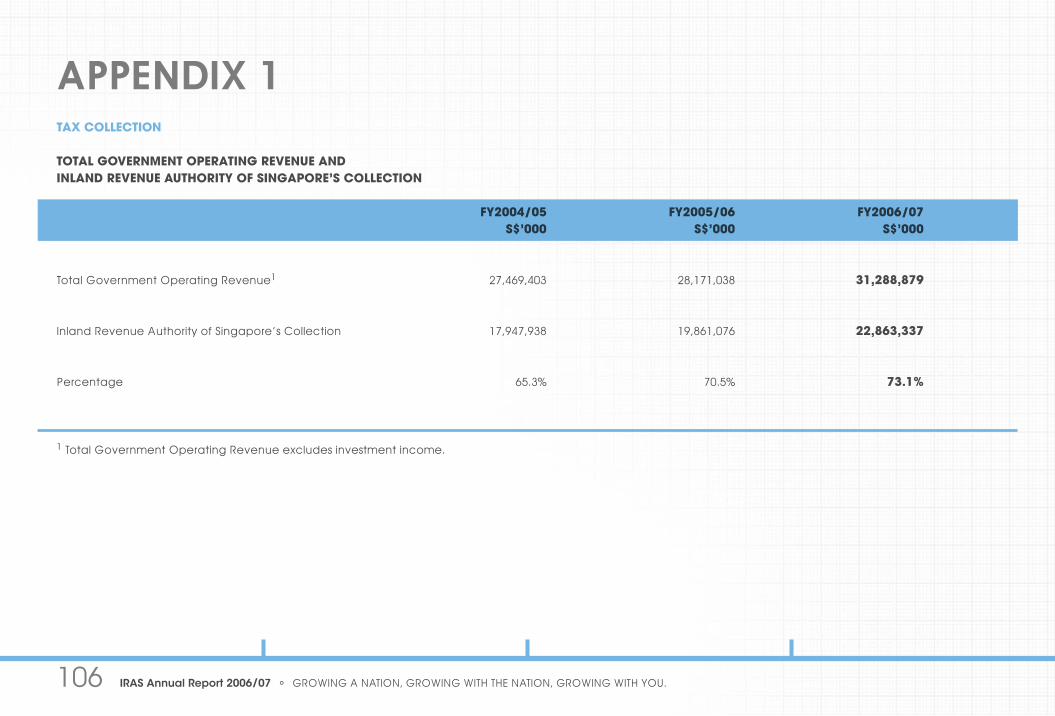
APPENDIX 1TAX COLLECTION
TOTAL GOVERNMENT OPERATING REVENUE ANDINLAND REVENUE AUTHORITY OF SINGAPORE’S COLLECTION
FY2004/05 FY2005/06 FY2006/07 S$’000 S$’000 S$’000
Total Government Operating Revenue1 27,469,403 28,171,038 31,288,879 Inland Revenue Authority of Singapore’s Collection 17,947,938 19,861,076 22,863,337 Percentage 65.3% 70.5% 73.1%
1 Total Government Operating Revenue excludes investment income.
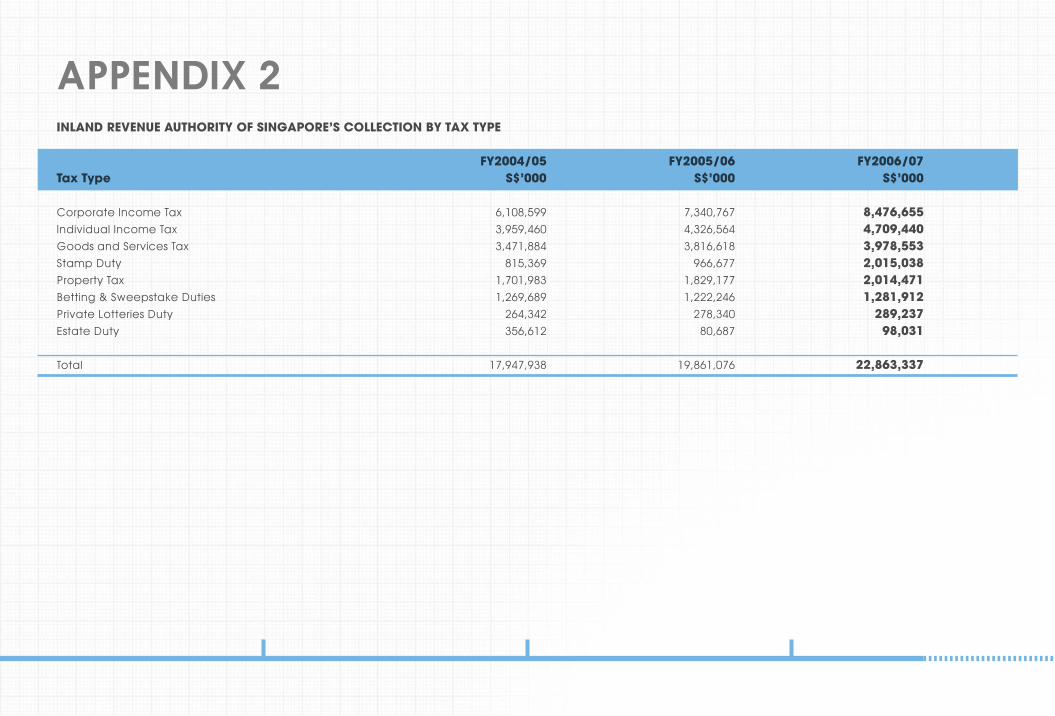
APPENDIX 2INLAND REVENUE AUTHORITY OF SINGAPORE’S COLLECTION BY TAX TYPE
FY2004/05 FY2005/06 FY2006/07Tax Type S$’000 S$’000 S$’000 Corporate Income Tax 6,108,599 7,340,767 8,476,655Individual Income Tax 3,959,460 4,326,564 4,709,440Goods and Services Tax 3,471,884 3,816,618 3,978,553Stamp Duty 815,369 966,677 2,015,038Property Tax 1,701,983 1,829,177 2,014,471Betting & Sweepstake Duties 1,269,689 1,222,246 1,281,912Private Lotteries Duty 264,342 278,340 289,237Estate Duty 356,612 80,687 98,031 Total 17,947,938 19,861,076 22,863,337
108 IRAS Annual Report 2006/07 GROWING A NATION, GROWING WITH THE NATION, GROWING WITH YOU.
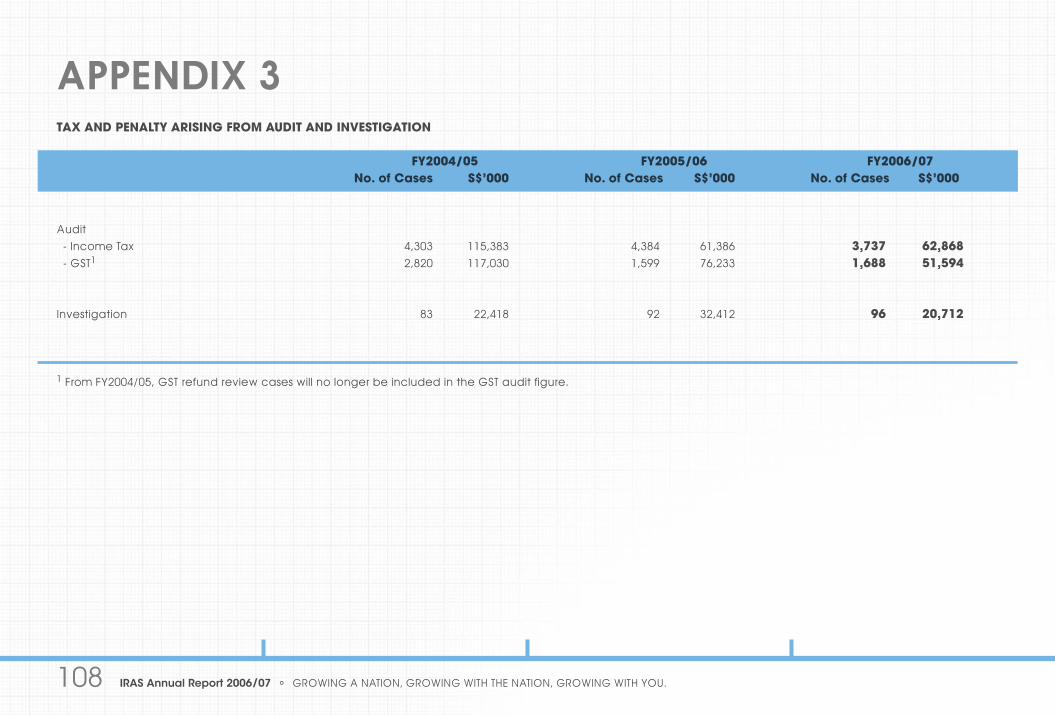
APPENDIX 3TAX AND PENALTY ARISING FROM AUDIT AND INVESTIGATION
FY2004/05 FY2005/06 FY2006/07 No. of Cases S$’000 No. of Cases S$’000 No. of Cases S$’000 Audit - Income Tax 4,303 115,383 4,384 61,386 3,737 62,868 - GST1 2,820 117,030 1,599 76,233 1,688 51,594
Investigation 83 22,418 92 32,412 96 20,712
1 From FY2004/05, GST refund review cases will no longer be included in the GST audit figure.

APPENDIX 4PROFILE OF TAXPAYERS
ASSESSABLE INCOME OF INDIVIDUALS BY INCOME TYPEAS AT 31 MARCH 2007 FOR THE YEAR OF ASSESSMENT 2006
Total Taxable Group1 Non-Taxable Group S$’000 S$’000 S$’000
Income from Trade and Profession 4,259,693 3,460,177 799,516Employment Income 65,932,248 54,400,434 11,531,814Rent / Net Annual Value 1,095,922 840,283 255,639Dividends 3,285,138 1,700,378 1,584,761Interest 67,236 44,413 22,823Royalties 3,642 2,872 771Other Types 836,424 743,469 92,955 Total Income 75,480,305 61,192,026 14,288,278Less: Gifts to Approved Institutions 323,978 180,755 143,223 Assessable Income 75,156,326 61,011,271 14,145,055
Number of Individuals Assessed2 1,461,040 769,599 691,441
1 Taxable Group means those with tax payable after allowing rebates and tax set-offs. 2 The figure includes 76,289 tax clearance cases for non-citizens.
110 IRAS Annual Report 2006/07 GROWING A NATION, GROWING WITH THE NATION, GROWING WITH YOU.
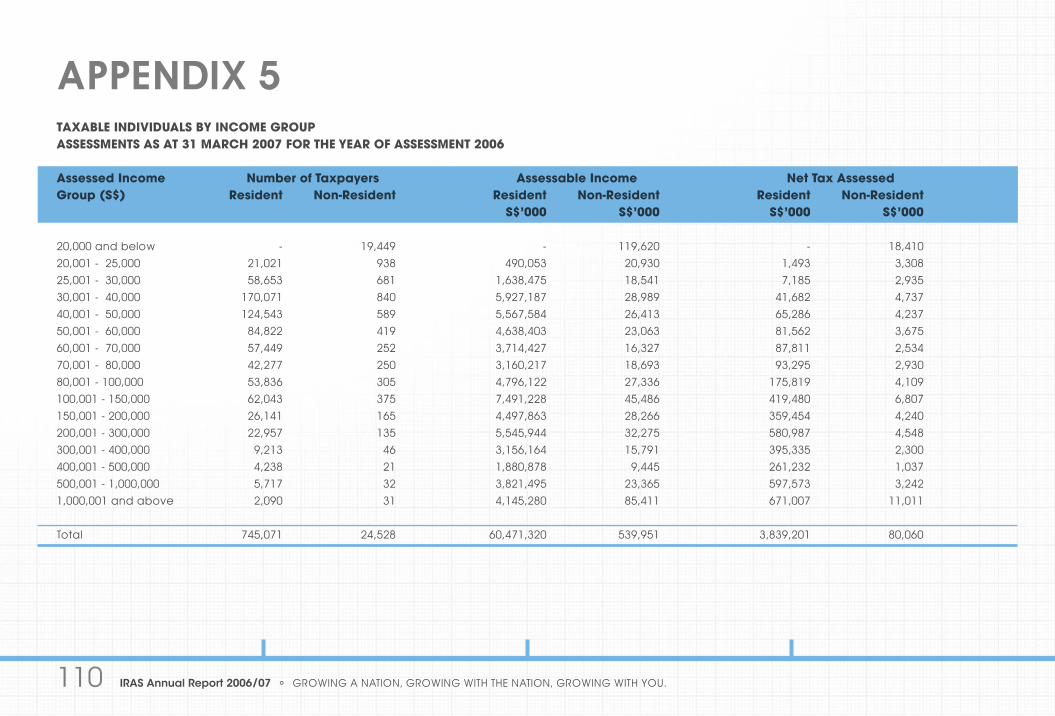
APPENDIX 5TAXABLE INDIVIDUALS BY INCOME GROUPASSESSMENTS AS AT 31 MARCH 2007 FOR THE YEAR OF ASSESSMENT 2006
Assessed Income Number of Taxpayers Assessable Income Net Tax Assessed Group (S$) Resident Non-Resident Resident Non-Resident Resident Non-Resident S$’000 S$’000 S$’000 S$’000 20,000 and below - 19,449 - 119,620 - 18,410 20,001 - 25,000 21,021 938 490,053 20,930 1,493 3,308 25,001 - 30,000 58,653 681 1,638,475 18,541 7,185 2,935 30,001 - 40,000 170,071 840 5,927,187 28,989 41,682 4,737 40,001 - 50,000 124,543 589 5,567,584 26,413 65,286 4,237 50,001 - 60,000 84,822 419 4,638,403 23,063 81,562 3,675 60,001 - 70,000 57,449 252 3,714,427 16,327 87,811 2,534 70,001 - 80,000 42,277 250 3,160,217 18,693 93,295 2,930 80,001 - 100,000 53,836 305 4,796,122 27,336 175,819 4,109 100,001 - 150,000 62,043 375 7,491,228 45,486 419,480 6,807 150,001 - 200,000 26,141 165 4,497,863 28,266 359,454 4,240 200,001 - 300,000 22,957 135 5,545,944 32,275 580,987 4,548 300,001 - 400,000 9,213 46 3,156,164 15,791 395,335 2,300 400,001 - 500,000 4,238 21 1,880,878 9,445 261,232 1,037 500,001 - 1,000,000 5,717 32 3,821,495 23,365 597,573 3,242 1,000,001 and above 2,090 31 4,145,280 85,411 671,007 11,011 Total 745,071 24,528 60,471,320 539,951 3,839,201 80,060
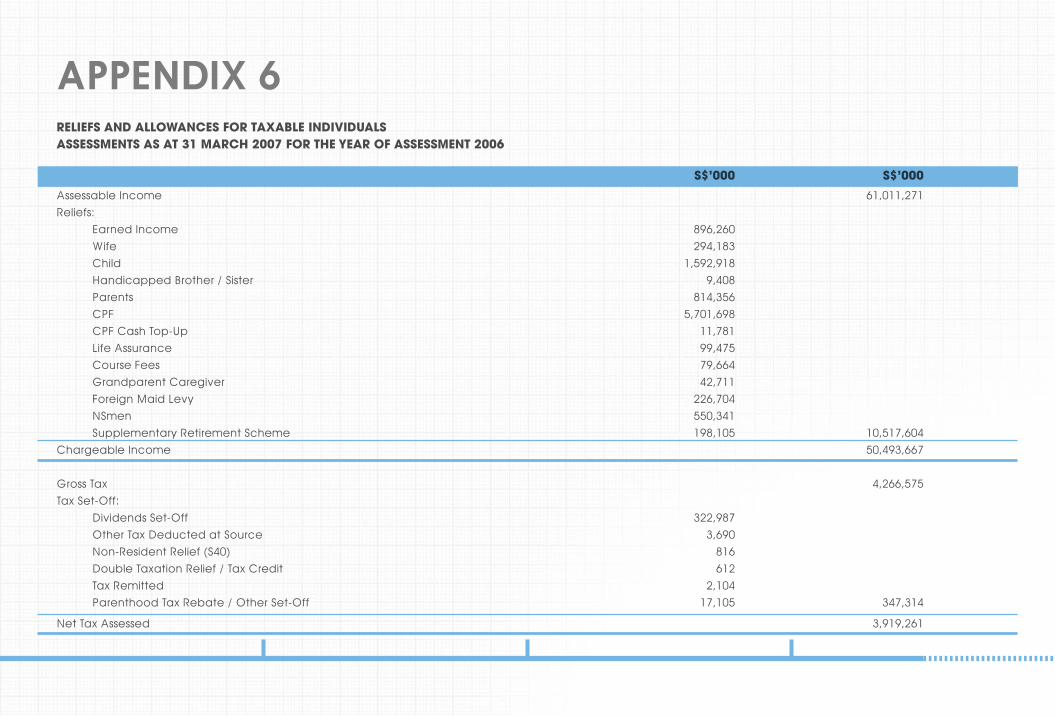
APPENDIX 6RELIEFS AND ALLOWANCES FOR TAXABLE INDIVIDUALSASSESSMENTS AS AT 31 MARCH 2007 FOR THE YEAR OF ASSESSMENT 2006
S$’000 S$’000
Assessable Income 61,011,271Reliefs: Earned Income 896,260 Wife 294,183 Child 1,592,918 Handicapped Brother / Sister 9,408 Parents 814,356 CPF 5,701,698 CPF Cash Top-Up 11,781 Life Assurance 99,475 Course Fees 79,664 Grandparent Caregiver 42,711 Foreign Maid Levy 226,704 NSmen 550,341 Supplementary Retirement Scheme 198,105 10,517,604 Chargeable Income 50,493,667
Gross Tax 4,266,575 Tax Set-Off: Dividends Set-Off 322,987 Other Tax Deducted at Source 3,690 Non-Resident Relief (S40) 816 Double Taxation Relief / Tax Credit 612 Tax Remitted 2,104 Parenthood Tax Rebate / Other Set-Off 17,105 347,314
Net Tax Assessed 3,919,261

112 IRAS Annual Report 2006/07 GROWING A NATION, GROWING WITH THE NATION, GROWING WITH YOU.
APPENDIX 7 ASSESSABLE INCOME OF COMPANIES BY INCOME TYPE AS AT 31 MARCH 2007
YEAR OF ASSESSMENT 2005 Taxable Group1 Non-Taxable Group S$’000 S$’000 Trade Income 41,455,372 22,244,230Rent / Net Annual Value 284,376 107,176 Dividends 1,249,941 1,623,052 Interest 265,822 74,681 Royalties 8,006 2,963 Other Types 46,550 30,310 Total Income 43,310,067 20,406,048Less: Gifts to Approved Institutions 18,463 76,668 Assessable Income 43,291,604 20,482,716 Number of Companies Assessed 29,095 80,653 YEAR OF ASSESSMENT 2006 Taxable Group1 Non-Taxable Group S$’000 S$’000
Assessable Income 46,433,157 9,319,118 Number of Companies Assessed 30,841 75,696
As at 31 March 2007, as the majority of assessments for Year of Assessment 2006 are estimated, details by income types are not meaningful. Breakdown by income types will be tabulated in the next report. 1 Taxable Group means those with tax payable after allowing tax set-offs.
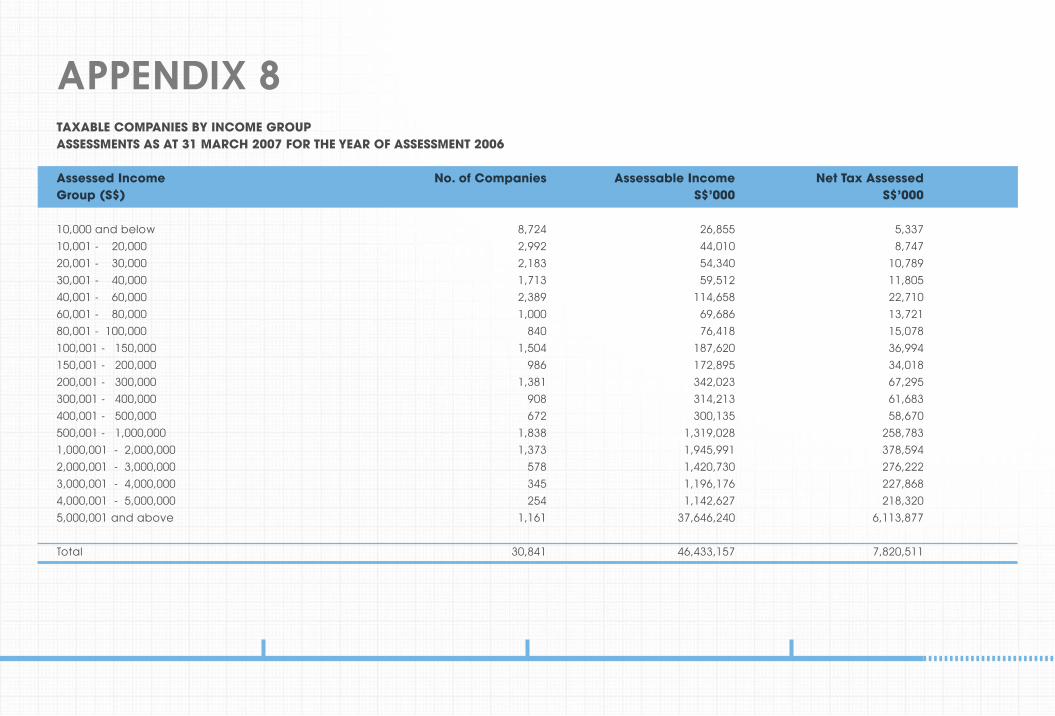
APPENDIX 8TAXABLE COMPANIES BY INCOME GROUPASSESSMENTS AS AT 31 MARCH 2007 FOR THE YEAR OF ASSESSMENT 2006
Assessed Income No. of Companies Assessable Income Net Tax AssessedGroup (S$) S$’000 S$’000
10,000 and below 8,724 26,855 5,337 10,001 - 20,000 2,992 44,010 8,747 20,001 - 30,000 2,183 54,340 10,789 30,001 - 40,000 1,713 59,512 11,805 40,001 - 60,000 2,389 114,658 22,710 60,001 - 80,000 1,000 69,686 13,721 80,001 - 100,000 840 76,418 15,078 100,001 - 150,000 1,504 187,620 36,994 150,001 - 200,000 986 172,895 34,018 200,001 - 300,000 1,381 342,023 67,295 300,001 - 400,000 908 314,213 61,683 400,001 - 500,000 672 300,135 58,670 500,001 - 1,000,000 1,838 1,319,028 258,783 1,000,001 - 2,000,000 1,373 1,945,991 378,594 2,000,001 - 3,000,000 578 1,420,730 276,222 3,000,001 - 4,000,000 345 1,196,176 227,868 4,000,001 - 5,000,000 254 1,142,627 218,320 5,000,001 and above 1,161 37,646,240 6,113,877 Total 30,841 46,433,157 7,820,511
114 IRAS Annual Report 2006/07 GROWING A NATION, GROWING WITH THE NATION, GROWING WITH YOU.
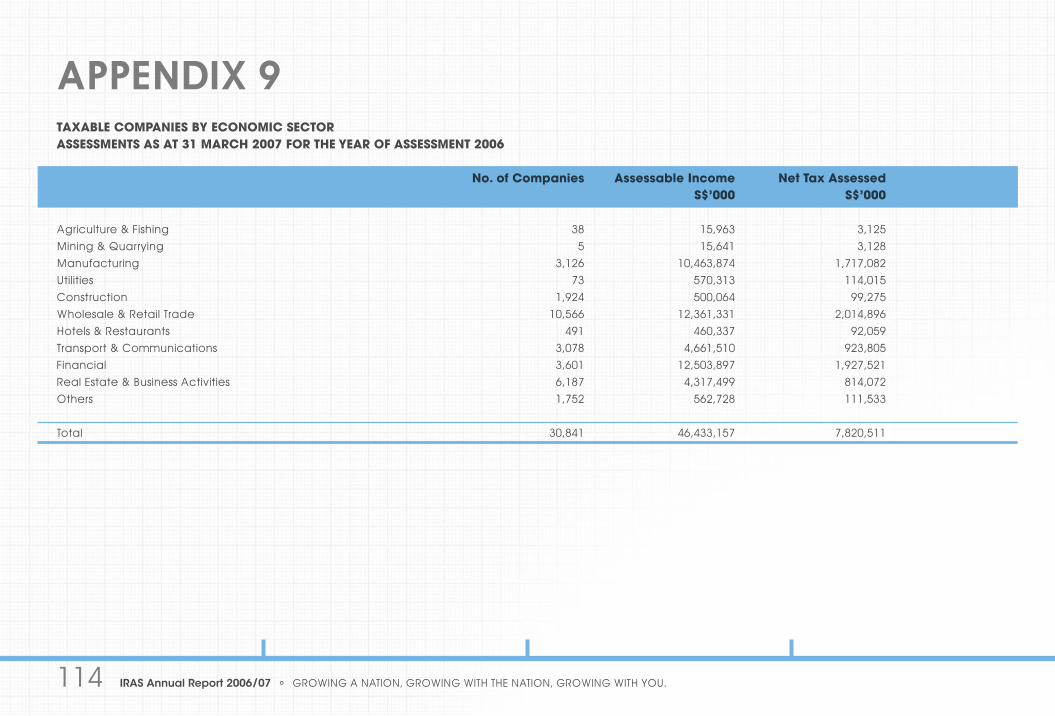
APPENDIX 9TAXABLE COMPANIES BY ECONOMIC SECTORASSESSMENTS AS AT 31 MARCH 2007 FOR THE YEAR OF ASSESSMENT 2006
No. of Companies Assessable Income Net Tax Assessed S$’000 S$’000
Agriculture & Fishing 38 15,963 3,125 Mining & Quarrying 5 15,641 3,128 Manufacturing 3,126 10,463,874 1,717,082 Utilities 73 570,313 114,015 Construction 1,924 500,064 99,275 Wholesale & Retail Trade 10,566 12,361,331 2,014,896 Hotels & Restaurants 491 460,337 92,059 Transport & Communications 3,078 4,661,510 923,805 Financial 3,601 12,503,897 1,927,521 Real Estate & Business Activities 6,187 4,317,499 814,072 Others 1,752 562,728 111,533 Total 30,841 46,433,157 7,820,511
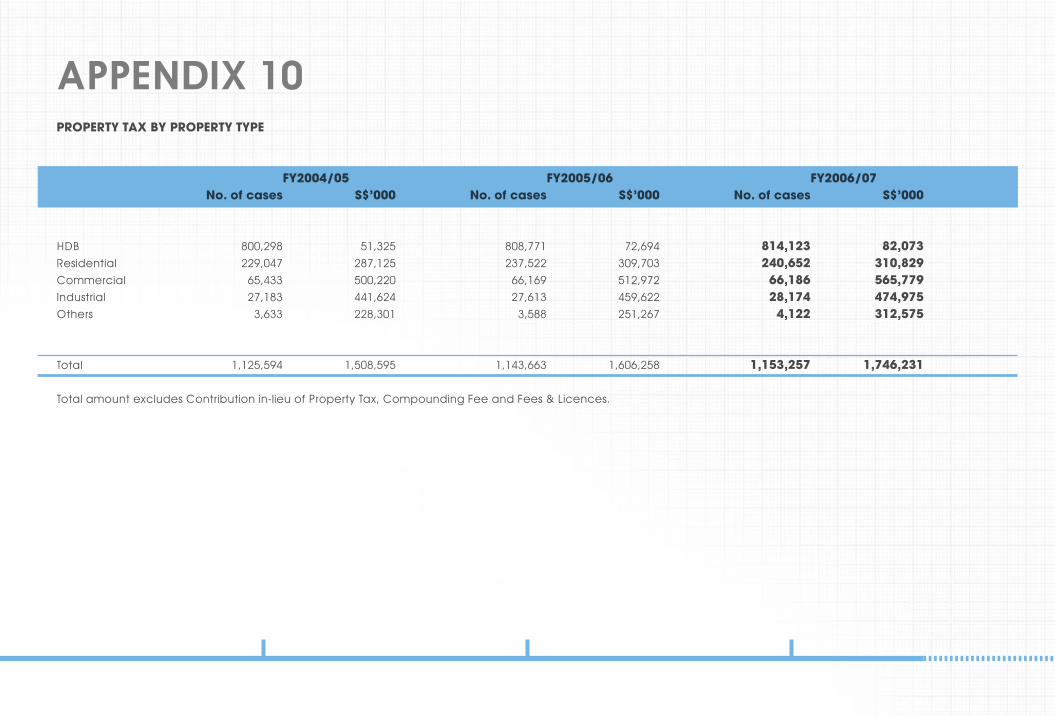
APPENDIX 10PROPERTY TAX BY PROPERTY TYPE
FY2004/05 FY2005/06 FY2006/07 No. of cases S$’000 No. of cases S$’000 No. of cases S$’000 HDB 800,298 51,325 808,771 72,694 814,123 82,073 Residential 229,047 287,125 237,522 309,703 240,652 310,829 Commercial 65,433 500,220 66,169 512,972 66,186 565,779 Industrial 27,183 441,624 27,613 459,622 28,174 474,975 Others 3,633 228,301 3,588 251,267 4,122 312,575 Total 1,125,594 1,508,595 1,143,663 1,606,258 1,153,257 1,746,231 Total amount excludes Contribution in-lieu of Property Tax, Compounding Fee and Fees & Licences.
116 IRAS Annual Report 2006/07 GROWING A NATION, GROWING WITH THE NATION, GROWING WITH YOU.
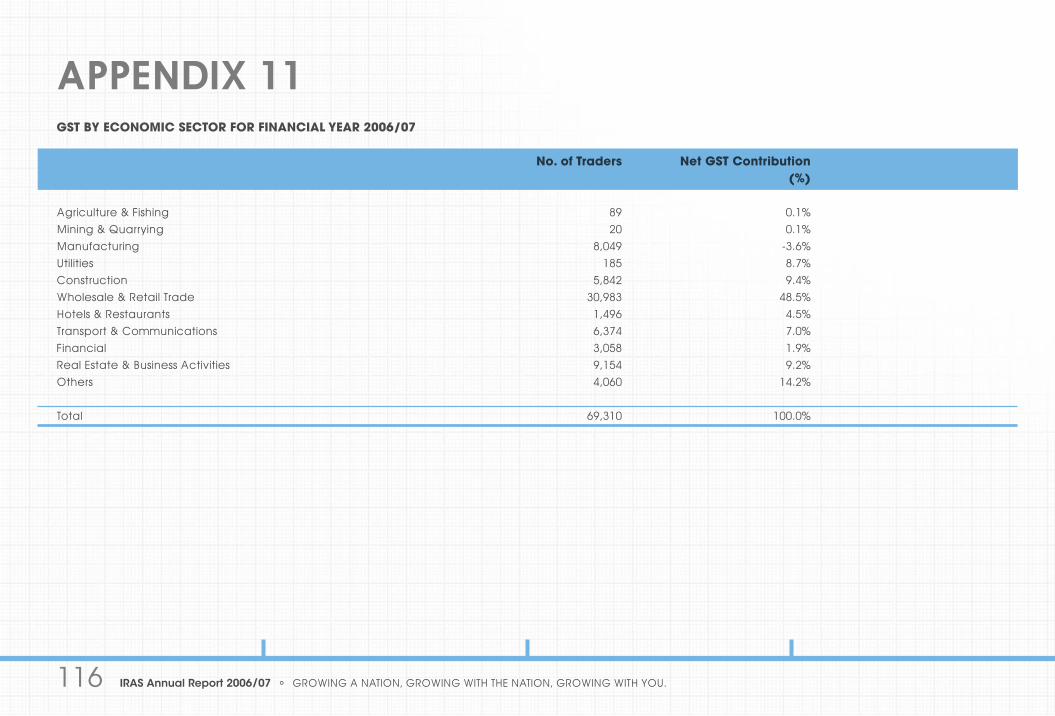
APPENDIX 11GST BY ECONOMIC SECTOR FOR FINANCIAL YEAR 2006/07
No. of Traders Net GST Contribution (%)
Agriculture & Fishing 89 0.1%Mining & Quarrying 20 0.1%Manufacturing 8,049 -3.6%Utilities 185 8.7%Construction 5,842 9.4%Wholesale & Retail Trade 30,983 48.5%Hotels & Restaurants 1,496 4.5%Transport & Communications 6,374 7.0%Financial 3,058 1.9%Real Estate & Business Activities 9,154 9.2%Others 4,060 14.2% Total 69,310 100.0%
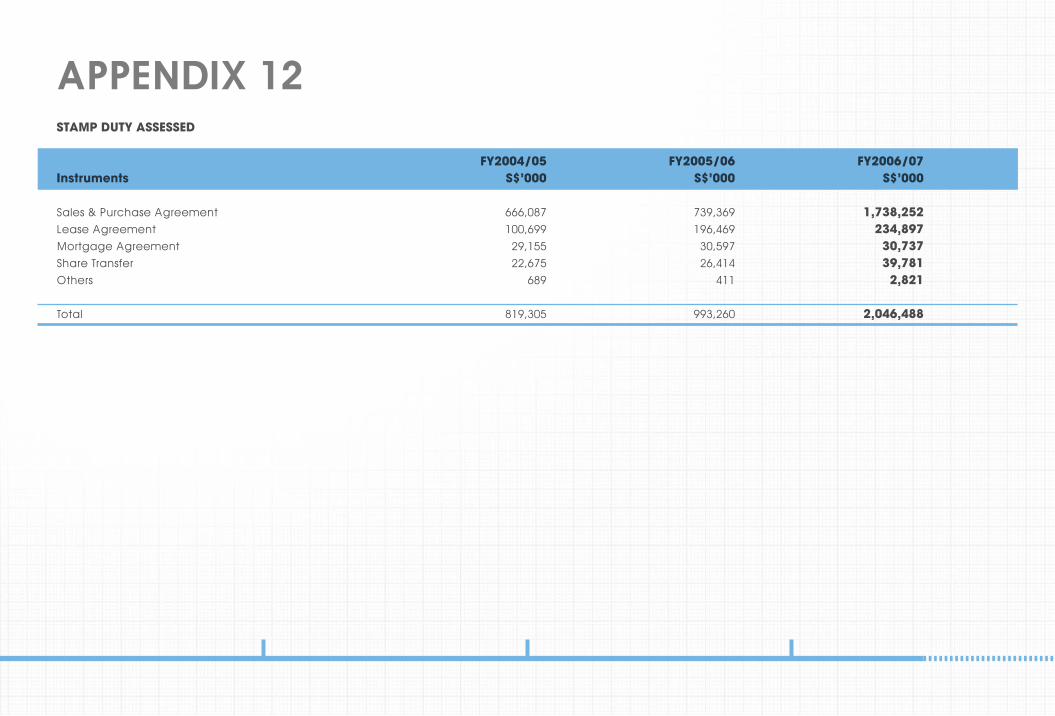
APPENDIX 12STAMP DUTY ASSESSED
FY2004/05 FY2005/06 FY2006/07Instruments S$’000 S$’000 S$’000 Sales & Purchase Agreement 666,087 739,369 1,738,252 Lease Agreement 100,699 196,469 234,897 Mortgage Agreement 29,155 30,597 30,737 Share Transfer 22,675 26,414 39,781 Others 689 411 2,821 Total 819,305 993,260 2,046,488
118 IRAS Annual Report 2006/07 GROWING A NATION, GROWING WITH THE NATION, GROWING WITH YOU.
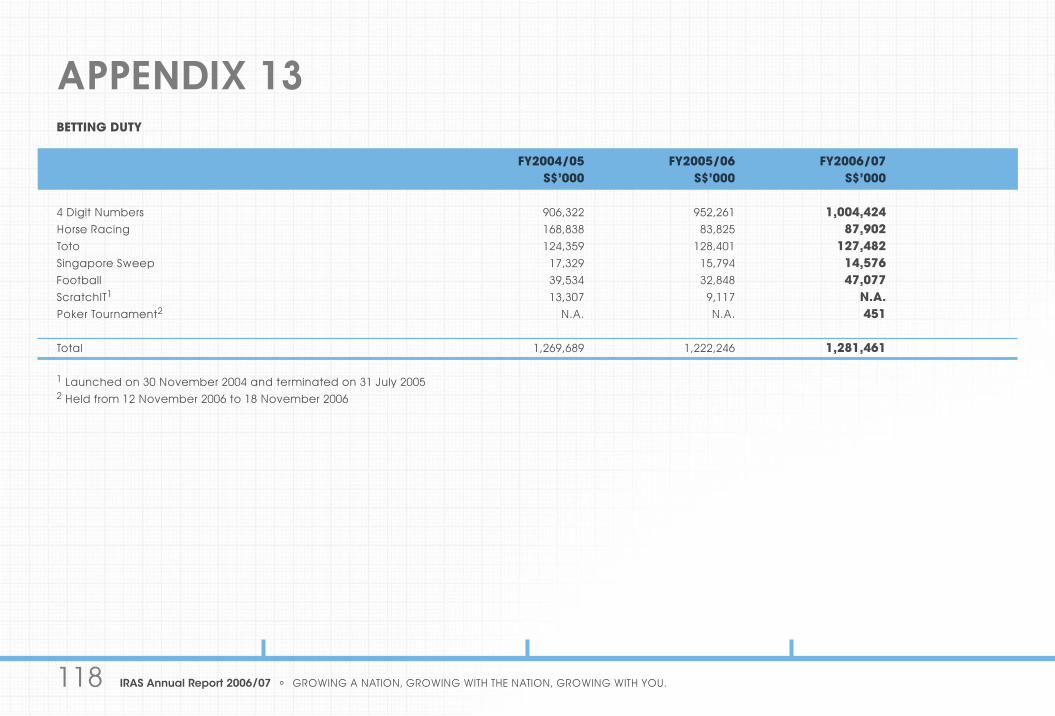
APPENDIX 13BETTING DUTY
FY2004/05 FY2005/06 FY2006/07 S$’000 S$’000 S$’000 4 Digit Numbers 906,322 952,261 1,004,424Horse Racing 168,838 83,825 87,902Toto 124,359 128,401 127,482Singapore Sweep 17,329 15,794 14,576Football 39,534 32,848 47,077ScratchIT1 13,307 9,117 N.A.Poker Tournament2 N.A. N.A. 451 Total 1,269,689 1,222,246 1,281,461 1 Launched on 30 November 2004 and terminated on 31 July 2005 2 Held from 12 November 2006 to 18 November 2006
APPENDIX 14
APPENDIX 15
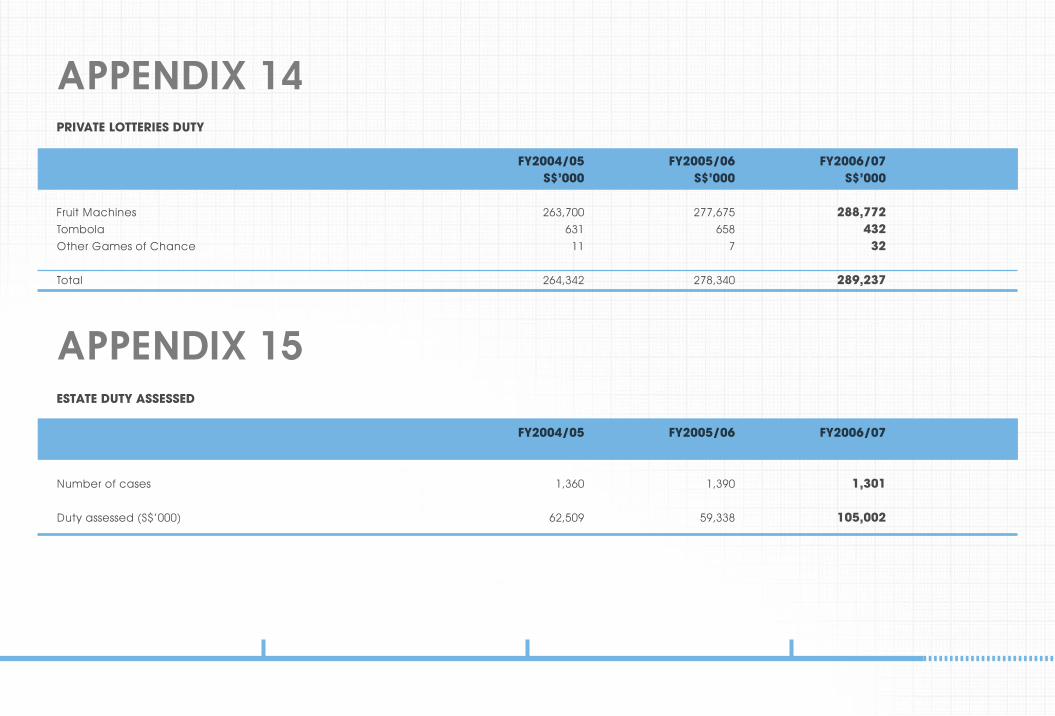
PRIVATE LOTTERIES DUTY
FY2004/05 FY2005/06 FY2006/07 S$’000 S$’000 S$’000
Fruit Machines 263,700 277,675 288,772 Tombola 631 658 432 Other Games of Chance 11 7 32 Total 264,342 278,340 289,237
ESTATE DUTY ASSESSED
FY2004/05 FY2005/06 FY2006/07
Number of cases 1,360 1,390 1,301 Duty assessed (S$’000) 62,509 59,338 105,002

120 IRAS Annual Report 2006/07 GROWING A NATION, GROWING WITH THE NATION, GROWING WITH YOU.
APPENDIX 16COMPLIANCE IN PAYMENT AND RETURN
TAX ARREARS 1
As at 31.3.05 As at 31.3.06 As at 31.3.07 S$’000 S$’000 S$’000
Income Tax Arrears arising in: Previous Financial Years 546,973 488,633 492,029 Current Financial Year 233,448 158,844 213,742 Total Arrears 780,421 647,477 705,771 Property Tax Arrears arising in: Previous Financial Years 31,561 22,757 22,412 Current Financial Year 48,605 35,402 55,620 Total Arrears 80,166 58,159 78,032 Goods & Services Tax Arrears arising in: Previous Financial Years 159,548 153,483 116,432 Current Financial Year 78,222 65,898 163,705 Total Arrears 237,770 219,381 280,137 Grand Total 1,098,357 925,017 1,063,940
1 The tax arrears exclude inactive arrears. Inactive arrears are those where all enforcement actions appropriate to these cases had been applied but tax recovery has not been successful. These cases include individuals who are bankrupt or deceased; and companies which were struck off, ceased registration, dissolved, in receivership, liquidated or under judicial management.
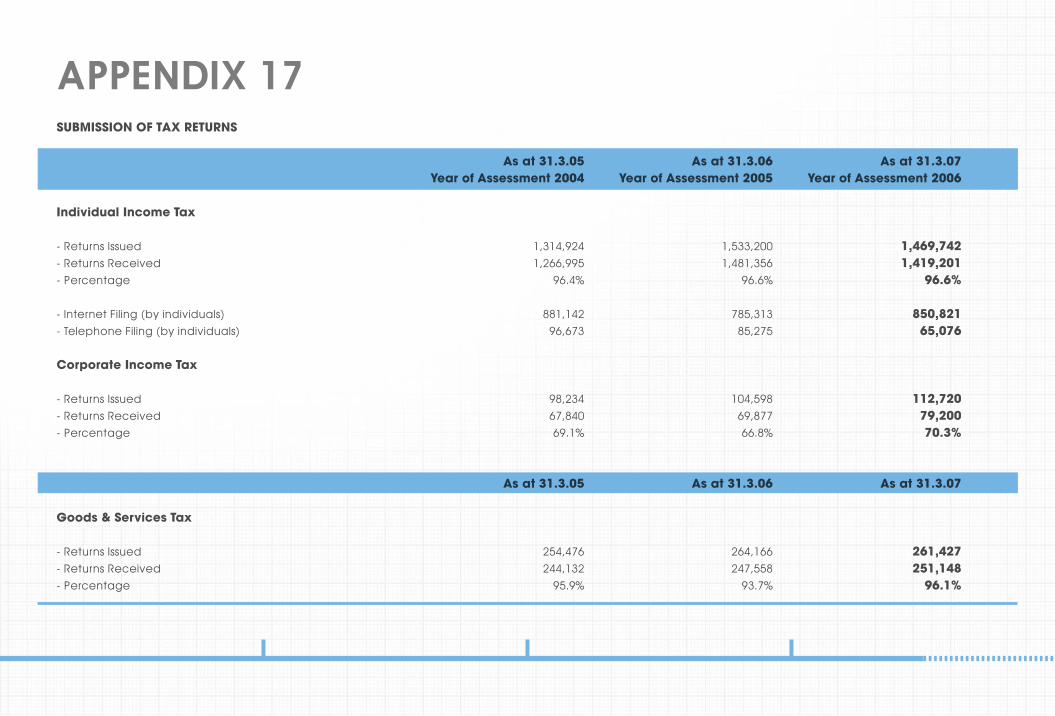
APPENDIX 17SUBMISSION OF TAX RETURNS
As at 31.3.05 As at 31.3.06 As at 31.3.07 Year of Assessment 2004 Year of Assessment 2005 Year of Assessment 2006 Individual Income Tax
- Returns Issued 1,314,924 1,533,200 1,469,742 - Returns Received 1,266,995 1,481,356 1,419,201 - Percentage 96.4% 96.6% 96.6% - Internet Filing (by individuals) 881,142 785,313 850,821 - Telephone Filing (by individuals) 96,673 85,275 65,076 Corporate Income Tax
- Returns Issued 98,234 104,598 112,720 - Returns Received 67,840 69,877 79,200 - Percentage 69.1% 66.8% 70.3%
As at 31.3.05 As at 31.3.06 As at 31.3.07 Goods & Services Tax
- Returns Issued 254,476 264,166 261,427 - Returns Received 244,132 247,558 251,148 - Percentage 95.9% 93.7% 96.1%
122 IRAS Annual Report 2006/07 GROWING A NATION, GROWING WITH THE NATION, GROWING WITH YOU.
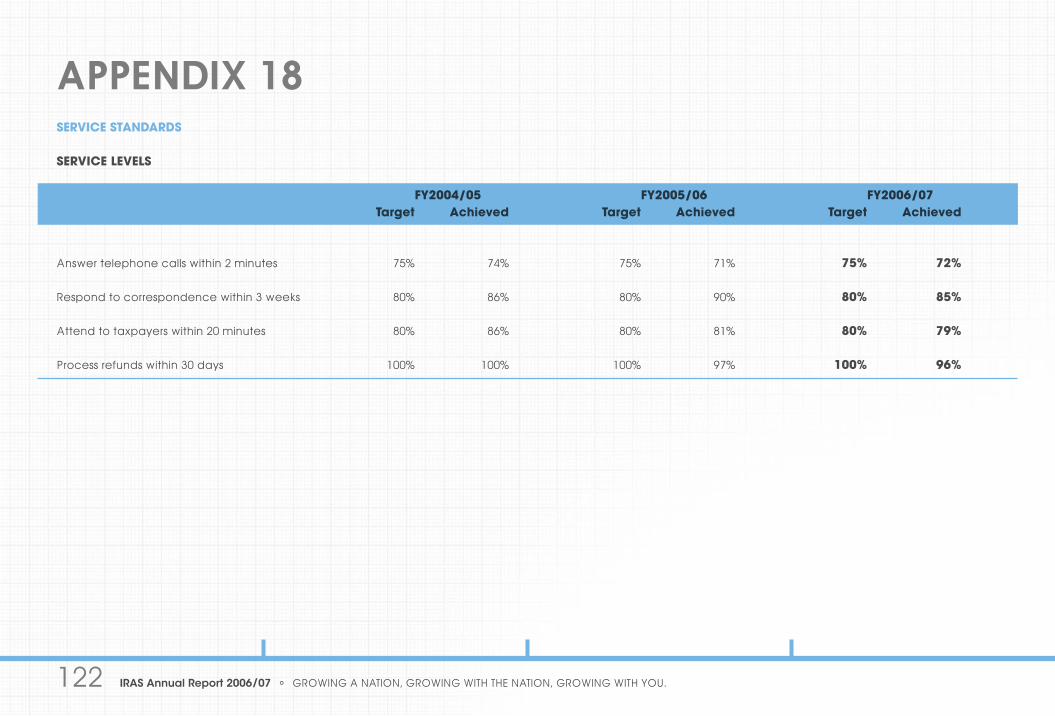
APPENDIX 18SERVICE STANDARDS SERVICE LEVELS
FY2004/05 FY2005/06 FY2006/07 Target Achieved Target Achieved Target Achieved Answer telephone calls within 2 minutes 75% 74% 75% 71% 75% 72% Respond to correspondence within 3 weeks 80% 86% 80% 90% 80% 85% Attend to taxpayers within 20 minutes 80% 86% 80% 81% 80% 79% Process refunds within 30 days 100% 100% 100% 97% 100% 96%
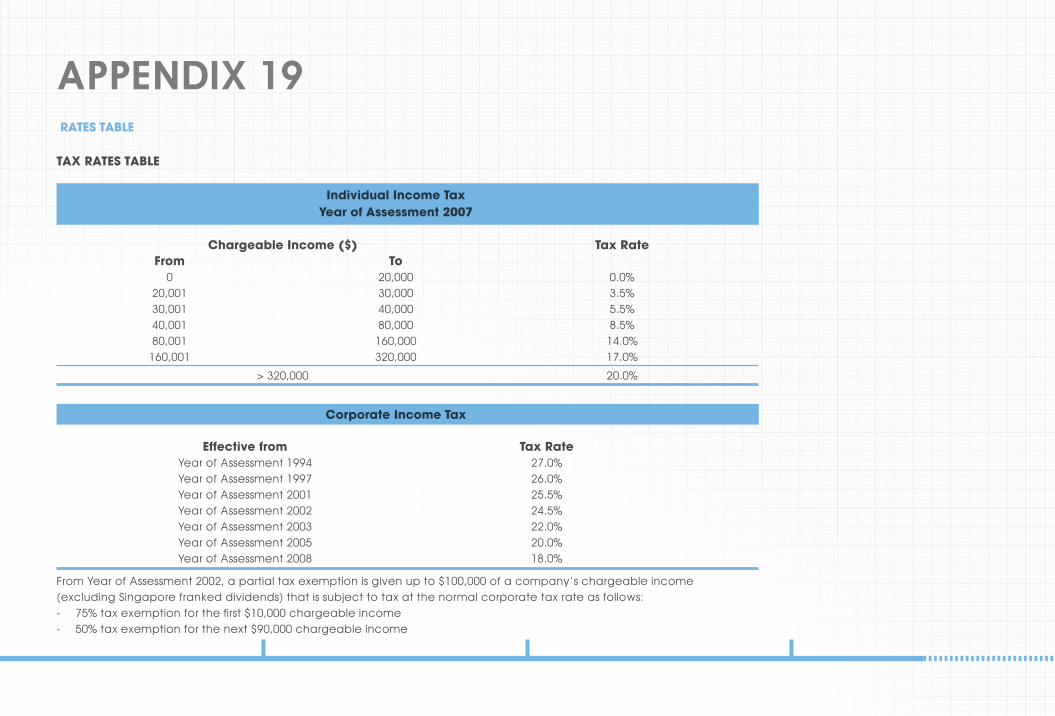
Corporate Income Tax Effective from Tax Rate Year of Assessment 1994 27.0% Year of Assessment 1997 26.0% Year of Assessment 2001 25.5% Year of Assessment 2002 24.5% Year of Assessment 2003 22.0% Year of Assessment 2005 20.0% Year of Assessment 2008 18.0%
RATES TABLE
TAX RATES TABLE
Individual Income Tax Year of Assessment 2007
Chargeable Income ($) Tax Rate From To 0 20,000 0.0% 20,001 30,000 3.5% 30,001 40,000 5.5% 40,001 80,000 8.5% 80,001 160,000 14.0% 160,001 320,000 17.0%
> 320,000 20.0%
APPENDIX 19
From Year of Assessment 2002, a partial tax exemption is given up to $100,000 of a company’s chargeable income (excluding Singapore franked dividends) that is subject to tax at the normal corporate tax rate as follows:- 75% tax exemption for the first $10,000 chargeable income- 50% tax exemption for the next $90,000 chargeable income
124 IRAS Annual Report 2006/07 GROWING A NATION, GROWING WITH THE NATION, GROWING WITH YOU.
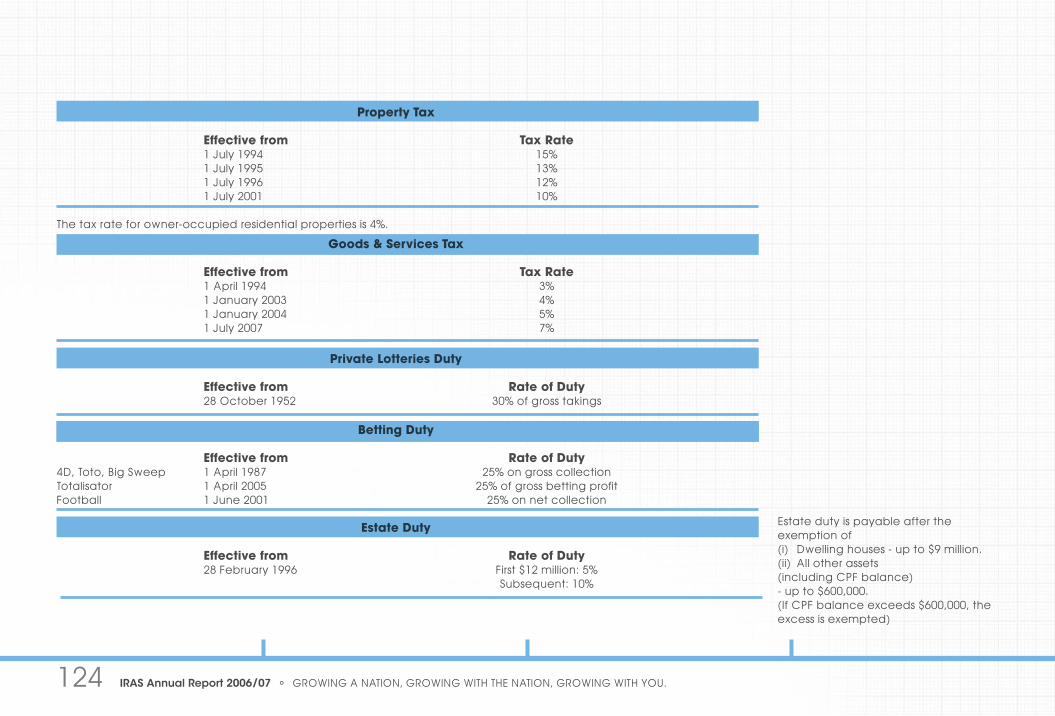
Property Tax Effective from Tax Rate 1 July 1994 15% 1 July 1995 13% 1 July 1996 12% 1 July 2001 10%
The tax rate for owner-occupied residential properties is 4%.
Goods & Services Tax
Effective from Tax Rate 1 April 1994 3% 1 January 2003 4% 1 January 2004 5% 1 July 2007 7%
Private Lotteries Duty
Effective from Rate of Duty 28 October 1952 30% of gross takings
Betting Duty
Effective from Rate of Duty4D, Toto, Big Sweep 1 April 1987 25% on gross collectionTotalisator 1 April 2005 25% of gross betting profitFootball 1 June 2001 25% on net collection
Estate Duty
Effective from Rate of Duty 28 February 1996 First $12 million: 5% Subsequent: 10%
Estate duty is payable after the exemption of(i) Dwelling houses - up to $9 million.(ii) All other assets (including CPF balance) - up to $600,000. (If CPF balance exceeds $600,000, the excess is exempted)
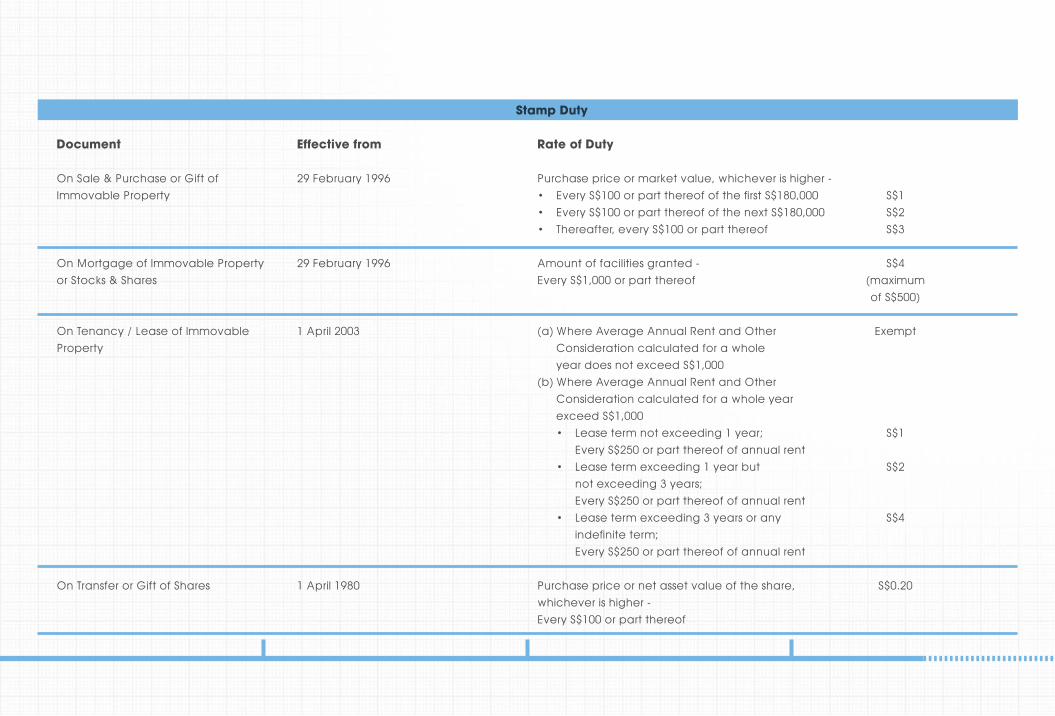
Stamp Duty
Document
On Sale & Purchase or Gift of Immovable Property
On Mortgage of Immovable Property or Stocks & Shares
On Tenancy / Lease of Immovable Property
On Transfer or Gift of Shares
Effective from
29 February 1996
29 February 1996
1 April 2003
1 April 1980
Rate of Duty
Purchase price or market value, whichever is higher - • Every S$100 or part thereof of the first S$180,000 S$1• Every S$100 or part thereof of the next S$180,000 S$2• Thereafter, every S$100 or part thereof S$3
Amount of facilities granted - S$4 Every S$1,000 or part thereof (maximum of S$500) (a) Where Average Annual Rent and Other Exempt Consideration calculated for a whole year does not exceed S$1,000 (b) Where Average Annual Rent and Other Consideration calculated for a whole year exceed S$1,000 • Lease term not exceeding 1 year; S$1 Every S$250 or part thereof of annual rent • Lease term exceeding 1 year but S$2 not exceeding 3 years; Every S$250 or part thereof of annual rent • Lease term exceeding 3 years or any S$4 indefinite term; Every S$250 or part thereof of annual rent
Purchase price or net asset value of the share, S$0.20whichever is higher -Every S$100 or part thereof
126 IRAS Annual Report 2006/07 GROWING A NATION, GROWING WITH THE NATION, GROWING WITH YOU.
Images courtesy of:
Gongshang Primary SchoolHousing & Development BoardMinistry of Information, Communications and the ArtsNational Archives of SingaporeSin Min Primary SchoolSingapore General HospitalSingapore Mass Rapid TransitFrederick William York
Related Documents


