Appalachia Coal Mining-to Marketing Training September 24, 2015 NETL Pittsburgh, PA

Welcome message from author
This document is posted to help you gain knowledge. Please leave a comment to let me know what you think about it! Share it to your friends and learn new things together.
Transcript

Appalachia Coal Mining-to Marketing Training
September 24, 2015
NETL Pittsburgh, PA

10/15/2015
1
National Energy Technology Laboratory
Driving Innovation ♦ Delivering Results
Mike Mosser
Project ManagerU.S. Department of Energy
National Energy Technology Laboratory
U.S. Coal Mining Methods Deployed in
the United States
2National Energy Technology Laboratory
Presentation Outline
• Statistics
• Coal Characteristics
• Coal Mining Methods– Underground Mining
– Surface Mining
• Coal Preparation
• Environmental– Reclamation

10/15/2015
2
3National Energy Technology Laboratory
Statistics – World Coal Reserves
• U.S. has the highest coal recoverable reserve – 237 billion tons
– Enough for mining 200 ‐ 300 years
– Only the good seams are mined currently
• China has the third largest reserve – 115 billion short tons
– 50 more years
4National Energy Technology Laboratory
Statistics – World Coal Production
• China: No. 1 coal producer– 2002: 1,380 million tons
– 2004: 1,950 million tons
– 2013: 3,561 million tons
• U.S.: No. 2 coal producer– 2002: 998 million tons
– 2013: 904 million tons
• India: No. 3 coal Producer– 2002: 356 million tons
– 2013: 613 million tons
PR China 3561Mt Russia 347Mt
USA 904Mt South Africa 256Mt
India 613Mt Germany 191Mt
Indonesia 489Mt Poland 143Mt
Australia 459Mt Kazakhstan 120Mt
Top 10 Coal Producing Countries
World Coal Association

10/15/2015
3
5National Energy Technology Laboratory
Statistics – U.S. Coal Fields
Average Heat Value• Anthracite
12,700 BTU/lb
• Bituminous 13,100 BTU/lb
• Sub‐bituminous 9,500 BTU/lb
• Lignite 6,700 BTU/lb
usgs.gov
6National Energy Technology Laboratory
Coal Production in the U.S.

10/15/2015
4
7National Energy Technology Laboratory
Coal Power Sector Generation
8National Energy Technology Laboratory
Some General Facts
Surface Mining 67%
Underground Mining 33%
Longwall mining 50%
Continuous mining 45%
Conventional mining 4.5%
Others 0.5%
Coal Mining Methods (2013 by Annual Production)
Source: energy information administration (EIA)

10/15/2015
5
9National Energy Technology Laboratory
Coal Mining Industry
• Main features of U.S. mines
– No or very few non‐production personnel at mine level (e.g., about 300 employees at Cumberland Mine producing 6.5 million tons clean coal/year)
– Mine life varies from several years to 30 years depending on the reserves and market forces
– Mine size varies from several thousand tons to 111 million tpy
– Common design tasks handled at corporate level
– Contractors are heavily used for special or difficult tasks
10National Energy Technology Laboratory
Coal Mining Industry
• Main challenges of the U.S. Coal Industry– Mine Safety is first priority
– Ground control problems
• Roof falls, cutter roof, floor heaving
• Entry stability in deep mines (>500 m)
• Surface subsidence, especially in the east, mid west
• Longwall tail entry support
– Environment limitations
• Air and water pollution
• Permitting issues
• Environment groups
– Depletion of good coal and good geologic conditions
– Competition from gas industry
– Longwall mine production limited by ventilation capability

10/15/2015
6
11National Energy Technology Laboratory
Safety is Important Phase of Mining Methods
Raspadskaya Mine, Russia March 2010 – 66 killed
12National Energy Technology Laboratory
Coal Mining Methods
Uky.edu

10/15/2015
7
13National Energy Technology Laboratory
Underground Coal Mining Methods
• Room and pillar method
– Very flexible, good for mining small and irregular reserves
– Development mining only
• Low recovery ratio, normally < 50 %
• Not intend to cause surface subsidence
– Development with pillar retrieving
• Pillars are partially recovered
• Higher recovery ratio
• Normally cause immediate surface subsidence
– Traditional (Drill, blast, load and haul operations) almost none now
– Continuous miner (Miner = cut and load, hauling remains to be only non‐continuous operation)

10/15/2015
8
15National Energy Technology Laboratory
Early Coal Mining Methods
16National Energy Technology Laboratory
Underground Coal Mining Methods
Traditional and Continuous Miner Room and Pillar Mining Methods

10/15/2015
9
17National Energy Technology Laboratory
Continuous Mining Machine
18National Energy Technology Laboratory
Underground Coal Mining Methods
Continuous Miner
Shuttle Car
Joy Manufacturing

10/15/2015
10
19National Energy Technology Laboratory
Underground Coal Mining Methods
Dual Boom Roof Bolter with TRS
Miner Bolter
Roof bolting operation could be the bottleneck for room and pillar mining operations
20National Energy Technology Laboratory
Longwall Method Panel Layout
MAINS
BLEEDERS
SR
SR
SR
SR
SR
RR
RR
RR
RR
No. 3 Panel
Direction of Mining
No. 5 Panel
RR B.P.
B.P.
B.P.
B.P.
B.P.
No. 4 Panel
W
WP
H
T
L

10/15/2015
11
21National Energy Technology Laboratory
Underground Coal Mining Methods
A Longwall Face in a Coal Mine
A Double Drum Longwall Shearer
22National Energy Technology Laboratory
Underground Coal Mining Methods
Longwall Shield
Battery HaulerMajor equipment for speedy longwall move

10/15/2015
12
23National Energy Technology Laboratory
Longwall Panel Development
• Primary support are roof bolts which are installed on cycle during development
23
24National Energy Technology Laboratory
Longwall Panel Development
• Roof bolting key to the success of high productive longwall mining
• About 100 million pieces of roof bolts consumed per year in U.S.– Mechanical bolts 40%
– Resin bolts 40%
– Specialty bolts. 20%
• Bolt length– Bolt length: 4 ft (1.2 m) ~ 16 ft (4.9 m)
– Max. bolt length < Mining height.
– If bolt length is longer than mining height, bolt notch or sectioned bolts (normally 4 ft 1) are used.
– Majority are 1.5–2.5 m long.

10/15/2015
13
25National Energy Technology Laboratory
Underground Coal Mining Methods
• Longwall Mining Method– All equipment becomes larger and more automated
• 40 inches (1.07 m) cutting web
• 1,000‐ton shields
• Wider shield (5.5 ft or 1.68 m)
• 2‐leg shields
• 72 inches (1.83 m) belt conveyors, 6,000 tons/hour capacity
• Batch shield moving system (8–10 shield per one operation)
• Fewer workers in one crew (5–6 persons per shift)– 2 shearer operators– 1 shield operator– 1 headgate operator– 1 mechanic – 1 helper (optional)
26National Energy Technology Laboratory
Longwall Mines 2014
• No. of Longwall Mines – 42
• No. of Longwall Faces – 47
• Ave. U.S. Longwall mine produces 4.4 million tpy
• Ave. cutting height 91.4 inches
• Ave. Panel width – 1,228 ft.
• Ave. panel length – 12,117 ft.
• 17 walls operate in the Pittsburgh coal seam
• Max. overburden on average reaches 1,145 ft.
• Deepest longwall is 3,000 ft. overburden (West Ridge, Utah)
• Top 3 operators are Murray Energy, CONSOL Energy, and Foresight Energy
• State of WV has 13 faces, PA has 7, Illinois has 7 and Alabama has 5
• Highest horse power shear has 2,805 HP
• CONSOL Bailey and Enlow Fork produced 12.3 million tons of clean coal
Coalage.com

10/15/2015
14
27National Energy Technology Laboratory
Longwall Mines
• Daily advance rate– Range: 15–35 m/day
– Average: 23 m/day
• Daily production: 18,000 tons (4 million tons/year)
• Main reasons– Favorite conditions for longwall mining: inclination <5o, height most
between 1.4 ~ 2.1 m
– Relatively shallow overburden: average about 240 m
– Low gassy mines
– Normally single seam mining
– Equipment automation
– Mixing of room & pillar and longwall mining methods: Longwall in good areas and R & P in left‐over areas.
28National Energy Technology Laboratory
Mountaineer II Mine, WV – Mining Two Seams With Different Methods
FACE16
FACE14
FACE13
GATE17
GATE16
GATE15
FACE12
GATE14
LW16
LW14
LW13
LW12
FA
CE
11
FA
CE
10
FA
CE
9
FA
CE
8
FA
CE
7F
AC
E6
MA
IN
GATE7
GATE8
GATE9
GATE10
GATE11
GATE12
GATE13
LW6
LW7
LW8
LW9
LW10
LW11
FA
CE
1
FA
CE
2
FA
CE
3
FA
CE
4
GATE1
GATE2
GATE3
GATE4
GATE5
LW1
LW2
LW3
LW4
GATE18
FA
CE
15
GATE20
GATE19
LW15
LW17
LW18
E LE VA TO R SH AF T
P RO P OS E D A IR S HA F TS
C ED A R G R OV E SH AF T
T O P EL E V. -105 0 ft .B O TT O M EL EV .-7 30 ft.DE PT H -32 0 f t.
GAT E _3
GA T E _4
GA T E_ 5
L W_ 2
FAC E_2
F ACE _3
L W_ 3
LW_ 4
F ACE_4
BL EEDER SH AFT
B L EE D ER _1
B LE E DE R_ 2
F ACE_6
F ACE_7
R OOMS_
1
R OOMS
_ 2
ROOM S_6
RO OMS_5
R OOMS _4
ROOM S_3
ROOMS _7
R OOMS_ 8
ROOM S_9
RO OMS_10
ROOMS _11
ROO MS_12
RO OMS_13
FACE_ 8
R OOMS_1 4ROO MS_15ROOM S_16RO OMS_17
GA T E _1 1
FAC E_9
ROOMS _18
ROOM S_19
RO OMS_20
ROOMS _21
ROOM S_22
RO OMS_23
GA T E _12
FACE_1 0
GA T E _1 3
F ACE_11
R OOMS_2 4
ROOMS _25
ROO MS_26
R OOMS_ 27
L W_1 0
L W_ 11
ROOMS _7ROOMS _7ROOMS _7ROOMS _7ROOMS _7ROOMS _7ROOMS _7ROOMS _7
GAT E _1
GAT E _2
ROOMS _7ROOMS _7ROOMS _7ROOMS _7ROOMS _7ROOMS _7ROOMS _7ROOMS _7
FA C E_ 16
F ACE_ 14
F ACE_ 13
F AC E _1 2
FACE_ 15
ROOMS _7ROOMS _7ROOMS _7ROOMS _7ROOMS _7
LW _ 12
LW _1 3
L W_ 14
L W_ 16
ROOMS _7ROOMS _7ROOMS _7ROOMS _7ROOMS _7
G AT E _16
GA T E_ 17
ROOMS _7ROOMS _7
FA CE _17
FAC E_1 8
G A TE _ 21
L W_ 17
LW_ 1 8
G A TE _ 22
G A T E_ 23
R O OM S _36
R O O MS _3 7
ROO M S_ 38
RO O M S_ 39
R O OMS _40
R OOM S_ 41
RO O M S_4 2
ROO MS_43
ROOM S_44
R OOMS_45
RO OMS_46
R OOMS_47
RO OMS_48
R OOMS_49
ROO MS_50
ROOMS _51
ROOMS_52
ROOMS _53
ROO MS_54
R OOMS_55ROOMS _56
ROOMS _7
S U B MAI N_ 2
S U B MAI N_ 2
S UB M AIN _3
PA N E L_ 24
P A N E L_ 25
P A N E L_ 26
P A NE L _2 9
P A N EL _ 28
P A N EL _ 27
P A NE L _3 0
P A NE L _3 1
P AN E L _3 2
P AN E L _3 3
P AN E L _34
P ANE L_4 5
P ANEL_4
4
PANEL
_ 43
PA NEL _46
PA NEL _47
PANEL
_4 8
PA NEL _49
P AN EL_5 0
P ANE L_
51
PAN EL_
52
P AN EL_5 3
PAN EL_
54
P AN EL _3 6
P AN E L_3 7
P AN E L_38
P AN E L_3 9
P AN E L_ 40
P ANE L_ 41
P AN E L_ 42
P ANEL_69PA NEL_68PAN EL_67
FA CE_ 1
ROOMS _7ROOMS _7ROOMS _7ROOMS _7ROOMS _7ROOMS _7ROOMS _7ROOMS _7ROOMS _7ROOMS _7ROOMS _7
GA TE _ 20
GA T E _1 9
G A TE _1 8
L W_ 15
ROOMS _7ROOMS _7ROOMS _7ROOMS _7ROOMS _7ROOMS _7ROOMS _7ROOMS _7ROOMS _7
G AT E_ 14
GA TE _1 5
S LOP E_B OT
RO OMS_28
R OOMS_ 29
ROO MS_30
RO OMS_31
ROOMS _33R OOMS_ 32
M AIN _ 5-3
M AI N_ 5- 3_1
MAI N_5 -4
M AIN _ 5-3
ROOMS _7
S UB MA IN_4
M AIN _ 6
S UBMA IN_ 5
L W_ 1
MA IN _ 5- 1
MA IN _ 5-2
S UB MA IN_4
PA NEL_55
P ANEL_56
PANEL_57
PANEL_5 8
PANEL _59
PANE L_60
PAN EL_61
PANEL_63
PANEL_6 4
PANEL _65
PAN EL_67PANE L_66
PA NEL_68
P ANEL_69
M AIN _ 6
P AN E L_ 42
P ANE L_ 41
P AN E L_ 40
P AN E L_3 9
P AN E L_38
P AN E L_3 7
P AN EL _3 6
P AN EL _3 5
S UB M AIN _3
S U B MAI N_ 2
S UBMA IN_ 5
MAIN_
1
MA I N_ 7
P ANEL_62
MAIN_
8
ROOMS _7
MAIN_3
MA IN_4
MAIN_3
MAIN_
4- 1
GA TE _ 9
GAT E _ 10
L W_ 6
L W_ 7
L W_8
L W_9
ROO MS_1
RO OMS_2
ROOMS _3
ROO MS_4
RO OMS_5
ROOMS _6
RO OMS_7
R OOMS_8
ROOM S_9
ROO MS_10
R OOMS_ 11
ROOM S_12
ROO MS_13
R OOMS_ 14
ROOM S_15
RO OMS_16
ROOMS _17
ROO MS_18
R OOMS_1 9
ROOMS _20
ROO MS_21
R OOMS_ 22
ROOM S_23
ROOM
S_23-1
ROO MS_2_1ROOM S_1_1
ROOM S_4_1RO OMS_3 _1
ROO MS_16_1ROOMS _15_1RO OMS_14_ 1ROO MS_13_1R OOMS_ 12_1ROO MS_11_1ROOMS _10_1R OOMS_ 9_1RO OMS_8_ 1ROOM S_7_1R OOMS_6 _1RO OMS_5_1
R OOMS_ 23_1ROO MS_22_1ROOMS _21_1R OOMS_ 20_1ROO MS_19_1ROOMS _18_1RO OMS_17 _1
ROOMS _7
GA T E_ 7
GA T E _8
S UB MA IN_ 1
ROOMS _7ROOMS _7
M AIN_2
X 837BM
821BM
X
GNIHSAW
NAGOL
934BM
X
BM 855 X
X811BM
806BMX
823XBM
796BMX
NOT
948BM
X
X 918BM
903BM
X
873BM
X854X
BM848
XBM
BM990
X
BM1008 X
B IA S T RA CT
300
FT
CE ME TERY
300 F
T
A LMAA IR SHAF T
B IA S T RA CT
300
FT
CE ME TERY
300 F
T
A LMAA IR SHAF T
N
NAY
854BM X
AGOL
934BM
X
BM 855 X
X811BM
806BMX
823XBM
X 918BM
903BMX
873BM
X854X
BM848
XBM
BMX1021
BM990
X
BM1008 X
BM BM1095 X
PANEL 1
PANEL 3
PAN
EL 2
PANEL 8PANEL 12
PANEL 35PANEL 36PANEL 37PANEL 38
PANEL 149PANEL 148
PANEL 147
PANEL 31
PANEL 146
PANEL 63PANEL 62
PANEL 39
PANEL
40PAN
EL 41
PANEL
42
PAN
EL 43
PANEL
67PAN
EL 69
PANE
L 71
PANEL
73P
ANEL 75
PANEL
77PA
NEL 79
PANEL 61PANEL 60PANEL 59PANEL 58PANEL 57PANEL 56PANEL 55PANEL 54PANEL 53PANEL 52PANEL 51PANEL 50PANEL 49PANEL 48PANEL 47PANEL 46PANEL 45PANEL 44PANEL 82
PANEL 128PANEL 127
PANEL 126PANEL 125
PANEL 124PANEL 123PANEL 122
PANEL 121PANEL 112
PANEL 131PANEL 130
PANEL 129
#1 M
AINS
P 4
P 5
P 6
P 7
P 9
10
11
13P
14P 1
5
P 16
P 1
7P
18
P 19
PANEL 20
21
P 2
2P
23
24
25
26
27
28
29
30
P 32
P 3
3P
34
PANEL 83PANEL 84PANEL 85PANEL 86PANEL 87PANEL 88PANEL 89
P 94
P 95
P 96PA
NEL 97
PANEL 98
PANEL 99
PANE
L 100P
ANEL 101
PAN
EL 102PAN
EL 103P
ANEL 104
PANE
L 105
PAN
EL 106
PANE
L 107
PANEL
120
PAN
EL 11
9P
ANEL
118
PANE
L 11
7PA
NEL
116
PANE
L 11
5PA
NEL
114
PAN
EL 1
13
PAN
EL 1
40PA
NEL
139
PANEL
138 PA
NEL
137
PAN
EL 1
36PAN
EL 1
41
PANE
L 14
2
PAN
EL 1
43
P 1
44
145
P 64
PANEL
65PAN
EL 6
6PAN
EL 70
PANEL
72PAN
EL 7
4PAN
EL 76
PANEL
78
PANEL
80
PAN
EL 68
PANEL
81
PANEL 90PANEL 91PANEL 92PANEL 93
PAN
EL 108PA
NEL 109
PAN
EL 110PA
NEL 111
PANEL 132
PANEL 135PANEL 134
PANEL 133
ALMA SEAM CEDAR GROVE SEAM
PLANT SITE
MINE PORTAL
PLANT SITE
MINE PORTAL
N N
LEA
SE
LINE
LEASE LINE
LEASE LINE
LEASE LINE
LE
AS
E LIN
E
LEASE LINE
Lower Seam mined with Longwall method 11 m above Alma seam, R&P method used

10/15/2015
15
29National Energy Technology Laboratory
Surface Mining
• Coal surface mining methods
– 67% of the coal production
– Mining methods
• Open‐pit
• Area Mining
• Contour mining
• Mountain top removal mining
• Highwall Mining
30National Energy Technology Laboratory
Surface Mining – Coal
Cast
Dozer
Dragline
Cast Profile
Dragline
Dozer
Cast
Spoil
Coal
Overburden
Pre-Bench

10/15/2015
16
31National Energy Technology Laboratory
Surface Mining Equipment
Typical Equipment Used for Overburden Removal
32National Energy Technology Laboratory
Surface Mining
MaximumCapacity(tons)
360 ton
340 ton
260 ton240 ton
190 ton170 ton
400 ton
1985 1990 1995 2000

10/15/2015
17
33National Energy Technology Laboratory
Surface Mining
• Some trends in surface mining
– Digital drives on shovels and draglines
– Larger trucks
– Global positioning systems
• Driverless trucks
• Collision avoid radar for large mobile equipment
– High voltage equipment
34National Energy Technology Laboratory
Area Mining ‐ Peabody Coal CompanyPRB Coal in Gillette, Wyoming

10/15/2015
18
35National Energy Technology Laboratory
Mountain Top Mining
Mountaintop removal mining (MTR), also known as mountaintop mining (MTM), is a form of surface mining that involves the mining of the summit or summit ridge of a mountain. Coal seams are extracted from a mountain by removing the land, or overburden, above the seams.
Mining in Process
36National Energy Technology Laboratory
Mountain Top Mining
Restoration in Process
10/15/2015
19
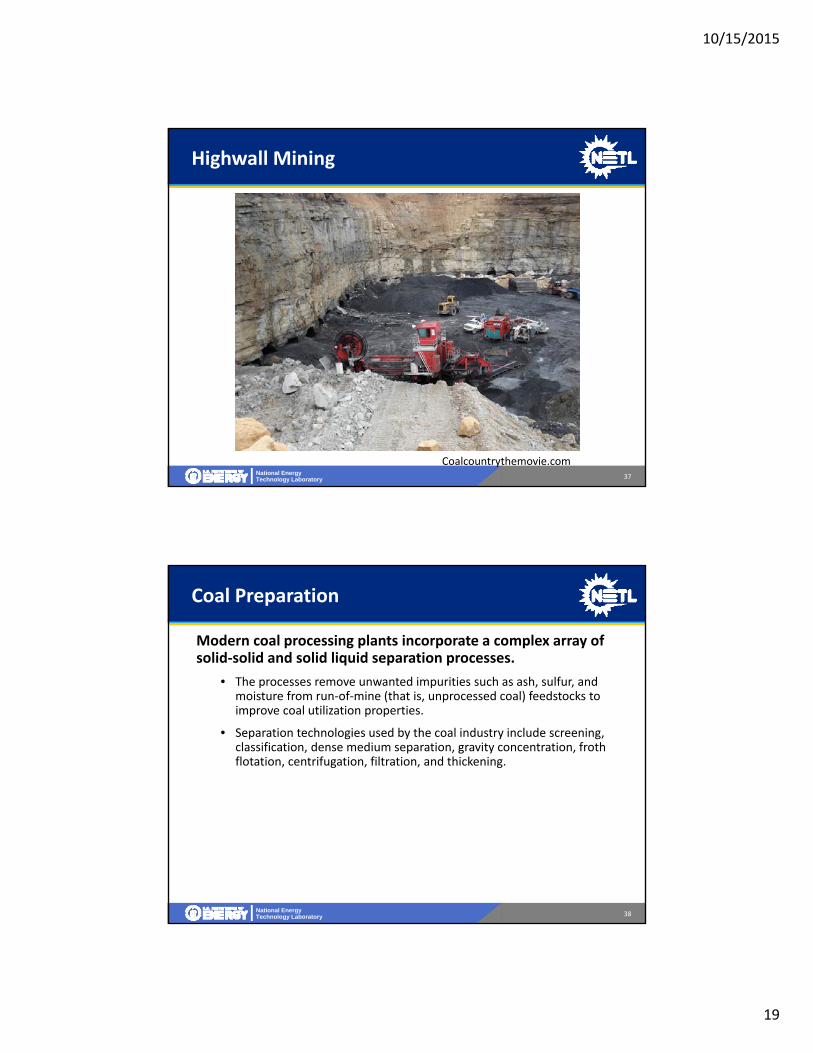
37National Energy Technology Laboratory
Highwall Mining
Coalcountrythemovie.com
38National Energy Technology Laboratory
Coal Preparation
Modern coal processing plants incorporate a complex array of solid‐solid and solid liquid separation processes.
• The processes remove unwanted impurities such as ash, sulfur, and moisture from run‐of‐mine (that is, unprocessed coal) feedstocks to improve coal utilization properties.
• Separation technologies used by the coal industry include screening, classification, dense medium separation, gravity concentration, froth flotation, centrifugation, filtration, and thickening.

10/15/2015
20
39National Energy Technology Laboratory
Prep Plant Statistics
• Operators
– ANR – 33 plants
– Patriot Coal – 16 plants
– Murray Energy – 15 plants
– Blackhawk Mining – 14 plants
– Arch and Alliance – 12 plants
• No. of U.S. Coal Prep. Plants – 268
– 19% reported as idle
– WV 80, KY 56, PA 44, VA 18, IL 16 and IN 14
40National Energy Technology Laboratory
Coal Preparation – Separation Processes Used for Coal
SieveBends
Dense MediaCyclone
BasketCentrifuges
Dense Media Vessel
DewateringScreens
Raw CoalScreens
Coal Spirals Screen‐BowlCentrifuges
ClassifyingCyclones
Med
ium
Solid‐Solid Solid‐LiquidSize‐Size
Coarse
Fine
Ultrafine Froth
FlotationDisc Filter
Increasing Difficulties
VT.edu

10/15/2015
21
41National Energy Technology Laboratory
Coal Preparation – Images
42National Energy Technology Laboratory
Environment and Reclamation
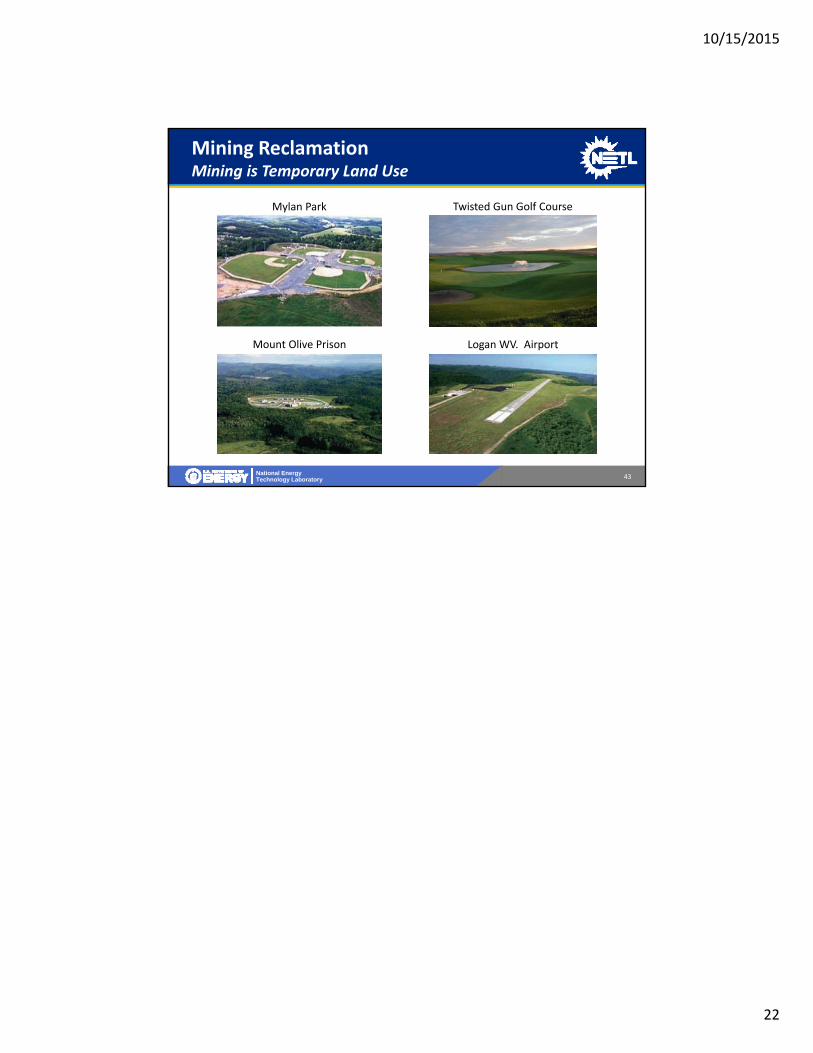
Returning the land to as good or better condition than before mining
10/15/2015
22
43National Energy Technology Laboratory
Mining ReclamationMining is Temporary Land Use
Mylan Park Twisted Gun Golf Course
Mount Olive Prison Logan WV. Airport

10/15/2015
1
National Energy Technology Laboratory
Driving Innovation ♦ Delivering Results
Perry Bissell
September 24, 2015
Appalachia Coal Markets
2National Energy Technology Laboratory
Presentation Outline
• Overview of Appalachia Coal Markets and Infrastructure
• Reasons for Decline in Appalachia Coal Markets

10/15/2015
2
3National Energy Technology Laboratory
Quick C.V.
• PhD, Mineral Economics, Penn State
• Director, Market Development and Analysis, CONSOL Energy
• Senior Energy Market Analyst, John T. Boyd Company
• Senior Director, Coal, PIRA Energy Group
4National Energy Technology Laboratory
U.S. Coal Producing Regions

10/15/2015
3
5National Energy Technology Laboratory
Appalachia Coal Quality v. Other Major Basins
Heat Content (Btu/lb) SO2 Content (lbs/MMBtu)
Basin Low High Low High
Central Appalachia 11,500 13,000 1.2 3.0
Northern Appalachia 11,500 13,000 2.5 7.0
Illinois Basin 10,000 12,500 4.0 6.5
Powder River Basin 8,300 8,800 0.7 1.0
Quality estimates are for illustrative purposes and represent "typical" low and high values. These are not intended to
represent lowest and highest potential quality.
6National Energy Technology Laboratory
Central Appalachia Mines and Preparation Plants

10/15/2015
4
7National Energy Technology Laboratory
Northern Appalachia Mines and Preparation Plants
8National Energy Technology Laboratory
Appalachia Coal Production,1990‐2014
Source: Ventyx Energy Velocity

10/15/2015
5
9National Energy Technology Laboratory
Central and Northern Appalachia Coal Production, 1990‐2014
Source: Ventyx Energy Velocity
10National Energy Technology Laboratory
Central Appalachia Coal Production by Mine Type, 1990‐2014
Source: Ventyx Energy Velocity
0
50
100
150
200
250
1990 1993 1996 1999 2002 2005 2008 2011 2014
To
ns
of
Co
al i
n M
illi
on
s
SMineType:

10/15/2015
6
11National Energy Technology Laboratory
Central Appalachia Coal Employees,1990‐2014
0
10000
20000
30000
40000
50000
60000
1990 1992 1994 1996 1998 2000 2002 2004 2006 2008 2010 2012 2014
To
tal N
um
ber
of
Em
plo
yees
Source: Ventyx Energy Velocity
12National Energy Technology Laboratory
Central Appalachia Coal Mine Labor Productivity, 1990‐2014
Source: Ventyx Energy Velocity
0
5
10
15
20
25
30
35
1990 1993 1996 1999 2002 2005 2008 2011 2014
To
ns
per
Man
Day

10/15/2015
7
13National Energy Technology Laboratory
Summary Data for Central Appalachia, 1990 and 2010
Sources: Ventyx Energy Velocity
Metric 1990 2010 2014
Production (Million Tons) 291 185 117
Number of Mines 1,837 736 490
Employment (Average Number of Employees 55,359 34,503 24,005
Productivity (Tons per Man Day) 20.15 17.77 16.83
14National Energy Technology Laboratory
Power Plants Receiving Appalachia Coal, 2014

10/15/2015
8
15National Energy Technology Laboratory
U.S. Electricity Generation by Fuel, All Sectors, 2004‐2014
Source: EIA Short Term Energy Outlook, August 2015
17.9% 18.8% 20.1% 21.6% 21.4% 23.3% 23.9% 24.8% 30.4% 27.8%27.5%
49.8% 49.6% 49.0% 48.5% 48.2% 44.4% 44.8% 42.2% 37.5% 39.0% 38.8%
0
2,000
4,000
6,000
8,000
10,000
12,000
14,000
2004 2005 2006 2007 2008 2009 2010 2011 2012 2013 2014
Th
ou
san
d M
egaw
atth
ou
rs P
er D
ay
Coal
Natural Gas
Petroleum
Nuclear
Power
Renewable Energy
Other Sources
Note: Labels show percentage share of total generation provided by coal and natural gas.
Sectors:
16National Energy Technology Laboratory
Monthly Share of Total Power Generation by Fuel (Percentage of Total Generation)
0
0.1
0.2
0.3
0.4
0.5
0.6
1990 January
1990 September
1991 M
ay
1992 January
1992 September
1993 M
ay
1994 January
1994 September
1995 M
ay
1996 January
1996 September
1997 M
ay
1998 January
1998 September
1999 M
ay
2000 January
2000 September
2001 M
ay
2002 January
2002 September
2003 M
ay
2004 January
2004 September
2005 M
ay
2006 January
2006 September
2007 M
ay
2008 January
2008 September
2009 M
ay
2010 January
2010 September
2011 M
ay
2012 January
2012 September
2013 M
ay
2014 January
2014 September
2015 M
ay
Coal Gas
Source: Energy Information Administration, August 2015 Monthly Energy Review, Table 7.2a_Electricity_Net_Generation_Total_ All_Sectors.xls
In April 2015, U.S. generation of electricity from natural gas exceeded coal‐fired generation for the first time since the start of EIA's monthly generation data in 1973.

10/15/2015
9
17National Energy Technology Laboratory
U.S. Electric Power Sector Coal Consumption, 1990‐2014
Source: Energy Information Administration
0
200
400
600
800
1,000
1,200
Million Tons
18National Energy Technology Laboratory
U.S. Coal Exports by Coal Type, 2002‐2014
Source: EIA, Historical Coal Exports, Data from: Quarterly Coal Reports 2002 through Q1 2015 http://www.eia.gov/coal/data.cfm#imports
0
10
20
30
40
50
60
70
80
2002 2003 2004 2005 2006 2007 2008 2009 2010 2011 2012 2013 2014
To
ns
of
Co
al i
n M
illi
on
s
Metallurgical
Steam
Coal Type:

10/15/2015
10
19National Energy Technology Laboratory
Central Appalachia Coal Prices, 2004‐YTD
Source: EIA: NYMEX Central Appalachian Coal Futures Near‐Month Contract Final Settlement Price History
$0
$20
$40
$60
$80
$100
$120
$140
$160
To
tal C
oal
Pri
ces
20National Energy Technology Laboratory
Major Factors Behind Decline of Appalachia Coal
• Regional Competition
• Natural Gas
• Tightening Environmental and Safety Regulations
• Declining Export Markets

10/15/2015
11
21National Energy Technology Laboratory
U.S. Coal Production by Region,2009‐2014
Sources: Ventyx Energy Velocity, EIA Annual Energy Outlook 2012
22National Energy Technology Laboratory
Major Coal Basins – Win, Lose or Draw?
GRAPH of CAPP, NAPP, PRB, ILB, CO/UT production
0
100
200
300
400
500
600
1990 1992 1994 1996 1998 2000 2002 2004 2006 2008 2010 2012 2014
To
ns
of
Co
al i
n M
illi
on
s
Central Appalachia
Illinois Basin
PRB
Northern Appalachia

10/15/2015
12
23National Energy Technology Laboratory
Costs of Central Appalachia Production
Source: Patriot Coal “Changes Underway in the Central Appalachia Coal Industry, July 14, 2014
WV coal producer: “You cannot mine CSX [12,500 Btu/lb] coal and sell it for $45/st. You can't.”, Platts Coal Trader, 8/24/15
24National Energy Technology Laboratory
Central Appalachia Production Cost Drivers
• Resource depletion
• Higher wages from prior labor shortages
• Mine safety and environmental regulations

10/15/2015
13
25National Energy Technology Laboratory
Henry Hub Natural Gas Spot Price (Dollars per Million Btu)
Source: Energy Information Administration
0
2
4
6
8
10
12
14
16
Jan‐1997
Jul‐1997
Jan‐1998
Jul‐1998
Jan‐1999
Jul‐1999
Jan‐2000
Jul‐2000
Jan‐2001
Jul‐2001
Jan‐2002
Jul‐2002
Jan‐2003
Jul‐2003
Jan‐2004
Jul‐2004
Jan‐2005
Jul‐2005
Jan‐2006
Jul‐2006
Jan‐2007
Jul‐2007
Jan‐2008
Jul‐2008
Jan‐2009
Jul‐2009
Jan‐2010
Jul‐2010
Jan‐2011
Jul‐2011
Jan‐2012
Jul‐2012
Jan‐2013
Jul‐2013
Jan‐2014
Jul‐2014
Jan‐2015
Jul‐2015
26National Energy Technology Laboratory
Illustrative Examples of “Breakeven” Delivered Costs of Coal Versus Gas
Central Appalachia
Northern Appalachia Illinois Basin
Powder River Basin Natural Gas
Fob Mine ($/Ton) $ 70.00 $ 60.00 $ 50.00 $ 15.00 na
Transportation ($/Ton) $ 20.00 $ 20.00 $ 20.00 $ 35.00 na
Delivered Cost ($/Ton) $ 90.00 $ 80.00 $ 70.00 $ 50.00 na
Delivered Cost ($/MMBtu) $ 3.60 $ 3.08 $ 2.97 $ 2.84 $ 2.85
Assumed Heat Content Btu/lb
Central Appalachia 12,500
Northern Appalachia 13,000
Illinois Basin 11,800
Powder River Basin 8,800
Source: LTI Estimates

10/15/2015
14
27National Energy Technology Laboratory
Central Appalachia Coal Exports
• Global markets have weakened
– Lower‐than‐expected Chinese coal imports
• Supply has increased
– Expanded production in Australia and Indonesia
• As the “swing supplier” in international coal markets, Central Appalachia exports have fallen dramatically
28National Energy Technology Laboratory
Growth in Chinese Coal Use is Slowing
Source: Energy Information Administration, Today in Energy, September 25, 2015

10/15/2015
15
29National Energy Technology Laboratory
Australia Coal Production
30National Energy Technology Laboratory
Tightening Environmental and Safety Regulations
• Environmental regulations have tightened on both producers and consumers of coal
– Power plant emissions
– MSHA safety regulations following 2010 UBB disaster
– Valley fill permitting
– Water treatment costs
• Prospects for additional tightening discourage investments

10/15/2015
16
31National Energy Technology Laboratory
Five Visuals Explaining Decline in Central Appalachia
0
10
20
30
40
50
Jan‐00
Nov‐00
Sep‐01
Jul‐02
May‐03
Mar‐04
Jan‐05
Nov‐05
Sep‐06
Jul‐07
May‐08
Mar‐09
Jan‐10
Nov‐10
Sep‐11
Jul‐12
May‐13
Mar‐14
Jan‐15
Antrim (MI, IN, & OH)Bakken (ND)Woodford (OK)Barnett (TX)Fayetteville (AR)Eagle Ford (TX)Haynesville (LA & TX)
Thin seams, tough mining compared to thick PRB seams and longwalls in other regions
Plant retirements in core marketsThe rise of shale gas
32National Energy Technology Laboratory
West Virginia Mine Entrance
Source: TechCorr, http://www.techcorr.com/news/Articles/Article.cfm?ID=388
Approximate Seam Height

10/15/2015
17
33National Energy Technology Laboratory
Peabody Coal CompanyPRB Coal in Gillette, Wyoming
Truck
Approximate Seam Height
34National Energy Technology Laboratory
Longwall Mining Drives Northern Appalachia and Illinois Basin

10/15/2015
18
35National Energy Technology Laboratory
Monthly Dry Shale Gas Production (Billion cubic feet per day)
Source: EIA, Natural Gas Weekly Update, http://www.eia.gov/naturalgas/weekly/archive/2015/07_16/index.cfm#tabs‐prices‐1
0
5
10
15
20
25
30
35
40
45
Jan‐00
Jul‐00
Jan‐01
Jul‐01
Jan‐02
Jul‐02
Jan‐03
Jul‐03
Jan‐04
Jul‐04
Jan‐05
Jul‐05
Jan‐06
Jul‐06
Jan‐07
Jul‐07
Jan‐08
Jul‐08
Jan‐09
Jul‐09
Jan‐10
Jul‐10
Jan‐11
Jul‐11
Jan‐12
Jul‐12
Jan‐13
Jul‐13
Jan‐14
Jul‐14
Jan‐15
Antrim (MI, IN, & OH) Bakken (ND) Woodford (OK)
Barnett (TX) Fayetteville (AR) Eagle Ford (TX)
Haynesville (LA & TX) Marcellus (PA & WV) Utica (OH, PA & WV)
Rest of US 'shale'
36National Energy Technology Laboratory
Coal Plant Retirements are in Central Appalachia Core Markets
Source: Energy Information Administration

10/15/2015
19
37National Energy Technology Laboratory
Summary
• Central Appalachia production has been declining for a long time– This is not a short‐term phenomenon
• The decline in Central Appalachia will continue– Competition from other regions for limited markets will be intense
• Natural gas is taking market share– Short‐term declines have been dramatic
• Environmental regulations are taking away domestic markets– Closing power plants
– Forcing scrubbing that reduces demand for lower sulfur coal
• Mining regulations are increasing production costs• Export markets are declining
Related Documents