Supplementary information Apoptosis-derived membrane vesicles drive the cGAS–STING pathway and enhances type-I IFN production in Systemic lupus erythematosus Yasuhiro Kato, JeongHoon Park, Hyota Takamatsu, Hachirou Konaka, Wataru Aoki, Syunsuke Aburaya, Mitsuyoshi Ueda, Masayuki Nishide, Shohei Koyama, Yoshitomo Hayama, Yuhei Kinehara, Toru Hirano, Yoshihito Shima, Masashi Narazaki, Atsushi Kumanogoh

Welcome message from author
This document is posted to help you gain knowledge. Please leave a comment to let me know what you think about it! Share it to your friends and learn new things together.
Transcript
Supplementary information�
Apoptosis-derived membrane vesicles drive the cGAS–STING pathway and
enhances type-I IFN production in Systemic lupus erythematosus��
Yasuhiro Kato, JeongHoon Park, Hyota Takamatsu, Hachirou Konaka, Wataru Aoki, Syunsuke Aburaya, Mitsuyoshi Ueda, Masayuki Nishide,
Shohei Koyama, Yoshitomo Hayama, Yuhei Kinehara, Toru Hirano, Yoshihito Shima, Masashi Narazaki, Atsushi Kumanogoh�
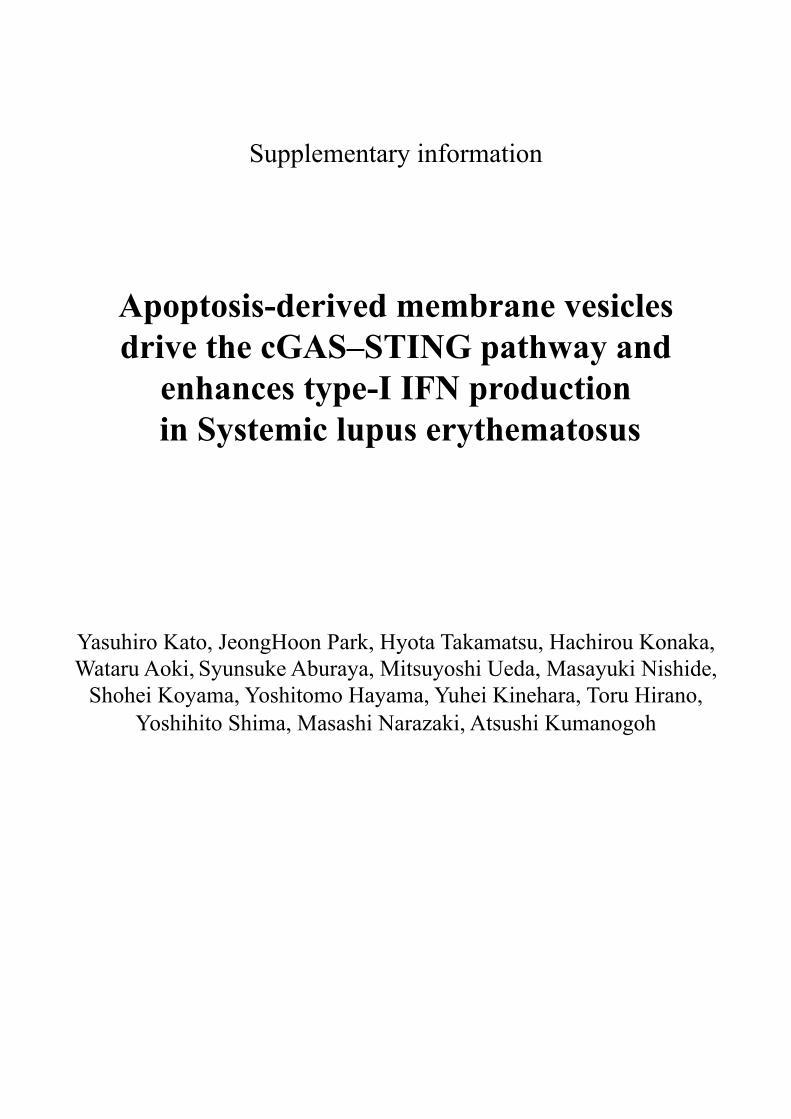
Supplementary Figure S1. Flow chart of the study design.�
Inpatients and outpatients in our hospital between 2012 and 2017 who fulfilled the ACR revised criteria for the classification of SLE
n=75
Inpatients excluded because they received intensive treatment for other diseases such as infectious enteritis and constrictive pericarditis.
n=11
SLE patients included in the study n=64�
��
0�
0.2�
0.4�
0.6�
0.8�
�.0�
rhIFNα (U/ml)�
IFN
-I bi
oact
ivity
(OD
620)�
1000�0�HEK-Blue™ IFN-α/β cells�
IFN-I�
Receptor
ISG SEAP
SEAP A� B�
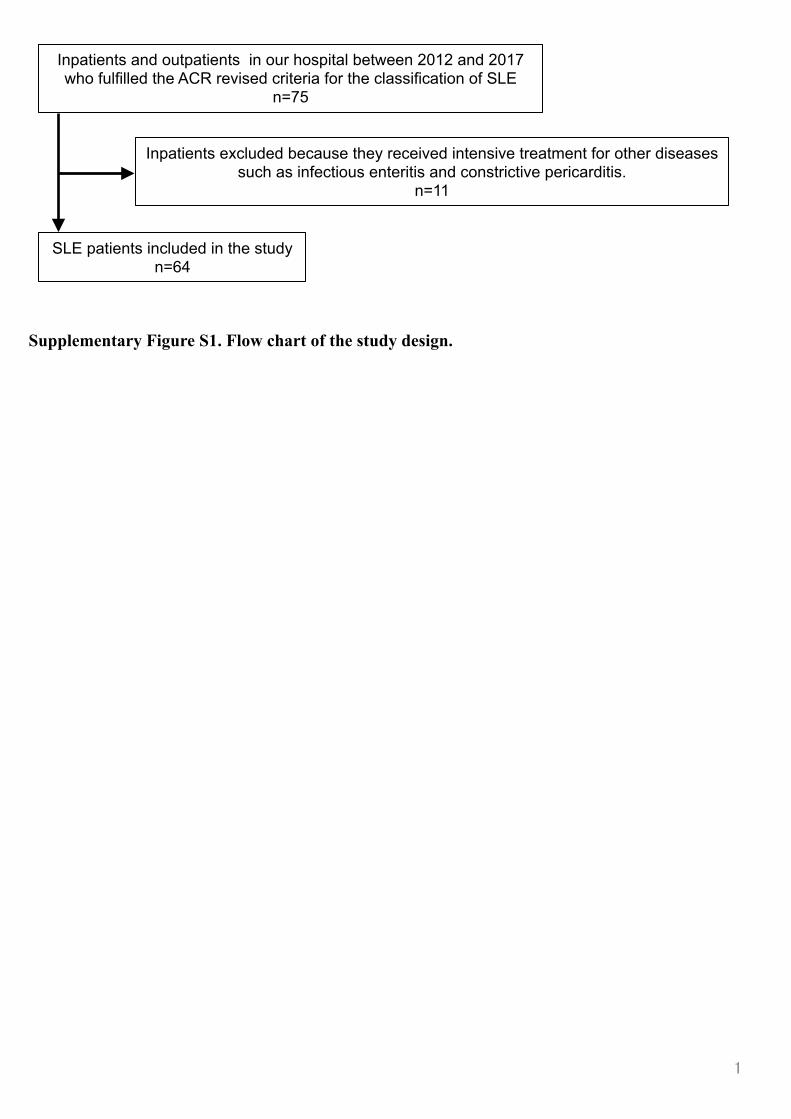
Supplementary Figure S2. Characteristics of HEK-Blue IFN-α/β and THP1-Blue ISG cells.
A) HEK-Blue IFN-α/β: According to the vend�r’s website (http://www.invivogen.com/hek-blue-ifn-ab) (Cat. hkb-ifnab), HEK-Blue IFN-α/β cells were generated by stable transduction of HEK cells with the human STAT2 and IRF9 genes and the SEAP reporter gene under the control of the ISG54 promoter. B) Measurement of IFN-I bioactivity with HEK-Blue IFN-α/β. HEK-Blue IFN-α/β cells were stimulated with recombinant human IFN-α (rhIFNα) used in 2-fold serial dilutions. Levels of SEAP in the supernatant were determined with QUANTI-Blue. C) THP1-Blue ISG: According to the vendor’s website (http://www.invivogen.com/thp1-blue-isg) (Cat. thp-isg), THP1 cells were stably transduced with an IRF-inducible SEAP reporter construct under the control of the ISG54 minimal promoter in conjunction with five interferon-stimulated response elements (ISREs). D) ISG-inducing activity measured with THP1-Blue ISG. THP1-Blue ISG cells were stimulated with 2’3’-cGAMP (5 µg/ml), c-diAMP (10 µg/ml), rhIFN-α (1000 U/ml), LPS (500 ng/ml), IL-1β (25 ng/ml), IL-6 (100 ng/ml), Pam3CSK4 (500 ng/ml), TNF-α (100 ng/ml), or control medium (Ctrl). ��
Receptor
ISRE+ISG IRFs �
Type-I IFN �
SEAP
SEAP
ISG
inducing factor
THP1-Blue™ ISG cells�
0�
0.2�
0.4�
0.6�
0.8�
1.0�
IFN
-I-In
duci
ng A
ctiv
ity (O
D62
0)�
C� D�
��
A�
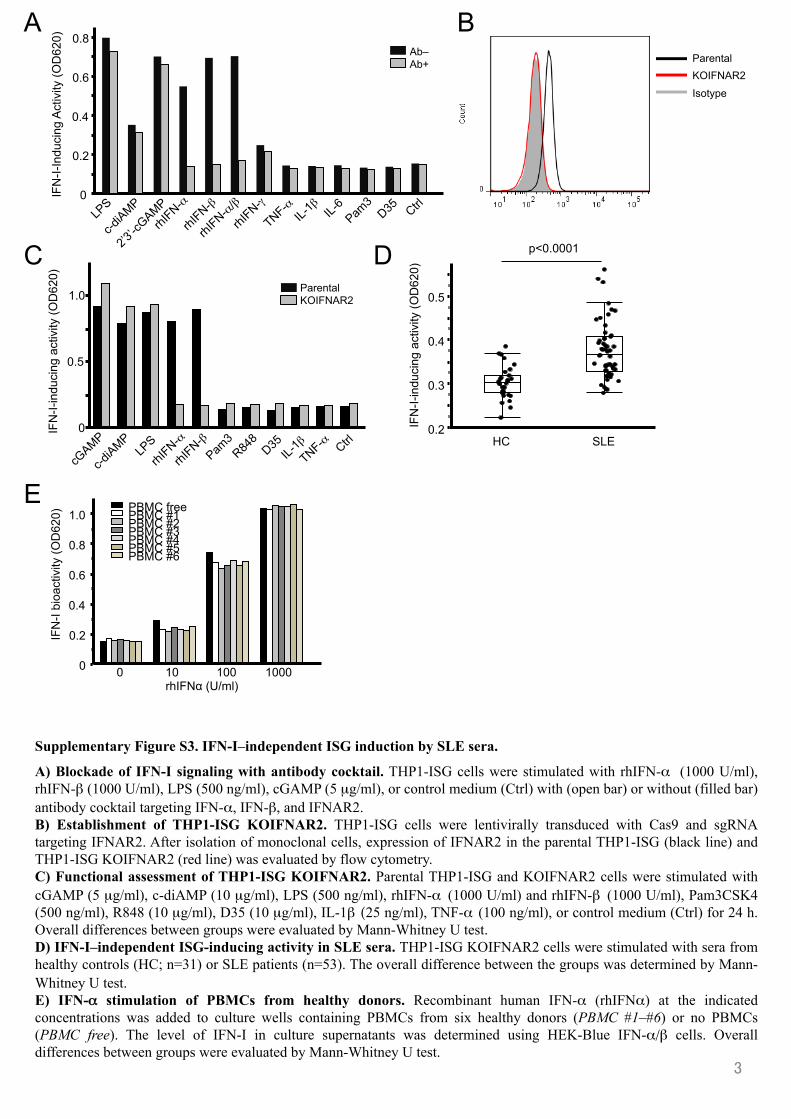
Supplementary Figure S3. IFN-I–independent ISG induction by SLE sera.�
A) Blockade of IFN-I signaling with antibody cocktail. THP1-ISG cells were stimulated with rhIFN-α (1000 U/ml), rhIFN-β (1000 U/ml), LPS (500 ng/ml), cGAMP (5 µg/ml), or control medium (Ctrl) with (open bar) or without (filled bar) antibody cocktail targeting IFN-α, IFN-β, and IFNAR2.�B) Establishment of THP1-ISG KOIFNAR2. THP1-ISG cells were lentivirally transduced with Cas9 and sgRNA targeting IFNAR2. After isolation of monoclonal cells, expression of IFNAR2 in the parental THP1-ISG (black line) and THP1-ISG KOIFNAR2 (red line) was evaluated by flow cytometry. �C) Functional assessment of THP1-ISG KOIFNAR2. Parental THP1-ISG and KOIFNAR2 cells were stimulated with cGAMP (5 µg/ml), c-diAMP (10 µg/ml), LPS (500 ng/ml), rhIFN-α (1000 U/ml) and rhIFN-β (1000 U/ml), Pam3CSK4 (500 ng/ml), R848 (10 µg/ml), D35 (10 µg/ml), IL-1β (25 ng/ml), TNF-α (100 ng/ml), or control medium (Ctrl) for 24 h. Overall differences between groups were evaluated by Mann-Whitney U test.�D) IFN-I–independent ISG-inducing activity in SLE sera. THP1-ISG KOIFNAR2 cells were stimulated with sera from healthy controls (HC; n=31) or SLE patients (n=53). The overall difference between the groups was determined by Mann-Whitney U test.�E) IFN-α stimulation of PBMCs from healthy donors. Recombinant human IFN-α (rhIFNα) at the indicated concentrations was added to culture wells containing PBMCs from six healthy donors (PBMC #1–#6) or no PBMCs (PBMC free). The level of IFN-I in culture supernatants was determined using HEK-Blue IFN-α/β cells. Overall differences between groups were evaluated by Mann-Whitney U test. �
C�
IFN
-I-in
duci
ng a
ctiv
ity (O
D62
0)�
Ab+� Ab–�
IFN
-I-In
duci
ng A
ctiv
ity (O
D62
0)�
0.4�
0�
0.2�
0.6�
0.8�
D� p<0.0001�
HC SLE
0.5�
0.2�
0.3�
0.4�
IFN
-I-in
duci
ng a
ctiv
ity (O
D62
0)�
E�
0�
0.2�
0.4�
0.6�
0.8�
1.0�
10� 100� 1000�0�
PBMC free�PBMC #1�PBMC #2�PBMC #3�PBMC #4�PBMC #5�PBMC #6�
rhIFNα (U/ml)�
IFN
-I bi
oact
ivity
(OD
620)
�
Parental� KOIFNAR2� Isotype�
B�
0�
0.5�
1.0� KOIFNAR2�Parental�
��
0�
1.0�
0.5�Act
ivat
ion
of
TLR
8 pa
thw
ay (O
D62
0) �
Act
ivat
ion
of
TLR
9 pa
thw
ay (O
D62
0) �
0�
0.5�
�.0�
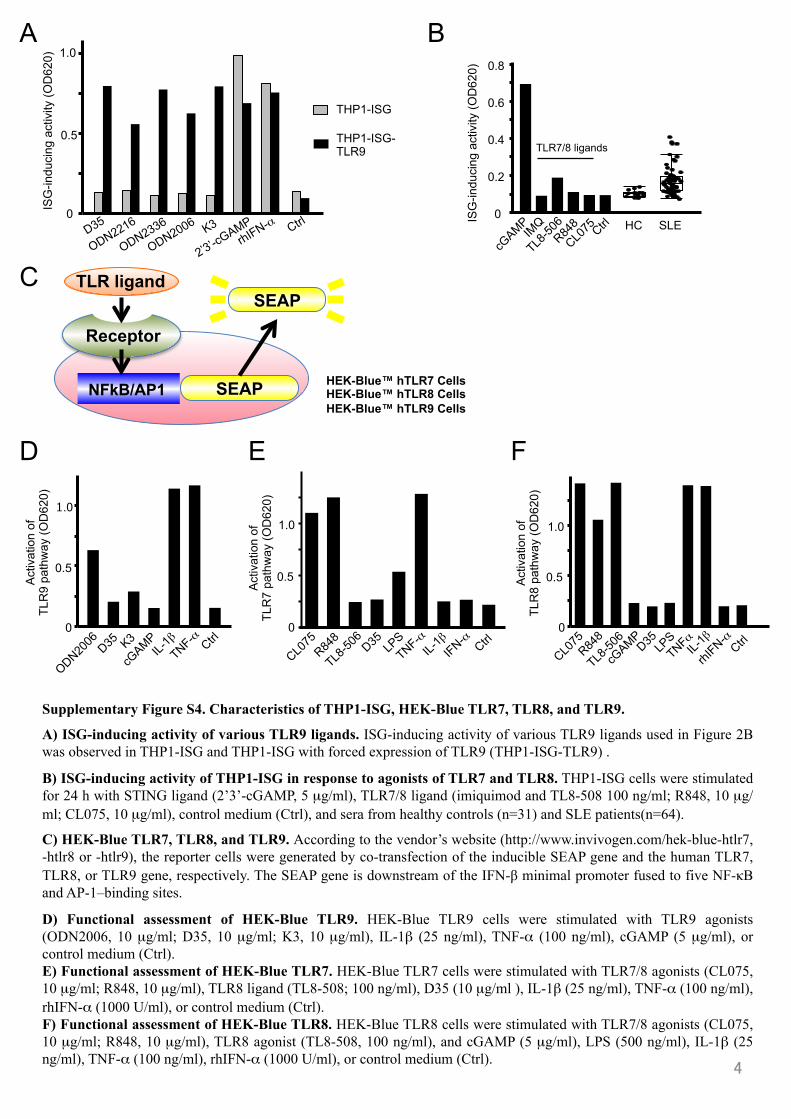
Supplementary Figure S4. Characteristics of THP1-ISG, HEK-Blue TLR7, TLR8, and TLR9.
A) ISG-inducing activity of various TLR9 ligands. ISG-inducing activity of various TLR9 ligands used in Figure 2B was observed in THP1-ISG and THP1-ISG with forced expression of TLR9 (THP1-ISG-TLR9) .
B) ISG-inducing activity of THP1-ISG in response to agonists of TLR7 and TLR8. THP1-ISG cells were stimulated for 24 h with STING ligand (2’3’-cGAMP, 5 µg/ml), TLR7/8 ligand (imiquimod and TL8-508 100 ng/ml; R848, 10 µg/ml; CL075, 10 µg/ml), control medium (Ctrl), and sera from healthy controls (n=31) and SLE patients(n=64).
C) HEK-Blue TLR7, TLR8, and TLR9. According to the vendor’s website (http://www.invivogen.com/hek-blue-htlr7, -htlr8 or -htlr9), the reporter cells were generated by co-transfection of the inducible SEAP gene and the human TLR7, TLR8, or TLR9 gene, respectively. The SEAP gene is downstream of the IFN-β minimal promoter fused to five NF-κB and AP-1–binding sites.�
D) Functional assessment of HEK-Blue TLR9. HEK-Blue TLR9 cells were stimulated with TLR9 agonists (ODN2006, 10 µg/ml; D35, 10 µg/ml; K3, 10 µg/ml), IL-1β (25 ng/ml), TNF-α (100 ng/ml), cGAMP (5 µg/ml), or control medium (Ctrl). E) Functional assessment of HEK-Blue TLR7. HEK-Blue TLR7 cells were stimulated with TLR7/8 agonists (CL075, 10 µg/ml; R848, 10 µg/ml), TLR8 ligand (TL8-508; 100 ng/ml), D35 (10 µg/ml ), IL-1β (25 ng/ml), TNF-α (100 ng/ml), rhIFN-α (1000 U/ml), or control medium (Ctrl). �F) Functional assessment of HEK-Blue TLR8. HEK-Blue TLR8 cells were stimulated with TLR7/8 agonists (CL075, 10 µg/ml; R848, 10 µg/ml), TLR8 agonist (TL8-508, 100 ng/ml), and cGAMP (5 µg/ml), LPS (500 ng/ml), IL-1β (25 ng/ml), TNF-α (100 ng/ml), rhIFN-α (1000 U/ml), or control medium (Ctrl). �
HEK-Blue™ hTLR7 Cells HEK-Blue™ hTLR8 Cells HEK-Blue™ hTLR9 Cells
TLR ligand �
Receptor
SEAP
SEAP
A�
E�
B�
D�
0�
0.2�
0.4�
0.6�
0.8�
HC SLE
TLR7/8 ligands�
ISG
-indu
cing
act
ivity
(OD
620)
�
NFkB/AP1
F�
Act
ivat
ion
of
TLR
7 pa
thw
ay (O
D62
0) �
0�
1.0�
0.5�
C�
THP1-ISG
THP1-ISG-TLR9�
ISG
-indu
cing
act
ivity
(OD
620)
�
0�
0.5�
1.0�
��
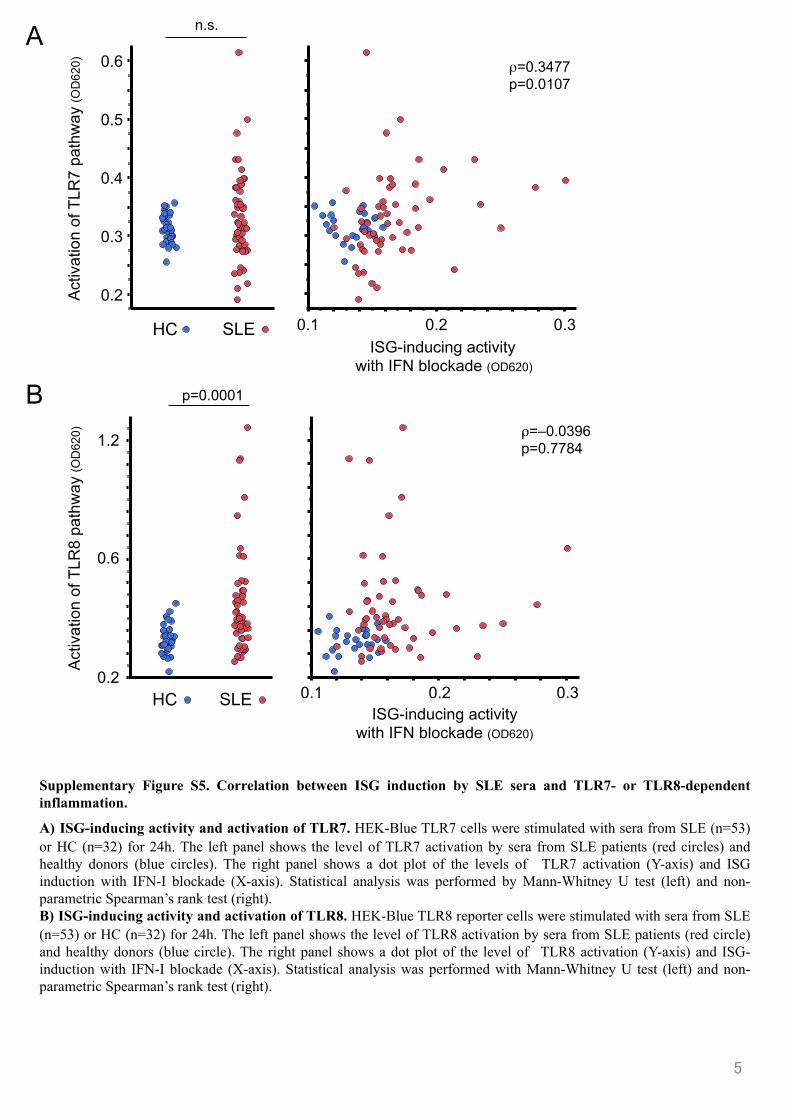
Supplementary Figure S5. Correlation between ISG induction by SLE sera and TLR7- or TLR8-dependent inflammation.�
A) ISG-inducing activity and activation of TLR7. HEK-Blue TLR7 cells were stimulated with sera from SLE (n=53) or HC (n=32) for 24h. The left panel shows the level of TLR7 activation by sera from SLE patients (red circles) and healthy donors (blue circles). The right panel shows a dot plot of the levels of TLR7 activation (Y-axis) and ISG induction with IFN-I blockade (X-axis). Statistical analysis was performed by Mann-Whitney U test (left) and non-parametric Spearman’s rank test (right). B) ISG-inducing activity and activation of TLR8. HEK-Blue TLR8 reporter cells were stimulated with sera from SLE (n=53) or HC (n=32) for 24h. The left panel shows the level of TLR8 activation by sera from SLE patients (red circle) and healthy donors (blue circle). The right panel shows a dot plot of the level of TLR8 activation (Y-axis) and ISG-induction with IFN-I blockade (X-axis). Statistical analysis was performed with Mann-Whitney U test (left) and non-parametric Spearman’s rank test (right).
A�
B�
0.2� 0.3�0.1�
Act
ivat
ion
of T
LR7
path
way
(OD
620)
� 0.6�
0.2�
0.3�
0.4 �
0.5�
SLE�HC�ISG-inducing activity
with IFN blockade (OD620)�
0.2� 0.3�0.1�ISG-inducing activity
with IFN blockade (OD620)�
1.2�
0.2�
0.6�
Act
ivat
ion
of T
LR8
path
way
(OD
620)
�
SLE�HC�
ρ=0.3477 p=0.0107�
ρ=–0.0396 p=0.7784�
n.s.�
p=0.0001�
�
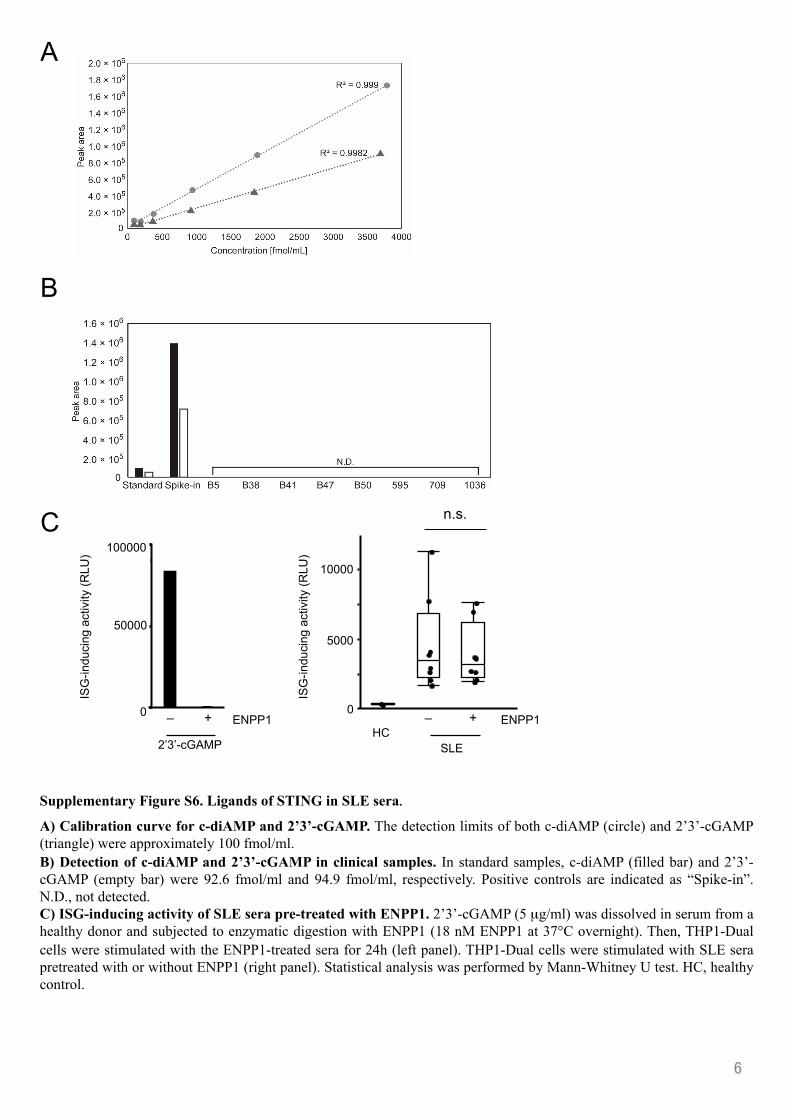
Supplementary Figure S6. Ligands of STING in SLE sera
A) Calibration curve for c-diAMP and 2’3’-cGAMP. The detection limits of both c-diAMP (circle) and 2’3’-cGAMP (triangle) were approximately 100 fmol/ml. B) Detection of c-diAMP and 2’3’-cGAMP in clinical samples. In standard samples, c-diAMP (filled bar) and 2’3’-cGAMP (empty bar) were 92.6 fmol/ml and 94.9 fmol/ml, respectively. Positive controls are indicated as “Spike-in”. N.D., not detected.C) ISG-inducing activity of SLE sera pre-treated with ENPP1. 2’3’-cGAMP (5 µg/ml) was dissolved in serum from a healthy donor and subjected to enzymatic digestion with ENPP1 (18 nM ENPP1 at 37°C overnight). Then, THP1-Dual cells were stimulated with the ENPP1-treated sera for 24h (left panel). THP1-Dual cells were stimulated with SLE sera pretreated with or without ENPP1 (right panel). Statistical analysis was performed by Mann-Whitney U test. HC, healthy control.
C
B
ISG
-indu
cing
act
ivity
(RLU
) 100000
0
50000
+
2’3’-cGAMP
– ENPP1
n.s.
ISG
-indu
cing
act
ivity
(RLU
)
ENPP1+–HC
10000
0
5000
SLE
A
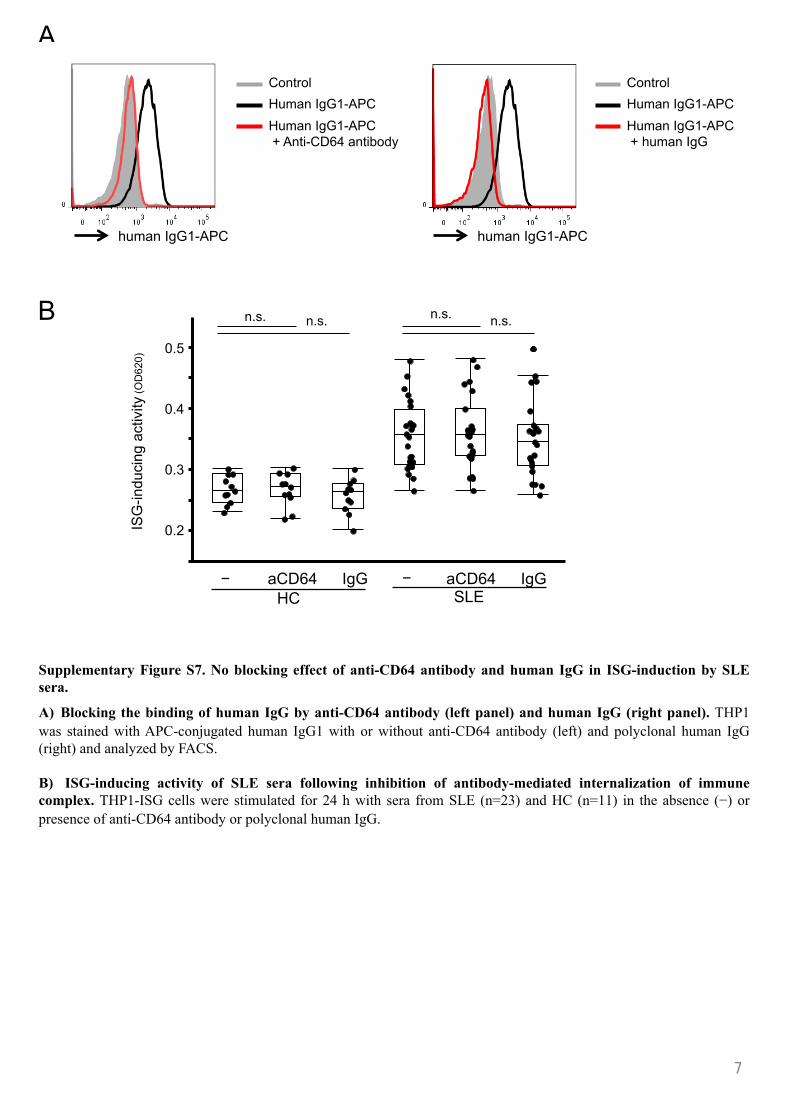
Supplementary Figure S7. No blocking effect of anti-CD64 antibody and human IgG in ISG-induction by SLE sera.�
A) Blocking the binding of human IgG by anti-CD64 antibody (left panel) and human IgG (right panel). THP1 was stained with APC-conjugated human IgG1 with or without anti-CD64 antibody (left) and polyclonal human IgG (right) and analyzed by FACS. B) ISG-inducing activity of SLE sera following inhibition of antibody-mediated internalization of immune complex. THP1-ISG cells were stimulated for 24 h with sera from SLE (n=23) and HC (n=11) in the absence (−) or presence of anti-CD64 antibody or polyclonal human IgG.�
A�Control�Human IgG1-APC �Human IgG1-APC + Anti-CD64 antibody�
Control�Human IgG1-APC �Human IgG1-APC + human IgG�
human IgG1-APC� human IgG1-APC�
SLE
ISG
-indu
cing
act
ivity
(OD
620)� 0.5�
0.2�
0.3�
0.4�
aCD64� IgG�HC
aCD64� IgG�−�
n.s.� n.s.� n.s.� n.s.�
−�
B�
��
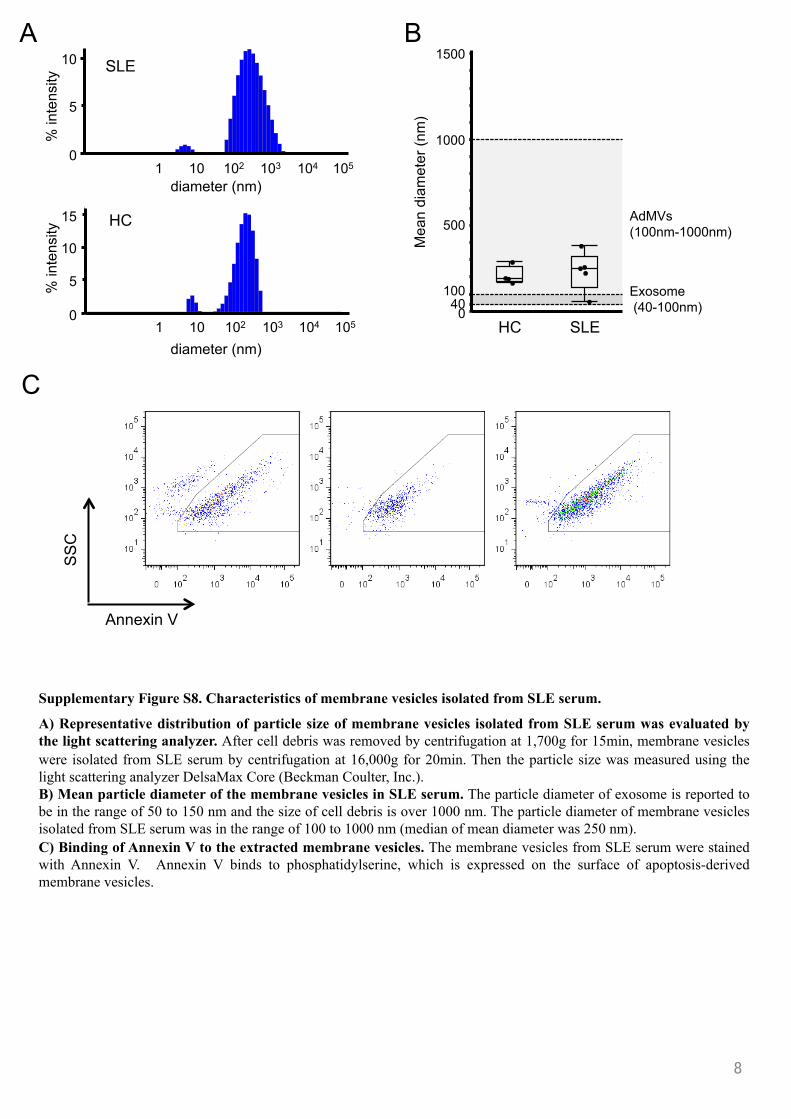
Supplementary Figure S8. Characteristics of membrane vesicles isolated from SLE serum.�
A) Representative distribution of particle size of membrane vesicles isolated from SLE serum was evaluated by the light scattering analyzer. After cell debris was removed by centrifugation at 1,700g for 15min, membrane vesicles were isolated from SLE serum by centrifugation at 16,000g for 20min. Then the particle size was measured using the light scattering analyzer DelsaMax Core (Beckman Coulter, Inc.). B) Mean particle diameter of the membrane vesicles in SLE serum. The particle diameter of exosome is reported to be in the range of 50 to 150 nm and the size of cell debris is over 1000 nm. The particle diameter of membrane vesicles isolated from SLE serum was in the range of 100 to 1000 nm (median of mean diameter was 250 nm). C) Binding of Annexin V to the extracted membrane vesicles. The membrane vesicles from SLE serum were stained with Annexin V. Annexin V binds to phosphatidylserine, which is expressed on the surface of apoptosis-derived membrane vesicles. �
A� B�
InstrumentSerial Number: 3175-DMCModel: DelsaMax CoreControl Firmware Version: 2.3.5.5DLS Firmware Version: 2.3.5.5Static Light Scattering Firmware Version: 2.3.5.5Instrument Name: BCI-3175-DMCLaser Wavelength (nm): 663.0
Datalog Table: B86Item Time Diameter Intensity
(s) (nm) (Cnt/s)1 Acq 1 5.5e+003 249.6 1738977
Regularization Results: B86
0
1
2
3
4
5
6
7
8
9
10
11
0.01 0.1 1 10 100 1000 10000 100000
%In
tens
ity
Diameter (nm)
Radius Diffusion Coefficient Mw-R %Pd %Intensity %Mass(nm) (cm²/s) (kDa)
Peak 1 2.7 7.7e-007 35.0 29.3 3.0 97.1Peak 2 225.2 9.4e-009 1075268.3 84.3 97.0 2.9
% in
tens
ity�
1� 10� 102� 103� 104� 105�
diameter (nm)�
10�
0�
5�
InstrumentSerial Number: 3175-DMCModel: DelsaMax CoreControl Firmware Version: 2.3.5.5DLS Firmware Version: 2.3.5.5Static Light Scattering Firmware Version: 2.3.5.5Instrument Name: BCI-3175-DMCLaser Wavelength (nm): 663.0
Datalog Table: A11Item Time Diameter Intensity
(s) (nm) (Cnt/s)1 Acq 1 5.9e+003 190.0 2036037
Regularization Results: A11
0
2
4
6
8
10
12
14
16
0.01 0.1 1 10 100 1000 10000 100000
%In
tens
ity
Diameter (nm)
Radius Diffusion Coefficient Mw-R %Pd %Intensity %Mass(nm) (cm²/s) (kDa)
Peak 1 4.3 4.9e-007 101.1 19.8 6.0 95.0Peak 2 129.3 1.6e-008 293915.1 51.6 94.0 5.0
0�
10�
5�
15�
1� 10� 102� 103� 104� 105�
diameter (nm)�
% in
tens
ity�
0 HC� SLE�
100
1000
500
Mea
n di
amet
er (n
m)�
40
AdMVs (100nm-1000nm)
Exosome (40-100nm)
1500
HC�
SLE�
C�
SS
C�
Annexin V�
��
��
600000�
400000�
200000�
IFN
-I-In
duci
ng A
ctiv
ity (R
LU)�
THP1-Dual�
IFN
-I-In
duci
ng A
ctiv
ity (R
LU)�
10000�
0�
20000�
30000�
THP1-Dual-KOSTING�
100000�
0�
300000�
200000�
IFN
-I-In
duci
ng A
ctiv
ity (R
LU)�
THP1-Dual-KOcGAS�B�
Receptor
ISRE+ISG IRFs �
Type-I IFN �
Luciferase
ISG
inducing factor
THP1-Dual™ Cells�
Luciferase
A�
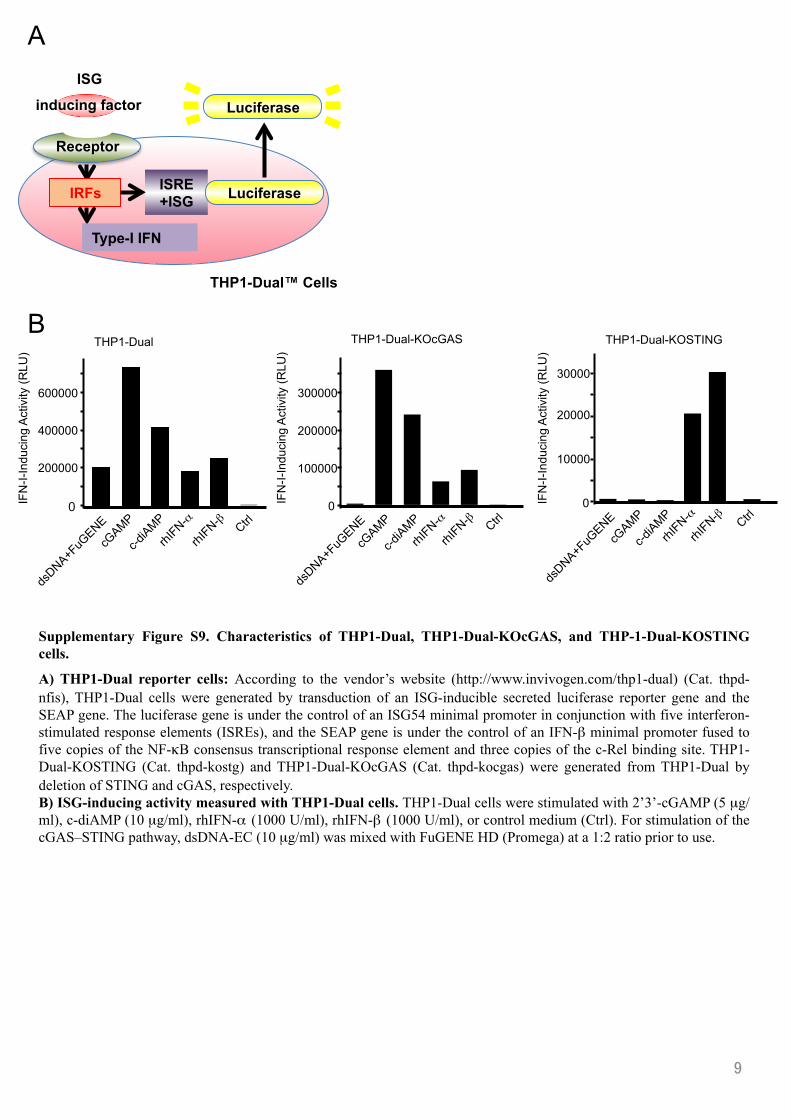
Supplementary Figure S9. Characteristics of THP1-Dual, THP1-Dual-KOcGAS, and THP-1-Dual-KOSTING cells.�
A) THP1-Dual reporter cells: According to the vendor’s website (http://www.invivogen.com/thp1-dual) (Cat. thpd-nfis), THP1-Dual cells were generated by transduction of an ISG-inducible secreted luciferase reporter gene and the SEAP gene. The luciferase gene is under the control of an ISG54 minimal promoter in conjunction with five interferon-stimulated response elements (ISREs), and the SEAP gene is under the control of an IFN-β minimal promoter fused to five copies of the NF-κB consensus transcriptional response element and three copies of the c-Rel binding site. THP1-Dual-KOSTING (Cat. thpd-kostg) and THP1-Dual-KOcGAS (Cat. thpd-kocgas) were generated from THP1-Dual by deletion of STING and cGAS, respectively. B) ISG-inducing activity measured with THP1-Dual cells. THP1-Dual cells were stimulated with 2’3’-cGAMP (5 µg/ml), c-diAMP (10 µg/ml), rhIFN-α (1000 U/ml), rhIFN-β (1000 U/ml), or control medium (Ctrl). For stimulation of the cGAS–STING pathway, dsDNA-EC (10 µg/ml) was mixed with FuGENE HD (Promega) at a 1:2 ratio prior to use.�
�
A�
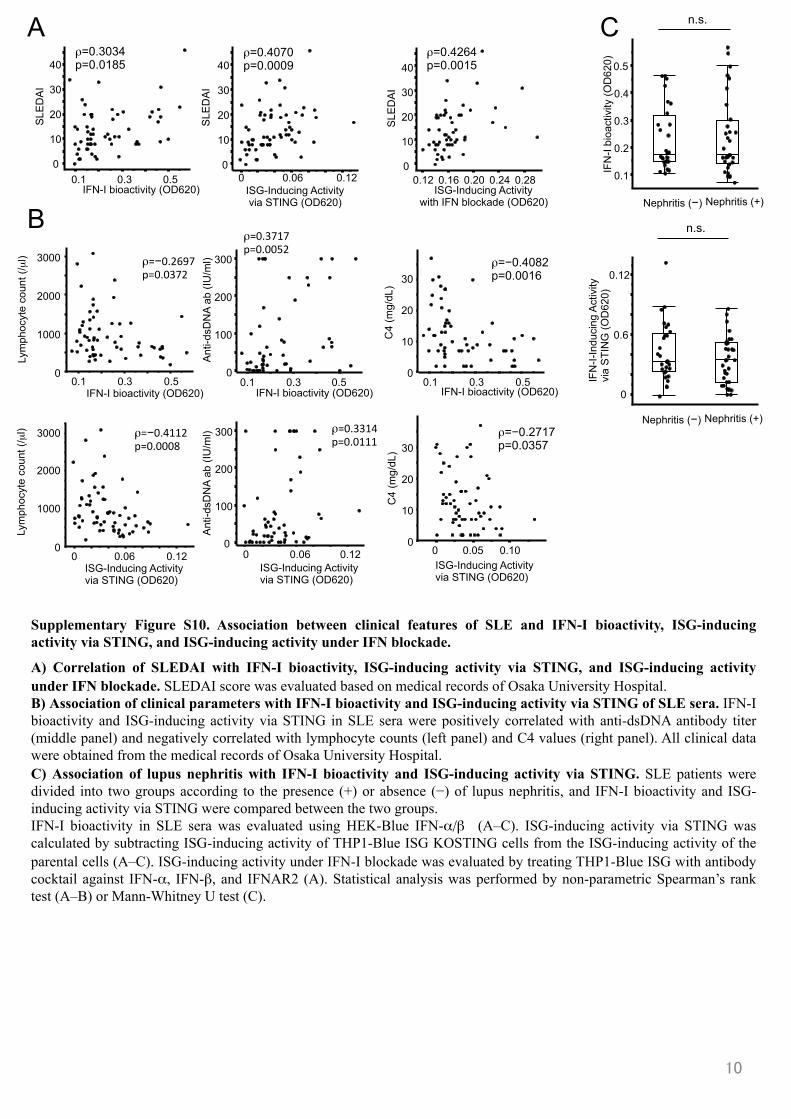
Supplementary Figure S10. Association between clinical features of SLE and IFN-I bioactivity, ISG-inducing activity via STING, and ISG-inducing activity under IFN blockade.
A) Correlation of SLEDAI with IFN-I bioactivity, ISG-inducing activity via STING, and ISG-inducing activity under IFN blockade. SLEDAI score was evaluated based on medical records of Osaka University Hospital. B) Association of clinical parameters with IFN-I bioactivity and ISG-inducing activity via STING of SLE sera. IFN-I bioactivity and ISG-inducing activity via STING in SLE sera were positively correlated with anti-dsDNA antibody titer (middle panel) and negatively correlated with lymphocyte counts (left panel) and C4 values (right panel). All clinical data were obtained from the medical records of Osaka University Hospital. C) Association of lupus nephritis with IFN-I bioactivity and ISG-inducing activity via STING. SLE patients were divided into two groups according to the presence (+) or absence (−) of lupus nephritis, and IFN-I bioactivity and ISG-inducing activity via STING were compared between the two groups. IFN-I bioactivity in SLE sera was evaluated using HEK-Blue IFN-α/β (A–C). ISG-inducing activity via STING was calculated by subtracting ISG-inducing activity of THP1-Blue ISG KOSTING cells from the ISG-inducing activity of the parental cells (A–C). ISG-inducing activity under IFN-I blockade was evaluated by treating THP1-Blue ISG with antibody cocktail against IFN-α, IFN-β, and IFNAR2 (A). Statistical analysis was performed by non-parametric Spearman’s rank test (A–B) or Mann-Whitney U test (C).
IFN-I bioactivity (OD620)�
SLE
DA
I�
0.1� 0.5�0.3�0�
10�
20�
30�
40�ρ=0.3034 p=0.0185�
ISG-Inducing Activity via STING (OD620)�
0.12�0.06�0�
SLE
DA
I�
0�
10�
20�
30�
40�ρ=0.4070 p=0.0009�
ISG-Inducing Activity with IFN blockade (OD620)�
SLE
DA
I�
ρ=0.4264 p=0.0015�
0.12�0�
10�
20�
30�
40�
0.16�0.20�0.24�0.28�
B�
ISG-Inducing Activity via STING (OD620)�
Lym
phoc
yte
coun
t (/µ
l)�Ly
mph
ocyt
e co
unt (
/µl)�
IFN-I bioactivity (OD620)�
Ant
i-dsD
NA
ab (I
U/m
l)�
0�
100�
200�
300�
IFN-I bioactivity (OD620)�0.1� 0.5�0.3�
C�
ρ=0.3717p=0.0052�
Ant
i-dsD
NA
ab (I
U/m
l)�
ISG-Inducing Activity via STING (OD620)�
0�0� 0.06� 0.12�
100�
200�
300� ρ=0.3314p=0.0111�
ρ=−0.2717 p=0.0357�
IFN
-I bi
oact
ivity
(OD
620)�
0.1�
0.4�
0.3�
0.2�
0.5�
Nephritis (+)�Nephritis (−)�
n.s.�
IFN
-I-In
duci
ng A
ctiv
ity
via
STI
NG
(OD
620)�
0.6�
0�
0.12�
Nephritis (+)�Nephritis (−)�
n.s.�
IFN-I bioactivity (OD620)�C
4 (m
g/dL
)�0.1� 0.5�0.3�
ρ=−0.4082 p=0.0016�
10�
30�
20�
0�
C4
(mg/
dL)�
ISG-Inducing Activity via STING (OD620)�
0.10�0.05�0�
10�
30�
20�
0�
3000�
2000�
1000�
0.1� 0.5�0.3�
ρ=−0.2697p=0.0372�
0�
3000�
2000�
1000�
0�0.12�0.06�0�
ρ=−0.4112p=0.0008�
���
IFN-I�
ISGs, IFN-I�
cGAS–STING�
Auto-Antibodies�Tissue damage�
Apoptosis�
Apoptosis-derived membrane vesicles�
Macrophages or non-hematopoietic cells�
Recurrent IFN-I production in SLE�
IFN-I�
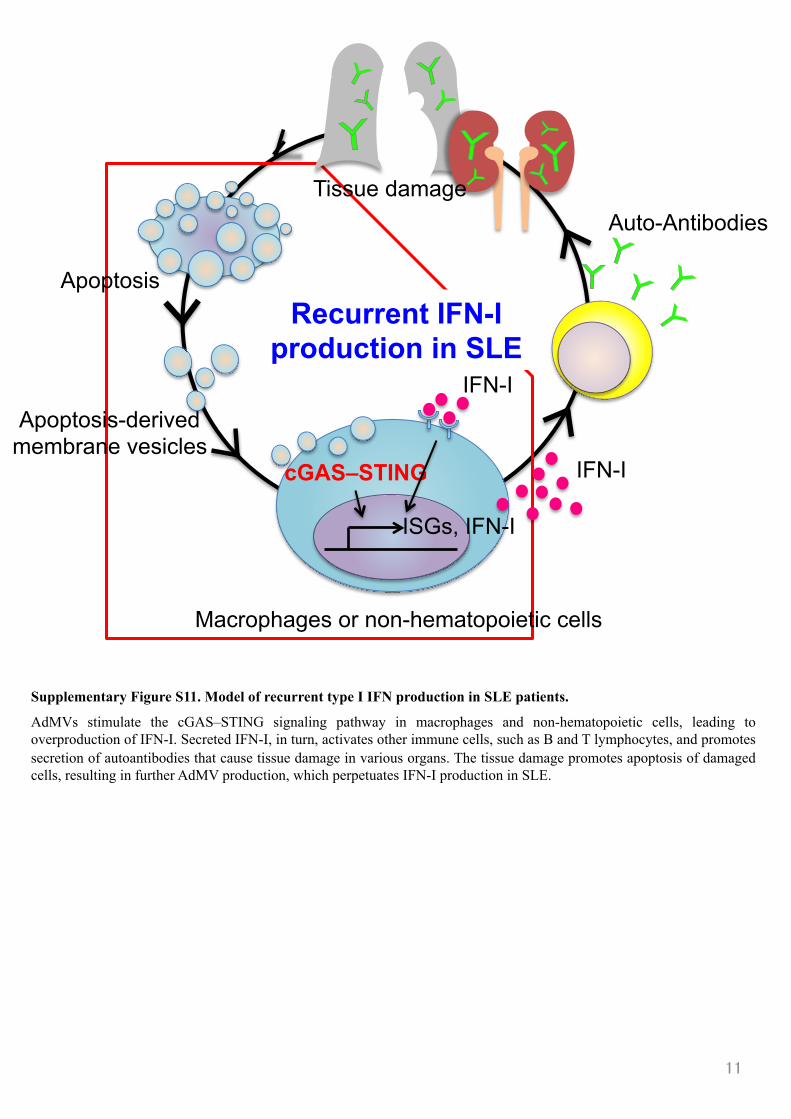
Supplementary Figure S11. Model of recurrent type I IFN production in SLE patients.
AdMVs stimulate the cGAS–STING signaling pathway in macrophages and non-hematopoietic cells, leading to overproduction of IFN-I. Secreted IFN-I, in turn, activates other immune cells, such as B and T lymphocytes, and promotes secretion of autoantibodies that cause tissue damage in various organs. The tissue damage promotes apoptosis of damaged cells, resulting in further AdMV production, which perpetuates IFN-I production in SLE.
���
12
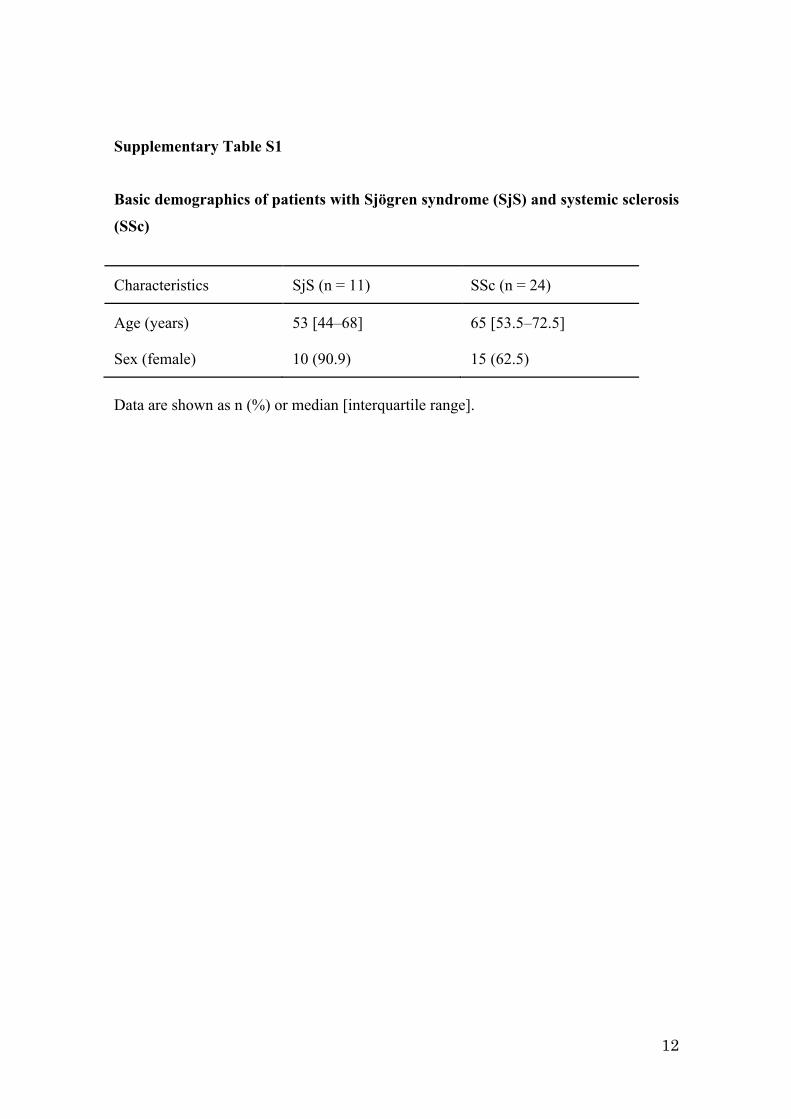
Supplementary Table S1
Basic demographics of patients with Sjögren syndrome (SjS) and systemic sclerosis
(SSc)
Characteristics SjS (n = 11) SSc (n = 24) Age (years) 53 [44–68] 65 [53.5–72.5] Sex (female) 10 (90.9) 15 (62.5)
Data are shown as n (%) or median [interquartile range].
13
Supplementary material and methods
Reagents
2’3’-cGAMP, c-diAMP, Pam3CSK4, CL075, TL8-506, R848, CpGs [(ODN 2006
(5’-tcgtcgttttgtcgttttgtcgtt-3’), ODN 2336 (5’-gggGACGAC:GTCGTGgggggg-3’),
ODN2216 (5’-ggGGGACGA:TCGTCgggggg-3’)], and double-stranded genomic DNA
from E. coli K12 (dsDNA-EC) were purchased from InvivoGen. LPS and PMA were
purchased from Sigma-Aldrich. Recombinant human IFN-α, IFN-β, and IL-1β were
purchased from R&D Systems. Recombinant human IL-6, TNF-α and IFN-γ were
purchased from Peprotech. CpGs, D35, and K3, were purchased from Gene Design.
DNase I Amplification Grade was obtained from Sigma-Aldrich. Recombinant human
ectonucleotide pyrophosphatase/phosphodiesterase 1 (ENPP-1) was purchased from
R&D Systems.
Details of reporter cell lines
Reporter cell lines used in this study were cultured under standard conditions. HEK-Blue
TLR7, 8, and 9 (Cat. hkb-htlr7, hkb-htlr8, and hkb-htlr9) were purchased from
InvivoGen. According to the vendor’s manual, HEK-Blue IFN-α/β was generated by
co-transfection with the human STAT2 and IRF9 genes and the SEAP reporter gene
under the control of the ISG54 promoter. THP1-Blue ISG cells were generated by
integrating the sequence of interferon response element of ISG54 in front of the
promoter region of SEAP gene. HEK-Blue TLR7, 8, and 9 were generated by
co-transfection with human TLR7, 8, and 9, respectively. THP1-Dual stably harbors
both an ISG-inducible secreted luciferase reporter gene and an NF-kB–inducible SEAP
gene. THP1-Dual-KOSTING and THP1-Dual-KOcGAS were generated from
THP1-Dual by knocking out STING and cGAS, respectively.
TLRs pathway induction with sera in reporter cells HEK-Blue TLR reporter cells were plated in 96-well plates, incubated overnight, and
then treated with 20% serum or relevant compounds at the indicated concentrations.
After 24 h, SEAP in supernatant was detected using QUANTI-Blue medium (Invivogen),
and quantified at an optical density of 620 nm.
14
Reporter cell assays with blockade of IFN-I or ICs and digestion of DNA or
cGAMP
Antibodies specific for human IFN-α (clone H7WM116, InvivoGen), IFN-β (clone
10B10, InvivoGen), and IFNAR2 antibody (clone MMHAR-2, PBL) were used at 1
µg/ml to neutralize type I interferon in sera. Anti–human CD64 antibody (clone 10.1,
BioLegend) and human IgG (Sigma-Aldrich) were used at 2 µg/ml to block Fcγ receptor.
For assessment of DNA and STING ligands, patient sera were treated with DNase I for
100 min at 37°C and with ENPP-1 overnight at 37°C, respectively.
Details of generation of IFNAR2- and STING-knockout THP1-Blue ISG reporter
cell lines using CRISPR-Cas9
One day before transfection, HEK293T cells were plated in 10-cm dishes at 40%
confluence. Cells were transfected the next day at 80–90% confluence. For each dish,
17 µg of the vector of interest, 10 µg of pCAG-HIVgp, and 10 µg of
pCMV-VSV-G-RSV-Rev (RIKEN BioResource Center) were prepared in a total
volume of 250 µl, and then 250 µl of 1 M CaCl2 and 500 µl of 2x BBS (50 mM BES, 280 mM NaCl, 1.5 mM Na2HPO4) were added with gentle mixing. The mixture was
incubated for 20 min at room temperature, and then transferred to the cell culture. After
overnight incubation at 37°C, the culture medium was replaced with 7.5 ml of
pre-warmed complete DMEM containing 10 µM forskolin (Sigma-Aldrich). Virus-containing medium was harvested 48 h after medium change and centrifuged at
1,500 g for 30 min to remove cell debris. The supernatant was then transferred to a new
tube and mixed with 5x PEG-it (System Biosciences). After incubation for 12–16 h at
4°C, the solution was centrifuged again at 1,500g for 30 min. The culture supernatant
was discarded, and the pellet was suspended in 50 µl of PBS and stored at −80°C. THP-1 cells were transduced with lentivirus via spinfection in 96-well plates. Three
days after spinfection, puromycin was added to the medium for selection.
THP1-Blue ISG cells (Invivogen) were lentivirally transduced with
lentiCas9-Blast (Addgene). Expression of Cas9 was confirmed by western blotting with
anti-FLAG antibody (Sigma-Aldrich, F3165). Monoclonal cell populations were
isolated by manual picking under a microscope. The clone with the highest Cas9
expression was used for subsequent gene knockout (THP-1 ISG Cas9). Target
sequences for STING and IFNAR2 were 5’-GCGGGCCGACCGCATTTGGG-3’ and
15
5’-CGTCATTGAAGAACAGTCAG-3’, respectively. These target sequences were
cloned into lentiGuide-Puro (Addgene) as directed in Target Guide Sequence Cloning
Protocol
(https://media.addgene.org/data/plasmids/52/52963/52963-attachment_IPB7ZL_hJcbm.
pdf). THP-1 ISG Cas9 cells were transduced with lentiGuide-Puro targeting STING or
IFNAR2. After isolation of monoclonal cell populations of the transduced cells, gene
knockout was confirmed by western blotting, DNA sequencing of the target position in
the genome, and functional screening.
Sample preparation for LC-MS/MS analysis
Extraction of metabolites was performed according to Nishiumi et al. with slight
modifications [Nishiumi, Shin, et al. Serum metabolomics as a novel diagnostic
approach for pancreatic cancer. Metabolomics 2010;6:518-528]. In brief, 50 µL of
serum were mixed with 139 µL of methanol, 55.6 µL of water, and 55.6 µL of
chloroform, and vortexed for a few seconds. In the spike-in method, 10 µL of authentic
standards (5 µg/mL each) was also added. The sample was shaken for 30 min at 37°C.
After centrifugation at 16,000 × g for 3 min at 4°C, 225 µL of the supernatant was
transferred to a new tube, to which 200 µL of water was added. After centrifugation at
16,000 × g for 3 min at 4°C, 250 µL of supernatant was transferred to a new tube. The
solution was lyophilized, and then dissolved in 50 µL of 0.1% formic acid/water.
LC-MS/MS analysis
Authentic standards for 2’3’-cGAMP and c-diAMP were purchased from InvivoGen.
LC-MS/MS analysis was performed by Nexera System (Shimadzu co.)–triple
quadrupole mass spectrometry (LCMS-8060, Shimadzu). Samples were separated by an
InertSustain AQ-C18 column (150 mm × 2.1 mm i.d., 1.9 µm particle size; GL Sciences,
Osaka, Japan) at a flow rate of 400 µL/min. The gradient was generated by changing the
mixing ratio of the two eluents: A, 0.1% (v/v) formic acid; and B, acetonitrile
containing 0.1% (v/v) formic acid. The gradient was initiated with 1% B with a 2-min
hold, increased to 20% B for 8 min, and then increased to 99% B for 1 min, followed by
a 2-min hold at 99% B. Finally, the mobile phase was adjusted to its initial composition
and held for 2 min to re-equilibrate the column. Injection volumes were 1 µL for
analysis of authentic standards and 5 µL for serum samples. The column temperature
16
was set at 40°C. Under this condition, retention times of 2’3’-cGAMP and c-diAMP
were 2.091 and 5.183 min, respectively. Electrospray ionization (ESI) was performed at
4 kV with positive mode at 250°C in the desolvation line and 300°C in the interface.
Gas flow rates were 2 L/min for nebulizing gas and 5 L/min for drying gas. Data
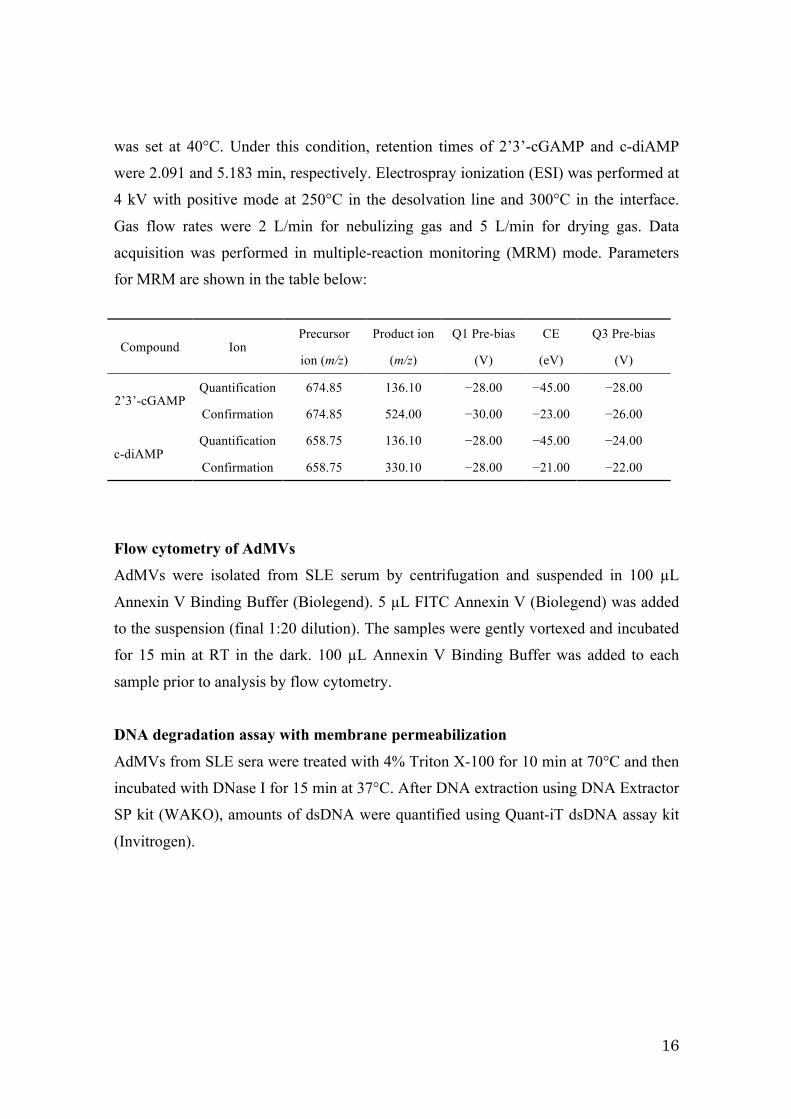
acquisition was performed in multiple-reaction monitoring (MRM) mode. Parameters
for MRM are shown in the table below:
Compound Ion Precursor
ion (m/z)
Product ion
(m/z)
Q1 Pre-bias
(V)
CE
(eV)
Q3 Pre-bias
(V)
2’3’-cGAMP Quantification 674.85 136.10 −28.00 −45.00 −28.00
Confirmation 674.85 524.00 −30.00 −23.00 −26.00
c-diAMP Quantification 658.75 136.10 −28.00 −45.00 −24.00
Confirmation 658.75 330.10 −28.00 −21.00 −22.00
Flow cytometry of AdMVs
AdMVs were isolated from SLE serum by centrifugation and suspended in 100 µL
Annexin V Binding Buffer (Biolegend). 5 µL FITC Annexin V (Biolegend) was added
to the suspension (final 1:20 dilution). The samples were gently vortexed and incubated
for 15 min at RT in the dark. 100 µL Annexin V Binding Buffer was added to each
sample prior to analysis by flow cytometry.
DNA degradation assay with membrane permeabilization
AdMVs from SLE sera were treated with 4% Triton X-100 for 10 min at 70°C and then
incubated with DNase I for 15 min at 37°C. After DNA extraction using DNA Extractor
SP kit (WAKO), amounts of dsDNA were quantified using Quant-iT dsDNA assay kit
(Invitrogen).
Related Documents