NASA/TM—2005-213457 Apollo Capsule Optimization for Improved Stability and Computational/Experimental Data Comparisons Susan E. Cliff Ames Research Center, Moffett Field, California Scott D. Thomas Raytheon ITSS Ames Research Center, Moffett Field, California May 2005

Welcome message from author
This document is posted to help you gain knowledge. Please leave a comment to let me know what you think about it! Share it to your friends and learn new things together.
Transcript

NASA/TM—2005-213457
Apollo Capsule Optimization for Improved Stability andComputational/Experimental Data Comparisons
Susan E. CliffAmes Research Center, Moffett Field, California
Scott D. ThomasRaytheon ITSSAmes Research Center, Moffett Field, California
May 2005

Since its founding, NASA has been dedicated to theadvancement of aeronautics and space science. TheNASA Scientific and Technical Information (STI)Program Office plays a key part in helping NASAmaintain this important role.
The NASA STI Program Office is operated byLangley Research Center, the Lead Center forNASA’s scientific and technical information. TheNASA STI Program Office provides access to theNASA STI Database, the largest collection ofaeronautical and space science STI in the world.The Program Office is also NASA’s institutionalmechanism for disseminating the results of itsresearch and development activities. These resultsare published by NASA in the NASA STI ReportSeries, which includes the following report types:
• TECHNICAL PUBLICATION. Reports ofcompleted research or a major significant phaseof research that present the results of NASAprograms and include extensive data or theoreti-cal analysis. Includes compilations of significantscientific and technical data and informationdeemed to be of continuing reference value.NASA’s counterpart of peer-reviewed formalprofessional papers but has less stringentlimitations on manuscript length and extentof graphic presentations.
• TECHNICAL MEMORANDUM. Scientific andtechnical findings that are preliminary or ofspecialized interest, e.g., quick release reports,working papers, and bibliographies that containminimal annotation. Does not contain extensiveanalysis.
• CONTRACTOR REPORT. Scientific andtechnical findings by NASA-sponsoredcontractors and grantees.
The NASA STI Program Office . . . in Profile
• CONFERENCE PUBLICATION. Collectedpapers from scientific and technical confer-ences, symposia, seminars, or other meetingssponsored or cosponsored by NASA.
• SPECIAL PUBLICATION. Scientific, technical,or historical information from NASA programs,projects, and missions, often concerned withsubjects having substantial public interest.
• TECHNICAL TRANSLATION. English-language translations of foreign scientific andtechnical material pertinent to NASA’s mission.
Specialized services that complement the STIProgram Office’s diverse offerings include creatingcustom thesauri, building customized databases,organizing and publishing research results . . . evenproviding videos.
For more information about the NASA STIProgram Office, see the following:
• Access the NASA STI Program Home Page athttp://www.sti.nasa.gov
• E-mail your question via the Internet [email protected]
• Fax your question to the NASA Access HelpDesk at (301) 621-0134
• Telephone the NASA Access Help Desk at(301) 621-0390
• Write to:NASA Access Help DeskNASA Center for AeroSpace Information7121 Standard DriveHanover, MD 21076-1320
NASA/TM—2005-213457
Apollo Capsule Optimization for Improved Stability andComputational/Experimental Data Comparisons
Susan E. CliffAmes Research Center, Moffett Field, California
Scott D. ThomasRaytheon ITSSAmes Research Center, Moffett Field, California
May 2005
National Aeronautics andSpace Administration
Ames Research CenterMoffett Field, California 94035-1000

Available from:
NASA Center for AeroSpace Information National Technical Information Service7121 Standard Drive 5285 Port Royal RoadHanover, MD 21076-1320 Springfield, VA 22161(301) 621-0390 (703) 487-4650
AcknowledgmentsThe authors would like to thank Scott L. Lawrence for his efforts in obtaining all of the Navier–Stokes computations presented in this report, and his help in obtaining and evaluating severalApollo Project reports.

CONTENTS
SUMMARY.......................................................................................................................................... 1
INTRODUCTION ................................................................................................................................ 1
PARAMETRIC STUDY AND RESULTS .......................................................................................... 2
OPTIMIZATION DESCRIPTION....................................................................................................... 4
APOLLO CAPSULE AERODYNAMIC CHARACTERISTICS ....................................................... 6
OPTIMIZATION DISCUSSION AND RESULTS ............................................................................. 6
COMPUTATIONAL DATA CORROBORATION OF OPTIMIZED CAPSULE EULER / EXPERIMENTAL DATA CORROBORATION ................................................................ 9
CONCLUDING REMARKS.............................................................................................................. 11
REFERENCES ................................................................................................................................... 13
TABLES ............................................................................................................................................ 15
FIGURES ............................................................................................................................................17
iii

.................................................................................................................................................................
iv
APOLLO CAPSULE OPTIMIZATION FOR IMPROVED STABILITY
AND COMPUTATIONAL/EXPERIMENTAL DATA COMPARISONS
Susan E. Cliff and Scott D. Thomas
Ames Research Center
SUMMARY
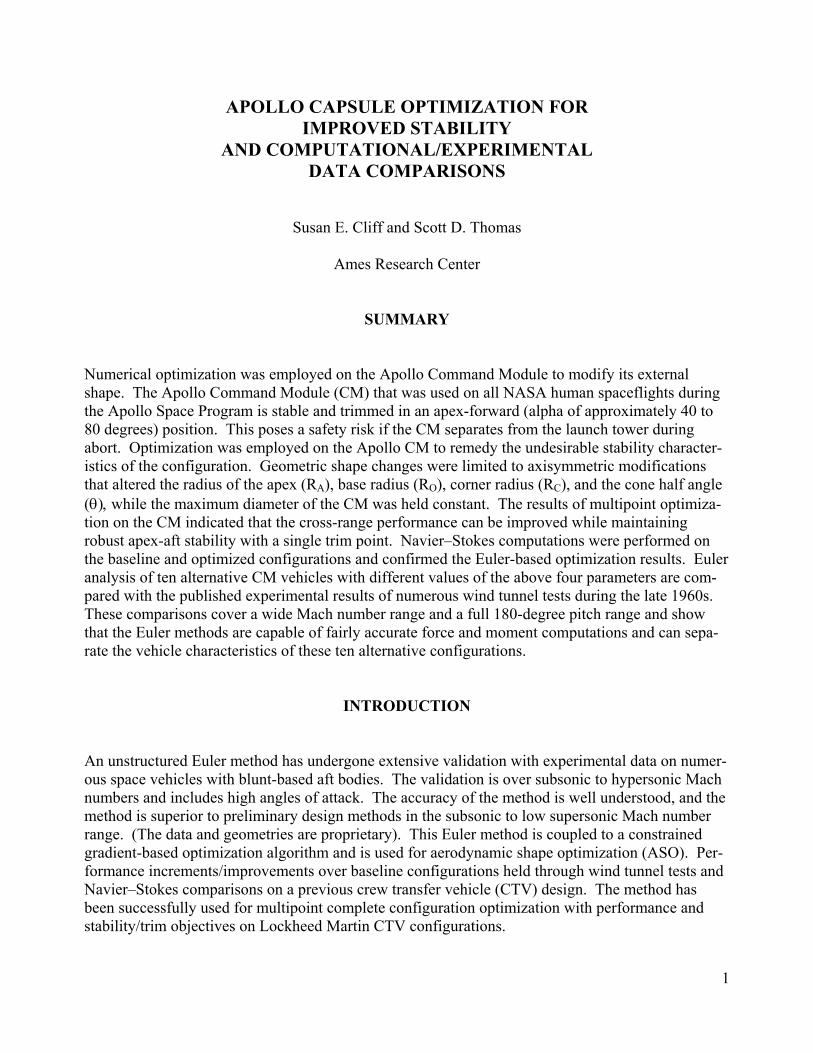
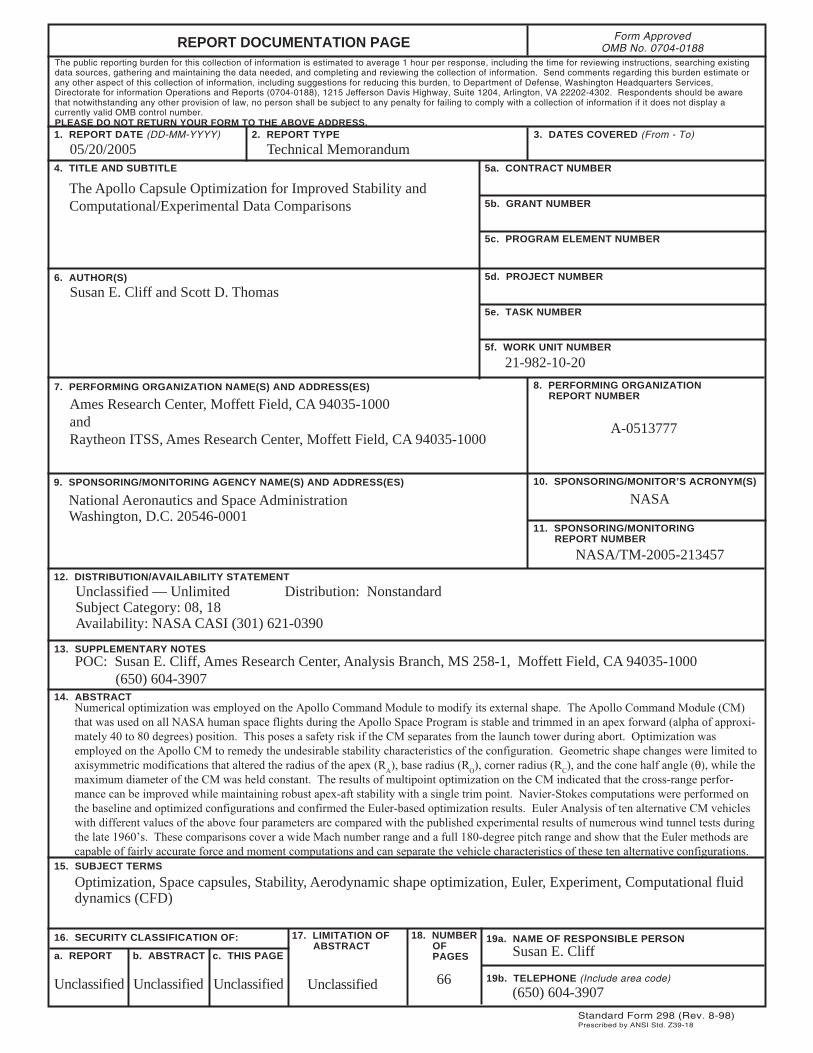
Numerical optimization was employed on the Apollo Command Module to modify its external shape. The Apollo Command Module (CM) that was used on all NASA human spaceflights during the Apollo Space Program is stable and trimmed in an apex-forward (alpha of approximately 40 to 80 degrees) position. This poses a safety risk if the CM separates from the launch tower during abort. Optimization was employed on the Apollo CM to remedy the undesirable stability character-istics of the configuration. Geometric shape changes were limited to axisymmetric modifications that altered the radius of the apex (RA), base radius (RO), corner radius (RC), and the cone half angle (θ), while the maximum diameter of the CM was held constant. The results of multipoint optimiza-tion on the CM indicated that the cross-range performance can be improved while maintaining robust apex-aft stability with a single trim point. Navier�Stokes computations were performed on the baseline and optimized configurations and confirmed the Euler-based optimization results. Euler analysis of ten alternative CM vehicles with different values of the above four parameters are com-pared with the published experimental results of numerous wind tunnel tests during the late 1960s. These comparisons cover a wide Mach number range and a full 180-degree pitch range and show that the Euler methods are capable of fairly accurate force and moment computations and can sepa-rate the vehicle characteristics of these ten alternative configurations.
INTRODUCTION An unstructured Euler method has undergone extensive validation with experimental data on numer-ous space vehicles with blunt-based aft bodies. The validation is over subsonic to hypersonic Mach numbers and includes high angles of attack. The accuracy of the method is well understood, and the method is superior to preliminary design methods in the subsonic to low supersonic Mach number range. (The data and geometries are proprietary). This Euler method is coupled to a constrained gradient-based optimization algorithm and is used for aerodynamic shape optimization (ASO). Per-formance increments/improvements over baseline configurations held through wind tunnel tests and Navier�Stokes comparisons on a previous crew transfer vehicle (CTV) design. The method has been successfully used for multipoint complete configuration optimization with performance and stability/trim objectives on Lockheed Martin CTV configurations.
1
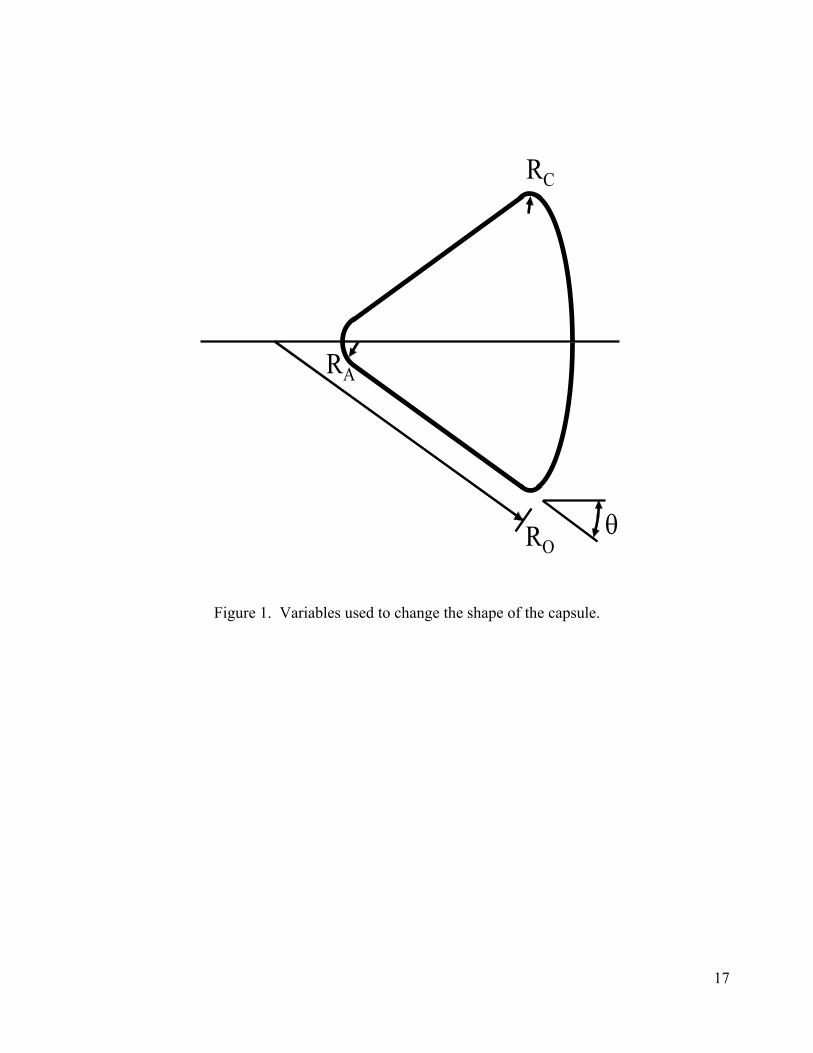
With the recent NASA mandate for the development of a manned crew exploration vehicle and the likely change from winged configurations to capsule designs, the Euler solver used in the optimiza-tion package was evaluated by comparison with the extensive wind tunnel data obtained during the Apollo Space Program. During this investigation the baseline Apollo CM (employed on all flights) was found to have an undesirable characteristic in that it is both stable and trimmed in an apex-forward position that poses a safety risk if the CM separates from the launch tower during abort. The Euler-based optimization program that was used successfully on winged configurations seemed ideally suited to perform optimization of the CM to remedy this undesirable characteristic. Altera-tions and additional components that were developed to eliminate the dual trim point of the Apollo capsule were built during the Apollo program, and the aerodynamic quantities of these vehicles were obtained through extensive wind tunnel tests. Computational fluid dynamics (CFD) codes have pro-liferated since the late 1960s and have become the testbeds for aerodynamic-based design changes with typically only limited wind tunnel testing. The wealth of test data from the 1960s remains sig-nificant to the calibration of CFD methods and was therefore used to compare with the Euler code on a series of 10 parametric designs of the capsule with shape changes that altered the radius of the apex (RA), base radius (RO), corner radius (RC), and the cone half angle (θ), while holding the maximum diameter of the CM constant. Figure 1 depicts the variables used to change the capsule shape. The four design parameters used were employed as design variables in a multipoint design optimiza-tion problem to eliminate the apex-forward trim point and improve the performance of the vehicle. Since the number of design variables was sufficiently small, a parametric study was also performed to find sets of parameters that were close to the optimum. This parametrically determined optimum is compared with the optimum found through the gradient-based optimization method. The set of ten capsules (table 1) with experimental data are compared with the Euler solver at Mach numbers of 0.4, 0.7, 1.2, 1.65, 3.26, 3.27, and 5.0.
PARAMETRIC STUDY AND RESULTS To properly assess an optimization of the Apollo capsule, a parametric study of the four design vari-ables was initiated during the optimization of the Apollo capsule. The small number of geometric variables made a parametric study feasible. Each of the four design variables was altered over a range of reasonable values in equal increments to five different values and at three different angles of attack, requiring a total of 1875 ( ) flow solutions. The values of the variables are provided below:
453×
θ (degrees) = 25.0 30.0 35.0 40.0 45.0 RA (inches) = 5.0 10.0 15.0 20.0 25.0 RC (inches) = 0.0 7.5 15.0 22.5 30.0 RO (inches) = 125.0 193.75 262.5 331.25 400.0 The capsule was assessed at Mach 3.26 and three angles of attack α = 75.0, 130.0, and 143.0 de-grees, representing design points 1, 2, and 3, respectively. This large volume of data was evaluated
2
by applying the objective function used in the optimization problem to lift, drag, and moment coeffi-cient data from these runs. The reference area of the semispan model used in the computations is 9313.2514 in.2, the center of gravity (c.g.) was located at an axial location of 105.49 inches and a vertical location of �9.086 inches from the apex, and the average chord was 154 inches. This objec-tive function comprises weighted terms involving forces and moment coefficient data from the three design points, as follows: Objective = σ1 (CM1 � 0.002)2 + σ2 |CD2/CL2| + σ3 (CM3)2
The subscripts on the force and moment terms represent the design point of the solution. The vari-ables σ1, σ2, and σ3 were derived by finding the maximum value of each of the three terms in the parametric study, and scaling them such that: σ1 = 0.50 / max [(CM1 - 0.002)2] σ2 = 0.25 / max [|CD2 /CL2|] σ3 = 0.25 / max [(CM3 - 0.0)2] This weights the first term, forcing a positive pitching moment of 0.002 at α = 75 degrees�to eliminate the trim point that occurs near this design point�as 50% of the objective function, with the other terms both weighted to 25% of the objective function. The actual values of weighting terms determined from the parametric study are: σ1 = 9.36754242347172 σ2 = 0.0424317664785264 σ3 = 15.5260032173313 These weighting terms were then used in optimization. The starting objective function is set equal to 1.0 by the choice of the weighting terms described previously. Thus, the resulting weighted sum is expected to be of order 1 during optimization. The parametric data can be visualized by multiplying the objective function at each of the 625 points of the four-dimensional matrix by 1000 and rounding its value to the nearest integer, as shown in table 2. The data are shown as inner and outer matrix values where the outer matrix is for the half angle of the cone, θ, and apex radius, RA, and the inner matrix is for the corner radius (columns for RC of 0.0, 7.5, 15.0, 22.5, and 30.0 inches plotted left to right, respectively) and the base radius (rows for RO of 125.0, 193.75, 262.5, 331.25, and 400.0 inches plotted from top to bottom, respectively). Since the objective function is to be minimized, the smaller integers represent better solutions. The lowest value of objective function using these σ values is 49 (colored red in table 2) and appears at position (4, 5, 1, 4); that is, outer matrix position of column 4, row 5, and inner matrix position of column 1, row 4, where θ = 40, RA = 25, RC = 0.0, and RO = 331.25. This will be called the best parametric shape. The objective function value was about 0.04948 for this combination of design variables.
3
Note that the optimum occurs where RC is zero (the corner between the cone and the base is sharp). This may not be desirable in a practical design problem for aerodynamic heating concerns. If the zero-radius solutions are not feasible there are several choices with objective function values of 58 with larger RC values of 7.5 degrees. The design space can be readily viewed by assigning colors to the original values of the four-dimensional matrix (figure 2). The color assignment is based on the values of the objective function, rather than the values in table 2. Slight differences in value are seen in the colors for equivalent values shown in the table. For example, the positions for θ = 35 degrees, RA = 25 inches, RC = 7.5 inches (row 2 of inner matrix), and RO = 262.5, 331.25, and 400 inches (columns 3�5) have values of 58. But these objective function values are actually 0.58108, 0.57557, and 0.57553, respectively, so there are slightly different shades of cyan in the colored graphic of fig-ure 2. The baseline Apollo capsule C01 has values of θ = 33 degrees, RA = 15.4 inches, RC = 7.7 inches, and RO = 184.8 inches with a base width of 154.0 inches. The closest parametric 4-tuple for this would correspond to θ = 35 degrees, RA = 15 inches, RC = 7.5 inches, and RO = 193.73 inches at position (3, 3, 2, 2), which corresponds to a value of 65 in the table.
OPTIMIZATION DESCRIPTION An Euler unstructured-tetrahedral-grid-based CFD code, AIRPLANE (ref. 1), is coupled to a con-strained gradient-based optimization algorithm, NPSOL (ref. 2), to provide an aerodynamic shape optimization technique for the Systems Analysis & Integration Branch at NASA Ames Research Center. NPSOL is a constrained quasi-Newton finite-difference optimization method. Several codes were developed to facilitate aerodynamic shape optimization. These include adding multigrid capability to AIRPLANE, developing surface grid perturbation methods, developing a variety of mesh movement techniques, and the parallelization of these methods. In this capsule design case, the surface grids were developed by a new process, described in the next paragraph, and the multi-grid option in the flow solver was not used. A four-tuple (θ, RA, RC, RO) determines a generating curve in the symmetry plane, which then defines the capsule by rotation about the x axis. The capsule surface is made of a spherical apex, conical body, toroidal corner, and spherical base, with tangency at the connecting circles unless R
)(xy
C is zero. Surface mesh generation is done by application of a special program named MKACM that creates strips of triangles from the waist (maximum diameter of the capsule), where 77)( =xy , marching to each axial extremity, driven by a maximum edge length requirement and a preference for equilateral triangles. For example, the baseline C01 surface mesh from minimum to maximum is defined by 9145 points, 18034 triangles, and 27178 edges, for which the av-erage edge length is 1.85 inches with a standard deviation of 0.064. The whole surface mesh is shown in figure 3. Details of the apex, apex cone, cone corner base, and the corner base are shown in figures 4, 5, 6, and 7, respectively. The resulting surface mesh meets the Delaunay criterion, which is that the sphere balanced on each triangle contains no other mesh points than its vertices.
88.12=x7.142=x
The optimization code has been successfully used in the recent past for the High-Performance Com-puting and Communication Program (HPCCP) by applying the method to the Ames Sharp CTV con-figurations. The resulting configurations were used for the approach and landing simulation data-base for the Virtual Flight Rapid Integration Test Environment (VF-RITE) project (ref. 3). These
4

methods more recently were used for the design of orbital space plane vehicles under a contract with Lockheed Martin Corporation, where improved stability characteristics and performance at multiple design points were attained. Aerodynamic shape optimization is particularly amenable to unstructured-grid methods. Complete configuration multipoint numerical optimization can often begin within a few days for an unstruc-tured method with the rapid generation of surface (triangles) and volume (tetrahedral) meshes of an unstructured method. A gradient approach was chosen since this tool is well suited for detailed aerodynamic design (the vehicle conceptual design was performed a priori). A gradient-based algo-rithm should require fewer function evaluations to find local minima or design improvements in con-trast to non-gradient methods such as genetic algorithm techniques that are capable of finding the global minimum. However, the gradients calculated via finite differences are computationally ex-pensive since they require at least two flow solutions for each design variable. Thus, a limited num-ber of design variables is recommended to reduce the CPU time with the present method. The AIRPLANE optimization process requires the user to supply a range of values for each design variable to limit the perturbations to those that are acceptable to the designer. The variable bounds are never exceeded since NPSOL is a constrained optimization method. The choice of variable bounds should be carefully considered before optimization begins. The ranges should be narrow enough to eliminate undesirable results, yet wide enough so that significant performance changes can be obtained by the optimizer. As the optimizer runs, it checks for stored solutions that may have already been computed, matching flow conditions and design variables. This is used to �restart� the optimization process because finding flow solutions is relatively time consuming�NPSOL itself executes very rapidly. If no existing solution is found, the code proceeds to create the surfaces of the vehicle, either through a body-of-revolution meshing method for capsule designs or through modification of the surfaces of the configurations using APSHAPER and APSHBODY (ref. 4). APSHAPER perturbs the triangulated surfaces of wing-type components, ensuring that the number of points and connectivity remain unchanged. It is capable of wing planform changes and dihedral in addition to wing sectional changes such as camber, thickness, and leading- and trailing-edge droop. It can also provide flap deflections as either true rotations or by shearing the wing for either leading- or trailing-edge flaps. APSHBODY is used to perturb �body-type� components. Perturba-tion on the fuselage can be applied vertically, spanwise, or radially. Fuselage camber and droop ap-plied to either the fore or aft portion is also attainable. When the surface mesh is established, the AIRPLANE volume mesh of tetrahedra is either deformed or regenerated. MESHMV (ref. 4), the mesh deformation package, preserves the number of points and connectivity of the original mesh and runs quickly. If this method inverts any tetrahedron, the whole mesh is automatically regenerated from scratch using MESH3D (ref. 5). In this capsule de-sign effort, MESH3D was used to regenerate the volume meshes each time because the surface mesh generation program was allowed to change the number of surface points. Following this, AIRPLANE is run, and the aerodynamic lift coefficient (CL), drag coefficient (CD), and pitching moment coefficient (CM) are returned to NPSOL in order to compute the objective function.
5
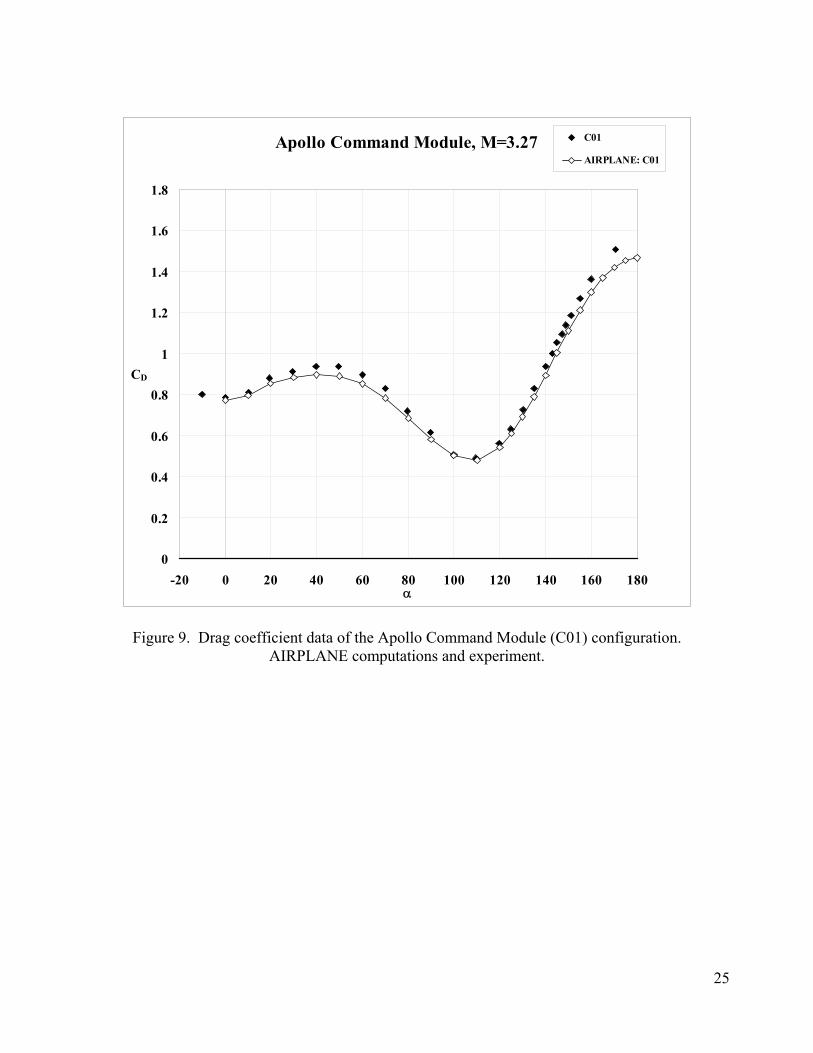
APOLLO CAPSULE AERODYNAMIC CHARACTERISTICS The Apollo capsule is known as the C01 configuration to distinguish it from the other nine capsules that were wind tunnel tested during the Apollo Program (table 1). The C01 configuration has these properties: θ = 33.0 degrees, RA = 15.4 inches, RC = 7.7 inches, and RO = 184.8 inches, with a base width of 154.0 inches. This capsule was used as the baseline configuration for optimization. The baseline configuration lift, drag, and pitching moment coefficient characteristics were obtained for Mach 3.27 using the unstructured Euler code, AIRPLANE, in figures 8, 9, and 10. An angle of attack of zero degrees represents the apex-forward position, and thus 180 degrees angle of attack will position the vehicle with the base (or heat shield) forward. The ability of the Euler computa-tional methods to predict the flow characteristics of this vehicle is very good for these flight condi-tions. These computational tools were not developed during the Apollo Program, hence wind tun-nels were used extensively to obtain aerodynamic data bases for the Apollo configurations. The pitching moment coefficient data shows the design flaw of the Apollo configuration (figure 10). The multiple trim points are shown in both the experimental and computational data. The trim points that occur at pitch angles between about 50 and 85 degrees are undesirable because the apex is still forward and the vehicle is not protected by the blunt base that acts as a heat shield. In addition, the negative slope of the moment curve indicates that the vehicle can achieve stable trim, that is, the capsule will return to the trim point if perturbed from this position. This was a well-known problem of the isolated capsule during the Apollo Program. The remedy to ensure that the capsule heat shield would be in a forward attitude was to include deployable canard surfaces near the rocket nose of the launch escape vehicle (LEV) (ref. 6) and to allow the entire LEV to remain attached during an abort scenario. The LEV consists of the command module, tower assembly, and rocket body. The de-ployed canard surfaces cause the complete LEV to rotate so that the heat shield is forward. The ca-nard surfaces also help to dampen the aerodynamic forces after the rotation maneuver.
OPTIMIZATION DISCUSSION AND RESULTS The objective function and range of design variables were chosen to address the performance and (static stability) pitching moment characteristics of the capsule. Other system requirements are not addressed, such as the dynamic stability of the isolated capsule or the aerodynamic heat loads of the capsule. This optimization problem was set up to demonstrate the applicability of unstructured op-timization to space capsule design, primarily as proof of concept to show that it is quite capable of achieving improved capsule designs for the currently mandated crew exploration vehicle. The ob-jective function for optimization was described in detail in the parametric study section of this re-port. The optimization was a three-point design problem with each of the three design points at Mach 3.26. The three points were for three angles of attack, where the first term of the objective function was designed to modify the pitching moment at alpha of 75 degrees to a value of 0.002 to remove the trim point at this condition. The second term was to improve L/D (minimize D/L) at 130 degrees, and the third term was to maintain the trim point at alpha 143 degrees. These three terms are added together with weighting factors of 0.5, 0.25, and 0.25 for the three design points, respec-tively, to form a single objective function value that is to be minimized during optimization. The
6
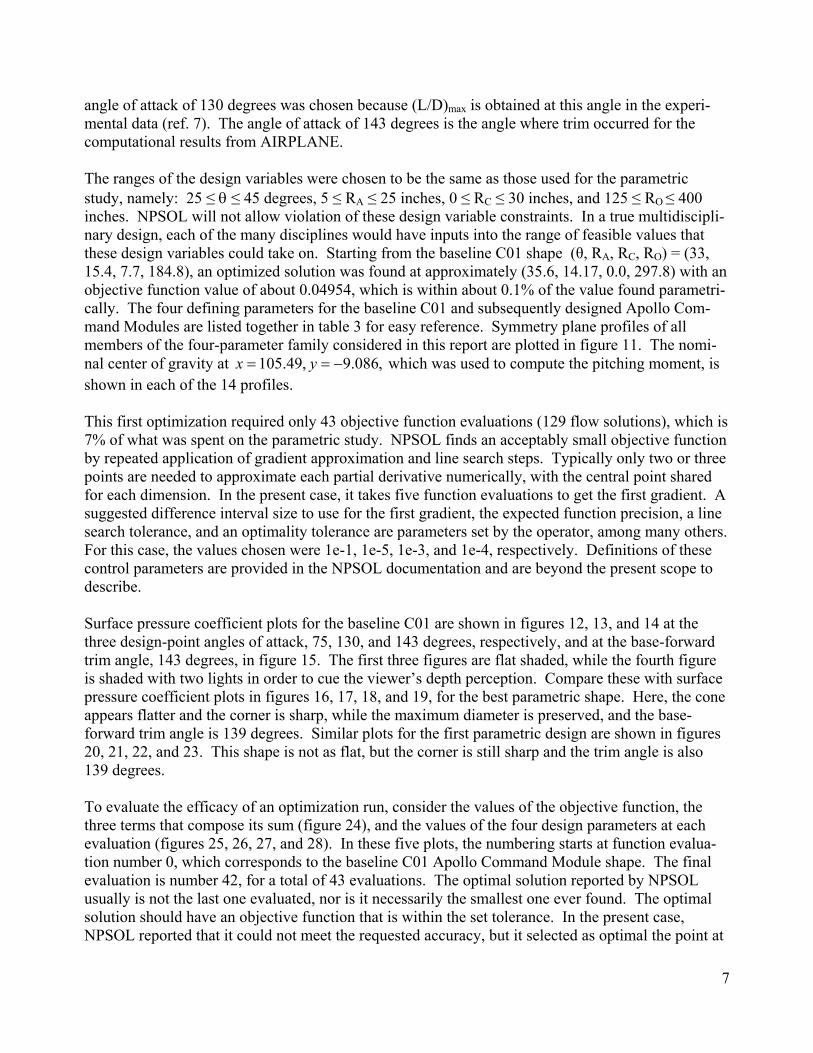
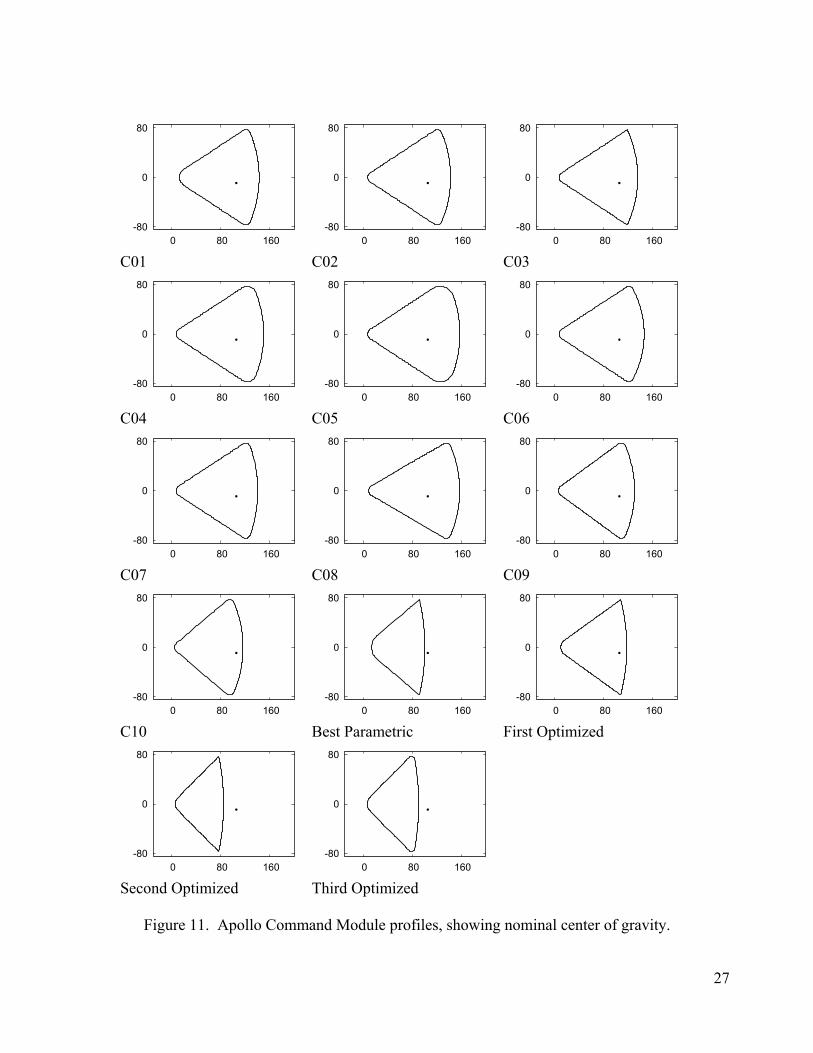
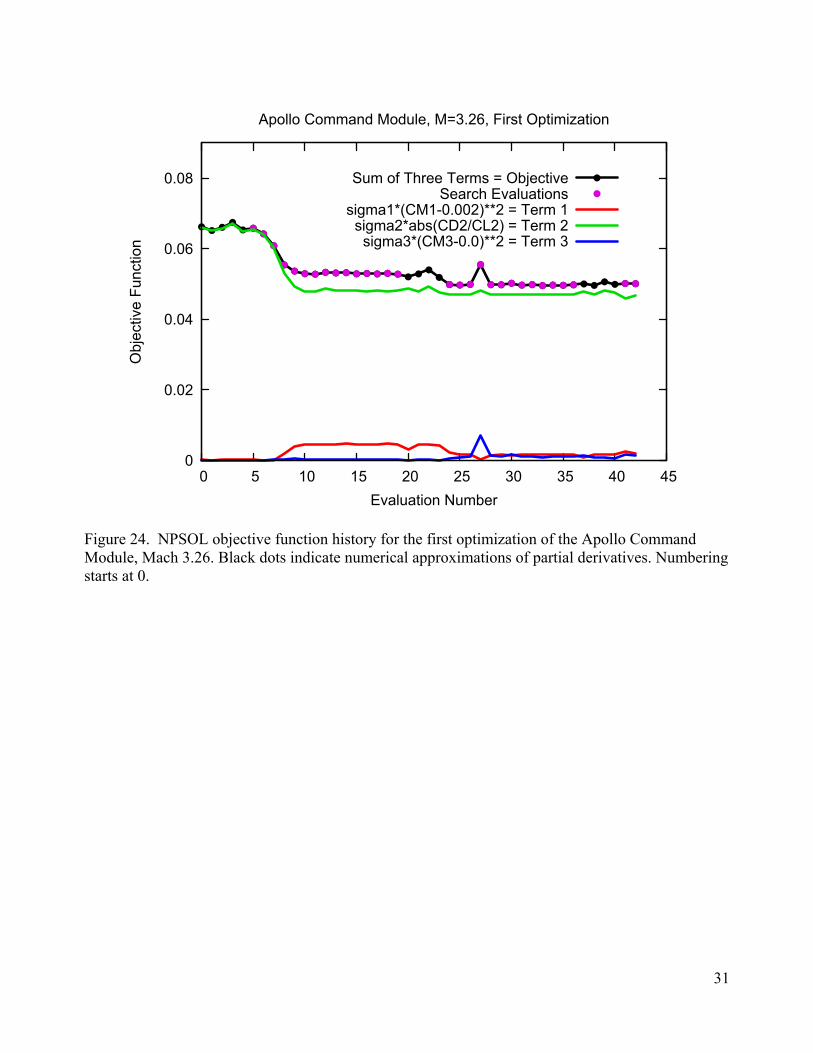
angle of attack of 130 degrees was chosen because (L/D)max is obtained at this angle in the experi-mental data (ref. 7). The angle of attack of 143 degrees is the angle where trim occurred for the computational results from AIRPLANE. The ranges of the design variables were chosen to be the same as those used for the parametric study, namely: 25 ≤ θ ≤ 45 degrees, 5 ≤ RA ≤ 25 inches, 0 ≤ RC ≤ 30 inches, and 125 ≤ RO ≤ 400 inches. NPSOL will not allow violation of these design variable constraints. In a true multidiscipli-nary design, each of the many disciplines would have inputs into the range of feasible values that these design variables could take on. Starting from the baseline C01 shape (θ, RA, RC, RO) = (33, 15.4, 7.7, 184.8), an optimized solution was found at approximately (35.6, 14.17, 0.0, 297.8) with an objective function value of about 0.04954, which is within about 0.1% of the value found parametri-cally. The four defining parameters for the baseline C01 and subsequently designed Apollo Com-mand Modules are listed together in table 3 for easy reference. Symmetry plane profiles of all members of the four-parameter family considered in this report are plotted in figure 11. The nomi-nal center of gravity at ,086.9,49.105 −== yx which was used to compute the pitching moment, is shown in each of the 14 profiles. This first optimization required only 43 objective function evaluations (129 flow solutions), which is 7% of what was spent on the parametric study. NPSOL finds an acceptably small objective function by repeated application of gradient approximation and line search steps. Typically only two or three points are needed to approximate each partial derivative numerically, with the central point shared for each dimension. In the present case, it takes five function evaluations to get the first gradient. A suggested difference interval size to use for the first gradient, the expected function precision, a line search tolerance, and an optimality tolerance are parameters set by the operator, among many others. For this case, the values chosen were 1e-1, 1e-5, 1e-3, and 1e-4, respectively. Definitions of these control parameters are provided in the NPSOL documentation and are beyond the present scope to describe. Surface pressure coefficient plots for the baseline C01 are shown in figures 12, 13, and 14 at the three design-point angles of attack, 75, 130, and 143 degrees, respectively, and at the base-forward trim angle, 143 degrees, in figure 15. The first three figures are flat shaded, while the fourth figure is shaded with two lights in order to cue the viewer�s depth perception. Compare these with surface pressure coefficient plots in figures 16, 17, 18, and 19, for the best parametric shape. Here, the cone appears flatter and the corner is sharp, while the maximum diameter is preserved, and the base-forward trim angle is 139 degrees. Similar plots for the first parametric design are shown in figures 20, 21, 22, and 23. This shape is not as flat, but the corner is still sharp and the trim angle is also 139 degrees. To evaluate the efficacy of an optimization run, consider the values of the objective function, the three terms that compose its sum (figure 24), and the values of the four design parameters at each evaluation (figures 25, 26, 27, and 28). In these five plots, the numbering starts at function evalua-tion number 0, which corresponds to the baseline C01 Apollo Command Module shape. The final evaluation is number 42, for a total of 43 evaluations. The optimal solution reported by NPSOL usually is not the last one evaluated, nor is it necessarily the smallest one ever found. The optimal solution should have an objective function that is within the set tolerance. In the present case, NPSOL reported that it could not meet the requested accuracy, but it selected as optimal the point at
7
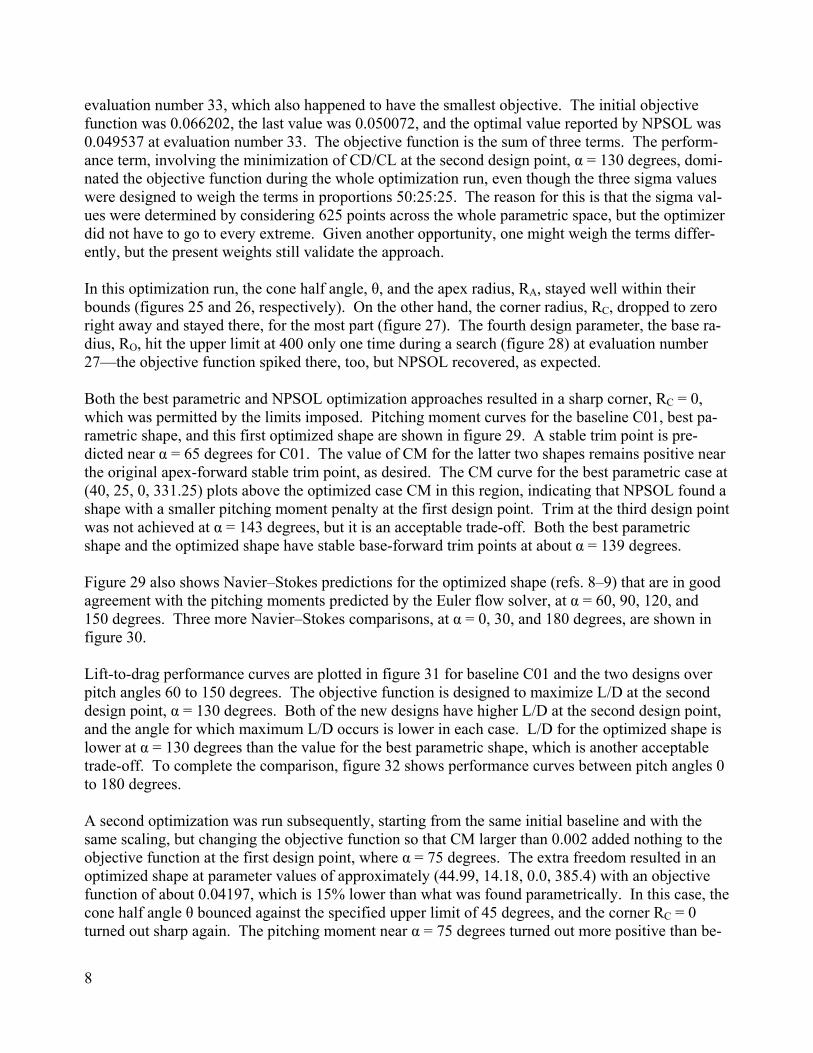
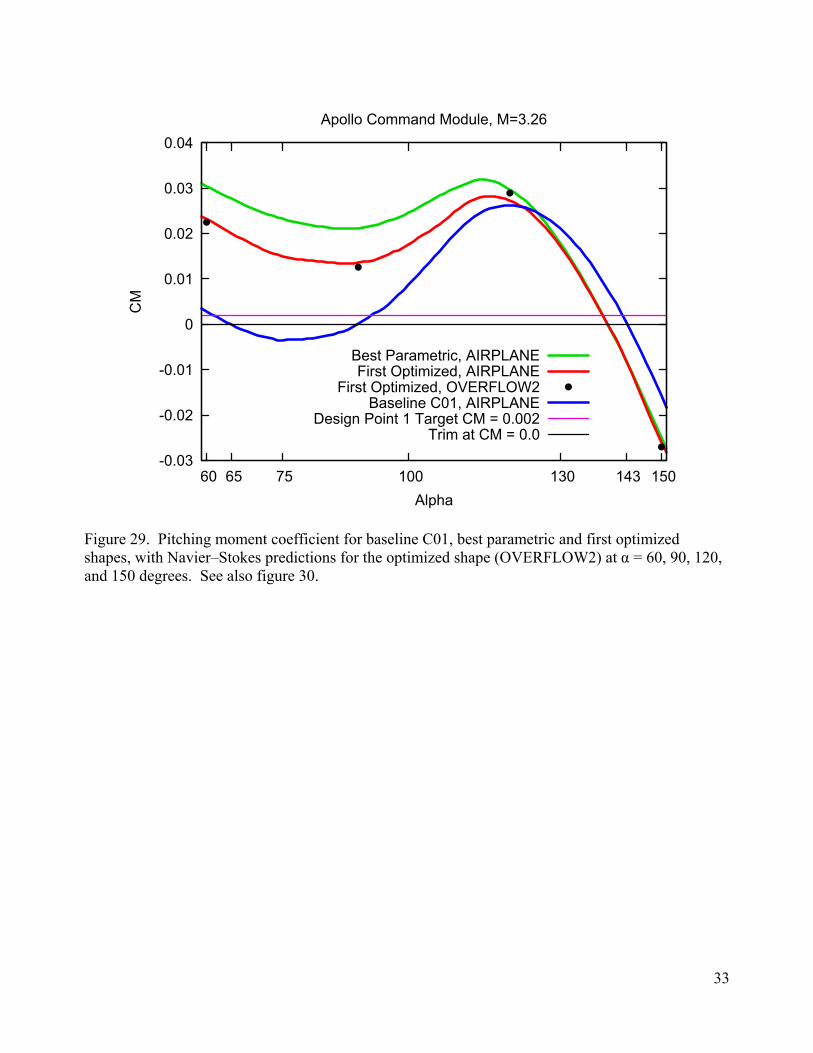
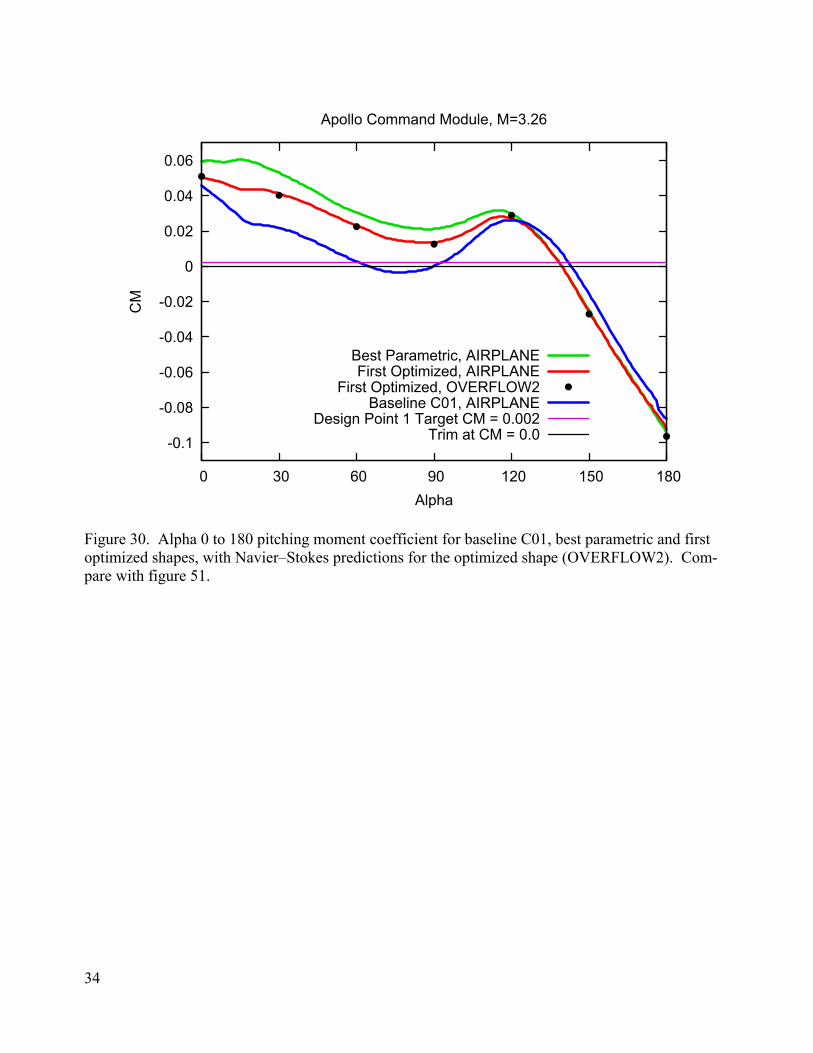
evaluation number 33, which also happened to have the smallest objective. The initial objective function was 0.066202, the last value was 0.050072, and the optimal value reported by NPSOL was 0.049537 at evaluation number 33. The objective function is the sum of three terms. The perform-ance term, involving the minimization of CD/CL at the second design point, α = 130 degrees, domi-nated the objective function during the whole optimization run, even though the three sigma values were designed to weigh the terms in proportions 50:25:25. The reason for this is that the sigma val-ues were determined by considering 625 points across the whole parametric space, but the optimizer did not have to go to every extreme. Given another opportunity, one might weigh the terms differ-ently, but the present weights still validate the approach. In this optimization run, the cone half angle, θ, and the apex radius, RA, stayed well within their bounds (figures 25 and 26, respectively). On the other hand, the corner radius, RC, dropped to zero right away and stayed there, for the most part (figure 27). The fourth design parameter, the base ra-dius, RO, hit the upper limit at 400 only one time during a search (figure 28) at evaluation number 27�the objective function spiked there, too, but NPSOL recovered, as expected. Both the best parametric and NPSOL optimization approaches resulted in a sharp corner, RC = 0, which was permitted by the limits imposed. Pitching moment curves for the baseline C01, best pa-rametric shape, and this first optimized shape are shown in figure 29. A stable trim point is pre-dicted near α = 65 degrees for C01. The value of CM for the latter two shapes remains positive near the original apex-forward stable trim point, as desired. The CM curve for the best parametric case at (40, 25, 0, 331.25) plots above the optimized case CM in this region, indicating that NPSOL found a shape with a smaller pitching moment penalty at the first design point. Trim at the third design point was not achieved at α = 143 degrees, but it is an acceptable trade-off. Both the best parametric shape and the optimized shape have stable base-forward trim points at about α = 139 degrees. Figure 29 also shows Navier�Stokes predictions for the optimized shape (refs. 8�9) that are in good agreement with the pitching moments predicted by the Euler flow solver, at α = 60, 90, 120, and 150 degrees. Three more Navier�Stokes comparisons, at α = 0, 30, and 180 degrees, are shown in figure 30. Lift-to-drag performance curves are plotted in figure 31 for baseline C01 and the two designs over pitch angles 60 to 150 degrees. The objective function is designed to maximize L/D at the second design point, α = 130 degrees. Both of the new designs have higher L/D at the second design point, and the angle for which maximum L/D occurs is lower in each case. L/D for the optimized shape is lower at α = 130 degrees than the value for the best parametric shape, which is another acceptable trade-off. To complete the comparison, figure 32 shows performance curves between pitch angles 0 to 180 degrees. A second optimization was run subsequently, starting from the same initial baseline and with the same scaling, but changing the objective function so that CM larger than 0.002 added nothing to the objective function at the first design point, where α = 75 degrees. The extra freedom resulted in an optimized shape at parameter values of approximately (44.99, 14.18, 0.0, 385.4) with an objective function of about 0.04197, which is 15% lower than what was found parametrically. In this case, the cone half angle θ bounced against the specified upper limit of 45 degrees, and the corner RC = 0 turned out sharp again. The pitching moment near α = 75 degrees turned out more positive than be-
8
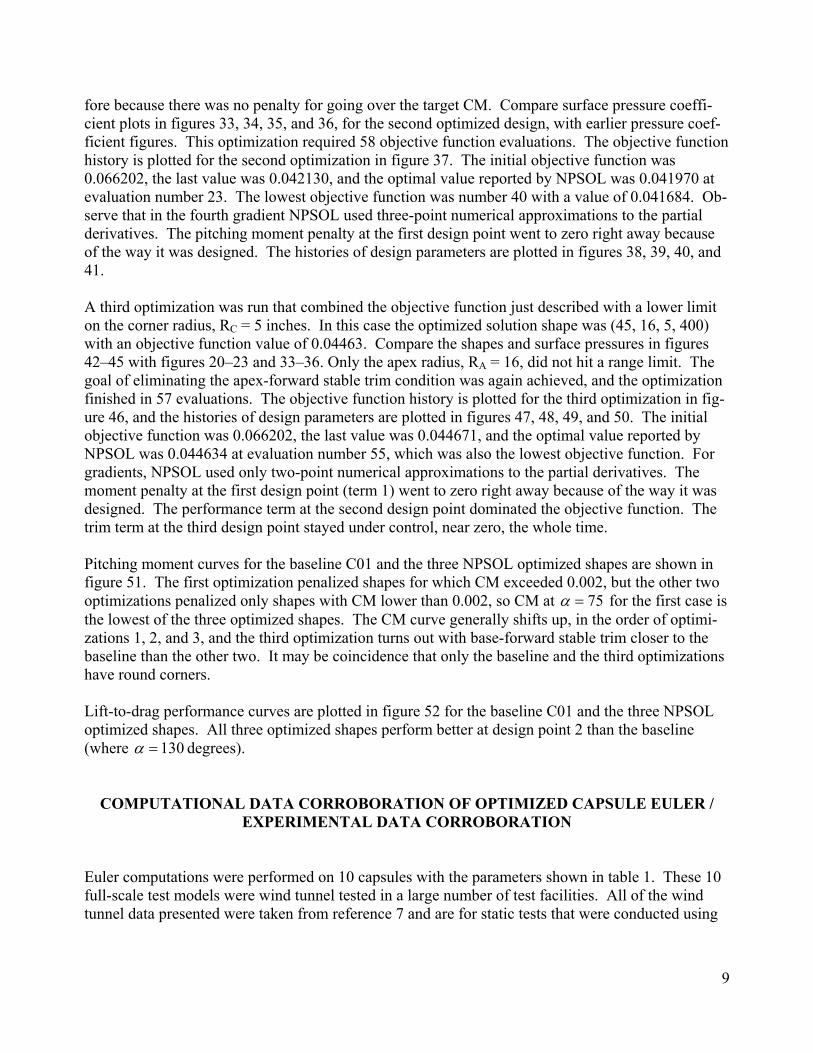
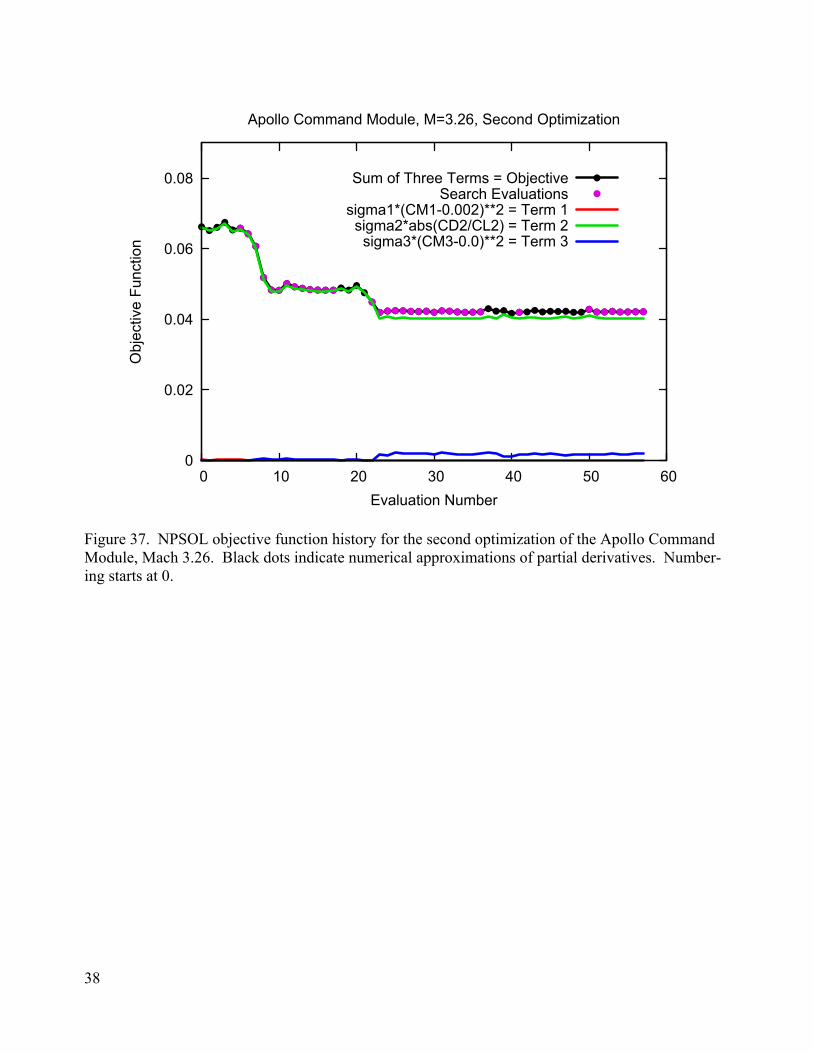
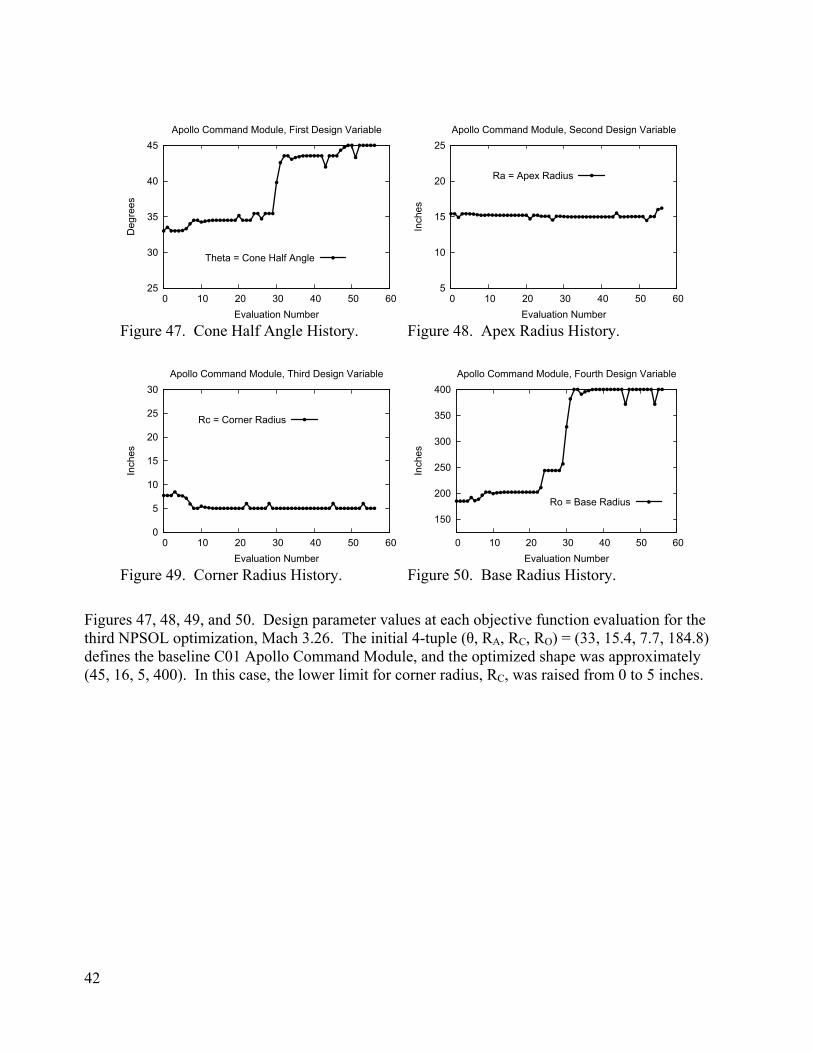
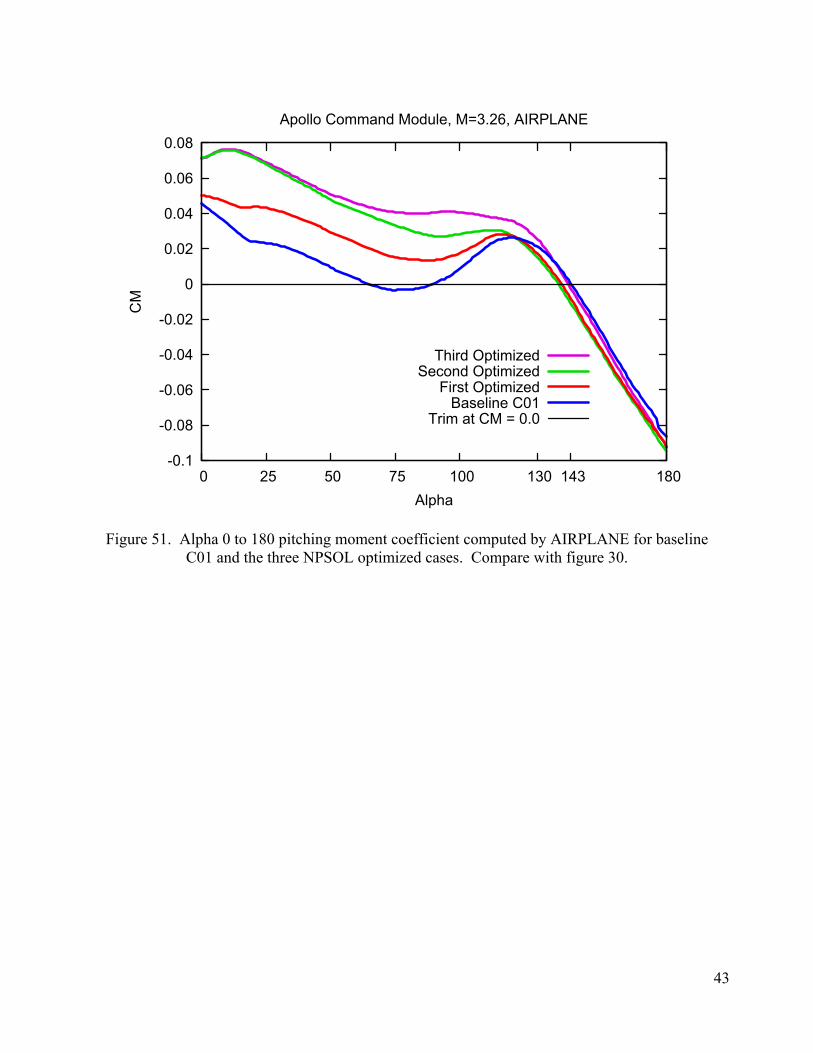
fore because there was no penalty for going over the target CM. Compare surface pressure coeffi-cient plots in figures 33, 34, 35, and 36, for the second optimized design, with earlier pressure coef-ficient figures. This optimization required 58 objective function evaluations. The objective function history is plotted for the second optimization in figure 37. The initial objective function was 0.066202, the last value was 0.042130, and the optimal value reported by NPSOL was 0.041970 at evaluation number 23. The lowest objective function was number 40 with a value of 0.041684. Ob-serve that in the fourth gradient NPSOL used three-point numerical approximations to the partial derivatives. The pitching moment penalty at the first design point went to zero right away because of the way it was designed. The histories of design parameters are plotted in figures 38, 39, 40, and 41. A third optimization was run that combined the objective function just described with a lower limit on the corner radius, RC = 5 inches. In this case the optimized solution shape was (45, 16, 5, 400) with an objective function value of 0.04463. Compare the shapes and surface pressures in figures 42�45 with figures 20�23 and 33�36. Only the apex radius, RA = 16, did not hit a range limit. The goal of eliminating the apex-forward stable trim condition was again achieved, and the optimization finished in 57 evaluations. The objective function history is plotted for the third optimization in fig-ure 46, and the histories of design parameters are plotted in figures 47, 48, 49, and 50. The initial objective function was 0.066202, the last value was 0.044671, and the optimal value reported by NPSOL was 0.044634 at evaluation number 55, which was also the lowest objective function. For gradients, NPSOL used only two-point numerical approximations to the partial derivatives. The moment penalty at the first design point (term 1) went to zero right away because of the way it was designed. The performance term at the second design point dominated the objective function. The trim term at the third design point stayed under control, near zero, the whole time. Pitching moment curves for the baseline C01 and the three NPSOL optimized shapes are shown in figure 51. The first optimization penalized shapes for which CM exceeded 0.002, but the other two optimizations penalized only shapes with CM lower than 0.002, so CM at 75=α for the first case is the lowest of the three optimized shapes. The CM curve generally shifts up, in the order of optimi-zations 1, 2, and 3, and the third optimization turns out with base-forward stable trim closer to the baseline than the other two. It may be coincidence that only the baseline and the third optimizations have round corners. Lift-to-drag performance curves are plotted in figure 52 for the baseline C01 and the three NPSOL optimized shapes. All three optimized shapes perform better at design point 2 than the baseline (where 130=α degrees).
COMPUTATIONAL DATA CORROBORATION OF OPTIMIZED CAPSULE EULER / EXPERIMENTAL DATA CORROBORATION
Euler computations were performed on 10 capsules with the parameters shown in table 1. These 10 full-scale test models were wind tunnel tested in a large number of test facilities. All of the wind tunnel data presented were taken from reference 7 and are for static tests that were conducted using
9

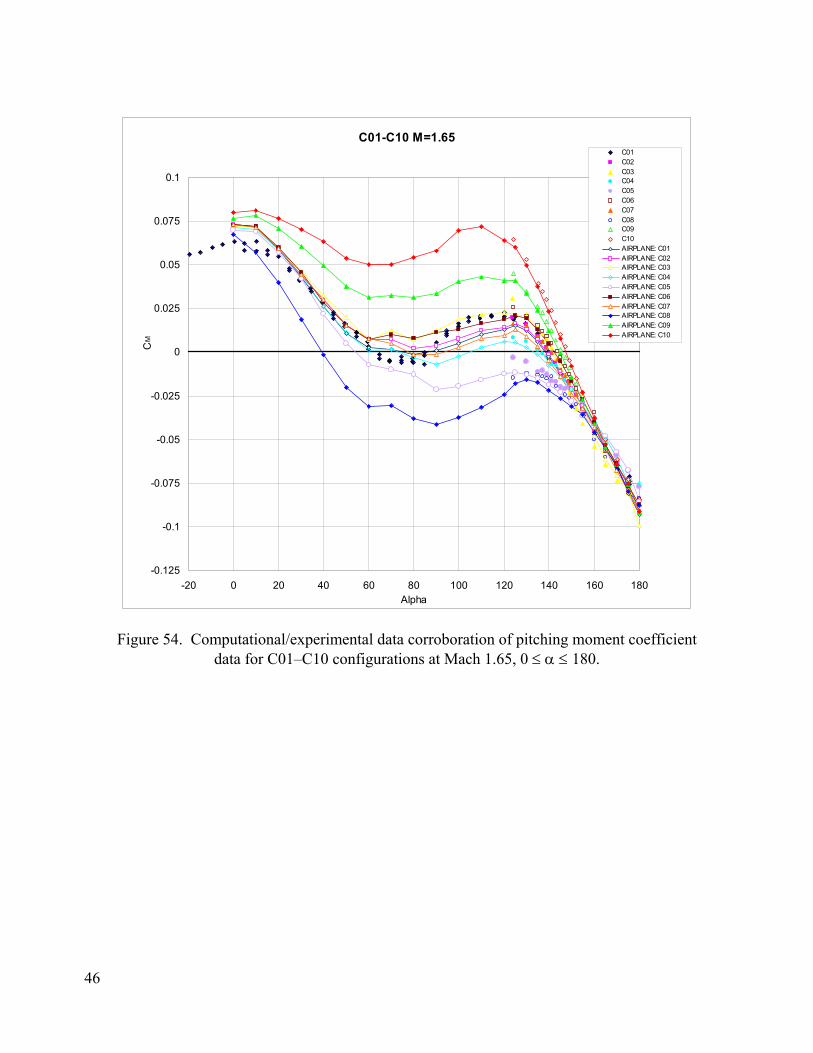
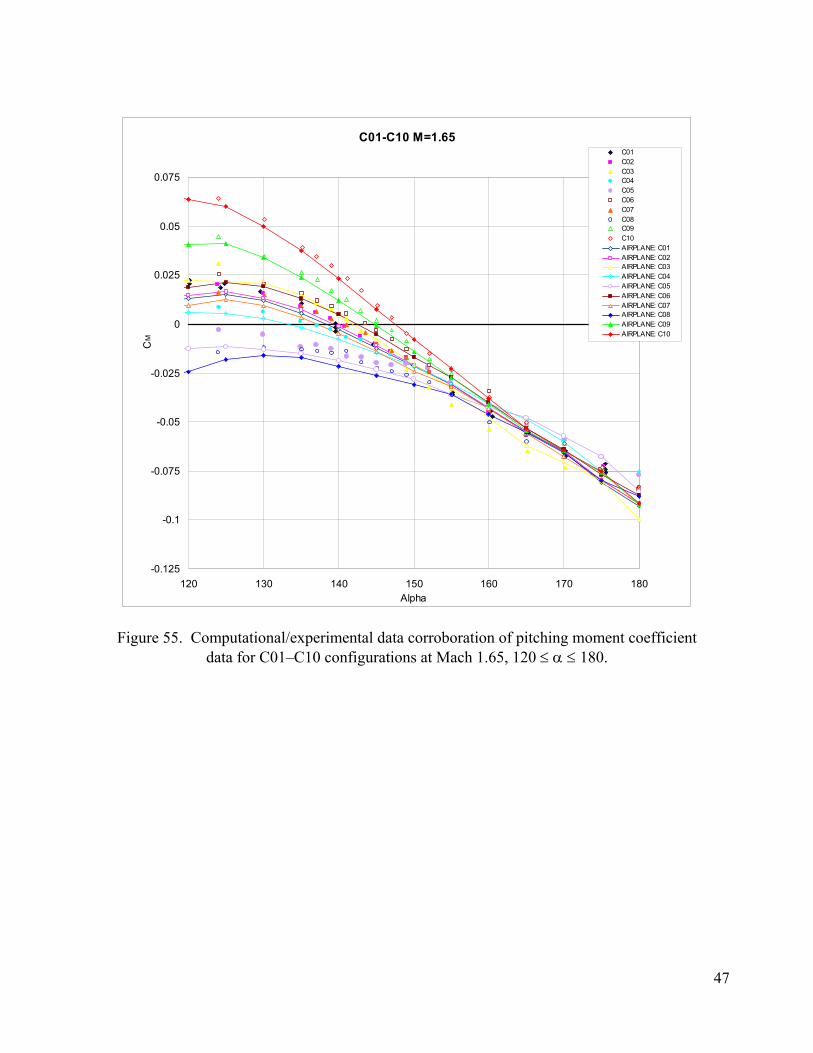
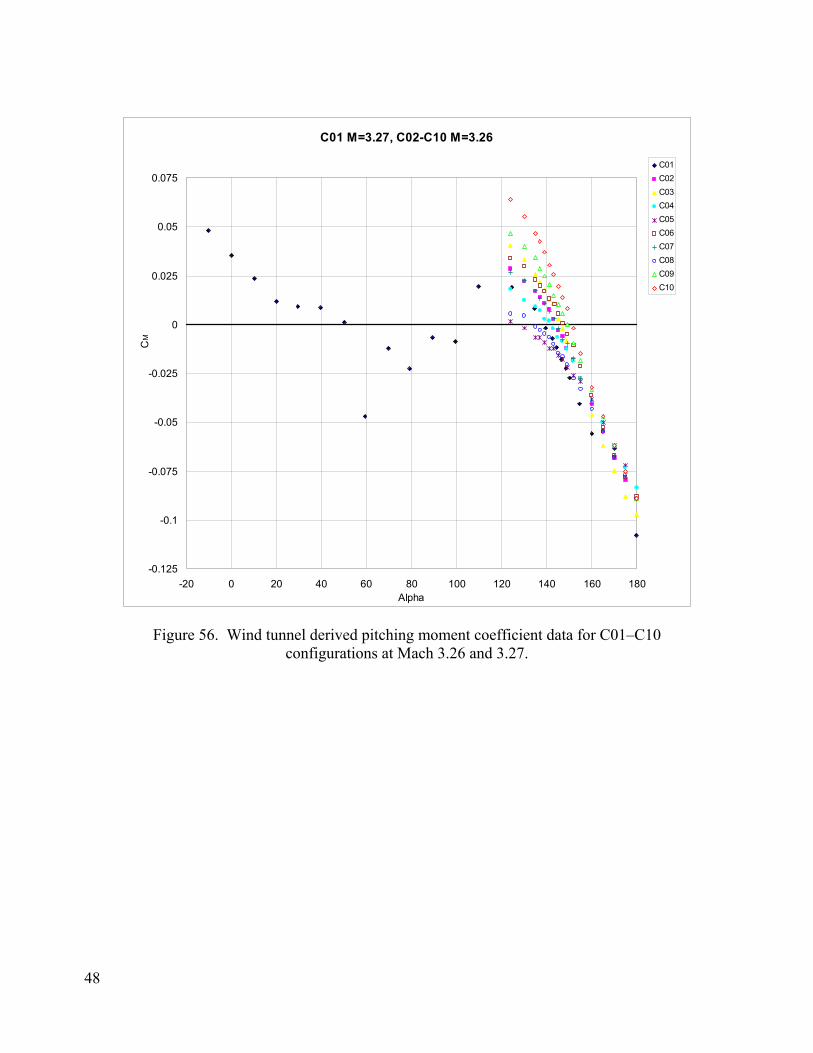
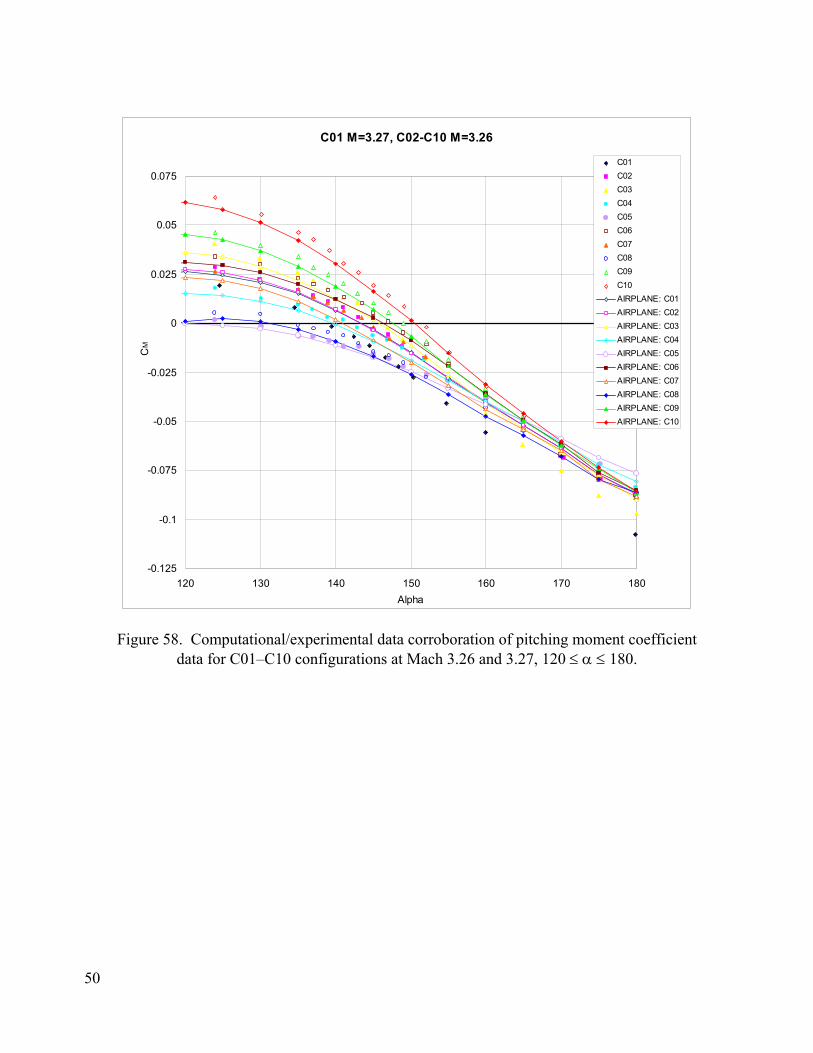
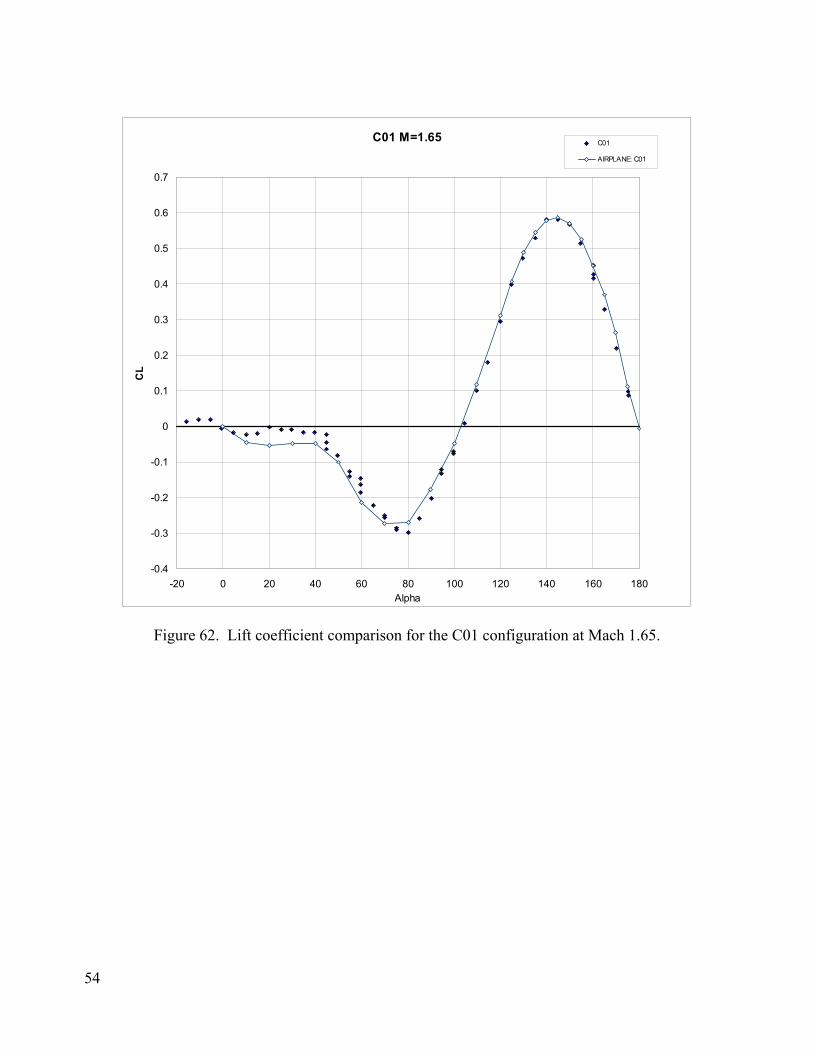
sting mounted models attached to strain-gauge balances to measure the force and moment coeffi-cient data. The reader is referred to reference 7 for further detail on the test and accuracy of the data. AIRPLANE computations were performed for the 10 configurations at Mach numbers of 1.65, 3.26, 3.27, and 5.0. Additional computations were obtained at Mach 0.4, 0.7, and 1.2 for the C01 configu-ration. The computational angles of attack ranged from 0 to 180 degrees with 5-degree increments. The pitching moment coefficients of the wind tunnel data and computational predictions are com-pared for all configurations at Mach 1.65, 3.26 (3.27 for C01), and 5.0. The wind tunnel data were obtained by hand digitizing the data from an electronically scanned version of reference 7. The data at Mach 1.65 are shown in figure 53. Most of the experimental data were taken only for 120 ≤ α ≤ 180, whereas the AIRPLANE computations were from 0 to 180 degrees. The data and computations over the entire range of angles of attack are shown in figure 54. The data and computation compari-sons for angles of attack of 120 to 180 degrees are shown in figure 55. Here, in figure 55, lies the evidence that the Euler methods are capable of predicting the differences in moment coefficient data between geometrically similar objects. Referring back to table 1, we see that C08, C02, C09, and C10 have cone angles θ = 30, 33, 36, and 40 degrees, respectively. Considering respective pairs, they differ in cone angle by 3, 3, and 4 degrees. The increments between the experimental data compare well with the increments between the computational predictions. The actual values of the pitching moment also compare fairly well. Configurations C01 and C02 differ in the apex radius, RA = 15.4 and 9.152, respectively. Reducing the apex radius by approximately 6 inches has little effect on the pitching moment characteristics. The computational data show the same result. How-ever, the actual values of the CM predictions differ slightly more than for the C08-C02-C09-C10 data. C03, C02, C04, and C05 differ by corner radius, RC = 0, 7.7, 15.4, and 23.1 inches, respec-tively (equal steps), and the increments between the test data are well predicted by the computations. Here again the actual value is shifted slightly, but the increments are well predicted. C06, C02, and C07 represent base radius changes, RO = 154, 184.8, and 215.6, respectively (equal steps). The in-crements are also very well predicted by the Euler computations. Data and computation comparisons for Mach 3.26 for C02�C10 and Mach 3.27 for C01 are shown in figures 56, 57, and 58. The increments are well captured overall by the Euler computational pre-dictions. Inviscid solutions almost invariably predict more negative (nose down) pitching moments than viscous (real world) results, though the differences are small. The overall characteristics of the moment curves are quite similar for Mach 1.65 and 3.26; compare figures 55 and 58. Data and computation comparisons for Mach 5.0 are shown in figures 59, 60, and 61. The computa-tional predictions compare with experiment in absolute value better for configurations C04, C05, and C08 than was seen for the lower Mach number results, but poorer correlations are seen for C09 and C10 configurations. Compare figures 55, 58, and 61 (Mach 1.65, 3.26, and 5, respectively). Looking solely at the incremental differences between the models, the computational predictions continue to be able to �see� the differences in the configurations at Mach 5.0. Mach 5.0 is about the upper Mach number limit of the Euler computational method. The strong shocks from larger hyper-sonic Mach numbers would require increased dissipation in the flow solver to achieve convergence, and this would invalidate higher Mach number solutions. The C01 configuration computations are also compared to the experimental data at lower Mach numbers. The lift and drag comparisons are shown for Mach 1.65 and 5.0 in figures 62, 63, 64, and
10
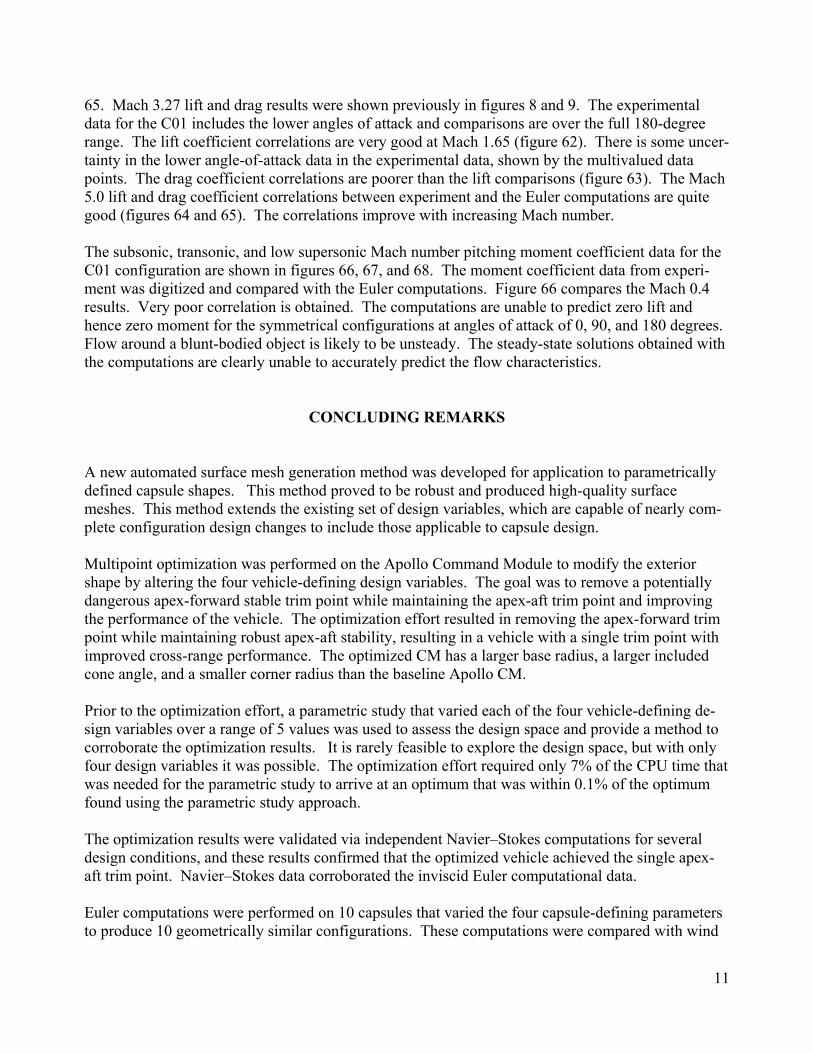
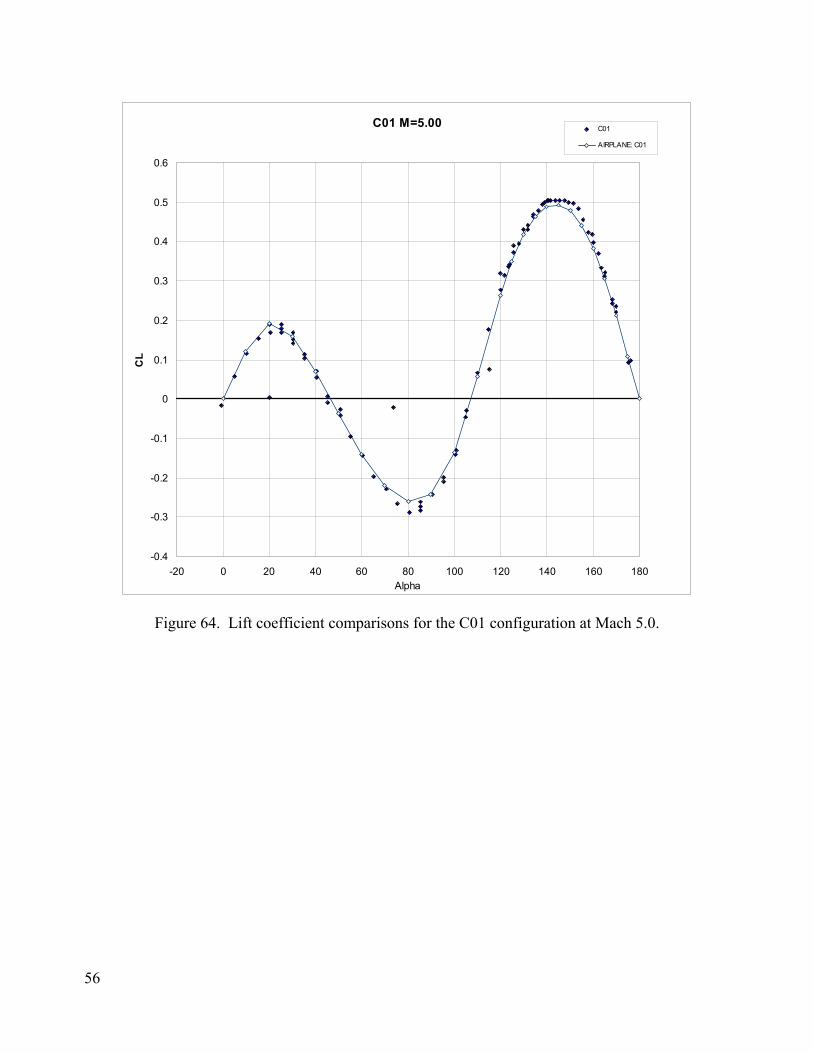
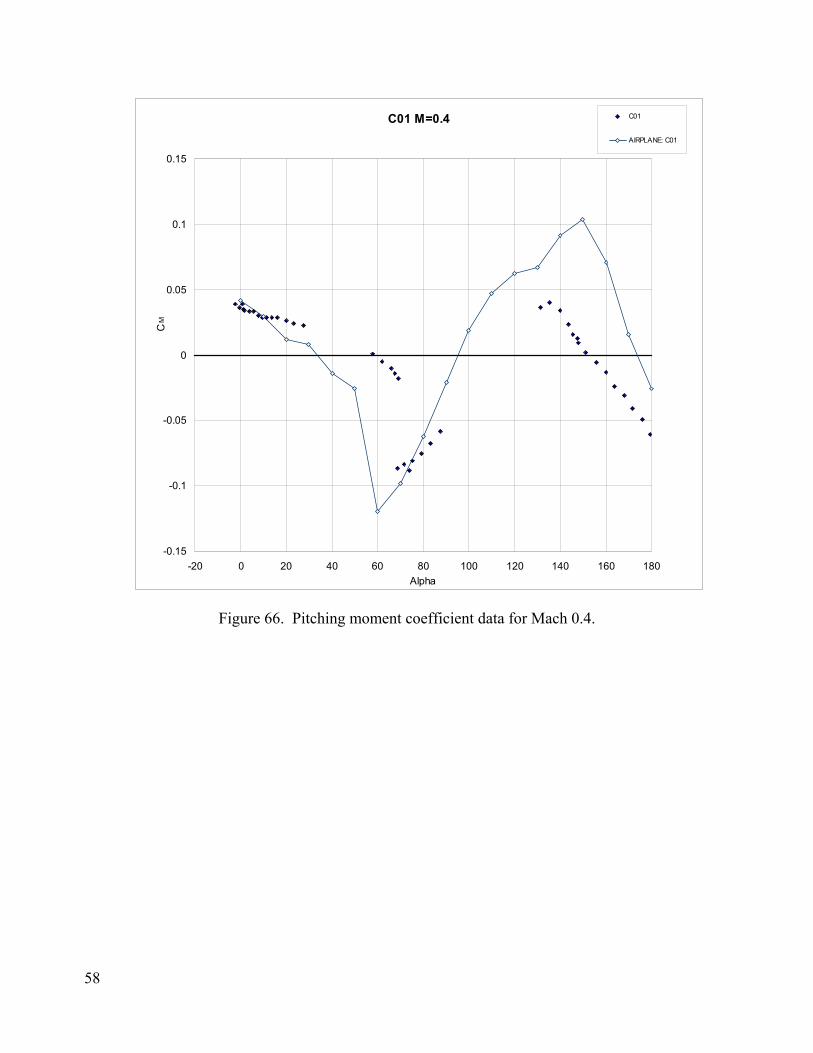
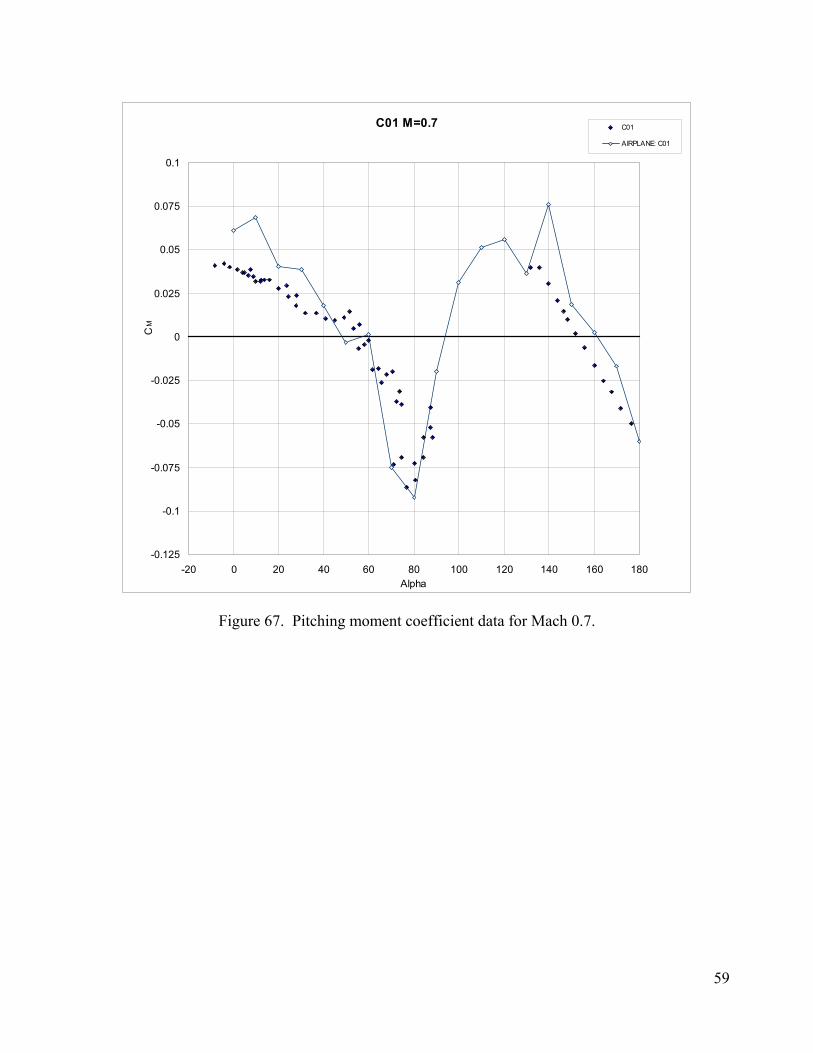
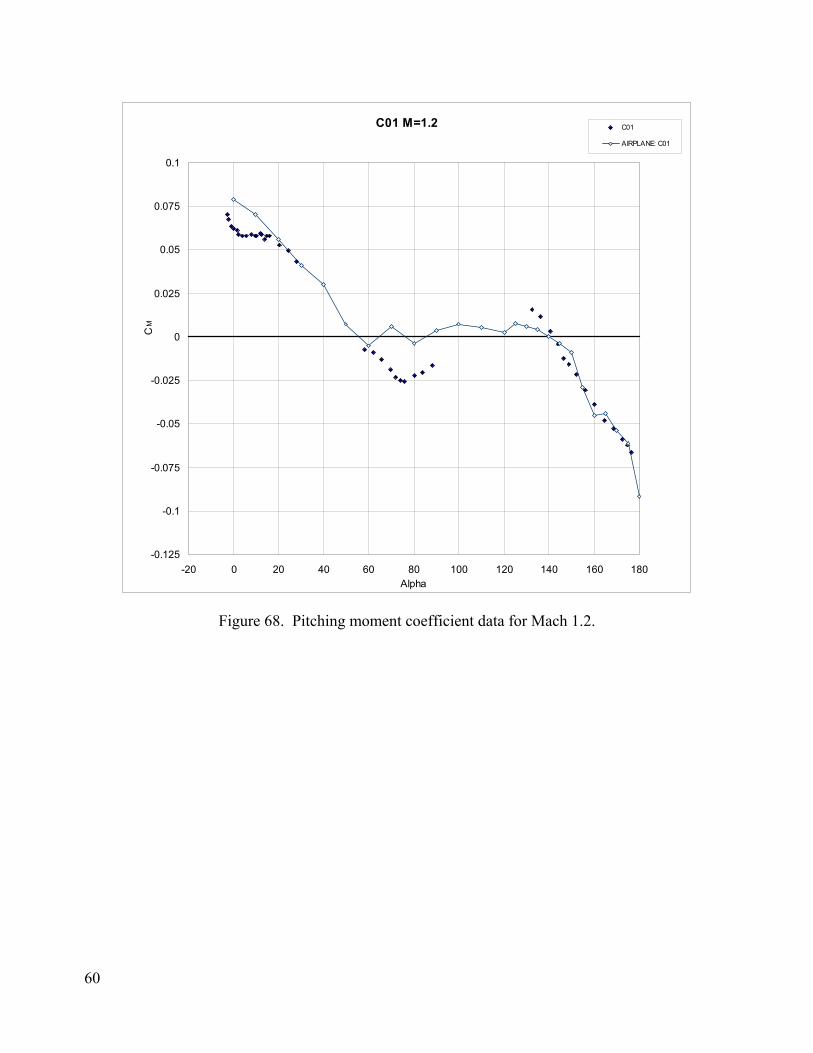
65. Mach 3.27 lift and drag results were shown previously in figures 8 and 9. The experimental data for the C01 includes the lower angles of attack and comparisons are over the full 180-degree range. The lift coefficient correlations are very good at Mach 1.65 (figure 62). There is some uncer-tainty in the lower angle-of-attack data in the experimental data, shown by the multivalued data points. The drag coefficient correlations are poorer than the lift comparisons (figure 63). The Mach 5.0 lift and drag coefficient correlations between experiment and the Euler computations are quite good (figures 64 and 65). The correlations improve with increasing Mach number. The subsonic, transonic, and low supersonic Mach number pitching moment coefficient data for the C01 configuration are shown in figures 66, 67, and 68. The moment coefficient data from experi-ment was digitized and compared with the Euler computations. Figure 66 compares the Mach 0.4 results. Very poor correlation is obtained. The computations are unable to predict zero lift and hence zero moment for the symmetrical configurations at angles of attack of 0, 90, and 180 degrees. Flow around a blunt-bodied object is likely to be unsteady. The steady-state solutions obtained with the computations are clearly unable to accurately predict the flow characteristics.
CONCLUDING REMARKS A new automated surface mesh generation method was developed for application to parametrically defined capsule shapes. This method proved to be robust and produced high-quality surface meshes. This method extends the existing set of design variables, which are capable of nearly com-plete configuration design changes to include those applicable to capsule design. Multipoint optimization was performed on the Apollo Command Module to modify the exterior shape by altering the four vehicle-defining design variables. The goal was to remove a potentially dangerous apex-forward stable trim point while maintaining the apex-aft trim point and improving the performance of the vehicle. The optimization effort resulted in removing the apex-forward trim point while maintaining robust apex-aft stability, resulting in a vehicle with a single trim point with improved cross-range performance. The optimized CM has a larger base radius, a larger included cone angle, and a smaller corner radius than the baseline Apollo CM. Prior to the optimization effort, a parametric study that varied each of the four vehicle-defining de-sign variables over a range of 5 values was used to assess the design space and provide a method to corroborate the optimization results. It is rarely feasible to explore the design space, but with only four design variables it was possible. The optimization effort required only 7% of the CPU time that was needed for the parametric study to arrive at an optimum that was within 0.1% of the optimum found using the parametric study approach. The optimization results were validated via independent Navier�Stokes computations for several design conditions, and these results confirmed that the optimized vehicle achieved the single apex-aft trim point. Navier�Stokes data corroborated the inviscid Euler computational data. Euler computations were performed on 10 capsules that varied the four capsule-defining parameters to produce 10 geometrically similar configurations. These computations were compared with wind
11

tunnel test data from numerous test facilities where full-scale test models were used. The Euler CFD comparisons were performed for a wide range of Mach numbers: 0.4, 0.7, 1.2, 1.65, 3.26, 3.27, and 5.0. The computational angles of attack ranged from 0 to 180 degrees with 5-degree increments. The comparisons showed the Euler methods are capable of predicting the differences in moment co-efficient data between geometrically similar objects; thus the increments between the experimental data of pairs of very similar models compare well with the increments computed by the Euler predic-tions. The actual values of the pitching moment also compare well at the supersonic and hypersonic Mach numbers, but the agreement lessened as the Mach number decreased for the subsonic Mach number comparisons.
12
13
REFERENCES 1. Jameson, Antony; and Baker, Timothy J.: Improvements to the Aircraft Euler Method. AIAA
Paper 87-0353, presented at the 25th AIAA Aerospace Sciences Meeting, Reno, Nev., Jan. 1987.
2. http://www.sbsi-sol-optimize.com/asp/sol_product_npsol.htm
3. Zuniga, F.; Cliff, S.; Kinney, D.; Smith, S.; Hawke, V.; and Tang, C.: Vehicle Design of a Sharp CTV Concept Using a Virtual Flight Rapid Integration Test Environment. AIAA Paper 2002-4881, presented at the AIAA Atmospheric Flight Mechanics Conference and Exhibit, Monterey, Calif., Aug. 2002.
4. Cliff, S. E.; Thomas, S. D.; Baker, T. J.; Jameson, A.; and Hicks, R. M.: Aerodynamic Shape Optimization Using Unstructured Grid Method. AIAA Paper No. 02-5550, presented at the 9th Symposium on Multidisciplinary Analysis and Optimization, Atlanta, Ga., Sept. 2002.
5. Baker, T. J.; and Vassberg, J. C.: Tetrahedral Mesh Generation and Optimization. Proceedings of the 6th International Conference on Numerical Grid Generation, International Society of Grid Generation (ISGG), Mississippi State Univ., 1998, pp. 337–349.
6. Mosely, William C.; and Redd, Bass: Aerodynamic Stability Characteristics of the Apollo Launch Escape Vehicle (LEV) with Canard Surfaces Deployed. NASA TN D-4280, 1967.
7. Mosely, William C.; Graham, Ralph E.; and Hughes, Jack E.: Aerodynamic Stability Character-istics of the Apollo Command Module. NASA TN D-4688, 1968.
8. Jespersen, D. C.; Pulliam, T. H.; and Buning, P. G.: Recent Enhancements to OVERFLOW. AIAA Paper 97-0644, Jan. 1997.
9. Klopfer, G. H.; Hung, C. H.; Van der Wijngaart, R. F.; and Onufer, J. T.: A Diagonalized Di-agonal Dominant Alternating Direction Implicit (D3ADI) Scheme and Subiteration Correc-tion. AIAA Paper 98-2824, June 1998.
10. Aftosmis, M. J.; Berger, M. J.; and Melton, J. E.: Robust and Efficient Cartesian Mesh Genera-tion for Component-Based Geometry. AIAA Paper No. 97-0196.
11. Jameson, Antony; Shankaran, Sriram; Martinelli, Luigi; Cliff, Susan; and Thomas, Scott: Aero-dynamic Shape Optimization. AIAA Paper No. 2005-1013, presented at the 43rd AIAA Aerospace Sciences Meeting, Reno, Nev., Jan. 2005.

14
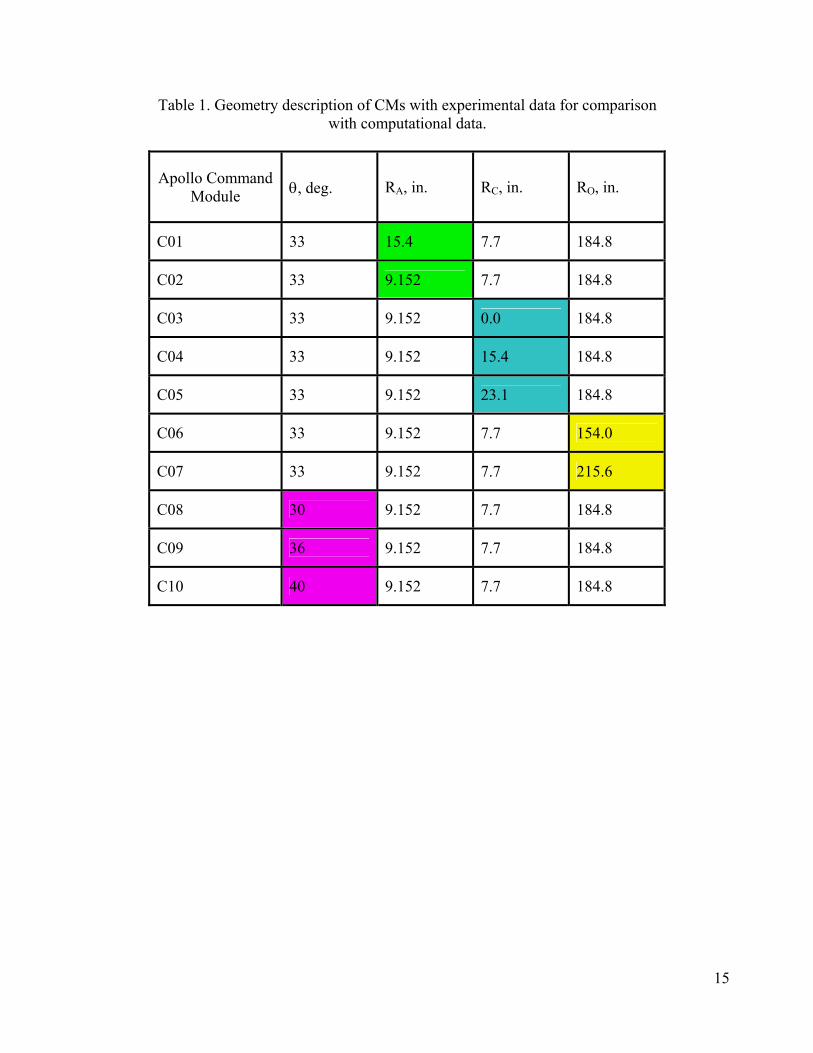
Table 1. Geometry description of CMs with experimental data for comparison with computational data.
Apollo Command Module θ, deg. RA, in. RC, in. RO, in.
C01 33 15.4 7.7 184.8
C02 33 9.152 7.7 184.8
C03 33 9.152 0.0 184.8
C04 33 9.152 15.4 184.8
C05 33 9.152 23.1 184.8
C06 33 9.152 7.7 154.0
C07 33 9.152 7.7 215.6
C08 30 9.152 7.7 184.8
C09 36 9.152 7.7 184.8
C10 40 9.152 7.7 184.8
15

Table 2. Four-dimensional matrix of objective function value multiplied by 1000 and rounded to the nearest integer.
θ = 25 θ = 30 θ = 35 θ = 40 θ = 45 289 369 491 658 888 89 106 136 185 261 89 91 99 113 139 117 120 129 138 150 142 153 168 186 201 245 319 430 591 807 70 87 115 160 229 59 66 78 94 118 67 80 97 113 130 73 94 123 151 175 RA = 5 247 319 426 582 793 69 86 112 156 223 53 60 72 88 113 56 69 87 105 123 56 77 109 140 168 250 322 428 581 793 72 87 113 155 220 52 59 70 86 110 54 65 83 102 121 53 71 103 136 164 255 327 430 580 786 75 89 113 154 220 54 59 69 85 109 55 63 80 100 119 54 69 99 133 163 299 379 502 671 905 90 107 138 188 263 88 90 98 112 137 115 119 127 137 149 141 152 168 184 199 254 329 444 606 823 72 89 117 163 233 59 66 77 93 117 67 79 96 112 129 72 94 122 150 174 RA = 10 257 330 441 595 810 71 88 115 159 227 52 60 72 88 112 55 68 86 104 123 56 77 108 140 166 262 333 441 595 807 74 89 115 159 224 52 59 70 86 110 53 64 81 101 119 53 71 101 134 163 265 338 445 596 805 76 91 115 158 223 54 59 69 84 108 54 62 79 98 118 53 68 98 131 161 311 395 521 695 924 92 109 142 192 269 87 89 97 112 137 114 118 125 134 147 139 149 166 183 198 270 349 462 624 846 74 92 120 168 238 57 65 77 92 117 66 77 94 111 127 71 92 121 149 172 RA = 15 271 349 460 618 834 73 91 119 164 233 51 59 71 87 112 54 66 84 102 121 55 76 107 138 165 275 352 462 618 829 76 93 119 162 230 51 58 69 85 109 52 62 80 99 117 52 70 100 132 161 280 357 466 615 826 79 95 120 163 229 54 58 68 84 108 53 61 78 97 116 52 67 97 130 159 331 416 543 715 949 95 113 146 198 276 85 87 96 110 138 111 115 123 132 145 139 147 163 180 195 290 368 487 649 871 78 96 126 173 246 56 64 76 92 117 64 76 92 108 124 69 91 119 147 169 RA = 20 291 370 480 643 862 77 96 124 171 241 51 59 71 87 112 53 64 82 100 118 54 74 105 135 161 295 374 485 642 857 81 98 125 170 239 51 58 69 85 110 51 61 78 96 115 51 68 98 130 158 300 378 488 643 853 84 100 126 169 238 53 58 68 84 108 52 59 75 94 114 51 65 95 127 156 354 439 569 747 982 99 118 152 205 284 83 86 95 110 136 109 112 119 130 142 136 146 161 177 192 311 393 512 679 905 82 102 132 182 256 56 63 75 92 117 62 73 89 105 122 68 88 116 144 166 RA = 25 312 393 511 673 894 82 102 132 179 250 50 58 70 87 112 51 63 79 98 115 53 72 102 133 159 318 398 516 672 889 85 104 131 178 247 51 58 68 85 110 . 49 59 75 94 113 50 66 95 127 155 323 403 517 675 888 90 107 133 178 247 53 58 68 83 109 51 58 73 92 111 50 64 92 125 154
Table 3. Defining parameters for baseline and designed Apollo Command Modules.
θ, degrees RA, in. RC, in. RO, in.
Baseline C01 33.0 15.4 7.7 184.8
Best Parametric 40.0 25.0 0.0 331.25
First Optimized 35.6 14.17 0.0 297.8
Second Optimized 44.99 14.18 0.0 385.4
Third Optimized 45.0 16.0 5.0 400.0
16
RC
RA
ROθ
Figure 1. Variables used to change the shape of the capsule.
17
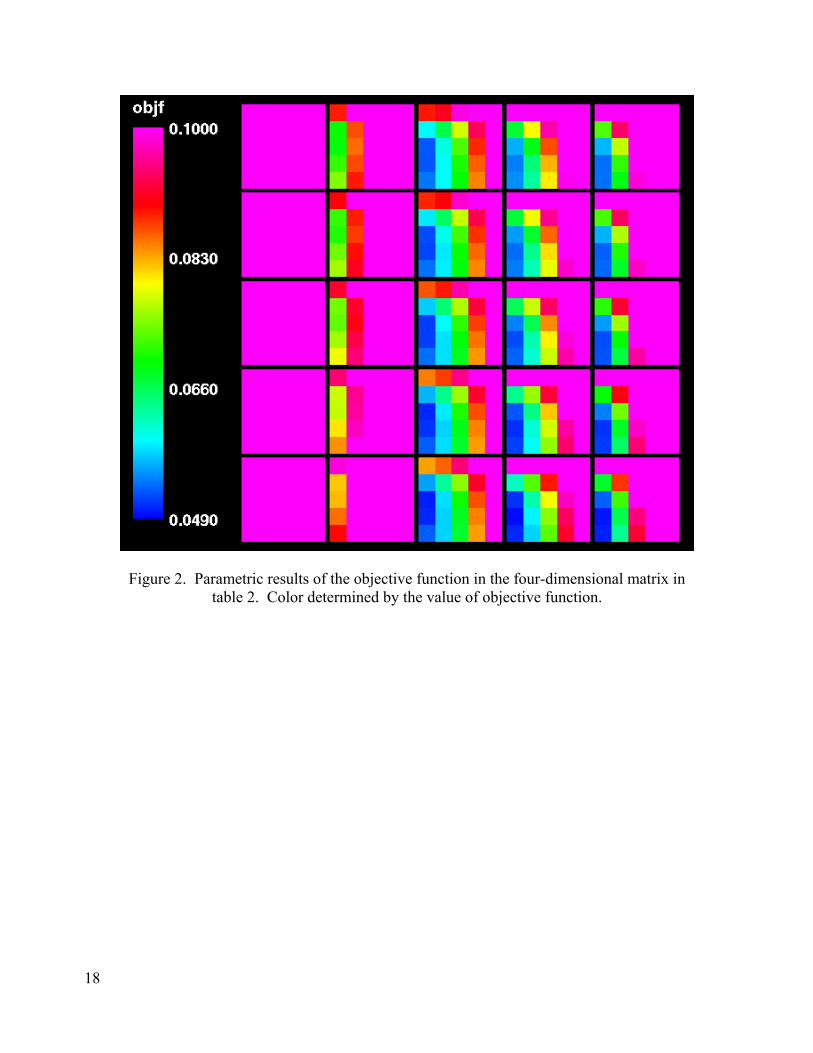
Figure 2. Parametric results of the objective function in the four-dimensional matrix in table 2. Color determined by the value of objective function.
18
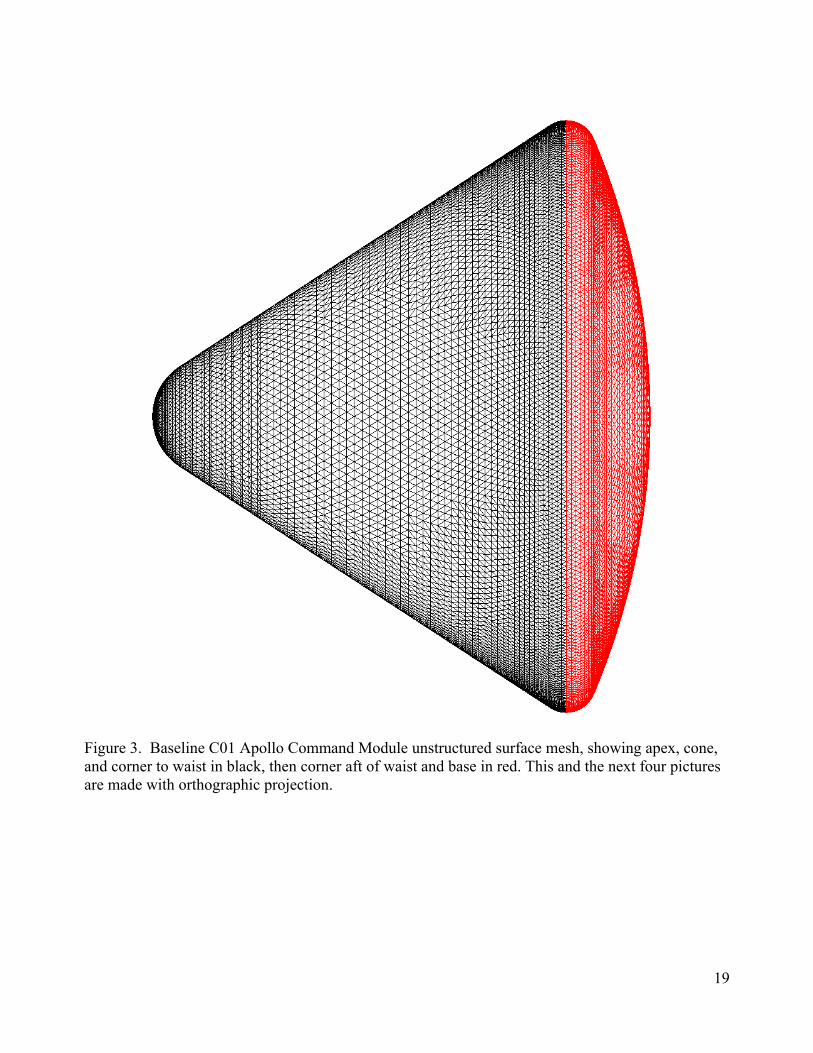
Figure 3. Baseline C01 Apollo Command Module unstructured surface mesh, showing apex, cone, and corner to waist in black, then corner aft of waist and base in red. This and the next four pictures are made with orthographic projection.
19

Figure 4. Baseline C01 Apollo Command Module unstructured surface mesh near the nose point of the apex. A mirror image is shown in blue.
20
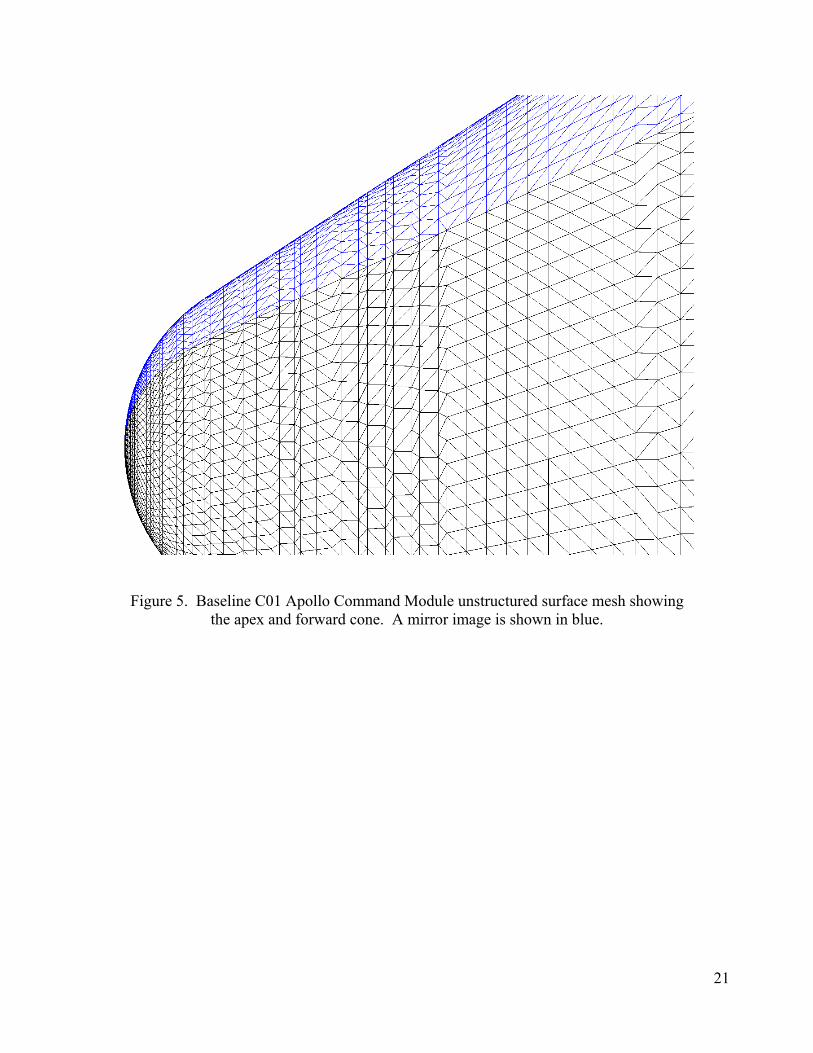
Figure 5. Baseline C01 Apollo Command Module unstructured surface mesh showing
the apex and forward cone. A mirror image is shown in blue.
21
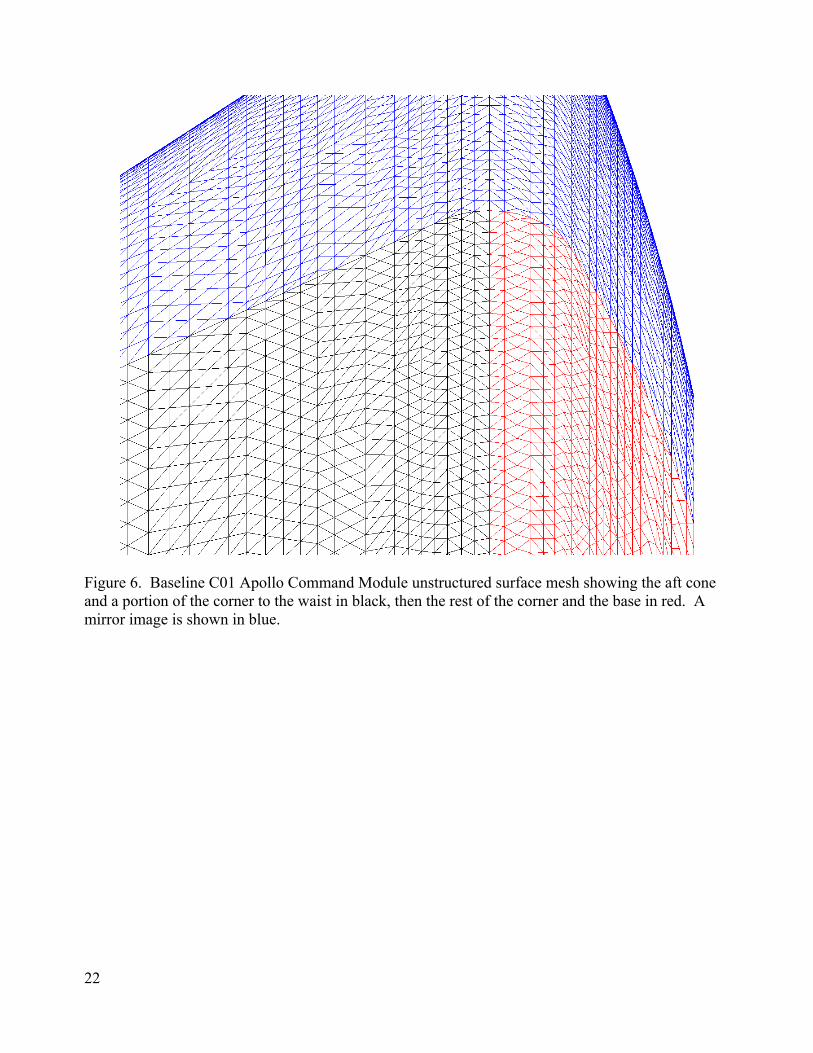
Figure 6. Baseline C01 Apollo Command Module unstructured surface mesh showing the aft cone and a portion of the corner to the waist in black, then the rest of the corner and the base in red. A mirror image is shown in blue.
22

Figure 7. Baseline C01 Apollo Command Module unstructured surface mesh showing the forward
corner in black, then aft of the waist the corner and base is red, with a mirror image in blue.
23

Apollo Command Module, M=3.27
-0.4
-0.3
-0.2
-0.1
0
0.1
0.2
0.3
0.4
0.5
0.6
-20 0 20 40 60 80 100 120 140 160 180α
CL
C01
AIRPLANE: C01
Figure 8. Lift coefficient data of the Apollo Command Module (C01) configuration. AIRPLANE computations and experiment.
24
Apollo Command Module, M=3.27
0
0.2
0.4
0.6
0.8
1
1.2
1.4
1.6
1.8
-20 0 20 40 60 80 100 120 140 160 180α
CD
C01
AIRPLANE: C01
Figure 9. Drag coefficient data of the Apollo Command Module (C01) configuration. AIRPLANE computations and experiment.
25

Apollo Comand Module, M=3.27
-0.125
-0.1
-0.075
-0.05
-0.025
0
0.025
0.05
0.075
-20 0 20 40 60 80 100 120 140 160 180α
CM
C01
AIRPLANE: C01
Figure 10. Pitching moment coefficient data of the Apollo Command Module (C01) configuration. AIRPLANE computations and experiment.
26
-80
0
80
0 80 160
C01
-80
0
80
0 80 160
C02
-80
0
80
0 80 160
C03
-80
0
80
0 80 160
C04
-80
0
80
0 80 160
C05
-80
0
80
0 80 160
C06
-80
0
80
0 80 160
C07
-80
0
80
0 80 160
C08
-80
0
80
0 80 160
C09
-80
0
80
0 80 160
C10
-80
0
80
0 80 160
Best Parametric
-80
0
80
0 80 160
First Optimized
-80
0
80
0 80 160
Second Optimized
-80
0
80
0 80 160
Third Optimized
Figure 11. Apollo Command Module profiles, showing nominal center of gravity.
27

Figure 12. Baseline C01 at α = 75.
Figure 13. Baseline C01 at α = 130.
Figure 14. Baseline C01 at α = 143. Figure 15. Baseline C01 at trim, α = 143.
Figures 12, 13, 14, and 15. AIRPLANE predictions of Cp on the baseline C01 Apollo Command Module, Mach 3.26, at the three design-point angles of attack (75, 130, 143 degrees) and at base-forward trim (143 degrees, shown shaded with two lights). The 4-tuple (θ, RA, RC, RO) = (33, 15.4, 7.7, 184.8) defines the baseline C01 Apollo Command Module.
28
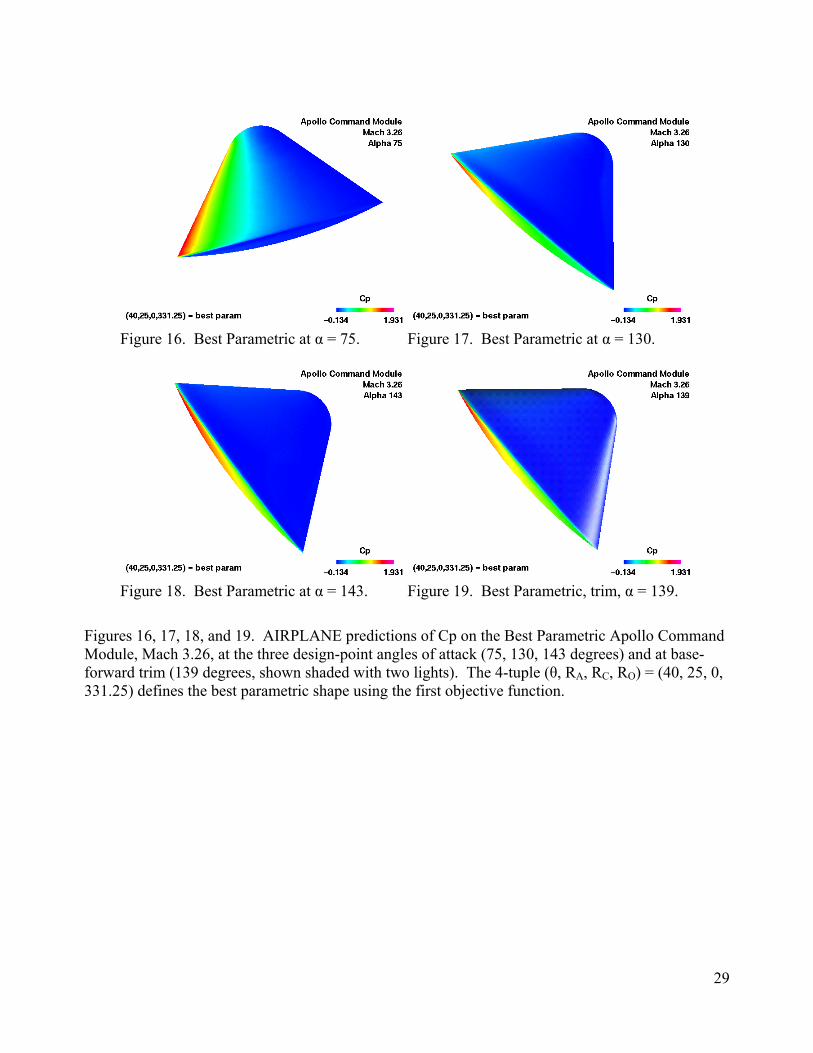
Figure 16. Best Parametric at α = 75.
Figure 17. Best Parametric at α = 130.
Figure 18. Best Parametric at α = 143. Figure 19. Best Parametric, trim, α = 139.
Figures 16, 17, 18, and 19. AIRPLANE predictions of Cp on the Best Parametric Apollo Command Module, Mach 3.26, at the three design-point angles of attack (75, 130, 143 degrees) and at base-forward trim (139 degrees, shown shaded with two lights). The 4-tuple (θ, RA, RC, RO) = (40, 25, 0, 331.25) defines the best parametric shape using the first objective function.
29
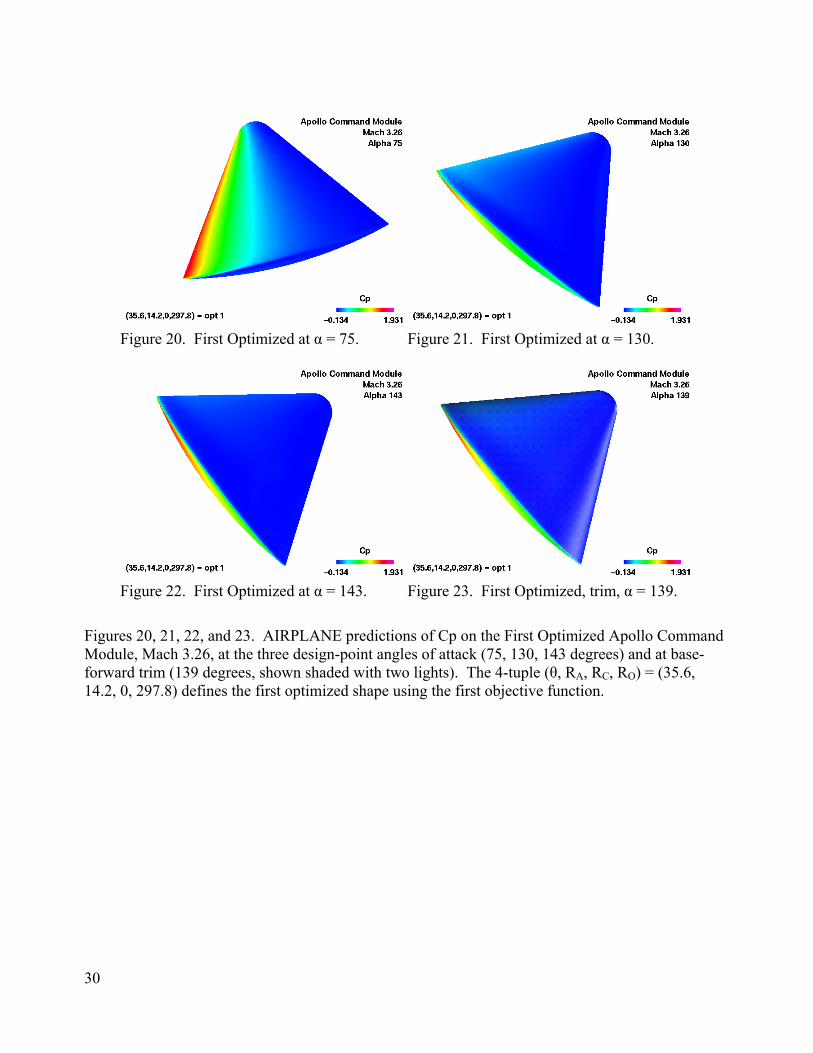
Figure 20. First Optimized at α = 75.
Figure 21. First Optimized at α = 130.
Figure 22. First Optimized at α = 143. Figure 23. First Optimized, trim, α = 139.
Figures 20, 21, 22, and 23. AIRPLANE predictions of Cp on the First Optimized Apollo Command Module, Mach 3.26, at the three design-point angles of attack (75, 130, 143 degrees) and at base-forward trim (139 degrees, shown shaded with two lights). The 4-tuple (θ, RA, RC, RO) = (35.6, 14.2, 0, 297.8) defines the first optimized shape using the first objective function.
30
0
0.02
0.04
0.06
0.08
0 5 10 15 20 25 30 35 40 45
Obj
ectiv
e Fu
nctio
n
Evaluation Number
Apollo Command Module, M=3.26, First Optimization
Sum of Three Terms = ObjectiveSearch Evaluations
sigma1*(CM1-0.002)**2 = Term 1sigma2*abs(CD2/CL2) = Term 2sigma3*(CM3-0.0)**2 = Term 3
Figure 24. NPSOL objective function history for the first optimization of the Apollo Command Module, Mach 3.26. Black dots indicate numerical approximations of partial derivatives. Numbering starts at 0.
31

25
30
35
40
45
0 5 10 15 20 25 30 35 40 45
Deg
rees
Evaluation Number
Apollo Command Module, First Design Variable
Theta = Cone Half Angle
Figure 25. Cone Half Angle History.
5
10
15
20
25
0 5 10 15 20 25 30 35 40 45
Inch
es
Evaluation Number
Apollo Command Module, Second Design Variable
Ra = Apex Radius
Figure 26. Apex Radius History.
0
5
10
15
20
25
30
0 5 10 15 20 25 30 35 40 45
Inch
es
Evaluation Number
Apollo Command Module, Third Design Variable
Rc = Corner Radius
Figure 27. Corner Radius History.
150
200
250
300
350
400
0 5 10 15 20 25 30 35 40 45
Inch
es
Evaluation Number
Apollo Command Module, Fourth Design Variable
Ro = Base Radius
Figure 28. Base Radius History.
Figures 25, 26, 27, and 28. Design parameter values at each objective function evaluation for the first NPSOL optimization, Mach 3.26. The initial 4-tuple (θ, RA, RC, RO) = (33, 15.4, 7.7, 184.8) defines the baseline C01 Apollo Command Module, and the optimized shape was approximately (35.6, 14.17, 0.0, 297.8).
32
-0.03
-0.02
-0.01
0
0.01
0.02
0.03
0.04
150 143 130 100 75 65 60
CM
Alpha
Apollo Command Module, M=3.26
Best Parametric, AIRPLANEFirst Optimized, AIRPLANE
First Optimized, OVERFLOW2Baseline C01, AIRPLANE
Design Point 1 Target CM = 0.002Trim at CM = 0.0
Figure 29. Pitching moment coefficient for baseline C01, best parametric and first optimized shapes, with Navier�Stokes predictions for the optimized shape (OVERFLOW2) at α = 60, 90, 120, and 150 degrees. See also figure 30.
33
-0.1
-0.08
-0.06
-0.04
-0.02
0
0.02
0.04
0.06
180 150 120 90 60 30 0
CM
Alpha
Apollo Command Module, M=3.26
Best Parametric, AIRPLANEFirst Optimized, AIRPLANE
First Optimized, OVERFLOW2Baseline C01, AIRPLANE
Design Point 1 Target CM = 0.002Trim at CM = 0.0
Figure 30. Alpha 0 to 180 pitching moment coefficient for baseline C01, best parametric and first optimized shapes, with Navier�Stokes predictions for the optimized shape (OVERFLOW2). Com-pare with figure 51.
34

-0.8
-0.4
0
0.4
0.8
1.2
150 143 130 100 75 65 60
CL/
CD
Alpha
Apollo Command Module, M=3.26, AIRPLANE
Best ParametricFirst Optimized
Baseline C01CD = 0.0
Figure 31. Lift-to-drag performance computed by AIRPLANE for baseline C01, best parametric and first optimized shapes. See also figure 32.
35

-0.8
-0.4
0
0.4
0.8
1.2
180 150 120 90 60 30 0
CL/
CD
Alpha
Apollo Command Module, M=3.26, AIRPLANE
Best ParametricFirst Optimized
Baseline C01CD = 0.0
Figure 32. Alpha 0 to 180 lift-to-drag performance computed by AIRPLANE for baseline C01, best parametric and first optimized shapes. Compare with figure 52.
36
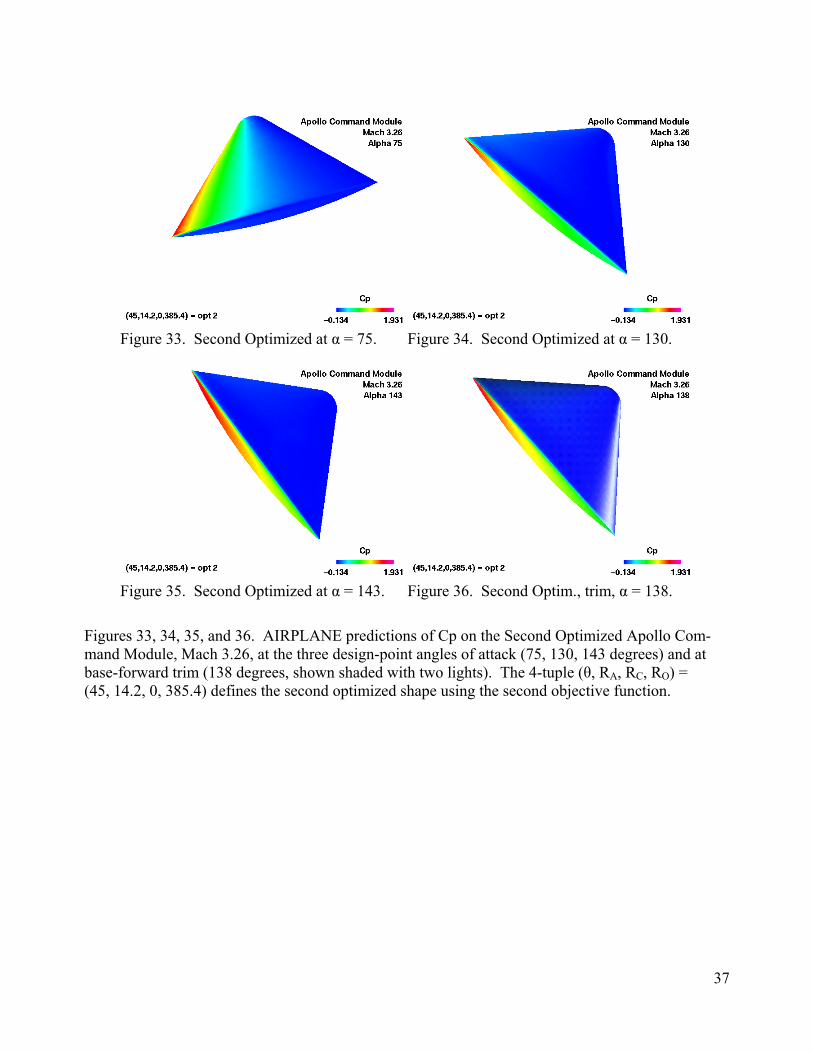
Figure 33. Second Optimized at α = 75.
Figure 34. Second Optimized at α = 130.
Figure 35. Second Optimized at α = 143. Figure 36. Second Optim., trim, α = 138.
Figures 33, 34, 35, and 36. AIRPLANE predictions of Cp on the Second Optimized Apollo Com-mand Module, Mach 3.26, at the three design-point angles of attack (75, 130, 143 degrees) and at base-forward trim (138 degrees, shown shaded with two lights). The 4-tuple (θ, RA, RC, RO) = (45, 14.2, 0, 385.4) defines the second optimized shape using the second objective function.
37
0
0.02
0.04
0.06
0.08
0 10 20 30 40 50 60
Obj
ectiv
e Fu
nctio
n
Evaluation Number
Apollo Command Module, M=3.26, Second Optimization
Sum of Three Terms = ObjectiveSearch Evaluations
sigma1*(CM1-0.002)**2 = Term 1sigma2*abs(CD2/CL2) = Term 2sigma3*(CM3-0.0)**2 = Term 3
Figure 37. NPSOL objective function history for the second optimization of the Apollo Command Module, Mach 3.26. Black dots indicate numerical approximations of partial derivatives. Number-ing starts at 0.
38

25
30
35
40
45
0 10 20 30 40 50 60
Deg
rees
Evaluation Number
Apollo Command Module, First Design Variable
Theta = Cone Half Angle
Figure 38. Cone Half Angle History.
5
10
15
20
25
0 10 20 30 40 50 60
Inch
es
Evaluation Number
Apollo Command Module, Second Design Variable
Ra = Apex Radius
Figure 39. Apex Radius History.
0
5
10
15
20
25
30
0 10 20 30 40 50 60
Inch
es
Evaluation Number
Apollo Command Module, Third Design Variable
Rc = Corner Radius
Figure 40. Corner Radius History.
150
200
250
300
350
400
0 10 20 30 40 50 60
Inch
es
Evaluation Number
Apollo Command Module, Fourth Design Variable
Ro = Base Radius
Figure 41. Base Radius History.
Figures 38, 39, 40, and 41. Design parameter values at each objective function evaluation for the second NPSOL Optimization, Mach 3.26. The initial 4-tuple (θ, RA, RC, RO) = (33, 15.4, 7.7, 184.8) defines the baseline C01 Apollo Command Module, and the optimized shape was approximately (44.99, 14.18, 0.0, 385.4).
39

Figure 42. Third Optimized at α = 75.
Figure 43. Third Optimized at α = 130.
Figure 44. Third Optimized at α = 143. Figure 45. Third Optim., trim, α = 142.
Figures 42, 43, 44, and 45. AIRPLANE predictions of Cp on the Third Optimized Apollo Command Module, Mach 3.26, at the three design-point angles of attack (75, 130, 143 degrees) and at base-forward trim (142 degrees, shown shaded with two lights). The 4-tuple (θ, RA, RC, RO) = (45, 16, 5, 400) defines the second optimized shape using the second objective function.
40

0
0.02
0.04
0.06
0.08
0 10 20 30 40 50 60
Obj
ectiv
e Fu
nctio
n
Evaluation Number
Apollo Command Module, M=3.26, Third Optimization
Sum of Three Terms = ObjectiveSearch Evaluations
sigma1*(CM1-0.002)**2 = Term 1sigma2*abs(CD2/CL2) = Term 2sigma3*(CM3-0.0)**2 = Term 3
Figure 46. NPSOL objective function history for the third optimization of the Apollo Command Module, Mach 3.26. Black dots indicate numerical approximations of partial derivatives. Numbering starts at 0.
41
25
30
35
40
45
0 10 20 30 40 50 60
Deg
rees
Evaluation Number
Apollo Command Module, First Design Variable
Theta = Cone Half Angle
Figure 47. Cone Half Angle History.
5
10
15
20
25
0 10 20 30 40 50 60
Inch
es
Evaluation Number
Apollo Command Module, Second Design Variable
Ra = Apex Radius
Figure 48. Apex Radius History.
0
5
10
15
20
25
30
0 10 20 30 40 50 60
Inch
es
Evaluation Number
Apollo Command Module, Third Design Variable
Rc = Corner Radius
Figure 49. Corner Radius History.
150
200
250
300
350
400
0 10 20 30 40 50 60
Inch
es
Evaluation Number
Apollo Command Module, Fourth Design Variable
Ro = Base Radius
Figure 50. Base Radius History.
Figures 47, 48, 49, and 50. Design parameter values at each objective function evaluation for the third NPSOL optimization, Mach 3.26. The initial 4-tuple (θ, RA, RC, RO) = (33, 15.4, 7.7, 184.8) defines the baseline C01 Apollo Command Module, and the optimized shape was approximately (45, 16, 5, 400). In this case, the lower limit for corner radius, RC, was raised from 0 to 5 inches.
42
-0.1
-0.08
-0.06
-0.04
-0.02
0
0.02
0.04
0.06
0.08
180 143 130 100 75 50 25 0
CM
Alpha
Apollo Command Module, M=3.26, AIRPLANE
Third OptimizedSecond Optimized
First OptimizedBaseline C01
Trim at CM = 0.0
Figure 51. Alpha 0 to 180 pitching moment coefficient computed by AIRPLANE for baseline C01 and the three NPSOL optimized cases. Compare with figure 30.
43

-0.8
-0.4
0
0.4
0.8
1.2
180 143 130 100 75 50 25 0
CL/
CD
Alpha
Apollo Command Module, M=3.26, AIRPLANE
Second OptimizedThird OptimizedFirst Optimized
Baseline C01CD = 0.0
Figure 52. Alpha 0 to 180 lift-to-drag performance computed by AIRPLANE for baseline C01 and the three NPSOL optimized cases. Compare with figure 32.
44

C01-C10 M=1.65
-0.125
-0.1
-0.075
-0.05
-0.025
0
0.025
0.05
0.075
-20 0 20 40 60 80 100 120 140 160 180Alpha
CM
C01C02C03C04C05C06C07C08C09C10
Figure 53. Wind tunnel derived pitching moment coefficient data for C01�C10 Configurations at Mach 1.65.
45
C01-C10 M=1.65
-0.125
-0.1
-0.075
-0.05
-0.025
0
0.025
0.05
0.075
0.1
-20 0 20 40 60 80 100 120 140 160 180Alpha
CM
C01C02C03C04C05C06C07C08C09C10AIRPLANE: C01AIRPLANE: C02AIRPLANE: C03AIRPLANE: C04AIRPLANE: C05AIRPLANE: C06AIRPLANE: C07AIRPLANE: C08AIRPLANE: C09AIRPLANE: C10
Figure 54. Computational/experimental data corroboration of pitching moment coefficient data for C01�C10 configurations at Mach 1.65, 0 ≤ α ≤ 180.
46
C01-C10 M=1.65
-0.125
-0.1
-0.075
-0.05
-0.025
0
0.025
0.05
0.075
120 130 140 150 160 170 180Alpha
CM
C01C02C03C04C05C06C07C08C09C10AIRPLANE: C01AIRPLANE: C02AIRPLANE: C03AIRPLANE: C04AIRPLANE: C05AIRPLANE: C06AIRPLANE: C07AIRPLANE: C08AIRPLANE: C09AIRPLANE: C10
Figure 55. Computational/experimental data corroboration of pitching moment coefficient data for C01�C10 configurations at Mach 1.65, 120 ≤ α ≤ 180.
47
C01 M=3.27, C02-C10 M=3.26
-0.125
-0.1
-0.075
-0.05
-0.025
0
0.025
0.05
0.075
-20 0 20 40 60 80 100 120 140 160 180Alpha
CM
C01C02C03C04C05C06C07C08C09C10
Figure 56. Wind tunnel derived pitching moment coefficient data for C01�C10 configurations at Mach 3.26 and 3.27.
48

C01 M=3.27, C02-C10 M=3.26
-0.125
-0.1
-0.075
-0.05
-0.025
0
0.025
0.05
0.075
-20 0 20 40 60 80 100 120 140 160 180Alpha
CM
C01C02C03C04C05C06C07C08C09C10AIRPLANE: C01AIRPLANE: C02AIRPLANE: C03AIRPLANE: C04AIRPLANE: C05AIRPLANE: C06AIRPLANE: C07AIRPLANE: C08AIRPLANE: C09AIRPLANE: C10
Figure 57. Computational/experimental data corroboration of pitching moment coefficient data for C01�C10 configurations at Mach 3.26 and 3.27, 0 ≤ α ≤ 180.
49
C01 M=3.27, C02-C10 M=3.26
-0.125
-0.1
-0.075
-0.05
-0.025
0
0.025
0.05
0.075
120 130 140 150 160 170 180Alpha
CM
C01C02C03C04C05C06C07C08C09C10AIRPLANE: C01AIRPLANE: C02AIRPLANE: C03AIRPLANE: C04AIRPLANE: C05AIRPLANE: C06AIRPLANE: C07AIRPLANE: C08AIRPLANE: C09AIRPLANE: C10
Figure 58. Computational/experimental data corroboration of pitching moment coefficient data for C01�C10 configurations at Mach 3.26 and 3.27, 120 ≤ α ≤ 180.
50

C01-C10 M=5.00
-0.125
-0.1
-0.075
-0.05
-0.025
0
0.025
0.05
0.075
-20 0 20 40 60 80 100 120 140 160 180Alpha
CM
C01C02C03C04C05C06C07C08C09C10
Figure 59. Wind tunnel derived pitching moment coefficient data for C01�C10 Configurations at Mach 5.0.
51

C01-C10 M=5.00
-0.1
-0.075
-0.05
-0.025
0
0.025
0.05
0.075
-20 0 20 40 60 80 100 120 140 160 180Alpha
CM
C01C02C03C04C05C06C07C08C09C10AIRPLANE: C01AIRPLANE: C02AIRPLANE: C03AIRPLANE: C04AIRPLANE: C05AIRPLANE: C06AIRPLANE: C07AIRPLANE: C08AIRPLANE: C09AIRPLANE: C10
Figure 60. Computational/experimental data corroboration of pitching moment coefficient data for C01�C10 configurations at Mach 5.0, 0 ≤ α ≤ 180.
52

C01-C10 M=5.00
-0.1
-0.075
-0.05
-0.025
0
0.025
0.05
0.075
120 130 140 150 160 170 180Alpha
CM
C01C02C03C04C05C06C07C08C09C10AIRPLANE: C01AIRPLANE: C02AIRPLANE: C03AIRPLANE: C04AIRPLANE: C05AIRPLANE: C06AIRPLANE: C07AIRPLANE: C08AIRPLANE: C09AIRPLANE: C10
Figure 61. Computational/experimental data corroboration of pitching moment coefficient data for C01�C10 configurations at Mach 5.0, 120 ≤ α ≤180.
53
C01 M=1.65
-0.4
-0.3
-0.2
-0.1
0
0.1
0.2
0.3
0.4
0.5
0.6
0.7
-20 0 20 40 60 80 100 120 140 160 180Alpha
CL
C01
AIRPLANE: C01
Figure 62. Lift coefficient comparison for the C01 configuration at Mach 1.65.
54

C01 M=1.65
0
0.2
0.4
0.6
0.8
1
1.2
1.4
1.6
1.8
-20 0 20 40 60 80 100 120 140 160 180Alpha
CD
C01
AIRPLANE: C01
Figure 63. Drag coefficient comparisons for the C01 configuration at Mach 1.65.
55
C01 M=5.00
-0.4
-0.3
-0.2
-0.1
0
0.1
0.2
0.3
0.4
0.5
0.6
-20 0 20 40 60 80 100 120 140 160 180Alpha
CL
C01
AIRPLANE: C01
Figure 64. Lift coefficient comparisons for the C01 configuration at Mach 5.0.
56

C01 M=5.00
0
0.2
0.4
0.6
0.8
1
1.2
1.4
1.6
-20 0 20 40 60 80 100 120 140 160 180Alpha
CD
C01
AIRPLANE: C01
Figure 65. Drag coefficient comparisons for the C01 configuration at Mach 5.0.
57
C01 M=0.4
-0.15
-0.1
-0.05
0
0.05
0.1
0.15
-20 0 20 40 60 80 100 120 140 160 180Alpha
CM
C01
AIRPLANE: C01
Figure 66. Pitching moment coefficient data for Mach 0.4.
58
C01 M=0.7
-0.125
-0.1
-0.075
-0.05
-0.025
0
0.025
0.05
0.075
0.1
-20 0 20 40 60 80 100 120 140 160 180Alpha
CM
C01
AIRPLANE: C01
Figure 67. Pitching moment coefficient data for Mach 0.7.
59
C01 M=1.2
-0.125
-0.1
-0.075
-0.05
-0.025
0
0.025
0.05
0.075
0.1
-20 0 20 40 60 80 100 120 140 160 180Alpha
CM
C01
AIRPLANE: C01
Figure 68. Pitching moment coefficient data for Mach 1.2.
60

61
REPORT DOCUMENTATION PAGE
8. PERFORMING ORGANIZATION REPORT NUMBER
10. SPONSORING/MONITOR’S ACRONYM(S)
Form ApprovedOMB No. 0704-0188
13. SUPPLEMENTARY NOTES
7. PERFORMING ORGANIZATION NAME(S) AND ADDRESS(ES)
4. TITLE AND SUBTITLE 5a. CONTRACT NUMBER
6. AUTHOR(S)
1. REPORT DATE (DD-MM-YYYY)
9. SPONSORING/MONITORING AGENCY NAME(S) AND ADDRESS(ES)
2. REPORT TYPE 3. DATES COVERED (From - To)
19a. NAME OF RESPONSIBLE PERSON
19b. TELEPHONE (Include area code)
18. NUMBER OF PAGES
17. LIMITATION OF ABSTRACT
16. SECURITY CLASSIFICATION OF:
15. SUBJECT TERMS
14. ABSTRACT
Standard Form 298 (Rev. 8-98)Prescribed by ANSI Std. Z39-18
The public reporting burden for this collection of information is estimated to average 1 hour per response, including the time for reviewing instructions, searching existingdata sources, gathering and maintaining the data needed, and completing and reviewing the collection of information. Send comments regarding this burden estimate orany other aspect of this collection of information, including suggestions for reducing this burden, to Department of Defense, Washington Headquarters Services,Directorate for information Operations and Reports (0704-0188), 1215 Jefferson Davis Highway, Suite 1204, Arlington, VA 22202-4302. Respondents should be awarethat notwithstanding any other provision of law, no person shall be subject to any penalty for failing to comply with a collection of information if it does not display acurrently valid OMB control number.PLEASE DO NOT RETURN YOUR FORM TO THE ABOVE ADDRESS.
12. DISTRIBUTION/AVAILABILITY STATEMENT
5b. GRANT NUMBER
5c. PROGRAM ELEMENT NUMBER
5d. PROJECT NUMBER
5e. TASK NUMBER
5f. WORK UNIT NUMBER
11. SPONSORING/MONITORING REPORT NUMBER
a. REPORT b. ABSTRACT c. THIS PAGE
Unclassified 66
Unclassified — Unlimited Distribution: NonstandardSubject Category: 08, 18Availability: NASA CASI (301) 621-0390
21-982-10-20
NASA/TM-2005-213457
05/20/2005
Ames Research Center, Moffett Field, CA 94035-1000andRaytheon ITSS, Ames Research Center, Moffett Field, CA 94035-1000
National Aeronautics and Space AdministrationWashington, D.C. 20546-0001
Susan E. Cliff
The Apollo Capsule Optimization for Improved Stability andComputational/Experimental Data Comparisons
Susan E. Cliff and Scott D. Thomas
Numerical optimization was employed on the Apollo Command Module to modify its external shape. The Apollo Command Module (CM)
that was used on all NASA human space flights during the Apollo Space Program is stable and trimmed in an apex forward (alpha of approxi-
mately 40 to 80 degrees) position. This poses a safety risk if the CM separates from the launch tower during abort. Optimization was
employed on the Apollo CM to remedy the undesirable stability characteristics of the configuration. Geometric shape changes were limited to
axisymmetric modifications that altered the radius of the apex (RA), base radius (R
O), corner radius (R
C), and the cone half angle (θ), while the
maximum diameter of the CM was held constant. The results of multipoint optimization on the CM indicated that the cross-range perfor-
mance can be improved while maintaining robust apex-aft stability with a single trim point. Navier-Stokes computations were performed on
the baseline and optimized configurations and confirmed the Euler-based optimization results. Euler Analysis of ten alternative CM vehicles
with different values of the above four parameters are compared with the published experimental results of numerous wind tunnel tests during
the late 1960’s. These comparisons cover a wide Mach number range and a full 180-degree pitch range and show that the Euler methods are
capable of fairly accurate force and moment computations and can separate the vehicle characteristics of these ten alternative configurations.
Optimization, Space capsules, Stability, Aerodynamic shape optimization, Euler, Experiment, Computational fluiddynamics (CFD)
POC: Susan E. Cliff, Ames Research Center, Analysis Branch, MS 258-1, Moffett Field, CA 94035-1000 (650) 604-3907
Technical Memorandum
Unclassified Unclassified
NASA
(650) 604-3907Unclassified
A-0513777
Related Documents