The Australian Passenger Motor Vehicle Industry (APMVI): Trade Liberalisation and Productivity Performance Lionel Bopage and Kishor Sharma 27 May 2015 Disclaimer: This presentation is based on consensus of the authors and does not necessarily represent the position of the Australian Government. The authors are solely responsible for any errors and omissions.

APMVI productivity and trade liberalisation
Aug 11, 2015
Welcome message from author
This document is posted to help you gain knowledge. Please leave a comment to let me know what you think about it! Share it to your friends and learn new things together.
Transcript

The Australian Passenger Motor Vehicle Industry (APMVI):
Trade Liberalisation and Productivity Performance
Lionel Bopage and Kishor Sharma
27 May 2015
Disclaimer:This presentation is based on consensus of the authors and does not necessarily represent the position of the Australian Government.
The authors are solely responsible for any errors and omissions.

Structure of presentation
1. Introduction
2. Quick review of the literature
3. Nature of liberalisation reforms in APMVI
4. Estimate of productivity growth
5. The Determinants of productivity growth in APMVI
6. Discussion and observations
2

Introduction
3
Motivation Globally studies on the effects of trade liberalisation on productivity performance of
automotive industry are limited; Only a few qualitative studies of productivity performance in the APMVI; No quantitative industry level studies that uses time series data; and Access to a long string of time series data from 1946 to 2008.
The aim is to undertake: a systematic investigation of the effects of trade liberalization on productivity growth;
through the experience of the APMVI; and examine its determinants.

Literature: Trade Liberalisation and Productivity
4
Australian Manufacturing Sector - X-sectional studies (Chand 1999, Oczkowski & Sharma 2001, Bloch & McDonald 2002, and Mahadevan 2002)
liberalisation led to manufacturing productivity growth
APMVI Experience serious doubts if liberalisation led to productivity growth
Theory: Influence of Trade Liberalisation on Productivity Growth
Increased competition (Tybout 1992, Tybout & Westbrok 1995, and De Boyrie & Kreinin 2013) may lead to lower price-cost margin & improve allocative efficiency; reduce x-inefficiency (efficient use of inputs and securing them from most efficient suppliers); lead to exit of less efficient firms; cause survivors move down the decreasing cost curve through economies of scale; and lead to productivity improvement.
However, Rodrik (1992b), and Rodriguez & Rodrick (1999) argue that shrinking sales of domestic firms may lead to lower productivity growth; and reduce incentives to invest in technological innovation.
In this context, we examine productivity performance of APMVI following liberalisation reforms

Policy Reform in Australia
Significant liberalisation since 1975 imports tariffs on motor vehicles, parts and components significantly reduced; quantitative restrictions and subsidies removed; and a significant fall in the effective rate of protection.
Features highly protected while being gradually opened up; intense public interest – production, trade deficit & employment; and results of ceasing PMV production in Australia.
5
Policy Reform in Australia (Contd)
6
Effective rate of protection takes into account all forms of assistance offered to an industry including tariffs on inputs, final products, export subsidies and import quotas.
The Effective Rate of Protection fell from 143% mid 1980s to 12 per cent by 2008.

Policy Reform in Australia (Contd)
7
Despite reforms APMVI remained highly vulnerable to external competition
Major concerns Frequently fluctuating domestic production; Rapidly expanding sectoral trade deficit; Rising trading losses; and Workforce redundancies.

Policy Reform in Australia (Contd)
8
Bracks 2008:
Justifying domestic production with large trading losses presented a major challenge; and
Recommendation for a revised policy platform for APMVI:To be more efficient and green.
Developments since Bracks Report
9
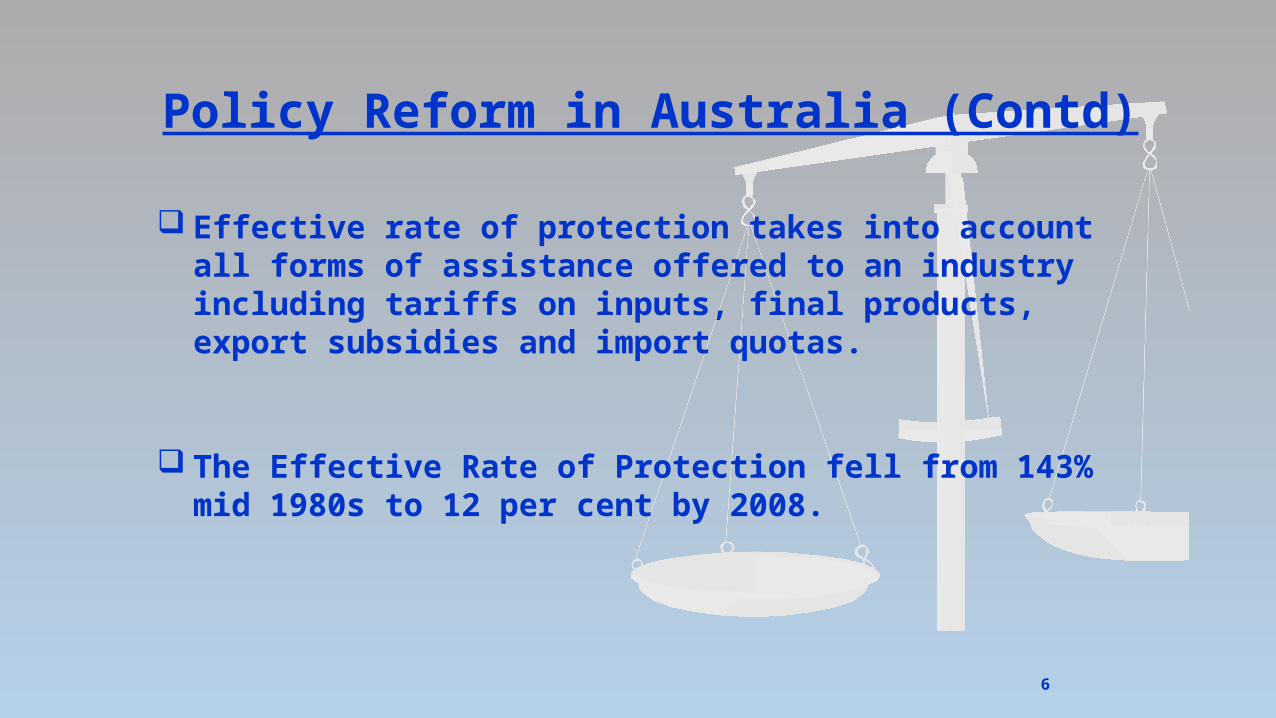
Since Bracks Recommendations Some component & part manufacturers closed down or relocated; Mitsubishi ceased production in March 2008; Ford to cease production in 2016; Holden to cease production in 2017; and Toyota to cease production in 2017.
Key features of pre and post reform era
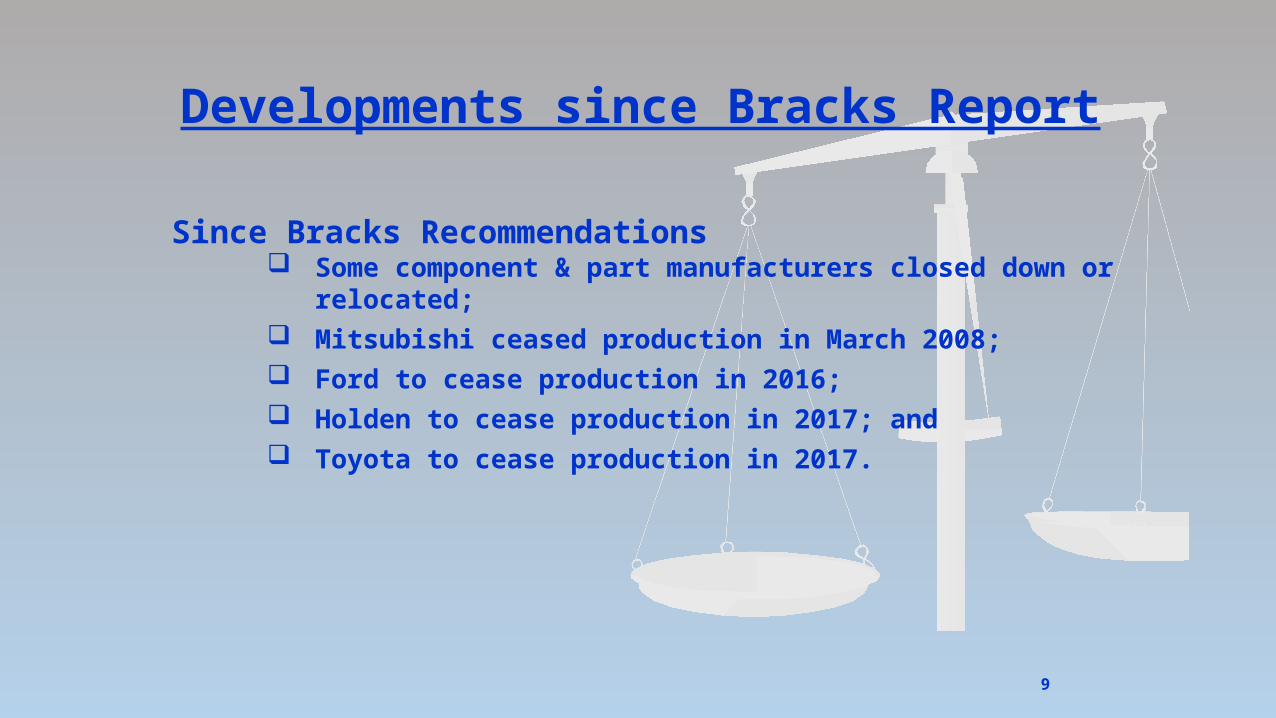
Australian Automotive Intelligence Yearbook 2013
Pre-reform era policies:• Protection from 1907 onwards;• High tariffs;• Increased quotas;• ERP much higher (143% by 1984-1985);• Preferential import licensing; and• Introduction of subsidies and duty drawback scheme
Post-reform era policies:• Need for restructuring the industry;• Button plan in 1984 with Automotive Industry Authority;• Import quotas replaced with tariffs & tariffs brought down;• Local content scheme abolished;• Export Facilitation Scheme replaced with ACIS;• ERP falls to 12% by 2007-2008; and• Nominal Rate of Protection fell from 46% to 10%.
10
Measuring Productivity
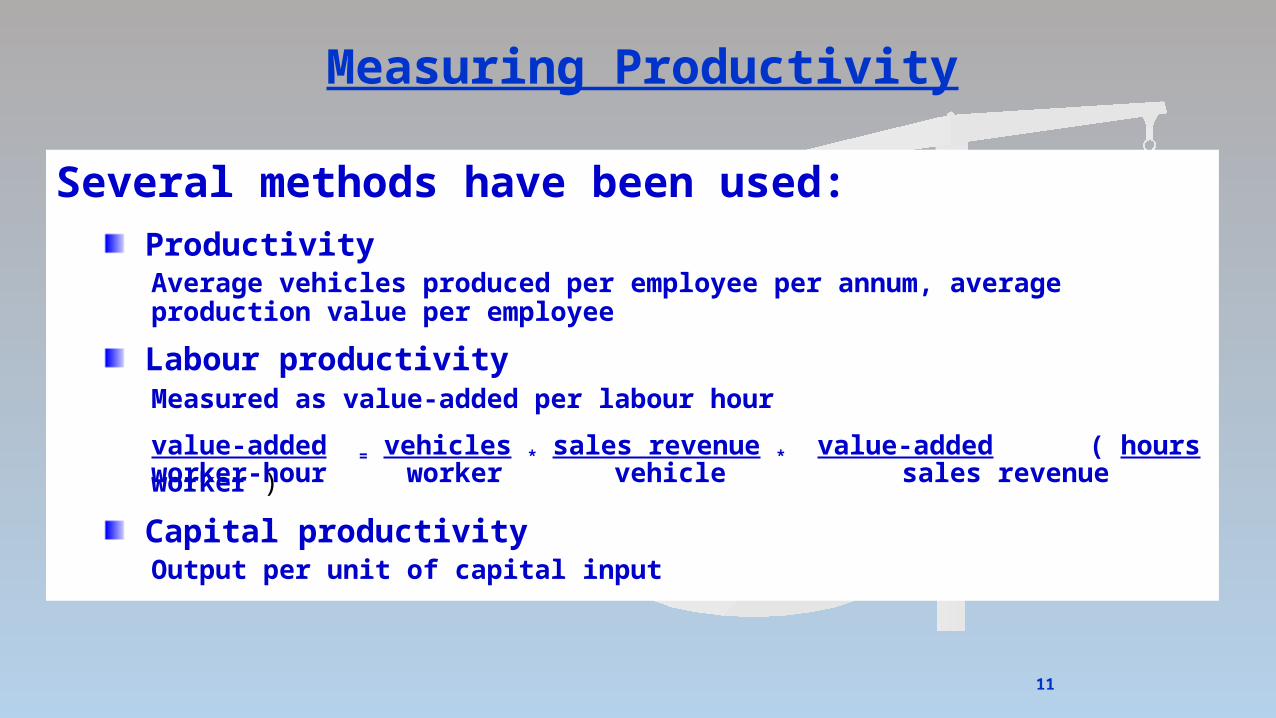
Several methods have been used: Productivity
Average vehicles produced per employee per annum, average production value per employee
Labour productivityMeasured as value-added per labour hour
value-added = vehicles * sales revenue * value-added ( hoursworker-hour worker vehicle sales revenue worker )
Capital productivityOutput per unit of capital input
11

Productivity – Methodological challenges
Labour Productivity (LP) and Capital productivity (CP) Partial measures; LP = Output per unit of labour; LP includes efficiencies gained due to capital accumulation; and CP disregards contributions due to smart working.
Total Factor Productivity (TFP)
TFP is regarded as an appropriate indicator as it considers weighted average growth in labour, capital and intermediate inputs in estimating productivity.
12
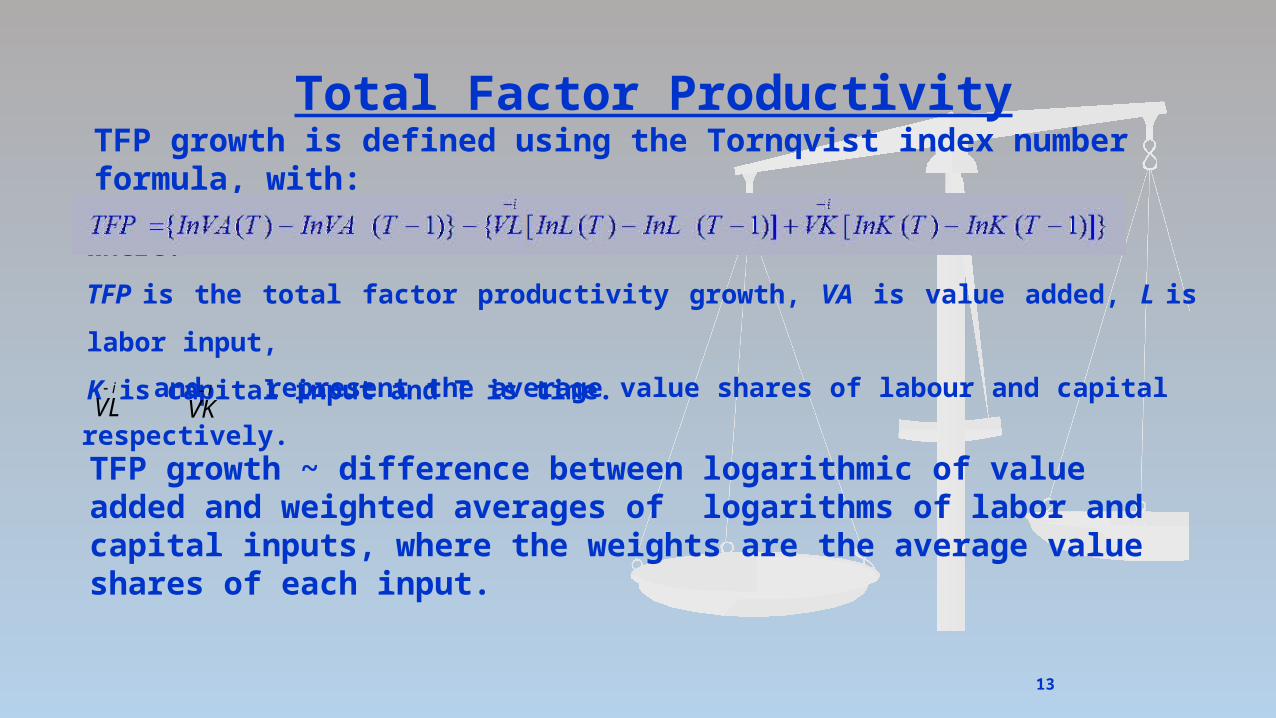
Total Factor ProductivityTFP growth is defined using the Tornqvist index number formula, with:
Where:
TFP is the total factor productivity growth, VA is value added, L is labor input,
K is capital input and T is time.
TFP growth ~ difference between logarithmic of value added and weighted averages of logarithms of labor and capital inputs, where the weights are the average value shares of each input.
13
and represent the average value shares of labour and capital respectively.i
VL i
VK
TFP Growth Estimates
This approach of estimating captures: technical efficiency; improvements / changes in capacity utilization; and better management practices, improvements in the work place
environment, training and learning by doing etc.
The estimated growth rates need be interpreted as rates of improvement in overall efficiency of resource use (including fixed factors of production), rather than as ‘pure’ rates of technological progress.
14
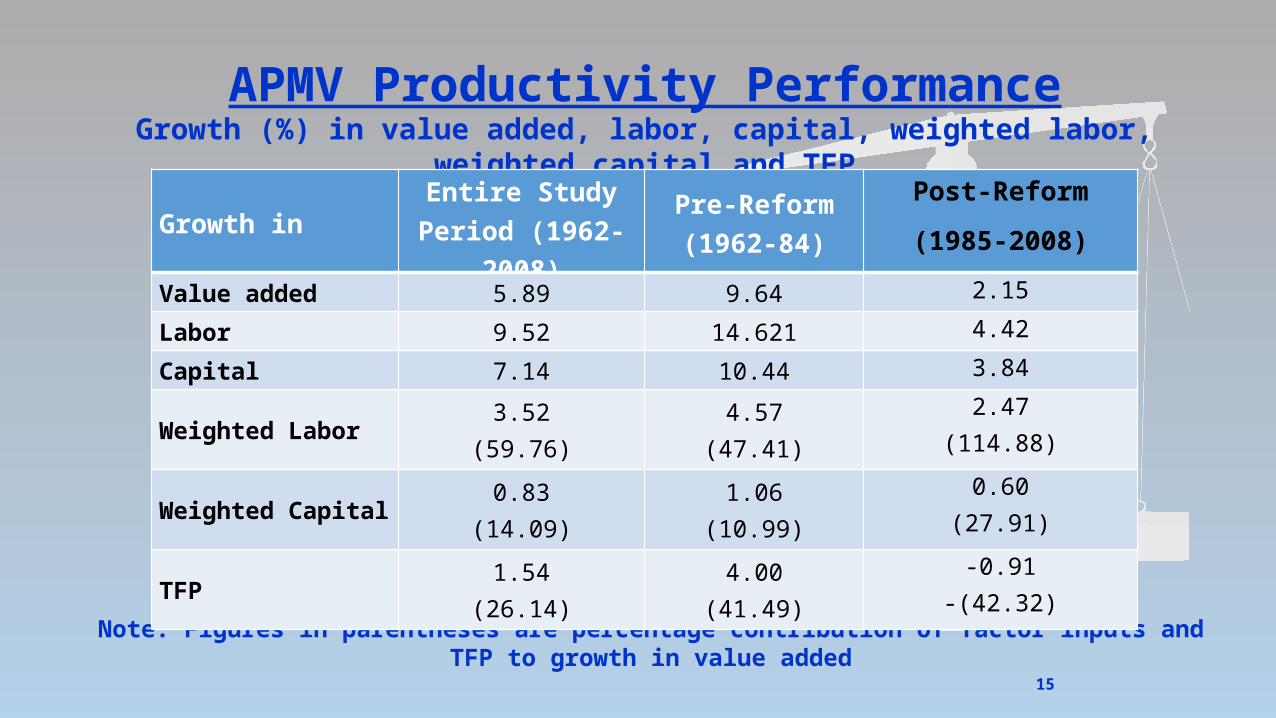
APMV Productivity PerformanceGrowth (%) in value added, labor, capital, weighted labor, weighted capital and TFP
Note: Figures in parentheses are percentage contribution of factor inputs and TFP to growth in value added
Growth inEntire Study Period
(1962-2008)Pre-Reform
(1962-84)
Post-Reform
(1985-2008)
Value added 5.89 9.64 2.15
Labor 9.52 14.621 4.42
Capital 7.14 10.44 3.84
Weighted Labor3.52
(59.76)4.57
(47.41)
2.47(114.88)
Weighted Capital0.83
(14.09)1.06
(10.99)
0.60(27.91)
TFP1.54
(26.14)4.00
(41.49)
-0.91-(42.32)
15
Determinants of Productivity Growth
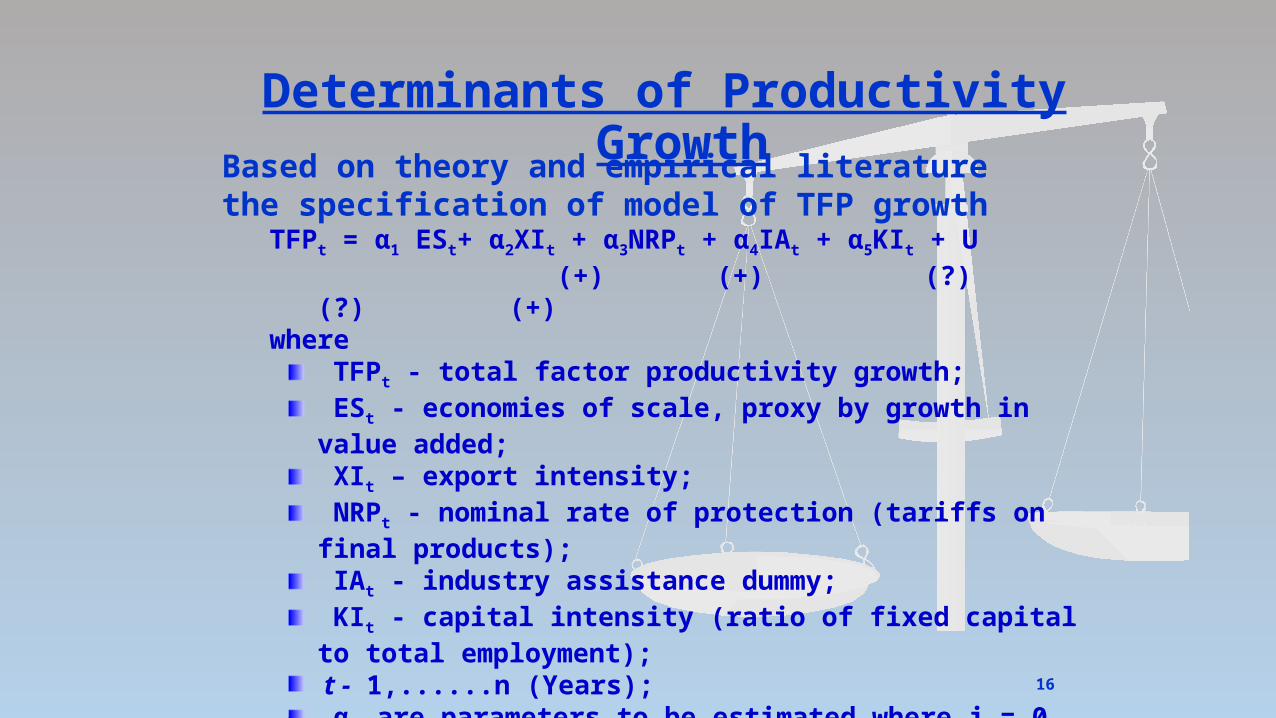
Based on theory and empirical literaturethe specification of model of TFP growth
TFPt = α1 ESt+ α2XIt + α3NRPt + α4IAt + α5KIt + U (+) (+) (?) (?) (+)where
TFPt - total factor productivity growth; ESt - economies of scale, proxy by growth in value added; XIt – export intensity; NRPt - nominal rate of protection (tariffs on final products); IAt - industry assistance dummy; KIt - capital intensity (ratio of fixed capital to total employment); t - 1,......n (Years); αj are parameters to be estimated where j = 0 to 5; and U is a standard classical error term.
16
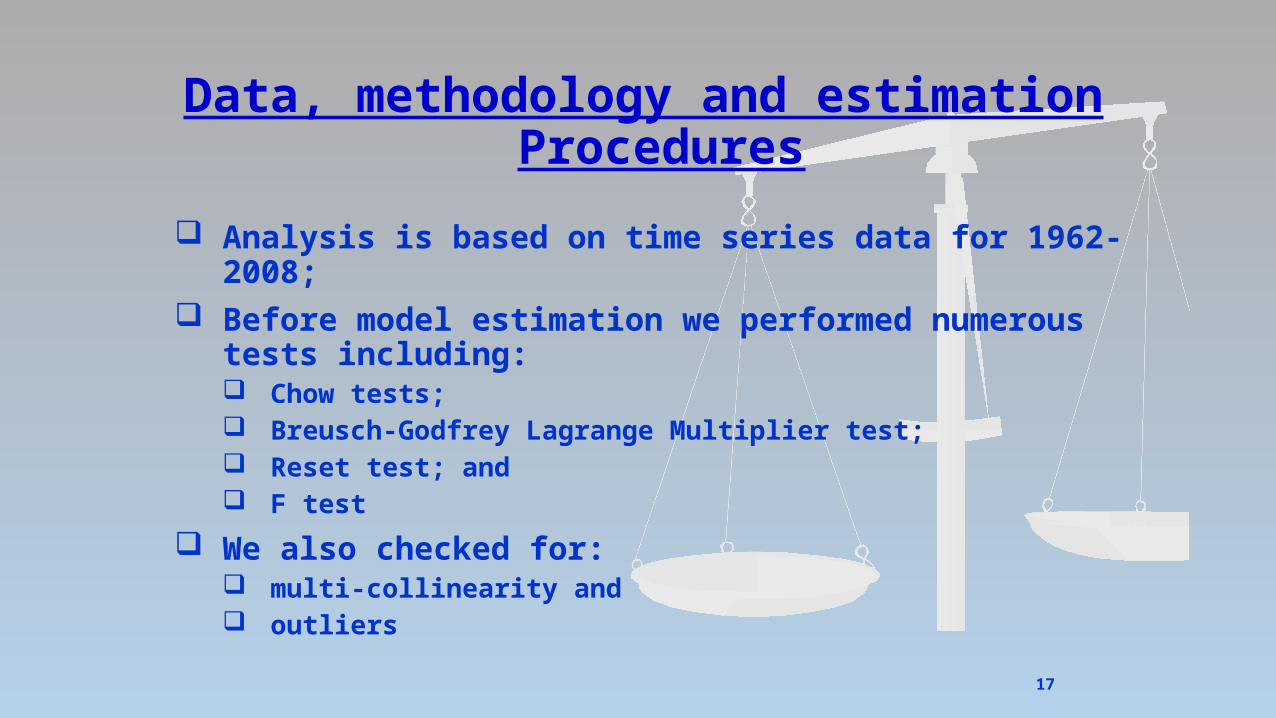
Data, methodology and estimation Procedures
Analysis is based on time series data for 1962-2008; Before model estimation we performed numerous tests including:
Chow tests; Breusch-Godfrey Lagrange Multiplier test; Reset test; and F test
We also checked for: multi-collinearity and outliers
17
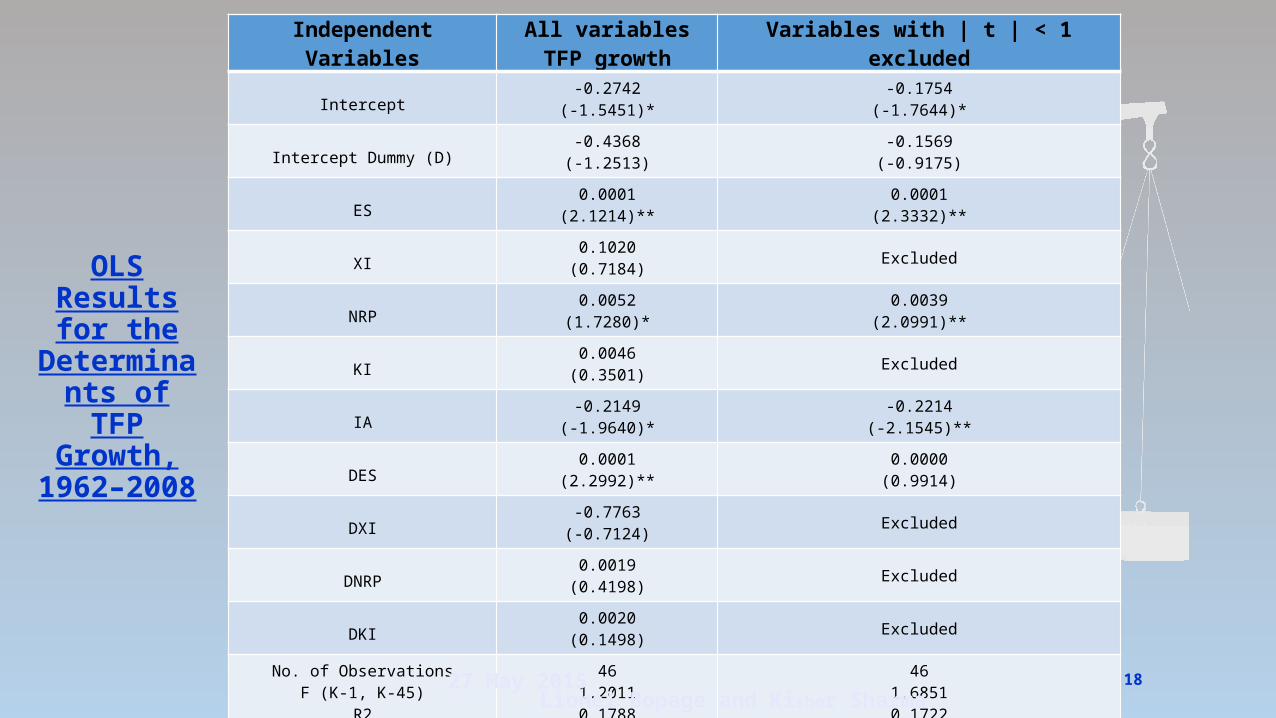
OLS Resultsfor the
Determinants of
TFP Growth, 1962–2008
Independent VariablesAll variablesTFP growth
Variables with | t | < 1 excluded
Intercept-0.2742
(-1.5451)*-0.1754
(-1.7644)*
Intercept Dummy (D)-0.4368
(-1.2513)-0.1569
(-0.9175)
ES0.0001
(2.1214)**0.0001
(2.3332)**
XI0.1020
(0.7184)Excluded
NRP0.0052
(1.7280)*0.0039
(2.0991)**
KI0.0046
(0.3501)Excluded
IA-0.2149
(-1.9640)*-0.2214
(-2.1545)**
DES0.0001
(2.2992)**0.0000
(0.9914)
DXI-0.7763
(-0.7124)Excluded
DNRP0.0019
(0.4198)Excluded
DKI0.0020
(0.1498)Excluded
No. of ObservationsF (K-1, K-45)
R2RESET F (4, 42-K)B-G LM AR(1) Test
461.20110.17881.18213.935
461.68510.17221.6643
4.427 May 2015Lionel Bopage and Kishor Sharma
18
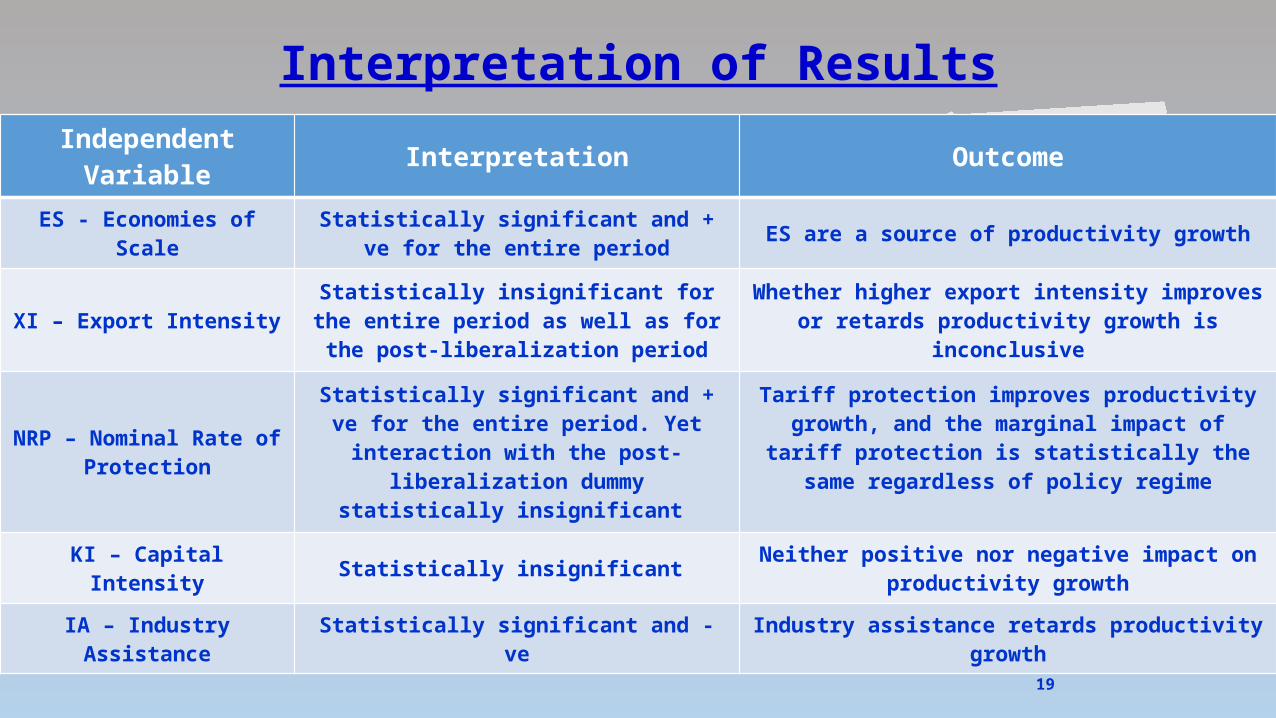
Interpretation of Results
19
Independent Variable Interpretation Outcome
ES - Economies of ScaleStatistically significant and + ve for the entire
periodES are a source of productivity growth
XI – Export IntensityStatistically insignificant for the entire period
as well as for the post-liberalization periodWhether higher export intensity improves or retards
productivity growth is inconclusive
NRP – Nominal Rate of Protection
Statistically significant and + ve for the entire period. Yet interaction with the post-
liberalization dummy statistically insignificant
Tariff protection improves productivity growth, and the marginal impact of tariff protection is statistically the
same regardless of policy regime
KI – Capital Intensity Statistically insignificant Neither positive nor negative impact on productivity
growth
IA – Industry Assistance Statistically significant and - ve Industry assistance retards productivity growth
Discussion and observations
20
Trade liberalization had a negative impact on productivity, at least in the immediate post-liberalization period;
Productivity growth declined significantly from over 4 per cent per annum in the pre-liberalization period to -0.9 per cent per annum in the post-liberalization period;
As import competition intensified the domestic producers appear to have lost market share leading to excess production capacity and an absolute fall in productivity growth, especially following trade liberalization;
Long-run impact of trade policy reforms is probably not fully reflected in the covered study period, and our results may have underestimated the long-run benefits of outward-orientation on productivity performance; and
Trade policy reforms caused no major improvements in productivity.
Discussion and observations (Contd)
21
Yet, the post-liberalization fall in productivity may signal the beginning of a turnaround, but only if appropriate strategies are implemented to promote innovation;
Economies of scale, nominal rate of protection and industry assistance are the major determinants of productivity growth;
While economies of scale and tariff protection contribute positively to productivity improvement, the impact of industry assistance appears to be negative;
Industry assistance retards productivity growth in that such assistance are less transparent, naturally leading to the rent-seeking behavior; and
Conclusion: No evidence of post-liberalization productivity improvements in APMVI.

27 May 2015 22
Questions and Suggestions
Thank You!
Related Documents