Interim Report, 1 January – 30 June 2015 1 Apetit Plc Interim Report, January–June 2015 Second quarter (April–June) Consolidated net sales were up on the previous year and amounted to EUR 100.2 (98.1) million. Operating profit excluding non-recurring items was lower than a year earlier and came to EUR -0.7 (0.7) million. The reported operating result was EUR 0.0 (0.6) million. The profit for the period was EUR -0.6 (0.1) million, and earnings per share amounted to EUR -0.10 (0.02). January–June Consolidated net sales were up on the previous year and amounted to EUR 191.7 (187.0) million. Operating profit excluding non-recurring items was lower than a year earlier and came to EUR -3.0 (0.4) million. The reported operating profit before non-recurring items was EUR -2.2 (-0.1) million. The profit for the period was EUR -2.9 (-1.1) million, and earnings per share amounted to EUR -0.41 (-0.12). Assessment of profit performance for the full year is unchanged. The Group’s full-year operating profit excluding non-recurring items is expected to fall short of the previous year’s level. The information in this Interim Report has not been audited. The figures in parentheses are the equivalent figures for the same period in 2014, and the comparison period means the corresponding period of the previous year, unless stated otherwise. Juha Vanhainen, CEO: “The Apetit Group’s net sales grew slightly in April–June but the operating profit excluding non- recurring items was lower than in the comparison period. The weakened profitability of the Food Business and especially its fish and fresh product groups had an adverse effect on the consolidated operating profit, which excluding non-recurring items was negative. Finland’s poor economic situation has reduced sales in the retail and restaurant sectors and shifted consumer demand to products of a lower price and with less added value. The market price level of sugar was low, as was expected, turning the associated company profit of Sucros, which is part of the Other Operations segment, negative. The April–June period was successful for the Grains and Oilseeds Business, where the large

Welcome message from author
This document is posted to help you gain knowledge. Please leave a comment to let me know what you think about it! Share it to your friends and learn new things together.
Transcript
Interim Report, 1 January – 30 June 2015 1
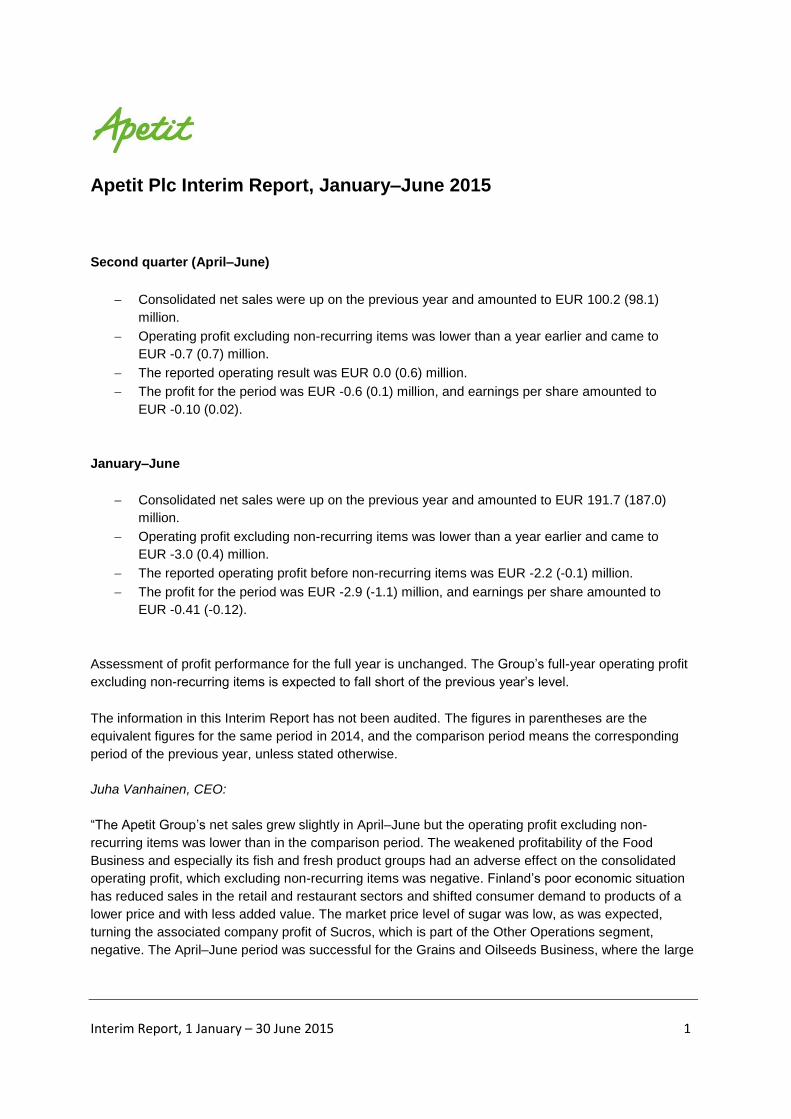
Apetit Plc Interim Report, January–June 2015
Second quarter (April–June)
Consolidated net sales were up on the previous year and amounted to EUR 100.2 (98.1)
million.
Operating profit excluding non-recurring items was lower than a year earlier and came to
EUR -0.7 (0.7) million.
The reported operating result was EUR 0.0 (0.6) million.
The profit for the period was EUR -0.6 (0.1) million, and earnings per share amounted to
EUR -0.10 (0.02).
January–June
Consolidated net sales were up on the previous year and amounted to EUR 191.7 (187.0)
million.
Operating profit excluding non-recurring items was lower than a year earlier and came to
EUR -3.0 (0.4) million.
The reported operating profit before non-recurring items was EUR -2.2 (-0.1) million.
The profit for the period was EUR -2.9 (-1.1) million, and earnings per share amounted to
EUR -0.41 (-0.12).
Assessment of profit performance for the full year is unchanged. The Group’s full-year operating profit
excluding non-recurring items is expected to fall short of the previous year’s level.
The information in this Interim Report has not been audited. The figures in parentheses are the
equivalent figures for the same period in 2014, and the comparison period means the corresponding
period of the previous year, unless stated otherwise.
Juha Vanhainen, CEO:
“The Apetit Group’s net sales grew slightly in April–June but the operating profit excluding non-
recurring items was lower than in the comparison period. The weakened profitability of the Food
Business and especially its fish and fresh product groups had an adverse effect on the consolidated
operating profit, which excluding non-recurring items was negative. Finland’s poor economic situation
has reduced sales in the retail and restaurant sectors and shifted consumer demand to products of a
lower price and with less added value. The market price level of sugar was low, as was expected,
turning the associated company profit of Sucros, which is part of the Other Operations segment,
negative. The April–June period was successful for the Grains and Oilseeds Business, where the large

Interim Report, 1 January – 30 June 2015 2
delivery volumes in the grain trade and the high profitability of oilseed products led to an improvement
in the segment operating profit, excluding non-recurring items, on the previous year.
I’ve spent my first few months studying the Group’s operations, finances and stakeholders in order to
understand the challenges and opportunities that we have. In the Food Business we are strengthening
our competitiveness and enhancing our customer and consumer orientation in a changing operating
environment. One of the first steps is to strengthen the segment’s management, and to this end we
have appointed Anu Ora as Director of the Food Business. She has considerable experience and
strong credentials in the Finnish retail trade and strategic business development.
In the late summer we began the planning of Apetit’s new strategy and will during the process define
the methods with which we can ensure the Group’s profitability, operating efficiency and continuous
customer and consumer oriented renewal in a changing operating environment. I am looking forward
to the strategy collaboration work within our organisation.
In the Food Business Apetit has many strengths based on quality, products and domestic origin. Our
product categories are a strong favourite of those who appreciate delicious wellbeing. At the same
time the continued difficult market situation in the Finnish food sector and the poor profitability in the
fish and fresh product segments are significant challenges to which we must respond with
determination. The long-term profitability programmes under way in the Food Business’s fish and fresh
products groups will continue throughout 2015 as planned, and we will adjust the measures taken if
necessary.
In the Grains and Oilseeds Business our market position is strong and our profitability is solid. We will
continue to strengthen our business in the Baltic Sea region and Finland. The expansion of the Inkoo
grain terminal will be inaugurated this month and we will enjoy the benefits of the new grain export
capacity during this harvest season. In the autumn we will launch a project to expand the packaging
plant at the Kirkkonummi vegetable oil milling plant in response to the increased demand for vegetable
oil products. Both projects support the profitable growth of the Grains and Oilseeds Business”.

Interim Report, 1 January – 30 June 2015 3
KEY FIGURES
EUR million Q2/
2015 Q2/
2014 Change
Q1-Q2/
2015
Q1–Q2/
2014 Change
Q1-Q4/
2014
Net sales 100.2 98.1 +2% 191.7 187.0 +3% 384.7
Operating profit before
non- recurring items -0.7 0.7 -3.0 0.4 7.3
Operating profit 0.0 0.6 -2.2 -0.1 -5.9
Profit before taxes -0.3 0.0 -2.6 -1.0 -8.1
Profit for the period -0.6 0.1 -2.9 -1.1 -8.7
Profit for the period excluding non-recurring items
-1.3 0.1 -3.6 -0.7 3.7
Earnings per share,
EUR -0.10 0.02 -0.41 -0.12 -1.29
Earnings per share excluding non-recurring items, EUR
-0.21 0.03 -0.52 -0.06 0.72
Equity per share, EUR 19.70 21.71 20.70
Equity ratio, % 75.8 76.7 69.7
Net cash flow from operating activities
14.1 28.7 18.1
NET SALES AND PROFIT
Second quarter (April–June)
Consolidated net sales rose to EUR 100.2 (98.1) million in April–June. Net sales were up in the Grains
and Oilseeds Business and down in the Food Business on the comparison period.
Consolidated operating profit excluding non-recurring items was EUR -0.7 (0.7) million. Operating profit
excluding non-recurring items decreased in the Food Business and increased in the Grains and
Oilseeds Business and in Other Operations. The reported operating profit was EUR 0.0 (0.6) million.
Non-recurring items totalled EUR 0.7 (-0.1) million and were in the Food Business, and in the
comparison period in the Other Operations segment.
The operating profit includes EUR -0.1 (0.9) million as the share of the profits of associated
companies.
Interim Report, 1 January – 30 June 2015 4
January–June
January–June consolidated net sales were up 3 per cent on the comparison period and amounted to
EUR 191.7 (187.0) million. The net sales of the Food Business were down and those of the Grains and
Oilseeds Business were up on the comparison period.
Operating profit excluding non-recurring items was lower than a year earlier and came to EUR -3.0
(0.4) million. The reported operating profit was EUR -2.2 (-0.1) million. Non-recurring items totalled
EUR 0.7 (-0.5) million during the review period and were related to the Food Business, and in the
comparison period to the Other Operations segment.
The operating profit includes EUR -1.1 (0.6) million as the share of the profits of associated
companies.
Financial income and expenses came to a total of EUR -0.3 (-0.9) million. Financial income and
expenses included valuation items of EUR 0.3 (-0.2) million with no cash flow implications, as a result
of changes in foreign exchange rates regarding internal loans to the Maritim Food Group. Financial
expenses also include EUR -0.5 (-0.5) million as the share of the Avena Nordic Grain Group’s result
attributable to the employee owners of Avena Nordic Grain Oy.
The profit before taxes was EUR -2.6 (-1.0) million. Profit for the period was EUR -2.9 (-1.1) million,
and earnings per share amounted to EUR -0.41 (-0.12).
FINANCING AND BALANCE SHEET
The Group’s liquidity remained good and its financial position is strong.
The cash flow from operating activities after interest and taxes amounted to EUR 14.1 (28.7) million in
January–June. The impact of the change in working capital was EUR 16.7 (26.9) million. Working
capital decreased in the Grains and Oilseeds business.
The net cash flow from investing activities was EUR -3.5 (-0.9) million. The cash flow from financing
activities was EUR -12.7 (-16.5) million, including EUR -8.4 (-10.3) million in loan repayments and EUR
-4.3 (-6.2) million in dividend payments. The net change in cash and cash equivalents was EUR -2.2
(11.2) million.
At the end of the period, the Group had EUR 3.3 (4.8) million in interest-bearing liabilities and EUR
11.5 (14.1) million in liquid assets. Net interest-bearing liabilities totalled EUR -8.2 (-9.3) million. The
consolidated balance sheet total stood at EUR 160.8 (177.3) million. At the end of the period, equity
totalled EUR 121.9 (136.0) million. The equity ratio was 75.8 (76.7) per cent. The Group’s liquidity is
secured with committed credit facilities; EUR 40 (25) million was available in credit at the end of the
period.
On 26 June 2015, Apetit Plc announced that it has renewed its credit limit and loan agreements. The
new binding and collateral-free credit facilities totalling EUR 40 million and intended for working capital
financing replaced the old credit facility agreements worth EUR 25 million in total. The maturity of the
credit facilities has been spread out to 2018 and 2020. The existing EUR 50 million commercial paper
programme will continue unchanged. In addition to these, Apetit Plc has agreed on a EUR 5 million
investment loan that is undrawn and will mature in 2022.

Interim Report, 1 January – 30 June 2015 5
INVESTMENT
The Group’s gross investment in non-current assets came to EUR 4.9 (1.1) million. Investment in the
Food Business totalled EUR 3.0 (0.9) million, in the Grains and Oilseeds Business EUR 1.8 (0.2)
million and in Other Operations EUR 0.1 (0.0) million.
PERSONNEL
The Apetit Group employed an average of 713 (731) people in January-June. The average number of
personnel in the Food Business was 617 (640), in the Grains and Oilseeds Business 86 (82) and in
Other Operations 10 (10).
SEASONALITY OF OPERATIONS
In accordance with the IAS 2 standard, the historical cost of inventories includes a systematically
allocated portion of the fixed production overheads. With production focusing on harvest time, raw
materials are processed into finished products mainly during the final quarter of the year, which means
that the inventory volumes and balance-sheet values are at their highest at the end of the year. Since
the entry of the fixed production overheads included in historical cost as an expense item is deferred
until the time of sale, most of the Group’s annual profit is accrued in the final quarter. The seasonal
nature of operations is most marked in the Food Business’s frozen foods group and in the associated
company Sucros, due to the link between production and the crop harvesting season.
Harvests also cause seasonal variation in the amount of working capital tied up in operations. Working
capital tied up in the Grains and Oilseeds Business is at its highest towards the end of the year and
decreases to its lowest in the summer before the next harvest season. As the production of frozen
products is also seasonal and follows the harvest period, the working capital tied on operations is at its
highest around the turn of the year.
In Finland, sales of fish products peak at weekends and in connection with public holidays. In the fish
products group in Finland, a significant proportion of the full-year result depends on a successful
Christmas season. Due to the growing season for fish, the profit accumulated by the Taimen Group,
which is reported as an associated company, is normally smaller during the summer than at other
times of the year. Net sales in the Grains and Oilseeds Business can vary from one year and quarter to
the next quite considerably, depending on demand and supply and on the price level in Finland and
other markets.
OVERVIEW OF OPERATING SEGMENTS
Food Business
EUR million Q2/
2015 Q2/
2014 Change
Q1-Q2/ 2015
Q1-Q2/ 2014
Change Q1-Q4/ 2014
Net sales 40.9 43.0 -5% 82.4 84.6 -3% 170.8
Operating profit before non- recurring items
-2.5 -0.1 -4.9 -1.5 0.6
Operating profit -1.8 -0.1 -4.2 -1.5 -9.7
Interim Report, 1 January – 30 June 2015 6
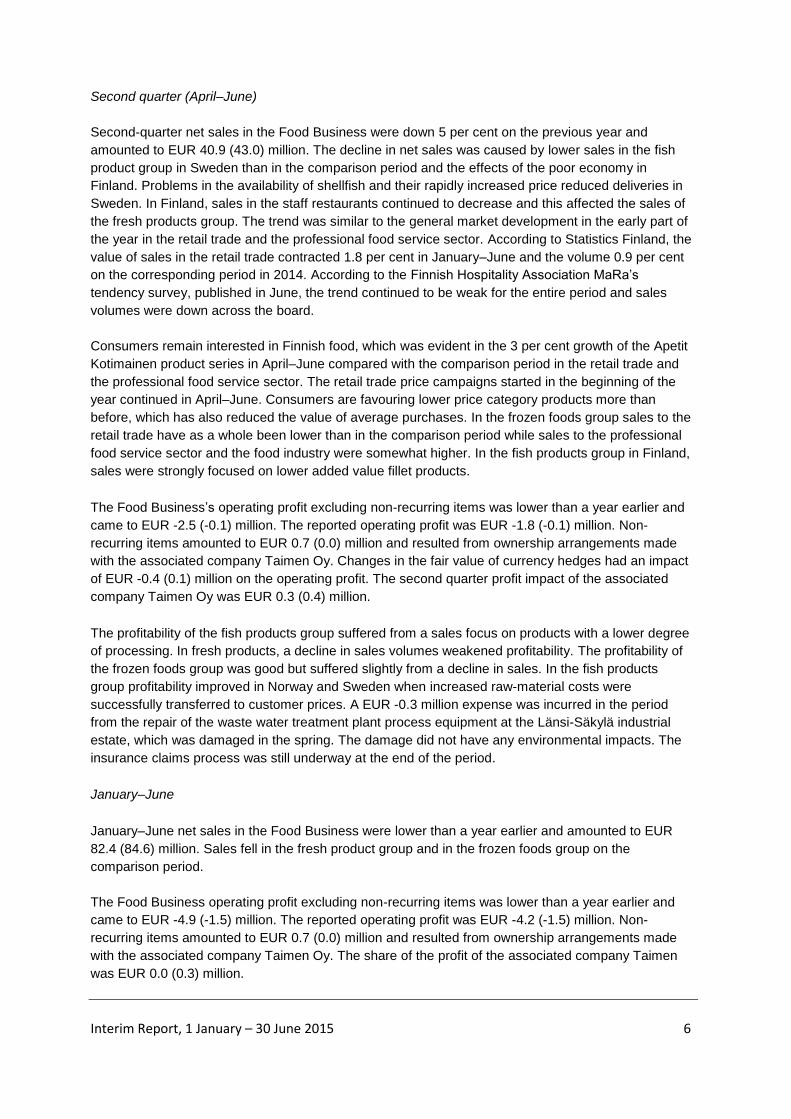
Second quarter (April–June)
Second-quarter net sales in the Food Business were down 5 per cent on the previous year and
amounted to EUR 40.9 (43.0) million. The decline in net sales was caused by lower sales in the fish
product group in Sweden than in the comparison period and the effects of the poor economy in
Finland. Problems in the availability of shellfish and their rapidly increased price reduced deliveries in
Sweden. In Finland, sales in the staff restaurants continued to decrease and this affected the sales of
the fresh products group. The trend was similar to the general market development in the early part of
the year in the retail trade and the professional food service sector. According to Statistics Finland, the
value of sales in the retail trade contracted 1.8 per cent in January–June and the volume 0.9 per cent
on the corresponding period in 2014. According to the Finnish Hospitality Association MaRa’s
tendency survey, published in June, the trend continued to be weak for the entire period and sales
volumes were down across the board.
Consumers remain interested in Finnish food, which was evident in the 3 per cent growth of the Apetit
Kotimainen product series in April–June compared with the comparison period in the retail trade and
the professional food service sector. The retail trade price campaigns started in the beginning of the
year continued in April–June. Consumers are favouring lower price category products more than
before, which has also reduced the value of average purchases. In the frozen foods group sales to the
retail trade have as a whole been lower than in the comparison period while sales to the professional
food service sector and the food industry were somewhat higher. In the fish products group in Finland,
sales were strongly focused on lower added value fillet products.
The Food Business’s operating profit excluding non-recurring items was lower than a year earlier and
came to EUR -2.5 (-0.1) million. The reported operating profit was EUR -1.8 (-0.1) million. Non-
recurring items amounted to EUR 0.7 (0.0) million and resulted from ownership arrangements made
with the associated company Taimen Oy. Changes in the fair value of currency hedges had an impact
of EUR -0.4 (0.1) million on the operating profit. The second quarter profit impact of the associated
company Taimen Oy was EUR 0.3 (0.4) million.
The profitability of the fish products group suffered from a sales focus on products with a lower degree
of processing. In fresh products, a decline in sales volumes weakened profitability. The profitability of
the frozen foods group was good but suffered slightly from a decline in sales. In the fish products
group profitability improved in Norway and Sweden when increased raw-material costs were
successfully transferred to customer prices. A EUR -0.3 million expense was incurred in the period
from the repair of the waste water treatment plant process equipment at the Länsi-Säkylä industrial
estate, which was damaged in the spring. The damage did not have any environmental impacts. The
insurance claims process was still underway at the end of the period.
January–June
January–June net sales in the Food Business were lower than a year earlier and amounted to EUR
82.4 (84.6) million. Sales fell in the fresh product group and in the frozen foods group on the
comparison period.
The Food Business operating profit excluding non-recurring items was lower than a year earlier and
came to EUR -4.9 (-1.5) million. The reported operating profit was EUR -4.2 (-1.5) million. Non-
recurring items amounted to EUR 0.7 (0.0) million and resulted from ownership arrangements made
with the associated company Taimen Oy. The share of the profit of the associated company Taimen
was EUR 0.0 (0.3) million.

Interim Report, 1 January – 30 June 2015 7
The Food Business employed an average of 617 (640) people.
Investment in the Food Business amounted to EUR 3.0 (0.9) million and targeted renovation and
development of production plants and facilities.
Long-term profitability programmes in the Food Business
The implementation of the long-term profitability programmes continued in January–June, generally as
planned. In the early part of the year, measures were targeted at the simplification of the operating
location structure, development of production processes and competencies and reorganisation of
purchasing and the order-delivery chain. In the first six months in the fish products group, processing
operations were focused in Kuopio and Helsinki. The facilities in Kustavi and Myrskylä have been sold.
In addition, a decision was made in the co-determination negotiations that ended in June to transfer
the production of high-volume fish products for the retail trade and the professional food service sector
from Helsinki to Kuopio as of the beginning of September. The measures to align purchasing with our
new operating unit structure have been started.
The measures of long-term profitability improvement programmes are to be carried out in stages by the
end of 2015. The aim is to reduce annual operating costs by a total of EUR -4.5 million in the fish
products group and the fresh products group in Finland. In addition, the measures are expected to
substantially increase the products’ market competitiveness. The impact of the profitability
programmes on the cost level of the Food Business in January-June was EUR -0.9 million in
comparison with the same period a year earlier.
Rescinding the cross-shareholding between Apetit Kala Oy and Taimen Oy
The corporate transaction between Apetit Kala Oy and Taimen Oy, and the cross-shareholding
incorporated within it, was dismantled on 6 May 2015. On 9 April 2015, Apetit Plc announced the
parties had agreed on rescinding the cross-shareholding and that the Finnish Competition and
Consumer Authority had granted approval on 29 April 2015. The deal was carried out in the form of a
change in holdings, without any cash compensation. Under the agreement, Taimen’s 30 per cent
holding in Apetit Kala was terminated and Apetit Kala’s 30 per cent holding in Taimen was reduced to
23.7 per cent. The rescinding of the cross-shareholding and the cancellation of the associated
redemption debt resulted in a EUR 0.7 million non-recurring income in the Food Business segment’s
other operative income.
Grains and Oilseeds Business
EUR million Q2/
2015 Q2/
2014 Change
Q1-Q2/ 2015
Q1-Q2/ 2014
Change Q1-Q4/ 2014
Net sales 59.4 55.2 +8% 109.5 102.5 +7% 214.2
Operating profit before non- recurring items
2.1 1.3 3.7 3.6 7.8
Operating profit 2.1 1.3 3.7 3.6 7.8

Interim Report, 1 January – 30 June 2015 8
Second quarter (April–June)
The second quarter net sales of the Grains and Oilseeds Business were up year on year, rising to EUR
59.4 (55.2) million. Net sales were boosted by the higher sales volume, which was some 20 per cent
higher than in the comparison period when measures in tonnes. Due to lower average prices than in
the comparison period, the growth in the segment’s net sales fell short of the volume growth. Nearly
two thirds of the grain trade consisted of exports. The delivered tonnage of unpackaged oilseed
products also grew on the previous year.
The operating profit excluding non-recurring items increased to EUR 2.1 (1.3) million. The good profit
performance was particularly due to the strong grain trade volume growth and sales growth. The
profitability of oilseed products was also up on the comparison period.
January–June
January–June net sales were up as a result of the rapid growth in delivery volumes and came to EUR
109.5 (102.5) million. Tonnage sales of oilseed products were also up on the previous year.
The January–June operating profit, excluding non-recurring items, rose to EUR 3.7 (3.6) million thanks
to the volume growth in the grain trade. The profitability of oilseed products was good but was
nevertheless below the record levels of the comparison period especially in the early part of the year.
As the harvest season gets under way, the forecast is that the European grain crop will be somewhat
smaller than last year. The latest crop forecast of Coceral, the European association representing the
trade in cereals, is 302 million tonnes. The amount of grain on the market is substantially increased by
stocks from last year, which amount to almost 40 million tonnes. At the beginning of the harvest
season the EU’s main export competitor is the Black Sea region, with the Russian and Ukrainian prices
especially dominant on the export market.
The unfavourable weather experienced in Finland in spring and early summer have affected crop
forecasts and the current yield estimate of the Natural Resources Institute Finland (LUKE) is 3.4 million
tonnes, which is 18 per cent less than in 2014. The August weather will have a significant impact on
both yield and quality, but a better picture of quality in particular will be gained only after the beginning
of the harvest. Avena has considerable experience of conducting profitable business in varying harvest
conditions and changing grain markets where grain flows vary according to yields and qualities.
The total yield of rapeseed is estimated to be up by almost 30 per cent to 78,000 tonnes. The weather
in the Baltic countries has been favourable and excellent grain and oilseed harvests are expected,
possibly even in excess of last year’s record yields.
An average of 86 (82) people were employed in the Grains and Oilseeds Business.
Investment by the Grains and Oilseeds business during the review period came to EUR 1.8 (0.2)
million and was mainly targeted at the construction of grain storage capacity and development of
infrastructure at the Inkoo port and replacements at the Kirkkonummi vegetable oil milling plant.
On 5 May 2015, Apetit announced that it will invest EUR 1.3 million in the expansion of the vegetable
oil packaging plant in Kirkkonummi. The expansion will allow further growth in the sales of packaged
vegetable oil products and will enable the range of these products to be broadened. The higher total
capacity at the packaging plant will also improve the utilisation rate of both the production process and
the oil milling plant, and thus the overall efficiency of operations. Opened at Kirkkonummi in the
second half of 2011, the vegetable oil packaging plant has exceeded the volume targets set for it.
Interim Report, 1 January – 30 June 2015 9
Construction work will begin in the autumn of 2015, and inauguration of the expanded section of the
packaging plant is scheduled for spring 2016.
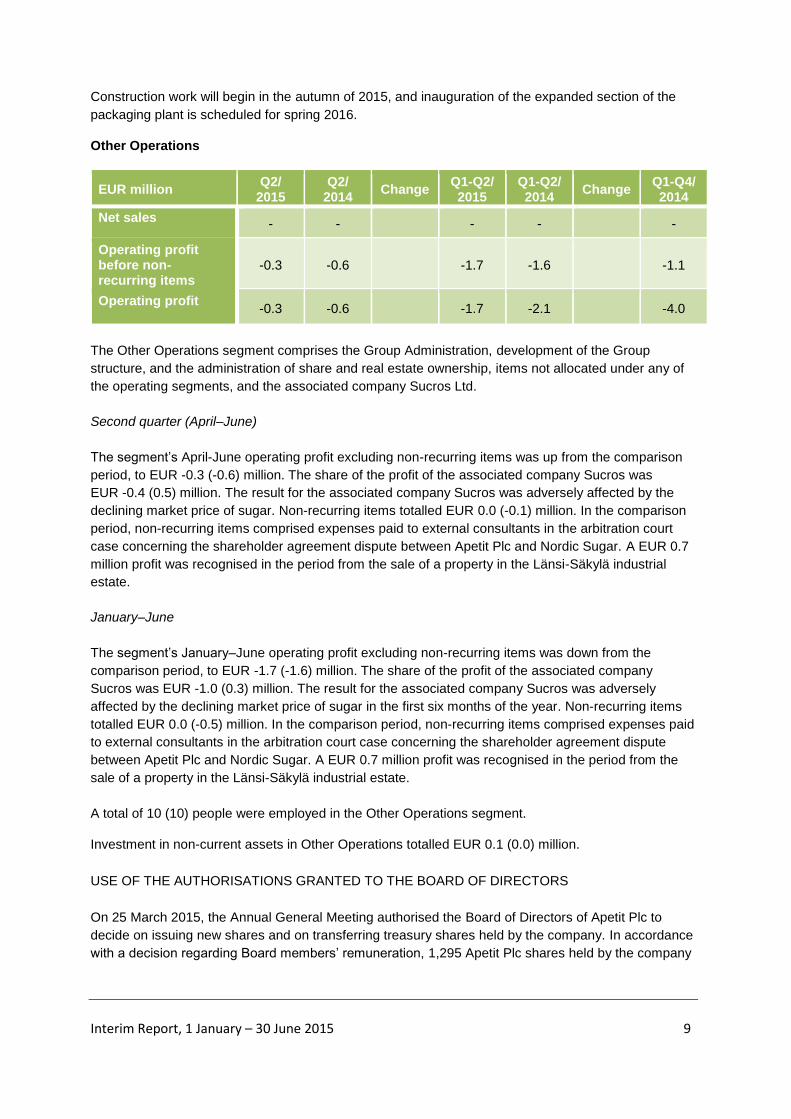
Other Operations
EUR million Q2/
2015 Q2/
2014 Change
Q1-Q2/ 2015
Q1-Q2/ 2014
Change Q1-Q4/ 2014
Net sales - - - - -
Operating profit before non- recurring items
-0.3 -0.6 -1.7 -1.6 -1.1
Operating profit -0.3 -0.6 -1.7 -2.1 -4.0
The Other Operations segment comprises the Group Administration, development of the Group
structure, and the administration of share and real estate ownership, items not allocated under any of
the operating segments, and the associated company Sucros Ltd.
Second quarter (April–June)
The segment’s April-June operating profit excluding non-recurring items was up from the comparison
period, to EUR -0.3 (-0.6) million. The share of the profit of the associated company Sucros was
EUR -0.4 (0.5) million. The result for the associated company Sucros was adversely affected by the
declining market price of sugar. Non-recurring items totalled EUR 0.0 (-0.1) million. In the comparison
period, non-recurring items comprised expenses paid to external consultants in the arbitration court
case concerning the shareholder agreement dispute between Apetit Plc and Nordic Sugar. A EUR 0.7
million profit was recognised in the period from the sale of a property in the Länsi-Säkylä industrial
estate.
January–June
The segment’s January–June operating profit excluding non-recurring items was down from the
comparison period, to EUR -1.7 (-1.6) million. The share of the profit of the associated company
Sucros was EUR -1.0 (0.3) million. The result for the associated company Sucros was adversely
affected by the declining market price of sugar in the first six months of the year. Non-recurring items
totalled EUR 0.0 (-0.5) million. In the comparison period, non-recurring items comprised expenses paid
to external consultants in the arbitration court case concerning the shareholder agreement dispute
between Apetit Plc and Nordic Sugar. A EUR 0.7 million profit was recognised in the period from the
sale of a property in the Länsi-Säkylä industrial estate.
A total of 10 (10) people were employed in the Other Operations segment.
Investment in non-current assets in Other Operations totalled EUR 0.1 (0.0) million.
USE OF THE AUTHORISATIONS GRANTED TO THE BOARD OF DIRECTORS
On 25 March 2015, the Annual General Meeting authorised the Board of Directors of Apetit Plc to
decide on issuing new shares and on transferring treasury shares held by the company. In accordance
with a decision regarding Board members’ remuneration, 1,295 Apetit Plc shares held by the company
Interim Report, 1 January – 30 June 2015 10
were transferred to the Board members on 2 June 2015. The transfer was announced in a stock
exchange release dated 2 June 2015.
SHARES AND TRADING
The number of Apetit Plc shares traded on the stock exchange during the review period was 401,278
(380,756), representing 6.4 (6.0) per cent of the total number of shares. The euro-denominated share
turnover was EUR 5.9 (7.4) million. The highest share price quoted was EUR 16.80 (21.63) and the
lowest EUR 13.35 (17.57). The average price of shares traded was EUR 14.72 (19.49).
At the end of the period, the market capitalisation totalled EUR 88.1 (111.7) million.
TREASURY SHARES
At the close of the review period, the company had in its possession a total of 124,992 (129,203) of its
own shares, with a combined nominal value of EUR 0.26 million. These treasury shares represent 2.0
per cent of the company’s total number of shares and votes.
CORPORATE ADMINISTRATION
At its organisational meeting on 16 April 2015, Apetit Plc’s Supervisory Board appointed Harri Eela as
chairman and Marja-Liisa Mikola-Luoto as deputy chairman of the Supervisory Board.
The Supervisory Board decided to elect 6 members to Apetit Plc's Board of Directors. Lasse Aho, Esa
Härmälä, Aappo Kontu, Tuomo Lähdesmäki, Veijo Meriläinen and Niko Simula were elected as
members of the Board of Directors. Veijo Meriläinen was appointed as Chairman of the Board of
Directors and Aappo Kontu as Deputy Chairman.
It was decided that the chairman of the Board of Directors will receive an annual remuneration of EUR
39,060, the deputy chairman will receive EUR 24,120 and the members EUR 19,560. A total of 50 per
cent of the annual remuneration will be paid in cash and 50 per cent in the form of Apetit Plc's shares
held by the company at the current value of the shares at the time of transfer. The remuneration will be
paid in four equal payments in euros in June, September, December and March. It was also decided
that the chairman and members of the Board of Directors will be paid a meeting allowance of EUR 510
and EUR 300, respectively.
SHORT-TERM RISKS AND UNCERTAINTIES
The most significant short-term risks for the Apetit Group are related to the management of raw-
material price changes and currency risks, the availability of raw materials, the solvency of customers,
the delivery performance of suppliers and service providers, changes in the Group’s business sectors
and in customer relationships and consumer demand, and the success of the profitability programmes
in the Food Business.
PROFIT GUIDANCE FOR 2015

Interim Report, 1 January – 30 June 2015 11
The Group’s full-year operating profit excluding non-recurring items is expected to fall short of the
previous year’s level.
Owing to the extremely challenging situation in the sugar market, the associated company Sucros,
which is part of the Other Operations segment, is anticipated to make a loss this year.
In Finland, the market situation in the food sector is expected to remain challenging, which is estimated
to affect the profitability of the Food Business in 2015 more than was earlier projected. The aim of the
long-term profitability programmes in the Food Business is to improve profitability and competitiveness.
The impact of these programmes on the operating profit is expected to be felt in stages during the year
as the measures are implemented.
In the Grains and Oilseeds Business, no major change is expected in the prospects for profitability in
2015 compared with the previous year.
Due to the substantial effect of international grain market price fluctuations on the entire Group’s net
sales, Apetit will not issue any estimates of the expected full-year net sales.
PUBLICATION DATES FOR FINANCIAL REPORTS
Apetit Plc will publish its January–September Interim Report on 30 October 2015 at 8.30 am.
Interim Report, 1 January – 30 June 2015 12
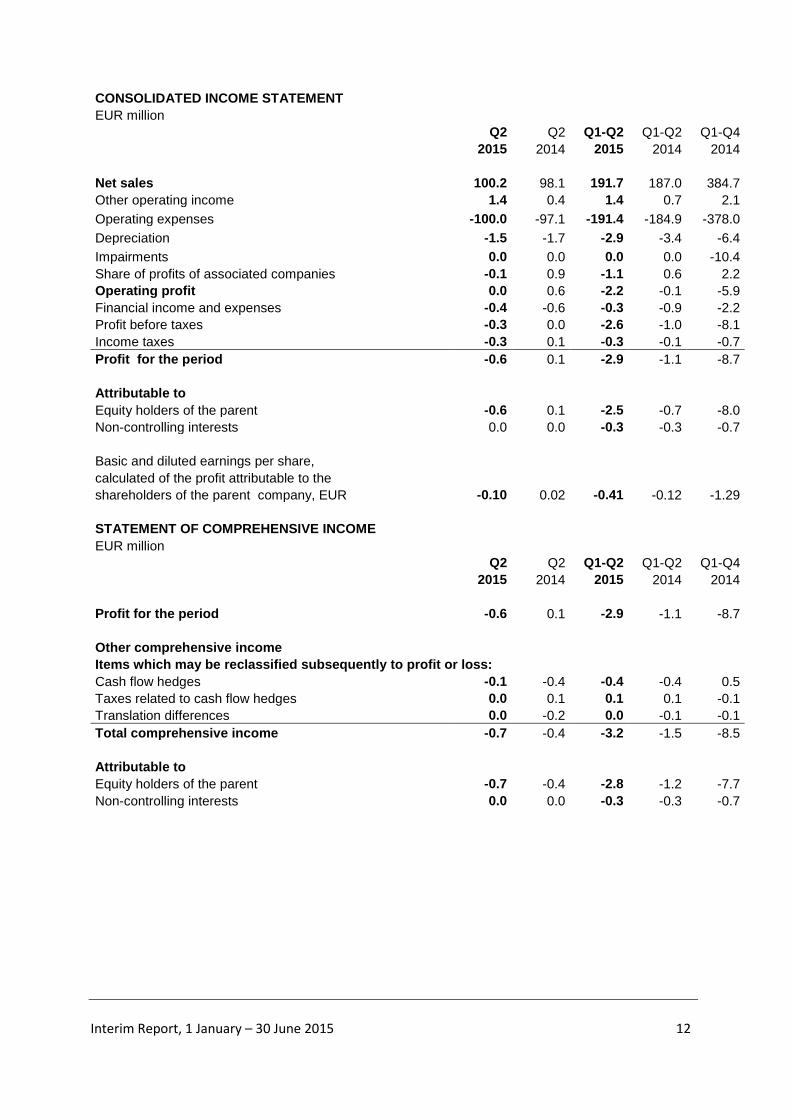
CONSOLIDATED INCOME STATEMENT
EUR million
Q2 Q2 Q1-Q2 Q1-Q2 Q1-Q4
2015 2014 2015 2014 2014
Net sales 100.2 98.1 191.7 187.0 384.7
Other operating income 1.4 0.4 1.4 0.7 2.1
Operating expenses -100.0 -97.1 -191.4 -184.9 -378.0
Depreciation -1.5 -1.7 -2.9 -3.4 -6.4
Impairments 0.0 0.0 0.0 0.0 -10.4
Share of profits of associated companies -0.1 0.9 -1.1 0.6 2.2
Operating profit 0.0 0.6 -2.2 -0.1 -5.9
Financial income and expenses -0.4 -0.6 -0.3 -0.9 -2.2
Profit before taxes -0.3 0.0 -2.6 -1.0 -8.1
Income taxes -0.3 0.1 -0.3 -0.1 -0.7
Profit for the period -0.6 0.1 -2.9 -1.1 -8.7
Attributable to
Equity holders of the parent -0.6 0.1 -2.5 -0.7 -8.0
Non-controlling interests 0.0 0.0 -0.3 -0.3 -0.7
Basic and diluted earnings per share,
calculated of the profit attributable to the
shareholders of the parent company, EUR -0.10 0.02 -0.41 -0.12 -1.29
STATEMENT OF COMPREHENSIVE INCOME
EUR million
Q2 Q2 Q1-Q2 Q1-Q2 Q1-Q4
2015 2014 2015 2014 2014
Profit for the period -0.6 0.1 -2.9 -1.1 -8.7
Other comprehensive income
Items which may be reclassified subsequently to profit or loss:
Cash flow hedges -0.1 -0.4 -0.4 -0.4 0.5
Taxes related to cash flow hedges 0.0 0.1 0.1 0.1 -0.1
Translation differences 0.0 -0.2 0.0 -0.1 -0.1
Total comprehensive income -0.7 -0.4 -3.2 -1.5 -8.5
Attributable to
Equity holders of the parent -0.7 -0.4 -2.8 -1.2 -7.7
Non-controlling interests 0.0 0.0 -0.3 -0.3 -0.7
Interim Report, 1 January – 30 June 2015 13
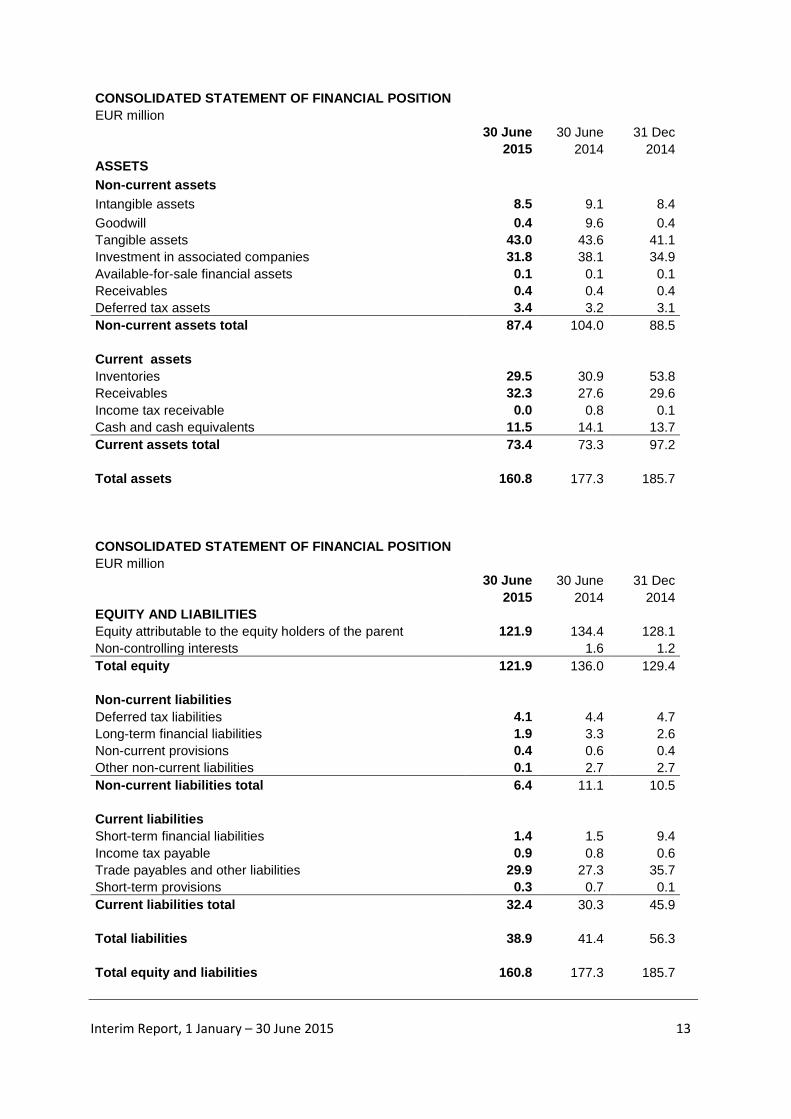
CONSOLIDATED STATEMENT OF FINANCIAL POSITION
EUR million
30 June 30 June 31 Dec
2015 2014 2014
ASSETS
Non-current assets
Intangible assets 8.5 9.1 8.4
Goodwill 0.4 9.6 0.4
Tangible assets 43.0 43.6 41.1
Investment in associated companies 31.8 38.1 34.9
Available-for-sale financial assets 0.1 0.1 0.1
Receivables 0.4 0.4 0.4
Deferred tax assets 3.4 3.2 3.1
Non-current assets total 87.4 104.0 88.5
Current assets
Inventories 29.5 30.9 53.8
Receivables 32.3 27.6 29.6
Income tax receivable 0.0 0.8 0.1
Cash and cash equivalents 11.5 14.1 13.7
Current assets total 73.4 73.3 97.2
Total assets 160.8 177.3 185.7
CONSOLIDATED STATEMENT OF FINANCIAL POSITION
EUR million
30 June 30 June 31 Dec
2015 2014 2014
EQUITY AND LIABILITIES
Equity attributable to the equity holders of the parent 121.9 134.4 128.1
Non-controlling interests 1.6 1.2
Total equity 121.9 136.0 129.4
Non-current liabilities
Deferred tax liabilities 4.1 4.4 4.7
Long-term financial liabilities 1.9 3.3 2.6
Non-current provisions 0.4 0.6 0.4
Other non-current liabilities 0.1 2.7 2.7
Non-current liabilities total 6.4 11.1 10.5
Current liabilities
Short-term financial liabilities 1.4 1.5 9.4
Income tax payable 0.9 0.8 0.6
Trade payables and other liabilities 29.9 27.3 35.7
Short-term provisions 0.3 0.7 0.1
Current liabilities total 32.4 30.3 45.9
Total liabilities 38.9 41.4 56.3
Total equity and liabilities 160.8 177.3 185.7
Interim Report, 1 January – 30 June 2015 14
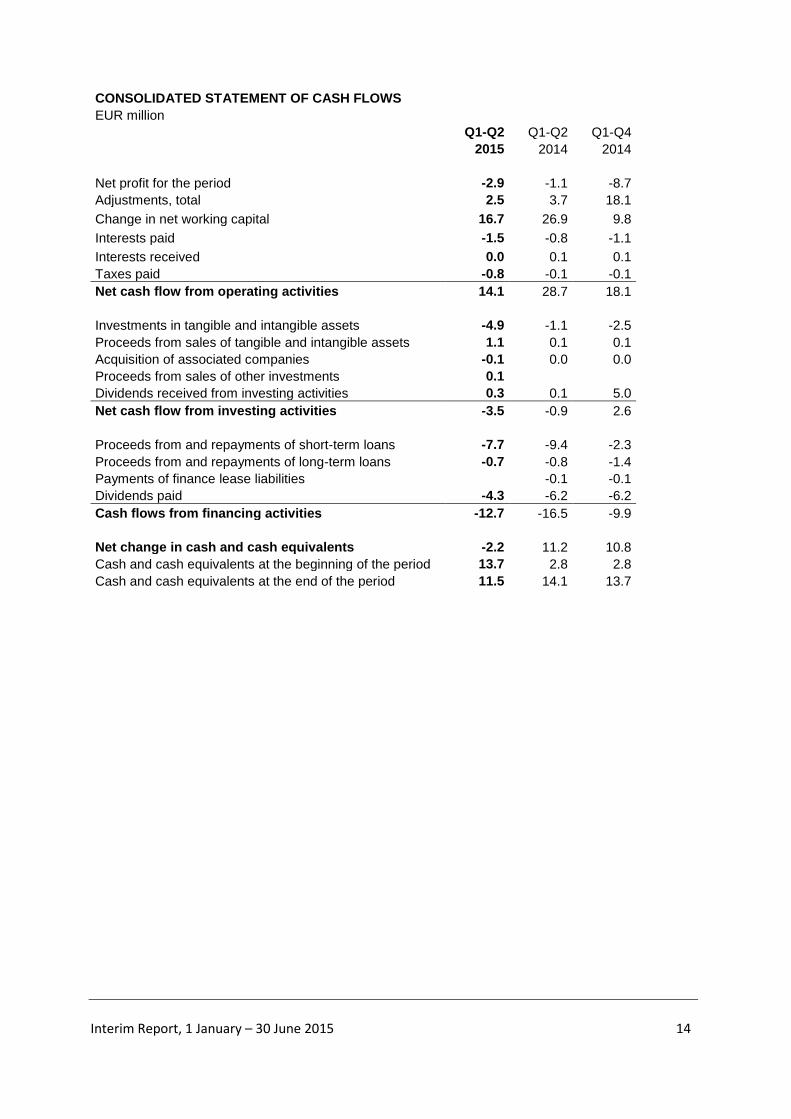
CONSOLIDATED STATEMENT OF CASH FLOWS
EUR million
Q1-Q2 Q1-Q2 Q1-Q4
2015 2014 2014
Net profit for the period -2.9 -1.1 -8.7
Adjustments, total 2.5 3.7 18.1
Change in net working capital 16.7 26.9 9.8
Interests paid -1.5 -0.8 -1.1
Interests received 0.0 0.1 0.1
Taxes paid -0.8 -0.1 -0.1
Net cash flow from operating activities 14.1 28.7 18.1
Investments in tangible and intangible assets -4.9 -1.1 -2.5
Proceeds from sales of tangible and intangible assets 1.1 0.1 0.1
Acquisition of associated companies -0.1 0.0 0.0
Proceeds from sales of other investments 0.1
Dividends received from investing activities 0.3 0.1 5.0
Net cash flow from investing activities -3.5 -0.9 2.6
Proceeds from and repayments of short-term loans -7.7 -9.4 -2.3
Proceeds from and repayments of long-term loans -0.7 -0.8 -1.4
Payments of finance lease liabilities -0.1 -0.1
Dividends paid -4.3 -6.2 -6.2
Cash flows from financing activities -12.7 -16.5 -9.9
Net change in cash and cash equivalents -2.2 11.2 10.8
Cash and cash equivalents at the beginning of the period 13.7 2.8 2.8
Cash and cash equivalents at the end of the period 11.5 14.1 13.7

Interim Report, 1 January – 30 June 2015 15
STATEMENT OF CHANGES IN SHAREHOLDERS´EQUITY
A = Shareholders' equity at 1 January
B = Dividend distribution
C = Transactions with NCI
D = Other changes
E = Total comprehensive income
F = Shareholders' equity at 30 June
January - June 2015
EUR million
A B C D E F
Share capital 12.6 12.6
Share premium account 23.4 23.4
Net unrealised gains 0.2 -0.3 -0.1
Other reserves 7.2 7.2
Own shares -1.7 0.0 -1.7
Translation differences -0.5 0.0 -0.4
Retained earnings 86.8 -4.3 0.9 0.1 -2.5 80.9
Attributable to equity holders of the parent 128.1 -4.3 0.9 0.1 -2.8 121.9
Non-controlling interests (NCI) 1.2 -0.9 -0.3
Total equity 129.4 -4.3 0.1 -3.2 121.9
January - June 2014
EUR million
A B C D E F
Share capital 12.6 12.6
Share premium account 23.4 23.4
Net unrealised gains -0.2 -0.3 -0.5
Other reserves 7.2 7.2
Own shares -1.8 0.0 -1.8
Translation differences -0.3 -0.1 -0.4
Retained earnings 100.7 -6.2 0.0 0.0 -0.7 93.8
Attributable to equity holders of the parent 141.7 -6.2 0.0 0.1 -1.2 134.4
Non-controlling interests (NCI) 1.9 0.0 -0.3 1.6
Total equity 143.6 -6.2 0.0 0.1 -1.5 136.0
BASIS OF PREPARATION AND ACCOUNTING POLICIES
The Interim report has been prepared in accordance with IAS 34, Interim Financial Reporting, as adopted by the EU. The accounting policies adopted are consistent with those of the Group's annual financial statements for the year ended 31 December 2014. New standards and interpretations adopted in 2015 have not had material effect to the interim report.

Interim Report, 1 January – 30 June 2015 16
SEGMENT INFORMATION
A = Food Business
B = Grains and Oilseeds Business
C = Other Operations
D = Total
Operating segments,
January - June 2015
EUR million
A B C D
Total segment sales 82.4 109.5 191.9
Intra-group sales -0.1 -0.1 -0.2
Net sales 82.4 109.4 191.7
Share of profits of associated companies
included in operating profit 0.0 -1.0 -1.1
Operating profit -4.2 3.7 -1.7 -2.2
Gross investments in non-current assets 3.0 1.8 0.1 4.9
Corporate acquisitions and other
share purchases 0.1 0.1
Depreciations 2.4 0.3 0.1 2.9
Impairments 0.0 0.0
Personnel 617 86 10 713
Operating segments,
January - June 2014
EUR million
A B C D
Total segment sales 84.6 102.5 187.1
Intra-group sales -0.1 0.0 -0.1
Net sales 84.5 102.5 187.0
Share of profits of associated companies
included in operating profit 0.3 0.3 0.6
Operating profit -1.5 3.6 -2.1 -0.1
Gross investments in non-current assets 0.9 0.2 0.0 1.1
Corporate acquisitions and other
share purchases 0.0 0.0
Depreciations 2.9 0.4 0.1 3.4
Impairments 0.0 0.0
Average number of personnel 640 82 10 731

Interim Report, 1 January – 30 June 2015 17
Operating segments,
January - December 2014
EUR million
A B C D
Total segment sales 170.8 214.2 385.0
Intra-group sales -0.2 -0.1 -0.3
Net sales 170.6 214.1 384.7
Share of profits of associated companies
included in operating profit 0.3 1.9 2.2
Operating profit -9.7 7.8 -4.0 -5.9
Gross investments in non-current assets 1.9 0.5 0.1 2.5
Corporate acquisitions and other
share purchases 0.0 0.0
Depreciations 5.4 0.7 0.3 6.4
Impairments 10.4 10.4
Average number of personnel 630 83 10 723
KEY INDICATORS
30 June 30 June 31 Dec
2015 2014 2014
Shareholders' equity per share, EUR 19.70 21.71 20.70
Equity ratio, % 75.8 76.7 69.7
Gearing, % -6.7 -6.9 -1.3
Gross investments in non-current assets, EUR million 4.9 1.1 2.5
Corporate acquisitions and other share purchases, EUR million
Average number of personnel 713 731 723
Average number of shares, 1,000 pcs 6191 6188 6188
The key figures in this Interim Report are calculated with same accounting principles than presented in the 2014 annual financial statements.

Interim Report, 1 January – 30 June 2015 18
COLLATERALS, CONTINGENT LIABILITIES,
CONTINGENT ASSETS AND OTHER COMMITMENTS
EUR million
30 June 30 June 31 Dec
2015 2014 2014
Mortgages given for debts
Real estate and corporate mortgages 1.4 1.6 1.5
Guarantees 11.0 9.0 9.1
Non-cancellable other leases, minimum lease payments
Real estate leases 6.0 8.4 6.7
Other leases 0.9 1.1 0.9
DERIVATIVE INSTRUMENTS
Outstanding nominal values of derivate instruments
Interest rate swaps 2.4 3.6 3.0
Forward currency contracts 9.4 7.0 8.3
Commodity derivative instruments 20.5 15.9 14.7
CONTINGENT ASSETS
The present value of proceeds from the sale of
shares in the joint entry account 0.7 0.7 0.7
INVESTMENT COMMITMENTS
Food Business 1.2
Grains and Oilseeds Business 0.3
CHANGES IN TANGIBLE ASSETS
EUR million
30 June 30 June 31 Dec
2015 2014 2014
Book value at the beginning of the period 41.1 45.8 45.8
Additions 4.4 0.7 1.9
Disposals -0.2 -0.1 -0.4
Disposals of subsidiaries -0.2
Depreciations and impairments -2.4 -2.7 -6.0
Other changes 0.1 -0.1 -0.2
Book value at the end of the period 43.0 43.6 41.1
Interim Report, 1 January – 30 June 2015 19
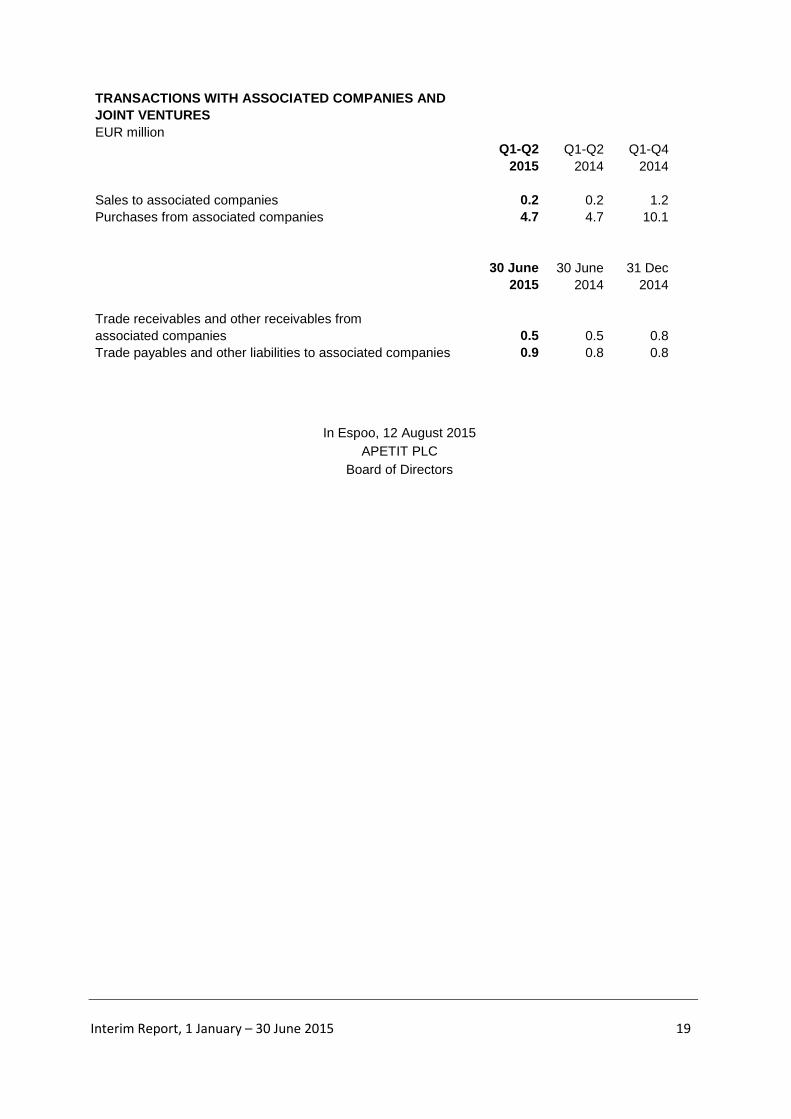
TRANSACTIONS WITH ASSOCIATED COMPANIES AND
JOINT VENTURES
EUR million
Q1-Q2 Q1-Q2 Q1-Q4
2015 2014 2014
Sales to associated companies 0.2 0.2 1.2
Purchases from associated companies 4.7 4.7 10.1
30 June 30 June 31 Dec
2015 2014 2014
Trade receivables and other receivables from
associated companies 0.5 0.5 0.8
Trade payables and other liabilities to associated companies 0.9 0.8 0.8
In Espoo, 12 August 2015
APETIT PLC
Board of Directors
Related Documents