FR ese por r c Department of Applied Economics and Statistics • College of Agriculture and Natural Resources • University of Delaware APEC Research Reports March 2014 APEC RR14-05 Working paper on Conservation Professional Attitudes about Cost Effectiveness of the Land Preservation: A Case Study in Maryland Kent Messer William Allen Maik Kecinski Yu Chen APPLIED ECONOMICS & STATISTICS

Welcome message from author
This document is posted to help you gain knowledge. Please leave a comment to let me know what you think about it! Share it to your friends and learn new things together.
Transcript

1
1
FREC
R esearc
h Reports
Depa
rtment
of Food
a ndRe
s
ou
rc e E c onomic
s • Coll
e geof Ag ric ulture
a nd
Natu ra l Res
our ces•
Departm
ent of Applied Econom
ics and Statistics •
College of A
griculture and Natural R
esources • University of D
elaware
APEC
Research R
eports March 2014 APEC RR14-05
Working paper on
Conservation Professional Attitudes about Cost Effectiveness of the Land
Preservation: A Case Study in Maryland
Kent Messer William Allen Maik Kecinski
Yu Chen
APPLIED
ECONOMICS
& STATISTICS

1
Conservation Professional Attitudes about Cost Effectiveness of the Land Preservation: 1
A Case Study in Maryland 2
3
4
5
Kent D. Messera,*, William L. Allen IIIb, Maik Kecinskia, Yu Chena 6
a University of Delaware, Department of Applied Economics and Statistics, 213 Townsend Hall, 7 Newark, DE 19716-2130, United States 8
b The Conservation Fund, 410 Market Street, Suite 360, Chapel Hill, NC 27516, United States 9
* Corresponding Author. Phone: +1 302-831-1316. Email: [email protected] 10
11
12
Abstract 13
A consensus exists amongst academics that cost-effective land preservation should involve benefits 14 and costs. In reality, the vast majority of conservation programs are not cost-effective, i.e. lower 15 conservation benefits are achieved for the limited funding. Little research has been conducted about 16 the attitudes of conservation professionals about the importance of being cost-effective and little is 17 known about how conservation professionals believe that they can become more cost-effective. 18 This study reports on a survey conducted with conservation professionals associated with the State 19 of Maryland’s agricultural protection program, a leading program in the United States. Results 20 suggest that while conservation professionals are generally in favor cost-effective conservation, it is 21 not a top goal for them. Processes such as transparency and fairness are rated more important. This 22 research shows how the willingness of administrators to adopt mathematical programming 23 techniques is significantly influenced by knowledge of optimization technique, administrative 24 requirements, cost concerns, percentage of agricultural land previously preserved in the county, how 25 rural the county is, and lack of incentive for administrators to adopt cost-effectiveness techniques. 26 This finding is important to understand the lack of adoption of cost-effective techniques. Results 27 also suggest that adoption may be enhanced with the availability of software and training. 28
Keywords: Land conservation, Survey, Conservation professionals, Optimization, Attitudes, 29 Willingness to adopt 30
31
2
1. Introduction 32
Agricultural land preservation involved involves responsible management of public funds to acquire 33
the greatest benefits given the limited amount of money available to conservation programs. For 34
agricultural preservation programs to deliver the greatest ‘bang for the buck’, it is critical to establish 35
a robust decision support framework that can be used to reliably and consistently evaluate and select 36
potential preservation opportunities. Integrating economic costs into conservation planning is a key 37
to ensuring better conservation outcomes (Naidoo et al., 2006). When trying to select the most 38
cost-effective mix of conservation projects, it is important to determine overall quality based on 39
benefit and costs rather than with an analysis strictly of either benefits or costs (Babcock et al., 1997; 40
Hughey et al., 2003; Perhans et al., 2008). 41
Studies have shown that using optimization in conservation programs can yield significantly more 42
acreage with higher overall conservation benefits (e.g. Messer, 2006; Duke et al., 3013). 43
Unfortunately, cost-effective conservation is rarely implemented. Instead, most conservation 44
programs use a rank-based model, called benefit-targeting (BT), selecting projects with the highest 45
benefit scores with little consideration of the project’s cost. In situations where numerous high 46
quality projects go unfunded due to budget constraints, BT ensures only that the available resources 47
are spent on the highest ranked projects; however, the model frequently misses opportunities to 48
spend the money in a cost-effective way by funding lower-cost, high-benefit alternatives that would 49
extend limited financial resources and maximize overall conservation benefits (Allen et al., 2010). 50
In contrast, an optimization model identifies the set of cost-effective projects that maximize 51
aggregate benefits by using data describing the resource benefits of the potential projects and relative 52
priority weights assigned to each benefit measure, as well as estimated project costs and budget 53
constraints (Kaiser and Messer, 2011). Thus, optimization can help decision makers distinguish 54

3
between high-cost projects that can rapidly deplete available funds while making relatively small 55
contributions to overall conservation goals and “good value” projects that ensure that conservation 56
benefits are maximized given the available budget (Amundsen et al., 2010). An important difference 57
between BT and optimization is the sequence of the selection process. While BT selects the top 58
parcel with the highest benefits first, followed by the parcel with the second highest benefits and so 59
on, optimization focuses on the total benefits of the pool of potential projects. 60
In Maryland, a leader in agricultural preservation in the United States1, the Maryland Agricultural 61
Land Preservation Foundation (MALPF), established guidelines for agricultural preservation and 62
relies on Land Evaluation/Site Assessment (LESA) models to help improve investments in 63
agricultural preservation. Baltimore County had also relied upon a LESA model for evaluating 64
parcels for conservation. In 2006, however, Baltimore County staff introduced optimization in their 65
applicant selection process as a pilot project. For the next three years, Baltimore County staff and 66
advisory board evaluated applications for preservation using optimization. The county evaluated 67
their applications over a series of grant cycles tied to different fund sources for 2007, 2008, and 2009 68
including both state and county funding rounds. 69
In 2007, Baltimore County used optimization in two different selection processes: (i) to select 70
projects totaling 809 acres for protection given the $4.8 million of funding by MALPF and (ii) to 71
select projects totaling 882 acres for protection given the $3 million of funding from Baltimore 72
County. If LESA-based BT had been employed, Baltimore County would have only protected 733 73
acres for the $4.8 million of MALPF funds and 651 acres for the $3 million of funding from 74
Baltimore County. In other words, using optimization in 2007, Baltimore County protected 1,691 75
acres instead of just 1,384 acres, a 22% increase worth an estimated $1.8 million. 76 1 Maryland ranks 3rd in terms of federal funding for easement acquisition and technical assistance for the period 1996-‐2009 (FIC, 2013).
4
Given its initial success in preserving substantially more conservation benefits, Baltimore County 77
continued applying optimization to its selection processes in 2008 and 2009. In total over the first 78
three years of use, optimization helped Baltimore County protect an additional 680 acres of high-79
quality agricultural land at a cost savings of approximately $5.4 million (Kaiser and Messer, 2011). 80
Baltimore County serves as an example that optimization tools, when implemented, can help 81
conservation professionals preserve more land and more conservation benefits at the same level of 82
funding. So, why is BT the tool of choice of conservation professionals in almost all conservation 83
programs? and what may change planner’s willingness to apply optimization to their respective 84
programs? In order to understand why conservation professionals have not adopted optimization 85
we set out to understand planners’ attitudes towards optimization. 86
We show that while conservation professionals are generally in favor of being cost-effective, cost-87
effectiveness is not a top goal for them. Our results suggest that the more administrators know 88
about optimization, the less concern they have for it. Similarly, the results suggest that the higher 89
the administrators’ understanding of optimization, the higher their willingness to adopt it. 90
Additionally, the more successful administrators, in terms of previously preserved farmland as a 91
percentage of total farmland available, are more willing to adopt more advanced approaches. 92
Furthermore, metro areas that are experiencing particularly strong development pressures are more 93
willing than non-metro areas to step up their efforts by adopting “sophisticated” but cost-effective 94
preservation techniques. 95
Our results also suggest that the initial investment in technical resources related to using 96
optimization has prevented program administrators from using optimization. Many administrators 97
report that the current system lacks incentives to adopt optimization. Providing software and 98
training on optimization significantly increases administrators’ willingness to adopt this optimization. 99

5
100
2. Literature Review 101
The loss of farmland and forestland to development as a result of population change increases the 102
importance of cost-effective conservation (Kline, 2006; Lynch, 2008; Fooks and Messer, 2012). 103
Limited funding typically restricts the effectiveness of conservation programs at providing public 104
benefits. At the same time, this may also render efficiency impossible to achieve as the socially 105
optimal solution may lie outside the bounds of the budget constraint, i.e. it restricts the set of 106
feasible solutions. Hence, in order to ensure responsible use of public money, it is cost-effective 107
conservation that ensures the largest amount of conservation benefits. Great effort has been put 108
into development of theories and techniques to increase the effectiveness of conservation programs. 109
Given the substantial amount of money that is spent on land conservation - the U.S. Farm Bill 110
covering the period 2008-2012 allocated $13 billion to land retirement programs (Duke et al., 2013) 111
and the federal farm and ranch lands protection program reports that approximately $1.2 billion had 112
been spent on agricultural protection by the end of 2012 (see FIC, 2013) - many studies within the 113
economic literature have identified and measured the benefits of farmland preservation (Gardner, 114
1977; Kline and Wichelns, 1996; Rosenberger, 1998; Duke and Hyde, 2002; Johnston and Duke, 115
2007; Johnston and Duke, 2009). 116
In particular, Duke and Hyde, 2002 suggested that providing locally grown food, keeping farming as 117
a way of life, and protecting water quality were the top three attributes sought by the public from 118
preserved land, while protecting agriculture as an important industry, preserving natural places, and 119
providing breaks in the built environment received the least support. Although there may exist 120
public support in favor of agricultural preservation and clearly identified benefits from conservation, 121
6
studies have largely neglected to consider the needs and attitudes of conservation professionals who 122
make conservation decisions on the public’s behalf. 123
Duke and Lynch, 2007 report that, although, there are many studies that focus on the general 124
public’s preferences of preserving farmland, only a few studies focus on what type of techniques 125
may be considered acceptable and effective to policy makers, administrators, and landowners. The 126
authors found that “rights of first refusal” (ROFR) as described in Malcolm et al., 2005, which gives 127
conservation programs the option to match offers landowner receive from developers, was ranked 128
as the most preferred amongst all three groups. Thus, before landowners can sell parcels to 129
developers, conservation programs must be given the opportunity match the offer ensuring that no 130
funds are spent on parcels that may not be developed to begin with. According to Duke and Lynch, 131
ROFR should be cost-effective as it only targets land actually threatened by development. 132
Others have developed methods that help conservation professionals in their decision-making 133
process. Messer, 2006 showed that cost-effective conservation (CEC) instead of the commonly used 134
approach of benefit-targeting yields substantially higher social benefits. In Messer and Allen, 2010, 135
CEC, using binary linear programming, preserves more parcels of land at higher social net benefits 136
than either sealed-bid-offer auction or benefit-targeting given the same budget (see also Babcock et 137
al., 1997; Polasky et al., 2001). 138
In reality, however, the lessons suggested in the economic literature are rarely implemented (Duke et 139
al. 2013, Predergast et al., 1999; Lynch, 2008). Given the advantages that CEC offers, what are the 140
reasons that optimization is rarely implemented by planners? Prendergast et al. (1999) argued that 141
the main reason for the low level of adoption of these sophisticated tools is a lack of awareness of 142
their existence. Additionally, insufficient funding, lack of understanding, and antipathy towards 143
“prescriptive” decision tools exist. Closing the gap between researchers and practitioners by 144
7
facilitating communication and making, often times, costly and scattered literature (Finch and 145
Patton-Mallory, 1992) available may be crucial to overcome these issues. Additionally, workshops 146
and training may also help resolve antipathy and relax preconceived fears of theoretical models and 147
stimulate learning between researchers and practitioners (Ferraro and Pattanayak, 2006; Salafsky et 148
al. 2002). 149
Moreover, conservation professionals face numerous political and strategic difficulties (Fooks and 150
Messer, 2012) as they receive funding from a multitude of sources, some private, others public, 151
expecting their interest in land preservation presented accordingly. This may mean that conservation 152
professionals need not only consider total benefits preserved, but also whether each group’s funding 153
achieved a fair share in the overall benefits. This confronts the optimization model with 154
considerable challenges. Fooks and Messer (2012) note that these may be thought of as secondary 155
objectives. Nonetheless, they do impact conservation professionals in their decision-making process. 156
Perhaps the first comprehensive synthesis paper of a broad methodological review for conservation 157
professionals seeking to adopt CEC was provided by Duke et al. 2013. In particular, they suggest 15 158
practical lessons, drawn from theory and applied conservation in the U.S., meant to guide 159
conservation professionals in an attempt to close the gap between theorists and administrators. The 160
authors identify 5 groups into which the 15 practical lessons can be grouped: Optimal selection, 161
benefits, costs, budgets, and incentive problems. While Duke et al., 2013 lay out a well-structured 162
and comprehensive manuscript outlining the issues related to adopting CEC, our experimental 163
survey approach reports on the attitudes collected from conservation professionals in Maryland, 164
identifying specific factors that impact their willingness to adopt optimization as their primary 165
selection process and what can be done to increase adoption of optimization. This may be a natural 166

8
extension to the target areas summarized by Duke et al., 2013 and help further close the gap 167
between researchers and practitioners. 168
169
3. Research Methods 170
The research approach includes the survey design, the pre-test of the survey, the revision process, 171
the administration of the survey, and the follow-up procedure. A critical series of questions in the 172
survey were related to the concept of optimization of the project selection process. The survey then 173
asks for opinions about two different optimization approaches. One approach is called “Binary 174
Linear Programming,” which is the assured optimal algorithm common in the operations research 175
literature (see Kaiser and Messer, 2011). The other approach called “Cost Effectiveness Analysis,” 176
which is commonly used in the medical field to determine the treatments that yield the highest 177
health benefits given the expenditure. Our objective with the survey is three-fold. 178
1. Identify the conservation program’s selection criteria in each county and how benefit 179
factors and cost assessments are measured. 180
2. Identify the administrator’s willingness to adopt optimization as a selection process and 181
compare the feasibility of optimization techniques. 182
3. Identify obstacles to adopting optimization and the severity of the obstacles. 183
Two survey instruments were used, a pre-survey and a post-survey (Appendix A). The five-part pre-184
survey was conducted before educational material about optimization was presented. The six-part 185
post-survey was conducted after an educational presentation on optimization was given. Both pre- 186
and post-survey underwent extensive pre-testing before implementation. 187
9
After the five-part pre-survey was completed the educational presentation on optimization was 188
given. It was explained how the approach performs, how to implement it, and what are the potential 189
benefits from its implementation. Additionally, a comparison of binary linear programming (BLP) 190
and cost-effectiveness analysis (CEA) was presented. 191
The participants in the survey were all conservation professionals from Maryland counties. As there 192
are 23 counties, we used several different approaches to survey them. On November 19, 2009, 193
MALPF held an annual conference in Annapolis, Maryland, for all county administrators. 194
Representatives from 12 counties attended the meeting. Another five county representatives used 195
video conference software to participate. Pre-surveys and materials for the optimization presentation 196
were prepared for each seat before the meeting. In total, twenty-three pre-survey questionnaires 197
were collected, 18 from administrators and staff members of the 12 counties at the meeting, one 198
from a county using video conference software, one from a MALPF board member, and three from 199
MALPF staff members. 200
Based on Dillman’s (1978) total design survey method, our post-survey used a variety of 201
follow-up attempts that included emails, written letters, telephone calls, prepaid return envelopes, 202
and a mailing of the survey accompanied by a DVD with a Powerpoint file containing the 203
presentation given at the meeting. The initial response rate after the November 19 MALPF meeting 204
was 52.2% and rose to 65.2% upon the first email reminder. A series of phone calls and follow-up 205
reminders brought the response rate to 91.3% and, finally, a shortened survey (Appendix B) that 206
focused on the key research questions addressed in this research brought the response rate up to 207
100%. 208
4. Results 209
10
The results from the pre-survey indicate that the surveyed participants had a high level of 210
conservation knowledge. For example, the average working experience of participants was 11.9 211
years with participants having spent an average of 8.3 years in the current position. Participants also 212
reported a high degree of knowledge of the MALPF program and their counties’ agricultural 213
preservation program. On a scale of 1 (low) to 5 (high), 29 county representatives reported an 214
average score of 4.0 for MALPF’s program and 4.4 for their county programs. 215
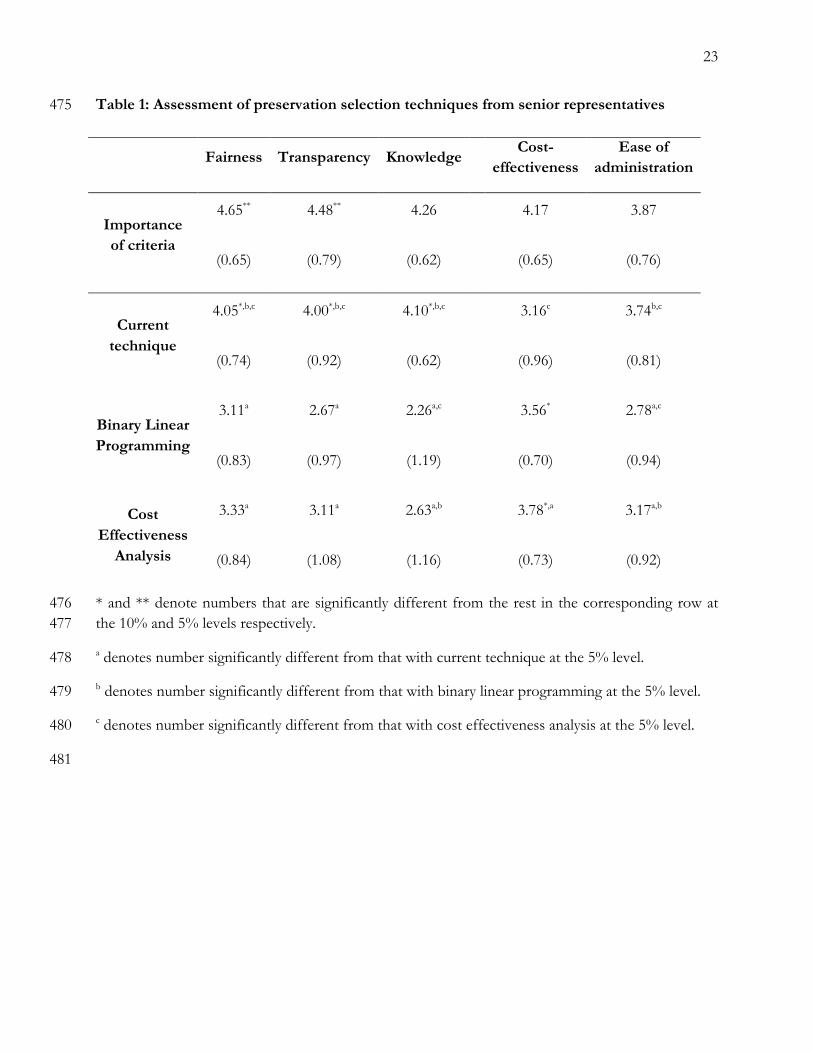
Several questions sought to measure how important various attributes of the selection process are to 216
the administrators. Five attributes of the processes were considered: knowledge, fairness, 217
transparency, cost-effectiveness and ease of administration. The importance of each attribute is 218
measured on a scale of one to five with one standing for not important, three for somewhat 219
important, five for very important, and two and four between. Statistical results from responses by 220
the 23 senior representatives show that fairness of the selection process is valued most. Table 1 221
shows fairness was the attribute that received the highest average score (4.65) followed by 222
transparency of the process, which also ranked very important (4.48). While not statistically different 223
from one another, these two factors were statistically more important than the other three attributes. 224
Interestingly, participants were aware that the current MALPF programs did not secure the best 225
deals available for land conservation. Given six different criteria by which to rate the effectiveness 226
of the MALPF program, acquiring the best deals scored lowest with a score of just 2.76 (Figure 1). 227
The six criteria were as follows: 228
Max agland Maximize the number of agricultural acres protected. 229
Max open space Maximize the open space quality of acres protected. 230
Protect soil Protect the best agricultural land in terms of soil. 231
Protect large blocks Preserve large blocks of contiguous agricultural land. 232
Best deals Acquire the best deals on agricultural land. 233

11
Incentives to farm Increase incentives for participants to remain in farming. 234
This finding is consistent with the results reported in Table 1, which showed that the current 235
techniques scored lowest with regards to cost effectiveness (3.16 out of 5). Figure 1 also shows that 236
administrators believe that their programs are doing reasonably well at protecting soil (4.10 out of 5) 237
and protecting large blocks of agricultural lands (4.05 out of 5). 238
Several of the survey questions evaluated the potential obstacles for adopting optimization as a 239
selection process. The survey listed eight obstacles and asked participants to assess the difficulty 240
each one presented on a scale of one to five in which one signified “not difficult at all,” three 241
signified “somewhat difficult,” and five signified “very difficult.” The eight obstacles were as 242
follows: 243
Lack_expr Lack of previous experience. 244
Admin Administration of the process. 245
Int_cost Protect the best agricultural land in terms of soil. 246
Time Time to implement the process. 247
Costinfo Need for cost information at the time of selection. 248
Lack_tech Lack of availability of technical resources. 249
Lack_incen Lack of incentives to justify a change in process. 250
Forgobest Possibly forgoing the “best” land regardless of cost. 251
252
We show in Figure 2 that all eight obstacles received a mean score of approximately 3, suggesting 253
that that no single problem was seen as impossible to overcome and that no single obstacle was seen 254
as more important to overcome than others. The survey results also showed that participants were 255
not familiar with optimization before the educational presentation. However, after the presentation, 256
there was a significant increase in understanding of optimization. The average score for optimization 257

12
knowledge before the presentation was 2.4 and rose to 3.7 after the presentations (Figure 3). This 258
finding complements the earlier finding from the statistical model that indicates that a better 259
understanding of optimization increases the willingness to adopt it. 260
In the post-survey, several questions were related to the evaluation of whether people would be 261
more willing to adopt optimization if additional resources, such as optimization software and 262
training, are offered. Our results show that when access to optimization software was offered, 263
willingness rose to 3.3, a 10% increase and significantly different from the previous value of 3.0. 264
When both access and training were offered, willingness to adopt optimization increased to 3.5, a 265
statistically significant 16.7% increase (Figure 4). 266
Respondents reported that the initial cost of training and software associated with optimization were 267
obstacles preventing adoption. This variable likely captures concerns both about the cost of the 268
technology, but also the limited budgets that were affecting all levels of government in Maryland in 269
2009-2010. County administrators also cited the lack of incentives as a key reason for the lack of 270
adoption. Although optimization techniques are widespread in the business sector, traditionally the 271
use of these approaches in government and non-profit sectors has lagged. This may suggest that the 272
reason for the lack of adaptation in government and non-profits is the lack of direct financial 273
incentives for staff to alter the status quo. Furthermore, the greater the percentage of agricultural 274
land the county has preserved, the more willing the county staff is to adopt optimization. A possible 275
explanation may be that counties with greater percentages of preserved agricultural land may have 276
larger budgets and more experienced employees, which would provide them with more resources 277
both financially and technically. 278
The following section explores the answer to the central question: Why is optimization rarely 279
adopted by conservation professionals? Using data collected from the post-survey, an ordered probit 280

13
model is applied to analyze the relationships between willingness to adopt optimization and the 281
regressors. As such, the ordered probit model analyzes factors that potentially influence a program 282
administrator’s decision to adopt optimization as a selection approach. The data set is comprised of 283
27 observations from administrators and senior staff members from every county in Maryland 284
except Baltimore County (due to their previous experience and implementation of CEC). In total 22 285
data point were considered in the regression model (5 were excluded due to missing information). 286
The dependent variable WILLING represents the willingness of administrators to adopt 287
optimization as the selection process for agricultural land preservations in the future and was 288
collected from question 11 in the post-survey. WILLING is measured on a scale of one to five, with 289
1 meaning “not willing to adopt optimization at all” and 5 meaning “very willing to adopt 290
optimization.” 291
The regressors in the ordered Probit model are OPKNOW, LACK_EXPR, ADMIN, INT_COST, 292
LACK_INCEN, PCT_PRESV, and RURALITY. Five of these independent variables are measured 293
on a scale of one to five by the post-survey. OPKNOW is rated by responses to question 10 of the 294
post-survey. It describes the respondents’ level of knowledge and understanding of the optimization 295
method after a presentation on optimization, with 1 meaning “does not understand optimization at 296
all” and 5 “understanding optimization very well.” 297
LACK_EXPR, ADMIN, INT_COST, and LACK_INCEN represent data gathered by questions 12, 298
13, 14, and 18 in the post-survey. These factors describe potential obstacles to adopting 299
optimization as the selection process. LACK_EXPR is lack of previous experience in applying 300
optimization. ADMIN is the administrative requirements of the process. INT_COST is the initial 301
technical cost for staff training and software. LACK_INC is a lack of incentive to justify a change in 302
14
process. Respondents rated the difficulties presented by these obstacles on a scale of one to five, 303
with 1 meaning “not difficult at all” and 5 meaning “very difficult.” 304
PCT_PRESV is the percentage of total agricultural land preserved by individual counties from 2002 305
to 2007. The amount of farmland preserved was collected from MALPF’s 2002-2007 annual report. 306
Information on the total number of acres of farmland in Maryland in 2007 was collected from the 307
2007 Census of Agriculture collected by the U.S. Department of Agriculture’s (USDA’s) National 308
Agricultural Statistics Service, thus, PCT_PRESV = Acres of Preserved Agricultural land ÷ Acres of Total 309
Agricultural land. 310
RURALITY is a measure of how rural a county is using data derived from urban influence codes 311
(UIC) formulated by USDA’s Economic Research Service (ERS). It is one of three widely accepted 312
rural classification systems. Based on the concepts of central place theory in regional economics, 313
these codes were developed to account for factors such as population size, urbanization, and access 314
to larger economies (Parker, 2007). However, the urban influence coding structure does not reflect a 315
continuous decline in urban influence. Therefore, RURALITY cannot be used to explain the 316
relationship between urban influence and program administrators’ willingness to adopt optimization. 317
Rather, the relationship provides a legitimate assumption that adjacency to metro areas brings a 318
strong development threat to agricultural lands and triggers motivation among administrators to 319
improve their selection techniques and processes. We, therefore, used the 2003 urban influence 320
codes that categorize counties as metropolitan or non-metropolitan. Metropolitan counties are then 321
divided into two groups by the size of the metro area. Non-metropolitan counties are located 322
outside of the boundaries of metro areas and are further subdivided into two types: micropolitan 323
areas, which are defined as centered on urban clusters of 10,000 or more persons, and all remaining 324
“noncore” counties. Micropolitan counties fall into one of three groups that are defined by 325

15
adjacency to urban areas while noncore counties are divided into seven groups based on their 326
adjacency to metro or micro areas and whether they have their “own town” of at least 2,500 327
residents (Cromartie, 2007) (See Table 2). 328
Table 3 displays the regression results. Six of the seven explanatory variables are significant at the 329
5% level. The survey’s parameter estimators of OPKNOW and ADMIN are significantly positive. 330
The positive OPKNOW coefficient indicates that the more knowledge the respondent has about 331
optimization, the more willing she is to adopt it. The positive ADMIN coefficient indicates that 332
willingness increases when more difficulties are predicted in administration of the optimization 333
process. This may imply that program administrators’ assumptions about the superiority of a 334
method are in direct proportion to the method’s perceived sophistication. It may also imply that the 335
administrative process is not the major concern in determining whether a new method shall be 336
adopted. Participants may assume that optimization can ultimately simplify the whole administration 337
process once people have abundant experience with it. In addition, a WALD test shows that the 338
coefficient of ADMIN is not statistically different from that of OPKNOW is not statistically 339
significant (p=0.4284). Therefore, both variables have essentially the same influence on willingness. 340
The three survey parameter estimators LACK_EXPR, INT_COST, and LACK_INCEN represent 341
significant obstacles the adoption of optimization. The LACK_EXPR coefficient is -1.88, showing 342
that the less experience a county has with optimization, the less willing it is to adopt it. The 343
INT_COST coefficient is -2.66, indicating that the initial technical cost is a considerable obstacle to 344
adoption. Both limited budgets and a prediction of high technical costs discourage administrators 345
from using optimization. The LACK_INCEN coefficient is -2.85, meaning the more unwilling a 346
county is to change the status quo, the less willing it is to adopt a new approach. The three 347
coefficients are not statistically significantly different from one another. Therefore, lack of 348
16
experience, the initial technical cost, and a lack of incentive to change have about the same effect on 349
the adoption decision. 350
The PCT_PRESV coefficient is significantly positive, meaning that the greater the percentage of 351
agricultural land the county has previously preserved, the more willing it is to adopt optimization. 352
Counties with greater percentages of preserved agricultural land may have larger budgets or more 353
experienced employees, which would provide them with more resources both financially and 354
technically. Such counties may also have more incentive to develop better practices, further 355
improving their effectiveness. Their administrators may place a high value on techniques in the 356
preservation process and be more open to adopt new ideas and approaches. The absolute value of 357
the coefficient is not comparable to those of the previously discussed parameters because this 358
variable is not a categorical value obtained from the survey but is a very small contiguous percentage 359
number instead. Finally, the RURALITY estimator takes a negative sign and a value of -0.33, which 360
is not significant at the 10% level but is significant at the 15% level, indicating that the closer a 361
county is located to an urbanized area, the more willing it is to adopt optimization. 362
363
5. Conclusion 364
While a clear consensus exists amongst academics that cost-effective lands preservation should 365
involve careful measurement of the likely benefits and costs associated with each project, the reality 366
remains that the vast majority of conservation programs continue to follow practices that are not 367
cost-effective and thus lower conservation benefits are achieved for the limited available funding. 368
Little research has investigated the attitudes of conservation professionals concerning the 369
importance of cost-effectiveness, and little is known about how conservation professionals believe 370
that they can become more cost-effective. This research reports on a survey conducted with 371

17
conservation professionals associated with the State of Maryland’s agricultural protection program, a 372
leading program in the United States. 373
Our results suggest that while conservation professionals are generally in favor of being cost-374
effective, cost-effectiveness is not a top goal for them. When asked to indicate the importance of 5 375
attributes (knowledge, fairness, transparency, cost-effectiveness and ease of administration) on a 376
scale of 1 (not important) to 5 (very important), fairness and transparency received the highest 377
average scores, while, cost-effectiveness and ease of administration, though still moderately 378
important, received the lowest scores. 379
An ordered probit regression analyzes how the willingness of administrators to adopt optimization 380
may be influenced by knowledge of optimization technique, administrative requirements, cost 381
concerns, percentage of agricultural land previously preserved in the county, rurality, and lack of 382
incentive for administrators to adopt cost-effectiveness techniques. All except one of these variables 383
influence willingness to adopt and are significant at the 5% level. The rurality estimator, indicating 384
that the closer a county is located to an urbanized area, the more willing it is to adopt optimization, 385
is significant at the 15% level. 386
These results also show that the willingness to adopt increases when access to optimization software 387
and/or training is provided. Moreover, administrators’ willingness to adopt optimization rises by 388
10% when access to software was offered and by 16.7% when both software and training was 389
offered. 390
The results reported on in this study shed light on a number of important issues related to the 391
attitude of conservation professionals to adopt optimization. First, conservation professionals report 392
that being cost-effective is not a priority for them, in part because their jobs lack incentives for being 393
cost-effective. Second, several other variables had a significant effect on the willingness to adopt. 394

18
Lastly, we show that software accessibility and training can significantly increase the willingness to 395
adopt optimization. These results are helpful in understanding the needs of conservation planners 396
and suggest ways by which economists can improve their communication with conservation 397
planners to help them make their programs more cost-effective. 398
399
Acknowledgments: 400
Funding support for this research was provided by the Maryland Center for Agro-Ecology, the 401
National Science Foundation, and USDA Hatch funds. 402
19
References 403
Allen, W.L., Weber, T.C. and Hoellen, K.A. 2010. Green Infrastructure Design and Benefit-Cost 404
Optimization in Transportation Planning: Maximizing Conservation and Restoration 405
Opportunities in Four Southern Maryland Watersheds. Chapter in Burke, David G. and Joel E. 406
Dunn (eds.). A Sustainable Chesapeake: Better Models for Conservation. The Conservation Fund. 407
Arlington, VA. 408
Amundsen, O.M., Messer, K.D. and Allen, W.L. 2010. Integrating Optimization and Strategic 409
Conservation to Achieve Higher Efficiencies in Land Protection. University of Delaware Working 410
Papers series, (www.lerner.udel.edu/departments/economics/research-411
scholarship/workingpaperseries). 412
Babcock, B.A., Lakshminarayan, P.G., Wu, J. and Zilberman, D. 1997. Targeting Tools for the 413
Purchase of Environmental Amenities. Land Economics, 73: 325-339. 414
Cromartie, John. (2007). Measuring rurality: What is rural? Briefing room on the ERS website at 415
www.ers.usda.gov/Briefing/Rurality/WhatIsRural. 416
Dillman, D.A. 1978. Mail and telephone surveys: The total design method. New York: John Wiley & 417
Sons. 418
Duke, J. M., and Aull-Hyde, R. (2002). Identifying public preferences for land preservation using the 419
analytic hierarchy process. Ecological Economics, 42(1-2), 131-145. 420
Duke, J. M., and Lynch, L. (2007). Gauging support for innovative farmland preservation 421
techniques. Policy Sciences, 40(2), 123-155. 422
20
Duke, J. M., Dundas, S. J., and Messer, K. D., 2013. Cost-effective conservation planning: Lessons 423
from economics. Journal of environmental management,125, 126-133. 424
Farm and Ranch Land Protection Program. Farmland Information Center (2013). Information 425
retrieved on January 26, 2014 from: hwww.farmlandinfo.org/sites/default/files/FIC_FRPP_09-426
2013.pdf 427
Ferraro, P. J., and Pattanayak, S. K. (2006). Money for nothing? A call for empirical evaluation of 428
biodiversity conservation investments. PLoS biology, 4(4), e105. 429
Finch, D. M., and Patton-Mallory, M. (1992). Closing the gap between research and management. 430
Pages 12-16. Proceedings of the 1992 partners in flight training workshop. General technical 431
report RM 229. U.S. Forest Service, Wshington, D.C. 432
Fooks, J. R., and Messer, K. D. (2012). Maximizing conservation and in-kind cost share: Applying 433
Goal Programming to forest protection. Journal of Forest Economics, 18(3), 207-217. 434
Gardner, B.D., 1977. The economics of agricultural land preservation. American Journal of 435
Agricultural Economics 59, 1027-1036. 436
Hughey, K.F.D., Cullen, R. and Moran, E. 2003. Integrating Economic Approaches into the 437
Evaluation of Conservation Management Initiatives. Conservation Biology, 17(1): 1-12. 438
Johnston, R. J., and Duke, J. M. (2007). Willingness to pay for agricultural land preservation and 439
policy process attributes: Does the method matter?. American Journal of Agricultural 440
Economics, 89(4), 1098-1115. 441
Johnston, R. J., and Duke, J. M. (2009). Willingness to pay for land preservation across states and 442
jurisdictional scale: implications for benefit transfer. Land Economics, 85(2), 217-237. 443
21
Kaiser, H.M. and Messer, K.D. (2011). Mathematical Programming Models for Agricultural, 444
Environmental, and Resource Economics. John Wiley & Sons. 445
Kline, J. D. (2006). Public demand for preserving local open space. Society and Natural Resources, 19(7), 446
645-659. 447
Kline, J., and Wichelns, D. (1996). Public preferences regarding the goals of farmland preservation 448
programs. Land Economics, 72(4), 538-549. 449
Lynch, L. (2008). Desirability, challenges, and methods of protecting farmland. Choices, 23(4), 16-450
21. 451
Malcolm, S. A., Duke, J. M., and Mackenzie, J. (2005). Valuing rights of first refusal for farmland 452
preservation policy. Applied Economics Letters, 12(5), 285-288. 453
Messer, K.D. 2006. The Conservation Benefits of Cost Effective Land Acquisition: A Case Study in 454
Maryland. Journal of Environmental Management, 79: 305–315. 455
Messer, K.D. and Allen, W.L. 2010. Applying Optimization and the Analytic Hierarchy Process to 456
Enhance Agricultural Preservation Strategies in the State of Delaware. Agricultural and Resource 457
Economics Review. 39(3): 442-456. 458
Naidoo, R., Balmford, A., Ferraro, P. J., Polasky, S., Ricketts, T. H. and Rouget, M. 2006. Integrating 459
economic costs into conservation planning. Trends in Ecology & Evolution, 21(12): 681-687. 460
Parker, Tim. (2007). Measuring rurality: urban influence codes. Briefing Room on the ERS website at 461
www.ers.usda.gov/briefing/rurality/urbaninf. 462

22
Perhans, K., Kindstrand, C., Boman, M., Djupström, L.B., Gustafsson, L., Mattsson, L., Schroeder, 463
L.M., Weslien, J., Wikberg, S., 2008. Conservation goals and the relative importance of costs and 464
benefits in reserve selection. Conservation Biology, 22(5): 1331-9. 465
Polasky, S., Camm, J. D., and Garber-Yonts, B. (2001). Selecting biological reserves cost-effectively: 466
an application to terrestrial vertebrate conservation in Oregon. Land Economics, 77(1), 68-78. 467
Prendergast, J. R., Quinn, R. M., and Lawton, J. H. (1999). The gaps between theory and practice in 468
selecting nature reserves. Conservation biology, 13(3), 484-492. 469
Rosenberger, R. S. (1998). Public preferences regarding the goals of farmland preservation 470
programs: Comment. Land Economics, 74(4), 557-565. 471
Salafsky, N., Margoluis R., Redford K.H., and Robinson, J.G. (2002). Improving the practice of 472
conservation: A conceptual framework and research agenda for conservation science. 473
Conservation Biology 16: 1469–1479. 474
23
Table 1: Assessment of preservation selection techniques from senior representatives 475
* and ** denote numbers that are significantly different from the rest in the corresponding row at 476 the 10% and 5% levels respectively. 477
a denotes number significantly different from that with current technique at the 5% level. 478
b denotes number significantly different from that with binary linear programming at the 5% level. 479
c denotes number significantly different from that with cost effectiveness analysis at the 5% level. 480
481
Fairness Transparency Knowledge
Cost- effectiveness
Ease of administration
Importance of criteria
4.65** 4.48** 4.26 4.17 3.87
(0.65) (0.79) (0.62) (0.65) (0.76)
Current technique
4.05*,b,c 4.00*,b,c 4.10*,b,c 3.16c 3.74b,c
(0.74) (0.92) (0.62) (0.96) (0.81)
Binary Linear Programming
3.11a 2.67a 2.26a,c 3.56* 2.78a,c
(0.83) (0.97) (1.19) (0.70) (0.94)
Cost Effectiveness
Analysis
3.33a 3.11a 2.63a,b 3.78*,a 3.17a,b
(0.84) (1.08) (1.16) (0.73) (0.92)

24
Figure 1: Assessments of the performance of current selection processes 482
483
484
3.60
3.06
4.10 4.05
2.76 2.95
0
1
2
3
4
5
Max agland Max open space
Protect soil Protect large blocks
Best deals IncenLves to farm
x : mean

25
Figure 2: Obstacles to adopting optimization 485
486
487
488
3.35 3.11
3.65 3.32 3.26 3.10
3.42 3.11
0
1
2
3
4
5
Lack_expr Admin Int_cost Time CosLnfo Lack_tech Lack_incen Forgobest
x : mean
26
Figure 3. Knowledge about the various techniques before and after the education session. 489
490
2.4
2.0
2.4
3.7
3.0
3.5
1.0
1.5
2.0
2.5
3.0
3.5
4.0
Knowledge of OpLmizaLon
Knowledge of Binary Linear Programming
Knowledge of Cost EffecLveness Analysis
Before
AYer

27
Figure 4: Willingness to adopt optimization under different scenarios 491
492
3.0
3.3
3.5
2
3
4
General Access Access & Training
Increase 10.0%
Increase 16.7%

28
Table 2: 2003 Urban influence codes 493
Code 2003 Urban Influence Codes
1 Large—in a metro area with at least 1 million residents or more 2 Small—in a metro area with fewer than 1 million residents 3 Micropolitan area adjacent to a large metro area 4 Noncore adjacent to a large metro area 5 Micropolitan area adjacent to a small metro area 6 Noncore adjacent to a small metro area with town of at least 2,500 residents
7 Noncore adjacent to a small metro area and does not contain a town of at least 2,500 residents
8 Micropolitan area not adjacent to a metro area 9 Noncore adjacent to micro area and contains a town of at least 2,500 residents 10 Noncore adjacent to micro area and does not contain a town of at least 2,500 residents
11 Noncore not adjacent to a metro/micro area and contains a town of 2,500 or more residents
12 Noncore not adjacent to a metro/micro area and does not contain a town of at least 2,500 residents
494
29
Table 3: Ordered Probit regression on Willingness to Adopt Optimization. 495
Coefficient
OPKNOW 2.317* (0.980) LACK_EXPR -1.883* (0.858) ADMIN 2.791* (1.124) INT_COST -2.670* (1.0577) LACK_INCEN -2.853** (1.015) PCT_PRESV 241.294** (93.118) RURALITY -0.329 (0.228) LR chi2(7) 37.25 Prob > chi2 0.000 Log likelihood -11.423 N 22 Notes: Standard errors listed in parentheses. * signifies statistical significance at the 0.05 level. * * 496 signifies statistical significance at the 0.01 level. 497

30
Appendix A 498
Survey Questionnaire 499
500 PRE-SURVEY 501 502 1. Your name: 503 504 2. Maryland county and/or your organization: 505 506 3. How many years have you worked for this county/organization? 507 508 4. Your current job title: 509 510 5. How many years have you been employed in this position? 511 512 6. How many people in your county/organization work on agricultural preservation programs? 513
a. Full-time employees 514 b. Part-time employees 515 c. Volunteers 516
517 518 7. How knowledgeable are you regarding the Maryland Agricultural Land Preservation Foundation’s 519
(MALPF) agricultural preservation program? (Circle one) 520 521 Not Knowledgeable Somewhat Knowledgeable Expert 522 1 2 3 4 5 523
524 8. How knowledgeable are you regarding your County/Organization’s agricultural preservation program? 525
(Circle one) 526 527 Not Knowledgeable Somewhat Knowledgeable Expert 528 1 2 3 4 5 529
530 9. In your county, approximately what percentage of agricultural land, measured by acreage, has been 531
protected by the following sources over the past five years? (Total should sum to 100%) 532 533
a. Maryland Agricultural Lands Preservation Foundation % 534 b. Your county’s agricultural preservation program % 535 c. Rural Legacy Program % 536 d. Maryland Environmental Trust (MET) Program % 537 e. Program Open Space % 538 f. Other % 539
Total: 100 % 540

31
10. List, in order of importance, the 3 to 5 most important benefit factors (such as, soil quality, acres, 541 biodiversity value, or development potential) in your county/organization’s selection process. 542 543 Indicate how each benefit is measured (such as, GIS mapping, Land Evaluation and Site Assessment 544 (LESA), or site visits). 545
546 Benefit Factor How Measured 547 1. 548 2. 549 3. 550 4. 551 5. 552 553
11. Who determines the benefit factors and weights for your county/organization’s selection process? (Circle 554 ALL that apply) 555
a. County program staff 556 b. County advisory board 557 c. MALPF guidelines 558 d. County guidelines 559 e. Other 560 f. Don’t know 561
562 563 12. If your county/organization has a LESA system to help determine the benefit score for any preservation 564
program, please describe how this LESA system is used. 565 566 Program How LESA system is used
1. MALPF program
2. County Program
3. Rural Legacy Program
4. MET Program
5. Program Open Space
6. Other 567
568
32
13. Do any of your preservation programs use price caps to determine the easement cost? (Circle one) 569
570 Yes No Unsure 571
572 573 If you answered “Yes”, please describe what advantages and disadvantages your county has experienced with price 574 caps: 575
576 Advantages Disadvantages 577
578
579
580
581
582 If you answered “No”, please complete one of the following: 583 584 We are planning to use price caps because: 585 586 587 588
We are not planning to use price caps because: 589 590 591
592 14. For each program in the table below, which of the following methods determines the easement cost in your 593
county? (Please check all that apply for each program.) 594 595 596
Program Method
MALPF
County
Rur
al
Legacy
MET
Prog
ram
O
pen
Spac
e
Oth
er
_________
_
Asking price □ □ □ □ □ □
Seller discount □ □ □ □ □ □
Calculated easement value □ □ □ □ □ □
Price caps □ □ □ □ □ □
Appraised value □ □ □ □ □ □
Other □ □ □ □ □ □
Don’t know □ □ □ □ □ □
Not applicable □ □ □ □ □ □ 597 598 599
33
15. For each program in the table below, how are easement costs factored into your county/organization’s 600 selection process? (Please check all that apply for each program.) 601 602 Program
M
ALP
F County
Rur
al
Legacy
MET
Progra
m O
pen
Space
Oth
er
______
____
Not explicitly included, except to determine whether funds are still available in the budget
□ □ □ □ □ □
Considered as part of the parcel benefit scoring □ □ □ □ □ □
Used in an optimization process □ □ □ □ □ □
Used in calculation of benefit-cost ratios □ □ □ □ □ □
Other □ □ □ □ □ □
Don’t know □ □ □ □ □ □
Not applicable □ □ □ □ □ □ 603 604
16. For each program in the table below, how are the parcels selected for agricultural preservation in your 605 county/organization? (Please check all that apply for each program.) 606 607
Program
Method M
ALPF
County
Rur
al
Legacy
MET
Prog
ram
O
pen
Spac
e
Oth
er
__________
___
Parcels with the highest benefit scores are selected first until the budget is exhausted □ □ □ □ □ □
Parcels with the highest benefit-cost ratios are selected first until the budget is exhausted □ □ □ □ □ □
Parcels are selected based on advisory board recommendations □ □ □ □ □ □
Parcels are selected based on political considerations □ □ □ □ □ □
Parcels are selected based on their benefits and costs using binary linear programming □ □ □ □ □ □
No official selection system is used □ □ □ □ □ □
Other □ □ □ □ □ □
Don’t know □ □ □ □ □ □
Not applicable □ □ □ □ □ □ 608 609

34
610 Assess the ability of your county/organization’s current selection processes for agricultural land preservation according to the following criteria:
Poor Fair Excellent
17. Maximize the number of agricultural acres protected 1 2 3 4 5
18. Maximize the open space quality of acres protected 1 2 3 4 5
19. Protect the best agricultural land in terms of soil 1 2 3 4 5
20. Preserve large blocks of contiguous agricultural land 1 2 3 4 5
21. Acquire the best deals on agricultural land 1 2 3 4 5
22. Increase incentives for participants to remain in farming 1 2 3 4 5 611 612 Assess the technique used for your county/organization’s current selection processes for agricultural land preservation according to the following criteria:
Poor Fair Excellent
23. Knowledge of staff on how to use this technique 1 2 3 4 5
24. Fairness to applicants 1 2 3 4 5
25. Transparency (i.e. ease of explanation to public, advisory board, or potential applicants) 1 2 3 4 5
26. Cost-effectiveness 1 2 3 4 5
27. Ease of administration 1 2 3 4 5
28. Other 1 2 3 4 5 613
614
Please rate the following programs according to their efficiency in preserving agricultural land:
Low Medium High
29. MALPF Program 1 2 3 4 5
30. County Program 1 2 3 4 5
31. Rural Legacy Program 1 2 3 4 5
32. MET Program 1 2 3 4 5
33. Program Open Space 1 2 3 4 5
34. Other program __________________________________ 1 2 3 4 5
35
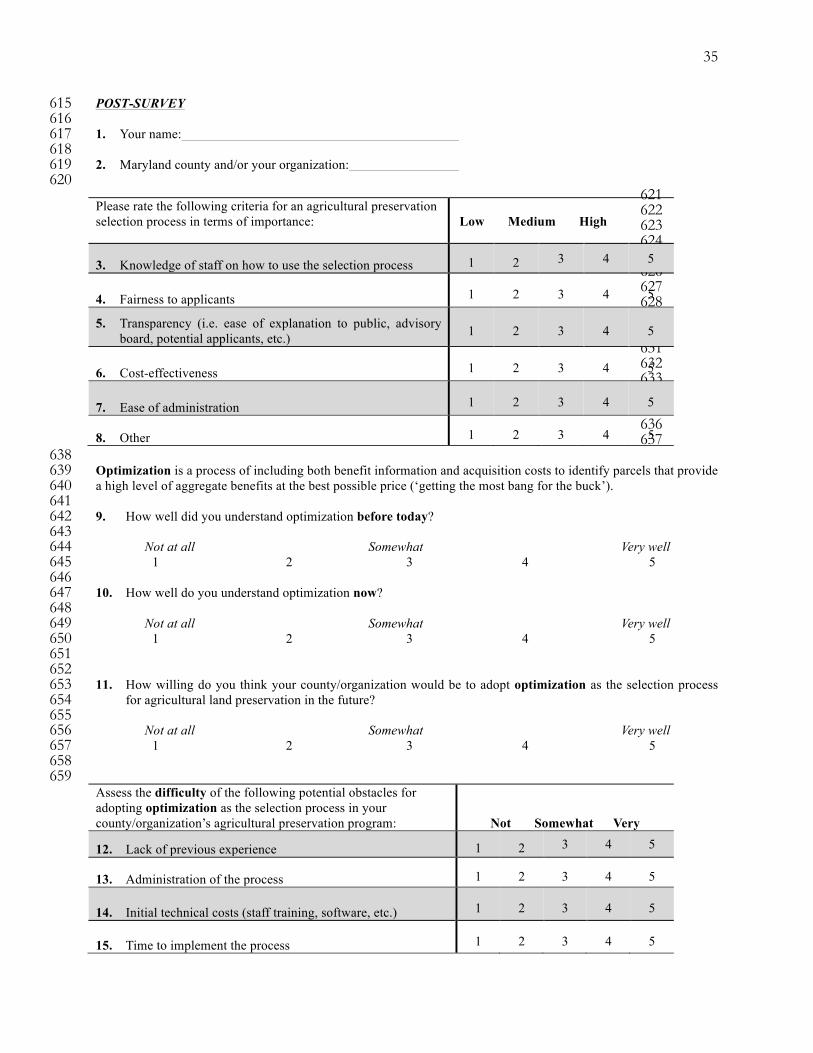
POST-SURVEY 615 616 1. Your name: 617 618 2. Maryland county and/or your organization: 619 620
621 622 623 624 625 626 627 628 629 630 631 632 633 634 635 636 637
638 Optimization is a process of including both benefit information and acquisition costs to identify parcels that provide 639 a high level of aggregate benefits at the best possible price (‘getting the most bang for the buck’). 640 641 9. How well did you understand optimization before today? 642
643 Not at all Somewhat Very well 644
1 2 3 4 5 645 646
10. How well do you understand optimization now? 647 648 Not at all Somewhat Very well 649
1 2 3 4 5 650 651
652 11. How willing do you think your county/organization would be to adopt optimization as the selection process 653
for agricultural land preservation in the future? 654 655 Not at all Somewhat Very well 656
1 2 3 4 5 657 658 659 Assess the difficulty of the following potential obstacles for adopting optimization as the selection process in your county/organization’s agricultural preservation program:
Not Somewhat Very
12. Lack of previous experience 1 2 3 4 5
13. Administration of the process 1 2 3 4 5
14. Initial technical costs (staff training, software, etc.) 1 2 3 4 5
15. Time to implement the process 1 2 3 4 5
Please rate the following criteria for an agricultural preservation selection process in terms of importance:
Low Medium High
3. Knowledge of staff on how to use the selection process 1 2 3 4 5
4. Fairness to applicants 1 2 3 4 5
5. Transparency (i.e. ease of explanation to public, advisory board, potential applicants, etc.) 1 2 3 4 5
6. Cost-effectiveness 1 2 3 4 5
7. Ease of administration 1 2 3 4 5
8. Other 1 2 3 4 5

36
16. Need for cost information at the time of selection 1 2 3 4 5
17. Lack of availability of technical resources 1 2 3 4 5
18. Lack of incentives to justify a change in processes 1 2 3 4 5
19. Possibly forgoing the ‘best’ land regardless of cost 1 2 3 4 5
20. Other 1 2 3 4 5 660
661 662
21. If your county was given access to user-friendly software to help with optimization, how willing do you think 663 your county/organization would be to adopt this selection process in the future? 664
665 Not at all Somewhat Very willing 666
1 2 3 4 5 667 668 669
22. If your county was given access to and training for user-friendly software to help with optimization, how 670 willing do you think your county/organization would be to adopt this selection process in the future? 671
672 Not at all Somewhat Very willing 673
1 2 3 4 5 674

37
Binary Linear Programming is an optimization technique that seeks to use mathematical programming software 675 to identify the set of acquisitions that maximizes the total possible benefits given a variety of constraints (i.e. budget 676 constraints, staff constraints, minimum acreage goals, etc.). 677 678 679 23. How well did you understand optimization using binary linear programming before today? 680
681 Not at all Somewhat Very well 682
1 2 3 4 5 683 684 685
24. How well do you understand optimization using binary linear programming now? 686 687
Not at all Somewhat Very well 688 1 2 3 4 5 689 690
691 692
Assess binary linear programming as a technique in the selection process to preserve agricultural land in your county/organization according to the following criteria:
Poor Fair Excellent
25. Knowledge of staff on how to use this technique 1 2 3 4 5
26. Fairness to applicants 1 2 3 4 5
27. Transparency (i.e. ease of explanation to public, advisory board, potential applicants, etc.) 1 2 3 4 5
28. Cost-effectiveness 1 2 3 4 5
29. Ease of administration 1 2 3 4 5
30. Other 1 2 3 4 5
693 694 695 31. How willing do you think your county/organization would be to adopt binary linear programming in the 696
selection process for agricultural land preservation in the future? 697 698
Not at all Somewhat Very willing 699 1 2 3 4 5 700 701 702 703 704 705 706 707 708 709 710 Cost-Effectiveness Analysis is an optimization technique that assesses a parcel’s conservation value by taking the 711 ratio of benefits divided by costs, and then acquiring the parcels with the highest benefit-cost ratios until the 712 acquisition funds are exhausted. 713
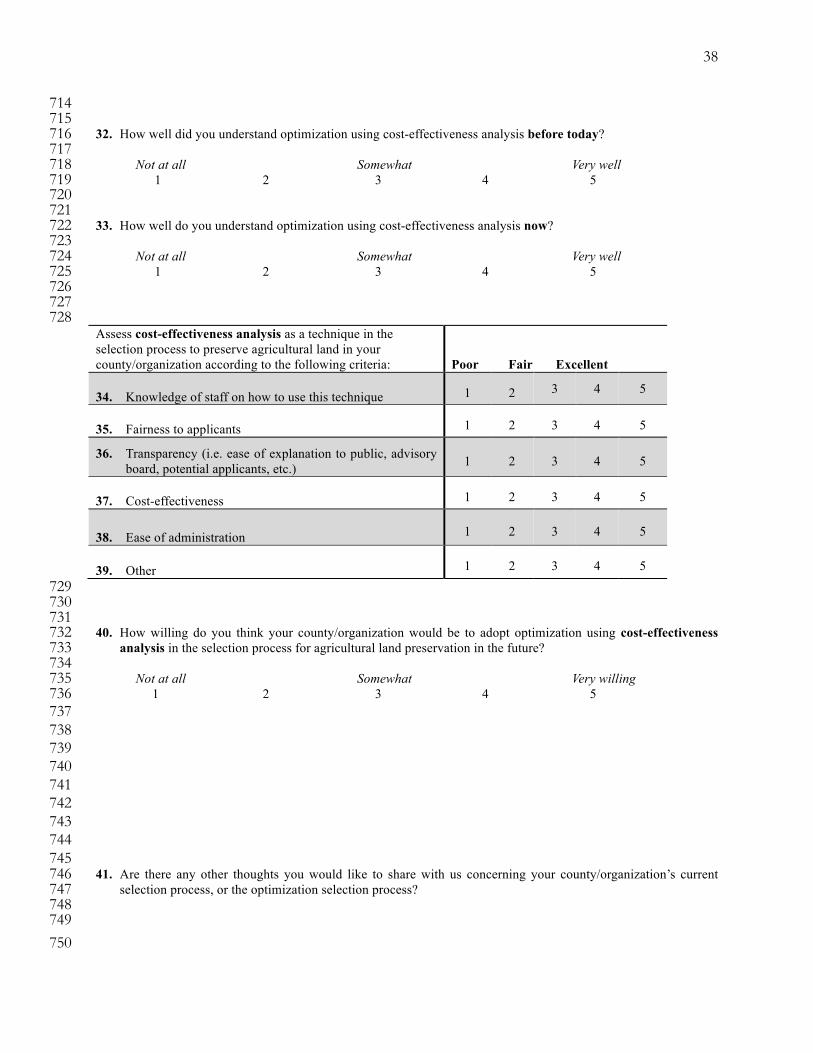
38
714 715 32. How well did you understand optimization using cost-effectiveness analysis before today? 716
717 Not at all Somewhat Very well 718
1 2 3 4 5 719 720 721
33. How well do you understand optimization using cost-effectiveness analysis now? 722 723
Not at all Somewhat Very well 724 1 2 3 4 5 725
726 727 728 Assess cost-effectiveness analysis as a technique in the selection process to preserve agricultural land in your county/organization according to the following criteria:
Poor Fair Excellent
34. Knowledge of staff on how to use this technique 1 2 3 4 5
35. Fairness to applicants 1 2 3 4 5
36. Transparency (i.e. ease of explanation to public, advisory board, potential applicants, etc.) 1 2 3 4 5
37. Cost-effectiveness 1 2 3 4 5
38. Ease of administration 1 2 3 4 5
39. Other 1 2 3 4 5 729
730 731 40. How willing do you think your county/organization would be to adopt optimization using cost-effectiveness 732
analysis in the selection process for agricultural land preservation in the future? 733 734
Not at all Somewhat Very willing 735 1 2 3 4 5 736 737 738 739 740 741 742 743 744 745 41. Are there any other thoughts you would like to share with us concerning your county/organization’s current 746
selection process, or the optimization selection process? 747 748 749 750

39
751 752 753 754 755 756 757 758 759 760 42. Do you have any comments or suggestions about this survey? 761 762 763 764 765 766 767 768 769 770 771 772 773 774 775 776 777 778 779
Thank you very much for your participation. 780 781

40
If you have any further questions or suggestions, please don’t hesitate to contact us: 782 783 784 Kent D. Messer, PhD 785 Assistant Professor of Food & Resource Economics 786 Assistant Professor of Economics 787 226 Townsend Hall 788 University of Delaware 789 Newark, Delaware 19716 790 [email protected] 791 Phone: 302-831-1316 792 793 William L. Allen 794 Director of Strategic Conservation 795 The Conservation Fund 796 410 Market Street, Suite 360 797 Chapel Hill, NC 27516 798 [email protected] 799 Phone: 919-967-2223 ext 124 800 801
Cindy Chen 802 Graduate Student of Agricultural Economics & Operations Research 803 226 Townsend Hall 804 University of Delaware 805 Newark, Delaware 19716 806 [email protected] 807 Phone: 302-345-5447 808 809
41
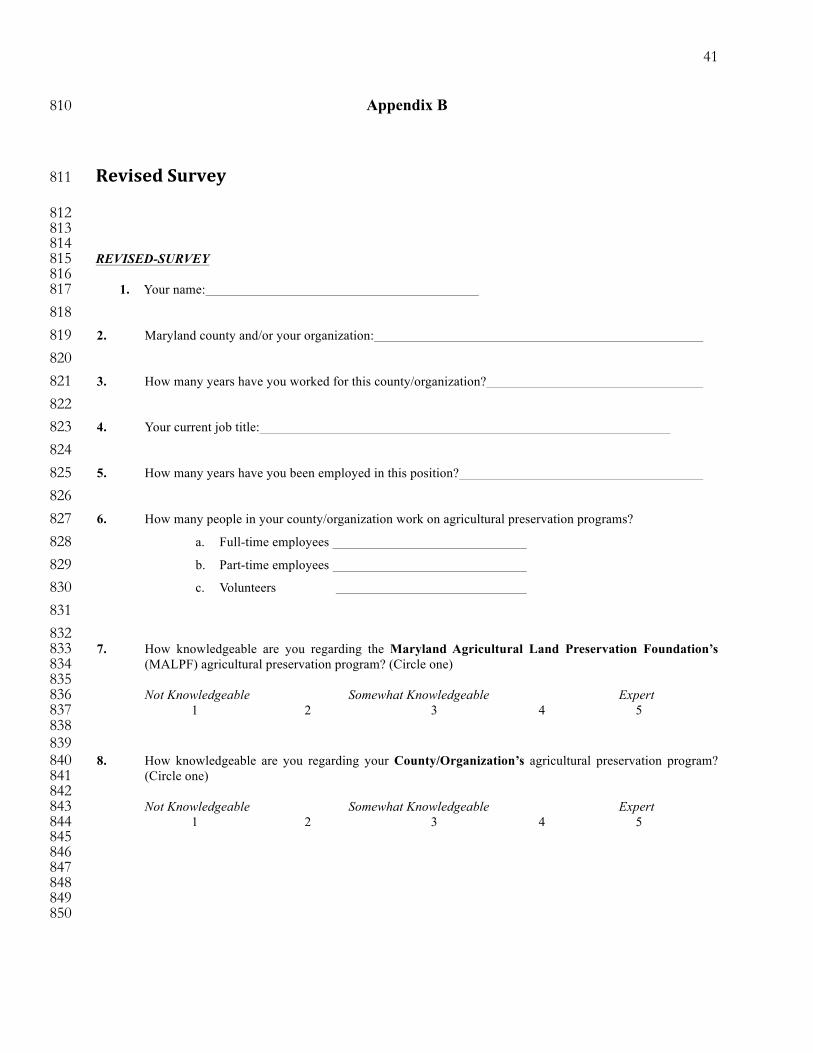
Appendix B 810
Revised Survey 811
812 813 814 REVISED-SURVEY 815 816
1. Your name: 817 818 2. Maryland county and/or your organization: 819 820 3. How many years have you worked for this county/organization? 821 822 4. Your current job title: 823 824 5. How many years have you been employed in this position? 825 826 6. How many people in your county/organization work on agricultural preservation programs? 827
a. Full-time employees 828 b. Part-time employees 829 c. Volunteers 830
831 832 7. How knowledgeable are you regarding the Maryland Agricultural Land Preservation Foundation’s 833
(MALPF) agricultural preservation program? (Circle one) 834 835 Not Knowledgeable Somewhat Knowledgeable Expert 836 1 2 3 4 5 837
838 839 8. How knowledgeable are you regarding your County/Organization’s agricultural preservation program? 840
(Circle one) 841 842 Not Knowledgeable Somewhat Knowledgeable Expert 843 1 2 3 4 5 844 845
846 847 848
849 850
42
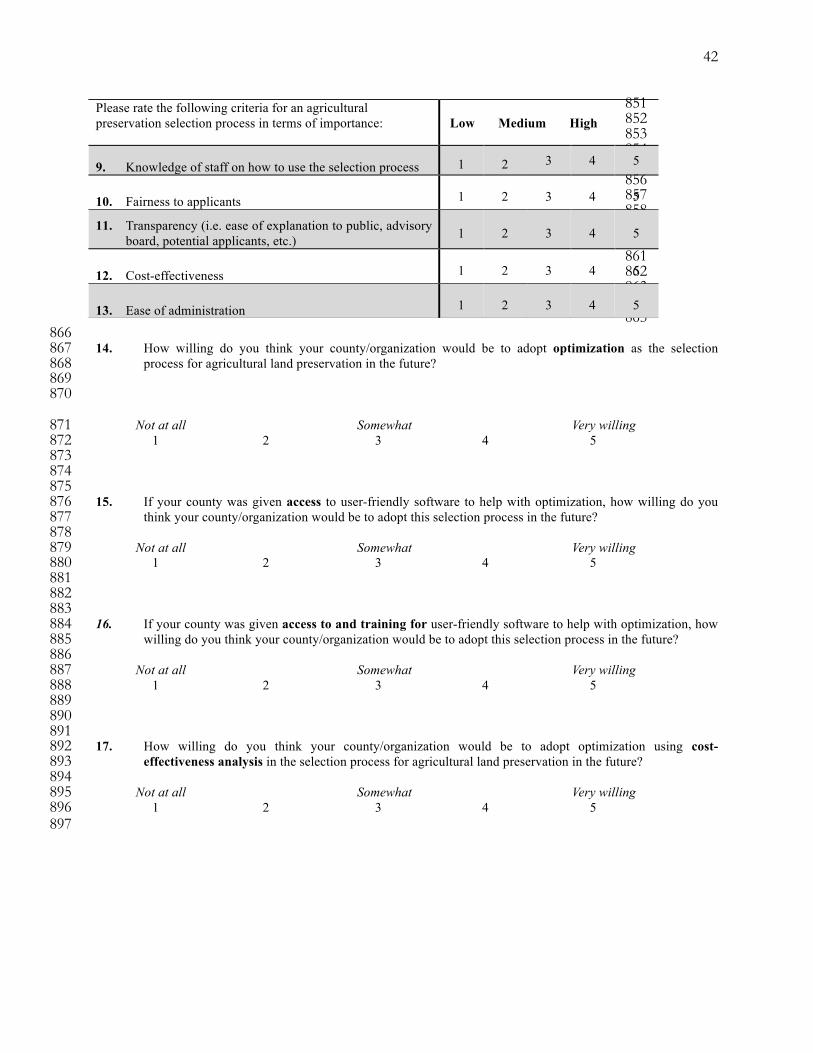
851 852 853 854 855 856 857 858 859 860 861 862 863 864 865
866 14. How willing do you think your county/organization would be to adopt optimization as the selection 867
process for agricultural land preservation in the future? 868 869 870
Not at all Somewhat Very willing 871 1 2 3 4 5 872 873 874 875 15. If your county was given access to user-friendly software to help with optimization, how willing do you 876
think your county/organization would be to adopt this selection process in the future? 877 878
Not at all Somewhat Very willing 879 1 2 3 4 5 880 881
882 883
16. If your county was given access to and training for user-friendly software to help with optimization, how 884 willing do you think your county/organization would be to adopt this selection process in the future? 885 886
Not at all Somewhat Very willing 887 1 2 3 4 5 888 889 890 891 17. How willing do you think your county/organization would be to adopt optimization using cost-892
effectiveness analysis in the selection process for agricultural land preservation in the future? 893 894
Not at all Somewhat Very willing 895 1 2 3 4 5 896 897
Please rate the following criteria for an agricultural preservation selection process in terms of importance:
Low Medium High
9. Knowledge of staff on how to use the selection process 1 2 3 4 5
10. Fairness to applicants 1 2 3 4 5
11. Transparency (i.e. ease of explanation to public, advisory board, potential applicants, etc.) 1 2 3 4 5
12. Cost-effectiveness 1 2 3 4 5
13. Ease of administration 1 2 3 4 5
Related Documents