1 Joint Ways and Means Subcommittee on Human Services Ashley Carson Cottingham, Director Aging and People with Disabilities March 15 and 16, 2017 Aging and People with Disabilities

Welcome message from author
This document is posted to help you gain knowledge. Please leave a comment to let me know what you think about it! Share it to your friends and learn new things together.
Transcript

1
Joint Ways and Means Subcommitteeon Human Services
Ashley Carson Cottingham, DirectorAging and People with Disabilities
March 15 and 16, 2017
Aging and People with Disabilities

2
APD presentation outline
Day 1
• Goals• Approach• System• Safety• Licensing
Day 2
• Services• Accomplishments• Challenges• Investments• Budget and KPMs

3
Aging & People with Disabilities (APD)
• Oregon’s older adults, people with disabilities and their families have easy access to services, supports and early interventions that help maintain independence, promote well-being, honor choice, respect cultural preferences and uphold dignity.

4
Aging & People with Disabilities Goals• Ensure the safety and protection of the population we serve
with a focus on prevention.• Facilitate broad awareness of, and easy access to,
services.• Invest in preventive services to keep people independent,
healthy and safe for longer periods of time.• Provide person-centered-services and supports.• Serve people in an equitable and culturally sensitive
manner. • Promote high quality services by APD, its local partners
and providers.• Increase advocacy efforts to improve outcomes for APD
consumers.• Administer programs with the utmost integrity.
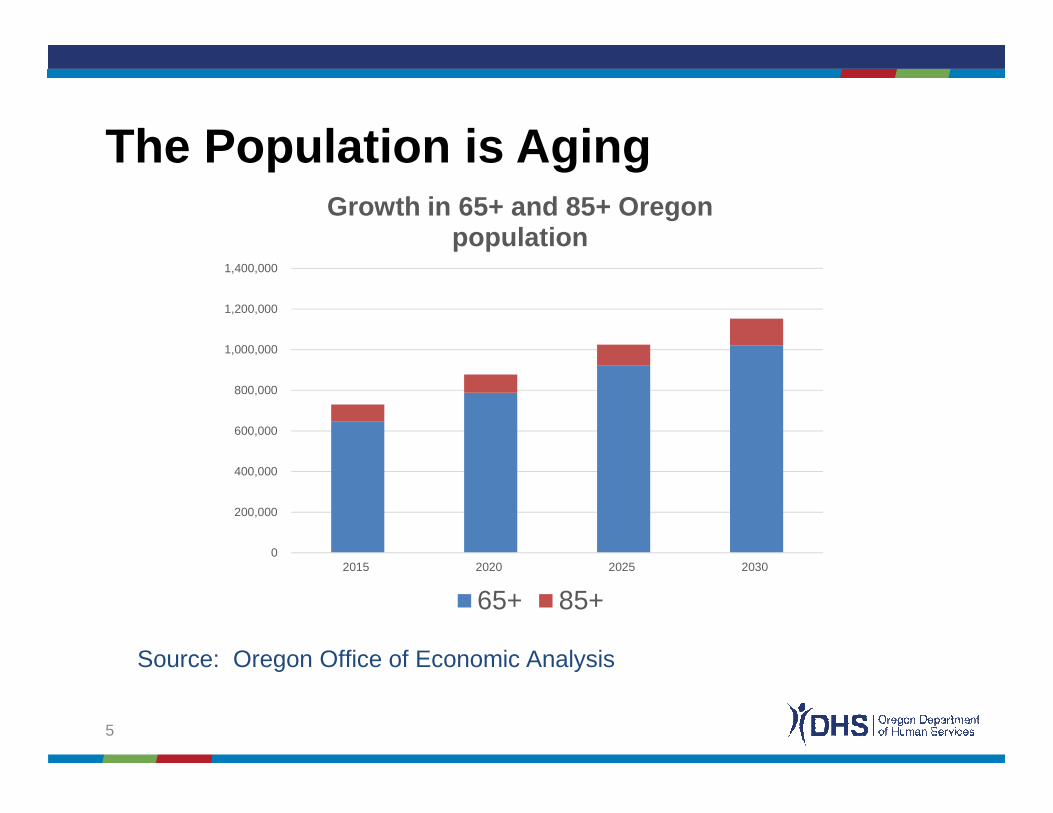
The Population is Aging
5
Source: Oregon Office of Economic Analysis
0
200,000
400,000
600,000
800,000
1,000,000
1,200,000
1,400,000
2015 2020 2025 2030
Growth in 65+ and 85+ Oregon population
65+ 85+

Crisis in retirement savings
6

A Social Model of Services
7
Holistic assessment
Strengths based service
planning
Value a person’s choice,
dignity, and self-direction
Balance paid services with
natural supports
Resources to keep people independent, healthy, and
safe

Oregon’s Long Term Care System
8
Oregonians served
76,000 Aging & Disability Resource
Connection
258,000 in OAA
4,000 in OPI
163,000 Financial eligibility
(Medicaid, SNAP)
13,000 Adult Protective Services
investigations
20,000 Medicaid LTC
in in-home services 11,000
Medicaid residents in community-based care
4,770 Medicaid residents in
nursing facilities
38,296 Licensed beds

9
Medicare
Older Americans
Act
Medicaid
Laws Passed in 1965 -The Vision for Older Americans

Where We Serve Oregonians
10

Aging & People with Disabilities (State Offices)
Area Agencies on Aging(AAAs)
Type A (Non-Medicaid –
OPI /OAA)
Type B(Medicaid, OPI, OAA,
APS, etc.)
The Aging Services Network

How Do I Navigate the System?
12
adrcoforegon.org 1-855-ORE-ADRC 1-855-673-2372

13
The Services We Offer

Elder Abuse – Types of Adult Abuse• Financial exploitation• Physical abuse• Sexual abuse• Emotional abuse• Abandonment• Wrongful restraint• Involuntary seclusion• Neglect• Self neglect
14
Adult Protective Services Investigations
To Report Abuse: Statewide # 1-855-503-SAFE

Adult Protective Services
15

Community Abuse Investigations
�Abuse allegations have increased by 35% since 2011 by Community Adult Protective Services.
�Economic forecasts project the older adult (65+) population in Oregon to continue increasing through 2022 by an average of 3.83% per year.
• This increase is attributed to an aging population, and migration from other parts of the country.
16

Centralized Abuse Management System
17

APD - Facility Licensing
18
Safety, Oversight & Quality (SOQ)
Unit
Adult Foster Home (AFH) Licensing
Nursing Facility (NF) Licensing
Residential & Assisted Living Facility (CBC)
Licensing
Staff in our program have an unwavering commitment to the safety, independence, choice and dignity of
vulnerable Oregonians in our licensed care settings.

Settings Number of facilities
Memory Care Endorsed
Nursing Facilities
137 11
Assisted Living and Residential Care Facilities
518 186
Adult Foster Homes
1,609 N/A
19
Pressure on Licensing Staff

Compliance Tools
20
• Licensing Complaint Unit (phone/email)• Surveys• Civil penalties• Licensing conditions• Letters of Agreement• Suspension/Revocation/Non-Renewal of
a license• Department-approved consultant

Civil Penalties – All Settings
21
195215
129
195 198167
0
50
100
150
200
250
AFH CBC NF
Civil Penalties All Settings# Penalties Imposed
2015 2016

Licensing Conditions Imposed
22
26
13
0
38
28
10
5
10
15
20
25
30
35
40
AFH CBC NF (ROA)
Conditions Imposed
20152016

Immediate Suspensions
23
11
19
0
2
4
6
8
10
12
14
16
18
20
Suspensions
Adult Foster Homes
2015 2016

24
APD presentation outline
Day 1
• Goals• Approach• System• Safety• Licensing
Day 2
• Services• Accomplishments• Challenges• Investments• Budget and KPMs

25

Aging & Disability Resource Connection - Highlights• 76,213 - # of calls to local ADRCs,
including 1-855-ORE-ADRC
• 735,022 - # of web hits
• 24% - % of information and assistance/referral consumers in rural/frontier communities
• 73% - Options counseling consumers who report greater independence as a result of ADRC services
• 11.5% - % of information and assistance/referral consumers who are of racial or ethnic minorities
26

Older Americans Act• Delivered through Area Agencies on
Aging (AAAs)• Keep seniors safe and independent• Federal funds• Not means-tested• 2.6 million meals (home-delivered
and congregate)• 477,000 hours homemaker/personal
care services• 25,000 sessions nutrition education• 23,000 trips assisted transportation
27

Oregon Project Independence
• State funded program • Reduces risk of more
costly, out-of-home placements
• Only 19% of those served ended up on Medicaid services
• Average cost-per-case is $332, consumers pay on sliding scale
28

Medicaid & Financial Eligibility
• Supplemental Nutritional Assistance Program (SNAP)
• Medicaid as primary health care • Medicare Savings Programs• Medicare Part D Assistance
29
Medicaid Long Term Care
• Long term services and supports for individuals who meet financial eligibility & nursing home level of care
• If eligible, Medicaid pays for activities of daily living and other supports
30

Service Priority Levels (SPLs)
31

32
Caseload Forecast 2017 -19
In-Home, 19982
Community Based Care,
12456
Nursing Facility, 4123

Community First Choice –Medicaid State Plan Option
The K State Plan Option provides an enhanced 6% in federal matching funds for eligible services.
• 2013-15: $67.6M
• 2015-17: $87.1M
• 2017-19: $105.3M
(APD portion only)
33

General Assistance Program –Housing StatusHoused: 35 • 25 rent rooms • 3 in apartments• 5 in mobile park/ trailer space/
RV • 2 in long-term hotel/motel
Unhoused: 19• 8 couch surfing• 5 on the streets/outside• 2 in shelters• 1 in trailer (no hookups) (5%)• 1 in a garage (5%)• 2 unknown (11%)
34
Housing cases: 54
Housed: 35 (65%)Unhoused: 19 (35%)

Presum
ptive Medicaid D
isability D
etermination Team
35
0
500
1000
1500
2000
2500
3000
3500
4000
Jan-12Feb-12Mar-12Apr-12
May-12Jun-12Jul-12
Aug-12Sep-12Oct-12Nov-12Dec-12Jan-13Feb-13Mar-13Apr-13
May-13Jun-13Jul-13
Aug-13Sep-13Oct-13Nov-13Dec-13Jan-14Feb-14Mar-14Apr-14
May-14Jun-14Jul-14
Aug-14Sep-14Oct-14Nov-14Dec-14Jan-15Feb-15Mar-15Apr-15
May-15Jun-15
Jul-Sept-15Oct-Dec-15Jan-Mar-16Apr-Jun-16Jul-Sep 16
Oct-Dec 16
Presum
ptive Medicaid R
eferrals, Pending and
Processed C
ases 2012-2016
Referrals
Pending
Processed

Disability Determination Services
• 100% federally funded• Medical determination for
Social Security disability benefits
• 203 staff• 53,00 claims annually• Cash and medical
coverage provided to recipients
• $176.8 Million benefits monthly in Oregon
36

Accomplishments
• New Department of Labor (DOL) regulations implementation
• Live-in program reduction• Home and Community Based Services (HCBS)
transition plan• Regulatory improvements / Client Safety• Aging & People with Disabilities (APD) waiver
renewal (met all Centers for Medicare & Medicaid Services [CMS] assurances)
• Automated Survey Processing Environment (ASPEN) implementation for Adult Foster Homes
37

Sustainability Initiatives• More clearly define nursing facility level of care
– Improve case managers’ ability to assess consistently– Manage caseload growth rather than cutting Service
Priority Levels (SPLs)– Revised definitions around Activities of Daily Living
• Ongoing time study• Changes for the remaining consumers in Live-In
service option• More Quality Assurance reviews of annual
assessments• Separation of ongoing case management from
annual assessment 38

Unfunded Mandates• Cost of Department of Labor Rule
– Fair Labor Standards Act (FLSA) Rule requires paying at least minimum wage for all hours worked at, including standby
– APD reduced cost by changing live-in service option and capping overtime allowed
– Cost: $19.4 million
• Home & Community Based Services (HCBS) Settings Regulations
39

40
Central & Shared Services, State Assessments &
Enterprise-wide Costs and Program Design Services
$793.8 7%
Self Sufficiency$3.18 Billion
28%
Child Welfare$1.05 Billion
9%
VR Basic Rehabilitative Services
$114.0 1%
Aging and People with Disabilities
$3.42 Billion30%
Intellectual & Developmental
Disabilities$2.71 Billion
24%
Department of Human Services2017-19 Governor's BudgetTotal Fund by Program Area
$11.26 Billion

41
APD Program
Delivery & Design
$491.0
14.4%
Disability
Determination
Services (DDS)
$18.0
0.5%
DDS Program
Delivery & Design
$43.7
1.3%Nursing Facilities
$809.3
23.7%
Community
Based Care
$848.3
24.8%
In-Home Care
$1.14 Billion
33.2%
Misc. Other Services
$69.5
2.0%
Aging and People with DisabilitiesTotal by Program
$3.42 Billion

42
General Fund$992.0 29%
Other Fund$218.3
6%
Federal Fund$2.21 Billion
65%
Aging and People with DisabilitiesTotal by Fund Type
$3.42 Billion

43
DHS APD Direct Payments and Services2017-19 Governor’s Budget
Direct Payments toProviders
Direct Payments to Clients Design Delivery
GF 738,301,023 27,196,197 29,655,638 196,846,869OF 175,769,372 0 21,435,744 21,106,036FF 1,914,074,014 24,691,941 33,996,842 231,758,762TF 2,828,144,409 51,888,138 85,088,224 449,711,667
% of Total 82.82% 1.52% 2.49% 13.17%
0
500,000,000
1,000,000,000
1,500,000,000
2,000,000,000
2,500,000,000
3,000,000,000
Department of Human Services
Note: 97.51% of budget is direct services or direct payments to clients or providers

44
2013 2014 2015 2016
Actual 3.40% 3.13% 3.07% 3.09%
3.40%3.13% 3.07% 3.09%
0.00%
1.00%
2.00%
3.00%
4.00%
5.00%
KPM #10 LTC Need Prevention
% Of Seniors (65+) Needing Publicly funded Long-term Care
Services
Time Period: Jan- Dec.
The target for this measure is to be below 5%.

45
2012 2013 2014 2015 2016Actual 83.60% 84.80% 85.10% 86.10% 86.90%
81.00%
82.00%
83.00%
84.00%
85.00%
86.00%
87.00%
88.00%
KPM #11 LTC Recipients Living Outside Of Nursing Fa cilitiesThe Percentage of Oregonians Accessing Publicly Funded Long Term Care Services Who are Living Outside of Nursing Facilities.
The target for this measure is to be above 90%.

46
2015 2016
Actual 0.75% 0.73%
0.75%
0.73%
0.72%
0.73%
0.73%
0.74%
0.74%
0.75%
0.75%
0.76%
*KPM #16 Abuse Of Seniors And People With Disabilities
The Percentage of Seniors and Adults with Physical Disabilities
Experiencing Abuse.*Current measure – proposing change*
Time Period: Jan-Dec
The target for this measure is to be below 2.2%.

47
Wrap-up
• Promoting a culture of safety that is consistent wi th values of independence, dignity and choice
• Providing tools to prevent, identify and investigat e abuse
• Sustaining programs with aging and disability population growth
Coming up next
• Office of Developmental Disabilities Services,March 21-22
• Vocational Rehabilitation, March 27• Self-sufficiency, March 30

Related Documents