AP Statistics Test Prep Table of Contents Part 1: Test Overview Slide 2 Part 2: Test Content Slide 4 Part 3: 2013 Released Qs Slide 11 Part 4: Specific Concepts Slide 21 Part 5: Stats in a Nutshell Slide 26 Part 6: Example Questions Slide 31 Part 7: Formulas Slide 47 Part 8: Calculator Shortcuts © Richard Newton 2013

AP Statistics Test Prep Table of Contents Part 1: Test OverviewSlide 2Slide 2 Part 2: Test ContentSlide 4Slide 4 Part 3: 2013 Released QsSlide 11Slide.
Dec 17, 2015
Welcome message from author
This document is posted to help you gain knowledge. Please leave a comment to let me know what you think about it! Share it to your friends and learn new things together.
Transcript

AP Statistics Test PrepTable of ContentsPart 1: Test Overview Slide 2Part 2: Test Content Slide 4Part 3: 2013 Released Qs Slide 11Part 4: Specific Concepts Slide 21Part 5: Stats in a Nutshell Slide 26Part 6: Example Questions Slide 31Part 7: Formulas Slide 47Part 8: Calculator Shortcuts Slide 52Part 9: Study Guide by Chapter Slide 59
© Richard Newton 2013

AP Statistics Test Prep
Part 1: Test Overview
AP Stats Test is May 10th at Noon!AP Statistics Exam Study Materials!
Barron’s “AP Statistics”Princeton Review’s “Cracking the AP”Kaplan’s “5 Steps to a 5”
Part 1: Multiple Choice50% of overall Grade40 Questions90 Minutes
Part 2: Free Response50% of overall Grade6 Questions (5 and 1)90 Minutes
Breakdown:Each Multiple Choice Question is 1.25% of the overall scoreEach of the first 5 free response questions is 7.5% of the overall scoreThe final question is 12.5% of the overall score
There is no penalty for guessing.
AP Test Prep – Part 1: Test Overview

AP Statistics Test Prep
Part 2: Test Content

AP Test Prep – Part 2: Test ContentThe course can be divided into 4 major topics:
1. Exploratory Analysis2. Planning a Study3. Probability4. Inference
You will see 1 Free Response on each of these and 1 “Investigative Task” which is basically where you hit all of them in a single question.
Being able to look at a multiple choice or free response question and put it into 1 of these categories is one of the best skills you can learn.
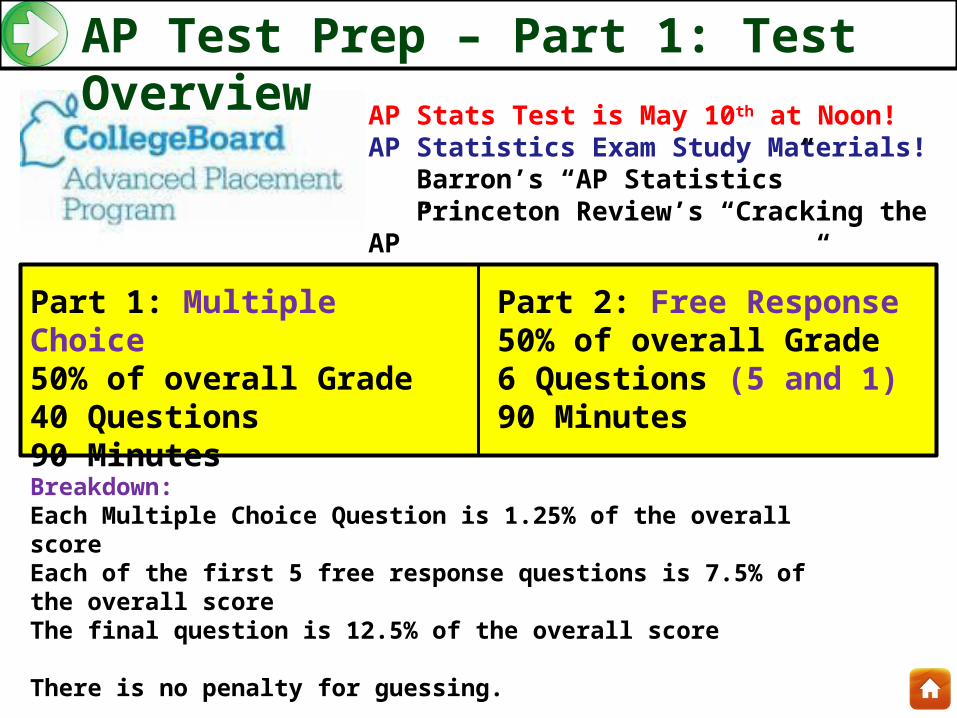
Exploratory AnalysisCh.1) Categorical vs. Quantitative Data Types of Graphs Describe the Distribution: SOCSCh.2) Density Curves (Area = 1) Normal Curves z-scores (Percentiles) Testing Normal: 5 Number Summary Box Plot
Use histogram to check normal 68-95-99.7 Test Normal Probability PlotCh.3) LSRL (y = a + bx, r, r2, residual)Ch.4) Marginal Distributions Conditional Distributions Simpsons Paradox Exponential Regression Power Regression
- Look back at the various types of graphs and be familiar with which can be used with categorical vs. quantitative. You can expect to see at least 2 questions on stem plots – possibly with a back to back stem plot. You will see 2+ histograms as well. It is possible that you will see an O-give but unlikely you would have to convert it backward into a histogram.
- Make sure you can find the area under a density curve if it is blocky. They’ll likely ask you to check if a data set is normal.
- Make sure you’re able to create and interpret a LSRL line – in particular, refresh your memory on r, r2, and residuals!
- Marginal and Conditional Distributions just means you’re able to interpret 2 way tables and answer questions about the data.
AP Test Prep – Part 2: Test Content

Planning a StudyCh.5) Designing Observational Studies Stratified Random Sample Multistage Sampling Design Bias Voluntary Response Convenience Sampling Leading Question Non Response Bias Response Bias Designing Experiments Matched Pairs Block Design
Control and Placebo Simulations
- If you split your observational study up by strata, you are stratifying it.
- Be sure that you understand the specific types of bias!
“The design is biased if it systematically favors certain outcomes.”- If you have each participant experience both
treatments (1 after the other), you’ve used a Matched Pairs design. You could also attempt to match each participant with a very similar participant so that for each treatment, you have similar experimental units. This would be an attempt at a Matched Pairs design but I don’t think they’ll ask about this.
- Make sure you can diagram experiments, especially if they are blocked.
- Using a placebo is an attempt to create a control group to which you can compare your results.
- Use randomInt to conduct simulations.
AP Test Prep – Part 2: Test Content

ProbabilityCh.6) Probability And (*)vs. Or (+) Replacement without Replacement Disjoint (not overlapping) Non Disjoint (overlapping)Ch.7) Discrete (integer columns) Continuous z-scores Combining Means Combining VarianceCh.8) Binomial Distributions Geometric Distributions Permutations Combinations Counting Principal
- Remember the Bridge and Moat!- Most sequential probability questions are
done with replacement (unless it says otherwise).
- Diagram – tree or chart – probability questions wherever possible. Most can be reasoned out with a diagram and fractions alone.
- Remember that discrete involves integer columns which makes them easier to work with but that means > and ≥ are different.
- Continuous is composed of infinitely small columns and unless it’s rectangular or normal, you don’t have the tools to calculate the areas.
- BinomPDF is a single column while BinomCDF is a single column and all the columns to the left.
AP Test Prep – Part 2: Test Content

- The sampling distribution is normal because of the Central Limit theorem if the rules of thumb are met. This is the principal which allows us to calculate probabilities and estimate standard deviation.
ALWAYS: Talk about the conditions!!1) Is the SRS from the population of interest?2) How big is the sample size? Is that big
enough to do the test you’re doing?You will get marked off big time if you don’t!
- You will only see t tests (see chapter 11 middle board), prop tests (ch.12), chi-squared (ch.13), and LSRL tests (ch.14).
- You can do this entire part with a calculator and get full credit! Just check the conditions, explain the hypothesis, show the t score and probability, and then clearly state if the Null or Alternative is supported!
InferenceCh.9) Sampling Distributions Central Limit TheoremCh.10) Inferences when σ is known (z)
Type 1 Error Type 2 ErrorCh.11) Inferences when σ is unknown (t)Ch.12) Proportions 1propZtest 2propZtestCh.13) Chi-Squared GOF Chi-Squared HomogeneityCh.14) LSRL Significance TestConfidence Intervals:They ONLY want to see:1. The interval (either notation is fine)2. What the interval means“We are 95% confident the true mean (or proportion) is between ____ and ____.”
AP Test Prep – Part 2: Test Content

Other topics that are not tested:Covariance (combining variance when they are not independent)Baye’s TheoremPooled t-tests Chapter 14.2 – LSRL Confidence Intervals
AP Test Prep – Part 2: Test Content
Read the Question
Re-Read the Question
ExploratoryAnalysis
LSRL
Categorical vs. QuantitativeSOCSCenter vs. Spread
y a bx xy ab
10a by xDesigning Studies
Observational Studies vs. ExperimentsSimulations
ProbabilityMutual Exclusivity Independence vs. DependenceAnd vs. OrDiscrete vs. ContinuousBinomial vs. Geometric
Significance Tests and Confidence Intervals
Z-Tests vs. T-Tests Samples vs. ProportionsConfidence Intervals Chi-Squared LSRL

AP Statistics Test Prep
Part 3: 2013 Released Qs

At first I thought I had to do a 1propZinterval, but I realized since they gave me the mean mean and standard deviation of a single sample, I had to do a t-interval.
We are 95% confident that the true mean for lead levels in crows to be between 4.4157 and 5.3843 ppm
AP Test Prep – Part 3: 2013 Released Qs

Pop > 10n
Football game attendees might be more school spirited which might cause bias in the results and overestimate the proportion which are satisfied with the appearance of the university buildings and grounds.
Using the list of 70,000 names, assign each student a number from 1 to 70,000, then have the number generator generate 500 unique random numbers from 1-70,000. The students who match those numbers are selected for the survey.
At first I thought this was saying the campuses were gender specific, but both campuses are mixed.
If the campuses are different, such that the results of the survey when stratified by location is expected to give different results, then it would be important to survey each campus individually rather than by gender.
AP Test Prep – Part 3: 2013 Released Qs

Simple z-score question.850 840
1.2667.9
xz
%100 89.8% 10.2%P
i) Combined mean = 840g840g – 20g for the carton = 820g for the dozen eggs, divided by 12 = 68.33 grams per egg
mean of X = 68.33gii) Combined standard deviation = 7.9g, so Combined variance = 62.41gContainer standard deviation = 1.7g, so variance = 2.89g 62.41 – 2.89 = 59.52g variance combined for 12 eggs 59.52 / 12 = 4.96g variance for a single egg 2.23g standard deviation for a single egg
standard deviation of X = 2.23g
AP Test Prep – Part 3: 2013 Released Qs

Because we’re given a 2-way table, I know that I need to do a Chi-Squared Test of Homogeneity. I need to first generate my Expected values. You can see those below. Then I need to do a Chi-Squared Homogeneity T-test.
Yes, at a probability of 1.12% there is significant evidence at the 5% level to support the alternative hypothesis. There appears to be an association between age group and fruit/vegi consumption.
H0: No association between age and fruit/vegi consumption.Ha: There is an association between age and fruit/vegi consumption.
AP Test Prep – Part 3: 2013 Released Qs
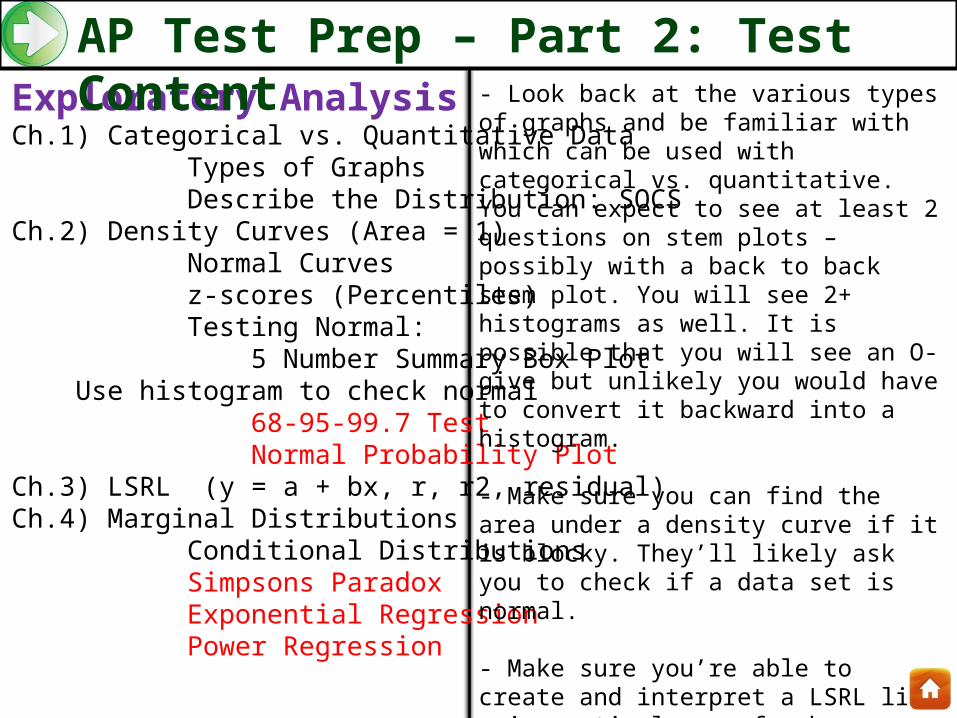
This is an observational study, meaning that treatments were not applied. Thus, lurking variables could be at work so we would not want to make any conclusions about causation.
If the situation were replicated and made into an experiment, control groups could be established to attempt to mitigate the impact of lurking variables. This would allow the researchers to make stronger conclusions about causation between meditation and blood pressure.
AP Test Prep – Part 3: 2013 Released Qs

b) There are a few issues – #1, the sample size of 11 is too small, it should be atleast 15 #2, To do a matched pairs design like this and set the u of the differences to zero for the Null, you want to have the same sample size
Values over here indicate the proportion with high bp was higher for non meditators
Values over here indicate the proportion with high bp was higher for meditators
The simulated distribution favors the left side, where meditators have a lower proportion of individuals with high bp than non meditators. For this reason, it might be reasonable to conclude that there is a relationship between meditation and blood pressure.
AP Test Prep – Part 3: 2013 Released Qs

AP Test Prep – Part 3: 2013 Released Qs

AP Test Prep – Part 3: 2013 Released Qs

AP Test Prep – Part 3: 2013 Released Qs

AP Statistics Test Prep
Part 4: Specific Concepts

AP Test Prep – Part 4: Specific ConceptsThings that are important to remember:
Type 1 Error: Rejecting the Null when it’s actually true - P(type 1 error) = alphaType 2 Error: Accepting the Null when it’s actually false –
P(type 2 error) is difficult to calculate (and not on the test, thankfully)Power = 1 – P (type 2 error)
High power is good – it means you’re unlikely to commit a type 2 errorWays to increase power: increase sample size or move alternative further away
Simulation: If you’re asked to explain how you would simulate something, make sure you clearly identify what different number values will mean, example:RandomInt(1,10)1-3: Miss4-10: make10 trials, results are: 5, 3, 2, 8, 5, 10, 1, 1, 6, 7
4 misses, 6 makes Experimental Result = 40% miss rate
Repeated this process 5 times and got: 40%, 60%, 10%, 30%, 40% Mean Miss Rate after 5 trials of experiment: 36% miss rate

Any t-test will fall into one of these categories: Considerations:
1 Sample t test – Use Calculator, set μ = whatever was givenMatched Pairs – Use calculator (use 1 sample t test), set μ = zero2 Sample T test – Use calculator, set μ1 = μ2
1 prop Z test – Use calculator, set p = whatever was given2 prop Z test – Use calculator, set p1 = p2
X2 GOF – No shortcut in a TI83 - sum((L1-L2)2/L2)X2 Homogeneity – use calculator, Matrix A and B – df = (r-1)(c-1)
LSRL – Use Calculator, df = n - 2
SRS comes from population of interestN ≥ 15
SRS comes from population of interestPop ≥ 10nNp ≥ 10 or n(1-p) ≥10
SRS comes from population of interest
Observations are independentTrue relationship is linearS the same everywhereResiduals are normally distributed
AP Test Prep – Part 4: Specific Concepts
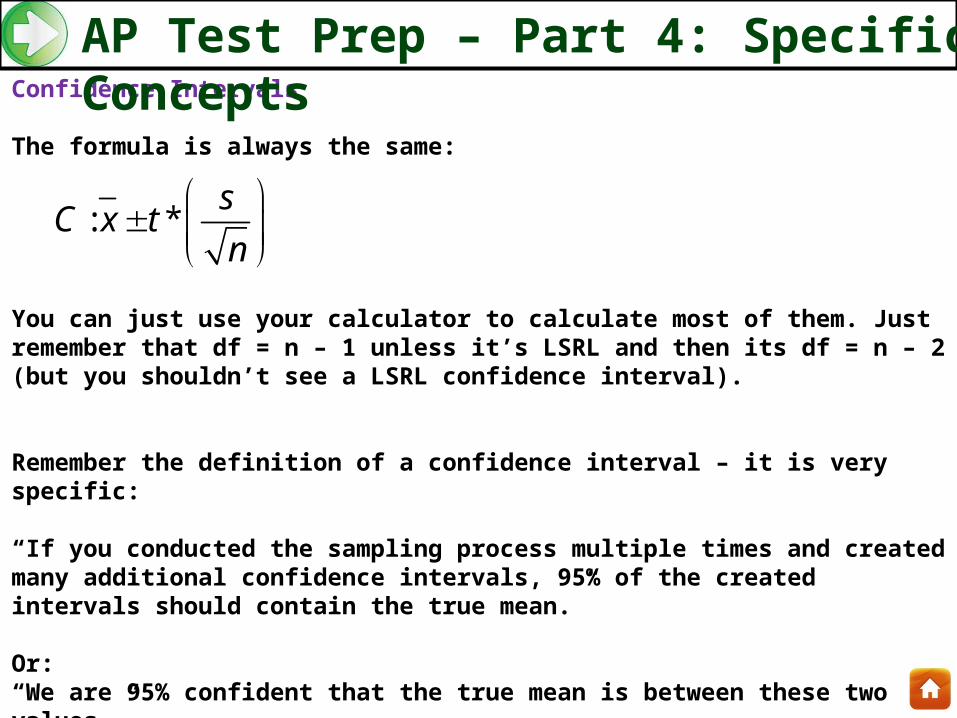
Confidence Intervals
The formula is always the same:
You can just use your calculator to calculate most of them. Just remember that df = n – 1 unless it’s LSRL and then its df = n – 2 (but you shouldn’t see a LSRL confidence interval).
Remember the definition of a confidence interval – it is very specific:
“If you conducted the sampling process multiple times and created many additional confidence intervals, 95% of the created intervals should contain the true mean.”
Or:“We are 95% confident that the true mean is between these two values.”
: *s
C x tn
AP Test Prep – Part 4: Specific Concepts

Combining Means and Variances
Let’s say that you and your friend are ordering 2 items at a restaurant – a burrito and a chicken salad. You know that the following about the time (in minutes) it takes to make each item:
mean standard deviationBurrito 2 1Chicken Salad 3 2
Combined mean is:Combined standard deviation is:
AP Test Prep – Part 4: Specific Concepts

AP Statistics Test Prep
Part 5: Stats in a Nutshell

AP Test Prep – Part 5: Stats in a Nutshell

AP Test Prep – Part 5: Stats in a Nutshell

AP Test Prep – Part 5: Stats in a Nutshell

AP Test Prep – Part 5: Stats in a Nutshell

AP Statistics Test Prep
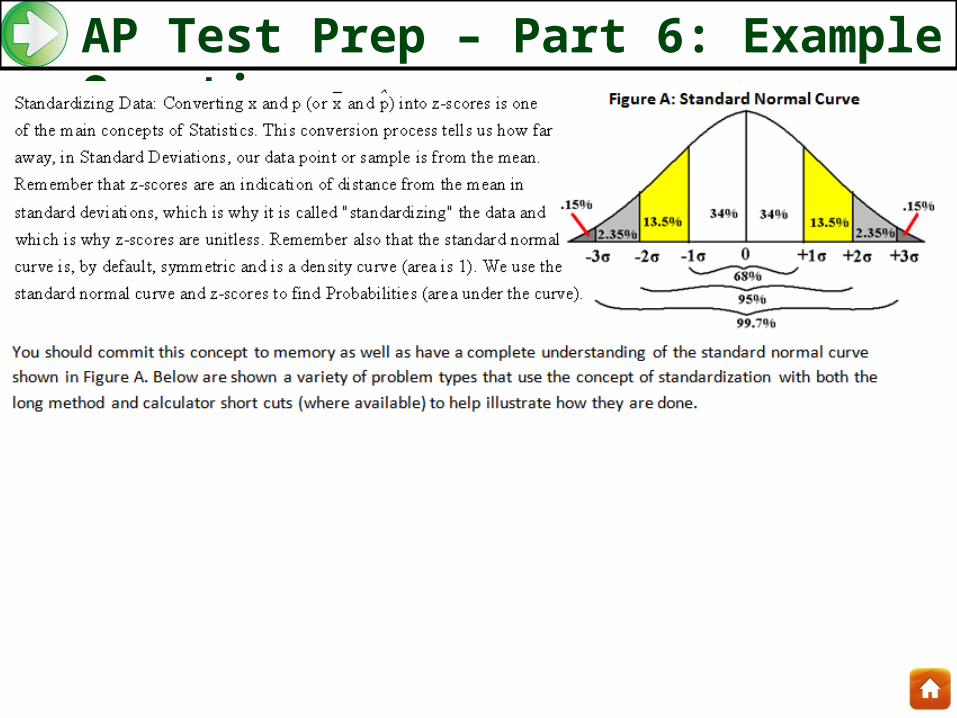
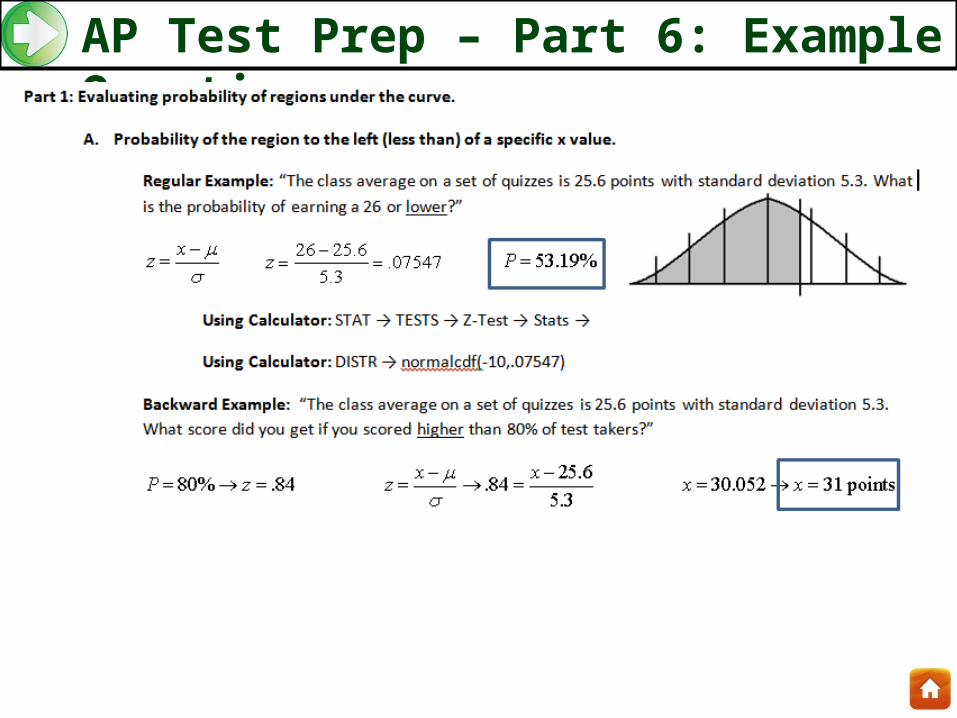
Part 6: Example Questions
AP Test Prep – Part 6: Example Questions
AP Test Prep – Part 6: Example Questions

AP Test Prep – Part 6: Example Questions

AP Test Prep – Part 6: Example Questions

AP Test Prep – Part 6: Example Questions

AP Test Prep – Part 6: Example Questions

AP Test Prep – Part 6: Example Questions

AP Test Prep – Part 6: Example Questions

AP Test Prep – Part 6: Example Questions

AP Test Prep – Part 6: Example Questions

AP Test Prep – Part 6: Example Questions

AP Test Prep – Part 6: Example Questions

AP Test Prep – Part 6: Example Questions

AP Test Prep – Part 6: Example Questions

AP Test Prep – Part 6: Example Questions

AP Statistics Test Prep
Part 7: Formulas

AP Test Prep – Part 7: Formulas

AP Test Prep – Part 7: Formulas

AP Test Prep – Part 7: Formulas

AP Test Prep – Part 7: Formulas

AP Statistics Test Prep
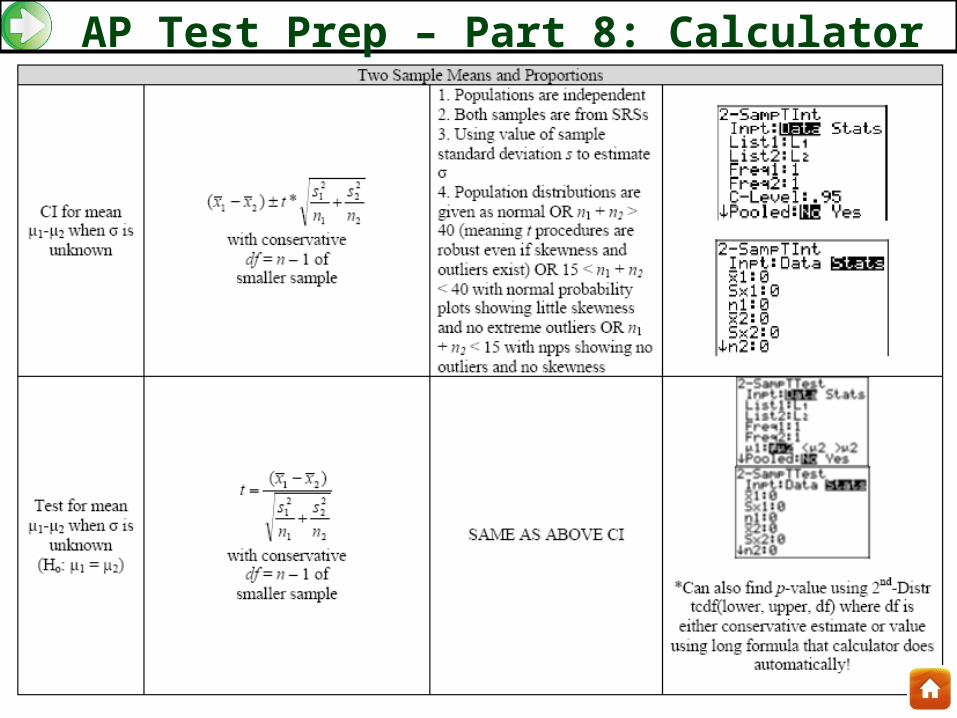
Part 8: Calculator Shortcuts

AP Test Prep – Part 8: Calculator Shortcuts

AP Test Prep – Part 8: Calculator Shortcuts
AP Test Prep – Part 8: Calculator Shortcuts
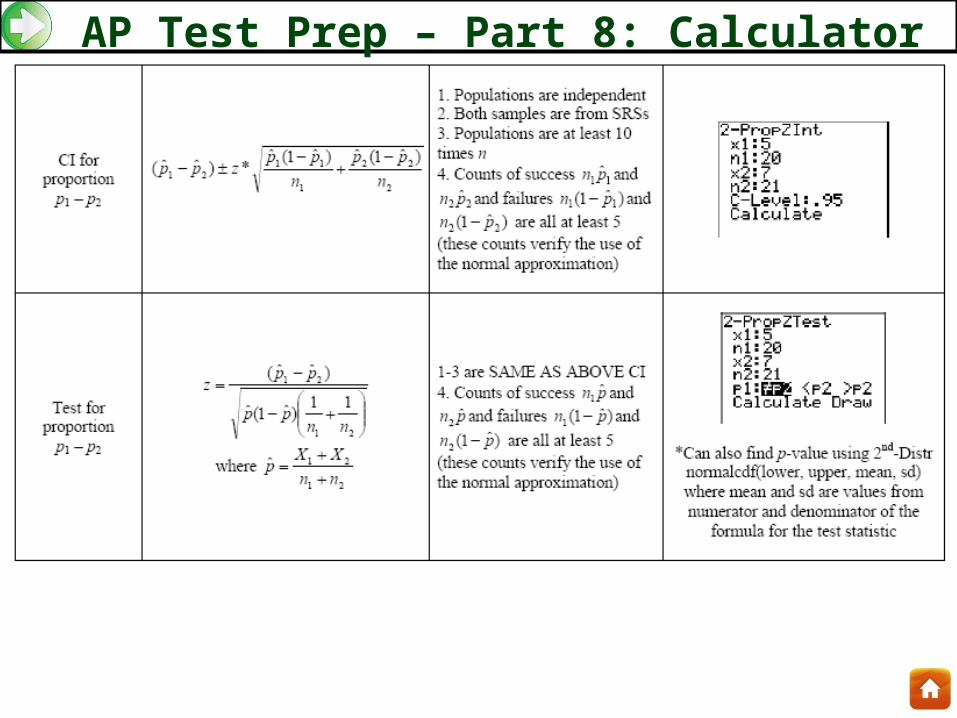
AP Test Prep – Part 8: Calculator Shortcuts

AP Test Prep – Part 8: Calculator Shortcuts

AP Test Prep – Part 8: Calculator Shortcuts

AP Statistics Test Prep
Part 9: Study Guide by Chapter

AP Test Prep – Part 9: Study Guide by ChapterChapter 1 – Exploring Data
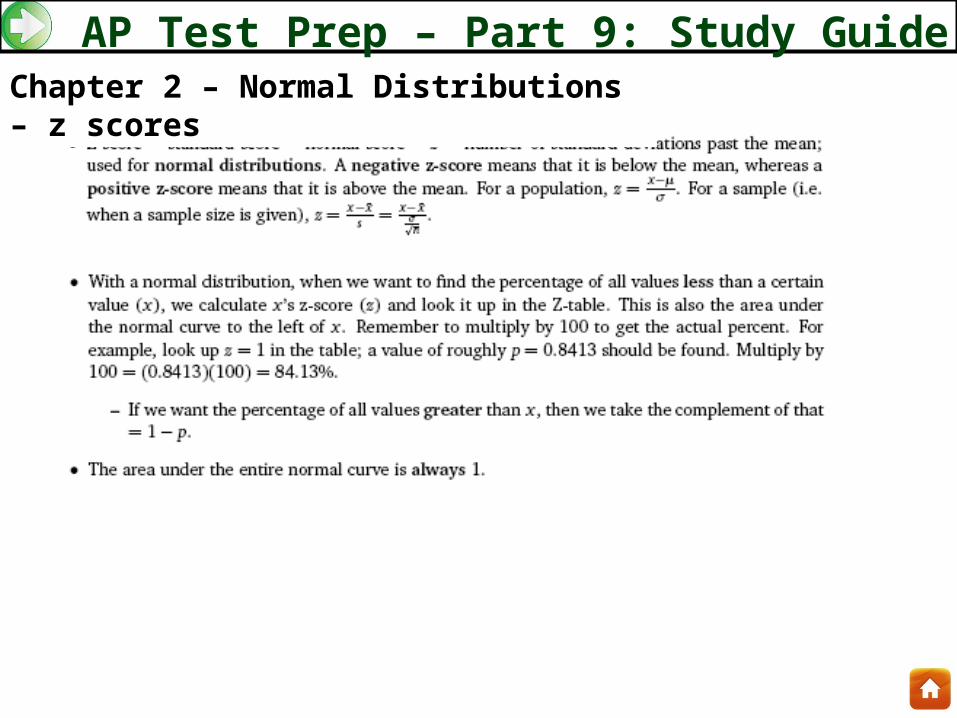
AP Test Prep – Part 9: Study Guide by ChapterChapter 2 – Normal Distributions – z scores
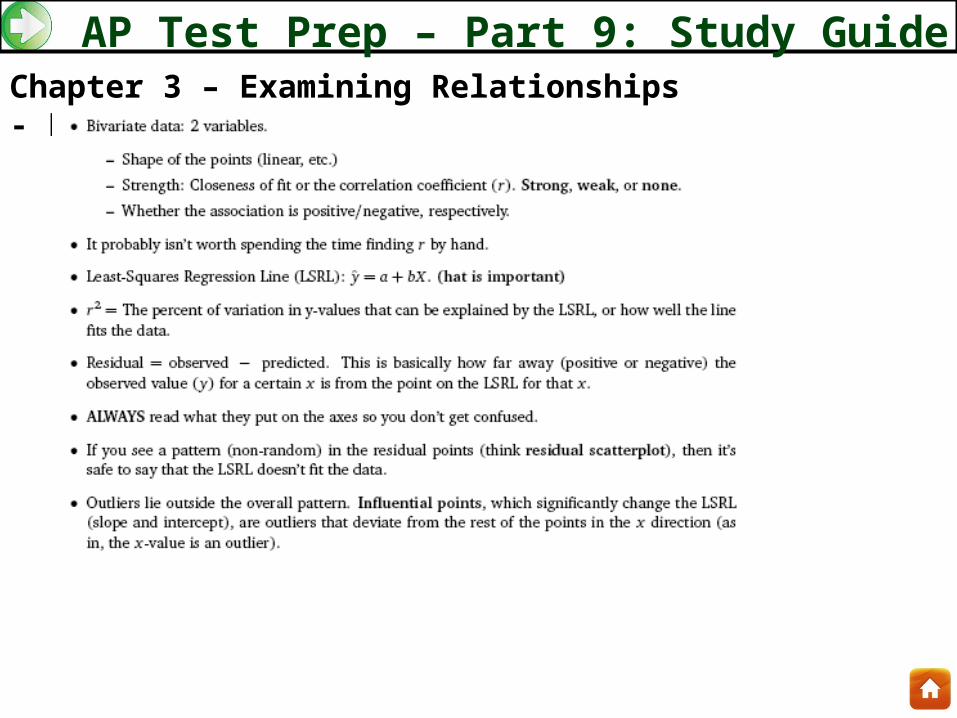
AP Test Prep – Part 9: Study Guide by ChapterChapter 3 – Examining Relationships - LSRL

AP Test Prep – Part 9: Study Guide by ChapterChapter 4 – 2 Variable Data

AP Test Prep – Part 9: Study Guide by ChapterChapter 5 – Producing Data
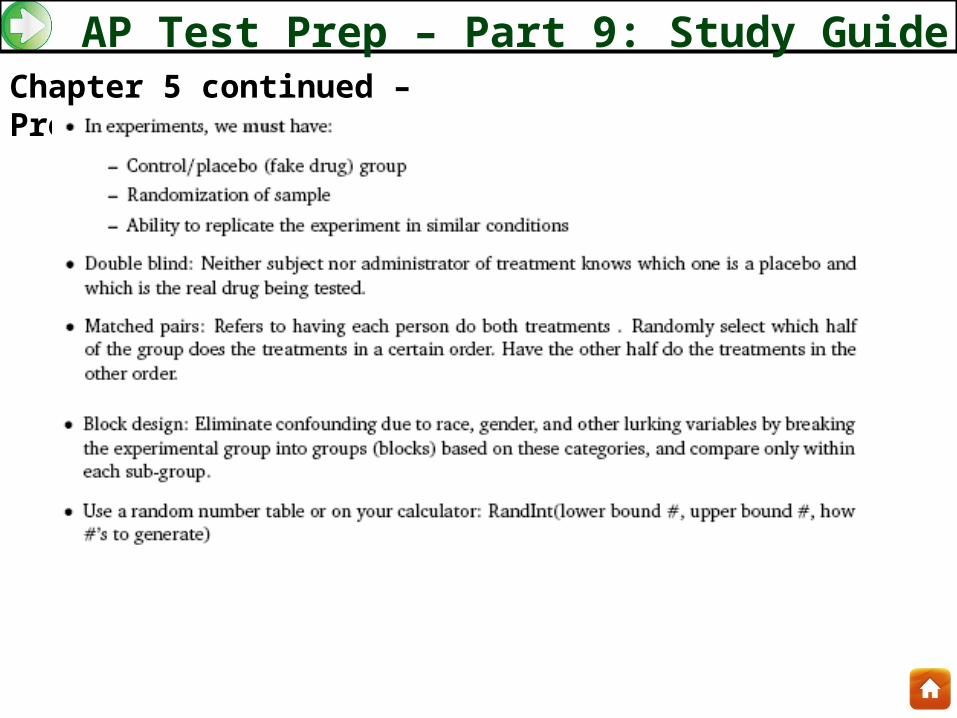
AP Test Prep – Part 9: Study Guide by ChapterChapter 5 continued – Producing Data

AP Test Prep – Part 9: Study Guide by ChapterChapter 6 - Probability
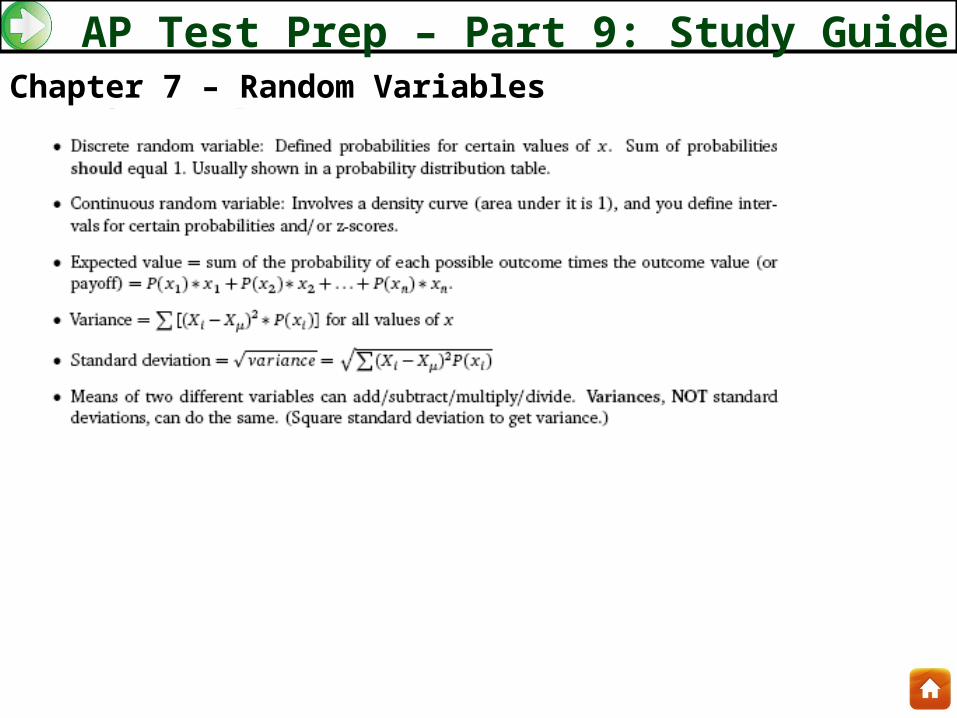
AP Test Prep – Part 9: Study Guide by ChapterChapter 7 – Random Variables

AP Test Prep – Part 9: Study Guide by ChapterChapter 8 – Binomial and Geometric Distributions

AP Test Prep – Part 9: Study Guide by ChapterChapter 9 – Sampling Distributions

AP Test Prep – Part 9: Study Guide by ChapterChapter 10 – Z Tests

AP Test Prep – Part 9: Study Guide by ChapterChapter 11 – T tests

AP Test Prep – Part 9: Study Guide by ChapterChapter 11 continued – T tests

AP Test Prep – Part 9: Study Guide by ChapterChapter 12 – Prop tests

AP Test Prep – Part 9: Study Guide by ChapterChapter 13 – Chi Squared
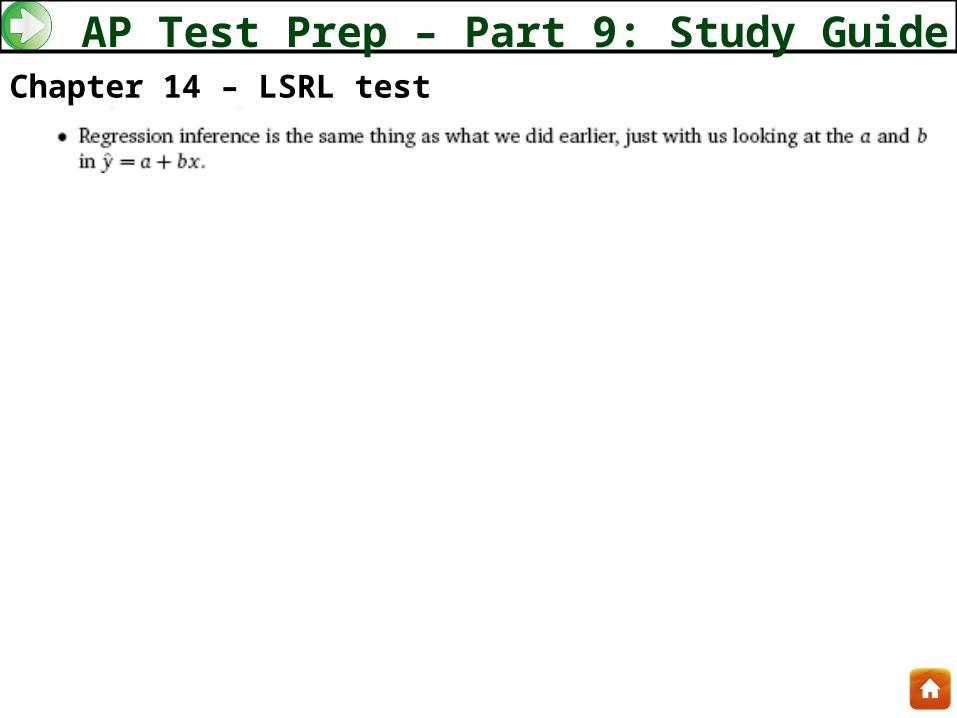
AP Test Prep – Part 9: Study Guide by ChapterChapter 14 – LSRL test
Related Documents