2022 AP ® Statistics Free-Response Questions © 2022 College Board. College Board, Advanced Placement, AP, AP Central, and the acorn logo are registered trademarks of College Board. Visit College Board on the web: collegeboard.org. AP Central is the official online home for the AP Program: apcentral.collegeboard.org.

Welcome message from author
This document is posted to help you gain knowledge. Please leave a comment to let me know what you think about it! Share it to your friends and learn new things together.
Transcript
2022
AP®
StatisticsFree-Response Questions
© 2022 College Board. College Board, Advanced Placement, AP, AP Central, and the acorn logo are registered trademarks of College Board. Visit College Board on the web: collegeboard.org.
AP Central is the official online home for the AP Program: apcentral.collegeboard.org.
Formulas for AP Statistics
I. Descriptive Statistics
1 ∑ xi x = ∑ x = i n n 1 2 ∑( xi − x )2
s = ∑( x − x ) = x in − 1 n − 1
y = a + bx y = a + bx
1 xi − x yi − y r = ∑ n − 1 sx sy
syb = r sx
II. Probability and Distributions
P A ∪ B = P A + P B − P A ∩ B ( ) ( ) ( ) ( ) P A B( ∩ )P A B| =( ) P B( )
Probability Distribution Mean Standard Deviation
Discrete random variable, X µ = (E X ) = ∑ ( )x P x X i i 2σ = ∑( x − µ ) ( )P xX i X i
If 𝑋𝑋 has a binomial distribution with parameters n and p, then:
n x n x−(P X = x) = p (1 − p) x
where x = 0, 1, 2, 3, , n
µ = npX σ = np (1 − p)X
If 𝑋𝑋 has a geometric distribution with parameter p, then:
x 1−(P X = x) = (1 − p) p
where x = 1, 2, 3,
1µ = X p 1 − pσ = X p
III. Sampling Distributions and Inferential Statistics
Standardized test statistic: statistic − parameter standard error of the statistic
Confidence interval: statistic ± (critical value )( standard error of statistic )
Chi-square statistic: (observed − expected)2 2χ = ∑ expected
III. Sampling Distributions and Inferential Statistics (continued)
Sampling distributions for proportions:
Random Variable
Parameters of Sampling Distribution
Standard Error*
of Sample Statistic For one population:
p µ p = p p (1 − p)σ =p n
p (1 − p)s =p n
For two populations:
p ˆ− p1 2 µ = p − p1 2
p − p1 2 p (1 − p ) p (1 − p )1 1 2 2σ = +p − p1 2 n n1 2
p (1 − p ) p (1 − p )1 1 2 2s = +p − p1 2 n n1 2
When p = p 1 2 is assumed:
1 1 s = p (1 − p ) +p − p c c 1 2 n n 1 2
X + X1 2where p = c n + n1 2
Sampling distributions for means:
Random Variable Parameters of Sampling Distribution Standard Error*
of Sample Statistic For one population:
X µ = µX
σσ = X n s s = X n
For two populations: X − X1 2
µ = µ − µX − X 1 21 2 2 2σ σ1 2σ = +X − X1 2 n n1 2
2 2s s1 2s = +X − X1 2 n n1 2
Sampling distributions for simple linear regression:
Random Variable Parameters of Sampling Distribution Standard Error*
of Sample Statistic
For slope: b
= βµb
σσ = ,b σ n x
)2∑( x − xiwhere σ = x n
s s = ,b s n − 1 x
)2∑( y − yi iwhere s = n − 2
)2∑( x − xiand s = x n − 1
*S tandard deviation is a measurement of variability from the theoretical population. Standard error is the estimate of the standard de viation. If the standard deviation of the statistic is assumed to be known, then the standard deviation should be used instead of the standard error.
AP® Statistics 2022 Free-Response Questions
Begin your response to QUESTION 1 on this page.
STATISTICS
SECTION II
Total Time—1 hour and 30 minutes
6 Questions
Part A
Suggested Time—1 hour and 5 minutes
5 Questions
Directions: Show all your work. Indicate clearly the methods you use, because you will be scored on the correctness of your methods as well as on the accuracy and completeness of your results and explanations.
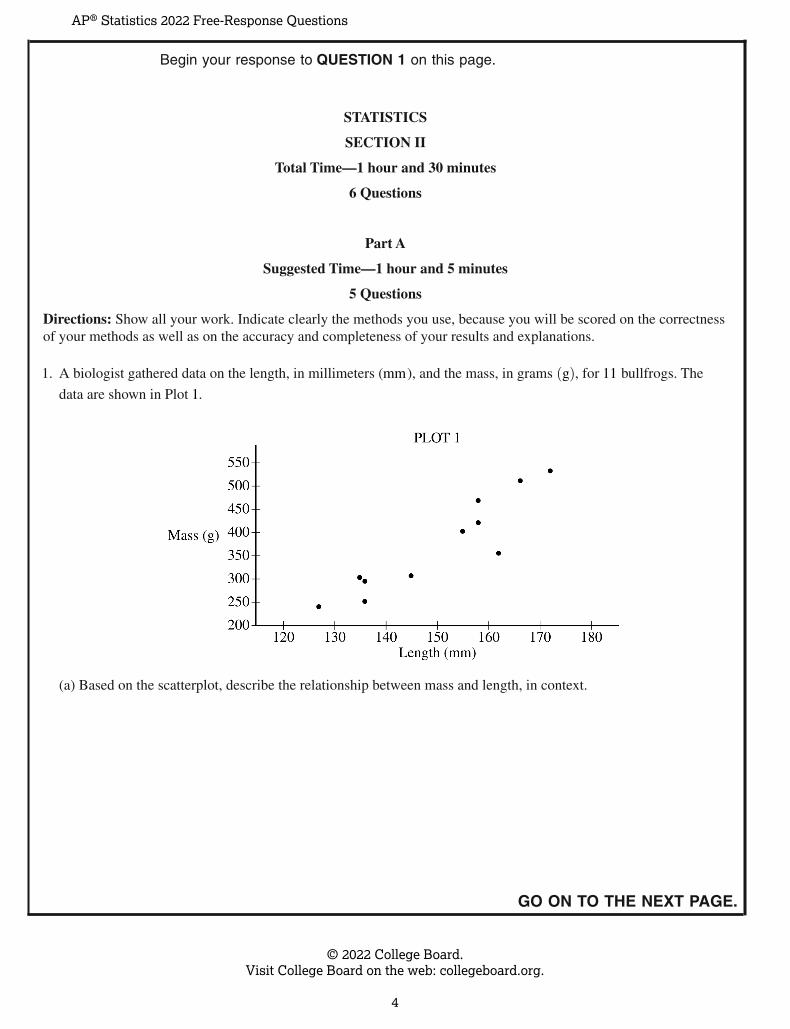
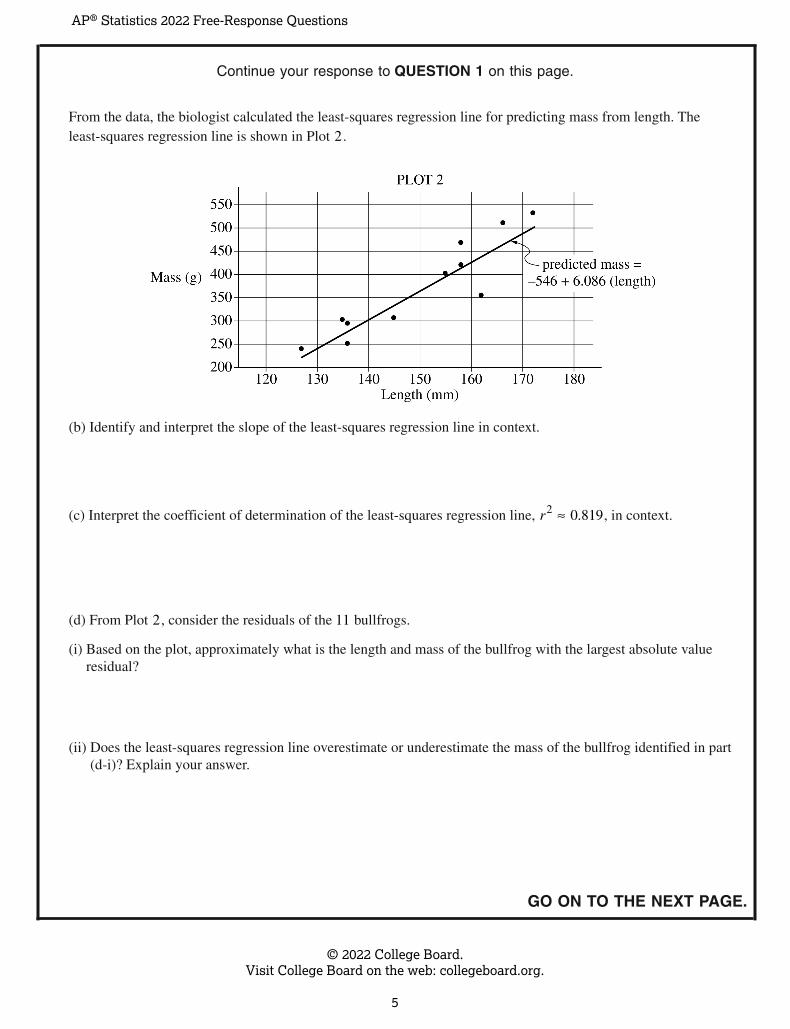
1. A biologist gathered data on the length, in millimeters (mm), and the mass, in grams (g) , for 11 bullfrogs. The
data are shown in Plot 1.
(a) Based on the scatterplot, describe the relationship between mass and length, in context.
GO ON TO THE NEXT PAGE.
© 2022 College Board. Visit College Board on the web: collegeboard.org.
4
AP® Statistics 2022 Free-Response Questions
Continue your response to QUESTION 1 on this page.
From the data, the biologist calculated the least-squares regression line for predicting mass from length. The least-squares regression line is shown in Plot 2 .
(b) Identify and interpret the slope of the least-squares regression line in context.
(c) Interpret the coefficient of determination of the least-squares regression line, r 2 ª 0.819, in context.
(d) From Plot 2 , consider the residuals of the 11 bullfrogs.
(i) Based on the plot, approximately what is the length and mass of the bullfrog with the largest absolute value residual?
(ii) Does the least-squares regression line overestimate or underestimate the mass of the bullfrog identified in part (d-i)? Explain your answer.
GO ON TO THE NEXT PAGE.
© 2022 College Board. Visit College Board on the web: collegeboard.org.
5
AP® Statistics 2022 Free-Response Questions
Begin your response to QUESTION 2 on this page.
2. A dermatologist will conduct an experiment to investigate the effectiveness of a new drug to treat acne. The dermatologist has recruited 36 pairs of identical twins. Each person in the experiment has acne and each person in the experiment will receive either the new drug or a placebo. After each person in the experiment uses either the new drug or the placebo for 2 weeks, the dermatologist will evaluate the improvement in acne severity for each person on a scale from 0 (no improvement) to 100 (complete cure).
(a) Identify the treatments, experimental units, and response variable of the experiment.
•
•
•
Treatments:
Experimental units:
Response variable:
Each twin in the experiment has a severity of acne similar to that of the other twin. However, the severity of acne differs from one twin pair to another.
(b) For the dermatologist’s experiment, describe a statistical advantage of using a matched-pairs design where twins are paired rather than using a completely randomized design.
GO ON TO THE NEXT PAGE.
© 2022 College Board. Visit College Board on the web: collegeboard.org.
6
AP® Statistics 2022 Free-Response Questions
Continue your response to QUESTION 2 on this page.
(c) For the dermatologist’s experiment, describe how the treatments can be randomly assigned to people using a matched-pairs design in which twins are paired.
GO ON TO THE NEXT PAGE.
© 2022 College Board. Visit College Board on the web: collegeboard.org.
7
AP® Statistics 2022 Free-Response Questions
Begin your response to QUESTION 3 on this page.
3. A machine at a manufacturing company is programmed to fill shampoo bottles such that the amount of shampoo in each bottle is normally distributed with mean 0.60 liter and standard deviation 0.04 liter. Let the random variable A represent the amount of shampoo, in liters, that is inserted into a bottle by the filling machine.
(a) A bottle is considered to be underfilled if it has less than 0.50 liter of shampoo. Determine the probability that a randomly selected bottle of shampoo will be underfilled. Show your work.
After the bottles are filled, they are placed in boxes of 10 bottles per box. After the bottles are placed in the boxes, several boxes are placed in a crate for shipping to a beauty supply warehouse. The manufacturing company’s contract with the beauty supply warehouse states that one box will be randomly selected from a crate. If 2 or more bottles in the selected box are underfilled, the entire crate will be rejected and sent back to the manufacturing company.
(b) The beauty supply warehouse manager is interested in the probability that a crate shipped to the warehouse will be rejected. Assume that the amounts of shampoo in the bottles are independent of each other.
(i) Define the random variable of interest for the warehouse manager and state how the random variable is distributed.
(ii) Determine the probability that a crate will be rejected by the warehouse manager. Show your work.
GO ON TO THE NEXT PAGE.
© 2022 College Board. Visit College Board on the web: collegeboard.org.
8
AP® Statistics 2022 Free-Response Questions
Continue your response to QUESTION 3 on this page.
To reduce the number of crates rejected by the beauty supply warehouse manager, the manufacturing company is considering adjusting the programming of the filling machine so that the amount of shampoo in each bottle is normally distributed with mean 0.56 liter and standard deviation 0.03 liter.
(c) Would you recommend that the manufacturing company use the original programming of the filling machine or the adjusted programming of the filling machine? Provide a statistical justification for your choice.
GO ON TO THE NEXT PAGE.
© 2022 College Board. Visit College Board on the web: collegeboard.org.
9
AP® Statistics 2022 Free-Response Questions
Begin your response to QUESTION 4 on this page.
4. A survey conducted by a national research center asked a random sample of 920 teenagers in the United States how often they use a video streaming service. From the sample, 59% answered that they use a video streaming service every day.
(a) Construct and interpret a 95% confidence interval for the proportion of all teenagers in the United States who would respond that they use a video streaming service every day.
GO ON TO THE NEXT PAGE.
© 2022 College Board. Visit College Board on the web: collegeboard.org.
10
AP® Statistics 2022 Free-Response Questions
Continue your response to QUESTION 4 on this page.
(b) Based on the confidence interval in part (a), do the sample data provide convincing statistical evidence that the proportion of all teenagers in the United States who would respond that they use a video streaming service every day is not 0.5? Justify your answer.
GO ON TO THE NEXT PAGE.
© 2022 College Board. Visit College Board on the web: collegeboard.org.
11
AP® Statistics 2022 Free-Response Questions
Begin your response to QUESTION 5 on this page.
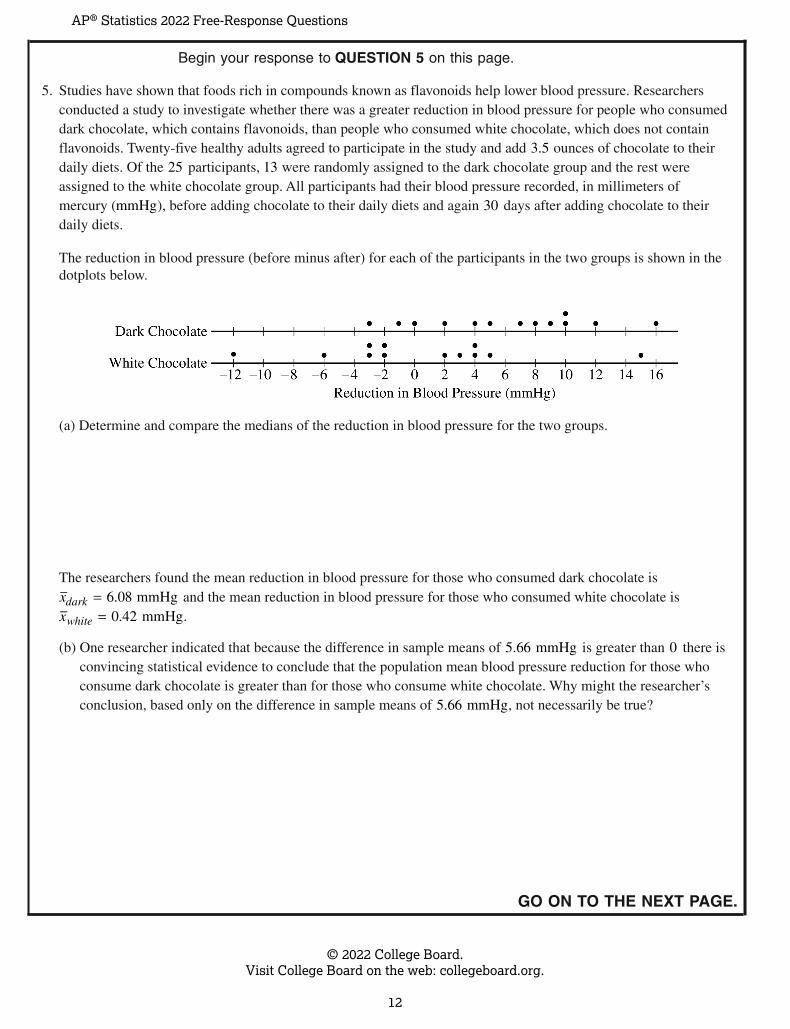
5. Studies have shown that foods rich in compounds known as flavonoids help lower blood pressure. Researchers conducted a study to investigate whether there was a greater reduction in blood pressure for people who consumed dark chocolate, which contains flavonoids, than people who consumed white chocolate, which does not contain flavonoids. Twenty-five healthy adults agreed to participate in the study and add 3.5 ounces of chocolate to their daily diets. Of the 25 participants, 13 were randomly assigned to the dark chocolate group and the rest were assigned to the white chocolate group. All participants had their blood pressure recorded, in millimeters of mercury (mmHg), before adding chocolate to their daily diets and again 30 days after adding chocolate to their daily diets.
The reduction in blood pressure (before minus after) for each of the participants in the two groups is shown in the dotplots below.
(a) Determine and compare the medians of the reduction in blood pressure for the two groups.
The researchers found the mean reduction in blood pressure for those who consumed dark chocolate is xdark = 6.08 mmHg and the mean reduction in blood pressure for those who consumed white chocolate is x = 0.42 mmHgwhite .
(b) One researcher indicated that because the difference in sample means of 5.66 mmHg is greater than 0 there is convincing statistical evidence to conclude that the population mean blood pressure reduction for those who consume dark chocolate is greater than for those who consume white chocolate. Why might the researcher’s conclusion, based only on the difference in sample means of 5.66 mmHg, not necessarily be true?
GO ON TO THE NEXT PAGE.
© 2022 College Board. Visit College Board on the web: collegeboard.org.
12
AP® Statistics 2022 Free-Response Questions
Continue your response to QUESTION 5 on this page.
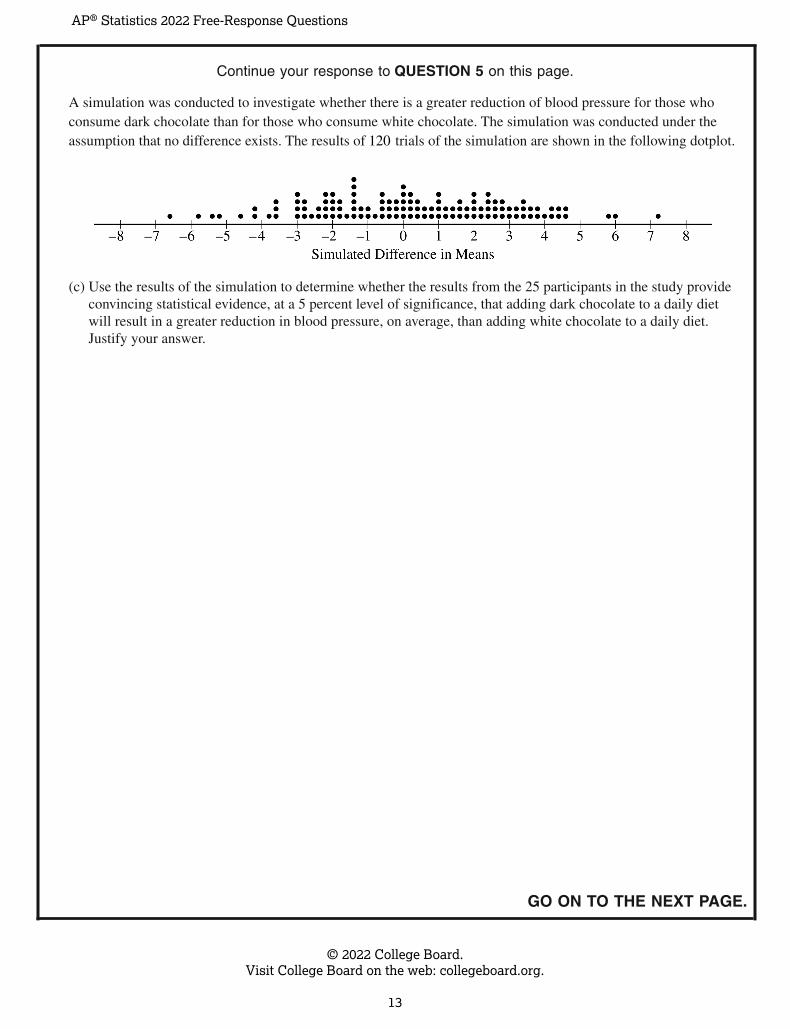
A simulation was conducted to investigate whether there is a greater reduction of blood pressure for those who consume dark chocolate than for those who consume white chocolate. The simulation was conducted under the assumption that no difference exists. The results of 120 trials of the simulation are shown in the following dotplot.
(c) Use the results of the simulation to determine whether the results from the 25 participants in the study provide convincing statistical evidence, at a 5 percent level of significance, that adding dark chocolate to a daily diet will result in a greater reduction in blood pressure, on average, than adding white chocolate to a daily diet. Justify your answer.
GO ON TO THE NEXT PAGE.
© 2022 College Board. Visit College Board on the web: collegeboard.org.
13
AP® Statistics 2022 Free-Response Questions
Begin your response to QUESTION 6 on this page.
STATISTICS
SECTION II, Part B
Suggested Time—25 minutes
1 Question
Directions: Show all your work. Indicate clearly the methods you use, because you will be scored on the correctness of your methods as well as on the accuracy and completeness of your results and explanations.
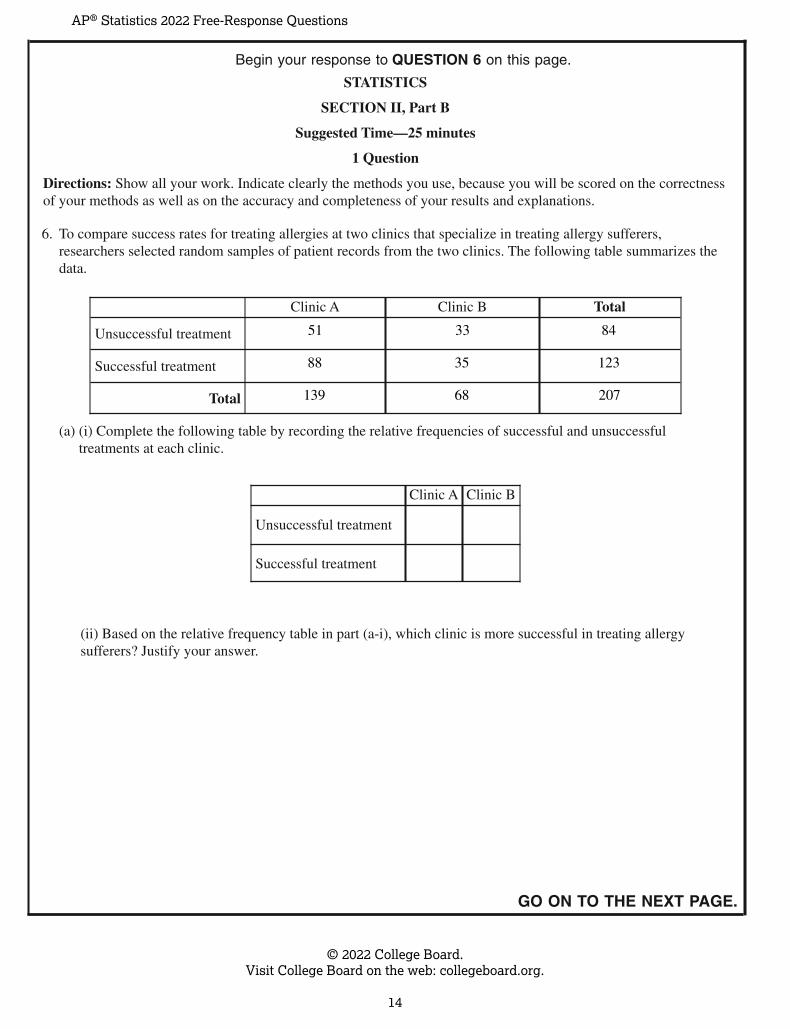
6. To compare success rates for treating allergies at two clinics that specialize in treating allergy sufferers,researchers selected random samples of patient records from the two clinics. The following table summarizes thedata.
Clinic A Clinic B Total
Unsuccessful treatment 51 33 84
Successful treatment 88 35 123
Total 139 68 207
(a) (i) Complete the following table by recording the relative frequencies of successful and unsuccessfultreatments at each clinic.
Clinic A Clinic B
Unsuccessful treatment
Successful treatment
(ii) Based on the relative frequency table in part (a-i), which clinic is more successful in treating allergysufferers? Justify your answer.
GO ON TO THE NEXT PAGE.
© 2022 College Board. Visit College Board on the web: collegeboard.org.
14
AP® Statistics 2022 Free-Response Questions
Continue your response to QUESTION 6 on this page.
(b) Based on the design of the study, would a statistically significant result allow the researchers to conclude thatreceiving treatments at the clinic you selected in part (a-ii) causes a higher percentage of successful treatmentsthan at the other clinic? Explain your answer.
GO ON TO THE NEXT PAGE.
© 2022 College Board. Visit College Board on the web: collegeboard.org.
15
AP® Statistics 2022 Free-Response Questions
Continue your response to QUESTION 6 on this page.
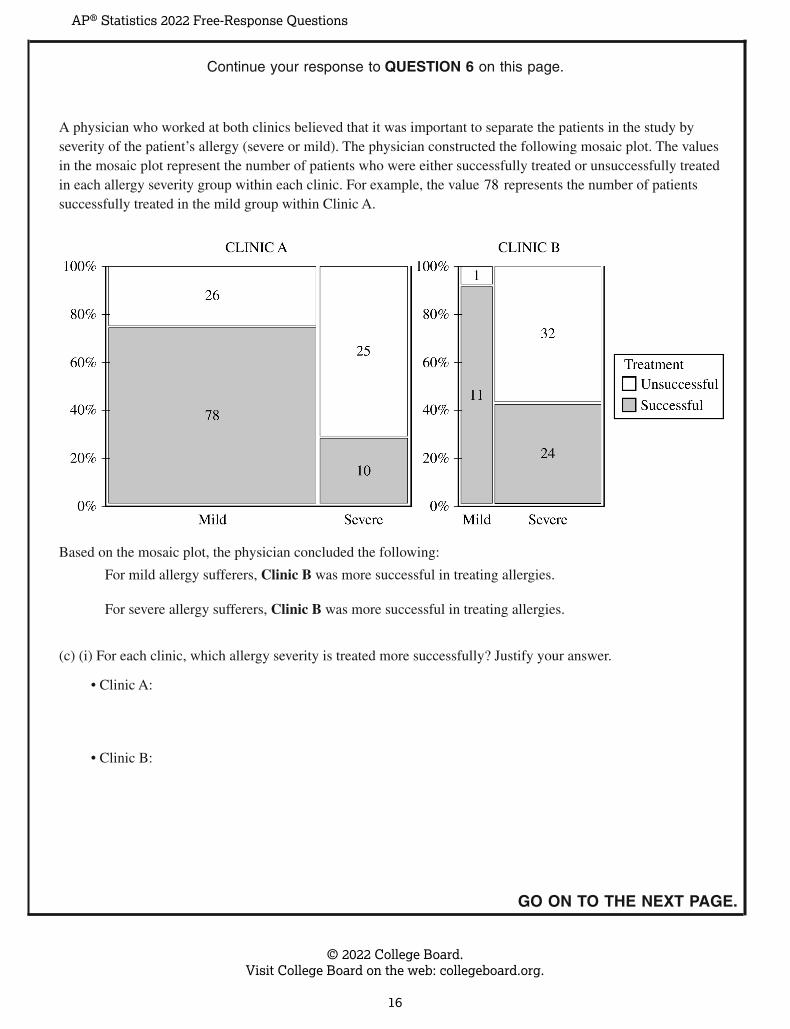
A physician who worked at both clinics believed that it was important to separate the patients in the study by severity of the patient’s allergy (severe or mild). The physician constructed the following mosaic plot. The values in the mosaic plot represent the number of patients who were either successfully treated or unsuccessfully treated in each allergy severity group within each clinic. For example, the value 78 represents the number of patients successfully treated in the mild group within Clinic A.
Based on the mosaic plot, the physician concluded the following:
For mild allergy sufferers, Clinic B was more successful in treating allergies.
For severe allergy sufferers, Clinic B was more successful in treating allergies.
(c) (i) For each clinic, which allergy severity is treated more successfully? Justify your answer.
•
•
Clinic A:
Clinic B:
GO ON TO THE NEXT PAGE.
© 2022 College Board. Visit College Board on the web: collegeboard.org.
16
AP® Statistics 2022 Free-Response Questions
Continue your response to QUESTION 6 on this page.
(ii) For each clinic, which allergy severity is more likely to be treated? Justify your answer.
•
•
Clinic A:
Clinic B:
(d) Using your answers from part (c), give a reasonable explanation of why the more successful clinic identified in part (a-ii) is the same as or different from the physician’s conclusion that Clinic B is more successful in treating both severe and mild allergies.
GO ON TO THE NEXT PAGE.
© 2022 College Board. Visit College Board on the web: collegeboard.org.
17
AP® Statistics 2022 Free-Response Questions
STOP
END OF EXAM
© 2022 College Board. Visit College Board on the web: collegeboard.org.
18
Probability
z
Table entry for z is the probability lying below z.
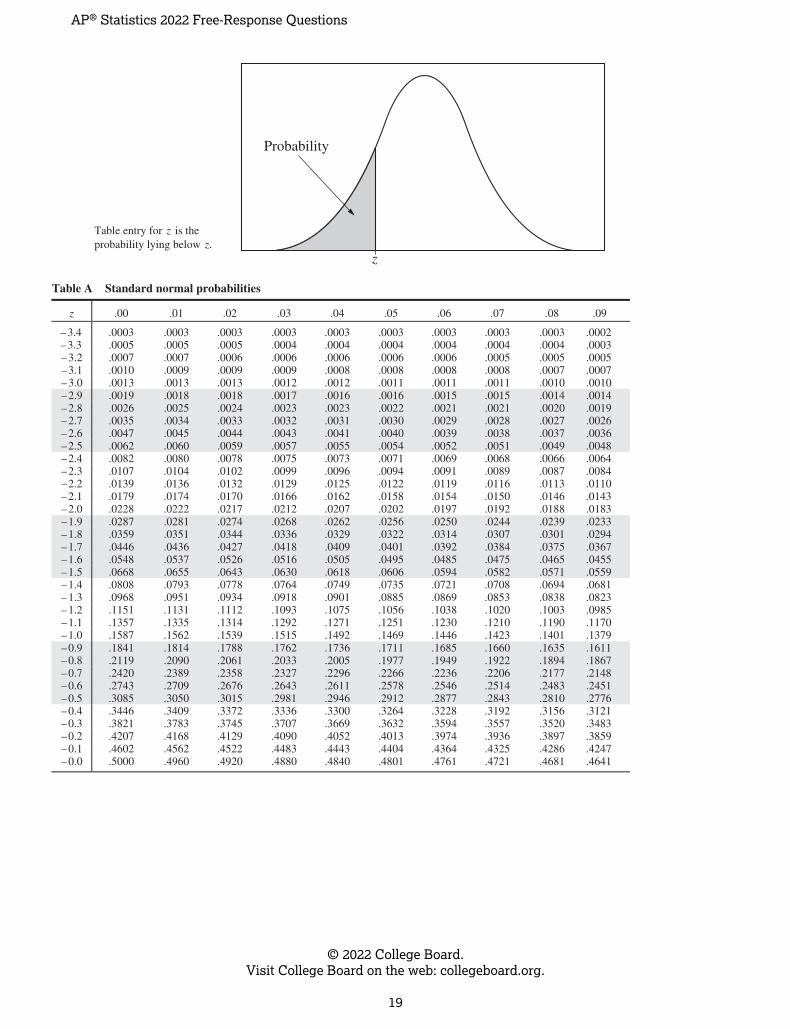
Table A Standard normal probabilities
z .00 .01 .02 .03 .04 .05 .06 .07 .08 .09
–3.4 .0003 .0003 .0003 .0003 .0003 .0003 .0003 .0003 .0003 .0002–3.3 .0005 .0005 .0005 .0004 .0004 .0004 .0004 .0004 .0004 .0003–3.2 .0007 .0007 .0006 .0006 .0006 .0006 .0006 .0005 .0005 .0005–3.1 .0010 .0009 .0009 .0009 .0008 .0008 .0008 .0008 .0007 .0007–3.0 .0013 .0013 .0013 .0012 .0012 .0011 .0011 .0011 .0010 .0010–2.9 .0019 .0018 .0018 .0017 .0016 .0016 .0015 .0015 .0014 .0014–2.8 .0026 .0025 .0024 .0023 .0023 .0022 .0021 .0021 .0020 .0019–2.7 .0035 .0034 .0033 .0032 .0031 .0030 .0029 .0028 .0027 .0026–2.6 .0047 .0045 .0044 .0043 .0041 .0040 .0039 .0038 .0037 .0036–2.5 .0062 .0060 .0059 .0057 .0055 .0054 .0052 .0051 .0049 .0048–2.4 .0082 .0080 .0078 .0075 .0073 .0071 .0069 .0068 .0066 .0064–2.3 .0107 .0104 .0102 .0099 .0096 .0094 .0091 .0089 .0087 .0084–2.2 .0139 .0136 .0132 .0129 .0125 .0122 .0119 .0116 .0113 .0110–2.1 .0179 .0174 .0170 .0166 .0162 .0158 .0154 .0150 .0146 .0143–2.0 .0228 .0222 .0217 .0212 .0207 .0202 .0197 .0192 .0188 .0183–1.9 .0287 .0281 .0274 .0268 .0262 .0256 .0250 .0244 .0239 .0233–1.8 .0359 .0351 .0344 .0336 .0329 .0322 .0314 .0307 .0301 .0294–1.7 .0446 .0436 .0427 .0418 .0409 .0401 .0392 .0384 .0375 .0367–1.6 .0548 .0537 .0526 .0516 .0505 .0495 .0485 .0475 .0465 .0455–1.5 .0668 .0655 .0643 .0630 .0618 .0606 .0594 .0582 .0571 .0559–1.4 .0808 .0793 .0778 .0764 .0749 .0735 .0721 .0708 .0694 .0681–1.3 .0968 .0951 .0934 .0918 .0901 .0885 .0869 .0853 .0838 .0823–1.2 .1151 .1131 .1112 .1093 .1075 .1056 .1038 .1020 .1003 .0985–1.1 .1357 .1335 .1314 .1292 .1271 .1251 .1230 .1210 .1190 .1170–1.0 .1587 .1562 .1539 .1515 .1492 .1469 .1446 .1423 .1401 .1379–0.9 .1841 .1814 .1788 .1762 .1736 .1711 .1685 .1660 .1635 .1611–0.8 .2119 .2090 .2061 .2033 .2005 .1977 .1949 .1922 .1894 .1867–0.7 .2420 .2389 .2358 .2327 .2296 .2266 .2236 .2206 .2177 .2148–0.6 .2743 .2709 .2676 .2643 .2611 .2578 .2546 .2514 .2483 .2451–0.5 .3085 .3050 .3015 .2981 .2946 .2912 .2877 .2843 .2810 .2776–0.4 .3446 .3409 .3372 .3336 .3300 .3264 .3228 .3192 .3156 .3121–0.3 .3821 .3783 .3745 .3707 .3669 .3632 .3594 .3557 .3520 .3483–0.2 .4207 .4168 .4129 .4090 .4052 .4013 .3974 .3936 .3897 .3859–0.1 .4602 .4562 .4522 .4483 .4443 .4404 .4364 .4325 .4286 .4247–0.0 .5000 .4960 .4920 .4880 .4840 .4801 .4761 .4721 .4681 .4641
© 2022 College Board. Visit College Board on the web: collegeboard.org.
19
AP® Statistics 2022 Free-Response Questions
Probability
z
Table entry for z is the probability lying below z.
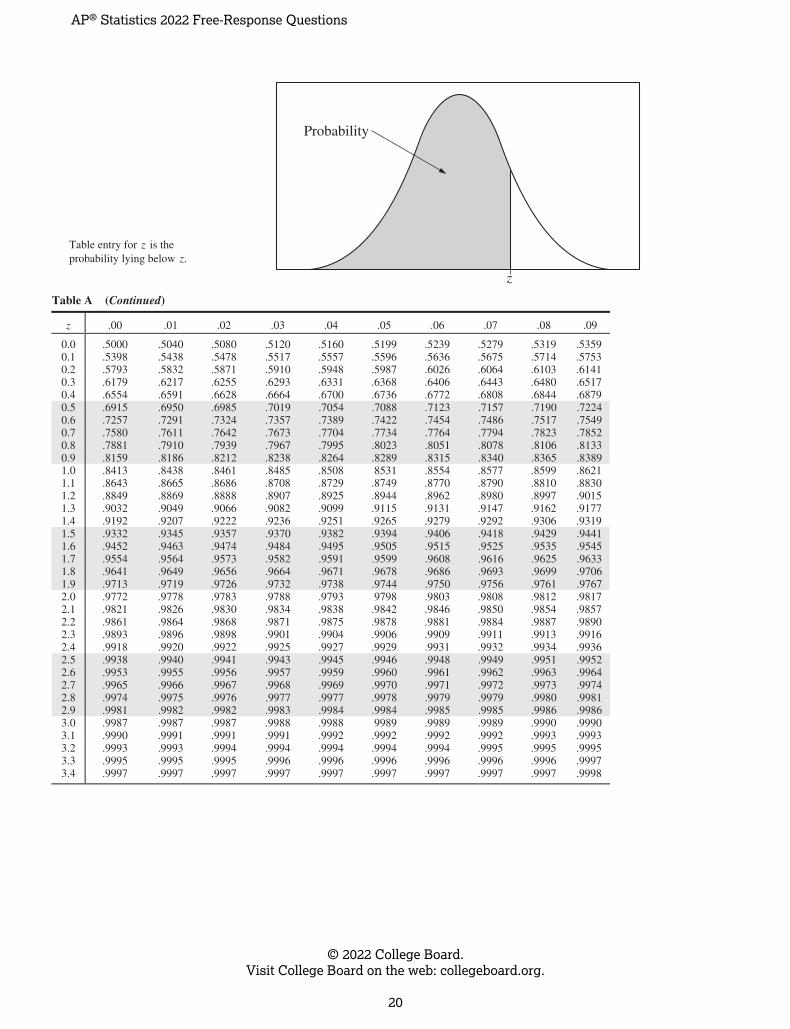
Table A (Continued)
z .00 .01 .02 .03 .04 .05 .06 .07 .08 .09
0.0 .5000 .5040 .5080 .5120 .5160 .5199 .5239 .5279 .5319 .53590.1 .5398 .5438 .5478 .5517 .5557 .5596 .5636 .5675 .5714 .57530.2 .5793 .5832 .5871 .5910 .5948 .5987 .6026 .6064 .6103 .61410.3 .6179 .6217 .6255 .6293 .6331 .6368 .6406 .6443 .6480 .65170.4 .6554 .6591 .6628 .6664 .6700 .6736 .6772 .6808 .6844 .68790.5 .6915 .6950 .6985 .7019 .7054 .7088 .7123 .7157 .7190 .72240.6 .7257 .7291 .7324 .7357 .7389 .7422 .7454 .7486 .7517 .75490.7 .7580 .7611 .7642 .7673 .7704 .7734 .7764 .7794 .7823 .78520.8 .7881 .7910 .7939 .7967 .7995 .8023 .8051 .8078 .8106 .81330.9 .8159 .8186 .8212 .8238 .8264 .8289 .8315 .8340 .8365 .83891.0 .8413 .8438 .8461 .8485 .8508 8531 .8554 .8577 .8599 .86211.1 .8643 .8665 .8686 .8708 .8729 .8749 .8770 .8790 .8810 .88301.2 .8849 .8869 .8888 .8907 .8925 .8944 .8962 .8980 .8997 .90151.3 .9032 .9049 .9066 .9082 .9099 .9115 .9131 .9147 .9162 .91771.4 .9192 .9207 .9222 .9236 .9251 .9265 .9279 .9292 .9306 .93191.5 .9332 .9345 .9357 .9370 .9382 .9394 .9406 .9418 .9429 .94411.6 .9452 .9463 .9474 .9484 .9495 .9505 .9515 .9525 .9535 .95451.7 .9554 .9564 .9573 .9582 .9591 .9599 .9608 .9616 .9625 .96331.8 .9641 .9649 .9656 .9664 .9671 .9678 .9686 .9693 .9699 .97061.9 .9713 .9719 .9726 .9732 .9738 .9744 .9750 .9756 .9761 .97672.0 .9772 .9778 .9783 .9788 .9793 9798 .9803 .9808 .9812 .98172.1 .9821 .9826 .9830 .9834 .9838 .9842 .9846 .9850 .9854 .98572.2 .9861 .9864 .9868 .9871 .9875 .9878 .9881 .9884 .9887 .98902.3 .9893 .9896 .9898 .9901 .9904 .9906 .9909 .9911 .9913 .99162.4 .9918 .9920 .9922 .9925 .9927 .9929 .9931 .9932 .9934 .99362.5 .9938 .9940 .9941 .9943 .9945 .9946 .9948 .9949 .9951 .99522.6 .9953 .9955 .9956 .9957 .9959 .9960 .9961 .9962 .9963 .99642.7 .9965 .9966 .9967 .9968 .9969 .9970 .9971 .9972 .9973 .99742.8 .9974 .9975 .9976 .9977 .9977 .9978 .9979 .9979 .9980 .99812.9 .9981 .9982 .9982 .9983 .9984 .9984 .9985 .9985 .9986 .99863.0 .9987 .9987 .9987 .9988 .9988 9989 .9989 .9989 .9990 .99903.1 .9990 .9991 .9991 .9991 .9992 .9992 .9992 .9992 .9993 .99933.2 .9993 .9993 .9994 .9994 .9994 .9994 .9994 .9995 .9995 .99953.3 .9995 .9995 .9995 .9996 .9996 .9996 .9996 .9996 .9996 .99973.4 .9997 .9997 .9997 .9997 .9997 .9997 .9997 .9997 .9997 .9998
© 2022 College Board. Visit College Board on the web: collegeboard.org.
20
AP® Statistics 2022 Free-Response Questions
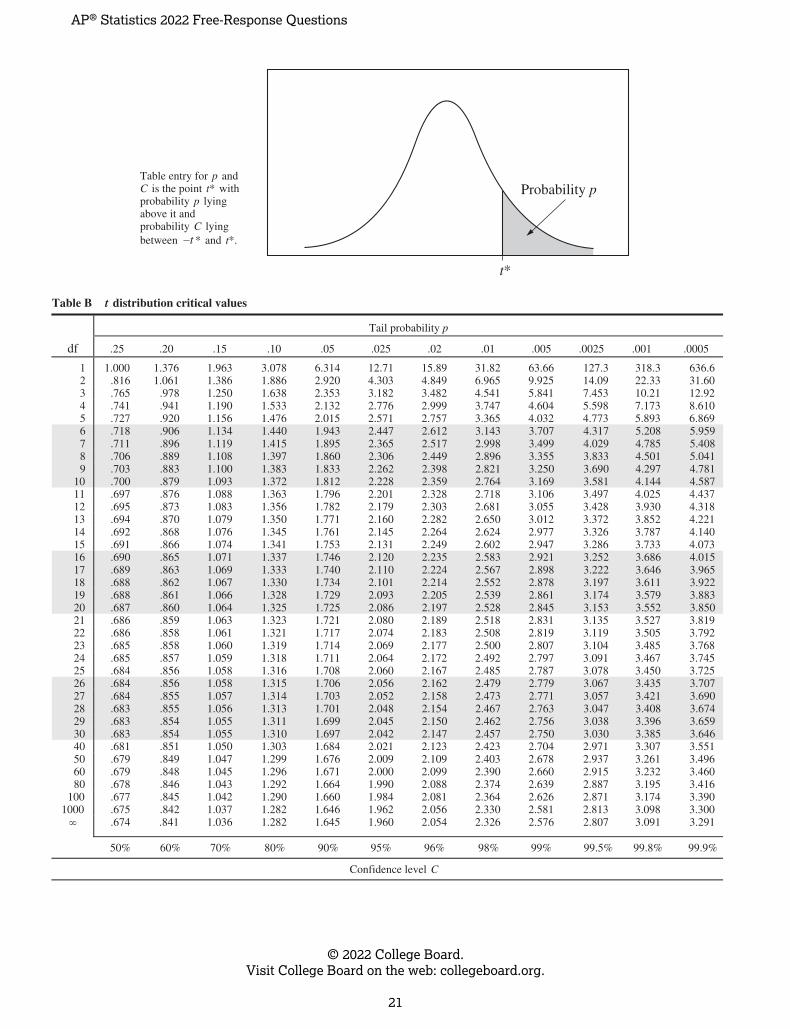
Probability p
t*
Table entry for p and C is the point t* with probability p lying above it and probability C lying between t * and t*.
Table B t distribution critical values
df
Tail probability p
.25 .20 .15 .10 .05 .025 .02 .01 .005 .0025 .001 .0005
1 1.000 1.376 1.963 3.078 6.314 12.71 15.89 31.82 63.66 127.3 318.3 636.62 .816 1.061 1.386 1.886 2.920 4.303 4.849 6.965 9.925 14.09 22.33 31.603 .765 .978 1.250 1.638 2.353 3.182 3.482 4.541 5.841 7.453 10.21 12.924 .741 .941 1.190 1.533 2.132 2.776 2.999 3.747 4.604 5.598 7.173 8.6105 .727 .920 1.156 1.476 2.015 2.571 2.757 3.365 4.032 4.773 5.893 6.8696 .718 .906 1.134 1.440 1.943 2.447 2.612 3.143 3.707 4.317 5.208 5.9597 .711 .896 1.119 1.415 1.895 2.365 2.517 2.998 3.499 4.029 4.785 5.4088 .706 .889 1.108 1.397 1.860 2.306 2.449 2.896 3.355 3.833 4.501 5.0419 .703 .883 1.100 1.383 1.833 2.262 2.398 2.821 3.250 3.690 4.297 4.781
10 .700 .879 1.093 1.372 1.812 2.228 2.359 2.764 3.169 3.581 4.144 4.58711 .697 .876 1.088 1.363 1.796 2.201 2.328 2.718 3.106 3.497 4.025 4.43712 .695 .873 1.083 1.356 1.782 2.179 2.303 2.681 3.055 3.428 3.930 4.31813 .694 .870 1.079 1.350 1.771 2.160 2.282 2.650 3.012 3.372 3.852 4.22114 .692 .868 1.076 1.345 1.761 2.145 2.264 2.624 2.977 3.326 3.787 4.14015 .691 .866 1.074 1.341 1.753 2.131 2.249 2.602 2.947 3.286 3.733 4.07316 .690 .865 1.071 1.337 1.746 2.120 2.235 2.583 2.921 3.252 3.686 4.01517 .689 .863 1.069 1.333 1.740 2.110 2.224 2.567 2.898 3.222 3.646 3.96518 .688 .862 1.067 1.330 1.734 2.101 2.214 2.552 2.878 3.197 3.611 3.92219 .688 .861 1.066 1.328 1.729 2.093 2.205 2.539 2.861 3.174 3.579 3.88320 .687 .860 1.064 1.325 1.725 2.086 2.197 2.528 2.845 3.153 3.552 3.85021 .686 .859 1.063 1.323 1.721 2.080 2.189 2.518 2.831 3.135 3.527 3.81922 .686 .858 1.061 1.321 1.717 2.074 2.183 2.508 2.819 3.119 3.505 3.79223 .685 .858 1.060 1.319 1.714 2.069 2.177 2.500 2.807 3.104 3.485 3.76824 .685 .857 1.059 1.318 1.711 2.064 2.172 2.492 2.797 3.091 3.467 3.74525 .684 .856 1.058 1.316 1.708 2.060 2.167 2.485 2.787 3.078 3.450 3.72526 .684 .856 1.058 1.315 1.706 2.056 2.162 2.479 2.779 3.067 3.435 3.70727 .684 .855 1.057 1.314 1.703 2.052 2.158 2.473 2.771 3.057 3.421 3.69028 .683 .855 1.056 1.313 1.701 2.048 2.154 2.467 2.763 3.047 3.408 3.67429 .683 .854 1.055 1.311 1.699 2.045 2.150 2.462 2.756 3.038 3.396 3.65930 .683 .854 1.055 1.310 1.697 2.042 2.147 2.457 2.750 3.030 3.385 3.64640 .681 .851 1.050 1.303 1.684 2.021 2.123 2.423 2.704 2.971 3.307 3.55150 .679 .849 1.047 1.299 1.676 2.009 2.109 2.403 2.678 2.937 3.261 3.49660 .679 .848 1.045 1.296 1.671 2.000 2.099 2.390 2.660 2.915 3.232 3.46080 .678 .846 1.043 1.292 1.664 1.990 2.088 2.374 2.639 2.887 3.195 3.416
100 .677 .845 1.042 1.290 1.660 1.984 2.081 2.364 2.626 2.871 3.174 3.3901000 .675 .842 1.037 1.282 1.646 1.962 2.056 2.330 2.581 2.813 3.098 3.300
.674 .841 1.036 1.282 1.645 1.960 2.054 2.326 2.576 2.807 3.091 3.291
50% 60% 70% 80% 90% 95% 96% 98% 99% 99.5% 99.8% 99.9%
Confidence level C
© 2022 College Board. Visit College Board on the web: collegeboard.org.
21
AP® Statistics 2022 Free-Response Questions
1
Probability p
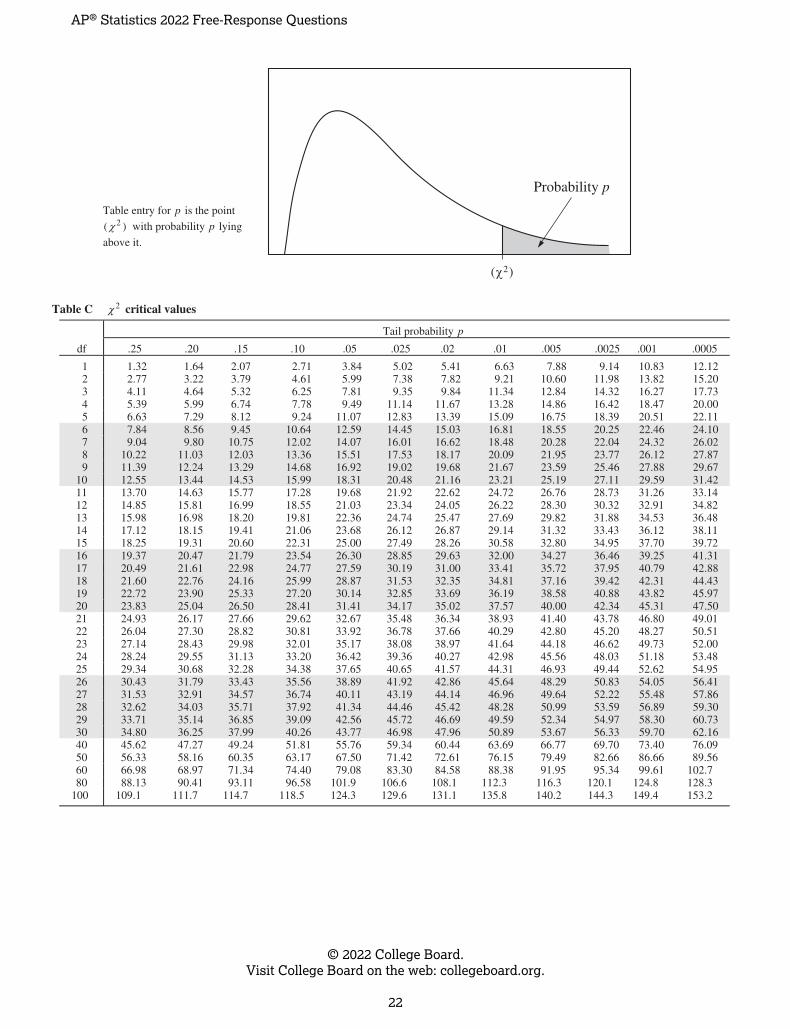
(χ2)
Table entry for p is the point
( )2 with probability p lying
above it.
Table C 2c critical values
df
Tail probability p
.25 .20 .15 .10 .05 .025 .02 .01 .005 .0025 .001 .0005
1 1.32 1.64 2.07 2.71 3.84 5.02 5.41 6.63 7.88 9.14 10.83 12.122 2.77 3.22 3.79 4.61 5.99 7.38 7.82 9.21 10.60 11.98 13.82 15.203 4.11 4.64 5.32 6.25 7.81 9.35 9.84 11.34 12.84 14.32 16.27 17.734 5.39 5.99 6.74 7.78 9.49 11.14 11.67 13.28 14.86 16.42 18.47 20.005 6.63 7.29 8.12 9.24 11.07 12.83 13.39 15.09 16.75 18.39 20.51 22.116 7.84 8.56 9.45 10.64 12.59 14.45 15.03 16.81 18.55 20.25 22.46 24.107 9.04 9.80 10.75 12.02 14.07 16.01 16.62 18.48 20.28 22.04 24.32 26.028 10.22 11.03 12.03 13.36 15.51 17.53 18.17 20.09 21.95 23.77 26.12 27.879 11.39 12.24 13.29 14.68 16.92 19.02 19.68 21.67 23.59 25.46 27.88 29.67
10 12.55 13.44 14.53 15.99 18.31 20.48 21.16 23.21 25.19 27.11 29.59 31.4211 13.70 14.63 15.77 17.28 19.68 21.92 22.62 24.72 26.76 28.73 31.26 33.1412 14.85 15.81 16.99 18.55 21.03 23.34 24.05 26.22 28.30 30.32 32.91 34.8213 15.98 16.98 18.20 19.81 22.36 24.74 25.47 27.69 29.82 31.88 34.53 36.4814 17.12 18.15 19.41 21.06 23.68 26.12 26.87 29.14 31.32 33.43 36.12 38.1115 18.25 19.31 20.60 22.31 25.00 27.49 28.26 30.58 32.80 34.95 37.70 39.7216 19.37 20.47 21.79 23.54 26.30 28.85 29.63 32.00 34.27 36.46 39.25 41.3117 20.49 21.61 22.98 24.77 27.59 30.19 31.00 33.41 35.72 37.95 40.79 42.8818 21.60 22.76 24.16 25.99 28.87 31.53 32.35 34.81 37.16 39.42 42.31 44.4319 22.72 23.90 25.33 27.20 30.14 32.85 33.69 36.19 38.58 40.88 43.82 45.9720 23.83 25.04 26.50 28.41 31.41 34.17 35.02 37.57 40.00 42.34 45.31 47.5021 24.93 26.17 27.66 29.62 32.67 35.48 36.34 38.93 41.40 43.78 46.80 49.0122 26.04 27.30 28.82 30.81 33.92 36.78 37.66 40.29 42.80 45.20 48.27 50.5123 27.14 28.43 29.98 32.01 35.17 38.08 38.97 41.64 44.18 46.62 49.73 52.0024 28.24 29.55 31.13 33.20 36.42 39.36 40.27 42.98 45.56 48.03 51.18 53.4825 29.34 30.68 32.28 34.38 37.65 40.65 41.57 44.31 46.93 49.44 52.62 54.9526 30.43 31.79 33.43 35.56 38.89 41.92 42.86 45.64 48.29 50.83 54.05 56.4127 31.53 32.91 34.57 36.74 40.11 43.19 44.14 46.96 49.64 52.22 55.48 57.8628 32.62 34.03 35.71 37.92 41.34 44.46 45.42 48.28 50.99 53.59 56.89 59.3029 33.71 35.14 36.85 39.09 42.56 45.72 46.69 49.59 52.34 54.97 58.30 60.7330 34.80 36.25 37.99 40.26 43.77 46.98 47.96 50.89 53.67 56.33 59.70 62.1640 45.62 47.27 49.24 51.81 55.76 59.34 60.44 63.69 66.77 69.70 73.40 76.0950 56.33 58.16 60.35 63.17 67.50 71.42 72.61 76.15 79.49 82.66 86.66 89.5660 66.98 68.97 71.34 74.40 79.08 83.30 84.58 88.38 91.95 95.34 99.61 102.780 88.13 90.41 93.11 96.58 101.9 106.6 108.1 112.3 116.3 120.1 124.8 128.3
100 09.1 111.7 114.7 118.5 124.3 129.6 131.1 135.8 140.2 144.3 149.4 153.2
© 2022 College Board. Visit College Board on the web: collegeboard.org.
22
AP® Statistics 2022 Free-Response Questions
Related Documents