AP ® Report to the Nation The 5th Annual Class of 2008: AP Subject-Specific Results February 4, 2009

Welcome message from author
This document is posted to help you gain knowledge. Please leave a comment to let me know what you think about it! Share it to your friends and learn new things together.
Transcript

AP® Report to the NationThe 5th Annual
Class of 2008: AP Subject-Specific Results
February 4, 2009

U.S. Public Schools: High School Class Data
AP Art History ........................................................................................................ 1AP Biology ............................................................................................................... 2AP Calculus AB ...................................................................................................... 3AP Calculus BC ...................................................................................................... 4AP Chemistry ......................................................................................................... 5AP Chinese Language and Culture ..................................................................... 6AP Computer Science A and AB .......................................................................... 7AP English Language and Composition ............................................................. 8AP English Literature and Composition ............................................................. 9AP Environmental Science .................................................................................. 10AP European History ........................................................................................... 11AP French Language ........................................................................................... 12AP French Literature ........................................................................................... 13AP German Language ......................................................................................... 14AP Government and Politics: Comparative ...................................................... 15AP Government and Politics: United States ..................................................... 16AP Human Geography ........................................................................................ 17AP Italian Language and Culture ...................................................................... 18AP Japanese Language and Culture ................................................................. 19AP Latin Literature and AP Latin: Vergil .......................................................... 20AP Macroeconomics ............................................................................................ 21AP Microeconomics ............................................................................................. 22AP Music Theory .................................................................................................. 23AP Physics B ......................................................................................................... 24AP Physics C: Electricity and Magnetism ........................................................ 25AP Physics C: Mechanics .................................................................................... 26AP Psychology ...................................................................................................... 27AP Spanish Language ......................................................................................... 28AP Spanish Literature ......................................................................................... 29AP Statistics .......................................................................................................... 30AP Studio Art: Drawing, 2-D Design, 3-D Design ............................................ 31AP United States History .................................................................................... 32AP World History ................................................................................................. 33
Table of Contents
© 2009 The College Board. All rights reserved. College Board, Advanced Placement, Advanced Placement Program, AP, Pre-AP, SAT, and the acorn logo are registered trademarks of the College Board. inspiring minds is a trademark owned by the College Board. PSAT/NMSQT is a registered trademark of the College Board and National Merit Scholarship Corporation. All other products and services may be trademarks of their respective owners. Visit the College Board on the Web: www.collegeboard.com.

The 5th Annual AP Report to the Nation®
Other 4.6%
Not Stated 2.8%American Indian or Alaska Native 0.5%
Asian, Asian American or Pacific Islander 16.1%
Black or African American 4.0%
White 57.3%
Hispanic or Latino 14.7%
Female 68%
Male 32%
AP Art History
Number of Exams, Class of 2004-2008
Grade Level of Examinees, Class of 2008
Examinees by Race and Ethnicity, Class of 2008
Examinees by Gender, Class of 2008
U.S. Public Schools: High School Class Data
0%
10%
20%
30%
40%
50%
60%
Grade 9 Grade 10 Grade 11 Grade 12
Perc
ent o
f Exa
min
ees
0
5,000
10,000
15,000
20,000
2004 2005 2006 2007 2008
Num
ber o
f Exa
ms
9,795
11,405
13,238 13,699
15,568
9.0%
33.9%
57.0%
0.2%
Number of Exam Score Examinees %
Score of 5 1,506 9.7
Score of 4 3,172 20.4
Score of 3 3,894 25.0
Score of 2 3,132 20.1
Score of 1 3,864 24.8
Total 15,568
Score Distribution, Class of 2008
1
The 5th Annual AP Report to the Nation®
AP Biology
Number of Exams, Class of 2004-2008
Grade Level of Examinees, Class of 2008
Examinees by Race and Ethnicity, Class of 2008
Examinees by Gender, Class of 2008
0%
10%
20%
30%
40%
50%
60%
Grade 9 Grade 10 Grade 11 Grade 12
Perc
ent o
f Exa
min
ees
0
30,000
60,000
90,000
120,000
150,000
Num
ber o
f Exa
ms
85,24291,942
99,192110,152
121,778
8.7%
37.1%
53.6%
0.7%
2004 2005 2006 2007 2008
Number of Exam Score Examinees %
Score of 5 21,492 17.6
Score of 4 21,062 17.3
Score of 3 22,315 18.3
Score of 2 23,064 18.9
Score of 1 33,845 27.8
Total 121,778
Score Distribution, Class of 2008
Other 3.8%Not Stated 2.2%
American Indian or Alaska Native 0.5%
Asian, Asian Americanor Pacific Islander18.8%
Black or African American6.1%
White 59.4%
Hispanic or Latino 9.1%
Female 59%
Male 41%
2
U.S. Public Schools: High School Class Data
The 5th Annual AP Report to the Nation®
AP Calculus AB
Number of Exams, Class of 2004-2008
Grade Level of Examinees, Class of 2008
Examinees by Race and Ethnicity, Class of 2008
Examinees by Gender, Class of 2008
0%
20%
40%
60%
80%
100%
Grade 9 Grade 10 Grade 11 Grade 12
Perc
ent o
f Exa
min
ees
0
50,000
100,000
150,000
200,000
Num
ber o
f Exa
ms 138,124
146,333155,730
166,661177,155
1.1%
18.4%
80.4%
0.1%
2004 2005 2006 2007 2008
Number of Exam Score Examinees %
Score of 5 36,341 20.5
Score of 4 36,278 20.5
Score of 3 32,348 18.3
Score of 2 27,570 15.6
Score of 1 44,618 25.2
Total 177,155
Score Distribution, Class of 2008
Other 2.9%Not Stated 1.9%American Indian or Alaska Native 0.4%
Asian, Asian American or Pacific Islander 15.5%
Black or African American 5.1%
White 64.5%
Hispanic or Latino 9.7%
Male 51%
Female 49%
3
U.S. Public Schools: High School Class Data

The 5th Annual AP Report to the Nation®
Other 3.1%Not Stated 1.9%American Indian or Alaska Native 0.3%
Asian, Asian Americanor Pacific Islander27.6%
Black or African American 2.5%
White 59%
Hispanic or Latino 5.7%
Male 58%
Female 42%
AP Calculus BC
Number of Exams, Class of 2004-2008
Grade Level of Examinees, Class of 2008
Examinees by Race and Ethnicity, Class of 2008
Examinees by Gender, Class of 2008
0%
10%
20%
30%
40%
50%
60%
70%
80%
Grade 9 Grade 10 Grade 11 Grade 12
Perc
ent o
f Exa
min
ees
0
10,000
20,000
30,000
40,000
50,000
60,000
Num
ber o
f Exa
ms
39,96243,069
46,651
51,61855,481
1.6%
22.0%
76.3%
0.1%
2004 2005 2006 2007 2008
Number of Exam Score Examinees %
Score of 5 23,012 41.5
Score of 4 9,797 17.7
Score of 3 11,082 20.0
Score of 2 3,938 7.1
Score of 1 7,652 13.8
Total 55,481
Score Distribution, Class of 2008
4
U.S. Public Schools: High School Class Data

The 5th Annual AP Report to the Nation®
AP Chemistry
Number of Exams, Class of 2004-2008
Grade Level of Examinees, Class of 2008
Examinees by Race and Ethnicity, Class of 2008
Examinees by Gender, Class of 2008
0%
10%
20%
30%
40%
50%
60%
Grade 9 Grade 10 Grade 11 Grade 12
Perc
ent o
f Exa
min
ees
0
10,000
20,000
30,000
40,000
50,000
60,000
70,000
80,000
Num
ber o
f Exa
ms 54,225
58,993
66,293
73,097
79,386
5.5%
53.2%
41.2%
0.1%
2004 2005 2006 2007 2008
Number of Exam Score Examinees %
Score of 5 12,051 15.2
Score of 4 13,677 17.2
Score of 3 17,079 21.5
Score of 2 13,597 17.1
Score of 1 22,982 28.9
Total 79,386
Score Distribution, Class of 2008
Other 3.3%Not Stated 2.0%
American Indian or Alaska Native 0.4%
Asian, Asian Americanor Pacific Islander22.1%
Black or African American 4.8%
White 59.8%
Hispanic or Latino 7.6%
Male 52%
Female 48%
5
U.S. Public Schools: High School Class Data

The 5th Annual AP Report to the Nation®
AP Chinese Language and Culture
Number of Exams, Class of 2004-2008*
Grade Level of Examinees, Class of 2008
Examinees by Race and Ethnicity, Class of 2008
Examinees by Gender, Class of 2008
0%
10%
20%
30%
40%
50%
60%
70%
80%
Grade 9 Grade 10 Grade 11 Grade 12
Perc
ent o
f Exa
min
ees
0
500
1,000
1,500
2,000
Num
ber o
f Exa
ms
1,056
1,993
60.8%
39.2%
2004 2005 2006 2007 2008
0%0%
Number of Exam Score Examinees %
Score of 5 122 49.2
Score of 4 47 19.0
Score of 3 46 18.5
Score of 2 13 5.2
Score of 1 20 8.1
Total 248
Score Distribution, Class of 2008
Other 0.7%Not Stated 1.4%American Indian or Alaska Native 0.1%
Asian, Asian Americanor Pacific Islander95.3%
Black or African American 0.1%
White 2.1%Hispanic or Latino 0.4%
Male 44%
Female 56%
Number of Exam Score Examinees %
Score of 5 1,639 82.2
Score of 4 206 10.3
Score of 3 97 4.9
Score of 2 19 1.0
Score of 1 32 1.6
Total 1,993
Standard Group** Total Group
** Standard group students generally received most of their foreign language training in U.S. schools. They indicated on their answer sheets that they did not regularly speak or hear the foreign language of the examination at home and that they have not lived for one month or more in a country where the language was spoken.
6
U.S. Public Schools: High School Class Data
* AP Chinese Language and Culture was offered for the first time in 2007.

The 5th Annual AP Report to the Nation®
AP Computer Science A and AB*
Number of Exams, Class of 2004-2008
Grade Level of Examinees, Class of 2008
Examinees by Race and Ethnicity, Class of 2008
Examinees by Gender, Class of 2008
0%
10%
20%
30%
40%
50%
Grade 9 Grade 10 Grade 11 Grade 12
Perc
ent o
f Exa
min
ees
0
5,000
10,000
15,000
20,000
Num
ber o
f Exa
ms
17,161
15,716 15,830 15,64016,413
14.9%
39.7%
44.6%
0.7%
2004 2005 2006 2007 2008
Number of Exam Score Examinees %
Score of 5 3,891 23.7
Score of 4 3,531 21.5
Score of 3 2,555 15.6
Score of 2 1,486 9.1
Score of 1 4,950 30.2
Total 16,413
Score Distribution, Class of 2008
Other 3.4%Not Stated 1.8%
American Indian or Alaska Native 0.4%
Asian, Asian Americanor Pacific Islander25.4%
Black or African American 3.7%
White 58.5%
Hispanic or Latino 6.8%
Male 83%
Female 17%
7
U.S. Public Schools: High School Class Data
*This page contains data for both AP Computer Science Exams: AP Computer Science A and AP Computer Science AB. Charts showing examinees by grade level, race/ethnicity and gender include demographic data from both AP Computer Science Exams, so some populations may be slightly inflated when individual students in those populations took both exams in 2008.

The 5th Annual AP Report to the Nation®
Other 3.5%Not Stated 2.3%
American Indian or Alaska Native 0.6%Asian, Asian Americanor Pacific Islander11.2%
Black or African American 7.7%
White 61%
Hispanic or Latino 13.7%
Male 37%
Female 63%
AP English Language and Composition
Number of Exams, Class of 2004-2008
Grade Level of Examinees, Class of 2008
Examinees by Race and Ethnicity, Class of 2008
Examinees by Gender, Class of 2008
0%
20%
40%
60%
80%
100%
Grade 9 Grade 10 Grade 11 Grade 12
Perc
ent o
f Exa
min
ees
0
50,000
100,000
150,000
200,000
250,000
Num
ber o
f Exa
ms
149,611167,742
194,437213,120
242,990
1.2%
84.6%
14.1%0%
2004 2005 2006 2007 2008
Number of Exam Score Examinees %
Score of 5 19,457 8.0
Score of 4 41,887 17.2
Score of 3 76,278 31.4
Score of 2 76,410 31.4
Score of 1 28,958 11.9
Total 242,990
Score Distribution, Class of 2008
8
U.S. Public Schools: High School Class Data
The 5th Annual AP Report to the Nation®
Other 3.4%Not Stated 2.3%
American Indian or Alaska Native 0.6%Asian, Asian Americanor Pacific Islander10.5%
Black or African American 8.6%
White 62.8%
Hispanic or Latino 11.8%
Male 36%
Female 64%
Number of Exams, Class of 2004-2008
Grade Level of Examinees, Class of 2008
Examinees by Race and Ethnicity, Class of 2008
Examinees by Gender, Class of 2008
0%
20%
40%
60%
80%
100%
Grade 9 Grade 10 Grade 11 Grade 12
Perc
ent o
f Exa
min
ees
0
50,000
100,000
150,000
200,000
250,000
300,000
Num
ber o
f Exa
ms
192,838210,450
227,300241,545
261,699
0.2%6.3%
93.5%
0.0%
2004 2005 2006 2007 2008
Number of Exam Score Examinees %
Score of 5 15,274 5.8
Score of 4 48,783 18.6
Score of 3 87,527 33.4
Score of 2 83,870 32.0
Score of 1 26,245 10.0
Total 261,699
Score Distribution, Class of 2008
9
U.S. Public Schools: High School Class Data
AP English Literature and Composition
The 5th Annual AP Report to the Nation®
Other 3.7%Not Stated 2.6%
American Indian or Alaska Native 0.5%
Asian, Asian Americanor Pacific Islander11.9%
Black or African American 6.5%
White 63.7%
Hispanic or Latino 11.0%
Male 43%
Female 57%
AP Environmental Science
Number of Exams, Class of 2004-2008
Grade Level of Examinees, Class of 2008
Examinees by Race and Ethnicity, Class of 2008
Examinees by Gender, Class of 2008
0%
10%
20%
30%
40%
50%
60%
70%
80%
Grade 9 Grade 10 Grade 11 Grade 12
Perc
ent o
f Exa
min
ees
0
10,000
20,000
30,000
40,000
50,000
60,000
Num
ber o
f Exa
ms
26,23730,037
35,343
41,258
50,208
3.5%
31.8%
64.1%
0.6%
2004 2005 2006 2007 2008
Number of Exam Score Examinees %
Score of 5 5,568 11.1
Score of 4 11,523 23.0
Score of 3 8,828 17.6
Score of 2 8,729 17.4
Score of 1 15,560 31.0
Total 50,208
Score Distribution, Class of 2008
10
U.S. Public Schools: High School Class Data

The 5th Annual AP Report to the Nation®
Other 4.0%Not Stated 2.4%
American Indian or Alaska Native 0.5%
Asian, Asian Americanor Pacific Islander13.1%
Black or African American 4.1%
White 67.4%
Hispanic or Latino 8.5%
Male 46%
Female 54%
AP European History
Number of Exams, Class of 2004-2008
Grade Level of Examinees, Class of 2008
Examinees by Race and Ethnicity, Class of 2008
Examinees by Gender, Class of 2008
0%
10%
20%
30%
40%
50%
60%
Grade 9 Grade 10 Grade 11 Grade 12
Perc
ent o
f Exa
min
ees
0
10,000
20,000
30,000
40,000
50,000
60,000
70,000
80,000
Num
ber o
f Exa
ms 57,365
61,60466,709
71,54475,874
52.0%
17.2%
30.5%
0.4%
2004 2005 2006 2007 2008
Number of Exam Score Examinees %
Score of 5 7,336 9.7
Score of 4 13,639 18.0
Score of 3 27,583 36.4
Score of 2 12,172 16.0
Score of 1 15,144 20.0
Total 75,874
Score Distribution, Class of 2008
11
U.S. Public Schools: High School Class Data

The 5th Annual AP Report to the Nation®
0%
10%
20%
30%
40%
50%
60%
70%
80%
Grade 9 Grade 10 Grade 11 Grade 12
Perc
ent o
f Exa
min
ees
0
3,000
6,000
9,000
12,000
15,000
Num
ber o
f Exa
ms
12,32813,169
13,995 14,227 13,907
5.0%
26.4%
67.7%
0.9%
2004 2005 2006 2007 2008
Other 5.5%
Not Stated 2.4%American Indian or Alaska Native 0.2%
Asian, Asian Americanor Pacific Islander13.5%
Black or African American 6.6%
White 61.2%
Hispanic or Latino 10.5%
Male 30%
Female 70%
AP French Language
Number of Exams, Class of 2004-2008
Grade Level of Examinees, Class of 2008
Examinees by Race and Ethnicity, Class of 2008
Examinees by Gender, Class of 2008
Number of Exam Score Examinees %
Score of 5 686 6.3
Score of 4 1,386 12.7
Score of 3 3,166 29.0
Score of 2 2,603 23.8
Score of 1 3,086 28.2
Total 10,927
Score Distribution, Class of 2008
* Standard group students generally received most of their foreign language training in U.S. schools. They indicated on their answer sheets that they did not regularly speak or hear the foreign language of the examination at home and that they have not lived for one month or more in a country where the language was spoken.
Number of Exam Score Examinees %
Score of 5 1,383 9.9
Score of 4 1,961 14.1
Score of 3 3,950 28.4
Score of 2 3,035 21.8
Score of 1 3,578 25.7
Total 13,907 12
U.S. Public Schools: High School Class Data
Standard Group* Total Group

The 5th Annual AP Report to the Nation®
Other 5.7%
Not Stated 3.9%American Indian or Alaska Native 0.1%
Asian, Asian Americanor Pacific Islander12.7%
Black or African American 6.6%
White 64.4%
Hispanic or Latino 6.5%
Male 30%
Female 70%
AP French Literature
Number of Exams, Class of 2004-2008
Grade Level of Examinees, Class of 2008
Examinees by Race and Ethnicity, Class of 2008
Examinees by Gender, Class of 2008
0%
10%
20%
30%
40%
50%
60%
70%
80%
Grade 9 Grade 10 Grade 11 Grade 12
Perc
ent o
f Exa
min
ees
0
200
400
600
800
1,000
1,200
Num
ber o
f Exa
ms 830 825
945907
1,012
3.0%
26.2%
70.6%
0.3%
2004 2005 2006 2007 2008
Number of Exam Score Examinees %
Score of 5 149 14.7
Score of 4 229 22.6
Score of 3 227 22.4
Score of 2 183 18.1
Score of 1 224 22.1
Total 1,012
Score Distribution, Class of 2008
13
U.S. Public Schools: High School Class Data

The 5th Annual AP Report to the Nation®
Other 3.6%Not Stated 2.3%American Indian or Alaska Native 0.5%Asian, Asian Americanor Pacific Islander 6.0%Black or African American 1.7%
White 82.7%
Hispanic or Latino 3.2%
Male 51%
Female 49%
AP German Language
Number of Exams, Class of 2004-2008
Grade Level of Examinees, Class of 2008
Examinees by Race and Ethnicity, Class of 2008
Examinees by Gender, Class of 2008
0%
10%
20%
30%
40%
50%
60%
70%
80%
Grade 9 Grade 10 Grade 11 Grade 12
Perc
ent o
f Exa
min
ees
0
1,000
2,000
3,000
4,000
5,000
Num
ber o
f Exa
ms
3,3343,544
3,8594,121 4,265
3.8%
22.3%
72.9%
0.9%
2004 2005 2006 2007 2008
Number of Exam Score Examinees %
Score of 5 209 7.9
Score of 4 523 19.8
Score of 3 756 28.7
Score of 2 655 24.8
Score of 1 495 18.8
Total 2,638
Score Distribution, Class of 2008
* Standard group students generally received most of their foreign language training in U.S. schools. They indicated on their answer sheets that they did not regularly speak or hear the foreign language of the examination at home and that they have not lived for one month or more in a country where the language was spoken.
Number of Exam Score Examinees %
Score of 5 749 17.6
Score of 4 916 21.5
Score of 3 1,079 25.3
Score of 2 882 20.7
Score of 1 639 15.0
Total 4,26514
U.S. Public Schools: High School Class Data
Standard Group* Total Group

The 5th Annual AP Report to the Nation®
AP Government and Politics: Comparative
Number of Exams, Class of 2004-2008
Grade Level of Examinees, Class of 2008
Examinees by Race and Ethnicity, Class of 2008
Examinees by Gender, Class of 2008
Number of Exam Score Examinees %
Score of 5 1,948 17.2
Score of 4 2,205 19.5
Score of 3 2,272 20.1
Score of 2 2,441 21.6
Score of 1 2,428 21.5
Total 11,294
Score Distribution, Class of 2008
15
U.S. Public Schools: High School Class Data
0
10
20
30
40
50
60
70
80
Grade 9 Grade 10 Grade 11 Grade 12
Perc
ent o
f Exa
min
ees
0
2000
4000
6000
8000
10000
12000
Num
ber o
f Exa
ms
10,475
11,699
10,497 10,65211,294
9.2%
16.0%
74.8%
0.1%
2004 2005 2006 2007 2008
Other 4.0%Not Stated 2.8%American Indian or Alaska Native 0.5%
Asian, Asian Americanor Pacific Islander 13.4%
Black or African American 5.2%
White 65.8%
Hispanic or Latino 8.3%
Male 52%
Female 48%

The 5th Annual AP Report to the Nation®
Other 3.7%Not Stated 2.3%American Indian or Alaska Native 0.5%
Asian, Asian Americanor Pacific Islander 13.0%
Black or African American 6.4%
White 61.5%
Hispanic or Latino 12.6%
Male 46%
Female 54%
AP Government and Politics: United States
Number of Exams, Class of 2004-2008
Grade Level of Examinees, Class of 2008
Examinees by Race and Ethnicity, Class of 2008
Examinees by Gender, Class of 2008
0%
20%
40%
60%
80%
100%
Grade 9 Grade 10 Grade 11 Grade 12
Perc
ent o
f Exa
min
ees
0
50,000
100,000
150,000
200,000
Num
ber o
f Exa
ms
94,336107,233
119,397
135,322
151,792
5.1%9.9%
84.7%
0.3%
2004 2005 2006 2007 2008
Number of Exam Score Examinees %
Score of 5 16,634 11.0
Score of 4 20,941 13.8
Score of 3 38,384 25.3
Score of 2 40,459 26.7
Score of 1 35,374 23.3
Total 151,792
Score Distribution, Class of 2008
16
U.S. Public Schools: High School Class Data

The 5th Annual AP Report to the Nation®
Other 3.6%Not Stated 2.3%
American Indian or Alaska Native 0.5%
Asian, Asian Americanor Pacific Islander 10.8%
Black or African American 8.0%
White 62.9%
Hispanic or Latino 11.8%
Male 45%
Female 55%
AP Human Geography
Number of Exams, Class of 2004-2008
Grade Level of Examinees, Class of 2008
Examinees by Race and Ethnicity, Class of 2008
Examinees by Gender, Class of 2008
0%
5%
10%
15%
20%
25%
30%
35%
40%
Grade 9 Grade 10 Grade 11 Grade 12
Perc
ent o
f Exa
min
ees
0
5,000
10,000
15,000
20,000
Num
ber o
f Exa
ms
5,304
7,781
10,573
13,089
18,617
20.2%18.7%
38.6%
22.5%
2004 2005 2006 2007 2008
Number of Exam Score Examinees %
Score of 5 2,856 15.3
Score of 4 3,880 20.8
Score of 3 4,353 23.4
Score of 2 3,058 16.4
Score of 1 4,470 24.0
Total 18,617
Score Distribution, Class of 2008
17
U.S. Public Schools: High School Class Data

The 5th Annual AP Report to the Nation®
Other 4.2%Not Stated 3.0%
American Indian or Alaska Native 0.2%Asian, Asian Americanor Pacific Islander 4.0%Black or African American 1.9%
White 68.9%
Hispanic or Latino 17.8%
Male 38%
Female 62%
AP Italian Language and Culture
Number of Exams, Class of 2004-2008*
Grade Level of Examinees, Class of 2008
Examinees by Race and Ethnicity, Class of 2008
Examinees by Gender, Class of 2008
0%
20%
40%
60%
80%
100%
Grade 9 Grade 10 Grade 11 Grade 12
Perc
ent o
f Exa
min
ees
0
500
1,000
1,500
2,000
Num
ber o
f Exa
ms
1,124
1,319
1,559
1.3% 12.9%
85.8%
2004 2005 2006 2007 2008
0%
Number of Exam Score Examinees %
Score of 5 80 6.5
Score of 4 149 12.1
Score of 3 299 24.2
Score of 2 289 23.4
Score of 1 416 33.7
Total 1,233
Score Distribution, Class of 2008
** Standard group students generally received most of their foreign language training in U.S. schools. They indicated on their answer sheets that they did not regularly speak or hear the foreign language of the examination at home and that they have not lived for one month or more in a country where the language was spoken.
Number of Exam Score Examinees %
Score of 5 167 10.7
Score of 4 198 12.7
Score of 3 380 24.4
Score of 2 344 22.1
Score of 1 470 30.1
Total 1,559
18
U.S. Public Schools: High School Class Data
Standard Group** Total Group
*AP Italian Language and Culture was offered for the first time in 2006.

The 5th Annual AP Report to the Nation®
Other 4.6%Not Stated 2.5%American Indian or Alaska Native 0.4%
Asian, Asian Americanor Pacific Islander 61.1%
Black or African American 1.5%
White 26.1%
Hispanic or Latino 3.9%
Male 47%
Female 53%
AP Japanese Language and Culture
Number of Exams, Class of 2004-2008*
Grade Level of Examinees, Class of 2008
Examinees by Race and Ethnicity, Class of 2008
Examinees by Gender, Class of 2008
0%
10%
20%
30%
40%
50%
60%
70%
80%
Grade 9 Grade 10 Grade 11 Grade 12
Perc
ent o
f Exa
min
ees
0
200
400
600
800
1,000
Num
ber o
f Exa
ms
963
70.9%
29.1%
2004 2005 2006 2007 2008
685
0%0%
Number of Exam Score Examinees %
Score of 5 62 10.5
Score of 4 65 11.0
Score of 3 211 35.8
Score of 2 83 14.1
Score of 1 169 28.6
Total 590
Score Distribution, Class of 2008
** Standard group students generally received most of their foreign language training in U.S. schools. They indicated on their answer sheets that they did not regularly speak or hear the foreign language of the examination at home and that they have not lived for one month or more in a country where the language was spoken.
Number of Exam Score Examinees %
Score of 5 296 30.7
Score of 4 105 10.9
Score of 3 272 28.2
Score of 2 100 10.4
Score of 1 190 19.7
Total 96319
U.S. Public Schools: High School Class Data
Standard Group** Total Group
* AP Japanese Language and Culture was offered for the first time in 2007.

The 5th Annual AP Report to the Nation®
Other 2.9%Not Stated 2.2%American Indian or Alaska Native 0.3%
Asian, Asian Americanor Pacific Islander 14.5%
Black or African American 3.2%
White 73.1%
Hispanic or Latino 3.9%
Male 47%
Female 53%
AP Latin Literature and AP Latin: Vergil*
Number of Exams, Class of 2004-2008
Grade Level of Examinees, Class of 2008
Examinees by Race and Ethnicity, Class of 2008
Examinees by Gender, Class of 2008
0%
10%
20%
30%
40%
50%
60%
Grade 9 Grade 10 Grade 11 Grade 12
Perc
ent o
f Exa
min
ees
0
1,000
2,000
3,000
4,000
5,000
Num
ber o
f Exa
ms 3,513
3,8174,123
4,3344,639
6.2%
36.9%
56.5%
0.3%
2004 2005 2006 2007 2008
Number of Exam Score Examinees %
Score of 5 646 13.9
Score of 4 741 16.0
Score of 3 1,152 24.8
Score of 2 798 17.2
Score of 1 1,302 28.1
Total 4,639
Score Distribution, Class of 2008
20
U.S. Public Schools: High School Class Data
*This page contains data for both AP Latin Exams: AP Latin Literature and AP Latin: Vergil. Charts showing examinees by grade level, race/ethnicity and gender include demographic data from both AP Latin Exams, so some populations may be slightly inflated when individual students in those populations took both exams in 2008.
The 5th Annual AP Report to the Nation®
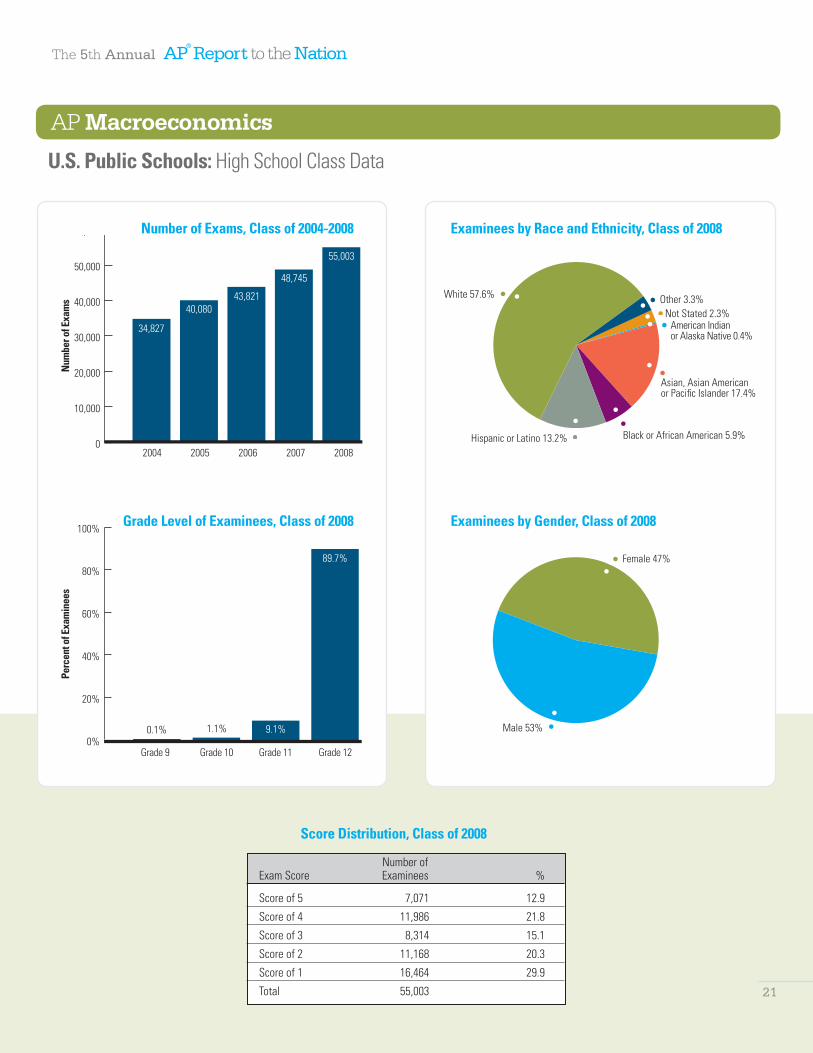
Other 3.3%Not Stated 2.3%
American Indian or Alaska Native 0.4%
Asian, Asian Americanor Pacific Islander 17.4%
Black or African American 5.9%
White 57.6%
Hispanic or Latino 13.2%
Male 53%
Female 47%
AP Macroeconomics
Number of Exams, Class of 2004-2008
Grade Level of Examinees, Class of 2008
Examinees by Race and Ethnicity, Class of 2008
Examinees by Gender, Class of 2008
0%
20%
40%
60%
80%
100%
Grade 9 Grade 10 Grade 11 Grade 12
Perc
ent o
f Exa
min
ees
0
10,000
20,000
30,000
40,000
50,000
60,000
Num
ber o
f Exa
ms
34,827
40,08043,821
48,745
55,003
1.1% 9.1%
89.7%
0.1%
2004 2005 2006 2007 2008
Number of Exam Score Examinees %
Score of 5 7,071 12.9
Score of 4 11,986 21.8
Score of 3 8,314 15.1
Score of 2 11,168 20.3
Score of 1 16,464 29.9
Total 55,003
Score Distribution, Class of 2008
21
U.S. Public Schools: High School Class Data

The 5th Annual AP Report to the Nation®
Other 3.4%Not Stated 2.5%
American Indian or Alaska Native 0.3%
Asian, Asian Americanor Pacific Islander18.9%
Black or African American 5.6%
White 59.3%
Hispanic or Latino 10.1%
Male 55%
Female 45%
AP Microeconomics
Number of Exams, Class of 2004-2008
Grade Level of Examinees, Class of 2008
Examinees by Race and Ethnicity, Class of 2008
Examinees by Gender, Class of 2008
0%
20%
40%
60%
80%
100%
Grade 9 Grade 10 Grade 11 Grade 12
Perc
ent o
f Exa
min
ees
0
5,000
10,000
15,000
20,000
25,000
30,000
35,000
Num
ber o
f Exa
ms
22,159
25,117 25,68527,961
31,890
2.2% 11.8%
85.7%
0.3%
2004 2005 2006 2007 2008
Number of Exam Score Examinees %
Score of 5 4,830 15.1
Score of 4 7,932 24.9
Score of 3 5,975 18.7
Score of 2 5,212 16.3
Score of 1 7,941 24.9
Total 31,890
Score Distribution, Class of 2008
22
U.S. Public Schools: High School Class Data

The 5th Annual AP Report to the Nation®
Other 3.4%Not Stated 2.5%American Indian or Alaska Native 0.5%
Asian, Asian Americanor Pacific Islander 11.1%
Black or African American 5.2%
White 69.1%
Hispanic or Latino 8.2%
Male 57%
Female 43%
AP Music Theory
Number of Exams, Class of 2004-2008
Grade Level of Examinees, Class of 2008
Examinees by Race and Ethnicity, Class of 2008
Examinees by Gender, Class of 2008
0%
10%
20%
30%
40%
50%
60%
Grade 9 Grade 10 Grade 11 Grade 12
Perc
ent o
f Exa
min
ees
0
2,000
4,000
6,000
8,000
10,000
12,000
Num
ber o
f Exa
ms
7,0717,956
9,258
10,534
11,762
7.8%
32.4%
59.4%
0.5%
2004 2005 2006 2007 2008
Number of Exam Score Examinees %
Score of 5 2,013 17.1
Score of 4 2,390 20.3
Score of 3 3,242 27.6
Score of 2 2,879 24.5
Score of 1 1,238 10.5
Total 11,762
Score Distribution, Class of 2008
23
U.S. Public Schools: High School Class Data

The 5th Annual AP Report to the Nation®
Other 3.4%Not Stated 2.2%American Indian or Alaska Native 0.4%
Asian, Asian Americanor Pacific Islander 19.9%
Black or African American 4.1%
White 60.9%
Hispanic or Latino 9.1%
Male 65%
Female 35%
AP Physics B
Number of Exams, Class of 2004-2008
Grade Level of Examinees, Class of 2008
Examinees by Race and Ethnicity, Class of 2008
Examinees by Gender, Class of 2008
0%
10%
20%
30%
40%
50%
60%
70%
80%
Grade 9 Grade 10 Grade 11 Grade 12
Perc
ent o
f Exa
min
ees
0
10,000
20,000
30,000
40,000
50,000
Num
ber o
f Exa
ms
33,57136,737
40,47143,196
46,052
1.7%
36.9%
61.2%
0.1%
2004 2005 2006 2007 2008
Number of Exam Score Examinees %
Score of 5 6,368 13.8
Score of 4 7,649 16.6
Score of 3 12,590 27.3
Score of 2 8,706 18.9
Score of 1 10,739 23.3
Total 46,052
Score Distribution, Class of 2008
24
U.S. Public Schools: High School Class Data

The 5th Annual AP Report to the Nation®
Other 3.5%Not Stated 2.1%American Indian or Alaska Native 0.3%
Asian, Asian Americanor Pacific Islander 27.5%
Black or African American 1.7%
White 60.0%
Hispanic or Latino 4.9%
Male 76%
Female 24%
AP Physics C: Electricity and Magnetism
Number of Exams, Class of 2004-2008
Grade Level of Examinees, Class of 2008
Examinees by Race and Ethnicity, Class of 2008
Examinees by Gender, Class of 2008
0%
20%
40%
60%
80%
100%
Grade 9 Grade 10 Grade 11 Grade 12
Perc
ent o
f Exa
min
ees
0
2,000
4,000
6,000
8,000
10,000
Num
ber o
f Exa
ms
8,0798,440
7,9848,657
9,377
0.8% 10.5%
88.7%
0.1%
2004 2005 2006 2007 2008
Number of Exam Score Examinees %
Score of 5 2,921 31.2
Score of 4 2,323 24.8
Score of 3 1,169 12.5
Score of 2 1,679 17.9
Score of 1 1,285 13.7
Total 9,377
Score Distribution, Class of 2008
25
U.S. Public Schools: High School Class Data

The 5th Annual AP Report to the Nation®
Other 3.3%Not Stated 2.2%American Indian or Alaska Native 0.3%
Asian, Asian Americanor Pacific Islander23.2%
Black or African American 2.5%
White 62.3%
Hispanic or Latino 6.2%
Male 73%
Female 27%
AP Physics C: Mechanics
Number of Exams, Class of 2004-2008
Grade Level of Examinees, Class of 2008
Examinees by Race and Ethnicity, Class of 2008
Examinees by Gender, Class of 2008
0%
20%
40%
60%
80%
100%
Grade 9 Grade 10 Grade 11 Grade 12
Perc
ent o
f Exa
min
ees
0
5,000
10,000
15,000
20,000
25,000
Num
ber o
f Exa
ms
16,91018,209 18,910
20,74222,059
0.6% 12.6%
86.7%
0%
2004 2005 2006 2007 2008
Number of Exam Score Examinees %
Score of 5 5,667 25.7
Score of 4 5,492 24.9
Score of 3 4,687 21.2
Score of 2 3,182 14.4
Score of 1 3,031 13.7
Total 22,059
Score Distribution, Class of 2008
26
U.S. Public Schools: High School Class Data

The 5th Annual AP Report to the Nation®
Other 3.7%Not Stated 2.3%American Indian or Alaska Native 0.4%
Asian, Asian Americanor Pacific Islander 12.5%
Black or African American 7.3%
White 64.5%
Hispanic or Latino 9.4%
Male 35%
Female 65%
AP Psychology
Number of Exams, Class of 2004-2008
Grade Level of Examinees, Class of 2008
Examinees by Race and Ethnicity, Class of 2008
Examinees by Gender, Class of 2008
0%
10%
20%
30%
40%
50%
60%
70%
80%
Grade 9 Grade 10 Grade 11 Grade 12
Perc
ent o
f Exa
min
ees
0
20,000
40,000
60,000
80,000
100,000
120,000
Num
ber o
f Exa
ms
59,543
71,699
83,931
96,108
111,118
2.6%
31.6%
65.8%
0%
2004 2005 2006 2007 2008
Number of Exam Score Examinees %
Score of 5 20,754 18.7
Score of 4 30,111 27.1
Score of 3 22,478 20.2
Score of 2 15,019 13.5
Score of 1 22,756 20.5
Total 111,118
Score Distribution, Class of 2008
27
U.S. Public Schools: High School Class Data

The 5th Annual AP Report to the Nation®
Other 2.2%Not Stated 2.6%American Indian or Alaska Native 0.2%Asian, Asian American or Pacific Islander 6.5%
Black or African American 2.3%
White 28.3%
Hispanic or Latino 57.9%
Male 35%
Female 65%
AP Spanish Language
Number of Exams, Class of 2004-2008
Grade Level of Examinees, Class of 2008
Examinees by Race and Ethnicity, Class of 2008
Examinees by Gender, Class of 2008
0%
10%
20%
30%
40%
50%
Grade 9 Grade 10 Grade 11 Grade 12
Perc
ent o
f Exa
min
ees
0
20,000
40,000
60,000
80,000
100,000
Num
ber o
f Exa
ms
67,57674,005
78,435 79,35983,532
13.4%
36.9%
47.4%
2.3%
2004 2005 2006 2007 2008
Number of Exam Score Examinees %
Score of 5 3,280 10.3
Score of 4 6,097 19.2
Score of 3 6,278 19.8
Score of 2 7,031 22.2
Score of 1 9,022 28.5
Total 31,708
Score Distribution, Class of 2008
* Standard group students generally received most of their foreign language training in U.S. schools. They indicated on their answer sheets that they did not regularly speak or hear the foreign language of the examination at home and that they have not lived for one month or more in a country where the language was spoken.
Number of Exam Score Examinees %
Score of 5 19,032 22.8
Score of 4 21,789 26.1
Score of 3 16,807 20.1
Score of 2 12,813 15.3
Score of 1 13,091 15.7
Total 83,53228
U.S. Public Schools: High School Class Data
Standard Group* Total Group

The 5th Annual AP Report to the Nation®
Other 1.4%Not Stated 2.4%American Indian or Alaska Native 0.1%Asian, Asian Americanor Pacific Islander 2.9%
Black or African American 0.7%
White 10.8%
Hispanic or Latino 81.7%
Male 32%
Female 68%
AP Spanish Literature
Number of Exams, Class of 2004-2008
Grade Level of Examinees, Class of 2008
Examinees by Race and Ethnicity, Class of 2008
Examinees by Gender, Class of 2008
0%
10%
20%
30%
40%
50%
60%
70%
80%
Grade 9 Grade 10 Grade 11 Grade 12
Perc
ent o
f Exa
min
ees
0
3,000
6,000
9,000
12,000
15,000
Num
ber o
f Exa
ms
9,40310,393
11,21211,668
13,028
7.5%
31.1%
60.9%
0.5%
2004 2005 2006 2007 2008
Number of Exam Score Examinees %
Score of 5 1,182 9.1
Score of 4 2,593 19.9
Score of 3 4,039 31.0
Score of 2 1,982 15.2
Score of 1 3,232 24.8
Total 13,028
Score Distribution, Class of 2008
29
U.S. Public Schools: High School Class Data

The 5th Annual AP Report to the Nation®
Other 3.0%Not Stated 2.1%American Indian or Alaska Native 0.4%
Asian, Asian Americanor Pacific Islander16.6%
Black or African American 5.4%
White 64.2%
Hispanic or Latino 8.3%
Male 48%
Female 52%
AP Statistics
Number of Exams, Class of 2004-2008
Grade Level of Examinees, Class of 2008
Examinees by Race and Ethnicity, Class of 2008
Examinees by Gender, Class of 2008
0%
10%
20%
30%
40%
50%
60%
70%
80%
Grade 9 Grade 10 Grade 11 Grade 12
Perc
ent o
f Exa
min
ees
0
20,000
40,000
60,000
80,000
100,000
Num
ber o
f Exa
ms
54,599
63,481
73,886
82,175
92,817
3.5%
19.0%
77.3%
0.1%
2004 2005 2006 2007 2008
Number of Exam Score Examinees %
Score of 5 11,132 12.0
Score of 4 20,290 21.9
Score of 3 22,231 24.0
Score of 2 17,539 18.9
Score of 1 21,625 23.3
Total 92,817
Score Distribution, Class of 2008
30
U.S. Public Schools: High School Class Data

The 5th Annual AP Report to the Nation®
Other 4.4%Not Stated 2.8%American Indian or Alaska Native 0.7%
Asian, Asian Americanor Pacific Islander10.2%
Black or African American 5.3%
White 64.5%
Hispanic or Latino 12.0%
Male 29%
Female 71%
AP Studio Art: Drawing, 2-D Design, 3-D Design*
Number of Exams, Class of 2004-2008
Grade Level of Examinees, Class of 2008
Examinees by Race and Ethnicity, Class of 2008
Examinees by Gender, Class of 2008
0%
20%
40%
60%
80%
100%
Grade 9 Grade 10 Grade 11 Grade 12
Perc
ent o
f Exa
min
ees
0
5,000
10,000
15,000
20,000
25,000
30,000
Num
ber o
f Exa
ms
16,98818,799
20,40322,465
25,163
1.8%16.1%
82.0%
0.1%
2004 2005 2006 2007 2008
Number of Exam Score Examinees %
Score of 5 3,183 12.6
Score of 4 4,860 19.3
Score of 3 9,051 36.0
Score of 2 6,626 26.3
Score of 1 1,443 5.7
Total 25,163
Score Distribution, Class of 2008
31
U.S. Public Schools: High School Class Data
*This page contains data for all three AP Studio Art portfolio assessments: Drawing, 2-D Design and 3-D Design Charts showing examinees by grade level, race/ethnicity and gender include demographic data from all portfolios combined, so some populations may be slightly inflated when individuals in those populations submitted more than one type of portfolio in 2008.
The 5th Annual AP Report to the Nation®
0%
20%
40%
60%
80%
100%
Grade 9 Grade 10 Grade 11 Grade 12
Perc
ent o
f Exa
min
ees
0
50,000
100,000
150,000
200,000
250,000
300,000
Num
ber o
f Exa
ms
199,377215,845
239,650256,048
278,379
7.5%
87.1%
5.3%0.1%
2004 2005 2006 2007 2008
Other 3.5%Not Stated 2.3%American Indian or Alaska Native 0.6%
Asian, Asian Americanor Pacific Islander 11.9%
Black or African American 6.7%
White 63.4%
Hispanic or Latino 11.6%
Male 45%
Female 55%
AP United States History
Number of Exams, Class of 2004-2008
Grade Level of Examinees, Class of 2008
Examinees by Race and Ethnicity, Class of 2008
Examinees by Gender, Class of 2008
Number of Exam Score Examinees %
Score of 5 28,035 10.1
Score of 4 52,553 18.9
Score of 3 60,959 21.9
Score of 2 74,521 26.8
Score of 1 62,311 22.4
Total 278,379
Score Distribution, Class of 2008
32
U.S. Public Schools: High School Class Data

The 5th Annual AP Report to the Nation®
Other 3.9%Not Stated 2.5%American Indian or Alaska Native 0.5%
Asian, Asian Americanor Pacific Islander 13.5%
Black or African American 7.7%
White 57.8%
Hispanic or Latino 14.0%
Male 44%
Female 56%
AP World History
Number of Exams, Class of 2004-2008
Grade Level of Examinees, Class of 2008
Examinees by Race and Ethnicity, Class of 2008
Examinees by Gender, Class of 2008
0%
10%
20%
30%
40%
50%
60%
70%
80%
Grade 9 Grade 10 Grade 11 Grade 12
Perc
ent o
f Exa
min
ees
0
20,000
40,000
60,000
80,000
100,000
Num
ber o
f Exa
ms
20,698
33,162
45,371
61,430
81,412
77.5%
12.1%7.0%
3.5%
2004 2005 2006 2007 2008
Number of Exam Score Examinees %
Score of 5 7,956 9.8
Score of 4 12,290 15.1
Score of 3 20,566 25.3
Score of 2 19,938 24.5
Score of 1 20,662 25.4
Total 81,412
Score Distribution, Class of 2008
33
U.S. Public Schools: High School Class Data
Related Documents


![10th Annual AP Report to the Nation Single Page[1]](https://static.cupdf.com/doc/110x72/577cd1471a28ab9e78940b9d/10th-annual-ap-report-to-the-nation-single-page1.jpg)
