AP Physics 1 – Summer Work (40 pts) Mr. Anderson: 2019-2020 Expect to be challenged! This is a college level course where you will be using your knowledge and understanding of everything you have learned in all of your classes to solve problems, analyze situations, arrange materials, compare data, design labs, and build incredible things. That is physics! Success: Effectiveness: Performance: You cannot expect to acquire the understanding you need to do well on an AP Exam by merely attending class and listening to the teacher. You have to become INVOLVED. You have to PARTICIPATE. If you get stuck, see ME, or other students! Ask for HELP. Your classmates will be your new best friends. You must study regularly. Students who study regularly have a good foundation to build on for new topics. This will pay off! If you are unorganized or inconsistent, things may start to fall apart – and nobody wants that to happen. Busy work is not assigned in this course, so do what I ask you to do regularly! Especially the homework!! Homework => Practice => Success Summer To Do Checklist: 1) Email instructor at [email protected] (Due By Aug. 28th, 2019) (10 pts) 2) Complete the attached MATH Assignment and turn in by the end of the first week of class. (30 pts) 3) Carefully read the attached text, Experimental Design and Graphical Analysis of Data Details: 1) Preferably today, but no later than Aug. 27th, 2018, email me at [email protected] to introduce yourself. Please include the following information with your email. (Late → - 5 pts). - First name, last name, last math class taken and grade received. - What was the most challenging class you have taken at the high school, and what did you do to be successful? - Personal interests, hobbies, summer plans, etc. - Future post-secondary plans. - What do you hope to get out of this course besides a good grade?

Welcome message from author
This document is posted to help you gain knowledge. Please leave a comment to let me know what you think about it! Share it to your friends and learn new things together.
Transcript
AP Physics 1 – Summer Work (40 pts) Mr. Anderson: 2019-2020 Expect to be challenged! This is a college level course where you will be using your knowledge and understanding of everything you have learned in all of your classes to solve problems, analyze situations, arrange materials, compare data, design labs, and build incredible things. That is physics! Success: Effectiveness: Performance: You cannot expect to acquire the understanding you need to do well on an AP Exam by merely attending class and listening to the teacher. You have to become INVOLVED. You have to PARTICIPATE. If you get stuck, see ME, or other students! Ask for HELP. Your classmates will be your new best friends. You must study regularly. Students who study regularly have a good foundation to build on for new topics. This will pay off! If you are unorganized or inconsistent, things may start to fall apart – and nobody wants that to happen. Busy work is not assigned in this course, so do what I ask you to do regularly! Especially the homework!! Homework => Practice => Success Summer To Do Checklist: 1) Email instructor at [email protected] (Due By Aug. 28th, 2019) (10 pts) 2) Complete the attached MATH Assignment and turn in by the end of the first week of class. (30 pts) 3) Carefully read the attached text, Experimental Design and Graphical Analysis of Data Details: 1) Preferably today, but no later than Aug. 27th, 2018, email me at [email protected] to introduce yourself. Please include the following information
with your email. (Late → - 5 pts). - First name, last name, last math class taken and grade received. - What was the most challenging class you have taken at the high school, and
what did you do to be successful? - Personal interests, hobbies, summer plans, etc. - Future post-secondary plans. - What do you hope to get out of this course besides a good grade?

2) Attached to this packet is a MATH Assignment that is designed to help you
understand the reading assignment and prepare you for the high level of math required
for this class. Please complete this before the first day of class. There will be quiz
covering this material at the end of the first week of class. Email me if you have any
questions. Don’t fall behind. (Late → - 5pts). 3) Attached to this packet is a reading assignment called Experimental Design and Graphical Analysis of Data. Read this paper very carefully as it will lay the foundation for much of the work you will do in this course. Scientific practices that will be developed include:
❖ Using representations and models to communicate scientific phenomena and solve scientific problems;
❖ Using mathematics appropriately; ❖ Engaging in scientific questioning to extend thinking or to guide investigations
within the context of the AP course; ❖ Planning and implementing data collection strategies in relation to a particular
scientific question; ❖ Performing data analysis and evaluation of evidence; ❖ Working with scientific explanations and theories; and ❖ Connecting and relating knowledge across various scales, concepts, and
representations in and across domains. Have a great summer! Mr. Anderson [email protected]

Summer MATH Assignment
You are to answer all of the questions and bring them to the first class of the school year. There will be a test (50 pts) over this material during the first week of school. Part 1: Factor-Label Method for Converting Units (Dimensional Analysis) A very useful method of converting one unit to an equivalent unit is called the factor-label method of unit conversion. You may be given the speed of an object as 25 km/h and wish to express it in m/s. To make this conversion, you must change km to m and h to s by multiplying by a series of factors so that the units you do not want will cancel out and the units you want will remain. Conversion factors: 1000 m = 1 km and 3600 seconds = 1 hour
What is the conversion factor to convert km/h to m/s? What is the conversion factor to convert m/s to km/h?
Do the following conversions. Show all of your work!
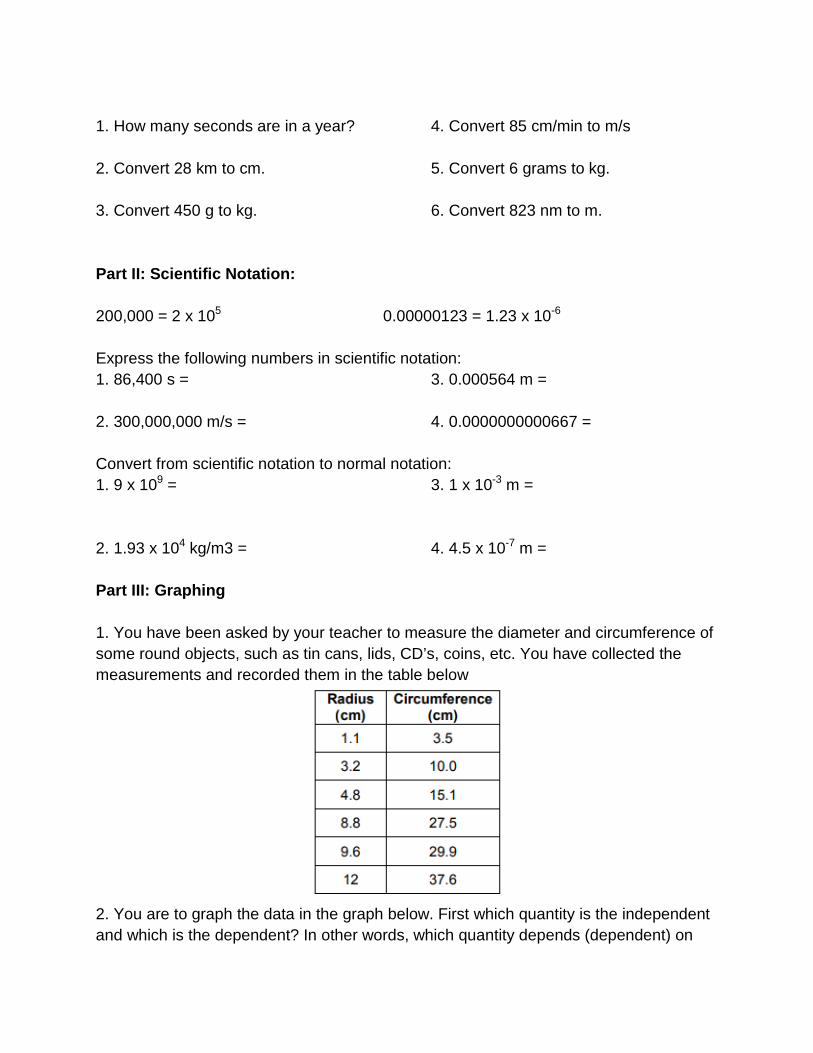
1. How many seconds are in a year? 2. Convert 28 km to cm. 3. Convert 450 g to kg.
4. Convert 85 cm/min to m/s 5. Convert 6 grams to kg. 6. Convert 823 nm to m.
Part II: Scientific Notation: 200,000 = 2 x 10⁵ 0.00000123 = 1.23 x 10⁻⁶
Express the following numbers in scientific notation: 1. 86,400 s = 2. 300,000,000 m/s =
3. 0.000564 m = 4. 0.0000000000667 =
Convert from scientific notation to normal notation: 1. 9 x 109 = 2. 1.93 x 10⁴ kg/m3 =
3. 1 x 10⁻³ m = 4. 4.5 x 10⁻⁷ m =
Part III: Graphing 1. You have been asked by your teacher to measure the diameter and circumference of some round objects, such as tin cans, lids, CD’s, coins, etc. You have collected the measurements and recorded them in the table below
2. You are to graph the data in the graph below. First which quantity is the independent and which is the dependent? In other words, which quantity depends (dependent) on
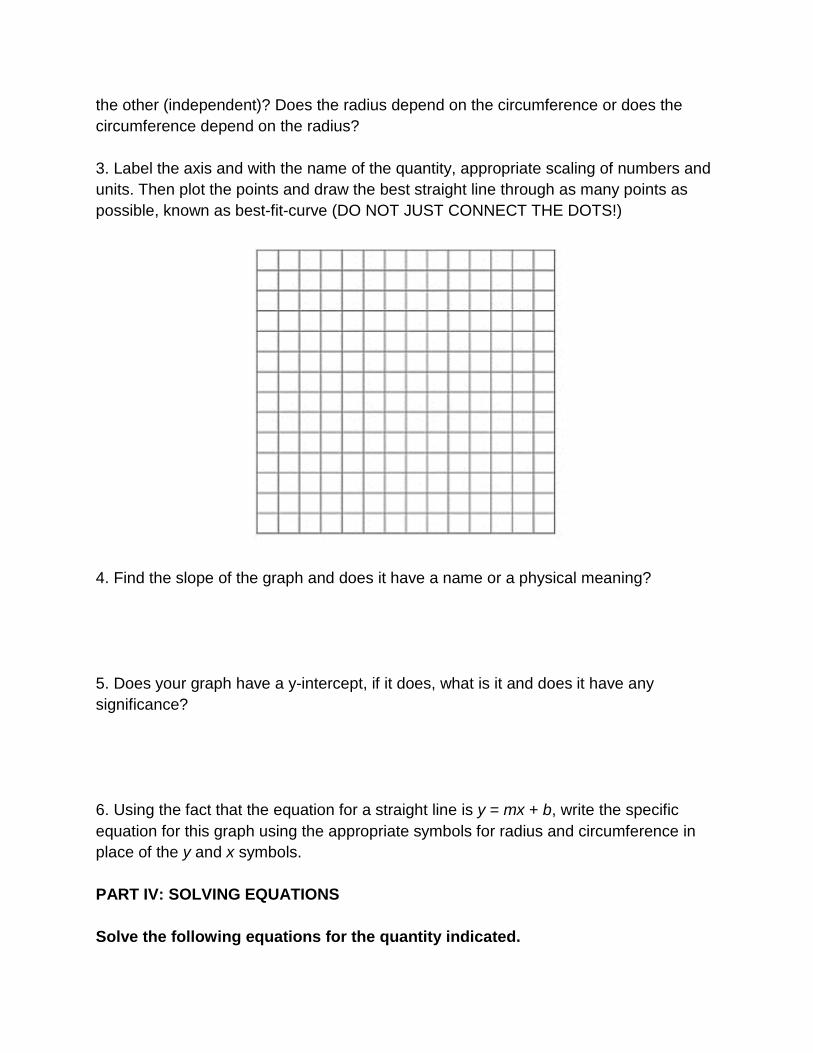
the other (independent)? Does the radius depend on the circumference or does the circumference depend on the radius? 3. Label the axis and with the name of the quantity, appropriate scaling of numbers and units. Then plot the points and draw the best straight line through as many points as possible, known as best-fit-curve (DO NOT JUST CONNECT THE DOTS!)
4. Find the slope of the graph and does it have a name or a physical meaning? 5. Does your graph have a y-intercept, if it does, what is it and does it have any significance? 6. Using the fact that the equation for a straight line is y = mx + b, write the specific equation for this graph using the appropriate symbols for radius and circumference in place of the y and x symbols. PART IV: SOLVING EQUATIONS Solve the following equations for the quantity indicated.
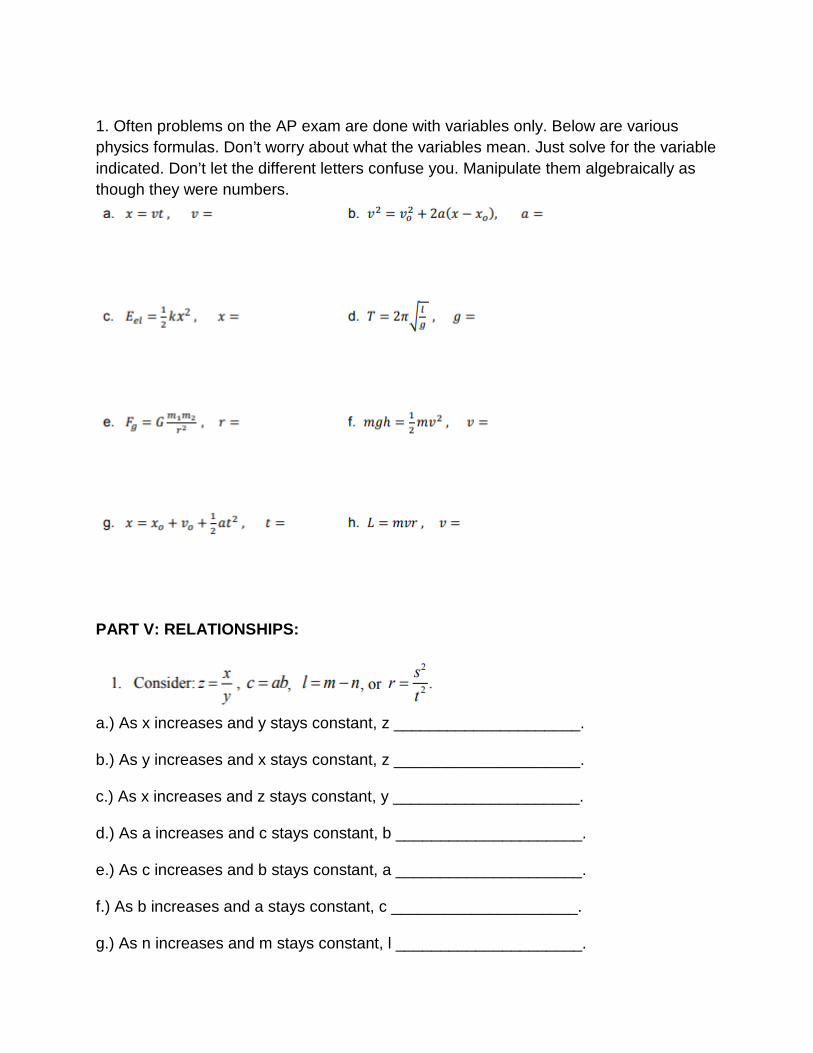
1. Often problems on the AP exam are done with variables only. Below are various physics formulas. Don’t worry about what the variables mean. Just solve for the variable indicated. Don’t let the different letters confuse you. Manipulate them algebraically as though they were numbers.
PART V: RELATIONSHIPS:
a.) As x increases and y stays constant, z _____________________.
b.) As y increases and x stays constant, z _____________________.
c.) As x increases and z stays constant, y _____________________.
d.) As a increases and c stays constant, b _____________________.
e.) As c increases and b stays constant, a _____________________.
f.) As b increases and a stays constant, c _____________________.
g.) As n increases and m stays constant, l _____________________.

h.) As l increases and n stays constant, m _____________________.
i.) If s is tripled and t stays constant, r is multiplied by _____________________.
j.) If t is doubled and s stays constant, r is multiplied by _____________________.
PART VI: Application: Do the following problems and show your work:
A bus driver clocked the following times for portions of his route:
a. How long did it take him to drive from Station A to Station E? b. What part of the whole traveling time does the time between Stations B and D represent? c. The time to go from Station A to Station C is how much more than the time to go from Station C to Station E? Experimental Design and Graphical Analysis of Data A. Designing a controlled experiment When scientists set up experiments they often attempt to determine how a given variable affects another variable. This requires the experiment to be designed in such a way that when the experimenter changes one variable, the effects of this change on a second variable can be measured. If any other variable that could affect the second variable is changed, the experimenter would have no way of knowing which

variable was responsible for the results. For this reason, scientists always attempt to conduct controlled experiments. This is done by choosing only one variable to manipulate in an experiment, observing its effect on a second variable, and holding all other variables in the experiment constant. Suppose you wanted to test how changing the mass of a pendulum affects the time it takes a pendulum to swing back and forth (also known as its period). You must keep all other variables constant. You must make sure the length of the pendulum string does not change. You must make sure that the distance that the pendulum is pulled back (also known as the amplitude) does not change. The length of the pendulum and the amplitude are variables that must be held constant in order to run a controlled experiment. The only thing that you would deliberately change would be the mass of the pendulum. This would then be considered the independent variable, because you will decide how much mass to put on the pendulum for each experimental trial. There are three possible outcomes to this experiment: 1. If the mass is increased, the period will increase. 2. If the mass is increased, the period will decrease. 3. If the mass is increased, the period will remain unchanged. Since you are testing the effect of changing the mass on the period, and since the period may depend on the value of the mass, the period is called the dependent variable. In review, there are only two variables that area allowed to change in a well-designed experiment. The variable manipulated by the experimenter (mass in this example) is called the independent variable. The dependent variable (period in this case) is the one that responds to or depends on the variable that was manipulated. Any other variable which might affect the value of the dependent value must be held constant. We might call these variables controlled variables. When an experiment is conducted with one (and only one) independent variable and one (and only one) dependent variable while holding all other variables constant, it is a controlled experiment. B. Recording Data How can a scientist determine if two variables are related to one another? First she must collect the data from an experiment. Raw data is recorded in a data table immediately as it is collected in the lab. It is important to build a well-organized data table such as the example shown. If you think that a given piece of data is in error, draw a single line through it and recollect the data point. Later, if you decide that the original point was really the correct one, you will still be able to read it. The independent variable, mass, is given in the first column. Scientists have agreed to consistently place the independent variable in the leftmost column. Whenever something is done as an agreed upon standard it is called a convention. It is conventional, therefore, to place the independent variable in the leftmost column of the data table. Notice that each column is labeled with the name of the variable being measured and the units of measurement in parentheses below the variable name. Notice that each data entry in a given column is written to the same number of decimal places. This number of decimal places is determined by the measuring device (and technique) used in the experiment. In the mass column she recorded mass to the nearest 0.1 g because her balance was calibrated to the nearest 0.1 g. In the "time for 10 swings" column the
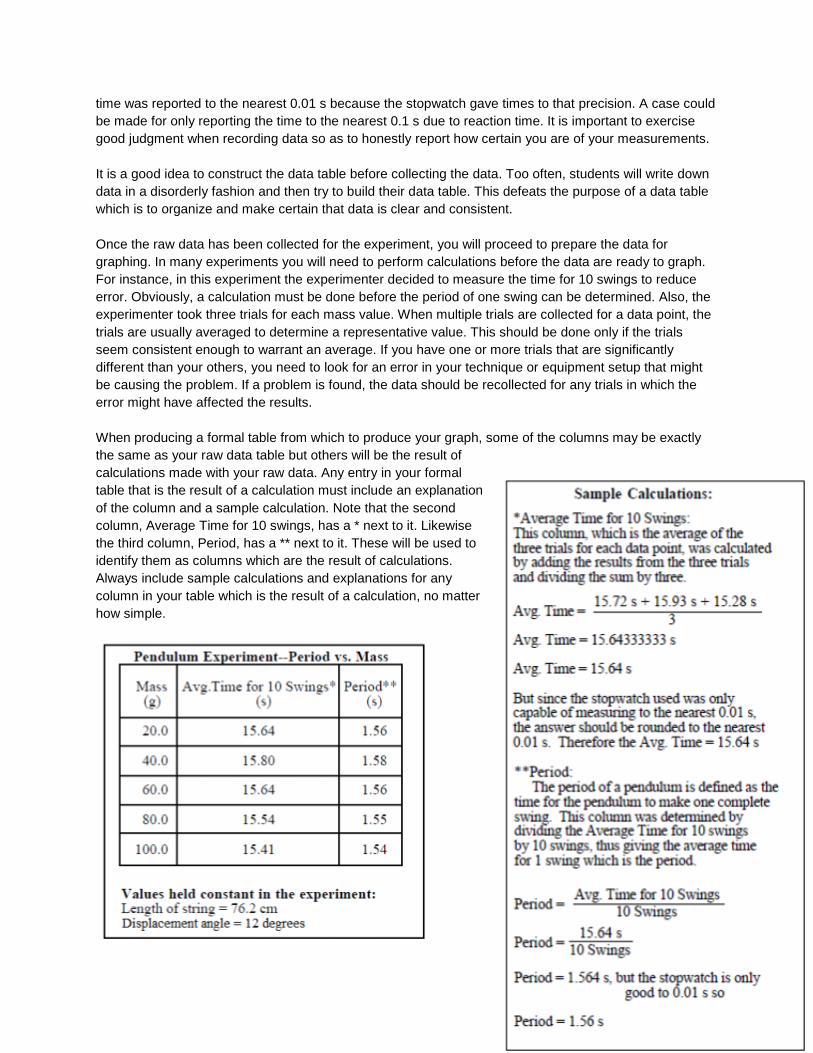
time was reported to the nearest 0.01 s because the stopwatch gave times to that precision. A case could be made for only reporting the time to the nearest 0.1 s due to reaction time. It is important to exercise good judgment when recording data so as to honestly report how certain you are of your measurements. It is a good idea to construct the data table before collecting the data. Too often, students will write down data in a disorderly fashion and then try to build their data table. This defeats the purpose of a data table which is to organize and make certain that data is clear and consistent. Once the raw data has been collected for the experiment, you will proceed to prepare the data for graphing. In many experiments you will need to perform calculations before the data are ready to graph. For instance, in this experiment the experimenter decided to measure the time for 10 swings to reduce error. Obviously, a calculation must be done before the period of one swing can be determined. Also, the experimenter took three trials for each mass value. When multiple trials are collected for a data point, the trials are usually averaged to determine a representative value. This should be done only if the trials seem consistent enough to warrant an average. If you have one or more trials that are significantly different than your others, you need to look for an error in your technique or equipment setup that might be causing the problem. If a problem is found, the data should be recollected for any trials in which the error might have affected the results. When producing a formal table from which to produce your graph, some of the columns may be exactly the same as your raw data table but others will be the result of calculations made with your raw data. Any entry in your formal table that is the result of a calculation must include an explanation of the column and a sample calculation. Note that the second column, Average Time for 10 swings, has a * next to it. Likewise the third column, Period, has a ** next to it. These will be used to identify them as columns which are the result of calculations. Always include sample calculations and explanations for any column in your table which is the result of a calculation, no matter how simple.
Characteristics of Good Data Recording 1. Raw data is recorded in ink. Data that you think is "bad" is not destroyed. It is noted but kept in case it is needed for future use. 2. The table for raw data is constructed prior to beginning data collection. 3. The table is laid out neatly using a straightedge. 4. The independent variable is recorded in the leftmost column (by convention). 5. The data table is given a descriptive title which makes it clear which experiment it represents. 6. Each column of the data table is labeled with the name of the variable it contains. 7. Below (or to the side of) each variable name is the name of the unit of measurement (or its symbol) in parentheses. 8. Data is recorded to an appropriate number of decimal places as determined by the precision of the measuring device or the measuring technique. 9. All columns in the table which are the result of a calculation are clearly explained and sample calculations are shown making it clear how each column in the table was determined. 10. The values held constant in the experiment are described and their values are recorded.
C. Graphing Data Once the data is collected, it is necessary to determine the relationship between the two variables in the experiment. You will construct a graph (or sometimes a series of graphs) from your data in order to determine the relationship between the independent and dependent variables. For each relationship that is being investigated in your experiment, you should prepare the appropriate graph. In general your graphs in physics are of a type known as scatter graphs. The graphs will be used to give you a conceptual understanding of the relation between the variables, and will usually also be used to help you formulate mathematical statement which describes that relationship. Graphs should include each of the elements described below:
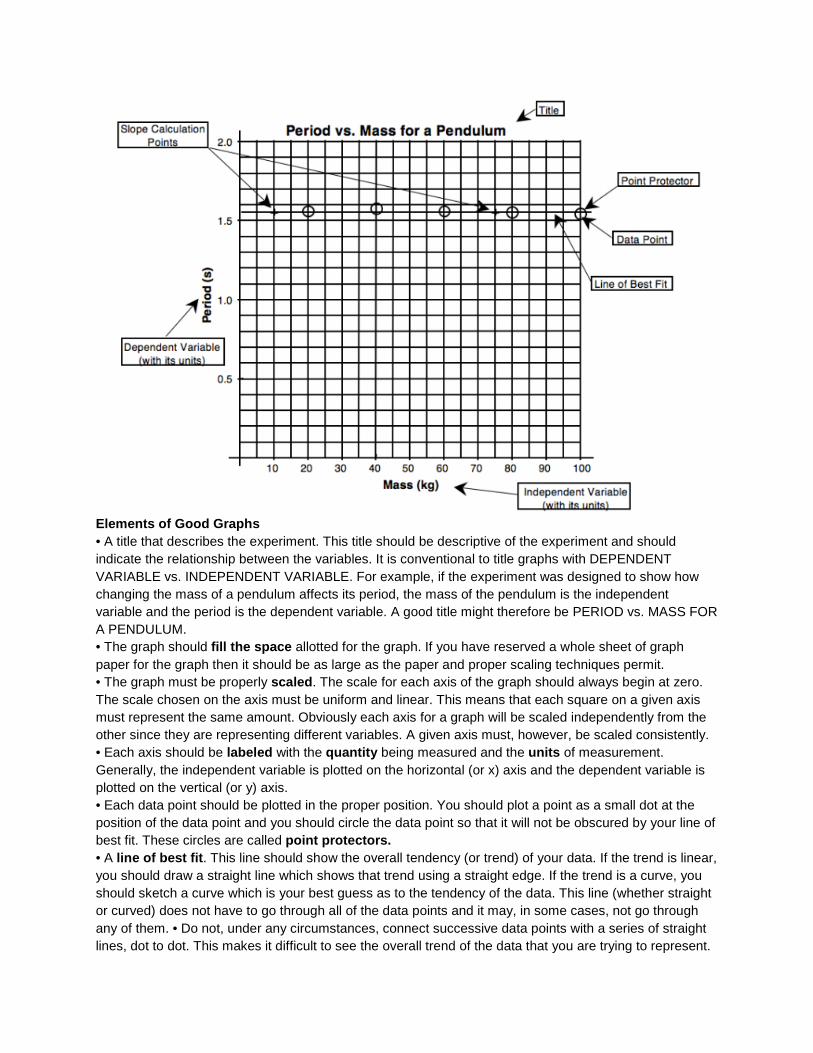
Elements of Good Graphs • A title that describes the experiment. This title should be descriptive of the experiment and should indicate the relationship between the variables. It is conventional to title graphs with DEPENDENT VARIABLE vs. INDEPENDENT VARIABLE. For example, if the experiment was designed to show how changing the mass of a pendulum affects its period, the mass of the pendulum is the independent variable and the period is the dependent variable. A good title might therefore be PERIOD vs. MASS FOR A PENDULUM. • The graph should fill the space allotted for the graph. If you have reserved a whole sheet of graph paper for the graph then it should be as large as the paper and proper scaling techniques permit. • The graph must be properly scaled. The scale for each axis of the graph should always begin at zero. The scale chosen on the axis must be uniform and linear. This means that each square on a given axis must represent the same amount. Obviously each axis for a graph will be scaled independently from the other since they are representing different variables. A given axis must, however, be scaled consistently. • Each axis should be labeled with the quantity being measured and the units of measurement. Generally, the independent variable is plotted on the horizontal (or x) axis and the dependent variable is plotted on the vertical (or y) axis. • Each data point should be plotted in the proper position. You should plot a point as a small dot at the position of the data point and you should circle the data point so that it will not be obscured by your line of best fit. These circles are called point protectors. • A line of best fit. This line should show the overall tendency (or trend) of your data. If the trend is linear, you should draw a straight line which shows that trend using a straight edge. If the trend is a curve, you should sketch a curve which is your best guess as to the tendency of the data. This line (whether straight or curved) does not have to go through all of the data points and it may, in some cases, not go through any of them. • Do not, under any circumstances, connect successive data points with a series of straight lines, dot to dot. This makes it difficult to see the overall trend of the data that you are trying to represent.

• If you are plotting the graph by hand, you will choose two points for all linear graphs from which to calculate the slope of the line of best fit. These points should not be data points unless a data point happens to fall perfectly on the line of best fit. Pick two points which are directly on your line of best fit and which are easy to read from the graph. Mark the points you have chosen with a +. • Do not do other work in the space of your graph such as the slope calculation or other parts of the mathematical analysis. • If your graph does not yield a straight line, you will be expected to manipulate one (or more) of the axes of your graph, replot the manipulated data, and continue doing this until a straight line results. We will address the details of linearization later in the course. D. Graphical Analysis and Linear Mathematical Models When the data you collect yields a linear graph, you will proceed to determine the mathematical equation that describes the relationship between the variables using the slope intercept form of the equation of a line. Consider the following experiment in which the experimenter tests the effect of adding various masses to a spring on the amount that the spring stretches. The development of the mathematical model is shown on the next page. Begin with the generic equation for a line:
y = mx + b Determine the slope and y-intercept from graph:
slope (m) = 0.30 (cm/g); y-intercept = 3.2 cm Substitute constants with units from experiment
y = [0.30 (cm/g)]x + 3.2 cm Substitute variables from experiment:
Stretch = S; mass = m S = [0.30 (cm/g)]m + 3.2 cm Final mathematical model: S = [0.30 (cm/g)]m + 3.2 cm The result of this experiment, then, is a mathematical equation which models the behavior of the spring:
Stretch = 0.30 cm/g · mass + 3.2 cm With this mathematical model we know many characteristics of the spring and can predict its behavior without actually further testing the spring. In models of this type, there is physical significance associated with each value in the equation. For instance, the slope of this graph, 0.30 cm/g, tells us that the spring will stretch 0.30 centimeters for each gram of mass that is added to it. We might call this slope the "wimpiness" of the spring, since if the slope is high it means that the spring stretches a lot when a relatively small mass is placed on it and a low value for the slope means that it takes a lot of mass to get a little stretch. The y-intercept of 3.2 cm tells us that the spring was already stretched 3.2 cm when the experimenter started adding mass to the spring. With this mathematical model, we can determine the stretch of the spring for any value of mass by simply substituting the mass value into the equation. How far would the spring be stretched if 57.2 g of mass were added to the spring? Mathematical models are powerful tools in the study of science and we will use those that you develop experimentally as the basis of many of our studies in physics. When you are evaluating real data, you will need to decide whether or not the graph should go through the origin. Given the limitations of the experimental process, real data will rarely yield a line that goes perfectly through the origin. In the example above, the computer calculated a y-intercept of 0.01 cm ±

0.09 cm. Since the uncertainty (±0.09 cm) in determining the y-intercept exceeds the value of the y-intercept (0.01 cm) it is obviously reasonable to call the y-intercept zero. Other cases may not be so clear cut. The first rule of order when trying to determine whether or not a direct linear relationship is indeed a direct proportion is to ask yourself what would happen to the dependent variable if the independent variable were zero. In many cases you can reason from the physical situation being investigated whether or not the graph should logically go through the origin. Sometimes, however, it might not be so obvious. In these cases we will assume that it has some physical significance and will go about trying to determine that significance.
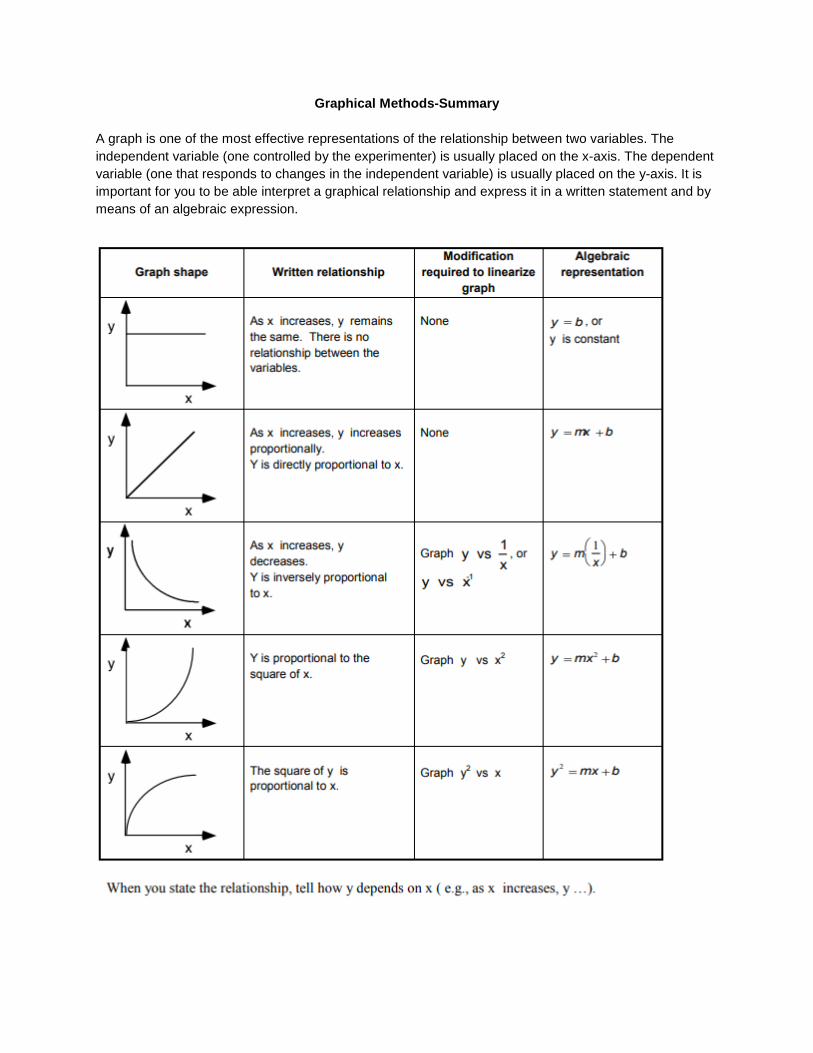
Graphical Methods-Summary
A graph is one of the most effective representations of the relationship between two variables. The independent variable (one controlled by the experimenter) is usually placed on the x-axis. The dependent variable (one that responds to changes in the independent variable) is usually placed on the y-axis. It is important for you to be able interpret a graphical relationship and express it in a written statement and by means of an algebraic expression.
Related Documents