Aon plc September 13, 2021

Welcome message from author
This document is posted to help you gain knowledge. Please leave a comment to let me know what you think about it! Share it to your friends and learn new things together.
Transcript

Aon plc
September 13, 2021

1
Greg Case
Chief Executive Officer
Christa Davies
Chief Financial Officer
2
Safe Harbor Statement
This communication contains certain statements related to f uture results, or states Aon’s intentions, beliefs and expectations or predictions f or the f uture which are f orward-looking statements as
that term is def ined in the Priv ate Securities Litigation Ref orm Act of 1995. These f orward-looking statements are subject to certain risks and uncertainties that could cause actual results to diff er
materially f rom either historical or anticipated results depending on a v ariety of f actors. These f orward-looking statements include inf ormation about possible or assumed f uture results of Aon’s
operations, the uncertainty surrounding the COVID-19 pandemic, and the termination of Aon’s Business Combination Agreement with Willis Towers Watson Public Limited Company regarding the
combination of the parties (the “Combination”). All statements other than statements of historical f acts that address activ ities, ev ents or dev elopments that Aon expects or anticipates may occur in
the f uture, including such things as its outlook, f uture capital expenditures, growth in commissions and f ees, changes to the composition or lev el of its rev enues, cash f low and liquidity , expected
tax rates, business strategies, competitiv e strengths, goals, the benef its of new initiativ es, growth of its business and operations, plans, ref erences to f uture successes, the termination of the
Combination and div estitures planned in connection therewith, and pending or potential litigation relating to the Combination and div estitures planned in connection therewith, including as a result of
the termination or potential termination of such transactions, are f orward-looking statements. Also, when Aon uses the words such as “anticipate”, “believ e”, “estimate”, “expect”, “intend”, “plan”,
“probably ”, “potential”, “looking f orward”, or similar expressions, it is making f orward-looking statements.
The f ollowing f actors, among others, could cause actual results to diff er f rom those set f orth in or anticipated by the f orward-looking statements: general economic and political conditions in
diff erent countries in which Aon does business around the world, including the U.K.’s withdrawal f rom the European Union; changes in the competitiv e env ironment or damage to Aon’s reputation;
f luctuations in exchange and interest rates that could inf luence rev enue and expenses; changes in global equity and f ixed income markets that could aff ect the return on inv ested assets; changes
in the f unding status of Aon's v arious def ined benef it pension plans and the impact of any increased pension f unding resulting f rom those changes; the lev el of Aon’s debt limiting f inancial f lexibility
or increasing borrowing costs; rating agency actions that could aff ect Aon's ability to borrow f unds; v olatility in Aon’s tax rate due to a v ariety of diff erent factors, including U.S. tax ref orm; changes
in estimates or assumptions on Aon’s f inancial statements; limits on Aon’s subsidiaries to make div idend and other pay ments to Aon; the impact of lawsuits and other contingent liabilities and loss
contingencies arising f rom errors and omissions and other claims against Aon; the impact of , and potential challenges in comply ing with, legislation and regulation in the jurisdictions in which Aon
operates, particularly giv en the global scope of Aon’s businesses and the possibility of conf licting regulatory requirements across jurisdictions in which Aon does business; the impact of any
inv estigations brought by regulatory authorities in the U.S., Ireland, the U.K. and other countries; the impact of any inquiries relating to compliance with the U.S. Foreign Corrupt Practices Act and
non-U.S. anti-corruption laws and with U.S. and non-U.S. trade sanctions regimes; f ailure to protect intellectual property rights or allegations that Aon inf ringes on the intellectual property rights of
others; the eff ects of Irish law on Aon’s operating f lexibility and the enf orcement of judgments against Aon; the f ailure to retain and attract qualif ied personnel, whether as a result of the termination
of the Combination or otherwise; international risks associated with Aon’s global operations; the eff ects of natural or man-made disasters, including the effects of COVID-19 and other health
pandemics; the potential of a system or network breach or disruption resulting in operational interruption or improper disclosure of personal data; Aon’s ability to dev elop and implement new
technology ; the damage to Aon’s reputation among clients, markets or third parties; the actions taken by third parties that perf orm aspects of Aon’s business operations and client serv ices; the
extent to which Aon manages certain risks created in connection with the serv ices, including fiduciary and inv estments, consulting, and other adv isory serv ices, among others, that Aon currently
prov ides, or will prov ide in the f uture, to clients; Aon’s ability to continue, and the costs and the costs and risks associated with, growing, dev eloping and integrating companies that it acquires or
new lines of business; changes in commercial property and casualty markets, commercial premium rates or methods of compensation; changes in the health care sy stem or Aon’s relationships
with insurance carriers; Aon’s ability to implement initiativ es intended to y ield, and the ability to achiev e, cost sav ings; Aon’s ability to realize the expected benef its f rom its restructuring plan;
adv erse eff ects on the market price of Aon’s securities and/or operating results for any reason, including, without limitation, because of the f ailure to consummate the Combination; the failure to
realize the expected benef its of the Combination (including anticipated rev enue and growth sy nergies); signif icant transaction costs in connection with the terminated Combination and div estitures
planned in connection with the Combination; litigation associated with the termination of the Combination and div estitures planned in connection with the Combination; the payment of the
termination f ee in connection with the termination of the Combination; the potential impact of the termination of the Combination on relationships, including with suppliers, customers, employ ees
and regulators; and general economic, business and political conditions (including any epidemic, pandemic or disease outbreak, including COVID-19) that af f ect the Company .
Any or all of Aon’s forward-looking statements may turn out to be inaccurate, and there are no guarantees about Aon’s perf ormance. The f actors identif ied abov e are not exhaustive. Aon and its
subsidiaries operate in a dy namic business env ironment in which new risks may emerge f requently . Accordingly, y ou should not place undue rel iance on f orward-looking statements, which speak
only as of the dates on which they are made. In addition, results f or the y ear ended December 31, 2020, and the quarters ended March 31, 2021, and June 30, 2021, are not necessarily indicativ e
of results that may be expected f or any f uture period, particularly in light of the continuing eff ects of the COVID-19 pandemic. Further inf ormation concerning Aon and its businesses, including
f actors that potentially could materially aff ect Aon’s f inancial results, is contained in Aon’s f ilings with the Securities and Exchange Commission (the “SEC”). See Aon’s Annual Report on Form 10-K
f or the y ear ended December 31, 2020 and its Quarterly Reports on Form 10-Q for the quarters ended March 31, 2021, and June 30, 2021, f or a f urther discussion of these and other risks and
uncertainties applicable to Aon and its businesses. These f actors may be rev ised or supplemented in subsequent reports f iled with the SEC. Aon is not under, and expressly disclaims, any
obligation to update or alter any f orward-looking statement that it may make f rom time to time, whether as a result of new inf ormation, f uture ev ents or otherwise.

3
Leading Global Professional Services Firm Enabled by Data & Analytics
Aon is a leading global professional services firm providing advice and solutions in Risk, Retirement and
Health at a time when those topics have never been
more important to the global economy. Aon develops
insights that reduce the volatility our clients face and help them maximize their performance
$110B+risk premium placed
annually
120countries in
w hich Aon
operates
50kAon colleagues
around the
w orld
ENABLED BYDATA & ANALYTICS
RISK RETIREMENT HEALTH
$3.4Tin assets under
advisement1
$180Bof healthcare premium
directed annually2
Aon provides risk advisory, commercial risk and reinsurance solutions to help
clients better identify, quantify and manage their risk exposure
Aon provides actuarial, investment and retirement solutions to help clients design
and implement secure, equitable and sustainable retirement programs
Aon provides consulting, global benefits and exchange solutions to help clients mitigate rising health care costs and
improve employee health and well-being
Aon combines data, technology, and advisory services to develop insights that help clients reduce volatility and improve
performance
1 As of 6/30/2020, includes non-discretionary assets advised by Aon and its global affiliates which includes retainer clients and clients in which Aon and its global
affi l iates have performed project services for over the past 12 months. Project clients may not currently engage Aon at the t ime of the calculation of assets
under advisement as the project may have concluded earlier during preceding 12 -month period.
2 Includes $30B of fully-insured premium and $150B of self-insured premium equivalents

4
Our Aon United Strategy Remains Constant
5
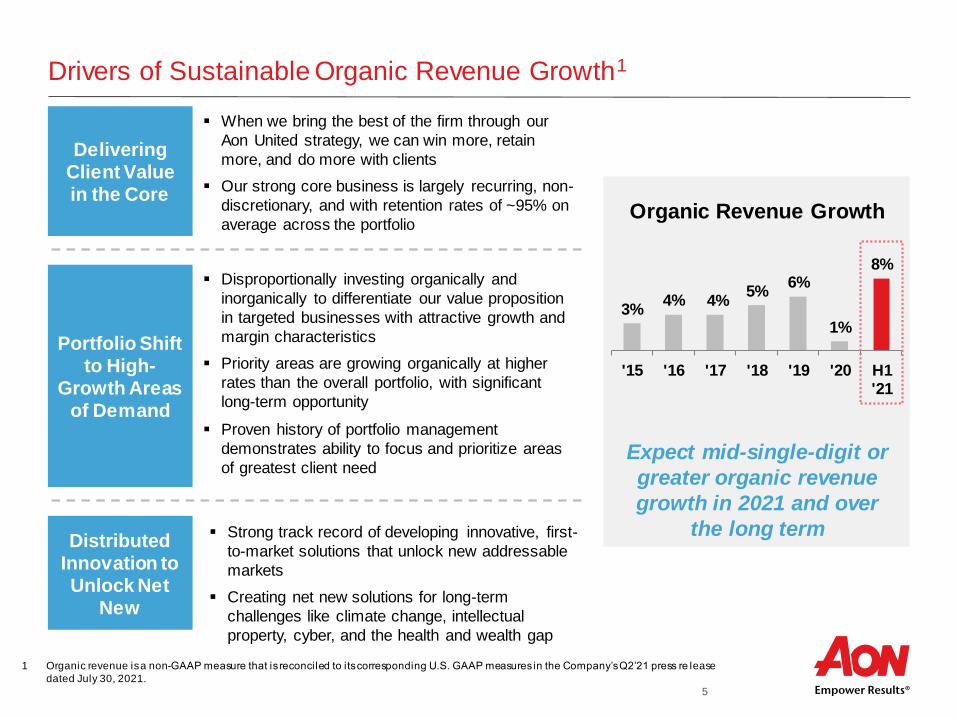
3%4% 4%
5%6%
1%
8%
'15 '16 '17 '18 '19 '20 H1'21
Drivers of Sustainable Organic Revenue Growth1
Delivering Client Value in the Core
Portfolio Shift to High-
Growth Areas of Demand
Distributed Innovation to Unlock Net
New
1 Organic revenue is a non-GAAP measure that is reconciled to its corresponding U.S. GAAP measures in the Company’s Q2’21 press re lease
dated July 30, 2021.
▪ When we bring the best of the firm through our
Aon United strategy, we can win more, retain
more, and do more with clients
▪ Our strong core business is largely recurring, non-
discretionary, and with retention rates of ~95% on
average across the portfolio
▪ Disproportionally investing organically and
inorganically to differentiate our value proposition
in targeted businesses with attractive growth and
margin characteristics
▪ Priority areas are growing organically at higher
rates than the overall portfolio, with significant
long-term opportunity
▪ Proven history of portfolio management
demonstrates ability to focus and prioritize areas
of greatest client need
▪ Strong track record of developing innovative, first-
to-market solutions that unlock new addressable
markets
▪ Creating net new solutions for long-term
challenges like climate change, intellectual
property, cyber, and the health and wealth gap
Organic Revenue Growth
Expect mid-single-digit or
greater organic revenue
growth in 2021 and over
the long term

6
Building on Existing Capabilities to Address New Areas of Client Need
Client demand continues to outpace innovation. Our Aon United strategy brings our full firm’s content and capabilities to create solutions for those challenges, demonstrated by our track record of
expanding and unlocking addressable markets. Client feedback combined with our data, analytics, and insight highlights four examples of unmet need:
Navigating New Forms of Volatility
Expand traditional risk management to
address long-tail risks
Building a Resilient Workforce
Provide career, financial, health and wellbeing
options for a wider spectrum of employees
Rethinking Access to Capital
Offer greater access to capital, unlock value
and protect it in novel ways
Addressing the Underserved
Create more affordable, scalable products to
broaden access to a wider range of recipients
We created the market for U.S. Mortgage Reinsurance
that has transferred over $24B of credit risk on 8.3M
residential mortgages loans valued at more than $1.9T
CoverWallet, our leading digital insurance platform,
enables online distribution to the $200B market for small
commercial premium growing 6% per year with under 5%
served digitally
Comprehensive solutions using tools like Aon Architect in
Health and Pooled Employer Program in Retirement
optimize outcomes for employees against growing
medical cost and underinvestment in retirement
Over ~$20T of intangible assets in the S&P500 have no
insurance protection. Our Intellectual Property Capital
Market Solution creates the market’s only alternative
financing opportunity for IP-rich companies

7
Aon Business Services Operating Model Enables Stability and Flexibility
19.6%
28.5%
2010 2020
Historic drivers of margin
expansion, particularly
operating leverage and
expense discipline driven by
Aon Business Services,
are more important than ever
FY Adjusted Operating Margin1 ▪ Aon Business Services integrates operations, technology, data, service delivery and vendor management
▪ Service centers and business platforms increase productivity in our operations, giving client-facing colleagues more capacity to meet client need, including 1 million hours of process automation in 2020
▪ Unified, resilient operating model enables colleagues to work remotely and access all systems with no loss of productivity
▪ Global management of working capital and discretionary costs enables ongoing efficiency improvements
▪ Single platform enables prioritized investment in our highest return opportunities balanced with net operating margin improvement
1 The results presented on this page are non-GAAP measures that are reconciled to their corresponding U.S. GAAP measures in the Ap pendices of this
presentation.

8
Environmental, Social, and Governance (ESG) Risks Are an Opportunity
to Help Clients and Improve Our Own Impact
Risk mitigation and governance starts with an
independent, engaged Board supported by robust
firm-wide policies and processes
▪ Board oversees our assessment of material risks, with
delegation to committees and management as
appropriate
▪ In 2020, established internal ESG committee to increase
coordination, communication and disclosure
▪ Strong data privacy practices and required annual
training for colleagues on key risks
Governance
Helping clients manage risk, volatility,
and people is at the core of what we do.
We see a significant opportunity to
address unmet need, as risk, including
ESG risk, increases
We are committed to resiliency and
sustainability to prepare for the ongoing
challenges we face from emerging and
long-tail risks
For more, please see our 2020 Aon Impact Report
Colleagues are the cornerstone of our Aon United
strategy and our one firm culture
▪ Strength on key culture indicators in 2020:
▪ Voluntary attrition down 35% year-over-year
▪ Engagement at historic highs, consistent with top-
quartile employers
▪ Firm-wide commitment to Inclusion and Diversity (I&D):
▪ In 2020, formed Board of Directors I&D committee
and internal Global Inclusive Leadership Council
▪ 2021 executive compensation goals include I&D
▪ Investing $30m over next 5 years and leading a group of
employers to create 10,000 US apprenticeships by 2030
Social
Opportunity to help clients navigate volatility
and transition risk, while managing our impact
▪ Committed to net-zero greenhouse gas emissions by
2030, using Science Based Targets
▪ 43% reduction in CO2e emissions from 2019 to
2020, a total reduction in greenhouse gas
emissions of 60%+ since 2015
▪ Submit annually to the Carbon Disclosure
Project and signed on to support TCFD
▪ Sustainability in real estate, travel, supply chain
Environmental

9
11.7%
23.5%
2010
2011
2012
2013
2014
2015
2016
2017
2018
2019
2020
Disciplined Focus on Capital Management and Free Cash Flow
1 Return on Invested Capital (ROIC) is a non-GAAP measure. A reconciliation can be found in Appendix A.
2 Free Cash Flow Margin is a non-GAAP measure. A reconciliation can be found in Appendix B.
Return on Invested Capital1
8.2%
23.9%
20
10
20
11
20
12
20
13
20
14
20
15
20
16
20
17
20
18
20
19
20
20
Free Cash Flow Margin2
Unlocks substantial long-termshareholder value creation
Targeting working capital neutral: An improvement of ~$500M, largely
receivables, over the long term
Reduction of CapEx: Moving IT platforms to the cloud and real estate footprint to smaller, agile, open space
Reduced pension contributions: Plans closed, frozen and de-risked
Revenue Growth and Operational Improvement
Our Strategy to Drive Free Cash Flow2

101 The results presented on this page are non-GAAP measures that are reconciled to their corresponding U.S. GAAP measures in the Company’s Q4’20 press release dated February
5, 2021, with respect to 2020, and in the Company's Q4'10 press release dated February 4, 2011, with respect to 2010.
1
11
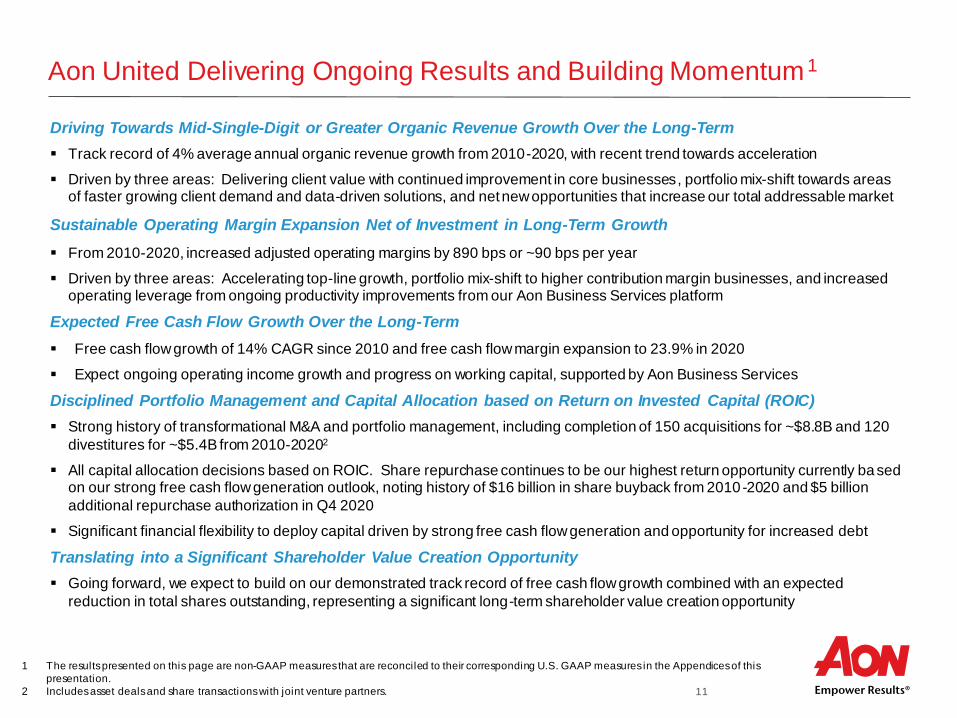
Aon United Delivering Ongoing Results and Building Momentum 1
1 The results presented on this page are non-GAAP measures that are reconciled to their corresponding U.S. GAAP measures in the Appendices of this
presentation.
2 Includes asset deals and share transactions with joint venture partners.
Driving Towards Mid-Single-Digit or Greater Organic Revenue Growth Over the Long-Term
▪ Track record of 4% average annual organic revenue growth from 2010-2020, with recent trend towards acceleration
▪ Driven by three areas: Delivering client value with continued improvement in core businesses, portfolio mix-shift towards areas of faster growing client demand and data-driven solutions, and net new opportunities that increase our total addressable market
Sustainable Operating Margin Expansion Net of Investment in Long-Term Growth
▪ From 2010-2020, increased adjusted operating margins by 890 bps or ~90 bps per year
▪ Driven by three areas: Accelerating top-line growth, portfolio mix-shift to higher contribution margin businesses, and increased operating leverage from ongoing productivity improvements from our Aon Business Services platform
Expected Free Cash Flow Growth Over the Long-Term
▪ Free cash flow growth of 14% CAGR since 2010 and free cash flow margin expansion to 23.9% in 2020
▪ Expect ongoing operating income growth and progress on working capital, supported by Aon Business Services
Disciplined Portfolio Management and Capital Allocation based on Return on Invested Capital (ROIC)
▪ Strong history of transformational M&A and portfolio management, including completion of 150 acquisitions for ~$8.8B and 120
divestitures for ~$5.4B from 2010-20202
▪ All capital allocation decisions based on ROIC. Share repurchase continues to be our highest return opportunity currently ba sedon our strong free cash flow generation outlook, noting history of $16 billion in share buyback from 2010-2020 and $5 billion
additional repurchase authorization in Q4 2020
▪ Significant financial flexibility to deploy capital driven by strong free cash flow generation and opportunity for increased debt
Translating into a Significant Shareholder Value Creation Opportunity
▪ Going forward, we expect to build on our demonstrated track record of free cash flow growth combined with an expected
reduction in total shares outstanding, representing a significant long-term shareholder value creation opportunity

12
Appendix

13
Commercial Risk Solutions
Q1’18 Q2’18 Q3’18 Q4’18 FY’18 Q1’19 Q2’19 Q3’19 Q4’19 FY’19 Q1’20 Q2’20 Q3’20 Q4’20 FY’20 Q1’21 Q2’21
Total Revenue1 ($M) $1,184 $1,166 $1,029 $1,273 $4,652 $1,118 $1,167 $1,057 $1,331 $4,673 $1,146 $1,126 $1,042 $1,376 $4,690 $1,289 $1,349
Organic Growth1 (%) 4% 6% 8% 4% 6% 6% 6% 7% 7% 7% 4% 1% 2% 4% 3% 9% 14%
Place over
$65Bof bound premium
each year
Global leader with
+20,000 colleagues around the
world
Retention rates
+90%on average in Retail
Brokerage
Retail Brokerage:
▪ Our dedicated teams of risk experts utilize comprehensive analytics capabilities
and insights to provide clients w ith distinctive risk advice that empow ers results
for their organizations
▪ Through our specialty-focused organizational structure, colleagues in 120
countries around the w orld dive deep into their areas of expertise to develop
unparalleled insights around industry verticals and lines of business to best
deliver value to clients in today’s complex and integrated risk environment
Global Risk Consulting:
▪ World leading provider of risk consulting services supporting clients in better
understanding and managing their risk profile through identifying and
quantifying the risks they face by assisting them w ith the selection and
implementation of the appropriate risk transfer, risk retention, and risk mitigation
solutions, and by ensuring the continuity of their operations through claims
consulting
Cyber Solutions:
▪ One of the industry’s premier resources in cyber risk management; our strategic
focus extends to identifying and protecting critical digital assets supported by
best-in-class transactional capabilities, enhanced coverage expertise, deep
carrier relationships, and incident response expertise
Captives:
▪ Leading global captive insurance solutions provider; managing +1,100
insurance entities w orldw ide including captives, protected segregated and
incorporated cell facilities, as w ell as entities that support Insurance Linked
Securities and specialist insurance and reinsurance companies
1 Organic revenue is a non-GAAP measure that is reconciled to its corresponding U.S. GAAP measure for the above historical periods that have been
restated on page 21 of the Company’s Q4’17 press release dated February 2, 2018, for the new revenue recognition accounting standard effective in
Q1’18.
14
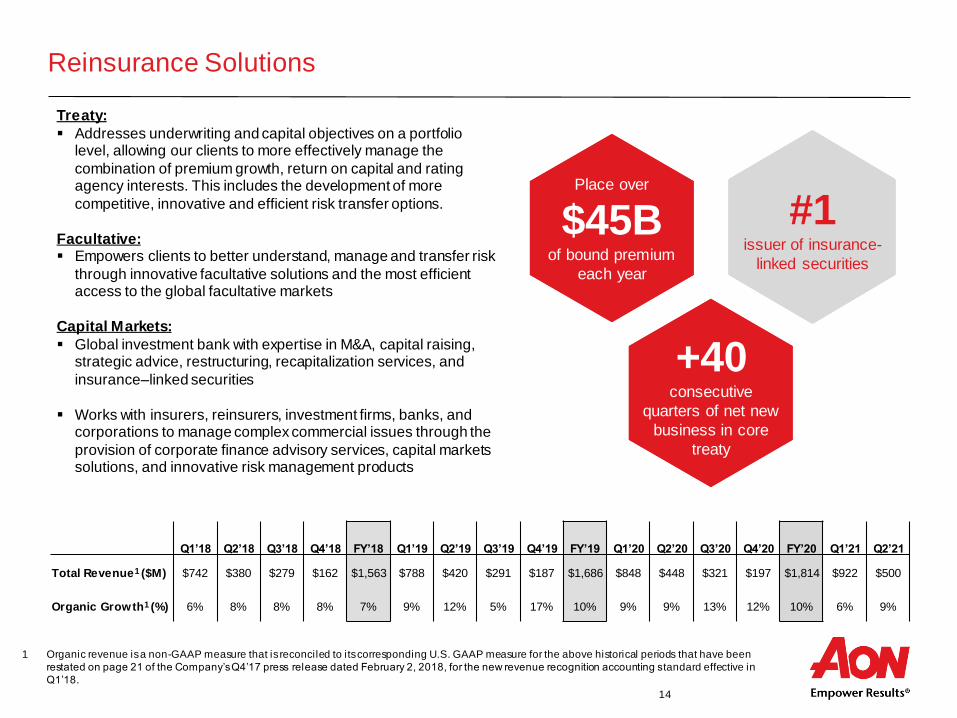
Reinsurance Solutions
Treaty:
▪ Addresses underwriting and capital objectives on a portfolio level, allowing our clients to more effectively manage the
combination of premium growth, return on capital and rating agency interests. This includes the development of more
competitive, innovative and efficient risk transfer options.
Facultative:▪ Empowers clients to better understand, manage and transfer risk
through innovative facultative solutions and the most efficient access to the global facultative markets
Capital Markets:
▪ Global investment bank with expertise in M&A, capital raising, strategic advice, restructuring, recapitalization services, and
insurance–linked securities
▪ Works with insurers, reinsurers, investment firms, banks, and corporations to manage complex commercial issues through the
provision of corporate finance advisory services, capital markets solutions, and innovative risk management products
Place over
$30Bof bound premium
each year
#1treaty and facultative
brokerage
23consecutive
quarters of net new
business in core
treaty
Place over
$45Bof bound premium
each year
#1issuer of insurance-
linked securities
+40consecutive
quarters of net new
business in core
treaty
Q1’18 Q2’18 Q3’18 Q4’18 FY’18 Q1’19 Q2’19 Q3’19 Q4’19 FY’19 Q1’20 Q2’20 Q3’20 Q4’20 FY’20 Q1’21 Q2’21
Total Revenue1 ($M) $742 $380 $279 $162 $1,563 $788 $420 $291 $187 $1,686 $848 $448 $321 $197 $1,814 $922 $500
Organic Growth1 (%) 6% 8% 8% 8% 7% 9% 12% 5% 17% 10% 9% 9% 13% 12% 10% 6% 9%
1 Organic revenue is a non-GAAP measure that is reconciled to its corresponding U.S. GAAP measure for the above historical periods that have been
restated on page 21 of the Company’s Q4’17 press release dated February 2, 2018, for the new revenue recognition accounting standard effective in
Q1’18.
15
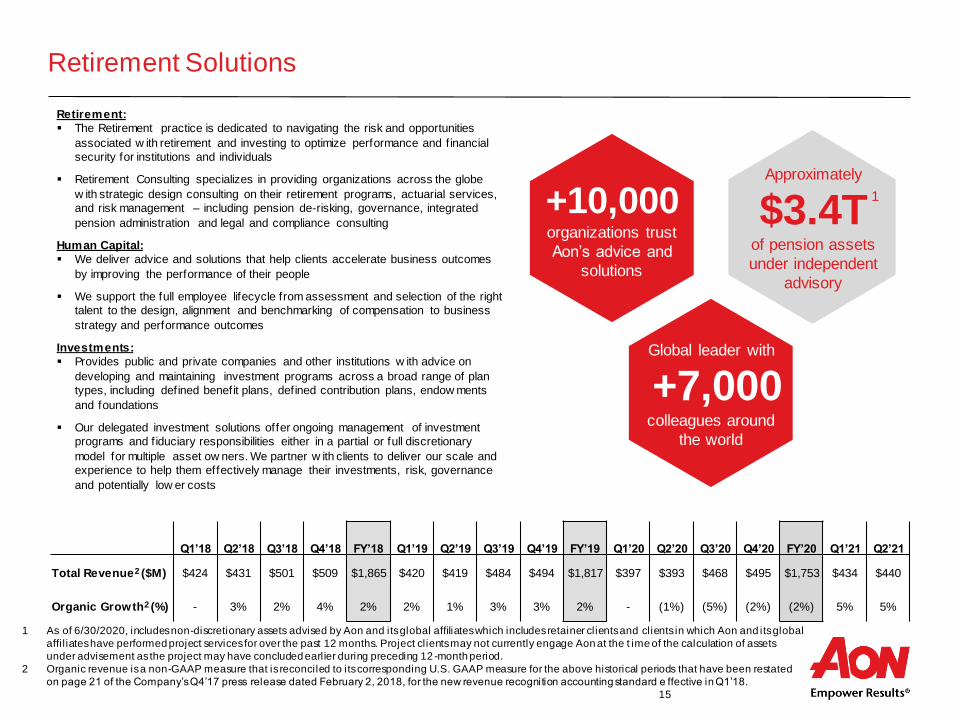
Approximately
$3.4T of pension assets
under independent
advisory
Retirement Solutions
Retirement:
▪ The Retirement practice is dedicated to navigating the risk and opportunities
associated w ith retirement and investing to optimize performance and financial
security for institutions and individuals
▪ Retirement Consulting specializes in providing organizations across the globe
w ith strategic design consulting on their retirement programs, actuarial services,
and risk management – including pension de-risking, governance, integrated
pension administration and legal and compliance consulting
Human Capital:
▪ We deliver advice and solutions that help clients accelerate business outcomes
by improving the performance of their people
▪ We support the full employee lifecycle from assessment and selection of the right
talent to the design, alignment and benchmarking of compensation to business
strategy and performance outcomes
Investments:
▪ Provides public and private companies and other institutions w ith advice on
developing and maintaining investment programs across a broad range of plan
types, including defined benefit plans, defined contribution plans, endow ments
and foundations
▪ Our delegated investment solutions offer ongoing management of investment
programs and fiduciary responsibilities either in a partial or full discretionary
model for multiple asset ow ners. We partner w ith clients to deliver our scale and
experience to help them effectively manage their investments, risk, governance
and potentially low er costs
1 As of 6/30/2020, includes non-discretionary assets advised by Aon and its global affiliates which includes retainer clients and clients in which Aon and its global
affi l iates have performed project services for over the past 12 months. Project clients may not currently engage Aon at the t ime of the calculation of assets
under advisement as the project may have concluded earlier during preceding 12 -month period.
2 Organic revenue is a non-GAAP measure that is reconciled to its corresponding U.S. GAAP measure for the above historical periods that have been restated
on page 21 of the Company’s Q4’17 press release dated February 2, 2018, for the new revenue recognition accounting standard e ffective in Q1’18.
1+10,000organizations trust
Aon’s advice and
solutions
Global leader with
+7,000 colleagues around
the world
Q1’18 Q2’18 Q3’18 Q4’18 FY’18 Q1’19 Q2’19 Q3’19 Q4’19 FY’19 Q1’20 Q2’20 Q3’20 Q4’20 FY’20 Q1’21 Q2’21
Total Revenue2 ($M) $424 $431 $501 $509 $1,865 $420 $419 $484 $494 $1,817 $397 $393 $468 $495 $1,753 $434 $440
Organic Growth2 (%) - 3% 2% 4% 2% 2% 1% 3% 3% 2% - (1%) (5%) (2%) (2%) 5% 5%

16
Health Solutions
Aon Health Solutions helps organizations confidently navigate the evolving health and benefits landscape while continuously adapting their approach and strategy to provide greater choice, affordability and wellbeing.
Consulting & Brokerage:▪ Develops and implements innovative, customized health and benefits
strategies for clients of all sizes across industries and geographies to manage risk, drive engagement, and increase accountability
▪ Partners with insurers and other strategic partners to develop and implement new and innovative solutions.
▪ Delivers specialized expertise and solutions across a range of areas such as pharmacy, voluntary benefits, and regulatory
▪ Leverages proprietary, world-class, analytics and technology to help clients make informed decisions and manage healthcare outcomes
Global Benefits:▪ Advises multinational companies on range of topics including program
design and management, financing optimization, and enhanced employee experience
▪ Assists employers in navigating and managing regulatory and compliance requirements in countries in which they operate
Healthcare Exchanges:▪ Helps transform how employers sponsor, structure, and deliver
healthcare strategies for both active and retiree populations
Place over
$30Bof health premium
with a full set of
solutions
#1provider of fully and
self-insured health
care exchanges
Global leader with
+8,000 colleagues in 90
countries
1 Organic revenue is a non-GAAP measure that is reconciled to its corresponding U.S. GAAP measure for the above historical periods that have been
restated on page 21 of the Company’s Q4’17 press release dated February 2, 2018, for the new revenue recognition accounting standard effective in
Q1’18.
Q1’18 Q2’18 Q3’18 Q4’18 FY’18 Q1’19 Q2’19 Q3’19 Q4’19 FY’19 Q1’20 Q2’20 Q3’20 Q4’20 FY’20 Q1’21 Q2’21
Total Revenue1 ($M) $451 $309 $278 $558 $1,596 $486 $317 $279 $585 $1,667 $502 $258 $282 $613 $1,655 $536 $307
Organic Growth1 (%) - 7% 8% 8% 5% 5% 6% 2% 5% 5% 5% (18%) 1% 2% (1%) 4% 14%

17
Data & Analytic Services
Affinity:
▪ Specializes in developing, marketing and administering customized insurance programs and specialty market solutions
for affinity organizations and their members or affiliates
Aon Inpoint:▪ Draws on Aon’s proprietary database (Global Risk Insight
Platform) and is dedicated to making insurers more competitive through providing data, analytics, engagement and consulting
CoverWallet:
▪ Leading digital insurance platform for small- and medium-sized businesses dedicated to delivering exceptional client
experiences to new and existing clients by leveraging data & analytics and a technology-enabled operating model to provide
choice, transparency, and convenience
ReView:▪ Draws on Aon’s proprietary database and broker market
knowledge to provide advisory services, analysis, and benchmarking to help reinsurers more effectively meet the needs
of cedents through the development of more competitive, innovative, and efficient risk transfer options
+300associations and
organizations
benefit from Aon’s
affinity solutions
Affinity partners with
+140insurance carrier
partners
Aon Inpoint
accesses
+$1Tof total premium
data over 10 year
history
1 Organic revenue is a non-GAAP measure that is reconciled to its corresponding U.S. GAAP measure for the above historical periods that have been
restated on page 21 of the Company’s Q4’17 press release dated February 2, 2018, for the new revenue recognition accounting standard effective in
Q1’18.
Q1’18 Q2’18 Q3’18 Q4’18 FY’18 Q1’19 Q2’19 Q3’19 Q4’19 FY’19 Q1’20 Q2’20 Q3’20 Q4’20 FY’20 Q1’21 Q2’21
Total Revenue1 ($M) $294 $277 $263 $271 $1,105 $336 $286 $271 $291 $1,184 $331 $274 $278 $288 $1,171 $351 $294
Organic Growth1 (%) 1% (4%) 5% 9% 3% 5% 4% 3% 6% 4% 1% (8%) (7%) (8%) (5%) (2%) 5%
18
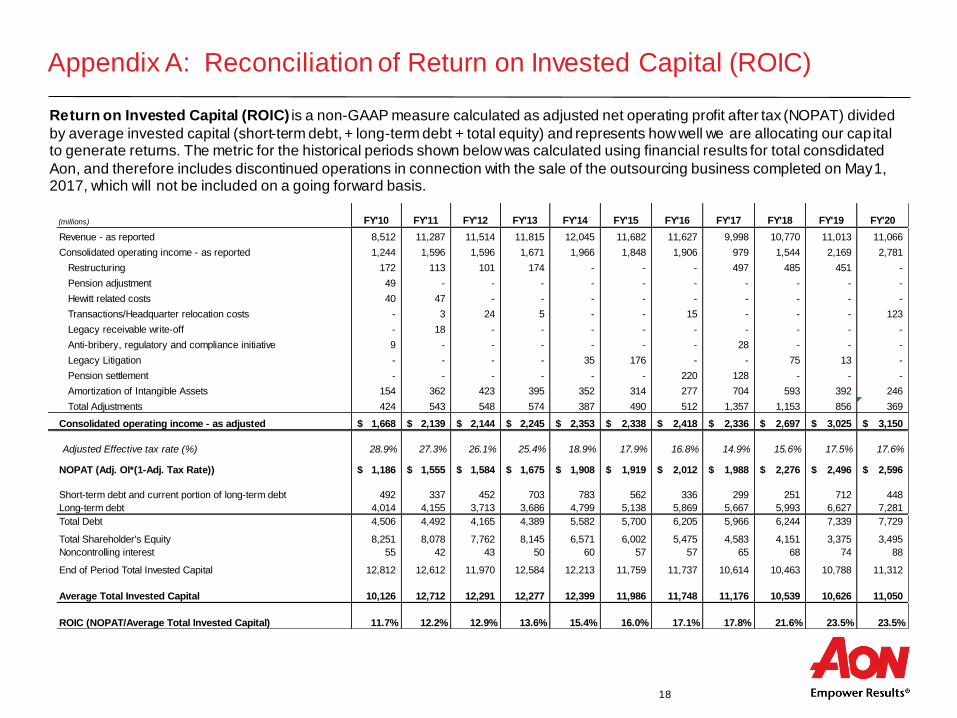
Appendix A: Reconciliation of Return on Invested Capital (ROIC)
Return on Invested Capital (ROIC) is a non-GAAP measure calculated as adjusted net operating profit after tax (NOPAT) divided
by average invested capital (short-term debt, + long-term debt + total equity) and represents how well we are allocating our capital to generate returns. The metric for the historical periods shown below was calculated using financial results for total consolidated
Aon, and therefore includes discontinued operations in connection with the sale of the outsourcing business completed on May 1, 2017, which will not be included on a going forward basis.
(millions) FY'10 FY'11 FY'12 FY'13 FY'14 FY'15 FY'16 FY'17 FY'18 FY'19 FY'20
Revenue - as reported 8,512 11,287 11,514 11,815 12,045 11,682 11,627 9,998 10,770 11,013 11,066
Consolidated operating income - as reported 1,244 1,596 1,596 1,671 1,966 1,848 1,906 979 1,544 2,169 2,781
Restructuring 172 113 101 174 - - - 497 485 451 -
Pension adjustment 49 - - - - - - - - - -
Hewitt related costs 40 47 - - - - - - - - -
Transactions/Headquarter relocation costs - 3 24 5 - - 15 - - - 123
Legacy receivable write-off - 18 - - - - - - - - -
Anti-bribery, regulatory and compliance initiative 9 - - - - - - 28 - - -
Legacy Litigation - - - - 35 176 - - 75 13 -
Pension settlement - - - - - - 220 128 - - -
Amortization of Intangible Assets 154 362 423 395 352 314 277 704 593 392 246
Total Adjustments 424 543 548 574 387 490 512 1,357 1,153 856 369
Consolidated operating income - as adjusted 1,668$ 2,139$ 2,144$ 2,245$ 2,353$ 2,338$ 2,418$ 2,336$ 2,697$ 3,025$ 3,150$
Adjusted Effective tax rate (%) 28.9% 27.3% 26.1% 25.4% 18.9% 17.9% 16.8% 14.9% 15.6% 17.5% 17.6%
NOPAT (Adj. OI*(1-Adj. Tax Rate)) 1,186$ 1,555$ 1,584$ 1,675$ 1,908$ 1,919$ 2,012$ 1,988$ 2,276$ 2,496$ 2,596$
Short-term debt and current portion of long-term debt 492 337 452 703 783 562 336 299 251 712 448
Long-term debt 4,014 4,155 3,713 3,686 4,799 5,138 5,869 5,667 5,993 6,627 7,281
Total Debt 4,506 4,492 4,165 4,389 5,582 5,700 6,205 5,966 6,244 7,339 7,729
Total Shareholder's Equity 8,251 8,078 7,762 8,145 6,571 6,002 5,475 4,583 4,151 3,375 3,495
Noncontrolling interest 55 42 43 50 60 57 57 65 68 74 88
End of Period Total Invested Capital 12,812 12,612 11,970 12,584 12,213 11,759 11,737 10,614 10,463 10,788 11,312
Average Total Invested Capital 10,126 12,712 12,291 12,277 12,399 11,986 11,748 11,176 10,539 10,626 11,050
ROIC (NOPAT/Average Total Invested Capital) 11.7% 12.2% 12.9% 13.6% 15.4% 16.0% 17.1% 17.8% 21.6% 23.5% 23.5%

19
Appendix B: Reconciliation of Free Cash Flow Margin
Free Cash Flow Margin is a non-GAAP measure calculated as Free Cash Flow (defined as Cash Flows from Operations less
Capital Expenditures) / Total Revenue and represents our conversion rate of revenue into cash. The metric for the historical periods shown below was calculated using financial results for total consolidated Aon, and therefore includes discontinued operations in
connection with the sale of the outsourcing business completed on May 1, 2017, which will not be included on a going forward basis.
1 In Q4’15, we reclassified certain cash flows related to employee shares withheld for taxes. This resulted in reclassifying $9 3M, $94M, $115M for the FY’10,
FY’11,and FY’12, respectively, from "Accounts payable and accrued liabilities" and "Other assets and liabilities" within Cash Flows From Operating Activities, to
"Issuance of shares for employee benefit plans" within Cash Flows From Financing Activities.
(millions) FY'10 FY'11 FY'12 FY'13 FY'14 FY'15 FY'16 FY'17 FY'18 FY'19 FY'20
Revenue - as reported 8,512 11,287 11,514 11,815 12,045 11,682 11,627 9,998 10,770 11,013 11,066
Cash Flow from Operations 876 1,112 1,534 1,753 1,812 2,009 2,326 669 1,686 1,835 2,783
Capital Expenditures (180) (241) (269) (229) (256) (290) (222) (183) (240) (225) (141)
Free Cash Flow - as Reported 696 871 1,265 1,524 1,556 1,719 2,104 486 1,446 1,610 2,642
Adjustments:
2017 Restructuring initiatives (Cash + CapEx) 307 491 489
Transactions costs related to the divested business 45
Tax payments related to the divested business 940
Underlying Free Cash Flow - as Adjusted 1,778 1,937 2,099 2,642
Free Cash Flow Margin 8.2% 7.7% 11.0% 12.9% 12.9% 14.7% 18.1% 17.8% 18.0% 19.1% 23.9%

Investor RelationsLeslie Follmer
Office: 312-381-3230
Adam Klauss
Office: 312-381-1801
Hunter Davis
Office: 312-381-9968
Alex Sivak
Office: 312-381-0357
Related Documents


![Investor Relations - hanatourcompany.comhanatour]ir_presentation_june... · Investor Relations 1 Investor Relations Jun. 2009.(Korean) 2 ... (cf. 국내소비0.3% 증가, 자료:한국은행,2006)](https://static.cupdf.com/doc/110x72/5a881d307f8b9a87368ecd91/investor-relations-hanatourirpresentationjuneinvestor-relations-1-investor.jpg)