AOD and Angstrom exponent of aerosols observed by the Chinese Sun Hazemeter Network from August 2004 to September 2005 Jinyuan Xin 1,3 , Yuesi Wang 1,3 , Zhanqing Li 2 , Pucai Wang 1 , Wei-Min Hao 4 , Bryce L. Nordgren 4 , Shigong Wang 3 , Guangren Liu 1 , Lili Wang 1 , Tianxue Wen 1 , Yang Sun 1 , Bo Hu 1 1 Institute of Atmospheric Physics, Chinese Academy of Sciences, Beijing 100029, P.R.China; 2 Department of Meteorology, The University of Maryland, College Park, MD 20782, USA; 3 College of Atmospheric Science, Lanzhou University, Lanzhou 730000, P.R.China; 4 USDA Forest Service Fire Sciences Laboratory, Missoula, MT 59807, USA Revised Manuscript Submitted to the Special Issue on East Asian Study of Tropospheric Aerosols: an International Regional Experiment (EAST-AIRE) Journal of Geophysical Research – Atmosphere Submitted: January 26, 2006 Revised: April 6, 2006 Revised: June 6, 2006 1

Welcome message from author
This document is posted to help you gain knowledge. Please leave a comment to let me know what you think about it! Share it to your friends and learn new things together.
Transcript

AOD and Angstrom exponent of aerosols observed by the Chinese
Sun Hazemeter Network from August 2004 to September 2005
Jinyuan Xin1,3, Yuesi Wang1,3, Zhanqing Li2, Pucai Wang1, Wei-Min Hao4, Bryce L.
Nordgren4, Shigong Wang3, Guangren Liu1, Lili Wang1, Tianxue Wen1, Yang Sun1, Bo
Hu1
1 Institute of Atmospheric Physics, Chinese Academy of Sciences, Beijing 100029, P.R.China;
2 Department of Meteorology, The University of Maryland, College Park, MD 20782, USA;
3 College of Atmospheric Science, Lanzhou University, Lanzhou 730000, P.R.China;
4 USDA Forest Service Fire Sciences Laboratory, Missoula, MT 59807, USA
Revised Manuscript Submitted to the Special Issue on
East Asian Study of Tropospheric Aerosols: an International Regional
Experiment (EAST-AIRE)
Journal of Geophysical Research – Atmosphere
Submitted: January 26, 2006
Revised: April 6, 2006
Revised: June 6, 2006
1
Abstract:
To reduce uncertainties in the quantitative assessment of aerosol effects on regional
climate and environmental changes, extensive measurements of aerosol optical
properties were made with hand-held sunphotometers in the Chinese Sun Hazemeter
Network (CSHNET) starting in August 2004. Regional characteristics of the Aerosol
optical depth (AOD) at 500 nm and Angstrom exponent (α) computed using 405, 500
and 650 nm were analyzed for the period of August 2004 to September 2005. The
smallest mean AOD (~0.15) was found in the Tibetan Plateau where α showed the
largest range in value (0.06 - 0.9). The remote northeast corner of China was the next
cleanest region with AODs ranging from 0.19 to 0.21 and with the largest α (1.16 -
1.79), indicating the presence of fine aerosol particles. The forested sites exhibited
moderate values of AOD (0.19 - 0.51) and α (0.97 - 1.47). A surprising finding was
that the AOD measured at a few desert sites in northern China were relatively low,
ranging from 0.24 to 0.36, and that α ranged from 0.42 to 0.99, presumably because of
several dust-blowing episodes during the observation period. The AOD observed over
agricultural areas ranges from 0.38 to 0.90; α ranges from 0.55 to 1.11. These values
do not differ much from those observed at the inland urban and suburban sites where
AOD ranges from 0.50 to 0.69 and α ranges from 0.90 to 1.48. Given the geographic
heterogeneity and the rapid increase in urbanization in China, much longer and more
extensive observations are required.
2
1. Introduction
Atmospheric aerosols play an important role in global and regional climate
change [IPCC, 1996, 2001; Haywood and Boucher, 2000]. In recent years, some
findings have shown that aerosols have a significant impact on the solar energy
budget and the formation and distribution of precipitation. For example, the reduction
of the solar radiation budget at the surface due to the effect of absorbing aerosols is
larger than at the top of the atmosphere [Li, 1998; Satheesh and Ramanathan, 2000;
Li and Trishchenko, 2001]. Absorption of solar radiation by black carbon aerosols
heats the atmosphere [Jacobson, 2001]. Suppression of precipitation was observed
by dust storms [Rosenfeld et al., 2001; Ramanathan et al., 2001a], air pollution
[Rosenfeld, 2000; Rosenfeld and Woodley, 2001], and fire smoke plumes [Rosenfeld,
2000]. Together, they slowdown the hydrological cycles [Ramanathan et al., 2001a].
Although aerosol particles have a potential climatic importance, they are poorly
characterized and understood and thus incur large uncertainties in estimating their
climatic effects [Anderson et al., 2003]. Unlike the uniformly mixed greenhouse gases,
tropospheric aerosol properties and effects exhibit considerable spatial and temporal
variability [Streets et al., 2001; Lelieveld et al., 2001; Dickerson et al., 2002], of
which we have rather poor knowledge and understanding [IPCC, 2001; Satheesh and
Moorthy, 2005]. Aerosol measurements are needed in order to (1) provide validation
data for model testing and (2) contribute basic information necessary for improving
the assessment of the impact of aerosols on climate forcing [Chin et al., 2002].
Asian aerosol sources differ from those in Europe and North America. In Asia,
3
there are substantially more coal and biomass burning and dust storms, adding more
absorbing soot and organic aerosols to the Asian and Pacific atmospheres [Streets et
al., 2001; Lelieveld et al., 2001; Huebert et al., 2003; Li, 2004; Seinfeld et al., 2004].
China, the primary source of both natural and anthropogenic aerosols in eastern Asia,
is drawing much scientific attention [Hayasaka et al., 2006; Li, 2004]. There have
been several field projects established to study aerosol characteristics over the south
and east Asian regions and their effect on climate, e.g. INDOEX [Ramanathan et al.,
2001b], APEX [Nakajima et al., 2003; Takemura et al., 2003], ACE/Asia [Huebert et
al., 2003; Seinfeld et al., 2004] and TRACE-P [Streets et al., 2001]. Chinese scientists
have also conducted many aerosol-related investigations [Luo et al., 1998; Mao et al.,
2002; Qiu et al., 2003], including the use of satellite data to retrieve aerosol optical
properties over China [Li et al., 2003a; Li et al., 2003b; Xiu et al., 2003]. Validation of
aerosol products obtained from various satellite sensors requires ground-based
measurements of a variety of aerosol optical characteristics with different data quality
requirements [Li et al., 2003a; Kaufman and Holben, 2000; Dubovik et al., 2000].
Due to a lack of systemic and long-term aerosol ground-based measurements, there
are still many difficulties and uncertainties when it comes to understanding and
explaining the Chinese aerosol issues.
The amassing of continuous aerosol measurements is one of the most powerful
ways of monitoring regional aerosol properties, calibrating satellite remote sensing
instruments and testing model results [Huebert et al., 2003; Holben et al., 1998]. As a
part of the East Asian Study of Tropospheric Aerosols, an International Regional
4

Experiment (EAST-AIRE) [Li et al., 2006a], the Chinese Sun Hazemeter Network
(CSHNET) was initiated in August 2004 by the Institute of Atmospheric Physics,
under the auspices of the Chinese Academy of Sciences, the U.S. Forest Service and
the University of Maryland. The network is co-located with the Chinese Ecosystem
Research Network (CERN), which has sites located in diverse ecosystems in China.
Data from this network provide routine observations of aerosol optical properties in
the morning and afternoon close to satellite overpass times for validating the satellite
products, in addition to charactering the regional aerosol properties.
2. Observation Network and Instrument Calibration
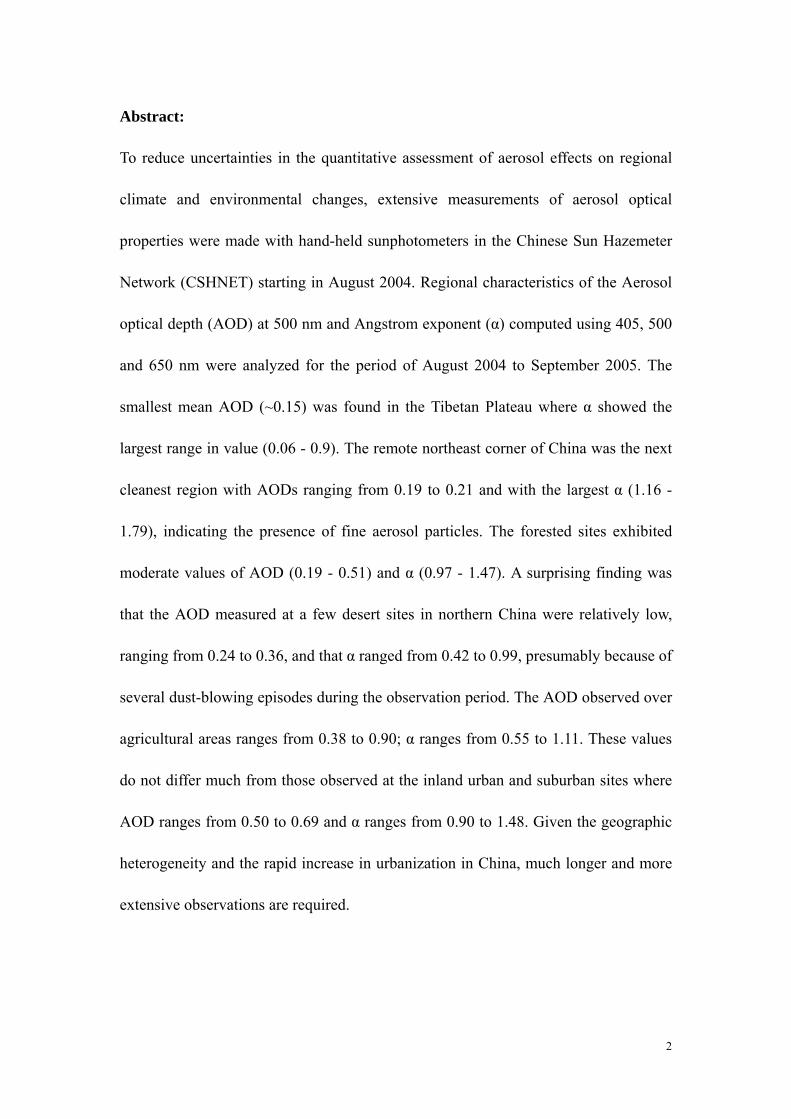
The CSHNET is the first standard network established to measure aerosol optical
properties and their spatial and temporal variations throughout China. Figure 1 shows
the locations of the sites in the CSHNET. This network includes nineteen CERN
stations representing some typical ecosystems, four urban sites, one data
collection/processing center and one instrument calibration center. The CERN stations
were installed in remote areas in order to represent large-scale regional conditions of
certain ecosystems; the urban sites represent typical urban environments. The
calibration center is located in Xianghe where annual calibrations of the hazemeters
against CIMEL sunphotometers are performed. Data collection and quality control are
conducted at the atmosphere sub-center/CERN in Beijing.
The sun hazemeters were manufactured by the U.S. Forestry Service and have
been used in some regional aerosol experiments [Hao et al., 2005]. Similar handheld
5
hazemeters have been widely used for measuring aerosol properties [Mims, 1992;
Acharya et al., 1995; Brooks and Mims, 2001; Acharya, 2005]. It has four spectral
channels: 405 nm, 500 nm, 650 nm, and 880 nm. The full-width half-maximum
(FWHM) at 880 nm is about 30 nm and about 5 nm at the other wavelengths. The
field of view is about 2.5º. Measurements are taken more than 20 times a day, and the
observation period is from 10AM to 2PM (local time), encompassing MODIS satellite
overpass times. The hazemeters use light-emitting diode (LED) detectors in place of
optical interference filters and photo diodes. The advantages of using LEDs include
low cost, durability, and long-term optical stability [Brooks and Mims, 2001; Acharya,
2005].
Measurements taken from August 2004 to September 2005 were available from
almost all sites. For the retrieval of aerosol optical properties, cloud-contaminated
measurements were removed using cloud observation records compiled by observers
on the ground. Some uncertainties are introduced in this step because sub-visible
cloud can be missed by the human observer. Columnar AODs were estimated using
the Beer-Lambert-Bouguer law. To determine the Angstrom exponent, a basic
measure related to the aerosol size distribution, a log-linear fitting was applied using
three wavelengths (405 nm, 500 nm and 650 nm) [Kim et al., 2004]. In general, the
Angstrom exponent ranges from 0.0 to 2.0, with smaller Angstrom exponents
corresponding to larger aerosol particle sizes [Dubovik et al., 2002; Kim et al., 2004].
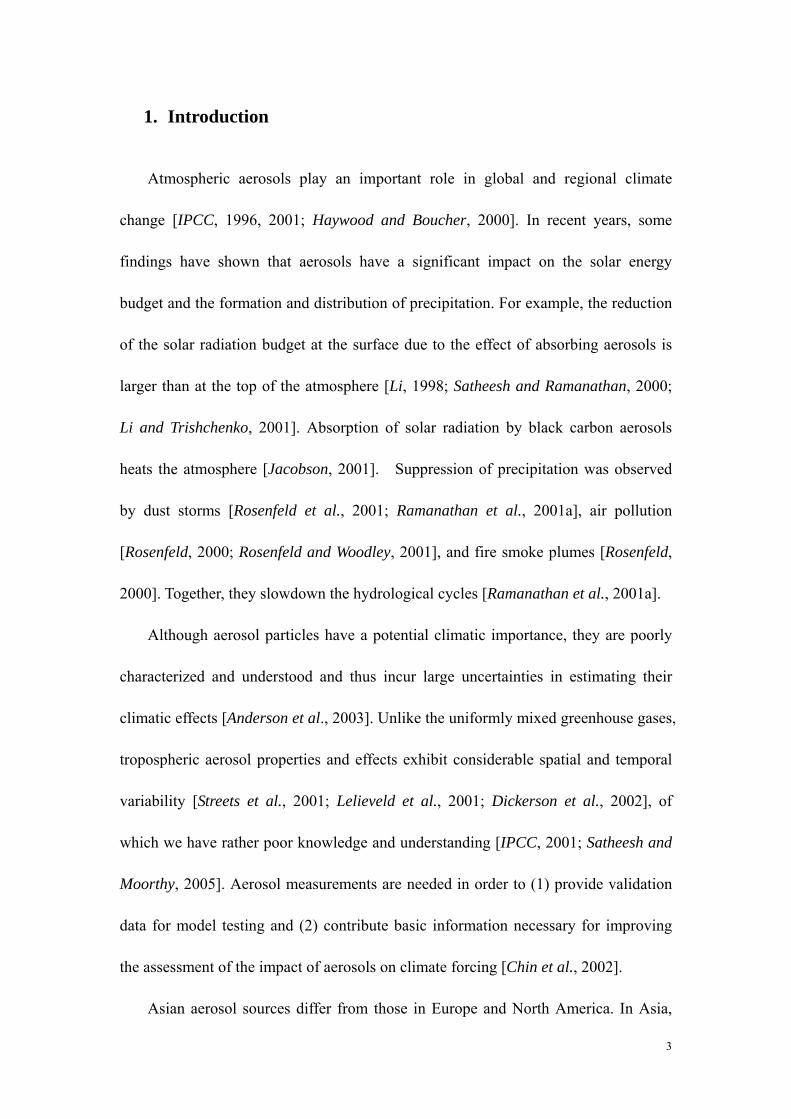
Given their relatively wide and unstable spectral response, periodic calibration of
the LED hazemeters is necessary. The LED hazemeters were calibrated using two
6

standard approaches: the Langley plot calibration and the transfer calibration [Brooks
and Mims, 2001]. Figure 2 shows Langley plot calibrations for the LED hazemeters at
the Lhasa, Fukang, Sanjiang and Beijing sites. Application of the Langley method
requires a stable atmosphere during a period of at least several hours. It is impractical
to perform time-consuming Langley plot calibrations on large numbers of hazemeters.
Transfer calibration is an alternative method using several Langley calibrated
hazemeters as reference [Brooks and Mims, 2001].
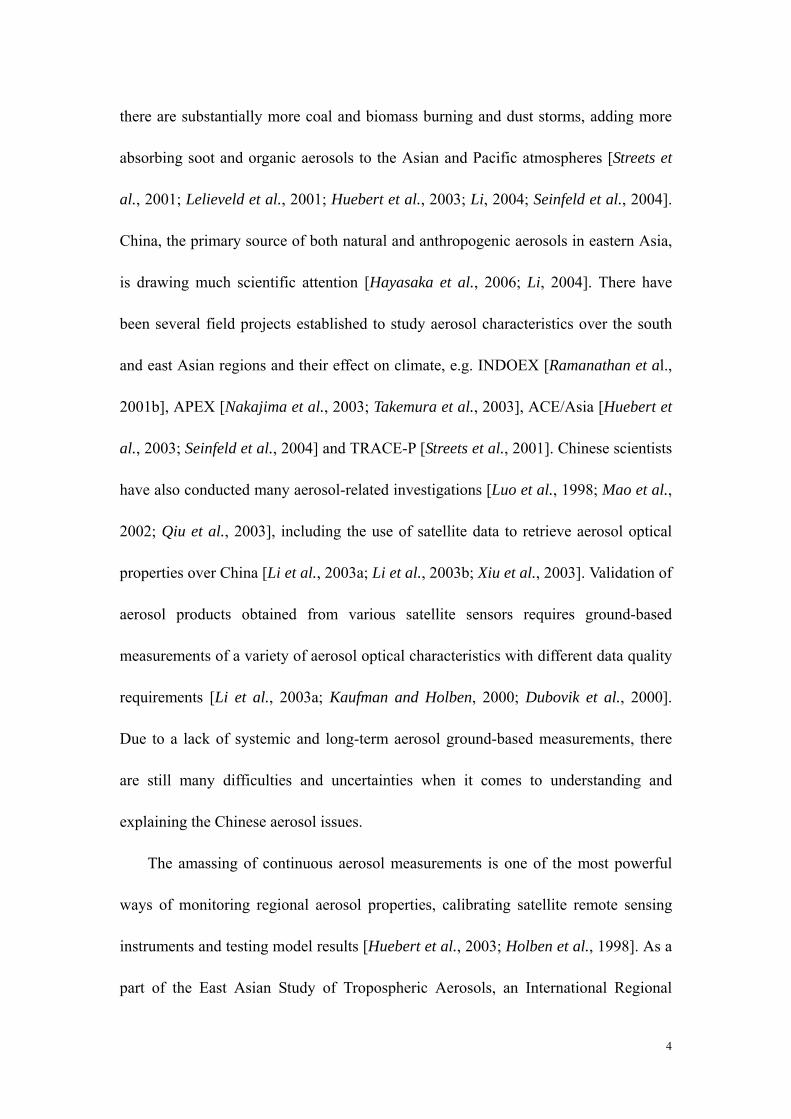
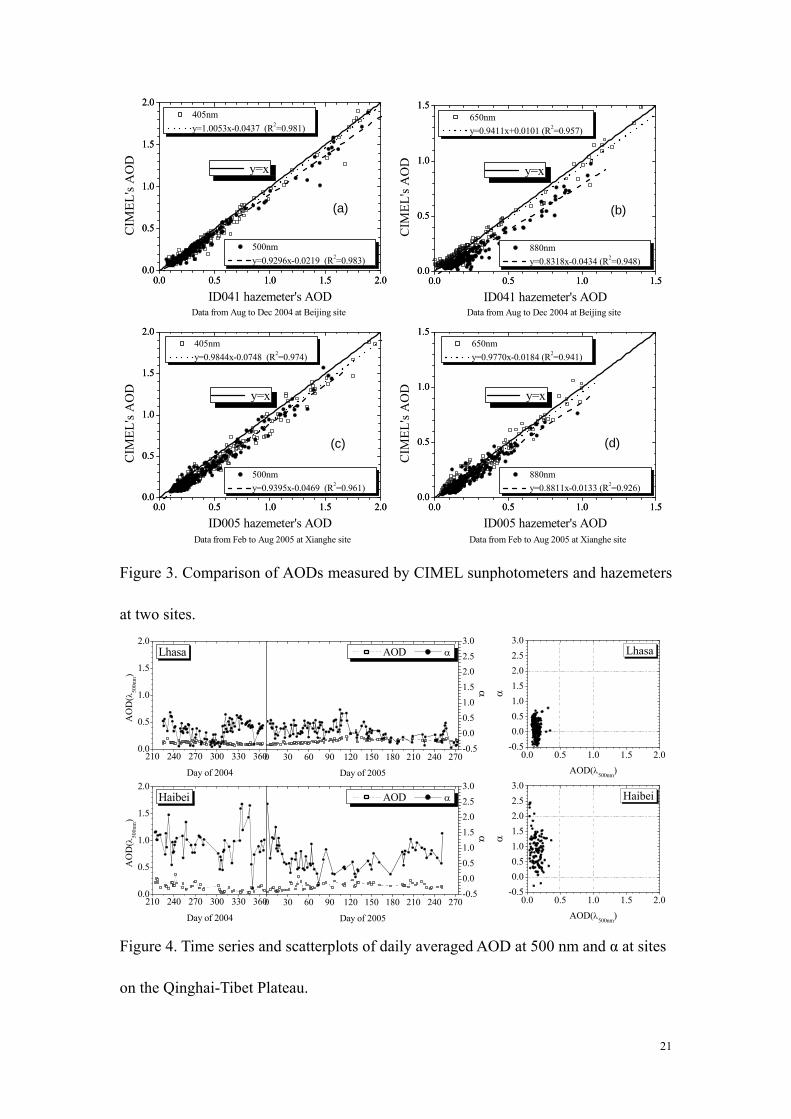
Figure 3 shows a comparison of hazemeter and CIMEL sunphotometer AODs at
four wavelengths. Measurements shown were taken at the Beijing (bottom panels) and
Xianghe (top panels) sites. The ID041 hazemeter at the Beijing site is calibrated by
the Langley method with data from August to December 2004, while the ID005
hazemeter at the Xianghe site is calibrated by the transfer calibration method with
data from February to August 2005. The slope of the regression line between the two
sets of AOD is close to 1.0 at 405 nm, 500 nm and 650 nm. The hazemeter results are
generally consistent with the CIMEL results with disagreements on the order of 2% to
6%. At 880 nm, the hazemeter results show larger errors (on the order of about 12% to
15%) because of the large FWHM at that wavelength, water vapor contamination and
observation errors. Although the equipment can reach a certain precision, there is the
uncertainty in the estimate with a single measurement. It would be nice to add
comparisons with other instruments such as MODIS in future. You should give the
standard devistion of the comparison as an indication of errors in individual
comparison. Note that MODIS has much large errors than ground-based sun
7
photometer measurements. So, the last statement is not right.
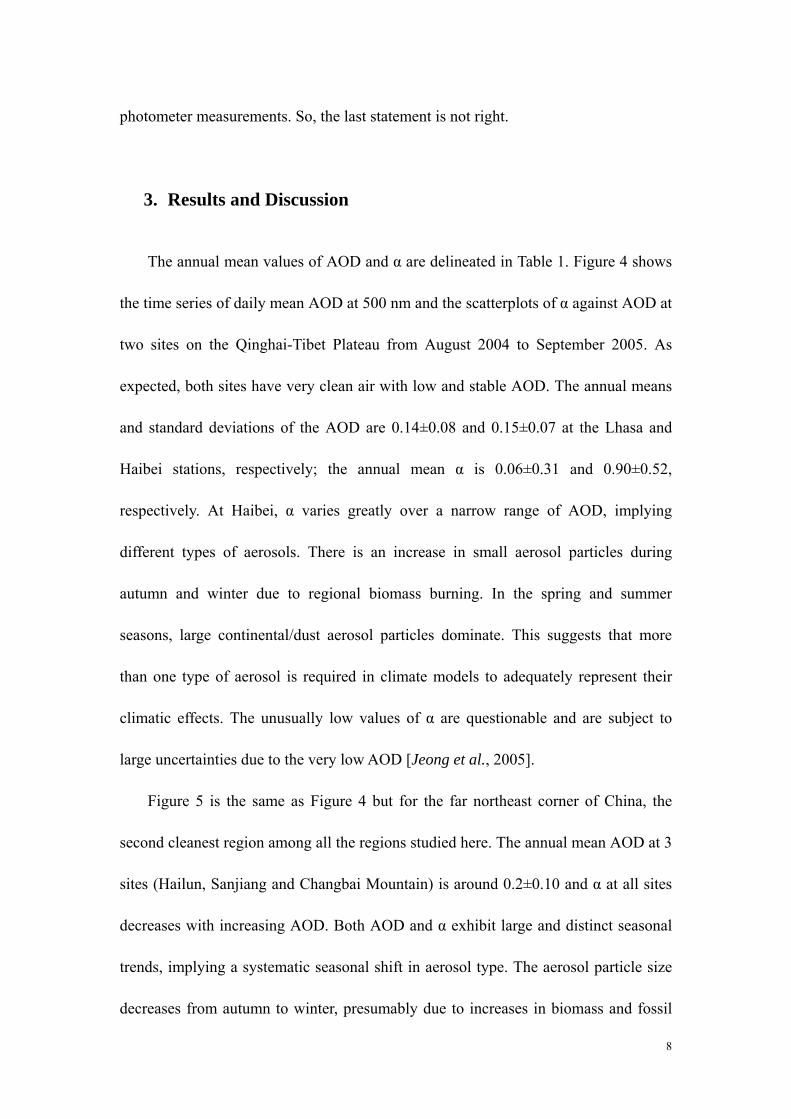
3. Results and Discussion
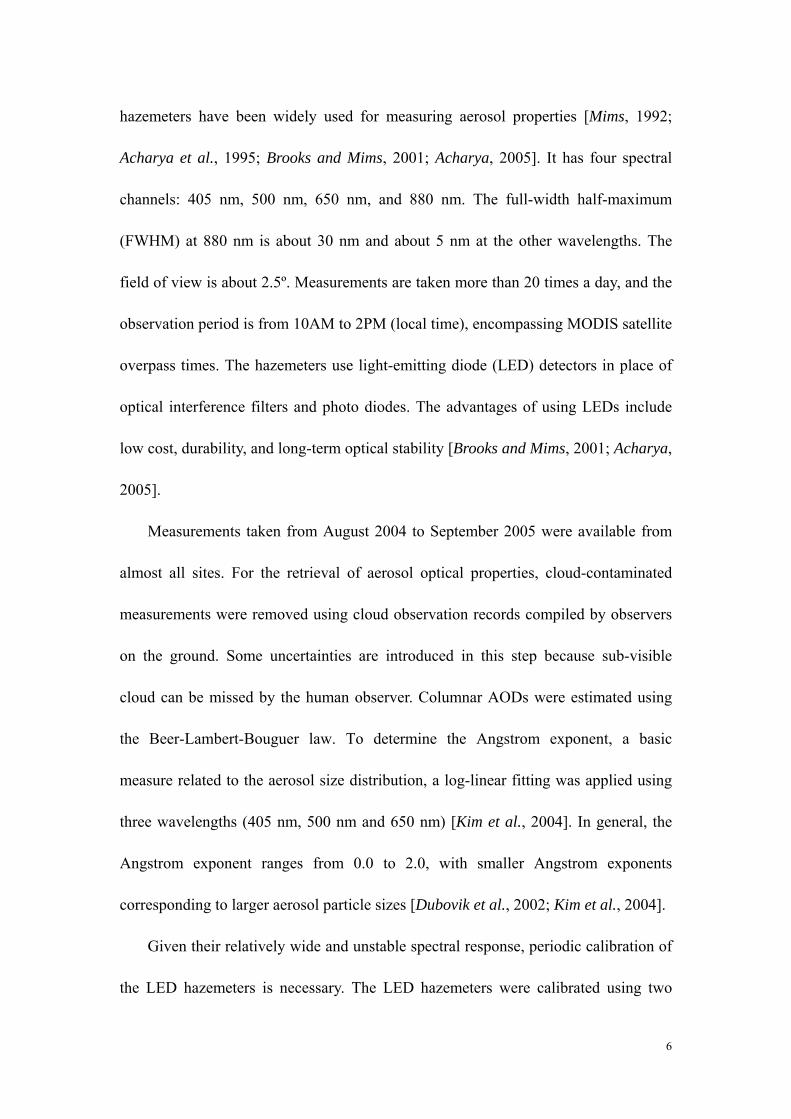
The annual mean values of AOD and α are delineated in Table 1. Figure 4 shows
the time series of daily mean AOD at 500 nm and the scatterplots of α against AOD at
two sites on the Qinghai-Tibet Plateau from August 2004 to September 2005. As
expected, both sites have very clean air with low and stable AOD. The annual means
and standard deviations of the AOD are 0.14±0.08 and 0.15±0.07 at the Lhasa and
Haibei stations, respectively; the annual mean α is 0.06±0.31 and 0.90±0.52,
respectively. At Haibei, α varies greatly over a narrow range of AOD, implying
different types of aerosols. There is an increase in small aerosol particles during
autumn and winter due to regional biomass burning. In the spring and summer
seasons, large continental/dust aerosol particles dominate. This suggests that more
than one type of aerosol is required in climate models to adequately represent their
climatic effects. The unusually low values of α are questionable and are subject to
large uncertainties due to the very low AOD [Jeong et al., 2005].
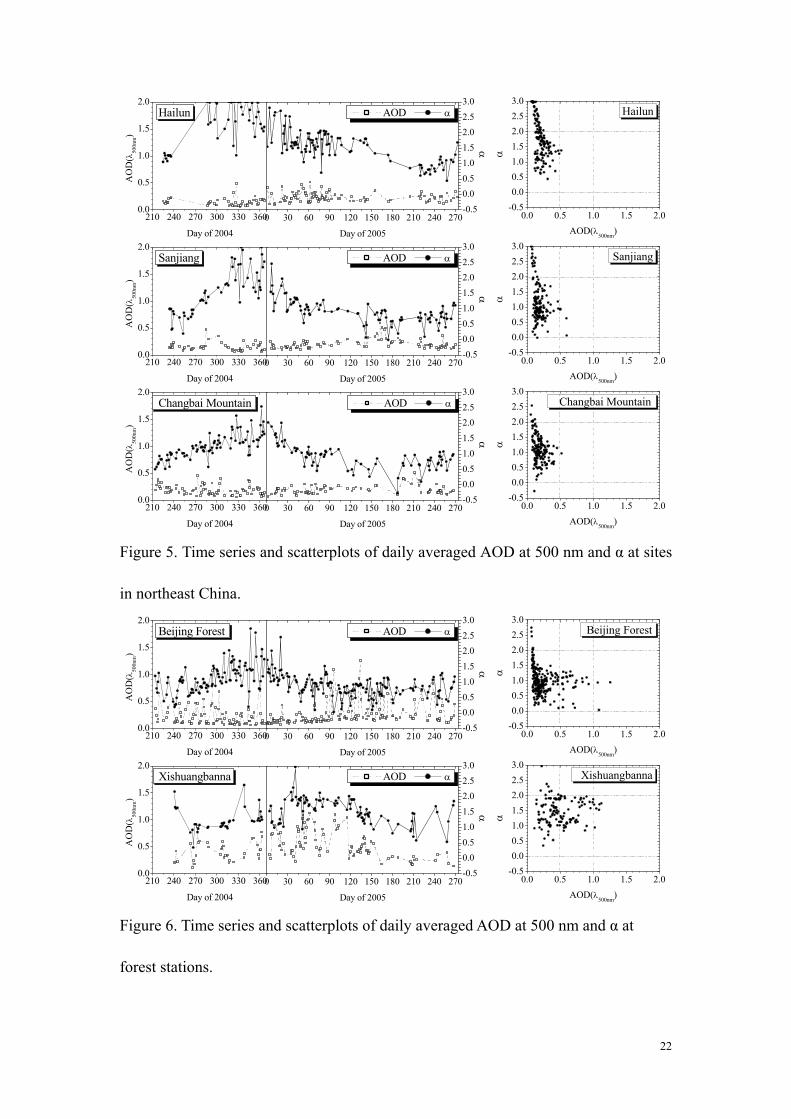
Figure 5 is the same as Figure 4 but for the far northeast corner of China, the
second cleanest region among all the regions studied here. The annual mean AOD at 3
sites (Hailun, Sanjiang and Changbai Mountain) is around 0.2±0.10 and α at all sites
decreases with increasing AOD. Both AOD and α exhibit large and distinct seasonal
trends, implying a systematic seasonal shift in aerosol type. The aerosol particle size
decreases from autumn to winter, presumably due to increases in biomass and fossil
8

fuel burning as the winter season approaches. Meanwhile, a gradual increase in snow
and ice cover on the ground prevents soil erosion and thus restricts the emission of
coarse-mode mineral particles, which is also implied by the low AOD during this
season. An opposite trend is observed from winter to spring where increasing AOD
and decreasing α is evident. In spring and summer, the aerosols seem to be more of a
continental variety.
Figure 6 presents the same results at two forest stations, one in northern China
(Beijing Forest station) and another in southern China (Xishuangbanna station). There
are large differences between the two stations both in terms of the magnitudes and
seasonal variations of AOD and α, as well as the dependence of α on AOD. The
general trends of AOD and α at the Beijing Forest station bear a close resemblance to
those observed at the three northeast sites except that the AOD is generally larger with
many short-term episodes of very high AOD. This site is influenced by regional
aerosol emission sources from Beijing and Hebei, Inner Mongolia and Shanxi
provinces. In winter, the site is overwhelmed by smoke aerosols from biomass
burning. Drastic changes in AOD were usually caused by changes in airmass due to
the passage of cold fronts, which were also observed at the supersite in Xianghe by
various instruments measuring aerosol, gases, cloud and radiation quantities [Li et al.,
2006a, b, submitted to the same EAST-AIRE special issue]. The increase in AOD was
usually caused by the buildup of anthropogenic pollutants, as indicated by the
consistent episodes seen in simultaneous measurements of precursor gases such as
SO2 and CO and NOy made during an intensive observation period conducted during
9
March 2005 [Li et al., 2006b].
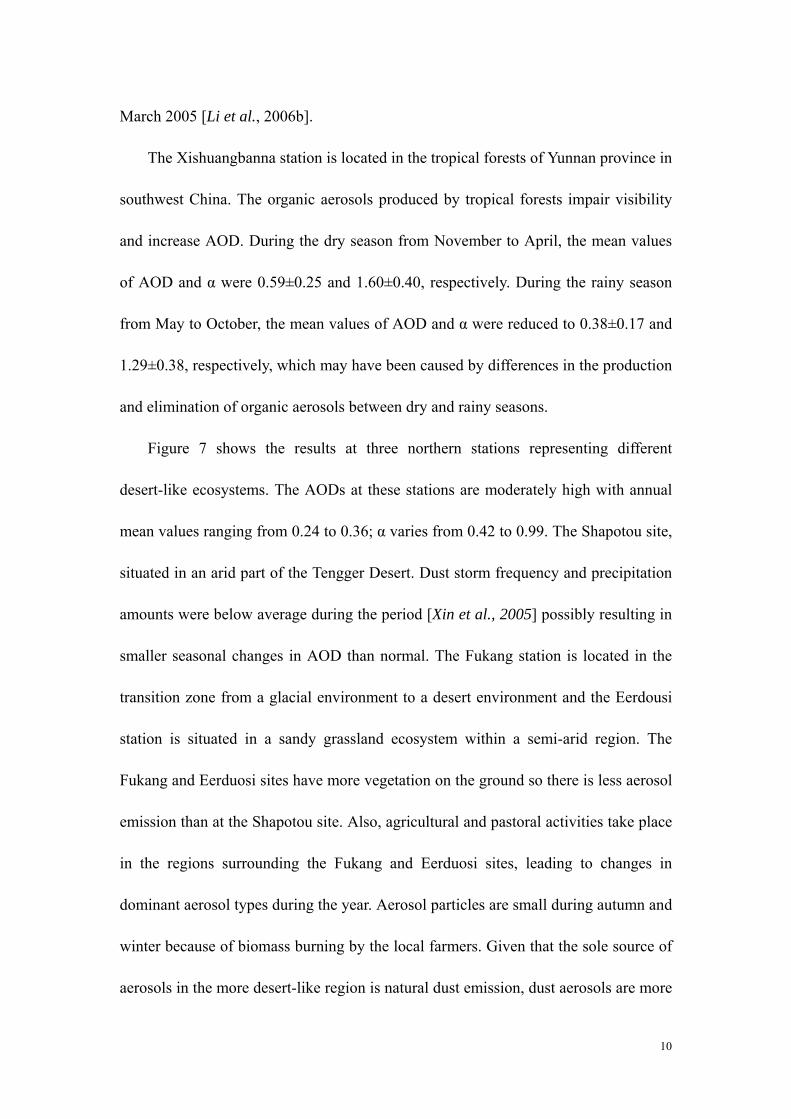
The Xishuangbanna station is located in the tropical forests of Yunnan province in
southwest China. The organic aerosols produced by tropical forests impair visibility
and increase AOD. During the dry season from November to April, the mean values
of AOD and α were 0.59±0.25 and 1.60±0.40, respectively. During the rainy season
from May to October, the mean values of AOD and α were reduced to 0.38±0.17 and
1.29±0.38, respectively, which may have been caused by differences in the production
and elimination of organic aerosols between dry and rainy seasons.
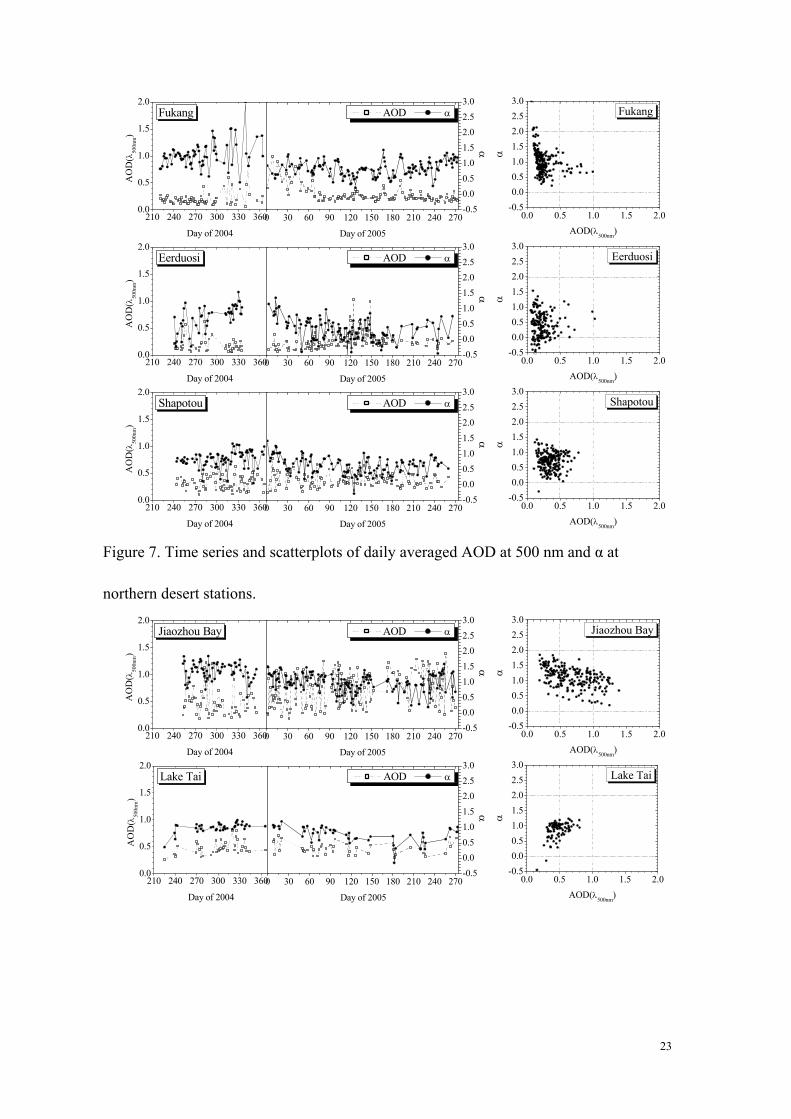
Figure 7 shows the results at three northern stations representing different
desert-like ecosystems. The AODs at these stations are moderately high with annual
mean values ranging from 0.24 to 0.36; α varies from 0.42 to 0.99. The Shapotou site,
situated in an arid part of the Tengger Desert. Dust storm frequency and precipitation
amounts were below average during the period [Xin et al., 2005] possibly resulting in
smaller seasonal changes in AOD than normal. The Fukang station is located in the
transition zone from a glacial environment to a desert environment and the Eerdousi
station is situated in a sandy grassland ecosystem within a semi-arid region. The
Fukang and Eerduosi sites have more vegetation on the ground so there is less aerosol
emission than at the Shapotou site. Also, agricultural and pastoral activities take place
in the regions surrounding the Fukang and Eerduosi sites, leading to changes in
dominant aerosol types during the year. Aerosol particles are small during autumn and
winter because of biomass burning by the local farmers. Given that the sole source of
aerosols in the more desert-like region is natural dust emission, dust aerosols are more
10
persistent at the Shapotou station.
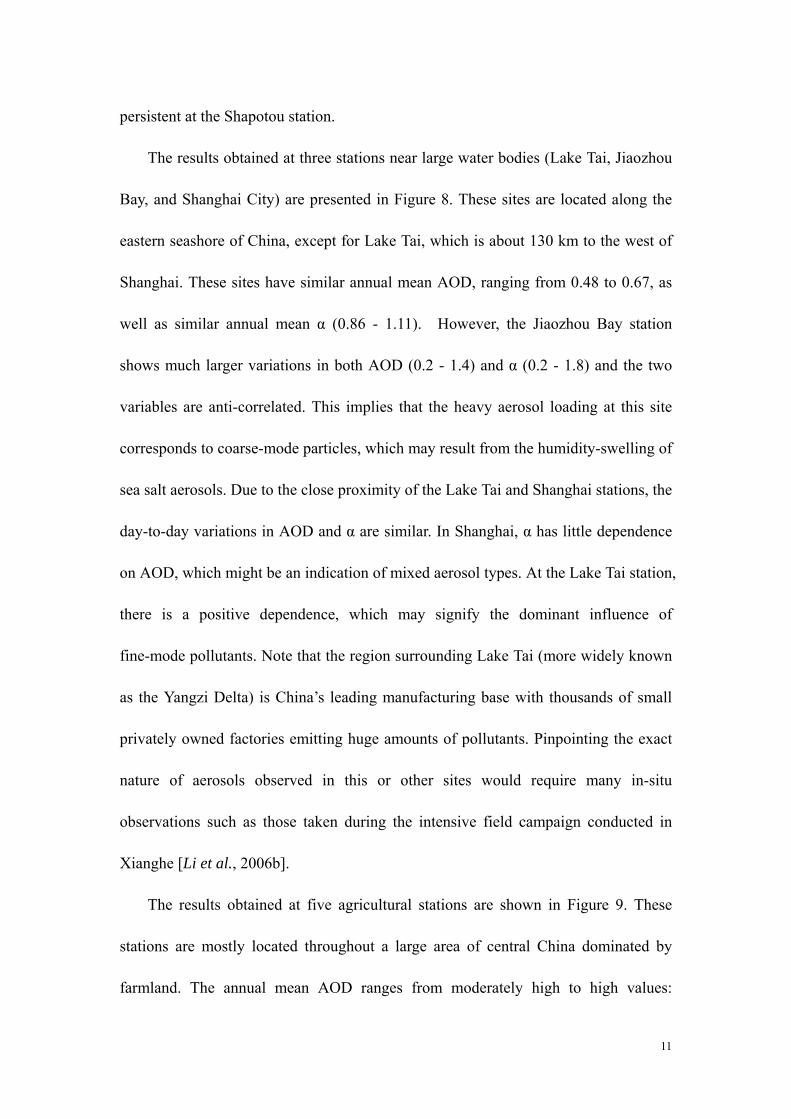
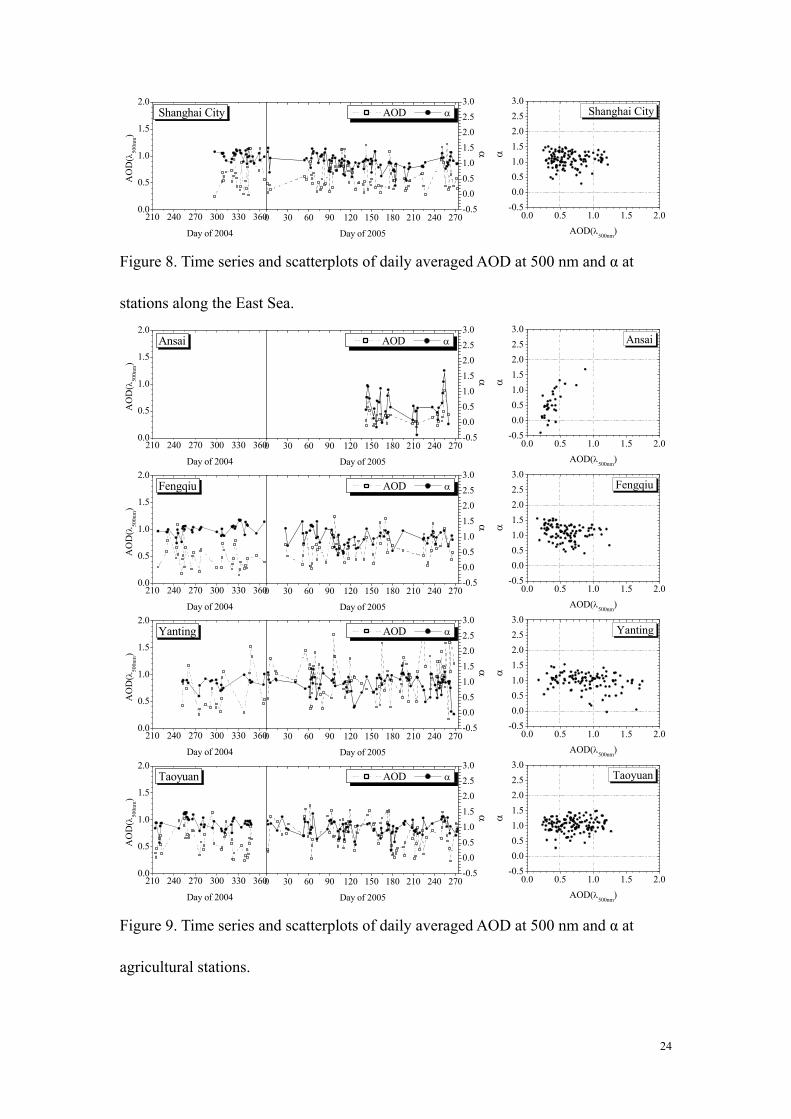
The results obtained at three stations near large water bodies (Lake Tai, Jiaozhou
Bay, and Shanghai City) are presented in Figure 8. These sites are located along the
eastern seashore of China, except for Lake Tai, which is about 130 km to the west of
Shanghai. These sites have similar annual mean AOD, ranging from 0.48 to 0.67, as
well as similar annual mean α (0.86 - 1.11). However, the Jiaozhou Bay station
shows much larger variations in both AOD (0.2 - 1.4) and α (0.2 - 1.8) and the two
variables are anti-correlated. This implies that the heavy aerosol loading at this site
corresponds to coarse-mode particles, which may result from the humidity-swelling of
sea salt aerosols. Due to the close proximity of the Lake Tai and Shanghai stations, the
day-to-day variations in AOD and α are similar. In Shanghai, α has little dependence
on AOD, which might be an indication of mixed aerosol types. At the Lake Tai station,
there is a positive dependence, which may signify the dominant influence of
fine-mode pollutants. Note that the region surrounding Lake Tai (more widely known
as the Yangzi Delta) is China’s leading manufacturing base with thousands of small
privately owned factories emitting huge amounts of pollutants. Pinpointing the exact
nature of aerosols observed in this or other sites would require many in-situ
observations such as those taken during the intensive field campaign conducted in
Xianghe [Li et al., 2006b].
The results obtained at five agricultural stations are shown in Figure 9. These
stations are mostly located throughout a large area of central China dominated by
farmland. The annual mean AOD ranges from moderately high to high values:
11

0.38±0.14, 0.59±0.24, 0.90±0.38 and 0.70±0.26, respectively, for the Ansai, Fengqiu,
Yanting and Taoyuan stations. The annual mean α is approximately equal to 1 with a
standard deviation of ~0.28 for all the stations, except for Ansai where α is 0.55±0.46.
More mineral dust aerosols are emitted in this region, due to intensive farming and the
exposure of bare soil. The day-to-day variation of AOD is large, but its seasonable
dependence is weak. The intermittently high AODs originate most likely from
blowing dust. Yanting, located in the basin of Sichuan Province, has the largest AOD;
Ansai, located in the Loess Plateau of Shanxi Province, has the lowest AOD.
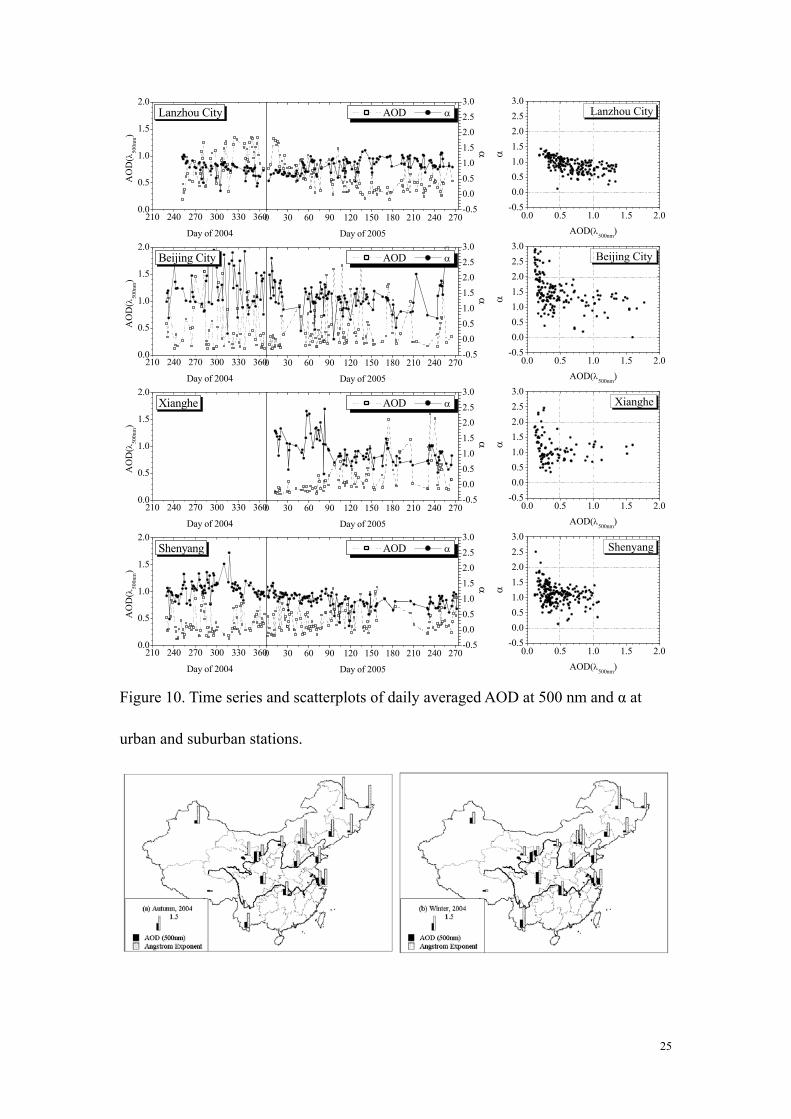
Results obtained at a few major Chinese cities are presented in Figure 10.
Measurements taken at the Shenyang station, an agricultural site located in a suburb
of Shenyang City; show that the air is mostly urban in character. Comparisons with
results for the rural agricultural sites (Figure 9) highlight some interesting features.
Overall, the annual mean AOD are similar for both urban and rural sites, which is
contrary to common belief. Also, the day-to-day variations of AOD for the urban sites
are substantially larger than the rural sites, both in terms of the magnitude and
frequency of changes. At the Lanzhou City site in midland China, α does not change
much with the AOD due to the strong influence of dust aerosol and pollutants
generated from ground surface emissions and transportation of dust from other arid
desert regions in northwest China. The AOD is large (0.79) and α is small (0.84) in
winter and spring, compared to summer and autumn. The seasonal variation stems
from both emission strength and atmospheric dynamic conditions. Lanzhou is a major
industrial city in northwest China, situated in a local basin with frequent temperature
12

inversions during the winter. Heavy aerosols generated by windswept dust, winter
heating, and industrial activities are often trapped in the basin during winter when
rainfall amounts are minimal, making it one of the most polluted regions in China.
There are two stations in Beijing, one near the city center and another in a distant
suburb (Xianghe) about 70 km east of Beijing City. The suburban site has slightly
lower AODs than the city site. At both stations, the AOD values are large and
fluctuate much more than those observed in Lanzhou. Another distinct feature in
Beijing is that there were some very clean days with AODs less than 0.2 and very
turbid days with AODs ranging from 1.5-4 [Li et al., 2006a] that occurred
alternatively over short periods of time. Explanations for this phenomenon were given
earlier. Moreover, α also exhibits a large variation but is generally larger than
Lanzhou, presumably due to a much lower concentration of dust aerosols in Beijing.
In general, aerosols in Beijing are much more diverse than in Lanzhou, encompassing
the very fine-mode aerosols from fossil fuel burning and biomass burning to large
coarse-mode dust aerosols originating from the desertification grassland in Mongolia.
During the first month of the lunar year, smoke aerosols were detected, emanating
from the firework displays celebrating the Chinese New Year. From spring to summer,
the AOD increases because of at least in part humidity swelling [Li et al., 2006a;
Jeong et al., 2006].
Some intriguing findings can be seen by comparing the aerosol characteristics
measured at the Lanzhou and Shenyang sites, located in major industrial zones in
northeast and northwest China. Both stations show large AODs, but their seasonal
13
trends appear to be opposite. In Shenyang, the AOD is generally high in summer and
low in winter, whereas in Lanzhou, the trend is opposite. This is because Shenyang is
close to the Yellow Sea and the humidity in summer is high, leading to a stronger
humidity effect and larger AOD. In wintertime, cold air from Siberia often brought
clean air into the region, washing away pollutants. These arguments are supported by
the seasonal change in α: smaller (large particles) in summertime and larger (smaller
particles) in wintertime, also opposite to the seasonal change in Lanzhou.
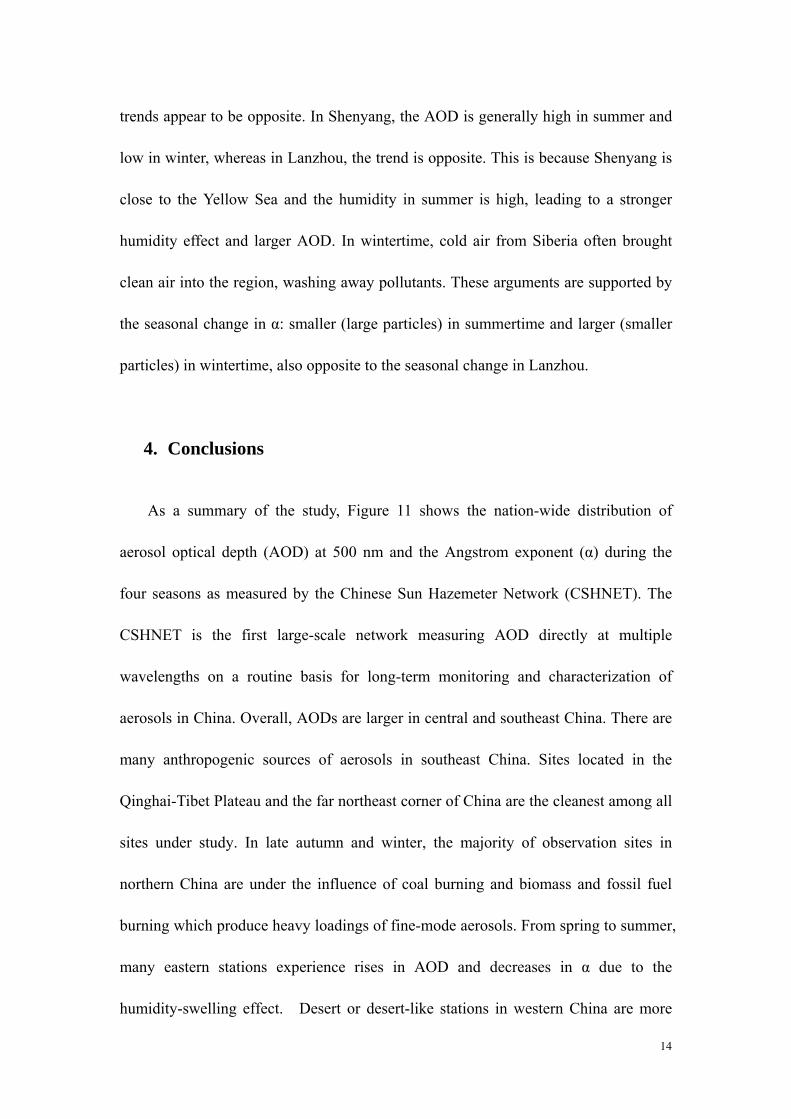
4. Conclusions
As a summary of the study, Figure 11 shows the nation-wide distribution of
aerosol optical depth (AOD) at 500 nm and the Angstrom exponent (α) during the
four seasons as measured by the Chinese Sun Hazemeter Network (CSHNET). The
CSHNET is the first large-scale network measuring AOD directly at multiple
wavelengths on a routine basis for long-term monitoring and characterization of
aerosols in China. Overall, AODs are larger in central and southeast China. There are
many anthropogenic sources of aerosols in southeast China. Sites located in the
Qinghai-Tibet Plateau and the far northeast corner of China are the cleanest among all
sites under study. In late autumn and winter, the majority of observation sites in
northern China are under the influence of coal burning and biomass and fossil fuel
burning which produce heavy loadings of fine-mode aerosols. From spring to summer,
many eastern stations experience rises in AOD and decreases in α due to the
humidity-swelling effect. Desert or desert-like stations in western China are more
14
affected by the coarse-mode mineral dust aerosols, with the peaks of loading in spring.
Continental aerosols are observed across China because of dust transportation and
relatively strong regional emissions, while pollutants may play a more significant role
in urban regions. Many sites in eastern China show aerosol properties characteristic of
mixtures of pollutants, mineral aerosols, and smoke aerosols. One finding worth
noting is that the aerosol loading is generally heavy in many parts of China but seems
not to differ significantly between rural agricultural stations and urban stations, at
least for the stations under study. The annual mean AOD averaged over all the sites is
0.43, which is about 3 times the global mean value measured at all the Aerosol
Robotic Network sites [Dubovik et al., 2002] .
Acknowledgments. This work was partly supported by the Project of Field Station
Network of the Chinese Academy of Sciences, the National Natural Science
Foundation of China (40525016; 40520120071), and the NASA Radiation Science
Program (NNG04GE79G). The authors thank the Chinese Ecosystem Research
Network (CERN) and the U.S. Forestry Service for contributions to this research. The
paper was edited by Maureen Cribb.
15
References Acharya, Y. B. (2005), Spectral and emission characteristics of LED and its application to LED-based sun-photometry, Optics & Laser Technology, 37, 547-550. Acharya, Y. B., A. Jayaraman, S. Ramachandran, B. H. Subbaraya (1995), Compact light emitting diode sun photometer for atmospheric optical depth measurement, Appl. Opt., 34(7), 1209-1214. Anderson, T., R. J. Charlson, S. E. Schwartz, R. Knutti, O. Boucher, H. Rodhe, and J. Heintzenberg (2003), Climate forcing by aerosols: A hazy picture, Science, 300, 1103-1104. Brooks, D. R., and F. M. III Mims (2001), Development of an inexpensive handheld LED-based Sun photometer for the GLOBE program, Journal Geophys. Res., 106(D5), 4733-4740. Chin, M., Ginoux, P., Kinne, S., Torres, O., Holben, B., Duncan, B. N., Martin, R. V., Logan, J. A., Higurashi, A., and Nakajima, T.: Tropospheric aerosol optical thickness from the GOCART model and comparisons with satellite and sun photometer measurements, J. Atmos., Sci., 59, 461-483, 2002. Dickerson, R. R., M. O. Andreae, T. Campos, O. L. Mayol-Bracero, C. Neusuess, and D. G. Streets (2002), Analysis of black carbon and carbon monoxide observed over the Indian Ocean: Implications for emissions and photochemistry, J. Geophys. Res., 107 (D19), 8017. Dubovik, O., A. Smirnov, B. N. Holben, M.D. King, Y. J. Kaufman, T. F. Eck, and I. Slutsker (2000), Accuracy assessments of aerosol optical properties retrieved from Aerosol Robotic Network (AERONET) sun and sky radiance measurements. J. Geoph. Res., 105(8), 9791-9806. Dubovik, O., B. N. Holben, T. F. Eck, A. Smirnov, Y. J. Kaufman, M. D. King, D. Tanre, and I. Slutsker (2002), Variability of absorption and optical properties of key aerosol types observed in worldwide locations, J. Atmos. Sci., 59, 590-608. Hao, W.M., D.E. Ward, R.A. Susott, R.E. Babbitt, B.L. Nordgren, Y.J. Kaufman, B.N. Holben, and D.M. Giles (2005), Comparison of aerosol optical thickness measurements by MODIS, AERONET sun photometers, and Forest Service handheld sun photometers in southern Africa during the SAFARI 2000 campaign, Int. J. Remote Sensing, 26, 4169-4183. Hayasak, T., K. Kawamoto, G. Shi, A. Ohmura (2006), Importance of aerosols in satellite-derived estimates of surface shortwave irradiance over China, Geophy. Res. Lett., 33, 10.1029/2005GL025093. Haywood, J.M., and O. Boucher (2000), Estimates of the direct and indirect radiative forcing due to tropospheric aerosols: a review, Revs. Geophys., 38, 513-543.
16

Holben, B. N., et al. (1998), AERONET - A federated instrument network and data archive for aerosol characterization, Remote Sensing of Environment, 66(1), 1-16. Huebert, B. J., T. Bates, P. B. Russell, G. Shi, Y. J. Kim, K. Kawamura, G. Carmichael, T. Nakajima (2003), An overview of ACE-Asia: Strategies for quantifying the relationships between Asian aerosols and their climatic impacts, J. Geophys. Res., 108 (D23), 8633. Intergovernmental Panel on Climate Change (IPCC) (2001), Climate Change 2000, The Scientific Basis-Contribution of Working Group I to the Third Assessment Report of the Intergovernmental Panel on Climate Change. Cambridge University Press, New York. Intergovernmental Panel on Climate Change (IPCC) (1996), Climate Change 1995, The science of climate change, contribution of working group I to the second assessment report of the IPCC. Cambridge University Press, Cambridge, UK. Jacobson, M.Z. (2001), Strong radiative heating due to the mixing state of black carbon in atmospheric aerosols, Nature, 409, 695-697. Jeong, M.J , Z. Li, D.A. Chu, and S-T. Tsay (2005), Quality and Compatibility Analyses of Global Aerosol Products Derived from the Advanced Very High Resolution Radiometers and the Moderate Imaging Spectroradiometer, J. Geophy. Res., 110, D10S09, doi:10.1029/2004JD004648. Jeong, M.-J., Z. Li, S.C. Tsay, (2006), Effect of Aerosol Humidification on the Column Aerosol Optical Thickness over the ARM Southern Great Plains Site, J. Geophy. Res., submitted. Kaufman, Y. J., B. N. Holben (2000), Will aerosol measurements from Terra and Aqua polar orbiting satellites represent the daily aerosol abundance and properties? Geophysics Research Letters, 27 (23), 3861-3864. Kim, D., B. Sohn, T. Nakajima, T. Takamura, T. Takemura, B. Choi, and S. Yoon (2004), Aerosol optical properties over East Asia determined from ground-based sky radiation measurements, J. Geophys. Res., 109, D02209. Lelieveld, J., et al. (2001), The Indian Ocean Experiment: Widespread air Pullution from South and South-East Asia, Science, 291(5506), 1031-1036. Li, C., et al. (2003a), Characteristics of distribution and seasonal variation of aerosol optical depth in eastern China with MODIS products, Chinese Science Bulletin, 48(22), 2488-2495. Li, X., Y. Liu, H. Qiu, Y. Zhang (2003b), Retrieval method for optical thickness of aerosols over Beijing and its vicinity by using the MODIS data, ACTA METEOROLOGICA SINICA, 61(5), 581-592. (In Chinese)
17

Li, Z. (1998), Influence of absorbing aerosols on the inference of solar surface radiation budget and cloud absorption, J. Climate, 11, 5-17. Li, Z. (2004), Aerosol and climate: A perspective from East Asia, In "Observation, Theory, and Modeling of the Atmospheric Variability" (ed. Zhu), World Scientific Pub. Co., 501-525. Li, Z., A. Trishchenko (2001), Quantifying the uncertainties in determining SW cloud radiative forcing and cloud absorption due to variability in atmospheric condition, J. Atmos. Sci., 58, 376-389. Li, Z., et al. (2006a), Aerosol optical properties and radiative effects in Northern China. submitted to the same EAST-AIRE special issue. Li, C., et al. (2006b), In-Situ Measurements of Trace Gases and Aerosol Optical Properties at a Rural Site in Northern China during EAST-AIRE IOP 2005. submitted to the same EAST-AIRE special issue. Luo, Y., X. Zhou, W. Li (1998), Advances in the study of atmospheric aerosol radiative forcing and climate change, Advance in earth sciences, 13(6), 572-581. (In Chinese) Mao, J., J. Zhang, M. Wang (2002), Summary comment on research of atmospheric aerosol in china, ACTA METEOROLOGICA SINICA, 60(5), 625-634. (In Chinese) Mims, F. M. III (1992), Sun photometer with light-emitting diodes as spectrally selective detectors, Applied Optics, 31(33), 6965-6967. Nakajima, T., et al. (2003), Significance of direct and indirect radiative forcings of aerosols in the East China Sea region. Journal of Geophysical Research, 108(D23), 8658, doi:10.1029/2002JD003261. Qiu, J., D. Lu, H. Chen, G. Wang and G. Shi (2003), Modern research progresses in atmospheric physics, Chinese Journal of Atmospheric Sciences, 27(4), 628-652. (In Chinese) Ramanathan, V., P.J. Crutzen, J.T. Kiehl, and D. Rosenfeld (2001a), Aerosols, climate and the hydrological cycle, Nature, 294, 2119-2124. Ramanathan, V., et al. (2001b), Indian Ocean experiment: An integrated analysis of the climate forcing and effects of the great Indo-Asian haze, J. Geophys. Res., 106(D22), 28371-28398, 10.1029/2001JD900133. Rosenfeld, D. (2000), Suppression of rain and snow by urban and industrial air pollution, Science, 287, 1793-1796. Rosenfeld, D., and W. Woodley (2001), Pollution and clouds, Physics World, 33-37.
18

Rosenfeld, D., Y. Rudich, and R. Lahav (2001), Desert dust suppressing precipitation: A possible desertification feedback loop, Proceedings of the National Academy of Sciences (PNAS), 98, 5975-5980. Satheesh, S. K. and K. K. Moorthy (2005), Radiative effects of natural aerosols: A review. Atmospheric Environment, 39(11) 2089-2110. Satheesh, S.K., and V. Ramanathan (2000), Large differences in tropical aerosol forcing at the top of the atmosphere and Earth’s surface, Nature, 405, 60-63. Seinfeld, J. H., et al. (2004), ACE-ASIA: Regional Climatic and Atmospheric Chemical Effects of Asian Dust and Pollution, Bulletin of the American Meteorological Society, 85(3), 367–380. Streets, D. G., S. Gupta, S. T. Waldhoff, M. Q. Wang, T. C. Bond, and Y. Bo (2001), Black carbon emissions in China, Atmos. Environ., 35, 4281-4296. Takemura, T., T. Nakajima, A. Higurashi, S. Ohta, and N. Sugimoto (2003), Aerosol distributions and radiative forcing over the Asian-Pacific region simulated by Spectral Radiation-Transport Model for Aerosol Species (SPRINTARS). Journal of Geophysical Research, 108(D23), 8659, doi:10.1029/2002JD003210. Xin, J., S. Wang, Y. Wang, J. Yuan, W. Zhang, Y. Sun (2005). Optical properties and size distribution of dust aerosols over the Tengger Desert in Northern China. Atmospheric Environment, 39, 5971-5978. Xiu, X., et al. (2003), Explore aerosol variational field by using MODIS data and ground-based photometer observation, Chinese Science Bulletin, 48(15), 1680-1685. (In Chinese)
19

80 90 100 110 120 130
East Longitude
20
25
30
35
40
45
50N
orth
Lat
itude
CERN station (19)
City site (4)
(116.37E,39.97N,44m)
(115.43E,39.97N,1130m)
(128.63E,42.40N,736m)
(110.18E,39.48N,1300m)
(114.40E,35.00N,68m)
(101.32E,37.45N,3230m)
(87.92E,44.28N,470m)
(126.63E,47.43N,240m)
(120.18E,35.90N,6m)
(133.52E,47.58N,56m)
(123.63E,41.52N,31m)
(121.75E,31.12N,5m)
(120.22E,31.40N,6m)
(111.45E,28.92N,78m)
(105.45E,31.27N,420m)
(101.27E,21.90N,570m)
(103.82E,36.07N,1520m)
(91.33E,29.67N,3688m)
(109.47E,18.22N,3m)
(112.53E,23.17N,300m)
Fukang
Haibei
Lhasa
Xishuangbanna
Sanya
Dinghu Mountain
Yanting
Taoyuan
Shanghai
Lanzhou
Shapotou(104.95E,37.45N,1357m)
Eerduosi
Beijing forest
Beijing
Jiaozhou Bay
Shenyang
Fengqiu
Changbai Mountain
Sanjiang
Hailun
Xianghe
Calibration center
Chinese Sun Hazemeter Network (CSHNET)
Ansai(109.31E,36.85N,1208m)
110 112 114 1164
6
8
10
12
14
16
18
20Sanya
(109.47E,18.22N,3m)
(121.09E,25.00N,230m)Taibei
Lake Tai
Hainan archipelago
Figure 1. Geographical locations of the CSHNET sites.
0 2 4 6 8 10 128.0
8.5
9.0
9.5
10.0
10.5
ln(V
-Vda
rk)
Relative air mass
880nm
(a) ID023 meter, at the Lhasa site, 6 November 2004
R2=0.998
R2=0.998
R2=0.996
650nm
R2=0.965
500nm405nm
0 2 4 6 8 10 125
6
7
8
9
10
11
ln(V
-Vda
rk)
Relative air mass
(b) ID032 meter, at the Fukang site, 15 November 2004
R2=0.981
R2=0.992
R2=0.991
R2=0.983
0 2 4 6 85
6
7
8
9
10
11
ln(V
-Vda
rk)
Relative air mass
(c) ID041 meter, at the Beijing site, 27 November 2004
R2=0.991
R2=0.984
R2=0.973
R2=0.962
0 2 4 6 86
7
8
9
10
11
ln(V
-Vda
rk)
Relative air mass
(d) ID025 meter, at the Sanjiang site, 29 November 2004
R2=0.993
R2=0.981
R2=0.982
R2=0.914
Figure 2. The Langley calibration plots of LED hazemeters at four sites. V and Vdark
are the sunlight and dark voltages at four specific channels.
20
0.0 0.5 1.0 1.5 2.00.0
0.5
1.0
1.5
2.0
0.0 0.5 1.0 1.5 2.00.0
0.5
1.0
1.5
2.0
CIM
EL's
AO
D
ID041 hazemeter's AOD
500nmy=0.9296x-0.0219 (R2=0.983)
Data from Aug to Dec 2004 at Beijing site
(a)
y=x
405nmy=1.0053x-0.0437 (R2=0.981)
0.0 0.5 1.0 1.50.0
0.5
1.0
1.5
0.0 0.5 1.0 10.0
0.5
1.0
1.5
.5
CIM
EL's
AO
D
ID041 hazemeter's AOD
880nm y=0.8318x-0.0434 (R2=0.948)
Data from Aug to Dec 2004 at Beijing site
(b)
y=x
650nm y=0.9411x+0.0101 (R2=0.957)
0.0 0.5 1.0 1.5 2.00.0
0.5
1.0
1.5
2.0
0.0 0.5 1.0 1.5 2.00.0
0.5
1.0
1.5
2.0
CIM
EL's
AO
D
ID005 hazemeter's AOD
500nmy=0.9395x-0.0469 (R2=0.961)
Data from Feb to Aug 2005 at Xianghe site
(c)
y=x
405nmy=0.9844x-0.0748 (R2=0.974)
0.0 0.5 1.0 1.50.0
0.5
1.0
1.5
0.0 0.5 1.0 10.0
0.5
1.0
1.5
.5
CIM
EL's
AO
D
ID005 hazemeter's AOD
880nm y=0.8811x-0.0133 (R2=0.926)
Data from Feb to Aug 2005 at Xianghe site
(d)
y=x
650nm y=0.9770x-0.0184 (R2=0.941)
Figure 3. Comparison of AODs measured by CIMEL sunphotometers and hazemeters
at two sites.
210 240 270 300 330 3600.0
0.5
1.0
1.5
2.0
Day of 2004
AO
D(λ
500n
m)
0 30 60 90 120 150 180 210 240 270
AOD α
Day of 2005
Lhasa
-0.50.00.51.01.52.02.53.0
α
0.0 0.5 1.0 1.5 2.0-0.50.00.51.01.52.02.53.0
Lhasa α
AOD(λ500nm)
210 240 270 300 330 3600.0
0.5
1.0
1.5
2.0
Day of 2004
AO
D(λ
500n
m)
0 30 60 90 120 150 180 210 240 270
AOD α
Day of 2005
Haibei
-0.50.00.51.01.52.02.53.0
α
0.0 0.5 1.0 1.5 2.0-0.50.00.51.01.52.02.53.0
Haibei
α
AOD(λ500nm)
Figure 4. Time series and scatterplots of daily averaged AOD at 500 nm and α at sites
on the Qinghai-Tibet Plateau.
21
210 240 270 300 330 3600.0
0.5
1.0
1.5
2.0
Day of 2004
AO
D(λ
500n
m)
0 30 60 90 120 150 180 210 240 270
AOD α
Day of 2005
Hailun
-0.50.00.51.01.52.02.53.0
α
0.0 0.5 1.0 1.5 2.0-0.50.00.51.01.52.02.53.0
Hailun
α
AOD(λ500nm)
210 240 270 300 330 3600.0
0.5
1.0
1.5
2.0
Day of 2004
AO
D(λ
500n
m)
0 30 60 90 120 150 180 210 240 270
AOD α
Day of 2005
Sanjiang
-0.50.00.51.01.52.02.53.0
α
0.0 0.5 1.0 1.5 2.0-0.50.00.51.01.52.02.53.0
Sanjiang
α
AOD(λ500nm)
210 240 270 300 330 3600.0
0.5
1.0
1.5
2.0
Day of 2004
AO
D(λ
500n
m)
0 30 60 90 120 150 180 210 240 270
AOD α
Day of 2005
Changbai Mountain
-0.50.00.51.01.52.02.53.0
α
0.0 0.5 1.0 1.5 2.0-0.50.00.51.01.52.02.53.0
Changbai Mountain
α
AOD(λ500nm)
Figure 5. Time series and scatterplots of daily averaged AOD at 500 nm and α at sites
in northeast China.
210 240 270 300 330 3600.0
0.5
1.0
1.5
2.0
Day of 2004
AO
D(λ
500n
m)
0 30 60 90 120 150 180 210 240 270
AOD α
Day of 2005
Beijing Forest
-0.50.00.51.01.52.02.53.0
α
0.0 0.5 1.0 1.5 2.0-0.50.00.51.01.52.02.53.0
Beijing Forest
α
AOD(λ500nm)
210 240 270 300 330 3600.0
0.5
1.0
1.5
2.0
Day of 2004
AO
D(λ
500n
m)
0 30 60 90 120 150 180 210 240 270
AOD α
Day of 2005
Xishuangbanna
-0.50.00.51.01.52.02.53.0
α
0.0 0.5 1.0 1.5 2.0-0.50.00.51.01.52.02.53.0
Xishuangbanna
α
AOD(λ500nm)
Figure 6. Time series and scatterplots of daily averaged AOD at 500 nm and α at
forest stations.
22
210 240 270 300 330 3600.0
0.5
1.0
1.5
2.0
Day of 2004
AO
D(λ
500n
m)
0 30 60 90 120 150 180 210 240 270
AOD α
Day of 2005
Fukang
-0.50.00.51.01.52.02.53.0
α
0.0 0.5 1.0 1.5 2.0-0.50.00.51.01.52.02.53.0
Fukang
α
AOD(λ500nm)
210 240 270 300 330 3600.0
0.5
1.0
1.5
2.0
Day of 2004
AO
D(λ
500n
m)
0 30 60 90 120 150 180 210 240 270
AOD α
Day of 2005
Eerduosi
-0.50.00.51.01.52.02.53.0
α
0.0 0.5 1.0 1.5 2.0-0.50.00.51.01.52.02.53.0
Eerduosi
α
AOD(λ500nm)
210 240 270 300 330 3600.0
0.5
1.0
1.5
2.0
Day of 2004
AO
D(λ
500n
m)
0 30 60 90 120 150 180 210 240 270
AOD α
Day of 2005
Shapotou
-0.50.00.51.01.52.02.53.0
α
0.0 0.5 1.0 1.5 2.0-0.50.00.51.01.52.02.53.0
Shapotou
α
AOD(λ500nm)
Figure 7. Time series and scatterplots of daily averaged AOD at 500 nm and α at
northern desert stations.
210 240 270 300 330 3600.0
0.5
1.0
1.5
2.0
Day of 2004
AO
D(λ
500n
m)
0 30 60 90 120 150 180 210 240 270
AOD α
Day of 2005
Jiaozhou Bay
-0.50.00.51.01.52.02.53.0
α
0.0 0.5 1.0 1.5 2.0-0.50.00.51.01.52.02.53.0
Jiaozhou Bay
α
AOD(λ500nm)
210 240 270 300 330 3600.0
0.5
1.0
1.5
2.0
Day of 2004
AO
D(λ
500n
m)
0 30 60 90 120 150 180 210 240 270
AOD α
Day of 2005
Lake Tai
-0.50.00.51.01.52.02.53.0
α
0.0 0.5 1.0 1.5 2.0-0.50.00.51.01.52.02.53.0
Lake Tai
α
AOD(λ500nm)
23
210 240 270 300 330 3600.0
0.5
1.0
1.5
2.0
Day of 2004
AO
D(λ
500n
m)
0 30 60 90 120 150 180 210 240 270
AOD α
Day of 2005
Shanghai City
-0.50.00.51.01.52.02.53.0
α
0.0 0.5 1.0 1.5 2.0-0.50.00.51.01.52.02.53.0
Shanghai City
α
AOD(λ500nm)
Figure 8. Time series and scatterplots of daily averaged AOD at 500 nm and α at
stations along the East Sea.
210 240 270 300 330 3600.0
0.5
1.0
1.5
2.0
Day of 2004
AO
D(λ
500n
m)
0 30 60 90 120 150 180 210 240 270
AOD α
Day of 2005
Ansai
-0.50.00.51.01.52.02.53.0
α
0.0 0.5 1.0 1.5 2.0-0.50.00.51.01.52.02.53.0
Ansai
α
AOD(λ500nm)
210 240 270 300 330 3600.0
0.5
1.0
1.5
2.0
Day of 2004
AO
D(λ
500n
m)
0 30 60 90 120 150 180 210 240 270
AOD α
Day of 2005
Fengqiu
-0.50.00.51.01.52.02.53.0
α
0.0 0.5 1.0 1.5 2.0-0.50.00.51.01.52.02.53.0
Fengqiu
α
AOD(λ500nm)
210 240 270 300 330 3600.0
0.5
1.0
1.5
2.0
Day of 2004
AO
D(λ
500n
m)
0 30 60 90 120 150 180 210 240 270
AOD α
Day of 2005
Yanting
-0.50.00.51.01.52.02.53.0
α
0.0 0.5 1.0 1.5 2.0-0.50.00.51.01.52.02.53.0
Yanting
α
AOD(λ500nm)
210 240 270 300 330 3600.0
0.5
1.0
1.5
2.0
Day of 2004
AO
D(λ
500n
m)
0 30 60 90 120 150 180 210 240 270
AOD α
Day of 2005
Taoyuan
-0.50.00.51.01.52.02.53.0
α
0.0 0.5 1.0 1.5 2.0-0.50.00.51.01.52.02.53.0
Taoyuan
α
AOD(λ500nm)
Figure 9. Time series and scatterplots of daily averaged AOD at 500 nm and α at
agricultural stations.
24
210 240 270 300 330 3600.0
0.5
1.0
1.5
2.0
Day of 2004
AO
D(λ
500n
m)
0 30 60 90 120 150 180 210 240 270
AOD α
Day of 2005
Lanzhou City
-0.50.00.51.01.52.02.53.0
α
0.0 0.5 1.0 1.5 2.0-0.50.00.51.01.52.02.53.0
Lanzhou City
α
AOD(λ500nm)
210 240 270 300 330 3600.0
0.5
1.0
1.5
2.0
Day of 2004
AO
D(λ
500n
m)
0 30 60 90 120 150 180 210 240 270
AOD α
Day of 2005
Beijing City
-0.50.00.51.01.52.02.53.0
α
0.0 0.5 1.0 1.5 2.0-0.50.00.51.01.52.02.53.0
Beijing City
α
AOD(λ500nm)
210 240 270 300 330 3600.0
0.5
1.0
1.5
2.0
Day of 2004
AO
D(λ
500n
m)
0 30 60 90 120 150 180 210 240 270
AOD α
Day of 2005
Xianghe
-0.50.00.51.01.52.02.53.0
α
0.0 0.5 1.0 1.5 2.0-0.50.00.51.01.52.02.53.0
Xianghe
α
AOD(λ500nm)
210 240 270 300 330 3600.0
0.5
1.0
1.5
2.0
Day of 2004
AO
D(λ
500n
m)
0 30 60 90 120 150 180 210 240 270
AOD α
Day of 2005
Shenyang
-0.50.00.51.01.52.02.53.0
α
0.0 0.5 1.0 1.5 2.0-0.50.00.51.01.52.02.53.0
Shenyang
α
AOD(λ500nm)
Figure 10. Time series and scatterplots of daily averaged AOD at 500 nm and α at
urban and suburban stations.
25
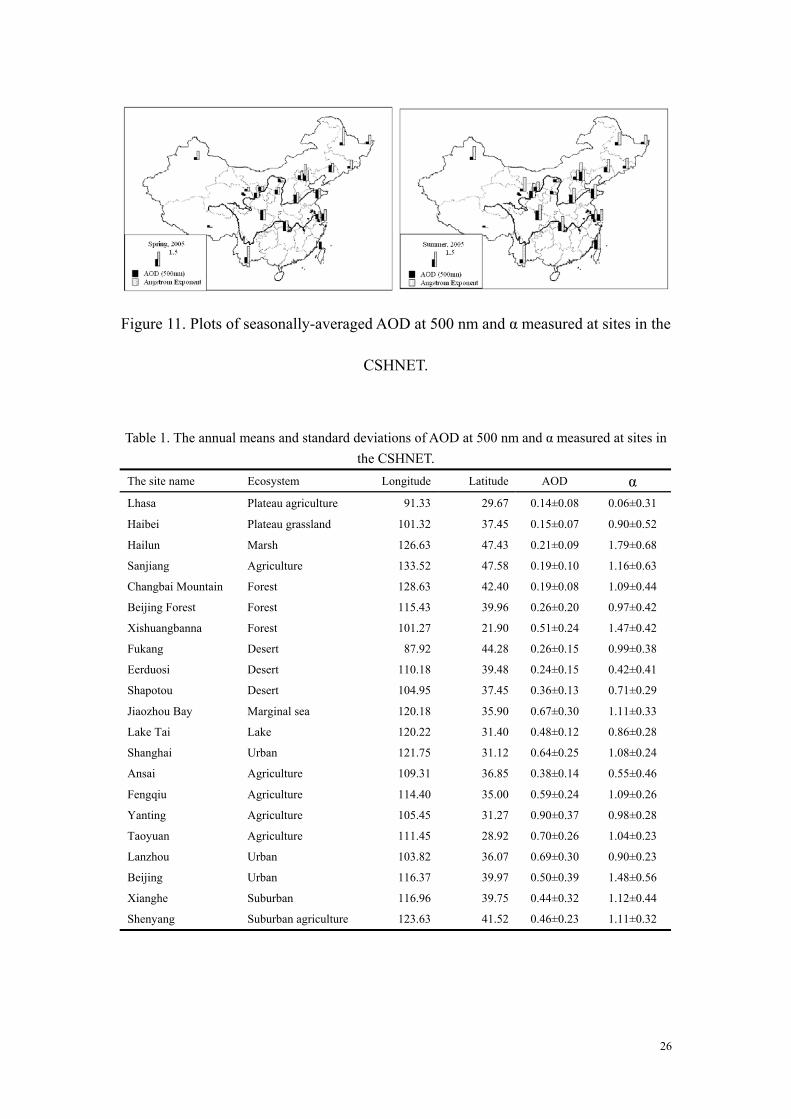
Figure 11. Plots of seasonally-averaged AOD at 500 nm and α measured at sites in the
CSHNET.
Table 1. The annual means and standard deviations of AOD at 500 nm and α measured at sites in the CSHNET.
The site name Ecosystem Longitude Latitude AOD α
Lhasa Plateau agriculture 91.33 29.67 0.14±0.08 0.06±0.31
Haibei Plateau grassland 101.32 37.45 0.15±0.07 0.90±0.52
Hailun Marsh 126.63 47.43 0.21±0.09 1.79±0.68
Sanjiang Agriculture 133.52 47.58 0.19±0.10 1.16±0.63
Changbai Mountain Forest 128.63 42.40 0.19±0.08 1.09±0.44
Beijing Forest Forest 115.43 39.96 0.26±0.20 0.97±0.42
Xishuangbanna Forest 101.27 21.90 0.51±0.24 1.47±0.42
Fukang Desert 87.92 44.28 0.26±0.15 0.99±0.38
Eerduosi Desert 110.18 39.48 0.24±0.15 0.42±0.41
Shapotou Desert 104.95 37.45 0.36±0.13 0.71±0.29
Jiaozhou Bay Marginal sea 120.18 35.90 0.67±0.30 1.11±0.33
Lake Tai Lake 120.22 31.40 0.48±0.12 0.86±0.28
Shanghai Urban 121.75 31.12 0.64±0.25 1.08±0.24
Ansai Agriculture 109.31 36.85 0.38±0.14 0.55±0.46
Fengqiu Agriculture 114.40 35.00 0.59±0.24 1.09±0.26
Yanting Agriculture 105.45 31.27 0.90±0.37 0.98±0.28
Taoyuan Agriculture 111.45 28.92 0.70±0.26 1.04±0.23
Lanzhou Urban 103.82 36.07 0.69±0.30 0.90±0.23
Beijing Urban 116.37 39.97 0.50±0.39 1.48±0.56
Xianghe Suburban 116.96 39.75 0.44±0.32 1.12±0.44
Shenyang Suburban agriculture 123.63 41.52 0.46±0.23 1.11±0.32
26
Related Documents