Antioxidant defences and homeostasis of reactive oxygen species in different human mitochondrial DNA-depleted cell lines Lodovica Vergani 1 , Maura Floreani 2 , Aaron Russell 3 , Mara Ceccon 1 , Eleonora Napoli 4 , Anna Cabrelle 5 , Lucia Valente 2 , Federica Bragantini 1 , Bertrand Leger 3 and Federica Dabbeni-Sala 2 1 Dipartimento di Scienze Neurologiche and 2 Dipartimento di Farmacologia e Anestesiologia, Universita ` di Padova, Padova, Italy; 3 Clinique Romande de Re ´adaptation SUVA Care, Sion, Switzerland; 4 E.Medea Scientific Institute, Conegliano Research Centre, Conegliano, Italy; 5 Dipartimento di Medicina Clinica, Universita ` di Padova, c/o Istituto Veneto di Medicina Molecolare, Padova, Italy Three pairs of parental (q + ) and established mitochondrial DNA depleted (q 0 ) cells, derived from bone, lung and muscle were used to verify the influence of the nuclear background and the lack of efficient mitochondrial respiratory chain on antioxidant defences and homeostasis of intracellular reactive oxygen species (ROS). Mitochondrial DNA deple- tion significantly lowered glutathione reductase activity, glutathione (GSH) content, and consistently altered the GSH 2 : oxidized glutathione ratio in all of the q 0 cell lines, albeit to differing extents, indicating the most oxidized redox state in bone q 0 cells. Activity, as well as gene expression and protein content, of superoxide dismutase showed a decrease in bone and muscle q 0 cell lines but not in lung q 0 cells. GSH peroxidase activity was four times higher in all three q 0 cell lines in comparison to the parental q + , suggesting that this may be a necessary adaptation for survival without a functional respiratory chain. Taken together, these data suggest that the lack of respiratory chain prompts the cells to reduce their need for antioxidant defences in a tissue-specific manner, exposing them to a major risk of oxidative injury. In fact bone-derived q 0 cells displayed the highest steady-state level of intracellular ROS (measured directly by 2¢,7¢-di- chlorofluorescin, or indirectly by aconitase activity) com- pared to all the other q + and q 0 cells, both in the presence or absence of glucose. Analysis of mitochondrial and cytosolic/ iron regulatory protein-1 aconitase indicated that most ROS of bone q 0 cells originate from sources other than mitochondria. Keywords: A549 q 0 cells; antioxidant defences; 143 q 0 cells; reactive oxygen species; rhabdomyosarcoma q 0 cells. Cellular reactive oxygen species (ROS), such as superoxide anions (O 2 ) 1 , and hydrogen peroxide (H 2 O 2 ), have long been held to be harmful by-products of life in an aerobic environment. ROS are potentially toxic because they are highly reactive and modify several types of cellular macro- molecules. Lipid, protein and DNA damage can lead to cytotoxicity and mutagenesis [1]. Therefore, cells have evolved elaborate defence systems to counteract the effects of ROS. These include both nonenzymatic (glutathione, pyridine nucleotides, ascorbate, retinoic acid, thioredoxin and tocopherol) and enzymatic (such as superoxide dis- mutases, catalase, glutathione peroxidase and peroxi- redoxin) pathways, which limit the rate of oxidation and thereby protect cells from oxidative stress [1,2]. Notwith- standing, evidence is emerging that ROS also act as signals or mediators in many cellular processes, such as cell pro- liferation, differentiation, apoptosis, and senescence [3–5]. The redox environment of a cell may alter the balance between apoptosis and mitosis by affecting gene expression and enzyme activity [6]. Consequently, cellular redox state is increasingly accepted as a key mediator of multiple meta- bolic, signalling and transcriptional pathways essential for normal function and cell survival or programmed cell death [3–6]. Mitochondria are certainly the major cellular site for oxygen reduction and hence the site with the greatest potential for ROS formation. An estimated 0.4–0.8% [7] to 2–4% [8] of the total oxygen consumed during electron transport is reduced not to water by cytochrome c oxidase but rather to superoxide by complexes I, and III of the respiratory chain [1,7,8]. ROS production increases when respiratory flux is depressed by a high ATP/ADP ratio, high electronegativity of auto-oxidizable redox carriers in Correspondence to L. Vergani, Dipartimento di Scienze Neurologiche, Universita` di Padova, c/o Istituto Veneto di Medicina Molecolare, Via Orus 2, 35129 Padova, Italy. Fax: +39 049 7923271, Tel.: +39 049 7923219, E-mail: [email protected] Abbreviations: CS, citrate synthase; CuZnSOD, copper zinc super- oxide dismutase; DCF, 2¢,7¢-dichlorofluorescin; DTT, 1,4-dithio-DL- threitol; GSH, glutathione; GSSG, oxidized glutathione; GPx, GSH peroxidase; GR, GSSG reductase; GST, GSH transferase; H 2 -DCF- DA, 2¢,7¢-dichlorofluorescin-diacetate; IRP-1, iron regulatory protein- 1; LDH, lactate dehydrogenase; MFI, mean log fluorescence intensity; MnSOD, manganese superoxide dismutase; MPA, metaphosphoric acid; mt, mitochondrial; NBT, nitroblue tetrazolium; PMRS, plasma membrane oxidoreductase system; PBN, N-tert-butyl-a-phenyl- nitrone; ROS, reactive oxygen species; SOD, superoxide dismutase. Enzymes: catalase (EC 1.11.1.6); GSH peroxidase (EC 1.11.1.9); GSSG reductase (EC 1.8.1.7); GSH transferase (EC 2.5.1.18); Mn superoxide dismutase, CuZn superoxide dismutase, superoxide dismutase (EC 1.15.1.1). (Received 26 April 2004, revised 16 July 2004, accepted 23 July 2004) Eur. J. Biochem. 271, 3646–3656 (2004) Ó FEBS 2004 doi:10.1111/j.1432-1033.2004.04298.x

Welcome message from author
This document is posted to help you gain knowledge. Please leave a comment to let me know what you think about it! Share it to your friends and learn new things together.
Transcript

Antioxidant defences and homeostasis of reactive oxygen speciesin different human mitochondrial DNA-depleted cell lines
Lodovica Vergani1, Maura Floreani2, Aaron Russell3, Mara Ceccon1, Eleonora Napoli4, Anna Cabrelle5,Lucia Valente2, Federica Bragantini1, Bertrand Leger3 and Federica Dabbeni-Sala2
1Dipartimento di Scienze Neurologiche and 2Dipartimento di Farmacologia e Anestesiologia, Universita di Padova, Padova, Italy;3Clinique Romande de Readaptation SUVA Care, Sion, Switzerland; 4E.Medea Scientific Institute, Conegliano Research Centre,
Conegliano, Italy; 5Dipartimento di Medicina Clinica, Universita di Padova, c/o Istituto Veneto di Medicina Molecolare, Padova, Italy
Three pairs of parental (q+) and established mitochondrialDNAdepleted (q0) cells, derived frombone, lung andmusclewere used to verify the influence of the nuclear backgroundand the lack of efficient mitochondrial respiratory chain onantioxidant defences and homeostasis of intracellularreactive oxygen species (ROS). Mitochondrial DNA deple-tion significantly lowered glutathione reductase activity,glutathione (GSH) content, and consistently altered theGSH2 : oxidized glutathione ratio in all of the q0 cell lines,albeit to differing extents, indicating themost oxidized redoxstate in bone q0 cells. Activity, as well as gene expression andprotein content, of superoxide dismutase showed a decreasein bone andmuscle q0 cell lines but not in lung q0 cells. GSHperoxidase activity was four times higher in all three q0 celllines in comparison to the parental q+, suggesting thatthis may be a necessary adaptation for survival without a
functional respiratory chain. Taken together, these datasuggest that the lack of respiratory chain prompts the cells toreduce their need for antioxidant defences in a tissue-specificmanner, exposing them to amajor risk of oxidative injury. Infact bone-derived q0 cells displayed the highest steady-statelevel of intracellular ROS (measured directly by 2¢,7¢-di-chlorofluorescin, or indirectly by aconitase activity) com-pared to all the other q+and q0 cells, both in the presence orabsence of glucose. Analysis of mitochondrial and cytosolic/iron regulatory protein-1 aconitase indicated that mostROS of bone q0 cells originate from sources other thanmitochondria.
Keywords: A549 q0 cells; antioxidant defences; 143 q0 cells;reactive oxygen species; rhabdomyosarcoma q0 cells.
Cellular reactive oxygen species (ROS), such as superoxideanions (OÆ �
2 )1 , and hydrogen peroxide (H2O2), have longbeen held to be harmful by-products of life in an aerobicenvironment. ROS are potentially toxic because they arehighly reactive and modify several types of cellular macro-molecules. Lipid, protein and DNA damage can lead to
cytotoxicity and mutagenesis [1]. Therefore, cells haveevolved elaborate defence systems to counteract the effectsof ROS. These include both nonenzymatic (glutathione,pyridine nucleotides, ascorbate, retinoic acid, thioredoxinand tocopherol) and enzymatic (such as superoxide dis-mutases, catalase, glutathione peroxidase and peroxi-redoxin) pathways, which limit the rate of oxidation andthereby protect cells from oxidative stress [1,2]. Notwith-standing, evidence is emerging that ROS also act as signalsor mediators in many cellular processes, such as cell pro-liferation, differentiation, apoptosis, and senescence [3–5].The redox environment of a cell may alter the balancebetween apoptosis and mitosis by affecting gene expressionand enzyme activity [6]. Consequently, cellular redox state isincreasingly accepted as a key mediator of multiple meta-bolic, signalling and transcriptional pathways essential fornormal function and cell survival or programmed cell death[3–6].
Mitochondria are certainly the major cellular site foroxygen reduction and hence the site with the greatestpotential for ROS formation. An estimated 0.4–0.8% [7]to 2–4% [8] of the total oxygen consumed during electrontransport is reduced not to water by cytochrome c oxidasebut rather to superoxide by complexes I, and III of therespiratory chain [1,7,8]. ROS production increases whenrespiratory flux is depressed by a high ATP/ADP ratio,high electronegativity of auto-oxidizable redox carriers in
Correspondence to L. Vergani, Dipartimento di Scienze Neurologiche,
Universita di Padova, c/o Istituto Veneto di Medicina Molecolare,
Via Orus 2, 35129 Padova, Italy. Fax: +39 049 7923271,
Tel.: +39 049 7923219, E-mail: [email protected]
Abbreviations: CS, citrate synthase; CuZnSOD, copper zinc super-
oxide dismutase; DCF, 2¢,7¢-dichlorofluorescin; DTT, 1,4-dithio-DL-
threitol; GSH, glutathione; GSSG, oxidized glutathione; GPx, GSH
peroxidase; GR, GSSG reductase; GST, GSH transferase; H2-DCF-
DA, 2¢,7¢-dichlorofluorescin-diacetate; IRP-1, iron regulatory protein-
1; LDH, lactate dehydrogenase;MFI, mean log fluorescence intensity;
MnSOD, manganese superoxide dismutase; MPA, metaphosphoric
acid; mt, mitochondrial; NBT, nitroblue tetrazolium; PMRS, plasma
membrane oxidoreductase system; PBN, N-tert-butyl-a-phenyl-nitrone; ROS, reactive oxygen species; SOD, superoxide dismutase.
Enzymes: catalase (EC 1.11.1.6); GSH peroxidase (EC 1.11.1.9);
GSSG reductase (EC 1.8.1.7); GSH transferase (EC 2.5.1.18); Mn
superoxide dismutase, CuZn superoxide dismutase, superoxide
dismutase (EC 1.15.1.1).
(Received 26 April 2004, revised 16 July 2004, accepted 23 July 2004)
Eur. J. Biochem. 271, 3646–3656 (2004) � FEBS 2004 doi:10.1111/j.1432-1033.2004.04298.x

complex I and III, or a rise in oxygen tension (state 4respiration). Defects in respiratory complexes [9] andnormal aging [10] also lead to increased mitochondrialROS production. A recent study [11] indicates thatmitochondrial ROS homeostasis plays a key role in thelife and death of eukaryotic cells, as mitochondria notonly respond to ROS but also release ROS in response toa number of pro-apoptotic stimuli. However, mitochon-dria are not the sole source of cellular ROS. ROS alsoform in the cytosol and in peroxisomes as by-products ofspecific oxidases [7,10]. The plasma membrane oxido-reductase system (PMRS) also influences cellular redoxstate [12,13].
Mitochondria are partially autonomous organelles; theypossess DNA, which contributes essential proteins to theoxidative phosphorylation system. In vitro mammaliancells can be depleted entirely of their mitochondrial DNA,creating so-called q0 cells [14,15]. Rho0 cells lack afunctional electron transport chain and appear incapableof generating ATP from mitochondria. Moreover, it is stilla debated question [16] whether or not q0 cells maygenerate ROS at the mitochondrial level. Therefore, q0
cells may require alternative mechanisms for energy supplyand for maintenance of an appropriate redox environment[17,18]. Analysis of q0 cells has provided insights intooxygen metabolism [13,17,19–21] and the role of mito-chondria in redox signalling during apoptosis [22,23].Redox-sensitive signalling and sensitivity to oxidativestress depend on the cell type and its antioxidant systems,due to differential tissue expression of nuclear genes [24].There are no reports that compare antioxidant defencesand ROS homeostasis between mitochondrial (mt)DNA-depleted cells with different nuclear backgrounds. In thisstudy, soluble and enzymatic antioxidant systems andROS steady-state level were characterized in three tumourcell lines derived from bone (osteosarcoma, 143B), muscle(rhabdomyosarcoma, RD) and lung (adenocarcinoma,A549) and in the respective q0 cells: 143Bq0 (bone), RDq0
(muscle) and A549q0 (lung) cells. This approach wasundertaken to investigate the effect of the absence ofelectron transport chain on cellular redox homeostasis,with the hypothesis that ROS levels could be altered inconsequence of the ablation of an efficient respiratorychain. We aimed to verify: (a) if q0 status requiresantioxidant defence systems as efficient as those of normalq+ cells; (b) if nuclear background influences redoxhomeostatis in the different cell lines, precursors ofcytoplasmic hybrids (cybrids), that are useful tool forstudies of mtDNA segregation [25,26].
Experimental procedures
Materials
All reagents and enzymes were from Sigma. NaCl/Pi fromOxoid had the following composition: NaCl 8 gÆL)1, KCl0.2 gÆL)1, Na2HPO4 1.15 gÆL)1 and KH2PO4 0.2 gÆL)1
(pH 7.3). Tissue culture reagents were purchased fromGibco-Invitrogen Co. Reverse transcription was performedusing the Stratascript enzyme (Stratagene). 2¢,7¢-Dichloro-fluorescin-diacetate (H2-DCF-DA) was from MolecularProbes.
Cell lines and culture conditions
The q+ wild-type osteosarcoma cells (143B) and the q0 cellsderived from 143B were a gift from G. Attardi (Division ofBiology, California Institute of Technology, Pasadena, CA,USA)2 [14], RD and RDq0 cells were established by Verganiet al. [27], lung carcinoma (A549) and the derived q0 cellswere a gift from I. J. Holt (MRC, Dunn Human NutritionUnit, Cambridge, UK)3 [25]. The cells were grown inDulbecco’s modified Eagle’s medium containing 4.5 gÆL)1
glucose, 110 mgÆL)1 pyruvate, supplemented with 10%(v/v)4 fetal bovine serum, 100 unitsÆmL)1 penicillin, and0.1 mgÆmL)1 streptomycin, at 37 �C in a humidified atmo-sphere of 5%CO2. Themedium for q0 cells was additionallysupplemented with 50 lgÆmL)1 uridine. The absence ofmtDNA in these three cell lines was reconfirmed at severaltime points throughout the study by PCR as describedpreviously [14,25,27]. Routinely, 2 · 106 q+ or q0 cellswere seeded on 100 mm diameter plates and harvested after42–48 h of culture during the period of exponential growth.
Subcellular fraction preparation
In some experiments regarding aconitase reactivation (seebelow), 40 · 106 cells suspended in 0.8 mL were treatedwith digitonin (0.5 mgÆmL)1) in NaCl/Pi for 15 min on ice.The samples were centrifuged at 17 000 g for 15 min at4 �C, the supernatant (cytosolic fraction) and the pellet(mitochondria-enriched fraction), as well as the whole cells,were recovered, immediately frozen in liquid N2 and storedat )80 �C. Aliquots, kept at )80 �C for up to 2 weeks, werethawed immediately before the assay, as reported previously[28]. As markers of cytosolic and mitochondria-enrichedfractions, lactate dehydrogenase (LDH) [29] and citratesynthase (CS) [30] activities were assayed in total cells and incytosolic and mitochondria-enriched fractions, respectively.In mitochondria-enriched fractions CS activity was twicethe value found in the whole cells, whereas cytosoliccontamination, checked by measuring LDH, ranged from10 to 30%. In the cytosolic fractions the contamination ofmitochondria, checked bymeasuring CS activity, was about10% of the value found in whole cells.
Antioxidant defences
Glutathione and oxidized glutathione amounts. Cellularglutathione (GSH) and oxidized glutathione (GSSG) levelswere measured enzymatically by using a modification of theprocedure of Anderson, as described [31,32]. The assay isbased on the determination of a chromophoric product,2-nitro-5-thiobenzoic acid, resulting from the reaction of5,5¢-dithiobis-(2-nitrobenzoic acid) with GSH. In thisreaction, GSH is oxidized to GSSG, which is thenreconverted toGSH in the presence of glutathione reductaseand NADPH. The rate of 2-nitro-5-thiobenzoic acidformation is measured spectrophotometrically at 412 nm.The cells (about 5–6 · 106 cells) were washed once withNaCl/Pi and treated with 6% (v/v) metaphosphoric acid(MPA) (1 mLÆdish)1) at room temperature. After 10 minthe acid extract was collected, centrifuged for 5 min at18 000 g at 4 �C and processed. The cellular debrisremaining on the plate were solubilized with 0.5 M KOH
� FEBS 2004 Homeostasis of ROS in q0 cells (Eur. J. Biochem. 271) 3647

and assayed for their protein content [33]. For totalglutathione determination, the above acid extract wasdiluted (1 : 6) in 6% (v/v) MPA; thereafter to 0.1 mL ofsupernatant, 0.75 mL 0.1 M potassium phosphate, 5 mM
EDTA buffer pH 7.4, 0.05 mL 10 mM 5,5¢-dithiobis-2-nitrobenzoic acid (prepared in 0.1 M phosphate buffer) and0.08 mL 5 mM NADPH were added. After a 3 minequilibration period at 25 �C, the reaction was started bythe addition of 2 U glutathione reductase (type III, Sigma,from bakers yeast, diluted in 0.1 M phosphate/EDTAbuffer). Product formation was recorded continuously at412 nm (for 3 min at 25 �C) with a Shimadzu UV-160spectrophotometer. The total amount of GSH in thesamples was determined from a standard curve obtainedby plotting known amounts (from 0.05 to 0.4 lgÆmL)1) ofGSH vs. the rate of change of absorbance at 412 nm. GSHstandards were prepared daily in 6% (v/v)MPA and dilutedin phosphate/EDTA buffer pH 7.4. For GSSG measure-ment, soon after preparation the supernatant of acid extractwas treated for derivatization with 2-vinylpiridine at roomtemperature for 60 min. In a typical experiment, 0.15 mL ofsupernatant was treated with 3 lL of undiluted 2-vinyl-pyridine. Nine microliters of triethanolamine were alsoadded, the mixture was vigorously mixed, and the pH waschecked; it was generally between 6 and 7. After 60 min,0.1 mL aliquots of the samples were assayed by means ofthe procedure described above for total GSHmeasurement.The amount of GSSGwas quantified from a standard curveobtained by plotting known amounts of GSSG (from 0.05to 0.20 lgÆmL)1) vs. the rate of change of absorbance. GSHpresent in the samples was calculated as the differencebetween total glutathione and GSSG levels.
Antioxidant enzyme activities. GSH peroxidase (GPx),GSSG reductase (GR), catalase, superoxide dismutase(SOD) andGSH transferase (GST) activities weremeasuredin monolayer cells (about 2–3 · 106 cells), washed threetimes with NaCl/Pi before treatment directly on the dishwith 0.25 M sucrose, 10 mM Tris/HCl pH 7.5, 1 mM
EDTA, 0.5 mM phenylmethanesulfonyl fluoride, 0.5 mM
1,4-dithio-DL-threitol (DTT) and 0.1% (v/v) Nonidet(named solution A), to obtain complete lysis of intracellularorganelles. Cells were then scraped from the plate and thesamples were centrifuged for 30 min at 105 000 g. Proteincontent measurements [33] and enzymatic assays werecarried out on the clear supernatant fractions.
Total GPx activity was measured according to thecoupled enzyme procedure with glutathione reductase, asdescribed [34], using cumene hydroperoxide as substrate.The enzymatic activity was monitored by following thedisappearance of NADPH at 340 nm for 3 min at 25 �C.The incubation medium (final volume 1 mL) had thecomposition 50 mM KH2PO4 pH 7.0, 3 mM EDTA, 1 mM
KCN, 1 mM GSH, 0.1 mM NADPH, 2 U glutathionereductase and� 300 lg protein. After a 3 min equilibrationperiod at 25 �C, the reaction was started by the addition of0.1 mM cumene hydroperoxide dissolved in ethanol. Thespecific activity was calculated by using an extinction molarcoefficient obtained by a standard curve of NADPHbetween 0.02 and 0.1 lmolesÆmL)1 and GPx activitywas expressed in nmoles NADPH consumedÆmgprotein)1Æmin)1.
GR activity was measured according to the method ofCarlberg & Mannervik [35], by following the rate ofoxidation of NADPH by GSSG at 340 nm for 3 min at25 �C. The reaction mixture (final volume 1 mL) contained0.1 M KH2PO4 pH 7.6, 0.5 mM EDTA, 1 mM GSSG,0.1 mMNADPH,and� 300 lgprotein.The specific activitywas calculated by using an extinction molar coefficientobtained by a standard curve of NADPH between 0.02 and0.1 lmolesÆmL)1 and GR activity was expressed in nmolesNADPH consumedÆmg protein)1Æmin)1.
Total catalase activity was assayed according to themethod of Aebi [36]. Activity was measured by monitoring,for 30 s at 25 �C, the decomposition of 10 mM H2O2 at240 nm in a medium (final volume 1 mL) consisting of50 mM phosphate buffer pH 7.0 and � 100 lg proteins.Catalase activity was expressed as unitsÆmg protein)1,assuming that 1 unit of catalase decomposes 1 lmole ofH2O2Æmin)1.
For SOD activity assay a 0.6 mL aliquot of cell lysatewas sonicated on ice (2 · 30 s) and centrifuged for 30 minat 105 000 g. The supernatant was collected and dialysedovernight in cold double-distilled water5 to remove smallinterference substances [37]. Enzymatic assays were carriedout according to the method of Oberlay & Spitz [38], withminor modifications. Briefly, in 1 mL 50 mM KH2PO4
pH 7.8 and 0.1 mM EDTA, a superoxide-generating sys-tem (0.15 mM xanthine plus 0.02 U xanthine oxidase) wasused together with 50 lM nitroblue tetrazolium (NBT) tomonitor superoxide formation by following the changes incolorimetric absorbance at 560 nm for 5 min at 25 �C. Thecatalytic activities of the samples were evaluated as theirability to inhibit the rate of NBT reduction; increasingamounts of proteins (5–150 lg) were added to each sampleuntil maximum inhibition was obtained. SOD activity wasexpressed as unitsÆmg protein)1, with 1 unit of SODactivity being defined as the amount of proteins causinghalf-maximal inhibition of the rate of NBT reduction.
GST activity was assayed in the supernatant of celllysates, as described [39]. Briefly, 150 lg protein wereincubated in 50 mM KH2PO4 pH 6.5, 1 mM GSH and0.25 mM 1-chloro-2,4-dinitrobenzene. The reaction wasfollowed for 2 min at 37 �C at 340 nm, and GST activitywas calculated using an extinction coefficient of9.6 mM
)1Æcm)1 [39].
Reverse transcription and quantitative PCR
RNA (5 lg) was reverse transcribed to cDNA usingrandom hexamer primers and the Stratascript enzyme.Quantitative PCR was performed using an MX3000pthermal cycler system and Brilliant� SYBERGreen QPCRMaster Mix (Stratagene). The conditions for the amplifica-tion of copper zinc superoxide dismutase (CuZnSOD),manganese superoxide dismutase (MnSOD) and the nor-malization gene, ribosomal 36B4, were as follows. Onedenaturation step at 90 �C for 10 min, 40 cycles consistingof denaturation at 90 �C for 30 s, annealing at 56 �C for60 s for CuZnSOD and MnSOD and 60 �C for 36B4,elongation at 72 �C for 60 s. At the end of the PCR thesamples were subjected to melting curve analysis. Allreactions were performed in triplicate. The primersequences were CuZnSOD [40], sense 5¢-GCGACGAAG
3648 L. Vergani et al. (Eur. J. Biochem. 271) � FEBS 2004
GCCGTGTGCGTGC-3¢, antisense 5¢-ACTTTCTTCATTTCCACCTTTGCC-3¢; MnSOD [40], sense 5¢-CTTCAGCCTGCACTGAAGTTCAAT-3¢, antisense 5¢-CTGAAGGTAGTAAGCGTGCTCCC-3¢; 36B4, sense 5¢-GTGATGTGCAGCTGATCAAGACT-3¢, antisense 5¢-GATGACCAGCCCAAAGGAGA-3¢.
Western blot analysis
Cells were lysed in the same buffer as used for the enzymeactivity assay. An equal amount of protein (40 lgÆlane)1)for each sample was separated by SDS/PAGE (12%acrylamide) and transferred to nitrocellulose membrane.The membrane was blocked in 5% (w/v) nonfat dry milk in
60.02 M Tris/HCl pH 7.5, 0.137 M NaCl, and 0.1% (v/v)Tween-20 for 3 h at room temperature. After overnightincubation at 4 �C in 1 : 1000 of primary antibodiesto CuZnSOD (Santa Crutz) or MnSOD (Stressgen Bio-technology), membranes were probed with horseradishperoxidase-conjugated secondary antibody (AmershamBiosciences). Bound antibody was visualized using anECL reagent (Amersham Biosciences). Densitometric ana-lysis of Western blot signal was performed using IMAGE-MASTER VDS-CL (Amersham Pharmacia Biotech) andIMAGE-MASTER TOTALLAB v1.11 software.
ROS measurement
Aconitase determination. Aconitase activity was measuredas described previously [41] on 1 · 106 cells or on thesubcellular fractions obtained as reported above. Thesamples were dissolved in 0.1% (v/v) Triton X-100 andincubated for 15 min at 30 �C in 50 mM Tris/HCl pH 7.4,0.6 mM MgCl2, 0.4 mM NADP, 5 mM Na citrate. To startthe assay, 2 U isocitrate dehydrogenase were addedand activity was measured by monitoring absorbance at340 nm for 15 min. Reactivation of aconitase wasobtained by adding 50 lM DTT, 20 lM Na2S and 20 lMFe(NH4)2(SO4)2 directly into the cuvette, just beforespectrophotometric determination [41].
DCF fluorescence. Direct detection of intracellular steady-state levels of ROSwas carried out on living cells using 2¢,7¢-dichlorofluorescin-diacetate (H2-DCF-DA) [42–44]. Theprobe is de-acetylated inside the cell. The subsequentoxidation by intracellular oxidants yields a fluorescentproduct, 2¢,7¢-dichlorofluorescin (DCF). Cells were collectedby trypsinization and centrifuged for 5 min at 800 g. Thepellet was incubated in tissue-culture medium with 5 lMH2-DCF-DA for 30 min at 37 �C. Cells were washed andthen suspended (1 · 106 per mL) in medium (standardgrowth conditions) or in NaCl/Pi for 90 min (stressconditions). A FACSCalibur analyser (Becton-DickinsonImmunocytometry Systems) equipped with a 488 Argonlaser was used for measurements of intracellular fluores-cence. Dead cells were excluded by electronically gating dataon the basis of forward- vs. side-scatter profiles; a minimumof 1 · 104 cells of interest were analysed further. Logarith-mic detectors were used for the FL-1 fluorescence channelnecessary for DCF detection. Mean log fluorescenceintensity (MFI) values were obtained by the CELLQUEST
software program (Becton-Dickinson).
Results
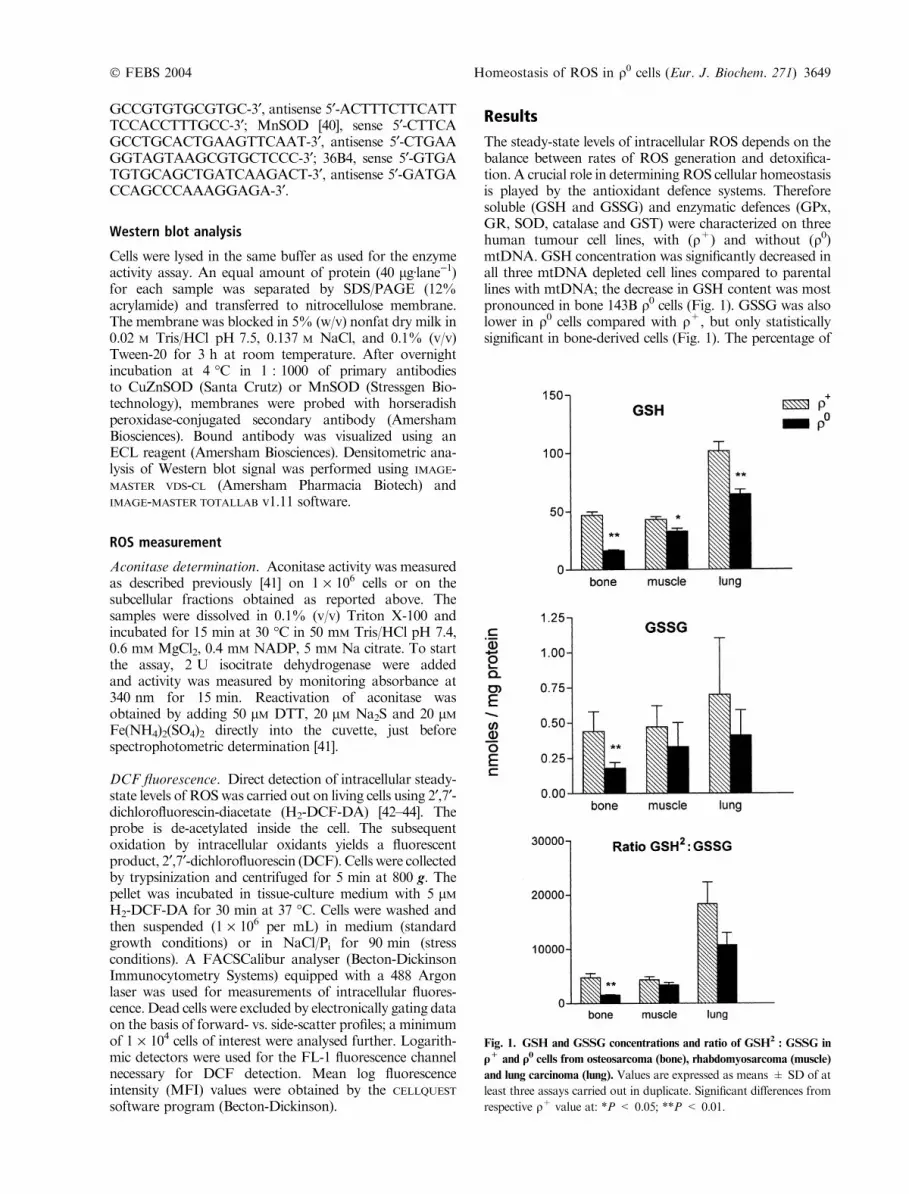
The steady-state levels of intracellular ROS depends on thebalance between rates of ROS generation and detoxifica-tion. A crucial role in determining ROS cellular homeostasisis played by the antioxidant defence systems. Thereforesoluble (GSH and GSSG) and enzymatic defences (GPx,GR, SOD, catalase and GST) were characterized on threehuman tumour cell lines, with (q+) and without (q0)mtDNA. GSH concentration was significantly decreased inall three mtDNA depleted cell lines compared to parentallines with mtDNA; the decrease in GSH content was mostpronounced in bone 143B q0 cells (Fig. 1). GSSG was alsolower in q0 cells compared with q+, but only statisticallysignificant in bone-derived cells (Fig. 1). The percentage of
Fig. 1. GSH and GSSG concentrations and ratio of GSH2: GSSG in
q+ and q0 cells from osteosarcoma (bone), rhabdomyosarcoma (muscle)
and lung carcinoma (lung). Values are expressed as means ± SD of at
least three assays carried out in duplicate. Significant differences from
respective q+ value at: *P < 0.05; **P < 0.01.
� FEBS 2004 Homeostasis of ROS in q0 cells (Eur. J. Biochem. 271) 3649
mitochondrial GSH in respect to total GSH was similar inall tested q+ and q0 cell lines, ranging from 2.7 to 5% (datanot shown). To assess the cellular redox state we measuredtheGSH2 : GSSG ratio which is considered a good index ofthis parameter [45]. MtDNA loss was associated with analteration in this ratio with q0 cells having a more oxidizedredox state than q+ cells. However the change wasstatistically significant only in bone-derived q0 cells. More-over, the different values found in bone, muscle and lung q0
cells were all significantly different (P < 0.05) from eachother; in fact theGSH2 : GSSG ratio of bone 143Bq0 cells isabout one-half of that in muscle RDq0 cells and even threeto four times lower than that measured in lung A549q0 cells.
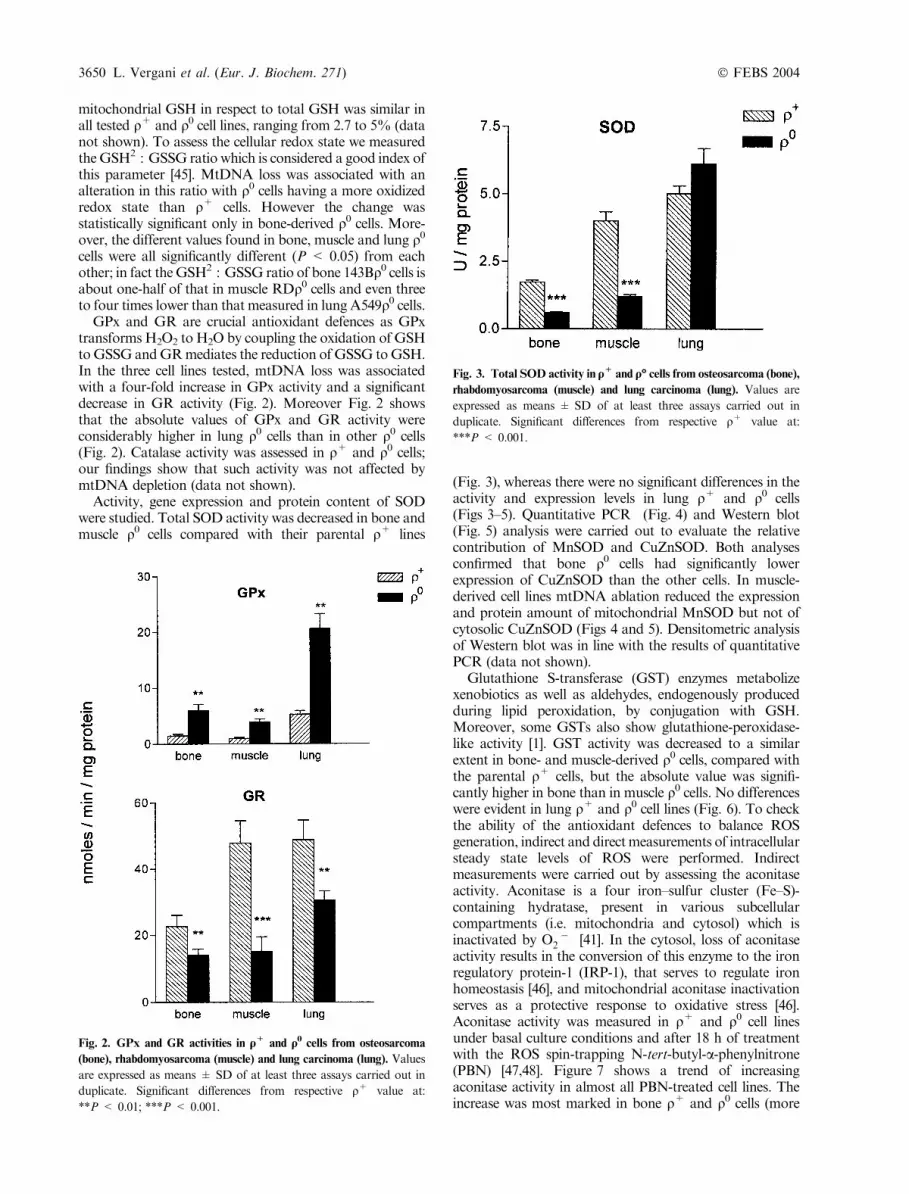
GPx and GR are crucial antioxidant defences as GPxtransforms H2O2 to H2O by coupling the oxidation of GSHtoGSSG andGRmediates the reduction of GSSG toGSH.In the three cell lines tested, mtDNA loss was associatedwith a four-fold increase in GPx activity and a significantdecrease in GR activity (Fig. 2). Moreover Fig. 2 showsthat the absolute values of GPx and GR activity wereconsiderably higher in lung q0 cells than in other q0 cells(Fig. 2). Catalase activity was assessed in q+ and q0 cells;our findings show that such activity was not affected bymtDNA depletion (data not shown).
Activity, gene expression and protein content of SODwere studied. Total SOD activity was decreased in bone andmuscle q0 cells compared with their parental q+ lines
(Fig. 3), whereas there were no significant differences in theactivity and expression levels in lung q+ and q0 cells(Figs 3–5). Quantitative PCR (Fig. 4) and Western blot(Fig. 5) analysis were carried out to evaluate the relativecontribution of MnSOD and CuZnSOD. Both analysesconfirmed that bone q0 cells had significantly lowerexpression of CuZnSOD than the other cells. In muscle-derived cell lines mtDNA ablation reduced the expressionand protein amount of mitochondrial MnSOD but not ofcytosolic CuZnSOD (Figs 4 and 5). Densitometric analysisof Western blot was in line with the results of quantitativePCR (data not shown).
Glutathione S-transferase (GST) enzymes metabolizexenobiotics as well as aldehydes, endogenously producedduring lipid peroxidation, by conjugation with GSH.Moreover, some GSTs also show glutathione-peroxidase-like activity [1]. GST activity was decreased to a similarextent in bone- and muscle-derived q0 cells, compared withthe parental q+ cells, but the absolute value was signifi-cantly higher in bone than in muscle q0 cells. No differenceswere evident in lung q+ and q0 cell lines (Fig. 6). To checkthe ability of the antioxidant defences to balance ROSgeneration, indirect and directmeasurements of intracellularsteady state levels of ROS were performed. Indirectmeasurements were carried out by assessing the aconitaseactivity. Aconitase is a four iron–sulfur cluster (Fe–S)-containing hydratase, present in various subcellularcompartments (i.e. mitochondria and cytosol) which isinactivated by OÆ �
2 [41]. In the cytosol, loss of aconitaseactivity results in the conversion of this enzyme to the ironregulatory protein-1 (IRP-1), that serves to regulate ironhomeostasis [46], and mitochondrial aconitase inactivationserves as a protective response to oxidative stress [46].Aconitase activity was measured in q+ and q0 cell linesunder basal culture conditions and after 18 h of treatmentwith the ROS spin-trapping N-tert-butyl-a-phenylnitrone(PBN) [47,48]. Figure 7 shows a trend of increasingaconitase activity in almost all PBN-treated cell lines. Theincrease was most marked in bone q+ and q0 cells (more
Fig. 2. GPx and GR activities in q+ and q0 cells from osteosarcoma
(bone), rhabdomyosarcoma (muscle) and lung carcinoma (lung). Values
are expressed as means ± SD of at least three assays carried out in
duplicate. Significant differences from respective q+ value at:
**P < 0.01; ***P < 0.001.
Fig. 3. Total SOD activity in q+ and q� cells from osteosarcoma (bone),
rhabdomyosarcoma (muscle) and lung carcinoma (lung). Values are
expressed as means ± SD of at least three assays carried out in
duplicate. Significant differences from respective q+ value at:
***P < 0.001.
3650 L. Vergani et al. (Eur. J. Biochem. 271) � FEBS 2004

than five-fold) and in muscle q0 cells, suggesting that theOÆ �
2 level was higher in these cells than in lung q0 cells.Both mitochondrial [28,46] and cytosolic IRP-1/aconitaseactivities [46] are reactivated in the presence of reducingagents and free Fe2+ carrier–donor [41]. Therefore, in anattempt to localize OÆ �
2 production, we assessed aconitasereactivation in these subcellular fractions. Reactivatedaconitase showed a dramatic increase in cytosolic fractionsof bone q0 cells (Fig. 8), whereas in mitochondria-enrichedfractions there were no significant differences.
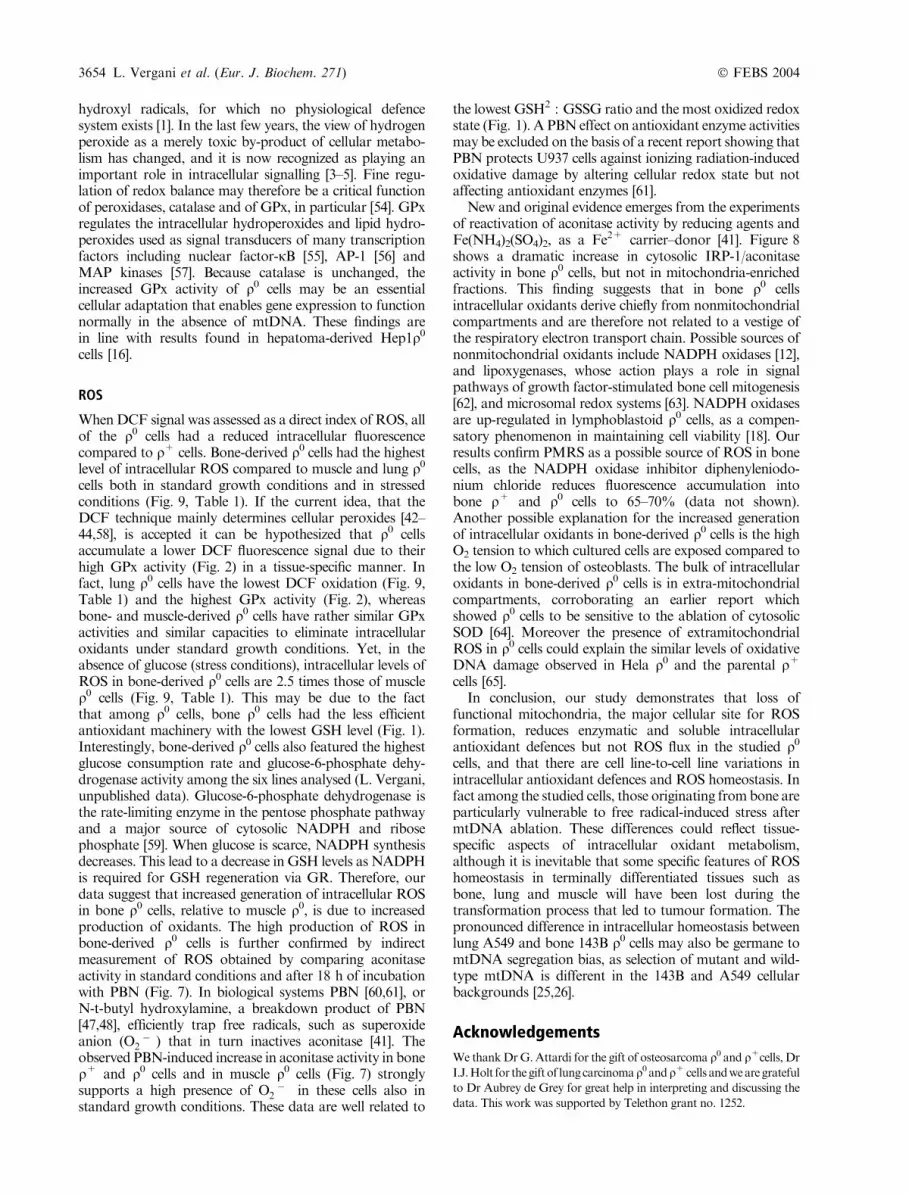
Lastly, by means of the DCF technique coupled to flowcytometric analysis, intracellular fluorescence was measuredas an index of steady-state levels of ROS under basal andstress conditions (Fig. 9, Table 1). In the presence of glucoseand 10% serum (standard growth conditions), the fluores-cence measured in q0 cells was lower than that in theparental cell lines containing mtDNA. The decrease wassubstantial in lung (90%) and muscle (40%) cells but wasless evident in bone (less than one-third) (Table 1). Whenthe cells were incubated in NaCl/Pi for 90 min, theintracellular fluorescence signal dramatically increased inall cases (Fig. 9, Table 1). The increases, in comparison tothe signals observed in standard growth conditions, were
consistently greater in q0 than in q+ cells, yet the extent ofthe increase varied considerably between the three q0 lines.In bone and lung q0 cells the increases were 17- and 39-fold,respectively. However only in bone q0 cells was DCFoxidation significantly higher compared to the value of therespective q+ cell line (Table 1).
Discussion
Our analysis of three pairs of q+ and q0 cells, derived frombone, muscle and lung, indicates that these cells differsignificantly both in their antioxidant defences and intra-cellular ROS homeostasis. The antioxidant system is
Fig. 5. Western blotting analysis of CuZnSOD andMnSOD in q+ and
q0 cells from osteosarcoma (bone), rhabdomyosarcoma (muscle) and lung
carcinoma (lung). Total cell extract was resolved by SDS/PAGE and
blotted onto nitrocellulose. The membrane was cut in strips, corres-
ponding to the different molecular masses of MnSOD, CuZnSOD and
actin, the last acting as an internal standard, and incubated with the
corresponding antibody. Forty micrograms of cell protein extract was
loaded in each lane. The blots depicted are representative of three
separate experiments.
Fig. 6. GST activity in q+ and q0 cells from osteosarcoma (bone),
rhabdomyosarcoma (muscle) and lung carcinoma (lung). Values are ex-
pressed as means ± SD of at least three assays carried out in dupli-
cate. Significant differences from respective q+ value at: **P < 0.01.
Fig. 4. Quantitative real-time PCR of CuZnSOD and MnSOD in q+
and q0 cells from osteosarcoma (bone), rhabdomyosarcoma (muscle) and
lung carcinoma (lung). mRNA values of CuZnSOD and MnSOD are
normalized for ribosomal 36B4 gene and are expressed as
means ± SD of three assays in triplicate in arbitrary units (A.U.).
Significant differences from respective q+ value at: *P < 0.05.
� FEBS 2004 Homeostasis of ROS in q0 cells (Eur. J. Biochem. 271) 3651

profoundly affected by mtDNA depletion in a tissuespecific-manner, probably as a response to a decreasedneed of efficient antioxidant machinery.
Antioxidant defences of parental q+ cell lines
The parental (q+) A549 cells, derived from type II humanalveolar epithelial cells [49], are provided with the highestGSH content and GSH2 : GSSG ratio (Fig. 1), and thehighest GPx, GR (Fig. 2) and SOD (Fig. 3) activities incomparison with bone and muscle derived q+ cells. Thisvery efficient ROS defence systemmay be related to the highoxygen tension normally present in the lung and explainsthe great resistance of these cells to apoptosis, after exposureto high oxygen concentrations [50]. By contrast, bone(143B)- and muscle derived (RD)- cells are similar in theirlow content of GSH (only one-half of that present in A549)and poor GPx activity (Figs 1 and 2); however, RD cellsdiffer significantly in GR activity and in particular inactivity, gene expression and protein content of SOD(Figs 3–5).
Antioxidant defences of q0 cell lines
GSH-GSSG and GR. We measured GSH and GSSG inexponentially growing cells, as GSH content changes in thegrowth and lag phases [51]. In all q0 cells studied, GSH wassignificantly lower than in the respective parental cells, withthe lowestGSH level in bone-derived q0 cells, and significantdifferences in the GSH2 : GSSG ratios among the differentq0 cells (Fig. 1). The intracellular content of GSH is theresult of balance between its synthesis and consumption.GSH synthesis is a two-step ATP-requiring process cata-lysed by cytosolic c-glutamylcysteine synthetase (c-GCS)and GSH synthetase and is regulated (feedback-inhibited)by GSH itself [52]. We neither directly measured these
activities in our q0 cells nor did we find reports on this topicin the literature, but we did find a very low amount of ATP(data not shown) in all of the q0 cells compared with therespective parental q+ cells. The smaller GSH pool in q0
cells (reducedGSH andGSSG) suggests that it could be dueto reduced synthesis rather than to enhanced utilization incells with low amounts of ATP. In fact if the lower level ofGSH in q0 cells was due to its extensive consumption in theGPx pathway or to a direct interaction with ROS, weshould find increased GSSG. In our experimental condi-tions we found that GSSG levels in all q0 cell lines were notincreased, but rather decreased, although GR activity wassignificantly decreased in all q0 cells (Fig. 2). However, itcannot be excluded that GSSG is actively secreted from thecells subjected to an oxidative stress [52]7 in an attempt tomaintain cellular redox environment [45]. Therefore ourdata could indicate that mtDNA-depleted cells need less
Fig. 8. Aconitase reactivation. Aconitase activity was assayed in mit-
ochondrial and cytosolic fractions of q+ and q0 from osteosarcoma
(bone), rhabdomyosarcoma (muscle) and lung carcinoma (lung).
Reactivation was achieved in presence of reducing agents (DTT) and
Fe2+ carrier–donor [Fe(NH4)2(SO4)2], as described in Experimental
procedures, and is expressed as percentage of basal value. Basal values
(nmolesÆmin)1Æmg protein)1) of mitochondrial aconitase activity were:
in bone q+ ¼ 3.26 ± 1.87 (4); bone q0 ¼ 2.36 ± 0.93 (4); muscle
q+ ¼ 8.77 ± 0.57 (3); muscle q0 ¼ 2.08 ± 0.19 (3); lung q+ ¼8.46 ± 4.12 (3); lung q0 ¼ 4.88 ± 0.59 (3). Basal cytosolic aconitase
in bone q+ ¼ 1.64 ± 0.57 (4); bone q0 ¼ 2.81 ± 1.12 (4); muscle
q+ ¼ 0.76 ± 0.29 (3); muscle q0 ¼ 1.26 ± 0.53 (3); lung q+ ¼4.79 ± 0.6 (3); lung q0 ¼ 4.59 ± 2.27 (3). Significant differences from
respective q+ value at: *P < 0.05, **P < 0.01.
Fig. 7. Aconitase activity in whole cells in absence (–) and presence (+)
of PBN. Rho+ and q0 cells from osteosarcoma (bone), rhabdomyo-
sarcoma (muscle) and lung carcinoma (lung) were cultured in the ab-
sence (–) or the presence (+) of 500 lM PBN for 18 h. Aconitase
activity were assayed spectrophotometrically in cell lysate. Values are
expressed as means ± SD of at least three assays in duplicate as
nmolesÆmin)1Æmg)1 protein. –PBN value significantly different from
+PBN value at: *P < 0.05; **P < 0.01; ***P < 0.001.
3652 L. Vergani et al. (Eur. J. Biochem. 271) � FEBS 2004

anti-ROS buffer in the form of GSH for loss of ROSmitochondrial fluctuation and of ROS spike, occurringwhen the respiratory chain is active.8
SOD, GST, GPx and catalase
With the exception of catalase and GPx activity, depletionof mtDNA diminished SOD and GST activities in bone-and muscle-derived q0 cells but not in lung-derived q0 cells(Figs 3–6), where SOD (Figs 3–5) and GST (Fig. 6) wereunaffected after ablation of the respiratory chain. In boneand muscle q0 cells SOD activity decreased (Fig. 3) ascompared with the respective parental q+ cells. Expressionlevel analysis revealed that in bone q0 cells CuZnSODmRNA (Fig. 4) and protein content were decreased(Fig. 5), whereas in muscle q0 cells MnSOD decreased inmRNA and protein amount compared with parental cells(Figs 4 and 5). The decrease of SOD and GST antioxidantenzymes in bone andmuscle but not in lung q0 cellsmight beascribed to different expression–regulation of nuclear genesas a response to cell type differential redox-sensitivesignalling [53].
Catalase activity is unaffected by mtDNA depletion(data not shown) and, interestingly, the activity of GPxwas found to be considerably increased in all q0 cellsrelative to the parental cells (Fig. 2). GPx, together withcatalase and thioredoxin peroxidase, restricts H2O2 accu-mulation and the consequent production of highly reactive
Bone
Muscle
Lung
BlankStandard growth conditionStressed condition
100 101 102 103 104
100 101 102 103 104
100 101 102 103 104 100 101 102 103 104
100 101 102 103 104
100 101 102 103 104
FL1-H
FL1-H
FL1-HFL1-H
FL1-H
FL1-H
020
4060
8010
00
3060
9012
015
018
00
2040
6080
100
020
4060
8010
00
2040
6080
100
020
4060
8010
0
Co
un
tsC
ou
nts
Co
un
ts
Co
un
tsC
ou
nts
Co
un
ts
ρ+ ρ0
Fig. 9. DCF oxidation in cells with and without glucose. Rho+ and q0 cells from osteosarcoma (bone), rhabdomyosarcoma (muscle), and lung
carcinoma (lung) were collected and loaded with H2-DCF-DA. Fluorimetric signals of oxidized DCF (excitation, 488 nm; emission, 530 nm) were
recorded by cytofluorimeter from cells in presence of glucose (dotted line): standard growth conditions or in absence of glucose (bold line): stressed
conditions. Blank signal, obtained from cells without H2-DCF-DA, was deducted to the reported MFI values. The panels are representative of the
separate experiments summarized in Table 1.
Table 1. Levels of DCF oxidation in q+ and q0 cells from osteosarcoma
(bone), rhabdomyosarcoma (muscle) and lung carcinoma (lung).MFI of
the DCF signal was measured by fluorescence activated cell sorting as
arbitrary units in cells in presence of glucose (standard growth con-
ditions) and in absence of glucose (stress conditions). Values are ex-
pressed as mean ± SD as arbitrary units of fluorescence. Numbers in
parentheses are the numbers of experiments. Significant differences
from respective q+ value: *P < 0.05; ***P < 0.001.
Conditions
Standard growth Stressa
Bone q+ 186 ± 33 (4) 1275 ± 92 (3)
q0 142 ± 75 (6) 2500 ± 217 (3)*
Muscle q+ 208 ± 3 (3) 1055 ± 315 (3)
q0 143 ± 4 (3)*** 996 ± 210 (3)
Lung q+ 235 ± 13 (3) 1693 ± 245 (3)
q0 25 ± 2 (3)*** 976 ± 319 (3)
a P < 0.001 vs. respective values in standard growth conditions.
� FEBS 2004 Homeostasis of ROS in q0 cells (Eur. J. Biochem. 271) 3653
hydroxyl radicals, for which no physiological defencesystem exists [1]. In the last few years, the view of hydrogenperoxide as a merely toxic by-product of cellular metabo-lism has changed, and it is now recognized as playing animportant role in intracellular signalling [3–5]. Fine regu-lation of redox balance may therefore be a critical functionof peroxidases, catalase and of GPx, in particular [54]. GPxregulates the intracellular hydroperoxides and lipid hydro-peroxides used as signal transducers of many transcriptionfactors including nuclear factor-jB [55], AP-1 [56] andMAP kinases [57]. Because catalase is unchanged, theincreased GPx activity of q0 cells may be an essentialcellular adaptation that enables gene expression to functionnormally in the absence of mtDNA. These findings arein line with results found in hepatoma-derived Hep1q0
cells [16].
ROS
WhenDCF signal was assessed as a direct index of ROS, allof the q0 cells had a reduced intracellular fluorescencecompared to q+ cells. Bone-derived q0 cells had the highestlevel of intracellular ROS compared to muscle and lung q0
cells both in standard growth conditions and in stressedconditions (Fig. 9, Table 1). If the current idea, that theDCF technique mainly determines cellular peroxides [42–44,58], is accepted it can be hypothesized that q0 cellsaccumulate a lower DCF fluorescence signal due to theirhigh GPx activity (Fig. 2) in a tissue-specific manner. Infact, lung q0 cells have the lowest DCF oxidation (Fig. 9,Table 1) and the highest GPx activity (Fig. 2), whereasbone- and muscle-derived q0 cells have rather similar GPxactivities and similar capacities to eliminate intracellularoxidants under standard growth conditions. Yet, in theabsence of glucose (stress conditions), intracellular levels ofROS in bone-derived q0 cells are 2.5 times those of muscleq0 cells (Fig. 9, Table 1). This may be due to the factthat among q0 cells, bone q0 cells had the less efficientantioxidant machinery with the lowest GSH level (Fig. 1).Interestingly, bone-derived q0 cells also featured the highestglucose consumption rate and glucose-6-phosphate dehy-drogenase activity among the six lines analysed (L. Vergani,unpublished data). Glucose-6-phosphate dehydrogenase isthe rate-limiting enzyme in the pentose phosphate pathwayand a major source of cytosolic NADPH and ribosephosphate [59]. When glucose is scarce, NADPH synthesisdecreases. This lead to a decrease in GSH levels as NADPHis required for GSH regeneration via GR. Therefore, ourdata suggest that increased generation of intracellular ROSin bone q0 cells, relative to muscle q0, is due to increasedproduction of oxidants. The high production of ROS inbone-derived q0 cells is further confirmed by indirectmeasurement of ROS obtained by comparing aconitaseactivity in standard conditions and after 18 h of incubationwith PBN (Fig. 7). In biological systems PBN [60,61], orN-t-butyl hydroxylamine, a breakdown product of PBN[47,48], efficiently trap free radicals, such as superoxideanion (OÆ �
2 ) that in turn inactives aconitase [41]. Theobserved PBN-induced increase in aconitase activity in boneq+ and q0 cells and in muscle q0 cells (Fig. 7) stronglysupports a high presence of OÆ �
2 in these cells also instandard growth conditions. These data are well related to
the lowest GSH2 : GSSG ratio and the most oxidized redoxstate (Fig. 1). A PBN effect on antioxidant enzyme activitiesmay be excluded on the basis of a recent report showing thatPBN protects U937 cells against ionizing radiation-inducedoxidative damage by altering cellular redox state but notaffecting antioxidant enzymes [61].
New and original evidence emerges from the experimentsof reactivation of aconitase activity by reducing agents andFe(NH4)2(SO4)2, as a Fe2+ carrier–donor [41]. Figure 8shows a dramatic increase in cytosolic IRP-1/aconitaseactivity in bone q0 cells, but not in mitochondria-enrichedfractions. This finding suggests that in bone q0 cellsintracellular oxidants derive chiefly from nonmitochondrialcompartments and are therefore not related to a vestige ofthe respiratory electron transport chain. Possible sources ofnonmitochondrial oxidants include NADPH oxidases [12],and lipoxygenases, whose action plays a role in signalpathways of growth factor-stimulated bone cell mitogenesis[62], and microsomal redox systems [63]. NADPH oxidasesare up-regulated in lymphoblastoid q0 cells, as a compen-satory phenomenon in maintaining cell viability [18]. Ourresults confirm PMRS as a possible source of ROS in bonecells, as the NADPH oxidase inhibitor diphenyleniodo-nium chloride reduces fluorescence accumulation intobone q+ and q0 cells to 65–70% (data not shown).Another possible explanation for the increased generationof intracellular oxidants in bone-derived q0 cells is the highO2 tension to which cultured cells are exposed compared tothe low O2 tension of osteoblasts. The bulk of intracellularoxidants in bone-derived q0 cells is in extra-mitochondrialcompartments, corroborating an earlier report whichshowed q0 cells to be sensitive to the ablation of cytosolicSOD [64]. Moreover the presence of extramitochondrialROS in q0 cells could explain the similar levels of oxidativeDNA damage observed in Hela q0 and the parental q+
cells [65].In conclusion, our study demonstrates that loss of
functional mitochondria, the major cellular site for ROSformation, reduces enzymatic and soluble intracellularantioxidant defences but not ROS flux in the studied q0
cells, and that there are cell line-to-cell line variations inintracellular antioxidant defences and ROS homeostasis. Infact among the studied cells, those originating frombone areparticularly vulnerable to free radical-induced stress aftermtDNA ablation. These differences could reflect tissue-specific aspects of intracellular oxidant metabolism,although it is inevitable that some specific features of ROShomeostasis in terminally differentiated tissues such asbone, lung and muscle will have been lost during thetransformation process that led to tumour formation. Thepronounced difference in intracellular homeostasis betweenlung A549 and bone 143B q0 cells may also be germane tomtDNA segregation bias, as selection of mutant and wild-type mtDNA is different in the 143B and A549 cellularbackgrounds [25,26].
Acknowledgements
We thankDrG.Attardi for the gift of osteosarcoma q0 and q+cells, Dr
I.J.Holt for thegift of lungcarcinomaq0 andq+cells andwearegrateful
to Dr Aubrey de Grey for great help in interpreting and discussing the
data. This work was supported by Telethon grant no. 1252.
3654 L. Vergani et al. (Eur. J. Biochem. 271) � FEBS 2004

References
1. Halliwell, B. & Gutterdge, J.M.C. (1999) Free Radicals in Biology
and Medicine, 3rd edn. Oxford University Press, New York.
2. Maxwell, S.R. (1995) Prospects for the use of antioxidant ther-
apies. Drugs 49, 345–361.
3. Finkel, T. (2003) Oxidant signals and oxidative stress. Curr. Opin.
Cell. Biol. 15, 247–254.
4. Sauer, H., Wartenberg, M. & Hescheler, J. (2001) Reactive Oxy-
gen Species as intracellular messengers during cell growth and
differentiation. Cell Physiol. Biochem. 11, 173–186.
5. Dalton, T.P., Shertzer, H.G. & Puga, A. (1999) Regulation of gene
expression by reactive oxygen. Annu. Rev. Pharmacol. Toxicol. 39,
67–101.
6. Forman, H.J., Torres, M. & Fukuto, J. (2002) Redox signaling.
Mol. Cell. Biochem. 234–235, 49–62.
7. Chance, B., Sies, H. & Boveris, A. (1979) Hydroperoxide meta-
bolism in mammalian organs. Physiol. Rev. 59, 527–605.
8. Hansfort, R.G., Hogue, B.A.&Mildaziene, V. (1997)Dependence
of H2O2 formation by rat heart mitochondria on substrate ava-
ibility and donor age. J. Bioenerg. Biomembr. 29, 89–95.
9. Esposito, L.A., Melov, S., Panov, A., Cottrell, B.A. & Wallace,
D.C. (1999) Mitochondrial disease in mouse results in increased
oxidative stress. Proc. Natl Acad. Sci. USA 96, 4820–4825.
10. Cadenas, E. & Davies, K.J.A. (2000) Mitochondrial free radical
generation, oxidative stress, and aging. Free Radic. Biol. Med. 29,
222–230.
11. Fleury, C., Mignotte, B. & Vayssiere, J.L. (2002) Mitochondrial
reactive oxygen species in cell death signaling. Biochimie 84,
131–141.
12. Berridge, M.V. & Tan, A.N.S. (2000) Cell-surface NAD(P)H-
oxidase: relationship to trans-plasma membrane NADH-oxido-
reductase and a potential source of circulating NADH-oxidase.
Antioxid. Redox Signal. 2, 277–288.
13. Shen, J., Khan, N., Lewis, L.D., Armand, R., Grinberg, O.,
Demidenko, E. & Swartz, H. (2003) Oxygen consumption rates
and oxygen concentration in molt-4 cells and their mtDNA de-
pleted (q0) mutants. Biophys. J. 84, 1291–1298.
14. King, M.P. & Attardi, G. (1989) Human cells lacking mtDNA:
repopulation with exogenous mitochondria by complementation.
Science 246, 500–503.
15. Jazayeri, M., Andreyev, A., Will, Y., Ward, M., Anderson, C.M.
& Clevenger, W. (2003) Inducible expression of a dominant ne-
gative DNA polymerase-c depletes mitochondrial DNA and
produces a q0 phenotype. J. Biol. Chem. 278, 9823–9830.16. Park, S.Y., Chang, I., Kim, J.Y., Kang, S.W., Park, S.H., Sing, K.
& Lee, M.S. (2004) Resistance of mitochondrial DNA-depleted
cells against cell death: role of mitochondrialsuperoxide dismutase.
J. Biol. Chem. 279, 7512–7520.
17. Chandel, N.S. & Schumacker, P.T. (1999) Cells depleted of
mitochondrial DNA (q0) yield insight into physiological mecha-
nisms. FEBS Lett. 454, 173–176.
18. Larm, J.A., Vaillant, F., Linnane, A.W. & Lawen, A. (1994)
Up-regulation of the plasma membrane oxidoreductase as a pre-
requisite for the viability of human Namalwa q0 cells. J. Biol.
Chem. 269, 30097–30100.
19. Chandel, N.S., Maltepe, E., Goldwasser, E., Mathieu, C.E.,
Simon, M.C. & Schumacker, P.T. (1998) Mitochondrial reactive
oxygen species trigger hypoxia-induced transcription. Proc. Natl
Acad. Sci. USA 95, 11715–11720.
20. Srinivas, V., Leshchinsky, I., Sang, N., King, M.P., Minchenko,
A. & Caro, J. (2001) Oxygen sensing and HIF-1 activation does
not require an active mitochondrial respiratory chain electron-
transfer pathway. J. Biol. Chem. 276, 21995–21998.
21. Vaux, E.C., Metzen, E., Yeates, K.M. & Ratcliffe, P.J. (2001)
Regulation of hypoxia-inducible factor is preserved in the absence
of a functioning mitochondrial respiratory chain. Blood 98,
296–302.
22. Yoneda, M., Katsumata, K., Hayakawa, M., Tanaka, M. &
Ozawa, T. (1995) Oxygen stress induces an apoptotic cell death
associated with fragmentation of mitochondrial genome.Biochem.
Biophys. Res. Commun. 209, 723–729.
23. Cai, J., Wallace, D.C., Zhivotovsky, B. & Jones, D.P. (2000)
Separation of cytochrome c-dependent caspase activation from
thiol-disulfide redox change in cells lacking mitochondrial DNA.
Free Radic. Biol. Med. 29, 334–342.
24. Jackson, M.J., Papa, S., Bolanos, J., Bruckdorfer, R., Carlsen, H.,
Elliott, R.M., Flier, J., Griffiths, H.R., Heales, S., Holst, B.,
Lorusso, M., Lund, E., Oivind Moskaug, J., Moser, U., DiPaola,
M., Polidori, M.C., Signorile, A., Stahl, W., Vina-Ribes, J. &
Astley, S.B. (2002) Antioxidants, reactive oxygen and nitrogen
species, gene induction and mitochondrial function. Mol. Aspects
Med. 23, 209–285.
25. Dunbar, D.R., Moonie, P.A., Jacobs, H.T. & Holt, I.J. (1995)
Different cellular backgrounds confer a marked advantage to
either mutant or wild-type mitochondrial genomes. Proc. Natl
Acad. Sci. USA 92, 6562–6566.
26. Holt, I.J., Dunbar, D.R. & Jacobs, H.T. (1997) Behaviour of a
population of partially duplicated mitochondrial DNA molecules
in cell colture: segregation, maintenance and recombination
dependent upon nuclear background. Hum. Mol. Genet. 6, 1251–
1260.
27. Vergani, L., Prescott, A. & Holt, I.J. (2000) Rhabdomyosarcoma
q0 cells: isolation and characterisation of a mitochondrial DNA
depleted cell line with �muscle-like� properties. Neuromuscul.
Disord. 10, 454–459.
28. Longo, V.D., Liou, L.L., Valentine, J.S. & Gralla, E.B. (1999)
Mitochondrial superoxide decreases yeast survival in stationary
phase. Arch. Biochem. Biophys. 365, 131–142.
29. Kornberg, A. (1955) Lactic dehydrogenase of muscle. Methods
Enzymol. 1, 441–443.
30. Srere, P.A. (1969) Citrate synthase. Methods Enzymol. 13, 3–5.
31. Anderson, M.E. (1985) Determination of glutathione and gluta-
thione disulfide in biological samples. Methods Enzymol. 113,
548–555.
32. Floreani, M., Petrone, M., Debetto, P. & Palatini, P. (1997) A
comparison between different methods for the determination of
reduced and oxidized glutathione in mammalian tissue. Free
Radic. Res. 26, 449–455.
33. Bradford, M.M. (1976) A rapid and sensitive method for the
quantitation of microgram quantities of protein utilizing the
principle of protein-dye binding. Anal. Biochem. 72, 248–254.
34. Prohaska, J.R. & Ganther, H.E. (1976) Selenium and glutathione
peroxidase in developing rat brain. J. Neurochem. 27, 1379–1387.
35. Carlberg, I. & Mannervik, B. (1974) Purification and character-
isation of the flavoenzyme glutathione reductase from rat liver.
J. Biol. Chem. 250, 5475–5480.
36. Aebi, H. (1984) Catalase in vitro.Methods Enzymol. 105, 121–126.
37. Siemankowsky, L.M., Morreale, J. & Briehl, M.M. (1999) Anti-
oxidant defences in the TNF-treated MCF-7 cells: selective
increase in MnSOD. Free Radic. Biol. Med. 26, 919–924.
38. Oberley, L.W. & Spitz, D.Z. (1984) Assay of superoxide dismutase
activity in tumor tissue. Methods Enzymol. 105, 457–464.
39. Habig, W.H., Pabst, M.J. & Jakoby, W.B. (1974) Gluthatione-S-
transferase: the first enzymatic step in mercapturic acid formation.
J. Biol. Chem. 249, 7130–7139.
40. Bianchi, A., Becuwe, P., Franck, P. &Dauca,M. (2002) Induction
of MnSOD gene by arachidonic acid is mediated by reactive
oxygen species and p38 MAPK signaling pathway in human
HepG2 hepatoma cells. Free Radic. Biol. Med. 32, 1132–1142.
41. Gardner, P.R. (2002) Aconitase: sensitive target and measure of
superoxide. Methods Enzymol. 349, 9–23.
� FEBS 2004 Homeostasis of ROS in q0 cells (Eur. J. Biochem. 271) 3655

42. Boveris, A., Alvarez, S., Bustamante, J. & Valdez, L. (2002)
Measurement of superoxide radical and hydrogen peroxide pro-
duction in isolated cells and subcellular organelles. Methods
Enzymol. 349, 280–287.
43. Pani, G., Colavitti, R., Bedogni, B., Anzevino, R., Borrello, S.
& Galeotti, T. (2002) Determination of intracellular reactive
oxygen species as function of cell density. Methods Enzymol. 352,
91–100.
44. Zuo, L. & Clanton, T.L. (2002) Detection of reactive oxygen and
nitrogen species in tissues using redox-sensitive fluorescent probes.
Methods Enzymol. 352, 307–325.
45. Schafer, F.Q. & Buettner, G.R. (2001) Redox environment of the
cell as viewed through the redox state of glutathione disulfide/
gluthatione couple. Free Radic. Biol. Med. 30, 1191–1212.
46. Bulteau, A.L., Ikeda-Saito, M. & Szweda, L.I. (2003) Redox-
dependent modulation of aconitase activity in intact mitochon-
dria. Biochemistry 42, 14846–14855.
47. Atamna, H., Paler-Mertinez, A. & Ames, B.N. (2000) N-t-Butyl
hydroxylamine, a hydrolysis product of a-phenyl-N-t-butyl nit-
rone, is more potent in delaying senescence in human lung fibro-
blasts. J. Biol. Chem. 275, 6741–6748.
48. Atamna, H., Robinson, C., Ingersoll, R., Elliott, H. &Ames, B.N.
(2001) N-t-Butyl hydroxylamine is an antioxidant that reverses
age-related changes in mitochondria in vivo and in vitro. FASEB
J. 15, 2196–2204.
49. Lieber, M., Smith, B., Szakal, A., Nelson-Rees, W. & Todaro, G.
(1976) A continous tumor-cell line from a human lung carcinoma
with properties of type II alveolar epithelial cells. Int. J. Cancer 17,
62–70.
50. Franek, W.R., Horowitz, S., Stansberry, L., Kazzaz, J.A., Koo,
H.C., Li, Y., Arita, Y., Davis, J.M., Mantell, A.S., Scott, W. &
Mantell. L.L. (2001) Hyperoxia inhibits oxidant-induced apop-
tosis in lung epithelial cells. J. Biol. Chem. 276, 569–575.
51. Allalunis-Turner, M.J., Lee, F.Y. & Siemann, D.W. (1988)
Comparison of glutathione levels in rodent and human tumor cells
grown in vitro and in vivo. Cancer Res. 48, 3657–3660.
52. Dickinson, D.A. & Forman, H.J. (2002) Cellular glutathione and
thiol metabolism. Biochem. Pharmacol. 64, 1019–1026.
53.9 Kamata, H. & Hirata, H. (1999) Redox regulation of cellular
signalling. Cell Signal. 11, 1–14.
54. Brigelius-Flohe, R. (1999) Tissue-specific functions of individual
glutathione peroxidases. Free Radic. Biol. Med. 27, 951–965.
55. Brigelius-Flohe, R., Maurer, S., Lotzer, K., Bol, G., Kallionpaa,
H., Lehtolainen, P., Viita, H. & Yla-Herttuala, S. (2000) Over-
expression of PHGPx inhibits hydroperoxide-induced oxidation,
NFkappaB activation and apoptosis and affects oxLDL-mediated
proliferation of rabbit aortic smooth muscle cells. Atherosclerosis
152, 307–316.
56. Meyer, M., Schreck, R. & Baeuerle, P.A. (1993) H2O2 and anti-
oxidants have opposite effects on activation of NF-kappa B and
AP-1 in intact cells: AP-1 as secondary antioxidant-responsive
factor. EMBO J. 12, 2005–2015.
57. Chen, Q., Olashaw, N. & Wu, J. (1995) Participation of reactive
oxygen species in the lysophosphatidic acid-stimulated mitogen-
activated protein kinase activation pathway. J. Biol. Chem. 270,
28499–28502.
58. Curtin, J.F., Donovan, M. & Cotter, T.G. (2002) Regulation and
measurement of oxidative stress in apoptosis. J. Immunol. Meth.
265, 49–72.
59. Meister, A. (1983) Selective modification of glutathione metabo-
lism. Science 220, 472–477.
60. Carney, J.M., Starke-Reed, P.E., Oliver, C.N., Landum, R.W.,
Cheng, M.S., Wu, J.F. & Floyd, R.A. (1991) Reversal of age-
related increase in brain protein oxidation, decrease in enzyme
activity, and loss in temporal and spatial memory by chronic
administration of the spin trapping compound N-tert-butyl-a-phenylnitrone. Proc. Natl Acad. Sci. USA 88, 3633–3636.
61. Lee, J.H. & Park, J.W. (2003) Protective role of a-phenyl–N-t-butylnitrone against ionizing radiation in U937 cells and mice.
Cancer Res. 63, 6885–6893.
62. Sandy, J., Davies, M., Prime, S. & Farndale, R. (1998) Signal
pathways that transduce growth factor-stimulated mitogenesis in
bone cells. Bone 23, 17–26.
63. Cross, A.R. & Jones, O.T.G. (1991) Enzymic mechanisms of su-
peroxide production. Biochim. Biophys. Acta 1057, 281–298.
64. Guidot, D.M., Repine, J.E., Kitlowski, A.D., Flores, S.C., Nel-
son, S.K., Wright, R.M. & McCord, J.M. (1995) Mitochondrial
respiration scavenges extramitochondrial superoxide anion via a
nonenzymatic mechanism. J. Clin. Invest. 96, 1131–1136.
65. Hoffmann, S., Spitkovsky, D., Radicella, J.P., Epe, B., &Wiesner,
R.J. (2004) Reactive oxygen species derived from the mitochon-
drial respiratory chain are not responsible for the basal levels of
oxidative base modifications observed in nuclear, DNA, of
mammalian cells. Free Radic. Biol. Med. 36, 765–773.
3656 L. Vergani et al. (Eur. J. Biochem. 271) � FEBS 2004
Related Documents