Development of LDPE-based Antimicrobial Films for Food Packaging Yogesh Mistry A thesis submitted in fulfilment of the requirements for the Award of Masters Degree Packaging and Polymer Research Unit School of Molecular Sciences Faculty of Health, Engineering and Science Victoria University July 2006

antimicrobial-films-for-food
Jul 13, 2015
Welcome message from author
This document is posted to help you gain knowledge. Please leave a comment to let me know what you think about it! Share it to your friends and learn new things together.
Transcript

Development of LDPE-based
Antimicrobial Films for Food
Packaging
Yogesh Mistry
A thesis submitted in fulfilment of the requirements
for the Award of Masters Degree
Packaging and Polymer Research Unit
School of Molecular Sciences
Faculty of Health, Engineering and Science
Victoria University
July 2006
i Abstract
Abstract
The integration of antimicrobial (AM) agents into packaging materials is aimed at
killing or inhibiting the spoilage and pathogenic microorganisms that may
contaminate packaged food products. Over the years there has been an increased
emphasis on naturally derived AM agents and polymer films containing AM agents
derived from basil, for example, exhibit an AM effect against a wide spectrum of
microorganisms. Due to the relatively high temperatures involved in manufacturing
such films, however, there is a considerable evaporation loss of AM agent during the
film blowing process. The present study aims at developing effective AM films and
subsequently reducing the loss of active AM agents. The effect of polyethylene
glycol (PEG) and ethylene vinyl acetate (EVA) in minimising the loss of active AM
agent during the manufacturing of low-density polyethylene (LDPE) film is
explored by measuring the release of AM agent into food simulants. The release of
AM agents from the film is satisfactorily and consistently described by short-term
and long-term migration equations and by first order kinetics. Furthermore, the
polymer additives PEG and EVA play a role in controlling the release of the AM
agents. The incorporation of AM agent does not adversely affect the mechanical or
optical properties of the extruded LDPE/EVA film and the films retain ca. 75% of
AM agents after extrusion.
ii Declaration
Declaration
I, Yogesh Mistry, declare that the Master by Research thesis entitled “Development
of LDPE-based Antimicrobial Films for Food Packaging” is no more than 60,000
words in length, exclusive of tables, figures, appendices, references and footnotes.
This thesis contains no material that has been submitted previously, in whole or in
part, for the award of any other academic degree or diploma. Except where
otherwise indicated, this thesis is my own work.
Signed Date

iii Acknowledgements
Acknowledgements
I would like to express my sincere gratitude to all people that helped me during my
project. I would like to thank my supervisor, Associate Professor Kees Sonneveld,
Professor Stephen Bigger and Professor Joseph Miltz for their support, guidance and
encouragement.
I would like to thank all staff and lab technicians who helped me during the course
of the experimental work. I am grateful to the authorities and staff of Kangan
Batman TAFE Institute, Broadmeadows, for their support during the film-making
process and for the use of their facilities. Thanks also to Mr. Rob Richmond, Mr.
Nick Jascol, Mr. Joseph Rojter, Ms. Audrey Waling, Associate Professor John
Casey, and Mr. Joe Pelle. I express my thanks to Ms. Sharon Atwell and Ms. Alison
Smith for their valuable administrative services. I would like to express my thanks
to Ms. Elizabeth Smith, Professor Elaine Martine and the staff of the postgraduate
research unit at Victoria University.
My sincere gratitude to Dr. Marlene Cran, Mr. Chanun Rardniyom, Ms. Liyana
Rupika, Dr. Endang Warsiki and all of my friends for their advice and support for
the completion of my project.
I express my deepest thanks to my parents, uncle, brother and sister for the support
and encouragement for which I am very grateful.
iv Abbreviations
Abbreviations and Nomenclature
AM Antimicrobial
EVA Ethylene Vinyl Acetate
EVOH Ethylene Vinyl Alcohol
FDA Food and Drug Administration
GC Gas Chromatography
GFSE Grapefruit Seed Extract
LDPE Low-Density Polyethylene
MAP Modified Atmosphere Packaging
MIC Minimum Inhibitory Concentration
PEG Polyethylene Glycol
SF Supercritical Fluid
D diffusion coefficient
k rate constant
l film thickness
m∞ equilibrium amount of AM agent released from film
mp amount of AM agent in packaging material
mt amount of AM agent released from film
t time
vt rate of release of AM agent

v Table of Contents
Table of Contents
Abstract ........................................................................................................................... i Declaration ..................................................................................................................... ii Acknowledgements ........................................................................................................ iii Abbreviations and Nomenclature..................................................................................... iv List of Tables ............................................................................................................... viii List of Figures ................................................................................................................ ix
1 Introduction .............................................................................................................. 1 1.1 Background................................................................................................. 1
1.2 Active Packaging......................................................................................... 2
1.3 Antimicrobial Food Packaging ..................................................................... 3
1.3.1 Design Factors for Antimicrobial Packaging...................................... 3
1.3.2 Release of Antimicrobial Agents ...................................................... 4
1.3.3 Migration of Antimicrobial Agents into Foods................................... 5
1.4 Food Packaging Systems.............................................................................. 6
1.5 Polymers and Active Packaging.................................................................... 8
1.5.1 Polymer Processing ......................................................................... 9
1.5.2 Blown Film Processing .................................................................. 11
1.5.3 Additives in Polymers.................................................................... 12
1.5.4 Antimicrobial Film Production ....................................................... 13
1.6 Aims......................................................................................................... 14
1.7 Scope of Work .......................................................................................... 15
2 Literature Review .................................................................................................... 16 2.1 Progress in Antimicrobial Packaging........................................................... 16
2.2 Developments in Polymers and Packaging .................................................. 21

vi Table of Contents
2.3 Polymer Additives for AM Film Development ............................................ 24
2.4 Types and Uses of Antimicrobial Agents..................................................... 26
2.5 Natural Antimicrobial Agents..................................................................... 28
2.5.1 Properties and Uses of Thymol ....................................................... 31
2.5.2 Properties and Uses of Linalool ...................................................... 32
2.6 The Properties of Antimicrobial Films ........................................................ 34
2.7 The Future of AM Films for Packaging Applications ................................... 36
3 Experimental Work.................................................................................................. 37 3.1 Materials................................................................................................... 37
3.1.1 Polymers....................................................................................... 37
3.1.2 Antimicrobial Additives................................................................. 37
3.1.3 Solvents ........................................................................................ 38
3.2 Blend Preparation and Film Production....................................................... 38
3.2.1 Incorporation of AM Agent into the Polymer................................... 38
3.2.2 Compression Moulded Film Production .......................................... 38
3.2.3 Film Production to Study the Retention Ability of PEG.................... 39
3.2.4 Film Production to Study the Retention Ability of EVA ................... 39
3.2.5 Film Production to Study the Effect of AM Agent ........................... 40
3.2.6 Production of Film by Extrusion..................................................... 41
3.3 Release Experiments.................................................................................. 41
3.3.1 Quantification of AM Agents by Gas Chromatography .................... 41
3.3.2 Antimicrobial Agent Release using Incubators................................. 42
3.3.3 Antimicrobial Agent Quantification using Soxhlet Extraction........... 42
3.4 Data Analysis ............................................................................................ 43
3.4.1 Migration as a Diffusion Process .................................................... 43
3.4.2 Migration as a Chemical Process .................................................... 44
3.5 Thermogravimetric Analysis ...................................................................... 47
3.6 Mechanical and Optical Properties of AM Films.......................................... 47

vii Table of Contents
4 Results and Discussion............................................................................................. 48 4.1 Effect of Compounding LDPE with PEG .................................................... 48
4.2 Blown Film Extrusion of LDPE/EVA/PEG Blends ...................................... 49
4.2.1 Effect of EVA and PEG on LDPE Extruded Films........................... 49
4.2.2 Loss of AM Agent During Blown Film Extrusion............................ 50
4.2.3 Mechanical and Optical Properties of Extruded AM Films ............... 50
4.3 Release of AM Agent from Films ............................................................... 51
4.3.1 Effect of PEG on the Release of AM Agent..................................... 52
4.3.2 Effect of AM Agent and PEG on the Release from Film................... 55
4.3.3 Effect of EVA on the Release of AM Agent .................................... 61
4.3.4 Effect of Food Simulant on the Release of AM Agent ...................... 64
4.3.5 Effect of Film Fabrication on the Release of AM Agent ................... 70
4.3.6 TGA Analysis of AM Films ........................................................... 72
5 Conclusions, Recommendations, Future work ........................................................... 74 5.1 Conclusions .............................................................................................. 74
5.1.1 Effect of Blending LDPE with PEG................................................ 74
5.1.2 Effect of Blending LDPE with EVA ............................................... 74
5.1.3 Development of Extruded AM Films .............................................. 75
5.1.4 Release of AM Agents from Film ................................................... 75
5.2 Recommendations ..................................................................................... 76
5.2.1 Blending Improvements ................................................................. 76
5.2.2 Additive Quantification.................................................................. 76
5.2.3 Release Experiments...................................................................... 77
5.2.4 Development of TGA Methodology................................................ 77
5.3 Scope for Future Work............................................................................... 77
5.3.1 Barrier Properties .......................................................................... 77
5.3.2 Multi-Layer Film Packaging........................................................... 78
5.3.3 Antimicrobial Activity ................................................................... 78
5.3.4 Modelling AM Release .................................................................. 79
viii Table of Contents
Appendix A Material Properties..................................................................................... 92 Appendix B Supplemental Figures................................................................................. 97
List of Tables
Table 2.1 Summary of some recent AM packaging developments ......................... 17
Table 2.2. Some typical applications of AM LDPE food packaging....................... 22
Table 2.3 Examples of typical AM agents used in food packaging......................... 27
Table 3.1 Characteristic properties of the polymers for AM films.......................... 37
Table 3.2 Film formulations used to study the retention ability of PEG ................. 39
Table 3.3 Film formulations used to study the retention ability of EVA ................ 40
Table 3.4 Film formulations used in AM agent release experiments ...................... 40
Table 3.5 Polymer formulations for blown film extrusion ...................................... 41
Table 4.1 Quantification of AM agent lost during blown film extrusion ................ 50
Table 4.2 Tensile and optical properties of extrusion blown AM films .................. 51
Table 4.3 Effect of PEG on the release of AM agent............................................... 55
Table 4.4 Effect of AM Agent and PEG on the release of AM agent...................... 61
Table 4.5 Effect of EVA on the release of AM agent .............................................. 64
Table 4.6 Effect of food simulant on the release of linalool from F2 films............. 67
Table 4.7 Effect of food simulant on the release of thymol from F3 films ............. 69
Table 4.8 Effect of film fabrication on the release of linalool................................. 72
Table A.1. Typical properties of LDPE resin .......................................................... 92
Table A.2. Typical properties of EVA resin ............................................................ 93
Table A.3. Typical properties of PEG resins ........................................................... 94
Table A.4. Properties of AM agent linalool............................................................. 95
Table A.5. Properties of AM agent thymol.............................................................. 96

ix Table of Contents
List of Figures
Figure 1.1. Diffusion of AM agent in a package/food system. .............................................. 7
Figure 1.2. Diffusion of AM agent in a package/ headspace/food system............................. 8
Figure 3.1. Plot of mass of AM vs time for a first order kinetic system.............................. 44
Figure 3.2. Plot of mass fraction of AM released vs time.................................................... 46
Figure 4.1. Plot of mass fraction of linalool released vs time for P1 film ........................... 52
Figure 4.2. Plot of mass fraction of linalool released vs time for P2 film ........................... 53
Figure 4.3. Plots of (mt/m∞) vs t½ and ln(1 - mt/m∞) vs time for P1 film.............................. 53
Figure 4.4. Plots of (mt/m∞) vs t½ and ln(1 - mt/m∞) vs time for P2 film.............................. 53
Figure 4.5. Plot of ln(1 - mt/m∞) vs time for P1 film............................................................ 54
Figure 4.6. Plot of ln(1 - mt/m∞) vs time for P2 film............................................................ 54
Figure 4.7. Plots of mass fraction of linalool released vs time for L0 & L1 films............... 56
Figure 4.8. Plots of (mt/m∞) vs t½ and ln(1 - mt/m∞) vs time for L0 film.............................. 56
Figure 4.9. Plots of (mt/m∞) vs t½ and ln(1 - mt/m∞) vs time for L1 film.............................. 57
Figure 4.10. Plot of ln(1 - mt/m∞) vs time for L0 film.......................................................... 57
Figure 4.11. Plot of ln(1 - mt/m∞) vs time for L1 film.......................................................... 58
Figure 4.12. Plots of mass fraction of thymol released vs time for T0 & T1 films ............. 58
Figure 4.13. Plots of (mt/m∞) vs t½ and ln(1 - mt/m∞) vs time for T0 film............................ 59
Figure 4.14. Plots of (mt/m∞) vs t½ and ln(1 - mt/m∞) vs time for T1 film............................ 59
Figure 4.15. Plot of ln(1 - mt/m∞) vs time for T0 film.......................................................... 60
Figure 4.16. Plot of ln(1 - mt/m∞) vs time for T1 film.......................................................... 60
Figure 4.17. Plots of mass fraction of linalool released vs time for E0, E1 & E2 films ...... 62
Figure 4.18. Plots of (mt/m∞) vs t½ and ln(1 - mt/m∞) vs time for E0 film............................ 62
Figure 4.19. Plots of (mt/m∞) vs t½ and ln(1 - mt/m∞) vs time for E1 film............................ 62
Figure 4.20. Plot of ln(1 - mt/m∞) vs time for E0, E1 & E2 films ........................................ 63
x Table of Contents
Figure 4.21. Plots of (mt/m∞) of linalool vs time for F2 film into food simulants. .............. 64
Figure 4.22. Plots of (mt/m∞) vs t½ and ln(1 - mt/m∞) vs time, F2 film, 15% ethanol........... 65
Figure 4.23. Plots of ln(1 - mt/m∞) vs time for F2 film into food simulants......................... 66
Figure 4.24. Plots of (mt/m∞) of thymol vs time for F3 film into food simulants ................ 67
Figure 4.25. Plots of (mt/m∞) vs t½ and ln(1 - mt/m∞) vs time, F3 film, 15% ethanol........... 68
Figure 4.26. Plots of ln(1 - mt/m∞) vs time for F3 film into food simulants......................... 69
Figure 4.27. Plots of mass fraction of linalool vs time, compression vs extrusion.............. 70
Figure 4.28. Plots of (mt/m∞) vs t½ and ln(1 - mt/m∞) vs time, compression vs extrusion.... 71
Figure 4.29. Plots of ln(1 - mt/m∞) vs time, compression vs extrusion ................................ 71
Figure 4.30. Plot of fractional mass loss of film vs temperature for extruded films............ 73
List of Supplementary Figures
Figure B.1. Plot of mass fraction of linalool released vs time for P3 film........................... 97
Figure B.2. Plot of mass fraction of linalool released vs time for P4 film........................... 97
Figure B.3. Plots of (mt/m∞) vs t½ and ln(1 - mt/m∞) vs time for P3 film ............................. 97
Figure B.4. Plots of (mt/m∞) vs t½ and ln(1 - mt/m∞) vs time for P4 film ............................. 98
Figure B.5. Plot of ln(1 - mt/m∞) vs time for P3 film ........................................................... 98
Figure B.6. Plot of ln(1 - mt/m∞) vs time for P4 film ........................................................... 98
Figure B.7. Plot of mass fraction of linalool released vs time for E0 film .......................... 99
Figure B.8. Plot of mass fraction of linalool released vs time for E1 film .......................... 99
Figure B.9. Plot of mass fraction of linalool released vs time for E2 film .......................... 99
Figure B.10. Plot of (mt/m∞) vs t½ vs time for E2 film....................................................... 100
Figure B.11. Plots of (mt/m∞) vs t½ and ln(1 - mt/m∞) vs time, F2 film, isooctane............. 100
Figure B.12. Plots of (mt/m∞) vs t½ and ln(1 - mt/m∞) vs time, F2 film, 95% ethanol. ....... 100
Figure B.13. Plots of (mt/m∞) vs t½ and ln(1 - mt/m∞) vs time, F3 film, isooctane............. 101
Figure B.14. Plots of (mt/m∞) vs t½ and ln(1 - mt/m∞) vs time, F3 film, 95% ethanol....... 101

1 Introduction
1 Introduction
This chapter provides an insight into the role of food packaging materials and in
particular, polymer films. The concept of active packaging is introduced with an
emphasis on antimicrobial additives in polymer film formulations.
1.1 Background
Many food products can be subjected to contamination by undesirable microbes
such as fungi, yeast and bacteria (Hotchkiss, 1997). In order to prevent or impede
such contamination, novel packaging technologies are continually being developed
to prolong the shelf-life and improve the safety or sensory properties of fresh foods
(Ahvenainen, 2003). Food packaging therefore plays a significant role in the food
supply chain and is an integral part of both food processes and the whole food
supply chain.
Food packaging must perform several tasks as well as fulfilling many demands and
requirements. Basic packaging requirements include good marketing properties,
reasonable price, technical feasibility (e.g., suitability for automatic packaging
machines, seal-ability, etc.), suitability for food contact, low environmental stress
and suitability for recycling and refilling (Ahvenainen, 2003). A package must
satisfy each of these requirements both effectively and economically. Furthermore,
packaging has a more significant role in the preservation of food and in ensuring the
safety of food in order to avoid wastage, food poisoning and to reduce allergies. To
ensure a longer shelf-life, packaging must play an active role in processing,
preservation and in retaining the quality of food products (Floras et al., 1997).

2 Introduction
In the past, packaging was expected to play a passive role as active roles were
considered to result in damage to either the product or the package (Yam and Lee,
1995). The development of modified atmosphere packaging (MAP) over two
decades ago was one of the first examples showing that some product/package
interactions may have a positive effect (Farber, 1991; Parry, 1993). A more recent
and advanced class of food packaging systems is known as “active packaging”
(Rooney, 1995a).
1.2 Active Packaging
Active packaging has been defined as a system in which the product, the package,
and the environment interact in a positive way to extend shelf-life or to achieve
some characteristics that cannot be obtained otherwise (Miltz et al., 1995; Yam, et
al., 2005). The main aim of active packaging is to change the condition of packaged
food in order to extend the shelf-life (Ahvenainen, 2003). This practice can improve
food safety and sensory properties, while maintaining the quality of packaged food.
Active packaging techniques for preservation and improving quality and safety of
foods can be divided into three categories: (i) absorbing systems; (ii) releasing
systems; and (iii) other speciality system for temperature, ultraviolet light and
microwave control systems (Han, 2003). Active packaging materials that can
release active compounds for enhancing the quality and safety of a wide range of
foods during extended storage are particularly important. The release of active
compounds plays an important role in determining the activity of the packaging
material as well as in the inhibitory effect the packaging has on the spectrum of
microorganisms.
3 Introduction
1.3 Antimicrobial Food Packaging
In most foods, the surface growth of microorganisms is the major cause of food
spoilage (Maxcy, 1981). Microbial contamination in packaging materials is
typically controlled by heat, steam or radiation treatment or by the addition of
antimicrobial (AM) additives (Hotchkiss, 1997). Antimicrobial agents are often
mixed directly into foods to control microbial growth and to extend shelf life (Weng
and Hotchkiss, 1992). The vast majority of these AM agents, however, are synthetic
materials that have the following disadvantages: (i) they are distributed in the bulk
of the food at relatively large quantities and therefore may impart an off-flavour; and
(ii) consumers are concerned about the possible side-effects of synthetic additives.
To assist in solving these problems, AM packaging systems have started to evolve
and these are primarily based on natural AM additives.
1.3.1 Design Factors for Antimicrobial Packaging
Antimicrobial agents have a specific inhibition activity against particular micro-
organisms. The selection of an AM agent therefore depends primarily on its activity
against the target microorganisms (Ahvenainen, 2003). Many other factors,
however, need to be considered when designing AM packaging systems. Specific
gravity, water solubility, organoleptic properties, toxicity and resistance to
microorganisms are important characteristic properties of the AM agent (Han,
2003). Other factors such as the method of incorporation into the packaging,
permeation and evaporation, controlled release, and the physicomechanical
properties of the packaging materials should also be considered (Han, 1996). The
characteristics of food products such as the composition and chemical nature (i.e.
4 Introduction
pH, water activity) as well as manufacturing, storage and distribution conditions
such as temperature are also important (Parry, 1993). Each of these factors should
be carefully considered in accordance with the relevant regulations in order to
design an effective AM package.
The design of an AM packaging system requires knowledge of controlled release
technology and microbial growth kinetics (LaCoste et al., 2005). When the
migration rate of an AM agent is faster than the growth rate of the target
microorganisms, the AM agent will be depleted before the expected storage period
and the packaging system will loose its AM activity. This may result in the growth
of microorganisms after the depletion of the AM agent. On the other hand, when the
release rate is too slow to control the growth of the microorganisms, the
microorganisms may grow before the AM agent is released. Therefore, the release
rate of AM agents from the packaging material onto food should be specifically
controlled to be similar to the growth rate of the target microorganisms (Han, 2000).
1.3.2 Release of Antimicrobial Agents
Antimicrobial activity can be achieved by adding AM agents to a packaging system
during manufacturing or by using AM polymeric materials (Hotchkiss 1997). There
are three typical systems of AM agent activity: (i) absorption; (ii) immobilisation;
and (iii) release systems. The absorption mode removes the essential factors of
microbial growth from the food systems and inhibits the growth of microorganisms.
The immobilisation system does not release AM agents but suppresses the growth of
microorganisms at the contact surface. Immobilisation systems are considered less
effective in the case of solid foods compared to liquid foods because there is
5 Introduction
generally less contact between an AM package and a solid food product (Han,
2000).
The release system allows the migration of the AM agent (solute or gas) into the
food or the headspace inside the package to inhibit the growth of microorganisms.
Whereas a gaseous AM agent can penetrate through any space, a solute AM agent
cannot migrate through the air space between the food and the packaging material.
The release kinetics of a packaging system is studied by measuring the release rate
of the AM agent into a food simulant or by measuring the effectiveness in inhibiting
microbial growth and extending the shelf life of food. Control of the release rates
and migration of the AM agent from the food packaging are very important
(LaCoste et al., 2005). Biochemical factors affecting the mass transfer
characteristics of an AM substance include AM activity and the mechanism and
kinetics of the selected substance to target microorganisms. Furthermore, the release
kinetics should be designed to control the growth of the microbes and maintain the
AM concentration above the critical inhibitory concentration (Han, 2000).
1.3.3 Migration of Antimicrobial Agents into Foods
In food packaging, migration is used to describe the transfer of a substance from the
packaging material into a food (Choudhry et al., 1998). The migration of AM
agents from the package into the food product is an essential in order to effectively
inhibit the growth of microorganisms on the surface of food products. While the
concentration of AM agent is maintained over the minimum inhibitory concentration
(MIC) on the food surface, the system actively presents effective AM activity
(Suppakul, 2004). It is technically difficult to measure the migration of a given

6 Introduction
active agent into the food, however, because most foodstuffs are comprised of a
complex mixture of substances such as water, carbohydrates, fats, lipids, proteins,
vitamins, fibres and minerals. For this reason, migration studies are usually
performed using food simulants (Dopico et al., 2003). In current European food-
packaging regulations (European Standard EN 1186-1, 1999), various food
simulants that can be used for migration testing have been identified. These include:
water (simulant A), 3% (v/v) acetic acid in water (simulant B); 15% (v/v) ethanol in
water (simulant C); olive oil; sunflower oil; and synthetic fat simulant HB 307
(simulant D) where each simulant is representative of a particular type of food.
Traditional liquid solvent/polymer extraction methods, which involve
dissolution/precipitation, are used for studying the migration of additives from
polymer (Zhou, 1998). In recent years, analysis with supercritical fluids (SFs) has
emerged as an alternative analytical technique because SFs afford higher diffusivity
and lower viscosity.
1.4 Food Packaging Systems
Most food packaging systems consist of packaging materials, food products and the
headspace of the package (Ahvenainen, 2003). If the void volume of solid food
products is considered as headspace, most food packaging systems represents either
a package/food system or package/headspace/food system. A package/food system
is a package in contact with a solid food product, or a low viscosity/liquid food
without head space. Examples of food packaged in this type of system include
wrapped cheese, deli products and aseptic meat packages. Diffusion between the
packaging material and the food and partitioning at the interface are the main
migration phenomena involved in this system (Han, 2003). An AM agent

7 Introduction
incorporated into the packaging material can migrate into the food through diffusion
and partitioning as shown in Figure 1.1.
Package
diffusion
chemicalimmobilization
Food
Figure 1.1. Diffusion of AM agent in a package/food system.
Examples of package/headspace/food systems include flexible packages, bottles,
cans, cups and cartons. Evaporation or equilibrated distribution of a substance
among the head space, packaging materials and food are to be considered as a part
of main migration mechanism to estimate the interfacial distribution of the substance
(Han, 2003). Compared to a non-volatile substance which can only migrate through
the contact area between the package and the food, a volatile substance can migrate
through the headspace and air gap between the package and the food as shown in
Figure 1.2.
Other than diffusion and equilibrated sorption, some AM packaging systems use
covalently immobilized antibiotics or fungicides. In this case, surface microbial
growth is suppressed by immobilization of a non-food grade AM substance without
diffusional mass transfer.
AM
AM
AM AM
AM
AM
AM AM AM
AM
AM
AM
AM AM

8 Introduction
Headspace
equilibrium
Package
diffusion
chemicalimmobilization
sorption
Food
Figure 1.2. Diffusion of AM agent in a package/ headspace/food system.
1.5 Polymers and Active Packaging
Polymers such as low-density polyethylene (LDPE) constitute a majority of primary
packages for foods and beverages and a great deal of research has been devoted to
the development of active polymer packaging (Rooney, 1995b). Polymers can be
activated by the addition of components such as antioxidants, oxygen scavengers,
carbon dioxide absorbers/emitters, AM agents and ethanol emitters during their
conversion into packaging materials. Most forms of active polymeric packaging
involve an intimate interaction between the food and its package so that the layer in
contact with the food is chosen to be active (Rooney, 1995b). Such polymer films
can be used in laminates and in edible films that contain the active additives for
wrapped food products (Han, 2000).
Antimicrobial agents in particular can be incorporated into a packaging system to
form AM packages (Vartiainen et al., 2003). The incorporation of these agents can
be achieved by simple blending with the packaging materials, as well as
AM
AM
AM
AM
AM
AM
AM AM AM
AM
AM
AM
AM
AM
AM
AM
AM

9 Introduction
immobilisation or coating depending on the characteristics of packaging systems,
AM agent and the food. Blended volatile AM agents can migrate from the
packaging material into the food via diffusion, evaporation or slow release, while the
immobilised agents remain bound to the polymer. A number of naturally derived
AM agents have been shown to possess AM activity (Azaz et al., 2005). Packaging
materials containing natural AM agents have shown inhibitory effect against
selected microorganisms such as Staphylococcus aureus, Listeria innocua,
Escherichia coli and Saccharomyces cerevisiae (Suppakul, 2004). The
manufacturing of films containing naturally derived AM agents, however, showed a
considerable amount of loss due to evaporation occurring at extrusion conditions
(Suppakul, 2004).
1.5.1 Polymer Processing
In order to develop optimal AM packaging systems, the processability of the
polymers, the AM constituents and any other additives should be understood. This
will enable the production of AM products with sound morphological structures that
will yield the required physical properties at an economical cost (Matthews, 1982).
In the processing of polymeric materials it is necessary to achieve not only the
required shape, but also suitable degree of homogeneity in composition and
properties (Kim and Kwon, 1996). Vibratory blenders, tumble blenders, stirrer
mixers, ribbon blenders, buss turbine mixers and roll mills are commonly used for
dry blending polymers in powder or granule form with powdered additives such as
pigments to produce master batches in powder or granule form for batch
compounding (Matthews, 1982). Continuous compounding can be achieved cheaper
and with better uniformity by using screw-extruders (Hess, 1978).

10 Introduction
The function of an extruder in multi-component polymer processing is to transfer,
soften, compact, compress and uniformly blend the components (Matthews, 1982).
Compared with single-screw extruder, a twin-screw extruder can increase mixing by
shearing in the regions between the surfaces of the screws (Cassagnau et al., 2005).
Mixing in extruders depends upon detailed material flow patterns, which largely
occurs by laminar shearing in the molten polymer (Tadmor and Gogos, 1979). Dry
blends of polymers having particle size of average diameter greater than 100 µm
may be feed satisfactorily with gravity (Todd, 1999). Blends made from smaller
polymer particles or containing unabsorbed soft or liquid additives, however, will
generally not feed smoothly from a gravity operated hopper. Positive forced feeding
is achieved with such blends into the feed section of the screw by screw feeding
devices (Matthews, 1982).
Matthews (1982) reviewed different screw designs and feeding mechanism for direct
blending of liquids as well as solids additives with polymers. The compounding of
LDPE with pigments can be aided by the addition of 0.2% to 0.5% (w/w) light oil or
plasticizers with intensive non-fluxing mixers (Cudworth, 1976) of relatively low
speed. Blending of polymers in powder form presents no special problems although
the apparent melt viscosity and flow behaviour at compounding temperatures are
significant in determining the degree and mode of dispersion (Han et al., 1975). For
processing complex blends where low viscosity additives are incorporated with a
high viscosity molten polymer, the ratio of zero shear viscosity of additive to
polymer must ideally be less than 10-7. Furthermore, the distribution and dispersion
of the dispersed phase are decisive properties for blending of polymers (Cassagnau,
et al., 2005).
11 Introduction
1.5.2 Blown Film Processing
The production of plastic film is primarily achieved by blown film extrusion
(Middleman, 1977). In this process, the molten polymer enters a die, flows around a
mandrel, and emerges through a ring-shaped opening in the form of' a tube. Air is
introduced into the tube causing it to expand and form a bubble while air-flow
around the outside of the bubble cools and solidifies the melt. The air is contained
in the bubble by the die at one end and by the nip rolls at the other end. An even
pressure of air is maintained to ensure uniform thickness of the film bubble. The
air-cooling is an integral part of a blown film line which affects the heat transfer
from molten polymer film and the stability and bubble formation. Sidiropoulos and
Vlachopoulos (2005) investigated the temperature distribution in machine direction
and normal (thickness) direction the melt phase of a typical blown film bubble.
Both stretching the bubble radially, and pulling it away from the die biaxially orient
the plastic, improving its strength and properties. After solidification, the film
bubble moves into a set of pinch rolls where it is flattened and rolled onto a winder.
Some extrusion lines have printing equipment and bag-making machines on-line.
Simpler extrusion lines form the film or sheet and then perform the printing and bag
making functions off-line. Bubble stability plays a very important role in evaluating
the possibility of a polymer. A stable bubble is a requirement not only for
continuous operation of the process but also for the production of an acceptable film.
The key parameters affecting the film blowing process are bubble diameter and
velocity. Ghaneh-Fard et al. (1996) studied in detail the criteria’s for bubble
stability during film blowing and demonstrated that the cooling of bubble is

12 Introduction
controlled by amount of air inside the bubble, die diameter, height, melt
temperatures and the velocity of the nip rollers.
Co-extrusion is a variation of the blown film process where the die is designed with
multiple flow channels so that multiple layers may be formed. In food packaging,
multiple layers are typically used in order to create barrier layers to protect the
product from moisture, air, etc. The number of layers can range from two to as
many as ten layers in more complex systems and the typical range of film thickness
is 0.0001-0.050 inch. Common products formed by blown film extrusion or co-
extrusion include garbage bags, can liners, agricultural films, grocery bags, and thin
films for paper and tissue products (Pirkle and Braatz, 2003). Typical polymers
used for blown film processing include polyethylenes, polypropylenes, ethylene
vinyl acetate (EVA), and flexible polyvinyl chloride (Berins, 1991).
1.5.3 Additives in Polymers
The extrusion processing of polymer products is often aided by the addition of
additives such as polyethylene glycol (PEG). Polymer additives represent many
classes of compounds, which possess a wide variety of chemical (i.e., phenols,
amides, esters) and physical (i.e., volatility, solubility) properties (Berins, 1991).
They are often incorporated into polyolefins and other polymeric materials for
several reasons including: (i) to prevent of degradation by ultraviolet light, heat, and
oxygen; (ii) to aid in the processing of the polymer; and (iii) to modify the physical
properties of the polymer. Since the purity and amount of additive can affect
polymer properties, it is very important to characterize and quantify additives in
polymer products (Berins, 1991).

13 Introduction
Traditionally, the incorporation of an AM agent into food can cause the
consumption of the active compound by reaction with the food resulting in a loss of
protection an increased rate of food spoilage (Han, 2003). In active packaging AM
systems, the AM agents can be incorporated directly into a polymer during
processing. The loss of an AM agent during processing or manufacturing of
packaging material, however, can result in the unnecessarily and undesirable release
into the food products. In order to control the retention within the polymer during
manufacturing or any post packaging processing stages of the AM agent, polymer
additives are often incorporated during processing.
1.5.4 Antimicrobial Film Production
Low-density polyethylene films are used in many food packaging applications and
are primarily produced by blown film extrusion (Pirkle and Braatz, 2003). Due to
the high temperatures required during the extrusion process, volatile natural AM
agents can be subsequently lost which may cause a lack of AM activity (Suppakul,
2004). Since the release of active compounds is directed toward the food surface,
however, relatively low quantities of active compounds are needed. Reducing the
amount of active compounds in food packaging may also improve quality of flavour,
since many additives can cause off-flavour (Han, 2003).
In order to develop effective AM films, a number of important factors need to be
carefully considered. These include:
• The types and grades of polymers and additives for the production of
the film.
14 Introduction
• The method used to incorporate the AM agent into the polymer or
master-batch.
• The optimal extrusion conditions to minimize the loss of AM agents.
• The extent to which an additive polymer could reduce the evapor-
ation losses of volatile AM agents.
• The extent to which an additive polymer could control the release of
the AM agent into the food product.
• The effect that any added polymer has on the ultimate properties of
the film.
1.6 Aims
In view of the potential economical, environmental and general health benefits
imparted by natural AM additives in food packaging films, the present study is
aimed at the following:
• To prepare active LDPE films, using natural AM agents (linalool and
thymol) with EVA and/or PEG as the AM binding agents, by
compression moulding or blown film extrusion.
• To investigate the ability of the additive polymers EVA or PEG to
retain the AM agents during film processing by determining the
release of the AM agents from the films.
• To investigate the migration of AM agents into food simulants by
conventional diffusion analysis.
• To investigate the migration of AM agents using an alternative
kinetics analysis.

15 Introduction
• To compare the release of AM agents from extruded film into
different food simulants.
• To study the effect of AM agent on the properties of extruded films.
1.7 Scope of Work
The natural AM agents linalool and thymol were selected for the studies and a
standard commercial film grade LDPE was chosen as the packaging material.
Additive polymers EVA and PEG were selected to improve solubilization by
partially binding the AM agents in the polymer matrix. Samples were prepared
using a compression moulding press and by blown film extrusion in order to study
the release kinetics of the AM agent. The release rate of the AM agent into food
simulants was also studied. The release of AM agents was also investigated using
thermogravimetric analysis and some properties of the extruded films were
measured.

16 Literature Review
2 Literature Review
This chapter reviews the recent developments in active packaging and naturally
derived AM additives in particular. A review of blending AM additives and AM
film production is also presented.
2.1 Progress in Antimicrobial Packaging
Active packaging is one of the innovative food packaging concepts and has been
introduced in response to the continuous changes in consumer demands and market
trends. This practice can improve food safety and sensory properties, while
maintaining the quality of packaged food by changing the condition of packaged
food to extend the shelf-life (Ahvenainen, 2003). Active packaging and AM
packaging in particular, plays a very important role in the protection of food
products (Robertson, 1993) and the cost saving potentials of active packaging
systems have been demonstrated by Hotchkiss (1997).
Antimicrobial packaging systems are able to kill or inhibit spoilage and pathogenic
microorganisms that can potentially contaminate food products (Hotchkiss, 1997).
The inhibition of microbial activity is achieved by slow release of AM agents from
the packaging system onto the food surface (Han, 2000). When a packaging system
acquires AM activity, the packaging system limits or prevents microbial growth by
extending the lag period and reducing the growth rate or decrease live counts of
microorganisms. The goals of an AM system are safety assurance, quality
maintenance and shelf-life extension (Ahvenainen, 2003). The development and
application of AM films with an emphasis on active and AM packaging have been

17 Literature Review
recently reviewed (Suppakul et al., 2003a; Suppakul et al., 2003b). Table 2.1
summarizes recent advances in AM packaging development.
Table 2.1 Summary of some recent AM packaging developments
AM Compounds Trade Name(s) Producer Packaging Type
Silver zeolite Aglon Aglon Technologies
Paper, milk containers
Novaron Toagosei Co Plastic
Triclosan Microban Microban Deli-wrap, re-heatable containers
Allylisothiocyanate WasaOuro Lintec Corp. Labels, sheets Dry Company Sachets
Chlorine dioxide Microsphere Bernard Tech Inc.
Bags, coatings, labels
Carbon dioxide Freshpax Multisorb Tech. Sachets Verifrais Sarl Codimer Sachets
Ethanol vapour Ethicap, Negamold, Fretek
Freund
Sachets
Oitech Nippon Kayaku Sachets (Japan)
Glucose oxidase Bioka Bioka Ltd Sachets (Finland) Source: Adapted from Han (2000).
The current approach to AM film development is to control the undesirable
microorganisms present in the food products by incorporating AM agents directly
into the polymer matrix (Labuza and Breene, 1989). Excellent processing properties
of LDPE and application of transparent LDPE films in food packages and
agricultural were studied by LaMantia et al. (1986). These studies suggest that it is
highly desirable to have polymers with good rheological properties that will provide
sound tubular film stability without the need to perform time-consuming and
18 Literature Review
expensive pilot runs. Fang et al. (2003) investigated the correlation between
rheological properties and processability of polyethylene in film blowing and found
that, the more elastic polymers were found to be more stable in film blowing. Also,
the more stable polymer melts were found to be those possessing larger elongation
properties.
Hong et al. (2000) incorporated naturally derived compounds such as propolis
extract and clove extract into LDPE to form AM food packaging films. The
compounds were directly blended through master batch processing and films were
fabricated by blown film extrusion process. The direct incorporation of the
additives into the LDPE film resulted in a uniform film matrix that was observed via
Fourier transform infrared spectrometry. The incorporation of these natural AM
agents did not significantly affect the mechanical or permeability properties of the
films. Furthermore, the films incorporated with natural AM agents showed positive
AM ability against L. plantarum and F. oxysporum.
An et al. (1998) incorporated a combination of AM agents including Rheum
palmatum extract, Coptis chinensis extract, sorbic acid and silver substituted
inorganic zirconium matrix in a 1% (w/w) concentration with LDPE. The
incorporation of these natural and inorganic AM additives into LDPE did not
adversely affect the mechanical tensile strength, heat shrinkage or wet-ability of the
resulting film. The films, which were used for packing cucumber and curled lettuce,
showed reduced growth of total aerobic bacteria compared with a control film
without any AM additive. Furthermore, the presence of the AM agent into LDPE
did not adversely affect the other quality attributes of the vegetables during storage.
19 Literature Review
Antimicrobial LDPE films can be also used in MAP applications. For example,
Chung et al. (1998) incorporated 1% (w/w) AM agents of Rheum palmatum extract,
Coptis chinesis extract and silver substituted inorganic zirconium into LDPE for the
preservation of strawberries. The studies were conducted under a modified
atmosphere produced by hermetic sealing to maintain the oxygen and carbon
dioxide concentrations. The AM LDPE film successfully retarded the growth of
total aerobic bacteria, lactic acid bacteria and yeast on fruits and resulted in
significantly lower rate of decay. The hermetically sealed packages of AM LDPE
films showed better retention of fruit firmness and did not impart any negative effect
on the physical or chemical qualities of strawberries.
Lee et al. (1998) developed LDPE films of 30 µm thickness, containing 1% (w/w)
grapefruit seed extract by blown film extrusion processing at 150°C. An LDPE
master batch containing 10% (w/w) of this extract was prepared in a twin-screw
extruder prior to proportional mixing with LDPE pellets and fabrication into films.
The resulting films showed inhibitory activity against Escherichia coli and
Staphylococcus aureus. The films, when used for packing curled lettuce and
soybean sprouts, also successfully inhibited the growth rate of lactic acid bacteria.
Furthermore, the growth rate of aerobic bacteria and yeast were considerably
reduced.
Grower et al. (2004) developed a nisin-containing solution for coating the surface of
LDPE films in order to release nisin to inhibit the growth of Listeria monocytogenes.
These AM coatings were effective against L. monocytogenes on solid micro-
20 Literature Review
biological media and on the surface of individually packed hotdogs. Coatings
containing nisin (10,000, 7,500 and 2,500 IU mL-1) inhibited the growth of L.
monocytogenes on modified oxford agar and tryptic soy agar. Films coated with
solutions containing 156.3 IU mL-1 of nisin, however, had no effect against L.
monocytogenes grown on either agar.
Cahan et al. (2003) introduced 1% (w/w) of AM agent (Melcaptobenzothiazol,
Polyacrylamid and starch potato) into EVA film. The AM agent was compounded
with polyethylene wax prior to extrusion with EVA via a single-screw extruder
equipped with a blown film die and film stretching unit. These films successfully
reduced the target bacterial growth by ca. 50 to 70%.
Other than active food packaging applications, polymers can also be blended with
insecticides to protect against rodent damage. “Rodrepel” containing oleoresin
derivatives extracted from green peppers are often used in the manufacturing of
aromatic polymers (Joshi, 2006). They are compounded in low concentrations (ca.
200 ppm) into a master batch which is subsequently used in manufacturing
underground pipes, cables, optical fibre and metal coatings. Low-density
polyethylene cable insulations and coating can also be prepared from a master batch
containing less than 5% (w/w) Thermirepel to repel termites (Joshi, 2006).
Halek and Anita (1989) prepared an antifungal ionomeric film by compressing
Surlyn pellets (Dupont Laboratories, Delaware) with an ethylene copolymer
containing 15% (w/w) methacrylic acid. The films were doped into an antifungal
benomyl solution for six days to couple the fungicide to the ionomeric film and the
21 Literature Review
films successfully inhibited the growth of Aspergillus flavus and Penicillium
notatum. Aitor et al. (2002) studied the tensile properties of polyethylene films (of
200 µm thickness) containing additives such as Irganox1010, Irganox1330 and
LowinoxCA22 prepared using a compression moulding press to study the effect of
additives against environmental conditions.
Donghwan et al. (2003) evaluated the release kinetics of triclosan from a polymer
coating on LDPE, as an AM layer for packaging materials, into 10% aqueous
ethanol and n-heptane. Using pure water, no release of triclosan was observed.
Studies on 10% ethanol showed that a 1.2% (w/w) triclosan was quickly released.
Using n-heptane to simulate fatty foods 65% (w/w) of the triclosan was quickly
released. Wang et al. (2005) investigated the antibacterial activity of LDPE films
containing nanoparticles of TiO2 prepared as a master batch by melt blending.
Biodegradable polymers that demonstrated AM activity are currently being studied
as edible coatings. Padgett et al. (1998) demonstrated the AM activity of lysozyme
and nisin in soy protein isolate and corn zein films.
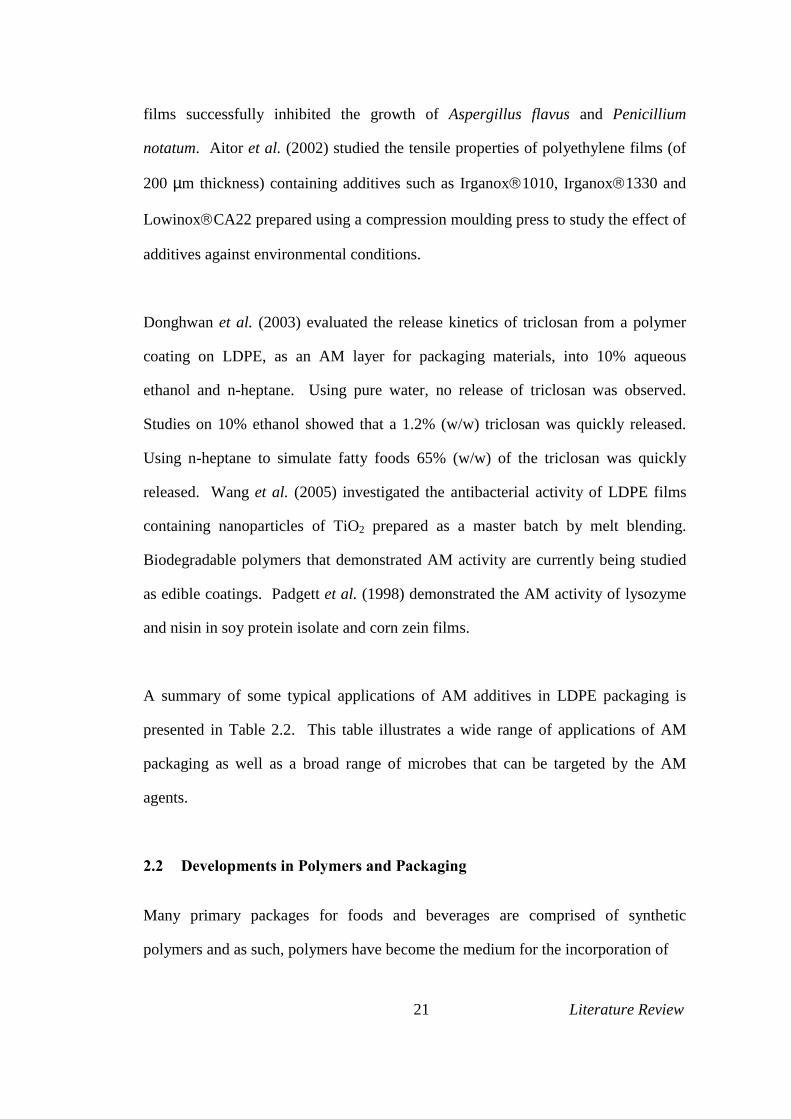
A summary of some typical applications of AM additives in LDPE packaging is
presented in Table 2.2. This table illustrates a wide range of applications of AM
packaging as well as a broad range of microbes that can be targeted by the AM
agents.
2.2 Developments in Polymers and Packaging
Many primary packages for foods and beverages are comprised of synthetic
polymers and as such, polymers have become the medium for the incorporation of
22 Literature Review
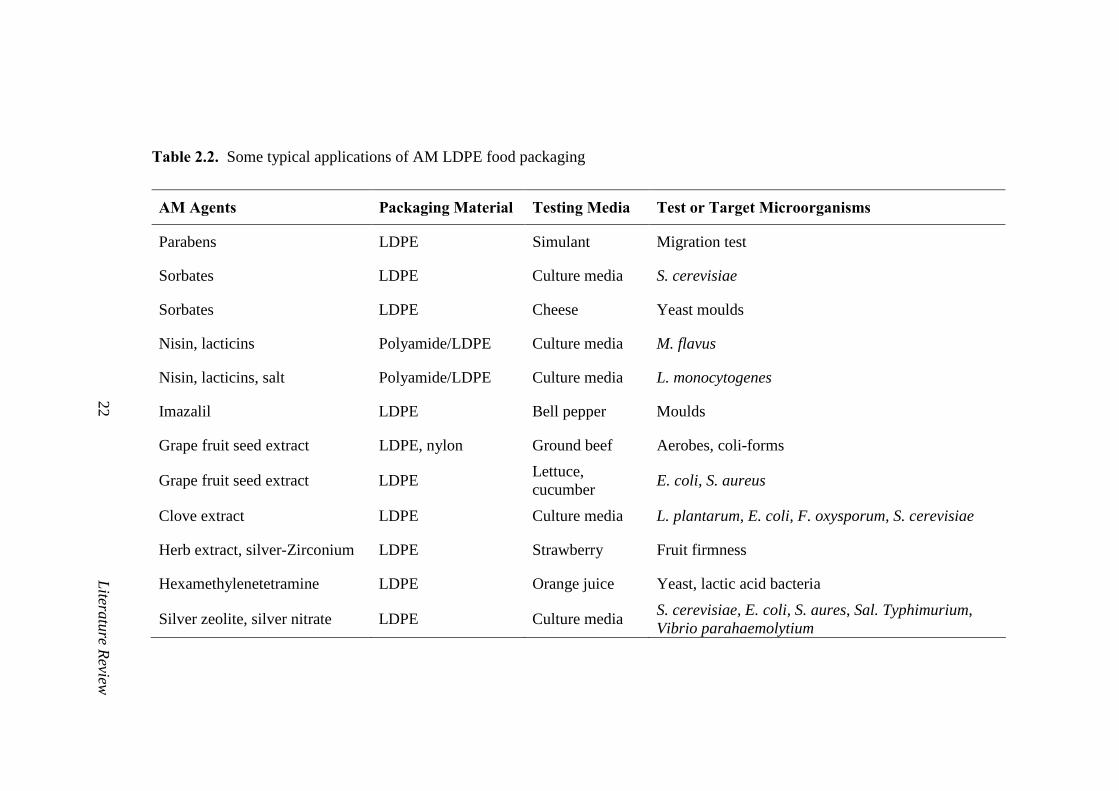
Table 2.2. Some typical applications of AM LDPE food packaging
AM Agents Packaging Material Testing Media Test or Target Microorganisms
Parabens LDPE Simulant Migration test
Sorbates LDPE Culture media S. cerevisiae
Sorbates LDPE Cheese Yeast moulds
Nisin, lacticins Polyamide/LDPE Culture media M. flavus
Nisin, lacticins, salt Polyamide/LDPE Culture media L. monocytogenes
Imazalil LDPE Bell pepper Moulds
Grape fruit seed extract LDPE, nylon Ground beef Aerobes, coli-forms
Grape fruit seed extract LDPE Lettuce, cucumber E. coli, S. aureus
Clove extract LDPE Culture media L. plantarum, E. coli, F. oxysporum, S. cerevisiae
Herb extract, silver-Zirconium LDPE Strawberry Fruit firmness
Hexamethylenetetramine LDPE Orange juice Yeast, lactic acid bacteria
Silver zeolite, silver nitrate LDPE Culture media S. cerevisiae, E. coli, S. aures, Sal. Typhimurium, Vibrio parahaemolytium
23 Literature Review
active substances such as antioxidants, oxygen scavengers, flavour compounds and
natural AM agents (Hotchkiss, 1997). In recent years, a great deal of research has
been dedicated to polymeric food packaging materials that possess AM properties.
Polymers containing AM agents from plant and herb extracts in combination with
citric acid extracts were found to be very effective against a variety of different
microorganisms including bacteria, viruses and fungi (Seabrook et al., 1997).
Polymer additives other than AM agents can include antioxidants, flavours to offset
degradation on storage, insecticides to repel or kill insects, and fumigants in plastic
films for packing of grains (Sherman and Manolis, 1998). The ability of such
polymers to possess AM activity with food additives was studied by Halek and
Anita (1989). The controlled slow release of these AM agents is essential to
maintain the required concentration of the AM agent on the food surfaces to retard
microbial growth (Han, 2000).
The incorporation of AM agents into polymers can affect the physical and
mechanical integrity of packaging materials (Han, 2003). If an AM agent is
compatible with a particular packaging material and does not interfere with the
polymer structure, a substantial amount of the AM agent may be impregnated into
the packaging material without any physicomechanical integrity deterioration (Han,
1996). An excess amount of AM agent that is not capable of being blended with
packaging material, however, can result in a detriment to the physical strength and
mechanical integrity of the package (Cooksey, 2000). Polymer morphological
studies are thus helpful in predicting the impact of the addition of an AM agent on
the physical integrity of the packaging product.
24 Literature Review
2.3 Polymer Additives for AM Film Development
The production of successful AM films can be achieved by the use of additives that
can serve as compatibilizers between AM agents and polymer materials.
Polyethylene glycol, for example, is a biocompatible, non-toxic and non-
immunogenic polymer used in biomaterials and biotechnology (Harris, 1992) that
has been approved for internal consumption by the United States Food and Drug
Administration. Several PEG gels have been studied for drug delivery and the
controlled release of various therapeutic drugs (Kanjickal et al., 2005). The terminal
hydroxyl groups and ether groups are hydrophilic structures that are suitable for the
controlled delivery of low molecular weight drugs. The use of PEG as a plasticiser
can result in film products with improved tensile strength. Furthermore, PEG has
the potential to form hydrogen bonds and to provide hydrophilic sites in otherwise
hydrophobic polymer systems (Tillekeratne and Easteal, 2000).
Polyethylene glycol is well known for its low viscosity and lubrication properties
(Liu et al., 2005). The incorporation of small amounts of PEG can improve the melt
rheology of polyolefins. Liu et al. (2005) incorporated small amounts (ca. 1-5 phr
by weight) of PEG resin into mLLDPE to investigate the flow performance during
extrusion. The rheological experiments showed that PEG/ mLLDPE blends exhibit
lower apparent shear stress compared to that of pure mLLDPE. Furthermore, there
was a synergistic improvement in the processability of mLLDPE. Liu et al. (2005)
also studied the effect of PEG on the viscosity of mLLDPE compounded with
inorganic fillers. A similar reduction in the viscosity of mLLDPE was observed
with the incorporation of 1-5 phr and PEG also assisted in delaying the development
of sharkskin fracture during the extrusion. More recently, Xie et al. (2006)

25 Literature Review
investigated the influence of PEG containing additives on the extrusion behaviour of
ultrahigh molecular weight polyethylene and polypropylene bends. Blending 1%
(w/w) PEG in polyethylene blends resulted in significant reduction of die pressure
and melt viscosity and an increase in flow rate at a given die pressure.
Suyatma et al. (2005) studied the effect of PEG as a hydrophilic plasticizer on the
mechanical, thermal and surface properties of chitosan used as potential AM films.
The plasticisation efficiency of PEG in chitosan films was improved and films
containing PEG showed better stability during storage, better elastic properties, high
strain and lower tensile stress values than films that had no PEG.
The microstructure or the morphology of a polymer film can greatly influence the
mobility of active compounds in the film. For an immiscible phase containing PEG
and LDPE, the approach of smart blending (LaCoste et al., 2005) may be applied to
alter the blend morphology in order to provide the controlled release of linalool and
thymol. The technique of smart blending may also provide a wide range of film
permeability to suit different applications.
Other possible additive polymers that may contribute to blend compatibility between
some polymers and AM agents are EVA and ethylene vinyl alcohol (EVOH). Moly
et al. (2005) performed crystallisation studies on the blending of EVA with LLDPE
and showed that blending EVA does not affect crystalline structure, but the
crystallinity decreases with EVA content. Lee and Kim (1996) studied the
morphology and oxygen barrier properties of LDPE/EVOH blends whereby the
blends were prepared using a single screw extruder. The extruded blends were
26 Literature Review
compression moulded into thin films to study the morphology of the dispersed phase
in immiscible polymer blends and demonstrated that the processing conditions
influence the shape and dimension of the polymer structure. Polymer-based
nanocomposites prepared by melt compounding have also been reported to exhibit
markedly improved properties over neat polymers and micro-sized-particle-filled
polymer composites (Walter et al., 1999).
2.4 Types and Uses of Antimicrobial Agents
There are many different types of AM agents, natural or synthetic, that can be used
in a variety of applications in the food, pharmaceutical and cosmetic industries.
Several categories of AM agents have been tested for suitability in AM packaging
applications including organic acids, fungicides, bacteriocins, proteins, enzymes,
inorganic gases, and metal substituted zeolite (Ming et al., 1997; Scannell et al.,
2000). Antimicrobial agents used in food packaging may be organic or inorganic
materials or their salts (Cahan et al., 2003).
Various chemicals like antioxidants, AM polymers, natural AM agents and gases,
which have the potential to inhibit microorganisms, can be incorporated in
packaging systems (Suppakul et al., 2003b). Among the synthetic AM agents used
are organic acids, fungicides, alcohols and antibiotics. Organic acids such as
benzoic acids, parabenes, sorbic acid, propionic acid, acetic acid, lactic acid and
their mixture possess a strong AM activity (Han, 2005). Table 2.3 lists some typical
natural and synthetic AM agents that are used in food packaging.

27 Literature Review
Table 2.3 Examples of typical AM agents used in food packaging
Class of AM agents Examples
Organic acids Propionic, benzoic, sorbic, acetic, lactic, malic, succinic, tartaric
Mineral acids Phosphoric acid
Inorganics Sulphites, sulfur dioxide
Parabens Methyl, propylparaben
Antibiotics Natamycin
Enzymes Lactoperoxidase, lysozyme, lactoferrin
Metals Silver, copper
Chelating agents Ethylene diamine tetra acetate, purophosphate, citrates
Bacteriocins Nisin, pediocins
Fungicides Benomyl, imazalil
Essential oils Eugenol, thymol, salicylaldehyde, cinnamic acid
Proteins Conalbumin, cathepsin
Phenolic antioxidants Butylatedhydroxyanisole, Butylatedhydroxytoluene 2-terbutylhydroquinone
Isothiocynanates Allyl isothiocyanate, hypothiocyanate
Fatty acids and esters Monolaurin
Others Reuterin (3-hydroxypropionaldhyde), hydrogen peroxide, ozone, sulfur dioxide
Source: Adapted from Hotchkiss (1997).
Food-grade antioxidants can be incorporated into packaging materials creating an
anaerobic atmosphere inside the package and eventually protect the food against
aerobic spoilage. Various bacteriosins that are produced by beneficial
microorganisms can also inhibit the growth of spoilage and pathogenic micro-
28 Literature Review
organisms (Ahvenainen, 2003). Fermentation products or by-products such as nisin,
lacticins, pediocin; diolococcin and propionic can also impart AM activity
(Daeschel, 1989). Some natural or synthetic polymers such as chitosan can possess
AM activity (Hong et al., 2000) while ultra-violet radiation can excite the structure
of polymers such as nylon and stimulate AM activity (Paik et al., 1998).
Gaseous AM agents can offer protection in the headspace of food packaging.
Chlorine dioxide, allyl isothiocynates, hinokithiol and ozone are examples of
gaseous AM agents that have been successfully incorporated into packages
(Gontard, 1997). Chemicals that produce chlorine dioxide when in contact with
moisture can be incorporated into film during extrusion processing (Podhajny,
2004). MicroActive Corporation (Bernard Technologies) recently developed
chlorine dioxide liberating films under the trade name Microsphere (Podhajny,
2004).
2.5 Natural Antimicrobial Agents
With the increase in consumer awareness for food safety and health standards, there
is a general concern for use of chemical preservatives in food chain (Azaz et al.,
2005). In response to this, bio-preservatives and naturally derived AM additives are
becoming more important as they represent a perceived lower risk to consumers
(Nicholson, 1998). More extensive attempts are being made in the search for
alternative AM compounds based on plant extracts (Hotchkiss, 1997). For example,
the AM effect of essential oils and their active constituents against many food borne
pathogenic bacteria including Salmonella enterica, Campylobactor jejuni (Friedman

29 Literature Review
et al., 2002), Staphylococcus aureus and Vibrio parahaemolyticus (Juven et al.,
1994) have been studied.
The use of natural extracts is often preferred due to less complex regulation
processes and consumer preference when compared to chemical AM agents (Baratta
et al., 1998). Plant extracts in particular such as grapefruit seed, cinnamon,
horseradish and cloves have been added to packaging system to demonstrate
effective AM activity against spoilage and pathogenic bacteria (Ha et al., 2001; Lee
et al. 1998; Hong et al., 2000). The essential oils of various biologically active plant
species have become popular in recent years (Ayse Dilek et al., 2005). Some
essential oils are known to possess AM activity in liquid as well as vapour media
(Ayse Dilek et al., 2005). Friedman et al. (2002) analysed a broad variety of
naturally occurring and potentially food compatible plant-derived oils and oil
compounds for AM activity. The extract showed promising AM activity against
several species of bacterial food-borne pathogens including C. jejuni, E. coli, L.
monocytogenes and S. enterica.
The use of natural AM compounds is not only important in the control of human and
plant diseases of microbial origin but also in preservation and packaging food
products (Baratta et al., 1998). Fyfe et al. (1998) studied the inhibition of L.
monocytogenes and S. enteritis by combinations of plant essential oils with either
benzoic acid or methyl-paraben. This work highlighted the fact that essential oil of
basil was a potent inhibitor of both the species. Koga et al. (1999) studied the
bacteriocidal activity of basil and sage essential oil against a range of bacteria and
their findings showed that gram-positive bacteria showed higher resistance to basil
essential oil than gram-negative bacteria. In addition to AM activity, basil oil is

30 Literature Review
often used as a flavourant in tomato based products that have high acidity and that
are prone to spoilage by acid-tolerant food microflora (Dziezak, 1989; Frierheller,
1991).
Deans and Ritchie (1987) screened the AM spectrum of 50 plants essential oils
against twenty-five genera of bacteria and all bacteria showed a reasonably broad
sensitivity to the oils tested. The AM and antifungal properties of essential oils of
different species of Ocicum have been predominantly associated with the main
constituent linalool (Sinha and Gulathi, 1990) and there have been synergistic
effects attributed to these two components against Rhizopus nigrans (Reuveni et al.,
1984). Couladis et al. (2004) demonstrated the antifungal activity of thymol and
also proved that it was a potent inhibitor of moulds thus confirming its potential for
using in food preservation. Prasad et al. (1986) studied the AM activity of essential
oils of O. basilicum which were rich in linalool against 11 gram positive and 7 gram
negative bacteria. They discovered that these oils were more effective against the
gram positive than the gram-negative bacteria. All gram positive bacteria including
Bacillus sacharolyticus, Bacillus stearothermophilus, B. subtilis, Bacillus
thurengiensis, Micrococcus glutamicus and Sarcina lutea were inhibited by each of
these basil essential oils. Only the gram-negative strain Salmonella weltevreden,
however, was suppressed by the oils. Lahariya and Rao (1979) studied the AM
effectiveness of the essential oil of O. basilicum tested in vitro against 10 different
microorganisms. They discovered that the essential oil was more active in inhibiting
the growth of Bacillus pumilus and had less activity against the fungi.
Sweet basil (Ocimum basilicum L.) is a popular culinary herb that has been widely
used as a food ingredient (Dziezak, 1989). Sweet basil has also been used for many
31 Literature Review
years as a food flavourant and as an ingredient in dental and oral health care
products (Guenther, 1952). Additionally, basil essential oils have been reported to
possess AM activity against a spectrum of gram-positive and -negative bacteria as
well as important food borne pathogens (Fyfe et al., 1998), moulds (Arora and
Pandey, 1977) and yeasts (Conner and Beuchat, 1984). Coating of LDPE films or
blending LDPE with basil extracts prior to extrusion are some of the techniques used
for obtaining AM films (Han, 2000).
Suppakul et al. (2003b) recently published articles focussing on potentials of basil
extracts in the field of AM food packaging. The investigation, evaluation, efficacy
and feasibility effect of basil AM agents when incorporated into LDPE films against
a wide section of microorganisms including Staphylococcus aureus, Listeria
innocua, Escherichia coli and Saccharomyces cerevisiae were discussed. The
resulting LDPE films proved to be promising as an active AM packaging material.
2.5.1 Properties and Uses of Thymol
The natural product of the essential oil of Thymus vulgaris, thymol, is a phenolic
monoterpene that has received considerable attention as a possible AM agent (Tepe
et al., 2004; Olasupo et al., 2004) and as a possible food antioxidant (Youdim and
Deanes, 2000; Shen et al., 2005). Sefidkon et al. (2005) extracted 19.6% thymol by
hydrodistillation from aerial parts of Thymus eriocalyx jalas growing in various
locations in central Iran with the major component observed to be linalool (1.8% -
60.4%). Kalvandi et al. (2005) extracted 42.8% to 43.1% thymol from essential oils
obtained from Thymus eriocalyx (Ronniger) species. Couladis et al. (2004) obtained
59% thymol from essential oils extracted from Thymus striatus collected from the

32 Literature Review
Orjen Mountains. Thymol was observed to be the major constituent in T.
kotschyanus (19.6%), T. carnosus (36.6%), T. pubescisus (27.1%) and T. serpullum
(18.7%) (Sefidkon et al., 2005). The hydrodistillation of essential oils from the
Saturja species in Turkey contained 17.5% - 43.5% thymol (Ayse Dilek et al.,
2005). These examples illustrate the diversity of locations and variation in
extractable quantities of naturally occurring thymol.
As an AM agent, thymol possesses very high antifungal activity with very low MIC
values (Thompson, 1989). Couladis et al. (2004) reported thymol to possess a
significant antifungal activity, a low MIC and potent mould inhibitory properties.
Ayse Dilek et al. (2005) reported that essential oils containing thymol possess strong
antibacterial and antifungal action. Radulovic et al. (2006) showed that the essential
oil of Equisetum arvense L. possesses a broad spectrum of strong AM activity
attributed to the presence of thymol (12.9%) and linalool (2.77%).
2.5.2 Properties and Uses of Linalool
Basil is a popular culinary herb and its essential oils have been used in wide
applications in perfumery and oral products (Guenther, 1952). Basil oil has been
shown to contain biologically active constituents that are fungistatic and have AM
properties (Simon et al., 1990). Several types of essential oils are extracted from
basil oils and classified according to their geographic origin (Marotti et al., 1996).
The oils containing linalool are extracted traditionally by steam distillation from the
leaves, stems and flowers of the plant. An alternative to the conventional steam
distillation method is carbon dioxide extraction under supercritical extraction.
Roberto and James (2006) detected 21 different volatile constituents of O. basilicum

33 Literature Review
and linalool was observed to be the major constituent. Lorenzo et al. (2003)
extracted linalool by the hydrodistillation of essential oils obtained from the leaves
of H. angustifolium and H. scabrum. Linalool was found to be the most abundant
component (23.8%) of bark oil obtained by the hydrodistillation of wood oils from
Cinnamomum sintoc Blume found in the forest of peninsular Malaysia by Jantan et
al. (2005). Raina et al. (2001) performed gas chromatographic analysis of the
hydrodistillation extract of fresh leaves of Cinnamomum zeylanicum Blume grown in
Little Andaman and observed that linalool was a major constituent of the 47
constituents identified representing the 99.96% of the oil. Certain Lippia alba
grown in Indian plains and their cultivated clones have been reported to yield 65%
linalool from the extracted essential oils (Bahl et al., 2000). Studies conducted by
hydrodistillation on Zanthoxylum alatum seeds (Neetu et al., 2001) reported high
levels of linalool (70.6%) from seeds obtained in northern India. Singh et al. (2005)
demonstrated by gas chromatographic analysis that coriander seed essential oils
contain more than 52 components with the major component being linalool (75.3%).
Furthermore, this study explored the potent antifungal activity of linalool suggesting
it can be used as an alternative source of natural antioxidants.
The active volatile components of essential oils (e.g. linalool) are responsible for the
AM activity of these essential oils (Bezic et al., 2003). It has been shown that
phenolic components of essential oils have the strongest AM activity followed by
camphor compounds (Mario et al., 1998). Linalool has been previously reported to
have effective antibacterial (Onawunmi et al., 1984) and antifungal (Reuveni et al.,
1984) properties that would be ideal for its use in AM film development.

34 Literature Review
2.6 The Properties of Antimicrobial Films
Antimicrobial agents that are blended with polymeric materials are most likely to be
dispersed in the amorphous region of the polymeric structure. If an excessive
amount of AM agent is mixed into the polymer, the amorphous region can be
saturated and the additive can interfere with the polymer-polymer interactions in the
crystalline regions (Han, 2003). The selection of polymer, polymer additive and
AM agents is therefore important in developing an AM packaging system.
Antimicrobial agents and additives that are blended with a polymer packaging
material may affect the processability, physicomechanical properties and optical
properties of the resulting polymer product.
Transparent film materials are highly desired for food packaging applications for
product visibility (Park et al., 1998; Wang et al., 2005). Han and Floras (1997)
suggested an optimum transparency for LDPE films is ca. 15-20%. These workers
also reported no significant difference in the tensile properties before and after the
incorporation of potassium sorbate in LDPE films although the transparency of the
films deteriorated as the sorbate concentration was increased. Weng and Hotchkiss
(1993) reported no noticeable difference in clarity and strength of an LDPE film
containing 0.5% and 1% (w/w) benzoic anhydride. Similar results were reported for
naturally derived plant extracts such as 5% propolis, 5% clove (Hong et al., 2000),
1% R. palmatum (An et al., 1998) and 1% C. chinensis (Chung et al., 1998).
Although no physical integrity damage is observed after a low level of AM agent
addition, optical properties can be changed with a loss in transparency or colour
change of some packaging materials (Han and Floras, 1997). Studies conducted by
Baldev et al. (2000) showed that the optical properties of polymer film were
35 Literature Review
adversely affected after incorporation of low molecular weight fillers. The
percentage transmission of these films was reduced from 71% to 36% and the haze
increased from 23% to 55%, with the increase in additive content from 0% to
50% (w/w).
Studies conducted by Park et al. (1998) on coated AM films containing
polysaccharide and additives showed that the haze index was higher than that of the
normal uncoated film. The haze was produced due to irregularities and the
heterogeneity of the polymer. The transparency of the coated films appeared to
decrease with the increasing molecular size of the plasticiser used for coating.
Wang et al. (2005) investigated the transparency of antibacterial LDPE films
containing titanium dioxide and observed that the transparency of the films
decreases with the increase in dosage of the incompatible additive. Inclusion of
another incompatible additive, silica gel, in LDPE blown films produced by
Chuayjuljit et al. (2003) showed that the haze and gloss characteristics of the film
were altered with the increase in the particle size and the amount of additive.
Vartiainen et al. (2003) concluded that the transparency of AM films containing
EDTA decreases rapidly with the increase in EDTA content. Recent studies
conducted by Suppakul (2004) on LDPE-EVA blown film containing natural AM
agents showed that there is a statistically significant decrease in transparency of AM
films. The transparency of films containing linalool is less when compared to that
of the LDPE-EVA control films without linalool.
Mechanical and sealing properties can also be adversely affected by the addition of
AM agents. Dobias et al. (2000) observed that samples containing AM agents such
36 Literature Review
as benzoic anhydride, ethyl paraben or propyl paraben had poor tensile and sealing
properties. Cooksey (2000) reported that LDPE films coated with nisin are difficult
to heat seal.
2.7 The Future of AM Films for Packaging Applications
Since most AM agents have different AM activities, a combination of different
agents may improve the overall AM efficacy and the safety of packaged foods.
Balancing AM products and their effectiveness depends on the AM additives, the
substrate and the food products themselves. Another possibility for AM films may
be incorporation of radiation emitting material into the films. Materials that emit
long wavelength IR radiation have been developed in an attempt to control
microorganisms without the risk associated with high-energy radiation (Rooney,
1995a). However, little evidence for the efficacy of this technology has been
published in the scientific literature to date.
Although the current literature widely reports the properties and AM activity of a
variety of agents in polymer films, the kinetics of migration of these agents are yet
to be fully investigated. Studies of the loss of AM agents from extruded films, the
effect of polymer additives on the retention of AM agents, and studies of the
morphology of polymers blended with AM agents would also be beneficial to the
current literature. Further studies of the controlled release of AM agents from
polymer films would be of particular interest for the development of successful
active packaging systems.
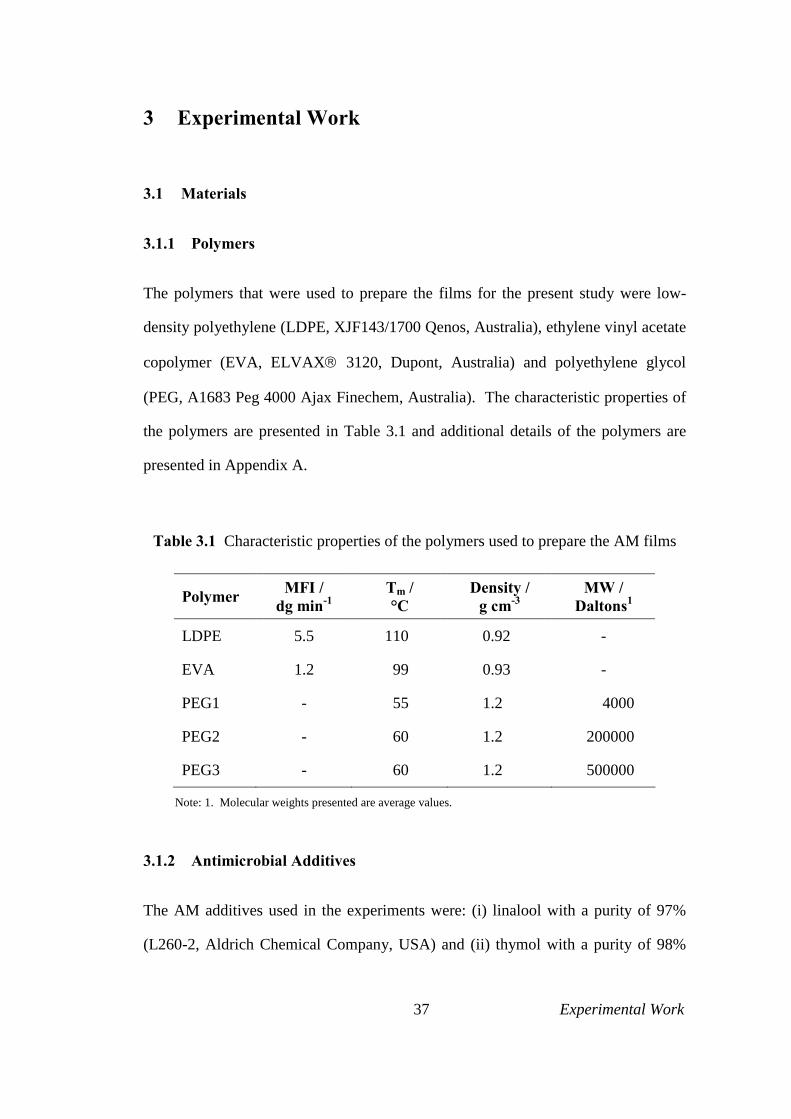
37 Experimental Work
3 Experimental Work
3.1 Materials
3.1.1 Polymers
The polymers that were used to prepare the films for the present study were low-
density polyethylene (LDPE, XJF143/1700 Qenos, Australia), ethylene vinyl acetate
copolymer (EVA, ELVAX 3120, Dupont, Australia) and polyethylene glycol
(PEG, A1683 Peg 4000 Ajax Finechem, Australia). The characteristic properties of
the polymers are presented in Table 3.1 and additional details of the polymers are
presented in Appendix A.
Table 3.1 Characteristic properties of the polymers used to prepare the AM films
Polymer MFI / dg min-1
Tm / °C
Density / g cm-3
MW / Daltons1
LDPE 5.5 110 0.92 -
EVA 1.2 99 0.93 -
PEG1 - 55 1.2 4000
PEG2 - 60 1.2 200000
PEG3 - 60 1.2 500000
Note: 1. Molecular weights presented are average values.
3.1.2 Antimicrobial Additives
The AM additives used in the experiments were: (i) linalool with a purity of 97%
(L260-2, Aldrich Chemical Company, USA) and (ii) thymol with a purity of 98%

38 Experimental Work
(AUSTL 21320, Aurora Pty Ltd, Australia). Additional details of the AM additives
are presented in Appendix A.
3.1.3 Solvents
The chemicals used in the experiments were isooctane (Unichrom 2516-2.5L GL,
purchased from APS Chemicals, Australia) and ethanol (95 SG, CSR Distilleries,
Australia).
3.2 Blend Preparation and Film Production
3.2.1 Incorporation of AM Agent into the Polymer
Film grade LDPE resin pellets and EVA resin pellets were ground to a powder in an
industrial grinder (CTS Plastics Machinery Pty Ltd, Australia). Flakes of the PEG
were crushed to powder using a glass rod. The AM agents were blended directly
and mixed to ensure uniformity at room temperature.
3.2.2 Compression Moulded Film Production
Films were prepared by compression moulding of the LDPE formulation to a
thickness of ca. 2 mm using a compression moulding press (Laboratory press 15T,
L0003, IDM Instrument Pty Ltd, Australia). A hard-chromed steel frame of 2 mm
thickness was placed between the two platens of the press with the temperatures of
the upper and lower platens set to 120°C. The polymer formulation was placed at
the centre of the frame and was sandwiched between the two platens. As the
polymer formulation melted, a compression force was gradually applied up to

39 Experimental Work
130 kPa. The platens were then allowed to cool to 20°C by water circulation
through a coil in the platens. The pressure was released and the films that were
produced were folded and again heated in the press up to 3 times to facilitate
uniform mixing. After the pressing operation, the films were immediately wrapped
in aluminium foil to prevent loss of the AM agent. A hand held micrometer
(Mitutoyo, Japan) was used for measuring the thickness.
3.2.3 Film Production to Study the Retention Ability of PEG
Polymer blends consisting of LDPE, EVA, AM agent and varying concentrations of
PEG were compressed to films in accordance with the method described in Section
3.2.2. Details of the film formulations that were prepared are given in Table 3.2.
Table 3.2 Film formulations used to study the retention ability of PEG
Formulation P0 P1 P2 P3 P4
LDPE 88 87 86 86 86
Linalool 2 2 2 2 2
EVA 10 10 10 10 10
PEG1 - 1 2 - -
PEG2 - - - 2 -
PEG3 - - - - 2
Note: Values shown are % (w/w).
3.2.4 Film Production to Study the Retention Ability of EVA
Polymer blends consisting of LDPE, AM agent and varying concentrations of EVA
were compression moulded into films in accordance with the method described in

40 Experimental Work
Section 3.2.2. Details of the film formulations that were prepared are given in
Table 3.3.
Table 3.3 Film formulations used to study the retention ability of EVA
Formulation E0 E1 E2
LDPE 98 88 48
Linalool 2 2 2
EVA 0 10 50
Note: Values shown are % (w/w).
3.2.5 Film Production to Study the Effect of AM Agent
Polymer blends consisting of LDPE, AM agent, EVA or PEG were compression
moulded into films in accordance with the method given in Section 3.2.2. Details of
the film formulations that were prepared are given in Table 3.4.
Table 3.4 Film formulations used in AM agent release experiments
Formulation L0 L1 T0 T1
LDPE 88 87 88 87
Linalool 2 2 - -
Thymol - - 2 2
EVA 10 10 10 10
PEG1 - 1 - 1
Note: Values shown are % (w/w).
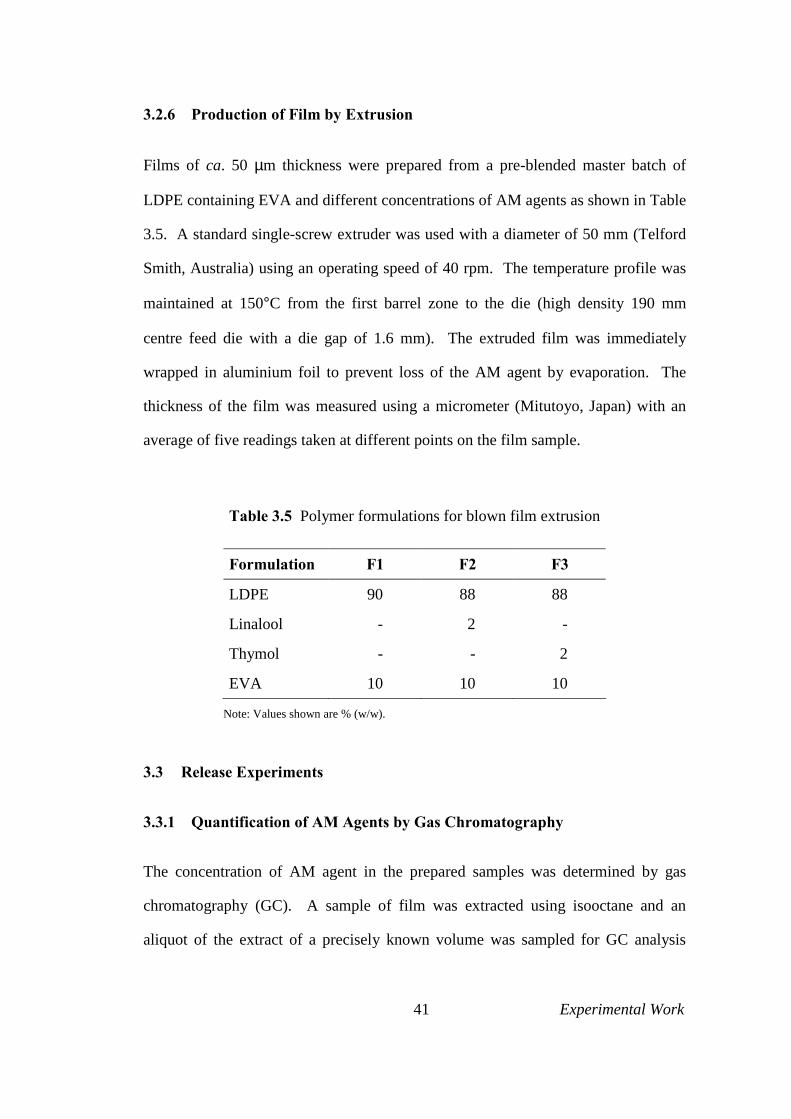
41 Experimental Work
3.2.6 Production of Film by Extrusion
Films of ca. 50 µm thickness were prepared from a pre-blended master batch of
LDPE containing EVA and different concentrations of AM agents as shown in Table
3.5. A standard single-screw extruder was used with a diameter of 50 mm (Telford
Smith, Australia) using an operating speed of 40 rpm. The temperature profile was
maintained at 150°C from the first barrel zone to the die (high density 190 mm
centre feed die with a die gap of 1.6 mm). The extruded film was immediately
wrapped in aluminium foil to prevent loss of the AM agent by evaporation. The
thickness of the film was measured using a micrometer (Mitutoyo, Japan) with an
average of five readings taken at different points on the film sample.
Table 3.5 Polymer formulations for blown film extrusion
Formulation F1 F2 F3
LDPE 90 88 88
Linalool - 2 -
Thymol - - 2
EVA 10 10 10
Note: Values shown are % (w/w).
3.3 Release Experiments
3.3.1 Quantification of AM Agents by Gas Chromatography
The concentration of AM agent in the prepared samples was determined by gas
chromatography (GC). A sample of film was extracted using isooctane and an
aliquot of the extract of a precisely known volume was sampled for GC analysis

42 Experimental Work
using a Varian Star 3400-CX GC equipped with fused silica capillary column DB-5
(30 × 0.25 mm inner diameter, film thickness 0.25 µm, J. & W. Scientific, USA).
The GC was operated using the following conditions: injection volume: 1.0 µl;
initial column temperature: 80°C; heating rate: 5°C min-1; injector temperature:
250°C; split ratio 1:100; FID detector temperature: 300°C; and carrier gas: nitrogen.
The concentration of AM agent was calculated from standard curves.
3.3.2 Antimicrobial Agent Release using Incubators
Compression moulded film samples of approximately 5 × 5 cm were immersed in a
sealed vessel of 100 mL of isooctane and were placed in an incubator shaker
(InnovaTM 4230, New Brunswick Scientific, U.S.A.) maintained at 25°C. The
amount of AM agent released was monitored until equilibrium was attained. An
aliquot of the solution was analysed by GC at different time intervals as described in
Section 3.3.1. The release of AM agents from the extruded films into the food
simulants was investigated by immersing ca. 0.5 g (4 pieces, 5 × 5 cm) of weighed
film sample into 100 mL of isooctane, ethanol (95% and 15%) or distilled water in a
sealed vessel as described in Section 3.3.1.
3.3.3 Antimicrobial Agent Quantification using Soxhlet Extraction
In order to determine the amount of AM agent retained in the film after extrusion,
the film samples were cut into small pieces and ca. 5 g of each film sample was
extracted for 18 h by Soxhlet extraction using 150 mL of isooctane. An aliquot of
the extract of a precisely known volume was sampled for GC analysis as described
in Section 3.3.1.

43 Experimental Work
3.4 Data Analysis
In order to determine the release of the AM agent from the polymer film
formulations, two data analysis treatments were applied to the release data.
3.4.1 Migration as a Diffusion Process
The release of the AM agent from the film into a food simulant is a diffusion
process. Equations relating the mass fraction of molecules migrating from a
polymer film with time have been derived by Miltz (1987).
For short-term migration (mt/m∞) < 0.6:
21
24
=
∞ lDt
mmt
π (1)
where mt is the amount of AM agent released from the film, m∞ is the equilibrium
amount of AM agent released from the film, D is the diffusion coefficient and l is
the thickness of the film. A plot of (mt/m∞) versus t½ should yield a straight line
from which the diffusion coefficient can be obtained.
For long-term migration (mt/m∞) > 0.6:
−−=∞
2
2
2 exp81l
Dtmmt π
π (2)
Rearranging equation (2) becomes:
2
2
2
8ln1lnlDt
mmt π
π−
=
−
∞
(3)

44 Experimental Work
ktmmt −
=
−
∞2
8ln1lnπ
(4)
where k is the rate constant. From equation (4), a plot of ln(1 – mt/m∞) versus time
should yield a straight line with slope, -k.
For the release experiments, the diffusion coefficients were calculated using
equation (1) for short-term migration. The rate constants were calculated using
equation (4) for long-term migration.
3.4.2 Migration as a Chemical Process
In addition to the diffusion analysis, the release of AM agent into the food simulant
was further analysed for the fit to first-order kinetics. This analysis technique can
provide an initial release rate as well as a rate constant. Figure 3.1 shows a plot of a
typical first-order kinetics system.
0.0
0.2
0.4
0.6
0.8
1.0
time
mas
s fra
ctio
n of
AM
age
nt
Figure 3.1. Plot of mass of AM versus time for a first order kinetic system where: (!!!!) mass of AM in packaging material and ("""") mass of AM released.

45 Experimental Work
A similar experimental plot of mass fraction of AM agent released versus time
would confirm that first order kinetics adequately models the release process.
For a first-order system, the rate of loss of the active agent from the packaging
material is given by:
pt km
dtdm
−= (5)
where mt is the amount of AM agent released into the food simulant, mp is the
amount of AM agent in the packaging material, and k is the rate constant. At any
point in time, the equilibrium concentration of the active agent, m∞, is given by:
pt mmm +=∞ (6)
Rearranging and substituting equation (6) in equation (5), the equation becomes:
)( tt mmk
dtdm
−−= ∞ (7)
Integrating equation (7) from time t = 0 to t, and concentration mp = m∞ to mp = m∞ -
mt, the equation becomes:
ktmmt −=−
∞
)1ln( (8)
From equation (8), a plot of ln(1 – mt/m∞) versus time should yield a straight line
with slope, -k. Equation (9) is obtained by re-arranging equation (8):
)1( kt
t emm −∞ −= (9)
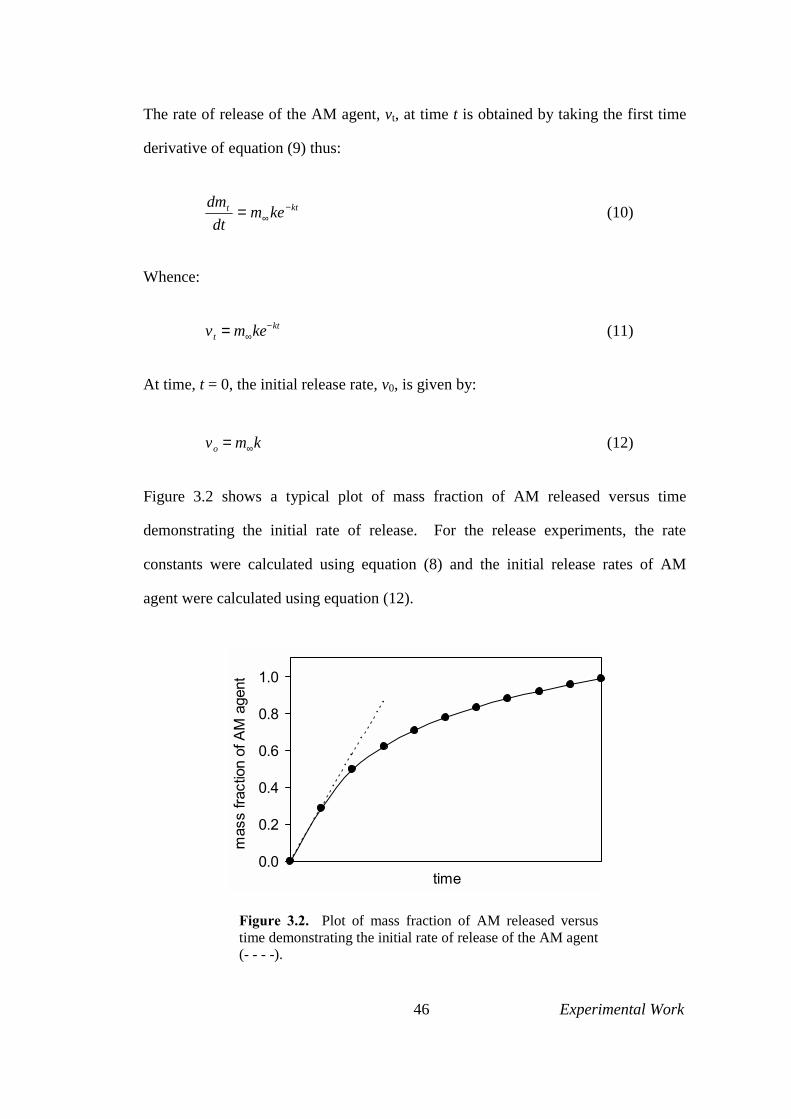
46 Experimental Work
The rate of release of the AM agent, vt, at time t is obtained by taking the first time
derivative of equation (9) thus:
ktt kem
dtdm −
∞= (10)
Whence:
vt = m∞ke−kt (11)
At time, t = 0, the initial release rate, v0, is given by:
vo = m∞k (12)
Figure 3.2 shows a typical plot of mass fraction of AM released versus time
demonstrating the initial rate of release. For the release experiments, the rate
constants were calculated using equation (8) and the initial release rates of AM
agent were calculated using equation (12).
0.0
0.2
0.4
0.6
0.8
1.0
time
mas
s fra
ctio
n of
AM
age
nt
Figure 3.2. Plot of mass fraction of AM released versus time demonstrating the initial rate of release of the AM agent (- - - -).
47 Experimental Work
3.5 Thermogravimetric Analysis
A Perkin-Elmer Thermogravimetric Analyser (TGA 7) was used to obtain the mass
loss of AM agents from the extruded films in nitrogen at elevated temperatures. The
mass loss for films containing linalool and thymol were measured in the TGA
apparatus by heating the samples from 35°C to ca. 200°C at a heating rate of 20°C
min-1, using a nitrogen flow rate of 20 mL min-1.
3.6 Mechanical and Optical Properties of AM Films
The effect of AM agents on the mechanical properties of the extruded films was
investigated by measuring the tensile strength. The peak load of the film section
(1 × 10) inch was determined using an Instron 4465 (USA) tensile tester in
accordance with ASTM Method D 882-97. The percent haze of some of the films
was measured using a Gardener hazemeter in accordance with ASTM Method D
1003-97. A total of five and four replicates were tested for the tensile and haze
measurements respectively.
48 Results & Discussion
4 Results and Discussion
This chapter examines the processing of blends of LDPE with AM agents and
additive polymers by a compression moulding technique and by extrusion film
blowing. The release of the AM agents from the resulting films into food simulants
is analysed. In addition, the use of TGA analysis was explored.
4.1 Effect of Compounding LDPE with PEG
Prior to preparation of the blends by blown film extrusion, the effect of
compounding the additive polymer (PEG1) with film-grade LDPE was observed
using compression moulding. Due to the differences in melting temperatures of the
additive polymer (PEG, ca. 55°C) and LDPE (ca. 110°C), the PEG melted first and
separated out to the periphery of the solid LDPE. As a compression force was
applied, the LDPE gradually melted with the resultant film comprising two separate
phases, with particles of PEG clearly visible on the boundary of the film.
With a decrease in PEG concentration, the phase separation was observed to
decrease, with a subsequent increase in homogeneity and clarity. At a low
concentration of PEG (ca. 1% (w/w)), a semi-transparent homogenous film was
obtained. The immiscibility of PEG and LDPE may be due to the high difference in
melt viscosity between PEG and LDPE (see Appendix A). A technique of
melt-mixing the constituents and using finely ground PEG may improve miscibility
and subsequent film clarity.

49 Results & Discussion
4.2 Blown Film Extrusion of LDPE/EVA/PEG Blends
4.2.1 Effect of EVA and PEG on LDPE Extruded Films
Blown film extrusion processing of LDPE/EVA blends containing as low as 1%
(w/w) PEG caused choking in the feed section of the extrusion unit and the throat of
the gravity feed hopper. The relatively low melting point of PEG and the
subsequent softening of this component in the feeding zone of the extruder may
account for the observed choking. The softening of the PEG caused agglomeration
and adhesion of LDPE pellets to the single-screw and obstructed the progression of
the polymer into the melting zone of the extruder and consequently no stable bubble
was obtained during the process. Furthermore, bubble instability and holes were
evident during extrusion that may be due to the incompatibility of the
PEG/LDPE/EVA blend. The hydrophilic nature of PEG in contrast to the
hydrophobic nature of LDPE may contribute to the blend incompatibility
(Tillekeratne and Easteal, 2000). The inefficiency of mixing in the single-screw
extruder and the particle size of PEG may also have interfered with the crystalline
structure of the LDPE/EVA blend.
When a batch containing EVA and LDPE without PEG was extruded under identical
conditions, a stable bubble was observed during extrusion and a film of uniform
thickness was obtained. The bubble diameter was observed to be constant and
uniform throughout the extrusion process while a constant screw speed was
maintained. A stable film was produced with the incorporation of 2% (w/w) linalool
or thymol and there was no significant difference observed in the bubble diameter
and film thickness with the incorporation of either AM agent at this level.
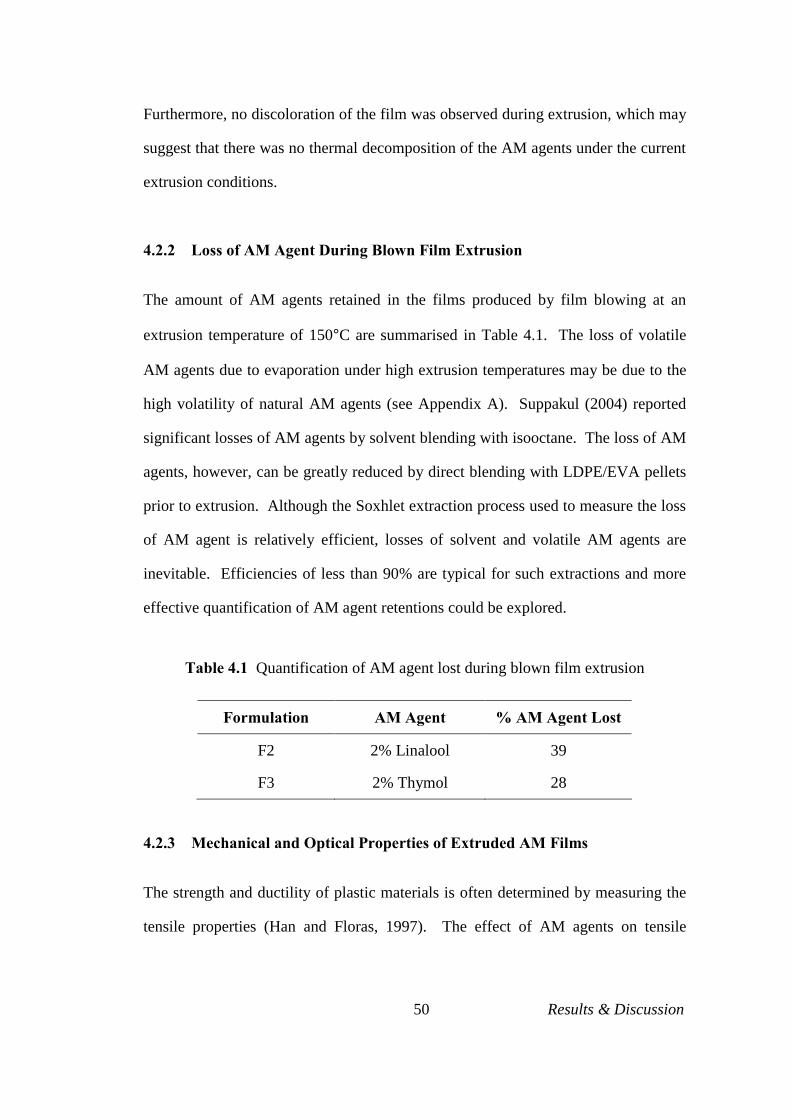
50 Results & Discussion
Furthermore, no discoloration of the film was observed during extrusion, which may
suggest that there was no thermal decomposition of the AM agents under the current
extrusion conditions.
4.2.2 Loss of AM Agent During Blown Film Extrusion
The amount of AM agents retained in the films produced by film blowing at an
extrusion temperature of 150°C are summarised in Table 4.1. The loss of volatile
AM agents due to evaporation under high extrusion temperatures may be due to the
high volatility of natural AM agents (see Appendix A). Suppakul (2004) reported
significant losses of AM agents by solvent blending with isooctane. The loss of AM
agents, however, can be greatly reduced by direct blending with LDPE/EVA pellets
prior to extrusion. Although the Soxhlet extraction process used to measure the loss
of AM agent is relatively efficient, losses of solvent and volatile AM agents are
inevitable. Efficiencies of less than 90% are typical for such extractions and more
effective quantification of AM agent retentions could be explored.
Table 4.1 Quantification of AM agent lost during blown film extrusion
Formulation AM Agent % AM Agent Lost
F2 2% Linalool 39
F3 2% Thymol 28
4.2.3 Mechanical and Optical Properties of Extruded AM Films
The strength and ductility of plastic materials is often determined by measuring the
tensile properties (Han and Floras, 1997). The effect of AM agents on tensile
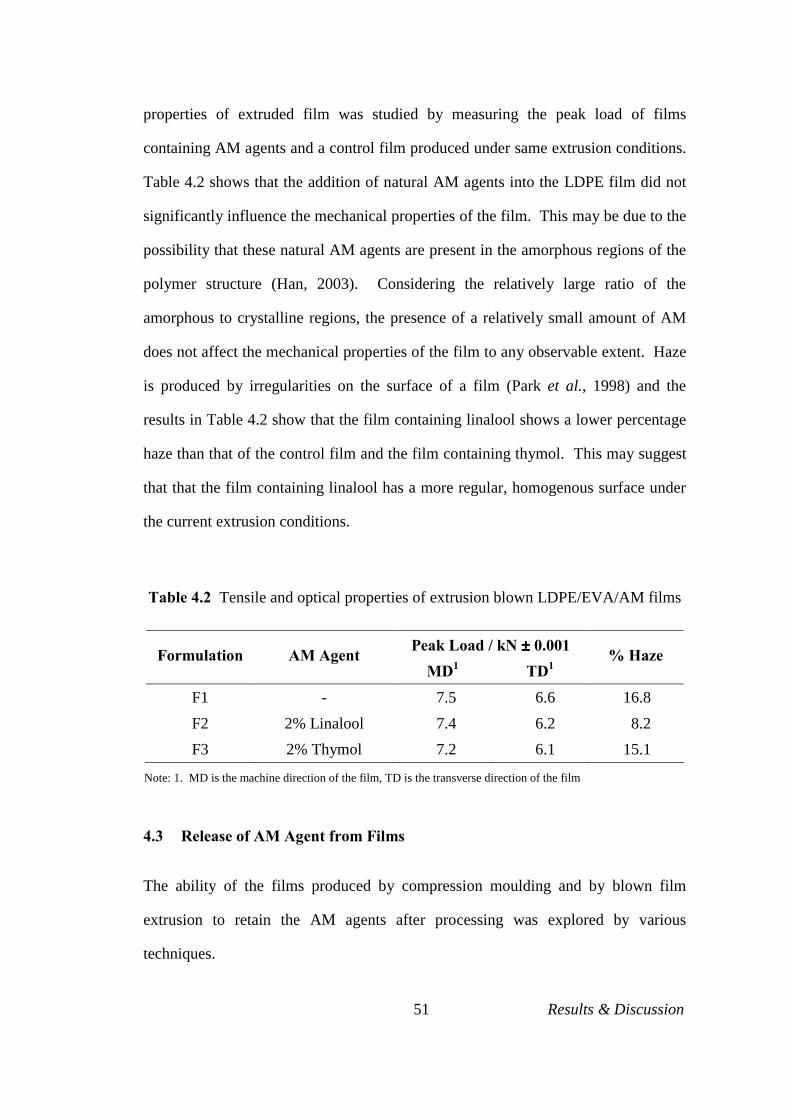
51 Results & Discussion
properties of extruded film was studied by measuring the peak load of films
containing AM agents and a control film produced under same extrusion conditions.
Table 4.2 shows that the addition of natural AM agents into the LDPE film did not
significantly influence the mechanical properties of the film. This may be due to the
possibility that these natural AM agents are present in the amorphous regions of the
polymer structure (Han, 2003). Considering the relatively large ratio of the
amorphous to crystalline regions, the presence of a relatively small amount of AM
does not affect the mechanical properties of the film to any observable extent. Haze
is produced by irregularities on the surface of a film (Park et al., 1998) and the
results in Table 4.2 show that the film containing linalool shows a lower percentage
haze than that of the control film and the film containing thymol. This may suggest
that that the film containing linalool has a more regular, homogenous surface under
the current extrusion conditions.
Table 4.2 Tensile and optical properties of extrusion blown LDPE/EVA/AM films
Peak Load / kN ±±±± 0.001 Formulation AM Agent MD1 TD1
% Haze
F1 - 7.5 6.6 16.8 F2 2% Linalool 7.4 6.2 8.2 F3 2% Thymol 7.2 6.1 15.1
Note: 1. MD is the machine direction of the film, TD is the transverse direction of the film
4.3 Release of AM Agent from Films
The ability of the films produced by compression moulding and by blown film
extrusion to retain the AM agents after processing was explored by various
techniques.

52 Results & Discussion
4.3.1 Effect of PEG on the Release of AM Agent
The effect of varying the amount and MW of PEG on the release of the AM agent
linalool was explored. Plots of mass fraction of linalool released versus time for
blends containing 1% and 2% (w/w) PEG1 are presented in Figure 4.1 and Figure
4.2 respectively. From these plots it is evident that the release of linalool with time
is similar for blends containing 1% or 2% (w/w) PEG1. Furthermore, the time taken
to release almost all of the linalool from the film is ca. 90 min in each case. Similar
plots were obtained for formulations containing PEG2 and PEG3 with linalool (see
Appendix B).
0.0
0.2
0.4
0.6
0.8
1.0
0 1000 2000 3000 4000 5000time / s
mas
s fra
ctio
n of
linal
ool
Figure 4.1. Plot of mass fraction (mt/m∞) of linalool released into isooctane at 25°C versus time from the compression moulded film containing 1% (w/w) PEG1 (P1).
Plots of (mt/m∞) versus t½ and of ln(1 - mt/m∞) versus time for blends containing 1%
and 2% (w/w) PEG1 are shown in Figure 4.3 and 4.4 respectively. Similar plots
were obtained for formulations containing PEG2 and PEG3 with linalool (see
Appendix B). The linearity of these plots confirms the data are adequately described
by equation (1) for short-term migration and equation (4) for long-term migration.

53 Results & Discussion
0.0
0.2
0.4
0.6
0.8
1.0
0 1000 2000 3000 4000 5000time / s
mas
s fra
ctio
n of
linal
ool
Figure 4.2. Plot of mass fraction (mt/m∞) of linalool released into isooctane at 25°C versus time from the compression moulded film containing 2% (w/w) PEG1 (P2).
-3.5
-3.0
-2.5
-2.0
-1.5
-1.0
-0.5
1000 1400 1800 2200 2600time / s
(b)
ln(1 - mt /m
∞ )
0.0
0.1
0.2
0.3
0 4 8 12time1/2 / s1/2
mas
s fra
ctio
n of
linal
ool
(a)
Figure 4.3. Plots of: (a) (mt/m∞) versus t½ and (b) ln(1 - mt/m∞) versus time for a blend containing 1% (w/w) PEG1 (P1) in isooctane at 25°C.
-3.5
-3.0
-2.5
-2.0
-1.5
-1.0
-0.5
1000 1400 1800time / s
(b)
ln(1 - mt /m
∞ )
0.0
0.1
0.2
0.3
0.4
0.5
0 10 20 30time1/2 / s1/2
mas
s fra
ctio
n of
lina
lool (a)
Figure 4.4. Plots of: (a) (mt/m∞) versus t½ and (b) ln(1 - mt/m∞) versus time for a blend containing 2% (w/w) PEG1 (P2) in isooctane at 25°C.

54 Results & Discussion
Plots of ln(1 - mt/m∞) versus time for blends containing 1% and 2% (w/w) PEG1 are
presented in Figure 4.5 and Figure 4.6 respectively. The linearity of these plots
suggests that these systems are consistent with first order kinetics (equation (8)).
Similar plots were obtained for formulations containing PEG2 and PEG3 with
linalool (see Appendix B).
-3.5-3.0-2.5-2.0-1.5-1.0-0.50.0
0 400 800 1200 1600 2000 2400time / s
ln(1
- m
t /m∞)
Figure 4.5. Plot of ln(1 - mt/m∞) versus time for the release of linalool into isooctane at 25°C from the compression moulded film containing 1% (w/w) PEG1 (P1).
-3.5
-3.0
-2.5
-2.0
-1.5
-1.0
-0.5
0.0
0 400 800 1200 1600 2000time / s
ln(1
- m
t /m∞)
Figure 4.6. Plot of ln(1 - mt/m∞) versus time for the release of linalool into isooctane at 25°C from the compression moulded film containing 2% (w/w) PEG1 (P2).
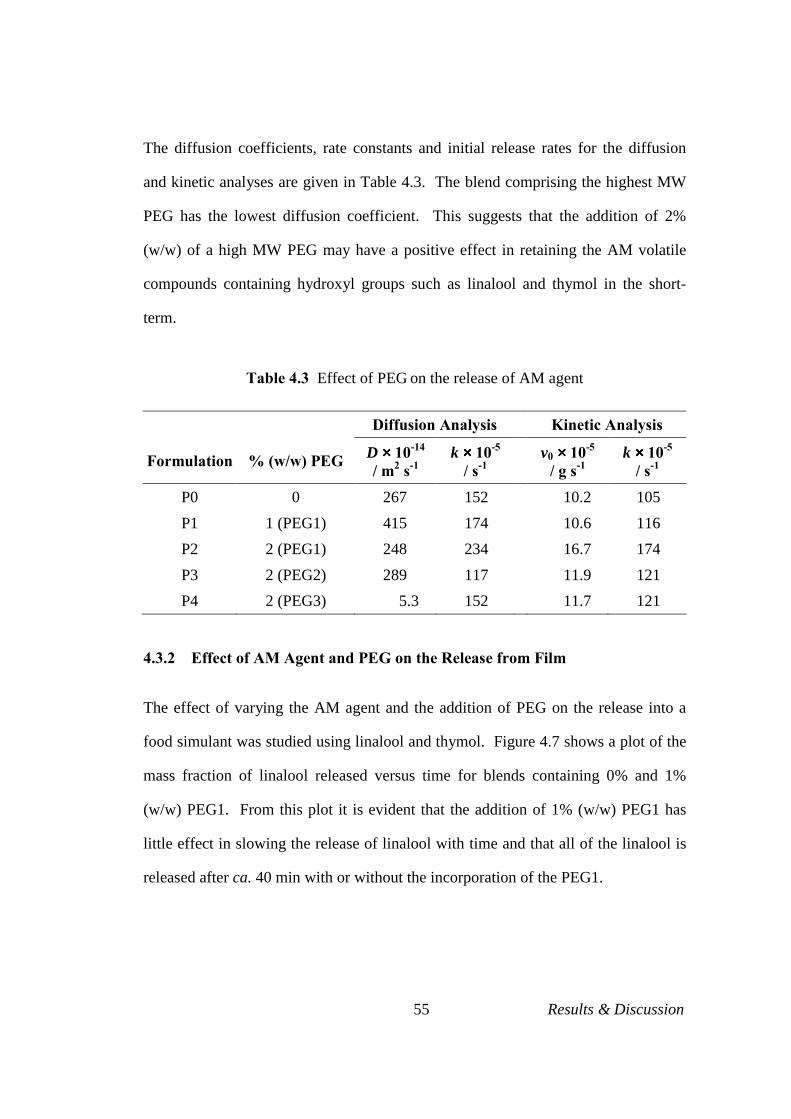
55 Results & Discussion
The diffusion coefficients, rate constants and initial release rates for the diffusion
and kinetic analyses are given in Table 4.3. The blend comprising the highest MW
PEG has the lowest diffusion coefficient. This suggests that the addition of 2%
(w/w) of a high MW PEG may have a positive effect in retaining the AM volatile
compounds containing hydroxyl groups such as linalool and thymol in the short-
term.
Table 4.3 Effect of PEG on the release of AM agent
Diffusion Analysis Kinetic Analysis
Formulation % (w/w) PEG D ×××× 10-14
/ m2 s-1 k ×××× 10-5
/ s-1 v0 ×××× 10-5
/ g s-1 k ×××× 10-5
/ s-1 P0 0 267 152 10.2 105 P1 1 (PEG1) 415 174 10.6 116 P2 2 (PEG1) 248 234 16.7 174 P3 2 (PEG2) 289 117 11.9 121 P4 2 (PEG3) 5.3 152 11.7 121
4.3.2 Effect of AM Agent and PEG on the Release from Film
The effect of varying the AM agent and the addition of PEG on the release into a
food simulant was studied using linalool and thymol. Figure 4.7 shows a plot of the
mass fraction of linalool released versus time for blends containing 0% and 1%
(w/w) PEG1. From this plot it is evident that the addition of 1% (w/w) PEG1 has
little effect in slowing the release of linalool with time and that all of the linalool is
released after ca. 40 min with or without the incorporation of the PEG1.
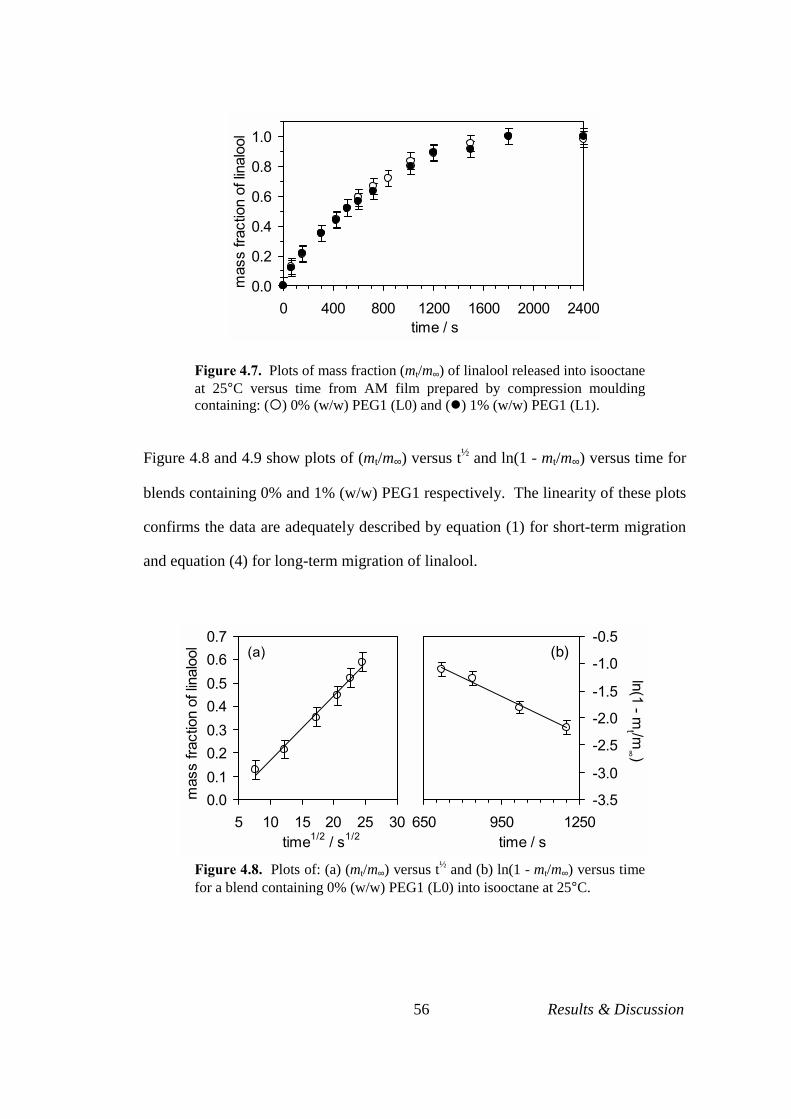
56 Results & Discussion
0.0
0.2
0.4
0.6
0.8
1.0
0 400 800 1200 1600 2000 2400time / s
mas
s fra
ctio
n of
linal
ool
Figure 4.7. Plots of mass fraction (mt/m∞) of linalool released into isooctane at 25°C versus time from AM film prepared by compression moulding containing: (!) 0% (w/w) PEG1 (L0) and (") 1% (w/w) PEG1 (L1).
Figure 4.8 and 4.9 show plots of (mt/m∞) versus t½ and ln(1 - mt/m∞) versus time for
blends containing 0% and 1% (w/w) PEG1 respectively. The linearity of these plots
confirms the data are adequately described by equation (1) for short-term migration
and equation (4) for long-term migration of linalool.
-3.5
-3.0
-2.5
-2.0
-1.5
-1.0
-0.5
650 950 1250time / s
(b)
ln(1 - mt /m
∞ )
0.00.10.20.30.40.50.60.7
5 10 15 20 25 30time1/2 / s1/2
mas
s fra
ctio
n of
lina
lool (a)
Figure 4.8. Plots of: (a) (mt/m∞) versus t½ and (b) ln(1 - mt/m∞) versus time for a blend containing 0% (w/w) PEG1 (L0) into isooctane at 25°C.
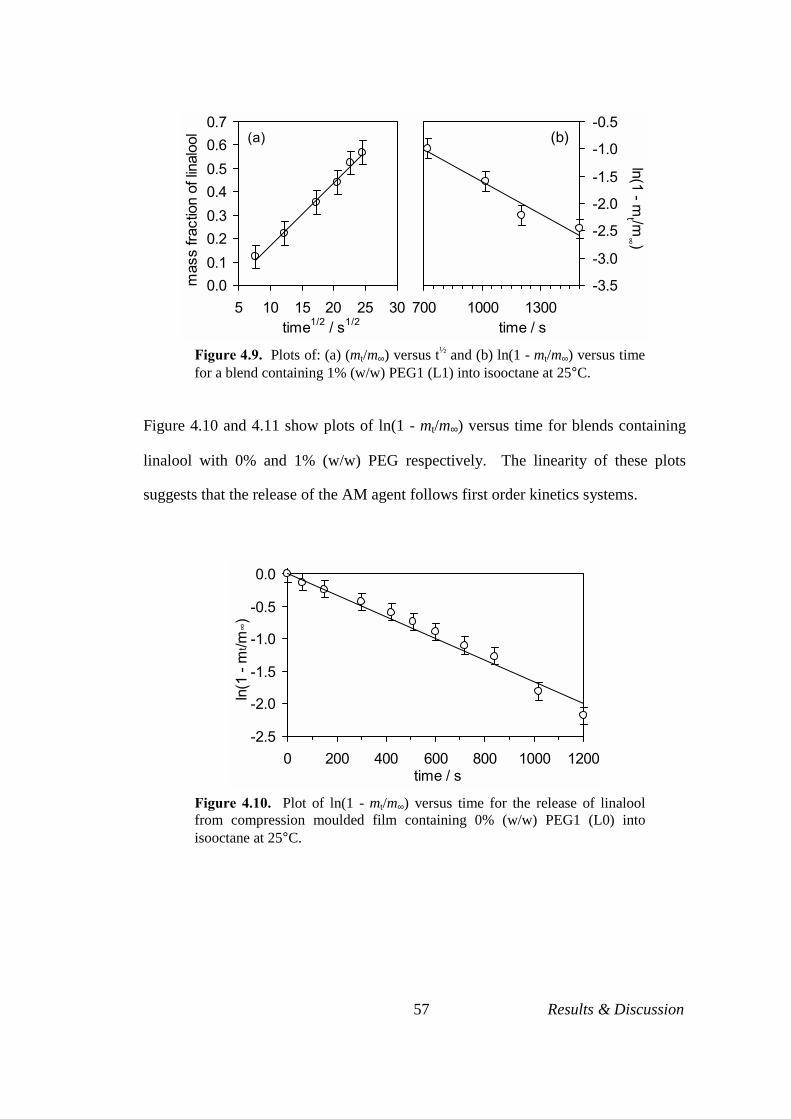
57 Results & Discussion
-3.5
-3.0
-2.5
-2.0
-1.5
-1.0
-0.5
700 1000 1300time / s
(b)ln(1 - m
t /m∞ )
0.00.10.20.30.40.50.60.7
5 10 15 20 25 30time1/2 / s1/2
mas
s fra
ctio
n of
lina
lool (a)
Figure 4.9. Plots of: (a) (mt/m∞) versus t½ and (b) ln(1 - mt/m∞) versus time for a blend containing 1% (w/w) PEG1 (L1) into isooctane at 25°C.
Figure 4.10 and 4.11 show plots of ln(1 - mt/m∞) versus time for blends containing
linalool with 0% and 1% (w/w) PEG respectively. The linearity of these plots
suggests that the release of the AM agent follows first order kinetics systems.
-2.5
-2.0
-1.5
-1.0
-0.5
0.0
0 200 400 600 800 1000 1200time / s
ln(1
- m
t /m∞)
Figure 4.10. Plot of ln(1 - mt/m∞) versus time for the release of linalool from compression moulded film containing 0% (w/w) PEG1 (L0) into isooctane at 25°C.
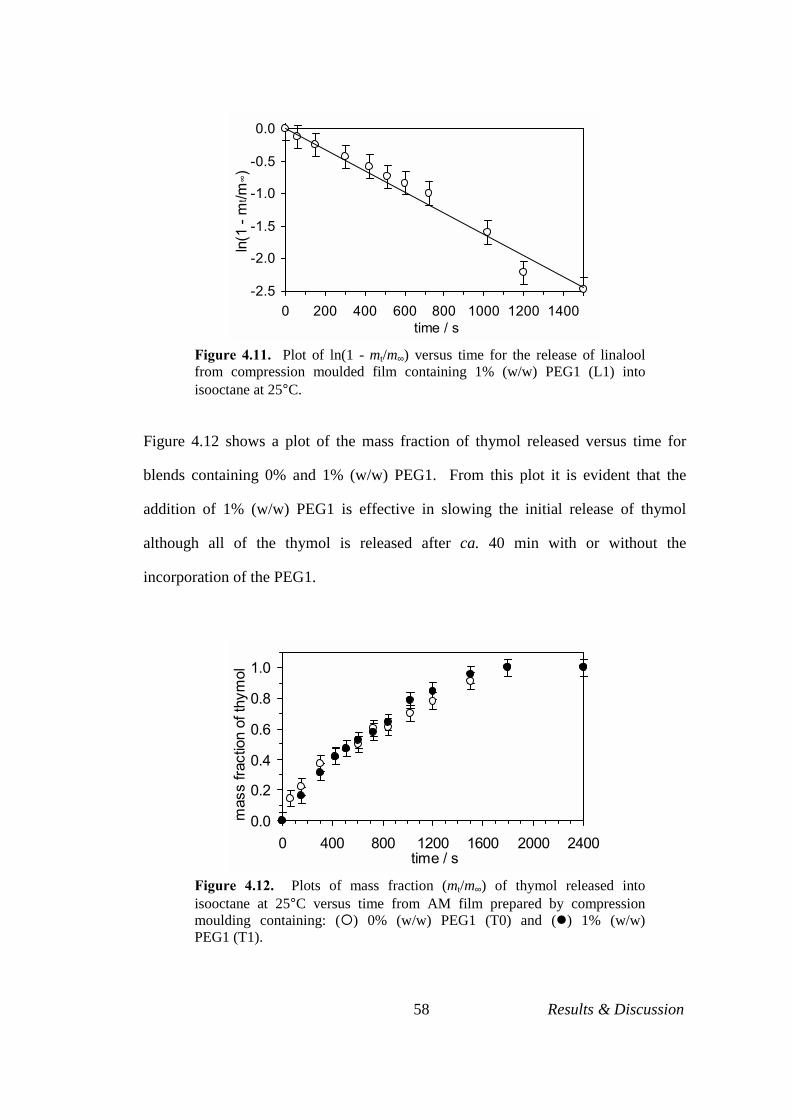
58 Results & Discussion
-2.5
-2.0
-1.5
-1.0
-0.5
0.0
0 200 400 600 800 1000 1200 1400time / s
ln(1
- m
t /m∞)
Figure 4.11. Plot of ln(1 - mt/m∞) versus time for the release of linalool from compression moulded film containing 1% (w/w) PEG1 (L1) into isooctane at 25°C.
Figure 4.12 shows a plot of the mass fraction of thymol released versus time for
blends containing 0% and 1% (w/w) PEG1. From this plot it is evident that the
addition of 1% (w/w) PEG1 is effective in slowing the initial release of thymol
although all of the thymol is released after ca. 40 min with or without the
incorporation of the PEG1.
0.0
0.2
0.4
0.6
0.8
1.0
0 400 800 1200 1600 2000 2400time / s
mas
s fra
ctio
n of
thym
ol
Figure 4.12. Plots of mass fraction (mt/m∞) of thymol released into isooctane at 25°C versus time from AM film prepared by compression moulding containing: (!) 0% (w/w) PEG1 (T0) and (") 1% (w/w) PEG1 (T1).

59 Results & Discussion
Figure 4.13 and 4.14 show plots of (mt/m∞) versus t½ and ln(1 - mt/m∞) versus time
for blends containing 0% and 1% (w/w) PEG1 respectively. The linearity of these
plots confirms the data are adequately described by equation (1) for short-term
migration and equation (4) for long-term migration of thymol.
-3.5
-3.0
-2.5
-2.0
-1.5
-1.0
-0.5
700 1000 1300time / s
(b)
ln(1 - mt /m
∞ )
0.0
0.1
0.2
0.3
0.4
0.5
0.6
5 10 15 20 25 30time1/2 / s1/2
mas
s fra
ctio
n of
thym
ol (a)
Figure 4.13. Plots of: (a) (mt/m∞) versus t½ and (b) ln(1 - mt/m∞) versus time for a blend containing 0% (w/w) PEG1 (T0) into isooctane at 25°C.
-3.5
-3.0
-2.5
-2.0
-1.5
-1.0
-0.5
700 1000 1300 1600time / s
(b)
ln(1 - mt /m
∞ )
0.00.10.20.30.40.50.60.7
10 15 20 25 30time1/2 / s1/2
mas
s fra
ctio
n of
thym
ol (a)
Figure 4.14. Plots of: (a) (mt/m∞) versus t½ and (b) ln(1 - mt/m∞) versus time for a blend containing 1% (w/w) PEG1 (T1) into isooctane at 25°C.
Plots of ln(1 - mt/m∞) versus time for blends containing thymol with 0% and 1%
(w/w) PEG respectively are shown in Figure 4.15 and 4.16 respectively. The
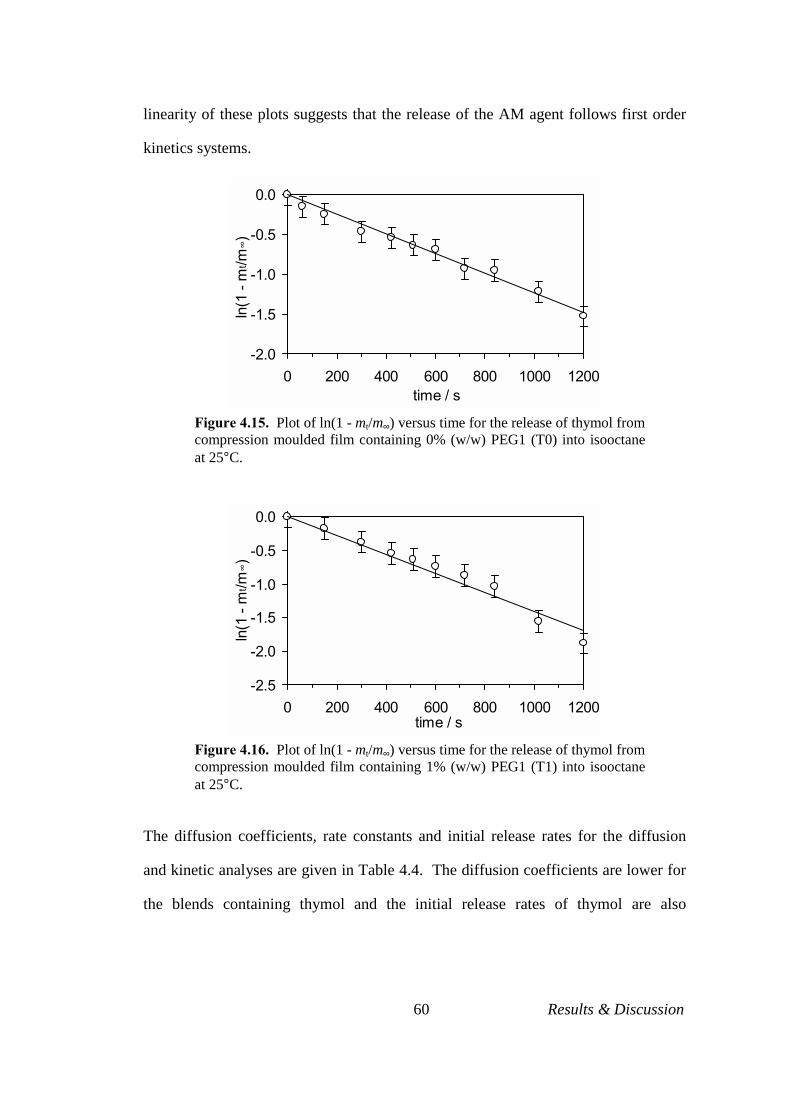
60 Results & Discussion
linearity of these plots suggests that the release of the AM agent follows first order
kinetics systems.
-2.0
-1.5
-1.0
-0.5
0.0
0 200 400 600 800 1000 1200time / s
ln(1
- m
t /m∞)
Figure 4.15. Plot of ln(1 - mt/m∞) versus time for the release of thymol from compression moulded film containing 0% (w/w) PEG1 (T0) into isooctane at 25°C.
-2.5
-2.0
-1.5
-1.0
-0.5
0.0
0 200 400 600 800 1000 1200time / s
ln(1
- m
t /m∞)
Figure 4.16. Plot of ln(1 - mt/m∞) versus time for the release of thymol from compression moulded film containing 1% (w/w) PEG1 (T1) into isooctane at 25°C.
The diffusion coefficients, rate constants and initial release rates for the diffusion
and kinetic analyses are given in Table 4.4. The diffusion coefficients are lower for
the blends containing thymol and the initial release rates of thymol are also

61 Results & Discussion
significantly lower. This suggests that thymol may be retained longer in the film
initially which may be due to the presence of PEG.
Table 4.4 Effect of AM Agent and PEG on the release of AM agent
Diffusion Analysis Kinetic Analysis
Formulation % (w/w) PEG
D ×××× 10-14
/ m2 s-1 k ×××× 10-5
/ s-1 v0 ×××× 10-5
/ g s-1 k ×××× 10-5
/ s-1 L0 (2% linalool) 0 384 235 22.3 166 L1 (2% linalool) 1 374 196 22.8 162 T0 (2% thymol) 0 326 131 14.0 123 T1 (2% thymol) 1 327 308 10.3 140
4.3.3 Effect of EVA on the Release of AM Agent
The effect of a second polymer, EVA, was explored as a possible additive polymer
to retain the AM agents in the LDPE film. A plot of mass fraction of linalool
released versus time for blends containing 0%, 10% and 50% (w/w) EVA is
presented in Figure 4.17 (and separately in Appendix B). From this plot it is evident
that although the initial rate of release of linalool is higher for blends containing
50% (w/w) EVA, the time taken to release all of the linalool from the film is similar
for each blend. Furthermore, the blend containing 10% (w/w) EVA retains slightly
more linalool than any other blend at any point in time.
Figures 4.18 and 4.19 show plots of (mt/m∞) versus t½ and ln(1 - mt/m∞) versus time
for blends containing 0% and 10% (w/w) EVA respectively. The linearity of these
plots confirms the data are adequately described by equation (1) for short-term
migration and equation (4) for long-term migration of linalool.
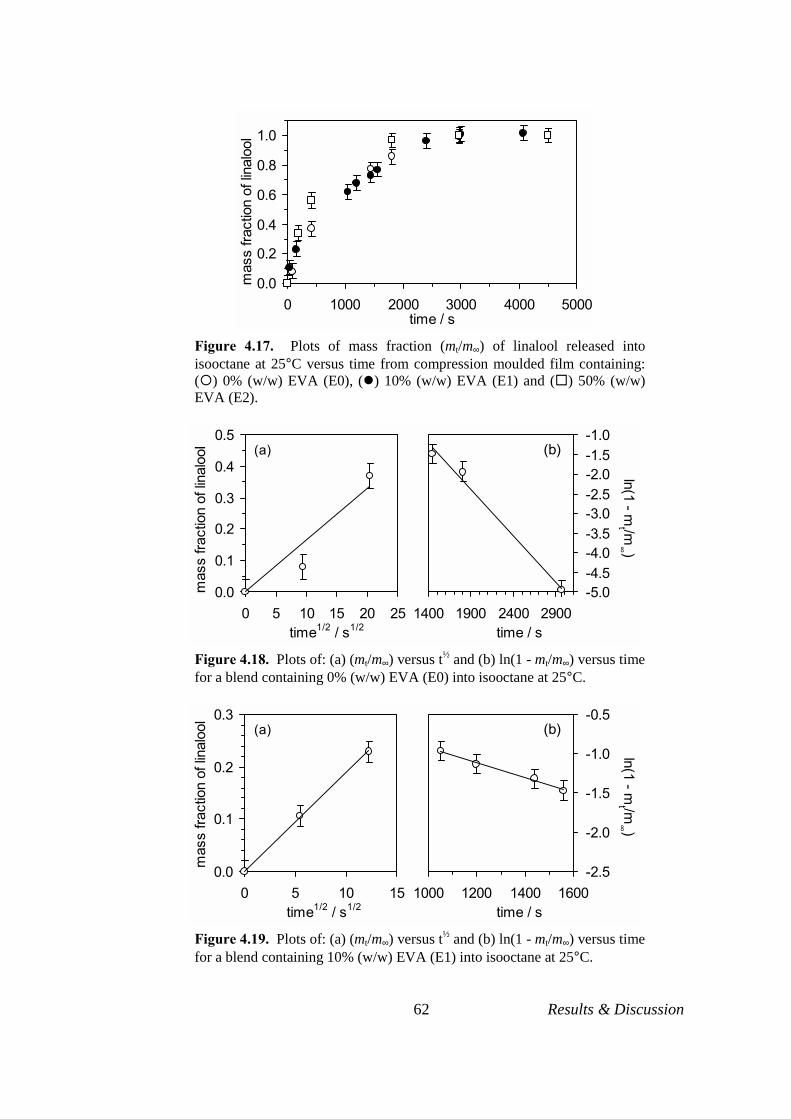
62 Results & Discussion
0.0
0.2
0.4
0.6
0.8
1.0
0 1000 2000 3000 4000 5000time / s
mas
s fra
ctio
n of
linal
ool
Figure 4.17. Plots of mass fraction (mt/m∞) of linalool released into isooctane at 25°C versus time from compression moulded film containing: (!) 0% (w/w) EVA (E0), (") 10% (w/w) EVA (E1) and (#) 50% (w/w) EVA (E2).
-5.0-4.5-4.0-3.5-3.0-2.5-2.0-1.5-1.0
1400 1900 2400 2900time / s
(b)
ln(1 - mt /m
∞ )
0.0
0.1
0.2
0.3
0.4
0.5
0 5 10 15 20 25time1/2 / s1/2
mas
s fra
ctio
n of
linal
ool (a)
Figure 4.18. Plots of: (a) (mt/m∞) versus t½ and (b) ln(1 - mt/m∞) versus time for a blend containing 0% (w/w) EVA (E0) into isooctane at 25°C.
-2.5
-2.0
-1.5
-1.0
-0.5
1000 1200 1400 1600time / s
(b)
ln(1 - mt /m
∞ )
0.0
0.1
0.2
0.3
0 5 10 15time1/2 / s1/2
mas
s fra
ctio
n of
linal
ool
(a)
Figure 4.19. Plots of: (a) (mt/m∞) versus t½ and (b) ln(1 - mt/m∞) versus time for a blend containing 10% (w/w) EVA (E1) into isooctane at 25°C.
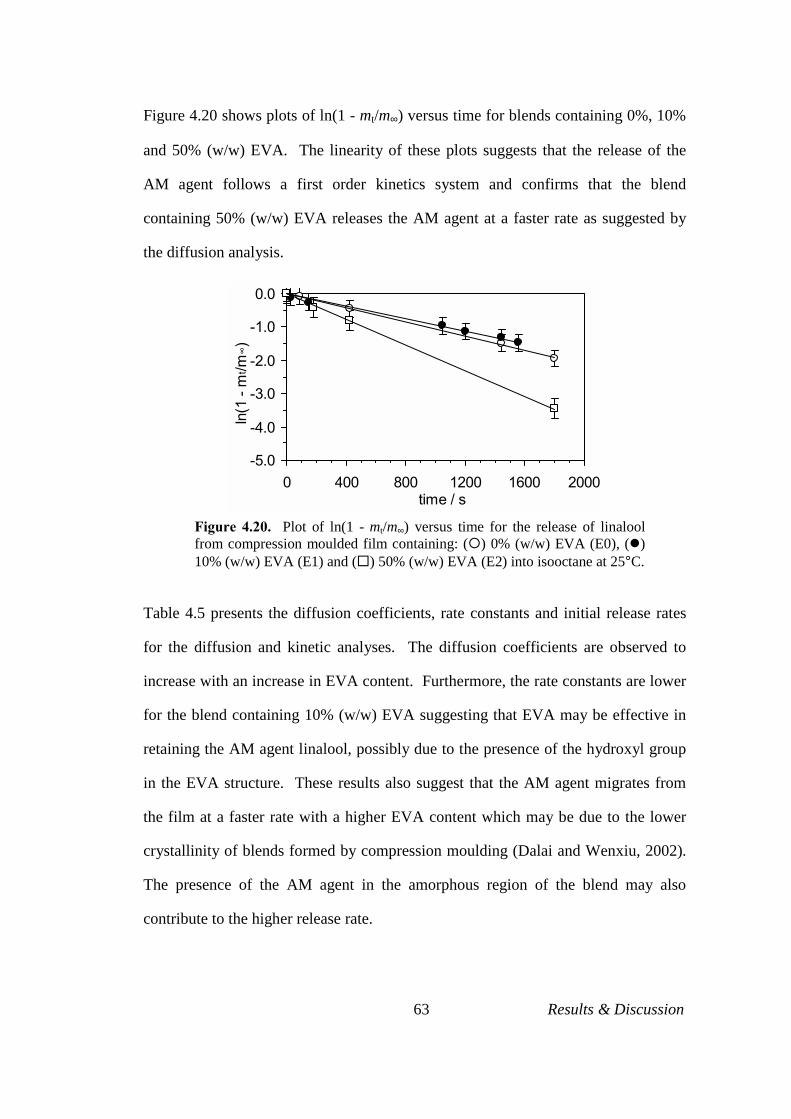
63 Results & Discussion
Figure 4.20 shows plots of ln(1 - mt/m∞) versus time for blends containing 0%, 10%
and 50% (w/w) EVA. The linearity of these plots suggests that the release of the
AM agent follows a first order kinetics system and confirms that the blend
containing 50% (w/w) EVA releases the AM agent at a faster rate as suggested by
the diffusion analysis.
-5.0
-4.0
-3.0
-2.0
-1.0
0.0
0 400 800 1200 1600 2000time / s
ln(1
- m
t /m∞)
Figure 4.20. Plot of ln(1 - mt/m∞) versus time for the release of linalool from compression moulded film containing: (!) 0% (w/w) EVA (E0), (") 10% (w/w) EVA (E1) and (#) 50% (w/w) EVA (E2) into isooctane at 25°C.
Table 4.5 presents the diffusion coefficients, rate constants and initial release rates
for the diffusion and kinetic analyses. The diffusion coefficients are observed to
increase with an increase in EVA content. Furthermore, the rate constants are lower
for the blend containing 10% (w/w) EVA suggesting that EVA may be effective in
retaining the AM agent linalool, possibly due to the presence of the hydroxyl group
in the EVA structure. These results also suggest that the AM agent migrates from
the film at a faster rate with a higher EVA content which may be due to the lower
crystallinity of blends formed by compression moulding (Dalai and Wenxiu, 2002).
The presence of the AM agent in the amorphous region of the blend may also
contribute to the higher release rate.

64 Results & Discussion
Table 4.5 Effect of EVA on the release of AM agent
Diffusion Analysis Kinetic Analysis
Formulation % (w/w) EVA
D ×××× 10-14
/ m2 s-1 k ×××× 10-5
/ s-1 v0 ×××× 10-5
/ g s-1 k ×××× 10-5
/ s-1 E0 0 209 235 30.6 144 E1 10 278 91 8.8 93.4 E2 50 560 - 45.8 193
4.3.4 Effect of Food Simulant on the Release of AM Agent
The release of the AM agent linalool or thymol into various food simulants
including water, isooctane and ethanol was investigated. When using pure water as
a food stimulant, no release of linalool or thymol was observed due to the
insolubility of these AM agents in water. Plots of mass fraction of linalool released
versus time into isooctane, 15% ethanol and 95% ethanol from extrusion blown film
is presented in Figure 4.21. From this plot it is evident that the release of linalool
into isooctane occurs faster than in any other solvent studied and that the slowest
release is observed for 15% ethanol.
0.0
0.2
0.4
0.6
0.8
1.0
0 2000 4000 6000 8000 10000time / s
mas
s fra
ctio
n of
linal
ool
Figure 4.21. Plots of mass fraction (mt/m∞) of linalool released at 25°C versus time for F2 films into: (#) isooctane, (") 95% ethanol, and (!) 15% ethanol.
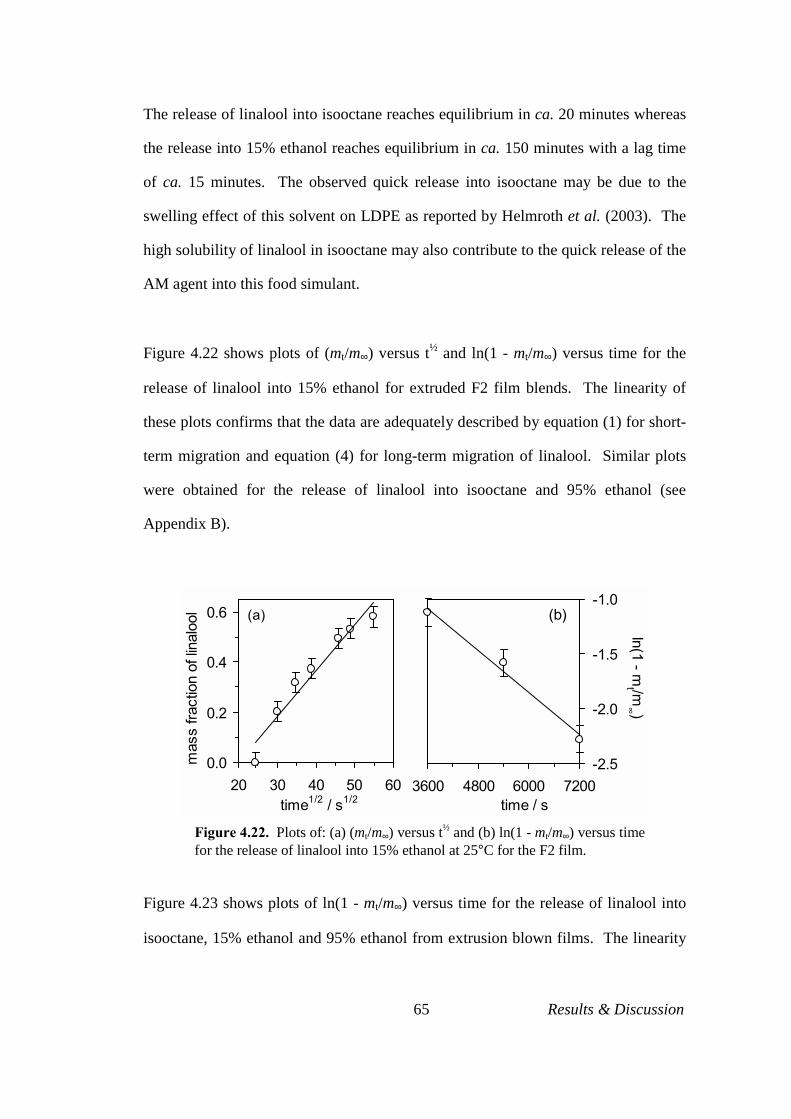
65 Results & Discussion
The release of linalool into isooctane reaches equilibrium in ca. 20 minutes whereas
the release into 15% ethanol reaches equilibrium in ca. 150 minutes with a lag time
of ca. 15 minutes. The observed quick release into isooctane may be due to the
swelling effect of this solvent on LDPE as reported by Helmroth et al. (2003). The
high solubility of linalool in isooctane may also contribute to the quick release of the
AM agent into this food simulant.
Figure 4.22 shows plots of (mt/m∞) versus t½ and ln(1 - mt/m∞) versus time for the
release of linalool into 15% ethanol for extruded F2 film blends. The linearity of
these plots confirms that the data are adequately described by equation (1) for short-
term migration and equation (4) for long-term migration of linalool. Similar plots
were obtained for the release of linalool into isooctane and 95% ethanol (see
Appendix B).
-2.5
-2.0
-1.5
-1.0
3600 4800 6000 7200time / s
(b)
ln(1 - mt /m
∞ )
0.0
0.2
0.4
0.6
20 30 40 50 60time1/2 / s1/2
mas
s fra
ctio
n of
linal
ool (a)
Figure 4.22. Plots of: (a) (mt/m∞) versus t½ and (b) ln(1 - mt/m∞) versus time for the release of linalool into 15% ethanol at 25°C for the F2 film.
Figure 4.23 shows plots of ln(1 - mt/m∞) versus time for the release of linalool into
isooctane, 15% ethanol and 95% ethanol from extrusion blown films. The linearity
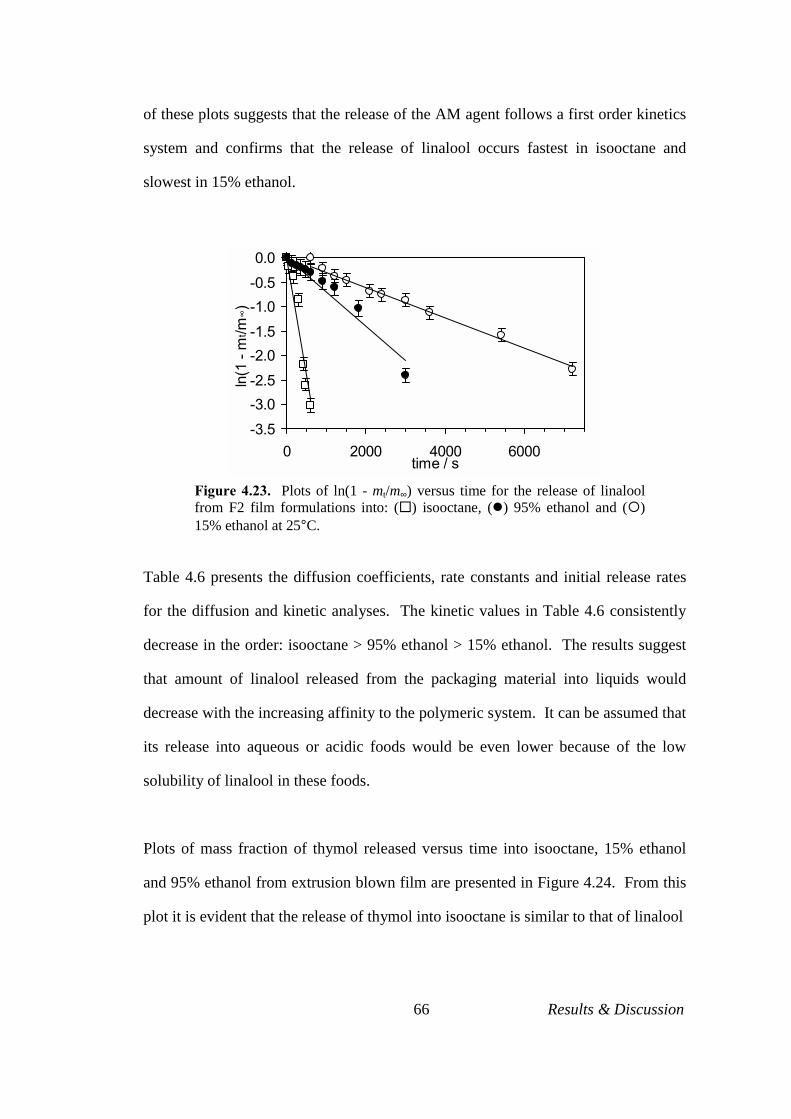
66 Results & Discussion
of these plots suggests that the release of the AM agent follows a first order kinetics
system and confirms that the release of linalool occurs fastest in isooctane and
slowest in 15% ethanol.
-3.5
-3.0-2.5
-2.0-1.5
-1.0-0.5
0.0
0 2000 4000 6000time / s
ln(1
- m
t /m∞)
Figure 4.23. Plots of ln(1 - mt/m∞) versus time for the release of linalool from F2 film formulations into: (#) isooctane, (") 95% ethanol and (!) 15% ethanol at 25°C.
Table 4.6 presents the diffusion coefficients, rate constants and initial release rates
for the diffusion and kinetic analyses. The kinetic values in Table 4.6 consistently
decrease in the order: isooctane > 95% ethanol > 15% ethanol. The results suggest
that amount of linalool released from the packaging material into liquids would
decrease with the increasing affinity to the polymeric system. It can be assumed that
its release into aqueous or acidic foods would be even lower because of the low
solubility of linalool in these foods.
Plots of mass fraction of thymol released versus time into isooctane, 15% ethanol
and 95% ethanol from extrusion blown film are presented in Figure 4.24. From this
plot it is evident that the release of thymol into isooctane is similar to that of linalool
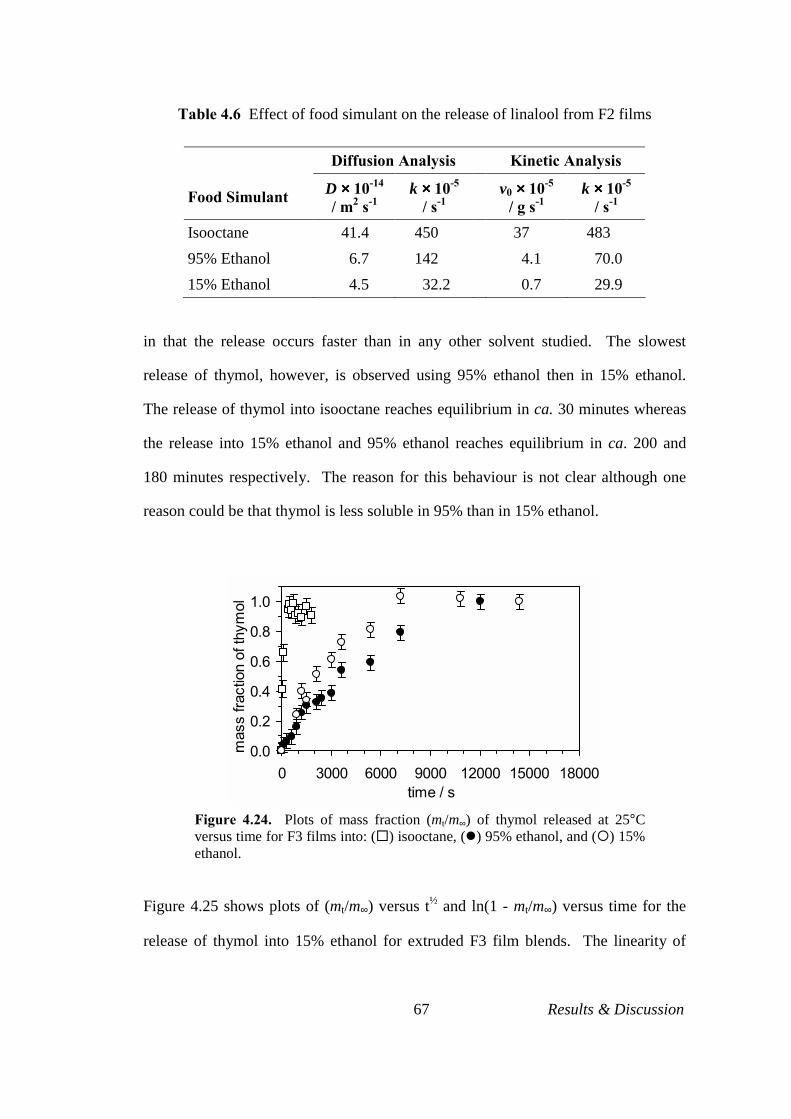
67 Results & Discussion
Table 4.6 Effect of food simulant on the release of linalool from F2 films
Diffusion Analysis Kinetic Analysis
Food Simulant D ×××× 10-14
/ m2 s-1 k ×××× 10-5
/ s-1 v0 ×××× 10-5
/ g s-1 k ×××× 10-5
/ s-1 Isooctane 41.4 450 37 483 95% Ethanol 6.7 142 4.1 70.0 15% Ethanol 4.5 32.2 0.7 29.9
in that the release occurs faster than in any other solvent studied. The slowest
release of thymol, however, is observed using 95% ethanol then in 15% ethanol.
The release of thymol into isooctane reaches equilibrium in ca. 30 minutes whereas
the release into 15% ethanol and 95% ethanol reaches equilibrium in ca. 200 and
180 minutes respectively. The reason for this behaviour is not clear although one
reason could be that thymol is less soluble in 95% than in 15% ethanol.
0.0
0.2
0.4
0.6
0.8
1.0
0 3000 6000 9000 12000 15000 18000time / s
mas
s fra
ctio
n of
thym
ol
Figure 4.24. Plots of mass fraction (mt/m∞) of thymol released at 25°C versus time for F3 films into: (#) isooctane, (") 95% ethanol, and (!) 15% ethanol.
Figure 4.25 shows plots of (mt/m∞) versus t½ and ln(1 - mt/m∞) versus time for the
release of thymol into 15% ethanol for extruded F3 film blends. The linearity of
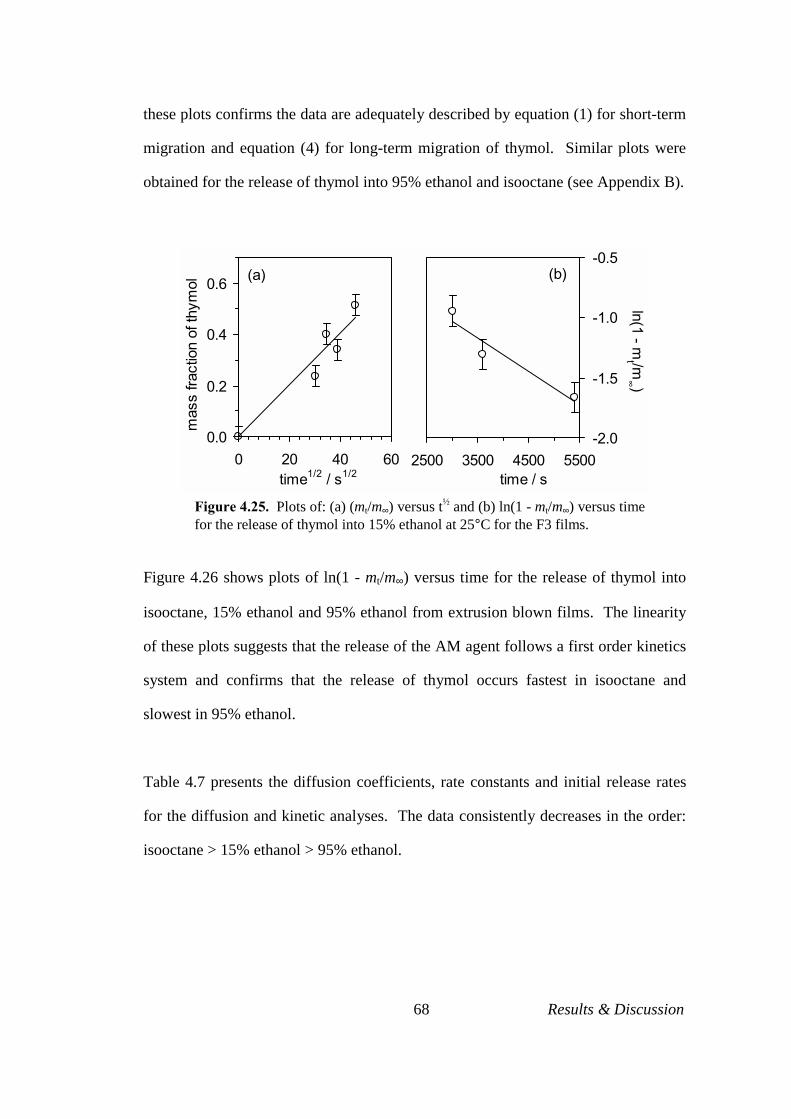
68 Results & Discussion
these plots confirms the data are adequately described by equation (1) for short-term
migration and equation (4) for long-term migration of thymol. Similar plots were
obtained for the release of thymol into 95% ethanol and isooctane (see Appendix B).
-2.0
-1.5
-1.0
-0.5
2500 3500 4500 5500time / s
(b)
ln(1 - mt /m
∞ )
0.0
0.2
0.4
0.6
0 20 40 60time1/2 / s1/2
mas
s fra
ctio
n of
thym
ol (a)
Figure 4.25. Plots of: (a) (mt/m∞) versus t½ and (b) ln(1 - mt/m∞) versus time for the release of thymol into 15% ethanol at 25°C for the F3 films.
Figure 4.26 shows plots of ln(1 - mt/m∞) versus time for the release of thymol into
isooctane, 15% ethanol and 95% ethanol from extrusion blown films. The linearity
of these plots suggests that the release of the AM agent follows a first order kinetics
system and confirms that the release of thymol occurs fastest in isooctane and
slowest in 95% ethanol.
Table 4.7 presents the diffusion coefficients, rate constants and initial release rates
for the diffusion and kinetic analyses. The data consistently decreases in the order:
isooctane > 15% ethanol > 95% ethanol.
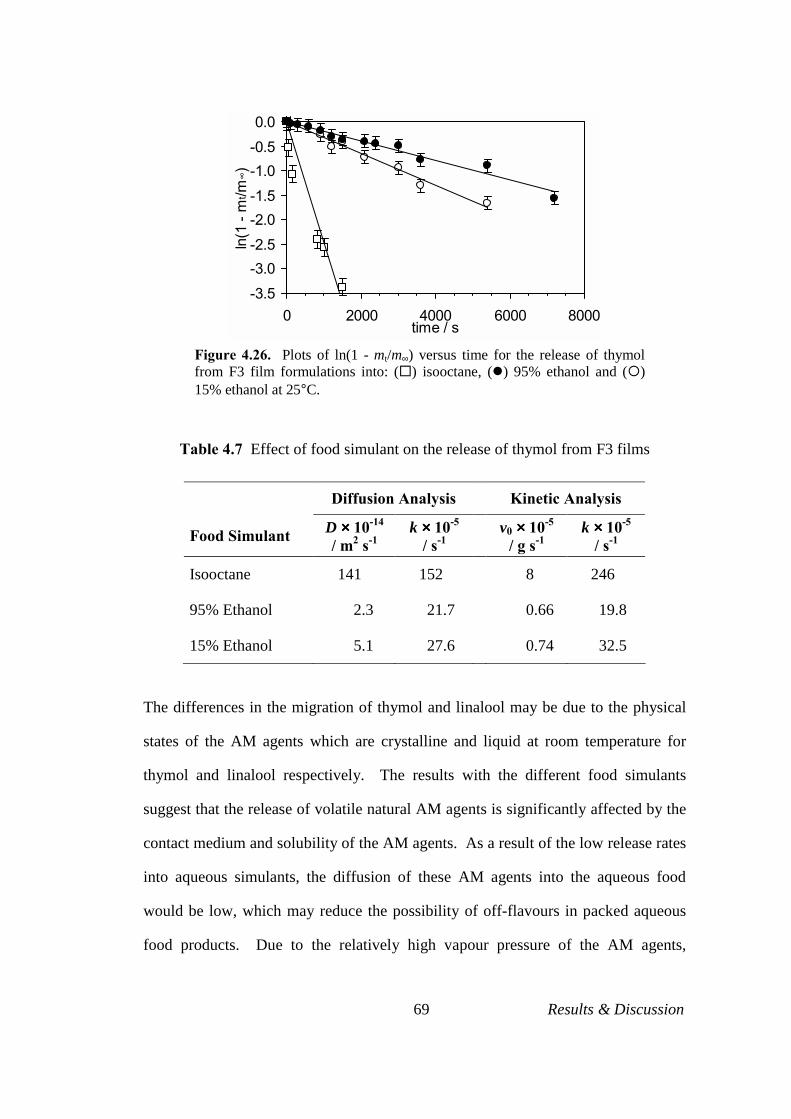
69 Results & Discussion
-3.5
-3.0-2.5
-2.0-1.5
-1.0-0.5
0.0
0 2000 4000 6000 8000time / s
ln(1
- m
t /m∞)
Figure 4.26. Plots of ln(1 - mt/m∞) versus time for the release of thymol from F3 film formulations into: (#) isooctane, (") 95% ethanol and (!) 15% ethanol at 25°C.
Table 4.7 Effect of food simulant on the release of thymol from F3 films
Diffusion Analysis Kinetic Analysis
Food Simulant D ×××× 10-14
/ m2 s-1 k ×××× 10-5
/ s-1 v0 ×××× 10-5
/ g s-1 k ×××× 10-5
/ s-1
Isooctane 141 152 8 246
95% Ethanol 2.3 21.7 0.66 19.8
15% Ethanol 5.1 27.6 0.74 32.5
The differences in the migration of thymol and linalool may be due to the physical
states of the AM agents which are crystalline and liquid at room temperature for
thymol and linalool respectively. The results with the different food simulants
suggest that the release of volatile natural AM agents is significantly affected by the
contact medium and solubility of the AM agents. As a result of the low release rates
into aqueous simulants, the diffusion of these AM agents into the aqueous food
would be low, which may reduce the possibility of off-flavours in packed aqueous
food products. Due to the relatively high vapour pressure of the AM agents,

70 Results & Discussion
however, a high release of these agents into the food package headspace would be
expected. These results suggest that volatile AM agents such as linalool and thymol
may be suitable for package/headspace/food systems as discussed by Han (2000).
4.3.5 Effect of Film Fabrication on the Release of AM Agent
Figure 4.27 shows a plot of the mass fraction of linalool released versus time for
film formulations produced by melt compression or melt extrusion. This plot
suggests that melt compression is more effective in controlling the release of the
AM agent. Furthermore, the film produced by melt compression releases entirely
the equilibrium concentration of the AM agent in about twice the time compared to
the film produced by melt extrusion.
0.0
0.2
0.4
0.6
0.8
1.0
0 400 800 1200 1600 2000 2400time / s
mas
s fra
ctio
n of
linal
ool
Figure 4.27. Plots of mass fraction (mt/m∞) of linalool released into isooctane at 25°C versus time from film formulations produced by: (") melt compression (L1) and (!) melt extrusion (F2).
Figure 4.28 shows plots of (mt/m∞) versus t½ and ln(1 - mt/m∞) versus time for the
release of linalool for film formulations produced by melt compression or melt

71 Results & Discussion
extrusion. These plots confirm that melt compression is more effective in
controlling the release of the AM agent.
-3.5
-3.0
-2.5
-2.0
-1.5
-1.0
-0.5
300 600 900 1200 1500time / s
(b)
ln(1 - mt /m
∞ )
0.0
0.1
0.2
0.3
0.4
0.5
0.6
0.7
5 10 15 20 25 30time1/2 / s1/2
mas
s fra
ctio
n of
lina
lool (a)(a)
Figure 4.28. Plots of: (a) (mt/m∞) versus t½ and (b) ln(1 - mt/m∞) versus time for the release of linalool into isooctane at 25°C from film formulations produced by: (") melt compression (L1) and (!) melt extrusion (F2).
Figure 4.29 shows plots of ln(1 - mt/m∞) versus time for the release of linalool from
film formulations produced by melt compression or melt extrusion. These plots also
confirm that melt compression is more effective in controlling the release of
linalool.
-3.5
-3.0
-2.5
-2.0
-1.5
-1.0
-0.5
0.0
0 200 400 600 800 1000 1200time / s
ln(1
- m
t /m∞)
Figure 4.29. Plots of ln(1 - mt/m∞) versus time for the release of linalool into isooctane at 25°C from film formulations produced by: (") melt compression (L1) and (!) melt extrusion (F2).

72 Results & Discussion
Table 4.8 shows the diffusion coefficients, rate constants and initial release rates for
the diffusion and kinetic analyses. Although the release of linalool occurs faster
from the extruded film, the diffusion coefficient is significantly lower than that of
the melt compressed film. The differences in the film fabrication method (see Table
4.8), would suggest that the short-term release of the AM agent from samples
produced by melt compression is considerably faster than that of samples produced
by melt extrusion. This may be due to the more uniform distribution of AM agent in
the polymer matrix (LaCoste et al., 2005) imparted by melt-mixing during extrusion.
Furthermore, in the thick, non-uniform films produced by melt compression, part of
the AM agent additive could be concentrated on the film surface resulting in an
apparent higher calculated diffusion coefficient. The diffusion coefficient
determined for the melt extruded film is of a similar order of magnitude to values
obtained in a previous study (Suppakul, 2004).
Table 4.8 Effect of film fabrication on the release of linalool
Diffusion Analysis Kinetic Analysis
Film Fabrication Film Thickness
D ×××× 10-14
/ m2 s-1 k ×××× 10-5
/ s-1 v0 ×××× 10-5
/ g s-1 k ×××× 10-5
/ s-1 Melt compression 2 mm 384 235 22.3 166
Melt extrusion 50 µm 41.4 450 37 483
4.3.6 TGA Analysis of AM Films
A possible alternative technique to conventional release kinetic analysis of AM
agents using TGA was explored. Figure 4.30 shows plots of the fractional mass loss
versus temperature for the control, linalool and thymol films. The fractional mass
loss of linalool and thymol films followed a similar trend over the temperature range
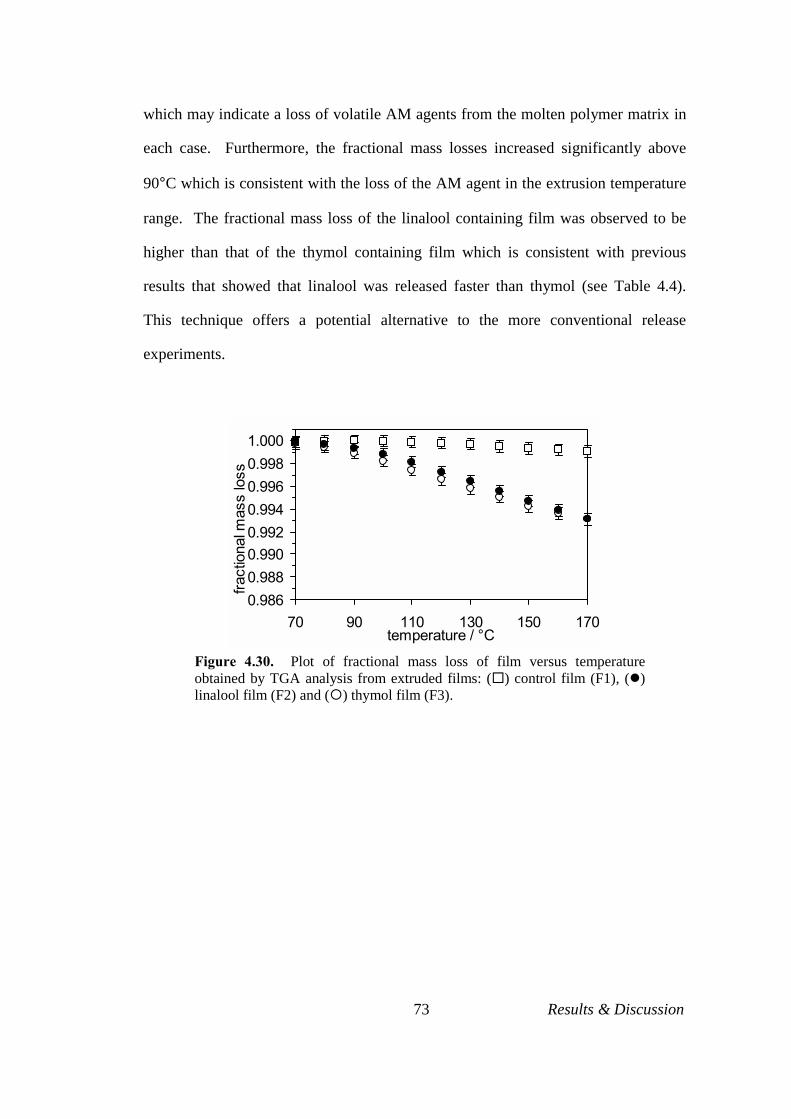
73 Results & Discussion
which may indicate a loss of volatile AM agents from the molten polymer matrix in
each case. Furthermore, the fractional mass losses increased significantly above
90°C which is consistent with the loss of the AM agent in the extrusion temperature
range. The fractional mass loss of the linalool containing film was observed to be
higher than that of the thymol containing film which is consistent with previous
results that showed that linalool was released faster than thymol (see Table 4.4).
This technique offers a potential alternative to the more conventional release
experiments.
0.9860.9880.9900.9920.9940.9960.9981.000
70 90 110 130 150 170temperature / °C
fract
iona
l mas
s lo
ss
Figure 4.30. Plot of fractional mass loss of film versus temperature obtained by TGA analysis from extruded films: (#) control film (F1), (") linalool film (F2) and (!) thymol film (F3).

74 Conclusions
5 Conclusions, Recommendations, Future work
5.1 Conclusions
The results of the present study highlight the promising potential and feasibility of
incorporating natural AM agents such as linalool and thymol in conventional LDPE
films to produce AM food packaging.
5.1.1 Effect of Blending LDPE with PEG
The incorporation of the additive polymer PEG into the LDPE/AM film blend
played an important role in controlling the release rate of the AM agents: linalool
and thymol. This was possibly due to the introduction of hydrophilic sites into the
polymer matrix. For compression moulded AM films the initial rate of release of
AM agent linalool decreased with an increase in PEG content. Furthermore, the
highest molecular weight PEG significantly decreased the short-term release of
linalool. The AM agent thymol was released at a comparatively slower rate than
linalool and the release was further reduced by the addition of PEG.
5.1.2 Effect of Blending LDPE with EVA
The incorporation of the additive polymer EVA resulted in higher initial release
rates of AM agents with high content (50% (w/w)) of EVA. The release rates were
lower at the lower EVA content (10% (w/w)). The diffusion coefficient and initial
rate of release of AM was lower in samples formed by extrusion mixing which may
be due to the introduction of more uniform melt mixing that cannot be achieved
during compression moulding.

75 Conclusions
5.1.3 Development of Extruded AM Films
The natural AM agents were effectively incorporated into the polymer pellets by
direct blending prior to blown film extrusion with significant retention of the AM
agents. The amount of AM agent retained in the film was observed to be high when
the agent was directly blended without using any solvent. The incorporation of
linalool and thymol did not adversely affect the mechanical or optical properties of
extruded LDPE-EVA films. Furthermore, the release rate of linalool was higher
than that of thymol; that may be due to the higher volatility of linalool relative to
thymol. A study using a TGA technique suggested that the loss of the volatile AM
agents was high at the processing extrusion temperatures. Furthermore, the AM
agent linalool was released faster than thymol from the polymer film.
5.1.4 Release of AM Agents from Film
The release of the AM agents from film produced by compression moulding or by
blown film extrusion can be adequately and consistently described by short-term and
long-term migration equations. Furthermore, all of the release experiments revealed
that the release of linalool and thymol from the polymer consistently obeyed first
order kinetics. Indeed, satisfactory fits to first-order kinetics were obtained for all
systems studied in this work and are confirmed by the linearity of the processed
data. In addition to the diffusion coefficient and rate constant provided by the
diffusion analysis, the kinetics analysis can provide an initial rate of release of AM
agent. The release of the AM agents from extruded film was consistently high into
isooctane and considerably slower into ethanol solutions.
76 Conclusions
5.2 Recommendations
5.2.1 Blending Improvements
The use of a single-screw extruder with a normal gravity feed hopper was
ineffective in compounding PEG with LDPE. The problem of choking of the hopper
at the throat caused by PEG may be overcome by using a screw feed hopper during
extrusion. Application of twin-screw extruders may also be explored to improve the
blend morphology. A detailed study on the compatibility of PEG with EVA/LDPE
blends using morphological techniques is recommended for the production of stable
films with good mechanical properties. Further morphological and rheological
studies of PEG/EVA/LDPE blends with AM agents could be conducted to optimize
the extrusion parameters. Investigation by X-ray diffraction, DSC evaluation and
microscopy to measure the extent of crystallinity, flow properties and particle size
distribution could be undertaken to develop such an optimum extrusion process.
5.2.2 Additive Quantification
As the natural AM agents are volatile, losses of solvent and the AM agent are
inevitable using a Soxhlet extraction method. Moreover, the loss of simulant and
solvent were very difficult to control. Traditional liquid solvent/polymer extraction
methods involving dissolution and precipitation are generally time consuming,
uneconomical and the recoveries are significantly lower than 90%. An on-line
supercritical fluid extraction/chromatography system could offer efficient extraction
and separation of polymer additives.

77 Conclusions
5.2.3 Release Experiments
The use of migration cells coupled with automatic sampling and analysis would help
in the accurate determination of the release of linalool and thymol. The use of
alternative food simulants such as hexane or acetic acid could be further explored
for monitoring the release of linalool and thymol from AM films.
5.2.4 Development of TGA Methodology
Foods packaged with AM films are often stored at different temperatures so the
release kinetics are consequently different under different storage conditions. The
use of a relatively unexplored technique of TGA to monitor the release of AM
agents from film could be further investigated. Isothermal experiments in particular
could be important in the development of optimal extrusion conditions of the AM
film blends. Diffusion coefficients, temperature dependence of the diffusion
coefficients, and Arrhenius activation energy of linalool and thymol could be
investigated by monitoring the mass loss of the AM films by TGA analyser at
different temperatures and isothermal conditions.
5.3 Scope for Future Work
5.3.1 Barrier Properties
Moisture, oxygen and carbon dioxide are very crucial for the preservation of foods
and as such, the determination of the transmission rates of these gases and vapours
through the AM/LDPE/EVA film blend could be investigated.
78 Conclusions
5.3.2 Multi-Layer Film Packaging
The manufacture of multi-layer films containing natural AM agents can be made by
co-extrusion or by extrusion lamination. In order to achieve the controlled release of
the active compounds to the surface of the food and not into the atmosphere, the use
of multi-layer film (control layer/active layer/barrier layer) as proposed by Han and
Floras (1997) could be explored. An ideal structure would consist of an outer AM
barrier layer, an AM containing matrix layer, and a release control layer. The outer
layer should be a barrier layer to prevent loss of active agent from the polymer
matrix layer. The release control layer may consist of a PEG/food grade resin blend
to control the release of the AM agent. Release experiments with mutli-layer films
containing linalool and thymol may prove to be crucial in controlling the release into
the food.
5.3.3 Antimicrobial Activity
The AM activity of the packaging materials can be measured by microbiology
experiments. Before food samples are packaged in the AM packaging material, the
activity of LDPE films containing linalool and thymol films may be tested against
variety of microorganisms. Determination of the minimum inhibition concentration
of linalool and thymol would prove to be crucial in developing an AM film. The
applicability of thymol and linalool films for the preservation of other types of food
such as meat, poultry, seafood and high moisture bakery food products could be
investigated. Microbial studies of LDPE films containing combinations of volatile
linalool and thymol AM agents with other non-releasing traditional AM agents
would also be of interest for the application of packaging different types of food.

79 Conclusions
5.3.4 Modelling AM Release
Mathematical modelling of the diffusion of the AM agent may be used to establish a
release profile of natural AM agent from a packaging material into the food product.
This may permit the estimation of accurate concentration pattern, provide diffusion
profile of real food packaging systems and predict the period during which the AM
concentration will be maintained above the critical inhibitory concentration in the
packaged food (Han, 2003). Furthermore, the determination of the Sherwood
number, which is the ratio of surface mass transfer coefficient to the diffusion
coefficient, may be also used in modelling the mass transfer to predict the
concentration of these active natural AM agents at any point in time.
80 References
References
Ahvenainen, R., Active and Intelligent Packaging. In: Novel Food Packaging Techniques,
Woodhead Publishing Limited, Cambridge, Ahvenainen, R. (Ed), 2003.
Aitor, P., Norman, S., Michele, E., and Eusebio, F. (2002). Additive interactions in
stabilization of film grade high density polyethylene. Journal of Vinyl and Additive
Technology 8, 90-102.
An, D., Hwang, Y.-I., Cho, S.-H., and Lee, D. (1998). Packaging of fresh curled lettuce and
cucumber by using low density polyethylene films impregnated with antimicrobial
agents. Journal of Korean Society Food Science and Nutrition 27, 675-681.
Arora, R., and Pandey, G.N. (1977). The application of essential oils and their isolates for
blue mould decay control in Citus reticulata Blanco. Journal of Food Science and
Technology 14, 137-146.
ASTM Method D 882 - 97, “Standard Test Method for Tensile Properties of Thin Plastic
Sheeting”, Plastics (I), 08.01, pp. 163-171, 1998.
ASTM Method D 1003 - 97, “Standard Test Method for Haze and Luminous Transmittance
of Transparent Plastics”, Plastics (I), 08.01, pp. 199-204, 1998.
Azaz, A.D., Kurkcuoglu, M., Satil, F., Baser, H.C., and Tumen, G. (2005). In vitro
antimicrobial activity and chemical composition of some Satureja essential oils.
Flavour and Fragrance Journal 20, 587-591.
Bahl, J.R., Garg, S.N., Sinha, S.C., Bansal, R.P., Naqvi, A.A., and Kumar, S. (2000).
Composition of linalool rich essential oil from Lippia alba grown in Indian plains.
Flavour and Fragrance Journal 15, 199-200.
Baldev, R., Sankar, U., and Siddaramaiah, K. (2000). Low density polyethylene/starch blend
films for food packaging applications. Advances in Polymer Technology 23, 32-45.
81 References
Baratta, T.M., Dorman, D.J.H., Denes, G.S., Figueiredo, C.A., Barroso, G.J., and Ruberto,
G. (1998). Antimicrobials and antioxidant properties of some commercial oils.
Flavour and Fragrance Journal 13, 235-244.
Berins, M., Plastics Engineering Handbook of the Society of Plastics Industry, 102-1991.
Bezic, N., Skocibusic, M., Dunkic, V., and Radonic, A. (2003). Composition and
antimicrobial activity of Achillea clavennae L. essential oil. Phytotherapy Research
17, 1037-1040.
Cahan, R., Vadim, G., Binjamin, F., and Edward, B. (2003). Development of novel active
packaging film preventing migration of antimicrobial component. The College of
Judea and Samaria, Israel 4, 89
Cassagnau, P., Courmont, M., Melis, F., and Puaux, J.P. (2005). Study of mixing of
liquid/polymer in twin screw extruder by residence time distribution. Polymer
Engineering and Science 45, 926-934.
Choudhry, M.S., Lox, F., Beukens, A., and Decroly, P. (1998). Evaluation of migrational
behaviour of plastic food-contact materials: a comparison of methods. Packaging
Technology and Science 11, 275-283.
Chuayjuljit, S., Kunsawat, C., and Potiyaraj, P. (2003). Use of silica from rice husk ash as
an antiblocking agent in low-density polyethylene film. Journal of Applied Polymer
Science 88, 848-852.
Chung, S.K., Cho, S.H., and Lee, D.S. (1998). Modified amosphere packaging of fresh
strawberries by antimicrobial plastic films. Korean Journal of Food Science and
Technology 30, 1140-1145.
Conner, D.E., and Beuchat, L.R. (1984). Effects of essential oils from plants on growth of
food spoilage yeasts. Journal of Food Science 49, 429-434.
Cooksey, K., Utilisation of Antimicrobial Packaging Films for Inhibition of Selected
Microrganisms. In: Food Packaging Testing Methods and Applications, American
Chemical Society, South Carolina, Risch, S. (Ed), 2000.
82 References
Couladis, M., Tzakou, O., Kujundzic, S., Sokovic, M., and Mimica-Dukic, N. (2004).
Chemical analysis and antifungal activity of Thymus striatus. Phytotherapy
Research 18, 40-42.
Cudworth, J., Farrel Bridge-Engineers to Rubber and Plastic Processing Industries, Farrel
Bridge Ltd, Rochdale, 1976.
Daeschel, M.A. (1989). Antimicrobial substances from lactic acid bacteria for use as food
preservatives. Food Technology 43, 164-167.
Dalai, S., and Wenxiu, C. (2002). Radiation effects on LDPE/EVA blends. Journal of
Applied Polymer Science 86, 1296-1302.
Deans, J.G., and Ritchie, G. (1987). Antimicrobial properties of plant essential oils.
International Journal of Food Microbiology 5, 165-180.
Dobias, J., Chudackova, K., Voldrich, M., and Marek, M. (2000). Properties of polyethylene
films with incorporated benzoic anhydride and/or ethyl and propyl esters of 4-
hydroxybenzoic acid and their suitability for food packaging. Food Additives and
Contaminants 17, 1047-1053.
Donghwan, C., Spyridon, E., and Yam, K.L. (2003). Evaluation of a polymer coating
containing triclosan as the antimicrobial layer for packaging materials.
International Journal of Food Science and Technology 38, 165-169.
Dopico, M.S., Lopez-Vilarino, J.M., and Gonzalez-Rodriguesz, M.V. (2003). Determination
of antioxidant migration levels from low density polyethylene film into food
simulants. Journal of Chromatography 1018, 53-62.
Dziezak, J.D. (1989). Spices. Food Technology 43, 102-115.
Fang, Y., Carreau, P., and Lafleur, P. (2003). Rheological effects of polyethylenes in film
blowing. Polymer Engineering and Science 43, 1391-1406.
Farber, J.M. (1991). Microbiological aspects of modified atmosphere packaging technology
- a review. Journal of Food Protection 54, 58-70.

83 References
Floras, J.D., Dock, L.L., and Han, J.H. (1997). Active packaging technologies and
applications. Food Cosmetics and Drug Packaging 20, 10-17.
Friedman, M., Henika, P.R., and Mandrell, R.E. (2002). Bacterial activity of plants essential
oils and some of their isolated constituents against Campylobacter jejuni,
Escherichia coli, Listeria monocytogenes and Salmonella enterica. Journal of Food
Protection 65, 1545-1560.
Frierheller, M.C., Modified Atmosphere Packaging of Miscellaneous Products. In: Modified
Atmosphere Packaging of Food, Ellis Horwood limited, Chichester, UK, Ooraikul,
B. and Stile, M.E. (Eds), 1991.
Fyfe, L., Armstrong, F., and Stewart., J. (1998). Inhibition of Listeria monocytogenes and
Salmonella enteridities by combinations of plant oils and derivatives of benzoic
acid: the development of synergistic antimicrobial combinations. International
Journal of Antimicrobial Agents 9, 130-136.
Ghaneh-Fard, A., Carreau, P.J., and Lafleur, P.G. (1996). Materials, interfaces, and
electrochemical phenomena study of instabilities in film blowing. Aiche Journal 42,
1388-1396.
Gontard, N. Proceedings of Workshop sobre Biopolymers, Active Packaging, Pirassununga,
FZEA. Brazil, April 22-24, 1997, pp. 23-27.
Grower, J.L., Cooksey, D.K., and Getty, K.J.K. (2004). Development and characterization
of an antimicrobial packaging film coating containing nisin for inhibition of Listeria
monocytogenes. Journal of Food Protection 67, 475-479.
Guenther, E., The Essential Oils, Van Nostrad Co. Inc., New York, 1952.
Ha, J.U., Kim, Y.M., and Lee, D.S. (2001). Multilayered antimicrobial polyethylene films
applied to the packaging of ground beef. Packaging Technology and Science 14,
55-62.
Halek, W.G., and Anita, G. (1989). Fungal inhibition by a fungicide coupled to an
ionomeric film. Journal of Food Safety 9, 215-222.

84 References
Han, C.D., Kim, Y.W., and Chen, S.J. (1975). Melt behaviour and blending of polymers.
Journal of Applied Polymer Science 19, 28-31.
Han, J.H. (1996). Developing antimicrobial packaging materials: review. The Journal of
Korean Food Research Institute 9, 111-127.
Han, J.H., and Floras, J.D. (1997). Casting antimicrobial packaging films and measuring
their physical and antimicrobial activity. Journal of Plastic Film and Sheeting 13,
287-298.
Han, J.H., Novel Food Packaging Techniques. In: Antimicrobial Food Packaging.
Woodhead Publishing Limited, Cambridge, Ahvenainen, R. (Ed), 2003.
Han, J.H. (2000). Antimicrobial food packaging. Food Technology 54, 56-65.
Han, J.H., Antimicrobial Packaging Systems. In: Innovations in Food Packaging. Elsevier
Academic Press, Amsterdam, The Netherlands, pp. 92-93, 2005.
Harris, J.M., Biotechnical and Biomedical Applications. In: Polyethylene Glycol Chemistry,
New York, 1992.
Helmroth, I.E., Dekker, M., and Hankemeier, Th. (2003). Additive diffusion from LDPE
slabs into contacting solvents as a function of solvent absorption. Journal of
Applied Polymer Science 90, 1609-1617.
Hess, K.M. PRI International Conference on PVC Processing, Engineering Royal Holloway
college, London, 1978, pp. 1-10.
Hong, S., Park, J., and Him, D. (2000). Antimicrobial and physical properties of food
packaging films incorporated with some natural compounds. Food Science and
Biotechnology 9, 38-42.
Hotchkiss, J.H. (1997). Food packaging interactions influencing quality and safety. Food
Additives and Contaminants 14, 601-607.
Jantan, I.b., Yalvema, M.F., Ayop, N., and Ahmad, S.A. (2005). Constituents of the
essential oils of Cinnamomum sintoc Blume from mountains forests of peninsular
Malaysia. Flavour and Fragrance Journal 20, 601-604.

85 References
Joshi, C. (2006). Nontoxic Animal, Rodent and Insect Repellants for Polymers,
www.rodrepel.com. www ctechcorporation com.
Juven, B.J., Kanner, J., Sched, F., and Weisslowicz., H. (1994). Factors that interact with the
antibacterial action of thyme oil and its active constituents. Journal of Applied
Bacteriology 76, 626-631.
Kalvandi, R., Sefidkon, F., Atri, M., and Mirza, M. (2005). Analysis of the essential oil of
Thymus eriocalyx from Iran. Flavour and Fragrance Journal 19, 341-343.
Kanjickal, D., Lopina, S., Schmidt, S., and Donovan, D. (2005). Improving delivery of
hydrophobic drugs from hydrogels through cyclodextrins. Journal of Biomedical
Materials 74A, 454-460.
Kim, S.J., and Kwon, T.H. (1996). Enhancement of mixing performance of single screw
extrusion processes via chotic flows: Part 1. Basic concepts and experimental
studies. Advances in Polymer Technology 15, 41-54.
Koga, T., Hirota, N., and Takumi, K. (1999). Bactericidal activities of essential oils of basil
and sage against a range of bacteria and the effects of these essential oils on Vibrio
parahaemolyticus. Microbiology Reserve 154, 267-273.
Labuza, T.P., and Breene, W.M. (1989). Applications of active packaging for improvements
of shelf life and nutritional quality of fresh and extended shelf life foods. Journal of
Food Protection 13, 1-69.
LaCoste, A., Schaich, K.M., Zumbrunnen, D., and Yam, K.L. (2005). Advancing controlled
release packaging through smart blending. Packaging Technology and Science 18,
77-87.
Lahariya, A.K., and Rao, J.T. (1979). In Vitro antimicrobial studies of the essential oils of
Cyprus scariosus and Ocimum basilicum. Indian Drugs 1916, 150-152.
LaMantia, F.P., Valenza, A., and Acierno, D. (1986). Influence of the structure of linear
density polyethylene on the rheological and mechanical properties of blends with
low density polyethylene. European Polymer Journal 22, 647-652.
86 References
Lee, D.S., Hwang, Y., and Cho, S.H. (1998). Developing antimicrobial packaging film for
curled lettuce and soyabean sprouts. Food Science and Biotechnology 7, 117-121.
Lee, S.Y., and Kim, S.C. (1996). Morphology and oxygen barrier properties of
LDPE/EVOH blends. International Journal of Polymer Processing 3, 238-247.
Liu, X., Xie, M., and Li, H. (2005). Effect of inorganic fillers in binary processing aids on
the rheology of a metallocene linear low density polyethylene. Journal of Applied
Polymer Science 96, 1824-1829.
Lorenzo, D., Loayza, I., and Dellacassa, E. (2003). Composition of the essential oils from
leaves of two Hedyosmum spp. and bolovia. Flavour and Fragrance Journal 18,
32-35.
Mario, D., Alessandra, T., Antinio, F., and Camella, C. (1998). In vivo activity of Salvia
officinalis oil against Botrytis cinerea. Journal of Essential Oil 10, 157-160.
Marotti, M., Piccaglia, R., and Giovanelli, E. (1996). Differences in essential oil
composition of basil (Ocimum basilicum L.) Italian cultivars related to
morphological characteristics. Journal of Agricultural and Food Chemistry 44,
3926-3929.
Matthews, G., Polymer Mixing Technology, Applied Science Publishers, New York, pp. 10-
61, 1982.
Maxcy, R.B. (1981). Surface microenvironment and penetration of bacteria into meat.
Journal of Food Protection 44, 550-552.
Middleman, S., Fundamental Studies of Polymer Processing, McGraw-Hill, New York,
1977.
Miltz, J., Migration of Low Molecular Weight Species from Packaging Materials:
Theoretical and Practical Considerations. In: Food Product-Package Compatibility,
Technomic Pub. Co., Gray, J.I., Harte, B.R., and Miltz, J. (Eds), pp. 1987.
Miltz, J., Passy, N., and Mannhwim, C.H., Trends and Applications of Active Packaging
Systems. In: Food and Packaging Materials - Chemical Interaction, The Royal

87 References
Society of Chemistry, Ackerman, P., Jägerstad, M., and Ohlsson, P. (Eds), pp. 201-
210, 1995.
Ming, X., Weber, G.H., Ayres, J.W., and Sandine, W.E. (1997). Bacteriocins applied to
food packaging materials to inhibit Listerial monocytogenes on meats. Journal of
Food Science 62, 413-415.
Moly, A.K., Radush, J.H., Androsh, R., Bhagawan, S.S., and Thomas, S. (2005).
Nonisothermal crystallisation, melting behaviour and wide angle X-ray scattering
investigations on linear low density polyethylene (LLDPE)/ethylene vinyl acetate
(EVA) blends: effects of compatibilisation and dynamic crosslinking. European
Polymer Journal 41, 1410-1419.
Neetu, J., Srivastava, S.K., Aggarwal, K.K., Ramesh, S., and Kumar, S. (2001). Essential oil
composition of Zanthoxylum alatum seeds from northern India. Flavour and
Fragrance Journal 16, 408-410.
Nicholson, M.D. (1998). The role of natural antimicrobials in food/packaging
biopreservation. Journal of Plastic Film and Sheeting 14, 234-241.
Olasupo, N.A., Fitzerald, D.J., Narbad, A., and Gasson, M.J. (2004). Inhibition of Bacillus
subtilis and Listeria innocua by nisin in combination with some naturally occuring
organic compounds. Journal of Food Protection 67, 596-600.
Onawunmi, G.O., Yisak, W.A., and Ogunlana, E.O. (1984). Antibacterial constituent in
essential oil of cymbopogon citratus. Journal of Ethnapharmacol 12, 279-286.
Padgett, T., Han, I.Y., and Dawson, P.L. (1998). Incorporation of food-grade antimicrobial
compounds into biodegradable packaging films. Journal of Food Protection 61,
1330-1335.
Paik, J.S., Dhanasekharan, M., and Kelly, M.J. (1998). Antimicrobial activity of UV-
irradiated nylon film for packaging applications. Packaging Technology and
Science 11, 179-187.
88 References
Park, J.S., Kim, J.H., Nho, Y.C., and Kwon, O.H. (1998). Antibacterial activities of acrylic
acid-grafted polypropylene fabric and its metallic salt. Journal of Applied Polymer
Science 69, 2213-2220.
Parry, R.T., Introduction in Principles and Applications of Modified Atmoshphere
Packaging of Food, Blackie Academic and Professional, Glasgow, pp. 1-18, 1993.
Pirkle, C., and Braatz, R. (2003). Dynamic modeling of blow film extrusion. Polymer
Engineering and Science 43, 398-418.
Podhajny, R.M. (2004). Antimicrobials on the fast track. Material Columnist Science 20, 20.
Prasad, G., Kumar, A., Singh, A.K., Bhattacharya, A.K., Singh, K., and Sharma, V.D.
(1986). Antimicrobial activity of essential oils of some Ocicum species and clove
oil. Fitoterapia 57, 429-432.
Radulovic, N., Stojanovic, G., and Palic, R. (2006). Composition and antimicrobial activity
of Equisetum arvense L. essential oil. Phytotherapy Research 20, 85-88.
Raina, V.K., Srivastava, S.K., Aggarwal, K.K., Ramesh, S., and Kumar, S. (2001). Essential
oil composition of Cinnamomum zeylanicum Blume leaves from Little Andaman,
India. Flavour and Fragrance Journal 16, 374-376.
Reuveni, R., Fleischer, A., and Putievsk, E. (1984). Fungistatic activity of essential oils
from ocimum basilicum. Journal of Essential Oil 110, 20-22.
Roberto, V., and James, S. (2006). Chemical characterization of basil (Ocimom spp.) based
on volatile oils. Flavour and Fragrance Journal 21, 214-221.
Robertson, G.L., Food Packaging: Principles and Practice, Marcel Dekker, New York, 1993.
Rooney, M.L., Plastics in Active Packaging. In: Materials and Development of Plastic
Packaging, Rooney, M.L. (Ed), 1995a.
Rooney, M.L., Active Packaging in Polymer Films. In: Active Food Packaging, Blackie
Academic & Professional, London, 1995b.
89 References
Scannell, A.G.M., Hill, C., Ross, R.P., Marx, S., Hartemeier, W., and Arendt, E.K. (2000).
Development of bioactive food packaging materials using immobilised bacteriocins
Lactin 3147 and Nisaplin. International Journal of Food Microbiology 60, 241-249.
Seabrook, Jr., Samuel, G., Willam, E., and Craver, I. Polymer Containing Antimicrobial
Agents and Methods for Making and Using Same, Patent Issue 953908, 1997,
Magellan Companies Inc., USA.
Sefidkon, F., Kalvandi, R., Arti, M., and Barazandeh, M.M. (2005). Essential oil variability
of Thymus eriocalyx (Ronniger) Jalas. Flavour and Fragrance Journal 20, 521-
524.
Shen, A.-Y., Huang, M.-H., Liao, L.-F., and Wang, T. (2005). Thymol alalogues with
antioxidant and L-type calcium current inhibitory activiy. Drug Development
Research 64, 195-202.
Sherman, and Manolis, L. (1998). Biocides keep the bugs off your plastics. Plastic
Technology 44, 45
Sidiropoulos, V., and Vlachopoulos, J. (2005). Temperature gradient in blown film bubbles.
Advances in Polymer Technology 24, 83-90.
Simon, J.E., Quinn, J., and Murray, R.G., Advances in New Crops Research, Portland,
Oregon, Simon, J.E. (Ed), pp. 484-489, 1990.
Singh, G., Maurya, S., and Catalan, C. (2005). Studies on essential oils, Part 41. Chemical
composition, antifungal, antioxidant and sprout suppressant activities of coriander
(Coriander sativum) essential oil and its oleoresin. Flavour and Fragrance Journal,
In press.
Sinha, G.K., and Gulathi, B.C. (1990). Antimicrobial and antifungal study of some essential
oils and some of their constituents. Indian Perfumer 34, 126-129.
Suppakul, P., Miltz, J., Sonneveld, K., and Bigger, S.W. (2003a). Active packaging
technologies with an emphasis on antimicrobial packaging and its applications.
Journal of Food Science, Concise Reviews and Hypotheses 68, 408-420.
90 References
Suppakul, P., Miltz, J., Sonneveld, K., and Bigger, S.W. (2003b). Antimicrobial properties
of basil and its possible application in food packaging. Journal of Agricultural and
Food Chemistry 51, 3197-3207.
Suppakul, P. Study of Antimicrobial Films Containing Basil Extracts, PhD Thesis, Polymer
Packaging Research Unit, Victoria University, Melbourne, Australia, 2004.
Suyatma, N., Tighzert, L., and Copinet, A. (2005). Effects of hydrophilic plasticizers on
mechanical, thermal and surface properties of Chitosan films. Journal of
Agricultural and Food Chemistry 53, 3950-3957.
Tadmor, Z., and Gogos, C.G., Principles of Polymer Processing, Wiley Interscience, New
York, pp. 89-92, 1979.
Tepe, B., Daferera, D., Sokmen, M., Polissiou, M., and Sokmen, A. (2004). Invitro
antimicrobial and antioxident activities of the essential oils and various extracts of
Thymus eigii. Journal of Food Protection 52, 1132-1137.
Thompson, D.P. (1989). Fungitoxic activity of essential oil components on food storage
fungi. Mycologia 81, 151-153.
Tillekeratne, M., and Easteal, A. (2000). Modification of zein films by incorporation of
polyethylene glycols. Polymer International 49, 127-134.
Todd, D. (1999). Improving the incorporation of fillers in plastics. A special report.
Advances in Polymer Technology 19, 54-64.
Vartiainen, J., Skytta, E., and Ahvenainen-Rantala, R. (2003). Antimicrobial and barrier
properties of LDPE films containing Imazalil and EDTA. Journal of Plastic Film
and Sheeting 19, 249-261.
Walter, P., Mader, D., and Reichert, P. (1999). Novel polypropylene materials. Journal of
Macromolecular Science 36, 1613
Wang, X., Wang, Z., and Wang, X. (2005). Preparation and characterization of linear low-
density polyethylene/low-density polyethylene/TiO2 membranes. Journal of
Applied Polymer Science 98, 216-221.

91 References
Wang, Z., Li, G., Xie, g., and Zhang, Z. (2005). Dispersion behaviour of titanium dioxide
nanoparticles in LLDPE and LDPE nanocomposites. Macromolecular Chemistry
and Physics 206, 258-262.
Weng, Y.M., and Hotchkiss, J.H. (1992). Inhitbition of surface moulds on cheese by
polyethylene film containing the antimycotic imazalil. Journal of Food Protection
55, 367-369.
Weng, Y.M., and Hotchkiss, J.H. (1993). Anhydrides as antimycotic agents added to
polyethylene films for food packaging. Packaging Technology and Science 6, 123-
128.
Xie, M., Liu, X., and Li, H. (2006). Influence of polyethylene glycol containing additives on
the extrusion of ultra high molecular weight polyethylene/polypropylene blend.
Journal of Applied Polymer Science 100, 1282-1288.
Yam, K.L., and Lee, D.S., Design of Modified Atmosphere Packaging for Fresh Produce.
In: Active Food Packaging, Blackie Academic & Professional, London, Rooney,
M.L. (Ed), p. 55, 1995.
Yam, K.L., Takhistov, P.T., and Miltz, J. (2005). Intelligent packaging: Concepts and
applications. Journal of Food Science, Concise Reviews and Hypotheses 70, R1-
R10.
Youdim, K.A., and Deanes, S.G. (2000). Effect of thyme oil and thymol dietary
supplementation on the antioxident status and fatty acid composition of the ageing
rat brain. Journal of Nutrition 83, 87-93.
Zhou, L.Y. Quantitative Analysis of Additives in Low Density Polyethylene Using On-line
Supercritical Fluid Extraction/Supercritical Fluid Chromatography, Masters Thesis,
Faculty of the Virginia Polytechnic Institute and State University, 1998.

92 Appendix A
Appendix A Material Properties
Table A.1. Typical properties of LDPE resin
Polymer Resin: QenosTM ALKATHENE XLF197, Low-Density Polyethylene
Product Characteristics Processing method Additives Features Uses Manufacturer
Blown film extrusion grade No additives (could be incorporated to enhance cling performance) Suitable for thin film guage (less than 20 microns) Packaging Qenos Pty Ltd.
Physical Properties Density Melt Index (190°C/2.16 kg)
0.920 g cm-3
5.5 dg min-1
ASTM D1505 ASTM D1238
Typical Film Properties (15 µm thickness; blow ratio 3.2 to 1)
Haze Gloss Dart Impact Tear strength (N) Tensile yield (MPa) Tensile strength (MPa) % strain at break Stiffness modulus (MPa)
3.5%
74 units
45 g 2.9 (MD) 0.8 (TD) 9 (MD) 10 (TD) 22 (MD) 15 (TD) 120% (MD) 670% (TD) 150 (MD) 190 (TD)
ASTM D1003 ASTM D2457 ASTM D1709 ASTM D1922 ASTM D882 ASTM D882 ASTM D882 ASTM D882
Processing Information FDA Status Complies with Food and Drug Administration Regulation 21
CFR 177.1520(c) 2.1 and AS2070-1999 section 4.1.1(a). Not applicable for use in articles that contact food except for articles used for packaging or holding food during cooking.
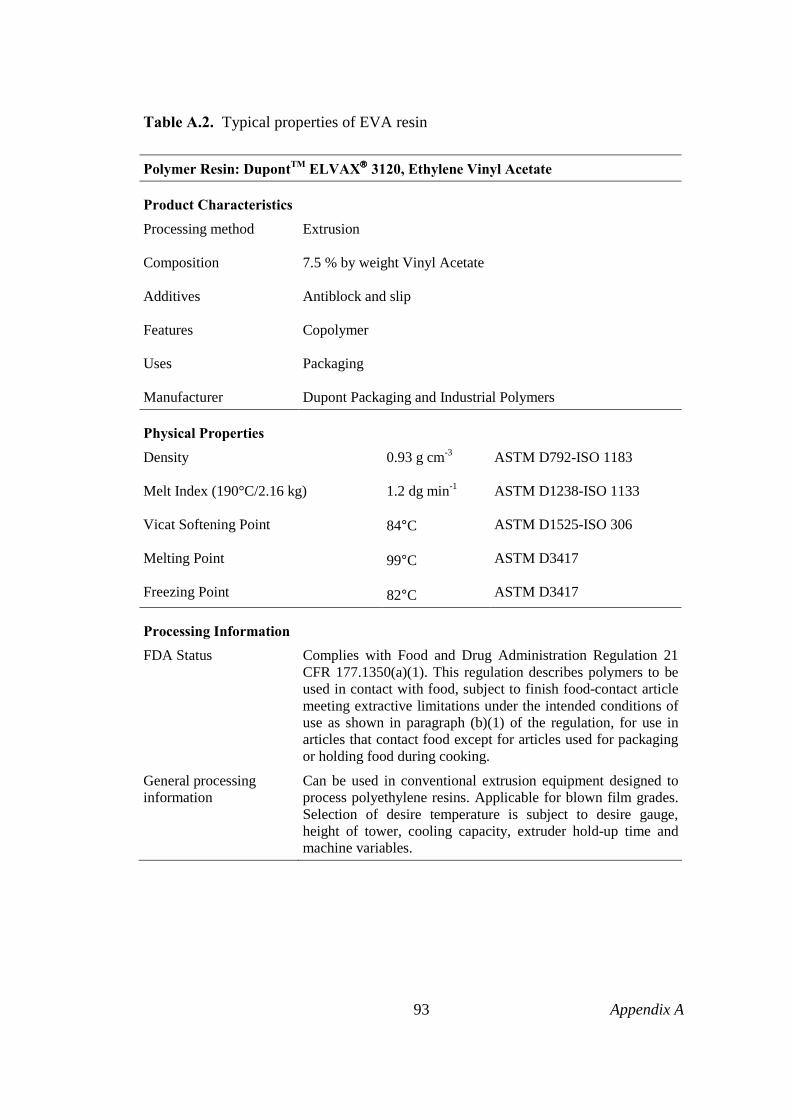
93 Appendix A
Table A.2. Typical properties of EVA resin
Polymer Resin: DupontTM ELVAX 3120, Ethylene Vinyl Acetate
Product Characteristics Processing method Composition Additives Features Uses Manufacturer
Extrusion 7.5 % by weight Vinyl Acetate Antiblock and slip Copolymer Packaging Dupont Packaging and Industrial Polymers
Physical Properties Density Melt Index (190°C/2.16 kg) Vicat Softening Point Melting Point Freezing Point
0.93 g cm-3
1.2 dg min-1 84°C 99°C 82°C
ASTM D792-ISO 1183 ASTM D1238-ISO 1133 ASTM D1525-ISO 306 ASTM D3417 ASTM D3417
Processing Information FDA Status Complies with Food and Drug Administration Regulation 21
CFR 177.1350(a)(1). This regulation describes polymers to be used in contact with food, subject to finish food-contact article meeting extractive limitations under the intended conditions of use as shown in paragraph (b)(1) of the regulation, for use in articles that contact food except for articles used for packaging or holding food during cooking.
General processing information
Can be used in conventional extrusion equipment designed to process polyethylene resins. Applicable for blown film grades. Selection of desire temperature is subject to desire gauge, height of tower, cooling capacity, extruder hold-up time and machine variables.
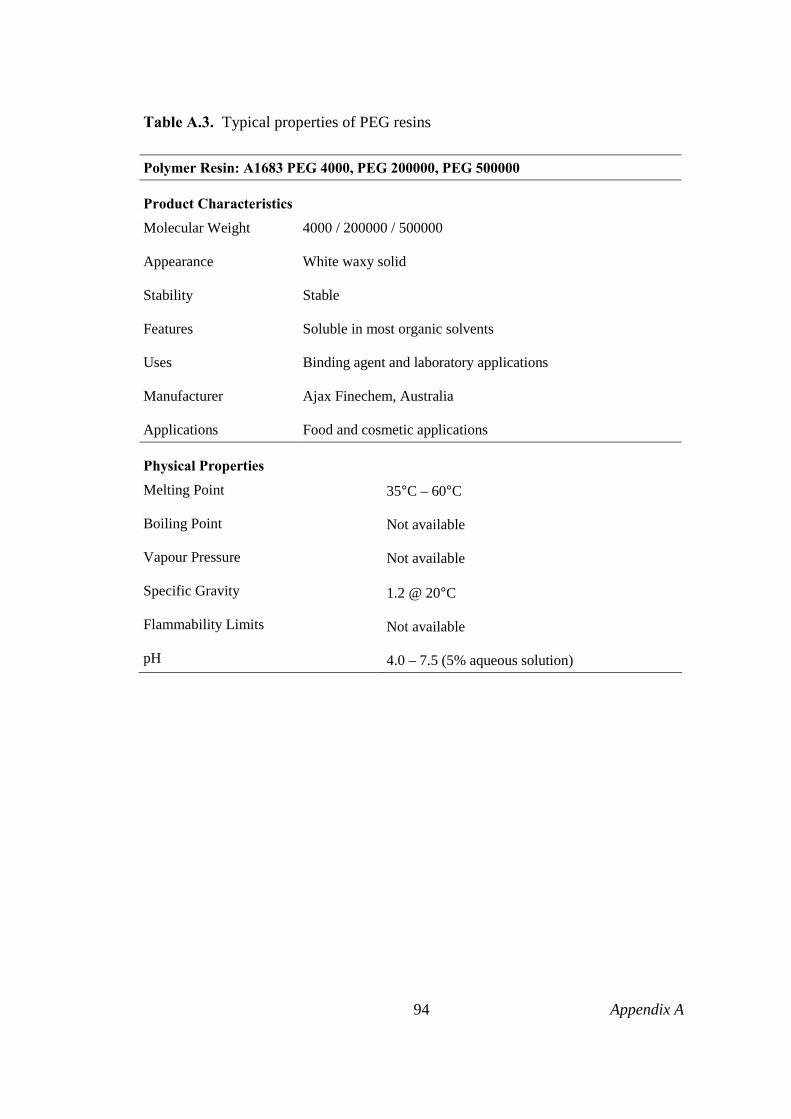
94 Appendix A
Table A.3. Typical properties of PEG resins
Polymer Resin: A1683 PEG 4000, PEG 200000, PEG 500000
Product Characteristics Molecular Weight Appearance Stability Features Uses Manufacturer Applications
4000 / 200000 / 500000 White waxy solid Stable Soluble in most organic solvents Binding agent and laboratory applications Ajax Finechem, Australia Food and cosmetic applications
Physical Properties Melting Point Boiling Point Vapour Pressure Specific Gravity Flammability Limits pH
35°C – 60°C Not available Not available 1.2 @ 20°C Not available 4.0 – 7.5 (5% aqueous solution)
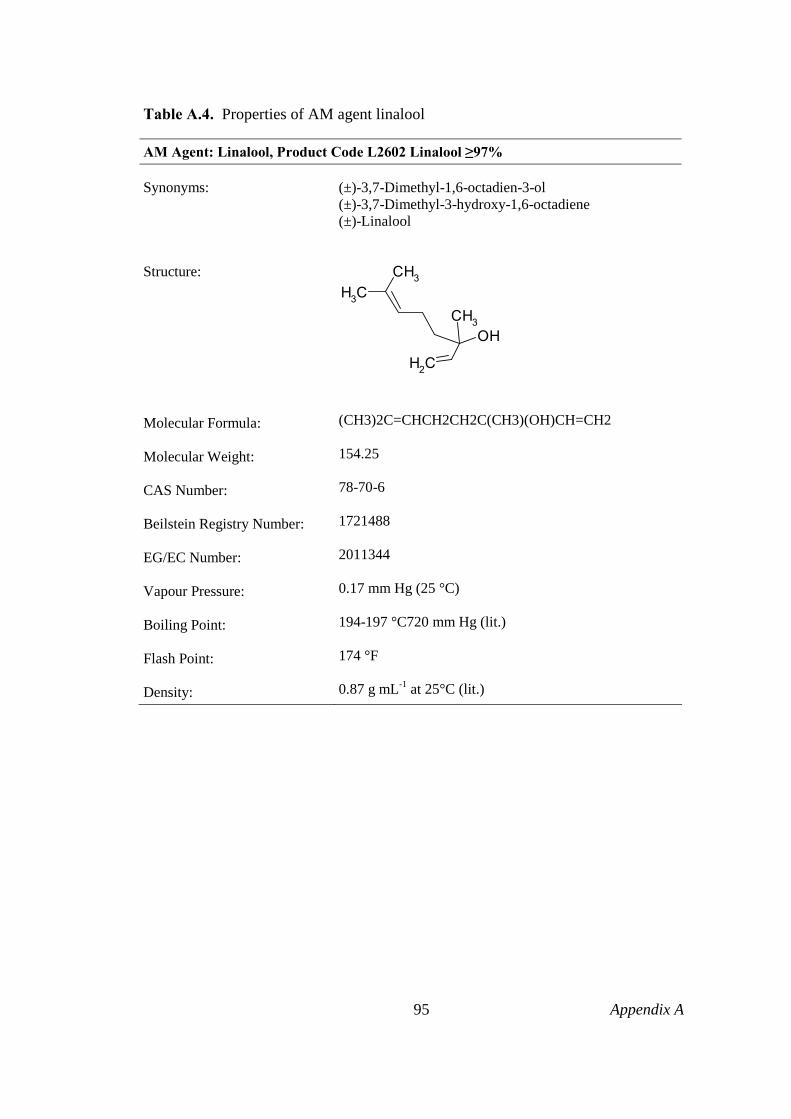
95 Appendix A
Table A.4. Properties of AM agent linalool
AM Agent: Linalool, Product Code L2602 Linalool ≥97%
Synonyms: Structure:
Molecular Formula: Molecular Weight: CAS Number: Beilstein Registry Number: EG/EC Number: Vapour Pressure: Boiling Point: Flash Point: Density:
(±)-3,7-Dimethyl-1,6-octadien-3-ol (±)-3,7-Dimethyl-3-hydroxy-1,6-octadiene (±)-Linalool
CH3CH3
CH3OH
CH2 (CH3)2C=CHCH2CH2C(CH3)(OH)CH=CH2 154.25 78-70-6 1721488 2011344 0.17 mm Hg (25 °C) 194-197 °C720 mm Hg (lit.) 174 °F 0.87 g mL-1 at 25°C (lit.)

96 Appendix A
Table A.5. Properties of AM agent thymol
AM Agent: Thymol, Product Code T0501 Thymol ≥99.5%
Synonyms: Structure: Molecular Formula: Molecular Weight: CAS Number: Beilstein Registry Number: EG/EC Number: Vapour Pressure: Boiling Point: Melting Point: Density:
2-Isopropyl-5-methylphenol 5-Methyl-2-(1-methylethyl)phenol 5-Methyl-2-isopropylphenol
OH
CH3
CH3
CH3
2-[(CH3)2CH]C6H3-5-(CH3)OH 150.22 89-83-8 1907135 2019448 1 mm Hg (64°C) 232°C (lit.) 48-51°C (lit.) 0.965 g mL-1 at 25°C (lit.)
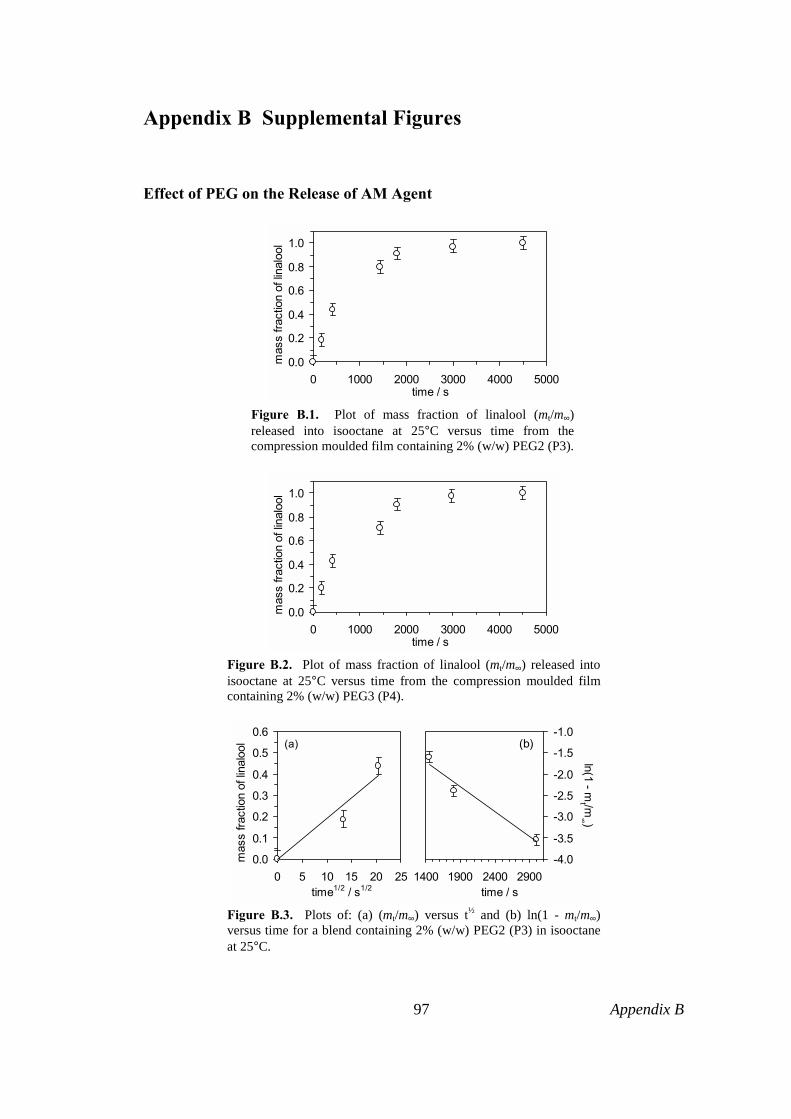
97 Appendix B
Appendix B Supplemental Figures
Effect of PEG on the Release of AM Agent
0.0
0.2
0.4
0.6
0.8
1.0
0 1000 2000 3000 4000 5000time / s
mas
s fra
ctio
n of
lina
lool
Figure B.1. Plot of mass fraction of linalool (mt/m∞) released into isooctane at 25°C versus time from the compression moulded film containing 2% (w/w) PEG2 (P3).
0.0
0.2
0.4
0.6
0.8
1.0
0 1000 2000 3000 4000 5000time / s
mas
s fra
ctio
n of
linal
ool
Figure B.2. Plot of mass fraction of linalool (mt/m∞) released into isooctane at 25°C versus time from the compression moulded film containing 2% (w/w) PEG3 (P4).
-4.0
-3.5
-3.0
-2.5
-2.0
-1.5
-1.0
1400 1900 2400 2900time / s
(b)
ln(1 - mt /m
∞ )
0.0
0.1
0.2
0.3
0.4
0.5
0.6
0 5 10 15 20 25time1/2 / s1/2
mas
s fra
ctio
n of
lina
lool (a)
Figure B.3. Plots of: (a) (mt/m∞) versus t½ and (b) ln(1 - mt/m∞) versus time for a blend containing 2% (w/w) PEG2 (P3) in isooctane at 25°C.

98 Appendix B
-4.0
-3.5
-3.0
-2.5
-2.0
-1.5
-1.0
1400 1900 2400 2900time / s
(b)
ln(1 - mt /m
∞ )
0.0
0.1
0.2
0.3
0.4
0.5
0 100 200time1/2 / s1/2
mas
s fra
ctio
n of
linal
ool (a)
Figure B.4. Plots of: (a) (mt/m∞) versus t½ and (b) ln(1 - mt/m∞) versus time for a blend containing 2% (w/w) PEG3 (P4) in isooctane at 25°C.
-4.0-3.5-3.0-2.5-2.0-1.5-1.0-0.50.0
0 400 800 1200 1600 2000 2400 2800time / s
ln(1
- m
t /m∞)
Figure B.5. Plot of ln(1 - mt/m∞) versus time for the release of linalool into isooctane at 25°C from the compression moulded film containing 2% (w/w) PEG2 (P3).
-4.0-3.5-3.0-2.5-2.0-1.5-1.0-0.50.0
0 400 800 1200 1600 2000 2400 2800time / s
ln(1
- m
t /m∞)
Figure B.6. Plot of ln(1 - mt/m∞) versus time for the release of linalool into isooctane at 25°C from the compression moulded film containing 2% (w/w) PEG3 (P4).

99 Appendix B
Effect of EVA on the Release of AM Agent
0.0
0.2
0.4
0.6
0.8
1.0
0 1000 2000 3000 4000 5000time / s
mas
s fra
ctio
n of
linal
ool
Figure B.7. Plot of mass fraction (mt/m∞) of linalool released into isooctane at 25°C versus time from compression moulded film containing 0% (w/w) EVA (E0).
0.0
0.2
0.4
0.6
0.8
1.0
0 1000 2000 3000 4000 5000time / s
mas
s fra
ctio
n of
linal
ool
Figure B.8. Plot of mass fraction (mt/m∞) of linalool released into isooctane at 25°C versus time from compression moulded film containing 10% (w/w) EVA (E1).
0.0
0.2
0.4
0.6
0.8
1.0
0 1000 2000 3000 4000 5000time / s
mas
s fra
ctio
n of
linal
ool
Figure B.9. Plot of mass fraction (mt/m∞) of linalool released into isooctane at 25°C versus time from compression moulded film containing 50% (w/w) EVA (E2).

100 Appendix B
0.00.10.20.30.40.50.60.7
0 5 10 15 20 25time1/2 / s1/2
mas
s fra
ctio
n of
linal
ool (a)
Figure B.10. Plot of (mt/m∞) versus t½ versus time for a blend containing 50% (w/w) EVA (E2) into isooctane at 25°C.
Effect of Food Simulant on the Release of AM Agent
-3.5
-3.0
-2.5
-2.0
400 500 600time / s
(b)
ln(1 - mt /m
∞ )
0.00.10.20.30.40.50.60.7
5 10 15 20time1/2 / s1/2
mas
s fra
ctio
n of
lina
lool (a)
Figure B.11. Plots of: (a) (mt/m∞) versus t½ and (b) ln(1 - mt/m∞) versus time for the release of linalool into isooctane at 25°C for the F2 film.
-5.0
-4.0
-3.0
-2.0
-1.0
1500 2500 3500 4500time / s
(b)
ln(1 - mt /m
∞ )
0.0
0.2
0.4
0.6
10 20 30 40time1/2 / s1/2
mas
s fra
ctio
n of
lina
lool (a)
Figure B.12. Plots of: (a) (mt/m∞) versus t½ and (b) ln(1 - mt/m∞) versus time for the release of linalool into 95% ethanol at 25°C for the F2 film.

101 Appendix B
-3.5
-3.0
-2.5
-2.0
800 1000 1200 1400 1600time / s
(b)
ln(1 - mt /m
∞ )
0.0
0.2
0.4
0.6
0 5 10 15time1/2 / s1/2
mas
s fra
ctio
n of
thym
ol (a)
Figure B.13. Plots of: (a) (mt/m∞) versus t½ and (b) ln(1 - mt/m∞) versus time for the release of thymol into isooctane at 25°C for the F3 film.
-2.0
-1.5
-1.0
-0.5
3600 5400 7200time / s
(b)
ln(1 - mt /m
∞ )
0.0
0.1
0.2
0.3
0.4
0.5
0 20 40 60time1/2 / s1/2
mas
s fra
ctio
n of
thym
ol (a)
Figure B.14. Plots of: (a) (mt/m∞) versus t½ and (b) ln(1 - mt/m∞) versus time for the release of thymol into 95% ethanol at 25°C for the F3 film.
Related Documents