Antimicrobial Effects of selected Non-antibiotics on Sensitivity and Invasion of Gram-positive Bacteria PhD-thesis by: Oliver Hendricks Institute of Clinical Research Departments of Clinical Microbiology Sønderborg /Odense Faculty of Health Sciences University of Southern Denmark July 2006

Welcome message from author
This document is posted to help you gain knowledge. Please leave a comment to let me know what you think about it! Share it to your friends and learn new things together.
Transcript
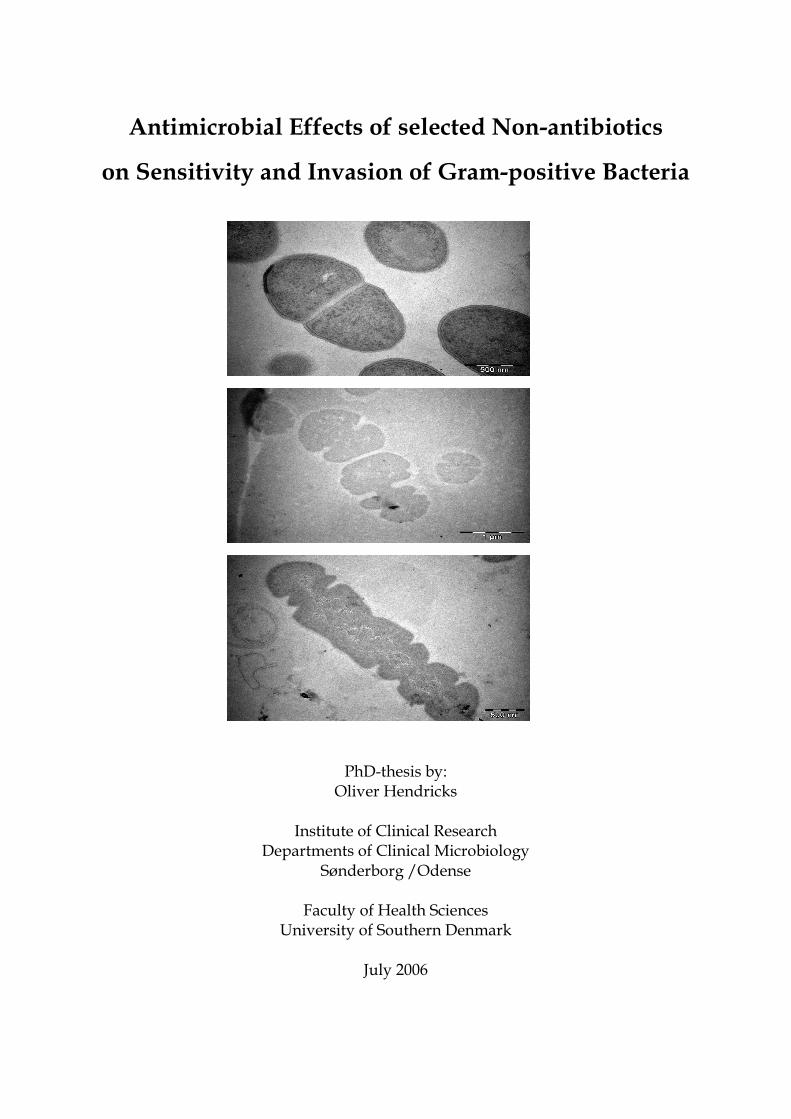
Antimicrobial Effects of selected Non-antibiotics
on Sensitivity and Invasion of Gram-positive Bacteria
PhD-thesis by: Oliver Hendricks
Institute of Clinical Research
Departments of Clinical Microbiology Sønderborg /Odense
Faculty of Health Sciences
University of Southern Denmark
July 2006
Table of contents 1. Acknowledgements page 3 2. Abstract in English page 4 3. Resumé på dansk page 6 4. Introduction page 8 4.1. The clinical problem: The emergence of multi-drug resistance 4.2. Efflux pumps as pharmacological targets 4.3. The concept of non-antibiotics 4.4. Aims and investigation strategies
5. Materials and Methods page 15 5.1. Choice of test compounds 5.2. Micro-organisms 5.3. Microbiological identification and susceptibility testing 5.4. Inoculum 5.5. MIC determination of test compounds 5.6. Checkerboard 5.7. Internalization assay 5.8. PCR set-up 6. Results page 22 6.1. Results of microbiological identification and susceptibility testing. 6.2. MIC values of selected compounds defined by agardilution 6.3. Results of microdilution and checkerboard tests 6.4. Effect of phenothiazines on the identification of the mecA- gene 6.5. Effect of phenothiazines on the bacterial invasion of human epithelial cells 7. Discussion page 48
7.1. Reversal of resistance and possible implications on bacterial efflux pumps 7.2. Reversal of resistance in Gram negative bacteria 7.3. Interaction with bacterial invasion 7.4. Potential of the selected neurotropic drugs
8. Perspectives page 59 9. References page 61 10. Glossary page 66 Appendices 1, 2
Articles I-III
Manuscript 1

Antimicrobial effects of selected non-antibiotics in Gram positive bacteria – 1. Acknowledgements
3
1. Acknowledgement
I am grateful to Associate Professor Dr. med. Jette Elisabeth Kristiansen for introducing
me to the exciting field of non-antibiotics. Without her everlasting enthusiasm and
presence as daily supervisor, this project would not exist. I thank Professor Dr. med. Hans
Jørn Kolmos for supervising and guiding me through the project. During the years he has
always been available for support. I am grateful to Cand. scient. Niels Rüdiger for his
significant scientific input to the bacterial genome studies and Professor Dr. med. Hany
Sahly and Professor Dr. scient. Rainer Podschun for their expert advice on epithelial cell
models.
Thanks are due to Elisa Knudsen and Lone Aagaard for their valuable technical assistance
and Cand. scient. Trine S. Butterworth for her patient introduction to pcr-techniques and
her help, whenever technical problems needed creative solutions. I thank Margarethe
Krog for realizing the desired scientific posters and Torrill Bille for her ambitious and
effective bibliographic skills. I also thank the other members of the Department of Clinical
Research (Hanne H. Nielsen, Helle Nielsen, Dorte T. Jakobsen, Karin Jacobsen, Jørn Posselt
and Dr. med. Jens J Strøm) for their valuable input in discussions and unfailing sense of
humour. I thank Associate Professor Cand. scient. Jørn B. Christensen for donation of the
enantiomers of thioridazine and Cand. med. vet. Marianne Skov PHD, Cand. med.
Thomas Delvin, Cand. scient. Annamária Molnár, Professor Cand. scient. Hendrik Keyzer
and Cand. med. Alice Friis-Møller for helpful input on my work. I am indebted to the
members of the Cost Action B16 (Reversal of Resistance by help of Trans Membrane
Compounds) of the European Commission for their valuable advice and cooperation.
I thank my parents Elfriede and Peter for their support. Finally but not least, I thank my
family, Yasmin, Ferdinand and Rosamunde for their patience and love.
This work was financed by the Department of Public Health, County of Southern
Jytland and supported by grants from the Foundation of Research, University of
Southern Denmark.

Antimicrobial effects of selected non-antibiotics – 2. Abstract in English
4
2. Abstract in English for the Danish Medical Bulletin
This thesis involves experimental work done at the Departments of Clinical Microbiology,
University of Southern Denmark, Sønderborg and Odense and the Department of Clinical
Virology and Microbiology, University of Kiel, Germany during the period of November
2002 to October 2005.
Infectious diseases caused by multi resistant bacteria are a matter of worldwide concern
both on an epidemiological level and with regards to the treatment regimen. New
strategies and treatments are being sought globally in attempts to keep up with the
development of drug resistance.
Recently, the focus has been centred on the anti-microbial effect of chemical substances
with affinity to the peripheral and the central nervous systems. Some psychotropic
therapeutics, especially the phenothiazines, show specific anti-microbial properties when
used in conjunction with antibiotics/chemotherapeutics against highly resistant bacteria.
The anti-microbial properties of selected psychotropic compounds were evaluated using
the Minimum Inhibitory Concentration (MIC) of the drugs against different sensitive and
resistant Gram positive bacteria. The evaluation of the combined effect of psychotropic
compounds and conventional antibiotics of clinical relevance showed a significant synergy
independent of the mechanism of resistance, especially in the case of Staphylococcus aureus,
Staphylococcus epidermidis, Streptococcus pyogenes and Enterococcus faecalis.
Many bacteria invade the cell as a part of the cycle of infection. The influence of the
phenothiazine derivatives chlorpromazine and thioridazine on bacterial invasion in the
human epithelial cell lines T-24 (urothel), HCT-8 (ileocecal) and A-549 (alveolar) was
investigated. The results indicated a significant reduction in the mean bacterial invasion
ability in the investigated cell lines in the presence of selected agents.
Antimicrobial effects of selected non-antibiotics – 2. Abstract in English
5
Based on the phenotypic findings, we studied several hypothetical models for the anti-
microbial effect of the test compounds. Interference of the selected psychotropics with
efflux based multi drug resistance was documented, whereas the interaction with the
bacterial resistance genes could not be directly proven.
This study offers new information on the phenotypic effect of the phenothiazine
derivatives on Gram positive bacteria and their effects on the underlying genetic and
transport mechanisms. The diversity of observed resistance types lead to the hypothetical
interaction between efflux and Penicillin Binding Proteins (PBP). The anti-microbial
activities of these compounds, especially the stereo-isomeric thioridazine{-} may have a
place in the treatment of infections caused by multi-drug resistant Gram positive bacteria,
where the options for current antibiotic treatment are limited.

Antimicrobial effects of selected non-antibiotics – 3. Resumé på dansk
6
3. Resumé på dansk
Ph.-d. afhandlingen bygger på eksperimentelt arbejde udført ved Forskningsenheden for
Klinisk Mikrobiologi, Klinisk Institut, Syddansk Universitet, Klinisk Mikrobiologisk
Afdeling og Afdeling for Forskning, Sønderborg Sygehus og Odense Universitetshospital,
og Klinisk Mikrobiologisk & Virologisk Institut, Universitet Kiel, Tyskland i perioden
november 2002– oktober 2005.
Internationalt er infektioner med multiresistente bakterier et alvorligt problem, både
behandlingsmæssigt og epidemiologisk. Der søges globalt efter nye strategier og
behandlingskoncepter for at komme på forkant med situationen. I de seneste år har der
bl.a. været fokuseret på den antimikrobielle effekt af kemiske forbindelser, der har affinitet
til det perifere og centrale nervesystem. Især lægemidler inden for phenothiazin-gruppen
har overraskende vist sig at have specielle antimikrobielle egenskaber, når de anvendes
sammen med antibiotika/ kemoterapeutika på højresistente Gram positive bakterier.
I afhandlingen er antimikrobielle egenskaber af udvalgte psykofarmaka, især
phenothiaziner, undersøgt mhp. at bestemme Minimum Inhibitory Concentration (MIC)
overfor antibiotika følsomme og resistente Gram positive bakterier. Overfor
Staphylococcus aureus, MRSA, Staphylococcus epidermidis, Streptococcus pyogenes og
Enterococcus faecalis viste det sig at en kombination af antibiotika med de valgte neurotrope
stoffer udviste signifikant synergi uafhængig af om det drejede sig om β-lactam, macrolid
eller glycopeptid resistens i de enkelte isolater.
Mange behandlingsresistente infektioner skyldes intracellulært lejrede bakterier. Derfor er
de neurotrope stoffers virkning undersøgt in en celle-model, som kan afdække om de
neurotrope stoffer chlorpromazin og thioridazin hæmmer den bakterielle invasion i
humane epithelcellelinier, som T-24 (urothel), HCT-8 (ileocecal) eller A-549 (alveolar).
Undersøgelserne viste en signifikant nedsættelse af den gennemsnitlige bakterielle
invasion i de undersøgte celleliner.

Antimicrobial effects of selected non-antibiotics – 3. Resumé på dansk
7
På baggrund af de fundne fænotypiske resultater opstilles forskellige hypoteser med
henblik på at forklare den fundne antibakterielle aktivitet af de valgte testsubstanser:
Det påvises at phenothiazin-derivater interagerer med efflux-medieret multi-resistens
og β-laktam resistens. Det har ikke været muligt at påvise en direkte effekt
af testsubstanserne på resistens-gener.
Studierne og det eksperimentelle arbejde har bidraget med nyt viden om især
phenothiazin-derivaternes fænotypiske virkning på Gram positive bakterier og disse
lægemidlers virkning på basale genetiske mekanismer og transportmekanismer.
Resultaterne peger på en interaktion mellem efflux mekanismer og Penicillin Bindende
Proteiner (PBP). De undersøgte lægemidler og nye især stereo-isomere analoger kan
forventes at få betydning ved den antibiotiske behandling af infektioner forårsaget af
multiresistente bakterier, hvor de aktuelle behandlings-strategier ikke er tilstrækkelige.

Antimicrobial effects of selected non-antibiotics – 4. Introduction
8
4. Introduction
4.1. The clinical problem: the emergence of multi-drug resistance
Anti-microbial drug resistance is a serious global health issue compromising the treatment
of bacterial, viral, fungal and parasitic infections (Dancer 2001; Berger Bachi 2002). The
increase and spread of drug resistance is the result of the evolutionary selection exerted by
the use and/or overuse of antimicrobials, and increasing human geographic mobility
(Heinemann 2000; Levy & Marshall 2004). Resistance development is now recognised both
in hospitals and in the community worldwide (Levy 2001; Livermore 2004). In this thesis
the focus has been on selected anti-microbial resistance in different Gram positive species
of clinical relevance both in developed and in developing countries such as:
Methicillin resistant Staphylococcus aureus (MRSA), Fluoroquinolone-resistant
Staphylococcus aureus (Kaatz 2005), Methicillin resistant Staphylococcus epidermidis (MRSE)
(Huppertz et al. 2004), erythromycin resistant Streptococcus pyogenes and Streptococcus
pneumoniae (Frimodt-Møller et al. 2001) and Vancomycin resistant enterocci (VRE) (Kayser
2003). Serious clinical infectious diseases caused by the investigated resistant Gram
positive strains affect virtually all human organs.
Staphylococcus aureus is an important cause of community- and hospital-acquired
infections. Infections caused by MRSA affect skin, soft tissue, bone and lung tissue and
give problems worldwide. An increased number of MRSA all over Europe has been
documented in the period 1999 – 2002 (Tiemersma 2004). Even in the Scandinavian
countries, which used to be low prevalence areas, MRSA is now on the increase (European
Antimicrobial Resistance Surveilance System, EARSS 2005).
Streptococcus pneumoniae is the predominant cause of community-acquired pneumonia
leading to bloodstream infections and meningitis in children and adults. The erythromycin
and penicillin resistance is now threatening the successful treatment of these infections.
The prevalence of S. pyogenes M-type, which is resistant to erythromycin because of the
presence of the mefA gene, has risen considerably all over Europe. The literature quotes
resistance frequencies between 38-97%.

Antimicrobial effects of selected non-antibiotics – 4. Introduction
9
A German survey covering the 2002-2003 time period shows the erythromycin resistance
rate as 14% (n=381) of which 55.6% was due to mefA efflux (Reinert RR et al. 2004).
Enterococci have become important nosocomial pathogens causing different serious and
even lethal infections in hospitalized patients, especially in immunocompromised
individuals. At the present time enterococci come in third place, sometimes even second
place in the surveys defining the frequency of bacterial infections in hospitalized patients
(Kayser 2003; Huppertz et al. 2004). Many strains of Enterococcus faecalis and Enterococcus
faecium have acquired multiple antibiotic resistance: VRE is characterized by a specific
glycopeptide resistance (VanA – VanE). Furthermore, enterococci have acquired modified
Penicillin Binding Proteins (PBP) leading to ampicillin resistant phenotypes.
The resistance development in these highly pathogenic micro-organisms might be
followed by serious treatment problems since only a few new antibiotics, primarily
fluoroquinolones and macrolides, have been licensed from 1991-2000. Strategies such as
restrictive antimicrobial prescribing have been introduced the last few years to prevent the
increasing threat of multi- resistance development. Anyway, multi-drug resistance (MDR)
is now also on the increase in northern Europe despite the reductions in prescribing in the
Scandinavian countries. New drugs or new drug combinations may be the solution in the
battle against resistance development in serious infectious diseases. The concept of
reversal of resistance by means of non-antibiotics may be a solution for bringing drug
resistant micro-organisms back to their original sensitivity to the classical antibiotics.
4.2. Efflux pumps as pharmacological targets
Passive and active efflux in eukaryotic cell systems (organs, mammalian cells) and in the
prokaryotes (microorganisms) is not a new phenomenon. Keld Danø pioneered the
concept that the eukaryotic Ehrlich`s tumor cells pumped out daunomycin, and he
demonstrated that the toxic plant extract Vinca inhibited the efflux system competitively
(Danø 1972). This important observation was extended to the presence of tet- and norA-
pumps in the prokaryotes Escherichia coli and Staphylococcus aureus (McMurry & Levy 1978;
Neyfakh et al. 1993).

Antimicrobial effects of selected non-antibiotics – 4. Introduction
10
Seen in relationship to the resistance problem it has become increasingly clear that at least
some resistance can be explained by the fact that both eukaryotes and prokaryotes are able
to pump out unwanted molecules, such as antibiotics/chemotherapeutics, from the cell
(Levy 1992; Nikaido 1994 & 2001; Borges-Walmsley et al. 2003). Following the
development of the first antibiotics and chemotherapeutics, the ultimate challenge has
been to develop synthetic or semi-synthetic molecules that retain the antimicrobial effect;
compounds the micro-organisms may not become resistant to. This has not been possible
up to date especially because of different resistance efflux systems in micro-organisms.
Efflux as a mechanism of resistance may be considered too complex a system to allow a
specific pharmacological use, especially as the efflux pumps are often not the sole cause of
the development of the resistance frequently perceived as multi-factorial (Van Bambeke et
al. 2003). The creation of efflux inhibitors with one point of attack in the resistant cell
presents a challenging scientific concept and a wider understanding of various efflux
mechanisms is imperative.
4.3. The concept of non-antibiotics
In pharmacology drugs are catalogued as antimicrobial agents or drugs for non-infectious
diseases (Williams 1995). Scattered observations from the mid-1950s indicated that many
eukaryote-directed drugs have antimicrobial, antipathogenic and antivirulence properties
(Bourdon 1962; Dastidar et al. 1976; Molnár et al. 1976; Kristiansen 1979; Crowle et al. 1992;
Molnár et al.1997; Amaral & Kristiansen 2000). A long list of compounds used in the
treatment of the peripheral and the central nervous system possess anti-microbial activity
(Kristiansen 1979). Pharmaceutical compounds developed as drugs to treat non-infectious
diseases but having anti-microbial activities are called non-antibiotics (Kristiansen 1990).
Particularly the neurotropic compounds have extraordinary anti-microbial activities.
(Kristiansen 1979, 1982, 1990). In 1979 it was shown that membrane active compounds,
which inhibit the passive ion effluxes from eukaryotic cell membranes (Seeman et al. 1971;
Clausen et al. 1973), interfere with the prokaryotic cell membranes (Kristiansen 1977 &
1979). This dualism is expressed by the technical term non-antibiotics and illustrated in
Figure 1.

Antimicrobial effects of selected non-antibiotics – 4. Introduction
11
The phenothiazines and chemically related compounds exhibit growth inhibiting activity
on a wide array of micro-organisms. This is also found for anti-psychotic drugs
(Kristiansen & Mortensen 1981 & 1987; Munoz-Bellido et al. 2000). The mechanisms of the
anti-microbial activity remains unknown, but it was suggested that the resistance
determined by efflux is inhibited by these compounds (Kaatz et al 2003).
In vitro studies demonstrate another aspect of the phenothiazines: They are concentrated
in human macrophages (Kristiansen MM et al. 2003) and different tissue types, such as
pulmonary epithelial cells. Ordway et al. demonstrated in 2002 how the phenothiazine
thioridazine at a concentration of 0.1 mg/L inhibited intracellular growth of S. aureus in
human macrophages. Therefore, it may be expected that these agents can interact with
invasive Gram positive human pathogens. The anti-microbial activity of the neurotropics
may be of clinical importance particularly in intracellular infections, as anti-microbial
concentrations of the drugs can be reached intra-cellularly, although the drug is given in
non-toxic concentrations (Forrest et al. 1963, Jortani et al. 1994).
Some phenothiazines are chiral, with the one stereoisomeric form having reduced
neurotropism: The levorotatory enantiomer of the phenothiazine thioridazine,
thioridazine{-}, has been reported to be the compound that is concentrated in human
tissue at higher levels than the dextrorotary form (Jortani et al. 1994). This compound has
earlier been reported to display less challenging CNS pharmaco-dynamic activity, e. g.
weaker blockade of dopamine D2-receptors, than thioridazine {+} (Svendsen et al. 1988).
These properties of isomeric phenothiazines are of interest for the investigation of their
anti-microbial value.

Antimicrobial effects of selected non-antibiotics – 4. Introduction
12
Figure 1. The concept of non-antibiotics (Kristiansen 1990)
Compounds which are chemically foreign or hostile to a biological system
Other chemical
Compounds Chemotherapeutics/
Non-antibiotics Antibiotics
Drugs Eukaryote Prokaryote directed directed
Eukaryotic cells
Prokaryotic cells

Antimicrobial effects of selected non-antibiotics – 4. Introduction
13
4.4. Aims and investigation strategies
The primary aim of the study was to investigate the mode of action of selected non-
antibiotics resulting in the observed antibiotic activity and to answer the question of how
the possible reversal of resistance is brought about. We used micro- and agar-dilution
techniques (Flackman 1973; Eliopulos & Moellering 1991) to define the growth inhibition
activity of and interaction between the selected antibiotics and non-antibiotics.
Furthermore, we applied cell line studies (Sahly et al. 2000) and molecular-biological tests
based on the polymerase chain reaction (Geha DJ et al. 1998). The strategy involved the use
of phenotypic patterns as guides to genetic structures and/or mechanisms that could be
affected by the non-antibiotics. In order to achieve this, an important focus was on
molecular-biological mechanisms, influenced by both the antibiotics and the non-
antibiotics on multi-resistant strains with known resistance mechanisms.
We used the following analytical steps:
• Definition of MICs of selected non-antibiotics on Gram positive strains with
relevant resistance profiles, causing the above mentioned serious and particular
intracellular infections. These data would reveal the essential baseline information
of the potential of the selected antibiotics and non-antibiotic compounds. The
investigations would tend to answer the question: What are the concentrations of
selected antibiotics/chemotherapeutics and non-antibiotics that inhibit the growth
of clinically highly relevant Gram positive bacteria?
• Microdilution techniques were performed and combined MIC-values were
obtained (Eliopulos & Moellering 1991). These investigations would answer the
questions: Do the selected non-antibiotics interact with antibiotics/chemo-
therapeutics on MDR Gram positive bacteria? If they do, is there a pattern in the
phenotypical resistance modification caused by the selected non-antibiotics? If an
interaction is seen for e.g. penicillin, methicillin, ampicillin, fluoroquinolones,
erythromycin and vancomycin- resistance, would it be related to well known and
well-described resistance mechanisms in the resistant bacterial strains?

Antimicrobial effects of selected non-antibiotics – 4. Introduction
14
• Elucidation of the mechanisms behind efflux inhibition utilising phenothiazines is
closely linked to the idea of modifying efflux related resistance. This leads to a
hypothesis that the activity of phenothiazines may be related particularly to an
interaction with efflux pumps of the Major Facilitator Superfamily (MFS) –type.
Figure 2 presents antibiotic resistance of the MFS-type, sorted by species. Specific
antibiotic resistance investigated in this study is marked blue and red.
Figure 2. MFS – efflux systems in Gram positive bacteria
• If the interactions with the different non-antibiotics and antibiotics/chemo-
therapeutics on the resistance mechanisms in the drug resistant bacterial strains can
be seen as e.g. synergistic, the next step would be to use the Polymerase-Chain
Reaction (PCR) to investigate and identify the existence of specific bacterial
resistance genes before and after modification of the phenotypical resistance
promoted by the non-antibiotics. This may lead to the development of a hypothesis
about the molecular basis for the reversal of resistance.
• Investigation of serious intracellular pathogens influenced by non-antibiotics to
answer the question: Do selected non-antibiotics inhibit or reduce bacterial
invasion of human epithelial cells?

Antimicrobial effects of selected non-antibiotics – 5. Materials and Methods
15
5. Materials and Methods
5.1. Choice of test compounds
The psychotherapeutic drugs chosen for the investigation are representatives of the
groups of neuroleptics, tricyclic antidepressants (Usdin & Forrest 1976) and Selective
Serotonin Reuptake Inhibitors (SSRI)(Mutschler 1991). In the present chapter the groups of
psychotherapeutic drugs in question will be presented and the representative compounds
discussed. Chemical structures of the compounds are given in Appendix 1.
5.1.1. Phenothiazines
Chlorpromazine (CPZ) was the first neuroleptic drug that found practical application as a
tranquilizer in psychiatry. Prochlorperazine (PCP) is used for the treatment of severe
nausea and vomiting. Both CPZ and PCP are optically inactive phenothiazines.
Promethazine (PTZ) is a commonly used antihistamine drug, chemically the racemic
mixture of levo- and dextro-rotary promethazine (PTZ{+} and PTZ{-}. Thioridazine
(THIO) in its ordinarily prescribed form is the racemic mixture of equal amounts of the
enantiomers THIO{+}and THIO{-} (Smith 1985; Svendsen et al. 1991).
5.1.2. Tricyclic Antidepressants
Amitriptyline (AMI) is a commonly prescribed tricyclic antidepressant and considered
a reference compound for the treatment of depressions. Desipramine (DES) and
imipramine (IMI) are tricyclic antidepressants similar to amitriptyline. The mechanism of
action of the tricyclic antidepressants is not well established, but usually attributed to the
inhibition of catecholamine reuptake into adrenergic nerve endings. Anticholinergic
properties of these compounds are responsible for some of their side effects (Usdin &
Forrest 1976).
Antimicrobial effects of selected non-antibiotics – 5. Materials and Methods
16
5.1.3. Selective serotonin reuptake inhibitors (SSRI)
The antidepressant effect of sertraline (SER) and citalopram (CIT) is presumably related to
their ability to inhibit the neuronal reuptake of serotonin. These compounds have only
very limited effects on norepinephrine and dopamine neuronal reuptake.
At clinical doses, SSRI block the uptake of serotonin into human platelets.
All test agents are well established neurotropic agents characterized by a three-ring system
either in form of a heteroaromatic ring (phenothiazines), or an tricyclic system (tricyclic
antidepressants) – both families targeting the same type of receptors; or the newer class of
selective serotonin reuptake inhibitors SER and CIT, see Appendix I.
All compounds have been mentioned in sporadic reports because of their additional anti-
microbial activity against a wide array of micro-organisms (Kristiansen 1990; Crowle et al.
1992; Molnár et al.1997; Amaral & Kristiansen 2000, Munoz-Bellido et al. 2000, Kaatz et al.
2003).
We determined the antimicrobial activity of all compounds in vitro. Furthermore, we
investigated a possible correlation between the observed anti-microbial properties and
stereo-isomerism, by focussing on the optically active enantiomers of thioridazine,
THIO{+}and THIO{-}.
5.1.4. Origin of psychotherapeutic drugs
Chlorpromazine, prochlorperazine, promethazine, thioridazine, amitriptyline,
desipramine, imipramine, citalopram and sertraline were purchased from Sigma-Aldrich,
Vallensbæk Strand, Denmark. The enantiomers of thioridazine, THIO{+} and THIO{-},
were synthesized by Associate Professor Cand. scient. Jørn B. Christensen, Department of
Chemistry, University of Copenhagen, Copenhagen.
Antimicrobial effects of selected non-antibiotics – 5. Materials and Methods
17
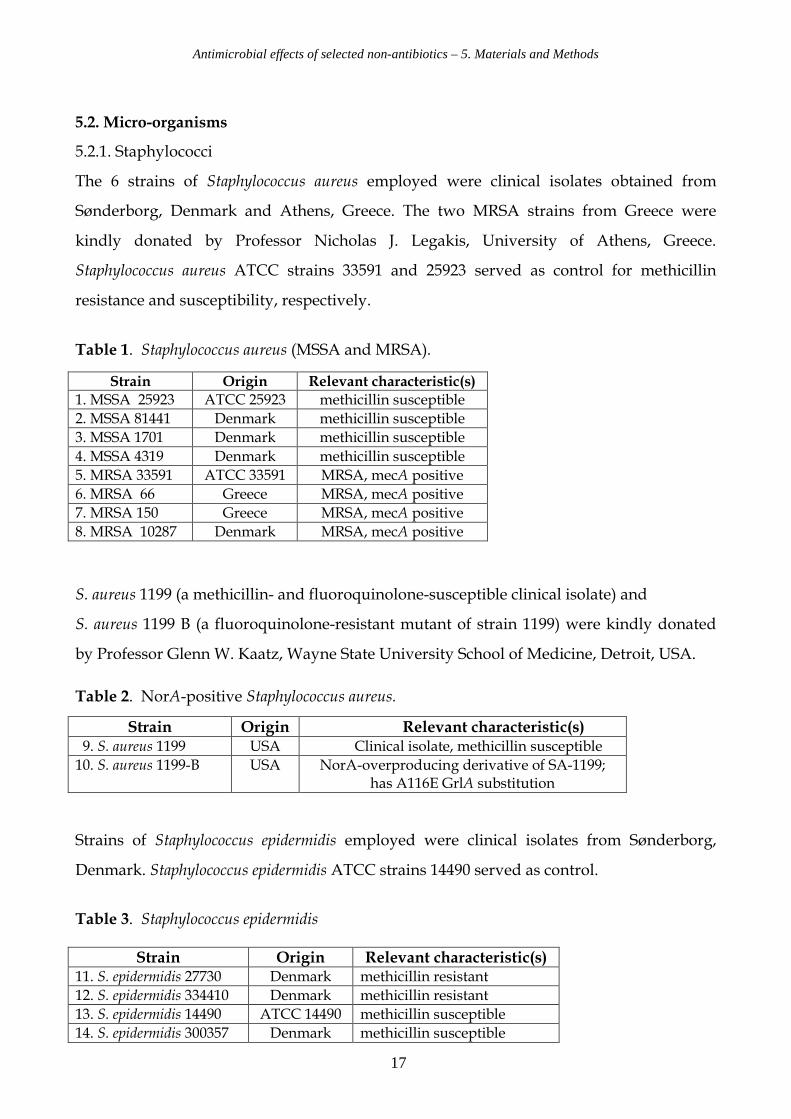
5.2. Micro-organisms
5.2.1. Staphylococci
The 6 strains of Staphylococcus aureus employed were clinical isolates obtained from
Sønderborg, Denmark and Athens, Greece. The two MRSA strains from Greece were
kindly donated by Professor Nicholas J. Legakis, University of Athens, Greece.
Staphylococcus aureus ATCC strains 33591 and 25923 served as control for methicillin
resistance and susceptibility, respectively.
Table 1. Staphylococcus aureus (MSSA and MRSA).
S. aureus 1199 (a methicillin- and fluoroquinolone-susceptible clinical isolate) and
S. aureus 1199 B (a fluoroquinolone-resistant mutant of strain 1199) were kindly donated
by Professor Glenn W. Kaatz, Wayne State University School of Medicine, Detroit, USA.
Table 2. NorA-positive Staphylococcus aureus.
Strains of Staphylococcus epidermidis employed were clinical isolates from Sønderborg,
Denmark. Staphylococcus epidermidis ATCC strains 14490 served as control.
Table 3. Staphylococcus epidermidis
Strain Origin Relevant characteristic(s)
1. MSSA 25923 ATCC 25923 methicillin susceptible
2. MSSA 81441 Denmark methicillin susceptible
3. MSSA 1701 Denmark methicillin susceptible
4. MSSA 4319 Denmark methicillin susceptible
5. MRSA 33591 ATCC 33591 MRSA, mecA positive
6. MRSA 66 Greece MRSA, mecA positive
7. MRSA 150 Greece MRSA, mecA positive
8. MRSA 10287 Denmark MRSA, mecA positive
Strain Origin Relevant characteristic(s) 9. S. aureus 1199 USA Clinical isolate, methicillin susceptible
10. S. aureus 1199-B USA
NorA-overproducing derivative of SA-1199; has A116E GrlA substitution
Strain Origin Relevant characteristic(s) 11. S. epidermidis 27730 Denmark methicillin resistant
12. S. epidermidis 334410 Denmark methicillin resistant
13. S. epidermidis 14490 ATCC 14490 methicillin susceptible
14. S. epidermidis 300357 Denmark methicillin susceptible

Antimicrobial effects of selected non-antibiotics – 5. Materials and Methods
18
5.2.2. Streptococci
5 Strains of Streptococcus pyogenes were obtained from clinical material, isolated in
Sønderborg and Odense Denmark. Streptococcus pyogenes ATCC strain 12385 served as
control. Strains G 18 and R114 served as positive controls for macrolid resistance based on
the existence of the mefA gene. These strains were kindly donated by Professor C.
Quentin-Noury, Department of Microbiology, University of Bordeaux, France. All 7
Strains of Streptococcus pneumoniae were clinical isolates from Sønderborg Hospital,
Sønderborg, Denmark.
Table 4. Streptococcus pyogenes.
Table 5. Streptococcus pneumoniae.
5.2.3. Enterococci
Strains of Enterococcus faecalis were clinical isolates from Statens Serum Institute, Denmark.
Table 6. Enterococcus faecalis
Strain Origin Relevant characteristic(s) 15. S. pyogenes R 114 France Erythromycin resistant, mefA positive 16. S. pyogenes G 18 France Erythromycin resistant, mefA positive 17. S. pyogenes 12385 ATCC 12385 Erythromycin sensitive 18. S. pyogenes 91047 Denmark Erythromycin sensitive 19. S. pyogenes G 1 Denmark Erythromycin sensitive 20. S. pyogenes G 2 Denmark Erythromycin sensitive
21. S. pyogenes G 3 Denmark Erythromycin sensitive 22. S. pyogenes 323033 Denmark Erythromycin sensitive
Strain Relevant characteristic(s) 23. S. pneumoniae 57921 Erythromycin sensitive
24. S. pneumoniae 58111 Erythromycin sensitive
25. S. pneumoniae 58385 Erythromycin sensitive
26. S. pneumoniae 311172 Erythromycin resistant
27. S. pneumoniae 58095 Erythromycin sensitive
28. S. pneumoniae 312275 Erythromycin resistant
29. S. pneumoniae 324367 Erythromycin resistant
Strain Relevant characteristic(s) 30. E. faecalis A Vancomycin resistant 31. E. faecalis B Vancomycin resistant 32. E. faecalis C Vancomycin resistant 33. E. faecalis D Vancomycin resistant 34. E. faecalis E Ampicillin resistant

Antimicrobial effects of selected non-antibiotics – 5. Materials and Methods
19
5.3. Microbiological identification and susceptibility testing.
5.3.1. Staphylococci
The tube coagulase test was performed on Mueller-Hinton broth according to NCCLS
guidelines (1999): Incubation for 4 hours at 35º C was followed by overnight
incubation at room temperature (Sperber 1975). Detection of the presence of β- lactamase
was defined by the nitrocefine test (Oxoid, Denmark) (Shannon & Phillips 1980). In the
case of S. epidermidis novobiocin resistance was determined. We performed oxacillin
(methicillin) susceptibility testing of S. aureus by the oxacillin disk diffusion method and
mecA identification in accordance with NCCLS standards. MICs were defined by the E-
test, and confirmed using agar dilution rows according to NCCLS-guidelines with
penicillin, oxacillin, dicloxacillin and ciprofloxacin from 0.5 - 256 mg/L.
5.3.2. Streptococci
Standard biochemical tests were carried out for strain identification (Bacitracin test,
Sigma-Aldrich, Denmark, Api-strep, Biomerieux ®). MICs were defined by the E-test
(Sanchez et al. 1992) and confirmed using agar dilution rows according to NCCLS-
guidelines, using penicillin and erythromycin from 0.5 - 256 mg/L.
5.3.3. Enterococci
Standard biochemical tests were carried out for strain identification (Bile-Esculin
Hydrolysis Test, Salt Tolerance Test, Api-Strep, Biomerieux ®) (MacFaddin 1985)
MICs were confirmed using agar dilution rows according to NCCLS- guidelines,
using ampicillin and vancomycin from 0.5 - 256 mg/L.
5.4. Inoculum
An overnight culture of the above mentioned Gram positive bacteria in SMBH/ TSB
was diluted in order to achieve the OD based inoculum of 1* 105 – 5* 105.

Antimicrobial effects of selected non-antibiotics – 5. Materials and Methods
20
5.5. MIC- determination of test compounds.
We determined MICs (=lowest concentration of compounds without bacterial growth) for
all test compounds by agardilution and by utilising the Kärber analysing system (Finney
1952). All MIC determinations were done in triplicate. Mueller Hinton agar was purchased
from Becton Dickson, adjusted to pH 7.3 and employed for studies on staphylococci.
Iso-Sensitest agar without blood (ISOA) was purchased from Oxoid and adjusted to pH
7.3 for studies on streptococci and enterococci. Test compounds were incorporated into the
agar-containing Petri dishes at concentrations from 0.5 – 256 mg/L. The standard
concentration (1* 105 – 5* 105) of the Gram positive cocci was “spot” inoculated onto the
surface of the medium. Agar plates were incubated 20-24 hours and then examined for
growth.
5.6. Checkerboard
We determined the interaction of the test compounds with the antibiotics with respect to
the microbial species by the checkerboard method. Preparation of microplates, dilution of
compounds and inoculation of test strains was performed according to the guidelines in
Appendix 2. Data collection and interpretation of the results in terms of synergy, additive
or interference effects were obtained as described (Eliopulos & Moellering 1991). MIC-
measurements were done in triplicate. All tests were performed at pH 7.3 for optimal
growth.
5.7. Internalization Assay (Oelschläger & Bell, 1997)
Three different human epithelial cell lines were used: The human alveolar epithelial cell
line A-549, ileocecal epithelial cell line HCT-8 and bladder epithelial cell line T-24. These
cell lines were chosen in order to represent different types of human epithelial tissue.
Epithelial cells were grown in 24-well cell culture clusters to confluent monolayers (7 x 10⁴
cells per well) in RPMI 1640 supplemented with 10% FCS. Mid-log-phase bacteria (2 x 10⁶
CFU/mL; A600 = 0.4 -0.6) in 0.1 mL of buffer were then added to each well (approximately
30 bacteria per epithelial cell). After centrifugation at 2000 g for 5 min internalization was
allowed to occur for 3 hours at 37 °C in an atmosphere of 94 % air with 6 % CO2.
Antimicrobial effects of selected non-antibiotics – 5. Materials and Methods
21
Monolayers were washed three times with Earle’s balanced salt solution, before second
2h incubation period under the same conditions but with fresh medium containing
100 mg/L imipenem in case of streptococci and 100 mg/L gentamicin in case of other
bacterial strains. Under these conditions, all extracellular (i.e., not internalised) bacteria
were killed by the added antibiotic compound. After 2 hours the monolayers were
washed three times with Earle’s balanced salt solution and lysed with 0.1 % Triton X-100
to determine the viable counts of released intracellular bacteria (Sahly et al. 2000). All
assays were conducted in duplicate and repeated two times. All results were
recorded in two dilution steps and as a percentage of the original inoculum.
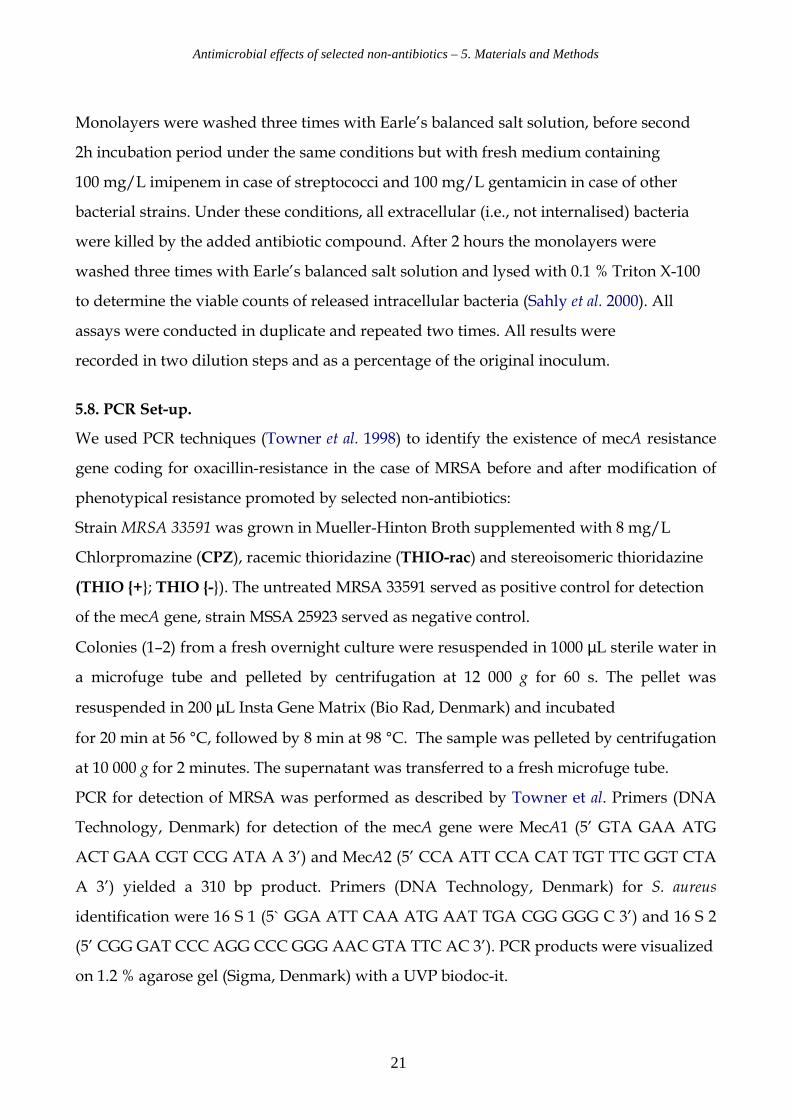
5.8. PCR Set-up.
We used PCR techniques (Towner et al. 1998) to identify the existence of mecA resistance
gene coding for oxacillin-resistance in the case of MRSA before and after modification of
phenotypical resistance promoted by selected non-antibiotics:
Strain MRSA 33591 was grown in Mueller-Hinton Broth supplemented with 8 mg/L
Chlorpromazine (CPZ), racemic thioridazine (THIO-rac) and stereoisomeric thioridazine
(THIO {+}; THIO {-}). The untreated MRSA 33591 served as positive control for detection
of the mecA gene, strain MSSA 25923 served as negative control.
Colonies (1–2) from a fresh overnight culture were resuspended in 1000 µL sterile water in
a microfuge tube and pelleted by centrifugation at 12 000 g for 60 s. The pellet was
resuspended in 200 µL Insta Gene Matrix (Bio Rad, Denmark) and incubated
for 20 min at 56 °C, followed by 8 min at 98 °C. The sample was pelleted by centrifugation
at 10 000 g for 2 minutes. The supernatant was transferred to a fresh microfuge tube.
PCR for detection of MRSA was performed as described by Towner et al. Primers (DNA
Technology, Denmark) for detection of the mecA gene were MecA1 (5’ GTA GAA ATG
ACT GAA CGT CCG ATA A 3’) and MecA2 (5’ CCA ATT CCA CAT TGT TTC GGT CTA
A 3’) yielded a 310 bp product. Primers (DNA Technology, Denmark) for S. aureus
identification were 16 S 1 (5` GGA ATT CAA ATG AAT TGA CGG GGG C 3’) and 16 S 2
(5’ CGG GAT CCC AGG CCC GGG AAC GTA TTC AC 3’). PCR products were visualized
on 1.2 % agarose gel (Sigma, Denmark) with a UVP biodoc-it.

Antimicrobial effects of selected non-antibiotics – 6. Results
22
6. Results
6.1. Microbiological identification and susceptibility testing.
Tables 7 – 12 present the MICs in mg/L of selected antibiotics on Gram-positive strains
with relevant resistance profiles. These data give the baseline information for the
resistance profile of the micro-organisms.
Table 7. Methicillin sensitive (MSSA) and methicillin resistant Staphylococcus aureus (MRSA).
Table 8. NorA-positive Staphylococcus aureus.
Table 9. Staphylococcus epidermidis.
Characteristic Strain
ββββ-lactamase
MIC penicillin
MIC oxacillin
mecA
1. MSSA 25923 - 0.047 0.38 -
2. MSSA 81441 + 2.0 1.0 -
3. MSSA 1701 - 0.047 0.38 -
4. MSSA 4319 - 0.094 0.75 -
5. MRSA 33591 + > 32 > 256 +
6. MRSA 66 + > 32 > 256 +
7. MRSA 150 + > 32 > 256 +
8. MRSA 10287 + > 32 > 256 +
Characteristic Strain
ββββ-lactamase
MIC penicillin
MIC oxacillin
MIC ciprofloxacin
norA
9. S. aureus 1199 - 0.75 0.38 0.19 +
10. S. aureus 1199-B - 0.38 0.125 8.0 +
Characteristic Strain
MIC penicillin
MIC oxacillin
11. S. epidermidis 27738 > 32 > 256
12. S. epidermidis 334410 > 32 > 256
13. S. epidermidis 14490 0.5 0.25
14. S. epidermidis 300357 0.023 0.19

Antimicrobial effects of selected non-antibiotics – 6. Results
23
Table 10. Streptococcus pyogenes.
Table 11. Streptococcus pneumoniae.
Table 12. . Enterococcus faecalis.
Characteristic Strain
mefA MIC penicillin
MIC erythromycin
15. S. pyogenes R 114 + 0.094 24
16. S. pyogenes G 18 + 0.016 24
17. S. pyogenes 12385 - 0.008 0.125
18. S. pyogenes 91047 - 0.016 0.094
19. S. pyogenes G 1 - < 0.016 > 256
20. S. pyogenes G 2 - < 0.016 > 256
21. S. pyogenes G 3 - < 0.016 > 256
22. S. pyogenes 323033 - < 0.016 16
Characteristic Strain
MIC penicillin
MIC erythromycin
23. S. pneumoniae 57921 < 0.032 0.064
24. S. pneumoniae 58111 < 0.016 0.064
25. S. pneumoniae 58385 < 0.016 0.125
26. S. pneumoniae 311172 < 0.016 96
27. S. pneumoniae 58095 < 0.016 0.19
28. S. pneumoniae 312275 < 0.016 64
29. S. pneumoniae 324367 < 0.016 16
Characteristic Strain
MIC ampicillin
MIC vancomycin
VAN
30. E. faecalis A 0.5 64 B
31. E. faecalis B 2 4 B
32. E. faecalis C 16 32 B
33. E. faecalis D 1 > 256 A
34. E. faecalis E 32 2 Sensitive

Antimicrobial effects of selected non-antibiotics – 6. Results
24
6.2. MIC values of tested compounds defined by agardilution.
The MICs in mg/L of chlorpromazine (CPZ), prochlorperazine (PCP), promethazine
(PTZ), racemic thioridazine (THIO-rac), stereoisomeric thioridazine (THIO {+}; THIO {-} ),
amitriptyline (ATT), desipramine (DES) imipramine (IMI), sertraline (SER) and
citalopram (CIT) against the above mentioned Gram-positive strains are summarised in
Table 13. Appendix 3 contains all observations of the agardilutions determined by the
Kärber-method. Article I outlines the results of the phenothiazine derivative
thioridazine as having consistent anti-microbial activity against strains of Staphylococcus
aureus regardless of their susceptibility or resistance to oxacillin.
Table 13. Susceptibilities of all studied strains. MICs for
Drug S. aureus S. epidermidis E. faecalis S. pyogenes S. pneumoniae CPZ 32 - 64 32 - 64 64 16 - 32 32
PCP 32 - 64 32 32 - 64 32 16 - 32
PTZ 128 128 128 128 128
THIO {rac} 16 - 32 16 16 16 8 - 16
THIO {+} 16 - 32 16 - 32 16 - 32 16 8 - 16
THIO {-} 16 - 32 16 - 32 16 - 32 16 8 - 16
ATT 128 128 128 128 128
DES 128 128 128 128 128
IMI 128 128 128 128 128
SER 8 –16 16 16 16 16
CIT > 256 > 256 < 256 > 256 > 256
Although the responses of all of the strains challenged were essentially similar for each of
the compounds, the compounds demonstrating greatest activity were all chemical forms
of thioridazine and sertraline.

Antimicrobial effects of selected non-antibiotics – 6. Results
25
6.3. Results of microdilution and checkerboard test.
The checkerboard method reveals the interaction, i.e. combined activity of two distinct
agents each at concentrations below their MIC on a given bacterial strain. The
checkerboard tests are based on the results presented in the two previous sections 6.1. and
6.2. Checkerboard studies were performed with the compounds which showed the lowest
MIC values in the primary performed agardilution CPZ, PCP, THIO-rac, THIO{+},
THIO{-} and SER. In the checkerboard experiment the non-antibiotics were combined
with antibiotics relevant to the bacterial species in question. This strategy led to the
reduction in the quantity of the checkerboard tests to a reasonable level. For the selected
Gram positive bacteria we could demonstrate the modification of resistance against quite
different antibiotics. Varying combinations of oxacillin, ampicillin, erythromycin,
ciprofloxacin and vancomycin, with prochlorperazine, sertraline and all forms of
thioridazine against most of the resistant strains inhibited the growth of the strains with
concentrations of either agent well below their MIC. Especially in the combinations of
oxacillin and vancomycin with the different forms of THIO it is telling that the MICs were
reduced significantly for the individual drugs, in some cases dramatically. The
modification of oxacillin, vancomycin and erythromycin resistance by phenothiazines in
combination with the respective antibiotics occurred in concentrations much less than
required for growth inhibition by these compounds as presented in Table 13. In these
experiments the in vitro defined, modifying values of thioridazine were 2 – 12 mg/L. The
stereo-isomeric thioridazine{-} showed the highest activity as a resistance modifying agent.
In order to present comparable data for the selected compounds, the effect was expressed
at fixed sub-inhibitory concentration of 16 mg/L in case of CPZ and 8 mg/L in case of
PCP, THIO, THIO{+}, THIO{-} and SER. Data for the investigated strains are shown in
the Tables 14 - 26, and are presented in mg/L with multi-fold inhibition in brackets.

Antimicrobial effects of selected non-antibiotics – 6. Results
26
6.3.1. MRSA (Tables 14 & 15) For MRSA an up to 128 fold reduction of oxacillin MICs was observed when
combining oxacillin with racemic or stereo-isomeric forms of thioridazine,
i.e. reversal of a primarily resistant phenotype to sensitive. Combination of sertraline
and prochlorperazine reduced the oxacillin MIC in a range of 16 –128 fold.
In case of chlorpromazine the results were less impressive, but still significant:
a 4 – 32 fold reduction was observed.
Table 14. Susceptibilities of MRSA strains defined by microdilution. Antibiotic/ Test compound MRSA-33591 MRSA-66 MRSA-150 MRSA-10287 Oxacillin 512 256 - 512 256 – 512 256-512 CPZ 64 32 64 64 PCP 32 64 32 64 THIO (rac) 32 16 32 32 THIO (+) 32 16 32 32 THIO (-) 32 16 32 32 SER 16 16 16 16
Table 15. Effect of neurotropics at fixed non-inhibiting concentrations on MICs of oxacillin and –fold inhibition in brackets.
Antibiotic/ Test compound MRSA-33591 MRSA-66 MRSA-150 MRSA-10287 Oxacillin + None 512 256 - 512 256 – 512 256-512
+ CPZ {16} 128 (4) 128 (4) 16 (32) 32 (16)
+ PCP {16} 16 (16) < 4 (128) < 4 (128) 8 (32)
+ THIO (rac) {8} < 4 (128) < 4 (128) < 4 (128) < 4 (128)
+ THIO (+) {8} < 4 (128) < 4 (128) < 4 (128) < 4 (128)
+ THIO (-) {8} < 4 (128) < 4 (128) < 4 (128) < 4 (128)
+ SER {8} 4 (128) 4 (64) 32 (16) 4 (128)

Antimicrobial effects of selected non-antibiotics – 6. Results
27
6.3.2. MSSA (Tables 16 & 17)
Checkerboard investigations performed on the beta-lactamase positive MSSA,
showed an 8 fold reduction in MIC in case of chlorpromazine, all forms of thioridazine
and prochlorperazine and a 4 fold in the case of sertraline.
Primary susceptible MIC values of the tested MSSA strains remained almost unaffected.
Table 16. Susceptibilities of MSSA strains defined by microdilution. Antibiotic/ Test compound MSSA-25923 MSSA-81441 MSSA-1701 MSSA-4319 Oxacillin 0.25-0.5 0.5 0.25 – 0.5 0.25 – 0.5 Penicillin 0.5 2 0.5 0.5 CPZ 32 32 32 32 PCP 32-64 32-64 32-64 32-64 THIO (rac) 16- 32 16 16- 32 16 THIO (+) 32 16-32 32 16 THIO (-) 32 16-32 32 16 SER 16 16 16 16
Table 17. Effect of neurotropics at fixed non-inhibiting concentration on MICs of oxacillin and penicillin and –fold inhibition in brackets. Antibiotic/ Test compound MSSA-25923 M3SA-81441 MSSA-1701 MSSA-4319 Oxacillin + None 0.25 – 0.5 0.5 0.25- 0.5 0.25 – 0.5
+ CPZ {16} 0.25 (2) 0.5 (1) 0.5 (1) 0.125 (2)
+ PCP {8} 0.25 (2) 0.5 (1) 0.25 (1) 0.125 (2)
+ THIO (rac) {8} 0.25 (1) 0.5 (1) 0.25 (1) 0.062 (4)
+ THIO (+) {8} 0.25 (1) 0.5 (1) 0.25 (1) 0.062 (4)
+ THIO (-) {8} 0.25 (1) 0.5 (1) 0.25 (1) 0.062 (4)
+ SER {8} 0.25 (2) 0.5 (1) 0.5 (1) 0.5 (1) Antibiotic/ Test compound MSSA-25923 MSSA-81441 MSSA-1701 MSSA-4319 Penicillin + None 0.5 2 0.5 0.5
+ CPZ {16} 0.5 (1) 0.25 (8) 0.5 (1) 0.5 (1)
+ PCP {8} 0.5 (1) 0.25 (8) 0.5 (1) 0.5 (1)
+ THIO (rac) {8} 0.5 (1) 0.25 (8) 0.5 (1) 0.5 (1)
+ THIO (+) {8} 0.5 (1) 0.25 (8) 0.5 (1) 0.5 (1)
+ THIO (-) {8} 0.5 (1) 0.25 (8) 0.5 (1) 0.5 (1)
+ SER {8} 0.5 (1) 0.5 (4) 0.5 (1) 0.5 (1)
Antimicrobial effects of selected non-antibiotics – 6. Results
28
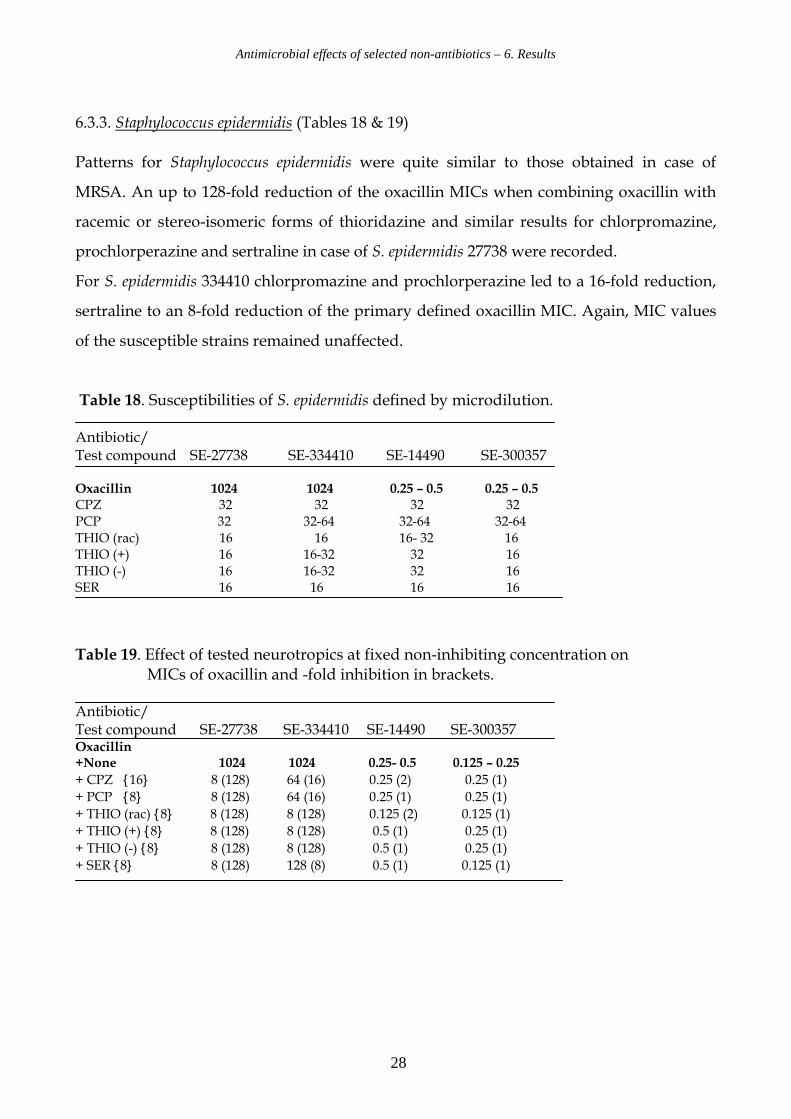
6.3.3. Staphylococcus epidermidis (Tables 18 & 19)
Patterns for Staphylococcus epidermidis were quite similar to those obtained in case of
MRSA. An up to 128-fold reduction of the oxacillin MICs when combining oxacillin with
racemic or stereo-isomeric forms of thioridazine and similar results for chlorpromazine,
prochlorperazine and sertraline in case of S. epidermidis 27738 were recorded.
For S. epidermidis 334410 chlorpromazine and prochlorperazine led to a 16-fold reduction,
sertraline to an 8-fold reduction of the primary defined oxacillin MIC. Again, MIC values
of the susceptible strains remained unaffected.
Table 18. Susceptibilities of S. epidermidis defined by microdilution. Antibiotic/ Test compound SE-27738 SE-334410 SE-14490 SE-300357 Oxacillin 1024 1024 0.25 – 0.5 0.25 – 0.5 CPZ 32 32 32 32 PCP 32 32-64 32-64 32-64 THIO (rac) 16 16 16- 32 16 THIO (+) 16 16-32 32 16 THIO (-) 16 16-32 32 16 SER 16 16 16 16
Table 19. Effect of tested neurotropics at fixed non-inhibiting concentration on MICs of oxacillin and -fold inhibition in brackets. Antibiotic/ Test compound SE-27738 SE-334410 SE-14490 SE-300357 Oxacillin +None 1024 1024 0.25- 0.5 0.125 – 0.25
+ CPZ {16} 8 (128) 64 (16) 0.25 (2) 0.25 (1)
+ PCP {8} 8 (128) 64 (16) 0.25 (1) 0.25 (1)
+ THIO (rac) {8} 8 (128) 8 (128) 0.125 (2) 0.125 (1)
+ THIO (+) {8} 8 (128) 8 (128) 0.5 (1) 0.25 (1)
+ THIO (-) {8} 8 (128) 8 (128) 0.5 (1) 0.25 (1)
+ SER {8} 8 (128) 128 (8) 0.5 (1) 0.125 (1)
Antimicrobial effects of selected non-antibiotics – 6. Results
29
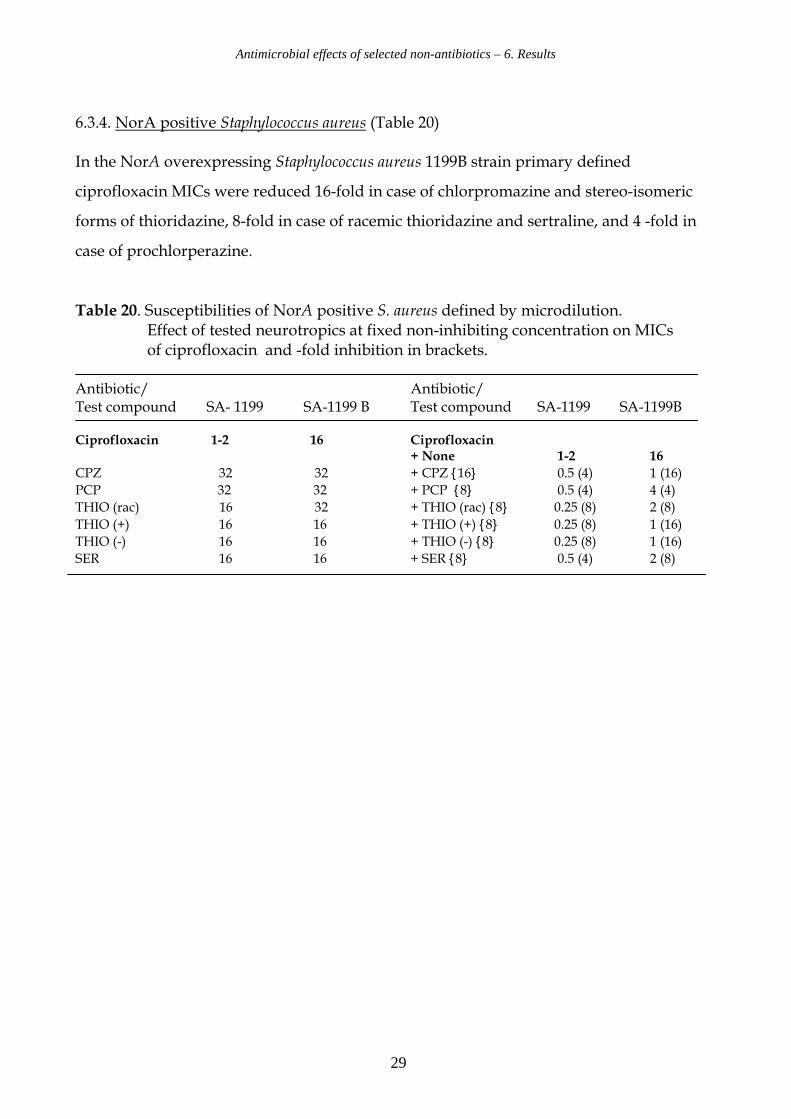
6.3.4. NorA positive Staphylococcus aureus (Table 20) In the NorA overexpressing Staphylococcus aureus 1199B strain primary defined
ciprofloxacin MICs were reduced 16-fold in case of chlorpromazine and stereo-isomeric
forms of thioridazine, 8-fold in case of racemic thioridazine and sertraline, and 4 -fold in
case of prochlorperazine.
Table 20. Susceptibilities of NorA positive S. aureus defined by microdilution. Effect of tested neurotropics at fixed non-inhibiting concentration on MICs of ciprofloxacin and -fold inhibition in brackets. Antibiotic/ Antibiotic/ Test compound SA- 1199 SA-1199 B Test compound SA-1199 SA-1199B Ciprofloxacin 1-2 16 Ciprofloxacin
+ None 1-2 16
CPZ 32 32 + CPZ {16} 0.5 (4) 1 (16)
PCP 32 32 + PCP {8} 0.5 (4) 4 (4)
THIO (rac) 16 32 + THIO (rac) {8} 0.25 (8) 2 (8)
THIO (+) 16 16 + THIO (+) {8} 0.25 (8) 1 (16)
THIO (-) 16 16 + THIO (-) {8} 0.25 (8) 1 (16)
SER 16 16 + SER {8} 0.5 (4) 2 (8)
Antimicrobial effects of selected non-antibiotics – 6. Results
30
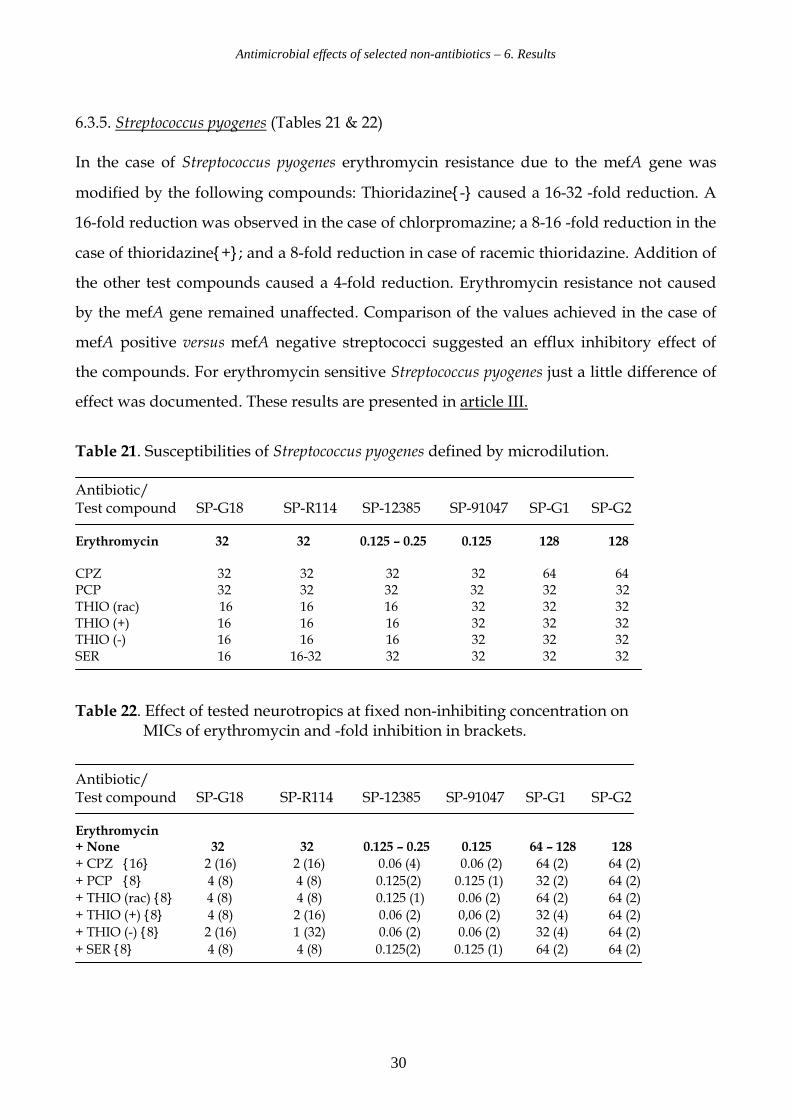
6.3.5. Streptococcus pyogenes (Tables 21 & 22)
In the case of Streptococcus pyogenes erythromycin resistance due to the mefA gene was
modified by the following compounds: Thioridazine{-} caused a 16-32 -fold reduction. A
16-fold reduction was observed in the case of chlorpromazine; a 8-16 -fold reduction in the
case of thioridazine{+}; and a 8-fold reduction in case of racemic thioridazine. Addition of
the other test compounds caused a 4-fold reduction. Erythromycin resistance not caused
by the mefA gene remained unaffected. Comparison of the values achieved in the case of
mefA positive versus mefA negative streptococci suggested an efflux inhibitory effect of
the compounds. For erythromycin sensitive Streptococcus pyogenes just a little difference of
effect was documented. These results are presented in article III.
Table 21. Susceptibilities of Streptococcus pyogenes defined by microdilution. Antibiotic/ Test compound SP-G18 SP-R114 SP-12385 SP-91047 SP-G1 SP-G2 Erythromycin 32 32 0.125 – 0.25 0.125 128 128 CPZ 32 32 32 32 64 64 PCP 32 32 32 32 32 32 THIO (rac) 16 16 16 32 32 32 THIO (+) 16 16 16 32 32 32 THIO (-) 16 16 16 32 32 32 SER 16 16-32 32 32 32 32
Table 22. Effect of tested neurotropics at fixed non-inhibiting concentration on MICs of erythromycin and -fold inhibition in brackets.
Antibiotic/ Test compound SP-G18 SP-R114 SP-12385 SP-91047 SP-G1 SP-G2 Erythromycin + None 32 32 0.125 – 0.25 0.125 64 – 128 128
+ CPZ {16} 2 (16) 2 (16) 0.06 (4) 0.06 (2) 64 (2) 64 (2)
+ PCP {8} 4 (8) 4 (8) 0.125(2) 0.125 (1) 32 (2) 64 (2)
+ THIO (rac) {8} 4 (8) 4 (8) 0.125 (1) 0.06 (2) 64 (2) 64 (2)
+ THIO (+) {8} 4 (8) 2 (16) 0.06 (2) 0,06 (2) 32 (4) 64 (2)
+ THIO (-) {8} 2 (16) 1 (32) 0.06 (2) 0.06 (2) 32 (4) 64 (2)
+ SER {8} 4 (8) 4 (8) 0.125(2) 0.125 (1) 64 (2) 64 (2)
Antimicrobial effects of selected non-antibiotics – 6. Results
31
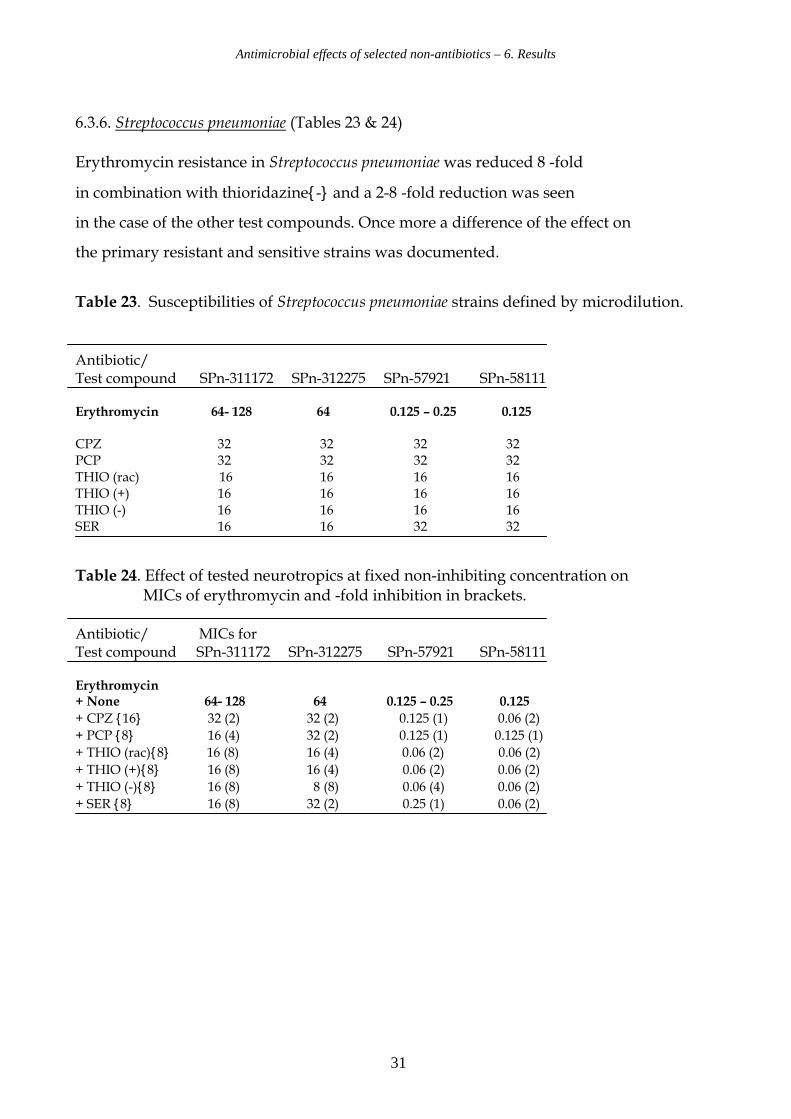
6.3.6. Streptococcus pneumoniae (Tables 23 & 24)
Erythromycin resistance in Streptococcus pneumoniae was reduced 8 -fold
in combination with thioridazine{-} and a 2-8 -fold reduction was seen
in the case of the other test compounds. Once more a difference of the effect on
the primary resistant and sensitive strains was documented.
Table 23. Susceptibilities of Streptococcus pneumoniae strains defined by microdilution. Antibiotic/ Test compound SPn-311172 SPn-312275 SPn-57921 SPn-58111 Erythromycin 64- 128 64 0.125 – 0.25 0.125 CPZ 32 32 32 32 PCP 32 32 32 32 THIO (rac) 16 16 16 16 THIO (+) 16 16 16 16 THIO (-) 16 16 16 16 SER 16 16 32 32
Table 24. Effect of tested neurotropics at fixed non-inhibiting concentration on MICs of erythromycin and -fold inhibition in brackets. Antibiotic/ MICs for Test compound SPn-311172 SPn-312275 SPn-57921 SPn-58111 Erythromycin + None 64- 128 64 0.125 – 0.25 0.125
+ CPZ {16} 32 (2) 32 (2) 0.125 (1) 0.06 (2)
+ PCP {8} 16 (4) 32 (2) 0.125 (1) 0.125 (1)
+ THIO (rac){8} 16 (8) 16 (4) 0.06 (2) 0.06 (2)
+ THIO (+){8} 16 (8) 16 (4) 0.06 (2) 0.06 (2)
+ THIO (-){8} 16 (8) 8 (8) 0.06 (4) 0.06 (2)
+ SER {8} 16 (8) 32 (2) 0.25 (1) 0.06 (2)

Antimicrobial effects of selected non-antibiotics – 6. Results
32
6.3.7. Enterococcus faecalis (Tables 25 & 26)
Results of our checkerboard investigations on Enterococcus faecalis are presented in
Article II: It was demonstrated that both ampicillin and vancomycin resistance are
modified by the relevant phenothiazines: In the case of strains Enterococcus faecalis C and
Enterococcus faecalis E, ampicillin resistance was reduced 8–16 -fold by racemic thioridazine
and thioridazine{-}; 4 -fold by sertraline and thioridazine{+}; 2 -fold by prochlorperazine;
and 16 – 32 -fold by chlorpromazine. When comparing these results one has to keep in
mind, that the values were achieved with combination of the antibiotics with 16 mg/L
chlorpromazine compared to 8 mg/L of the other compounds. In the case of strains
Enterococcus faecalis A and Enterococcus faecalis D vancomycin resistance was reduced 16 –
32 -fold by racemic thioridazine and thioridazine {-}, 4 -fold by sertraline and
thioridazine{+}. Prochlorperazine led to a 2 -fold reduction in case of strain Enterococcus
faecalis A, and 16 -fold reduction in case of strain Enterococcus faecalis D. Combination with
chlorpromazine caused a 4 – 8 -fold MIC reduction. In the case of strain Enterococcus
faecalis C the observed effect was quite limited: An 8 -fold reduction in the case of
chlorpromazine was recorded, all other test-compounds just led to a 2 -fold reduction.
Table 25. Susceptibilities of Enterococcus faecalis strains defined by microdilution. Antibiotic/ Test compound EF-A EF-B EF-C EF-D EF-E Ampicillin 1 2 16 1 64 - 128 Vancomycin 192 4 32 512 2 CPZ 32-64 32-64 32 32 64 PCP 32 32 32-64 32 32 THIO (rac) 32 32 16- 32 32 32 THIO (+) 16-32 16-32 32 32 32 THIO (-) 16-32 16-32 32 32 32 SER 16 16 16-32 32 32

Antimicrobial effects of selected non-antibiotics – 6. Results
33
Table 26. Effect of neurotropics at fixed non-inhibiting concentration on MICs of ampicillin and vancomycin -fold inhibition in brackets.
Antibiotic/ Test compound EF-A EF-B EF-C EF-D EF-E Ampicillin + None 1 2 16 1 64-128
+ CPZ {16} 0.125 (8) 1 (2) < 0.5 (32) 0.125 (8) 16 (8)
+ PCP {8} 0.25 (4) 1 (2) 8 (2) 0.25 (4) 64 (2)
+ THIO (rac) {8} 0.25 (4) 0.5 (4) 1 (16) 0.25 (4) 16 (8)
+ THIO (+) {8} 0.25 (4) 1 (2) 4 (4) 0.25 (4) 32 (4)
+ THIO (-) {8} 0.25 (4) 0.5 (4) 2 (8) 0.125(8) 8 (16)
+ SER {8} 0.25 (8) 0.5 (4) 4 (4) 0.25 (4) 32 (4) Antibiotic/ Test compound EF-A EF-B EF-C EF-D EF-E Vancomycin + None 192 4 128 512 2
+ CPZ {16} 48 (4) 2 (2) 16 (8) 64 (8) 0.5 (4)
+ PCP {8} 96 (2) 4 (1) 64 (2) 32 (16) 0.5 (4)
+ THIO (rac) {8} 6 (32) 4 (1) 64 (2) 32 (16) 1 (2)
+ THIO (+) {8} 12 (16) 2 (2) 64 (2) 64 (8) 0.5 (4)
+ THIO (-) {8} 6 (32) 2 (2) 64 (2) 32 (16) 0.5 (4)
+ SER {8} 24 (8) 2 (2) 64 (2) 32 (16) 1 (2)
Antimicrobial effects of selected non-antibiotics – 6. Results
34
6.4. Effect of selected phenothiazines on the identification of the mecA gene.
We investigated the effect of thioridazine and chlorpromazine on the presence of the mecA
gene in S. aureus using PCR with mecA specific primers. Agardilution results defined
MICs for all forms of thioridazine at 16 mg/L, and a MIC value for chlorpromazine at 32
mg/L in the case of S. aureus 33591. Checkerboard tests demonstrated a significant
modification of the phenotypical oxacillin resistance of MRSA strain 33591, when the
tested phenothiazines were added at the subinhibitory concentration of 8 mg/L.
The hypothesis that the observed phenotypical resistance modification is based on an
interaction of the phenothiazines with the resistance determinant gene mecA was tested at
the genetic level. The experiment was designed to investigate whether the selected
phenothiazines racemic thioridazine, thioridazine{+}, thioridazine{-}, and
chlorpromazine, present in subinhibitory concentrations, caused the reversal of the
oxacillin resistance by deleting the mecA gene. This was done by PCR with mecA specific
primers on MRSA with and without the addition of the phenothiazines to the growth
media. Strain MRSA 33591 was grown in Mueller-Hinton Broth supplemented with 8
mg/L of the relevant non-antibiotics. The untreated MRSA 33591 served as positive
control for detection of the mecA gene; strain MSSA 25923 served as negative control.
The results as shown in Figure 3 indicated that the presence of the 310 kb product of the
mecA gene PCR remained unaffected by the addition of the selected compounds at the
subinhibitory concentration of 8 mg/L: The phenothiazine derivatives chlorpromazine,
racemic thioridazine and the enantiomers do not delete the mecA gene in the oxacillin
resistant mecA positive S. aureus 33591. However, the results do not show whether the
level of expression was influenced.

Antimicrobial effects of selected non-antibiotics – 6. Results
35
Figure 3. Gel electrophoresis of the effect of selected phenothiazines on the existence of the mecA gene in Staphylococcus aureus 33591.
POS POS T (R) T(+) T (-) CPZ NEG NEG NEG
MecA
Legend T(R): MRSA 33591 grown with added subinhibitory concentration of 8 mg/L THIO (rac)
T (+): MRSA 33591 grown with added subinhibitory concentration of 8 mg/L THIO (+)
T (-): MRSA 33591 grown with added subinhibitory concentration of 8 mg/L THIO (-)
CPZ: MRSA 33591 grown with added subinhibitory concentration of 8 mg/L CPZ
MecA: 310 kb product of the mecA gene
Pos: positive control (MRSA 33591; normal growth conditions)
Neg: negative control (MSSA 25923; normal growth conditions

Antimicrobial effects of selected non-antibiotics – 6. Results
36
6.5. Effect of phenothiazines on the bacterial invasion of human epithelial cells.
Agardilution results defined MICs for all forms of thioridazine at 16 mg/L and a MIC value
for chlorpromazine at 32 mg/L in the case of the Gram positive bacteria.
In vitro cell studies reveal another aspect of the phenothiazines: Ordway et al. demonstrated
in 2002 that the phenothiazine thioridazine at a concentration of 0.1 mg/L inhibited
intracellular growth of S. aureus in human macrophages. Forrest et al. demonstrated in 1963
that therapeutic treatment with chlorpromazine leads to high concentrations of this
compound in different body tissues. The addition of 2.5 mg/L of chlorpromazine, racemic
and isomeric thioridazine was chosen in order to perform a simulation of bacterial invasion
under circumstances that may be encountered in human body tissues, when administered in
conventional doses.
Intracellular localization plays a clinically important role in infections caused by
streptococci and staphylococci. Therefore we determined the effect of these compounds on
the invasion ability of S. aureus 33591, S. aureus 66, S. pyogenes G 18 and S. pyogenes R 114.
Three human epithelial cell lines (human bladder epithelial cell line T-24, ileocecal
epithelial cell line HCT-8 and alveolar epithelial cell line A-549) revealed the influence of
the selected non-antibiotics on bacterial invasion ability in relevant human body tissues.
For comparison, we assessed the uptake efficiencies of invasive S. typhimurium C 17 and
non-invasive E. coli 101 in concurrent experiments.
Overall, the results indicated a significant reduction of the mean invasion ability of the
Gram positive bacteria in all epithelial cell lines in the presence of phenothiazine
derivatives (18.9% ± 1.8) as compared to the invasion in absence of the substance (52.1% ±
4.4) (p< 0.0001). Results based on statistics utilizing stata 8 ® are presented in details
below.
Antimicrobial effects of selected non-antibiotics – 6. Results
37
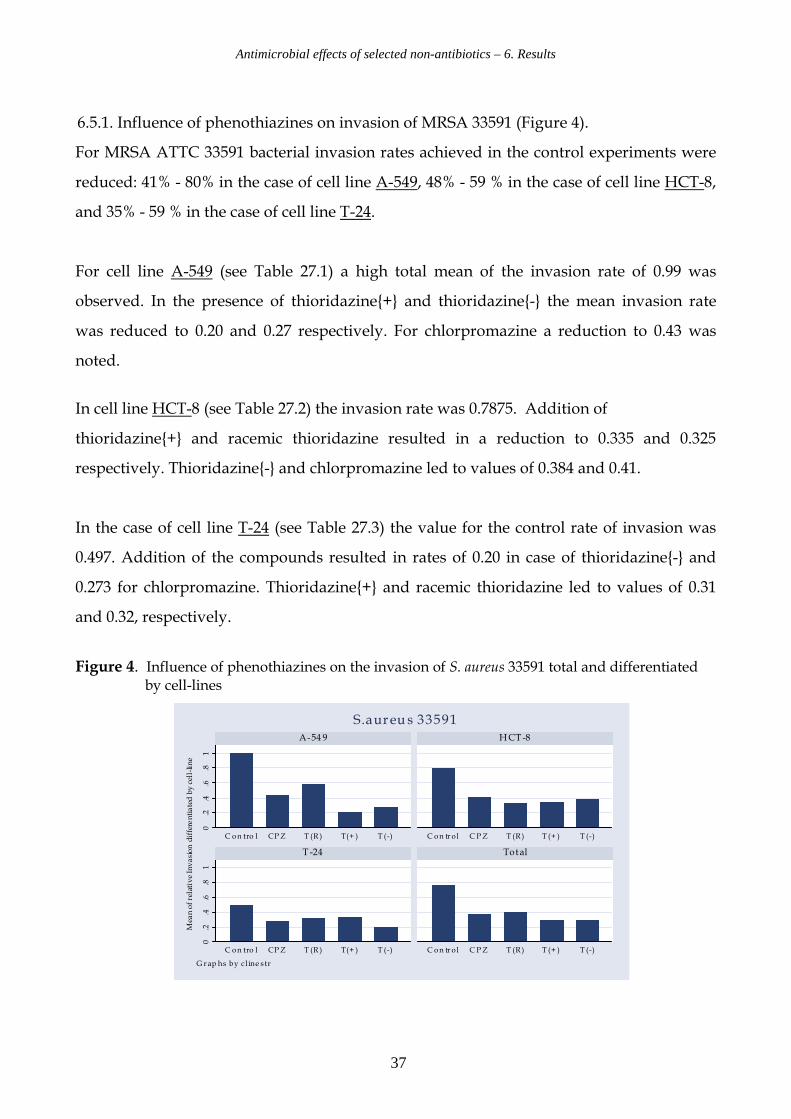
6.5.1. Influence of phenothiazines on invasion of MRSA 33591 (Figure 4).
For MRSA ATTC 33591 bacterial invasion rates achieved in the control experiments were
reduced: 41% - 80% in the case of cell line A-549, 48% - 59 % in the case of cell line HCT-8,
and 35% - 59 % in the case of cell line T-24.
For cell line A-549 (see Table 27.1) a high total mean of the invasion rate of 0.99 was
observed. In the presence of thioridazine{+} and thioridazine{-} the mean invasion rate
was reduced to 0.20 and 0.27 respectively. For chlorpromazine a reduction to 0.43 was
noted.
In cell line HCT-8 (see Table 27.2) the invasion rate was 0.7875. Addition of
thioridazine{+} and racemic thioridazine resulted in a reduction to 0.335 and 0.325
respectively. Thioridazine{-} and chlorpromazine led to values of 0.384 and 0.41.
In the case of cell line T-24 (see Table 27.3) the value for the control rate of invasion was
0.497. Addition of the compounds resulted in rates of 0.20 in case of thioridazine{-} and
0.273 for chlorpromazine. Thioridazine{+} and racemic thioridazine led to values of 0.31
and 0.32, respectively.
Figure 4. Influence of phenothiazines on the invasion of S. aureus 33591 total and differentiated by cell-lines
0.2
.4.6
.81
0.2
.4.6
.81
C on tro l CP Z T (R ) T(+ ) T (-) C on tr ol C P Z T (R) T (+ ) T (-)
C on tro l CP Z T (R ) T(+ ) T (-) C on tr ol C P Z T (R) T (+ ) T (-)
A-54 9 HCT-8
T -24 Total
Mean of relative Invasion differentiated by cell-line
G rap hs by cl ine s tr
S.aureu s 33591

Antimicrobial effects of selected non-antibiotics – 6. Results
38
Table 27. Absolute and relative invasion of Staphylococcus aureus 33591 in the absence (control) and presence of phenothiazines expressed as the number of bacteria and quotient of inoculum.
1. Cell-line A-549
2. Cell-line HCT-8
3. Cell-line T-24
1 Invasion is shown as a mean ± SEM of 8 independent counts
2 p < 0.01 by Student’s t test compared to bacterial invasion in the control group
3 p < 0.05 by Student’s t test compared to bacterial invasion in the control group
Culture condition
Absolute Invasion1 Relative Invasion (%) 1
Control 236250 ± 23775 99,4 ± 5,0
Chlorpromazine 91650 ± 6699 2 43,4 ± 7,4 2
Thioridazine (rac) 126888 ± 18738 3 58,1 ± 13,4 3
Thioridazine (+) 45150 ± 1655 2 20,3 ± 2,2 2
Thioridazine (-) 59563 ± 1787 2 27,4 ± 3,4 2
Culture condition
Absolute Invasion1 Relative Invasion (%) 1
Control 117750 ± 14875 78,8 ± 6,1
Chlorpromazine 62500 ± 9925 2 41,0 ± 4,3 2
Thioridazine (rac) 45288 ± 2950 2 32,5 ± 3,9 2
Thioridazine (+) 51413 ± 9305 2 33,5 ± 4,5 2
Thioridazine (-) 59788 ± 14883 2 38,4 ± 7,7 2
Culture condition
Absolute Invasion1 Relative Invasion (%) 1
Control 65975 ± 6356 49,7 ± 7,6
Chlorpromazine 35275 ± 3309 2 27,3 ± 4,9 2
Thioridazine (rac) 38313 ± 5669 2 30,9 ± 7,0 2
Thioridazine (+) 40913 ± 5528 2 32,4 ± 7,0 2
Thioridazine (-) 27275 ± 2039 2 20,2 ± 3,0 2

Antimicrobial effects of selected non-antibiotics – 6. Results
39
6.5.2. Influence of phenothiazines on the invasion of MRSA 66 (Figure 5).
For MRSA 66 bacterial invasion rates achieved in the control experiments are reduced by:
47% - 75% in the case of A-549, 47% - 62 % in the case of HCT-8, and 73% - 78 % in the case
of T-24.
In cell line A-549 (see Table 28.1) a high total mean of the invasion rate of 0.85 was
observed. In the presence of chlorpromazine and enantiopure thioridazine the mean
invasion rate was reduced to 0.21 and 0.25 respectively. In the case of racemic thioridazine
a reduction to 0.45 was noted.
In cell line HCT-8 (see Table 28.2) the invasion rate was 0.56. Addition of thioridazine{+}
and chlorpromazine resulted in a reduction to 0.21. Thioridazine{-} and racemic
thioridazine led to values of 0.27 and 0.30 respectively.
In the case of cell line T-24 (see Table 28.3) the value for the control rate of invasion
exceeded the value measured for the seeded inoculum by a rate of 1.03. Addition of
compounds resulted in rates of 0.19 in case of thioridazine {-} and 0.26 in case of racemic
thioridazine. Thioridazine{+} and chlorpromazine led to values of 0.286 and 0.30.
Figure 5. Influence of phenothiazines on the invasion of S. aureus 66 total and differentiated by cell-lines
0.5
10
.51
C on tro l CP Z T (R ) T(+ ) T (-) C on tr o l C P Z T (R ) T (+ ) T (-)
C on tro l CP Z T (R ) T(+ ) T (-) C on tr o l C P Z T (R ) T (+ ) T (-)
A-54 9 HCT -8
T -24 Total
Mean of relative Invasion differentiated by cell-line
G r ap hs by cl ine s tr
S.aureu s 66

Antimicrobial effects of selected non-antibiotics – 6. Results
40
Table 28. Absolute and relative invasion of Staphylococcus aureus 66 in the absence (control) and presence of phenothiazines expressed as the number of bacteria and quotient of inoculum. 1. Cell-line A-549
2. Cell-line HCT-8
3. Cell-line T-24
1 Invasion is shown as a mean ± SEM of 8 independent counts
2 p < 0.01 by Student’s t test compared to bacterial invasion in the control group
3 p < 0.05 by Student’s t test compared to bacterial invasion in the control group
4 Insignificant result by Student’s t test compared to bacterial invasion in the control group
Culture condition
Absolute Invasion1 Relative Invasion (%) 1
Control 184250 ± 23734 84,6 ± 8,0
Chlorpromazine 49875 ± 10788 2 21,6 ± 3,8 2
Thioridazine (R) 101613 ± 21638 2 45,2 ± 7,4 2
Thioridazine (+) 56200 ± 8243 2 25,2 ± 2,4 2
Thioridazine (-) 56300 ± 5722 2 25,9 ± 1,7
Culture condition
Absolute Invasion1 Relative Invasion (%) 1
Control 101650 ± 18441 56,6 ± 9,1
Chlorpromazine 38588 ± 4328 2 21,7 ± 2,0 2
Thioridazine (R) 54125 ± 9488 3 30,2 ± 4,6 3
Thioridazine (+) 38088 ± 9791 2 20,9 ± 5,0 2
Thioridazine (-) 48850 ± 4254 3 27,6 ± 1,9 3
Culture condition
Absolute Invasion1 Relative Invasion (%) 1
Control 145471 ± 51417 103,8 ± 34,2
Chlorpromazine 39450 ± 5152 4 30,0 ± 3,0 3
Thioridazine (R) 34613 ± 3052 3 26,1 ± 3,0 3
Thioridazine (+) 37625 ± 4946 3 28,6 ± 4,5 3
Thioridazine (-) 25550 ± 1419 3 19,0 ± 1,2 3

Antimicrobial effects of selected non-antibiotics – 6. Results
41
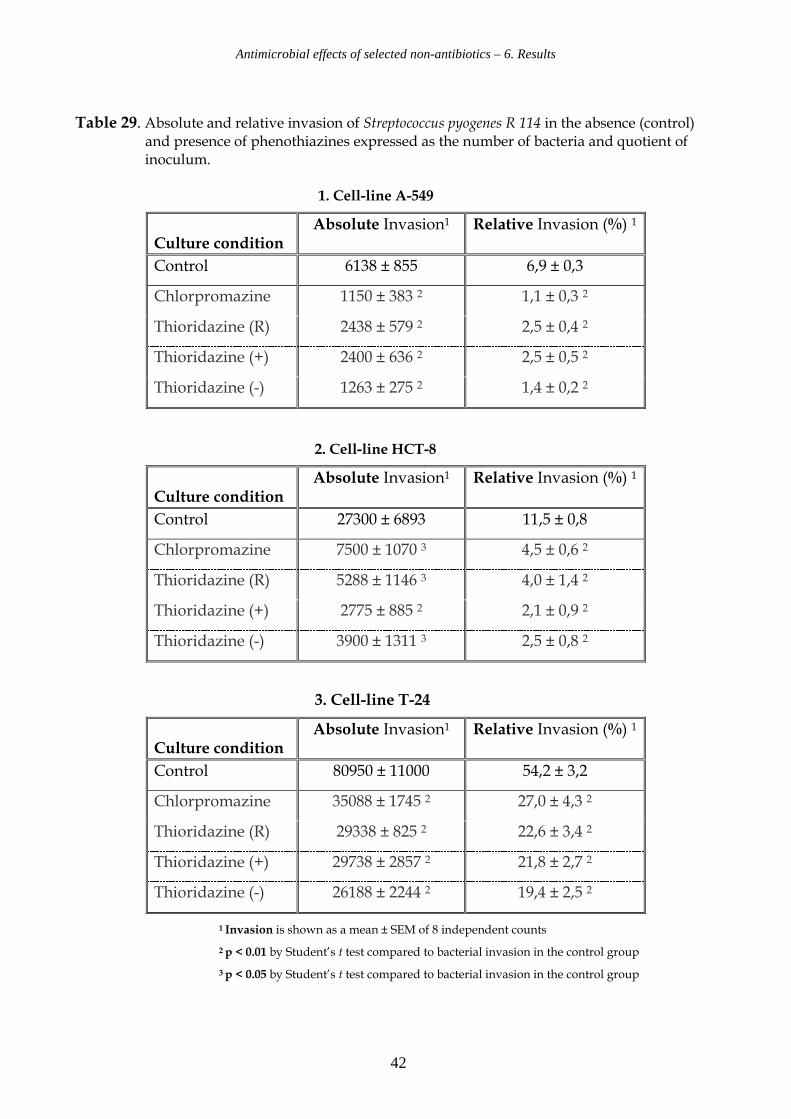
6.5.3. Influence of phenothiazines on invasion of S. pyogenes R 114 (Figure 6).
For S. pyogenes R 114 bacterial invasion rates achieved in the control experiments are
reduced by: 64% - 84% for A-549, 61% - 82 % in the case of HCT-8, and 50% - 64 % for T-24.
In cell line A-549 (see Table 29.1) a very low total mean of the invasion rate of 0.069 was
observed. In the presence of chlorpromazine and enantiopure thioridazine{-} the mean
invasion rate was reduced to 0.011 and 0.014 respectively, whereas for racemic
thioridazine and thioridazine{+} a reduction to 0.025 was noted.
In cell line HCT-8 (see Table 29.2) the invasion rate was also quite low at a level of 0.11.
Addition of enantiopure thioridazine{+} and thioridazine{-} resulted in a reduction to
0.021 and 0.025. Chlorpromazine and racemic thioridazine led to values of 0.04 and 0.045
respectively.
In case of cell line T-24 (see Table 29.3) the value for the control rate was 0.54. Addition of
the different forms of thioridazine resulted in rates between 0.194 in case of thioridazine{-},
0.218 in case of thioridazine{+} and 0.226 in case of racemic thioridazine. The
corresponding rate for chlorpromazine was 0.27.
Figure 6. Influence of phenothiazines on the invasion of S. pyogenes R 114 total and differentiated by cell-lines
0.2
.4.6
0.2
.4.6
C on tro l CPZ T (R) T(+ ) T (-) C on trol C PZ T (R) T (+ ) T (-)
C on tro l CPZ T (R) T(+ ) T (-) C on trol C PZ T (R) T (+ ) T (-)
A-549 HCT-8
T-24 Total
Mean of relative Invasion differentiated by cell-line
G rap hs by cl ine str
S.pyogenes R 114
Antimicrobial effects of selected non-antibiotics – 6. Results
42
Table 29. Absolute and relative invasion of Streptococcus pyogenes R 114 in the absence (control) and presence of phenothiazines expressed as the number of bacteria and quotient of inoculum. 1. Cell-line A-549
2. Cell-line HCT-8
3. Cell-line T-24
1 Invasion is shown as a mean ± SEM of 8 independent counts
2 p < 0.01 by Student’s t test compared to bacterial invasion in the control group
3 p < 0.05 by Student’s t test compared to bacterial invasion in the control group
Culture condition
Absolute Invasion1 Relative Invasion (%) 1
Control 6138 ± 855 6,9 ± 0,3
Chlorpromazine 1150 ± 383 2 1,1 ± 0,3 2
Thioridazine (R) 2438 ± 579 2 2,5 ± 0,4 2
Thioridazine (+) 2400 ± 636 2 2,5 ± 0,5 2
Thioridazine (-) 1263 ± 275 2 1,4 ± 0,2 2
Culture condition
Absolute Invasion1 Relative Invasion (%) 1
Control 27300 ± 6893 11,5 ± 0,8
Chlorpromazine 7500 ± 1070 3 4,5 ± 0,6 2
Thioridazine (R) 5288 ± 1146 3 4,0 ± 1,4 2
Thioridazine (+) 2775 ± 885 2 2,1 ± 0,9 2
Thioridazine (-) 3900 ± 1311 3 2,5 ± 0,8 2
Culture condition
Absolute Invasion1 Relative Invasion (%) 1
Control 80950 ± 11000 54,2 ± 3,2
Chlorpromazine 35088 ± 1745 2 27,0 ± 4,3 2
Thioridazine (R) 29338 ± 825 2 22,6 ± 3,4 2
Thioridazine (+) 29738 ± 2857 2 21,8 ± 2,7 2
Thioridazine (-) 26188 ± 2244 2 19,4 ± 2,5 2

Antimicrobial effects of selected non-antibiotics – 6. Results
43
6.5.4. Influence of phenothiazines on invasion of S. pyogenes G 18 (Figure 7).
For S. pyogenes G 18 bacterial invasion rates achieved in the control experiments are
reduced with: 71% -90 % for A-549, 53% - 87%% in case of HCT-8 and 79% - 91% for T-24.
In cell line A-549 (see Table 30.1) a total mean of the invasion rate of 0.113 was observed.
Addition of enantiopure thioridazine{+} and thioridazine{-} resulted in a reduction to
0.014 and 0.011. In the case of chlorpromazine and racemic thioridazine a reduction to
0.023 and 0.033 was noted.
In cell line HCT-8 (see Table 30.2) the invasion rate was quite low at a level of 0.17.
Addition of the different forms of thioridazine yielded rates between 0.021 for
thioridazine{+} and 0.068 for thioridazine{-}. Addition of racemic thioridazine resulted in a
reduction to 0.076, chlorpromazine reduced the value to 0.08.
For cell line T-24 (see Table 30.3) the value for the control rate was 0.57. Addition of the
different forms of thioridazine resulted in rates between 0.054 for thioridazine{-}, 0.068 for
racemic thioridazine and 0.083 in the case of thioridazine{+}. The corresponding rate for
chlorpromazine was 0.12.
Figure 7. Influence of phenothiazines on the invasion of S. pyogenes G 18 total and differentiated by cell-lines
0.2
.4.6
0.2
.4.6
C on tro l CPZ T (R) T(+ ) T (-) C on trol C PZ T (R) T (+ ) T (-)
C on tro l CPZ T (R) T(+ ) T (-) C on trol C PZ T (R) T (+ ) T (-)
A-549 HCT-8
T-24 Total
Mean of relative Invasion differentiated by cell-line
G rap hs by cline str
S.pyogenes R 114

Antimicrobial effects of selected non-antibiotics – 6. Results
44
Table 30. Absolute and relative invasion of Streptococcus pyogenes G 18 in the absence (control) and presence of phenothiazines expressed as number of bacteria and quotient of inoculum. 1. Cell-line A-549
2. Cell-line HCT-8
3. Cell-line T-24
1 Invasion is shown as mean ± SEM of 8 independent counts
2 p < 0.01 by Student’s t test compared to bacterial invasion in the control group
3 p < 0.05 by Student’s t test compared to bacterial invasion in the control group
Culture condition
Absolute Invasion1 Relative Invasion (%) 1
Control 38588 ± 13644 11,3 ± 2,8
Chlorpromazine 8788 ± 3276 2 2,3 ± 0,8 3
Thioridazine (R) 8200 ± 2363 2 3,3 ± 0,5 2
Thioridazine (+) 4550 ± 1578 2 1,4 ± 0,3 3
Thioridazine (-) 2050 ± 392 2 1,1 ± 0,2 3
Culture condition
Absolute Invasion1 Relative Invasion (%) 1
Control 32738 ± 7965 17,2 ± 2,2
Chlorpromazine 14738 ± 3575 2 8,0 ± 1,9 2
Thioridazine (R) 13763 ± 2789 2 7,6 ± 0,6 2
Thioridazine (+) 3263 ± 677 2 2,1 ± 0,5 2
Thioridazine (-) 13950 ± 5087 2 6,8 ± 1,9 2
Culture condition
Absolute Invasion1 Relative Invasion (%) 1
Control 108663 ± 16838 57,8 ± 4,5
Chlorpromazine 21225 ± 2214 2 12,1 ± 1,2 2
Thioridazine (R) 15338 ± 3901 2 6,8 ± 0,8 2
Thioridazine (+) 17138 ± 3766 2 8,3 ± 0,9 2
Thioridazine (-) 13838 ± 4554 2 5,4 ± 1,4 2

Antimicrobial effects of selected non-antibiotics – 6. Results
45
6.5.5. Influence of phenothiazines sorted by strains (Figure 8).
Reduction of bacterial invasion was observed both in the case of MRSA and S. pyogenes.
Bacterial invasion rates achieved in the control experiments were reduced by 46% - 71% in
the case of MRSA and 55% - 86% in the case of S. pyogenes.
For MRSA 66, the effect of the enantiopure forms of thioridazine and chlorpromazine was
equal, and superior to the effect of racemic thioridazine. In case of MRSA 33591, the effect
of the enantio-pure forms of thioridazine was equal, and superior to racemic thioridazine
and chlorpromazine. For S. pyogenes R 114 we observed thioridazine{-} to be the most
effective compound. In case of S. pyogenes G 18 we noted the lowest invasion rate by the
addition of enantiopure thioridazine{+} (see Table 31).
Figure 8. Influence of phenothiazines on Gram-positive strains differentiated by strain.
0
.2
.4
.6
.8
0
.2
.4
.6
.8
Contro l CPZ T (R ) T(+ ) T (-) Control CPZ T(R ) T(+ ) T(-) Contro l CPZ T (R ) T (+ ) T (-)
Contro l CPZ T (R ) T(+ ) T (-) Control CPZ T(R ) T(+ ) T(-)
S.typh im urium C 17 S .au reus 66 S . au reu s 33591
S . p yogenes R 114 S . pyogenes G 18
G raphs by ba cteria
Table 31: Absolute invasion in absence (control) and presence of investigated phenothiazines expressed as number of bacteria.
S. typhimurium C 17 served as a positive control for the tests
Compound Strain
CPZ
THIO (R) THIO (+) THIO (-) Control
S. typhimurium C 17 8.145 8.913 7.026 5.922 18.141
S. aureus 66 24.428 33.821 24.869 24.407 84.741
S. aureus 33591 37.237 40.511 28.738 28.606 75.976
S. pyogenes R 114 10.726 9.874 8.802 7.777 24.196
S. pyogenes G 18 7.488 5.879 3.95 4.429 28.76

Antimicrobial effects of selected non-antibiotics – 6. Results
46
6.5.6. Influence of phenothiazines sorted by the three different cell-lines (Figure 9).
In the case of the alveolar epithelial cell line A-549 a total mean of the invasion rate of 0.47
was observed. In the presence of thioridazine{+} the mean invasion rate was reduced to
0.11, in the case of thioridazine{-} we noted a reduction to 0.12. Thioridazine(rac) and
chlorpromazine were less effective, revealing values of 0.24 and 0.16 respectively.
In the human bladder epithelial cell line HCT-8 we noted a total mean invasion rate of
0.35. Addition of thioridazine{+} resulted in a reduction to the level of 0.13. The other
compounds gave almost equal results with a reduction of the mean invasion to values
between 0.164 and 0.168.
In the case of the ileocecal epithelial cell line T-24 a total mean of the invasion rate of 0.56
was observed. In the presence of thioridazine{-} the mean invasion rate was reduced to
0.139. Addition of the other compounds led to a reduced mean invasion rate between 0.184
and 0.204.
Figure 9. Influence of phenothiazines on Gram-positive strains differentiated by cell line.
.474658
.158707
.242055
.111945 .123218
.353415
.165486 .167856.13291
.164558
.562818
.203951 .184193 .19546.139397
0.2
.4.6
0.2
.4.6
C on tro l CPZ T(R) T(+ ) T (-) C on trol C PZ T (R) T (+ ) T (-)
C on tro l CPZ T(R) T(+ ) T (-)
A-549 HCT-8
T-24
Mean of relative Invasion differentiated by cell-line
G rap hs by cline str
Influence of phenothiazines on bacterial invasion
Table 32: Absolute invasion in the different cell lines in absence (control) and presence of phenothiazines expressed as number of bacteria
Compound Cell-line
CPZ
THIO (R) THIO (+) THIO (-) Control
A-549 2.319 3.271 1.402 1.121 11.337
HCT-8 8.049 7.646 2.127 6.79 17.181
T-24 12.097 6.774 8.321 5.376 57.762

Antimicrobial effects of selected non-antibiotics – 6. Results
47
6.5.7. The results of the cellular invasion studies may be summarized as follows:
• Reduction of bacterial invasion in Gram positive bacteria was observed in all three
different cell-lines.
• Bacterial invasion rates achieved for the control set-up were reduced with
49% - 76% in the case of A-549, 47% - 62 % for HCT-8 and 64% - 75% for T-24.
• Comparison of the data presented in Tables 27 – 30 yielded the following
correlations between the degrees of interaction of the tested phenothiazines in the
different cell-lines:
a. In the alveolar epithelial cell line A-549, the effect of enantiopure forms of
thioridazine was superior to racemic thioridazine and chlorpromazine
b. In the human bladder epithelial cell line HCT-8, the effect of thioridazine{+}
was superior to thioridazine{-}, racemic thioridazine and chlorpromazine.
c. In the ileocecal epithelial cell line T-24, the effect of thioridazine {-}
was superior to thioridazine{+}, racemic thioridazine and chlorpromazine.

Antimicrobial effects of selected non-antibiotics – 7. Discussion
48
7. Discussion
7.1 Reversal of resistance and possible implications for bacterial efflux pumps
Molecular genetic principles have significantly deepened our understanding of the
development and function of resistance mechanisms (Lomovskaya & Watkins 2001;
Nikaido 2001) Anti-microbial agents are inactivated by the following resistance
mechanisms
• Inactivation or modification of the antibiotic
• Target modification
• Reduced intracellular accumulation caused by reduced permeability and/or
increased efflux
Multi drug resistance (MDR) efflux pumps and modification of membrane proteins are
based on the existence of resistance genes. Ongoing studies which focus on the activity of
bacterial efflux influenced by phenothiazines, confirm the hypothesis, that modification of
resistance is related to the inhibition of efflux-pumps (Kaatz et al. 2003).
In this study, the effect of phenothiazines and tricyclic antidepressants on the resistance
mechanisms was investigated. Resistance mediated by the efflux pumps was found to be
significantly involved in the reversal of resistance by these compounds.
The MIC values of the various neurotropics demonstrated that racemic and enantiopure
forms of thioridazine as well as sertraline exhibit a pronounced activity against the Gram
positive bacteria involved. Consistent MICs of 16-32 mg/L were found independent of the
resistance profile of the bacteria. It is important to note that these concentrations can not
be achieved in vivo serum concentrations. However, the growth inhibiting concentrations
and the concentrations needed for reversal of resistance by many of these non-antibiotics
can be reached practically in vivo in humans in the urinary tract, in the lungs, the liver and
the skin (Forrest et al. 1963).

Antimicrobial effects of selected non-antibiotics – 7. Discussion
49
Our results are consistent with those of previous studies (Kristiansen 1990; Ordway et al.
2003). In the attempt to define the properties of the phenothiazines in context of antibiotic
drug reversal, we showed that the investigated phenothiazines modified the resistance
against very different conventional antibiotics, as presented in Figure 10. This observation
is the major result of similar experiments involving strains representing different,
clinically relevant pathogenic Gram positive bacteria: staphylococci, streptococci and
enterococci.
Figure 10. Antibiotic resistance modified by non-antibiotics
Staphylococci
Kaatz et al.previously demonstrated that a panel of phenothiazine derivatives as well as the
chemically related thioxanthenes inhibit the norA mediated fluoroquinolone efflux in
S. aureus. These results were verified by affecting the phenotypical fluoroquinolone
resistance in the norA positive S. aureus strain. Addition of the phenothiazines resulted in
an up to 16 -fold reduction of the primary defined norA dependent fluoroquinolone-
resistance in strain SA 1199B, thus emphasizing the effect of phenothiazines on efflux
mediated resistance in Staphylococcus aureus. The modification of resistance promoted by
the phenothiazines is also observed in the case of oxacillin resistance, a β-lactam resistance
that is explained by the mecA mediated activity of PBP2’. In the case of the investigated
MRSA thioridazine and its stereoisomeric enantiomers led to an up to 128 -fold reduction
of the primary defined MIC for oxacillin.
Antimicrobial effects of selected non-antibiotics – 7. Discussion
50
Methicillin resistance in S. epidermidis is understood to be based on more diverging genetic
traits than is the case in MRSA (Miragaia et al. 2005). However, in the case of the
investigated Staphylococcus epidermidis similar results were obtained as for MRSA:
Addition of thioridazine and its stereoisomeric enantiomers led to a significant
modification of the primary defined MIC for oxacillin. The hypothesis that the observed
activity of the phenothiazines is solely based on an interaction with efflux pumps is thus
insufficient, since oxacillin resistance in staphylococci is not understood as based on efflux,
but on alteration of the molecular structure of the PBPs.
Streptococci
Erythromycin resistance due to the mefA gene was modified. Thioridazine{-} caused an
up to 32 -fold reduction in strain R 114. In the case of chlorpromazine and thioridazine{+}
an up to 16 -fold reduction was recorded. Erythromycin resistance without co-existence of
the mefA gene remained unaffected. These results suggest indirectly an effect of the tested
neurotropics on the efflux mediation of erythromycin resistance as presented in Figure 2.
Experiments with Streptococcus pneumoniae yielded similar results. Addition of
thioridazine, its stereo isomeric enantiomers and sertraline led to an 8 -fold reduction of
the primary defined MIC for erythromycin. The effect on erythromycin resistance by the
tested compounds is interesting because of the clinical value of this antibiotic.
Efflux appears to be the most common type of macrolid resistance in S. pyogenes in Europe
and of macrolid resistance in S. pneumoniae in the USA (Zhong & Shortridge 2000).
Furthermore, an association between erythromycin resistance and the ability to enter
respiratory cells has been proposed (Facinelli et al. 2001).
Enterococci
Ampicillin as well as vancomycin MICs can be lowered when combined with the test
substances at sub-inhibitory concentrations. Ampicillin and vancomycin resistance were
modified by the neurotropics: In general, the most effective compounds were racemic
thioridazine and thioridazine{-}. A reduction of ampicillin MIC up to 16 -fold and
vancomycin MIC up to 32 -fold was recorded.

Antimicrobial effects of selected non-antibiotics – 7. Discussion
51
Our results are in agreement with those obtained by Ordway et al. in 2002, who found a
reduction in minimum inhibitory concentrations of oxacillin for methicillin resistant
S. aureus (MRSA) when phenothiazine derivatives were added to the medium. Significant
results were achieved which demonstrated synergism between the antibiotics and non-
antibiotics. The synergistic effect of antibiotics and non-antibiotics requires further
discussion: Since verapamil and reserpine do not influence the minimum inhibitory
concentrations of the antibiotics, it may be assumed that P-glycoprotein-mediated
multidrug resistant efflux is not the mechanism of resistance influenced by our test
compounds. Since the activity of the non-antibiotic is independent of the preexisting
resistance pattern in the investigated enterococci, the targets of the investigated antibiotics
and non-antibiotics are probably different.
In conclusion, the study illustrates that the investigated neurotropics inhibit the norA
mediated fluoroquinolone efflux in S. aureus. Furthermore phenotypical macrolid
resistance in streptococci is significantly modified, thus strongly suggesting that the
phenothiazines also affect the mefA related macrolid efflux. This leads to the hypothesis
that the activity of phenothiazines may be related particularly to an interaction with efflux
pumps of the MFS-type as presented in Figure 2. Therefore, the effect of the neurotropics
on other members of the major facilitator superfamily should be subjected to further
investigation. The non-antibiotics also block non efflux related phenotypes such as
oxacillin, ampicillin and vancomycin resistance. In this context the phenothiazines may
depolarize the bacterial membrane and lead to a consecutive disruption of both the
peptidoglycan synthesizing enzymes and the efflux pump activity. Alternatively, the
observed modification of different types of resistance could be based on an interaction of
the phenothiazines with active bacterial efflux or an implication of efflux mechanisms in
beta-lactam resistance in an as of today not yet elucidated way. These hypotheses contain
major scientific potential as efflux and/or exclusion of beta-lactams also might contribute
to emerging resistance (Poole 2005).

Antimicrobial effects of selected non-antibiotics – 7. Discussion
52
Thus, the possibility of an interaction between penicillin binding proteins and bacterial
efflux has to be investigated in the future.
If the phenothiazines inhibit efflux of the general MFS type, these compounds are
potential antibiotics characterized by a modification of bacterial resistance mediated by
MFS efflux pumps, and hence putative tools for modern drug design. The concept of
modifying efflux related resistance is closely linked to elucidation of the mechanisms
behind efflux inhibition by phenothiazines. MFS efflux is also found in Gram-negative
bacteria and other micro-organisms, which leads to an even more sophisticated theoretical
dimension.
Traditionally, microbiologic identification leads to the species identification of the
micro-organism in question. In terms of treatment options, the antibiotic spectrum has
been defined in close connection with the phenotypical and biochemical patterns of the
investigated strain and the antibiotic bio-diagram is closely related to the species.
MFS and other efflux systems as pharmacological targets change the therapeutic focus
from fighting the species to fighting a genetic trait of pathogenicity. This concept makes
sense when considering that at least some pathogenetic traits are inherited horizontally,
i.e. the commonality of pathogenetic features between different species. Thus the antibiotic
strategy of the future may well be based on identification and fight of a specific trait,
rather than the species. Based on this idea, Figure 11 presents the state of the art of efflux
mediated bacterial resistance sorted by efflux system instead of species. It illustrates very
clearly the diversity of resistance types expressed by efflux pumps. It also emphasizes the
potential of efflux mechanisms as antibiotic targets.

Antimicrobial effects of selected non-antibiotics – 7. Discussion
53
Figure 11. Anti-bacterial resistance sorted by microbiological efflux systems. A road map for
the identification of the antimicrobial activity of phenothiazines as potential efflux inhibitors.
11 a. MFS and RND systems
Biochemical Topography
Relations between biochemical structures (Super-family), microorganisms, substrates and efflux-pumps
1.Major facilitator superfamily (MFS).
H+
2. Resistance nodulation division (RND).
H+
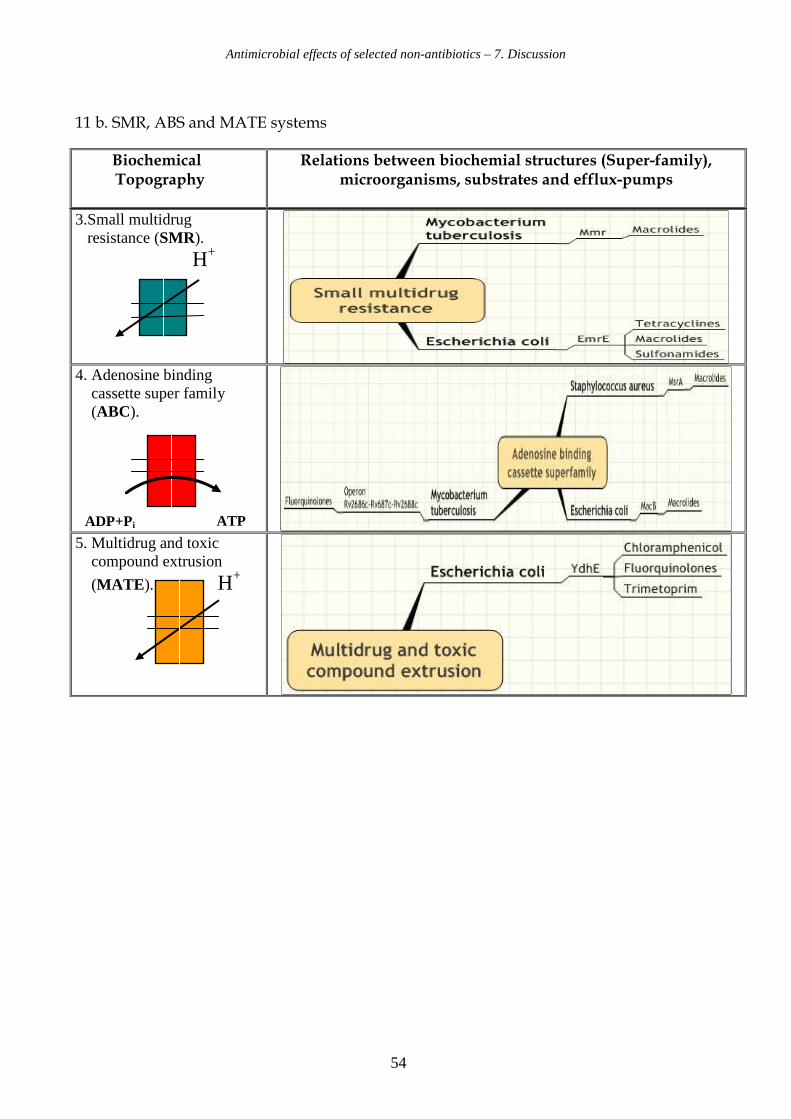
Antimicrobial effects of selected non-antibiotics – 7. Discussion
54
11 b. SMR, ABS and MATE systems
3.Small multidrug resistance (SMR).
H+
4. Adenosine binding cassette super family (ABC).
5. Multidrug and toxic compound extrusion
(MATE). H+
Biochemical Topography
Relations between biochemial structures (Super-family), microorganisms, substrates and efflux-pumps
ADP+Pi ATP

Antimicrobial effects of selected non-antibiotics – 7. Discussion
55
7.2. Reversal of resistance in Gram-negative bacteria
Köhler showed in 2002 that resistance of Pseudomonas aeruginosa to tetracycline efflux
could be reduced from MIC 64 to 4 mg/L by the phenothiazine, fluphenazine, this drug
being as potent as PHE-ARG-naphthylamide (Lomovskaya & Watkins 2001).
These investigations suggested that the help of phenothiazines in combination with
conventional drugs might influence positively also the effectiveness of treatment against
Gram negative micro-organisms.
In 2002 Chen et al. showed that nizatidine, an H (2)-receptor antagonist used as an anti-
ulcerative, counteracted H. pylori resistance to metronidazole in vitro and in vivo, in spite of
exhibiting no growth-inhibitory effect. This agrees with earlier findings that drugs capable
of reversing antibiotic resistance do not necessarily inhibit growth. Nizatidine also
inhibited fumarate reductase dose-dependently like metronidazole but unlike omeprazole
ineffective against that enzyme. The latter drug’s effect may be due to a proton pump
inhibition of H. pylori.
Our finding that one Pseudomonas strain demonstrated relatively high susceptibility to
thioridazine are presented in article 1 and afford the opportunity for studies which
compare this strain to others that are relatively resistant to phenothiazine, perhaps
defining a relationship between this compound and any efflux pump of thioridazine
susceptible and resistant strains of this bacterial species.
Antimicrobial effects of selected non-antibiotics – 7. Discussion
56
7.3. Interaction with bacterial invasion
The antimicrobial activity of the phenothiazines is characterized by another challenging
feature. These compounds are concentrated in human tissue cells and we suggest that the
substances may play a role in the treatment of serious intracellular infections. The
intracellular localization plays a clinically important role in infections such as caused by
S. pyogenes, S. aureus and S. epidermidis.
Ordway et al. demonstrated in 2002 how the phenothiazine thioridazine at a concentration of
0.1 mg/L inhibited intracellular growth of S. aureus in human macrophages. The MIC value
for thioridazine in that study was defined as 18 mg/L, which corresponds with our MIC
value at 16 mg/L as presented in Table 13. In our study enantiopure and racemic
thioridazine showed the most potent efflux inhibitory effect compared to other investigated
non-antibiotics on the Gram positive microorganisms we investigated. For that reason we
used an intracellular infection model to study the effect of non-antibiotics on intracellularly
located S. aureus and S. pyogenes in epithelial cell-lines, utilizing chlorpromazine and the
different forms of thioridazine.
In the 1960’s I. Forrest et al. demonstrated that therapeutic treatment with chlorpromazine
leads to high concentrations of this compound in different body tissues, i.e. 97.5 µg/g in
lung tissue, 6.9 µg/g in kidney tissue and 3.2 µg/g in intestinal tissue. In the actual study
addition of 2.5 mg/L of the test compounds was chosen in order to perform a simulation of
bacterial invasion under circumstances that can be reached theoretically in human body
tissues, when phenothiazines are administrated at therapeutically doses.
In summary, the results of this part of the study indicate a significant reduction of the
number of invasive Gram positive bacteria in all epithelial cell lines in the presence of
phenothiazine derivatives (18.9% ± 1.8) as compared to the invasion in absence of the sub-
stance (52.1% ± 4.4) (p< 0.0001).

Antimicrobial effects of selected non-antibiotics – 7. Discussion
57
Furthermore, the reduction of invasive bacteria caused by the phenothiazines is observed for
each Gram positive strain and in each cell line. The effect of these compounds is statistically
significant for experiments with staphylococci and streptococci.
The study was performed as a typical case-control experiment: The bacteria were
inoculated in the presence of test compounds versus absence in the control group. These
experiments lead to several possible explanations for the observed reduction of bacterial
invasion:
• the phenothiazines interact with the bacteria in an extra cellular location and
reduce the number of invasive bacteria
• the compounds are concentrated in the human tissue cells and inhibit bacterial
growth after invasion by the micro-organisms
• the compounds interact with human cell systems. Modulation of membrane
potential of the tissue cells may explain the observed reduction of bacterial invasion
• The observed effects are based on one or more of the above mentioned alternatives
The used model has to be understood in terms of a black box. The mode of action caused
by the phenothiazines in the intracellular studies remains undefined. Our results solely
justify the claim that phenothiazines reduce the number of invasive Gram positive
bacteria, but the underlying mechanism requires further elucidation.

Antimicrobial effects of selected non-antibiotics – 7. Discussion
58
7.4. The potential of the investigated neurotropic drugs
For elucidating the usefulness of the different stereo-chemical possibilities of different
psychotherapeutics to be developed for minimizing the CNS activity and maximizing the
antimicrobial activity in modern neurotropics we have investigated the antimicrobial
activity and the anti resistance activities of selected neurotropes, especially of the
phenothiazines. Under certain experimental settings, racemic or enantiopure thioridazine
displayed equipotent bacteriostatic or bactericidal properties when given alone or in
combination with traditional antibiotics. Racemic or enantiopure thioridazine acted in a
synergistic manner to lower the MIC of the conventional antibiotics.
The mechanisms by which the neurotropes interact with resistant bacteria is multifactorial.
It was demonstrated that MDR efflux is inhibited. It remains unclear whether the observed
effect is related to a direct interaction with the involved tranport proteins or due to the
disruption of membrane energetics. Besides being putative efflux inhibitors, the
phenothiazines may influence the ability of Gram positive bacteria to invade human
epithelial tissue cells. Such duality could be explored further in view of the earlier
described association between erythromycin resistance and the ability to enter respiratory
cells (Facinelli et al. 2001)
Thioridazine{-} had been reported to display less challenging CNS pharmaco-dynamic
activity, e.g. weaker blockade of dopamine D2-receptors, than thioridazine{+} (Svendsen et
al. 1988). Furthermore, thioridazine{-}, the levorotatory enantiomer, has been reported to
be the compound that is concentrated in human tissue at higher levels than the
dextrorotatory form (Jortani et al. 1994). Taken together, these facts suggest that the
thioridazine{-} should be superior in the context of reversal of drug resistance due to
potentially fewer side effects in anti-microbial therapy.
The stereoisomeric compounds of thioridazine are important tools for further
investigations in the modification and reversal of resistance of serious infections both in
vitro and in vivo. Compounds that appear to demonstrate promising antibiotic properties,
in the sense of a direct anti-microbial effect and/or reversal of resistance, including
potentially efflux-related resistance, should be tested in relevant animal models.

Antimicrobial effects of selected non-antibiotics – 8. Perspectives
59
8. Perspectives
Known non-antibiotics especially among the neurotropic compounds should be
investigated for further development. The transport proteins and energy systems in the
different efflux superfamilies appear to be potential targets. It is challenging to investigate
the interaction of phenothiazines with specific transporter superfamilies. The knowledge
of efflux pumps, their impact on resistance development, and especially the positive effect
on different resistance types utilizing the phenothiazines as putative efflux inhibitors, lead
to new treatment options. Antibiotics may be used in combination with non-antibiotic
“helper-compounds” from the beginning of an anti-microbial therapy in order to
overcome the expected resistance development.
Furthermore we plan to investigate the molecular mode of action of our testcompounds:
Based on the hypothesis of an influence of the phenothiazines on the bacterial membrane,
the creation of a mathematical model in order to define the effect on selected membrane
structures, e.g. PBP’s, utilizing photo-optical nano-techniques is in progress.
The mathematical model may help us not only to be descriptive but also to try to
understand the functions in the reversal of resistance systems in cells. By knowing
more about how the neurotropic compounds interfere with the resistance mechanisms
in micro-organisms, it may be possible to find a common molecular target in the cell
systems to modify/reverse resistance. This hypothetical molecular target may be more
specific than expected up to now. Resistance genes, enzymes, and transmenbrane
structures, such as proteins and phospholipids are interesting places to look at.
The influence of the selected non-antibiotics at the level of genetic transcription may lead
to further investigations of the quantitative expression of genes coding for MDR efflux
pumps. Analysis of the antibacterial effect of non-antibiotics on the gene level may be
performed by RT-PCR methods. The perspectives are summarized in Figure 12.

Antimicrobial effects of selected non-antibiotics – 8. Perspectives
60
Figure 12. Perspectives
Paul Ehrlich proposed that the solution in treatment of infectious diseases might be found
in the psychiatric departments (Ehrlich; 1950). In a historic dimension the renaissance of
the phenothiazines supports his assumption!

Antimicrobial effects of selected non-antibiotics – 9. References
61
9. References
1. Amaral L & Kristiansen JE: Phenothiazines: an alternative to conventional therapy for the
initial management of suspected multidrug resistant tuberculosis. A call for studies.
Int J Antimicrob Agents. (2000) 14 (3): 173-176.
2. Berger Bachi B: Resistance mechanisms and gram positiv bacteria
Int J Med Microbiol (2002) 292 (1): 27 – 35.
3. Bourdon, J.L.: Contribution a l´etude des propriétés antibiotiques de la chlorpromazin.
Ann. Inst. Pasteur (1961) 101: 876 – 886.
4. Borges-Walmsley MI, McKeegan KS, Walmsley AR: Structure and function of efflux pumps that
confer resistance to drugs. Biochem J (2003) 376: 313-338.
5. Chen M, Jensen B, Zhai L et al. Nizatidine and omeprazole enhance the effect of metronidazole
in Helicobacter pylori in vitro. Int J Antimicrob Agents 2002; 19 (3): 195-200.
6. Clausen T, Harving H, Dahl-Hansen, AB: The relationship between the transport of glucose and
cations across cell membranes in isolated tissues. 8. The effect of membrane stabilizers on the
transport of K +, Na + and glucose in muscle, adipocytes and erythrocytes. Biochem Biophys Acta
(1973) 298 (2): 393-411.
7. Crowle AJ, Douvas SG, May MH: Chlorpromazine: a drug potentially useful for the treating of
mycobacterial infections. Exp. Chemother (1992) 38 (6): 410–419.
8. Dancer SJ: The problems with cephalosporins. J Antimicrob Chemother. (2001) 48 (4): 463-478.
9. Danø K: Cross resistance between vinca alkaloids and anthracyclines in Ehrlich ascites tumor in
vivo. Cancer Chemother Rep. (1972) 56 (6): 701-708.
10. Dastidar SH, Saha PK, Sanyamat B, Chakrabarty AN: Antibacterial activity of ambodryl and
benadryl. J of applied Bacteriology (1976) 41 209-214.
11. European Antimicrobial Resistance Surveilance System; data available at http://www.earss.rivm.nl.
11. Ehrlich P.: Collected papers of Paul Ehrlich. Pergamon Press, New York (1950): 287–289.
12. Eliopulos GM, Moellering RC: Antimicrobial combinations. In: Antibiotics in laboratory medicine,
3rd ed. Ed.: V. Lorian. Baltimore. (1991) 434 441.
13. Ericsson H, Sherris JC: Antibiotic sensitivity testing. Report of an international collaborative
study. Act Pathol Microbiol Scand B (1971): Suppl 217: 1.
14. Facinelli B. et al.: Association between erythromycin resistance and ability to enter human
respiratory cells in group a streptococci. Lancet (2001) 358 (9275): 3-4.
15. Finney DJ: Statistical methods of biological assay. Biomol. Z. Lond. 524 (1952) 23–56.
16. Flackman R: Appl. Microbiol. (1973) 26: 138
17. Forrest FM, Forrest IS, Roizin L: Clinical, biochemical and post mortem studies on a patient treated
with chlorpromazine. Agressologie (1963) 4: 259-265.

Antimicrobial effects of selected non-antibiotics – 9. References
62
18. Frimodt-Møller N, Monnet DL, Sørensen TI: Increased resistance against macrolides
SSI, EPI-news week 4 (2001).
19. Geha DJ, Uhl JR, Gustaferro CA, Persing DH: Multiplex PCR of identification of methicillin-resistant
staphylococci in the clinical laboratory. Journal of Clinical Microbiology (1994) 32: 1768–177.
20. Heinemann J: Do antibiotics maintain antibiotic resistance?
Drug Discov Today. (2000). 5 (5): 195-204.
21. Hendricks O, Sahly H, Podschun R et al.: Anti-microbial effects of nonantibiotics: Influence of
phenothiazine-derivatives on bacterial invasion of epithelial cells. Proceeding of the ECC-6. Paris
(2004): Poster 613.
22. Huppertz K, Noll I, Wiedemann B, GENARS-group: Actual resistance situation in Germany (2004)
Pharmazeutische Mikrobiologie; Universität Bonn; Meckenheimer Allee 168; 53115 Bonn
23. Jortani SA, Valentour JC, Poklis A: Thioridazine enantiomers in human tissues.
Forensic Sci Int. (1994) 64 (2-3):165-170.
24. Kaatz GW, Mougdal VV, Seo SM, Hansen JB, Kristiansen JE: Phenylpiperidine selective serotonin
reuptake inhibitors interfere with multidrug efflux pump activity in Staphylococcus aureus.
Int J Antimicrob Agents. (2003) 22 (3): 254-261.
25. Kaatz GW, Moudgal V, Seo SM, Kristiansen JE:
Phenothiazines and thioxanthenes inhibit multidrug efflux pump activity in Staphylococcus aureus.
Antimicrob Agents Chemother. (2003) 47 (2): 719-726.
26. Kaatz GW: Bacterial efflux pump inhibition. Curr Opin Investig Drugs. (2005) 6 (2):191-198.
27. Kayser FH: Safety aspects of enterococci from medical point of view.
Int J Food Microbiol (2003) 88 (2-3): 255-262.
28. Kristiansen JEH: Fatal chloroquine poisoning with severe hypopotassiemia. Ugeskrift for læger.
(1977) 139 (28): 1666-1677.
29. Kristiansen JE: Experiments to illustrate the effect of chlorpromazine on the permeability of
the bacterial cell wall. Acta Pathol Microbiol Scand [B]. (1979) 87 (5): 317-319.
30. Kristiansen JE, Blom J: Effect of chlorpromazine on the ultrastructure of Staphylococcus aureus.
Acta Path. Microbiol Scand [B] (1981) 89 (6): 399-405.
31. Kristiansen JE, Mortensen I: Stereo-isomeric dissociation of the antibacterial and the neuroleptic
effect of clopenthixol. Acta Pathol Microbiol Scand [B]. (1981) 89 (6): 437-438.
32. Kristiansen JE, Mortensen I, Nissen B: Membrane stabilizers inhibit potassium efflux from
Staphylococcus aureus strain No. U 2275. Biochim Biophys Acta (1982) 685: 379-382.
33. Kristiansen JE, Jepsen S: The susceptibility of Plasmodium falciparum in vitro
to chlorpromazine and the stereo-isomere compounds cis(Z) and trans(E)-clopenthixol.
Acta Path Microbiol Immunol Scand [B]. (1985) 93 (3): 249-251.

Antimicrobial effects of selected non-antibiotics – 9. References
63
34. Kristiansen JE: The antimicrobial activity of psychotropic drugs and stereo-isomeric analogues
(Thesis, Dr. sci. University of Copenhagen, Denmark). Dan Med Bull (1990) 37: 165-182.
35. Kristiansen JE: Chlorpromazine: Non-antibiotics with antimicrobial activity-
new insight in managing resistance? Curr Opin Invest Drugs (1993) 2: 587-591.
36. Kristiansen MM, Leandro C, Ordway D et al.: Phenothiazines alter resistance of methicillin-resistant
strains of Staphylococcus aureus (MRSA) to oxacillin in vitro. Int J Antimicrob Agents. (2003) 22 (3):
250-253.
37. Levy SB: Active efflux mechanisms for antimicrobial resistance.
Antimicrob Agents Chemother. (1992) 36 (4): 695-703.
38. Levy SB: Antibiotic resistance: consequences of inaction Clin Infect Dis. (2001) 33 (Suppl 3): 124-129.
39. Levy SB, Marshall B: Antibacterial resistance worldwide: causes, challenges and responses.
Nat Med. (2004) 10 (12 Suppl): 122-129.
40. Livermore D: Can better prescribing turn the tide of resistance? Nat Rev Microbiol (2004) 2 (19):
73-78.
41. Lomovskaya O, Watkins WJ: Efflux pumps: their role in antibacterial drug discovery.
Curr Med Chem (2001): 8 (14): 1699-1711.
42. MacFaddin J.F: Media for Isolation-Cultivation-Identification-Maintainance of Medical Bacteria.
(1985) Vol I, Williams and Wilkins, Baltimore.
43. McMurry L, Levy SB: Two transport systems for tetracycline in sensitive Escherichia coli: critical role
for an initial rapid uptake system insensitive to energy inhibitors. Antimicrob Agents Chemother.
(1978) 14 (2): 201-209.
44. Miragaia M, Couto I, deLencastre H: Genetic diversity among methicillin-resistant Staphylococcus
epidermidis (MRSE): Microb Drug Resist. (2005) 11 (2): 83-93
45. Molnár J, Béládi I, Földes I: Studies on antituberculotic action of some phenothiazine derivatives
In vitro. Zbl Bakt Hyg (1977) A 239: 521 – 526.
46. Molnár J, Hever A, Fakla I, Fischer J, Ocsovski I and Aszalos A: Inhibition of the
transport function of membrane proteins by some substituted phenothiazines in E. coli and
multidrug resistant tumor cells. Anticancer Res (1997) 17: 481–486.
47. Mortensen I, Kristiansen JE: The antibacterial activity of the psychopharmacological agent
clopenthixol and its two main metabolites. Acta Pathol Microbiol Immunol Scand [B].
(1987) 95 (6): 355-359.
48. Munoz-Bellido JL, Munoz-Criado S, Garcia Rodriguez JA: Antibiotic activity of psychotropic drug-
selective serotonine reuptake inhibitors. Int J Antimicrob Agents (2000) 14 (3): 177-180.
49. Mutschler E: Arzneimittelwirkungen, Lehrbucjh der Pharmakologie und Toxikologie.
Wissenschaftliche Verlagsgesellschaft Stuttgart (1991).

Antimicrobial effects of selected non-antibiotics – 9. References
64
50. National Committee for Clinical Laboratory Standards. 1999. Methods for dilution antimicrobial
susceptibility tests for bacteria that grow aerobically, 5th ed. Approved standard M7-A5.
National Committee for Clinical Laboratory Standards, Wayne, Pa.
51. Neyfakh AA, Borsch CM, Kaatz GW: Fluoroquinolone resistance protein NorA of Staphylococcus
aureus is a multidrug efflux transporter.Antimicrob Agents Chemother. (1993) 37 (1): 128-129.
52. Nikaido H: Prevention of drug access to bacterial targets: permeability barriers and active efflux.
Science. (1994) 264 (5157): 382-388.
53. Nikaido H: Preventing drug access to targets: cell surface permeability barriers and active efflux in
bacteria. Semin Cell Dev Biol. (2001) 12 (3): 215-223.
54. Oelschlaeger T, Tall B: Invasion of cultured human epithelial cells by Klebsiella pneumoniae isolated
from the urinary tract. Infect. Immun. (1997) 65: 2950-2958.
55. Ordway D, Viveiros M, Leandro C et al.: Clinical concentrations of thioridazine kill intracellular
multidrug-resistant Mycobacterium tuberculosis. Antimicrob Agents Chemother (2003) 47 (3): 917-922.
56. Paulsen IT, Brown MH, Skurray RA: Proton-dependent multidrug efflux systems. Microbiol Rev.
(1996) 60 (4): 575-608.
57. Poole K: Efflux-mediated antimicrobial resistance. J Antimicrob Chemother. (2005). (Epub ahead of print)
58 Reinert RR, Lutticken R, Sutcliffe JA et al.: Clonal relatedness of erythromycin-resistant
Streptococcus pyogenes isolates in Germany. Antimicrob. Agents Chemother. (2004) 48: 1369 – 1373.
59. Sahly H. et al.: Capsule impedes adhesion to and invasion of epithelial cells by K. pneumoniae.
Infection and Immunity (2000): 6744 – 6749.
60. Sanchez, M. L., M. S. Barrett & R. N. Jones: The E-Test applied to susceptibility tests of gonococci,
multiply-resistant enterococci, and Enterobacteriaceae producing potent beta-lactamases. Diagn.
Microbiol Infect Dis (1992) 15: 459 463.
61. Seeman P, Kwant WO, Goldberg M, Chau-Wong M: The effects of ethanol and chlorpromazine on
the passive membrane permeability to Na + . Biochim Biophys Acta. (1971) 241 (2): 349-355.
62. Shannon K, Phillips I: beta-Lactamase detection by three simple methods: Intralactam, nitrocefin and
acidimetric. J Antimicrob Chemother (1980) 6 (5): 617-21.
63. Smith DF: CRC Handbook of Stereo-isomeres: Drugs in Psychopharmacology. CRC Press,
Inc. Boca Raton, Florida. (1985).
64. Sperber WH, Tatini SR: Interpretation of the tube coagulase test for identification of
Staphylococcus aureus. Appl.Microbiol (1975) 29: 502.
65. Statens Serum Institut (SSI): Epi-News 37, 2001.
66. Svendsen CN, Froimowitz M, Hrbek C et al.: Receptor affinity, neurochemistry and behavioral
characteristics of the enantiomers of thioridazine: evidence for different stereoselectivities at D1 and
D2 receptors in rat brain. Neuropharmacology (1988) 27 (11): 1117-1124.

Antimicrobial effects of selected non-antibiotics – 9. References
65
67. Tiemersma EW, Bronzwaer S, Lyytikäinen O et al.: Methicillin-resistant Staphylococcus aureus in
Europe, 1999–2002 Emerg Inf Dis (2004) 10(9) 1627-1634. EARSS data. Available at: www.earss.rivm.nl
68. Towner K, Talbot DCS, Curran R, Webster CA, Humphreys H: Development and evaluation of a
PCR-based immunoassay for the rapid detection of methicillin-resistant Staphylococcus aureus.
Journal of Medical Microbiology (1998) 47: 1–7.
69. Van Bambeke F, Glupczynski Y, Plesiat P, Pecheré JC, Tulkens PM: Antibiotic efflux pumps
in prokaryotic cells: occurrence, impact on resistance and strategies for the future of antimicrobial
therapy. J Antimicrob Chemother. (2003) 51 (5): 1055-1065.
70. Williams JD: The Garrod lecture. Selective toxicity and concordant pharmacodynamics of antibiotics
and other drugs. J Antimicrob Chemother 1995. 35 (6): 721-737.
71. Usdin E, Forest I: Psychotherapeutic Drugs. Marcel Dekker, Inc. New York and Basel (1976).
72. Zhong P, Shortridge D: The role of efflux in macrolide resistance. Drug Resistance Update
(2000) 3, 325-329.
Antimicrobial effects of selected non-antibiotics – Glossary
66
Glossary ABC Adenosine binding cassette super family
AMI Amitriptyline
AMR Anti-microbial drug resistance
CIT Citalopram
CPZ Chlorpromazine
DES Desipramine
EARSS European Antimicrobial Resistance Surveilance System
IMI Imipramine
MATE Multidrug and toxic compound extrusion
MDR Multi drug resistance
MFS Major facilitator superfamily
MIC Minimum Inhibitory Concentration
MRSA Methicillin resistant Staphylococcus aureus
MRSE Methicillin resistant Staphylococcus epidermidis
PBP Penicillin Binding Proteins
PCR Polymerase Chain Reaction
PCP Prochlorperazine
PTZ Promethazine
RND Resistance nodulation division
SEM Standard Error of the Mean
SER Sertraline
SMR Small multidrug resistance
SSRI Selective Serotonin Reuptake Inhibitors
THIO Thioridazine
VRE Vancomycin resistant Enterococcus faecalis

Antimicrobial effects of selected non-antibiotics – Appendix 1
67
Appendix 1: Chemical structures of test compounds
1. Phenothiazines
S
NCl
N
S
NCl
N
N
Chlorpromazine (CPZ) Prochlorperazine (PCP)
S N N
S
*
S
N
N
*
Thioridazine (THIO) Promethazine (PTZ)
2. Tricyklic antidepressants
NMe2
N
NHMe
N
NMe2
Amitriptyline (ATT) Desipramine (DES) Imipramine (IMI)
3. Selective Serotonine Reuptake inhibitors
O
NMe2
F
NC
*
MeHN
Cl
Cl* *
Citalopram (CIT) Sertraline (SER)

Antimicrobial effects of selected non-antibiotics – Appendix II
68
Appendix 2: Microtiter Antibiotic Synergy Testing (checker-board)
Example for set-up: Strain: MRSA 33591
Oxacillin: stocksolution 1: 4096 µg/ml
stocksolution 2: 8192 µg/ml
Chlorpromazine: stocksolution: 512 µg/ml
CHECKERBOARD
4 8 16 32 64 128 256 Oxa 512
control (strain) 1
2 3 4 5 6 7 8 9
MIC Oxa
MIC CPZ
control (med)
0.5 + + + + + + + + - + + - A
1 + + + + + + + + - + + - B
2 + + + + + + + - - + + - C
4 + + + + + + - - - + + - D
8 + + + + - - - - - + + - E
16 + - - - - - - - - + + - F
32 CPZ + - - - - - - - - + + - G
64 + - - - - - - - - - - - H
1. Materials: - U-bottom sterile microtiter plates - multichannel pipette and sterile tips - supplemented Mueller Hinton broth - 9.0 ml SMHB tubes - 4.0 ml saline blanks - 18-24 hour culture of organism in TSB - Mueller-Hinton agar plates / Iso-Sensitest agar plates - antibiotic stock solutions, frozen in small aliquots of
256 – 16384 µg/m
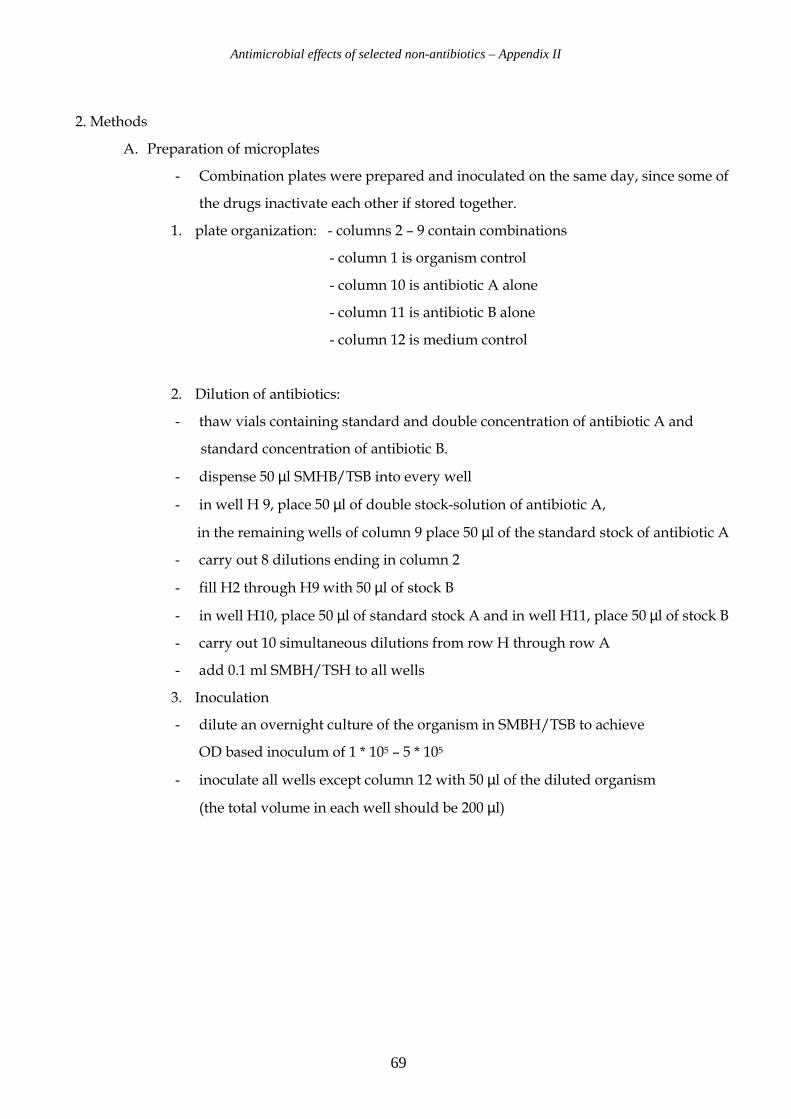
Antimicrobial effects of selected non-antibiotics – Appendix II
69
2. Methods
A. Preparation of microplates
- Combination plates were prepared and inoculated on the same day, since some of
the drugs inactivate each other if stored together.
1. plate organization: - columns 2 – 9 contain combinations
- column 1 is organism control
- column 10 is antibiotic A alone
- column 11 is antibiotic B alone
- column 12 is medium control
2. Dilution of antibiotics:
- thaw vials containing standard and double concentration of antibiotic A and
standard concentration of antibiotic B.
- dispense 50 µl SMHB/TSB into every well
- in well H 9, place 50 µl of double stock-solution of antibiotic A,
in the remaining wells of column 9 place 50 µl of the standard stock of antibiotic A
- carry out 8 dilutions ending in column 2
- fill H2 through H9 with 50 µl of stock B
- in well H10, place 50 µl of standard stock A and in well H11, place 50 µl of stock B
- carry out 10 simultaneous dilutions from row H through row A
- add 0.1 ml SMBH/TSH to all wells
3. Inoculation
- dilute an overnight culture of the organism in SMBH/TSB to achieve
OD based inoculum of 1 * 105 – 5 * 105
- inoculate all wells except column 12 with 50 µl of the diluted organism
(the total volume in each well should be 200 µl)

70
Related Documents


