ETH Library Antibody purification with ion- exchange chromatography Doctoral Thesis Author(s): Forrer, Nicola Publication date: 2008 Permanent link: https://doi.org/10.3929/ethz-a-005627370 Rights / license: In Copyright - Non-Commercial Use Permitted This page was generated automatically upon download from the ETH Zurich Research Collection . For more information, please consult the Terms of use .

Welcome message from author
This document is posted to help you gain knowledge. Please leave a comment to let me know what you think about it! Share it to your friends and learn new things together.
Transcript
ETH Library
Antibody purification with ion-exchange chromatography
Doctoral Thesis
Author(s):Forrer, Nicola
Publication date:2008
Permanent link:https://doi.org/10.3929/ethz-a-005627370
Rights / license:In Copyright - Non-Commercial Use Permitted
This page was generated automatically upon download from the ETH Zurich Research Collection.For more information, please consult the Terms of use.
ETH Diss. No. 17784
Antibody Purification With
Ion-Exchange Chromatography
A dissertation submitted to
ETH ZURICH
for the degree of
Doctor of Sciences
presented by
Nicola Forrer
Dipl. Chemieingenieur, ETH Zurich
born May 31, 1980
citizen of Ebnat-Kappel (SG)
accepted on the recommendation of
Prof. Dr. M. Morbidelli (ETH Zurich), examiner
Prof. Dr. M. Mazzotti (ETH Zurich), co-examiner
Dr. A. Butte (ETH Zurich), co-examiner
Zurich 2008


Abstract
In this thesis a detailed characterization of the behavior of a polyclonal IgG on a
preparative strong cation exchanger is discussed. The polyclonal mixture is studied
using chromatographic and non chromatographic methods. The study showed that the
mixture is composed by a very large number of components with different isoelectric
points and, therefore, can be separated by ion-exchange chromatography.
The adsorption of the polyclonal mixture is studied using different approaches. First,
the mixture is simplified by lumping the different components of the IgG into two
”macro-components”, referred to as pseudo-variants in the following. An analytical
method for the determination of the concentrations of the two pseudo-variants is de-
veloped. Based on this, the mass transport and the adsorption isotherm parameters
are determined experimentally using only well known sort-cut methods. This analysis
is evidencing the difficulty of the determination of these parameters for proteins. The
mass transport is very limited and the isotherm strongly dependent on the operating
conditions.
In a second approach, the adsorption is characterized using a detailed multi-component
pore model, while still considering two pseudo-variants only. This model is explicit in
all transport parameters and includes salt dependent isotherms. Linear gradient exper-
iments are used to fit the salt dependent adsorption isotherms and the mass transport
parameters for the two pseudo-variants. Using the model, breakthrough curves are
predicted with good accuracy. The model is also implemented to visualize the axial
and radial concentration profiles of the two pseudo-variants in the column.
The mixture simplification with only two components was, in some cases, not able to
reproduce the mixture profile. Therefore a more precise approach is used. The mixture
is approximated with a larger number of pseudo-variants. An analytical protocol is
proposed, which is able to differentiate between the pseudo-variants without the need
of complete resolution on an analytical column. Gradient elution experiments are used
to fit the adsorption parameters and breakthrough curves for the six components are
predicted using the model.
i

Porosity strongly affects the mass transport and the adsorption isotherms. This
parameter is studied in detail in the last part of this thesis. Changes in pore size
distribution are first studied as a function of the salt concentration. Then a new
technique to measure on-line the column porosity at different loading conditions is
discussed.
ii
Riassunto
In questa tesi il comportamento di un anticorpo policlonale su una resina a scambio
ionico e discusso nel dettaglio. La miscela policlonale e studiata utilizzando metodi
cromatografici e non cromatografici. Lo studio evidenzia che la miscela e composta da
un gran numero di componenti aventi punti isoelettrici diversi e che quindi possono
essere separati utilizzando cromatografia a scambio ionico.
L’adsorbimento della miscela policlonale e studiato utilizzando approcci diversi. In-
izialmente, la miscela e semplificata riunendo i differenti componenti in due ”macro-
componenti”, chiamati in seguito pseudo-varianti. Un metodo analitico per la deter-
minazione della concentrazione delle due pseudo-varianti e sviluppato. Basandosi su
questa semplificazione, i parametri di trasporto di massa e l’isoterma di adsorbimento
sono determinati utilizzando unicamente metodi approssimativi presenti in letteratura.
Questa analisi evidenzia la difficolta della determinazione di questi parametri per le pro-
teine. Il trasporto di massa e l’isoterma di adsorbimento sono estremamente sensibili
ai parametri operativi.
In un secondo approccio, l’adsorbimento delle due pseudo-varianti viene caratteriz-
zato utilizzando un modello matematico (”pore model”). Il modello e esplicito riguardo
a tutti i parametri di trasporto di massa e include isoterme di adsorbimento dipendenti
dalla concentrazione del sale. Gradienti lineari sono utilizzati per la determinazione dei
parametri di trasporto di massa e delle isoterme di adsorbimento per le due pseudo-
varianti. Utilizzando il modello, curve di sfondamento sono predette con notevole
precisione. Il modello e successivamente utilizzato per visualizzare i profili di concen-
trazione delle due pseudo-varianti all’interno della colonna.
La semplificazione della miscela con solo due componenti e, in alcuni casi, risul-
tata imprecisa. Quindi, un metodo piu preciso e utilizzato in seguito. La miscela e
approssimata con un numero maggiore di pseudo-varianti. Un protocollo analitico,
capace di distinguere le pseudo-varianti senza che esse siano completamente separate
su una colonna analitica e presentato. Gradienti lineari sono utilizzati per la determi-
nazione dei parametri d’adsorbimento e curve di sfondamento sono predette utilizzando
iii

il modello.
La porosita ha un’influenza enorme sul trasporto di massa e sulle isoterme di ad-
sorbimento. Questo parametro e studiato nel dettaglio nella parte finale della tesi.
Variazioni della distribuzione dei pori sono studiate inizialmente in funzione della quan-
tita di sale. Successivamente, un nuovo metodo e proposto tramite in quale e possibile
misurare ”on-line” la porosita in funzione della quatita di proteina caricata sulla resina.
iv

Acknowledgments
My greatest acknowledgment goes to Professor Morbidelli, who supervised my thesis. I
especially appreciated the very fruitful scientific discussions and his very useful advices.
Moreover I would like to thank him for the nice discussions about Italy, Switzerland
and about the ”ticinesi” we had.
I would also like to thank Ale for his great scientific help and enormous support and
encouragement. You have been a lot more than a supervisor for me.
A great acknowledgment also to Professor Mazzotti, who accepted to be my co-
examiner.
A very big thank goes to my friends and colleges Timm, Guido, Tomek, Lars, Nadia,
Agnes and Helen. I had a really great time with you, not only in the labs by also during
the excursion and the other activities we did together. I hope that we will continue
doing this also in the future. Thanks also to all other members of the Morbidelli group
for the nice time we spent together. I would like also to thank Olga, who contributed
with her master thesis to the chapter about porosity.
Un enorme grazie ai miei genitori e ai miei fratelli per il loro sostegno e incoraggia-
mento.
Un grazie particolare a Jenny per il sostegno, la pazienza e l’incoraggiamento. Grazie
anche per saper rendere speciale ogni momento che passiamo assieme.
Grazie anche a Glauco, Claudio, Aida, Cosma, Torria, Ronny, Hermann, Jamal,
Tino, Gabriele per aver reso piu piacevole la mia permanenza a Zurigo con le cene,
feste, grigliate e degustazioni che abbiamo fatto assieme.
The financial support of the ”Advanced Interactive Materials by Design” (AIMs)
project, supported by the Sixth Research Framework Programme of the European
Union (NMP3-CT-2004-500160), is also gratefully acknowledged.
v


Contents
Abstract i
Riassunto iii
Acknowledgments v
1 Introduction 1
1.1 State of the Art . . . . . . . . . . . . . . . . . . . . . . . . . . . . . . . 3
1.2 Outline . . . . . . . . . . . . . . . . . . . . . . . . . . . . . . . . . . . . 11
2 Experimental Characterization of the Adsorption 13
2.1 Introduction . . . . . . . . . . . . . . . . . . . . . . . . . . . . . . . . . 13
2.2 Materials . . . . . . . . . . . . . . . . . . . . . . . . . . . . . . . . . . 14
2.2.1 Stationary Phase and Columns . . . . . . . . . . . . . . . . . . 14
2.2.2 Mobile Phase and Chemicals . . . . . . . . . . . . . . . . . . . . 15
2.2.3 Chromatography Equipment . . . . . . . . . . . . . . . . . . . . 15
2.3 Methods . . . . . . . . . . . . . . . . . . . . . . . . . . . . . . . . . . . 16
2.3.1 Column Porosity . . . . . . . . . . . . . . . . . . . . . . . . . . 16
2.3.2 Mass Transport . . . . . . . . . . . . . . . . . . . . . . . . . . . 16
2.3.3 Adsorption Isotherm . . . . . . . . . . . . . . . . . . . . . . . . 18
2.4 Results and Discussion . . . . . . . . . . . . . . . . . . . . . . . . . . . 21
2.4.1 Column characterization . . . . . . . . . . . . . . . . . . . . . . 21
2.4.2 Polyclonal IgG Mixture Characterization . . . . . . . . . . . . . 23
2.4.3 Mass Transfer Effects . . . . . . . . . . . . . . . . . . . . . . . . 34
2.4.4 Isotherm Determination . . . . . . . . . . . . . . . . . . . . . . 37
2.5 Conclusions . . . . . . . . . . . . . . . . . . . . . . . . . . . . . . . . . 50
3 Mathematical Modelling of the Adsorption 53
3.1 Introduction . . . . . . . . . . . . . . . . . . . . . . . . . . . . . . . . . 53
3.2 Model Development . . . . . . . . . . . . . . . . . . . . . . . . . . . . . 55
vii
3.2.1 Mass balance of the salt . . . . . . . . . . . . . . . . . . . . . . 58
3.2.2 Adsorption isotherm . . . . . . . . . . . . . . . . . . . . . . . . 58
3.3 Parameter Determination . . . . . . . . . . . . . . . . . . . . . . . . . 59
3.3.1 Parameters from literature correlations . . . . . . . . . . . . . . 60
3.3.2 Parameter regression . . . . . . . . . . . . . . . . . . . . . . . . 60
3.4 Results and Discussion . . . . . . . . . . . . . . . . . . . . . . . . . . . 61
3.4.1 Column characterization . . . . . . . . . . . . . . . . . . . . . . 61
3.4.2 Polyclonal IgG mixture characterization . . . . . . . . . . . . . 61
3.4.3 Mass transport parameters . . . . . . . . . . . . . . . . . . . . . 62
3.4.4 Isotherm determination . . . . . . . . . . . . . . . . . . . . . . . 62
3.4.5 Analysis of the column behavior under loading conditions . . . . 76
3.5 Conclusions . . . . . . . . . . . . . . . . . . . . . . . . . . . . . . . . . 81
4 Multi Component Mathematical Modelling of the Adsorption 83
4.1 Introduction . . . . . . . . . . . . . . . . . . . . . . . . . . . . . . . . . 83
4.2 Materials and Methods . . . . . . . . . . . . . . . . . . . . . . . . . . . 85
4.2.1 Stationary phase and columns . . . . . . . . . . . . . . . . . . . 85
4.2.2 Mobile phase and chemicals . . . . . . . . . . . . . . . . . . . . 85
4.2.3 Chromatography equipment . . . . . . . . . . . . . . . . . . . . 86
4.3 Model Description . . . . . . . . . . . . . . . . . . . . . . . . . . . . . 86
4.3.1 Main Assumptions . . . . . . . . . . . . . . . . . . . . . . . . . 86
4.3.2 Mass Balance Equations . . . . . . . . . . . . . . . . . . . . . . 87
4.3.3 Adsorption Isotherms . . . . . . . . . . . . . . . . . . . . . . . . 89
4.3.4 Numerical Solution of the Mass Balance Equations . . . . . . . 90
4.3.5 Parameter Regression . . . . . . . . . . . . . . . . . . . . . . . . 91
4.3.6 Fraction Analysis . . . . . . . . . . . . . . . . . . . . . . . . . . 91
4.4 Results and Discussion . . . . . . . . . . . . . . . . . . . . . . . . . . . 93
4.4.1 Experiments under Non-Adsorption Conditions . . . . . . . . . 93
4.4.2 Diluted Linear Gradient Experiments . . . . . . . . . . . . . . . 94
4.4.3 Overloaded Linear Gradient Experiments . . . . . . . . . . . . . 103
4.4.4 Prediction of Breakthrough Experiments . . . . . . . . . . . . . 110
4.5 Conclusions . . . . . . . . . . . . . . . . . . . . . . . . . . . . . . . . . 113
5 Porosity Investigation 119
5.1 Introduction . . . . . . . . . . . . . . . . . . . . . . . . . . . . . . . . . 119
5.2 Materials and Methods . . . . . . . . . . . . . . . . . . . . . . . . . . . 121
5.3 Results and discussion . . . . . . . . . . . . . . . . . . . . . . . . . . . 127
viii
5.3.1 Porosity as a function of salt concentration . . . . . . . . . . . . 127
5.3.2 Porosity as a function of the amount of protein loading . . . . . 135
5.4 Conclusions . . . . . . . . . . . . . . . . . . . . . . . . . . . . . . . . . 140
6 Conclusions 145
List of Symbols 147
Bibliography 150
ix


Chapter 1
Introduction
Target specific drugs like monoclonal antibodies (MAb), are gaining increasing interest
for the treatment of different diseases, e.g. cancer and arthritis. As a consequence,
their market is steadily increasing. In 2004, approximately 200 antibodies and their
derivatives were in clinical trials, whereas 13 had already reached the market [1]. In
2005, 31 monoclonal antibody-based products have been approved for therapeutic or
in vivo diagnosis purposes [2]. The total market for the monoclonal antibodies in 2010
is estimated to be of 25 billion dollars [3].
Nowadays, MAbs are mainly produced by mammalian cells. The production process
is nowadays highly efficient and titers as high as 5-10 g/L can be reached. As a conse-
quence, the downstreaming part had become the cost determining step, contributing
to 50-80 % of the total production costs [1]. The purification is mainly based on chro-
matographic techniques and, in particular, on the use of protein A affinity resins. The
major advantage of this resin is its high selectivity: in fact it specifically binds the
constant part of the antibodies. This advantage is however balanced by the very high
price of the resin.
A significant amount of work has been done to find alternative methods to protein
A. The complex properties of the antibodies, e.g. its charge and hydrophobicity, can be
exploited to achieve separation in cation exchange chromatography [4] and hydrophobic
interaction chromatography [5], respectively. Both previous properties of the antibody
can be used together in the so-called mixed-mode resins. The most promising resins of
this family is the hydrophobic charge induction material [6, 7, 8]. Different supports
1
2 1. Introduction
have been used in addition to the polymer based ones. Native silica [9], silica coated
with thiophilic ligands [10], silica coated with ion-exchange ligands [11] and hydrox-
yapatite [12] have successfully been applied. Finally, it is worth mentioning that the
complete purification is typically comprising of different chromatographic steps, where
previously mentioned techniques must be combined in order to obtain a complete pu-
rification. For instance, a combination of ion exchange and hydrophobic interaction
was successfully applied for the purification of a monoclonal antibody from host cell
proteins [13, 14]. The removal of host cell proteins was comparable to a protein A pro-
cess with polishing step [14]. Among the different stationary phases mentioned above,
the use of cation exchange chromatography (CIEX) seems particularly interesting due
to (i) the cost, (ii) the large chemical stability of the stationary phase and (iii) the pos-
sibility of efficiently separate different proteins based on their charge distribution [15].
Due to their large size, the mass transport in conventional stationary phases is par-
ticularly hindered, thus often producing very broad peaks and small dynamic binding
capacities [16, 17, 18]. In addition to this, the adsorption mechanism of antibody
molecules is particularly complex, due to the their equally complex structure. When
dealing with ion-exchange chromatography, the adsorption behavior of these molecules
can dramatically change as a consequence of small changes in either the ionic strength
or the pH of the eluent. Under these conditions, the determination of the isotherm be-
comes particularly difficult and these difficulties are further increased by the hindered
mass transport mentioned before. All these reasons are contributing in explaining the
poor knowledge of monoclonal antibodies on ion-exchange columns.
The main objective of this work is then to clarify both the mass transport and the
adsorption isotherm of antibodies on ion-exchange resins. This is particularly impor-
tant for the development of appropriate numerical models for the simulation of these
systems. In fact, mathematical modelling is becoming more and more important due to
different reasons. The launch of the PAT (Process Analytical Technology) initiative [19]
by the FDA (Federal Drug Administration) is forcing biopharmaceutical producers to
move towards a more model-based control and monitoring of the production process
and therefore also of the purification. Moreover, model based approaches can be effec-
tively employed in the design of purification processes to shorten the design procedure
1.1. State of the Art 3
and to decrease material consumption, thus cutting down the costs. Mathematical
modelling is also a very powerful tool for the understanding and the analysis of the
adsorption process, as it will be extensively discussed in the Thesis.
1.1 State of the Art
In chromatography, different mechanisms are contributing in determining the overall
mass transport of the solutes. Axial diffusion, film mass transport, pore and surface
diffusion all contribute to the overall mass transport. However, for large molecules like
antibodies, the mass transport is mainly determined by the effective pore diffusivity.
The effective pore diffusivity can be determined in two ways: using macroscopic and
microscopic methods [20]. The first are based on the direct determination of mass
transfer rates from the macroscopic concentration profiles using a model. These meth-
ods are easy to implement, but provide only average values for the effective diffusivity.
Within the macroscopic methods, isocratic pulse response is the most easy one to im-
plement. This method is based on the assumption that the adsorption isotherm is
linear and that the injection pulse is infinitesimal. The effective diffusivity can be cal-
culated from the moments of the elution peak. This method has, however, different
limitations: small deviations from linearity of the isotherm can produce large tailing,
thus affecting the mass transport determination [21]; the method is very sensitive to
the accuracy of the buffer used; and, finally, since the moment determination is af-
fected by baseline drift, experiments should be done under conditions were the elution
peaks are fairly symmetrical (i.e. low flow rates). Gradient elution response is also
often used to estimate the effective diffusivity. This method has the advantage that
also non pure samples can be applied directly. Two sets of experiments are needed:
variation of the gradient slope (retention factor determination) and variation of the
mobile flow rate. The effective pore diffusivity can be determined from the HETP
defined for gradient elution [22, 23]. Frontal analysis experiments is another popular
macroscopic method. Here the mass transport is measured in high loading conditions
and the results can directly be used for scale-up purposes. It has the disadvantage of
requiring large amounts of protein and of being very time consuming. Moreover, an
4 1. Introduction
appropriate chromatography model and the knowledge of the adsorption isotherm are
needed. The effective pore diffusivity can be then determined from the solution of the
mass balance equations under the assumption of a constant pattern behavior and a
constant separation factor isotherm [22].
Batch adsorption experiments can also be applied for the determination of the effec-
tive diffusivity. Stirred batch adsorption [24, 25, 26, 27, 28, 29] is one of these methods.
Here the effective diffusivity is determined from uptake curves. Shallow bed adsorption
is another alternative. Here the same procedure as for the frontal analysis method is
used, but using a column containing only few adsorbent particles. The advantage is the
smaller consumption of proteins. In general, batch methods suffer from the disadvan-
tage that the effective diffusivity is measured in a different hydrodynamic environment
than in the chromatography column.
In the case of microscopic methods, the effective pore diffusivity is determined from
the intraparticle concentration profiles. The advantage is that the effective diffusivity
can be determined directly as a function of protein concentration and that no adsorp-
tion mechanism has to be assumed. However, complicated equipments are needed, the
analysis is limited to optical clear matrix and fluorescent labelling is often required. In
addition to this, impurities or preferential adsorption of native proteins can cause inter-
ferences. The visualization of the concentration profile can be done either by confocal
microscopy [30, 31, 32, 33, 34, 35] or by light microscopy [36, 37, 38, 39, 40].
The determination of the effective pore diffusivity is made even more complex by
the fact that it strongly depends on the operating conditions. Different results show
the influence of the protein concentration on the effective pore diffusivity. Chang and
Lenhoff determined the effective diffusivities of lysozyme in a set of preparative strong
cation-exchange stationary phases based on different base matrices [27]. In their study,
the experimental data from batch uptake data in a stirred vessel were fitted with either
the pore diffusion model or the homogeneous diffusion model. The estimated pore dif-
fusivities decreased with increasing protein concentration. The authors proposed that
protein-protein interactions and pore constrictions resulting from protein adsorption
contribute to this effect. Other authors have also reported diminishing diffusivity with
increasing protein concentration on different stationary phases [18, 41, 42]. Melter
1.1. State of the Art 5
et.al. used a regression technique to determine the effective diffusivity of a monoclonal
antibody on a weak cation exchanger [15]. They also found a decreasing diffusivity for
increasing protein loading.
Controversial results have been reported with respect to the effect of ionic strength
on pore diffusion. Axelsson et al. investigated protein diffusion in agarose gel and
reported a decrease of the pore diffusion coefficient based on the neutralization of the
electrostatic forces between protein molecules, which results in a shielding effect of the
protein charges [43]. This agrees with the results of protein diffusion in solution [44, 45].
The opposite effect, i.e. an increase in diffusivity with increasing salt concentration
was measured in other studies [27] and it is probably due to the increase of the pore
size with increasing ionic strength.
The determination of the effective diffusivity for multicomponent protein system
has been investigated only by few authors. Two-component adsorption kinetics on the
agarose based ion-exchanger SP-Sepharose-FF was investigated by Skidmore and Chase
[24]. Carta et al. [46] studied the adsorption kinetics of mixtures of cytochrome C and
lysozyme on the same resin by spectrophotometry. Two component protein adsorption
on a different resin, HyperD-M, was investigated by Lewus and Carta [47]. The resin
consisted in porous silica particles filled with a gel. Smooth intra-particle concentration
profiles were observed in all those gel-type structures for single and multi-component
systems [48]. Melter et.al. studied the multi-component competitive adsorption of
three monoclonal antibody variants on the preparative cation-exchanger, Fractogel
EMD COO− (S) [49]. Despite these contributions, the measurements of the effective
pore diffusivity for proteins remain a very difficult task and the understanding of the
mass transport process of large molecules is still very poor.
Different experimental techniques for the determination of the adsorption isotherm
can be found in literature [50]. The batch method is the most well known among
these methods. A known amount of adsorbent is equilibrated in a closed vessel with a
solution possessing a known initial concentration of solute. At equilibrium, the solute
concentration in the liquid phase is determined and from a mass balance, the adsorbed
amount is calculated. To construct the adsorption isotherm, several experiments have
6 1. Introduction
to be performed changing the initial solute concentration and the adsorbent quantity.
The advantage of this method is, however, the low solute consumption. The drawbacks
are the high amount of work needed and the low accuracy. Another well known method
is frontal analysis. In frontal analysis, the column is loaded with a protein solution
with known concentration, until the feed concentration is reached at the outlet of the
column. From the time at which the adsorption front reaches the column outlet and
the solute concentration, the amount adsorbed on the column can be calculated. An
identical result can be obtained by regenerating the equilibrated column and collecting
the elution fraction. In order to save solute, frontal analysis can be applied also to
very small column. This method is often referred to as shallow bed adsorption [51].
With successive frontal analysis experiments, the complete isotherm can be determined.
Frontal analysis can be applied also for the determination of multi component adsorp-
tion isotherms [52], but this method is very time and solute consuming. Perturbation
method is also frequently applied [53, 54, 55, 56]. The column is equilibrated with
different solute concentrations. Then, a small perturbation is introduced in the sys-
tem. The retention time of the perturbation gives information about the local total
derivative of the isotherm (∂qi/∂ci). Applying the method to different feed concen-
trations, a set of derivatives can be determined. From these derivatives the isotherm
can be found by integration. The main advantage of this method is that no detec-
tor calibration is needed, but it has the same drawbacks as frontal analysis. Elution
by characteristic point can also be applied to determine the adsorption isotherm [57].
This method is limited to very efficient columns, thus exhibiting very fast mass trans-
fer. For these columns, equilibrium theory can be used to analyze the dispersed fronts
in overloaded chromatograms [50]. However, this method can be seldom applied to
proteins due to their slow mass transport. The last methods discussed here is peak
fitting [58, 59, 60, 61, 62]. In this method a mathematical model is used to fit experi-
mental profiles under overloaded conditions. The isotherm model has, however, to be
known a priori.
It is important to note that for each method described above, the specific poros-
ity of the solute investigated has to be known. Errors in the porosity determination
leads to erroneous isotherm determination [50]. The determination of the porosity is
1.1. State of the Art 7
in principle a trivial experiment: in the so-called inverse size exclusion chromatogra-
phy (iSEC), a tracer has to be injected under non adsorption conditions and from its
retention time the porosity can be calculated. The selection of the tracer is instead
not trivial. This has not to adsorb under the experimental conditions studied, has to
be easily detectable and must have a well defined size. Polymer tracers are usually
applied, for which correlations between mass and size have been developed.
Different isotherms have been proposed to describe the adsorption of proteins in
ion exchange resins [63]. The most important ones are the Langmuir isotherm [64]
and the steric mass action isotherm [65]. The mass action isotherm takes into account
the competition for adsorption between the solute and the salt and is subject to the
following assumptions: (i) the multipointed nature of the protein can be reduced to a
single characteristic charge; (ii) competitive binding can be expressed by a mass action
equilibrium where electro-neutrality on the stationary phase is maintained; and (iii)
the binding of large molecules causes steric hindrance of salt counter ions bound to
the surface. These sites are then unavailable for adsorption. The effect of co-ions is
neglected and the isotherm parameters are assumed to be constant. The Langmuir
isotherm assumes a monolayer adsorption on an energetically homogeneous surface.
Moreover, it is assumed that adsorbed molecules are not affecting the adsorption of
other molecules. This adsorption isotherm is very commonly used to describe the
adsorption behavior of simple molecules under isocratic conditions. Many authors
have shown that for constant pH and salt concentration, the adsorption behavior of
proteins is well described by Langmuir-type isotherms [40, 66, 67, 68, 69]. Moreover,
it has been demonstrated that the mass action law in its simplest form can be reduced
to linear adsorption equilibrium if the salt concentration is much larger than that of
the solute. In this case, a salt dependent expression of the Henry coefficient can be
derived [70]. Both isotherms have successfully been applied for single components.
The determination of multi-component adsorption equilibrium isotherm is more
complicated. It typically includes three steps, namely (i) the determination of the ad-
sorption isotherm of the single components, (ii) the extension to the multi-component
case and (iii) the choice of suitable techniques to regress and validate the developed
8 1. Introduction
multi-component adsorption isotherm. One possibility when characterizing multi-
component systems is in fact to first determine single-component adsorption isotherms
and then derive from these the behavior of the multi-component system. For this, some
assumptions about the competitive behavior of the various components is needed in
order to define the multi-component equilibrium models. In the case of thermodynam-
ically consistent systems, this operation can lead to a precise characterization of the
adsorption behavior of the mixture [71]. However, in general this procedure may result
in predictions only of limited accuracy [50]. There are a number of models to describe
the complex behavior of multi-component adsorption isotherms, but the determination
of the corresponding parameters still remains laborious [72]. For instance, Hashim et
al. [73] could only obtain an accurate prediction of the adsorption equilibrium data
of two solutes using empirical parameters, because the amount of available adsorption
sites depended on the feed composition. For some systems, the competitive Lang-
muir isotherm [74] is a simple and valid alternative to the complex isotherm described
above. This isotherm considers only the diminishing of the available adsorption sites
due to the presence of the other components, but neglects all other interactions (e.g.
solute-solute). The multi component Langmuir isotherm is valid only for very similar
components with almost equal saturation capacities.
Different models have been proposed for the description of a chromatographic col-
umn [63]. The most comprehensive model present in literature is the so-called general
rate model (GRM) [75, 76, 77, 78]. In this model, the concentration profile along the
column axis is coupled with the description of the profile along the particle radius.
Accordingly, it is possible to detaily describe the mass transport in the particles due to
liquid and solid diffusion, as well as the adsorption kinetics. The model is comprising
of two sets of partial differential equations (PDEs) for the concentration profiles in
the liquid phases and one ordinary differential equation (ODE) for the mass balance
in the solid. A first simplification of the model can be obtained by neglecting pore
diffusion inside the particles. The resulting model is often referred to as lumped pore
model [79] and the concentration profile along the particle radius is substituted by an
average particle concentration and a linear driving force for mass transport across the

1.1. State of the Art 9
particle surface is assumed. Therefore, the PDE corresponding to the particle mass
balance is substituted by an ODE. A further simplification is obtained by lumping all
non-equilibrium mechanisms inside the particle due to both transport and kinetics into
a single kinetic coefficient. In addition to this, all the different porosities are grouped
into a single total accessible porosity of the solute. The corresponding model is referred
to as kinetic model [75] and it involves the solution of a PDE (concentration profile
along the column axis) and an ODE (concentration in the solid phase). If the kinetics
in the kinetic model is sufficiently fast, a further simplification can be introduced to
obtain the so-called equilibrium-dispersive model [80, 81, 82]. Here, equilibrium is as-
sumed between the liquid and the solid phases and all trasport resistances are lumped
into a single apparent axial dispersion. A single set of PDEs is then obtained. In all
previous cases, only numerical solutions are possible, with the exception of the moment
analysis, for which analytical solutions are available (for diluted conditions). If also
the remaining axial dispersion is neglected, thus obtaining an ideal column behavior,
the so-called ideal model [83, 84, 85] is obtained, for which analytical solutions can be
obtained with the method of characteristics [86, 87]. All previous models, with the
exception of the more general one (GRM), cannot be applied in general to proteins,
where pore diffusion is playing a primary role in determining the column behavior [88].
Polymer based ion-exchange resins are often the only choice in the separation of
biomolecules. In fact, GMP rules require column sanitization with sodium hydroxide,
which is not practical in silica based columns [89, 90]. In this work, Fractogel SE
HiCap is considered. This resin is made of a methacrylate based polymeric resin with
an hydrophilic surface. The functional sulfoethyl-groups are located on so-called ten-
tacles, that is long polymer chains bound to the surface [91]. The high selectivity and
capacity of this material, where non-specific solute-matrix interactions are minimized,
makes it promising with respect to the separation of very similar compounds with very
small charge differences.
In this work, monoclonal antibodies are replaced by a polyclonal antibody mixture.
Polyclonal antibodies are produced by the B-cells (a kind of white blood cell) in the
10 1. Introduction
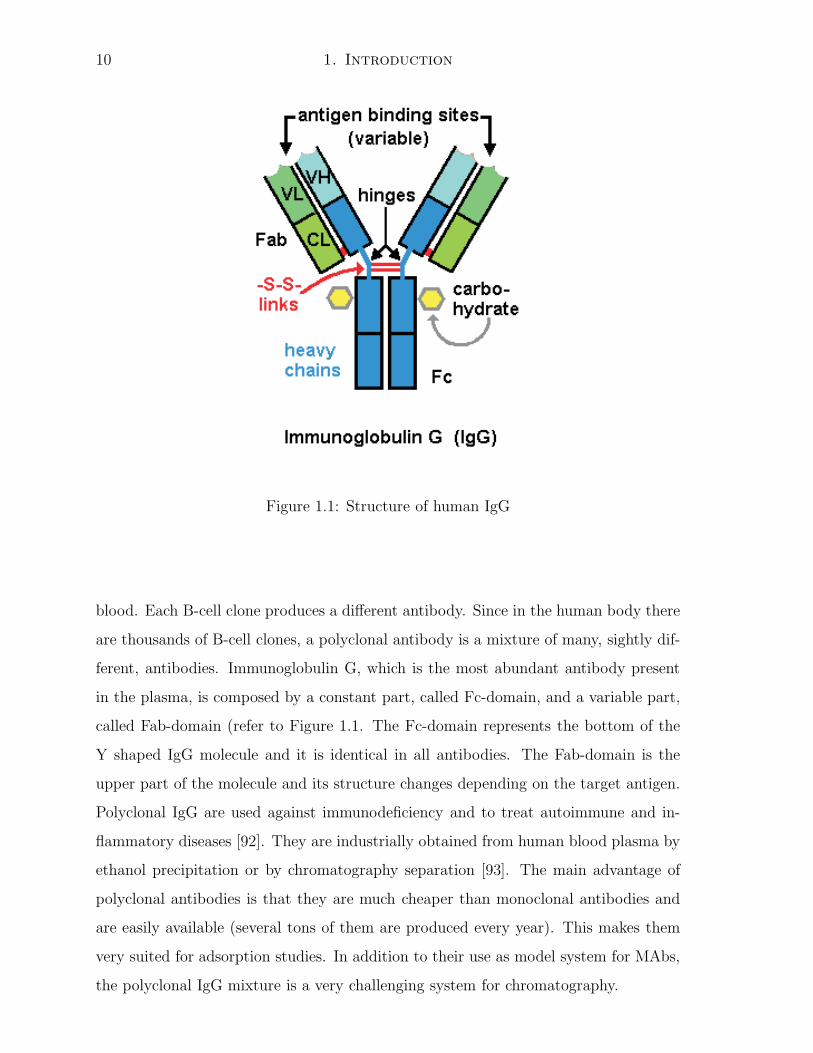
Figure 1.1: Structure of human IgG
blood. Each B-cell clone produces a different antibody. Since in the human body there
are thousands of B-cell clones, a polyclonal antibody is a mixture of many, sightly dif-
ferent, antibodies. Immunoglobulin G, which is the most abundant antibody present
in the plasma, is composed by a constant part, called Fc-domain, and a variable part,
called Fab-domain (refer to Figure 1.1. The Fc-domain represents the bottom of the
Y shaped IgG molecule and it is identical in all antibodies. The Fab-domain is the
upper part of the molecule and its structure changes depending on the target antigen.
Polyclonal IgG are used against immunodeficiency and to treat autoimmune and in-
flammatory diseases [92]. They are industrially obtained from human blood plasma by
ethanol precipitation or by chromatography separation [93]. The main advantage of
polyclonal antibodies is that they are much cheaper than monoclonal antibodies and
are easily available (several tons of them are produced every year). This makes them
very suited for adsorption studies. In addition to their use as model system for MAbs,
the polyclonal IgG mixture is a very challenging system for chromatography.
1.2. Outline 11
1.2 Outline
In the following the structure of the Thesis is outlined. In Chapter 2 the adsorption
of the polyclonal IgG mixture on a strong cation exchanger column is characterized
experimentally using analytical ion exchange and size exclusion columns. Following this
analysis, the mixture has been approximated by considering two pseudo-variants only.
An analytical procedure for the determination of the concentration of the two pseudo-
variants is developed. The general behavior of the PAb mixture on the preparative
IEX column is described. Shortcut methods are utilized for a first determination of
the isotherm and the mass transport parameters.
In Chapter 3 the experiments of previous chapter are utilized for the determina-
tion of the adsorption parameters by peak fitting. A two-component pore model is
presented. The model considers explicitly all contributions to mass transport. More-
over, salt dependent adsorption isotherm are used. Isocratic experiments under non
adsorption condition and at different flow rates are used for the determination of the
column porosity and mass transport parameters. Diluted and overloaded gradients are
then used for the determination of the salt dependent isotherms. Using the regressed
parameters, breakthrough curves are predicted. Moreover, the concentration profiles
of the two pseudo-variants along the column axis and the particle radius are discussed.
Chapter 4 presents a more detailed analysis of the adsorption of the polyclonal
mixture. Six pseudo-variants are used to reproduce the mixture profiles. A method is
developed to determine the concentration of the six pseudo-variants without the need of
complete resolution on the analytical column. A multi-component pore model is used
to fit the single profiles of the six components. Linear and overloaded gradients are
used to determine the six salt dependent isotherms and the mass transport parameters.
Breakthrough curves of the single components are predicted using the model.
The effect of the operating conditions on porosity is studied in detail in Chapter 5.
The change in porosity during linear gradient elution experiments and during loading
experiments is studied. Polyvinylpyrrolidone tracers are used to measure the porosity
as a function of the salt concentration in the buffer and as a function of the adsorbed
amount of two model proteins.

Chapter 2
Experimental Characterization of
the Adsorption
2.1 Introduction
In general, large proteins like antibodies often exhibit peculiar behaviors on conven-
tional stationary phases for chromatography. Due to their large molecular size, a large
fraction of the total column porosity is not accessible to these molecules. This has a
large impact on the transport inside the particles, which, as a consequence, is typically
very slow, and on the total capacity of this columns, which is then small. In turn,
these two effects are influencing typical chromatographic operations, such as loading
and separation. In the first case, the loading can be very inefficient and the so-called
dynamic binding capacity very small compared to the static capacity of the column. In
the second case, the purification may also be very inefficient, since the severe transport
limitations of such columns are broadening the outlet peaks and reduce peak resolution.
The thermodynamic behavior of mono- and polyclonal antibodies is also very pecu-
liar. The competition for adsorption with salts is very strong and the antibody affinity
towards the stationary phase can dramatically change as result of little variations in
the salt content. In addition to this, the protein net charge can considerably change in
response to pH variations, thus also affecting the affinity of the antibody. The charac-
terization of this behavior is generally very complex and made even more problematic
due to two additional facts: (i) the presence of strong transport limitations, which are
13

14 2. Experimental Characterization of the Adsorption
considerably deforming the shapes of the peaks and make the application of typical
methods for isotherm characterization very problematic; (ii) the presence of several
variants in the same clone or, as in the case of this work, the presence of different
clones, that is of a broad range of molecules with different adsorption behaviors.
In this chapter a detailed characterization of the behavior of a commercially avail-
able PAb on a commercial cation exchange chromatographic column is discussed. In
particular, the characterization will proceed in different steps: first, a characterization
of the PAb and of the column structure is presented. Then, it will be studied the
mass transport and the adsorption of the PAb. In addition to this work, techniques to
reduce the complexity of the system will be also discussed, where the different clones
and variants composing the PAb are lumped into a limited number of pseudo-variants,
i.e. in homogeneous pseudo-components.
2.2 Materials
2.2.1 Stationary Phase and Columns
The resin is packed, following the instruction of the manufacturer, into an Unicorn
(50x5 mm) glas column (GE Healthcare Bio-Science AB, Sweden). The packed column
resulted in a bed height of 4.3 cm, which corresponds to a volume of 0.83 mL (20 % resin
compression). The small volume of the column is needed to run loading experiments
without using too much protein. The main properties of Fractogel SE HiCap, as given
by the manufacturer, are summarized in Table 2.1.
An analytical weak cation exchanger column (100x4 mm, ProPac WCX-10 column
from Dionex) and a size exclusion column (300x78 mm, TSK-GEL G3000SWXL column
from Tosoh bioscience) with guard column (40x6 mm, SWXL) are used for the analysis
of the polyclonal IgG mixture. Isoelectric focusing experiments are performed using a
PhastGel IEF 3-10 gel (GE Healthcare Bio-Science AB, Sweden) stained with PhastGel
Blue R stain (GE Healthcare Bio-Science AB, Sweden).

2.2. Materials 15
column Fractogel EMD SE HiCap (M)
matrix crosslinked PMA
functional group sulfoethyl group
mean particle size 65 µm
pore size 800 A
binding capacity (lysozyme) 150 mg/ml
Table 2.1: Properties of the strong cation exchange resin used in this work.
2.2.2 Mobile Phase and Chemicals
Experiments under no adsorption conditions are run using 50 mM phosphate buffer
at pH = 7. The phosphate buffer is prepared mixing sodium dihydrogen phosphate
(Fluka, Switzerland), disodium hydrogen phosphate (Lancaster, England) and sodium
chloride (J.T. Baker, USA). Each component of the buffers is exactly weighted using
a precision balance (METTLER AT250, Mettler-Toledo, Switzerland). Adsorption ex-
periments are run using a 20 mM sodium acetate buffer at pH=5. This buffer was made
mixing sodium acetate (Merck, Germany) and acetic acid (Carlo Erba reagents, Italy).
Sodium chloride was used as modifier changing the solution ionic strength. Inverse size
exclusion experiments are carried out using dextran standards (Sigma-Aldrich, Switzer-
land). The mass transport coefficients are measured using: the polyclonal IgG mixture
(Gammanorm, Octapharma, Switzerland), human serum albumin (Sigma, Switzer-
land), myoglobin (Sigma, Switzerland) and acetone (J.T. Baker, Holland). Water is
filtered through a Millipore Synergy system before use. All chemicals are ”pro anal-
ysis” grade and all solutions are degassed and filtered through a 45 µm filter before
use.
2.2.3 Chromatography Equipment
The experiments are performed using an Agilent 1100 Series HPLC, equipped with a
quaternary gradient pump, an autosampler and a temperate two column switch. The
detection is done by a diode array detector and a refractive index detector. The column
outlet can be fractionated using a Gilson FC203B fraction collector.
16 2. Experimental Characterization of the Adsorption
2.3 Methods
2.3.1 Column Porosity
The knowledge of the column porosity is essential for the prediction of the solute elution
times and to understand the origin of the mass transport limitations. The complete
column pore size distribution is measured by inverse size exclusion chromatography
(iSEC) [94]. According to this procedure, tracers of different molecular weight are
injected under non retention conditions and the total liquid accessible volume, Vt,i, is
measured. The total porosity is then defined as [95]:
εt,i =Vt,i
Vc
(2.1)
where Vc is the volume of the column. The average retention volume Vt,i is calculated
from the first order moment of the elution peak. The particle volume accessed, Vp,i,
with respect to the particle volume, Vp, is referred to as particle porosity:
εp,i =Vp,i
Vp=
Vp,i
(1 − εb)Vc(2.2)
where εb is the bed porosity, that is the total porosity accessed by a molecule entirely
excluded from the particle pores. Therefore, the total and the particle porosity are
correlated to each other by the following equation:
εt,i = εp,i · (1 − εb) + εb (2.3)
Using tracers with different dimension, the so called inverse size exclusion chromatog-
raphy curve is constructed, where the total porosity is plotted against the logarithm
of the hydrodynamic diameter of the different tracers [94]. Two limits can be identi-
fied: the column free volume, εt, that is the volume accessed by a tracer so small to
enter every pore; and the bed volume, εb, that is the volume accessed by those tracers
entirely excluded by all particle pores.
2.3.2 Mass Transport
Mass transport in the particle pores can be very slow for large molecules, as antibodies,
and has a very strong influence on the shape of the eluting peaks. As discussed in the

2.3. Methods 17
Introduction, different methods have been developed for the determination of the pore
diffusivity. These methods can be divided in two classes: off-line and on-line methods.
Off-line methods, e.g. confocal (or light) microscopy or uptake experiments [32, 40, 96],
use unpacked resin. The on-line methods are instead applied directly on the packed
chromatography column [46]. These have the advantage of measuring the parameters
in the same hydrodynamic conditions as during the chromatography experiment. Note
that in case of adsorption (even in the simple case of linear adsorption), the mass trans-
port determination requires the knowledge of the adsorption isotherm. As discussed
later, this is difficult to be precisely measured, due to the complexity of the PAb mix-
ture. Therefore, it resulted convenient to carry out experiments under non-adsorbing
conditions, so to not introduce an additional degree of uncertainty in the estimation of
the mass transport parameters.
A popular method to characterize mass transport limitations inside a packed bed of
porous particle relies on the measure of the so-called height equivalent of a theoretical
plate (HETP). This procedure is based on the simplified description of a column into
a number of identical equilibrium plates, introduced by Synge et. al. in 1941 [97]. The
HETP is representative for the separation capacity of a chromatographic column and
it is providing a normalized measure of the elution peak variance. The HETP can be
calculated from the characteristics of the elution peak as in the following:
HETP =µ2
(µ1)2L (2.4)
where µ1 and µ2 are the first and the centered second moment of the elution peak, i.e.
the retention time and the peak standard deviation respectively.
The HETP value can be conveniently expressed in terms of the physical parameters
governing the mass transport inside the particles. This can be done by considering the
solution of the general rate model (GRM), which is the most comprehensive model for
chromatography and which accounts explicitly for all different contributions to the mass
transfer resistance. From the first two moments of the solution of the GRM equations
developed by Kubin and Kucera [98, 99], the HETP can be written for conditions of
no adsorption as [63]:
HETP =2Dax
uint+
2dp
F
(
Fεp
1 + Fεp
)2[1
6kf+
dp
60Deffp
]
uint (2.5)

18 2. Experimental Characterization of the Adsorption
where Dax is the axial diffusion coefficient of the column, uint the interstitial velocity,
εp the particle porosity, dp the particle diameter, F = εb/(1 − εb) the phase ratio, εb
the bed porosity, Deffp the effective diffusion coefficient in the pores and kf the film mass
transport coefficient.
The axial diffusion can be calculated assuming that hindered molecular diffusion
and eddy diffusion are additive [80]:
Dax = 0.7Dm + uintRp (2.6)
As it will be discussed in the following, the first term in the r.h.s. of Equation 2.5,
accounting for the axial dispersion, is negligible and the HETP value becomes then
linearly dependent on the interstitial velocity uint. The slope is comprising of two
terms. The first one is expressing the transport limitations in the external laminar
diffusion layer of the particle. The corresponding film mass transport coefficient can
be estimated from the equation of Wilson and Geankoplis [100]:
kf =Dm
dp
1.09
εb
(
usdp
Dm
)1/3
(2.7)
where us is the linear velocity and Dm is the molecular diffusion coefficient. This can
be calculated from the equation by Young et al [101]:
Dm = 8.31 10−8 T
ηbM1/3(2.8)
where T is the absolute temperature, ηb the solvent viscosity and M the molecular
weight of the solute.
Film resistances are generally negligible with respect to those inside the particle
pores, due to the very low effective pore diffusivity, Deffp . This is correlated to the
molecular diffusion coefficient by the following equation:
Deffp =
KpεpDm
τ(2.9)
where Kp is the hindrance factor and τ the tortuosity.
2.3.3 Adsorption Isotherm
Different approaches have been used for the description of the adsorption isotherm of
proteins on ion-exchange resins [70]: the law of mass action [65], the Donnan poten-
tial [102] and different others empirical correlations [103, 104, 105, 106]. Although some

2.3. Methods 19
of these isotherms are describing the adsorption in a correct mechanistical way, they
require the determination of many physical parameters. The Langmuir isotherm [64]
represents a convenient alternative. Even if it has no mechanistical justification outside
of the linear region of the isotherm [70], this isotherm is frequently used because it needs
the determination of only two parameters for each component. The multi-component
competitive Langmuir isotherm can be written as [63]:
qeqi =
Hiceqi
1 +∑n
j=1Hj
q∞j
ceqj
(2.10)
qeqi and ceq
i are the equilibrium concentrations of the i-th component in the solid and
in the liquid phase, respectively. Hi is the Henry coefficient and q∞
i the saturation
capacity [50, 63]. These two parameters are strong function of the ionic strength in
ion-exchange. Here, the following dependencies are assumed:
Hi = αiI−βi
m (2.11)
q∞i = γi − δiIm (2.12)
The parameters αi,βi, γi and δi are constants. The expression for the Henry coeffi-
cient (Equation 2.11) can be theoretically justified from the mass action law imposing
electroneutrality and very diluted conditions [70]. The use of a ionic strength depen-
dent saturation capacity, instead, has no theoretical justification and is used here to
account for the changes in saturation capacity observed by many authors for different
ionic strengths values [35, 40, 107, 108, 109, 110]. The values of αi and βi can be de-
termined from isocratic experiments at different ionic strengths or from linear gradient
elution experiments applying the method of Yamamoto [111]. For many proteins the
isocratic experiments are very difficult to apply due to the very strong dependence of
the Henry constant from the ionic strength. The method of Yamamoto is therefore
very often used. For the determination of γi and δi, the saturation capacities of the
two pure components have to be determined as a function of the salt concentration.
This is done by frontal analysis of the pure components.
Yamamoto method
Yamamoto and co-workers [106, 111] presented a simple graphical method for the de-
termination of the peak elution time under linear gradient elution chromatography. As-
20 2. Experimental Characterization of the Adsorption
suming a power dependence between the distribution coefficient and the ionic strength,
the parameters αi and βi can be graphically determined by running LGE experiments
with different gradient steepnesses [106]. This procedure becomes particularly simple
if it is assumed that the solute Henry coefficient is tending to that of the salt for large
salt concentrations. In this case, if the logarithm of the conductivity at the peak max-
imum and the normalized gradient slope are plotted together, the two parameters can
be determined from the the slope and the intercept of the line regressing the experi-
mental data [70]. The logarithm of the gradient slope is related to the logarithm of the
conductivity by the following equation:
log(GH) = log
(
I(β+1)R
α(β + 1)
)
(2.13)
GH is the gradient slope normalized with respect to the column stationary phase vol-
ume: GH = g(Vt − V0), g the gradient slope in concentration/volume, Vt the total
column volume and V0 the column void volume; IR is the conductivity at the peak
maximum. According to Yamamoto, the parameter β can be related to the number of
charges involved in the adsorption and α to the ion exchanger capacity. The function
relating the Henry constant to the ionic strength can then be calculated from:
Hi = αiI−βi
m + Hs (2.14)
Hs is the Henry constant of salt. This parameter is usually much smaller than the
Henry constant of the protein and is therefore neglected in the following.
Equilibrium capacity
The equilibrium capacity of a chromatographic resin can be measured by frontal anal-
ysis. The column is loaded with the mixture until a constant concentration of all
components is reached at the column outlet. The equilibrium capacity can then be
estimated in two ways: by integration of the breakthrough curve (BTC) [95] or by
eluting the adsorbed amount and determining the concentrations of each component.
In this work, the second approach is preferred. In fact, the elution concentration is
often slowly reaching a plateau, making it difficult to estimate the value of the signal
at complete breakthrough. Due to the long duration of the breakthrough experiments,
small mistakes in the estimation of the plateau-value can turn into large mistakes in the

2.4. Results and Discussion 21
evaluation of the equilibrium capacity. The elution fraction is collected and the con-
centration of the components determined. Knowing the volume of the elution fraction,
the masses of all the components, adsorbed on the column (mads,i) can be calculated.
The equilibrium capacity of component i can then be calculated as:
qeqi =
mads,i − (cf,iVcεi + cf,iVd)
Vc(1 − εtot). (2.15)
The term (cf,iVcεi + cf,iVd) represents the amount of component i present in the liquid
phase in the column and in the apparatus respectively.
In the case of a multi-component isotherm, the equilibrium capacities are function of
the ionic strength and of the concentrations of all components present in the mixture.
In general, the saturation capacity of each component has to be determined. In our
case, it is not practical to fractionate the polyclonal mixture and measure the single
saturation capacities independently. Since the clones are very similar to each other, it
is reasonable to assume that they have the same saturation capacity.
2.4 Results and Discussion
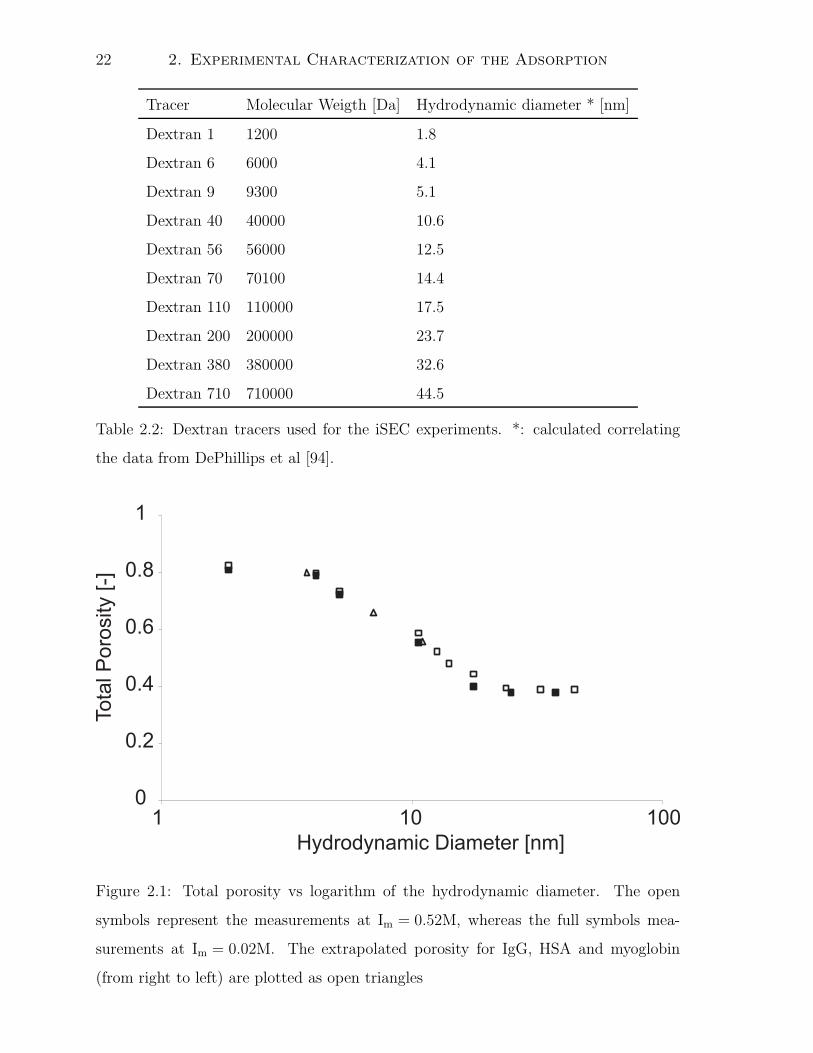
2.4.1 Column characterization
The pore size distribution of the column plays a determinant role in defining the column
behavior and performance. In fact, it is determining the pore accessibility of the solute
and, in turn, both the effective diffusion rate and the surface available for adsorption.
The pore size distribution of the material was measured by inverse size exclusion chro-
matography, using dextrans standards at two different ionic strengths. This is shown
in Figure 2.1, where the total porosity of the tracers is plotted versus the logarithm
of the corresponding hydrodynamic radius. Tracers characteristics are summarized in
Table 2.2. All measurements were performed under non adsorption conditions using a
50mM phosphate buffer, pH=7 and at two salt concentrations. From Figure 2.1 the
bed porosity and the column total porosity, corresponding to the two asymptotes of
the S-curve, can be observed (0.39 and 0.83, respectively, at Im = 0.52 M). The total
porosity for IgG, HSA and myoglobin has been extrapolated from the iSEC curve at
Im = 0.52M: 0.56, 0.66 and 0.80, respectively. The following diameters were assumed:
22 2. Experimental Characterization of the Adsorption
Tracer Molecular Weigth [Da] Hydrodynamic diameter * [nm]
Dextran 1 1200 1.8
Dextran 6 6000 4.1
Dextran 9 9300 5.1
Dextran 40 40000 10.6
Dextran 56 56000 12.5
Dextran 70 70100 14.4
Dextran 110 110000 17.5
Dextran 200 200000 23.7
Dextran 380 380000 32.6
Dextran 710 710000 44.5
Table 2.2: Dextran tracers used for the iSEC experiments. *: calculated correlating
the data from DePhillips et al [94].
Figure 2.1: Total porosity vs logarithm of the hydrodynamic diameter. The open
symbols represent the measurements at Im = 0.52M, whereas the full symbols mea-
surements at Im = 0.02M. The extrapolated porosity for IgG, HSA and myoglobin
(from right to left) are plotted as open triangles
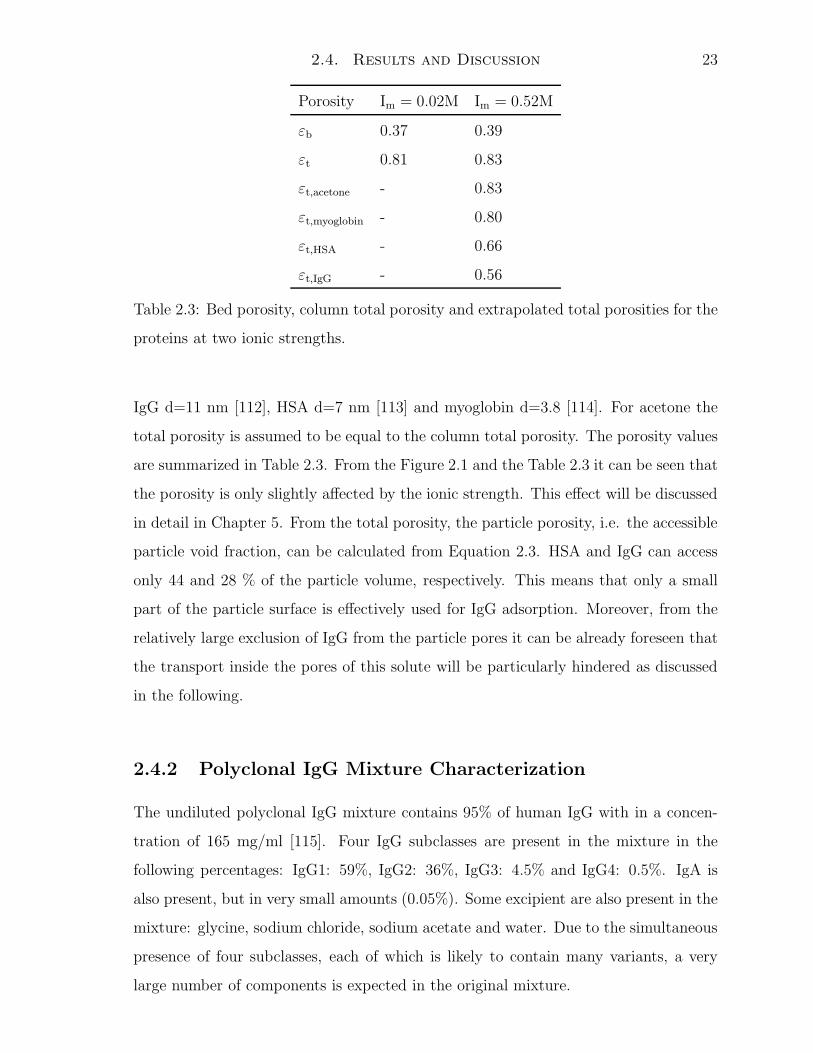
2.4. Results and Discussion 23
Porosity Im = 0.02M Im = 0.52M
εb 0.37 0.39
εt 0.81 0.83
εt,acetone - 0.83
εt,myoglobin - 0.80
εt,HSA - 0.66
εt,IgG - 0.56
Table 2.3: Bed porosity, column total porosity and extrapolated total porosities for the
proteins at two ionic strengths.
IgG d=11 nm [112], HSA d=7 nm [113] and myoglobin d=3.8 [114]. For acetone the
total porosity is assumed to be equal to the column total porosity. The porosity values
are summarized in Table 2.3. From the Figure 2.1 and the Table 2.3 it can be seen that
the porosity is only slightly affected by the ionic strength. This effect will be discussed
in detail in Chapter 5. From the total porosity, the particle porosity, i.e. the accessible
particle void fraction, can be calculated from Equation 2.3. HSA and IgG can access
only 44 and 28 % of the particle volume, respectively. This means that only a small
part of the particle surface is effectively used for IgG adsorption. Moreover, from the
relatively large exclusion of IgG from the particle pores it can be already foreseen that
the transport inside the pores of this solute will be particularly hindered as discussed
in the following.
2.4.2 Polyclonal IgG Mixture Characterization
The undiluted polyclonal IgG mixture contains 95% of human IgG with in a concen-
tration of 165 mg/ml [115]. Four IgG subclasses are present in the mixture in the
following percentages: IgG1: 59%, IgG2: 36%, IgG3: 4.5% and IgG4: 0.5%. IgA is
also present, but in very small amounts (0.05%). Some excipient are also present in the
mixture: glycine, sodium chloride, sodium acetate and water. Due to the simultaneous
presence of four subclasses, each of which is likely to contain many variants, a very
large number of components is expected in the original mixture.
24 2. Experimental Characterization of the Adsorption
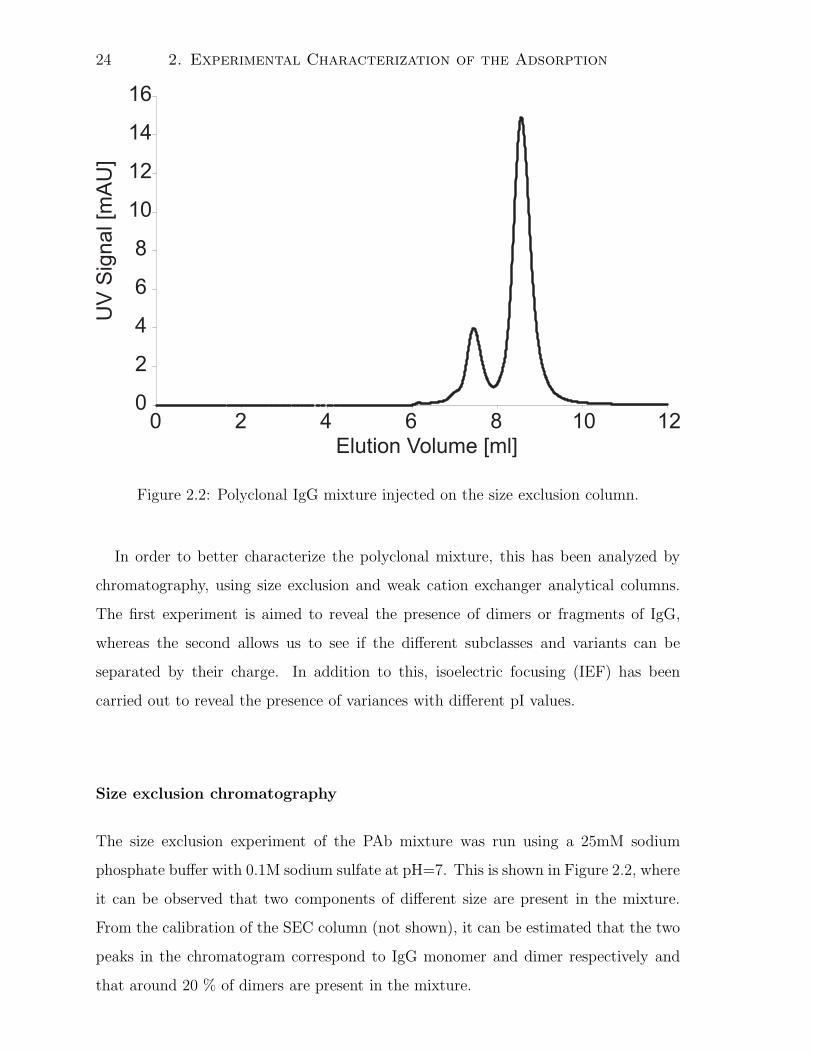
Figure 2.2: Polyclonal IgG mixture injected on the size exclusion column.
In order to better characterize the polyclonal mixture, this has been analyzed by
chromatography, using size exclusion and weak cation exchanger analytical columns.
The first experiment is aimed to reveal the presence of dimers or fragments of IgG,
whereas the second allows us to see if the different subclasses and variants can be
separated by their charge. In addition to this, isoelectric focusing (IEF) has been
carried out to reveal the presence of variances with different pI values.
Size exclusion chromatography
The size exclusion experiment of the PAb mixture was run using a 25mM sodium
phosphate buffer with 0.1M sodium sulfate at pH=7. This is shown in Figure 2.2, where
it can be observed that two components of different size are present in the mixture.
From the calibration of the SEC column (not shown), it can be estimated that the two
peaks in the chromatogram correspond to IgG monomer and dimer respectively and
that around 20 % of dimers are present in the mixture.

2.4. Results and Discussion 25
Figure 2.3: Isoelectric focusing of the polyclonal mixture. Lane 1: pI marker (IEF
Calibration Kit Board pI 3-10), Lane 2: polyclonal mixture.
Isoelectric focusing
The PAb mixture has been analyzed by IEF in order to analyze the pI of the different
components of the mixture. This is shown in Figure 2.3. It can be observed that Gam-
manorm is comprising of a continuous range of components whose pI value is ranging
in between about 6.5 and 10. As discussed by Melter et al. [116], who has studied
the separation of three monoclonal antibody variances on both analytical and prepar-
ative columns, cation exchange resins can provide an outstanding resolution power
in the presence of even smaller pI differences. Therefore, it is expected that the use
of ion-exchange chromatography can be very effective in separating the Gammanorm
variances.
Analytical cation exchanger column
The analytical cation exchanger analysis aims to differentiate between molecules with
different charge. The column used is described in the Experimental part. The mixture
was eluted with a linear gradient, where the ionic strength was changed from 0.07M to
0.52M in 40min (25 CV). Fractions have been taken every minute, reinjected and eluted
with the same protocol. Note that different injections volumes have been tested in order
26 2. Experimental Characterization of the Adsorption
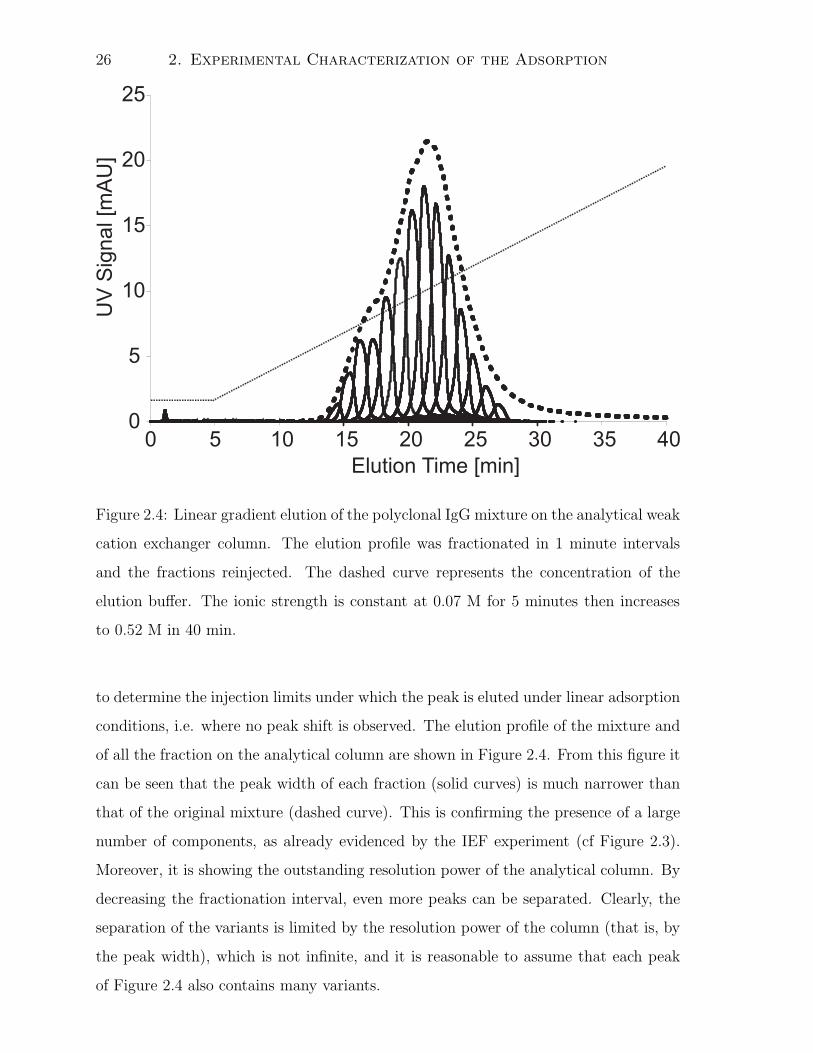
Figure 2.4: Linear gradient elution of the polyclonal IgG mixture on the analytical weak
cation exchanger column. The elution profile was fractionated in 1 minute intervals
and the fractions reinjected. The dashed curve represents the concentration of the
elution buffer. The ionic strength is constant at 0.07 M for 5 minutes then increases
to 0.52 M in 40 min.
to determine the injection limits under which the peak is eluted under linear adsorption
conditions, i.e. where no peak shift is observed. The elution profile of the mixture and
of all the fraction on the analytical column are shown in Figure 2.4. From this figure it
can be seen that the peak width of each fraction (solid curves) is much narrower than
that of the original mixture (dashed curve). This is confirming the presence of a large
number of components, as already evidenced by the IEF experiment (cf Figure 2.3).
Moreover, it is showing the outstanding resolution power of the analytical column. By
decreasing the fractionation interval, even more peaks can be separated. Clearly, the
separation of the variants is limited by the resolution power of the column (that is, by
the peak width), which is not infinite, and it is reasonable to assume that each peak
of Figure 2.4 also contains many variants.
2.4. Results and Discussion 27
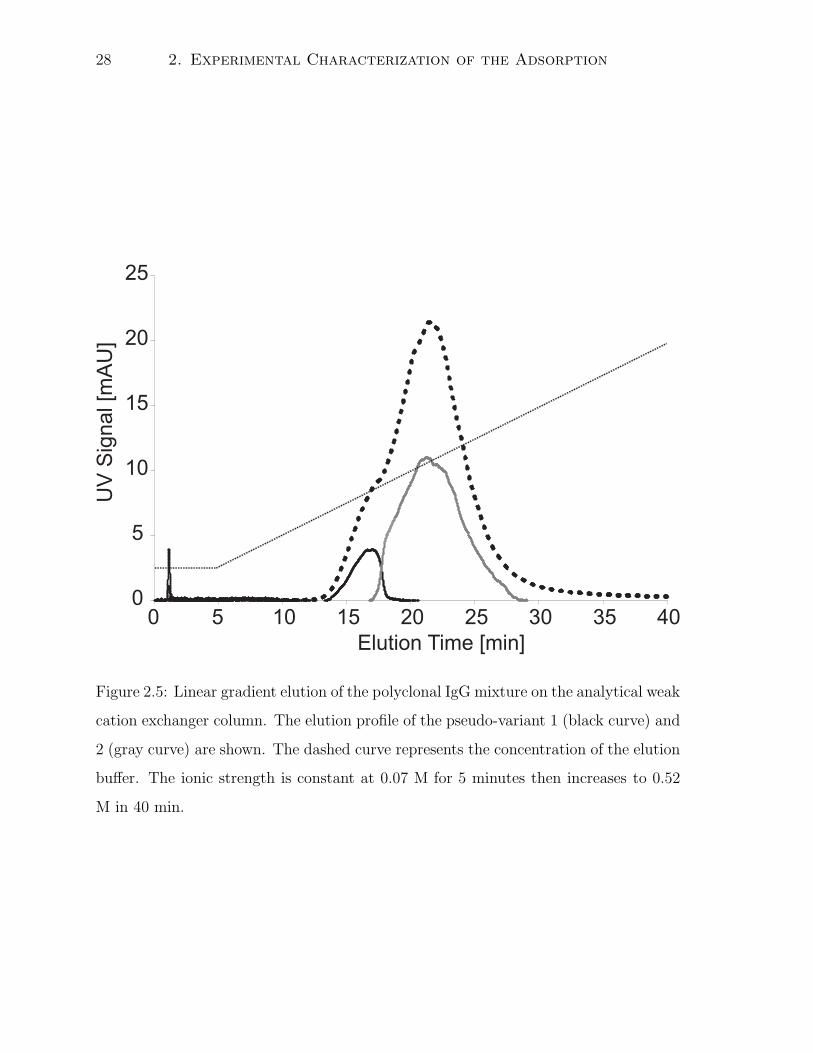
Even if the complexity of the original mixture is reduced to a limited number of
pseudo-variants (i. e. a collection of IgG variants that, due to the similarity in behavior,
can be assimilated to a single homogeneous component) as shown in Figure 2.4, the
analytical burden remains considerable. However, looking at the shape of the main peak
of Figure 2.4, it is possible to observe a shoulder in the peak front. This allows us to
suppose that the overall mixture is made of two main pseudo-variants, corresponding
to the shoulder and to the main peak, respectively, which in the following will be
considered single components. In order to verify this possibility, fractions 1 to 4 were
merged together producing the first pseudo-variant, whereas fractions 5 to 14 were
merged producing the second pseudo-variant. In Figure 2.5, the outlet concentration
profile on the analytical column corresponding to the polyclonal mixture and the two
pseudo-variants is shown. The merged fractions correspond with a good approximation
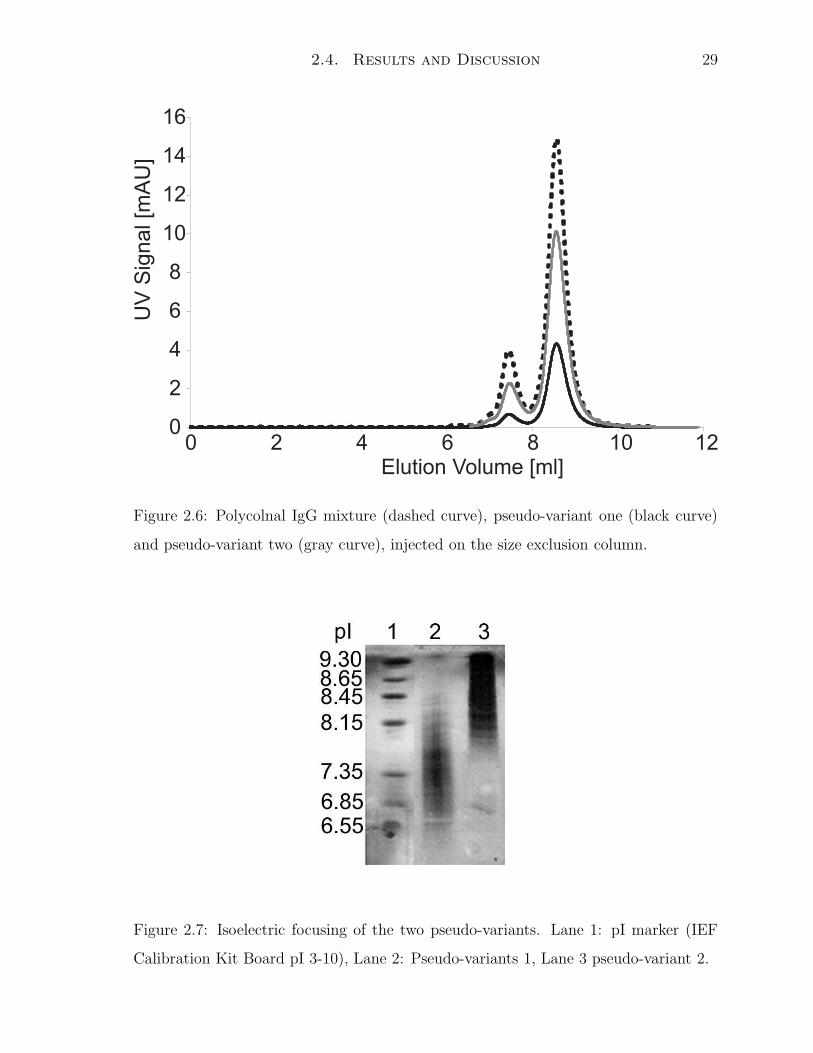
with the shoulder and the main peak of the polyclonal mixture, respectively. Figure 2.6
shows the size exclusion chromatogram of the two pseudo-variants. As it can be seen,
both pseudo-variants contain both monomers and dimers. This demonstrates that the
pseudo-variants are not corresponding to dimer and monomer. On the other hand,
it can be observed in Figure 2.7, where the IEF of the two pseudo-variants is shown,
that the two pseudo-variants are instead characterized by clearly pI ranges (see lanes
2 and 3), thus explaining the different elution time on the IEX column. For the
characterization of the elution profiles on the strong cation exchanger column used
in this work, an analytical procedure, allowing us to simply resolve the two pseudo-
variants is needed. From the Figure 2.5 it can be seen that the first pseudo-variant
elutes after about 17 min. This elution time corresponds to an ionic strength in the
outlet of 0.18 M. The second pseudo-variant elutes at higher ionic strength. In order
to separate the two pseudo-variants the following elution protocol is then used: an
isocratic phase at an ionic strength of 0.18 M lasting for 4 min (2 CV) is followed by
a gradient going from 0.18 M to 0.82 M in 9 min (5 CV). The corresponding elution
profiles are shown in Figure 2.8. As it can be seen from Figure 2.8, the two pseudo-
variants can be resolved by the proposed elution protocol. The second pseudo-variant
(gray curve) elutes almost completely (more that 90 %) during the gradient, whereas
the first variant (black curve) instead elutes mostly (more than 80 %) during the
28 2. Experimental Characterization of the Adsorption
Figure 2.5: Linear gradient elution of the polyclonal IgG mixture on the analytical weak
cation exchanger column. The elution profile of the pseudo-variant 1 (black curve) and
2 (gray curve) are shown. The dashed curve represents the concentration of the elution
buffer. The ionic strength is constant at 0.07 M for 5 minutes then increases to 0.52
M in 40 min.
2.4. Results and Discussion 29
Figure 2.6: Polycolnal IgG mixture (dashed curve), pseudo-variant one (black curve)
and pseudo-variant two (gray curve), injected on the size exclusion column.
Figure 2.7: Isoelectric focusing of the two pseudo-variants. Lane 1: pI marker (IEF
Calibration Kit Board pI 3-10), Lane 2: Pseudo-variants 1, Lane 3 pseudo-variant 2.

30 2. Experimental Characterization of the Adsorption
Figure 2.8: Analytical elution protocol applied to the polyclonal IgG mixture (dashed
curve) as well as to the pseudo-variant one (black curve) and two (gray curve). The
line represents the concentration of the elution buffer. The ionic strength is constant
at 0.18 M for 4 minutes then increases to 0.82 M in 9 min.
2.4. Results and Discussion 31
isocratic phase.
The proposed analytical method is therefore able to fractionate the original mixture
in two macro pseudo-variants with reasonable precision, small analytical effort and
time consumption. The elution profile of polyclonal mixture is also shown in Figure 2.8
(dashed curve). According to this analytical tool the mixture contains 23 % of pseudo-
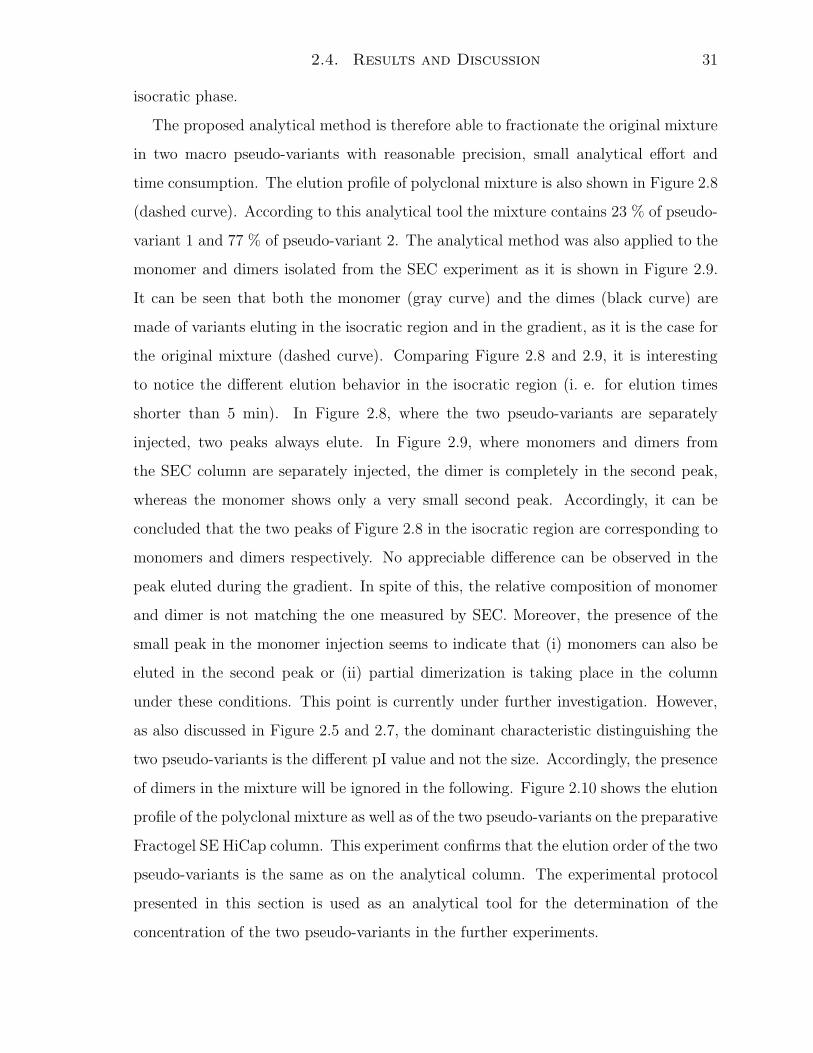
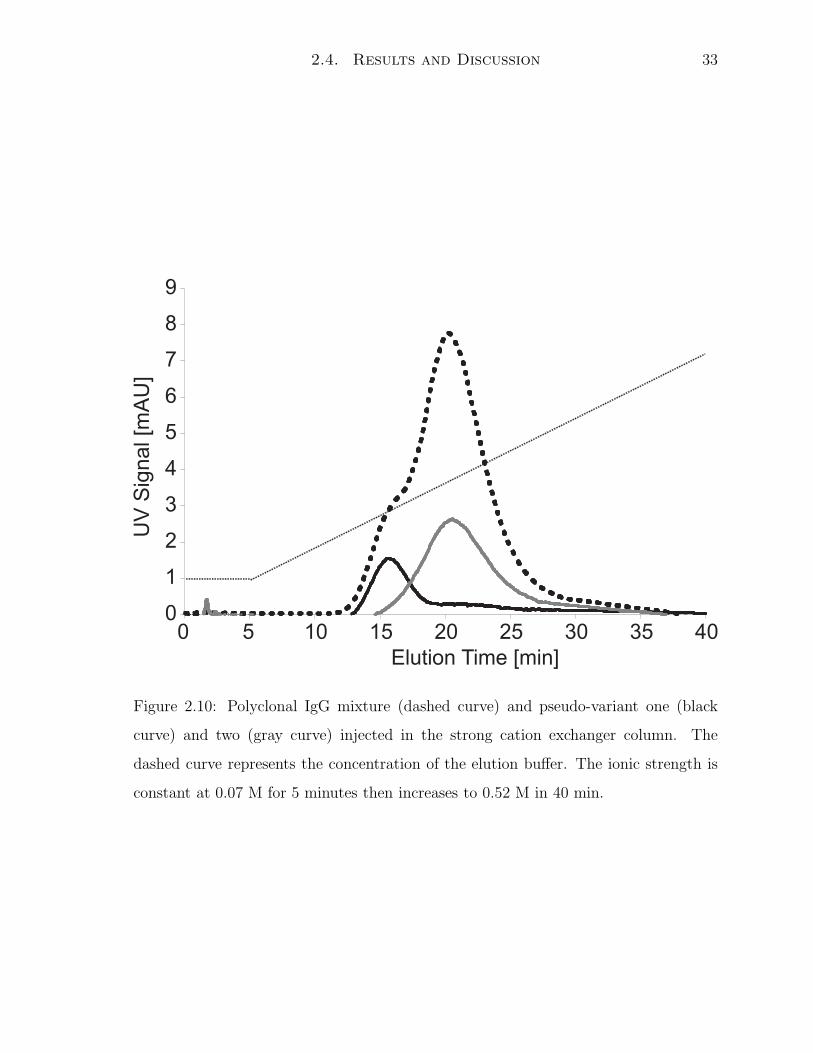
variant 1 and 77 % of pseudo-variant 2. The analytical method was also applied to the
monomer and dimers isolated from the SEC experiment as it is shown in Figure 2.9.
It can be seen that both the monomer (gray curve) and the dimes (black curve) are
made of variants eluting in the isocratic region and in the gradient, as it is the case for
the original mixture (dashed curve). Comparing Figure 2.8 and 2.9, it is interesting
to notice the different elution behavior in the isocratic region (i. e. for elution times
shorter than 5 min). In Figure 2.8, where the two pseudo-variants are separately
injected, two peaks always elute. In Figure 2.9, where monomers and dimers from
the SEC column are separately injected, the dimer is completely in the second peak,
whereas the monomer shows only a very small second peak. Accordingly, it can be
concluded that the two peaks of Figure 2.8 in the isocratic region are corresponding to
monomers and dimers respectively. No appreciable difference can be observed in the
peak eluted during the gradient. In spite of this, the relative composition of monomer
and dimer is not matching the one measured by SEC. Moreover, the presence of the
small peak in the monomer injection seems to indicate that (i) monomers can also be
eluted in the second peak or (ii) partial dimerization is taking place in the column
under these conditions. This point is currently under further investigation. However,
as also discussed in Figure 2.5 and 2.7, the dominant characteristic distinguishing the
two pseudo-variants is the different pI value and not the size. Accordingly, the presence
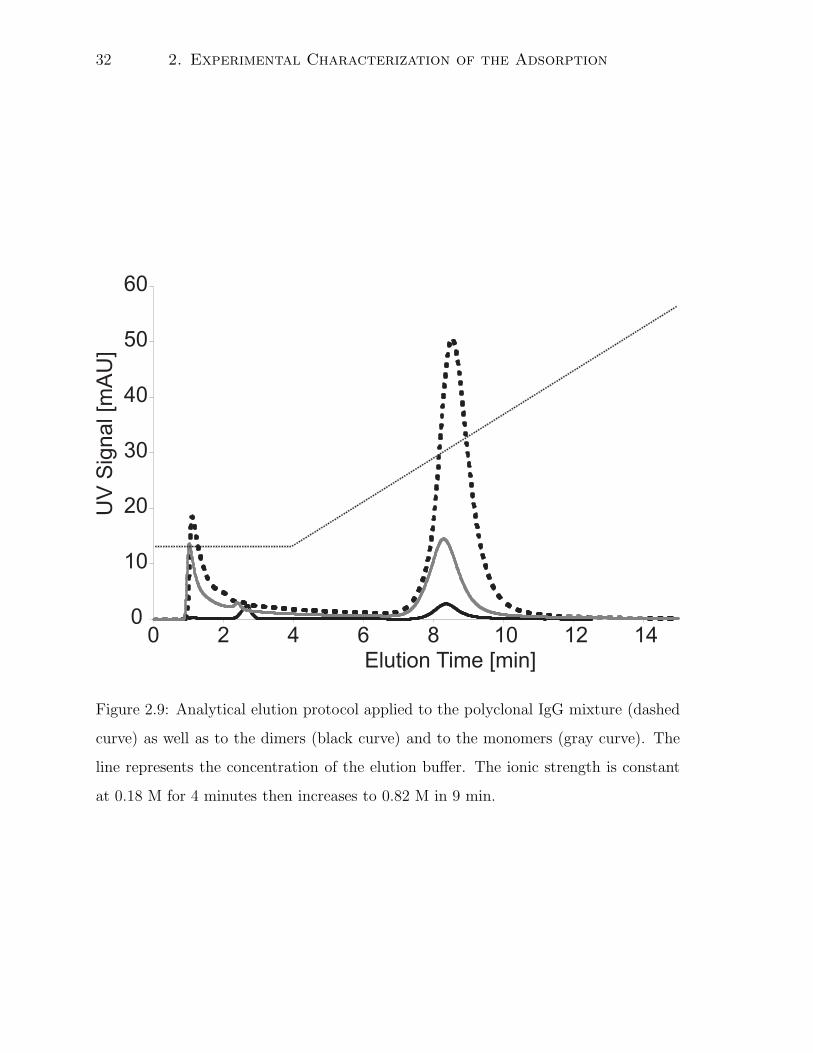
of dimers in the mixture will be ignored in the following. Figure 2.10 shows the elution
profile of the polyclonal mixture as well as of the two pseudo-variants on the preparative
Fractogel SE HiCap column. This experiment confirms that the elution order of the two
pseudo-variants is the same as on the analytical column. The experimental protocol
presented in this section is used as an analytical tool for the determination of the
concentration of the two pseudo-variants in the further experiments.
32 2. Experimental Characterization of the Adsorption
Figure 2.9: Analytical elution protocol applied to the polyclonal IgG mixture (dashed
curve) as well as to the dimers (black curve) and to the monomers (gray curve). The
line represents the concentration of the elution buffer. The ionic strength is constant
at 0.18 M for 4 minutes then increases to 0.82 M in 9 min.
2.4. Results and Discussion 33
Figure 2.10: Polyclonal IgG mixture (dashed curve) and pseudo-variant one (black
curve) and two (gray curve) injected in the strong cation exchanger column. The
dashed curve represents the concentration of the elution buffer. The ionic strength is
constant at 0.07 M for 5 minutes then increases to 0.52 M in 40 min.
34 2. Experimental Characterization of the Adsorption
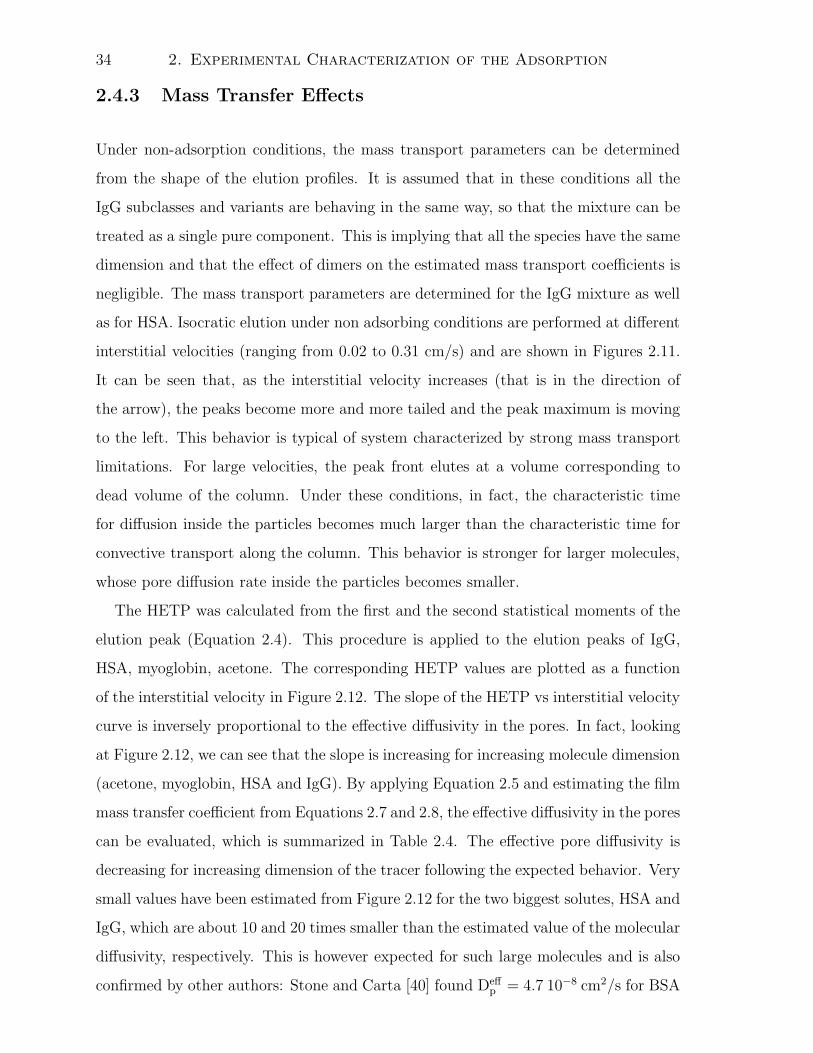
2.4.3 Mass Transfer Effects
Under non-adsorption conditions, the mass transport parameters can be determined
from the shape of the elution profiles. It is assumed that in these conditions all the
IgG subclasses and variants are behaving in the same way, so that the mixture can be
treated as a single pure component. This is implying that all the species have the same
dimension and that the effect of dimers on the estimated mass transport coefficients is
negligible. The mass transport parameters are determined for the IgG mixture as well
as for HSA. Isocratic elution under non adsorbing conditions are performed at different
interstitial velocities (ranging from 0.02 to 0.31 cm/s) and are shown in Figures 2.11.
It can be seen that, as the interstitial velocity increases (that is in the direction of
the arrow), the peaks become more and more tailed and the peak maximum is moving
to the left. This behavior is typical of system characterized by strong mass transport
limitations. For large velocities, the peak front elutes at a volume corresponding to
dead volume of the column. Under these conditions, in fact, the characteristic time
for diffusion inside the particles becomes much larger than the characteristic time for
convective transport along the column. This behavior is stronger for larger molecules,
whose pore diffusion rate inside the particles becomes smaller.
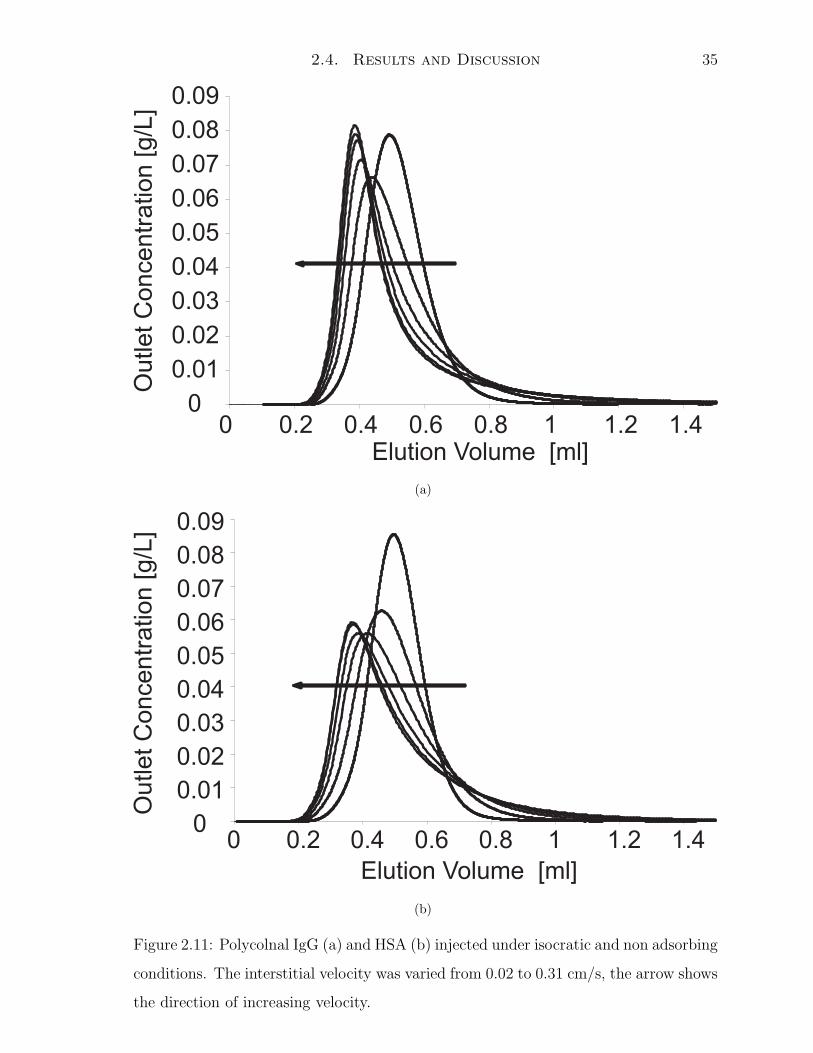
The HETP was calculated from the first and the second statistical moments of the
elution peak (Equation 2.4). This procedure is applied to the elution peaks of IgG,
HSA, myoglobin, acetone. The corresponding HETP values are plotted as a function
of the interstitial velocity in Figure 2.12. The slope of the HETP vs interstitial velocity
curve is inversely proportional to the effective diffusivity in the pores. In fact, looking
at Figure 2.12, we can see that the slope is increasing for increasing molecule dimension
(acetone, myoglobin, HSA and IgG). By applying Equation 2.5 and estimating the film
mass transfer coefficient from Equations 2.7 and 2.8, the effective diffusivity in the pores
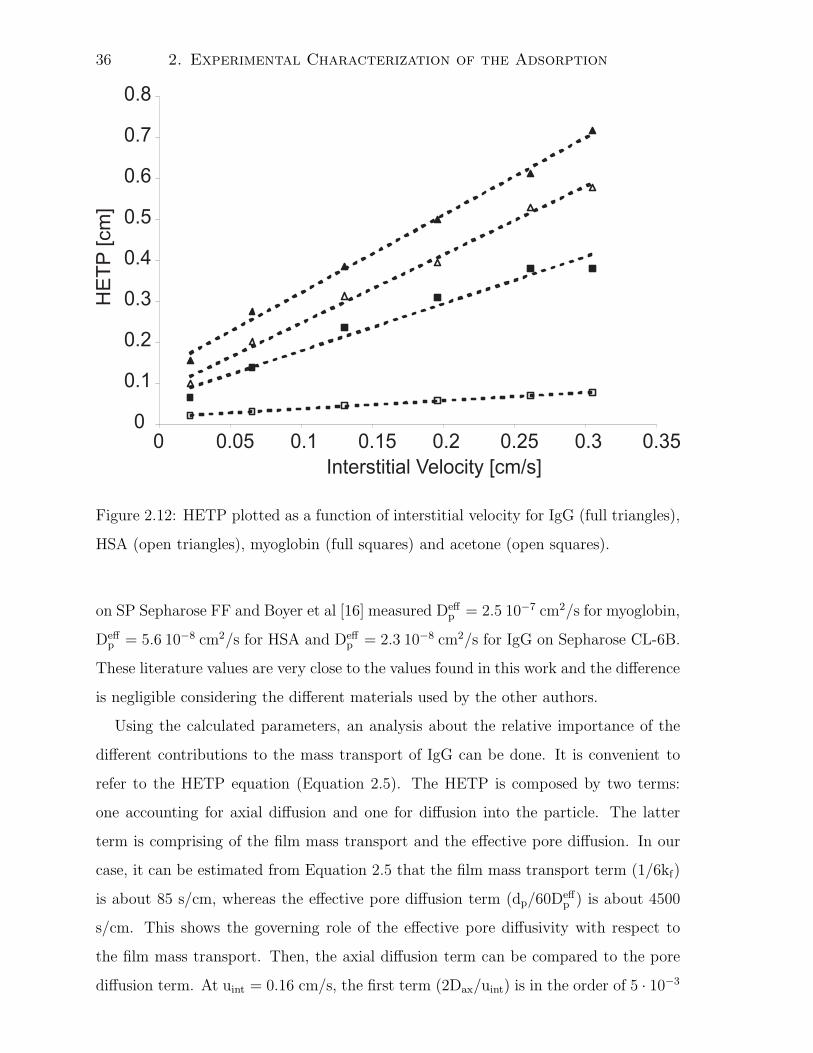
can be evaluated, which is summarized in Table 2.4. The effective pore diffusivity is
decreasing for increasing dimension of the tracer following the expected behavior. Very
small values have been estimated from Figure 2.12 for the two biggest solutes, HSA and
IgG, which are about 10 and 20 times smaller than the estimated value of the molecular
diffusivity, respectively. This is however expected for such large molecules and is also
confirmed by other authors: Stone and Carta [40] found Deffp = 4.7 10−8 cm2/s for BSA
2.4. Results and Discussion 35
(a)
(b)
Figure 2.11: Polycolnal IgG (a) and HSA (b) injected under isocratic and non adsorbing
conditions. The interstitial velocity was varied from 0.02 to 0.31 cm/s, the arrow shows
the direction of increasing velocity.
36 2. Experimental Characterization of the Adsorption
Figure 2.12: HETP plotted as a function of interstitial velocity for IgG (full triangles),
HSA (open triangles), myoglobin (full squares) and acetone (open squares).
on SP Sepharose FF and Boyer et al [16] measured Deffp = 2.5 10−7 cm2/s for myoglobin,
Deffp = 5.6 10−8 cm2/s for HSA and Deff
p = 2.3 10−8 cm2/s for IgG on Sepharose CL-6B.
These literature values are very close to the values found in this work and the difference
is negligible considering the different materials used by the other authors.
Using the calculated parameters, an analysis about the relative importance of the
different contributions to the mass transport of IgG can be done. It is convenient to
refer to the HETP equation (Equation 2.5). The HETP is composed by two terms:
one accounting for axial diffusion and one for diffusion into the particle. The latter
term is comprising of the film mass transport and the effective pore diffusion. In our
case, it can be estimated from Equation 2.5 that the film mass transport term (1/6kf)
is about 85 s/cm, whereas the effective pore diffusion term (dp/60Deffp ) is about 4500
s/cm. This shows the governing role of the effective pore diffusivity with respect to
the film mass transport. Then, the axial diffusion term can be compared to the pore
diffusion term. At uint = 0.16 cm/s, the first term (2Dax/uint) is in the order of 5 · 10−3
2.4. Results and Discussion 37
Molecule Dm [cm2/s] kf∗ [cm/s] Deffp [cm2/s]
Acetone 5.99 10−6 1.09 10−2 1.09 10−6
Myoglobine 9.07 10−7 3.10 10−3 1.60 10−7
HSA 6.02 10−7 2.36 10−3 5.69 10−8
IgG 4.50 10−7 1.95 10−3 2.31 10−8
Table 2.4: Molecular diffusivity, film mass transfer coefficient and pore diffusivity cal-
culated for the four molecules investigated. *: calculated at uint = 0.16 cm/s.
cm, whereas the second about 5 · 10−1 cm. The term accounting for the axial diffusion
is therefore negligible, thus confirming that HETP is dominated by pore diffusion and,
thus, proportional to the interstitial velocity, as discussed in the Methods section.
An interesting result is found plotting the effective pore diffusivity as a function of
the molecular diffusivity multiplied by the particle porosity. As it can be seen from
Figure 2.13, the experimental points fall on a straight line. Comparing this result with
the expression of Equation 2.9, it can be inferred that the term Kp/τ is constant. For
molecules with increasing diameter, the hindrance is expected to increase and, thus,
the term Kp to decrease. Accordingly, also the tortuosity must decrease with increasing
molecular size. It can be speculated that this effect is due to strong pore exclusion
measured for large molecules, i.e. by the fact that larger molecules cannot access all
the smallest pores and, therefore, their path must be more ”regular”.
2.4.4 Isotherm Determination
As discussed above, the polyclonal mixture, can be approximated by a two-component
mixture. For the two components, the Henry constants as a function of the ionic
strength and the equilibrium capacities at three ionic strengths are measured in the
following.
Linear gradient elution experiments
Figure 2.14 shows injections of the original polyclonal mixture (solid curves) as well as
of the first pseudo-variant (dashed curve) on the strong cation exchanger column eluted
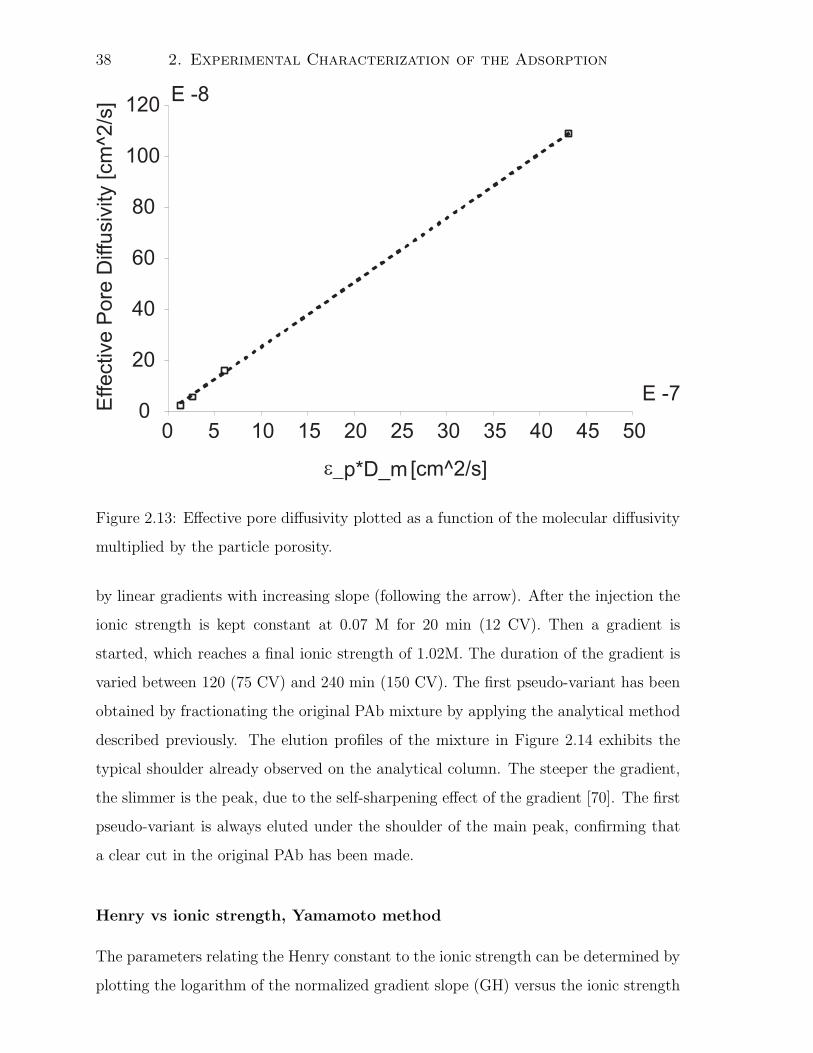
38 2. Experimental Characterization of the Adsorption
Figure 2.13: Effective pore diffusivity plotted as a function of the molecular diffusivity
multiplied by the particle porosity.
by linear gradients with increasing slope (following the arrow). After the injection the
ionic strength is kept constant at 0.07 M for 20 min (12 CV). Then a gradient is
started, which reaches a final ionic strength of 1.02M. The duration of the gradient is
varied between 120 (75 CV) and 240 min (150 CV). The first pseudo-variant has been
obtained by fractionating the original PAb mixture by applying the analytical method
described previously. The elution profiles of the mixture in Figure 2.14 exhibits the
typical shoulder already observed on the analytical column. The steeper the gradient,
the slimmer is the peak, due to the self-sharpening effect of the gradient [70]. The first
pseudo-variant is always eluted under the shoulder of the main peak, confirming that
a clear cut in the original PAb has been made.
Henry vs ionic strength, Yamamoto method
The parameters relating the Henry constant to the ionic strength can be determined by
plotting the logarithm of the normalized gradient slope (GH) versus the ionic strength
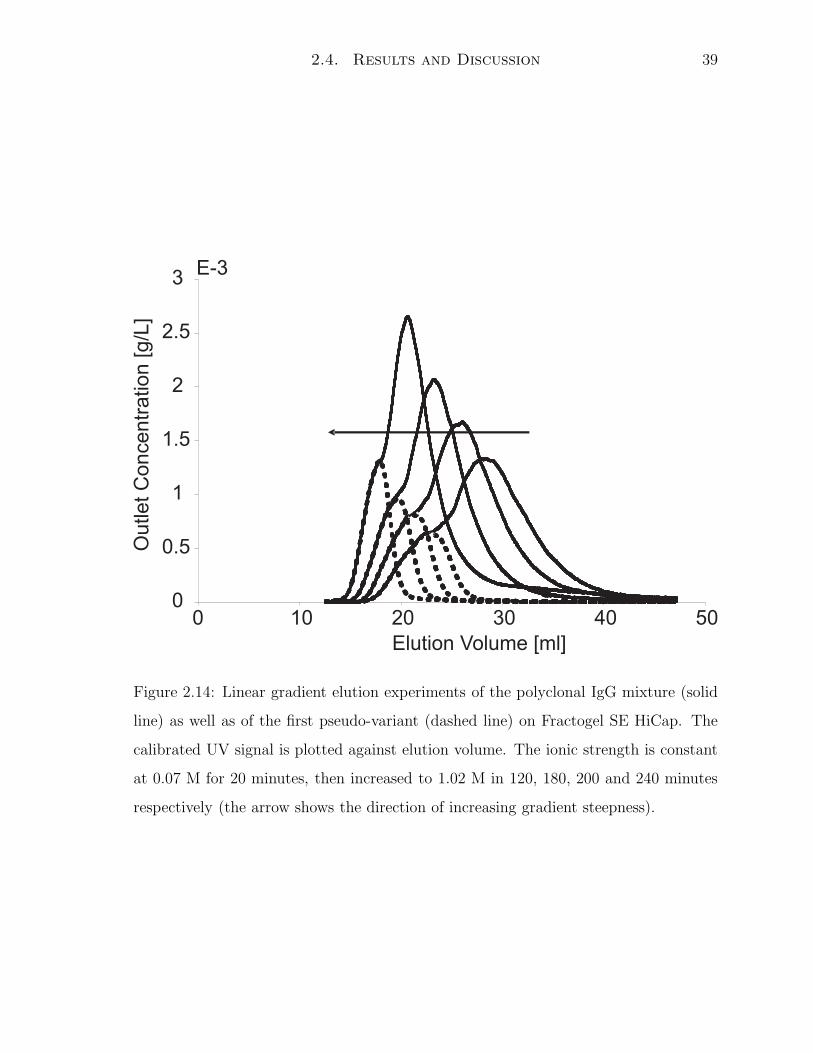
2.4. Results and Discussion 39
Figure 2.14: Linear gradient elution experiments of the polyclonal IgG mixture (solid
line) as well as of the first pseudo-variant (dashed line) on Fractogel SE HiCap. The
calibrated UV signal is plotted against elution volume. The ionic strength is constant
at 0.07 M for 20 minutes, then increased to 1.02 M in 120, 180, 200 and 240 minutes
respectively (the arrow shows the direction of increasing gradient steepness).

40 2. Experimental Characterization of the Adsorption
Figure 2.15: Logarithm of the normalized gradient slope (GH) versus the ionic strength
at the peak maximum (IR) for the two pseudo-variants. Pseudo-variant 1: open sym-
bols, Pseudo-variant 2: full symbols
at the peak maximum (IR). This is shown in Figure 2.15 for the two pseudo-variants
of Figure 2.14. The second pseudo-variant is assumed to have the same peak maxi-
mum as that of the mixture. From the expression of the straight line regressing the
experimental points, the parameters αi and βi can be determined (see Table 2.5). The
corresponding Henry coefficient as a function of the ionic strength can be calculated
applying Equation 2.14 and are shown in Figure 2.16 Two things must be noted from
this picture. First, the Henry coefficients of the two pseudo-variants are a strong func-
tion of the ionic strength of the eluent. For this reason, it is practically impossible
to carry out isocratic experiments in order to estimate the Henry coefficients. In fact,
small experimental errors in the eluent ionic strength would result in large errors in
the Henry coefficient and, thus, in the elution time. In addition to this, the Henry
coefficient becomes rapidly very large by decreasing the salt concentration and, there-
fore, the elution time becomes very soon very long. This effect, summed to the large
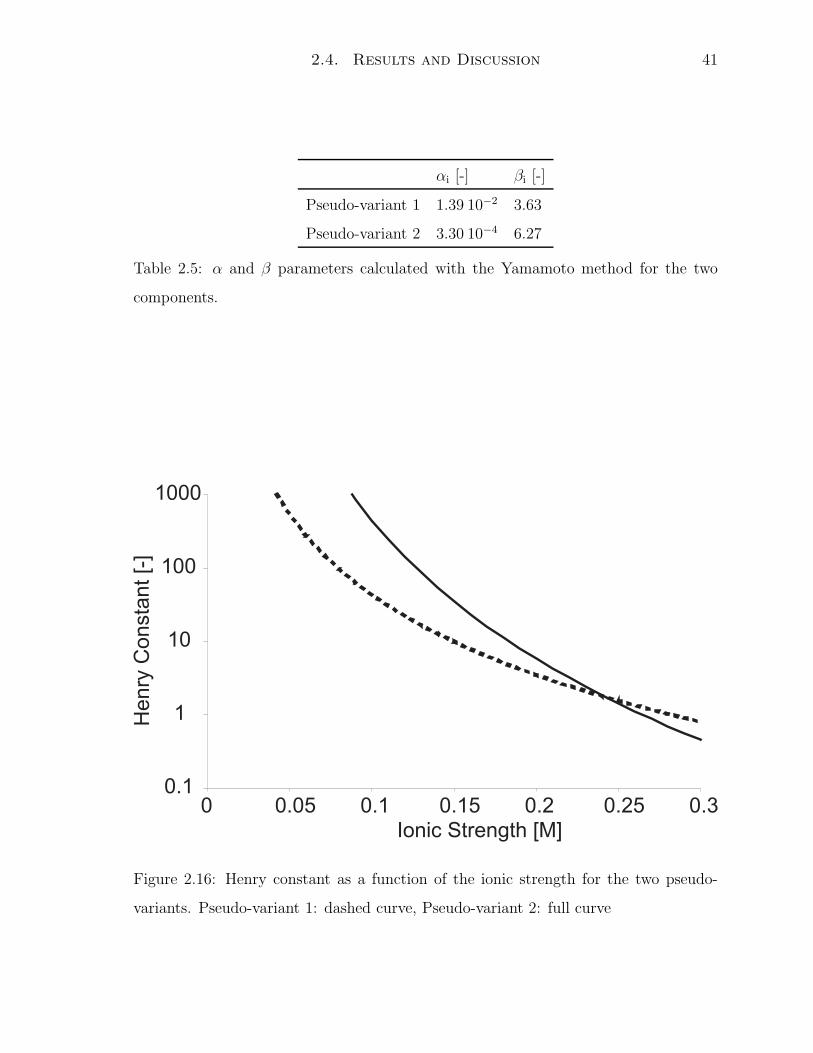
2.4. Results and Discussion 41
αi [-] βi [-]
Pseudo-variant 1 1.39 10−2 3.63
Pseudo-variant 2 3.30 10−4 6.27
Table 2.5: α and β parameters calculated with the Yamamoto method for the two
components.
Figure 2.16: Henry constant as a function of the ionic strength for the two pseudo-
variants. Pseudo-variant 1: dashed curve, Pseudo-variant 2: full curve
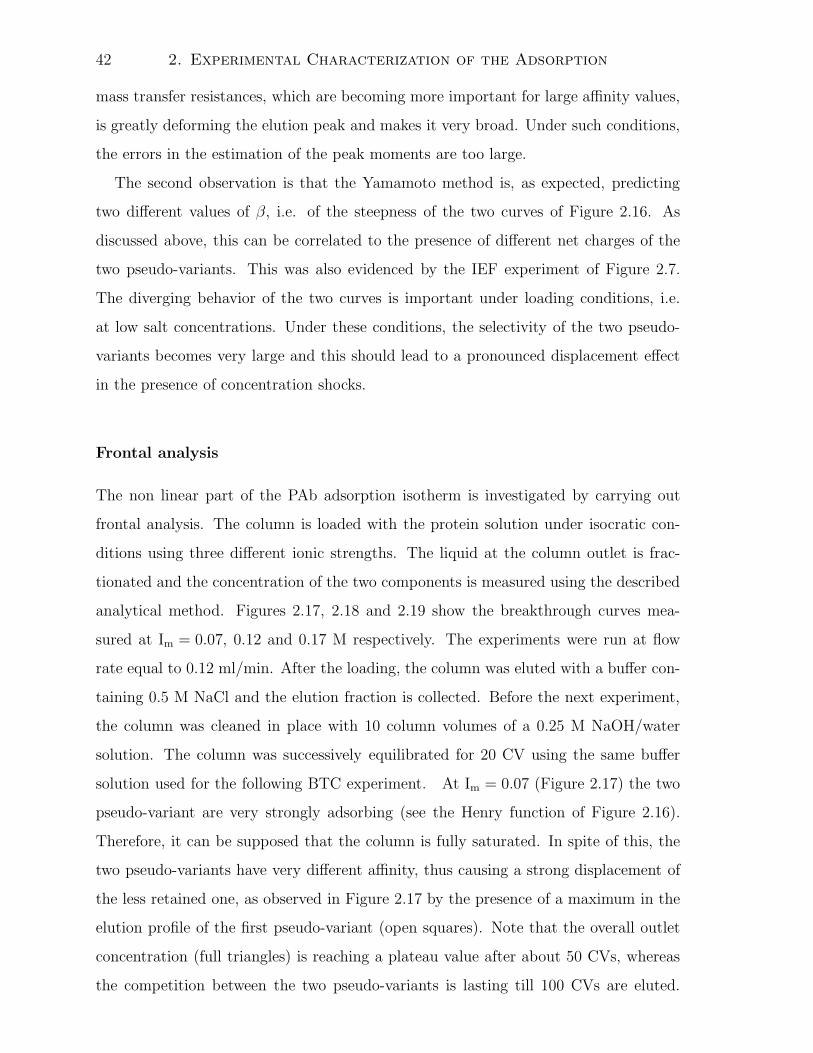
42 2. Experimental Characterization of the Adsorption
mass transfer resistances, which are becoming more important for large affinity values,
is greatly deforming the elution peak and makes it very broad. Under such conditions,
the errors in the estimation of the peak moments are too large.
The second observation is that the Yamamoto method is, as expected, predicting
two different values of β, i.e. of the steepness of the two curves of Figure 2.16. As
discussed above, this can be correlated to the presence of different net charges of the
two pseudo-variants. This was also evidenced by the IEF experiment of Figure 2.7.
The diverging behavior of the two curves is important under loading conditions, i.e.
at low salt concentrations. Under these conditions, the selectivity of the two pseudo-
variants becomes very large and this should lead to a pronounced displacement effect
in the presence of concentration shocks.
Frontal analysis
The non linear part of the PAb adsorption isotherm is investigated by carrying out
frontal analysis. The column is loaded with the protein solution under isocratic con-
ditions using three different ionic strengths. The liquid at the column outlet is frac-
tionated and the concentration of the two components is measured using the described
analytical method. Figures 2.17, 2.18 and 2.19 show the breakthrough curves mea-
sured at Im = 0.07, 0.12 and 0.17 M respectively. The experiments were run at flow
rate equal to 0.12 ml/min. After the loading, the column was eluted with a buffer con-
taining 0.5 M NaCl and the elution fraction is collected. Before the next experiment,
the column was cleaned in place with 10 column volumes of a 0.25 M NaOH/water
solution. The column was successively equilibrated for 20 CV using the same buffer
solution used for the following BTC experiment. At Im = 0.07 (Figure 2.17) the two
pseudo-variant are very strongly adsorbing (see the Henry function of Figure 2.16).
Therefore, it can be supposed that the column is fully saturated. In spite of this, the
two pseudo-variants have very different affinity, thus causing a strong displacement of
the less retained one, as observed in Figure 2.17 by the presence of a maximum in the
elution profile of the first pseudo-variant (open squares). Note that the overall outlet
concentration (full triangles) is reaching a plateau value after about 50 CVs, whereas
the competition between the two pseudo-variants is lasting till 100 CVs are eluted.
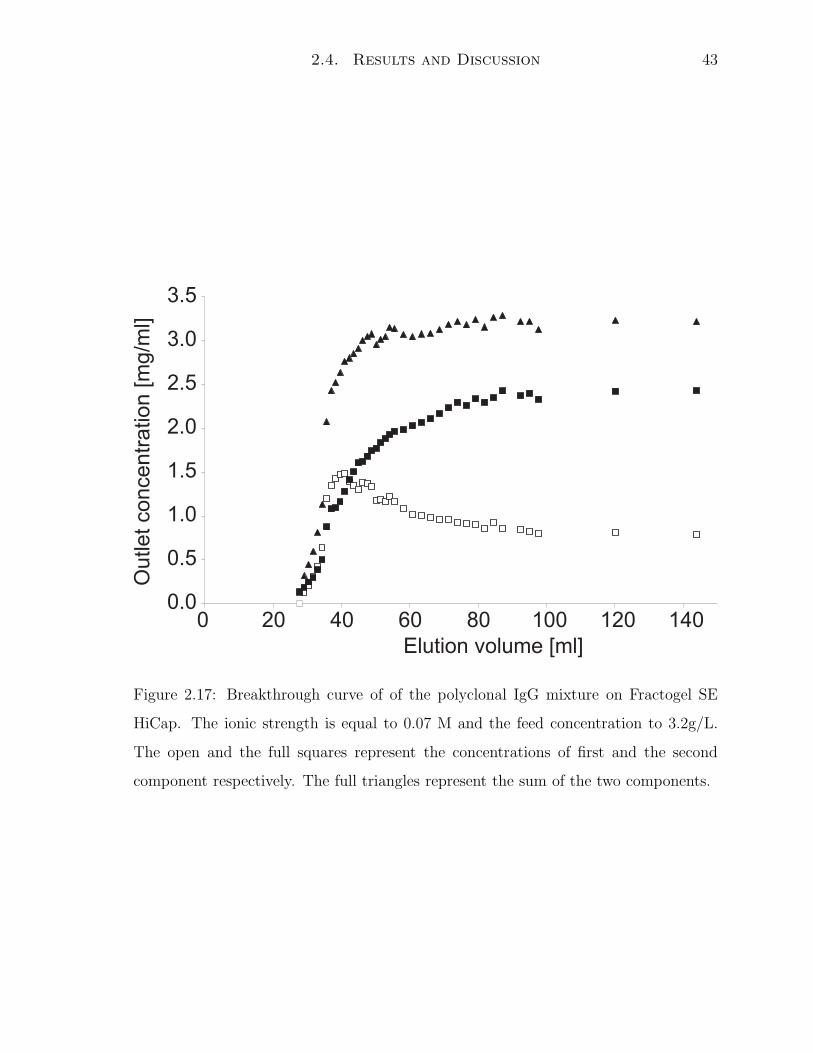
2.4. Results and Discussion 43
Figure 2.17: Breakthrough curve of of the polyclonal IgG mixture on Fractogel SE
HiCap. The ionic strength is equal to 0.07 M and the feed concentration to 3.2g/L.
The open and the full squares represent the concentrations of first and the second
component respectively. The full triangles represent the sum of the two components.

44 2. Experimental Characterization of the Adsorption
Figure 2.18: Breakthrough curve of of the polyclonal IgG mixture on Fractogel SE
HiCap. The ionic strength is equal to 0.12 M and the feed concentration to 3.3 g/L.
The open and the full squares represent the concentrations of first and the second
component respectively. The full triangles represent the sum of the two components.
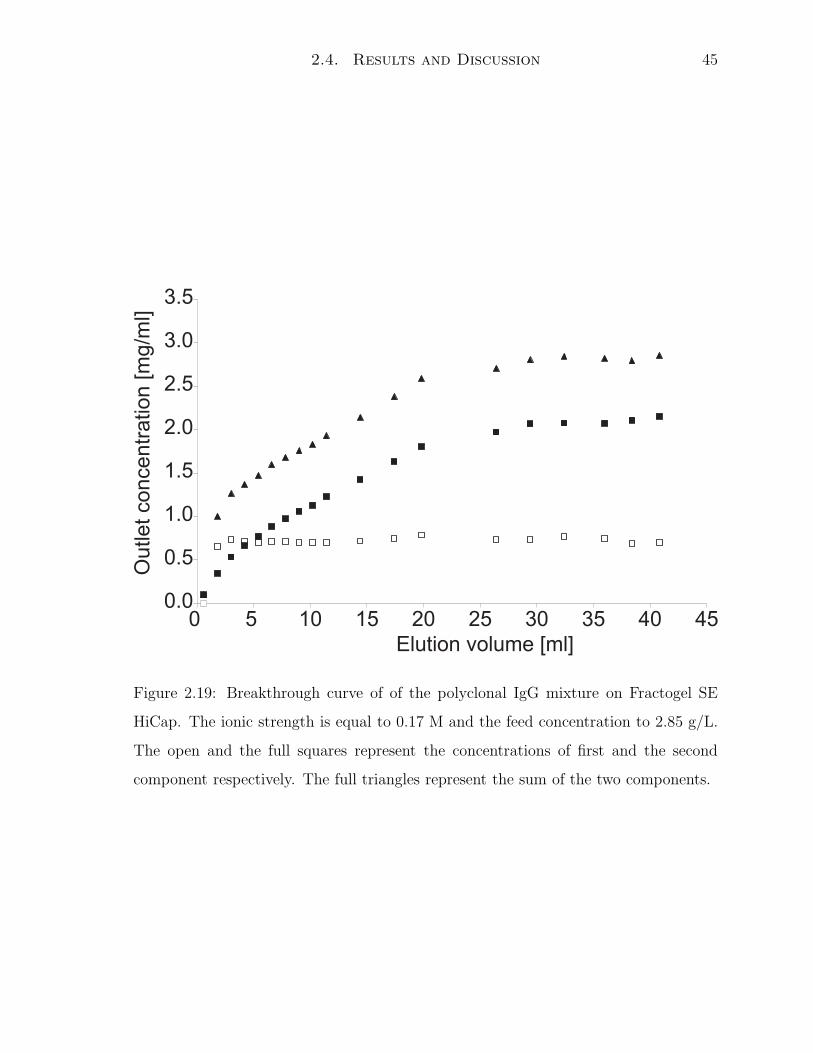
2.4. Results and Discussion 45
Figure 2.19: Breakthrough curve of of the polyclonal IgG mixture on Fractogel SE
HiCap. The ionic strength is equal to 0.17 M and the feed concentration to 2.85 g/L.
The open and the full squares represent the concentrations of first and the second
component respectively. The full triangles represent the sum of the two components.

46 2. Experimental Characterization of the Adsorption
At Im = 0.12 (Figure 2.18), the behavior of the mixture is more complex. Keeping in
mind that the mixture is made of a very large number of components and not only
two pseudo-variants, as exemplified in this work, it can be noted from Figure 2.16
that the first pseudo-variant has a relatively small Henry value, while the second one
a much larger one. As a result, the first pseudo-variant is breaking-through very early,
possibly also due to the competition of the second variant. When this is eluting, the
displacement of the first variant takes place, although this is less pronounced than in
Figure 2.17. At high ionic strength (Im = 0.17, Figure 2.19), the two components are
both adsorbing very weakly. Accordingly, they are immediately eluting and almost no
competition can be seen.
Equilibrium capacity vs. ionic strength
From the previous BTC experiments, it is possible to compute the equilibrium capacity
of the two pseudo-variants as a function of the ionic strength in the eluent. This has
been done by collecting the adsorbed antibody and by analyzing the relative quantities
of the two pseudo-variants as described in the Experimental part. The result is plotted
in Figure 2.20 and the corresponding values are summarized in Table 2.6. Note that the
reported values of capacity are referring to the amount of solid volume. It can be seen
that the equilibrium capacity of the two components is linearly decreasing with the
ionic strength. Moreover, due to the lower affinity of the first pseudo-variant and the
resulting displacement by the second one, the equilibrium capacity of the first pseudo-
variant is very low. It is worth noting that in spite of the very early breakthrough
at Im = 0.17 M, the second pseudo-variant still has a reasonable equilibrium capacity,
while the second one is practically non-adsorbing. The very early breakthrough can be
probably explained with the strong diffusion limitations. In other words, the so-called
dynamic capacity is small.
Overloaded experiments
The characterization of the PAb is finalized by carrying out some overloaded experi-
ments. The results are shown in Figure 2.21 for a gradient of 20 min length (12 CV)
and in Figure 2.22 for a gradient of 40 min length (24 CV). During the elution, differ-
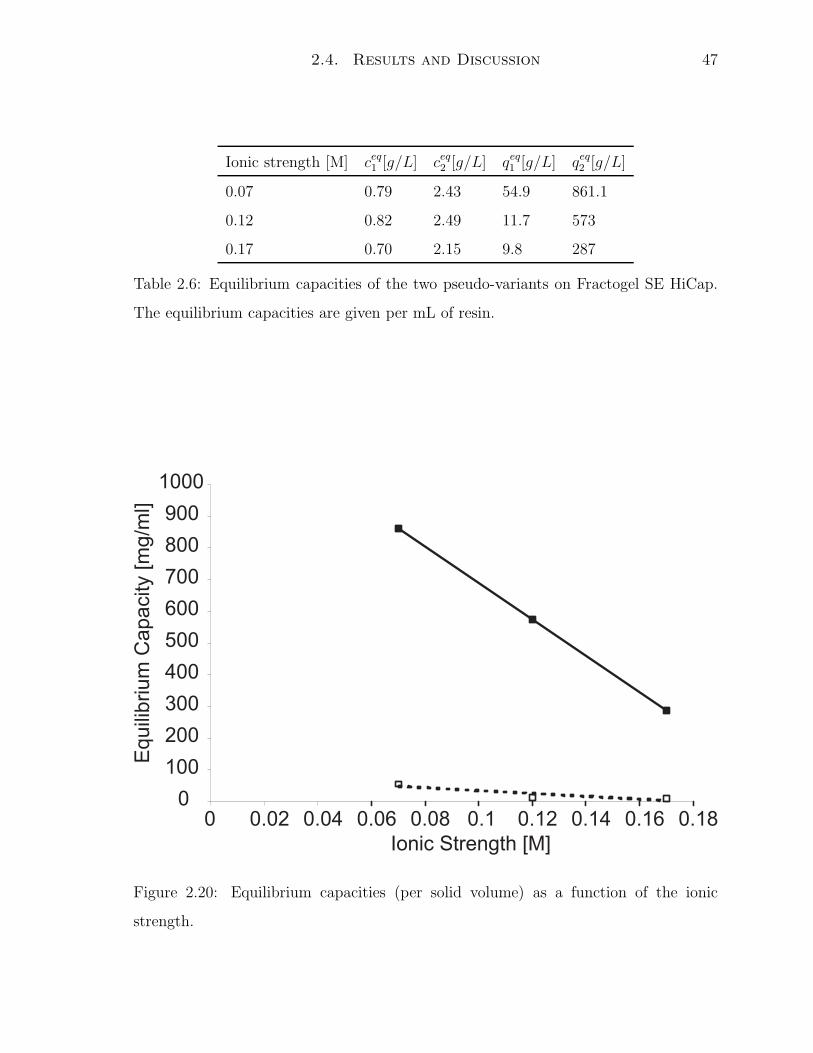
2.4. Results and Discussion 47
Ionic strength [M] ceq1 [g/L] ceq
2 [g/L] qeq1 [g/L] qeq
2 [g/L]
0.07 0.79 2.43 54.9 861.1
0.12 0.82 2.49 11.7 573
0.17 0.70 2.15 9.8 287
Table 2.6: Equilibrium capacities of the two pseudo-variants on Fractogel SE HiCap.
The equilibrium capacities are given per mL of resin.
Figure 2.20: Equilibrium capacities (per solid volume) as a function of the ionic
strength.

48 2. Experimental Characterization of the Adsorption
Figure 2.21: Overloaded linear gradient elution experiments of the polyclonal mixture
on Fractogel SE HiCap. The polyclonal mixture (dashed curve and full triangles) and
the first pseudo-variant (full curve and open squares) are shown. The gradient length
is 20 minutes and increasing amounts are injected: 41, 89, 110 mg
ent fractions are taken and analyzed using the described analytical method. In both
figures we can see that the peak front is shifted to the left as the injection volume is
increased, while the peak back is always eluting at the same time. This is coherent
with the theory for a (competitive) Langmuir isotherm. The shapes of the profiles are
however deformed by the slow mass transport and the shock in the front is cancelled
by the presence of dominant mass transport resistances. A similar displacement can
be observed for the first pseudo-variant, although the broadness of the peak induced
by the mass transport limitations and the actual presence of many variants is making
impossible to conclude more about the behavior of this pseudo-variant.

2.4. Results and Discussion 49
Figure 2.22: Overloaded linear gradient elution experiments of the polyclonal mixture
on Fractogel SE HiCap. The polyclonal mixture (dashed curve and full triangles) and
the first pseudo-variant (full curve and open squares) are shown. The gradient length
is 40 minutes. Increasing amounts are injected: 38, 79, 119 mg
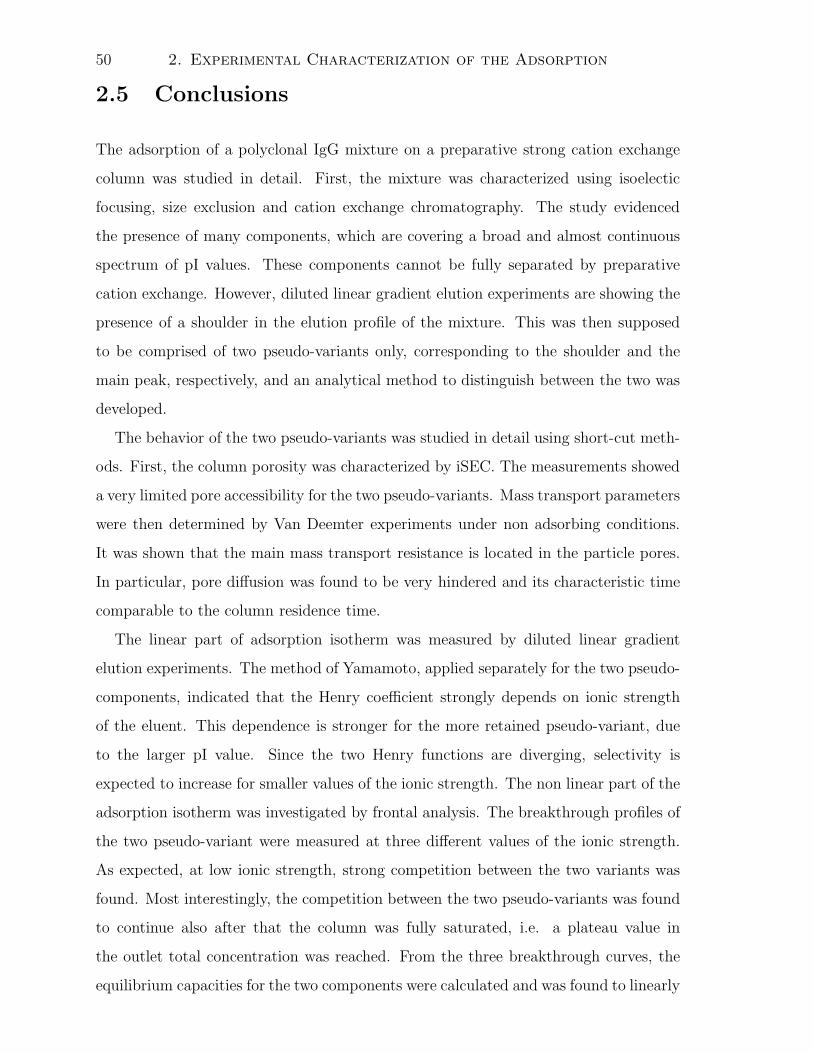
50 2. Experimental Characterization of the Adsorption
2.5 Conclusions
The adsorption of a polyclonal IgG mixture on a preparative strong cation exchange
column was studied in detail. First, the mixture was characterized using isoelectic
focusing, size exclusion and cation exchange chromatography. The study evidenced
the presence of many components, which are covering a broad and almost continuous
spectrum of pI values. These components cannot be fully separated by preparative
cation exchange. However, diluted linear gradient elution experiments are showing the
presence of a shoulder in the elution profile of the mixture. This was then supposed
to be comprised of two pseudo-variants only, corresponding to the shoulder and the
main peak, respectively, and an analytical method to distinguish between the two was
developed.
The behavior of the two pseudo-variants was studied in detail using short-cut meth-
ods. First, the column porosity was characterized by iSEC. The measurements showed
a very limited pore accessibility for the two pseudo-variants. Mass transport parameters
were then determined by Van Deemter experiments under non adsorbing conditions.
It was shown that the main mass transport resistance is located in the particle pores.
In particular, pore diffusion was found to be very hindered and its characteristic time
comparable to the column residence time.
The linear part of adsorption isotherm was measured by diluted linear gradient
elution experiments. The method of Yamamoto, applied separately for the two pseudo-
components, indicated that the Henry coefficient strongly depends on ionic strength
of the eluent. This dependence is stronger for the more retained pseudo-variant, due
to the larger pI value. Since the two Henry functions are diverging, selectivity is
expected to increase for smaller values of the ionic strength. The non linear part of the
adsorption isotherm was investigated by frontal analysis. The breakthrough profiles of
the two pseudo-variant were measured at three different values of the ionic strength.
As expected, at low ionic strength, strong competition between the two variants was
found. Most interestingly, the competition between the two pseudo-variants was found
to continue also after that the column was fully saturated, i.e. a plateau value in
the outlet total concentration was reached. From the three breakthrough curves, the
equilibrium capacities for the two components were calculated and was found to linearly

2.5. Conclusions 51
decreasing with the ionic strength.
The characterization was finalized by overloaded linear gradient experiments. As
expected, the overloaded peaks were moving towards shorter elution times for increas-
ing injection masses. However, the shape of the profiles did not show any concentration
shock in the peak front and, on the contrary, the peaks always remained rather sym-
metrical. This is due to the strong mass transport limitations.
The short-cut methods applied in this work allowed a simple and effective charac-
terization of the behavior of the polyclonal antibody mixture. It is believed that most
of the observations in this work can be readily applied to single monoclonal antibodies.
In addition to this, it is worth to be noticed that in monoclonal antibodies produced
by cell culture are very often present different variants, which are frequently inactive or
even toxic and, therefore, have to be separated. Accordingly, the problems discussed
in this work are closely resembling those typical of a monoclonal antibody purification.
However, the complexity of this problem can be properly tackled only with the aim
of a numerical model. This requires a more precise estimation of the mass transport
and adsorption isotherm parameters, which the short-cut methods discussed in this
work are not able to provide. This will be done in the following chapter, where all the
parameters will be regressed using a suitable numerical model.

Chapter 3
Mathematical Modelling of the
Adsorption
3.1 Introduction
The results of the previous chapter, have enlightened the complex behavior of the PAb
mixture in conventional cation exchange supports. Short-cut methods can be hardly
used to precisely estimate all the physicochemical parameters involved in the process.
In fact, the nature of the adsorption isotherm and the severe mass transport limitations
are making the system extremely sensitive to small errors in the parameters, so that
their use in a numerical model would lead to largely inaccurate model forecasts. For
this reason, it is often preferable to directly regress the parameters using the numerical
model.
Two main approaches can be found in the literature to carry out the regression of the
parameters needed to simulate the behavior of a chromatographic column: regression
of batch uptake experiments or regression of elution profiles. In the first approach, the
isotherm is determined directly from batch adsorption data and the mass transport is
found by regressing of protein uptake experiments. This approach has been widely used
for the adsorption of proteins on ion exchanger materials [26, 27, 29, 41, 46, 66, 117,
118, 119, 51]. Another option for the determination of the mass transport parameters is
to use microscopic techniques to visualize the protein front moving to the center of the
particles as the adsorption takes place. This can be done either by confocal microscopy
53
54 3. Mathematical Modelling of the Adsorption
[31, 32, 33] or by light microscopy [40]. However, these so called ”off-line” methods have
the disadvantage of measuring the adsorption parameters in a different fluid dynamic
environment than of the chromatographic column. This can be avoided when using
the so called ”on-line” methods. Here the isotherm and the mass transport parameters
are found by regression of elution profiles. This method has also been widely used for
the adsorption of proteins on ion-exchange columns [17, 24, 120, 121, 122, 123].
For the simulation of the adsorption of large molecules like proteins, a very compre-
hensive model is needed. The most complete model present in literature is the so-called
general rate model (GRM), where the concentration distribution of the different so-
lutes in both the axial and the particle radial directions is accounted for [63]. Due
to its complexity and the large number of differential equations involved, this model
has gained importance in the last years due to the strong increase of computational
power of the modern computers. It must be pointed out that the use of this model
is mandatory in the presence of dominant mass transport resistances, as discussed by
Kaczmarski et.al. [88]
In this chapter, the parameter regression of the elution profiles is applied for a com-
plete characterization (i.e. under diluted and overloaded conditions) of the adsorption
of the polyclonal IgG on the preparative strong cation exchanger column. Note that
the aim of this chapter is not only to estimate the relevant parameters to run the
model simulation, but to use the model as a powerful tool for the understanding of the
adsorption process. As it will be discussed in the following, through the model only it
is possible to capture the full complexity of the system and the behaviors observed in
the previous chapter.
As described in Chapter 2 of this Thesis, although the original polyclonal antibody
mixture is made by a very large number of different antibodies, it can be approxi-
mated by considering only two so-called pseudo-variants, which in the following will
be considered as single components. In order to simplify the regression procedure, the
experiments were designed in such a way that as few parameter as possible are fitted
together. The rationale behind the proposed regression procedure will be discussed in
this work.
3.2. Model Development 55
3.2 Model Development
The preparative separation of large molecules like proteins involve complex adsorption
mechanism and slow mass transfer [63]. In order to achieve an accurate prediction
of the elution profile a complete model is needed, which includes all contributions to
the mass transport in the chromatographic column. The GRM is accounting for the
concentration changes along the column axis and the particle radius. In this regard,
the following assumptions are made:
• transport is taking place by convection and diffusion in the mobile phase, i.e.
in the inter-particle voids; transport is purely by diffusion in the intra-particle
voids, the so-called stagnant phase;
• packing is uniform. Therefore, all porosities are constant;
• there is no concentration gradient along the column radius;
• particles have spherical symmetry;
• transport inside the particle is due to diffusion in the liquid phase only. Solid
diffusion is not accounted for;
• the adsorption process is always at equilibrium. Adsorption kinetics is neglected.
Considering the previous set of assumption, a model consisting of two sets of mass
balance equations, for the mobile and stagnant liquid phase, respectively, can be writ-
ten. The mass balance for the i-th component in the mobile phase is:
∂ci
∂t+ uint
∂ci
∂z+ εp,i
(1 − εb)
εbkf,i
3
Rp[ci − cp,i(r = Rp)] = Dax,i
∂2ci
∂z2(3.1)
where εb is the column bed porosity, ci the concentration of the i-th component, t the
time, uint the interstitial velocity of the mobile phase, εp,i the particle porosity accessi-
ble to the component i, z the axial position, kf,i the film mass transfer coefficient, Rp
the radius of the particles and cp,i(r = Rp) the concentration of the i-th component at
the particle surface, r the radial position in the particle and Dax,i the axial diffusion
coefficient of the i-th component. The initial and boundary conditions for Equation 3.1
are:
56 3. Mathematical Modelling of the Adsorption
t = 0 ci = ci(0, z)
and [124]:
z = 0 ∂ci∂z
= uint
Dax(ci − cf,i)
z = L ∂ci∂z
= 0
where the feed concentration, cf,i, is a function of time and it is defined for a loading
experiment as:
z = 0 cf,i(t) = cf,i for t > 0
and for peak injection as:
z = 0 cf,i(t) = cf,i for 0 < t ≤ tinj
cf,i(t) = 0 for t > tinj
where tinj is the injection time.
The corresponding mass balance for the stagnant liquid in the particle pores can be
written as:
∂cp,i
∂t+
(1 − εp,i)
εp,i
∂qi
∂t= Dp,i
1
r2
∂
∂r
(
r2∂cp,i
∂r
)
(3.2)
where cp,i is the pore concentration of the i-th component, qi the corresponding con-
centration in the solid phase and Dp,i the pore diffusion coefficient. Equation 3.2 is
subject to the following initial and boundary conditions:
t = 0 cp,i = cp,i(0, r)
and
r = 0∂cp,i
∂r= 0
r = Rp∂cp,i
∂r=
kf,i
Dp,i[ci − cp,i(r = Rp)]
Equations 3.1 and 3.2 can be rewritten in dimensionless form. The mass balance
in the mobile phase is written as follows:
∂ci
∂τ+
∂ci
∂η+ εp,i
(1 − εb)
εb
Sti[ci − cp,i(ρ = 1)] =1
Peax,i
∂2ci
∂η2(3.3)
3.2. Model Development 57
The one for the stagnant phase is written as:
∂cp,i
∂τ+
(1 − εp,i)
εp,i
∂qi
∂τ=
1
Pei
1
ρ2
∂
∂ρ
(
ρ2 ∂cp,i
∂ρ
)
(3.4)
where τ = (tuint)/L is the dimensionless time, η = z/L the dimensionless axial position
and ρ = r/Rp the dimensionless radial position. Note that according to the previous
definition, τ = 1 corresponds to the retention time of a tracer totally excluded from
the pores. The dimensionless numbers are defined as:
Axial Peclet number:
Peax,i =uint/L
Dax,i/L2=
tax
tconv(3.5)
Peclet number:
Pei =uint/L
Dp,i/R2p
=tpore
tconv(3.6)
Sherwood number:
Shi =kf,i/Rp
Dp,i/R2p
=tpore
tfilm
(3.7)
Stanton number:
Sti = 3Shi
Pei
= 3kf,i/Rp
uint/L=
tconv
tfilm
(3.8)
where tax, tconv, tpore and tfilm are the characteristic times for axial diffusion, con-
vection, pore diffusion and film mass transfer, respectively. The initial and boundary
conditions for the mass balance equations in the mobile (Eq. 3.3) and in the stagnant
(Eq. 3.4) phases can be then rewritten as:
τ = 0 ci = ci(0, η)
and
η = 0 ∂ci∂η
= Peax,i(ci − cf,i)
η = 1 ∂ci∂η
= 0
For Equation 3.4 the initial and boundary conditions become:
τ = 0 cp,i = cp,i(0, ρ)

58 3. Mathematical Modelling of the Adsorption
and
ρ = 0∂cp,i
∂ρ= 0
ρ = 1∂cp,i
∂ρ= Shi[ci − cp,i(ρ = 1)]
Due to its complexity, the general rate model has no analytical solution. Numeri-
cal methods have to be applied. In this work the finite difference method is used to
solve the original system of partial differential equations. This method consist in trans-
forming the space derivatives in difference equations over a small discretization interval
[125, 126]. The interval is achieved discretizing the space (radial and axial) coordinate.
In this work, 9 grid points along the particle radius and 99 along the column axis are
used. The final system of equations (ODEs) then consists of 9x99 ordinary differen-
tial equations per solute. The numerical code has been written in Fortran-95 and the
system of ODEs solved using the LSODI package [127]. The simulations were run on
a Pentium 4 Dual Core 3.2 MHz computer (average CPU time is about 1 to 5 sec).
More details on the numerical method used can be found in Chapter 4.
3.2.1 Mass balance of the salt
Due to its large diffusion coefficient (with respect to the proteins) it is assumed that
the transport of the salt inside the particle is infinitely fast and, therefore, the salt
concentration in the pores is everywhere the same as in the mobile phase. The mass
balance for the salt can be then simplified as in the following:
∂cs
∂η+
∂cs
∂τ+
(1 − εb)
εb
(
εp,s∂cs
∂τ+ (1 − εp,s)
∂qs
∂τ
)
=1
Peax,s
∂2cs
∂η2(3.9)
cs and qs are the salt concentration in the liquid and in the solid respectively and εp,s
is the particle porosity for the salt.
3.2.2 Adsorption isotherm
For the salt and the proteins, Langmuir-type adsorption isotherms are assumed. In
addition to this, due to the large excess of salt with respect to protein, it is assumed that

3.3. Parameter Determination 59
there is no competition between salt and antibodies [70]. As a result, the adsorption
isotherm of the salt reduces to a single component Langmuir, which can be written as:
qeqs (cs) =
Hsceqs
1 + Hs
q∞sceqs
(3.10)
where Hs is the Henry constant of the salt and q∞s the saturation capacity. In other
words, the adsorption behavior of the salt is independent from the antibody concen-
tration. Similarly, the adsorption isotherm of the different antibodies reduces to a
competitive multi-component Langmuir isotherm, as in the following:
qeqi (cp,i, cs) =
Hi(cs)ceqp,i
1 +∑n
j=1Hj(cs)
q∞j
(cs)ceqp,j
(3.11)
where cp,i is the pore concentration od the i-th pseudo-variants, Hi the Henry constant
and q∞i the saturation capacity of i-th component respectively. In this expression, it
can be noted that there is an explicit competition among the antibodies, but no explicit
competition with the salt. The role of the salt is implicit and it is embedded in the
definitions of the Henry coefficient and of the saturation capacity. For the former, the
expression derived by Yamamoto [70] is used:
Hi = αiI−βi
m (3.12)
where αi and βi are two constants. No expression can be found in the literature for the
dependence of the saturation capacity. Following the experimental results obtained in
the previous chapter, a simple linear dependence on the salt concentration is suggested:
q∞i = γi − δiIm (3.13)
3.3 Parameter Determination
The mass transport parameters and the adsorption isotherm for all components have to
be determined. This will be done by a proper combination of literature correlations and
parameter regression. For the regression of the parameters, the experiments presented
in Chapter 2 will be used. It is important to notice that, in the following, it is assumed
that all the IgG variants have identical size and, therefore, mass transport coefficients.
Moreover, it is assumed that the presence of dimers in the original mixture is negligible
(refer to Chapter 2.4.2).
60 3. Mathematical Modelling of the Adsorption
3.3.1 Parameters from literature correlations
The axial diffusivity (Peax) and the film mass transfer coefficient (St) can be calculated
from literature correlations. The film mass transport coefficient is calculated from the
equation of Wilson and Geankoplis [100]:
kf =Dm
2Rp
1.09
εb
(
us2Rp
Dm
)1/3
(3.14)
where us is the superficial velocity and Dm the molecular diffusion coefficient. This
can be calculated from the equation by Young et al [101]:
Dm = 8.31 10−8 T
ηbM1/3(3.15)
T is the absolute temperature, ηb the solvent viscosity and M the molecular weight of
IgG. The axial diffusion can be calculated assuming that hindered molecular diffusion
and eddy diffusion are additive [80]:
Dax,i = 0.7Dm,i + uintRp (3.16)
Considering that the molecular diffusion of a molecule in water is in the order of
10−5cm2/s, the first term in Equation 3.16 is approximately equal to 7 · 10−6cm2/s.
The stationary phase used in this work has a particle diameter of 65 µm and the
interstitial velocity is 0.11 cm/s. The second term is, therefore, equal to 3 · 10−4cm2/s
and, thus, dominant over the first one, which will be neglected.
3.3.2 Parameter regression
As already mentioned, the determination of the effective pore diffusivity and the ad-
sorption isotherm is carried out by regression of the experimental elution profiles, i.e.
by minimizing the error between the simulated and the experimental profiles. In this
work, an adaptive simulating annealing (ASA) optimization routine [128] is used to find
the global minimum of the regression function. The determination of the confidence
interval of the regressed parameter is a very important issue. However, for the sake of
space, it will not be discussed in this work.
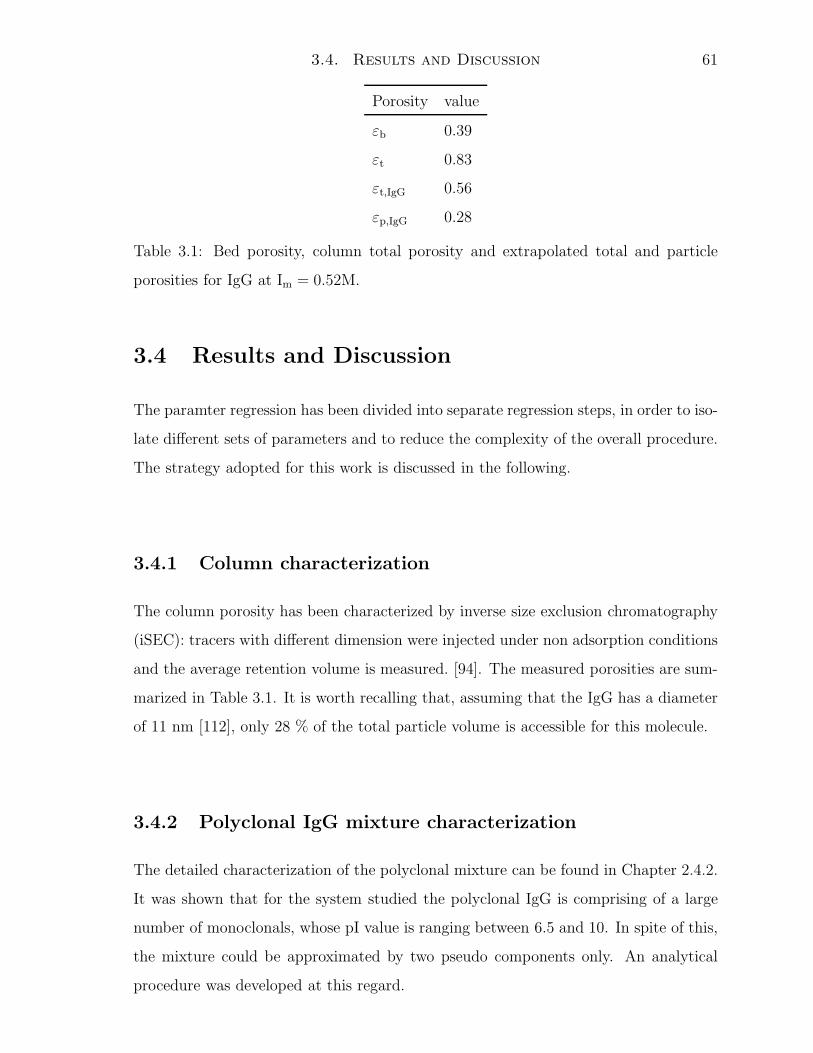
3.4. Results and Discussion 61
Porosity value
εb 0.39
εt 0.83
εt,IgG 0.56
εp,IgG 0.28
Table 3.1: Bed porosity, column total porosity and extrapolated total and particle
porosities for IgG at Im = 0.52M.
3.4 Results and Discussion
The paramter regression has been divided into separate regression steps, in order to iso-
late different sets of parameters and to reduce the complexity of the overall procedure.
The strategy adopted for this work is discussed in the following.
3.4.1 Column characterization
The column porosity has been characterized by inverse size exclusion chromatography
(iSEC): tracers with different dimension were injected under non adsorption conditions
and the average retention volume is measured. [94]. The measured porosities are sum-
marized in Table 3.1. It is worth recalling that, assuming that the IgG has a diameter
of 11 nm [112], only 28 % of the total particle volume is accessible for this molecule.
3.4.2 Polyclonal IgG mixture characterization
The detailed characterization of the polyclonal mixture can be found in Chapter 2.4.2.
It was shown that for the system studied the polyclonal IgG is comprising of a large
number of monoclonals, whose pI value is ranging between 6.5 and 10. In spite of this,
the mixture could be approximated by two pseudo components only. An analytical
procedure was developed at this regard.

62 3. Mathematical Modelling of the Adsorption
3.4.3 Mass transport parameters
As it can be observed from the mass balance equations reported above (Equations. 3.3
and 3.4), in the absence of adsorption the number of parameters reduces to the porosity
values (εb and εp) and to the non-dimensional mass transport parameters (Peax, Pe
and St). The bed and the total porosity have been evaluated above by iSEC. The axial
Peclet and the Stanton number can be estimated using literature parameters only (see
Equations. 3.5 and 3.8): Peax = 1342 and St = 61. As a result, only the pore Peclet
number (Pe) and the pore accessibility of IgG (εp), must be estimated. These are de-
termined by regression of isocratic experiments under non adsorbing conditions, run at
different interstitial velocities (from 0.02 to 0.31 cm/s). The fitted and the experimental
profiles are shown in Figure 3.1. It can be observed that the skewness of the peak in-
creases as the interstitial velocity increases, as effect of the transport limitations in the
pores. The fit is very good and the following values of the particle porosity, εp = 0.29,
and effective pore diffusivity, Deffp = 2.98 10−8 cm2/s, were regressed. Note that the
regressed specific IgG accessible porosity is well matching with the value extrapolated
from the iSEC curve, assuming a hydrodynamic diameter of 11 nm for IgG [112] and
reported in Table 3.1. It is also worth noticing that, for the regression of the pore
effective diffusivity, it was assumed that the characteristic diffusion length inside the
particle is equal to the entire particle radius. At uint = 0.11 cm/s, the fitted effective
pore diffusivity, corresponds to a Peclet number of 3.41. This means that the mass
transport into the pores is very hindered, being the characteristic time for diffusion
inside the particles more than three times larger than the characteristic time for con-
vection. The regressed effective pore diffusivity value is very close to the value found
from the Van Deemter’s plot shown in Chapter 2.4.3 (Deffp = 2.31 10−8 cm2/s).
3.4.4 Isotherm determination
The salt isotherm is determined by the perturbation method (not shown). For the
experimental conditions used in this work, a linear adsorption isotherm with Hs = 0.25
is found. In the following, it is described the procedure to regress the adsorption
isotherm parameters for the two pseudo-variants as a function of the ionic strength
(see Equations 3.12 and 3.13).
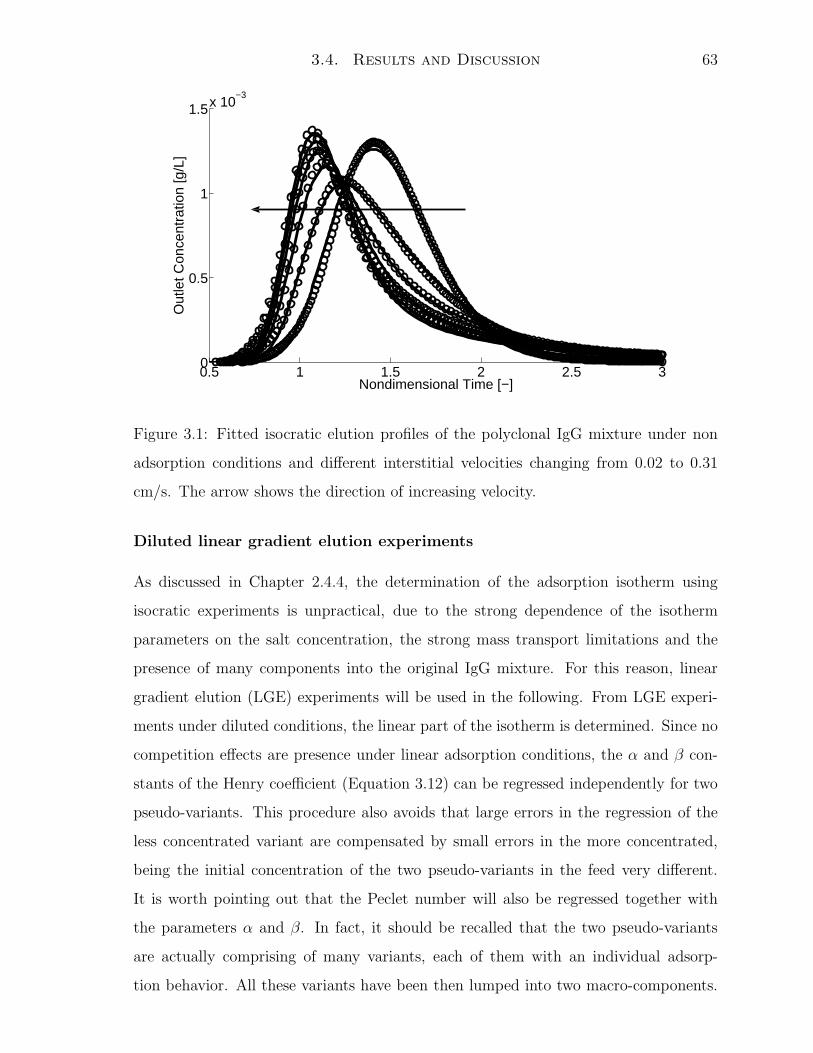
3.4. Results and Discussion 63
0.5 1 1.5 2 2.5 30
0.5
1
1.5x 10⁻³
Nondimensional Time [−]
Out
let C
once
ntra
tion
[g/L
]
Figure 3.1: Fitted isocratic elution profiles of the polyclonal IgG mixture under non
adsorption conditions and different interstitial velocities changing from 0.02 to 0.31
cm/s. The arrow shows the direction of increasing velocity.
Diluted linear gradient elution experiments
As discussed in Chapter 2.4.4, the determination of the adsorption isotherm using
isocratic experiments is unpractical, due to the strong dependence of the isotherm
parameters on the salt concentration, the strong mass transport limitations and the
presence of many components into the original IgG mixture. For this reason, linear
gradient elution (LGE) experiments will be used in the following. From LGE experi-
ments under diluted conditions, the linear part of the isotherm is determined. Since no
competition effects are presence under linear adsorption conditions, the α and β con-
stants of the Henry coefficient (Equation 3.12) can be regressed independently for two
pseudo-variants. This procedure also avoids that large errors in the regression of the
less concentrated variant are compensated by small errors in the more concentrated,
being the initial concentration of the two pseudo-variants in the feed very different.
It is worth pointing out that the Peclet number will also be regressed together with
the parameters α and β. In fact, it should be recalled that the two pseudo-variants
are actually comprising of many variants, each of them with an individual adsorp-
tion behavior. All these variants have been then lumped into two macro-components.
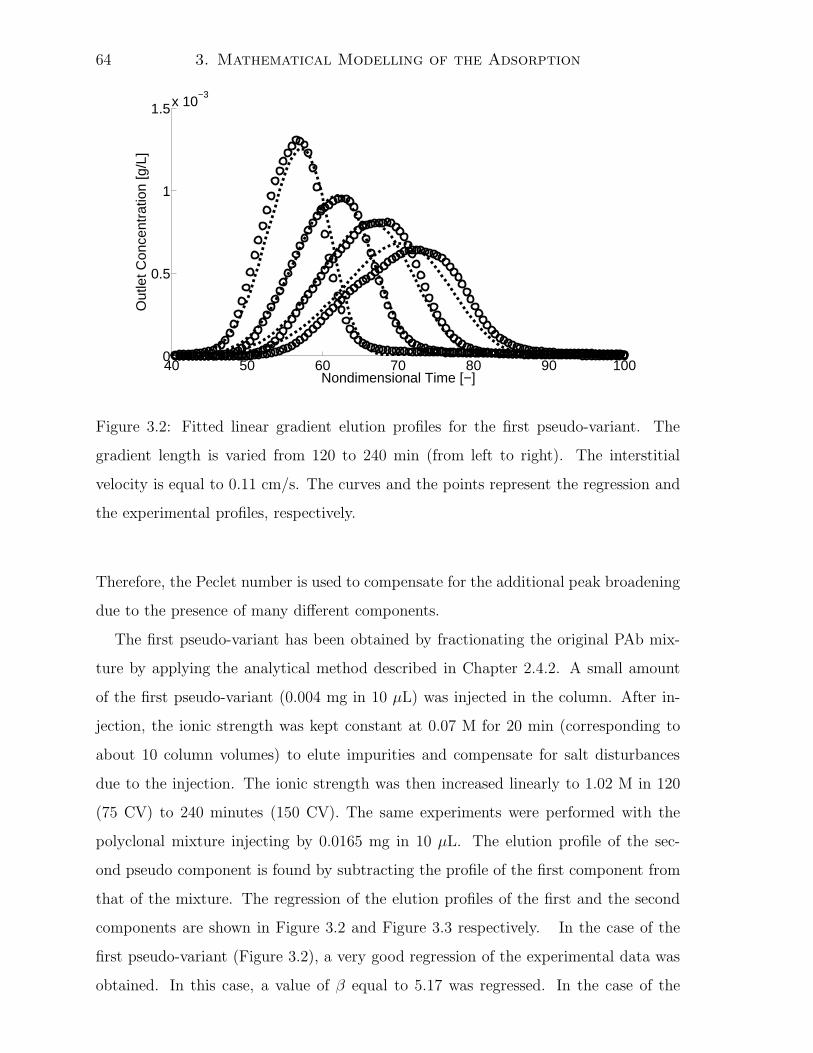
64 3. Mathematical Modelling of the Adsorption
40 50 60 70 80 90 1000
0.5
1
1.5x 10⁻³
Nondimensional Time [−]
Out
let C
once
ntra
tion
[g/L
]
Figure 3.2: Fitted linear gradient elution profiles for the first pseudo-variant. The
gradient length is varied from 120 to 240 min (from left to right). The interstitial
velocity is equal to 0.11 cm/s. The curves and the points represent the regression and
the experimental profiles, respectively.
Therefore, the Peclet number is used to compensate for the additional peak broadening
due to the presence of many different components.
The first pseudo-variant has been obtained by fractionating the original PAb mix-
ture by applying the analytical method described in Chapter 2.4.2. A small amount
of the first pseudo-variant (0.004 mg in 10 µL) was injected in the column. After in-
jection, the ionic strength was kept constant at 0.07 M for 20 min (corresponding to
about 10 column volumes) to elute impurities and compensate for salt disturbances
due to the injection. The ionic strength was then increased linearly to 1.02 M in 120
(75 CV) to 240 minutes (150 CV). The same experiments were performed with the
polyclonal mixture injecting by 0.0165 mg in 10 µL. The elution profile of the sec-
ond pseudo component is found by subtracting the profile of the first component from
that of the mixture. The regression of the elution profiles of the first and the second
components are shown in Figure 3.2 and Figure 3.3 respectively. In the case of the
first pseudo-variant (Figure 3.2), a very good regression of the experimental data was
obtained. In this case, a value of β equal to 5.17 was regressed. In the case of the

3.4. Results and Discussion 65
40 60 80 100 120 1400
0.5
1
1.5
2
2.5
3x 10⁻³
Nondimensional Time [−]
Out
let C
once
ntra
tion
[−]
Figure 3.3: Fitted linear gradient elution profiles for for the second pseudo-variant
(obtained by subtracting the first component profile from the mixture profile). The
gradient length is varied from 120 to 240 min (from left to right). The interstitial
velocity is equal to 0.11 cm/s. The curves and the points represent the regression and
the experimental profiles, respectively.

66 3. Mathematical Modelling of the Adsorption
α [-] β [-] Pe [-]
Pseudo-variant 1 3.76 10−3 5.17 1.16
Pseudo-variant 2 9.82 10−3 5.76 1.98
Table 3.2: α, β and Pe for the two pseudo-variants, obtained from the regression of
diluted linear gradient elution experiments.
second pseudo component (Figure 3.3), the matching between experiments and model
is not as good. The mean retention time of the peak (first moment) is predicted with
good approximation. However, the experimental elution profiles show very long tails
and asymmetric peaks, which cannot be predicted by the model. This is due to the
presence of a small portion of antibody molecules with very large affinity to the sta-
tionary phase, whose presence is not accounted for. The regressed value of β is 5.76.
All the regressed parameters (α, β and Pe) are summarized in Table 3.2. In Figure 3.4
the Henry constants of the two variants (calculated by Equation 3.12) are plotted as
a function of the ionic strength. Both functions are very strongly dependent on the
ionic strength. The fitted functions can be compared to those found with the method
of Yamamoto in Chapter 2.4.4. The values calculated with the method of Yamamoto
in the correspondence of the ionic strengths used for the breakthrough experiments
(discussed in the following) are shown in Figure 3.4 (points). The agreement with
the two methods is good especially for the pseudo-variant two. On the other hand,
the method of Yamamoto predicts a smoother dependence for the first pseudo-variant
Henry constant on salt. The difference is particularly important at large salt concen-
trations, i.e. at low retention times. Note that at Im = 0.17 M, the first pseudo-variant
is close to non-adsorption conditions. In such conditions, the mistake introduced by
the method of Yamamoto in the definition of the Henry constant (see Equation 2.14
in Chapter 2.3.3) is probably not negligible. It is also worth noting that the regressed
values of α and β are very correlated to each other. In particular, if the values of α
and β in the proximity of the solution are plotted against each other, they are almost
falling on a line. However, the effect of this strong correlation on the behavior of the
Henry coefficient as a function of salt is negligible. More details on this can be found
in Chapter 4.

3.4. Results and Discussion 67
0 0.05 0.1 0.15 0.210
0
102
104
106
Ionic Strength [M]
Hen
ry C
onst
ant [
−]
Figure 3.4: Henry constants of the two pseudo-variants plotted as a function of the
ionic strength. The curves are the function found from the regression of the linear
gradient elution experiments. The points are calculated by applying the equations
found with the method of Yamamoto in Part I of this work in correspondence to the
ionic strengths of the breakthrough curves (discussed in the following). The dashed
curve and open symbols represent the first pseudo-variant; the full curve and symbols
the second.

68 3. Mathematical Modelling of the Adsorption
An additional comment is due on the regressed values of the pore Peclet number
in Figures 3.2 and 3.3. Unexpectedly, the following values have been obtained for the
two pseudo-variants: Pe1 = 1.16 and Pe2 = 1.98. These Peclet numbers are actually
smaller than the ones regressed from the isocratic experiments under non adsorption
conditions (Chapter 3.4.3). This contradictory result can be explained by supposing
that some unspecific adsorption mechanism (e.g. hydrophobic interaction) is operating
in the absence of ion exchange even at the large salt concentrations used in Figure 3.1.
The presence of some (small) adsorption can then lead to peak broadening and, thus,
to an underestimation of the pore effective diffusion rate. It is worth noting that a very
similar value of the Peclet number under non-adsorption conditions have been obtained
here by peak regression and in the first part of this work from the van Deemter’s plot. In
other words, this result is independent of the method used to estimate pore diffusivity.
On the other hand, it is legitimate to assume that such kind of non-specific adsorption
is not influencing the determination of the IgG isotherm parameters, since the cation
exchange mechanism is most probably dominant at low salt concentrations.
As previously discussed, in the gradient experiments the original complex mixture
was approximated by two pseudo-variants only. This would also explain the different
Pe values found for the two components. The effective pore diffusivities calculated from
the Peclet numbers for the two pseudo components are equal to: Deffp,1 = 8.81 10−8 cm2/s
and Deffp,2 = 5.16 10−8 cm2/s. Even if these diffusion rate constants are not those of a
single IgG, as discussed above, they are still typical for an antibody on this type of
resin. It is also worth noting that these values of Peclet are not correlated to the values
of α and β found above. This result can be explained by recalling that, under diluted
conditions, the average retention time of the solute is a function of the adsorption
isotherm only.
Overloaded linear gradient elution experiments
The non-linear region of the adsorption isotherm, that is the saturation capacity, is
regressed by carrying out overloaded linear gradient elution experiments. In this re-
gression, the values of the Henry as function of the ionic strength functions and the
Peclet numbers found from the regression of the diluted linear gradients are kept con-
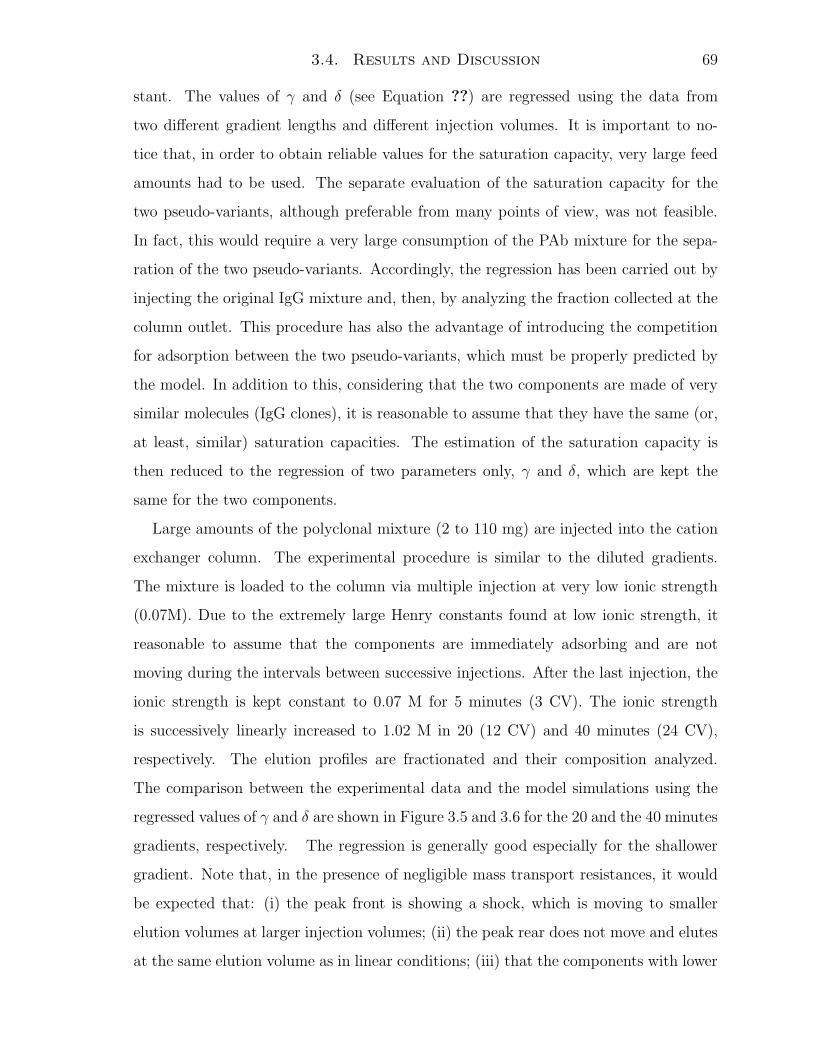
3.4. Results and Discussion 69
stant. The values of γ and δ (see Equation ??) are regressed using the data from
two different gradient lengths and different injection volumes. It is important to no-
tice that, in order to obtain reliable values for the saturation capacity, very large feed
amounts had to be used. The separate evaluation of the saturation capacity for the
two pseudo-variants, although preferable from many points of view, was not feasible.
In fact, this would require a very large consumption of the PAb mixture for the sepa-
ration of the two pseudo-variants. Accordingly, the regression has been carried out by
injecting the original IgG mixture and, then, by analyzing the fraction collected at the
column outlet. This procedure has also the advantage of introducing the competition
for adsorption between the two pseudo-variants, which must be properly predicted by
the model. In addition to this, considering that the two components are made of very
similar molecules (IgG clones), it is reasonable to assume that they have the same (or,
at least, similar) saturation capacities. The estimation of the saturation capacity is
then reduced to the regression of two parameters only, γ and δ, which are kept the
same for the two components.
Large amounts of the polyclonal mixture (2 to 110 mg) are injected into the cation
exchanger column. The experimental procedure is similar to the diluted gradients.
The mixture is loaded to the column via multiple injection at very low ionic strength
(0.07M). Due to the extremely large Henry constants found at low ionic strength, it
reasonable to assume that the components are immediately adsorbing and are not
moving during the intervals between successive injections. After the last injection, the
ionic strength is kept constant to 0.07 M for 5 minutes (3 CV). The ionic strength
is successively linearly increased to 1.02 M in 20 (12 CV) and 40 minutes (24 CV),
respectively. The elution profiles are fractionated and their composition analyzed.
The comparison between the experimental data and the model simulations using the
regressed values of γ and δ are shown in Figure 3.5 and 3.6 for the 20 and the 40 minutes
gradients, respectively. The regression is generally good especially for the shallower
gradient. Note that, in the presence of negligible mass transport resistances, it would
be expected that: (i) the peak front is showing a shock, which is moving to smaller
elution volumes at larger injection volumes; (ii) the peak rear does not move and elutes
at the same elution volume as in linear conditions; (iii) that the components with lower
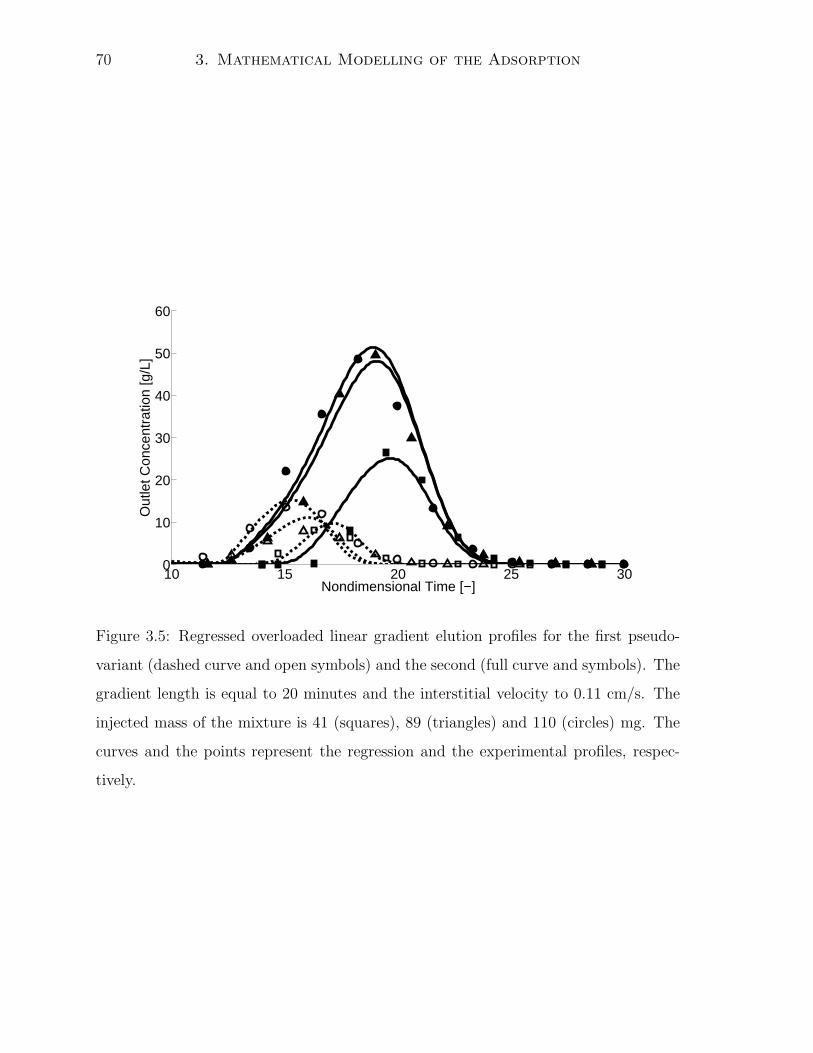
70 3. Mathematical Modelling of the Adsorption
10 15 20 25 300
10
20
30
40
50
60
Nondimensional Time [−]
Out
let C
once
ntra
tion
[g/L
]
Figure 3.5: Regressed overloaded linear gradient elution profiles for the first pseudo-
variant (dashed curve and open symbols) and the second (full curve and symbols). The
gradient length is equal to 20 minutes and the interstitial velocity to 0.11 cm/s. The
injected mass of the mixture is 41 (squares), 89 (triangles) and 110 (circles) mg. The
curves and the points represent the regression and the experimental profiles, respec-
tively.
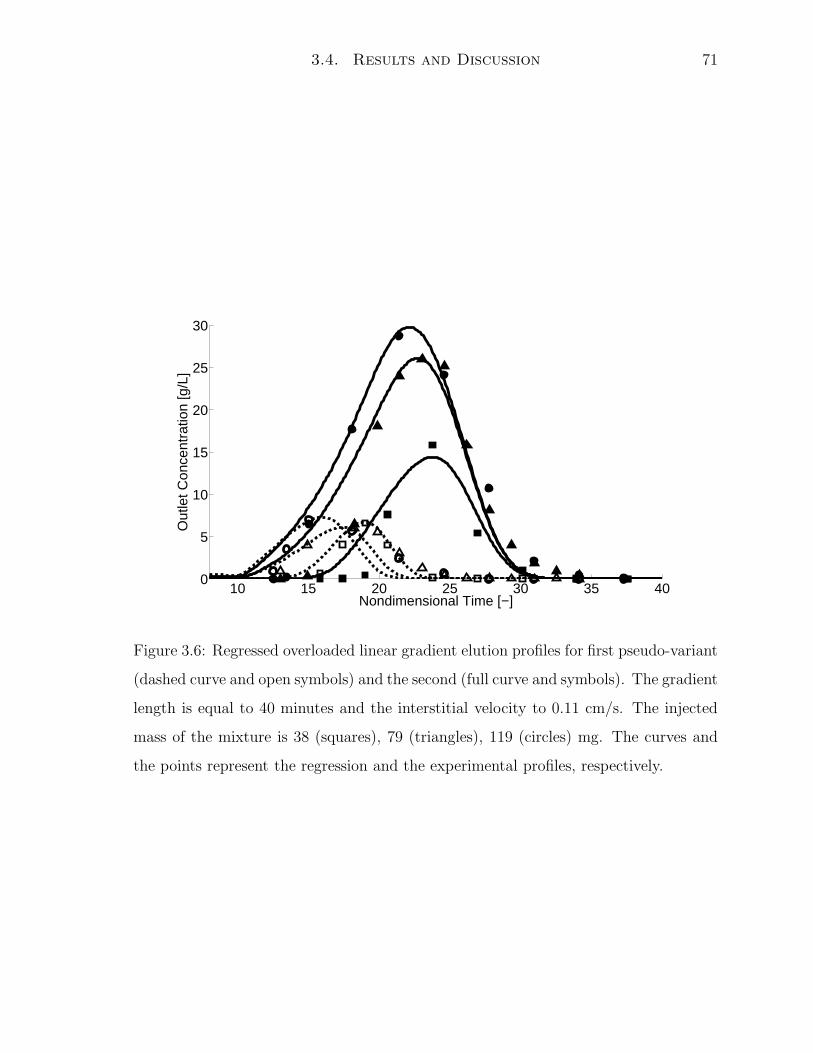
3.4. Results and Discussion 71
10 15 20 25 30 35 400
5
10
15
20
25
30
Nondimensional Time [−]
Out
let C
once
ntra
tion
[g/L
]
Figure 3.6: Regressed overloaded linear gradient elution profiles for first pseudo-variant
(dashed curve and open symbols) and the second (full curve and symbols). The gradient
length is equal to 40 minutes and the interstitial velocity to 0.11 cm/s. The injected
mass of the mixture is 38 (squares), 79 (triangles), 119 (circles) mg. The curves and
the points represent the regression and the experimental profiles, respectively.
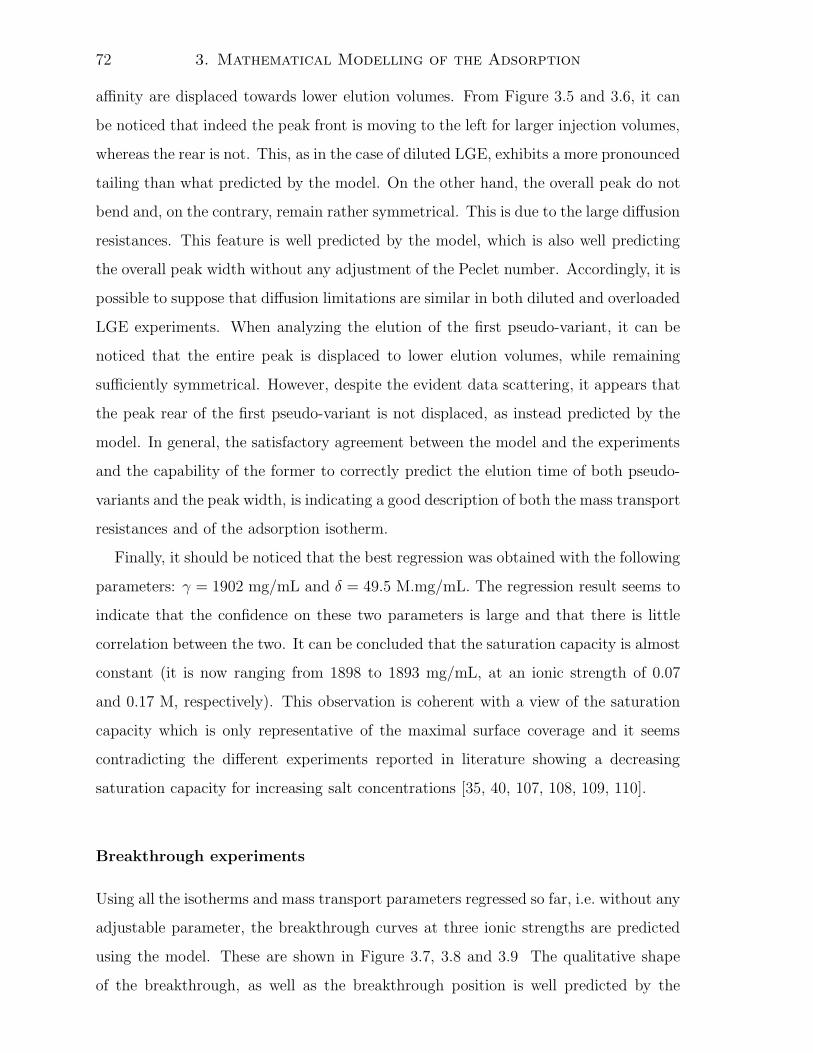
72 3. Mathematical Modelling of the Adsorption
affinity are displaced towards lower elution volumes. From Figure 3.5 and 3.6, it can
be noticed that indeed the peak front is moving to the left for larger injection volumes,
whereas the rear is not. This, as in the case of diluted LGE, exhibits a more pronounced
tailing than what predicted by the model. On the other hand, the overall peak do not
bend and, on the contrary, remain rather symmetrical. This is due to the large diffusion
resistances. This feature is well predicted by the model, which is also well predicting
the overall peak width without any adjustment of the Peclet number. Accordingly, it is
possible to suppose that diffusion limitations are similar in both diluted and overloaded
LGE experiments. When analyzing the elution of the first pseudo-variant, it can be
noticed that the entire peak is displaced to lower elution volumes, while remaining
sufficiently symmetrical. However, despite the evident data scattering, it appears that
the peak rear of the first pseudo-variant is not displaced, as instead predicted by the
model. In general, the satisfactory agreement between the model and the experiments
and the capability of the former to correctly predict the elution time of both pseudo-
variants and the peak width, is indicating a good description of both the mass transport
resistances and of the adsorption isotherm.
Finally, it should be noticed that the best regression was obtained with the following
parameters: γ = 1902 mg/mL and δ = 49.5 M.mg/mL. The regression result seems to
indicate that the confidence on these two parameters is large and that there is little
correlation between the two. It can be concluded that the saturation capacity is almost
constant (it is now ranging from 1898 to 1893 mg/mL, at an ionic strength of 0.07
and 0.17 M, respectively). This observation is coherent with a view of the saturation
capacity which is only representative of the maximal surface coverage and it seems
contradicting the different experiments reported in literature showing a decreasing
saturation capacity for increasing salt concentrations [35, 40, 107, 108, 109, 110].
Breakthrough experiments
Using all the isotherms and mass transport parameters regressed so far, i.e. without any
adjustable parameter, the breakthrough curves at three ionic strengths are predicted
using the model. These are shown in Figure 3.7, 3.8 and 3.9 The qualitative shape
of the breakthrough, as well as the breakthrough position is well predicted by the
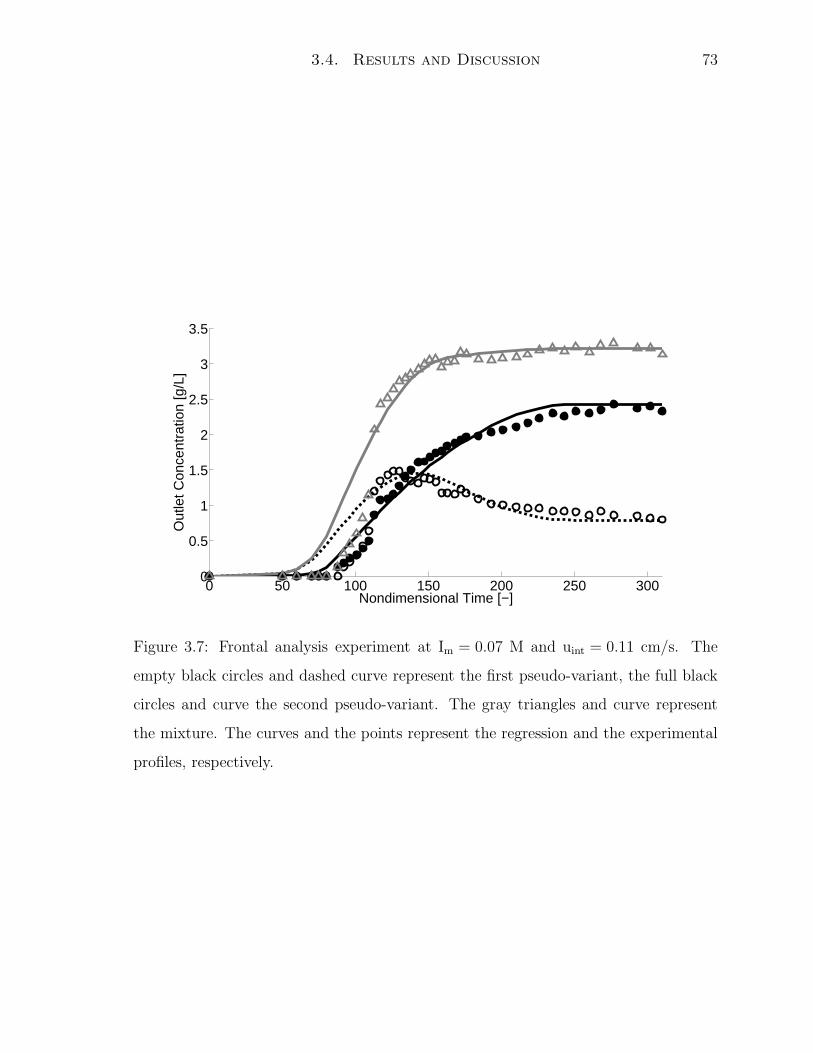
3.4. Results and Discussion 73
0 50 100 150 200 250 3000
0.5
1
1.5
2
2.5
3
3.5
Nondimensional Time [−]
Out
let C
once
ntra
tion
[g/L
]
Figure 3.7: Frontal analysis experiment at Im = 0.07 M and uint = 0.11 cm/s. The
empty black circles and dashed curve represent the first pseudo-variant, the full black
circles and curve the second pseudo-variant. The gray triangles and curve represent
the mixture. The curves and the points represent the regression and the experimental
profiles, respectively.
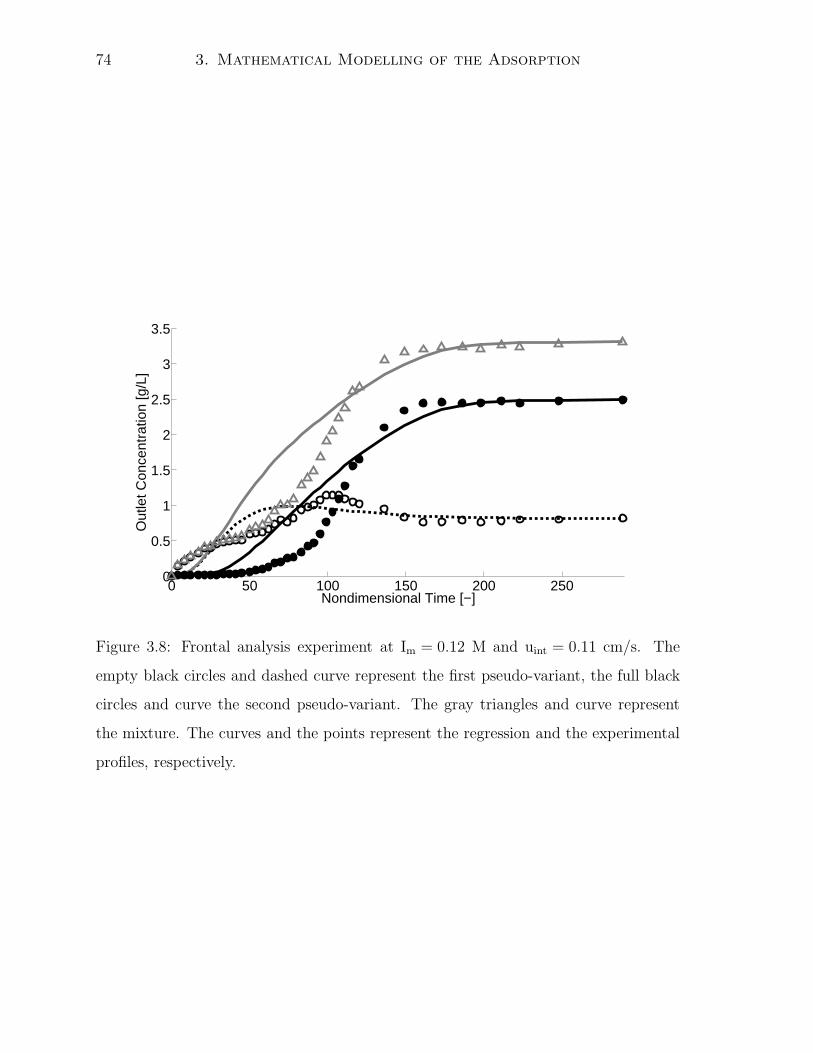
74 3. Mathematical Modelling of the Adsorption
0 50 100 150 200 2500
0.5
1
1.5
2
2.5
3
3.5
Nondimensional Time [−]
Out
let C
once
ntra
tion
[g/L
]
Figure 3.8: Frontal analysis experiment at Im = 0.12 M and uint = 0.11 cm/s. The
empty black circles and dashed curve represent the first pseudo-variant, the full black
circles and curve the second pseudo-variant. The gray triangles and curve represent
the mixture. The curves and the points represent the regression and the experimental
profiles, respectively.
3.4. Results and Discussion 75
0 20 40 60 80 100 1200
0.5
1
1.5
2
2.5
3
Nondimensional Time [−]
Out
let C
once
ntra
tion
[g/L
]
Figure 3.9: Frontal analysis experiment at Im = 0.17 M and uint = 0.11 cm/s. The
empty black circles and dashed curve represent the first pseudo-variant, the full black
circles and curve the second pseudo-variant. The gray triangles and curve represent
the mixture. The curves and the points represent the regression and the experimental
profiles, respectively.
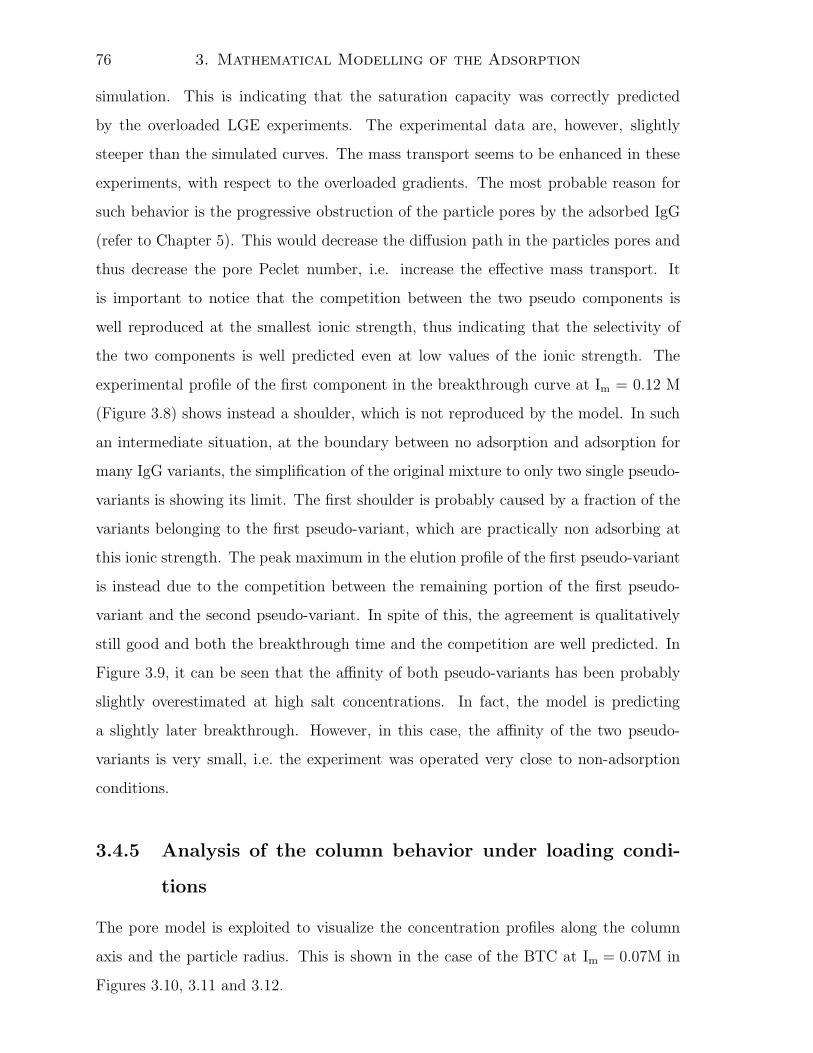
76 3. Mathematical Modelling of the Adsorption
simulation. This is indicating that the saturation capacity was correctly predicted
by the overloaded LGE experiments. The experimental data are, however, slightly
steeper than the simulated curves. The mass transport seems to be enhanced in these
experiments, with respect to the overloaded gradients. The most probable reason for
such behavior is the progressive obstruction of the particle pores by the adsorbed IgG
(refer to Chapter 5). This would decrease the diffusion path in the particles pores and
thus decrease the pore Peclet number, i.e. increase the effective mass transport. It
is important to notice that the competition between the two pseudo components is
well reproduced at the smallest ionic strength, thus indicating that the selectivity of
the two components is well predicted even at low values of the ionic strength. The
experimental profile of the first component in the breakthrough curve at Im = 0.12 M
(Figure 3.8) shows instead a shoulder, which is not reproduced by the model. In such
an intermediate situation, at the boundary between no adsorption and adsorption for
many IgG variants, the simplification of the original mixture to only two single pseudo-
variants is showing its limit. The first shoulder is probably caused by a fraction of the
variants belonging to the first pseudo-variant, which are practically non adsorbing at
this ionic strength. The peak maximum in the elution profile of the first pseudo-variant
is instead due to the competition between the remaining portion of the first pseudo-
variant and the second pseudo-variant. In spite of this, the agreement is qualitatively
still good and both the breakthrough time and the competition are well predicted. In
Figure 3.9, it can be seen that the affinity of both pseudo-variants has been probably
slightly overestimated at high salt concentrations. In fact, the model is predicting
a slightly later breakthrough. However, in this case, the affinity of the two pseudo-
variants is very small, i.e. the experiment was operated very close to non-adsorption
conditions.
3.4.5 Analysis of the column behavior under loading condi-
tions
The pore model is exploited to visualize the concentration profiles along the column
axis and the particle radius. This is shown in the case of the BTC at Im = 0.07M in
Figures 3.10, 3.11 and 3.12.
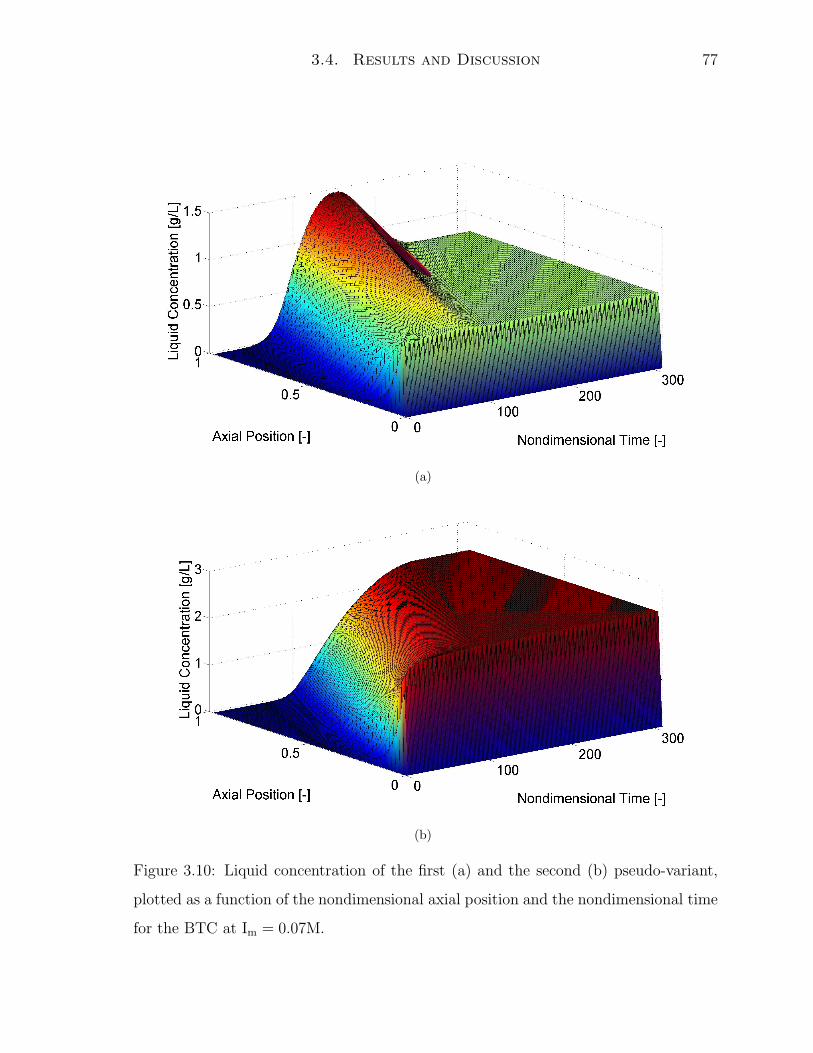
3.4. Results and Discussion 77
(a)
(b)
Figure 3.10: Liquid concentration of the first (a) and the second (b) pseudo-variant,
plotted as a function of the nondimensional axial position and the nondimensional time
for the BTC at Im = 0.07M.

78 3. Mathematical Modelling of the Adsorption
In Figures 3.10, the axial profiles of the first and second pseudo-variants are plotted
as a function of the nondimensional time τ . For η = 0 the concentration of the two
components is equal to the inlet concentration, with the exception of τ = 0 where it is
zero. As the loading proceeds, the concentration front of the two components moves
towards the outlet of the column. In these figures, it can be appreciated the fact that
the front of the first pseudo-component is travelling faster and, at the same time, it is
progressively displaced by the second one. As a consequence, the concentration of the
first pseudo-component builds up, thus creating the typical overshoot effect, evident
at τ = 100. At about τ = 210 the adsorption equilibrium is established and the feed
concentrations are reached at the outlet of the column.
The radial profiles of the two components, at the entrance and at the outlet of the
column, are shown in Figure 3.11 and 3.12, respectively. Let us start discussing the
radial concentration profiles at the entrance of the column (η = 0). It is interesting
to notice how the same displacement mechanism acting along the column axis in the
mobile phase, and shown in Figures 3.10, is replicated at the particle level. The same
discussion as for the axial profiles is valid. The concentration profile of the first pseudo-
variant moves towards the particle center faster than that of the second pseudo-variant
and, as a result, at τ > 50 it starts to be displaced. As a consequence, the concen-
tration overshoot is pushed towards the center of the particle, thus creating a large
concentration gradient which is favoring the diffusion of the excess of the first pseudo-
variant out of the particle. At τ = 100 the particle is completely equilibrated. Note
that τ = 100 is roughly the time at which the concentration overshoot starts building
up in the mobile phase and the two pseudo-variant are breaking-trough the column.
The radial profiles at the outlet of the column (at η = 1) are shown in Figure 3.12.
The same kind of mechanism already observed for the particles at the column inlet
(Figure 3.11) is observed here. However, the effect is stronger in this case. In fact,
differently from the column inlet, where the concentration of the two components at
the particle surface is constant and equal to the feed concentration, at the column
outlet the particles are also observing the build up of the first pseudo component at
the particle surface (ρ = 1). As a result, the build-up of the first component in the
particle center is more pronounced.
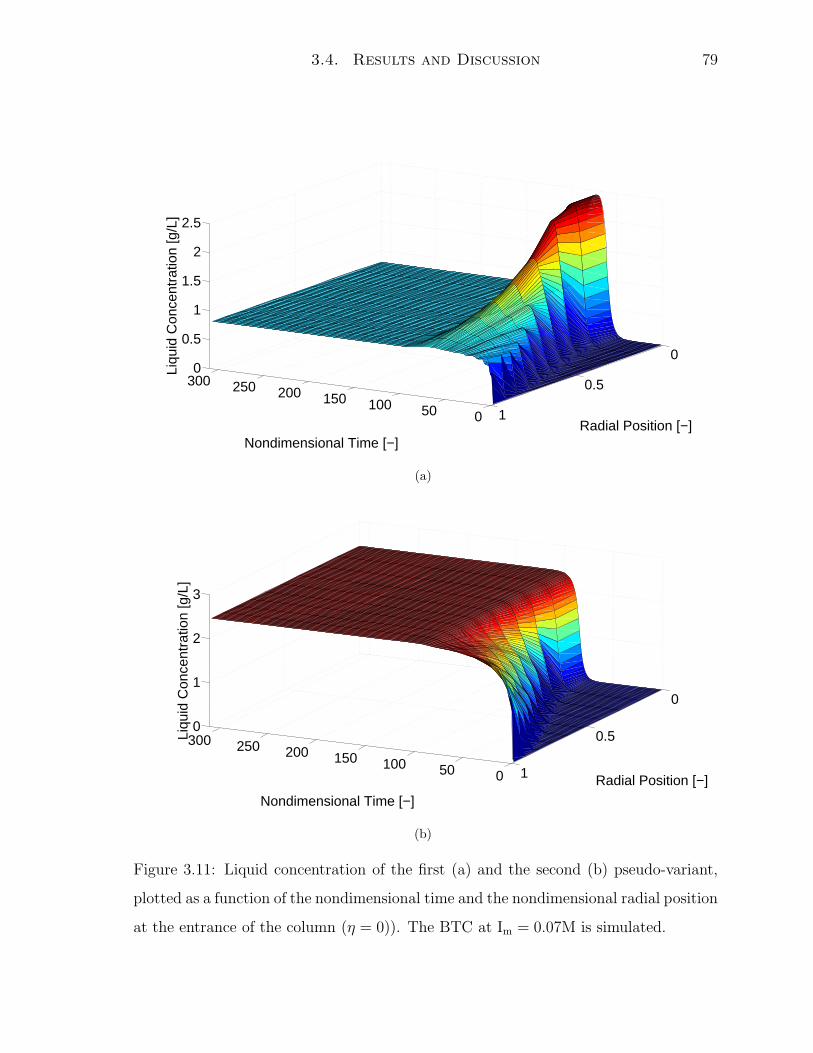
3.4. Results and Discussion 79
050100150200250300
0
0.5
1
0
0.5
1
1.5
2
2.5
Radial Position [−]Nondimensional Time [−]
Liqu
id C
once
ntra
tion
[g/L
]
(a)
050100150200250300
0
0.5
1
0
1
2
3
Radial Position [−]
Nondimensional Time [−]
Liqu
id C
once
ntra
tion
[g/L
]
(b)
Figure 3.11: Liquid concentration of the first (a) and the second (b) pseudo-variant,
plotted as a function of the nondimensional time and the nondimensional radial position
at the entrance of the column (η = 0)). The BTC at Im = 0.07M is simulated.
80 3. Mathematical Modelling of the Adsorption
050100150200250300
0
0.5
1
0
1
2
3
Radial Position [−]
Nondimensional Time [−]
Liqu
id C
once
ntra
tion
[g/L
]
(a)
050
100150
200250
300
0
0.5
1
0
1
2
3
Radial Position [−]
Nondimensional Time [−]
Liqu
id C
once
ntra
tion
[g/L
]
(b)
Figure 3.12: Liquid concentration of the first (a) and the second (b) pseudo-variant,
plotted as a function of the dimensionless time and the dimensionless radial position
at the outlet of the column (η = 1)). The BTC at Im = 0.07M is simulated.

3.5. Conclusions 81
Previous figures are evidencing the consequences of the limited mass transport in-
side the particle, which is at the origin of the difference between the so-called dynamic
binding capacity and the column static capacity. It is also showing that there is a need
of increasing the pore diffusivity of large proteins in order to increase the performance
of this materials. For higher pore diffusivity, the elution profiles are steeper and there-
fore the dynamic binding capacity higher. Higher pore diffusivity can be reached for
example by increasing the pore radius.
3.5 Conclusions
The adsorption of a polyclonal IgG mixture was studied in detail with the aid of a
mathematical model. In particular, a suitable model was developed for the simulation
of the adsorption process and a parameter regression strategy has been proposed.
As discussed in the previous chapter, the polyclonal mixture was simplified by as-
suming that two pseudo-variants are present only. The mass transport parameters were
calculated by literature correlations, with the exception of the effective pore diffusivity,
which was regressed on isocratic experiments under non adsorption conditions. Very
low values of diffusivity were found, in agreement with the value found from the Van
Deemter’s experiments of Chapter 2.
The adsorption isotherms were estimated by regression of diluted and overloaded
linear gradient elution experiments. In order to compensate for the errors produced by
the mixture simplification, the Pe number was kept as an adjustable parameter in the
regression of the diluted linear gradient experiments. A very good agreement between
experiments and model results was generally found. More specifically, diluted gradients
were used to separately estimate the Henry coefficients for the two pseudo-variants as a
function of ionic strength. These values were then used to regress the dependence of the
saturation capacity. Surprisingly, an almost constant saturation capacity as a function
of the ionic strength was found. It is also worth noticing that the Pe values regressed
from the linear gradient elution experiments were smaller than the one obtained from
regression of the experiments under non adsorption conditions. This is believed to
indicate that non-specific adsorption mechanisms, such as hydrophobic interaction, are
82 3. Mathematical Modelling of the Adsorption
operating at large salt concentrations.
The model was finally used in a completely predictive way to simulate three break-
through curves at different ionic strengths. The results indicate that the model with
the parameter values regressed by gradient elution experiments is able to predict the
elution profile of the breakthroughs with good approximation. The breakthrough time
and the competition between the two pseudo-variants could be as well reproduced by
the model.
The model was also exploited to visualize the concentration profiles of the two
pseudo-variants along the column axis and the particle radius. The overshoot of in
the concentration of the first pseudo-variant typical of competing systems could be
observed both along the column axis and the particle radius. The shape of the profiles
was found to be strongly affected by the small effective pore diffusivity of the two
pseudo-variants.
The model has proven to be well suited for the modelling of the adsorption pro-
cess of PAbs on cation exchange resins. Moreover the parameter regression strategy
proposed was proven to be robust, to require low solute consumption and to be read-
ily applicable to the adsorption of any protein on ion exchange resins. However, if
a precise determination of the elution profiles under different operative conditions is
required, the polyclonal mixture cannot be simplified to two components only. In fact,
the presence of long tailing and shoulders in the elution peaks can be predicted only
if a finer description of the mixture is carried out. This work will be discussed in the
following chapter.
Chapter 4
Multi Component Mathematical
Modelling of the Adsorption
4.1 Introduction
In the previous two chapters of this Thesis, an investigation of the behavior of a poly-
clonal antiboby (PAb) mixture on a strong cation exchanger (sCIEX) has been carried
out. In particular, in Chapter 2, the general behavior of the mixture has been de-
termined with short cut methods, whereas, in Chapter 3, the investigation of both
the mass transport and the adsorption isotherm parameters has been repeated by peak
regression using a suitable numerical model. From these two analyses, it became imme-
diately evident that it is impossible to consider the PAb mixture as a single monoclonal
antibody. The different antibody variants in the mixture are characterized by a broad,
almost continuous, spectrum of pI values. As a consequence, the different components
of the mixture have very different adsorption behaviors once injected into a sCIEX
column. On the other hand, in these two chapters it has been shown that the initial
complexity of the PAb mixture can be reduced to two so-called pseudo-variants only,
where the characteristics of a large number of different antibodies are lumped into two
single components. The advantages of these procedure lies in the simplicity of the
analytical procedure and of the corresponding numerical model, which must account
for the competition of two components only.
Besides the intrinsic difficulties connected to the investigation of the behavior of
83

84 4. Multi Component Mathematical Modelling of the Adsorption
proteins on CIEX columns, previous analysis soon showed all its limits. First, in
many experiments it was impossible to correctly describe the complex behavior of
the mixture and the presence of shoulders or long tailings. Second, in this analysis
the mass transport parameters were used as adjustable parameters to compensate
for the broadening introduced by the different adsorption behavior of the different
components in the two pseudo-variants. As a result, the main advantage of using a
sophisticated numerical model as the general rate model (GRM) [75, 76, 77, 78] were
partly lost. In fact, as for other lumped models, such as the lumped pore model or
the kinetic rate model, the regressed mass transport parameters were actually lumped
parameters, which depend on the mass transport characteristics of the system and on
their adsorption behavior.
As previously discussed in this Thesis and by other authors, as Melter et.al. [15],
analytical weak cation exchange columns have an outstanding resolution power with
respect to protein having different pI values. In fact, the small differences in the net
protein charge lead to very different adsorption behaviors. This has been also suggested
by Yamamoto et.al. [70], who proposed the following expression of the Henry coefficient
on ion exchange columns:
H = α · c−βs (4.1)
where Cs is the salt concentration and α and β constant parameters. This expression
has been derived from the mass action law [65] and it can be demonstrated that the
constant β is directly correlated to the protein net charge. Clearly, being the expression
of the Henry coefficient in Equation 4.1 a power function of Cs, small changes in the
value of β are leading to very different adsorption affinities for small variations in the
salt concentration. In addition to this, non-porous analytical columns are avoiding
the problems connected to the limited mass transport of the proteins in macro-porous
particles and, thus, the peak spreading remains very limited.
In this chapter, the resolution power of non-porous analytical cation exchange
columns is exploited. In particular, a simple method to rapidly identify a finite num-
ber of pseudo-variants is presented. It is worth pointing out that the model regression
of all the mass transport and adsorption isotherm parameters is then exponentially
increasing with the number of pseudo-variants identified in the mixture. Accordingly,
4.2. Materials and Methods 85
a compromise must be found between the need of precisely reproduce the complex be-
havior of the mixture components and the time needed to estimate all the parameters,
so to have a numerical model able to predict (and not only simulate) the column output
under different operative conditions.
In the following on this chapter, the numerical model and the analytical procedure
are first discussed. Then, the regression procedure of all the involved parameters is
analyzed. A discussion on the optimal number of pseudo-variants is not present in this
work. On the contrary, it has been arbitrarily decided to simulate the PAb mixture
using six pseudo-variants only. It should be noticed that, as discussed by Kaczmarski
et.al. [78, 88], in the case of slow mass transport inside the particles, a numerical model
explicitly accounting for the solute concentration profile along the particle radius, as
the GRM, is mandatory. This is a rather computationally expensive model, especially
when the competition for adsorption among a large number of solutes in the presence
of very non-linear adsorption isotherms must be simulated. All the work to reduce
the computational time of such model to few seconds, so to carry out an extensive
parameter regression, is also not discussed.
4.2 Materials and Methods
4.2.1 Stationary phase and columns
The column discussed in Chapter 2.2.1 is used in the following. Moreover, an analytical
weak cation exchanger column (250x4 mm, ProPac WCX-10) from Dionex is used for
the analysis of the polyclonal IgG mixture.
4.2.2 Mobile phase and chemicals
Experiments under no adsorption conditions are run using 50 mM phosphate buffer at
pH = 7, whereas adsorption experiments are run using a 20 mM sodium acetate buffer
at pH=5. The buffer preparation is equivalent to the one discussed in Chapter 2.2.
Inverse size exclusion experiments are carried out using dextran standards (Sigma-
Aldrich, Switzerland). For the experiments a polyclonal IgG mixture (Gammanorm,
Octapharma, Switzerland) is used.
86 4. Multi Component Mathematical Modelling of the Adsorption
4.2.3 Chromatography equipment
The same chromatographic equipment as in the previous chapters is used in the fol-
lowing.
4.3 Model Description
4.3.1 Main Assumptions
In this work, the so-called general rate model (GRM) is used to simulate the behavior
of the different solutes inside a chromatographic column [75, 76, 77, 78] . In this
model, it is assumed that the mobile phase percolates through the interstitial spaces
left by the macro-porous particles (i.e. the beads). In this region of space (the mobile
phase), the transport is almost purely convective. From this stream, diffusion takes
place into the liquid filled pores of the particles (the stagnant phase). Here, transport
takes place exclusively by diffusion and in every point of the particle the liquid phase
is thermodynamically in equilibrium with the pore surface (the solid phase), where the
adsorption of the solutes takes place.
The following additional assumptions are made in writing the GRM:
• The concentration profiles along the column radius are flat and wall-effects are
ignored. Spherical symmetry is assumed for the macro-porous particles.
• The so-called bed porosity, that is the voids in between the particles, is constant
along the column axis. The particle pore size distribution is also constant along
the particle radius.
• The adsorption mechanism is described by using a competitive Langmuir adsorp-
tion isotherms. Kinetic limitations to adsorption are ignored.
• Due to very large salt concentration of the salt with respect to the IgG molecules,
the competition for adsorption between salt and antibodies is neglected. Ac-
cordingly, the adsorption isotherm of the salt is reduced to a single component
isotherm, whereas a competitive Langmuir is describing the adsorption behavior

4.3. Model Description 87
of the antibody mixture. In the latter, the role of the salt on adsorption is hidden
in the definition of the Langmuir coefficients.
• For sake of simplicity, the concentration of the solutes in the solid phase is com-
puted as a volumetric concentration, i.e. the amount of solute adsorbed per unit
volume of solid.
• All antibodies are assumed to have the same hydrodynamic size and, thus, to
access the same pore volume. Therefore, no size exclusion is present among
the antibodies and all the corresponding mass transport parameters are equal.
However, it should be noted that the salt has a different pore accessibility than the
antibodies and, in particular, it is assumed to access the entire particle porosity.
• The transport of the solute in the intra-particle voids takes place by diffusion in
the liquid phase only. Additional transport mechanisms, as solid-diffusion, are
ignored. The transport of the salt in the particle pores is assumed to be much
faster than the transport of the solutes and, therefore, it is supposed to take place
instantaneously. Accordingly, the salt concentration is constant everywhere in the
liquid phase in each column section.
Note that this assumptions are the same as used in Chapter 3.
4.3.2 Mass Balance Equations
According to previous model assumptions, it is possible to write the mass balances for
the solutes in each phase. First, the mass balance on the i-th solute in the mobile phase
can be written as follows:
∂ci
∂t+ u
∂ci
∂z+ εpνb
3
RpJi = Dax
∂2ci
∂z2(4.2)
where ci is the concnetration in the mobile phase of the i-th solute, u the interstitial
velocity, Ji the mass flux of the solute from the mobile to the stagnant phase. Note
that it has been assumed that only a fraction εp of the total particle surface is available
for the diffusion process. The initial and boundary conditions (Danckwerts’ conditions)
88 4. Multi Component Mathematical Modelling of the Adsorption
corresponding to the previous equations are:
ci = 0; t = 0; 0 ≤ z ≤ L
−Dax∂ci
∂z= u (cf,i(t) − ci) ; t > 0; z = 0 (4.3)
∂ci
∂z= 0; t > 0; z = L
where cf,i is the time dependent inlet concentration of the i-th solute. Previous mass
balance must be coupled to the mass balance on each solute in the macroporous par-
ticles:
∂cp,i
∂t+ νp
N∑
j=1
∂qi
∂cp,j
∂cp,j
∂t+ νp
∂qi
∂cm
∂cm
∂t=
Dp
r2
∂
∂r
(
r2∂cp,i
∂r
)
(4.4)
where qi is the solute equilibrium concentration in the solid phase and is a function of
the solutes and modifier concentrations. The following initial and boundary conditions
are valid in this case:
cp,i = 0; t = 0; 0 ≤ r ≤ Rp
Dp∂cp,i
∂r= Ji = kf (ci − cp,i) ; t > 0; r = Rp (4.5)
∂cp,i
∂r= 0; t > 0; r = 0
The following non-dimensional independent variables can be defined:
τ = tu
L
η =z
L(4.6)
ρ =r
Rp
an substituted in the previous mass balance equations and boundary conditions (Equa-
tions 4.2-4.5). The new set of mass balance equations using non-dimensional variables
is reported in the following, for the mobile phase:
∂ci
∂τ+
∂ci
∂η+ εpνbSt (c − cp) =
1
Peax
∂2ci
∂η2(4.7)
ci = 0; τ = 0; 0 ≤ η ≤ 1
−1
Peax
∂ci
∂η= cf,i − c; τ > 0; η = 0 (4.8)
∂ci
∂η= 0; τ > 0; η = 1
4.3. Model Description 89
and for the macroporous particles:
∂cp,i
∂τ+ νp
N∑
j=1
∂qi
∂cp,j
∂cp,j
∂τ+ νp
∂qi
∂cm
∂cm
∂τ=
1
Pep
1
ρ2
∂
∂ρ
(
ρ2 ∂cp,i
∂ρ
)
(4.9)
cp,i = 0; τ = 0; 0 ≤ ρ ≤ 1
∂cp,i
∂ρ= Sh (ci − cp,i) ; τ > 0; ρ = 1 (4.10)
∂cp,i
∂ρ= 0; τ > 0; ρ = 0
In previous equations (Equations 4.7-4.10), the following non-dimensional groups can
be identified:
St = 3L/u
Rp/kf
= 3tconv
tfilm
Peax =L2/Dax
L/u=
tdiff,ax
tconv
Pep =R2
p/Dp
L/u=
tdiff,p
tconv
Sh =R2
p/Dp
Rp/kf=
PepSt
3=
tdiff,p
tfilm
where tconv, tfilm, tdiff,ax, tdiff,p are the characteristic times of convection, film mass
transport, axial diffusion and particle pore diffusion, respectively.
4.3.3 Adsorption Isotherms
As mentioned above, due to the large excess of salt with respect to protein, it is
assumed that there is no competition between salt and antibodies [70]. As a result, the
adsorption isotherm of the salt reduces to a single component Langmuir, which can be
written as:
qeqs (cs) =
Hsceqs
1 + Hsceqs /q∞s
(4.11)
where Hs is the Henry constant of the salt and q∞s the saturation capacity. In other
words, the adsorption behavior of the salt is independent from the antibody concen-
tration. Similarly, the adsorption isotherm of the different antibodies reduces to a
competitive multi-component Langmuir isotherm, as in the following:
qeqi (cp,i, cs) =
Hi(cs)ceqp,i
1 +∑n
j=1 Hj(cs)ceqp,j/q
∞
j (cs)(4.12)
90 4. Multi Component Mathematical Modelling of the Adsorption
where Hi is the Henry constant and q∞i the saturation capacity of i-th component,
respectively. In this expression, it can be noted that there is anexplicit competition
among the antibodies, but no explicit competition with the salt. The role of the salt is
implicit and it is hidden in the definitions of the Henry coefficient and of the saturation
capacity. For the former, the expression derived by Yamamoto [70] and reported in
Equation 4.1 is used. No expression can be found in the literature for the dependence
of the saturation capacity. Differently as in Chapter 3, here the following S-shape
dependence on the salt concentration is used:
q∞i =γ
1 + exp(δcs − ǫ)(4.13)
Previous choice can be justified by the need of an expression which is asymptotically
going to zero for infinite salt concentration (i.e. under no-adsorption conditions) and
to γ for zero salt. This last value should represent the true saturation capacity due to
full coverage of the available surface. In between the two asymptotes, the function is
almost linear: the slope and the position of the inflection point are determined by δ
and ǫ, respectively.
4.3.4 Numerical Solution of the Mass Balance Equations
The original mass balance equations consist of a set of partial differential equations.
This system has been reduced to a system of ordinary differential equations (OEDs)
using the finite difference method. The first and second order space derivates were re-
duced using the so-called central scheme. A forward and a backward difference scheme
has been used for the axial coordinate at the column inlet and outlet, respectively. A
forward scheme was used for the space derivatives in the particle center, whereas a
second order polynomial expansion has been used on the particle surface (ρ = 1):
∂c(ρ = 1)
∂ρ∼
cN−1 − 4cN + 3cN+1
2∆ρ(4.14)
where ci is the estimated concentration at ρ = i/(N + 1) and N is the total number
of grid points along the radial coordinate. Both axial and radial directions have been
discretized using two equispaced grids. Typically, 99 grid points have been used along
the column axis and 15 along the particle radius.
4.3. Model Description 91
The resulting system of ODEs has been solved using the LSODI routine [129]. This
routine is solving the system in the form:
A(t, y) · y′ = g(t, y) (4.15)
where y is the vector of the unknown functions, y′ its time derivatives, and A is a square
matrix of the coefficients. It can be shown that, by a proper selection of the order of
the differential equation, the matrix of the coefficients A can be reduced to a banded
matrix with a width equal to the number of grid points along the radial coordinate,
thus minimizing the computational effort.
4.3.5 Parameter Regression
Parameter regression has been carried out by using the least square method [131],
where the difference between the observed outlet concentration values and the values
predicted by the model is minimized. The nlinfit package from Matlab was used to
find the different local minima of the least square function [130]. In this procedure, the
starting point for the minimum search was randomly generated and a procedure was
repeated until a sufficiently large number of minima where found, which were different
by 2% maximum. These local minima were then used for the correlation analysis.
4.3.6 Fraction Analysis
The fraction collected from all the experiments discussed in the following are analyzed
on the analytical column (see Materials and Methods). The elution chromatogram of
the original Gammanorm mixture is shown in Figure 4.1, where the UV signal as a
function of the elution time is shown. After the injection the ionic strength is kept
constant at 0.07 M for 5 min. Then a gradient is started, which reaches a final ionic
strength of 52M in 30 minutes at a flow rate of 0.5 ml/min. Note that, in this figure, the
dead time was already subtracted and a base line connecting the UV signal at 10 and
35 minutes was arbitrarily applied. In the same figure, the algorithm to estimate the
variant composition is show. The chromatogram has been approximated by triangular
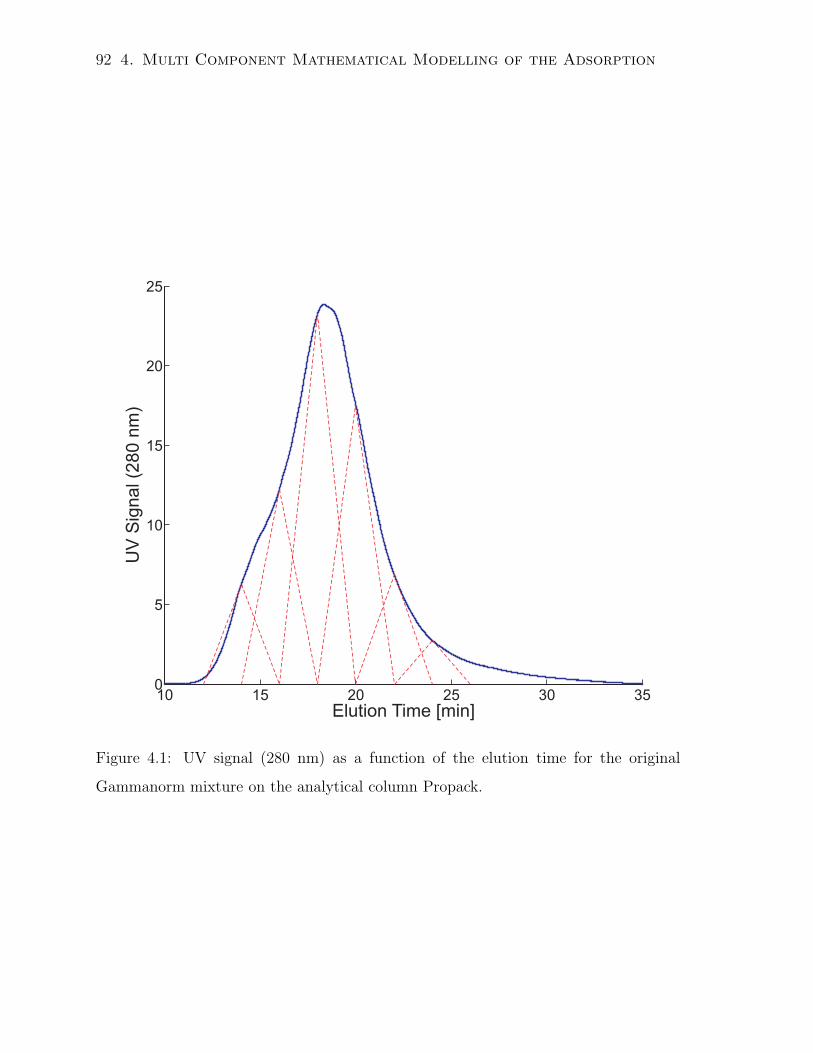
92 4. Multi Component Mathematical Modelling of the Adsorption
Figure 4.1: UV signal (280 nm) as a function of the elution time for the original
Gammanorm mixture on the analytical column Propack.
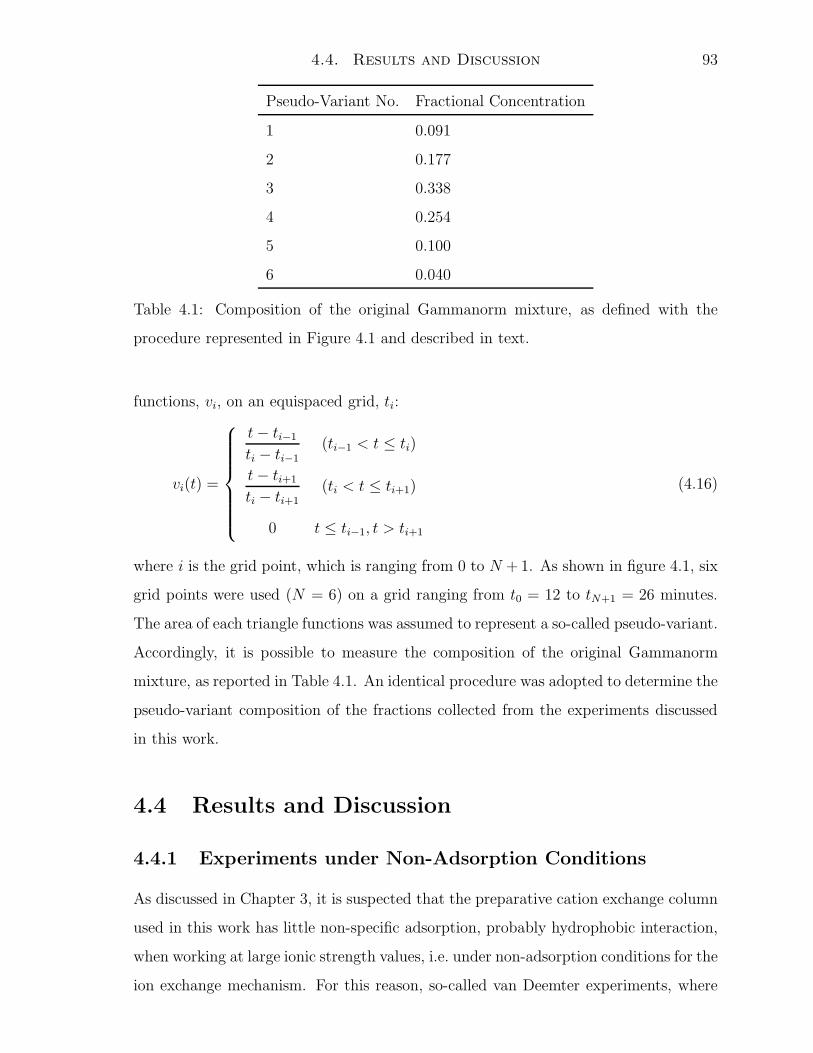
4.4. Results and Discussion 93
Pseudo-Variant No. Fractional Concentration
1 0.091
2 0.177
3 0.338
4 0.254
5 0.100
6 0.040
Table 4.1: Composition of the original Gammanorm mixture, as defined with the
procedure represented in Figure 4.1 and described in text.
functions, vi, on an equispaced grid, ti:
vi(t) =
t − ti−1
ti − ti−1(ti−1 < t ≤ ti)
t − ti+1
ti − ti+1(ti < t ≤ ti+1)
0 t ≤ ti−1, t > ti+1
(4.16)
where i is the grid point, which is ranging from 0 to N + 1. As shown in figure 4.1, six
grid points were used (N = 6) on a grid ranging from t0 = 12 to tN+1 = 26 minutes.
The area of each triangle functions was assumed to represent a so-called pseudo-variant.
Accordingly, it is possible to measure the composition of the original Gammanorm
mixture, as reported in Table 4.1. An identical procedure was adopted to determine the
pseudo-variant composition of the fractions collected from the experiments discussed
in this work.
4.4 Results and Discussion
4.4.1 Experiments under Non-Adsorption Conditions
As discussed in Chapter 3, it is suspected that the preparative cation exchange column
used in this work has little non-specific adsorption, probably hydrophobic interaction,
when working at large ionic strength values, i.e. under non-adsorption conditions for the
ion exchange mechanism. For this reason, so-called van Deemter experiments, where
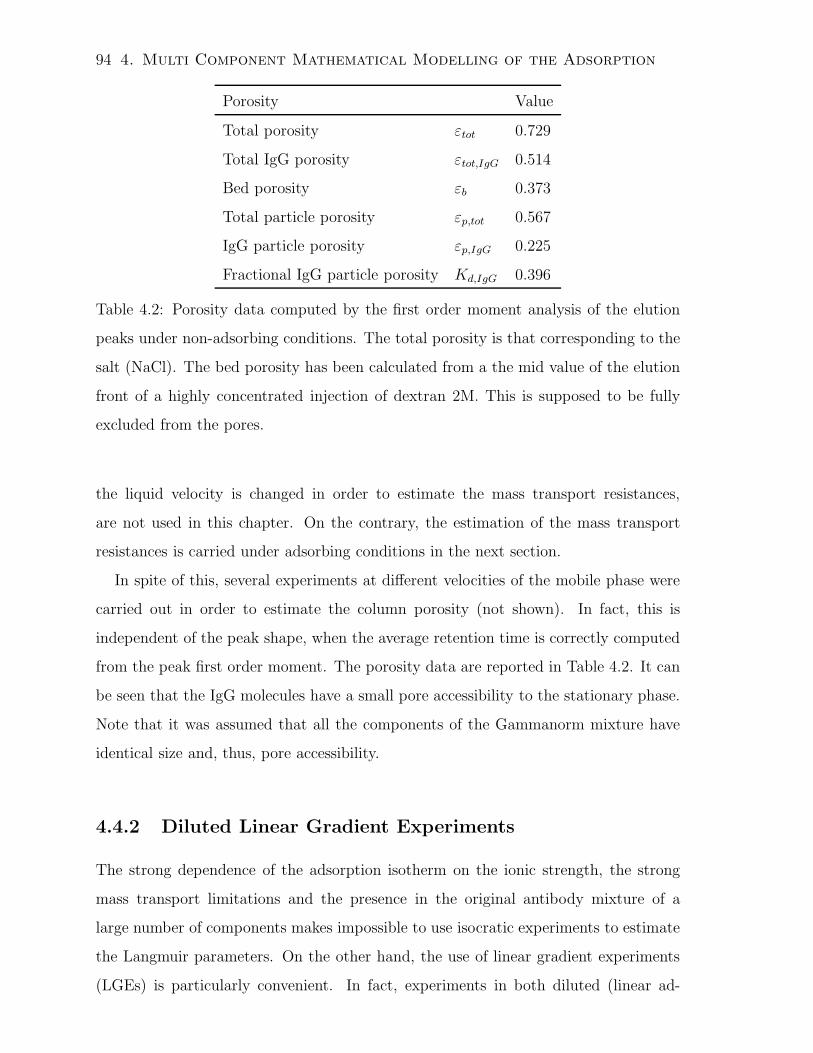
94 4. Multi Component Mathematical Modelling of the Adsorption
Porosity Value
Total porosity εtot 0.729
Total IgG porosity εtot,IgG 0.514
Bed porosity εb 0.373
Total particle porosity εp,tot 0.567
IgG particle porosity εp,IgG 0.225
Fractional IgG particle porosity Kd,IgG 0.396
Table 4.2: Porosity data computed by the first order moment analysis of the elution
peaks under non-adsorbing conditions. The total porosity is that corresponding to the
salt (NaCl). The bed porosity has been calculated from a the mid value of the elution
front of a highly concentrated injection of dextran 2M. This is supposed to be fully
excluded from the pores.
the liquid velocity is changed in order to estimate the mass transport resistances,
are not used in this chapter. On the contrary, the estimation of the mass transport
resistances is carried under adsorbing conditions in the next section.
In spite of this, several experiments at different velocities of the mobile phase were
carried out in order to estimate the column porosity (not shown). In fact, this is
independent of the peak shape, when the average retention time is correctly computed
from the peak first order moment. The porosity data are reported in Table 4.2. It can
be seen that the IgG molecules have a small pore accessibility to the stationary phase.
Note that it was assumed that all the components of the Gammanorm mixture have
identical size and, thus, pore accessibility.
4.4.2 Diluted Linear Gradient Experiments
The strong dependence of the adsorption isotherm on the ionic strength, the strong
mass transport limitations and the presence in the original antibody mixture of a
large number of components makes impossible to use isocratic experiments to estimate
the Langmuir parameters. On the other hand, the use of linear gradient experiments
(LGEs) is particularly convenient. In fact, experiments in both diluted (linear ad-
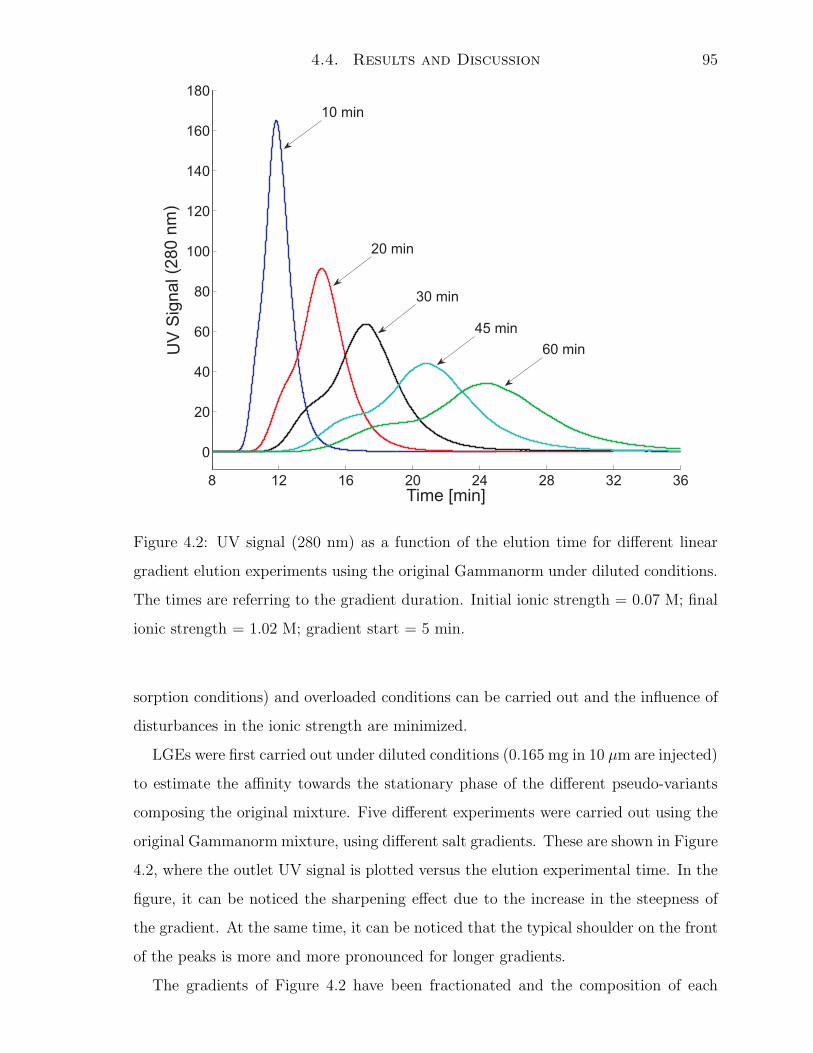
4.4. Results and Discussion 95
UV
Sig
nal (2
80
nm
)
Figure 4.2: UV signal (280 nm) as a function of the elution time for different linear
gradient elution experiments using the original Gammanorm under diluted conditions.
The times are referring to the gradient duration. Initial ionic strength = 0.07 M; final
ionic strength = 1.02 M; gradient start = 5 min.
sorption conditions) and overloaded conditions can be carried out and the influence of
disturbances in the ionic strength are minimized.
LGEs were first carried out under diluted conditions (0.165 mg in 10 µm are injected)
to estimate the affinity towards the stationary phase of the different pseudo-variants
composing the original mixture. Five different experiments were carried out using the
original Gammanorm mixture, using different salt gradients. These are shown in Figure
4.2, where the outlet UV signal is plotted versus the elution experimental time. In the
figure, it can be noticed the sharpening effect due to the increase in the steepness of
the gradient. At the same time, it can be noticed that the typical shoulder on the front
of the peaks is more and more pronounced for longer gradients.
The gradients of Figure 4.2 have been fractionated and the composition of each

96 4. Multi Component Mathematical Modelling of the Adsorption
fraction measured on the analytical column, with the procedure described before. The
α and β constants of the Henry coefficient (see Equation 4.1) have been regressed
individually. In fact, under linear adsorption conditions, the elution behavior of each
pseudo-variant is independent of the others. This procedure also avoids that large errors
in the estimation of the elution behavior of the less concentrated pseudo-variants are
compensated by small errors in the evaluation of the behavior of the more concentrated
ones.
The composition of each pseudo-variant in the different diluted LGE experiments
can be observed in Figures 4.3, where the UV signal is plotted as a function of the non-
dimensional time. The dashed curve is representing the experimental composition, as
computed from the analytical column for each gradient. It can be observed that for
the more concentrated pseudo-variants (variants 2 to 4 in Figures 4.3(b) to (d), respec-
tively), the computed composition is has a regular behavior with a clear maximum,
which is moving to shorter elution times for the shortest gradients. In the case of the
other pseudo-variant, the computed composition is less regular, especially in the case
of pseudo-variants 5 and 6 (Figures 4.3(e) and (f), respectively). This is due to the fact
that these components have small concentrations and are located at the extremes of
the peak. Accordingly, the determination of their concentration is largely affected by
the peak rumor. Note that, in order to remain under linear adsorption conditions, the
injected mass of the Gammanorm mixture had to remain small, making the analysis
of the fractions very difficult.
Previous problems are reflected in the regression of the adsorption isotherm parame-
ters. It can be noticed that, for the main pseudo-variants (Figures 4.3(b) to (d)) a good
regression of the main peaks was possible. The regression of the other variances is still
acceptable, although due to the large scattering of the experimental data, the regression
residuals are larger. In all cases, it can be concluded that the model is able to correctly
regress the average elution time of the peaks for the different gradient slopes. It is
worth pointing out that, together with the α and β constants of the Henry coefficient,
for each pseudo-variant, the Peclet and the Stanton numbers were regressed, in order
to determine the mass transport parameters of each variant. The feed concentration
was not a regression parameter. In all the cases, it was used the feed concentration of
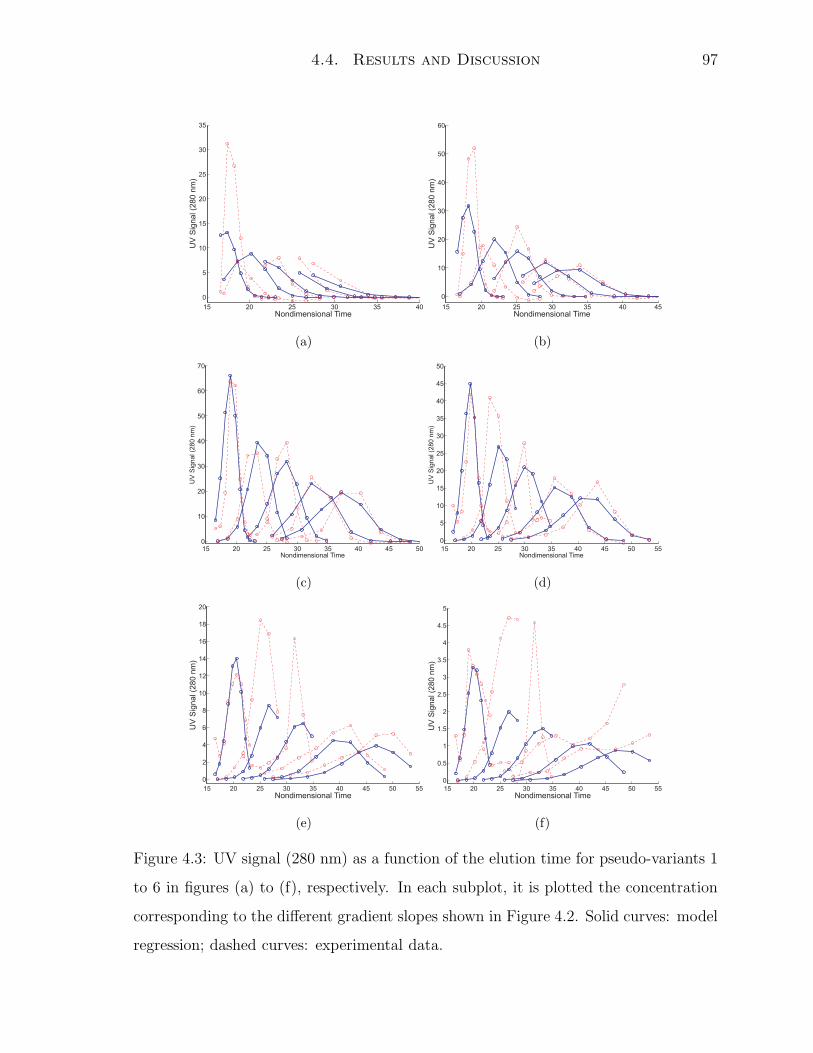
4.4. Results and Discussion 97
(a) (b)
(c) (d)
(e) (f)
Figure 4.3: UV signal (280 nm) as a function of the elution time for pseudo-variants 1
to 6 in figures (a) to (f), respectively. In each subplot, it is plotted the concentration
corresponding to the different gradient slopes shown in Figure 4.2. Solid curves: model
regression; dashed curves: experimental data.

98 4. Multi Component Mathematical Modelling of the Adsorption
Pseudo-variant α β Pe St α-β Correlation
1 2.9700 1.6740 6.4129 · 10−3 41.094 β ≃ −0.18134 α + 2.2113
2 1.4465 2.2958 1.2467 · 10−3 39.065 β ≃ −0.40936 α + 2.8880
3 1.1958 2.6505 6.8535 · 10−7 41.635 β ≃ −0.52807 α + 3.2824
4 1.1452 2.8966 2.5342 · 10−5 34.286 β ≃ −0.60041 α + 3.5849
5 0.69075 3.5056 2.6398 · 10−1 40.286 β ≃ −1.1222 α + 4.2786
6 0.40981 3.9671 9.0435 · 10−1 947.75 β ≃ −2.1000 α + 4.8250
Table 4.3: Values of the parameters corresponding to the best regression of the diluted
LGE experiments (cf. Figure 4.3). The last column represents the best linear fit of the
α-β correlation plots shown in Figure 4.5.
the pseudo-variant computed from the feed concentration of the Gammanorm mixture
and from the composition computed from Figure 4.1. Accordingly, the good matching
between the experimental and the model peak areas is confirming the effectiveness of
the analytical method.
In Figure 4.4, the correlation plots are shown for the fourth pseudo-variant. All the
points shown in the figures correspond to a local minimum found by the regression
routine. Minima whose value of the objective function was within 2% of the global
minimum are plotted only. In the different regression plots between all possible couples
of parameters, it can be observed that a clear correlation can be observed between the
values of α and β and between the Peclet and the Stanton numbers. In other words,
it can be said that the mass transport and the adsorption isotherm parameters are
not correlated with each other. This result can be explained by recalling that the
average retention time of the peaks under linear adsorption conditions is a function of
the isotherm only. Similar plots were obtained for the remaining variants (not shown).
It is now interesting to analyze the correlation plots between α and β for the different
pseudo-variants. This is shown in Figure 4.5, where it is shown, for the different pseudo-
varinats, the points corresponding to a local minimum whose value of the objective
function was within 0.25% of the global minimum (a stricter requirement than that
used for Figure 4.4). It can be observed that, moving from the first to the last pseudo-
variant, the value of β, which represent the steepness of the Henry function as a function
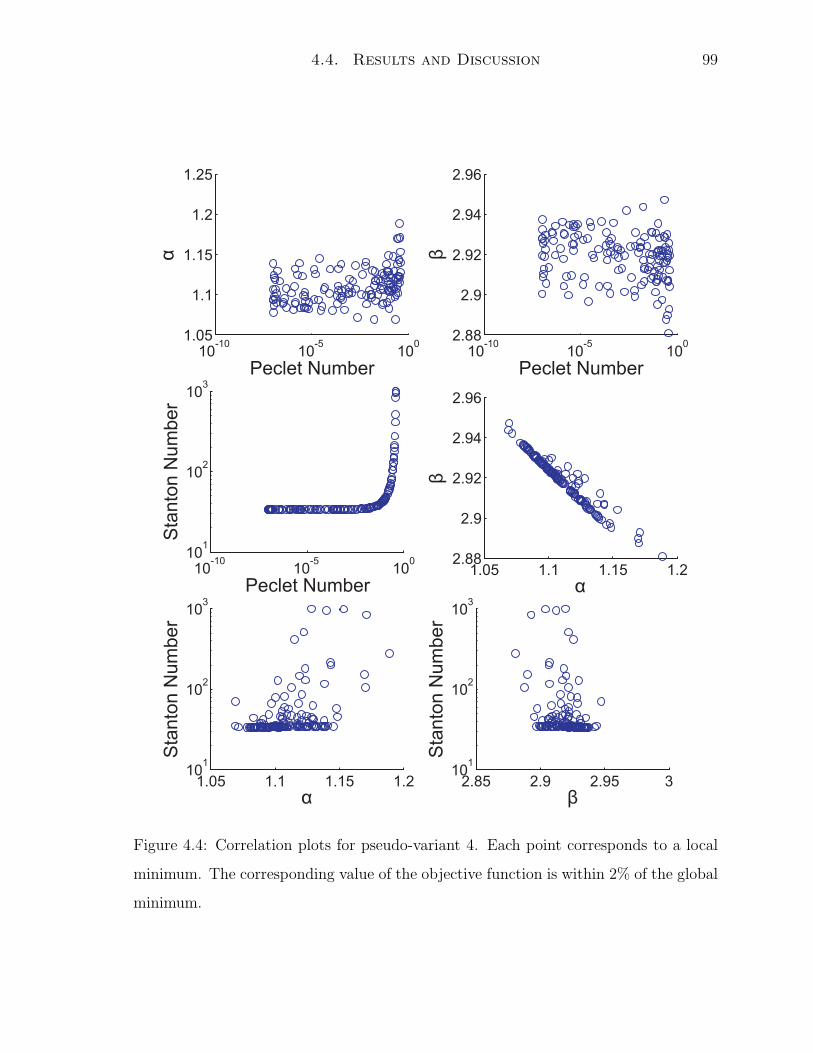
4.4. Results and Discussion 99
Figure 4.4: Correlation plots for pseudo-variant 4. Each point corresponds to a local
minimum. The corresponding value of the objective function is within 2% of the global
minimum.
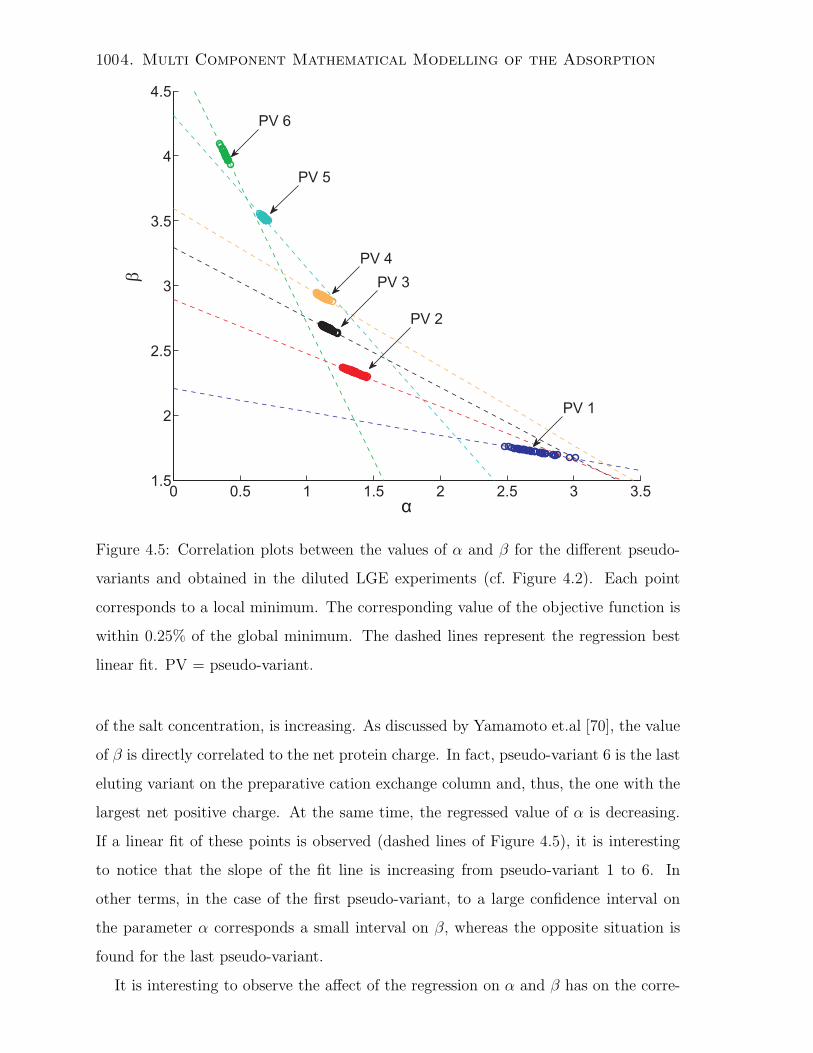
1004. Multi Component Mathematical Modelling of the Adsorption
b
Figure 4.5: Correlation plots between the values of α and β for the different pseudo-
variants and obtained in the diluted LGE experiments (cf. Figure 4.2). Each point
corresponds to a local minimum. The corresponding value of the objective function is
within 0.25% of the global minimum. The dashed lines represent the regression best
linear fit. PV = pseudo-variant.
of the salt concentration, is increasing. As discussed by Yamamoto et.al [70], the value
of β is directly correlated to the net protein charge. In fact, pseudo-variant 6 is the last
eluting variant on the preparative cation exchange column and, thus, the one with the
largest net positive charge. At the same time, the regressed value of α is decreasing.
If a linear fit of these points is observed (dashed lines of Figure 4.5), it is interesting
to notice that the slope of the fit line is increasing from pseudo-variant 1 to 6. In
other terms, in the case of the first pseudo-variant, to a large confidence interval on
the parameter α corresponds a small interval on β, whereas the opposite situation is
found for the last pseudo-variant.
It is interesting to observe the affect of the regression on α and β has on the corre-
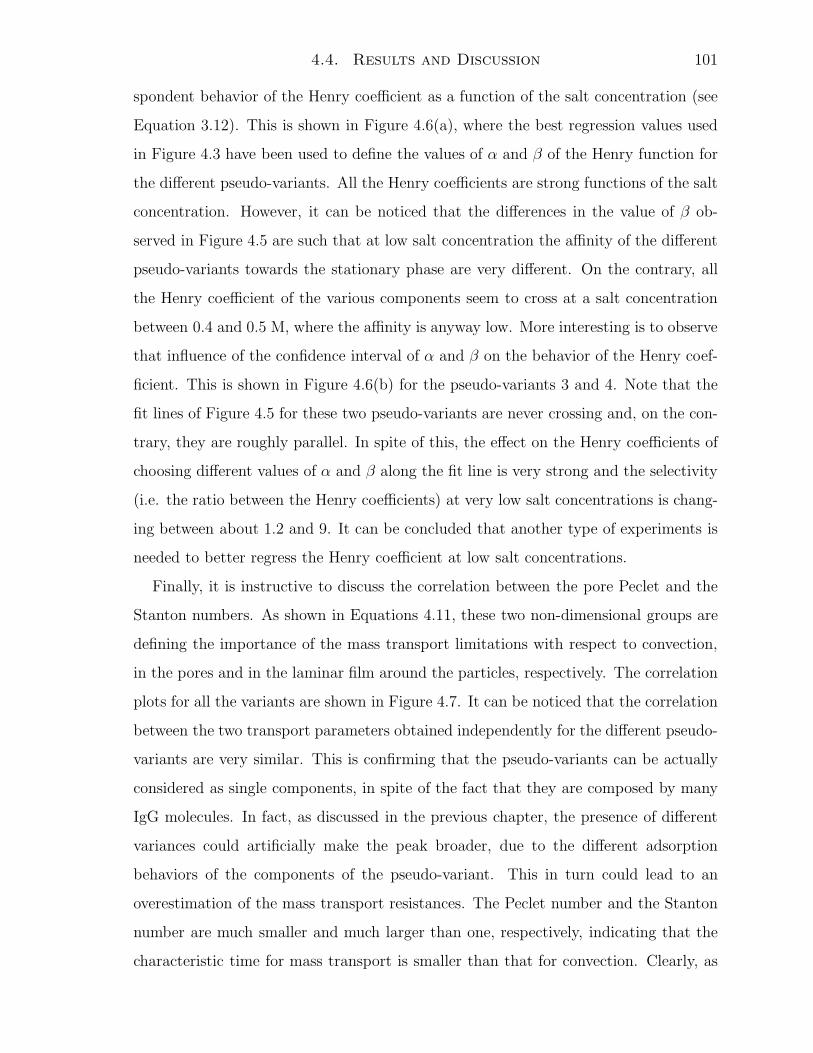
4.4. Results and Discussion 101
spondent behavior of the Henry coefficient as a function of the salt concentration (see
Equation 3.12). This is shown in Figure 4.6(a), where the best regression values used
in Figure 4.3 have been used to define the values of α and β of the Henry function for
the different pseudo-variants. All the Henry coefficients are strong functions of the salt
concentration. However, it can be noticed that the differences in the value of β ob-
served in Figure 4.5 are such that at low salt concentration the affinity of the different
pseudo-variants towards the stationary phase are very different. On the contrary, all
the Henry coefficient of the various components seem to cross at a salt concentration
between 0.4 and 0.5 M, where the affinity is anyway low. More interesting is to observe
that influence of the confidence interval of α and β on the behavior of the Henry coef-
ficient. This is shown in Figure 4.6(b) for the pseudo-variants 3 and 4. Note that the
fit lines of Figure 4.5 for these two pseudo-variants are never crossing and, on the con-
trary, they are roughly parallel. In spite of this, the effect on the Henry coefficients of
choosing different values of α and β along the fit line is very strong and the selectivity
(i.e. the ratio between the Henry coefficients) at very low salt concentrations is chang-
ing between about 1.2 and 9. It can be concluded that another type of experiments is
needed to better regress the Henry coefficient at low salt concentrations.
Finally, it is instructive to discuss the correlation between the pore Peclet and the
Stanton numbers. As shown in Equations 4.11, these two non-dimensional groups are
defining the importance of the mass transport limitations with respect to convection,
in the pores and in the laminar film around the particles, respectively. The correlation
plots for all the variants are shown in Figure 4.7. It can be noticed that the correlation
between the two transport parameters obtained independently for the different pseudo-
variants are very similar. This is confirming that the pseudo-variants can be actually
considered as single components, in spite of the fact that they are composed by many
IgG molecules. In fact, as discussed in the previous chapter, the presence of different
variances could artificially make the peak broader, due to the different adsorption
behaviors of the components of the pseudo-variant. This in turn could lead to an
overestimation of the mass transport resistances. The Peclet number and the Stanton
number are much smaller and much larger than one, respectively, indicating that the
characteristic time for mass transport is smaller than that for convection. Clearly, as

1024. Multi Component Mathematical Modelling of the Adsorption
(a)
(b)
Figure 4.6: Henry coefficient as a function of the salt concentration. (a) Henry function
for the different pseudo-variants found using the values of α and β corresponding to
the best regression of Figure 4.3. (b) Henry function of the pseudo-variants 3 and 4
found by moving along the fit line of Figure 4.5.
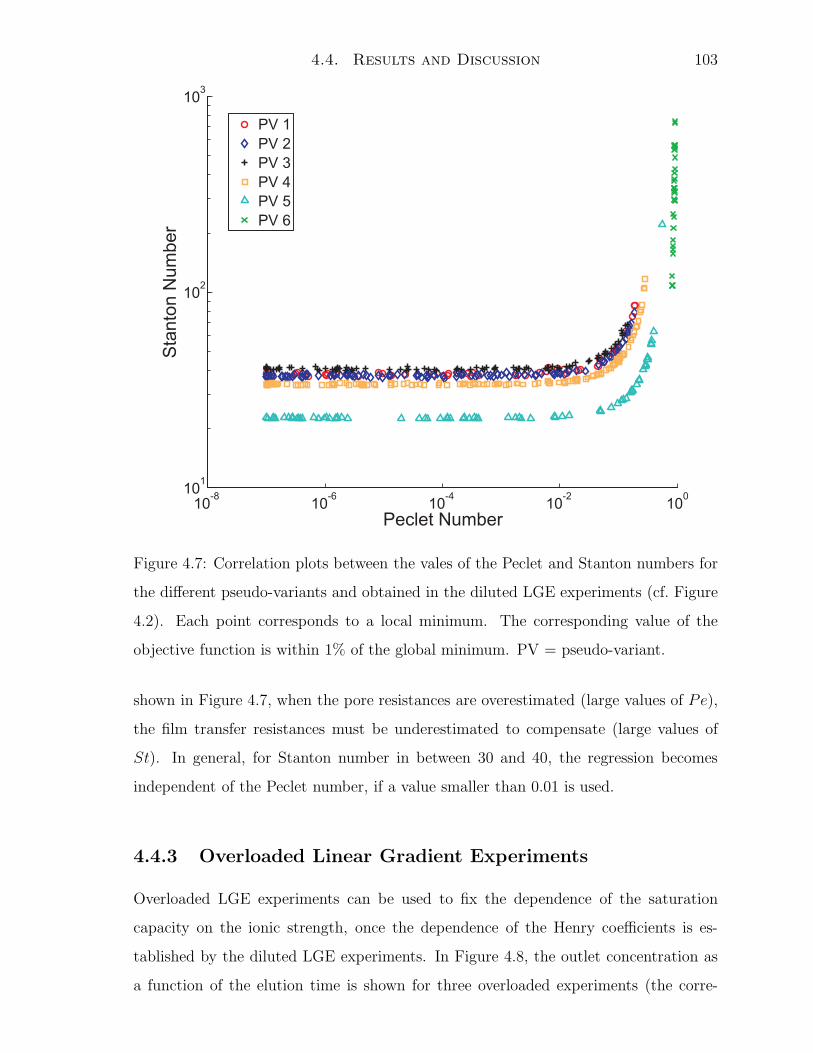
4.4. Results and Discussion 103
Figure 4.7: Correlation plots between the vales of the Peclet and Stanton numbers for
the different pseudo-variants and obtained in the diluted LGE experiments (cf. Figure
4.2). Each point corresponds to a local minimum. The corresponding value of the
objective function is within 1% of the global minimum. PV = pseudo-variant.
shown in Figure 4.7, when the pore resistances are overestimated (large values of Pe),
the film transfer resistances must be underestimated to compensate (large values of
St). In general, for Stanton number in between 30 and 40, the regression becomes
independent of the Peclet number, if a value smaller than 0.01 is used.
4.4.3 Overloaded Linear Gradient Experiments
Overloaded LGE experiments can be used to fix the dependence of the saturation
capacity on the ionic strength, once the dependence of the Henry coefficients is es-
tablished by the diluted LGE experiments. In Figure 4.8, the outlet concentration as
a function of the elution time is shown for three overloaded experiments (the corre-

1044. Multi Component Mathematical Modelling of the Adsorption
Figure 4.8: Outlet concentration as a function of the elution time for different linear
gradient elution experiments using the original Gammanorm under overloaded con-
ditions. The masses are referring to the injected mass of Gammanorm. Initial ionic
strength = 0.07 M; final ionic strength = 1.02 M; gradient start = 5 min; gradient
duration = 30 min.
sponding injected masses of the Gammanorm mixture are shown in the figure). It can
be observed that, as the injection mass is increased, the peak front is moving towards
shorter elution times, as a consequence of the saturation of the stationary phase. The
peak rear is not moving, coherently with the theory for Langmuir isotherms. On the
other hand, the typical concentration shock on the peak front predicted by the theory
is absent and, on the contrary, the peak remains rather symmetrical. This effect is due
to the dominant mass transport limitations.
The regression of the overloaded experiments proceeded as follows. First, the coeffi-
cients γ, δ and ǫ of the saturation capacity expression (see Equation 4.13) were assumed
to be equal for all the pseudo-variants. In fact, it is here assumed that the saturation
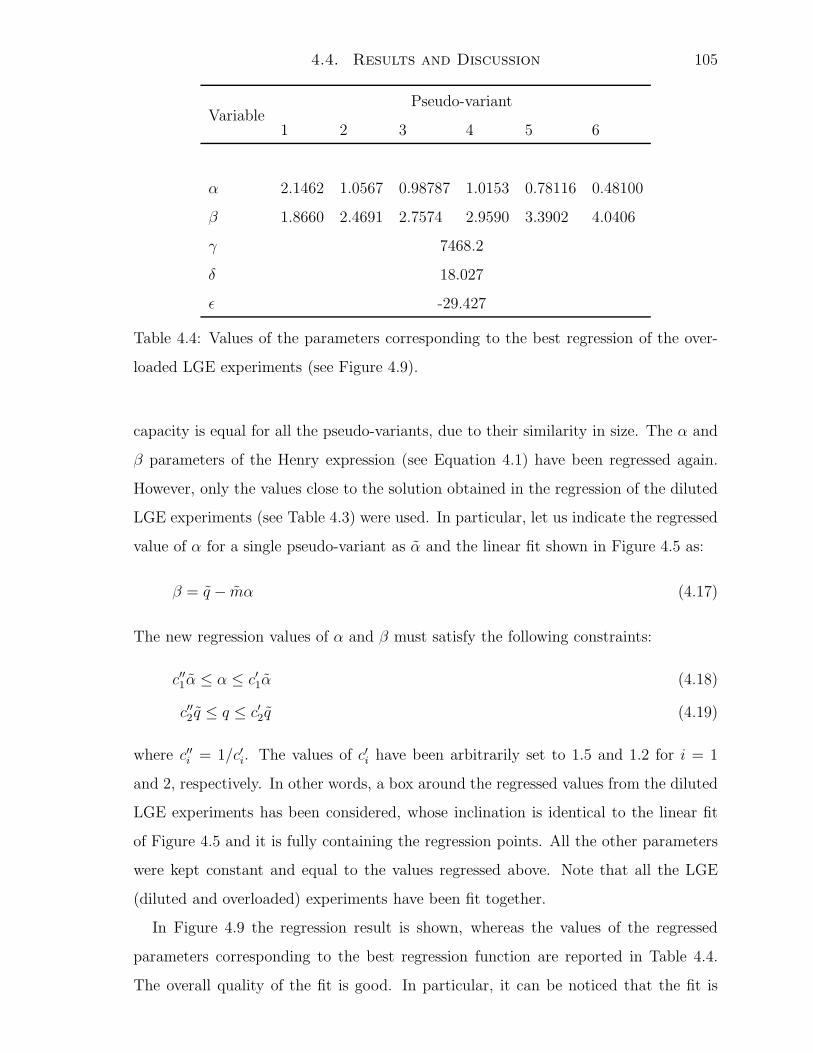
4.4. Results and Discussion 105
VariablePseudo-variant
1 2 3 4 5 6
α 2.1462 1.0567 0.98787 1.0153 0.78116 0.48100
β 1.8660 2.4691 2.7574 2.9590 3.3902 4.0406
γ 7468.2
δ 18.027
ǫ -29.427
Table 4.4: Values of the parameters corresponding to the best regression of the over-
loaded LGE experiments (see Figure 4.9).
capacity is equal for all the pseudo-variants, due to their similarity in size. The α and
β parameters of the Henry expression (see Equation 4.1) have been regressed again.
However, only the values close to the solution obtained in the regression of the diluted
LGE experiments (see Table 4.3) were used. In particular, let us indicate the regressed
value of α for a single pseudo-variant as α and the linear fit shown in Figure 4.5 as:
β = q − mα (4.17)
The new regression values of α and β must satisfy the following constraints:
c′′1α ≤ α ≤ c′1α (4.18)
c′′2 q ≤ q ≤ c′2q (4.19)
where c′′i = 1/c′i. The values of c′i have been arbitrarily set to 1.5 and 1.2 for i = 1
and 2, respectively. In other words, a box around the regressed values from the diluted
LGE experiments has been considered, whose inclination is identical to the linear fit
of Figure 4.5 and it is fully containing the regression points. All the other parameters
were kept constant and equal to the values regressed above. Note that all the LGE
(diluted and overloaded) experiments have been fit together.
In Figure 4.9 the regression result is shown, whereas the values of the regressed
parameters corresponding to the best regression function are reported in Table 4.4.
The overall quality of the fit is good. In particular, it can be noticed that the fit is
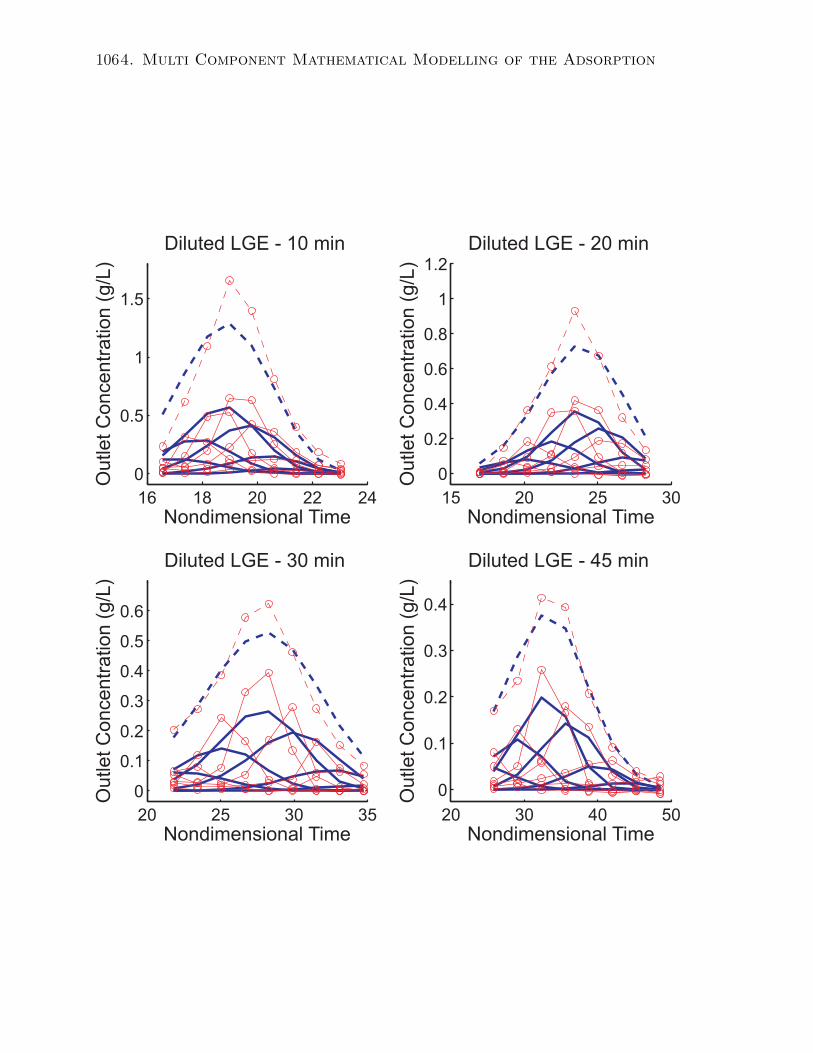
1064. Multi Component Mathematical Modelling of the Adsorption
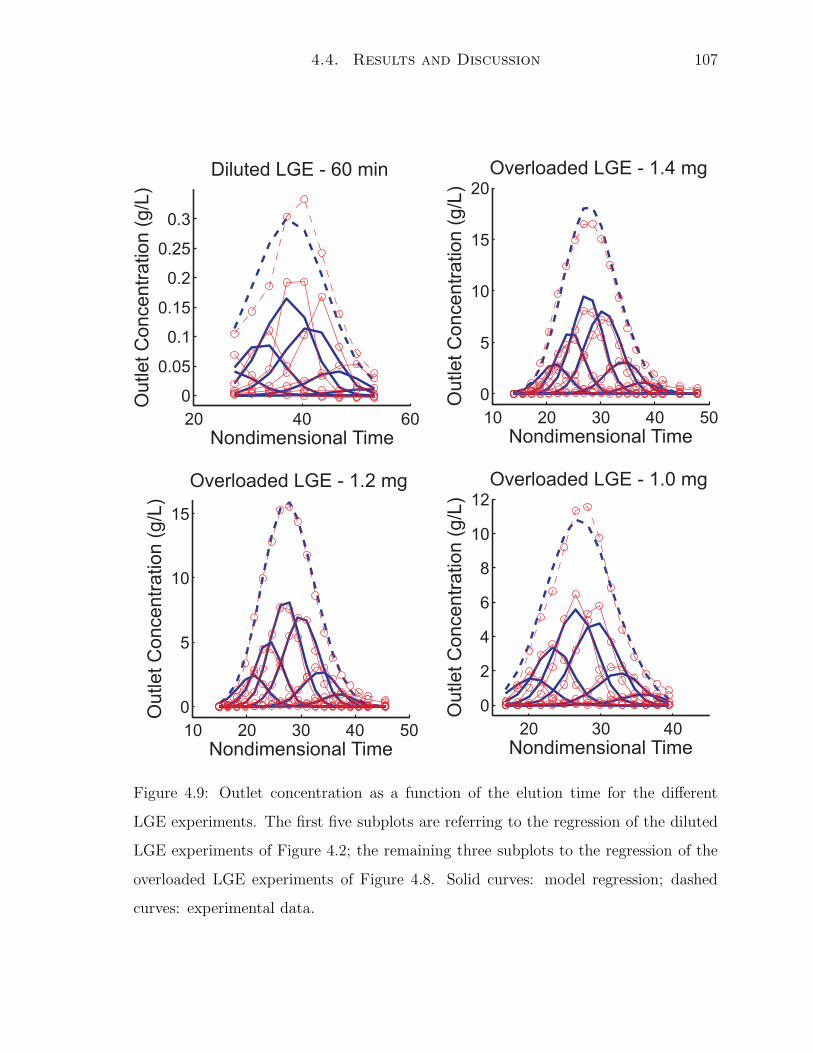
4.4. Results and Discussion 107
Figure 4.9: Outlet concentration as a function of the elution time for the different
LGE experiments. The first five subplots are referring to the regression of the diluted
LGE experiments of Figure 4.2; the remaining three subplots to the regression of the
overloaded LGE experiments of Figure 4.8. Solid curves: model regression; dashed
curves: experimental data.

1084. Multi Component Mathematical Modelling of the Adsorption
particularly good in the case of the overloaded experiments, where a very good matching
between experiments and model is obtained for both the overall concentration (dashed
curves) and the concentrations of the single pseudo-variants (solid curves). It can
be observed that the peak displacement at large overloading conditions is very well
predicted. To this regard, it must be pointed out that the quality of the overloaded
experiments was particularly good, due to the fact that the large outlet concentration
in each fraction made easy the following composition analysis on the analytical IEX
column. The regular behavior of the experiments, as compared to the scattering of the
ones in the diluted gradients, clearly helped the regression. This is particularly true
for the less concentrated pseudo-variants at the peak extremes. This fact can be noted
by comparing the regressed values of the parameters for the diluted (Table 4.3) and for
the overloaded experiments (Table 4.4). It can be observed that small changes have
been introduced in the values of α and β. This is especially the case of the central
(more concentrated) pseudo-variants, whereas larger changes are seen for the first and
the last pseudo-variants. In this case, the good quality of the overloaded gradients
allowed to adjust the uncertainty in the Henry parameters due to the large scattering
of the diluted gradients. A better view upon the values of α and β is found in Figure
4.10, where the regressed values of these parameters for all the variants is shown for
the diluted (circles) and the overloaded (diamonds) LGE experiments. As for Figure
4.5, only the points corresponding to a local minimum whose value of the objective
function was within 0.25% of the global minimum were plotted. It can be noted that for
pseudo-variants 2 to 5 the old regression points are overlapping to the new ones. This
is not the case for pseudo-variants 1 and 6, although the differences remain limited.
Finally, it is interesting to analyze the correlation between the remaining parameters.
There is little correlation among the values of β of the different variants (not shown).
The objective function for the regression is defined as the quadratic error between the
experimental concentration and that predicted by the model for each pseudo-variant.
As a consequence, the parameter correlation was minimized. On the other hand,
some degree of correlation can be observed for the parameters defining the saturation
capacity, γ, δ and ǫ. This can be observed in Figure 4.11. No correlation can be
observed between γ and the other two parameters. However, it is clear that some
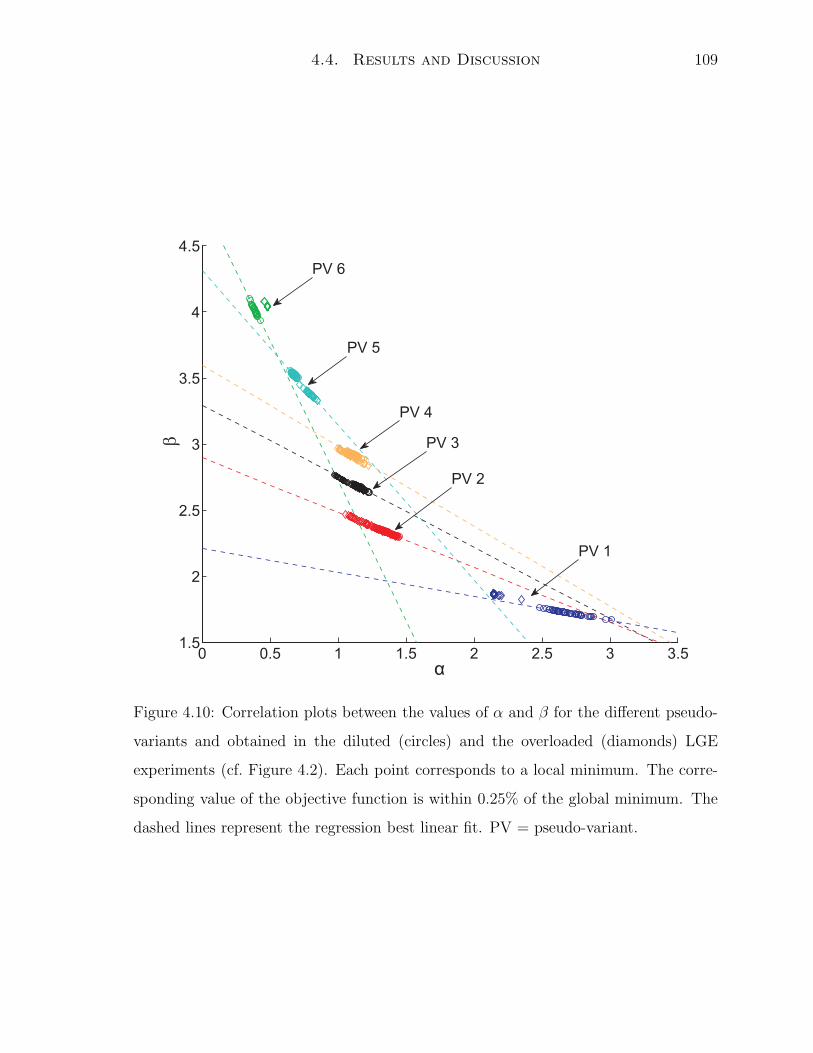
4.4. Results and Discussion 109
b
Figure 4.10: Correlation plots between the values of α and β for the different pseudo-
variants and obtained in the diluted (circles) and the overloaded (diamonds) LGE
experiments (cf. Figure 4.2). Each point corresponds to a local minimum. The corre-
sponding value of the objective function is within 0.25% of the global minimum. The
dashed lines represent the regression best linear fit. PV = pseudo-variant.

1104. Multi Component Mathematical Modelling of the Adsorption
correlation exists between δ and ǫ. The reason of this correlation can be found by
analyzing the computed behavior of the saturation capacity as a function of the ionic
strength. By inserting any of the value of δ and ǫ in the definition of the saturation
capacity (Equation 4.13), it can be seen that for ionic strength much smaller than one
the argument of the exponent is always much smaller than zero, i.e. the exponent
is tending to zero. Accordingly, under these conditions the saturation capacity is
constant with the ionic strength and equal to γ. As already noticed in Chapter 3,
this result seems to indicate that the saturation capacity is really representing the
maximum surface occupation of the stationary phase, coherently with the definition of
the Langmuir isotherm. This in spite of the fact that many works indicated that also
the saturation capacity is a function of the ionic strength (i.e. emptying the parameter
of its physical meaning) [35, 40, 107, 108, 109, 110].
4.4.4 Prediction of Breakthrough Experiments
Previous values of the mass transport and isotherm parameters are used here to predict
the elution profiles of two breakthrough experiments carried out at different salt con-
centrations. This is shown in Figures 4.12(a) and (b), where the outlet concentration
of the single psuedo-variants is shown as a function of time for the breakthrough exper-
iment using an ionic strength of 0.07 and 0.12M, respectively. The general agreement
is satisfactory. This is particularly true for the breakthrough curve at the smaller ionic
strength (Figure 4.12(a)). Here, it can be observed that the slope of the total concen-
tration, as well as the breakthrough time, are well predicted. The same can be said
for the competition between the pseudo-variants, with the exception of the first one,
which is eluting too early. In the case of the second breakthrough (Figure 4.12(b)), the
agreement is not as satisfactory. The breakthrough time is well predicted. However,
the overall concentration profile is not exhibiting the shoulder observed in the experi-
mental data. Moreover, the competition between the psuedo-variants is almost absent,
while it is very pronounced in the experiments.
The parameters of the Henry coefficients have been regressed again, together with
all the LGE experiments, in order to improve the description of the previous break-
through experiments. The parameters were left to change within 20% of the value

4.4. Results and Discussion 111
Figure 4.11: Correlation plots between the saturation capacity parameters (cf. Equa-
tion 4.13) regressed from the overloaded LGE experiments (cf. Figure 4.2). Each point
corresponds to a local minimum. The corresponding value of the objective function is
within 0.25% of the global minimum.

1124. Multi Component Mathematical Modelling of the Adsorption
(a)
(b)
Figure 4.12: Outlet concentration as a function of time for two breakthrough experi-
ments, using an ionic strength of (a) 0.07 and (b) 0.12M. The values of the parameters
found in the LGE experiments are used. Solid curves: pseudo-variant concentration;
dashed curves: total concentration; black curves: model prediction; gray curves: ex-
perimental data.

4.5. Conclusions 113
regressed in the overloaded LGE experiments (see Table 4.3). The same saturation
capacity as in the overloaded LGE experiments has been used, still keeping this value
equal for all the pseudo-variants. The final result of the regression is shown in Figures
4.13(a) and (b), where the outlet concentration of the single psuedo-variants is shown
as a function of time for the breakthrough experiment using an ionic strength of 0.07
and 0.12M, respectively. The fit on all the LGE experiments is shown in Figure 4.14.
In Figures 4.13, it can be observed that the regression of the first breakthrough ex-
periment is further improved. The overall concentration is almost perfectly matching
the experimental profile. This result has been mainly obtained by adjusting the Henry
coefficients of the first pseudo-variant, which was early eluting in Figure 4.12(a). Also
the overall profile of the second breakthrough is improved (Figures 4.13(b)). However,
the competition among the pseudo-variants is still not predicted correctly. Negligible
variations can be observed in the prediction of the remaining LGE experiments shown
in Figure 4.14.
4.5 Conclusions
In this Chapter, a new procedure for the identification of a pre-defined number of
pseudo-variants from a single analysis on a non-porous analytical weak cation exchange
column is presented. The polyclonal antibody mixture analyzed in this study is made
of a very large number of different antibodies and the analytical identification of all this
components can be very difficult. On the other hand, the description of the adsorption
behavior of the mixture can be carried out by identifying a limited number of pseudo-
variants, which are covering the entire range of components of the original mixture.
A regression procedure for the determination of the mass transport and the ad-
sorption isotherm parameters is discussed. Simple isocratic experiments under non-
adsorption conditions were carried out to determine the column porosity. The mass
transport parameters and the linear part of the adsorption isotherm have been instead
estimated by diluted linear gradient elution experiments. The regression has been done
separately for each variant. The analysis of the regression result evidenced that the
transport parameters are strongly correlated to each other, as well as the parameters of
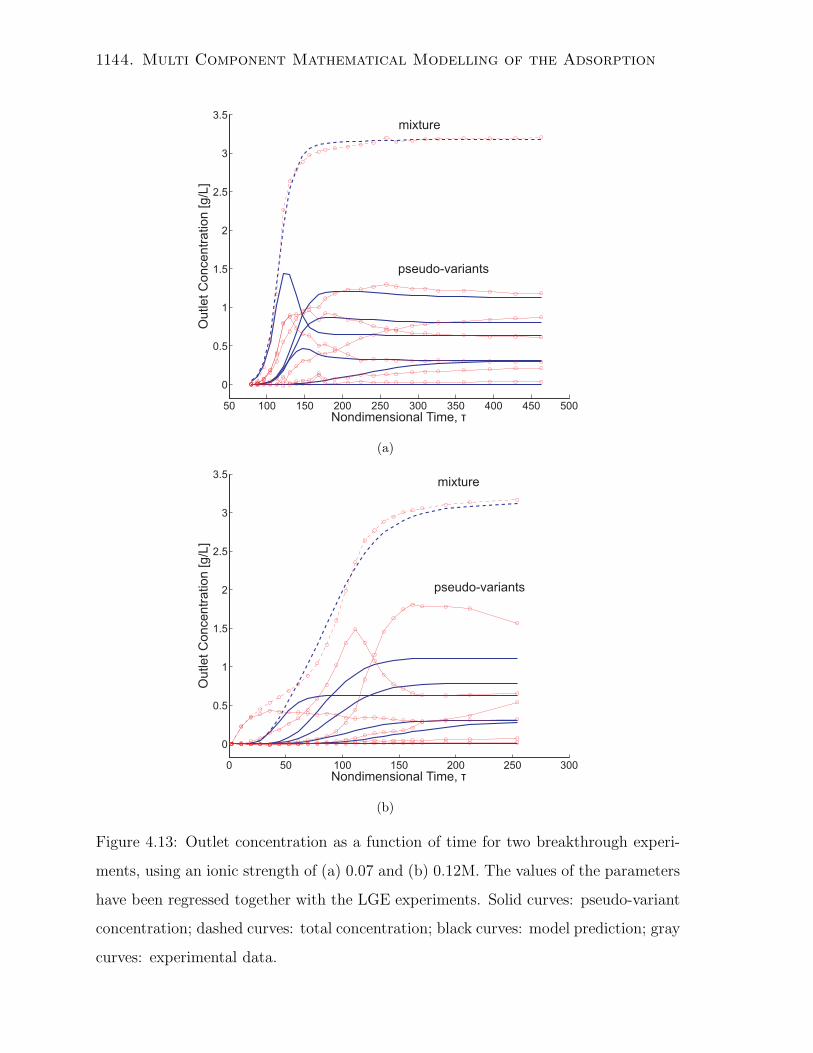
1144. Multi Component Mathematical Modelling of the Adsorption
mixture
pseudo-variants
(a)
mixture
pseudo-variants
(b)
Figure 4.13: Outlet concentration as a function of time for two breakthrough experi-
ments, using an ionic strength of (a) 0.07 and (b) 0.12M. The values of the parameters
have been regressed together with the LGE experiments. Solid curves: pseudo-variant
concentration; dashed curves: total concentration; black curves: model prediction; gray
curves: experimental data.
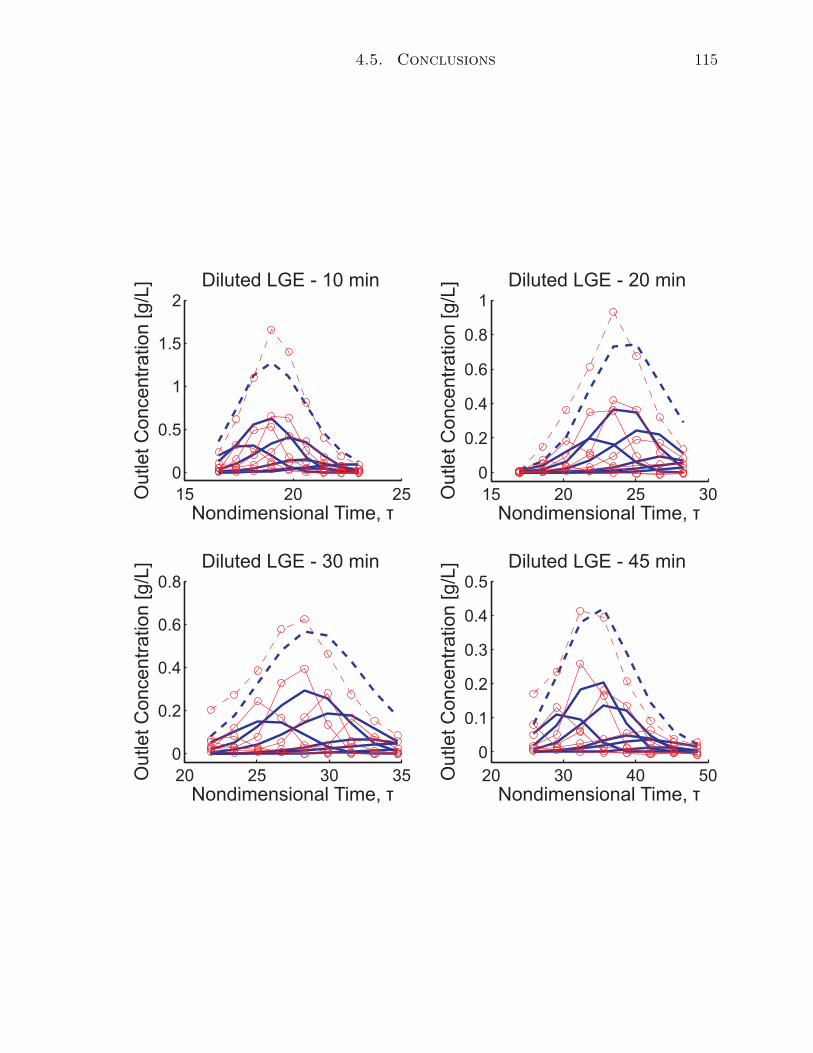
4.5. Conclusions 115
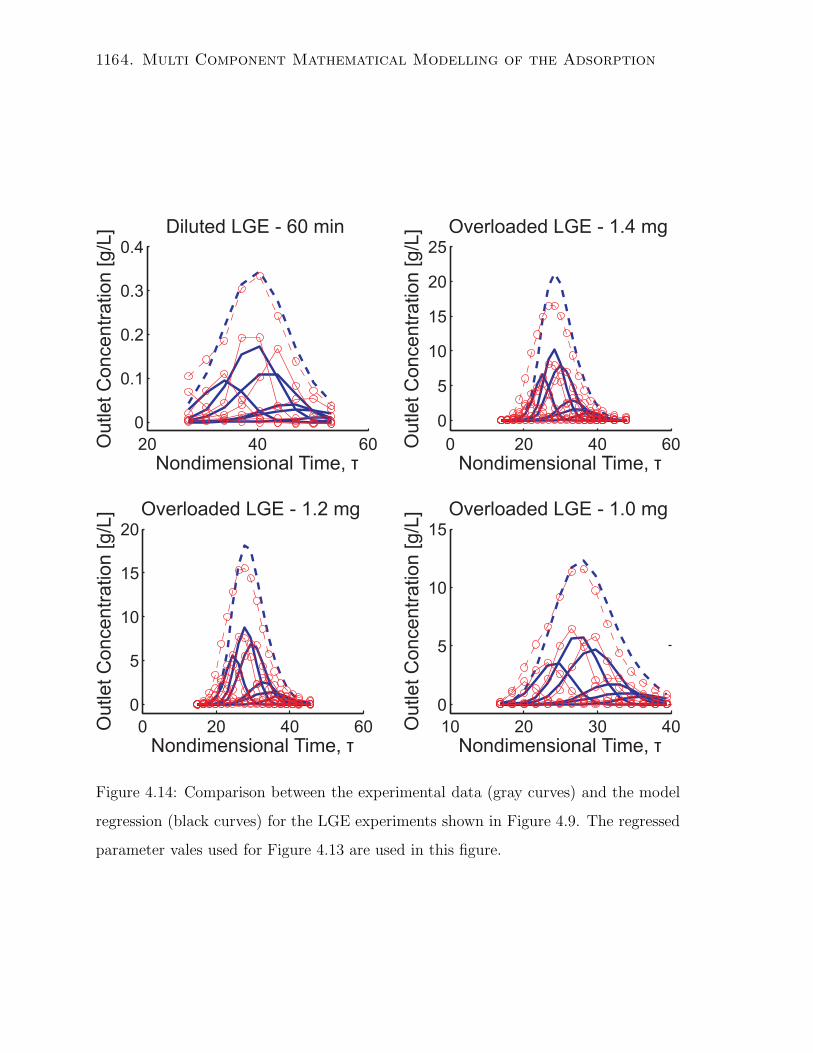
1164. Multi Component Mathematical Modelling of the Adsorption
Figure 4.14: Comparison between the experimental data (gray curves) and the model
regression (black curves) for the LGE experiments shown in Figure 4.9. The regressed
parameter vales used for Figure 4.13 are used in this figure.

4.5. Conclusions 117
the Henry coefficient. On the other hand, no important correlation was found between
the two groups of parameters.
A further refinement of the adsorption parameters has been done using the over-
loaded linear gradient elution experiments. With the exception of the least concen-
trated pseudo-variant, for which a large data scattering was present in the diluted
gradients, negligible changes have been introduced in the regressed values of the Henry
parameters. On the other hand, it has been possible to estimate the saturation capac-
ity of the column. As in the case of Chapter 3, it has been confirmed that this can
be assumed roughly independent of the ionic strength and equal for all the pseudo-
variants. In fact, a very good description of the overall elution profile, as well as of the
displacements effects among the components, has been obtained.
Unfortunately, the very good results in the description of the gradients experiments
did not lead to equally good results in the description of the breakthrough experi-
ments. Although there is a general acceptable agreement between the experiments and
the model prediction (i.e. without any parameter adjustment), the increase in model
complexity did not bring substantial improvements in the prediction capabilities of the
model. The same result has been obtained after an additional regression of all the
experiments. This is particularly true for the breakthrough experiment at larger ionic
strength.
Many reasons can be found for this result. First, the very large sensitivity of the
adsorption isotherm to the operating conditions (ionic strength and pH) makes this
experiments very difficult to be carried out. This is particularly true for the largest
ionic strengths, for which the adsorption isotherms are no more rectangular. On the
other hand, when using very small salt concentrations, the isotherm becomes soon
rectangular and, being the saturation capacity almost constant, a smaller sensitivity
can be expected. In fact, under this conditions it is possible to well reproduce the
experimental profiles. Another cause for the unsatisfactory regression can be found
is possible changes of the pH value due to salt displacement. This would affect the
adsorption isotherm is a way that is not accounted for in this work. Finally, a large
influence could be played by the changes in porosity due to adsorption, as reported
by many authors [15, 18, 27, 41, 42]. This could dramatically change the competition

1184. Multi Component Mathematical Modelling of the Adsorption
behavior inside the particles. This argument is the object of investigation of the next
chapter.
Chapter 5
Porosity Investigation
5.1 Introduction
High pressure liquid chromatography (HPLC) is the method of choice for the down
streaming process of various active pharmaceutical ingredients (APIs) in the pharma-
ceutical industry [132]. Although relatively expensive, liquid chromatography has the
big advantage of allowing good separations using very mild conditions. This is very
important especially for very sensible biomolecules like peptides and proteins. Pack-
ing materials with highly porous beads are typically used for this scope. Among the
different beads available on the market, those based on polymeric supports are partic-
ularly important in biomolecule purifications, due to the possibility of sanitize them
[133]. These materials can be functionalized with different groups, such as charged
groups (ion-exchange chromatography), groups with an hydrophobic character (hy-
drophobic interaction chromatography) or groups which can interact specifically with
other molecules (affinity chromatography). Ion exchange chromatography (IEX) is
widely used for the purification of proteins, since the different proteins can be effec-
tively separated according to their charge distribution [116]. Moreover, the entire pu-
rification process can be done under physiological conditions and therefore not affecting
the bioactivity of the protein [70].
In preparative IEX chromatography, 40 to 100 µm highly porous particles, with pore
diameters ranging from 100 to 1000 A, are generally used [134]. The formation of the
particle porosity must meet two conflicting needs. On one hand, that of forming very
119
120 5. Porosity investigation
small pores, so to increase the total surface area available for adsorption. On the other,
to have pores large enough to allow for the transport of the solutes. This dichotomy
becomes especially important in the case of large biomolecules. Large proteins can have
in fact hydrodynamic diameters as large as 100 A, that is very similar to the average
diameter of most of the available stationary phases, and therefore pore accessibility
of only 20 to 60% of the total available pore volume [94, 134, 135]. This is not only
detrimental to the total static capacity of the support, but it has major consequences
on the protein mass transport inside the beads. Under such conditions in fact hindrance
becomes very pronounced and, thus, the effective pore diffusion rate of these molecules,
already small due to their size, becomes even smaller. As a consequence, elution peaks
become broader, thus decreasing peak resolution, and the dynamic capacity drops fast
with increasing flow rates [134].
Several factors can have a large influence in determining pore accessibility of bio-
molecules. First, hindrance can clearly worsen under adsorption conditions, since the
presence of adsorbed molecules further reduces the available pore diameter for trans-
port. Several authors have investigated the change in the effective pore diffusion rate
with increasing loading, reporting a sensible decrease [18, 41, 42]. The same effect
can be expected in those materials where the ionic ligand is carried by the so-called
tentacles [136], that is a polymeric chain attached to the polymer surface. Tentacles
made of some hundreds of monomer units can have dimensions similar to those of the
pores and, thus, a large influence on the transport of large molecules. In particular,
it is interesting to investigate the behavior of such tentacles under different operating
conditions, i.e. salt concentrations. Charge shielding and salting-out effects can in fact
change the tentacle conformation and, then, its hindrance effect on the transport of
large molecules.
The knowledge of the pore size distribution is especially important in the numerical
modelling of chromatographic processes. Peak shape and elution time are a function of
the accessible pore volume, the overall retention factor, k′, and the overall rate of mass
transport [63]. All these parameters are direct function of the pore size distribution.
The retention factor can in fact be regarded as given by the product of two coefficients:
the specific retention factor of the surface, which is quantifying the affinity of the

5.2. Materials and Methods 121
solute towards the support, and the total accessible surface area. At the same time,
the rate determining step in the mass transport of large biomolecules is pore diffusion.
Accordingly, the knowledge of how the pore size distribution changes for different
operating conditions is fundamental for the prediction of the column behavior, and
small errors can lead to highly inaccurate model predictions [15].
Several works exist which are measuring the pore size distribution of stationary
phases under non-adsorbing conditions [94, 134, 135, 137]. Few reports can be found
on the change of the pore size distribution under adsorbing conditions, i.e. low salt
concentrations [66]. At the same time, several works can be found where the pore diffu-
sivity of biomolecules is measured directly with off-line experiments [138], or indirectly
by regressing it with both off- [41, 66] and on-line [116, 139, 140] experiments. However,
to our best knowledge, no investigation is available on the pore size distribution under
true working conditions, i.e. low salt concentrations and high loadings. In this chapter,
we focus on the direct measurement of porosity on ion-exchange resins with tentacles,
namely Fractogel EMD COO- (S) and Fractogel LLD (M). The former is a commercial
material, which is particularly suited for the purification of large bio-molecules. The
latter has been specifically synthesized for this work and is characterized by a lower
tentacle density on the surface. As it will be discussed, the measure of the pore size
distribution under typical working conditions was possible thanks to the careful choice
of a polymeric tracer, which does not interact neither with the support nor with the
adsorbed proteins.
5.2 Materials and Methods
Stationary phase and columns
Two ion exchange materials have been selected for this work: Fractogel EMD COO-
(S) and Fractogel LLD (M). Fractogel EMD COO- (S) is a commercial stationary phase
and was purchased from Merck (Germany). Fractogel LLD (M) was synthesized for
this work by Merck (Germany). The properties of the two materials are summarized
in Table 5.1. The chemistry of the base matrix is the same for both materials and
both are functionalized using the tentacles technology [141]. Fractogel EMD COO-
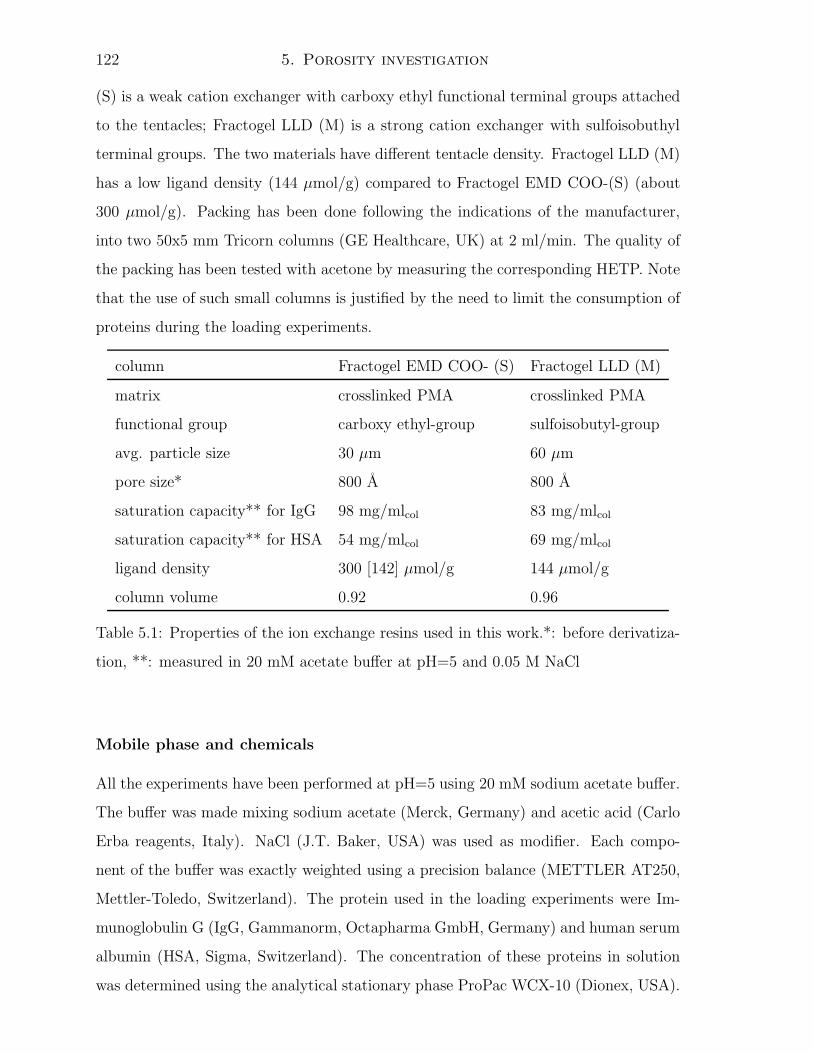
122 5. Porosity investigation
(S) is a weak cation exchanger with carboxy ethyl functional terminal groups attached
to the tentacles; Fractogel LLD (M) is a strong cation exchanger with sulfoisobuthyl
terminal groups. The two materials have different tentacle density. Fractogel LLD (M)
has a low ligand density (144 µmol/g) compared to Fractogel EMD COO-(S) (about
300 µmol/g). Packing has been done following the indications of the manufacturer,
into two 50x5 mm Tricorn columns (GE Healthcare, UK) at 2 ml/min. The quality of
the packing has been tested with acetone by measuring the corresponding HETP. Note
that the use of such small columns is justified by the need to limit the consumption of
proteins during the loading experiments.
column Fractogel EMD COO- (S) Fractogel LLD (M)
matrix crosslinked PMA crosslinked PMA
functional group carboxy ethyl-group sulfoisobutyl-group
avg. particle size 30 µm 60 µm
pore size* 800 A 800 A
saturation capacity** for IgG 98 mg/mlcol 83 mg/mlcol
saturation capacity** for HSA 54 mg/mlcol 69 mg/mlcol
ligand density 300 [142] µmol/g 144 µmol/g
column volume 0.92 0.96
Table 5.1: Properties of the ion exchange resins used in this work.*: before derivatiza-
tion, **: measured in 20 mM acetate buffer at pH=5 and 0.05 M NaCl
Mobile phase and chemicals
All the experiments have been performed at pH=5 using 20 mM sodium acetate buffer.
The buffer was made mixing sodium acetate (Merck, Germany) and acetic acid (Carlo
Erba reagents, Italy). NaCl (J.T. Baker, USA) was used as modifier. Each compo-
nent of the buffer was exactly weighted using a precision balance (METTLER AT250,
Mettler-Toledo, Switzerland). The protein used in the loading experiments were Im-
munoglobulin G (IgG, Gammanorm, Octapharma GmbH, Germany) and human serum
albumin (HSA, Sigma, Switzerland). The concentration of these proteins in solution
was determined using the analytical stationary phase ProPac WCX-10 (Dionex, USA).
5.2. Materials and Methods 123
Chromatography equipment
The same chromatographic equipment as in the previous chapters has been used.
Selection of the porosity tracers
Polymeric tracers for porosity measurements must fulfill the following characteristics:
• negligible adsorption under the experimental conditions
• narrow molecular weight distribution
• well defined molecular size (or hydrodynamic radius)
• negligible change in size at the investigated operating conditions
• good UV and RI visibility
A polymer fulfilling most of the above requirements is polyvinylpyrrolidone (PVP).
However, PVP is only commercially available with broad molecular weight distribu-
tions. Three PVP products were selected: PVP K12 (avg MW 3 500 g/mol, Acros or-
ganics, USA), PVP K30 (avg MW 40 000 g/mol AppliChem, Germany) and PVP K90
(avg MW 360 000 g/mol, Acros organics, USA). In order to obtain narrow distributed
polymer fractions, PVPs were fractionated using two size exclusion chromatography
(SEC) columns in series: a 300x7.5 mm TSKgel G4000PWXL column (Tosoh bio-
science, Japan) followed by a 300x10 mm Supedex75 10/300 GL column (GE Health-
care, UK). The exclusion limits for the two columns are (in dextran equivalents): 1 000
to 700 000 g/mol and 500 to 40 000 g/mol, respectively. Pure water was used as solvent
in the fractionation. Successively, the collected fractions were dried in a oven in order
to obtain pure polymers in solid state. The SEC traces of the selected fractions as
measured on the TSKgel G4000PWXL SEC column are shown in Figure 5.1, where
the traces of the original polymers are also shown. The same column, previously cal-
ibrated using polyethylenglycol (PEG) tracers with known size (from 200 to 35 000
g/mol) [143], was used to evaluate the average molecular weight of the PVP fractions.
PVP 90 fraction 1 is excluded from the pores of the SEC column and its hydrodynamic
diameter was measured using dynamic light scattering (DLS). The characteristics of
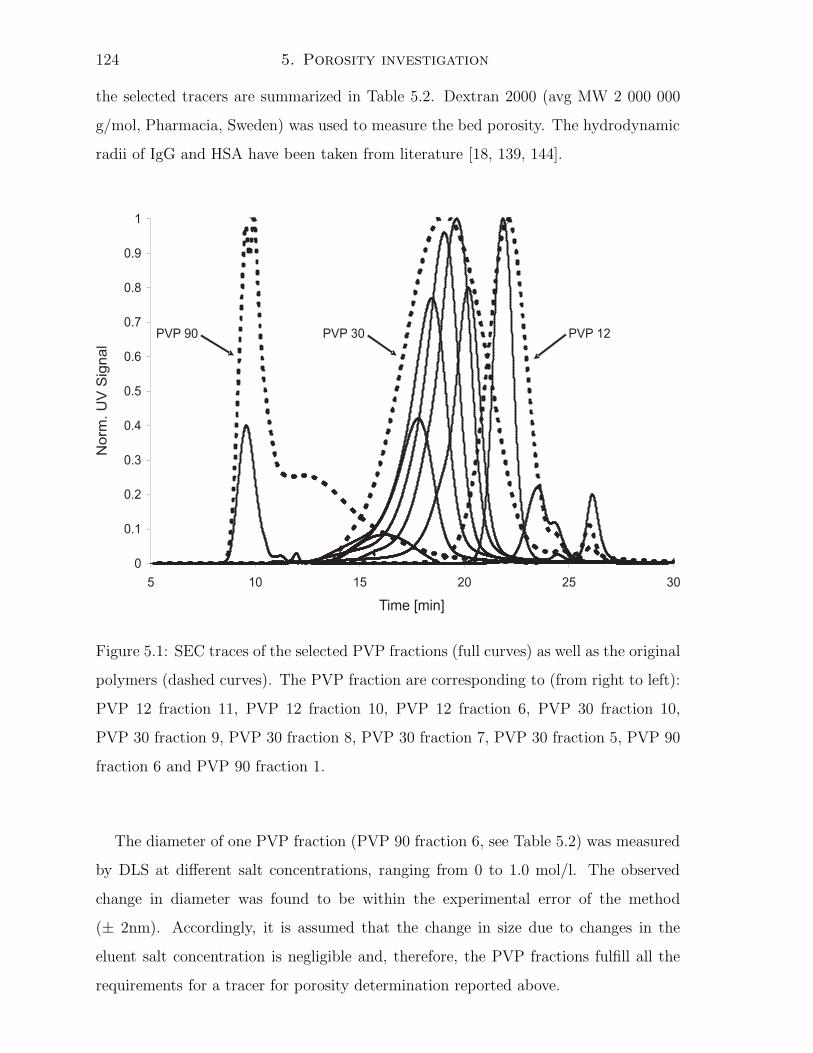
124 5. Porosity investigation
the selected tracers are summarized in Table 5.2. Dextran 2000 (avg MW 2 000 000
g/mol, Pharmacia, Sweden) was used to measure the bed porosity. The hydrodynamic
radii of IgG and HSA have been taken from literature [18, 139, 144].
Figure 5.1: SEC traces of the selected PVP fractions (full curves) as well as the original
polymers (dashed curves). The PVP fraction are corresponding to (from right to left):
PVP 12 fraction 11, PVP 12 fraction 10, PVP 12 fraction 6, PVP 30 fraction 10,
PVP 30 fraction 9, PVP 30 fraction 8, PVP 30 fraction 7, PVP 30 fraction 5, PVP 90
fraction 6 and PVP 90 fraction 1.
The diameter of one PVP fraction (PVP 90 fraction 6, see Table 5.2) was measured
by DLS at different salt concentrations, ranging from 0 to 1.0 mol/l. The observed
change in diameter was found to be within the experimental error of the method
(± 2nm). Accordingly, it is assumed that the change in size due to changes in the
eluent salt concentration is negligible and, therefore, the PVP fractions fulfill all the
requirements for a tracer for porosity determination reported above.
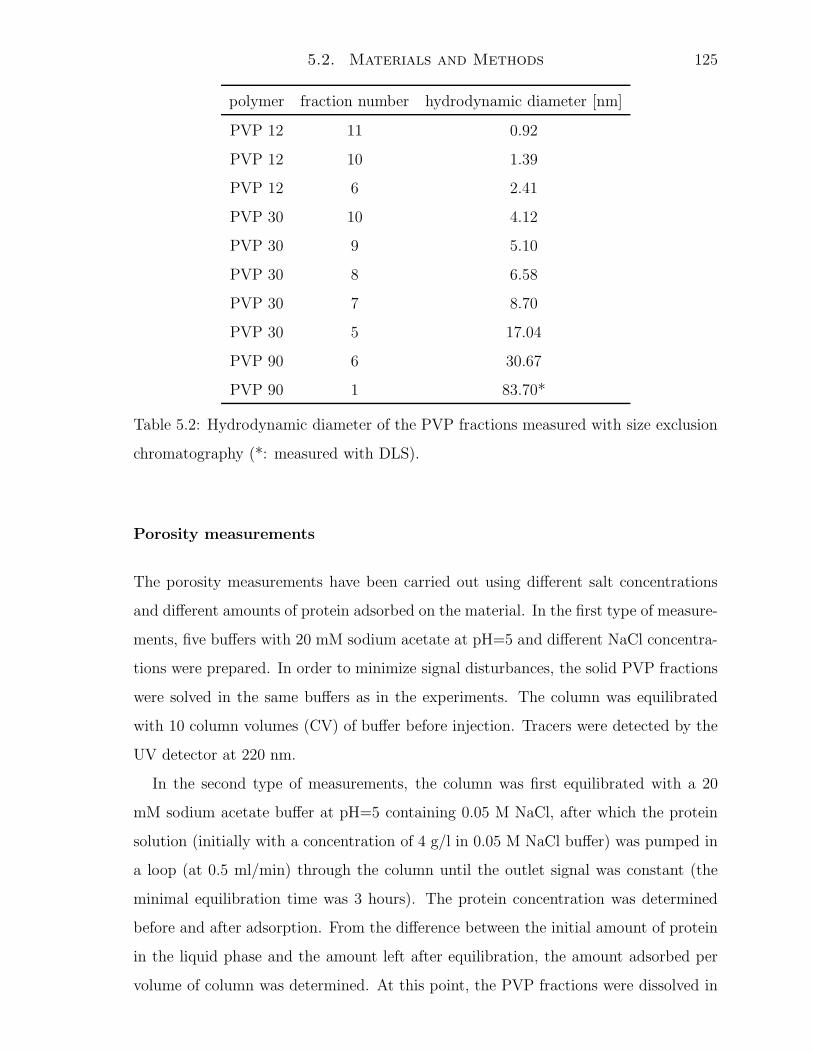
5.2. Materials and Methods 125
polymer fraction number hydrodynamic diameter [nm]
PVP 12 11 0.92
PVP 12 10 1.39
PVP 12 6 2.41
PVP 30 10 4.12
PVP 30 9 5.10
PVP 30 8 6.58
PVP 30 7 8.70
PVP 30 5 17.04
PVP 90 6 30.67
PVP 90 1 83.70*
Table 5.2: Hydrodynamic diameter of the PVP fractions measured with size exclusion
chromatography (*: measured with DLS).
Porosity measurements
The porosity measurements have been carried out using different salt concentrations
and different amounts of protein adsorbed on the material. In the first type of measure-
ments, five buffers with 20 mM sodium acetate at pH=5 and different NaCl concentra-
tions were prepared. In order to minimize signal disturbances, the solid PVP fractions
were solved in the same buffers as in the experiments. The column was equilibrated
with 10 column volumes (CV) of buffer before injection. Tracers were detected by the
UV detector at 220 nm.
In the second type of measurements, the column was first equilibrated with a 20
mM sodium acetate buffer at pH=5 containing 0.05 M NaCl, after which the protein
solution (initially with a concentration of 4 g/l in 0.05 M NaCl buffer) was pumped in
a loop (at 0.5 ml/min) through the column until the outlet signal was constant (the
minimal equilibration time was 3 hours). The protein concentration was determined
before and after adsorption. From the difference between the initial amount of protein
in the liquid phase and the amount left after equilibration, the amount adsorbed per
volume of column was determined. At this point, the PVP fractions were dissolved in
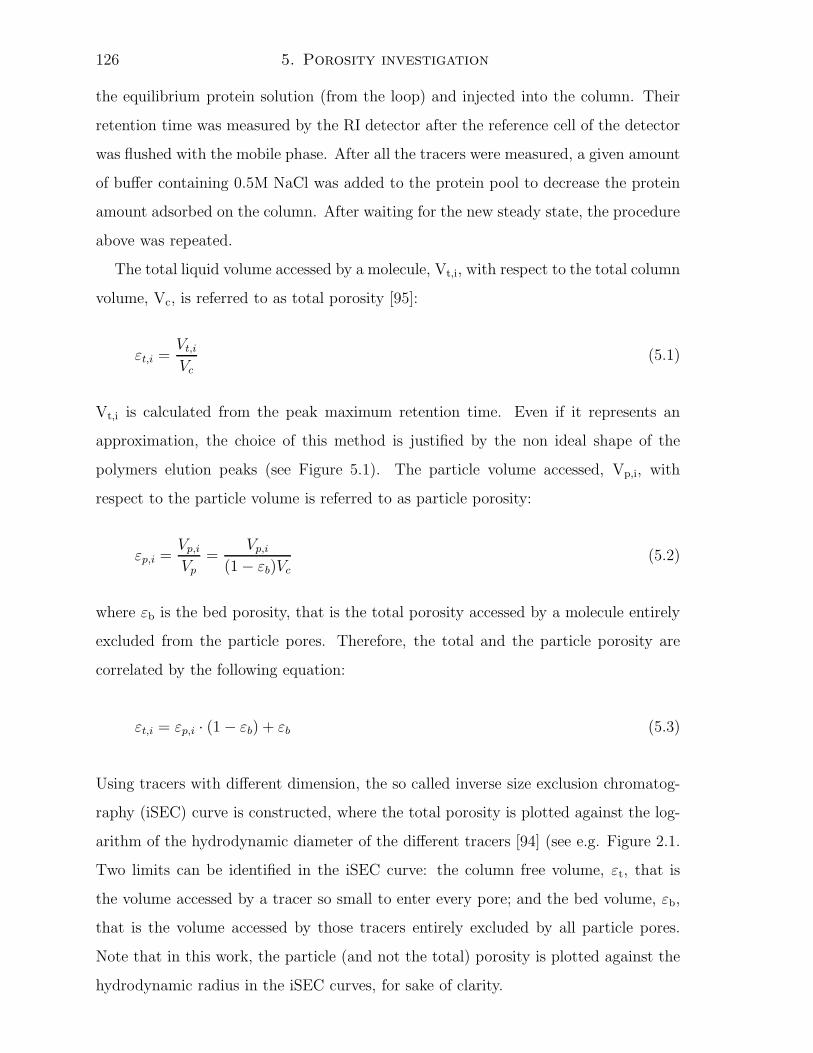
126 5. Porosity investigation
the equilibrium protein solution (from the loop) and injected into the column. Their
retention time was measured by the RI detector after the reference cell of the detector
was flushed with the mobile phase. After all the tracers were measured, a given amount
of buffer containing 0.5M NaCl was added to the protein pool to decrease the protein
amount adsorbed on the column. After waiting for the new steady state, the procedure
above was repeated.
The total liquid volume accessed by a molecule, Vt,i, with respect to the total column
volume, Vc, is referred to as total porosity [95]:
εt,i =Vt,i
Vc
(5.1)
Vt,i is calculated from the peak maximum retention time. Even if it represents an
approximation, the choice of this method is justified by the non ideal shape of the
polymers elution peaks (see Figure 5.1). The particle volume accessed, Vp,i, with
respect to the particle volume is referred to as particle porosity:
εp,i =Vp,i
Vp=
Vp,i
(1 − εb)Vc(5.2)
where εb is the bed porosity, that is the total porosity accessed by a molecule entirely
excluded from the particle pores. Therefore, the total and the particle porosity are
correlated by the following equation:
εt,i = εp,i · (1 − εb) + εb (5.3)
Using tracers with different dimension, the so called inverse size exclusion chromatog-
raphy (iSEC) curve is constructed, where the total porosity is plotted against the log-
arithm of the hydrodynamic diameter of the different tracers [94] (see e.g. Figure 2.1.
Two limits can be identified in the iSEC curve: the column free volume, εt, that is
the volume accessed by a tracer so small to enter every pore; and the bed volume, εb,
that is the volume accessed by those tracers entirely excluded by all particle pores.
Note that in this work, the particle (and not the total) porosity is plotted against the
hydrodynamic radius in the iSEC curves, for sake of clarity.
5.3. Results and discussion 127
5.3 Results and discussion
5.3.1 Porosity as a function of salt concentration
Different PVP fractions were injected in the columns pre-equilibrated with four salt
concentrations: 0.05, 0.1, 0.5 and 1.0 M NaCl, respectively. IgG and HSA were injected
at 1.0 M, since they are not retained at such large salt concentration. The change in
the measured particle porosity for the different PVP fractions is shown in Figures 5.2
and 5.3 for Fractogel EMD COO- (S), and in Figures 5.4 and 5.5 for Fractogel LLD
(M).
Figure 5.2: Change in particle porosity for PVP fractions as a function of the salt
concentration on Fractogel COO- (S). �: PVP 12 fraction 11, N: PVP 12 fraction
10, �: PVP 12 fraction 6, •: PVP 30 fraction 9, ♦: PVP 30 fraction 7, △: PVP 30
fraction 6 �: PVP 90 fraction 6
Let us discuss the results for Fractogel EMD COO- (S) first. Dextran 2000 and PVP
128 5. Porosity investigation
90 fraction 1 have the same pore accessibility. Due to their size, they are believe to be
both fully excluded from the pores and, therefore, are used for the determination of the
bed volume of the column. The total porosity of these tracers is not changing with the
salt concentration (not shown). This means that the dimension of the particles in the
column remains constant at the different salt concentrations and, therefore, only the
pore dimension is affected by changes in the salt concentration. On the other hand, by
observing Figure 5.2, it can be seen that there is a small increase in particle porosity
for increasing salt concentrations for the PVP fractions not fully excluded from the
pores, as also observed by Stone and Carta [66]. The observed size exclusion can be
due to both steric and electrostatic effects. As the salt concentration is increased, the
charge of the ionic groups on the tentacles is shielded, thus minimizing electrostatic
effects. At the same time, salting-out effects can take place [94], make the tentacles
more hydrophobic and causing their collapse on the support surface. This effect would
reduce the steric exclusion (except for the steric exclusion due to the pore structure of
the support).
In Figure 5.3, the inverse size exclusion (iSEC) graph is plotted for the same set
of experimental data. In this figure, the small role played by NaCl in affecting the
particle porosity is more evident, even though a small increase in particle porosity can
be observed for increasing salt concentration for the largest tracers. In the same figure,
the particle porosities of IgG and HSA (at 1M NaCl) are shown (circles). These are
very similar to those of the corresponding PVP tracers of the same size, which are not
charged. In fact, at such large salt concentration, all the protein charges are shielded
and exclusion is due to steric effects only. The residual differences in porosity can be
caused by small non-specific interactions between the proteins and the base matrix at
1M NaCl (most probably hydrophobic interactions), or by small errors in the evaluation
of the hydrodynamic radii of both the polymer tracers and the proteins. In spite of
this, the agreement is sufficiently good to confirm the reliability of PVP as porosity
tracer.
The same analysis as above has been repeated for Fractogel LLD (M). The particle
porosities for the different polymer tracers at different salt concentrations are shown in
Figures 5.4 and 5.5. In this material, dextran 2000 exhibits a smaller total porosity than
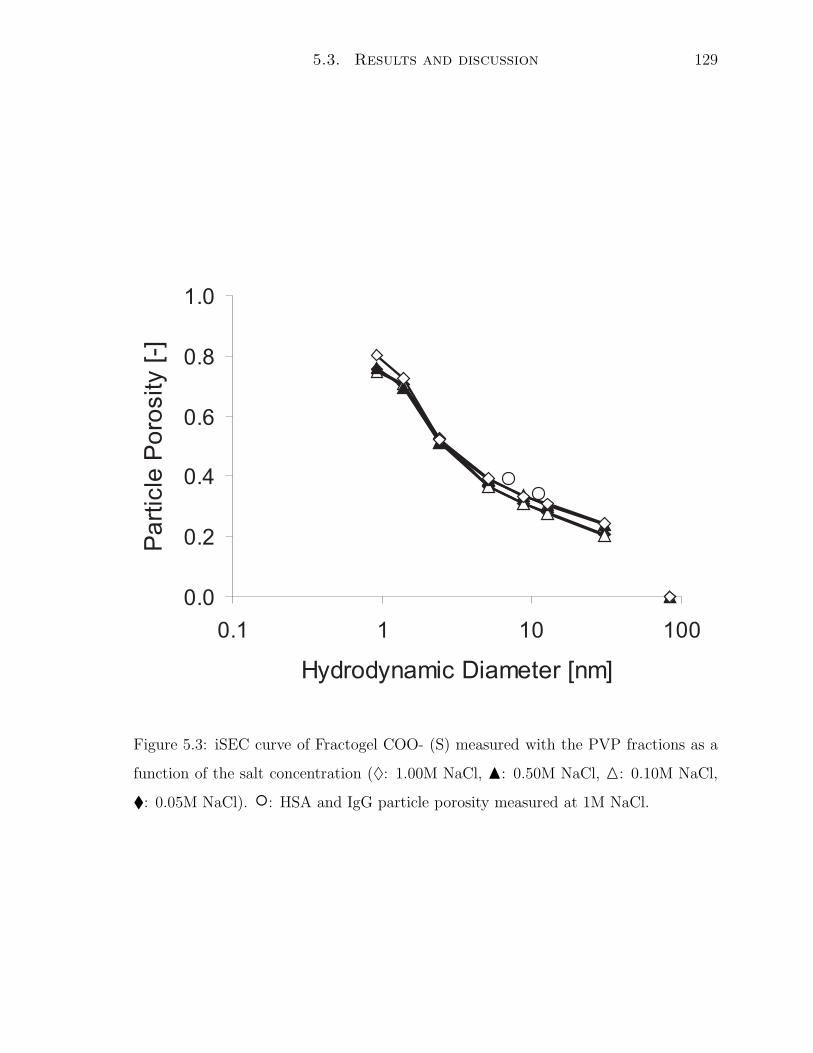
5.3. Results and discussion 129
Figure 5.3: iSEC curve of Fractogel COO- (S) measured with the PVP fractions as a
function of the salt concentration (♦: 1.00M NaCl, N: 0.50M NaCl, △: 0.10M NaCl,
�: 0.05M NaCl). ◦: HSA and IgG particle porosity measured at 1M NaCl.

130 5. Porosity investigation
Figure 5.4: Change in particle porosity for PVP fractions as a function of the salt
concentration on Fractogel LLD (M). �: PVP 12 fraction 11, N: PVP 12 fraction 10,
�: PVP 12 fraction 6, •: PVP 30 fraction 9, ♦: PVP 30 fraction 7, △: PVP 30
fraction 6 �: PVP 30 fraction 5, ◦: PVP 90 fraction 1
the largest PVP standard (not shown). Accordingly, dextran 2000 is used to evaluate
the bed porosity, while about 10% porosity seems to be accessible to PVP 90 fraction 1.
It cannot be excluded that this last result is caused by some small adsorption of dextran
2000. Two additional observations can be made from the comparison with Fractogel
EMD COO- (S): (i) the iSEC curves are steeper for Fractogel LLD (M) (see Figures
5.3 and 5.5), thus indicating a narrower pore size distibution; and (ii) this material has
a larger sensitivity to variations in the salt concentration. When considering the two
smallest tracers only (PVP 12 fraction 11 and PVP 12 fraction 10), a large variation
in the porosity and values larger than one can be observed in Fractogel LLD (M).
This material has a smaller ligand density than Fractogel EMD COO- (S) and, thus,
the underivatized surface is larger. For this reason, the two small tracers mentioned

5.3. Results and discussion 131
Figure 5.5: iSEC curve of Fractogel LLD (M) measured with the PVP fractions as a
function of the salt concentration (♦: 1.00M NaCl, N: 0.50M NaCl, △: 0.10M NaCl,
�: 0.05M NaCl). ◦: HSA and IgG particle porosity measured at 1M NaCl.
132 5. Porosity investigation
above can probably access part of this free surface and adsorb on it by hydrophobic
interaction. This effect is probably increased at larger salt concentrations by salting-
out effects. On the other hand, larger tracers should not access the surface between
the functional groups and, therefore, adsorb on the material. This is confirmed by
the similarity of the porosity data between the polymer tracers and the two proteins,
IgG and HSA at 1M NaCl (see Figure 5.5). However, as for the largest tracer, little
interactions cannot be excluded. Tracers between 2 and 9 nm have a larger pore
accessibility than in the case of Fractogel EMD COO- (S). However, the porosity of
the largest tracers is very similar to that measured on Fractogel EMD COO- (S).
It is possible that, for such large molecules, the accessibility to the pores is mostly
determined by the pore size distribution of the unfunctionalized support (which is
similar for the two materials). In spite of this, the sensitivity of the accessible porosity
to changes of salt concentration appears to be more pronounced than in the case of
Fractogel EMD COO- (S) (see Figure 5.2), especially for large tracers. In case of
dominant electrostatic effects, all the tracers should be similarly affected, being their
chemical composition identical. The fact that this effect is noticeable only for the
largest tracers should suggest that collapsing of the tentacles on the pore surface is the
most probable mechanism behind the increased porosity for the largest tracers.
It should be noted that the two materials are produced starting with the same
base material, but with two different derivatization techniques. This, combined with
the smaller ligand density, is probably the cause of the bigger pore size distributions
measured for the Fractogel LLD material. The different chemistry of the functional
groups, i.e. carboxy ethyl-groups and sulfoisobutyl-groups, could also be the reason
behind the different salt sensitivity of the two materials.
From the iSEC curves the pore size distribution and thus the average pore size of
the material can be calculated. The average pore size at 1.0 M NaCl is around 30 nm
for Fractogel COO- (S), and around 50 nm Fractogel LLD. This confirms the higher
porosity of Fractogel LLD. Moreover it is important to note that the average pore
diameters are only 3 and 5 times larger than IgG, respectively.
By extrapolation of the previous data from PVP tracers, it is possible to calculate
the pore accessibility of IgG and HSA as a function of salt concentration. This is

5.3. Results and discussion 133
Figure 5.6: Predicted change in particle porosity for HSA (♦) and IgG (N) as a function
of the salt concentration on Fractogel COO- (S).
shown in Figures 5.6 and 5.7 for Fractogel EMD COO- (S) and Fractogel LLD (M),
respectively. For both proteins, the change in porosity is modest and it is confirmed
that it is larger in the case of Fractogel LLD (M). As for the larger tracers, the porosity
accessed by IgG is very similar for both materials, with the exception of the smallest
salt concentration. On the other hand, the two materials behave very differently in
the case of HSA (and smaller molecules). In particular, the accessibility is larger for
Fractogel LLD (M). Note that pore accessibility for proteins is generally supposed to
be constant and independent of the operating conditions, especially when measuring
the solute affinity to the stationary phases. From Figures 5.6 and 5.7, it is seen that
changes in the pore accessibility are not negligible and are generally lumped into the
estimated adsorption isotherm. The independent knowledge of the pore accessibility
allows avoiding this mistake.
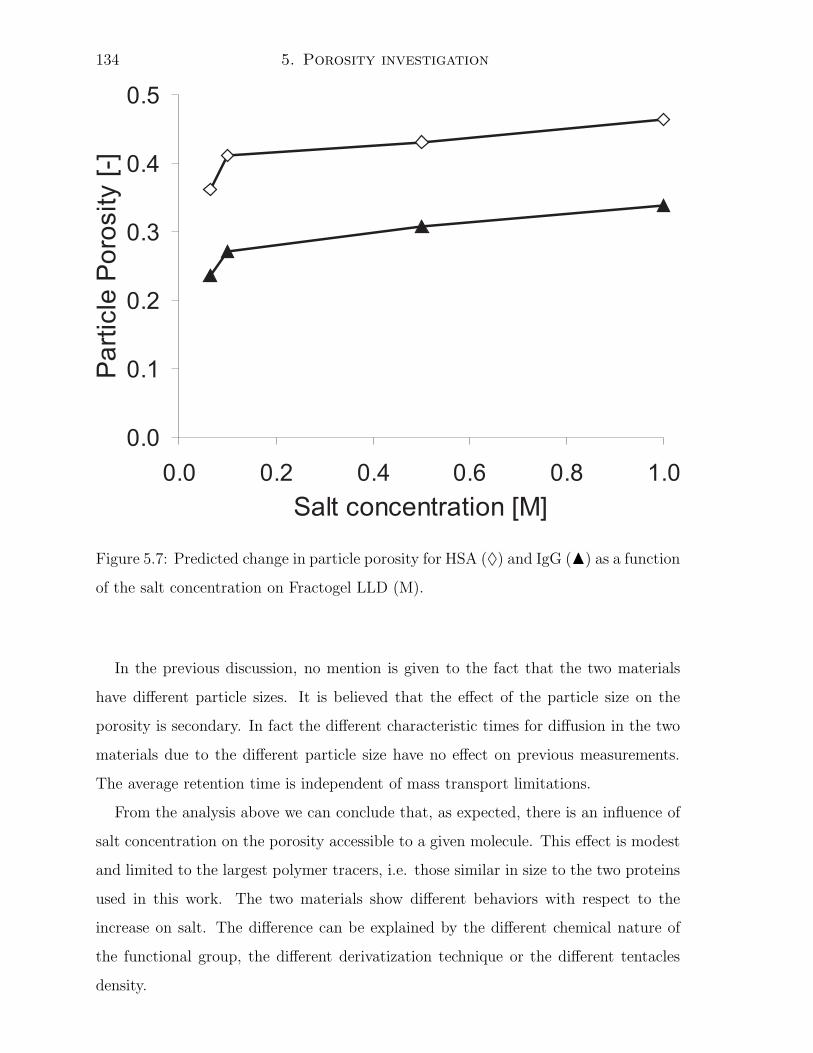
134 5. Porosity investigation
Figure 5.7: Predicted change in particle porosity for HSA (♦) and IgG (N) as a function
of the salt concentration on Fractogel LLD (M).
In the previous discussion, no mention is given to the fact that the two materials
have different particle sizes. It is believed that the effect of the particle size on the
porosity is secondary. In fact the different characteristic times for diffusion in the two
materials due to the different particle size have no effect on previous measurements.
The average retention time is independent of mass transport limitations.
From the analysis above we can conclude that, as expected, there is an influence of
salt concentration on the porosity accessible to a given molecule. This effect is modest
and limited to the largest polymer tracers, i.e. those similar in size to the two proteins
used in this work. The two materials show different behaviors with respect to the
increase on salt. The difference can be explained by the different chemical nature of
the functional group, the different derivatization technique or the different tentacles
density.
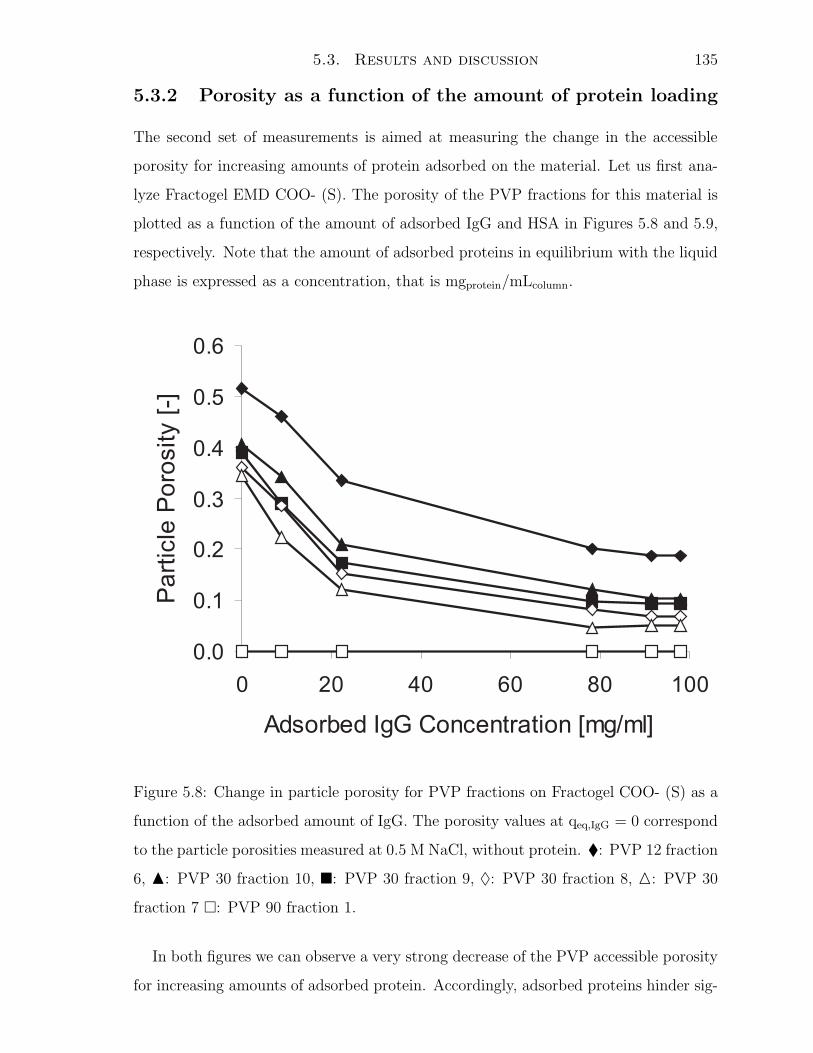
5.3. Results and discussion 135
5.3.2 Porosity as a function of the amount of protein loading
The second set of measurements is aimed at measuring the change in the accessible
porosity for increasing amounts of protein adsorbed on the material. Let us first ana-
lyze Fractogel EMD COO- (S). The porosity of the PVP fractions for this material is
plotted as a function of the amount of adsorbed IgG and HSA in Figures 5.8 and 5.9,
respectively. Note that the amount of adsorbed proteins in equilibrium with the liquid
phase is expressed as a concentration, that is mgprotein/mLcolumn.
Figure 5.8: Change in particle porosity for PVP fractions on Fractogel COO- (S) as a
function of the adsorbed amount of IgG. The porosity values at qeq,IgG = 0 correspond
to the particle porosities measured at 0.5 M NaCl, without protein. �: PVP 12 fraction
6, N: PVP 30 fraction 10, �: PVP 30 fraction 9, ♦: PVP 30 fraction 8, △: PVP 30
fraction 7 �: PVP 90 fraction 1.
In both figures we can observe a very strong decrease of the PVP accessible porosity
for increasing amounts of adsorbed protein. Accordingly, adsorbed proteins hinder sig-
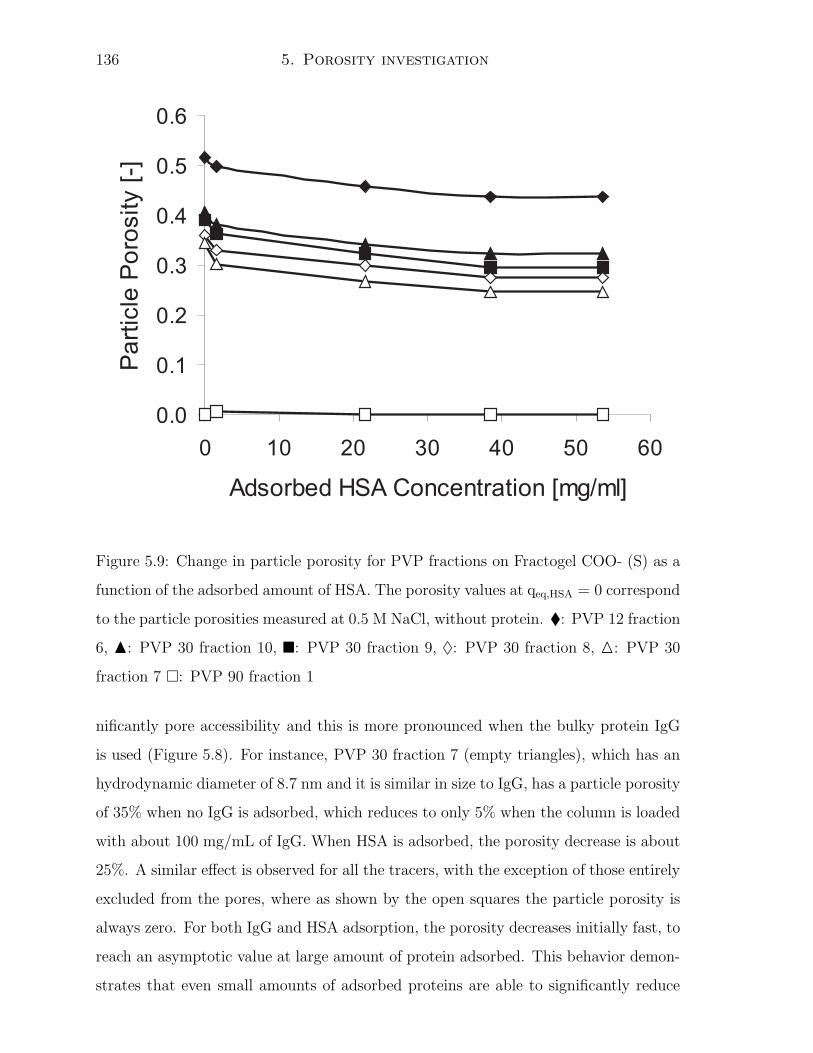
136 5. Porosity investigation
Figure 5.9: Change in particle porosity for PVP fractions on Fractogel COO- (S) as a
function of the adsorbed amount of HSA. The porosity values at qeq,HSA = 0 correspond
to the particle porosities measured at 0.5 M NaCl, without protein. �: PVP 12 fraction
6, N: PVP 30 fraction 10, �: PVP 30 fraction 9, ♦: PVP 30 fraction 8, △: PVP 30
fraction 7 �: PVP 90 fraction 1
nificantly pore accessibility and this is more pronounced when the bulky protein IgG
is used (Figure 5.8). For instance, PVP 30 fraction 7 (empty triangles), which has an
hydrodynamic diameter of 8.7 nm and it is similar in size to IgG, has a particle porosity
of 35% when no IgG is adsorbed, which reduces to only 5% when the column is loaded
with about 100 mg/mL of IgG. When HSA is adsorbed, the porosity decrease is about
25%. A similar effect is observed for all the tracers, with the exception of those entirely
excluded from the pores, where as shown by the open squares the particle porosity is
always zero. For both IgG and HSA adsorption, the porosity decreases initially fast, to
reach an asymptotic value at large amount of protein adsorbed. This behavior demon-
strates that even small amounts of adsorbed proteins are able to significantly reduce
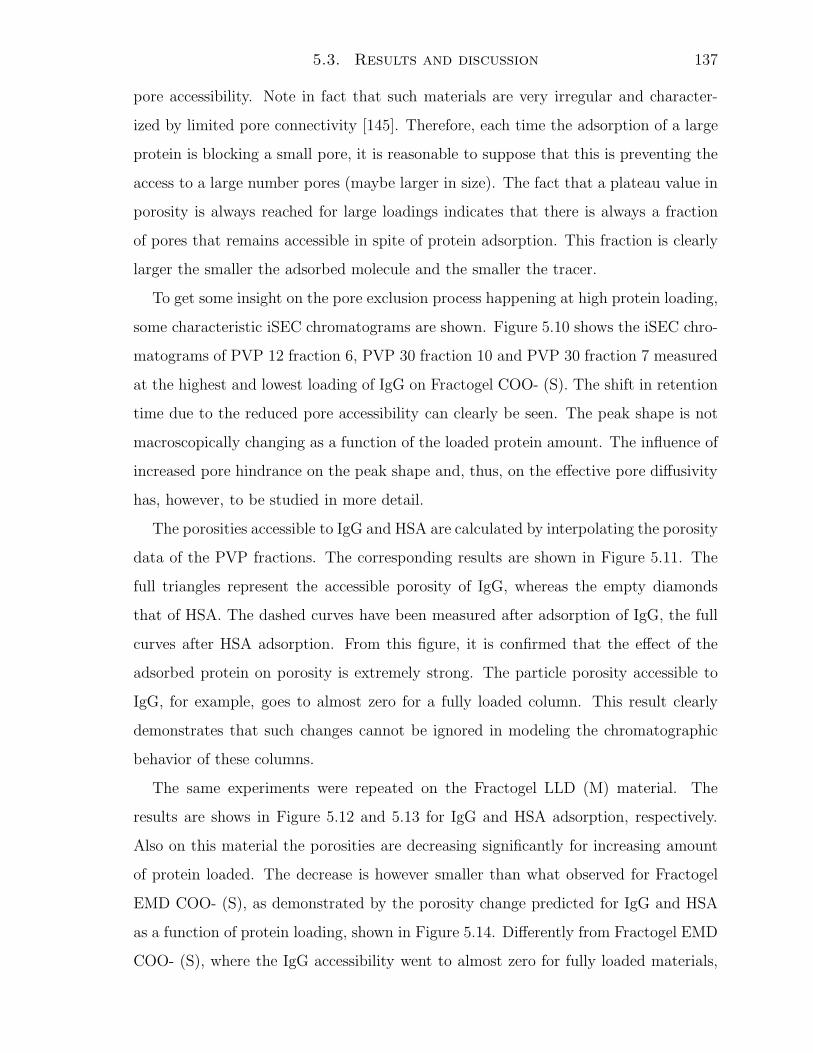
5.3. Results and discussion 137
pore accessibility. Note in fact that such materials are very irregular and character-
ized by limited pore connectivity [145]. Therefore, each time the adsorption of a large
protein is blocking a small pore, it is reasonable to suppose that this is preventing the
access to a large number pores (maybe larger in size). The fact that a plateau value in
porosity is always reached for large loadings indicates that there is always a fraction
of pores that remains accessible in spite of protein adsorption. This fraction is clearly
larger the smaller the adsorbed molecule and the smaller the tracer.
To get some insight on the pore exclusion process happening at high protein loading,
some characteristic iSEC chromatograms are shown. Figure 5.10 shows the iSEC chro-
matograms of PVP 12 fraction 6, PVP 30 fraction 10 and PVP 30 fraction 7 measured
at the highest and lowest loading of IgG on Fractogel COO- (S). The shift in retention
time due to the reduced pore accessibility can clearly be seen. The peak shape is not
macroscopically changing as a function of the loaded protein amount. The influence of
increased pore hindrance on the peak shape and, thus, on the effective pore diffusivity
has, however, to be studied in more detail.
The porosities accessible to IgG and HSA are calculated by interpolating the porosity
data of the PVP fractions. The corresponding results are shown in Figure 5.11. The
full triangles represent the accessible porosity of IgG, whereas the empty diamonds
that of HSA. The dashed curves have been measured after adsorption of IgG, the full
curves after HSA adsorption. From this figure, it is confirmed that the effect of the
adsorbed protein on porosity is extremely strong. The particle porosity accessible to
IgG, for example, goes to almost zero for a fully loaded column. This result clearly
demonstrates that such changes cannot be ignored in modeling the chromatographic
behavior of these columns.
The same experiments were repeated on the Fractogel LLD (M) material. The
results are shows in Figure 5.12 and 5.13 for IgG and HSA adsorption, respectively.
Also on this material the porosities are decreasing significantly for increasing amount
of protein loaded. The decrease is however smaller than what observed for Fractogel
EMD COO- (S), as demonstrated by the porosity change predicted for IgG and HSA
as a function of protein loading, shown in Figure 5.14. Differently from Fractogel EMD
COO- (S), where the IgG accessibility went to almost zero for fully loaded materials,

138 5. Porosity investigation
(a) (b)
(c)
Figure 5.10: Traces of PVP 12 fr 6 (a), PVP 30 fr 10 (b) and PVP 30 fr 7 (c) on the
Fractogel COO- (S) column loaded with 98 (solid curve) and 9 (dashed curve) mg/ml
IgG.
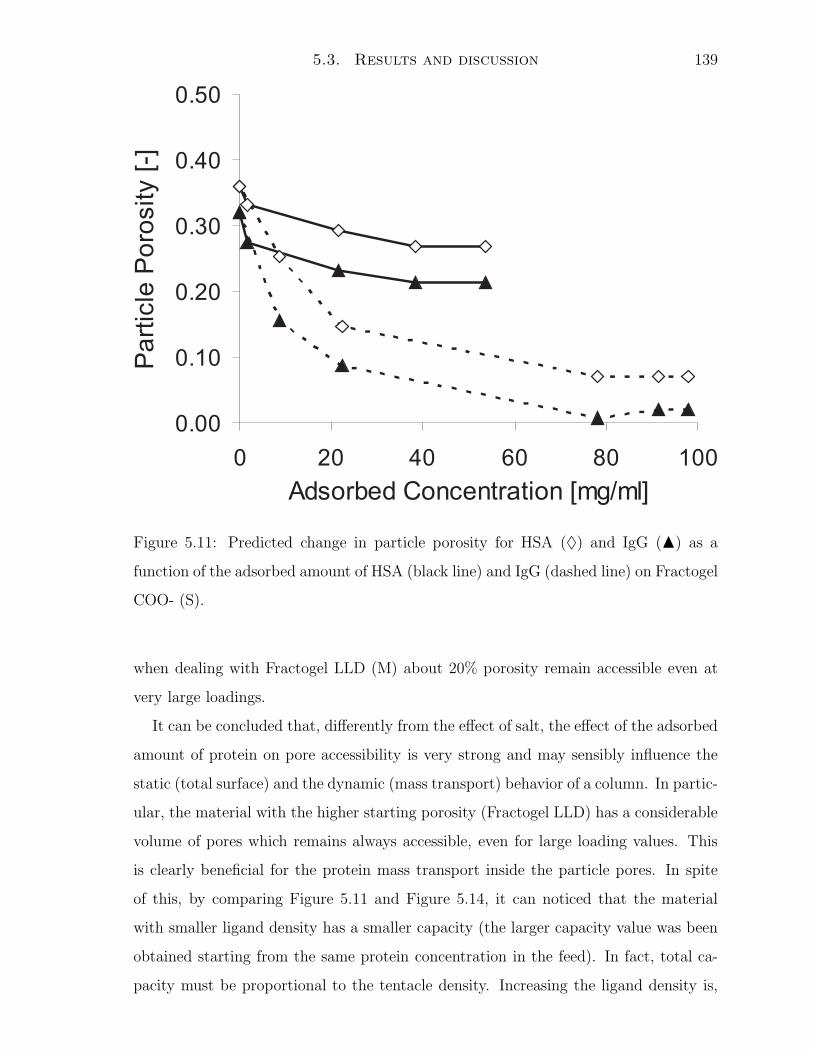
5.3. Results and discussion 139
Figure 5.11: Predicted change in particle porosity for HSA (♦) and IgG (N) as a
function of the adsorbed amount of HSA (black line) and IgG (dashed line) on Fractogel
COO- (S).
when dealing with Fractogel LLD (M) about 20% porosity remain accessible even at
very large loadings.
It can be concluded that, differently from the effect of salt, the effect of the adsorbed
amount of protein on pore accessibility is very strong and may sensibly influence the
static (total surface) and the dynamic (mass transport) behavior of a column. In partic-
ular, the material with the higher starting porosity (Fractogel LLD) has a considerable
volume of pores which remains always accessible, even for large loading values. This
is clearly beneficial for the protein mass transport inside the particle pores. In spite
of this, by comparing Figure 5.11 and Figure 5.14, it can noticed that the material
with smaller ligand density has a smaller capacity (the larger capacity value was been
obtained starting from the same protein concentration in the feed). In fact, total ca-
pacity must be proportional to the tentacle density. Increasing the ligand density is,
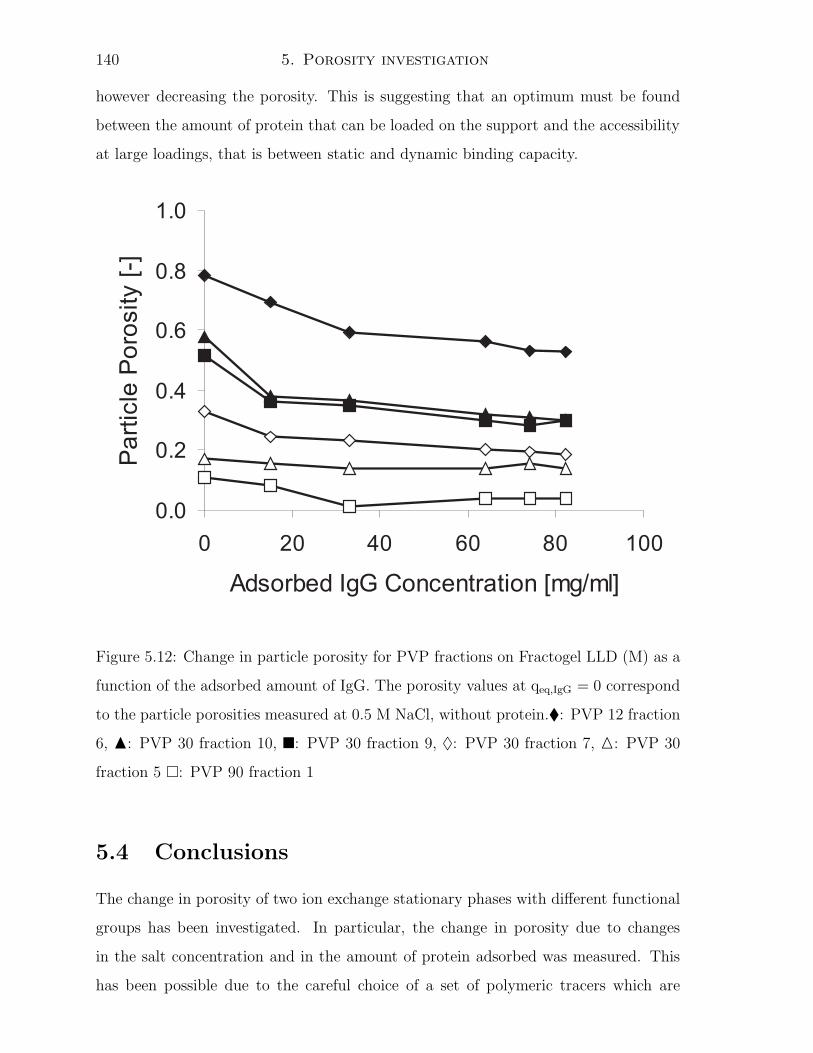
140 5. Porosity investigation
however decreasing the porosity. This is suggesting that an optimum must be found
between the amount of protein that can be loaded on the support and the accessibility
at large loadings, that is between static and dynamic binding capacity.
Figure 5.12: Change in particle porosity for PVP fractions on Fractogel LLD (M) as a
function of the adsorbed amount of IgG. The porosity values at qeq,IgG = 0 correspond
to the particle porosities measured at 0.5 M NaCl, without protein.�: PVP 12 fraction
6, N: PVP 30 fraction 10, �: PVP 30 fraction 9, ♦: PVP 30 fraction 7, △: PVP 30
fraction 5 �: PVP 90 fraction 1
5.4 Conclusions
The change in porosity of two ion exchange stationary phases with different functional
groups has been investigated. In particular, the change in porosity due to changes
in the salt concentration and in the amount of protein adsorbed was measured. This
has been possible due to the careful choice of a set of polymeric tracers which are

5.4. Conclusions 141
Figure 5.13: Change in particle porosity for PVP fractions on Fractogel LLD (M) as a
function of the adsorbed amount of HSA. The porosity values at qeq,HSA = 0 correspond
to the particle porosities measured at 0.5 M NaCl, without protein. �: PVP 12 fraction
6, N: PVP 30 fraction 10, �: PVP 30 fraction 9, ♦: PVP 30 fraction 7, △: PVP 30
fraction 5 �: PVP 90 fraction 1
not interacting with the stationary phases and the adsorbed proteins. Notably, the
analyzed conditions are closely representing typical working conditions in biomolecule
purification. More specifically, under such conditions the analyzed proteins strongly
bind to the stationary phase and therefore its pore accessibility cannot be measured
directly.
The influence of the salt concentration on the accessible porosity was found to
be modest. Moreover, mostly the largest tracers are influenced by a change in salt
concentration, which suggest that the change in porosity is mostly due to the tentacle
collapse on the support surface. However, this hypothesis must be further verified.
A much stronger influence has been observed when loading the column with different
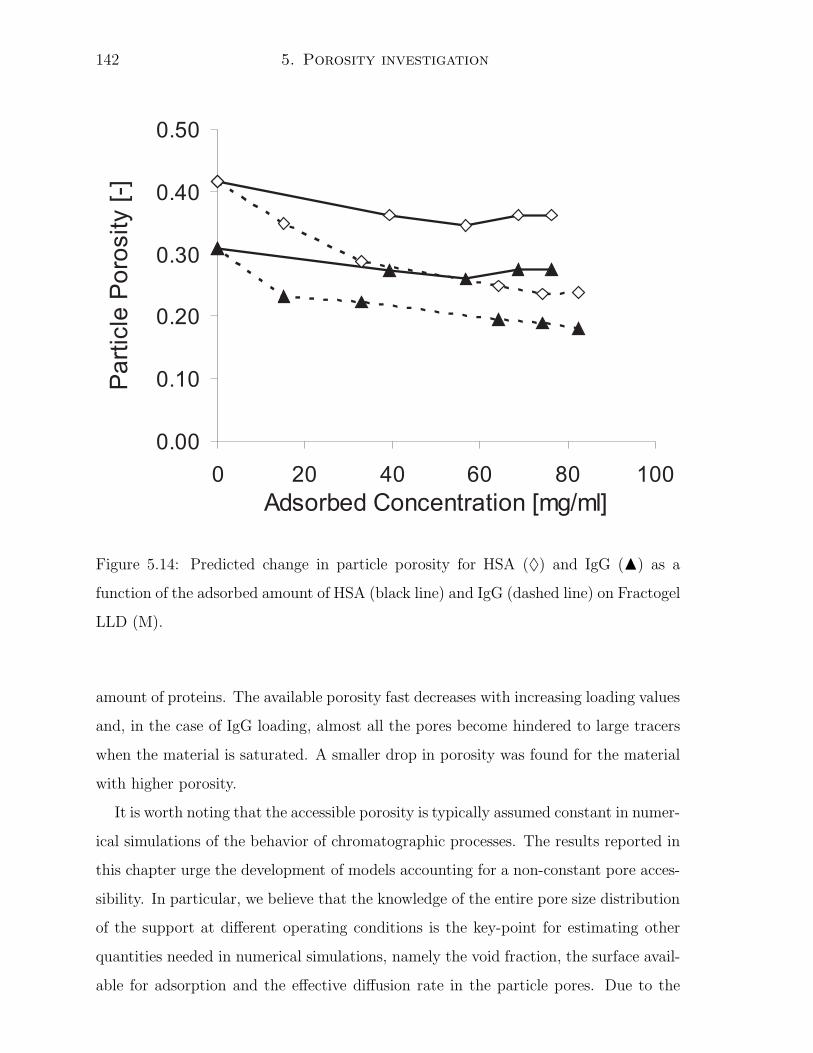
142 5. Porosity investigation
Figure 5.14: Predicted change in particle porosity for HSA (♦) and IgG (N) as a
function of the adsorbed amount of HSA (black line) and IgG (dashed line) on Fractogel
LLD (M).
amount of proteins. The available porosity fast decreases with increasing loading values
and, in the case of IgG loading, almost all the pores become hindered to large tracers
when the material is saturated. A smaller drop in porosity was found for the material
with higher porosity.
It is worth noting that the accessible porosity is typically assumed constant in numer-
ical simulations of the behavior of chromatographic processes. The results reported in
this chapter urge the development of models accounting for a non-constant pore acces-
sibility. In particular, we believe that the knowledge of the entire pore size distribution
of the support at different operating conditions is the key-point for estimating other
quantities needed in numerical simulations, namely the void fraction, the surface avail-
able for adsorption and the effective diffusion rate in the particle pores. Due to the
5.4. Conclusions 143
large adsorption capacities and the slow diffusion rates typical of such materials when
dealing with large biomolecules, the knowledge of the previous quantities is strongly
necessary to have a reliable simulation tool.


Chapter 6
Conclusions
A detailed study of the adsorption of a polyclonal IgG on a preparative strong cation
exchange column has been presented in this Thesis. The aim of this work was twofold:
first, to understand the underlying phenomena operating in protein chromatography;
second, to develop a numerical model aimed to better understand and study these
phenomena and to design protein chromatographic purifications. Different levels of
complexity have been introduced in this study. First, a purely experimental approach
was used to characterize the process, based on well known short-cut methods. Then,
a model based approach was introduced, in which the polyclonal IgG mixture was
extremely simplified and reduce to two ”macro-components” only. Finally, the model
was used to account for the presence of a larger number of different components. From
this analysis, it was possible to identify two main problems: (i) the very hindered
transport of the antibodies inside the macro-porous pores. This is largely affecting the
performance of the studied stationary phase. (ii) The large sensitivity of the adsorp-
tion isotherm, which, together with the limited mass transport, made the experimental
analysis particularly complex and which makes the process very sensitive to little vari-
ations in the operating parameters. The first problem was already addressed in this
Thesis, and a detailed analysis of the influence of the operating conditions on the
pore size distribution of the stationary phase (and, thus, on the pore mass transport
limitation) was carried out.
Although very satisfactory results have been already obtained in this work, a large
amount of work has still to be done in order to properly integrate previous observations
145

146 6. Conclusions
into a fully comprehensive numerical model. First, the correct influence of the pore size
distribution on the mass transport inside the particles must be implemented. Porosity
is largely affecting the column performance and it can sensibly change during the
process, as a result of e.g. adsorption. The corresponding reduction of the accessible
pore volume and, most probably, the change in the diffusion length inside the pores
must be properly characterized in the future. Clearly, this can be done by either
developing short-cut methods or by fully integrating the pore structure into the model.
At the same time, the influence of the ionic strength only on the adsorption isotherm
was considered in this work. However, a similar sensitivity can be observed in response
to pH changes. Moreover, it is to be expected that different molecules are reacting
in very different ways to simultaneous changes in ionic strength and pH, due to the
complexity of the charge distribution and type inside the proteins. Accordingly, this
kind of changes must be considered in the future not as a undesired perturbation in the
system in response to simple changes in the operating conditions, but as a tool to be
exploited in order to further enhance the resolution power of these stationary phases.
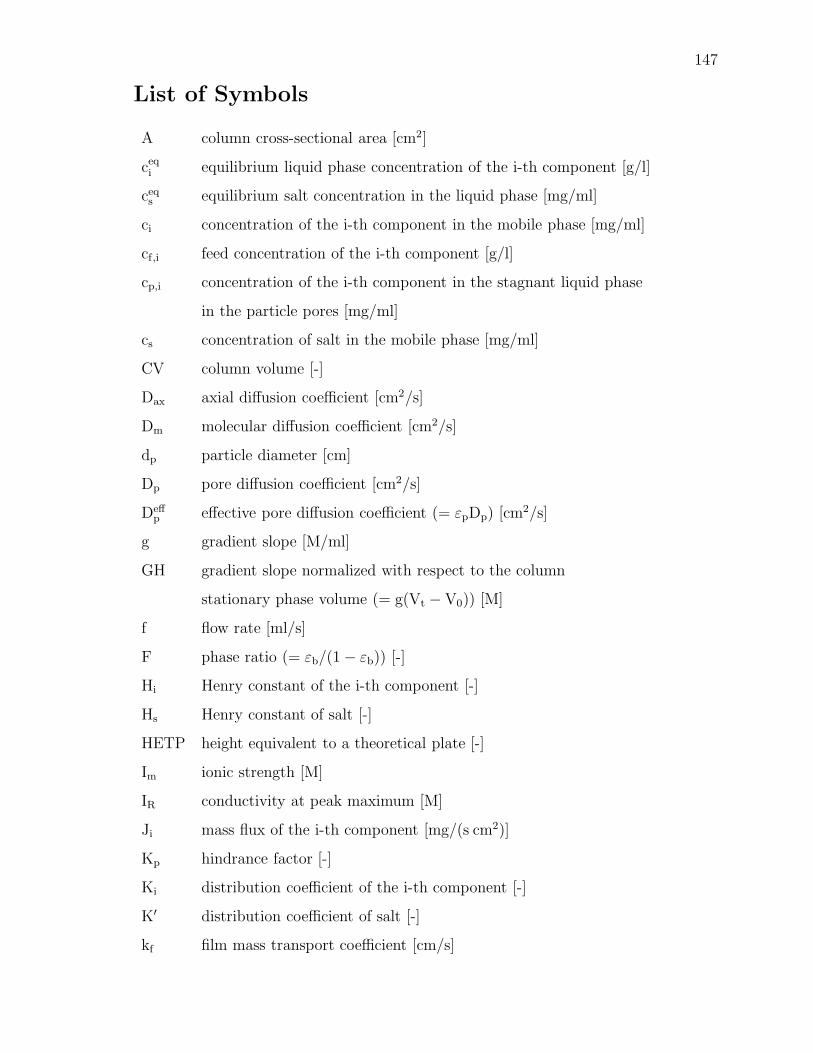
147
List of Symbols
A column cross-sectional area [cm2]
ceqi equilibrium liquid phase concentration of the i-th component [g/l]
ceqs equilibrium salt concentration in the liquid phase [mg/ml]
ci concentration of the i-th component in the mobile phase [mg/ml]
cf,i feed concentration of the i-th component [g/l]
cp,i concentration of the i-th component in the stagnant liquid phase
in the particle pores [mg/ml]
cs concentration of salt in the mobile phase [mg/ml]
CV column volume [-]
Dax axial diffusion coefficient [cm2/s]
Dm molecular diffusion coefficient [cm2/s]
dp particle diameter [cm]
Dp pore diffusion coefficient [cm2/s]
Deffp effective pore diffusion coefficient (= εpDp) [cm2/s]
g gradient slope [M/ml]
GH gradient slope normalized with respect to the column
stationary phase volume (= g(Vt − V0)) [M]
f flow rate [ml/s]
F phase ratio (= εb/(1 − εb)) [-]
Hi Henry constant of the i-th component [-]
Hs Henry constant of salt [-]
HETP height equivalent to a theoretical plate [-]
Im ionic strength [M]
IR conductivity at peak maximum [M]
Ji mass flux of the i-th component [mg/(s cm2)]
Kp hindrance factor [-]
Ki distribution coefficient of the i-th component [-]
K′ distribution coefficient of salt [-]
kf film mass transport coefficient [cm/s]
148 List of Symbols
L column length [cm]
M molecular weight [g/mol]
mads,i adsorbed mass of the i-th component [mg]
N total number of grid points [-]
Peax,i axial Peclet number of the i-th component (= uint/LDax,i/L2 ) [-]
Peax,s axial Peclet number of the salt (= uint/LDax,s/L2 ) [-]
Pei Peclet number of the i-th component (= uint/LDp,i/R2
p) [-]
qeqi equilibrium solid phase concentration of the i-th component [g/l]
qeqs equilibrium solid phase concentration of salt [mg/ml]
q∞
i saturation capacity of the i-th component [g/l]
q∞
s saturation capacity of salt [mg/ml]
qi solid phase concentration of the i-th component [mg/ml]
qs solid phase concentration of salt [mg/ml]
r radial position in the particle [cm]
Rp particle radius [cm]
Shi Sherwood number of the i-th component (=kf,i/Rp
Dp,i/R2p) [-]
Sti Stanton number of the i-th component (= 3Shi
Pei= 3
kf,i/Rp
uint/L) [-]
T absolute temperature [K]
t time [s]
tax characteristic time for axial diffusion [s]
tconv characteristic time for convection [s]
tfilm characteristic time for film mass transport [s]
tinj injection time [s]
tpore characteristic time for pore diffusion [s]
ui triangular function for the components determination
uint interstitial velocity (= f/(Aεb)) [cm/s]
us superficial velocity (=f/A) [cm/s]
V0 column void volume [ml]
Vc total column volume [ml]
Vd dead volume [ml]
Vp,i particle pore volume accessed by the i-th component [ml]
Vp total particle volume [ml]

149
Vt,i total liquid volume accessed by the i-th component [ml]
z axial position [cm]
Greek letters
αi α parameter of the Henry vs ionic strength function
for the i-th component [1/M−β]
βi β parameter of the Henry vs ionic strength function
for the i-th component [-]
δi δ parameter of the saturation capacity vs ionic strength function
for the i-th component [mg/(ml M)]
ε ε parameter of the saturation capacity vs ionic strength function
for the i-th component [mg/(ml M)]
εb bed porosity [-]
εp,i particle porosity of the i-th component [-]
εp,s particle porosity of salt [-]
εt,i total porosity of the i-th component [-]
εtot total porosity of the column [-]
γi γ parameter of the saturation capacity vs ionic strength function
for the i-th component [mg/ml]
νb phase ration (= (1 − εb)/εb) [-]
µ1 first moment [min]
µ2 second centered moment [min2]
η dimensionless axial position (= z/L) [-]
ηb solvent viscosity [Cp]
ρ dimensionless radial position (= r/Rp) [-]
τ dimensionless time (= (t uint)/L) [-]
τinj dimensionless injection time [-]
τ tortuosity (Chapter 2) [-]

Bibliography
[1] A.C.A. Roque, C.R. Lowe, M.A. Taipa. Antibodies and genetically engineered re-
lated molecules: production and purification. Biotechnol. Prog.. 20:639-654, 2004.
[2] G. Walsh. Biopharmaceuticals: recent approvals and likely directions. Trends
Biotechnol, 23:553-558, 2005.
[3] B. Monzavi-Karbassi, T. Kieber-Emmons. Current concepts in cancer vaccine
strategies. BioTechniques, 30:170-189, 2001.
[4] A. Stein, A. Kiesewetter. Cation exchange chromatography in antibody purifica-
tion: pH screening for optimised binding and HCP removal. J. Chromatogr. B,
848:151-158, 2007.
[5] Y. Kato, K. Nakamaura, T. Kitamura, M. Hasegawa, H. Sasaky. Hydrophobic
interaction chromatography at low salt concentration for the capture of monoclonal
antibodies. J. Chromatogr. A, 1036:45-50, 2004.
[6] L. Guerrier, P. Girot, W. Schwartz, E. Boschetti. New method for the selective cap-
ture of antibodies under physiolgical conditions. Bioseparation, 9:211-221, 2000.
[7] W. Schwartz, D. Judd, M. Wysocki, L. Guerrier, E. Birck-Wilson, E. Boschetti.
Comparison of hydrophobic charge induction chromatography with affinity chro-
matography on protein A for harvest and purification of antibodies. J. Chromatogr.
A, 908:251-263, 2001.
[8] E. Boschetti. Antibody separation by hydrophobic charge induction chromatogra-
phy. Trends Biotechnol., 20:333-337, 2002.
[9] A. Kamyshny, S. Lagerge, S. Partyka, P. Relkin, S. Magdassi. Adsorption of native
and hydrophobized human IgG onto silica: Isotherms, calorimetry, and biological
activity. Langmuir, 17:8242-8248, 2001.
151

152 Bibliography
[10] A. Serres, D. Muller, J. Jozefonvicz. Purification of monoclonal-antibodies on
dextran-coated silica support grafted by thiophilic ligand. J. Chromatogr. A,
711:151-157, 1995.
[11] A. H. Ross, D. Herlyn, H. Koprowski. Purification of monoclonal-antibodies from
ascites using ABx liquid-chromatography column. J. Immunol. Methods, 102:227-
231, 1987.
[12] R. Giovannini, R. Freitag. Comparison of different types of ceramic hydroxya-
patite for the chromatographic separation of plasmid DNA and a recombinant
anti-Rhesus D antibody. Bioseparation, 9:359-368, 2000.
[13] B. Pavlu, U. Johansson, C. N. Nyhlen, A. Wichman. Rapid purification of mon-
oclonal antibodies by high performance liquid chromatography. J. Chromatogr.,
359:449-460, 1986.
[14] D. K. Follmann, R. L. Fahrner. Factorial screening of antibody purification pro-
cesses using three chromatography steps without protein A. J. Chromatogr. A,
1024:79-85, 2004.
[15] L. Melter, A. Butte, M. Morbidelli. Preparative weak-cation exchange chromatog-
raphy of monoclonal antibody variants. I. Single compopnent adsorption. J. Chro-
matogr. A, Submitted for publication.
[16] P.M. Boyer, J.T. Hsu. Experimental studies of restricted protein diffusion in an
agarose matrix AIChE J., 38:259-272, 1992.
[17] D. Karlsson, N. Jakobsson, A. Axelsson, B. Nilsson. Model-based optimization
of a preparative ion-exchange step for antibody purification. J. Chromatogr. A,
1055:29-39, 2004.
[18] J. Gutenwik, B. Nilsson, A. Axelsson. Effect of hindered diffusion on the adsorption
of proteins in agarose gel using a pore model. J. Chromatogr. A, 1048:161-172,
2004.
[19] http://www.fda.gov/Cder/OPS/pat.htm
[20] G. Carta, A.R. Ubiera, T.M. Pabst. Protein mass transfer kinetics in ion exchange
media: Measurements and interpretations. Chem. Eng. Technol., 28:1252-1264,
2005.

Bibliography 153
[21] G. Guiochon, S.G. Shirazi, A.M. Katti. Fundamentals of preparative and non linear
chromatography. Academic Press, Boston MA, 1994.
[22] M.D. Levan, G. Carta, C. Yon, in Perry’s chemical engineers’ handbook (Ed: D.W.
Green). McGraw-Hill, New-York, 1997.
[23] S. Yamamoto. Plate height determination for gradient elution chromatography of
proteins. Biotechnol. Bioeng., 48:444-451, 1995.
[24] G.L. Skidmore, B.J. Horstmann, H.A. Chase. Modeling single-component protein
adsorption to the cation exchanger S Sepharose FF. J. Chromatogr. A, 498:113-
128, 1990.
[25] H. Yoshida, M. Yoshikawa, T. Kataoka. Parallel transport of BSA by surface and
pore diffusion in strongly basic chitosan. AIChE J., 40:2034-2044, 1994.
[26] L.E. Weaver Jr, G. Carta. Protein adsorption on cation exchangers: Comparison
of macroporous and gel-composite media. Biotechnol. Progr., 12:342-355, 1996.
[27] C. Chang, A.M. Lenhoff. Comparison of protein adsorption isotherms and uptake
rates in preparative cation-exchange materials. J. Chromatogr. A, 827:281-293,
1998.
[28] J.A. Wesselingh, J.C. Bosma. Protein ion-exchange adsorption kinetics. AIChE
J., 47:1571-1580, 2001.
[29] W.D. Chen, X.Y. Dong, Y. Sun. Analysis of diffusion models for protein adsorption
to porous anion-exchange adsorbent. J. Chromatogr. A, 962:29-40, 2002.
[30] T. Linden, A. Ljunglof, L. Hagel, M.-R. Kula, J. Thommes. Visualizing patterns
of protein uptake to porous media using confocal scanning laser microscopy. Sep.
Sci. Technol., 37:1-32, 2002.
[31] J. Hubbuch, T. Linden, E. Knieps, J. Thommes, M.R. Kula. Dynamics of protein
uptake within the adsorbent particle during packed bed chromatography. Biotech.
Bioeng., 80:359-368, 2002.
[32] A. Ljunglof, R. Hjorth. Confocal microscopy as a tool for studying protein adsorp-
tion to chromatographic matrices. J. Chromatogr. A, 743:75-83, 1996.
[33] A. Susanto, K. Wekenborg, J. Hubbuch, H. Schmidt-Traub. Developing a chro-
matographic column model for bovine serum albumin on strong anion-exchanger
154 Bibliography
Source30Q using data from confocal laser scanning microscopy. J. Chromatogr. A,
1137:63-75, 2006.
[34] J. Hubbuch, T. Linden, E. Knieps, A. Ljunglf, J. Thommes, M.-R. Kula. Mecha-
nism and kinetics of protein transport in chromatographic media studied by con-
focal laser scanning microscopy: Part I. The interplay of sorbent structure and
fluid phase conditions. J. Chromaogr. A, 1021:93-104 , 2002.
[35] S.R. Dziennik, E.B. Belcher, G.A. Barker,M.J. DeBergalis, S.E. Fernandez, A.M.
Lenhoff. Nondiffusive mechanisms enhance protein uptake rates in ion exchange
particles. Proc. Natl. Academ. Sci., 100:420-425, 2003.
[36] E.L. Cussler. Diffusion - mass transfer in fluid systems, 2nd ed., Cambridge Uni-
versity Press, Cambridge, UK, 1997.
[37] R.K. Lewus, G. Carta. Protein diffusion in charged polyacrylamide gels - Visual-
ization and analysis. J. Chromatogr. A, 865:155-168, 1999.
[38] R.K. Lewus, G. Carta. Protein transport in constrained anionic hydrogels: Dif-
fusion and boundary-layer mass transfer. Ind. Eng. Chem. Res., 40:1548-1558,
2001.
[39] S.M. Russell, E.B. Belcher, G. Carta. Protein partitioning and transport in sup-
ported cationic acrylamide-based hydrogels. AIChE J., 49:1168-1177 , 2005.
[40] M.C. Stone, G. Carta. Patterns of protein adsorption in chromatographic particles
visualized by optical microscopy. J. Chromatogr. A, 1160:206-214, 2007.
[41] J.R. Conder, B.O. Hayek. Adsorption kinetics and equilibria of bovine serum albu-
min on rigid ion-exchange and hydrophobic interaction chromatography matrices
in a stirred cell. Biochem. Eng. J., 6:215-223, 2000.
[42] A. Johnston, M.T.W. Hearn. High-performance liquid-chromatography of amino-
acid, pepdides and proteins .114. protein interaction with porous coulombic sor-
bents - comparison of esperimental findings with prediction od several adsorption
models. J. Chromatogr., 557:335-358, 1991.
[43] J. Gutenwik, B. Nilsson, A. Axelsson. Determination of protein diffusion coeffi-
cients in agarose gel with a diffusion cell. Biochem. Eng. J.,19:1-7, 2004.
[44] B. Nystrom, R.M. Johnsen. Effect of concentration and ionic-strength on the trans-
lational diffusion-coefficient of lysozyme. Chemica Scripta, 22:82-84, 1983.

Bibliography 155
[45] T. Raj, W.H. Flygare. Diffusion studies of bovine serum-albumin by quasi-elastic
light-scattering. Bhiochem., 13:3336-3340, 1974.
[46] C. Martin, G. Iberer, A.R. Ubiera, G. Carta. Two-component protein adsorption
kinetics in porous ion exchange media. J. Chromatogr. A, 1079:105-115, 2005.
[47] R.K. Lewus, G. Carta. Binary protein adsorption on gel-composite ion-exchange
media. AIChE J., 45:512-522, 1999.
[48] A.M. Russell, G. Carta. Multicomponent protein adsorption in supported cationic
polyacrylamide hydrogel. AIChE J, 51:2469-2480, 2005.
[49] L. Melter, A. Butte, M. Morbidelli. Preparative weak cation-exchange chromatog-
raphy of monoclonal antibody variants II. multicomponent adsorption. J. Chro-
matogr. A, submitted for pubblication.
[50] A. Seidel-Morgenstern. Experimental determination of single solute and competi-
tive adsorption isotherms. J. Chromatogr. A, 1037:255-272, 2004.
[51] A.K. Hunter, G. Carta. Protein adsorption on novel acrylamido-based polymeric
ion exchangers II. Adsorption rates and column behavior. J. Chromatogr. A,
897:81-97, 2000.
[52] D. Zhou, X. Liu, K. Kaczmarski, G. Guiochon. Prediction of band profiles of
mixtures of bradykinin and kallidin from data acquired by competitive frontal
analysis. Biotechnol. Progr., 19:945-954, 2003.
[53] C. Blumel, P. Hugo, A. Seidel-Morgenstern. Quantification of single solute and
competitive adsorption isotherms using a closed-loop perturbation method. J.
Chromatogr. A, 865:51-71, 1999.
[54] C. Heuer, E. Kusters, T. Plattner, A. Seidel-Morgenstern. . J. Chromatogr. A,
827:175-191, 1998.
[55] C.B. Ching, K.H. Chu, D.M. Ruthven. Design of the simulated moving bed process
based on adsorption isotherm measurements using a perturbation method. AIChE
J., 36:275-, 1990.
[56] D. Tondeur, H. Kabir, A. Luo, J. Granger. Multicomponent adsorption equilibria
from impulse response chromatography. Chem. Eng. Sci., 51:3781-3799, 1996.
156 Bibliography
[57] C. Heuer, P. Hugo, A. Seidel-Morgenstern. Experimental and theoretical study of
recycling in preparative chromatography. Sep. Sci. Technol. 34:173-199, 1999.
[58] E.V. Dose, S. Jacobson, G. Guiochon. Determination of isotherms from chromato-
graphic peak shape. Anal. Chem., 63:833-839, 1991.
[59] F. James, M. Sepulveda, F. Charton, I. Quinones, G. Guiochon. Determination
of binary competitive equilibrium isotherms from the individual chromatographic
band profiles. Chem. Eng. Sci., 54:1677-1696, 1999.
[60] L. Zhang, J. Selker, A. Qu, A. Velayudhan. Numerical estimation of multicompo-
nent adsorption isotherms in preparative chromatography: implications of exper-
imental error. J. Chromatogr. A, 934:13-29, 2001.
[61] A. Felinger, A. Cavazzini, G. Guiochon. Numerical determination of the compet-
itive isotherm of enantiomers. J. Chromatogr. A, 986:207-225, 2003.
[62] A. Felinger, D. Zhou, G. Guiochon. Determination of the single component and
competitive adsorption isotherms of the 1-indanol enantiomers by the inverse
method. J. Chromatogr. A, 1005:35-49, 2003.
[63] G. Guiochon, A. Felinger, D.G. Shirazi, A.M. Katti, Fundamentals of prepara-
tive and nonlinear chromatography, second edition, ELSEVIER Academic Press,
Amsterdam [etc.] (2006).
[64] I. Langmuir. The constitution and fundamental properties of solids and liquids.
Part I: solids. J. Am. Chem. Soc. 38:221-2295, 1916.
[65] C. A. Brooks, S. M. Cramer. Steric mass-action ion-exchange - displacement pro-
files and induced salt gradients. AIChE J., 38:1969-1978, 1992.
[66] M.C. Stone, G. Carta. Protein adsorption and transport in agarose and dextran-
grafted agarose media for ion exchange chromatography. J. Chromatogr. A,
1146:202-215, 2007.
[67] A.M. Hashim, K.H. Chu. Prediction of protein breakthrough behavior using sim-
plified analytical solutions. Sep. Purif. Technol., 53:189-197, 2007
[68] A.M. Hashim, K.H. Chu, P.S. Tsan. Determination of lumped rate coefficients of
proteins: effect of adsorption. Chem. Eng. Techno, 19:137-142, 1996.

Bibliography 157
[69] M. Degerman, N. Jakobsson, B. Nilsson. Constrained optimization of a preparative
ion-exchange step for antibody purification. J. Chromatogr. A, 1113:92100,
[70] S. Yamamoto, K. Nakanishi, R. Matsuno. Ion exchange chromatography of pro-
teins. Marcel Dekker, New York, 1988.
[71] D. Zhou, D.E. Cherrak, K. Kaczmarski, A. Cavazzini, G. Guiochon. Prediction of
the band proiles of the mixtures of the 1-indanol enantiomers from data acquired
with the single racemic mixture. Chem. Eng. Sci., 58:3257-3272, 2003.
[72] D.D. Frey, A. Barnes, J. Strong. Numerical studies of multicomponent chromatog-
raphy using pH gradients. AIChE J., 41:1171-1183, 1995.
[73] M.A. Hashim, K.H. Chu, P.S. Tsan. Equilibrium isotherm for protein adsorption
in a bisolute system. Trans. Inst. Chem. Engineers, 73:22-26, 1995.
[74] G.M. Schwab. Ergebnisse der exakten Naturwissenschaften. Vol7, Julius Springer,
Berlin, 1928.
[75] D.M. Ruthven. Principles of adsorption and adsorption processes, Wiley, New
York, NY, 1984.
[76] M. Suzuki. Adsorption engineering. Elsevier, Amsterdam, The Netherlands, 1990.
[77] J.A. Berninger, R.D. Whitley, X. Zhang, N.-H.L. Wang. A versatile model for
simulation of reaction and nonequilibrium dynamics in multicomponent fixed-bed
adsorption processes. Comput. Chem. Eng., 15:749-768, 1991.
[78] W. Piatkowski, D. Antos, K. Kaczmarski. Modeling of preparative chromatogra-
phy processes with slow intraparticle mass transport kinetics. J. Chromatogr. A,
988:219-231, 2003.
[79] M. Morbidelli, A. Servida, G. Storti, S. Carra. Simulation of multicomponent
adsorption adsorption beds - model analysis and numerical-solution. Ind. Eng.
Chem. Fundam., 21:123-131, 1982.
[80] J.J. van Deemter, F.J. Zuiderweg, A. Klinkenberg. Longitudinal diffusion and
resistance to mass transfer as causes of nonideality in chromatography. Chem.
Eng. Sci., 5:271-289, 1956.
[81] J. Giddings. Dynamics of chromatography, M. Dekker, New York, NY, 1965.

158 Bibliography
[82] P. Haarhoff, H.J. Van der Linde. Concentration dependence of elution curves in
non-ideal gas chromatography. Anal. Chem., 38:573-582, 1966.
[83] E. Wicke. Empirical and theoretical tests on the rate of sorption of gases in porous
materials. Kolloid Z., 86:295-313, 1939.
[84] J.N. Wilson. A theory of chromatography. J. Am. Chem. Soc., 62:1583-1591, 1940.
[85] D. DeVault. The theory of chromatography. J. Am. Chem. Soc., 65:532-540, 1943.
[86] H.-K. Rhee, R. Aris, N.R. Amundson. First order partial differential equations,
Volume 1, Dover publications, Mineola, New York, 1986.
[87] H.-K. Rhee, R. Aris, N.R. Amundson. First order partial differential equations,
Volume 2, Dover publications, Mineola, New York, 1989.
[88] K. Kaczmarski, D. Antos. Modified Rouchon and Rouchon-like algorithms for
solving different models of multicomponent preparative chromatography. J. Chro-
matogr. A, 756:73-87 ,1996.
[89] G.K. Sofer, L.E. Nystrom. Process Chromatogrgraphy: A Practical Guide, Aca-
demic Press, New York, 1989.
[90] R.F. Burgoyne, M.C. Priest, K.L. Roche, G. Vella. Systematic development and
validation of sanitization protocols for a chromatographic system designed for
biotherapeutics purification. Pharm. Biomed. Anal. 11:1317-1325, 1993.
[91] W. Muller. New ion exchangers for the chromatography of biopolymers. J. Chro-
matogr., 510:133-140, 1990.
[92] R. Lemieux, R. Bazin, S. Neron. Therapeutic intravenous immunoglobulins. Mol.
Immunol., 42:839-848, 2005.
[93] A. Buchacher, G. Iberer. Purification of intravenous immunoglobulin G from hu-
man plasma - aspects of yeld and virus safety. Biotechnol. J., 1:148-163, 2006.
[94] P. DePhillips, A.M. Lenhoff. Pore size distributions of cation-exchange adsorbents
determined by inverse size-exclusion chromatography. J. Chromatogr. A, 883:39-
54, 2000.
[95] H. Schmidt-Traub. Preparative chromatography of fine chemicals and pharmaceu-
tical agents, Wiley-VCH, Weinheim, 2005.
Bibliography 159
[96] M.S. Saunders, J. B. Vierow, G. Carta. Uptake of phenylalanine and tyrosine by
a strong-acid cation exchanger. AIChE J., 35:5368, 1989.
[97] A. Martin, R. Synge. A new form of chromatogram employing two liquid phases
I. A theory of chromatography 2. Application to the micro-determination of the
higher monoamino-acids in proteins Biochem. J. 35:1358-1368, 1941.
[98] E. Kucera. Contribution to the theory of chromatography, linear non-equilibrium
elution chromatography. J. Chromatogr., 19:237-248, 1965.
[99] M. Kubin. Beitrag zur theorie der Chromatographie. Collect. Czech. Chem.
Comm., 30:1104-1118, 1965.
[100] E.J. Wilson, C.J. Geankoplis. Liquid mass transfer at very low Reynolds numbers
in packed beds. Ind. Eng. Chem. Fundam., 5:9-14, 1966.
[101] M.E. Young P.A. Carroad, R.L. Bell. Estimation of diffusion coefficients of pro-
teins. Biotechnol. Bioeng., 22:947-955, 1980.
[102] H.P. Gregor. A general thermidynamic theory of ion exchange processes. J. Am.
Chem. Soc., 70:1293-1293, 1948.
[103] G. Wiegner, H. Jenny. Base exchange in permutites. (Cations exchange in eugels).
Kolloid Z., 42:268-272, 1927.
[104] P. Vageler, J. Woltersdorf. Beitrage zur Frage des Basesaustausches und der
Aziditaten. Z. Pflanzenernahr. Dung. Bodenkunde A, 15:329-342, 1930.
[105] P. Vageler, J. Woltersdorf. Beitrage zur Frage des Basenaustausches und der
Aziditaten. II. Vorversuche an Permutiten. Z. Pflanzenernahr. Dung. Bodenkunde
A, 16:184-204, 1930.
[106] S. Yamamoto, K. Nakanishi, R. Matsuno, T. Kamikubo. Ion exchange chro-
matography of proteins- prediction of elution curves and operating conditions. II.
experimental verification. Biotechnol. Bioeng., 25:1373-1391, 1983.
[107] Q.D. Lan, A.S. Bassi, J.-X. Zhu, A. Margaritis. A modified Langmuir model for
the prediction of the effects of ionic strength on the equilibrium characteristics of
protein adsorption onto ion exchange/affinity adsorbents. Chem. Eng. J., 81:179-
186, 2001.

160 Bibliography
[108] M.A. Hashim, K.-H. Chu, P.-S. Tsan. Effects of ionic strength and pH on the
adsorption equilibria of lysozyme on ion exchangers. J. Chem. Tech. Biotechnol.,
62:253-260, 1995.
[109] G.M.S. Finette, Q.-M.Mao, M.T.W. Hearn. Comparative studies on the isother-
mal characteristics of proteins adsorbed under batch equilibrium conditions to
ion-exchange, immobilised metal ion affinity and dye affinity matrices with dif-
ferent ionic strength and temperature conditions. J. Chromatogr. A, 763:71-90,
1997.
[110] J.-X. Huang, J. Schudel, G. Guiochon. Adsorption behavior of albumin and conal-
bumin on TSK-DEAE PW anion exchanger. J. Chromatogr., 504:335-349, 1990.
[111] S. Yamamoto, K. Nakanishi, R. Matsuno, T. Kamikubo. Ion exchange chro-
matography of proteins-prediction of elution curves and operating conditions. I.
theoretical considerations. Biotechnol. Bioeng., 25:1465-1483, 1983.
[112] T. Narita, S. Ito, et al. Effects of protein meals on the urinary excretion of various
plasma proteins in healthy subjects. Nephron, 81:398-405, 1999.
[113] C.C. Gyenge, O. Tenstad, H. Wiig, In vivo determination of steric and electro-
static exclusion of albumin in rat skin and skeletal muscle. J. Physiol. 552.3:907-
916, 2003.
[114] H. M. Patel, J. Kraszewsky, B. Mukhopadhyay. The phosphoenolpyruvate car-
boxylase from methanothermobacter thermautotrophicus has a novel structure. J.
Bacteriology, 186:5129-5137, 2004.
[115] Medication guide for Gammanorm, Octapharma, Langenfeld (Germany) 2004.
[116] L. Melter, A. Butte, M. Morbidelli. Adsorption of monoclonal antibody variants
on analytical cation-exchange resin. J. Chromatogr. A, 1154:121-131, 2007.
[117] M.A. Fernandez, W.S. Laughinghouse, G. Carta. Characterization of protein ad-
sorption by composite silica-polyacrylamide gel anion exchangers .2. Mass transfer
in packed columns and predictability of breakthrough behavior. J. Chromatogr.
A, 746:185-198. 1996.
[118] M.A. Fernandez, G. Carta. Characterization of protein adsorption by composite
silica-polyacrylamide gel anion exchangers .1. Equilibrium and mass transfer in
agitated contactors. J. Chromatogr. A, 746:169-183, 1996.

Bibliography 161
[119] G. Garke, R. Hartmann, N. Papamichael, W.D. Deckwer, F.B. Anspach. The in-
fluence of protein size on adsorption kinetics and equilibria in ion-exchange chro-
matography, Sep. Sci. Technol., 34:2521-2538, 1999.
[120] J.R. Conder, B.O. Hayek. Adsorption and desorption kinetics of bovine serum
albumin in ion exchange and hydrophobic interaction chromatography on silica
matrices. Biochem. Eng. J., 6:225-232, 2000.
[121] K. Miyabe, G. Guiochon. Kinetic study of the mass transfer of bovine serum
albumin in anion-exchange chromatography. J. Chromatogr. A, 866:147-171, 2000.
[122] K. Kaczmarski, D. Antos, H. Sajonz, P. Sajonz, G. Guiochon. Comparative mod-
eling of breakthrough curves of bovine serum albumin in anion-exchange chro-
matography. J. Chromatogr. A, 925:1-17, 2001.
[123] B. Nilsson. Aspects of modeling a preparative ion-exchange step for antibody
purification. Chem. Eng. Technol., 28:1367-1374, 2005.
[124] P.V. Danckwerts. Continuous flow systems - distribution of residence times.
Chem. Eng. Sci., 2:1-13, 1953.
[125] R.J. LeVeque. Finite difference methods for ordinary differeential equations.
SIAM, Philadephia, 2007.
[126] J.C. Strikwerda. Finite difference schemes and partial differential equations. sec-
ond edition, SIAM, Philadelphia, 2004.
[127] A.C. Hindmarsh. ODEPACK, A Systematized Collection of ODE Solvers, in Sci-
entific computing : applications of mathematics and computing to the physical
sciences. ed. by R. S. Stepleman et al., North-Holland, Amsterdam [etc.], 1983.
[128] A.E.W Jones, G.W. Forbes. An adaptive simulated annealing algorithm for global
optimization over continuous-variables. J. Global. Optim., 6:1-37, 1995.
[129] Alan C. Hindmarsh, ”LSODE and LSODI, Two New Initial Value Ordinary
Differential Equation Solvers”, ACM-Signum Newsletter 15 (1980) 10.
[130] G. A. F. Seber, C. J. Wild, Nonlinear Regression, John Wiley & Sons Inc., 1989.
[131] T. Kariya, H. Kurata, Generalized Least Squares, Wiley, 2004.
[132] G. Subramanian. Bioseparation and bioprocessing : a handbook. second edition,
Wiley-VCH, Weinheim, 2007.
162 Bibliography
[133] A.K.B. Frej, S. Johansson, P. Leijon. Expanded bed adsorption at production
scale: Scale-up verification, process example and sanitization of column and ad-
sorbent. Bioprocess Eng., 16:57-63, 1997.
[134] Y. Yao, A.M. Lenhoff. Pore size distributions of ion exchangers and relation to
protein binding capacity. J. Chromatogr. A, 1126:107-119, 2006.
[135] Y. Yao, A.M. Lenhoff. Determination of pore size distributions of porous chro-
matographic adsorbents by inverse size-exclusion chromatography. J. Chromatogr.
A, 1037:273-282, 2004.
[136] E. Muller. Properties and characterization of high capacity resins for biochro-
matography. Chem. Eng. Technol., 28:1295-1305, 2005.
[137] B.C.S. To, A.M. Lenhoff. Hydrophobic interaction chromatography of proteins
I. The effects of protein and adsorbent properties on retention and recovery. J.
Chromatogr. A, 1141:191-205, 2007.
[138] X.-P. Zhou, W. Li, Q.-H. Shi, Y. Sun. Analysis of mass transport models for pro-
tein adsorption to cation exchanger by visualization with confocal laser scanning
microscopy. J. Chromatogr. A, 1103:110-117, 2006.
[139] J.F. Langford, M.R. Schure, Y. Yao, S.F. Maloney, A.M. Lenhoff. Effects of
pore structure and molecular size on diffusion in chromatographic adsorbents. J.
Chromatogr. A, 1126:95-106, 2006.
[140] H. Kempe, P. Persson, A. Axelsson, B. Nilsson, G. Zacchi. Determination of
diffusion coefficients of proteins in stationary phases by frontal chromatography.
Biotechnol. Bioeng., 93:656-664, 2006.
[141] http://www.merck.de/servlet/PB/show/1225330/w214154_Fracotgel_WF.pdf
[142] Personal communication
[143] O.V. Krasilnikov, R.Z. Sabirov, V.I. Ternovsky, P.G. Merzliak, J.N. Muratkhod-
jaev. A simple method for the determination of the pore radius of ion channels in
planar lipid bilayer-membranes. FEMS Microbiol. Immun., 105:93-100, 1992.
[144] K. Yang, Y. Sun. Structured parallel diffusion model for intraparticle mass trans-
port of proteins to porous adsorbent. Biochem. Eng. J., 37:298-310, 2007.
Bibliography 163
[145] Y. Yao, K.J. Czymmek, R. Pazhianur, A.M. Lenhoff. Three-dimensional pore
structure of chromatographic adsorbents from electron tomography. Langmuir,
22:11148-11157, 2006.

165
Curriculum Vitae
Nicola Forrer
05/2004 – 05/2008 PhD at the Institute for Chemical and Bioengineering,
ETH Zurich
10/1999 – 04/2004 Chemical Engineering study, ETH Zurich
2004: Diplom
09/1995 – 06/1999 Mathematics and science gymnasium, Lugano
1999: Matura Type C
09/1986 – 06/1995 Primary and secondary school, Lugano
31/05/1980 Born in Minusio (TI), Switzerland
Publications
• A. Butte, N. Forrer and M. Morbidelli , ”Modelling of a polyclonal antibody in
cation exchange chromatography” manuscript in preparation (2008).
• N. Forrer, A. Butte and M. Morbidelli , ”Characterization of the adsorption of
a polyclonal IgG mixture on a strong cation exchanger column. Part II:
Adsorption modelling” manuscript in preparation (2008).
• N. Forrer, A. Butte and M. Morbidelli , ”Characterization of the adsorption of
a polyclonal IgG mixture on a strong cation exchanger column. Part I:
Adsorption characterization,” manuscript in preparation (2008).
• N. Forrer and M. Morbidelli , ”The role of the silanol activity in antidepressant
and insulin separation” manuscript in preparation (2008).
• N. Forrer, O. Kartachova, A. Butte and M. Morbidelli , ”Investigation of the
porosity variation in chromatography experiments,” submitted to Ind Eng Chem
Res (2007).

166
• A. Rajendran, B. Bonavoglia, N. Forrer, G. Storti, M. Mazzotti, M. Morbidelli,
”Simultaneous measurement of sorption and swelling in supercritical
CO2-poly(methyl metacrylate) system,” Ind Eng Chem Res, 24 (2004)
2549-2560.
Conference proceedings
• M. Johnck, A. Butte, N. Forrer, A. Franke, M. Schulte, M. Morbidelli,
”Improving the productivity for an antibody purification by systematic
variation of sorbent and process design, ” 13th Recovery of Biologicals
Conference, Qubec, Canada (2008).
• N. Forrer, D. Getaz, H. Thomas, G. Strohlein, A. Butte, M. Morbidelli, ”The
importance of porosity in biomolecules separation, ” 27th International
Symposium on the Separation of Proteins, Peptides and Polynucleotides
(ISPPP), Orlando, USA (2007).
• N. Forrer and M. Morbidelli, ”The role of the silanol groups in the separation of
basic antidepressants by reversed-phase chromatography, ” 20th International
Symposium on Preparative / Process Chromatography, Ion Exchange,
Adsorption/ Desorption Processes & Related Separation Techniques (PREP)
Baltimore, USA (2007).
• N. Forrer, A. Butte, G. Storti, M. Morbidelli, ”Antibody Purification on a
Strong Cation Exchanger Column, ” 19th International Symposium on
Preparative/ Process Chromatography, Ion Exchange, Adsorption/ Desorption
Processes & Related Separation Techniques (PREP), Baltimore, USA (2006).
• N. Forrer, A. Butte, M. Morbidelli, ”Antibody Purification on a Strong Cation
Exchange Column, ” 11th International Symposium on Preparative and
Industrial Chromatography and Allied Techniques (SPICA) and 26th
International Symposium on the Separation of Proteins, Peptides and
Polynucleotides (ISPPP), Innsbruck, Austria (2006).
Related Documents