96 ANTI-MALARIA EFFECT OF ETHANOL EXTRACT OF MORINGA OLEIFERA (AGBAJI) LEAVES ON MALARIA-INDUCED MICE DISSERTATION SUBMITTED IN PARTIAL FULFILMENT OF THE REQUIREMENTS FOR AWARD OF DEGREE OF MASTER OF SCIENCE (M.Sc) IN PHARMACOLOGICAL BIOCHEMISTRY, UNIVERSITY OF NIGERIA, NSUKKA BY UGWU, OKECHUKWU PAUL-CHIMA (PG/M.Sc/09/51438) DEPARTMENT OF BIOCHEMISTRY UNIVERSITY OF NIGERIA NSUKKA SUPERVISOR: PROF. O. F. C. NWODO SEPTEMBER, 2011

Welcome message from author
This document is posted to help you gain knowledge. Please leave a comment to let me know what you think about it! Share it to your friends and learn new things together.
Transcript
96
ANTI-MALARIA EFFECT OF ETHANOL EXTRACT OF MORINGA
OLEIFERA (AGBAJI) LEAVES ON MALARIA-INDUCED MICE
DISSERTATION SUBMITTED IN PARTIAL FULFILMENT OF THE
REQUIREMENTS FOR AWARD OF DEGREE OF MASTER OF SCIENCE (M.Sc)
IN PHARMACOLOGICAL BIOCHEMISTRY, UNIVERSITY OF NIGERIA,
NSUKKA
BY
UGWU, OKECHUKWU PAUL-CHIMA
(PG/M.Sc/09/51438)
DEPARTMENT OF BIOCHEMISTRY
UNIVERSITY OF NIGERIA
NSUKKA
SUPERVISOR: PROF. O. F. C. NWODO
SEPTEMBER, 2011
97
CERTIFICATION
Ugwu, Okechukwu Paul-Chima, a postgraduate student of the Department of
Biochemistry with the Reg. No: PG/M.Sc/09/51438 has satisfactorily completed his
requirement for research work for the degree of Master of Science (M.Sc) in
Pharmacological Biochemistry. The work embodied in this project (dissertation) is
original and has not been submitted in part or full for any other diploma or degree of
this or any other University.
PROF. O. F. C. NWODO PROF. L.U.S. EZEANYIKA
(Supervisor) (Head)
EXTERNAL EXAMINER
98
DEDICATION
This work is dedicated to my lovely parents Sir Hyacinth Chima and Lady (Hon.)
Francisca Chika Ugwu.
99
ACKNOWLEDGEMENT
Firstly, my sincere gratitude goes to the Almighty God for His love, guidance,
protection, provisions and other countless blessings. My immeasurable gratitude goes
to my supervisor, Prof. O.F.C. Nwodo, for his fatherly support and guidance especially
his painstaking patience during the course of this study in helping to separate the
wheat from the chaff. He inculcated knowledge, wisdom, discipline and humility in me.
I remain grateful Sir. The good Lord will continue to bless and protect you, my Prof. I
appreciate my parents, Sir and Lady Hyacinth Ugwu, for their prayers and support. I
cannot forget my siblings, Adaoma Ugwu, Chinyere Ugwu, Nnenna Ugwu and
Ndidiamaka Ugwu for their encouragements. Also, my unreserved gratitude goes to my
love and wife, Nnenna Jovita Ugwu for her love, prayers and encouragements during
the course of the research. I cannot forget the encouragements of my cousin
Chukwuma Asogwa and my dear friends Sunday Valentine Eze, Emeka Aroh,
Okechukwu Ugwueze , in the course of this research
I also appreciate the encouragements of my distinguished lecturers of
Department of Biochemistry, especially Prof. L.U.S. Ezeanyika, Prof. O. Obidoa, Prof.
I.N.E. Onwurah, Prof. O.U. Njoku, Prof. E.O. Alumanah, Prof. F.C. Chilaka, Prof. P.N.
Uzoegwu, Dr. J.E Parker , Dr. S.O.O. Eze, Dr. B.C. Nwanguma, Dr. V.N. Ogugwa, and all
the tutorial and non tutorial staff of the Department of Biochemistry.
My warm regards equally go to Mr.Thomas Adonu of Adonai Laboratory, Nsukka
and Mr Ikechukwu Eze of Department of Veterinary Medicine, University of Nigeria,
Nsukka.
100
Special thanks also go to my friends Heros, Victor, Paul, Ebube, Dopa, Chris
and other postgraduate colleagues of Department of Biochemistry. Finally, my
immeasurable gratitude goes to my friend Dr. B.O Mama of Department of Civil
Engineering, University of Nigeria, Nsukka, for his financial and moral support during
the course of this research. Thanks to you all and remain blessed.
101
ABSTRACT
Percentage parasitaemia, haematological parameters, liver markers, kidney markers, lipid profile of
triacylglycerides, total cholesterol, high density lipoprotein and low density lipoprotein were evaluated
in mice consisting of six groups. Groups 1 (positive control) and 6 (negative control) were treated with
5mg/kg body weight of distilled water, group 5 (standard control) was treated with 5mg/kg body
weight of artesunate while groups 2, 3 and 4 were treated with 45, 90 and 180 mg/kg body weight of
Moringa oleifera ethanol leaf extract. The results showed that percentage parasitaemia of the mice
treated with ethanol leaf extract of moringa oleifera significantly cleared parasitaemia on day 28 of
post treatment in groups 4 and 5 compared with groups 1 (positive control) ,2 and 3. The
haematological parameters of packed cell volume (PCV), haemoglobin concentration of the cell (Hb)
and total red blood cell counts (TRBC) increased significantly (p<0.05) in groups 4 (180 mg/kg body
weight of the extract), group 5 (5 mg/kg body weight of Artesunate) and group 6 (negative control)
compared to group 1 (positive control) on day 28 of post treatment while the haematological parameter
of total white blood cell (TWBC) increased significantly (p<0.05) in groups 3 (90 mg/kg body weight
of the extract) and group 6 (negative control) compared to group 1 (positive control). Kidney marker of
serum creatinine increased significantly (p<0.05) in group 1 (positive control) compared to group 6
(negative control) and other groups. Group 6 (negative control) showed a non-significant difference
(p>0.05) in serum urea compared to group 1 (positive control) and other groups. Liver marker of total
bilirubin (TB) increased significantly (p<0.05) in group 1 (positive control) and group 2 (45 mg/kg
body weight of the extract) compared to group 6 (negative control) and other groups. Alanine
aminotransferase (ALT) also, significantly increased (p<0.05) in group 1 (positive control) and group 2
(45 mg/kg body weight of the extract) when compared to group 6 (negative control). Group 6 (negative
control) showed no significant difference (p<0.05) in aspartate aminotransferase (AST) compared to
group 1 (positive control) and other groups. Alkaline phosphatase (ALP) activity in the mice
significantly increased (p<0.05) in group 1 (positive control) and group 4(180mg/kg body weight of the
extract) compared to group 6 (negative control). Lipid profile of total cholesterol, triacylglycerol, high
density lipoprotein and low density lipoprotein showed non-significant difference (p>0.95) when group
6 (negative control) was compared to group 1 (positive control) and other groups.
102
TABLE OF CONTENTS
PAGE
103
Title page … … … … … … … … … … i
Certification … … … … … … … … … … ii
Dedication … … … …. … … … … … … iii
Acknowledgement … … … … … … … … … iv
Abstract … … … … … … … … … vi
Table of contents … … … … … … … … … vii
List of tables … … … … … … … … … x
List of figures … … … … … … … … … xi
List of abbreviations … … … … … … … … … xii
CHAPTER ONE: INTRODUCTION
1.1 Overview of malaria … … … … … … … 2
1.1.1 Signs and symptoms of malaria … … … … … 3
1.1.2 Causes of malaria … … … … … … … … 4
1.1.3 Lifecycle of malaria parasites … … … … … … 5
1.1.4 Recurrent malaria … … … … … … … … 9
1.1.5 Pathogenesis of malaria … … … … … … … 9
1.1.6 Malaria epidemiology … … … … … … … 11
1.1.7 Immunity against malaria … … … … … … … 15
1.1.8 Human genetics and innate resistance … … … … … 16
1.1.9 Diagnosis of malaria … … … … … … … … 17
1.1.9.1 Blood films … … … … … … … … … 17
104
1.1.9.2 Molecular methods … … … … … … …
… 18
1.1.10 Prevention and control of malaria … … … … … … 18
1.1.11 Anti-malarial drugs … … … … … … … … 19
1.1.11.1 Chemoprophylaxis … … … … … … … … 22
1.1.12 Drug resistance … … … … … … … … 22
1.1.12.1 Spread of resistance … … … … … … … 24
1.1.12.2 Prevention of resistance … … … … … … … 25
1.2 Moringa oleifera .. … … … … … … … 26
1.2.1 Distribution of Moringa oleifera … … … … … … 28
1.2.2 General nutrition of Moringa oleifera … … … … … 28
1.3 Aim and objectives of the research … … … … … … 29
CHAPTER TWO: MATERIALS AND METHODS
2.1 MATERIALS … … … … … … … … … 30
2.1.1 Animals … … … … … … … … … 30
2.1.2 Moringa oleifera (Agbaji) … … … … … … … 30
2.1.3 Instruments/Equipment … … … … … … … 30
2.1.4 Chemicals/Reagents/Samples … … … … … … 31
2.2 METHODS … … … … … … … … … 31
2.2.1 Extraction … … … … … … … … … 31
2.2.2 Experimental design … … … … … … … 31
2.2.3 Procurement of parasitaemia … … … … … … … 32
105
2.2.4 Preparation of EDTA (Sequestrene) anticoagulant … … … … 33
2.2.5 Preparation of giemsa stain … … … … … … … 33
2.2.6 Preparation of alcohol fixative solution … … … … … 33
2.2.7 Methods of Estimations … … … … … … … 33
2.2.7.1 Determination of parasitaemia … … … … … … 33
2.2.7.2 Determination of total red blood cell (RBC) count … … … … 34
2.2.7.3 Determination of total white blood cell (WBC) count … … … 35
2.2.7.4 Determination of packed cell volume (PCV) … … … … … 36
2.2.7.5 Determination of haemoglobin (Hb) concentration … … … … 37
2.2.7.6 Determination of total bilirubin concentration … … … … 38
2.2.7.7 Determination of serum urea concentration … … … … … 39
2.2.7.8 Determination of creatinine concentration … … … … … 40
2.2.7.9 Assay of aspartate aminotransferase (AST) activity … … … … 40
2.2.7.10 Assay of alanine aminotransferase (ALT) activity … … … … 42
2.2.7.11 Assay of alkaline phosphatase (ALP) activity … … … … 43
2.2.7.12 Total cholesterol concentration … … … … … … 44
2.2.7.13 High density lipoproteins (HDL)–cholesterol concentration … … 45
2.2.7.14 Determination of triacylglycerol (TAG) concentration … … … 46
2.2.7.15 Low density lipoprotein (LDL)-cholesterol concentration … … … 47
2.2.7.16 Acute toxicity studies (LD50) … … … … … … 48
2.2.8 Phytochemical Analyses … … … … … … 49
2.2.8.1 Test for carbohydrates … … … … … … … 49
2.2.8.2 Test for alkaloids … … … … … … … 49
2.2.8.3 Test for glycosides … … … … … … … 50
2.2.8.4 Test for saponins … … … … … … … 50
2.2.8.5 Test for tannins … … … … … … … 50
106
2.2.8.6 Test for flavonoids … … … … … … … 50
2.2.8.7 Test for resins (Precipitaion Test) … … … … … 51
2.2.8.8 Test for proteins (Million’s Test) … … … …. … 51
2.2.8.9 Test for oils … … … … … … … … 51
2.2.8.10 Test for steroids and terpenoids … … … … … 51
2.2.9 Statistical analysis … … … … … … … 51
CHAPTER THREE: RESULTS
3.1 Phytochemical constituents of Moringa oleifera … … … … 52
3.2 Acute toxicity (LD50) … … … … … … … 53
3.3. Effect of ethanol leaf extract of Moringa oleifera on percentage parasitaemia 54
3.4 Effect of ethanol leaf extract of Moringa oleifera on haemoglobin
concentration … .… … … … … … … 56
3.5 Effect of ethanol leaf extract of Moringa oleifera on total white blood
cell count … … … … … … … … … 58
3.6 Effect of ethanol leaf extract of Moringa oleifera on packed cell
volume … … … … … … … … … 60
3.7 Effect of ethanol leaf extract of Moringa oleifera on red blood
cell count … … … … … … … … … 62
3.8 Effect of ethanol leaf extract of Moringa oleifera on serum creatinine
concentration … … … … … … … … … 64
3.9 Effect of ethanol leaf extract of Moringa oleifera on urea
concentration … … … … … … … … … 66
3.10 Effect of ethanol leaf extract of Moringa oleifera on total bilirubin
concentration … … … … … … … … … 68
3.11 Effect of ethanol leaf extract of Moringa oleifera on
107
alanine aminotransferase activity … … … … … …
70
3.12 Effects of ethanol leaf extract of Moninga oleifera on aspartate
aminotrasferase activity … … … … … … … 72
3.13 Effect of ethanol leaf extract of Moringa oleifera on alkaline
phosphatase activity … … … … … … … … 74
3.14 Effect of ethanol leaf extract of Moringa oleifera on total
cholesterol concentration … … … … … … … 76
3.15 Effect of ethanol leaf extract of Moringa oleifera on total high density
lipoprotein concentration … … … … .. … … 78
3.16 Effect of ethanol leaf extract of Moringa oleifera on low density
lipoprotein concentration … … … … … … … 80
3.17 Effect of ethanol leaf extract of Moringa oleifera on triacylglycerol
concentration … … … … … … … … … 82
CHAPTER FOUR: DISCUSSION
4.1 Discussion … … … … … … … … … 84
4.2 Conclusion … … … … … … … … … 90
4.3 Suggestions for further studies … … … … … … 90
References … … … … … … … … … 91
Appendices … … … … … … … … … … 96
108
LIST OF TABLES
109
Table 1: Factors influencing vectorial capacity … … … … …
14
Table 2: Selected anti-malarial drugs … … … … … … 20
Table 3: Scientific classification of Moringa oleifera … … … … 27
Table 4: Phytochemical constituents of Moringa oleifera … … … … 52
110
LIST OF FIGURES
Fig. 1 Pictorial view of Moringa oleifera … … … … … … 27
Fig. 2 Effect of ethanol leaf extract of Moringa oleifera on percentage
parasitaemia … … … … … … … … … 55
Fig. 3 Effect of ethanol leaf extract of Moringa oleifera on haemoglobin
concentration … … … … … … … … … 57
Fig. 4 Effect of ethanol leaf extract of Moringa oleifera on total white blood
111
cell count … … … … … … … … … 59
Fig. 5 Effect of ethanol leaf extract of Moringa oleifera on packed cell
volume … … … … … … … … … 61
Fig. 6 Effect of ethanol leaf extract of Moringa oleifera on red blood
cell count … … … … … … … … … 63
Fig. 7 Effect of ethanol leaf extract of Moringa oleifera on serum creatinine
concentration … … … … … … … … … 65
Fig. 8 Effect of ethanol leaf extract of Moringa oleifera on urea
concentration … … … … … … … … … 67
Fig. 9 Effect of ethanol leaf extract of Moringa oleifera on total bilirubin
concentration … … … … … … … … … 69
Fig. 10 Effect of ethanol leaf extract of Moringa oleifera on
alanine aminotransferase activity … … … … … … 71
Fig. 11 Effects of ethanol leaf extract of Moringa oleifera on aspartate
aminotransferase activity … … … … … … … 73
Fig. 12 Effect of ethanol leaf extract of Moringa oleifera on alkaline
phosphatase activity … … … … … … … … 75
Fig. 13 Effect of ethanol leaf extract of Moringa oleifera on total
cholesterol concentration … … … … … … … 77
Fig. 14 Effect of ethanol leaf extract of Moringa oleifera on total high density
lipoprotein concentration … … … … .. … … 79
Fig. 15 Effect of ethanol leaf extract of Moringa oleifera on low density
lipoprotein concentration … … … … … … … 81
Fig. 16 Effect of ethanol leaf extract of Moringa oleifera on triacylglycerol
concentration … … … … … … … … … 83
112
LIST OF ABBREVIATIONS
ALT Alanine aminotransferase
ALP Alkaline phosphate
AST Aspartate aminotransferase
TB Total bilirubin
Mp Malaria parasite
Hb Heamogloblin
TWBC Total white blood cell count
TRBC Total red blood cell count
TAG Triacylglycerides
CHOL Cholesterol
HDL High-density lipoprotein
LDL Low-density lipoprotein
PCV Packed cell volume
IU/l International unit Per litre
Mmol/l Milimole per litre
µmol/l Micromole per litre
113
g/dl Gramme per decilitre
i.p Intraperitoneal
HIV Human immuno deficiency virus
EDTA Ethylene diamine tetra-acetate
SPSS Statistical package for social sciences
CHAPTER ONE
INTRODUCTION
Malaria has been and is still the cause of major human morbidity and mortality (Clark and Cowden,
2003). It is the most important parasitic disease worldwide with an incidence of almost three hundred
million clinical cases and over one million deaths yearly (WHO, 2000). Malaria is directly responsible
for one in five childhood deaths in Africa and indirectly contributes to illnesses and deaths from other
diseases (WHO, 1999). Pregnant women and children under five years of age are the most vulnerable.
In the absence of an effective vaccine, the fight against malaria depends on chemotherapy, the
reduction and prevention of anopheles mosquito contacts with human (Winstainley, 2000). The loss in
effectiveness of chemotherapy due to the emergence of resistant strains, constitutes the greatest threat
to the control of malaria. Therefore, to overcome malaria, new knowledge, products, and tools
especially new drugs are urgently needed (Omulokoli et al., 1997). Traditional methods of treatment
and control of malaria could be a promising source of potential anti-malaria drugs. (Wright and
Phillipson,1990) Moringa oleifera was massively grown and promoted by the local media in Uganda in
the 1980s as a plant which is capable of curing a number of diseases ,including malaria, and of
relieving some symptoms of HIV/AIDS. Moringa oleifera is referred to as a MIRACLE TREE (Fuglie,
2001). This is due to its socio-economic, nutritional, pharmacological and industrial benefits (Makkar
and Becker, 2007). As a result of the impact of malaria on the human race and claimed effectiveness of
Moringa oleifera in curing diseases such as diabetes,typhoid and high blood pressure, it was considered
necessary to investigate the anti-malarial effect of Moringa oleifera.

114
1.1 OVERVIEW OF MALARIA
Malaria is a mosquito-borne disease of humans caused by eukaryotic protists of the genus Plasmodium.
It is transmitted from one human to another by a bite of an infected female anopheles mosquito. It is
widespread in tropical and sub-tropical regions, including much of Sub-Sahara Africa, Asia and the
Americas (Clark and Cowden, 2003). Plasmodium species are generally host specific and vector
specific in that each species will only infect a limited range of hosts and vectors. Four species of
plasmodium can infect and be transmitted by humans. They are Plasmodium falciparum, Plasmodium
vivax, Plasmodium ovale and Plasmodium malariae. Malaria caused by Plasmodium vivax,
Plasmodium ovale, and Plasmodium malariae is generally milder and rarely fatal. The fifth species,
Plasmodium knowlesi is a zoonosis that causes malaria in Macaques but can also infect humans.Severe
disease results largely from Plasmodium falciparum.
In humans, the parasites called sporozoites travel to the liver, where they mature and release another
form, the merozoites. These enter the bloodstream and infect the red blood cells. The parasites multiply
inside the red blood cells, which then ruptures after 48 to 78 hours, infecting more red blood cells
(Trampuz et al., 2003). The first symptoms usually occur 10 days to 4 weeks after infection, though
they can appear as early as 8 days or as long as a year after infection. The symptoms occur in cycles of
48 to 72 hours.
The majority of symptoms are caused by the massive release of merozoites into the bloodstream, the
anaemia resulting from the destruction of the red blood cells and the problems caused by large amount
of free hemoglobin released into circulation after red blood cells rupture. Malaria can also be
transmitted from a mother to her unborn baby (congenitally) and through blood transmission (Clark and
115
Cowden, 2003). Malaria is transmitted by mosquitoes in temperate climates, but the parasites
disappear over the winter. The disease is a major health problem in most of the tropics and sub-tropics
(Clark and Cowden, 2003). WHO (2005) estimates that there are three hundred to five hundred million
cases of malaria each year and more than one million people die. It presents a major health hazard for
travelers to warm climates. In some areas of the world, mosquitoes that transmit malaria have
developed resistance to insecticides. In addition, the parasites have developed resistance to some
antibiotics. This has led to difficulties in controlling both the rate of infection and the spread of the
disease.
1.1.1 Signs and Symptoms of Malaria
Symptoms of malaria include flu-like illness with fever, chills, muscle aches and headache. Some
patients develop nausea, vomiting, cough and diarrhoea. Cycles of chills, fever and sweating that repeat
every one, two or three days are typical. There can be sometimes vomiting, diarrhoea, coughing and
yellowing (jaundice) of the skin and whitening of the eyes due to destruction of red blood and liver
cells (Mueller et al., 2007). People with severe Plasmodium falciparum malaria can develop bleeding
problems, shocks, liver and kidney failure, central nervous system problems and they can die from
infection or its complications. Celebral malaria (coma, altered mental status or seizures) can occur with
severe Plasmodium falciparum infection. It can be lethal if not treated quickly. Even with treatment,
about 15 -20% die (Adams et al., 2002). The symptoms can be summarized as follows:
i. Anaemia
ii. Chills
iii. Coma
iv. Convulsion
v. Fever
vi. Headache
vii. Jaundice
viii. Muscle pain and Nausea
ix. Bloody stools
116
x. Sweating and vomiting.
The classic symptoms of malaria is cyclical occurrence of sudden coldness followed by rigour, then
fever and sweating lasting four to six hours, occurring every two days in Plasmodium vivax and
Plasmodium ovale infections, while every three days for Plasmodium malariae. Malaria due to
Plasmodium falciparum can give recurrent fever every 36 – 48 hours or a less pronounced and almost
continous fever. For reasons that are poorly understood, but that may be related to high intracranial
pressure, children with malaria frequently exhibit abnormal posturing, a sign indicating severe brain
damage (Idro et al., 2005). Malaria has been also found to cause cognitive impairments, especially in
children. It causes widespread anaemia during a period of rapid brain development and also direct brain
damage. The neurologic damage results from celebral malaria in which children are more vulnerable
(Trampuz et al., 2003). Celebral Malaria is associated with retinal whitening, which may be a useful
clinical sign in distinguishing between malaria and other causes of fever (Trampuz, et al., 2003).
Severe malaria is almost exclusively caused by Plasmodium falciparum infection and usually arises 6 –
14 days after infection.
Consequences of severe malaria include coma and death if untreated. Young children and pregnant
women are more vulnerable. Splenomegaly (enlarged spleen), severe headache, celebral ischemia,
hepatomegally (enlarged liver), hypoglycemia and hemoglobinuria with renal failure may occur. Renal
failure is a feature of blackwater fever, where hemoglobin from lysed red blood cells leak into the
urine. Severe malaria can progress extremely rapidly and cause death within hours or days (Makintosh
et al., 2004). In most severe cases of the disease, fatality rate can exceed 20% even with intensive care
and treatment (Makintosh et al., 2004). In endemic areas, treatment is often less satisfactory and the
overall fatality rate for all cases of malaria can be as high as one in ten (Trampuz et al., 2003).The long
term developmental impairments have been documented in children who have suffered episodes of
severe malaria.
1.1.4 Causes of Malaria
Malaria is caused by a parasite that is transmitted by the bite of an infected female anopheles mosquito.
Malaria is caused by the members of the genus Plasmodium (Phylum Apicomplexan).
Plasmodium falciparum is the most common cause of infection and is responsible for about 80% of all
malaria cases, and it is also responsible for about 90% of the deaths from malaria (Gardener et al.,
1998). Parasitic Plasmodium species can also infect birds, reptiles, monkeys, mice, chimpanzees and
117
rodents. There have been documented human infections with severe Simian species of malaria,
namely: Plasmodium knowlesi, Plasmodium inui, Plasmodium cynomolgi, plasmodium simiovale,
Plasmodium brazilianum, Plasmodium schwetzi and Plasmodium simium; However, with the exception
of Plasmodium knowlesi, these are mostly of limited public health importance (Redd et al., 2006).
Malaria parasites have apicoplasts, an organelle usually found in plants. These apicoplasts are thought
to have originated through the endosymbiosis of algae and play a crucial role in various aspects of
parasite metabolism, e.g fatty acid biosynthesis. To date, 466 proteins have been found to be produced
by apicoplasts and these are now being looked at as possible targets for novel anti-malarial drugs
(Pasvol, 2006).
1.1.5 Lifecycle of Malaria Parasites
Human and other mammalian plasmodium species are transmitted by anopheline mosquitoes. The
parasite is injected with the saliva during mosquito feeding and first undergoes a round of merogony in
the erythrocytes. Gametogony begins within the erythrocytes of the vertebrate host and is completed
within the mosquito where sporogony takes place. This lifecycle exhibits the general features of other
apicomplexan parasites characterized by asexual replication and the formation of invasive stages with
typical organelles (Trampuz et al., 2003). The cycle is divided into various stages such as:
i. LIVER STAGE: Human infection is initiated when sporozoites are injected with the saliva during
mosquito feeding. The sporozoites enter the circulatory system and within 30-60 minutes will
invade a liver cell. The host cell entry, as in all apicomplexan is facilitated by apical organelles
(Mueller et al., 2007). After invading the hepatocyte, the parasite undergoes an asexual replication.
This replicative stage is often called exoerythrocytic or pre-erythrocytic schizogony. Schizogony
refers to a replicative process in which the parasite undergoes multiple rounds of nuclear division
without cytoplasmic division followed by budding or segmentation to form a progeny. The
progeny, called merozoites , are released into the circulatory system following rupture of the host
hepatocyte. In Plasmodium vivax and Plasmodium ovale, some of the sporozoites do not
immediately undergo asexual replication, but enter a dormant phase known as the hypnozoite. This
hyponozoite can reactivate and undergo schizogony at a later time resulting in a relapse (Idro et al.,
2005). Relapse has a specific meaning in regards to malaria and refers to the reactivation of the
infection via hypnozoites. Recrudescence is used to describe the situation in which parasitemia falls
below detectable level and later increases to a patent level. Interestingly, strains isolated from
118
temperate regions tend to exhibit a longer latent period between the primary infection and the
first relapse than strains from tropical regions with continuous transmission (Idro et al., 2005).
ii. BLOOD STAGE: Merozoites released from the infected liver cells invade erythrocytes. The
merozoites recognize specific proteins on the surface of the erythrocyte and actively invade the cell
in a manner similar to other apicomplexan parasites. After entering the erythrocyte, the parasite
undergoes a trophic period followed by an asexual replication. The young trophozoite is often
called a ring form due to its morphology in giemsa stained blood smears. As the parasite increases
in size, this ring morphology disappears and it is called the trophozoites. During the trophic period
the parasite ingests the host cell cytoplasm and breaks down the hemoglobin into amino-acids. A
by-product of the hemoglobin digestion is the malaria pigment or hemozoin. These golden-brown
to black granules have been long recognized as distinctive feature of blood-stage parasites
(Mackintosh et al., 2004). Nuclear division marks the end of the trophozoite stage and the
beginning of the schizont stage. Erythrocytic schizogony consists of 3 – 5 rounds of nuclear
replication followed by budding process. Late stage schizonts in which the individual merozoite
becomes discernable are called segmenters. The host erythrocytes rupture and release the
merozoites. These merozoites invade new erythrocytes and initiate another round of schizogony.
The blood-stage parasites within the host usually undergo a synchronous schizogony. The
simultaneous rupture of the infected erythrocytes and the concomitant release of antigens and waste
products accounts for the intermittent fever paroxysms associated with malaria (Makintosh et al.,
2004). The blood stage schizogony in Plasmodium falciparum differs from the other human
malarial parasites in that trophozoite and schizont infected erythrocytes adhere to capillary
endothelial cells and are not found in the peripheral circulation. This sequestration is also
associated with celebral malaria (Mueller et al., 2007).
iii. SEXUAL STAGE: As an alternative to schizogony, some parasites undergo a sexual cycle and
terminally differentiate into either micro or macrogametocytes. The factors involved in the
induction of the gametocytogenesis are not known. However, commitment to the sexual stage
occurs during the asexual erythrocytic cycle that immediately preceed gametocyte formations.
Daughter merozoites from this schizont will develop into either all asexual forms or all sexual
forms.
119
Gametocytes do not cause pathology in the human host and will disappear from the circulation
if not taken up by a mosquito (Wellems, 2002). Gametogenesis or the formation of micro and
macrogametes, is induced when the gametocytes are ingested by a mosquito. After ingestion by the
mosquito, the microgametocyte undergoes three rounds of nuclear replication (Phillip and Nicky,
2010). The macrogametocytes mature into macrogametes. The high mobile microgametes will seek
out and fuse with a macrogamete. Within 12 – 24hours, the resulting zygote develops into ookinete.
The ookinete is a motile invasive stage which transverses both the peritrophic matrix and the
midgut epithelium of the mosquito. The invasion process is similar to other apicomplexans except
that the ookinete does not have rhoptries and does not form a parasitophorous vacuole after
invading the host cell (Mueller et al., 2007).
iv. SPOROGONY: After reaching the extracellular space between the epithelial cells and the basal
lamina, the ookinete develops into oocyst (Talman et al., 2004). The oocysts undergo an asexual
replication called sporogony, which culminates in the production of several thousand sporozoites.
This generally takes 10 – 28 days depending on species and temperature. Upon maturity, the oocyst
ruptures and releases the sporozoites which cross the basal lamina into the hemocoel (body cavity)
of the mosquito (Talman et al., 2004). These sporozoites are motile and have ability to specifically
recognize the salivary glands. After finding the salivary glands, the sporozoites will invade and
transverse the salivary gland epithelial cells and come to lie within its lumen. Some of these
sporozoites will be expelled into the vertebrate host as the mosquito takes a blood meal, and thus
re-initiate the infection in the vertebrate host. Although, the hemocoel and salivary gland
sporozoites are morphologically similar, they are functionally distinct. Salivary gland sporozoites
efficiently invade liver cells, but cannot re-invade the salivary glands, whereas the hemocoel
sporozoites are inefficient at invading liver cells.
Finally, malaria parasite exhibits a lifecycle with a typical apicomplexan features. There are three
distinct invasive stages: sporozoites, merozoites and ookinete. All of them are characterized by
apical organelles and can invade or pass through host cells (Philip and Nicky, 2010).Two distinct
merogony are observed. The first, called exoerythrocytic schizogony, occurs in the liver and is
initiated by the sporozoites. The resulting merozoites then invade erythrocytes and undergo
repeated rounds of merogony called erythrocytic schizogony. Some of the merozoites produced
from the erythrocytes schizogony will undergo gamogony. Plasmodium gamogony is described in
two phases: Gametocytogenesis occurring in the blood stream of the vertebrate host and
120
gametogenesis taking place in the mosquito gut. The gametes fuse to become a zygote which
first develops into an ookinete and then becomes an oocyst where sporogony takes place (Trampuz
et al., 2003). The parasite’s secondary (intermediate) hosts are humans and other vertebrates.
Female mosquitoes of the anopheles genus are the primary hosts and transmission vectors. Young
mosquitoes first ingest the malaria parasite by feeding on an infected human carrier and the infected
anopheles mosquito carries the plasmodium sporozoites in their salivary glands. A mosquito
becomes infected when it takes a blood meal from an infected human (Biovin, 2002). Once
ingested, the parasite gametocytes taken up in the blood will further differentiate into male or
female gametes and fuse in the mosquito gut. This produces an ookinete that penetrates the gut
lining and produces an oocyst in the gut wall. When the oocyst ruptures, it releases sporozoites that
migrate through the mosquito’s body to the salivary glands, where they are then ready to infect a
new human host (Biovin, 2002). This type of transmission is occasionally referred to as anterior
station transfer (Biovin, 2002). The sporozoites are injected into the skin, alongside saliva, when
the mosquito takes a subsequent blood meal. Only the female mosquitoes feed on blood while male
mosquitoes feed on plant nectar (Trampuz et al., 2003). So, male mosquitoes do not transmit
diseases. The female of the anopheles genus of the mosquito prefer to feed at night. They usually
start searching for a meal at dusk and will continue throughout the night until they take a meal.
When an infected female anopheles mosquito bites a person and injects the malaria parasite
(sporozoites) into the blood, the sporozoite passes through the blood stream to the liver where they
mature and eventually infect the human red blood cells. While in the human red bood cells, they
develop until, an uninfected mosquito takes a blood meal from an infected human and ingests the
human red blood cells with the parasite. Then, the parasites enter the anopheles mosquito’s stomach
and eventually invade the mosquito salivary glands and the cycle continues (Trampuz et al., 2003).
1.1.4 Recurrent Malaria
Malaria recurs after treatments for two reasons. Recrudescence occurs when parasites are not cleared
by treatment (Dondorp et al., 2010). Relapse is specific to Plasmodium vivax and Plasmodium ovale
and involves re-emergence of blood stage parasites from latent parasites (hypnozoites) in the liver.
1.2.5 Pathogenesis of Malaria
Malaria develops via two phases: an exoerythrocytic phase and an erythrocytic phase. The
exoerythrocytic phase involves infection of the hepatic system or the liver, whereas the erythrocytic
121
phase involves the infection of the erythrocytes or the red blood cells (Trampuz et al., 2003).
When an infected mosquito pierces a person’s skin to take blood meal, sporozoites in the mosquito
saliva enter the blood stream and migrate to the liver. Within minutes of being introduced into the
human host, the sporozoites infect hepatocytes, multiplying asexually and asymptomatically for a
period of 8 – 30 days (Idro et al., 2005). Once in the liver, these organisms differentiate to yield
thousands of merozoites, which favours the rupture of their host cells, thereby escaping into the blood
and infect red blood cells, thus beginning the erythrocytic stage of the lifecycle. The parasite escapes
from the liver undetected by wrapping itself in the cell membrane of the infected host liver cell (Idro et
al., 2005). Within the red blood cells, the parasites multiply further, again asexually, periodically
breaking out of their hosts to invade fresh red blood cells. Thus, classic descriptions of waves of fever
arise from simultaneous waves of merozoites escaping and infecting the red blood cells. Some
Plasmodium vivax and Plasmodium ovale sporozoites do not immediately develop into exoerythrocytic
phase merozoites, but instead produce hypnozoites that remain dormant for periods ranging from
several months (6 – 12 months is typical) to as long as three years. After a period of dormancy, they
reactivate and produce merozoites. Hypnozoites are responsible for long incubation and late relapses in
these two species of malaria (Makintosh et al., 2004). The parasite is relatively protected from attack
by the body’s immune system because for most of its human lifecycle, it resides within the liver and
blood cells and is relatively invisible to immune surveillance.
However, circulating infected blood cells are destroyed in the spleen. To avoid this fate, the
Plasmodium falciparum parasite displays adhesive proteins on the surface of the infected blood cells,
causing the blood cells to stick to the walls of small blood vessels, thereby sequestering the parasite
from passage through the general circulation and spleen (Idro et al., 2005). This stickiness is the main
factor giving rise to hemorrhagic complications of malaria. High endothelial venules (smallest branches
of the circulatory system) can be blocked by the attachment of masses of these infected red blood cells.
The blockage of these vessels causes symptoms such as in placetal and celebral malaria. In celebral
malaria, the sequestrated red blood cells can breach the brain barrier possibly leading to coma
(Williams, 2006).
Pathology associated with all malarial species is related to the rupture of the infected erythrocytes and
the release of parasite material and metabolites, hemozoin (malaria pigment) and cellular debris (Idro et
al., 2005). The deposition of hemozoin has been known as a characteristic feature of malaria. There is
an increased activity of the reticuloendothelial system, particularly in the liver and spleen and thus their
122
enlargement, as evidenced by macrophages with ingested infected and normal erythrocytes.Except
for Plasmodium falciparum, the pathology associated with malaria tends to be benign. Several severe
complications can be associated with Falciparum malaria with celebral malaria being the most notable
and a frequent cause of death.
Celebral malaria is characterized by an impaired consciousness. The presenting symptoms are severe
headache followed by drowsiness, confusion and ultimately coma. Convulsions are also frequently
associated with celebral malaria. These neurological manifestations are believed to be due to the
sequestration of the infected erythrocytes in the celebral micro-vasculature. Sequestration refers to the
cytoadherence of trophozoite and schizont erythrocytes to endothelial cells of deep vascular beds in
vital organs, especially brain, lung, gut, heart and placenta. This sequestration provides several
advantages for the parasite. The major advantage is the avoidance of the spleen and the subsequent
elimination of infected erythrocytes. Cytoadherence appears to be mediated by the electron- dense
protuberances on the surface of the infected erythrocyte (Idro et al., 2005). These knobs are expressed
during the schizont and trophozoite stages. Among human plasmodium species, knobs are restricted to
Plasmodium falciparum and their presence might indicate that they play a role in cytoadherance.
Electron microscopy also shows that the knobs are contact points between the infected erythrocytes and
the endothelial cell. As stated earlier, Plasmodium falciparum causes the most severe form of malaria
in humans with one to three million deaths annually (Clark and Cowden, 2003). The multiplication of
the parasite inside red blood cells is responsible for its severity and mortality that are associated with
the disease. After the parasite invasion, the red blood cells undergo profound structural and
morphological changes, thereby altering their physical properties and impairing circulation. In contrast
to normal red blood cells, parasitized cells become rigid and adhere to the lining of the blood vessels
and other cell types (Trampuz et al., 2003). Those changes are known to be caused by proteins the
parasite produce inside the cells of its host and export across several membranes out to the red blood
cell itself. Earlier studies showed two important ingredients: Plasmodium falciparum erythrocyte
membrane protein (PFEMP1), which allows infected cells to stick to blood vessels, and knobs made up
of a second protein knob associated histidine – rich protein (KAHRP) that anchor (PFEMP1) at the red
blood cell surface (Clark and Cowden, 2003).
1.2.6 Malaria Epidemiology
123
Malaria is primarily a disease of the tropics and subtropics (Samba, 1997). It is widespread in hot
humid regions of Africa, Asia, South and Central America (Clark and Cowden, 2003). The disease was
also common in many temperate areas including the U.S.A, Europe and Northern Eurasia and Asia, but
has been eradicated. But many areas which previously had malaria under control, are experiencing a
resurgence (Cox, 2002).The four human malarial species exhibit an overlapping geographical
distribution. Plasmodium vivax and Plasmodium falciparum are the most commonly encountered
species with Plasmodium vivax being the most widespread geographically. Mixed infections are found
mainly in endemic areas. Molecular methods suggest that Plasmodium malariae and plasmodium ovale
might be more widespread and prevalent than previously thought (Mueller et al., 2007). The
epidemiology of malaria can be viewed in terms of being stable or endemic and unstable or epidemic.
Stable malaria refers to a situation in which there is a measureable incidence of natural transmission
over several years. This would also include areas which experience seasonal transmission. Different
areas can experience different level of incidence rates and this is often denoted by: hypoendemic,
mesoendemic and hyperendemic. Persons living in highly endemic areas usually exhibit a high level of
immunity thereby being able to tolerate the infection well.
Unstable or epidemic malaria refers to an increase in malaria in areas of low endemic or outbreak in
areas previously without malaria or among non-immune persons. These outbreaks can usually be
attributed to changes in human behaviour or effects on the environment. For example, human migration
and resettlement can either introduce malaria into an area or expose a previously non-immune
population to endemic transmission.
Changes in the ecology caused by natural disasters or public work projects such as construction of road
can also impact malaria transmission and lead to epidemics (Mueller et al., 2007).
It is estimated that malaria causes two hundred and fifty million cases of fever and approximately one
million deaths annually (Kilama and Ntoumi, 2009). The vast majority of cases occur in children under
5 years of age, pregnant women are also vulnerable. Despite efforts to reduce transmission and increase
treatments, there has been little change in the areas that are at risk of this disease since 1992.
Indeed, if the prevalence of malaria stays on its present upward course, the death rate could double in
the next twenty years (Humpherys, 2001). Precise statistics are unknown because many cases occur in
rural areas where people do not have access to hospital or the means to afford healthcare. As a
consequence, the majority of cases are undocumented (Humpherys, 2001).
124
Although co-infection with HIV and malaria do cause increased mortality, this is less of a problem
than with HIV/tuberclosis co-infection, due to that, the two diseases usually attack different age-range,
with malaria being most common in the old (Sachs and Malaney, 2002). HIV/malaria co-infection
produces less severe symptoms than the interaction between HIV and tuberculosis, HIV and malaria do
contribute to each other’s spread. This effect comes from malaria increasing the viral load and HIV
infection increasing a person’s susceptibility to malaria infection (Mackintosh et al., 2004).
Malaria is presently endemic in a broad band around the equator, in areas of the Americas, many parts
of Asia, and more of Africa. However, it is in sub-saharan Africa that 85-90% of malaria fatalities
occur (Sachs and Malaney, 2002). The geographical distribution of malaria within large regions is
complex with malaria afflicted and malaria-free areas being often found close to each other
(Humpherys, 2001). In drier areas, outbreaks of malaria can be predicted with reasonable accuracy by
mapping rainfall. Malaria is more common in rural areas than in cities; this is in contrast to dengue
fever where urban areas present the greater risk (James and Webb, 2009). For example, several cities in
Vietnam, Loas and Cambodia are essentially free from malaria, but the disease is present in many rural
regions (James and Webb, 2009). By contrast, in Africa, malaria is present in both rural and urban
areas, though the risk is lower in larger cities (James and Webb, 2009). The global endemic levels of
malaria have not been mapped since the 1960s.
However, the Welcome Trust UK, has funded the malaria Atlas Project to rectify this, thereby
providing a more contemporary and robust means with which to assess current and future malaria
disease burden. The intricate interactions between host, parasite, and vector are the major factors in this
epidemiological complexity. For example, as with all vector transmitted diseases, the parasite must be
able to establish a chronic infection within the host to maximize the opportunities for transmission
(Mueller et al., 2007). This is especially true in the case of low endemicity. In general, malaria
infections are characterized by an initial acute phase followed by a longer relatively asymptomatic
chronic phase. This is due, in part, to the ability of the parasite to avoid complete clearance by the
immune system. Plasmodium falciparum exhibits an antigenic variation that allows it to stay ahead of
immune system. Plasmodium vivax and Plasmodium ovale exhibit the hypnozoite stage and are capable
of relapses. This allows the parasite to maintain the infection within the human host even after the
blood stage of the infection has been cleared. The relative long interval between relapses in some
Plasmodium vivax isolates probably explains its ability to maintain transmission cycles in some
125
temperate climates. Some molecular epidemiology studies have indicated that Plasmodium
falciparum can also produce long-term chronic infections.
However, in regards to the host, humans are the major reservoir for the parasite and sustained
transmission depends upon maintaining a pool of infected individuals and contact between humans and
anopheline mosquitoes (Miller et al., 2002). Several factors influence the susceptibility of humans to
infection. Obviously the immune status of the individual and their prior experience with malaria will
influence the course of the infection. Pregnant women, especially during the first pregnancy are
susceptible to Falciparum malaria as illustrated by a higher prevalence of infection and higher
parasitemia. The potential of the mosquito to serve as a vector depends on the ability to support
sporogony, mosquito abundance, and contact with humans, which are all influenced by climatic and
ecological factors. The ability to support sporogony is largely dependent upon species in that not all
species of anopheles are susceptible to plasmodium infection. Temperature and mosquito longevity are
other key factors affecting the parasite’s interaction with the vector. Development of Plasmodium
falciparum requires a minimum temperature of 200C, whereas the minimum temperature for other
species is 160C (Miller et al., 2002). Temperature also affects the time of development in that the
duration of sporogony is substantially shorter at higher temperature. A shorter duration of sporogony
increases the chances that the mosquito will transmit the infection within its lifespan.
Table 1: Factors influencing vectorial capacity
SPOROGONY MOSQUITO DENSITY HUMAN CONTACT
Temperature Temperature Anthropophilic
Mosquito longevity Altitude Indoor Vs Outdoor
Mosquito species Rainfall Feeding time
Breeding Places
(Miller et al., 2002)
Mosquito density and feeding habits also influence the transmission of malaria. Mosquito density is
affected by temperature, altitude, rainfall and availability of breeding places, whereas human-mosquito
126
contact will be influenced by the mosquito behaviour. For example, the degree to which a
particular mosquito species is anthropophilic will influence the probability of the mosquito becoming
infected and then transmitting the infection to another human. These anthropophilic tendencies are
necessarily absolute in that many zoophilic mosquitoes will switch to humans if densities reach high
levels or the preferred animal source is diminished. The preferred feeding time and whether the
mosquito feeds predominantly indoors or outdoors will influence the transmission dynamics.
For example, outdoor feeding mosquitoes are likely to find human blood meal in early evening than
those feeding late at night when most people are inside. The behavior of the mosquito also needs to be
considered in controlling its activities.
1.2.7 Immunity Against Malaria
Persons living in endemic areas do develop immunity against malaria (Amador and Patarroyo, 1996).
Usually, a person will exhibit some symptoms during the initial exposure to malaria. Though symptoms
associated with subsequent exposures to malaria are usually less severe, the immunity against malaria
is slow to develop and requires multiple exposures. In highly endemic areas only young children are at
high risk of developing severe malaria, whereas older children and adults are essentially protected from
severe disease and death. However, this immunity is not a sterilizing immunity in that persons can still
become infected. In addition, the immunity is short-lived and in the absence of repeated exposure the
level of immunity decreases. For example, previously semi-immune adults will often develop severe
malaria upon returning to an endemic area after being in non-endemic area for 1–2 years. This state of
partial immunity in which parasitemia is lower, but not eliminated, and parasitemia is better tolerated is
sometimes referred to as premonition. Premonition refers to an immunity that is contingent upon the
pathogen being present.
The immune response could be directed at either the pre-erythrocytic or erythrocytic stage of the
parasite’s lifecycle (White, 1996). However, the erythrocytic stage of the lifecycle is probably the most
important in terms of clearing the parasites and lessening the disease. Possible effector mechanism for
antibody include blocking of the erythrocyte invasion by merozoites, antibody dependent cellular
killing mediated by cytophilic antibodies or increased clearance of the infected erythrocytes due to
binding of antibodies to parasite antigens exposed on the erythrocyte surfaces. All of these will result to
low parasitemia. The relative importance of these various mechanisms is not clear and probably
immunity requires the generation of antibodies against numerous targets. This, along with antigenic
127
variation and polymorphisms in many plasmodium antigens, could explain the slow development
of immunity.
1.2.8 Human Genetics and Innate Resistance
Genetic resistance to malaria occurs through both modifications of the immune system that enhance
immunity to this infection and also by the changes in human red blood cells that hinder the malaria
parasite’s ability to invade and replicate within these cells (Mino and Gros, 2005). Host resistance to
malaria therefore involves not only the blood cell genes such as abnormal haemoglobins, glucose-6-
phosphate dehydrogenase deficiency and Duffy antigens which provide innate resistance but also
genes involved in immunity such as the major histocompatibility complex genes, which regulate
adaptive immune responses. The resistance provided by modified blood cells aids survival through the
dangerous years of early childhood, while the potent protection mediated by adaptive immune
responses is more important in older children and adults living where, malaria is endemic (Williams,
2006).
Certain genetic diseases and polymorphisms have been associated with decreased infection or disease
(Mino and Gros, 2005). For example, individuals who lack the Duffy blood – group antigen are
refractory to Plasmodium vivax. A large proportion of the populations in Western Africa are Duffy
negative, thus accounting for the low levels of Plasmodium vivax in West Africa. This innate resistance
led to the identification of the Duffy Antigens as the erythrocyte receptor for merozoite invasion
(Williams, 2006).
Several inherited erythrocyte disorders are found predominantly in malaria endemic areas and at
frequencies much higher than expected. This has led to speculation that these disorders confer some
protection against malaria (Mino and Gros, 2005). The combination of defect and infection lead to
premature lysis or clearance of the infected erythrocyte. For example, glucose-6-phosphate
dehydrogenase (G6PD) deficient erythrocytes would have an impaired ability to handle oxidative
stress. Then, the additional oxidants produced as a result of parasite metabolism and the digestion of
hemoglobin may overwhelm the infected erythrocyte and lead to its destruction before the parasite is
able to complete schizogony. Sickle cell anemia and thalassemia are also speculated to make the
infected erythrocyte more susceptible to oxidative stress (Williams, 2006).
1.2.9 Diagnosis of Malaria
128
Malaria is suspected in persons with a history of being in an endemic area and presenting
symptoms consistent with malaria (Beare et al., 2006). The mainstay of malaria diagnosis has been
microscopic examination of the blood. Although, blood is the sample most frequently used to make
diagnosis, both saliva and urine have been investigated as alternative less invasive specimen. Areas that
cannot afford laboratory diagnostic tests often use only history of subjective fever as the indication to
treat for malaria (Beare et al., 2006). Using giemsa-stained blood smears from children in Malawi were
adopted instead of clinical prediction as treatment indications, rather than using only a history of
subjective fevers, a correct diagnosis increased from 2% to 41% of cases, and unnecessary treatment
for malaria was significantly decreased. Some of the methods of diagnosis are :
1.1.9.1 Blood Films
The most economic, preferred and reliable diagnosis of malaria is the microscopic examination of
blood films because each of the plasmodium species have distinguishing parasitic characteristics (Beare
et al., 2006). Two type of blood films are used traditionally. Thin films are usually the most used and
allow species identification because the parasite’s appearance is best preserved in this preparation
(Redds et al., 2006). Thick films allow the microscopist to screen a larger volume of blood and are
about eleven times more sensitive than the thin film, so picking up low levels of infection is easier on
the thick film, but the appearance of the parasite is very difficult to detect. But, it is usually imperative
to utilize the two types of smears while attempting to make a definitive diagnosis (Redds et al., 2006).
For areas where microscopy is not available or where laboratory staff are not experienced at malaria
diagnosis, there are commercial antigen detection tests that require only a drop of blood (Warhust and
Williams, 1996). Immunochromatographic tests also called Malaria Rapid Diagnostic Tests, Antigen-
capture Assay or Dipsticks have been developed, distributed and Field-Tested. These tests use finger-
stick or venous blood, the complete test takes a total of 15 – 20 minutes, and the results are read
visually as the presence or absence of coloured stripes on the dipstick, so they are suitable for use in the
field. The thresholds of detection by these rapid diagnostic tests are in the range of 100 parasite/µl of
blood. The disadvantage is that dipstick tests are qualitative but not quantitative they can determine if
parasites are present in the blood, but not how many.
1.1.9.2 Molecular Methods
129
Molecular methods are available in some clinical laboratories and rapid real-time assays. for
example, QT-NASBA, based on the polymerase chain reaction (PCR), are being developed with the
hope of being able to deploy them in endemic areas. PCR and other molecular methods are more
accurate than those based on microscopy (Mc Cutchan et al., 2008). However, it is expensive and
requires a specialized laboratory. Moreover, levels of parasitemia are not necessarily correlative with
the progression of disease, particularly when the parasite is able to adhere to blood vessel walls.
Therefore, more sensitive low cost diagnostic tools need to be developed in order to detect low levels
of parasitemia in the field (Mc Cutchan et al., 2008).
1.2.10 Prevention and Control of Malaria
Strategies for preventing and controlling malaria involve three different approaches which include:
Reduction of human-mosquito contacts
Reduction of the vector density and
Reduction of parasite reservoir (Phillips, 2001).
Prevention of malaria in individuals will generally involve the reduction of human-mosquito contacts
through the use of bednets, repellents and house spraying. Also, chemoprophylaxis can be used
especially in travelers. Chemoprophylaxis only suppresses parasitemia but does not prevent infection.
Controlling activities at the community level can utilize approaches which directly reduce human-
mosquito contact as well as, approaches which reduce the total number of mosquitoes in an area. Such
approaches include the reduction in mosquito breeding grounds; target the larvae stages with chemical
or biological agents and massive insecticide spraying for the adult mosquitoes. Biological control
methods include the introduction of fish which eat the mosquito larvae, for example Bacillus
thuringiensis which excrete larval toxins. Case detection and treatment is another potential control
method. Identifying and treating infected persons, especially asymptomatic individuals will reduce the
size of the parasite reservoir within the human population and can be a relatively expensive approach.
These approaches are not mutually exclusive and can be combined. Many of the successful control
programmes include both measures to control mosquitoes and treatment of infected individuals
(Phillips, 2001). There is no standard method of malaria control that has proven universally effective.
The epidemiology, socio-economic, cultural and infrastructural factors of a particular region will
determine the most appropriate malaria control. Some of the factors which need to be considered are:
Infrastructure of existing healthcare service and other resources
Intensity and periodicity of transmission
130
Mosquito species
Parasite species and drug sensitivities
Cultural and social characteristics of the population
Presence of social and ecological changes.
The control of malaria in tropical Africa has been particularly problematic because of high transmission
rates and the overall low socio-economic level. Several studies have shown that insecticide treated
bednets (ITBN) reduce the morbidity and mortality associated with malaria (Pasvol, 2006). In most
areas the introduction of bednets do not require large promotional programmes and their uses are
readily accepted (Pasvol, 2006). This may be partly due to the reduction in mosquito irritating biting. It
is necessary to retreat the bednets with insecticide periodically and the bednets need to be repaired and
replaced as they become torn and worn out. In addition, some have raised concerns about the long-term
benefits of bednets since they reduce exposure, but do not eliminate it. This reduction in exposure may
delay the acquisition of immunity and simply postpone morbidity and mortality to older age groups.
1.2.11 Anti-Malarial Drugs
Drugs which are used for prophylaxis, treatment and in the prevention of malaria are called anti-
malarials. These drugs could be used in the
Treatment of malaria in individuals with suspected or confirmed infection
Prevention of infection in individuals visiting a malaria-endemic region, who have no immunity
Routine intermittent treatment of certain groups in endemic regions
Hence, some agents are used for more than one application. It is therefore, more practical to group anti-
malaria agents by their chemical structure since this is associated with their drug properties, such as
mechanism of action (White, 2004).
Several anti-malarial drugs are available. Many factors are involved in deciding the best treatment for
malaria. These factors include:
The parasite species
The severity of disease (complicated)
The patience’s age and immune status
The parasite’s susceptibility to the drugs (drug resistance) and
The cost and availability of drugs.
131
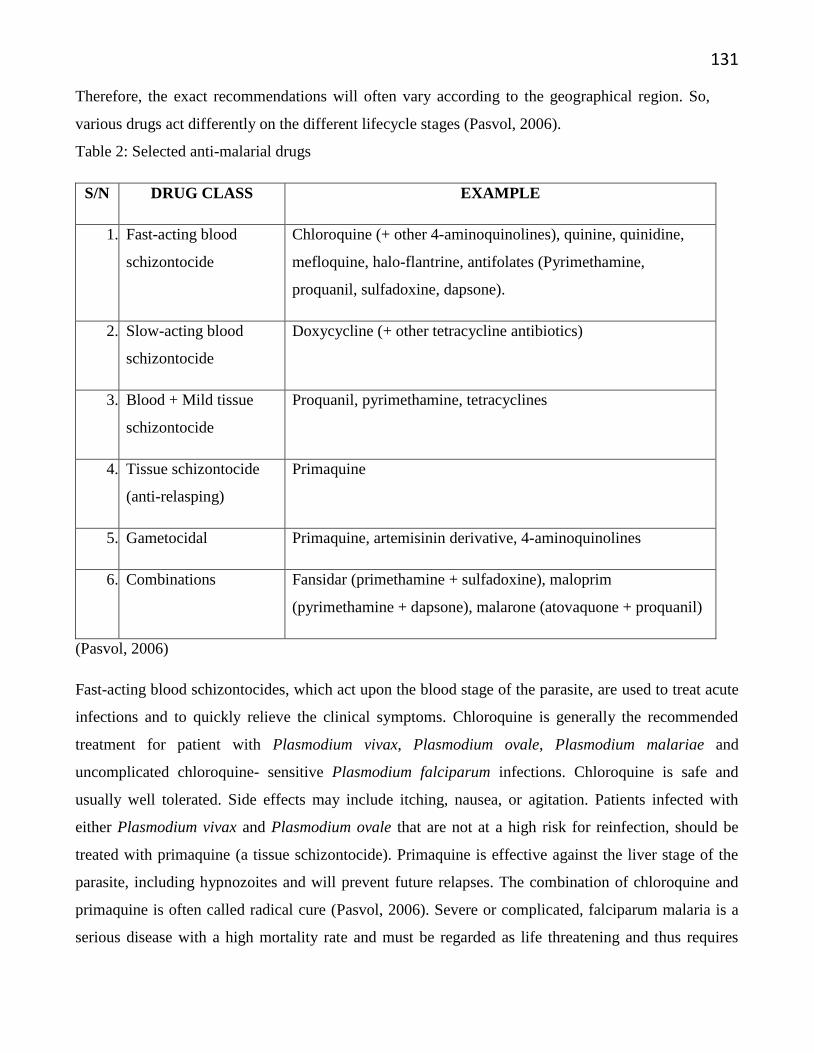
Therefore, the exact recommendations will often vary according to the geographical region. So,
various drugs act differently on the different lifecycle stages (Pasvol, 2006).
Table 2: Selected anti-malarial drugs
S/N DRUG CLASS EXAMPLE
1. Fast-acting blood
schizontocide
Chloroquine (+ other 4-aminoquinolines), quinine, quinidine,
mefloquine, halo-flantrine, antifolates (Pyrimethamine,
proquanil, sulfadoxine, dapsone).
2. Slow-acting blood
schizontocide
Doxycycline (+ other tetracycline antibiotics)
3. Blood + Mild tissue
schizontocide
Proquanil, pyrimethamine, tetracyclines
4. Tissue schizontocide
(anti-relasping)
Primaquine
5. Gametocidal Primaquine, artemisinin derivative, 4-aminoquinolines
6. Combinations Fansidar (primethamine + sulfadoxine), maloprim
(pyrimethamine + dapsone), malarone (atovaquone + proquanil)
(Pasvol, 2006)
Fast-acting blood schizontocides, which act upon the blood stage of the parasite, are used to treat acute
infections and to quickly relieve the clinical symptoms. Chloroquine is generally the recommended
treatment for patient with Plasmodium vivax, Plasmodium ovale, Plasmodium malariae and
uncomplicated chloroquine- sensitive Plasmodium falciparum infections. Chloroquine is safe and
usually well tolerated. Side effects may include itching, nausea, or agitation. Patients infected with
either Plasmodium vivax and Plasmodium ovale that are not at a high risk for reinfection, should be
treated with primaquine (a tissue schizontocide). Primaquine is effective against the liver stage of the
parasite, including hypnozoites and will prevent future relapses. The combination of chloroquine and
primaquine is often called radical cure (Pasvol, 2006). Severe or complicated, falciparum malaria is a
serious disease with a high mortality rate and must be regarded as life threatening and thus requires
132
urgent treatment. Treatment typically requires parenteral drug administration (i.e. injections) since
the patients is often vomiting and thus cannot take the drugs orally. Parenteral formulations are equally
available for chloroquine, quinine, quinidine and artemisinin derivatives. The artemisinin derivatives
are generally the preferred choice, but are not yet approved. For example, in the United States, quinine
and quinidine are the approved drugs for severe malaria (White, 2008). Patients are screened of
parasitemia, hydration levels, hypoglycemia and signs of drug toxicity and other complication during
the course of treatment. Most deaths due to severe malaria occur at or close to home in situations where
the patients cannot be taken to the hospital. Artemisinin suppositories which can be administered by
village health workers have also been developed and have proved to be safe and effective (White,
2008).
The efficacy of chloroquine is greatly diminished by the widespread of chloroquine resistant
Plasmodium falciparum and also, the emergence of chloroquine resistant Plasmodium vivax. In an area
with chloroquine resistant malaria, the common alternatives include the use of mefloquine, quinine in
combination with doxycycline, fansidar, derivatives of artemisinin (dihydroartemisinin, artesunate and
artemether) are increasingly used in Asia and Africa. It is now recommended as the first line of
treatment by the World Health Organization. These drugs were originally derived from wormwood
plant (Artemesia annua) and have been used for a long time in China as an herbal tea called quinhaosu
to treat febrile illnesses. To prevent high recrudescence and to slow the development of drug resistance,
it is recommended that the treatment will be combined with an un-related anti-malarial (Ogwal, 1996).
Drugs used in combination with artemisinin include mefloquine, lumefantrine, fansidar and
amodiquine.
1.1.11.1 Chemoprophylaxis
Chemoprophylaxis is particularly important for persons from non-endemic areas who visit areas
endemic for malaria (White, 1996). Such non-immune persons can quickly develop a serious and life-
threatening disease. As in the case of treatment there is no standard recommendation and the choices
for chemoprophylaxis are highly dependent upon the individual concerned (Newton and White, 1999).
Chemoprophylaxis drugs should be non-toxic since these drugs will be taken over an extended periods
of time.
1.1.12 Drug Resistance
133
Anti-malarial drugs resistance has been defined as the ability of a parasite to survive or multiply
despite the administration and absorption of a drug given in doses equal to or higher than those usually
recommended but within the tolerance of the subject. The drug in question must gain access to the
parasite or the infected red blood cell for the duration of the time necessary for its normal action. In
most instances, this refers to parasites that remain from an observed treatment. In order for a case to be
defined as resistant, the patient must have received a known and an observed anti-malarial therapy
whilst the blood and metabolite concentrations are monitored concurrently. The techniques used to
demonstrate this are in vivo, in vitro animal model testing and the most recently developed molecular
techniques.
Drug resistant parasites are often used to explain malaria treatment failure (Boland, 2001). However,
there are two potentially very different clinical scenarios. The failure to clear parasitemia and recover
from an acute clinical episode when a suitable treatment has been given, then anti-malarial resistance is
in its true form. Drug resistance may lead to treatment failure, but treatment failure is not necessarily
caused by drug resistance despite assisting to its development (Warhust, 2001). A multitude of factors
can be involved in the processes including problems with non-compliance and adherence, poor drug
quality, interactions with other pharmaceuticals, poor absorption, misdiagnosis and incorrect doses
being given. The majority of these factors also contribute to the development of drug resistance.
The development of resistance can be complicated and varies between plasmodium species as follows:
It is generally accepted to be initiated primarily through a spontaneous mutation that provides
some evolutionary benefit, thus giving an anti-malaria used a reduced level of sensitivity
This can be caused by a single point mutation or multiple mutations. In most instances a
mutation will be fatal for the parasite however, some resistant parasites will survive. Resistance
can become firmly established within a parasite population, existing for long periods of time
(Hyde, 2007). The first type of resistance to be recognised was to chloroquine in Thailand in
1957. The biological mechanism behind this resistance was subsequently discovered to be
related to the development of an efflux mechanism that expels chloroquine from the parasite
134
before the level required to effectively inhibit the process of haem polymerization (i.e.
necessary to prevent build up of the toxic byproducts formed by haemoglobin digestion)
(Hyde, 2007). This theory has been supported by evidence showing that resistance can be
effectively reversed on the addition of substances which can halt the efflux.
The resistance of other quinolone anti-malarials such as mefloquine, halofantine and quinine are
thought to have occurred by similar mechanisms (Hyde, 2007). Also, plasmodium have developed
resistance against antifoliate combination drugs, the most commonly used being sulfadoxine and
pyrimethamine. Two gene mutations are thought to be responsible, allowing synergistic blockages of
two enzymes involved in foliate synthesis. Regional variations of specific mutations give differing
levels of resistance.
Atovaquone is recommended to be used only in combination with another anti-malarial compound as
the selection of resistant parasites occurs very quickly when used in monotherapy. Resistance is
thought to originate from a single point mutation in the gene coding for cytochrome b.
1.1.12.1 Spread of Resistance
There is no single factor that confers the greatest degree of influence on the spread of drug resistance .
A number of plausible causes associated with an increase have been advocated. These include aspects
of economics, human behaviour, pharmacokinetics and the biology of vectors and parasites.
The most influential causes of spread of resistance are listed below:
The biological influences are based on the parasites ability to survive the presence of anti-
malarial, thus, enabling the persistence of resistance and the potential for further
transmission despite treatment. In the normal circumstances any parasite that persist after
treatment are destroyed by the host’s immune system. Therefore any factors that act to
reduce the elimination of parasites could facilitate the development of resistance. This
explains the poorer response associated with immunocompromised individuals, pregnant
women and young children.
There has been evidence that certain parasite- vector combinations can alternatively enhance or inhibit
the transmission of resistant parasites.
The use of antimalarials developed from similar basic chemical compounds can increase
the rate of emergence of resistance for example, cross-resistance to chloroquine and
aminodiaquine, two 4-aminoquinolones and mefloquine conferring resistance to quinine
135
and halofantrine. This phenomenon may reduce the usefulness of newly developed
therapies prior to large scale usage.
The resistance to anti-malarials may be increased by a process found in some species of
plasmodium, where a degree of phenotypic plasticity was exhibited, allowing the rapid
development of resistance to a new drug, even if the drug has not been previously used.
The pharmakinetics of the chosen anti-malarial are keys; the decision of choosing a long
half-life over a drug that is metabolized quickly is complex and still remains unclear. Drugs
with shorter half-life require more frequent administration to maintain the correct plasma
concentrations. Longer-lasting drugs can increase the development of resistance due to
prolonged periods of low drug concentration.
The pharmakinetics of anti-malarials are important when using combination therapy,
mismatched drug combination, for example, having an unprotected period when one drug
dominates can seriously increase the likelihood of selection for resistant parasites.
Individuals may only take the drugs until symptoms clear or will take lower doses to save
money
Individuals may not complete the full course of treatment because of drug side effects.
The widespread use of a drug in an area of intense transmission increases drug pressure by
exposing a larger parasite population to the drug.
High levels of transmission may allow re-infection while drugs are at sub-therapeutic
levels.
1.1.12.2 Prevention of Resistance
The prevention of anti-malarial drug resistance is of enormous public health importance (Wellem and
Plowe, 2001). It can be assumed that no therapy currently under development or to be developed in the
foreseeable future will totally be protective against malaria. In accordance with this, there is a
possibility of resistance emerging for any given therapy that is developed. This is a serious concern, as
the rate at which new drugs are produced by no means matches the rate of the development of
resistance. In addition, the most newly developed therapeutics tend to be the most expensive and are
required in the largest quantities by some of the poorest areas of the world.
136
Therefore, it is apparent that the degree to which malaria can be controlled depends on the careful
use of the current drugs to limit any further development of resistance. Provisions essential to this
process include the delivery of fast primary healthcare where staff are well trained and supported with
the necessary supplies for efficient treatment.
Preventing malaria has a substantial effect on the potential rate of development of resistance, by
directly reducing the number of cases of malaria thus decreasing the requirement for anti-malarial
therapy (Wellems, 2002). So, by preventing the transmission of resistant parasites limits the risk of
resistant malarial infections becoming endemic and can be controlled by a variety of non-medical
methods including insecticide-treated bednets, indoor residual spraying, environmental controls (such
as swamp draining) and personal protective methods such as using mosquito repellent.
Chemoprophylaxis is also important in the transmission of malaria infection and the resistance in
defined populations e.g. travelers (Wellems and Plowe, 2001).
A hope for future of anti-malarial therapy is the development of an effective malaria vaccine
(Wongsrichanalai et al., 2002). This could have enormous public health benefits, providing a cost
effective and easily applicable approach to preventing not only the onset of malaria but the
transmission of gametocytes, thus reducing the risk of resistance development.
1.3 MORINGA OLEIFERA
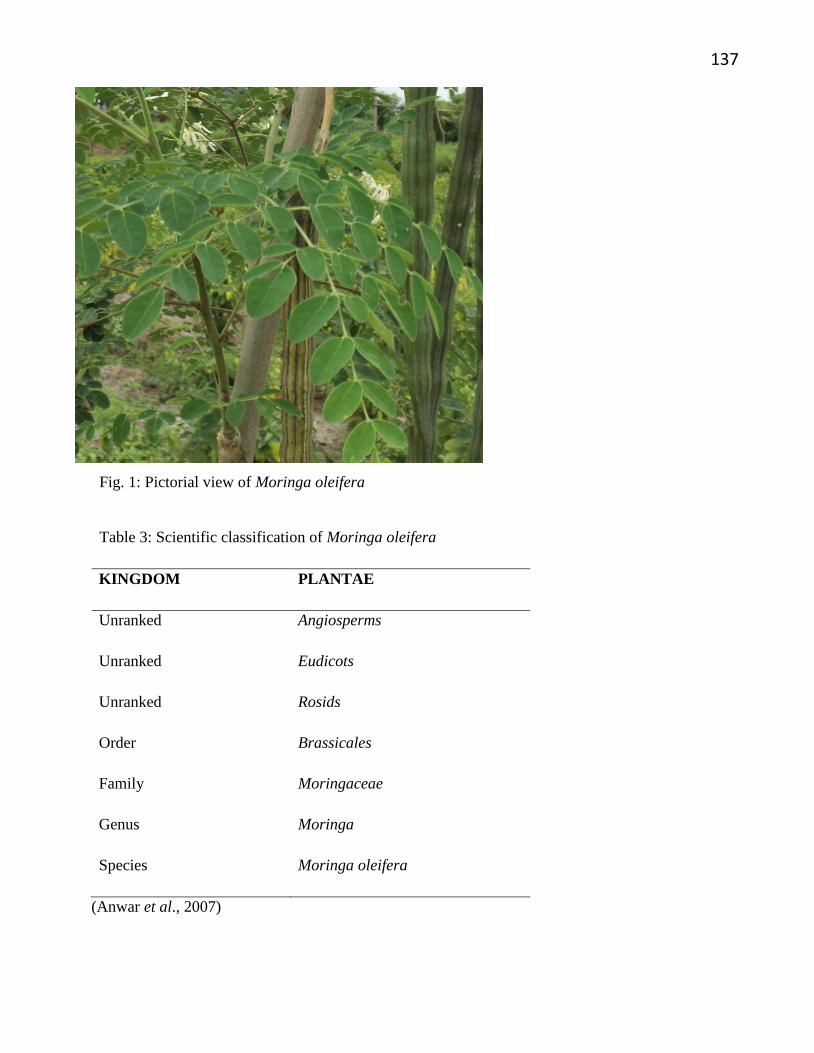
Moringa oleifera, commonly referred to as Moringa is the most widely cultivated species of the genus
Moringa, which is the only genus in the family of Moringaceae. It is an exceptionally nutritious
vegetable tree with a variety of potential uses (Caceres et al., 1991). The tree itself is rather slender,
with dropping branches that grow to appropriately 10m in height. In cultivation, it is often cut back
annually to 1 meter or less and allowed to re grow so that pods and leaves remain within arm’s reach.
137
Fig. 1: Pictorial view of Moringa oleifera
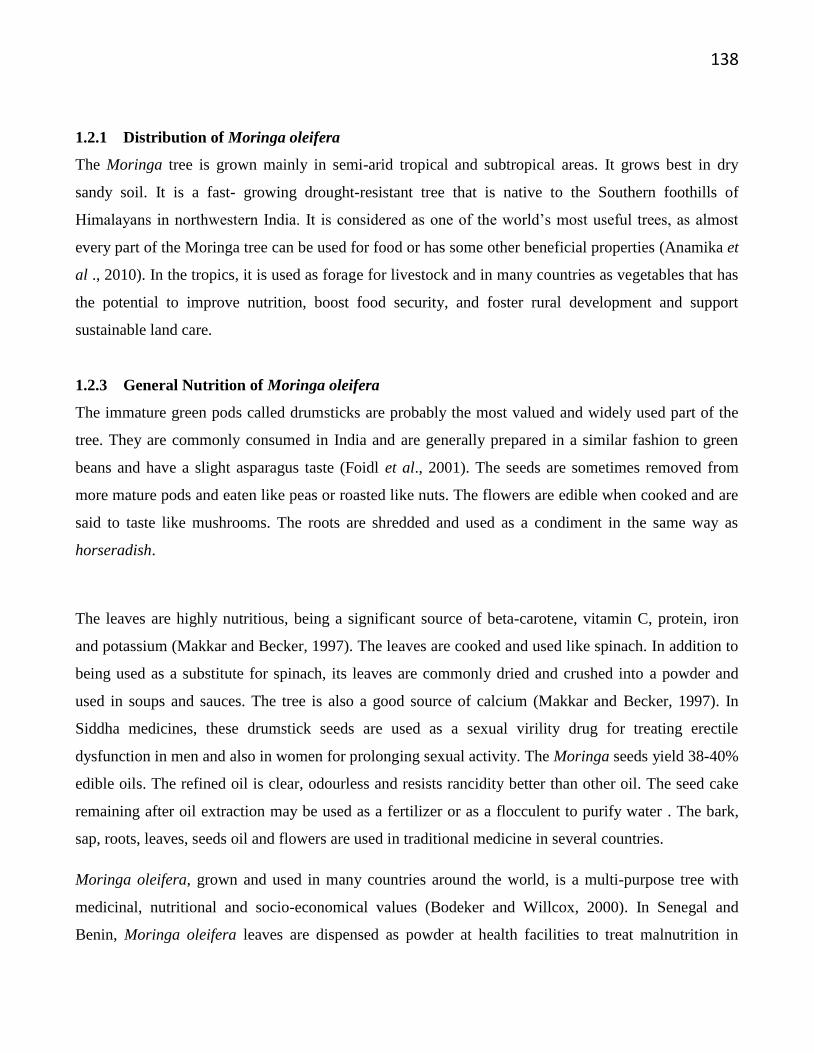
Table 3: Scientific classification of Moringa oleifera
KINGDOM PLANTAE
Unranked Angiosperms
Unranked Eudicots
Unranked Rosids
Order Brassicales
Family Moringaceae
Genus Moringa
Species Moringa oleifera
(Anwar et al., 2007)
138
1.2.1 Distribution of Moringa oleifera
The Moringa tree is grown mainly in semi-arid tropical and subtropical areas. It grows best in dry
sandy soil. It is a fast- growing drought-resistant tree that is native to the Southern foothills of
Himalayans in northwestern India. It is considered as one of the world’s most useful trees, as almost
every part of the Moringa tree can be used for food or has some other beneficial properties (Anamika et
al ., 2010). In the tropics, it is used as forage for livestock and in many countries as vegetables that has
the potential to improve nutrition, boost food security, and foster rural development and support
sustainable land care.
1.2.3 General Nutrition of Moringa oleifera
The immature green pods called drumsticks are probably the most valued and widely used part of the
tree. They are commonly consumed in India and are generally prepared in a similar fashion to green
beans and have a slight asparagus taste (Foidl et al., 2001). The seeds are sometimes removed from
more mature pods and eaten like peas or roasted like nuts. The flowers are edible when cooked and are
said to taste like mushrooms. The roots are shredded and used as a condiment in the same way as
horseradish.
The leaves are highly nutritious, being a significant source of beta-carotene, vitamin C, protein, iron
and potassium (Makkar and Becker, 1997). The leaves are cooked and used like spinach. In addition to
being used as a substitute for spinach, its leaves are commonly dried and crushed into a powder and
used in soups and sauces. The tree is also a good source of calcium (Makkar and Becker, 1997). In
Siddha medicines, these drumstick seeds are used as a sexual virility drug for treating erectile
dysfunction in men and also in women for prolonging sexual activity. The Moringa seeds yield 38-40%
edible oils. The refined oil is clear, odourless and resists rancidity better than other oil. The seed cake
remaining after oil extraction may be used as a fertilizer or as a flocculent to purify water . The bark,
sap, roots, leaves, seeds oil and flowers are used in traditional medicine in several countries.
Moringa oleifera, grown and used in many countries around the world, is a multi-purpose tree with
medicinal, nutritional and socio-economical values (Bodeker and Willcox, 2000). In Senegal and
Benin, Moringa oleifera leaves are dispensed as powder at health facilities to treat malnutrition in
139
children (Willcox et al., 2005). It was massively grown and promoted by the local media in
Uganda in the 1980s as a plant putatively able to cure a number of diseases including malaria and
symptoms of HIV/AIDS (Willcox, 1999).
1.3 AIM AND OBJECTIVES OF THE STUDY
The aim of this study was to investigate the effectiveness of Moringa oleifera ethanol leaf extract in the
treatment of malaria.
The specific objectives were as follow:
To determine the acute toxicity (LD50) and phytochemical constituents in Moringa oleifera
ethanol leaf extract.
To determine the percentage parasitaemia in mice and the effect of Moringa oleifera ethanol
leaf extract on the percentage parasitaemia within the pre- and post-treatment periods.
To determine the effect of Moringa oleifera ethanol leaf extract on haematological parameters
in malaria-induced mice within the pre- and post-treatment periods.
To determine the effect of Moringa oleifera ethanol leaf extract on the liver marker enzymes in
malaria-induced mice within the post-treatment periods.
To determine the effect of Moringa oleifera ethanol leaf extract on some kidney markers in
malaria-induced mice within the post-treatment periods.
To determine the effect of Moringa oleifera ethanol leaf extract on lipid profile in malaria-
induced mice within the post-treatment periods.
CHAPTER TWO
MATERIALS AND METHODS
2.1 Materials
2.1.1 Animals
The experimental animals used for this study were white albino mice of either sex weighing 20 – 34g.
The mice were between 3 – 4 months old and were obtained from the animal unit of Faculty of
Veterinary Medicine, University of Nigeria, Nsukka.
2.1.3 Moringa oleifera (Agbaji) Leaves
140
Moringa oleifera (Agbaji) leaves were plucked from Moringa oleifera trees in various locations in
Ovoko, Igbo-Eze South L.G.A of Enugu Sate, Nigeria. The leaves were identified by Mr. O. Chijioke
of the Hebarium Unit of the Department of Botany, University of Nigeria , Nsukka.
2.1.4 Instruments/Equipment
Water bath (Gallenkamp, England)
Chemical balance (Gallenkamp, England)
Test tubes (Pyrex, England)
Conical flask (Pyrex, England)
Hot box (Gallenkamp, England)
Centrifuge (Pic, England)
Syringe & needle(1ml and 5ml) (Dana Jet, Nigeria)
Microscope slides (Unescope, USA)
Digital photo colorimeter (E1,312 Model, Japan)
Adjustable micropipette (Perfect, USA)
Refrigerator (Kelvinator, Germany)
pH meter (Pye, Unicam 293, England)
Stirrer (Sward, England)
Capillary tubes (Pyrex, England)
2.1.5 Chemicals/Reagents
All the chemicals used in this study were of analytical grade and products of May and Baker, England;
BDH, England and Merck, Darmstadt, Germany. The reagents used for all the assays were commercial
kits and products of Randox, QCA, USA and biosystem Reagents and Instruments, Spain.
2.2 METHODS
2.2.1 Extraction
The leaves of Moringa oleifera plant were plucked and then dried under room temperature at (290C -
350C) for three weeks, after which the leaves were pulverized into coarse form with a Crestor high
speed milling machine. The coarse form (1kg) was then macerated in 5 volume (w:v) absolute ethanol.
141
This was left to stand for 48 hours. After that the extract was filtered through muslin cloth on a
plug of glass wool in a glass column. The resulting ethanol extract was concentrated and evaporated to
dryness using rotary evaporator at an optimum temperature of between 40 and 450C to avoid
denaturation of the active ingredients. The concentrated extract was stored in the refrigerator for
subsequent studies.
2.2.2 Experimental Design
Twenty-four white albino mice of either sex weighing 20 – 34kg were housed in separate cages,
acclimatized for one week and then divided into six groups of four mice each. The route of
administration (treatment) was via oral route with the aid of an oral intubation tube.
Group 1 was the (positive control) inoculated with malaria parasite (Mp+) and treated with 5mg/kg
body weight of distilled water.
Group II was inoculated with malaria parasite and treated with 45mg/kg body weight of Moringa
oleifera ethanol leaf extract.
Group III was also inoculated with malaria parasite and treated with 90mg/kg body weight of Moringa
oleifera ethanol leaf extract.
Group IV was inoculated with malaria parasite and treated with 180mg/kg body weight of Moringa
oleifera ethanol leaf extract.
Group V which was also inoculated with malaria parasite (standard control) and was treated with
5mg/kg body weight of artesunate (standard drug).
Group VI was the negative control which was not inoculated with malaria parasite and was finally
treated with 5mg/kg body weight of distilled water.
Before the treatments, the mice in Groups I – V were inoculated with malaria parasite and 3 days after
that analyses were carried out to determine the baseline parameter in all the groups, then, two days
later, treatment began. The treatment lasted for 5 days during which analyses were done on day 3, day
5 of treatment and 28 days post treatment .
Several parameters were investigated using whole blood. The parameters were
Packed Cell Volume (PCV)
Malaria parasite test
Total White Blood Cell Counts (TWBC)
Total Red Blood Cell Counts (TRBC)
142
Haemoglobin Tests (Hb)
Parameters studied using serum were
Alanine aminotransferase activity (ALT)
Aspartate aminotransferase activity (AST)
Alkaline phosphatase activity (ALP)
Total Bilirubin concentration (TB)
Serum Creatinine concentration
Urea Concentration concentration
Total Serum Cholesterol concentration
Triacyglycerol concentration
High Density Lipropotein (HDL) concentration
Low Density Lipoprotein (LDL) concentration
2.2.3 Procurement of Parasitaemia
Malaria parasite (Plasmodium berghei) was obtained from malaria infected- mice at the Department of
Veterinary Medicine, University of Nigeria, Nsukka. Ten drops of the parasitized blood obtained with
the aid of a capillary tube through the ocular region of the mice, were diluted with 1 ml of normal
saline. Thereafter, 0.2 ml of the diluted parasitized blood was used to infect the three mice that served
as the host from where other experimental animals were infected.
2.2.5 Preparation of EDTA (Sequestrene) Anticoagulant
EDTA anticoagulant was prepared by dissolving 2.5g of di-potassium ethylene in 25ml of distilled
water. The bottle was labeled and 0.04 ml of the anticoagulant reagent was pipetted into bottles marked
to hold 2.5 ml of blood. The small bottles ,protected from dust and flies, were placed without tops on a
warm bench for the anticoagulant to dry. Then, when dried, the bottle were capped and stored in a
refrigerator ready to be used.
2.2.6 Preparation of Giemsa Stain
Exactly 3.8g of Giemsa powder was transferred to a dry brown bottle of 500 ml capacity. With the aid
of a dry measuring cylinder, 250ml of methanol was measured and added to the Giemsa powder and
mixed well; 250ml of glycerol was also added to the stain and stirred very well. Then, the bottle
143
containing the stain was placed in a water bath at 370C for up to 2 hours to help the stain dissolve.
The mixture was stirred at intervals. The bottle was labelled and marked flammable and toxic. It was
kept at room temperature ready for use.
2.2.6 Preparation of Alcohol Fixative Solution
Exactly 180 ml of absolute ethanol was added into 250ml cylinder capacity. This was followed by
addition of 10 ml of distilled water and 10ml of glacial acetic acid into 200ml marked container and
mixed. The bottle was labelled flammable and ready for use.
2.2.7 Methods of Estimations.
2.2.7.1 Determination of Malaria Parasitaemia
The determination of malaria parasitemia (Mp+) was carried out according to the Method of Dacie and
Lewis (2000). A swab moistened with 70% v/v alcohol was used to cleanse the tail of a mouse and
allowed to dry. A pair of scissors was used to cut the tail which was squeezed gently to obtain a small
drop of blood that was placed on the centre of a microscope slide. Immediately the thin film was spread
using a smooth edged slide spreader. The slide was labeled with a black lead pencil and air-dried in
horizontal position.
i. Fixation of the thin blood films: The slide was horizontally placed on a level staining rack. A
small drop of absolute ethanol was applied to the thin film, using a swab. This was allowed to
fix for 2 minutes.
ii. Giemsa Staining Technique: A volume of 50 ml of buffered saline pH 7.1 – 7.2 was added to
1.5ml of Geimsa stain and mixed gently. The slides were placed face downwards in a shallow
tray supported on two rods in a staining rack. Then, the diluted stain was poured into the
shallow tray and allowed for 30 minutes, after which the stain was washed off from the staining
container using clean water. Finally, the back of the slide was wiped and placed in a draining
rack for air-drying. With the aid of counting chamber, dried stained film was viewed
microscopically using 100 x objective.
iii. Counting the Percentage of Parasitized Red Cells: 100 x objective was used to select an area
of the thin film where the total number of red cells was approximately 250 per field. The
numbers of parasitized red cells were counted in 8 fields, which were approximately 2000 cells.
Then, the number of parasitized red cells was divided by 20 to get the percentage of parasitized
cells.
144
% Parasitized = 20
cells red dparasitize ofNumber
Blood samples that were used for haematological analyses were collected with the help of a
capillary tube via the ocular region of the mice and placed in an EDTA tube.
2.2.7.2 Determination of Total Red Blood Cell Count
The determination of total red blood cell count was carried out according to the method of Dacie and
Lewis (2000).
Principle
The blood specimen was diluted 1:200 with the red blood cell diluting fluid and cells were counted
under high power (40 X objective) by using a counting chamber. The number of cells in the blood were
calculated and reported as the number of red cells per µl of the whole blood.
Methodology
Blood from EDTA tube was mixed carefully by swirling the bulb. The blood was drawn quickly
with red blood cell pipette up to the 0.5 mark, then, excess blood outside the pipette was carefully
wiped using cotton. This was equally used to draw diluting fluid up to the 101 mark. The pipette was
rotated rapidly by keeping it horizontally during mixing. The cell was allowed to settle 2 to 3 minutes,
then, counting chamber was placed on the stage of the microscope. The microscope was switched to
low power (10x) objective. Its light was adjusted to locate the large square in the centre with 2 small
squares. Then, the microscope was switched to high power (40x) objective. Finally, the red blood cells
in the four corner squares and in the centre square were counted.
Total red blood cells per litre of blood =10 Dilution Counted Volume
Counted Cell ofNumber
2.2.7.17 Determination of Total White Blood Cell Count
The determination of total white blood cell count was carried out according to the method of Dacie and
Lewis (2000).
Principle
145
Whole blood was diluted 1 in 20 in an acidic reagent which haemolyzes the red cells, leaving the
white cells to be counted. White cells are counted microscopically using a counting chamber. .
Methodology
The counting chamber and cover slip were cleaned with water, dried and mounted on the mechanical
stage of the microscope. The blood sample was pipetted from the EDTA tube up to the 0.5 mark of the
pipette, followed by drawing of the diluting fluid up to the 11 mark from the watch glass by keeping
the pipette in a vertical position. The blood and diluting fluid were allowed to mix well by rolling the
pipette horizontally in between the palms. The cells were allowed to settle for 2 to 3 minutes. The cells
were counted microscopically by using 10 x objectives. This was used to focus the four large corner
squares of the chamber. The number of white cells per litre of blood was calculated using the
following formula:
WBC = 20
counted cell ofnumber Total
The number obtained which was multiplied by a factor of 109 gives the white cell count.
2.2.7.18 Determination of Packed Cell Volume (PCV)
Packed cell volume (PCV) was determined by the method of Dacie and Lewis (2000).
Principle
Anticoagulated blood in a glass capillary of specified length, bore size and the wall-thickness is
centrifuged in a micro-haematocrit centrifuge at RCF 10,000-11,000 rpm for 5 minutes to obtain
constant packing of the red cells. A small amount of plasma remains trapped between the packed red
cells. The PCV value is read from the scale of a micro-haematocrit reader or calculated by dividing the
height of the red cell column by the height of the total column of the blood.
Methodology
A heparinized capillary tube was filled with blood from an EDTA tube up to the three quarters of the
capillary tube. The end of the tube was sealed with a plasticine sealant. The capillary tubes were
arranged according to their number in the micro-haematocrit, then, followed by centrifuging for 5
146
minutes (RCF 10,000-11,000 rpm). Immediately after centrifuging, the PCV was read by using a
micro-haematocrit reader by aligning the base of the red cell column above the sealant on the 0 line and
the top of the plasma column on the 100 line.
PCV = (mm) Total ofLength
(mm)Count Cell Red ofLength
2.2.7.19 Determination of Haemoglobin (Hb) Concentration
Haemoglobin (Hb) concentration was determined using haemoglobincyanide (HICN) technique as
outlined in the method of Dacie & Lewis (2000).
Principle
Whole blood was diluted 1 in 201 in a modified Drabkin’s solution which contains potassium
ferricyanide and potassium cyanide. The red cells are haemolyzed and the haemoglobin is oxidized by
the ferricyanide to methaemoglobin. This was converted by cyanide to stable haemiglobincyanide
(HiCN). The absorbance of the HiCN solution was read at wavelength of 540nm. The absorbance
obtained was compared with that of a reference HiCN standard solution. Haemoglobin values are
obtained from tables prepared from a calibration graph.
Methodology
A volume of 20µl of the capillary blood was dispensed into 4 ml of Drabkin’s neutral diluting fluid in a
tube. The tube was stoppered, mixed and left at room temperature (29–35oC) for 5 minutes. The
colorimeter was adjusted to 540 nm followed by zeroing it with Drabkin’s fluid and reading of the
absorbance of the sample. With the aid of table prepared from the calibration graph, the mice
haemoglobin values were read.
Concentration of HiCN in 1000
200/ lmg
Preparation of a calibration curve.
Six tubes were taken and labelled blank B, 1, 2, 3, 4 and 5. The following reagents were pipetted into
the test tubes as follows
Tests B 1 2 3 4 5
1ml in 20ml diluted standard - 4 3 2 1 5
147
1 ml of ammonia water 5 1 2 3 4 -
The colorimeter was adjusted to 540nm followed by zeroing with Drabkin’s neutral fluid in B
and reading of the absorbance. The haemoglobin (Hb) equivalent in g/l of solution in tubes 1- 5 was
calculated as follow:-
Tube 1 Hb value of HiCN standard x = Hb g/l
Tube 2 Hb value of HiCN standard x = Hb g/l
Tube 3 Hb value of HiCN standard x = Hb g/l
Tube 4 Hb value of HiCN standard x =Hb g/l
Tube 5 Hb value of HiCN standard = Hb g/l
A graph of absorbance against concentration was plotted for Hb with values from 20- 200g/l or 2 –
20g/dl .
2.2.7.20 Determination of Total Bilirutin Concentration
Total bilirubin concentration was determined using the method of Jendrassik and Grof (1938) as
outlined in the Randox kit.
Principle
Direct (conjugated) bilirubin reacts with diazotized sulphanilic acid in alkaline medium to form a blue
coloured complex. Total bilirubin is determinded in the presence of caffeine, which releases albumin
bound bilirubin by reaction with diazotized sulphanilic acid.
Methodology
A volume of 0.2 ml of sulphanilic acid was pipetted into the sample blank tube and sample tube. This
was immediately followed by the addition of 0.05 ml of sodium nitrite to the sample tube. Caffeine
(10ml) and 0.2 ml of sample were also pipetted into each of the sample blank tube and sample tube.
These mixtures were mixed and incubated for 10 minutes at 20 -250C. Finally, 1.0 ml of tartrate was
148
pipetted into the sample blank tube and sample tube. These mixtures were once again mixed,
incubated for 30 minutes at 20 – 250C and their absorbances read at 578nm against the sample blank.
Total bilirubin (µmol/l) = 185 × sample blank (578nm)
2.2.7.21 Determination of Serum Urea Concentration
The concentration of serum urea was determined using the method of Tietz (1994) as outlined in
Randox kits, UK.
Principle
Urea in serum is hydrolysed to ammonia and is then measured photometrically .
Urea + H2O Urease
2NH3 + CO2
NH3 + Hypochlorite + Phenol Indophenol
Methodology
A known volume, 10µl of the sample was pipetted into the sample tube, 10µl of the standard was also
pipetted into the standard tube followed by addition of 10µl of distilled water to the blank tube. A
volume of 10µl sodium nitroprusside and urease were added to each of the three tubes. The tubes were
mixed and incubated at 370C for 15 minutes. Then, 2.50 ml of phenol was added to each of the three
tubes followed by addition of 2.50 ml of sodium hypochlorite also. These were mixed and incubated
for 15 minutes at 370C and the absorbance was read against the reagent blank at 546nm.
Urea concentration (mmol/l) = Standard
Sample
A
A× Standard concentration
ASample = Absorbance of sample
AStandard = Absorbance of standard
2.2.7.22 Determination of Serum Creatinine Concentration
149
The concentration of serum creatinine was determined using the method of Tietz (1994) as
outlined in Randox kits, UK.
Principle
Creatinine in alkaline solution reacts with picric acid to form a coloured complex. The amount
of the complex formed is directly proportional to the creatinine concentration. A known volume, 100 µl
of distilled water was pipetted into the blank tube; also 100 µl of the standard was pipetted to the
standard tube while 100 µl of the sample was pipetted into the sample tube. Then, 100 µl of the
working reagents were pipetted into the three tubes and mixed. The absorbance of the sample was read
against the blank at 492 nm.
Creatinine (µmol/l) = Standard
Sample
A
A x Standard Concentration
ΔASample = Change in Absorbance of sample
ΔAStandard = Change in Absorbance of standard
2.2.7.23 Assay of Aspartate Aminotransferase (AST) Activity
The activity of aspartate aminotransferase was assayed by the method of Reitman and Frankel (1957)
as outline in Randox kit.
Principle
Oxaloacetate is formed according to the equation:
α – Oxoglutarate + L-aspartate AST
L-glutamate+ Oxaloacetate
Methodology
Aspartate aminotransferase activity was assayed by monitoring the following information of
oxaloacetate hydrazone with 2, 4-dinitrophenylhydrazine.
Kit Reagents
150
Mea
sure
men
t
Aga
inst Reagent Blank
The AST substrate phosphate buffer of 0.5ml each was pipetted into both the reagent blank (B) and
sample test (T) test tubes respectively. The serum sample of 0.1 ml was added to the sample test (T)
test tubes only and mixed thoroughly. Then, 0.1 ml of distilled water was added to the reagent blank
(B). Then, the entire reaction medium was well mixed and incubated for 30 minutes in a water bath at
370C.
Immediately after incubation, 2, 4-dinitrophenylhydrazine (0.5 ml) was added to the reagent blank (B)
and the sample test tubes. It was mixed thoroughly and allowed to stand for exactly 20 minutes at 250C.
Finally, 5.0 ml of sodium hydroxide solution was added to both the blank and the reagent and the
reagent test tubes respectively and mixed thoroughly. The absorbance of sample Asample was read at a
wavelength of 550nm against the reagent blank after 5 minutes.
Measurement Against Sample Blank
The AST substrate phosphate buffer of 0.5ml each was pipetted into both the reagent blank (B) and
sample test (T) test tubes respectively. The serum sample of 0.1 ml was added to the sample test (T)
test tubes only and mixed thoroughly. Then, 0.1 ml of distilled water was added to the reagent blank
(B). Then, the entire reaction medium was well mixed and incubated at 37oC for 30 minutes in a water
bath.
A volume of 0.5 ml of 2, 4-dinitrophenylhydrazine (0.5 ml) was added to the reagent blank (B) and the
sample test tubes immediately after incubation. Also, 0.1 ml of the sample was added to blank (B) only.
The medium was mixed and allowed to stand for exactly 20 minutes at 250C. Finally, 5.0 ml of sodium
hydroxide (NaOH) solution was added to both the blank (B) and sample test (T) test tubes and mixed
thoroughly. The absorbance of sample Asample was read at a wavelength of 550nm against the sample
S/N Content Initial Concentration of Reagents
1. Phosphate Buffer 100 mmol/l, pH 7.4
L – Aspartate 100 mml/l
α – Oxoglutarate 2 mmol/l
2. 2, 4-Dinitrophenylhydrazine 2mmol/l
151
blank after 5 minutes. The activity of AST in mice serum was obtained from the already calibrated
table below (Randox Company).
2.2.7.10 Assay of Alanine Aminotransferase (ALT) Activity
The activity of alanine aminotransferase was assayed by the method of Reitman and Frankel (1957) as
outline in Randox kit.
Alanine aminotransferase assay, according to this method, is based on the principle that pyruvate is
formed from the reaction below:
α -Oxoglutarate + L-Alanine L-Glutamate + Pyruvate
Alanine aminotransferase activity was assayed by monitoring the concentration of pyruvate hydrazone
formed with 2, 4-dinitrophenylhydrazine.
Kit Reagents
P
roce
dur
es
The
ALT
substrate phosphate buffer of 0.5ml each was pipetted into two sets of test tubes labeled B (sample
blank) and T (sample test) respectively. The serum sample of 0.1 ml was added to the sample test (T)
test tubes only and mixed thoroughly and then, incubated exactly for 30 minutes in a water bath at
temperature of 370C.
A volume of 0.5 ml each of 2, 4-dinitrophenylhydrazine was added to both test tubes labeled T (sample
test) and B (sample blank) immediately after the incubation. Also, 0.1 ml of serum sample was added
to sample blank (B) only. The entire medium was mixed thoroughly and allowed to stand for exactly 20
minutes at 250C. After this, 5.0 ml each of sodium hydroxide (NaOH) solution was added to both test
tubes and mixed thoroughly. Absorbance of ASample against the sample blank was read at a wavelength
S/N Content Initial Concentration of Reagents
1.
Phosphate Buffer 100 mmol/l, pH 7.4
L – alanine 200 mmol/l,
Α – Oxoglutarate 2.0 mmol/l
2. 2, 4-Dinitrophenylhydrazine 2.0mmol/l
ALT
152
of 550nm against the sample blank after 5 minutes. The activity of ALT in the serum was obtained
from the already calibrated table below:
2.2.7.11 Assay of Alkaline Phosphatase (ALP) Activity
The activity of alkaline phosphatase (ALP) was assayed by the method of Klein et al. (1960) as outline
in Randox kit.
This method is based on the principle that serum alkaline phosphatase hydrolyses a colourless substrate
of phenolphthalein monophosphate giving rise to phosphoric acid and phenolphthalein, which at
alkaline pH value turns into a pink colour whose optical density can be measured
spectophotometrically.
Reagent Concentration
2-Amino-2-methyl-1-propanol pH 11 7.9 M
Phenolphthalein monophosphate 63mM
Na2HPO4 80 mM
Procedure
Distilled water (1.0 ml) was pipetted into 2 sets of test tubes labelled SA (sample) and ST (standard)
respectively. Then, one drop each of chromogenic substrate was added to the distilled water in the two
sets of test tubes. Their contents were mixed and incubated at 370C for 20 minutes in a water bath; after
which a standard solution of 0.1 ml was added to the standard test tube (ST) only, followed by the
addition of the serum sample of 0.1 ml to the sample test tube (SA). The content was also mixed and
incubated at 370C for 20 minutes in a water bath. A colour developer of 5.0 ml was added to both sets
of test tubes. The absorbance of the sample against the blank (water) was read at the wavelength of
550nm. The activity of alkaline phosphatase in the serum was obtained from the formula (calculations)
below:
30..
..
DOSA
DOSA = U/L of Alkaline phosphatase
Where
SA O.D = Sample Optical Density
ST O.D = Standard Optical Density
153
2.2.7.12 Determination of Total Cholesterol Concentration
Total cholesterol concentration was determined by the method of Allain et al. (1976) using Randox kit.
The total cholesterol using Randox Commercial kit is based on the principle that cholesterol is
determined after enzymatic hydrolysis and oxidation. The indicator quinoneimine is formed from
hydrogen peroxide and 4-aminoantipyrine in the presence of phenol and peroxide.
Cholesterol-ester + H2O cholesterol + Fatty acid (1)
Cholesterol-ester + H2O cholestene-3-one + H2O (2)
2H2O2 + Phenol + 4-Aminoantipyrene H2O Quinoneimine + H2O (3)
REAGENTS COMPOSITION
Content Reagents Initial Concentration of Solution
4-aminoantipyrine 0.3 mmol/l
Phenol 6 mmol/l
Peroxide ≥ 0.5 U/ml
Cholesterol esterase ≥ 0.15 U/ml
Cholesterol oxidase ≥ 0.1 U/ml
Pipes Buffer 80 mmol/l; pH 6.8
Standard 5.17 mmol/l (200 mg/dl)
Procedure
Distilled (10µl) water was pipetted into test tubes labeled B (reagent blank) only. Standard solution of
10µl was pipetted into test tubes labelled ST (standard). Serum sample (10µl) from the various
groups/mice was correspondingly pipetted into the last set of test tubes labelled SA (sample). Finally, 1
ml of the reagent was added to all the three sets of test tubes (Reagent blank, standard and sample),
mixed thoroughly and incubated for 10 minutes at 250C. The absorbance of sample (Asample) against the
reagent blank was read or measured at 500nm within 60 minutes.
154
The concentration of cholesterol in the serum sample was determined as follow; Conc. of
Cholesterol of in Sample = Standard
Sample
A
A× Conc. of Standard
2.2.7.13 Determination of High-Density Lipoproteins (HDL)–Cholesterol Concentration
High density lipoprotein (HDL) concentration was determined by the method of Albers et al. (1978)
using Randox kit.
The HDL-cholesterol determination using biosystem commercial kit method was based on the principle
that very low density lipoproteins (VLDL) and low density lipoprotein (LDL) in the sample
precipitated with phosphotungstate and magnesium ions. The supernatant contains high density
lipoproteins (HDL). The HDL cholesterol was spectrophotometrically measured.
The procedure took two steps;
a. Precipitation step: The sample (0.2 ml) was pipetted into labelled centrifuge tubes.
Also, 0.5 ml of reagent A (Phosphotungstate 0.4 mmol/l, magnesium chloride
20mmol/l) was added to the same sets of centrifuge tubes. The contents of the tubes
were thoroughly mixed and allowed to stand for 10 minutes at room temperature, then
centrifuged for 10 minutes at the minimum of 4000 rpm. The supernatant was carefully
collected.
b. Colorimetric step:Reagent B was brought to room temperature. Distilled water (50µl)
was pipetted into the blank test tubes (B). HDL cholesterol standard (50µl) and sample
supernatant were pipetted into the standard (ST) and the sample (SA) test tubes
respectively. Reagent B (1.0µl) each was added to all test tubes and thoroughly mixed;
then incubated for 30 minutes at room temperature. The absorbance (A) of the standard
and sample at 500nm wavelength was measured against the blank. The colour was stable
for at least 30 minutes.
Calculations
The HDL cholesterol concentration in the sample was calculated using the following general formula:
Standard
Sample
A
A × 52.5 = mg/dl HDL-cholesterol
Reagent Contents and Composition
155
Reagent A: 2 x 50ml phosphotungstate 0.4 mmol/l, magnesium chloride 20 mmol/l
Reagent B: 2 x 50 ml phosphate 35 mmol/l, cholesterol esterase > 0.2 U/ml, cholesterol oxidase > 0.1
U/ml, peroxidase > 1 U/ml, 4-aminoantipyrine 0.5 mmol/L, sodium cholate 0.5 mmol/l,
dichlorophenol-sulfonate 4 mmol/L, pH 7.0. HDL cholesterol standard: 1 x 5 ml. cholesterol 15 mg/dl;
aqueous primary standard.
2.2.7.14 Determination of Triacylglycerol Concentration
Triacylglycerol (TAG) concentration was determined by the method of Allain et al. (1976) using
Randox kit.
Principle
The triacylglycerol concentration was determined after enzymatic hydrolysis with lipases. The
indicator is a quinoneimine formed from hydrogen –peroxide, 4-aminophenazone and 4-chlorophenol
under the catalytic influence of peroxide.
Triglycerides + H2O Lipases
Glycerol + fatty acids
Glycerol + ATP GK
Glycerol-3-phosphate + ADP
Glycerol-3-phosphate + O2 GPO
Dihydroxyacetone + phosphate + H2O2
2H2O2 + 4-aminophenazone + 4-chlorophenol POD
Quinoneimine + HCl + 4H2O.
A known volume of 100µl of the reagent was pipetted into the reagent blank tube, standard tube and
the sample tubes. 10µl of the standard was then added to the standard tube while 10µl of the sample
was pipetted into the sample tube. The mixtures in the three tubes were mixed and incubated at 20 –
250C for 10 minutes. Then, the absorbance of the sample and the standard were measured against the
reagent blank within 60 minutes at 546nm.
Triacylglycerol concentration (mmol/l) = Standard
Sample
A
A × 2.29
ASample = Absorbance of sample
AStandard= Absorbance of standard
2.2.7.15 Determination of Low Density Lipoprotein-Cholesterol Concentration
156
Low density lipoprotein (LDL) concentration was determined by the method of Assmann et al.
(1984) using Randox kit.
The LDL-cholesterol determination, using Randox Commercial Kit is based on the principle that low
density lipoproteins (LDL) are precipitated by heparin or EDTA at their isoelectric point (pH 5.04).
After centrifugation, the high density lipoproteins (HDL) and the very low density lipoproteins (VLDL)
remain in the supernatant. These were determined by enzymatic methods.
LDL-cholesterol = Total cholesterol – cholesterol in the supernatant
Reagents
CONTENT INITIAL CONCENTRATION OF SOLUTION
Precipitation reagent Heparin 50,000 IU/L
Sodium 0.064 mol/L, pH 5.04
Procedure
The serum (100µl) was pipetted into the centrifuge tube which was immediately accompanied with the
addition of 1 ml of the precipitation reagent to the centrifuge tube. The contents were well mixed and
left to stand for 10 minutes at 25oC; then, centrifuged for 15 minutes at 3500 rpm. The cholesterol
concentration of the supernatant was determined within 1 hour after centrifugation.
Distilled water (50µl) was pipetted into a reagent blank test tube (B) of a new set of test tubes. The
standard solution (50µl) each and the supernatant were pipetted into the standard test tube (ST) and the
sample test tube (SA) respectively. A volume of 1ml each of the reagent solution was added to all the
three sets of test tubes. The test tubes contents were mixed and inoculated for 10 minutes at 25oC. The
absorbance of the sample (Asample) against the reagent blank was read at;
Conc. of Cholesterol in the Supernatant Standard
Sample
A
A × Conc. of Standard
Calculation of the LDL-cholesterol:
LDL-Cholesterol = Total Cholesterol – Cholesterol in the Supernatant
2.2.7.16 Acute Toxicity Studies (LD50)
157
Acute toxicity studies (LD50) was measured using method of Lorke (1989). The animals were
divided into two groups, A and B, with each group subdivided into four groups made up of three
animals each.
Experimental Protocol for Acute Toxicity Studies
Phase I:
Group 1 : Mice were administered with 10mg/kg of body weight of the ethanol leaf extract of
Moringa oleifera.
Group 2 : Mice were administered with 100mg/kg of body weight of the ethanol
leaf extract of Moringa oleifera.
Group 3 : Mice were administered with 1000 mg/kg of body weight of the ethanol leaf extract of
Moringa oleifera.
Group 4 : Mice were administered with 1000 mg/kg of body weight of distilled water.
Phase II
Group 1 : Mice were administered with 1900 mg/kg of body weight of the ethanol leaf extract.
Group 2 : Mice were administered with 2600 mg/kg of body weight of the ethanol leaf extract.
Group 3 : Mice were administered with 5000 mg/kg of body weight of the ethanol leaf extract.
Group 4 : Mice were administered with 5000 mg/kg of body weight of distilled water.
The mice were monitored closely for 24 hours for signs of toxicity and lethality
2.2.8 Phytochemical Analyses
Phytochemical analyses were carried out according to the methods of Harborne (1973) and Trease and
Evans (1989).
The following phytochemical tests were carried out:
2.2.8.1 Test for Carbohydrate (Molisch’s Test)
A known weight, 0.1 g, of extract was boiled with 2ml of water and filtered. To the filtrate, few drops
of naphtol solution in ethanol (Molisch’s reagent) were added. Concentrated sulphuric acid was then
gently poured down the side of the test tube to form a lower layer
158
2.2.8.2 Test for Alkaloids (General Tests)
Sulphuric acid (20 ml of 5%) in 50% ethanol was added to about 2g of the powdered material (extract)
and heated on a boiling water bath for 10 minutes, cooled and filtered. The filtrate (2 ml) was tested
with a few drops of:
Mayer’s reagent (potassium mercuric iodide solution)
Dragendorff’s reagent (bismuth potassium iodide solution)
Wagner’s reagent (iodide in potassium iodide solution)
Picric acid solution (1%)
The remaining filtrate was placed in 100ml separating funnel and alkaline with diluted ammonia
solution. The aqueous alkaline solution was separated and extracted with two 5 ml portions of diluted
sulphuric acid. The extract was tested with a few drops of Mayer’s Wagner’s and Drangendorff’s
reagent.
2.2.8.3 Test for Glycosides (Fehling’s Test)
A known volume, 5 ml, of a mixture of equal parts of Fehling’s solution I and II were added to 5 ml of
the aqueous extract and then heated on a water bath for 5 minutes.
2.2.8.4 Test for Saponins (Fehling’s Method)
Distilled water (20 ml) was added to 0.25g of extract in 100ml beaker and boiled gently on a hot water
bath for 2 minutes. The mixture was filtered hot and allowed to cool and the filtrate used as follows:
To 5ml of the filtrate was added 5ml of Fehling’s solution (equal parts of I and II) and the content
heated. A reddish precipitate indicated the presence of saponins. It was then heated further with
sulphuric acid.
2.2.8.5 Test for Tannins (Ferric Chloride Method)
A known weight of 1g of the powdered material (extract) was boiled with 50ml of water, filtered and
used for the ferric Chloride Test proper:
To 3 ml of the filtrate, few drops of ferric chloride were added.
159
2.2.8.6 Test for Flavonoids (Ammonium Test Method)
Ethylacetate (10ml) were added to 0.2g of the plant extract and heated on a water bath for 3 minutes.
The mixture was cooled, filtered and the filtrate used for the ammonium test proper:
A volume of 4 ml of the filtrate was shaken with 1 ml of dilute ammonia solution. The layers were
allowed to separate.
2.2.8.7 Test for Resins (Precipitaion Test)
The Moringa oleifera leaf extract (0.2g) was extracted with 15 ml of 95% ethanol. The alcoholic
extract was then poured into 20ml of distilled water in a beaker.
2.2.8.8 Test for Proteins (Million’s Test)
Two drops of Million’s reagent were added to the filtrate in a test tube.
2.2.8.9 Test for Oils
The Moringa oleifera leaf extract (0.1g) material was pressed between a filter paper and the filter paper
was put under serious observation.
2.2.8.10 Test for Steroids and Terpenoids
Ethanol (9ml) was added to 1g of the plant extract and refluxed for few minutes and filtered. The
filtrate was concentrated to 2.5 ml on a boiling water bath and 5 ml of hot water was added. The
mixture was allowed to stand for 1 hour and the waxy matter filtered off. The filtrate was extracted
with 2.5 ml of chloroform using separating funnel. To 0.5 ml of the chloroform extract in a test tube
was carefully added 1 ml of concentrated sulphuric acid to form a lower layer. Another 0.5 ml of the
chloroform extract was evaporated to dryness on a water bath and heated with 3 ml of concentrated
sulphuric acid for 10 minutes on a water bath.
2.3 STATISTICAL ANALYSIS
The data obtained from the laboratory tests were subjected to one- way analyses of variance (ANOVA).
Significant differences were obtained at p≤0.05.The results were expressed as mean and standard
160
deviation (SD).This analysis was estimated using computer software known as Statistical Package
for Social Sciences (SPSS), version 18.
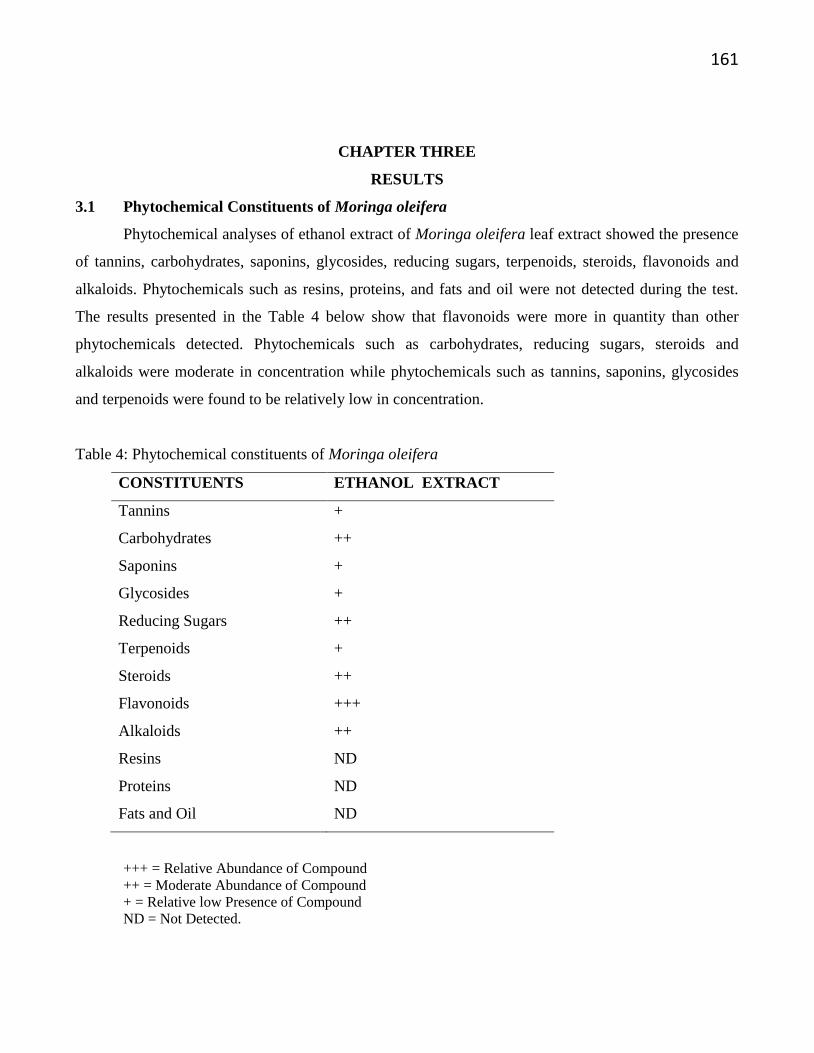
161
CHAPTER THREE
RESULTS
3.1 Phytochemical Constituents of Moringa oleifera
Phytochemical analyses of ethanol extract of Moringa oleifera leaf extract showed the presence
of tannins, carbohydrates, saponins, glycosides, reducing sugars, terpenoids, steroids, flavonoids and
alkaloids. Phytochemicals such as resins, proteins, and fats and oil were not detected during the test.
The results presented in the Table 4 below show that flavonoids were more in quantity than other
phytochemicals detected. Phytochemicals such as carbohydrates, reducing sugars, steroids and
alkaloids were moderate in concentration while phytochemicals such as tannins, saponins, glycosides
and terpenoids were found to be relatively low in concentration.
Table 4: Phytochemical constituents of Moringa oleifera
CONSTITUENTS ETHANOL EXTRACT
Tannins +
Carbohydrates ++
Saponins +
Glycosides +
Reducing Sugars ++
Terpenoids +
Steroids ++
Flavonoids +++
Alkaloids ++
Resins ND
Proteins ND
Fats and Oil ND
+++ = Relative Abundance of Compound
++ = Moderate Abundance of Compound
+ = Relative low Presence of Compound
ND = Not Detected.
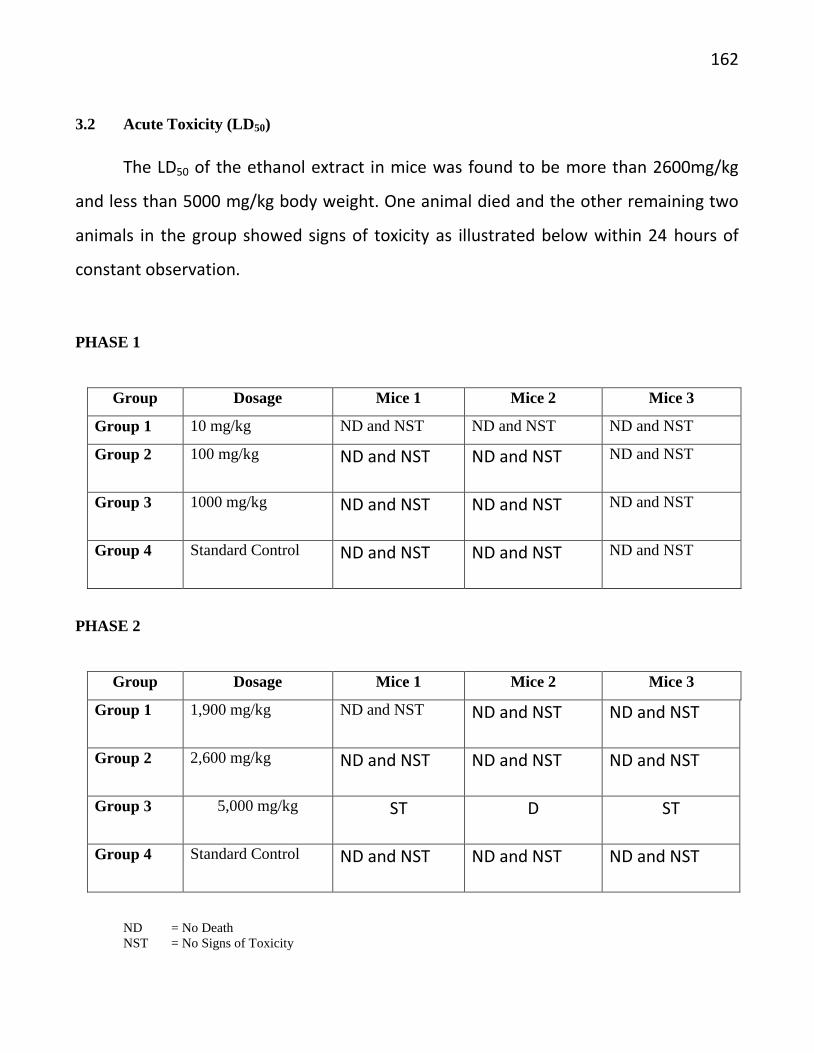
162
3.2 Acute Toxicity (LD50)
The LD50 of the ethanol extract in mice was found to be more than 2600mg/kg
and less than 5000 mg/kg body weight. One animal died and the other remaining two
animals in the group showed signs of toxicity as illustrated below within 24 hours of
constant observation.
PHASE 1
Group Dosage Mice 1 Mice 2 Mice 3
Group 1 10 mg/kg ND and NST ND and NST ND and NST
Group 2 100 mg/kg ND and NST ND and NST ND and NST
Group 3 1000 mg/kg ND and NST ND and NST ND and NST
Group 4 Standard Control ND and NST ND and NST ND and NST
PHASE 2
Group Dosage Mice 1 Mice 2 Mice 3
Group 1 1,900 mg/kg ND and NST ND and NST ND and NST
Group 2 2,600 mg/kg ND and NST ND and NST ND and NST
Group 3 5,000 mg/kg ST D ST
Group 4 Standard Control ND and NST ND and NST ND and NST
ND = No Death
NST = No Signs of Toxicity
163
D = Death
ST = Signs of Toxicity
3.3. Effect of Ethanol Leaf Extract of Moringa oleifera on Percentage Parasitaemia
Fig. 2 shows that 3 days of inoculation the mean values for percentage parasitaemia of mice in
groups 4 and 5 significantly decreased (p<0.05) compared to the values of mice in groups 1 (positive
control), 2 and 3. On day 3 of treatment the mean values for percentage parasitaemia in all the groups
significantly decreased (p<0.05) compared to the mean percentage parasitaemia of mice in groups 1
(positive control) and 2. Also, on day 5 of treatment the mean percentage parasitaemia in all the groups
significantly decreased (p<0.05) compared to the values for the percentage parasitaemia of mice in
group 1 (positive control). On day 28 of post treatment the mean values of the percentage parasitaemia
significantly decreased in all the groups compared to the mean percentage parasitaemia of group 1
(positive control). Finally on day 28 of post treatment also showed significant (p<0.05) clearance of the
parasitaemia in groups 4 and 5 compared to the mean values of the percentage parasitaemia in groups 1
(positive control), 2 and 3 animals.
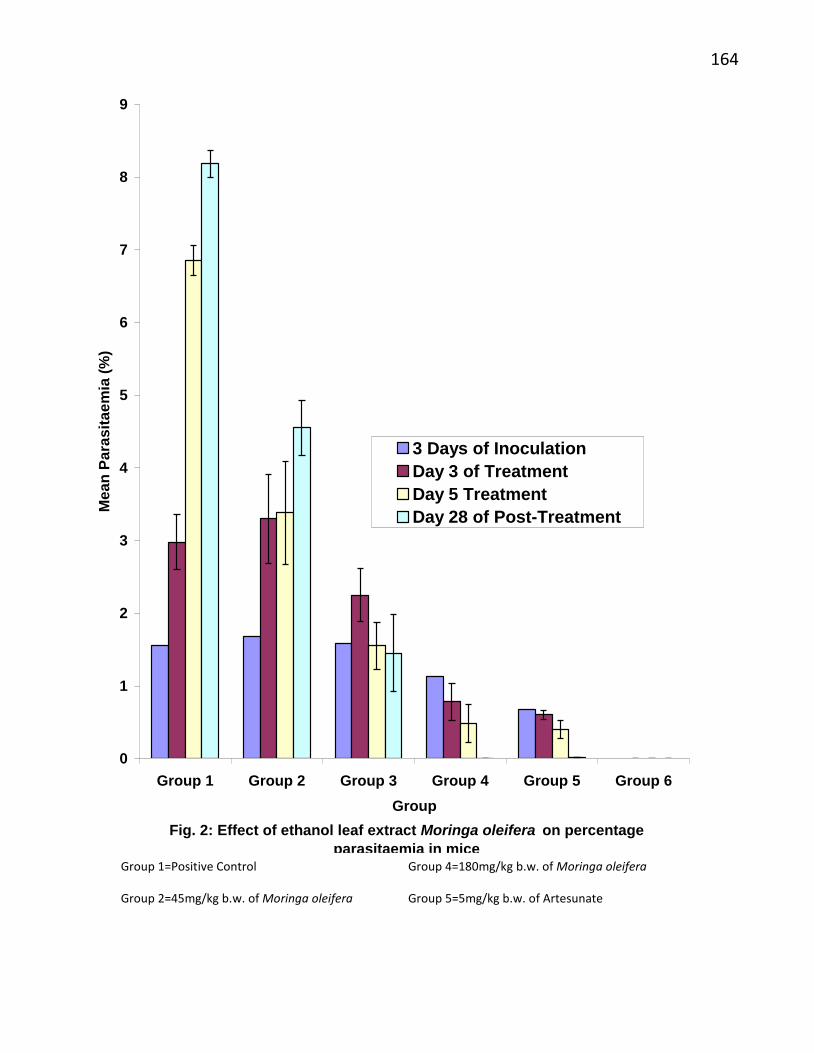
164
Fig. 2: Effect of ethanol leaf extract Moringa oleifera on percentage
parasitaemia in mice
0
1
2
3
4
5
6
7
8
9
Group 1 Group 2 Group 3 Group 4 Group 5 Group 6
Group
Me
an
Pa
ras
ita
em
ia (
%)
3 Days of Inoculation
Day 3 of Treatment
Day 5 Treatment
Day 28 of Post-Treatment
Group 1=Positive Control Group 4=180mg/kg b.w. of Moringa oleifera
Group 2=45mg/kg b.w. of Moringa oleifera Group 5=5mg/kg b.w. of Artesunate
Group 3=90mg/kg b.w. of Moringa oleifera Group 6=Negative Control
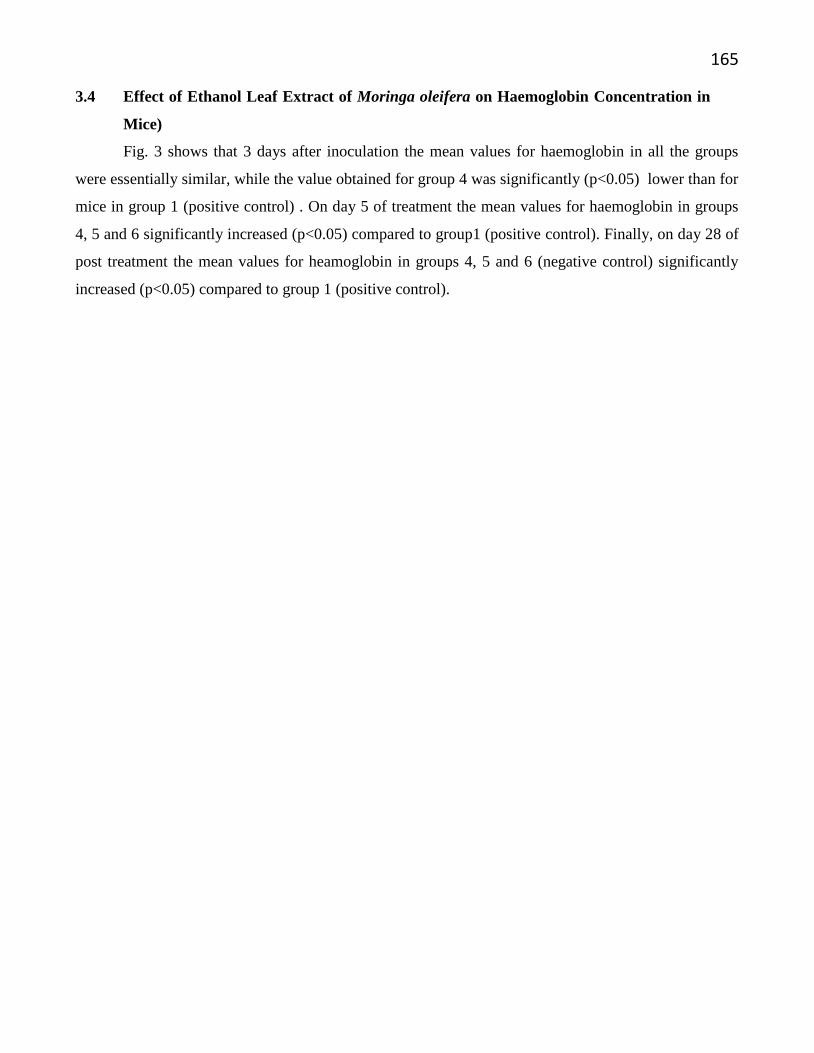
165
3.4 Effect of Ethanol Leaf Extract of Moringa oleifera on Haemoglobin Concentration in
Mice)
Fig. 3 shows that 3 days after inoculation the mean values for haemoglobin in all the groups
were essentially similar, while the value obtained for group 4 was significantly (p<0.05) lower than for
mice in group 1 (positive control) . On day 5 of treatment the mean values for haemoglobin in groups
4, 5 and 6 significantly increased (p<0.05) compared to group1 (positive control). Finally, on day 28 of
post treatment the mean values for heamoglobin in groups 4, 5 and 6 (negative control) significantly
increased (p<0.05) compared to group 1 (positive control).
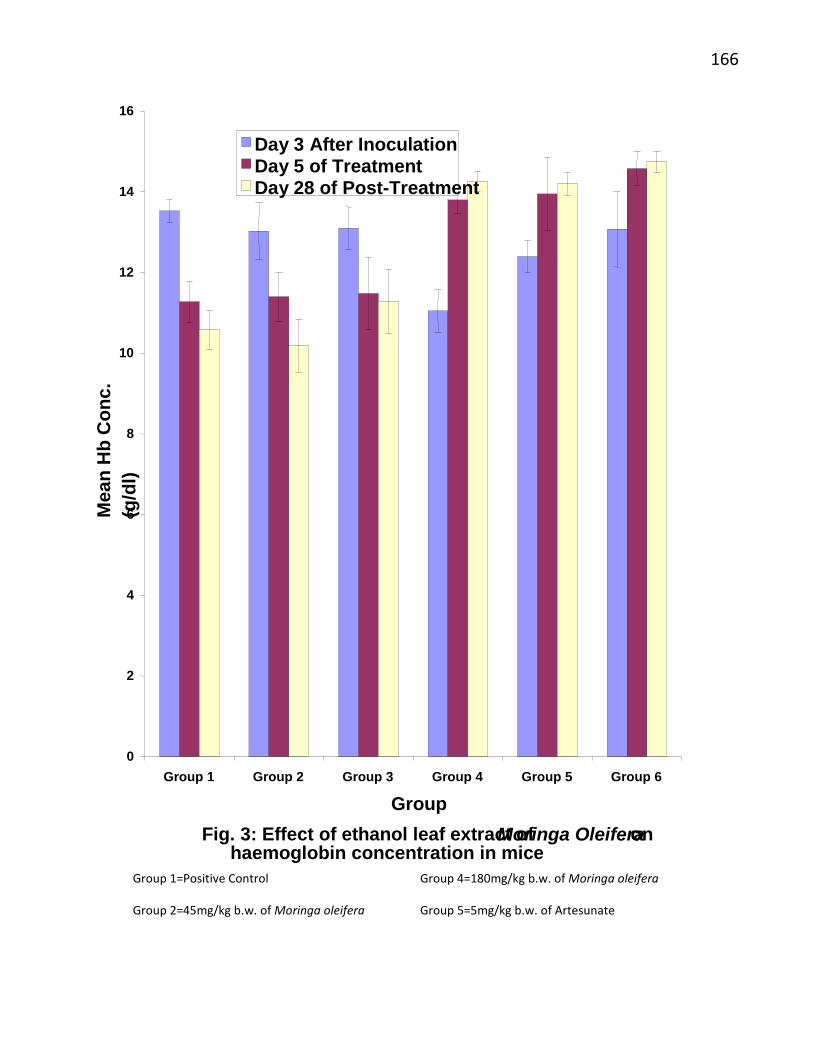
166
Fig. 3: Effect of ethanol leaf extract of Moringa Oleifera on haemoglobin concentration in mice
0
2
4
6
8
10
12
14
16
Group 1 Group 2 Group 3 Group 4 Group 5 Group 6
Group
Day 3 After Inoculation Day 5 of Treatment Day 28 of Post-Treatment
Group 1=Positive Control Group 4=180mg/kg b.w. of Moringa oleifera
Group 2=45mg/kg b.w. of Moringa oleifera Group 5=5mg/kg b.w. of Artesunate
Group 3=90mg/kg b.w. of Moringa oleifera Group 6=Negative Control
Me
an
Hb
Co
nc
.
(g/d
l)
167
3.5 Effect of Ethanol Leaf Extract of Moringa oleifera on Total White Blood Cell Count in
Mice
Fig. 4 shows the effect of ethanol leaf extract of Moringa oleifera on total white blood cell
count. The TWBC (baseline) count obtained 3 days after inoculation for mice in groups 1, 2, 3, 5 and 6
were essentially similar, while the value obtained for mice in group 4 was significantly lower than that
for mice in group 1. On day 5 after commencement of treatment, mean value for group 2 mice was
significantly (p<0.05) lower than that of group 1 mice, while mean values for mice in groups 3 and 5
were significantly (p<0.05) higher than that of group 1 mice. There was no significant difference
(p>0.05) between the mean values for mice in groups 4 and 6 when compared with that for mice in
group 1. TWBC count on day 28 of treatment in group 3 mice was essentially similar to the value of
TWBC in group 6 (negative control) mice, while the values obtained for mice in groups 2, 3, 4, 5 and 6
were significantly (p<0.05) higher than that for group 1 (positive control) mice.
168
Fig. 4: Effect of ethanol leaf extract of Moringa oleifera on total
white blood cell count in mice
0
5
10
15
20
25
Group 1 Group 2 Group 3 Group 4 Group 5 Group 6
Group
Me
an
To
tal
WB
C (
10
9/L
)
Day 3 After Inoculation
Day 5 of Treatment
Day 28 of Post-Treatment
3.6 Effect of Ethanol Leaf Extract of Moringa oleifera on Packed Cell Volume in Mice
Group 1=Positive Control Group 4=180mg/kg b.w. of Moringa oleifera
Group 2=45mg/kg b.w. of Moringa oleifera Group 5=5mg/kg b.w. of Artesunate
Group 3=90mg/kg b.w. of Moringa oleifera Group 6=Negative Control
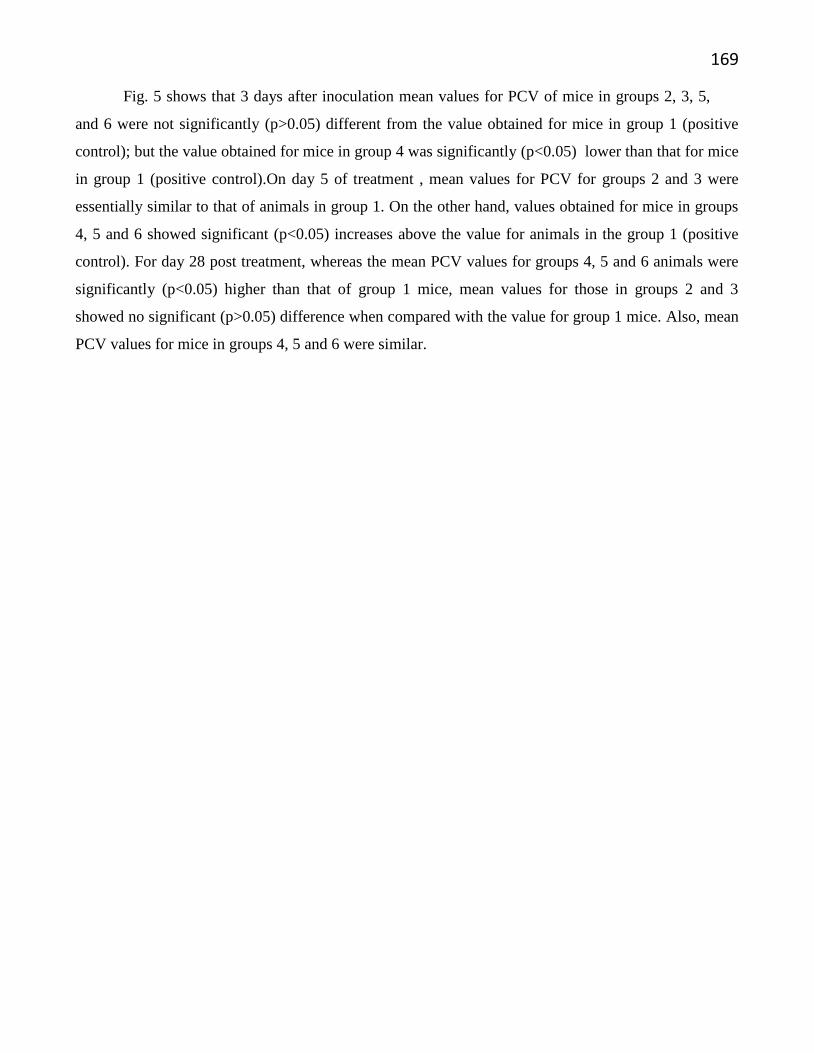
169
Fig. 5 shows that 3 days after inoculation mean values for PCV of mice in groups 2, 3, 5,
and 6 were not significantly (p>0.05) different from the value obtained for mice in group 1 (positive
control); but the value obtained for mice in group 4 was significantly (p<0.05) lower than that for mice
in group 1 (positive control).On day 5 of treatment , mean values for PCV for groups 2 and 3 were
essentially similar to that of animals in group 1. On the other hand, values obtained for mice in groups
4, 5 and 6 showed significant (p<0.05) increases above the value for animals in the group 1 (positive
control). For day 28 post treatment, whereas the mean PCV values for groups 4, 5 and 6 animals were
significantly (p<0.05) higher than that of group 1 mice, mean values for those in groups 2 and 3
showed no significant (p>0.05) difference when compared with the value for group 1 mice. Also, mean
PCV values for mice in groups 4, 5 and 6 were similar.
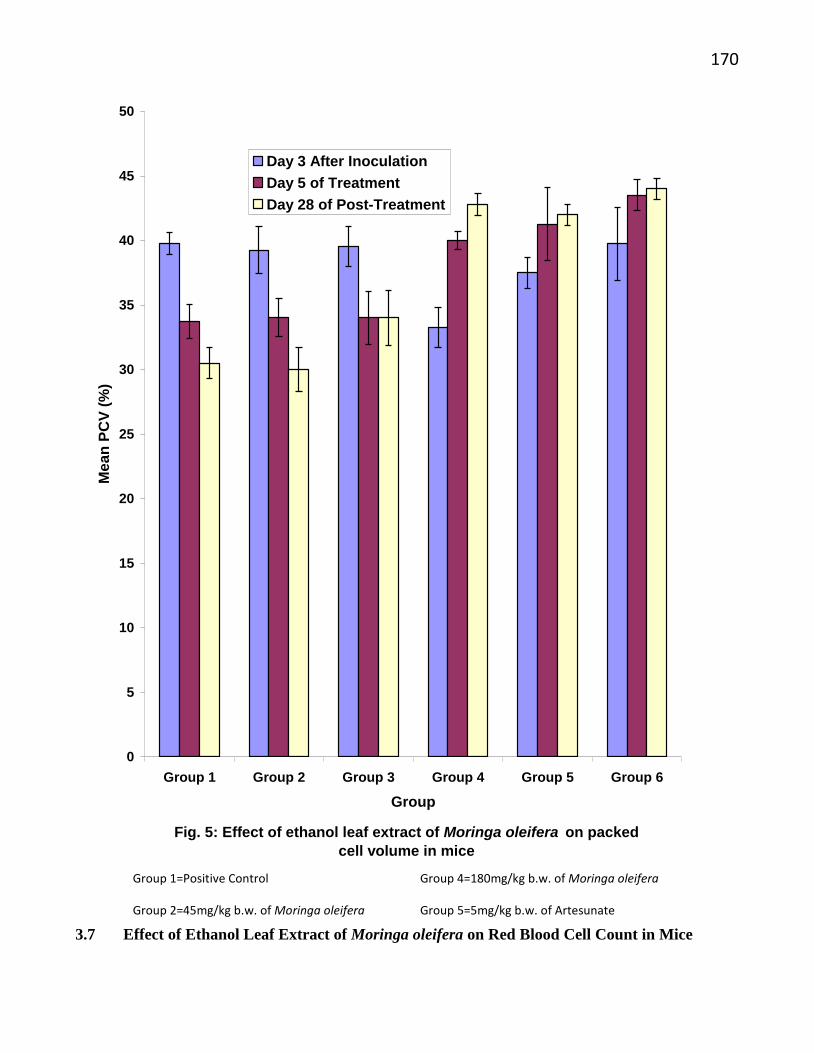
170
Fig. 5: Effect of ethanol leaf extract of Moringa oleifera on packed
cell volume in mice
0
5
10
15
20
25
30
35
40
45
50
Group 1 Group 2 Group 3 Group 4 Group 5 Group 6
Group
Me
an
PC
V (
%)
Day 3 After Inoculation
Day 5 of Treatment
Day 28 of Post-Treatment
3.7 Effect of Ethanol Leaf Extract of Moringa oleifera on Red Blood Cell Count in Mice
Group 1=Positive Control Group 4=180mg/kg b.w. of Moringa oleifera
Group 2=45mg/kg b.w. of Moringa oleifera Group 5=5mg/kg b.w. of Artesunate
Group 3=90mg/kg b.w. of Moringa oleifera Group 6=Negative Control
171
Fig. 6 shows that mean RBC baseline obtained 3 days after inoculation for mice in groups
2, 3, 4, 5 and 6 (negative control) mice were not significantly (p>0.05) different compared to the value
in group 1 (positive control) mice. On day 5 of treatment showed significant increase (p<0.05) in RBC
count of groups 2, 3, 4, 5 and 6 (negative control) mice compared to the mean value for RBC count of
mice in group 1 (positive control). Also day 28 of post treatment, showed significant increase (p<0.05)
in the mean values of RBC count of mice in groups 2, 3, 4, 5 and 6 (negative control) mice when
compared to the value of RBC count obtained for group 1 (positive control) mice. But the mean value
of RBC obtained in group 4 mice was essentially similar to that for group 6 (negative control).
172
Fig. 6: Effect of ethanol leaf extract of Moringa oleifera on red blood
cell count in mice
0
2
4
6
8
10
12
14
16
18
20
Group 1 Group 2 Group 3 Group 4 Group 5 Group 6
Group
Me
an
RB
C C
ou
nt
(x1
06)
Day 3 After Inoculation
Day 5 of Treatment
Day 28 of Post-Treatment
Group 1=Positive Control Group 4=180mg/kg b.w. of Moringa oleifera
Group 2=45mg/kg b.w. of Moringa oleifera Group 5=5mg/kg b.w. of Artesunate
Group 3=90mg/kg b.w. of Moringa oleifera Group 6=Negative Control
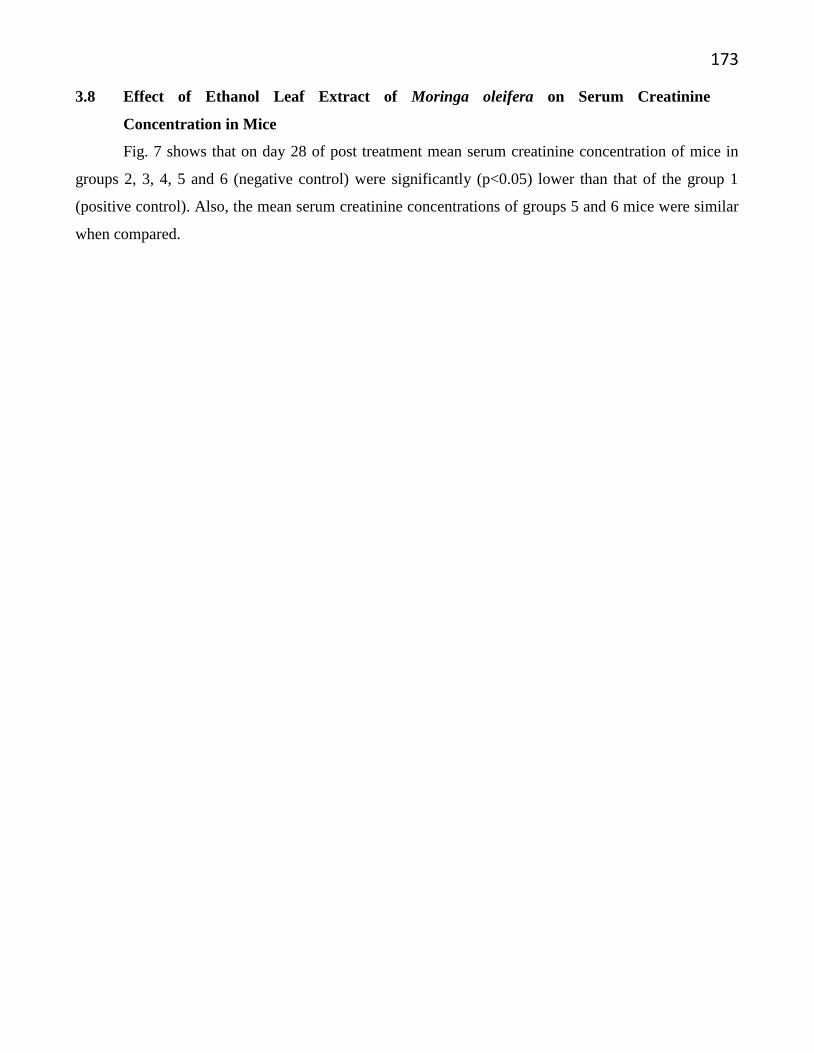
173
3.8 Effect of Ethanol Leaf Extract of Moringa oleifera on Serum Creatinine
Concentration in Mice
Fig. 7 shows that on day 28 of post treatment mean serum creatinine concentration of mice in
groups 2, 3, 4, 5 and 6 (negative control) were significantly (p<0.05) lower than that of the group 1
(positive control). Also, the mean serum creatinine concentrations of groups 5 and 6 mice were similar
when compared.
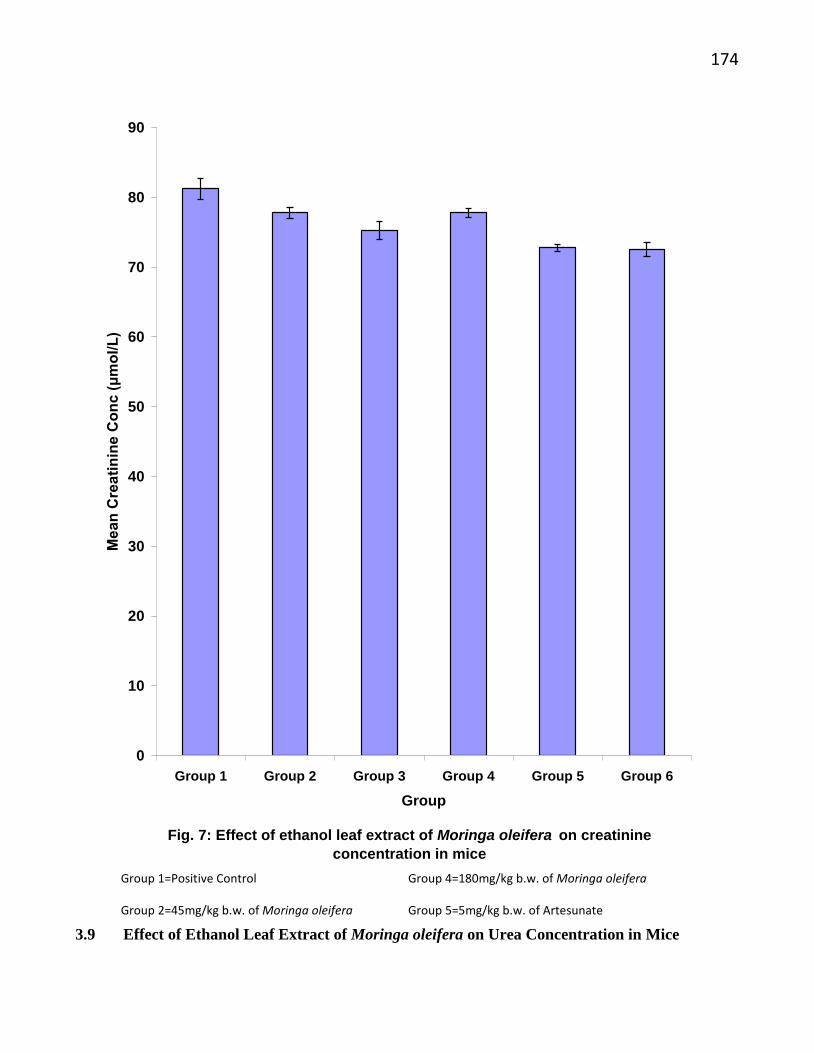
174
Fig. 7: Effect of ethanol leaf extract of Moringa oleifera on creatinine
concentration in mice
0
10
20
30
40
50
60
70
80
90
Group 1 Group 2 Group 3 Group 4 Group 5 Group 6
Group
Me
an
Cre
ati
nin
e C
on
c (
μm
ol/
L)
3.9 Effect of Ethanol Leaf Extract of Moringa oleifera on Urea Concentration in Mice
Group 1=Positive Control Group 4=180mg/kg b.w. of Moringa oleifera
Group 2=45mg/kg b.w. of Moringa oleifera Group 5=5mg/kg b.w. of Artesunate
Group 3=90mg/kg b.w. of Moringa oleifera Group 6=Negative Control
175
Fig. 8 shows that on day 28 of post treatment mean values for urea concentration of mice in
groups 2, 3, 4, 5 and 6 (negative control) were not significantly (p>0.05) different from the value
obtained for mice in group 1 (positive control). But the values obtained for mice in groups 2 and 4 were
significantly (p<0.05) lower than that for mice in group 6 (negative control). Also mean values for urea
concentration in groups 1 (positive control) and 3 were similar when compared.
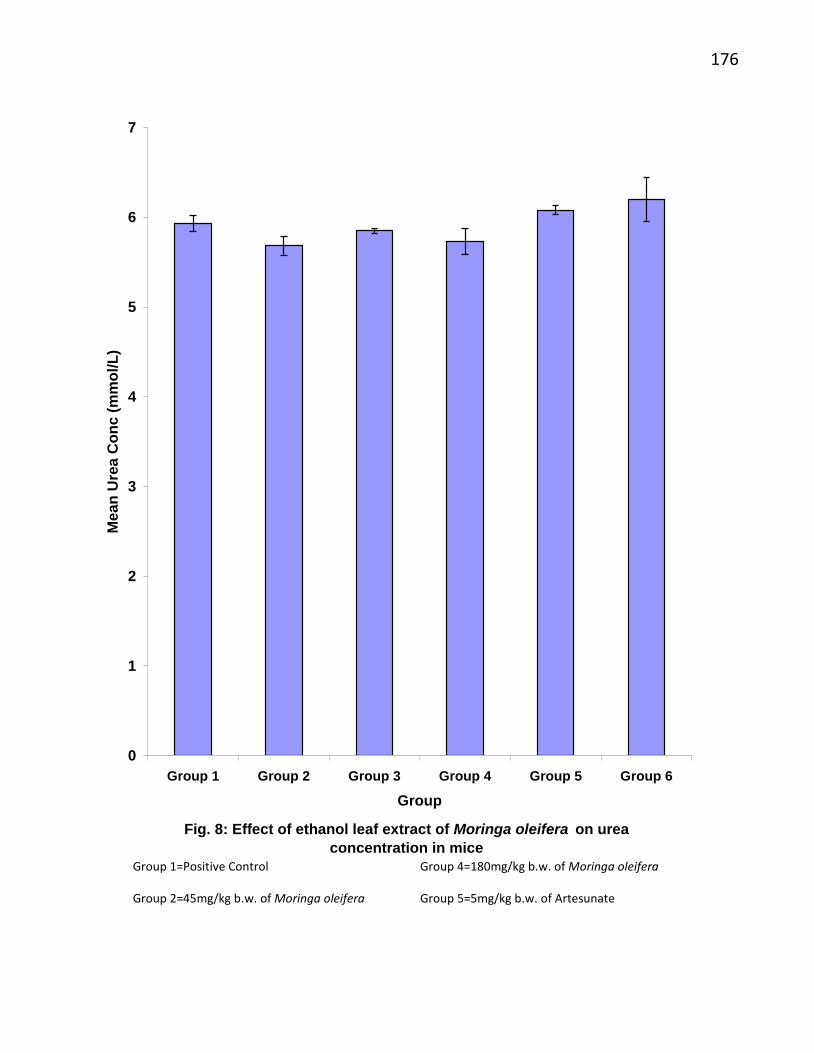
176
Fig. 8: Effect of ethanol leaf extract of Moringa oleifera on urea
concentration in mice
0
1
2
3
4
5
6
7
Group 1 Group 2 Group 3 Group 4 Group 5 Group 6
Group
Me
an
Ure
a C
on
c (
mm
ol/
L)
Group 1=Positive Control Group 4=180mg/kg b.w. of Moringa oleifera
Group 2=45mg/kg b.w. of Moringa oleifera Group 5=5mg/kg b.w. of Artesunate
Group 3=90mg/kg b.w. of Moringa oleifera Group 6=Negative Control
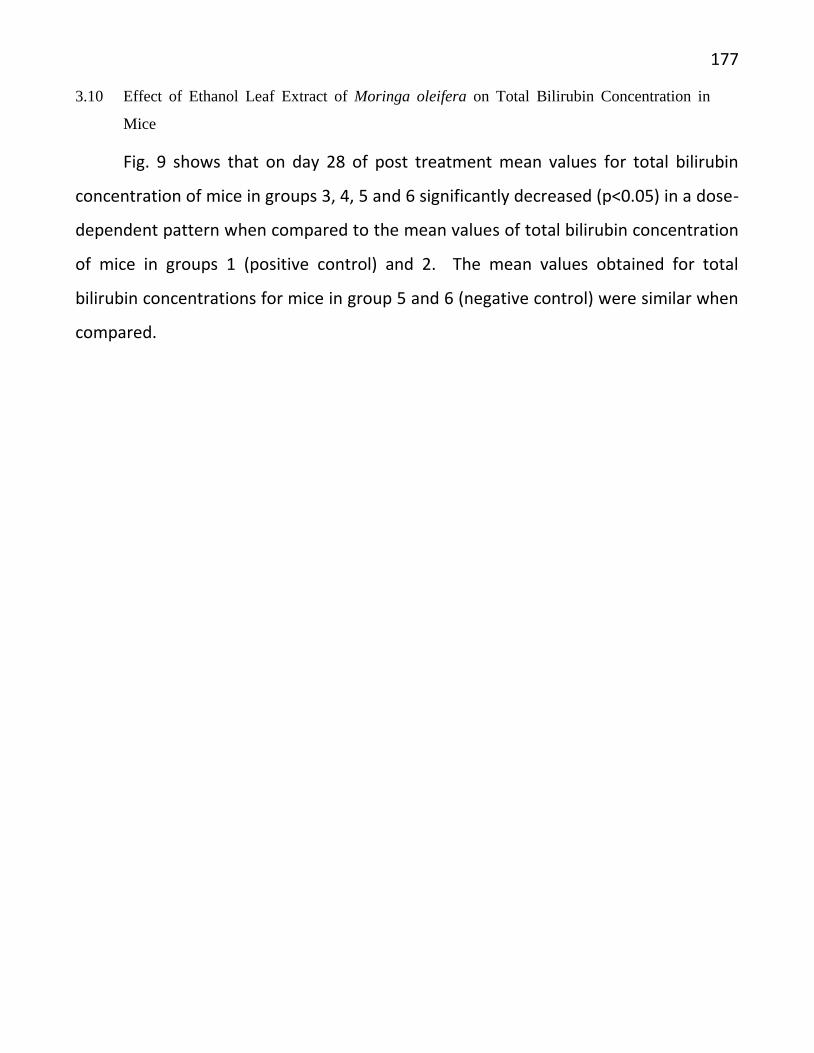
177
3.10 Effect of Ethanol Leaf Extract of Moringa oleifera on Total Bilirubin Concentration in
Mice
Fig. 9 shows that on day 28 of post treatment mean values for total bilirubin
concentration of mice in groups 3, 4, 5 and 6 significantly decreased (p<0.05) in a dose-
dependent pattern when compared to the mean values of total bilirubin concentration
of mice in groups 1 (positive control) and 2. The mean values obtained for total
bilirubin concentrations for mice in group 5 and 6 (negative control) were similar when
compared.
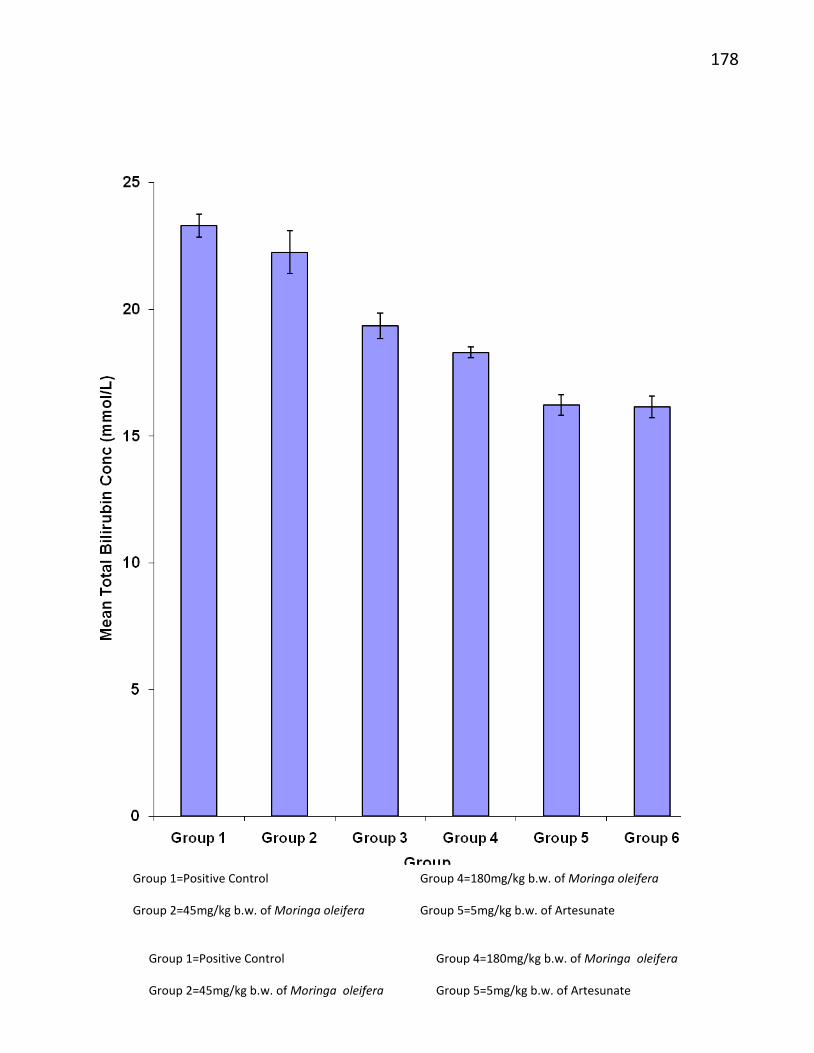
178
Group 1=Positive Control Group 4=180mg/kg b.w. of Moringa oleifera
Group 2=45mg/kg b.w. of Moringa oleifera Group 5=5mg/kg b.w. of Artesunate
Group 3=90mg/kg b.w. of Moringa oleifera Group 6=Negative Control
Group 1=Positive Control Group 4=180mg/kg b.w. of Moringa oleifera
Group 2=45mg/kg b.w. of Moringa oleifera Group 5=5mg/kg b.w. of Artesunate
Group 3=90mg/kg b.w. of Moringa oleifera Group 6=Negative Control
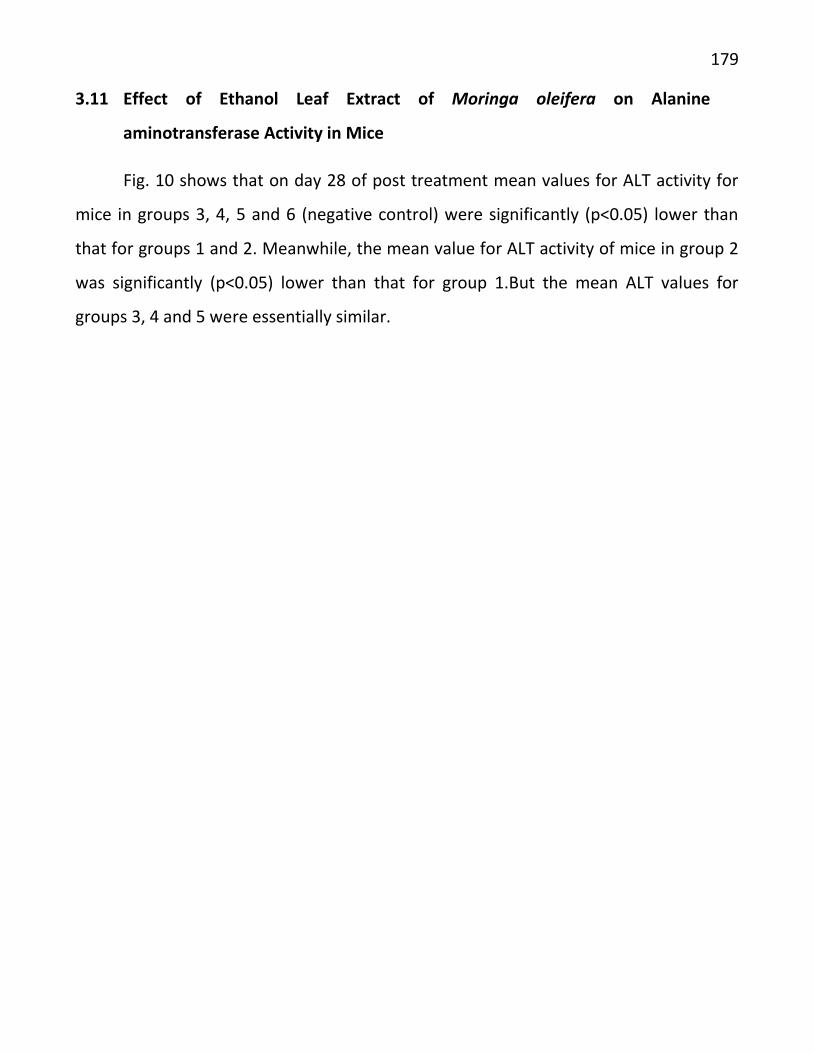
179
3.11 Effect of Ethanol Leaf Extract of Moringa oleifera on Alanine
aminotransferase Activity in Mice
Fig. 10 shows that on day 28 of post treatment mean values for ALT activity for
mice in groups 3, 4, 5 and 6 (negative control) were significantly (p<0.05) lower than
that for groups 1 and 2. Meanwhile, the mean value for ALT activity of mice in group 2
was significantly (p<0.05) lower than that for group 1.But the mean ALT values for
groups 3, 4 and 5 were essentially similar.
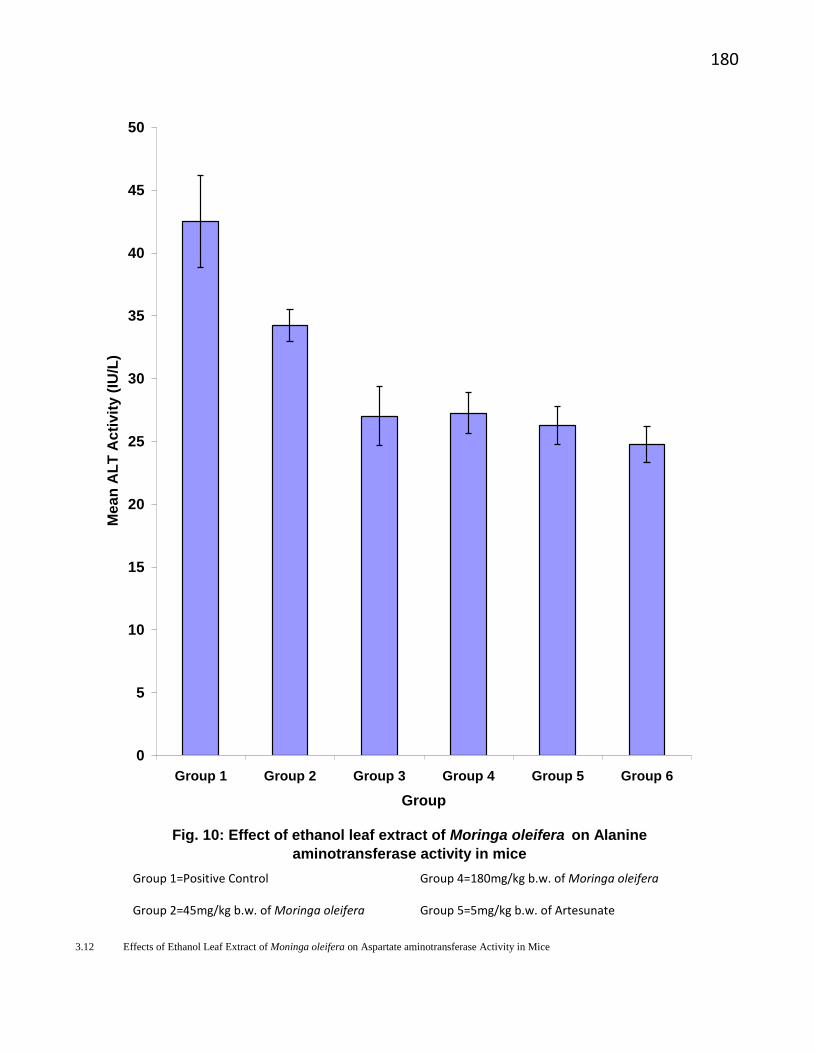
180
Fig. 10: Effect of ethanol leaf extract of Moringa oleifera on Alanine
aminotransferase activity in mice
0
5
10
15
20
25
30
35
40
45
50
Group 1 Group 2 Group 3 Group 4 Group 5 Group 6
Group
Me
an
AL
T A
cti
vit
y (
IU/L
)
3.12 Effects of Ethanol Leaf Extract of Moninga oleifera on Aspartate aminotransferase Activity in Mice
Group 1=Positive Control Group 4=180mg/kg b.w. of Moringa oleifera
Group 2=45mg/kg b.w. of Moringa oleifera Group 5=5mg/kg b.w. of Artesunate
Group 3=90mg/kg b.w. of Moringa oleifera Group 6=Negative Control
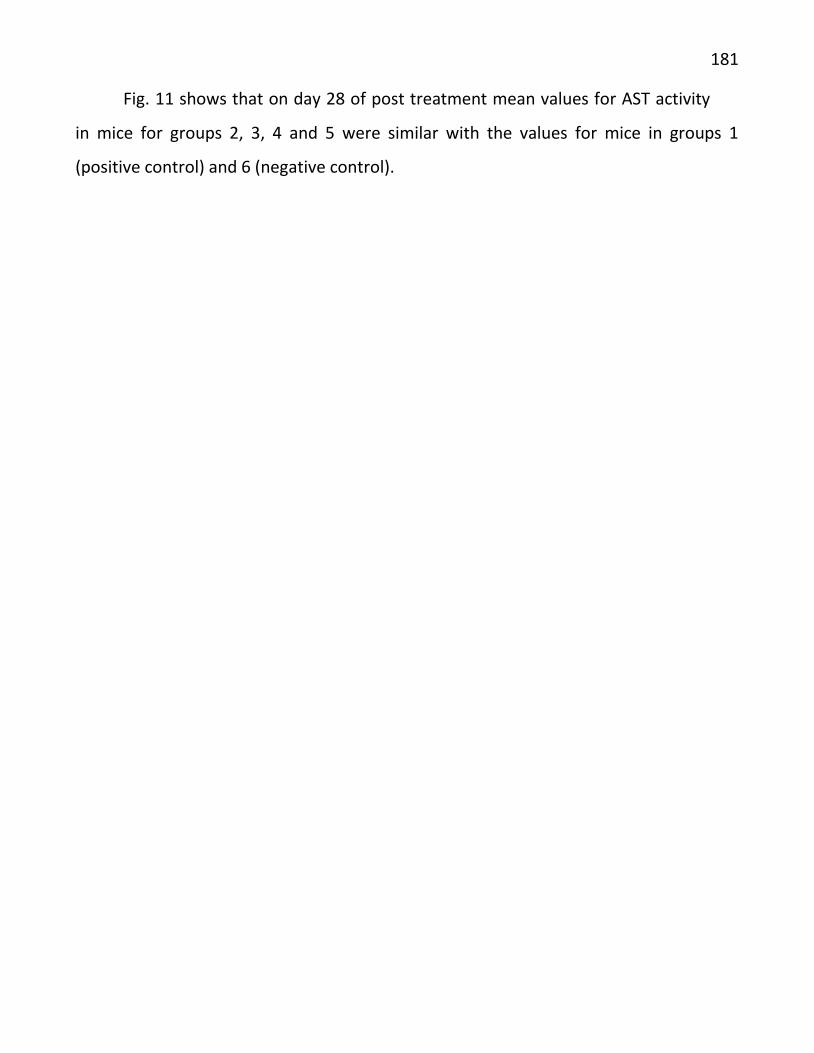
181
Fig. 11 shows that on day 28 of post treatment mean values for AST activity
in mice for groups 2, 3, 4 and 5 were similar with the values for mice in groups 1
(positive control) and 6 (negative control).

182
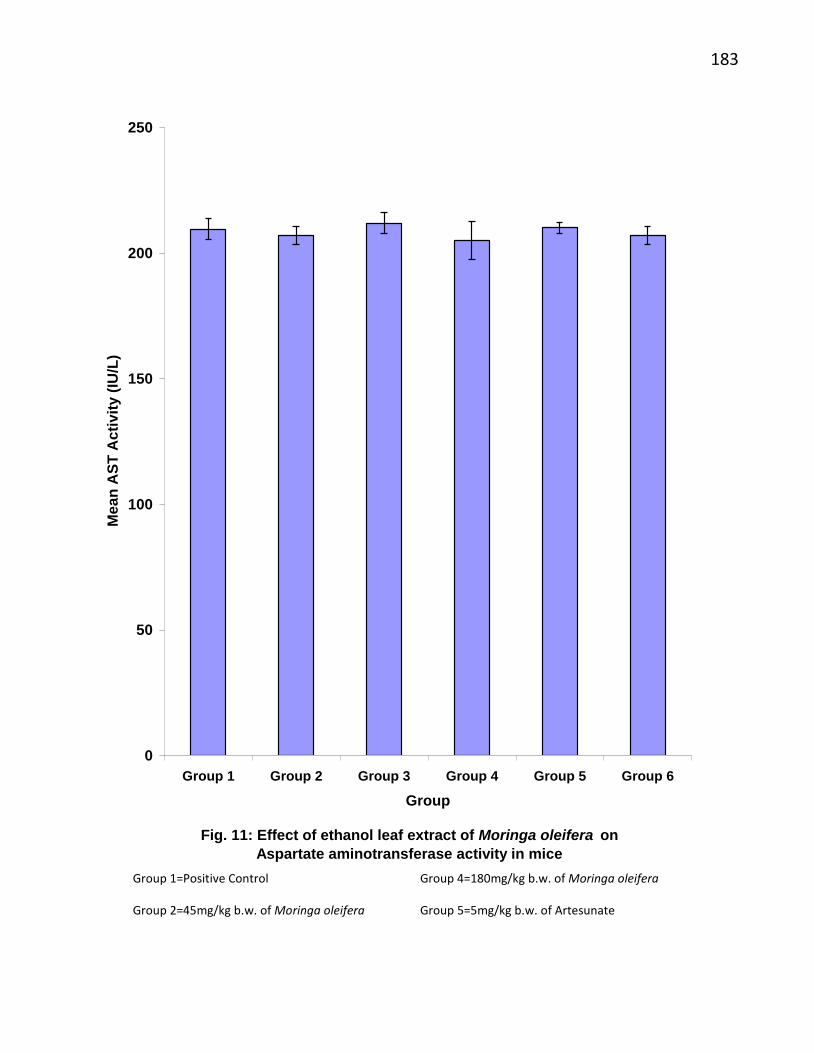
183
Fig. 11: Effect of ethanol leaf extract of Moringa oleifera on
Aspartate aminotransferase activity in mice
0
50
100
150
200
250
Group 1 Group 2 Group 3 Group 4 Group 5 Group 6
Group
Me
an
AS
T A
cti
vit
y (
IU/L
)
Group 1=Positive Control Group 4=180mg/kg b.w. of Moringa oleifera
Group 2=45mg/kg b.w. of Moringa oleifera Group 5=5mg/kg b.w. of Artesunate
Group 3=90mg/kg b.w. of Moringa oleifera Group 6=Negative Control
184
3.13 Effect of Ethanol Leaf Extract of Moringa oleifera on Alkaline Phosphatase Activity in Mice
Fig. 12 shows the effect of ethanol leaf extract of Moringa oleifera on alkaline phosphatase activity in mice. On day 28 of post
treatment shows that the mean ALP values for mice in groups 2, 3, 5 and 6 (negative control) were significantly (p<0.05) lower than
that for mice in groups 1 (positive control) and 4. But the ALP values for mice in groups 4 and 1 (positive control) were similar when
compared.
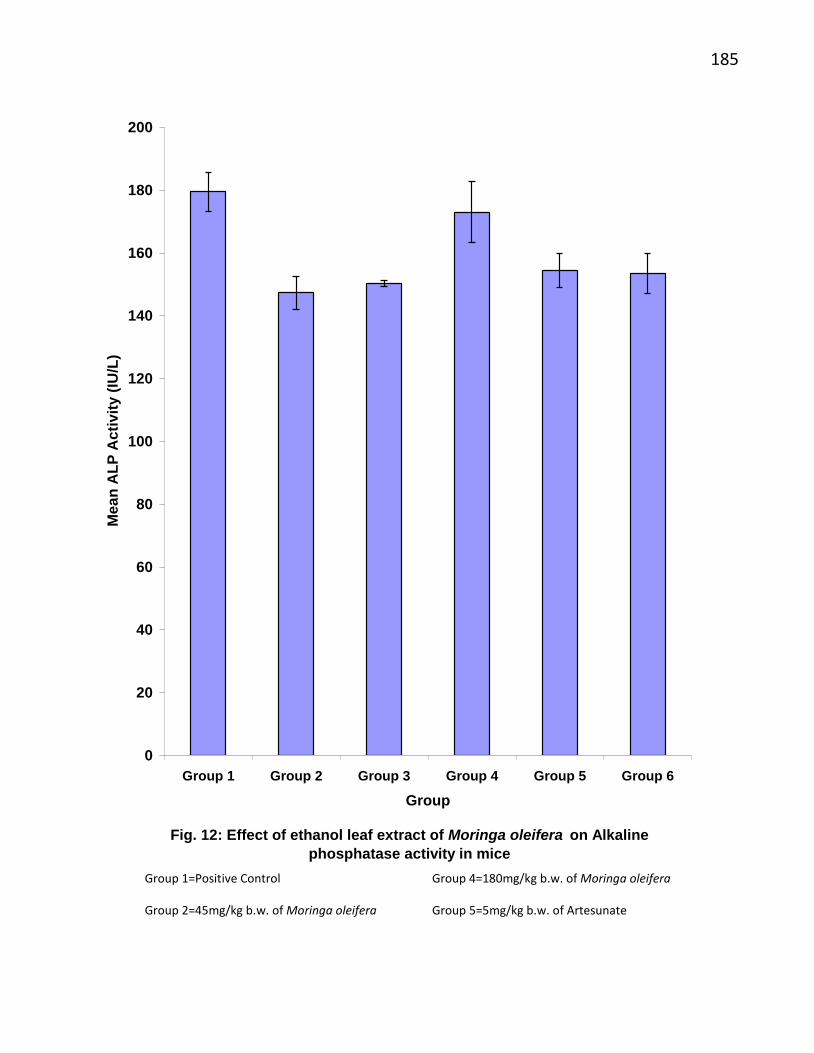
185
Fig. 12: Effect of ethanol leaf extract of Moringa oleifera on Alkaline
phosphatase activity in mice
0
20
40
60
80
100
120
140
160
180
200
Group 1 Group 2 Group 3 Group 4 Group 5 Group 6
Group
Me
an
AL
P A
cti
vit
y (
IU/L
)
Group 1=Positive Control Group 4=180mg/kg b.w. of Moringa oleifera
Group 2=45mg/kg b.w. of Moringa oleifera Group 5=5mg/kg b.w. of Artesunate
Group 3=90mg/kg b.w. of Moringa oleifera Group 6=Negative Control
186
3.14 Effect of Ethanol Leaf Extract of Moringa oleifera on Total Cholesterol
Concentration in Mice
Fig. 13 shows that on day 28 of post treatment mean total cholesterol
concentration for mice in groups 2, 3, 4 and 5 were non-significantly (p>0.05) lower
than the values for mice in groups 1 (positive control) and 6 (negative control).

187
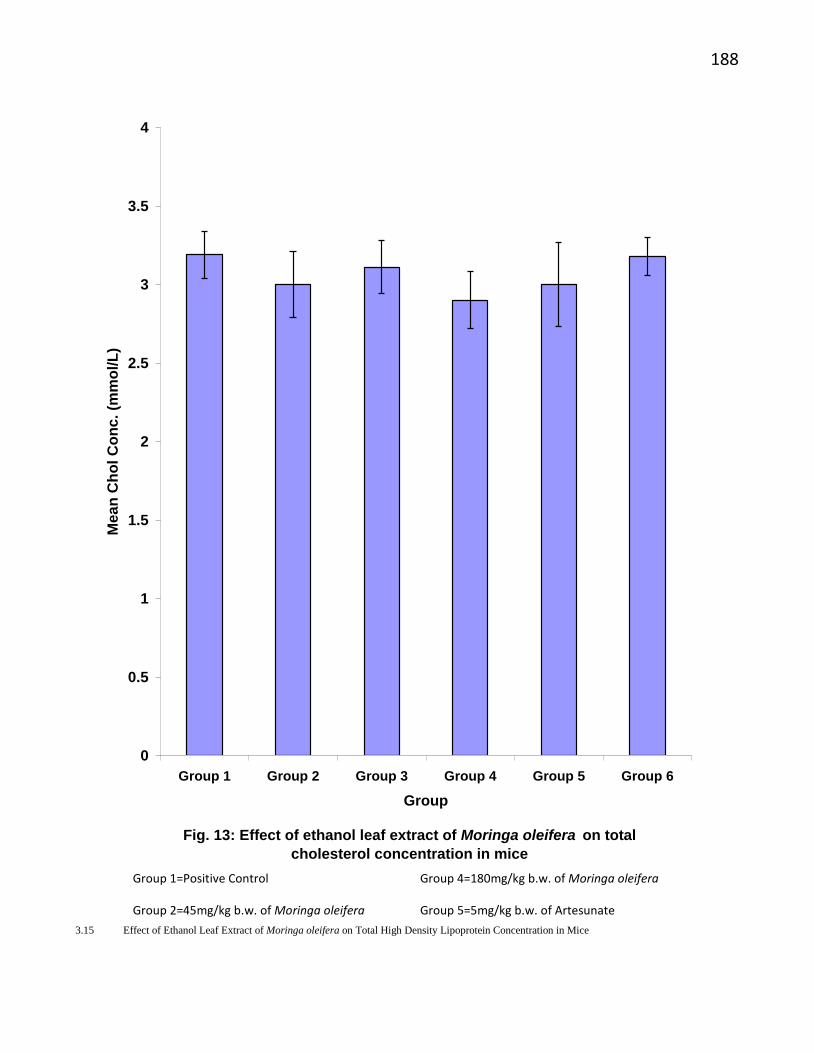
188
Fig. 13: Effect of ethanol leaf extract of Moringa oleifera on total
cholesterol concentration in mice
0
0.5
1
1.5
2
2.5
3
3.5
4
Group 1 Group 2 Group 3 Group 4 Group 5 Group 6
Group
Me
an
Ch
ol
Co
nc
. (m
mo
l/L
)
3.15 Effect of Ethanol Leaf Extract of Moringa oleifera on Total High Density Lipoprotein Concentration in Mice
Group 1=Positive Control Group 4=180mg/kg b.w. of Moringa oleifera
Group 2=45mg/kg b.w. of Moringa oleifera Group 5=5mg/kg b.w. of Artesunate
Group 3=90mg/kg b.w. of Moringa oleifera Group 6=Negative Control
189
Fig. 14 shows that on day 28 of post-treatment, there was a non-significant
(p>0.05) increase in the high density lipoprotein (HDL) concentration of the mice in all
the test groups administered graded doses of the extract (45, 90 and 180 mg/kg body
weight) when compared to the HDL concentration of mice in the three control groups
(positive, negative and standard). In the same vein, the HDL concentration of mice in
groups 5 (standard control) and 6 (negative control) decreased compared to the HDL
concentration of mice in group 1 (positive control). However, such decrease was found
to be non-significant (p>0.05) as shown in Fig. 14.

190
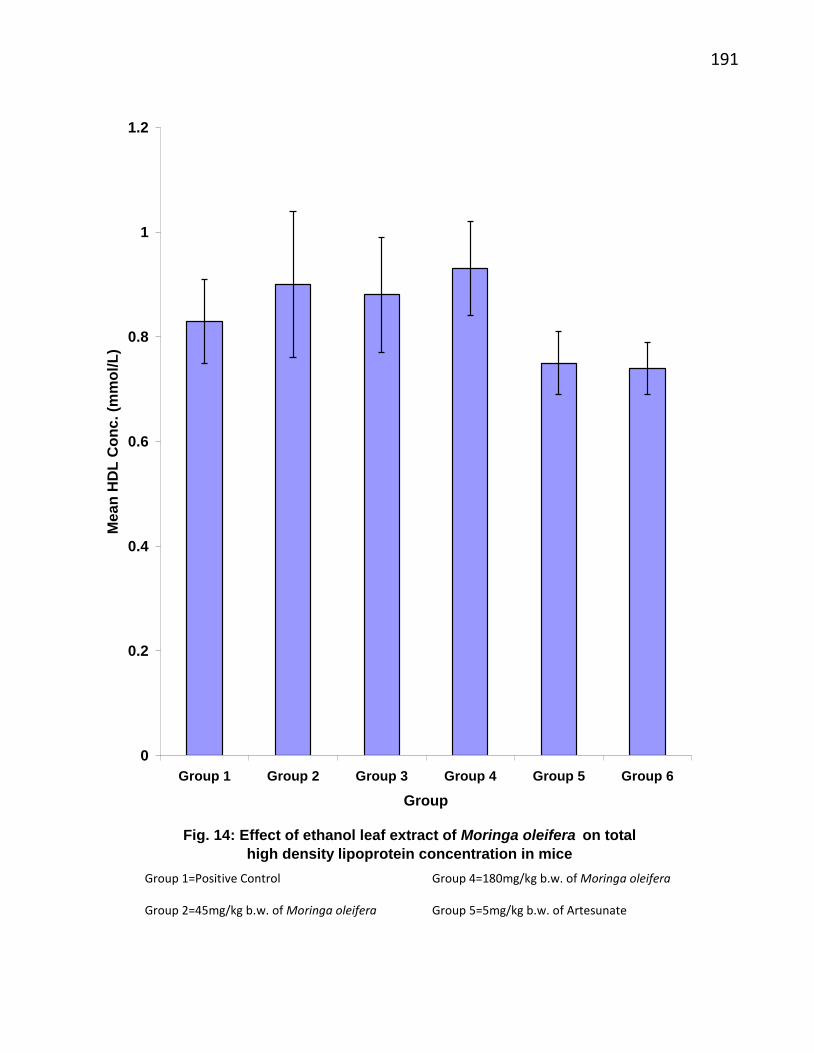
191
Fig. 14: Effect of ethanol leaf extract of Moringa oleifera on total
high density lipoprotein concentration in mice
0
0.2
0.4
0.6
0.8
1
1.2
Group 1 Group 2 Group 3 Group 4 Group 5 Group 6
Group
Me
an
HD
L C
on
c.
(mm
ol/
L)
Group 1=Positive Control Group 4=180mg/kg b.w. of Moringa oleifera
Group 2=45mg/kg b.w. of Moringa oleifera Group 5=5mg/kg b.w. of Artesunate
Group 3=90mg/kg b.w. of Moringa oleifera Group 6=Negative Control
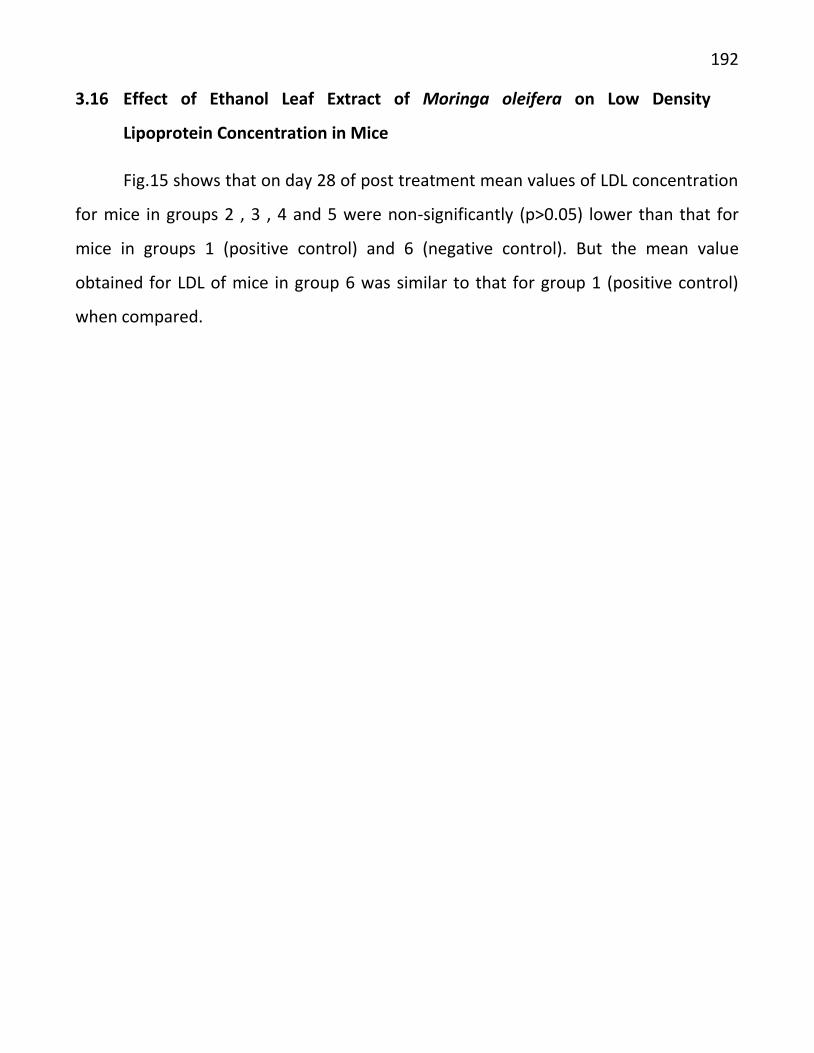
192
3.16 Effect of Ethanol Leaf Extract of Moringa oleifera on Low Density
Lipoprotein Concentration in Mice
Fig.15 shows that on day 28 of post treatment mean values of LDL concentration
for mice in groups 2 , 3 , 4 and 5 were non-significantly (p>0.05) lower than that for
mice in groups 1 (positive control) and 6 (negative control). But the mean value
obtained for LDL of mice in group 6 was similar to that for group 1 (positive control)
when compared.
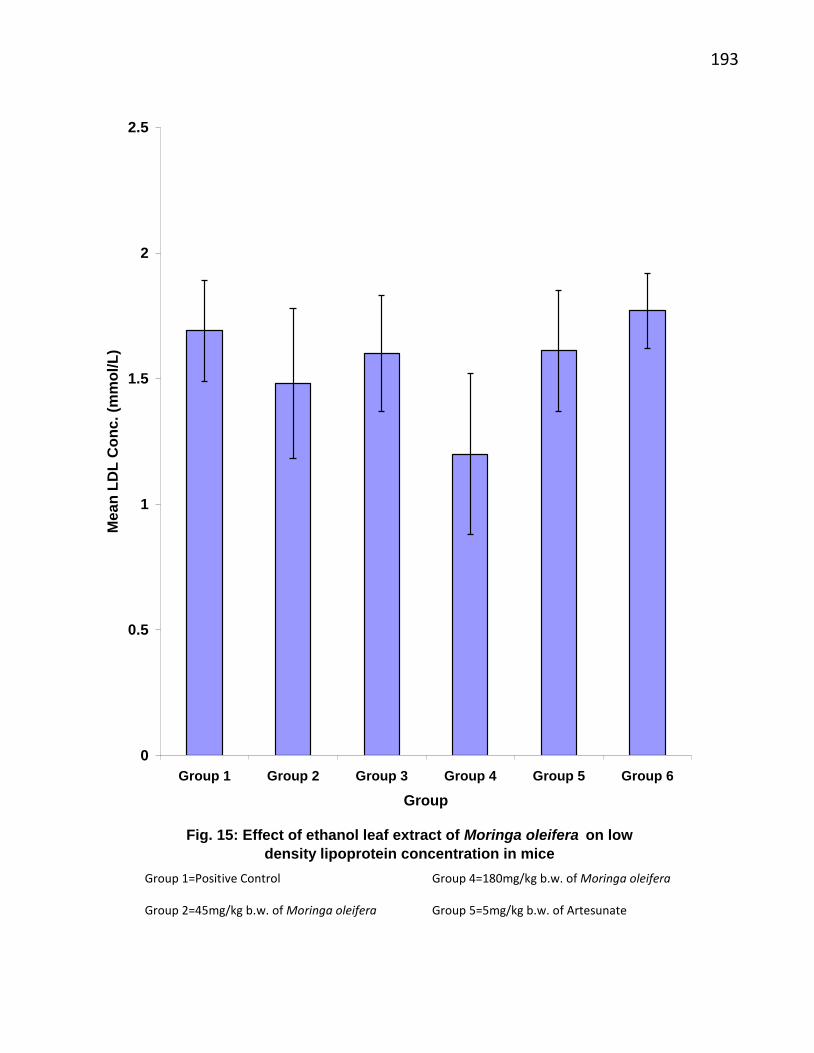
193
Fig. 15: Effect of ethanol leaf extract of Moringa oleifera on low
density lipoprotein concentration in mice
0
0.5
1
1.5
2
2.5
Group 1 Group 2 Group 3 Group 4 Group 5 Group 6
Group
Me
an
LD
L C
on
c.
(mm
ol/
L)
Group 1=Positive Control Group 4=180mg/kg b.w. of Moringa oleifera
Group 2=45mg/kg b.w. of Moringa oleifera Group 5=5mg/kg b.w. of Artesunate
Group 3=90mg/kg b.w. of Moringa oleifera Group 6=Negative Control
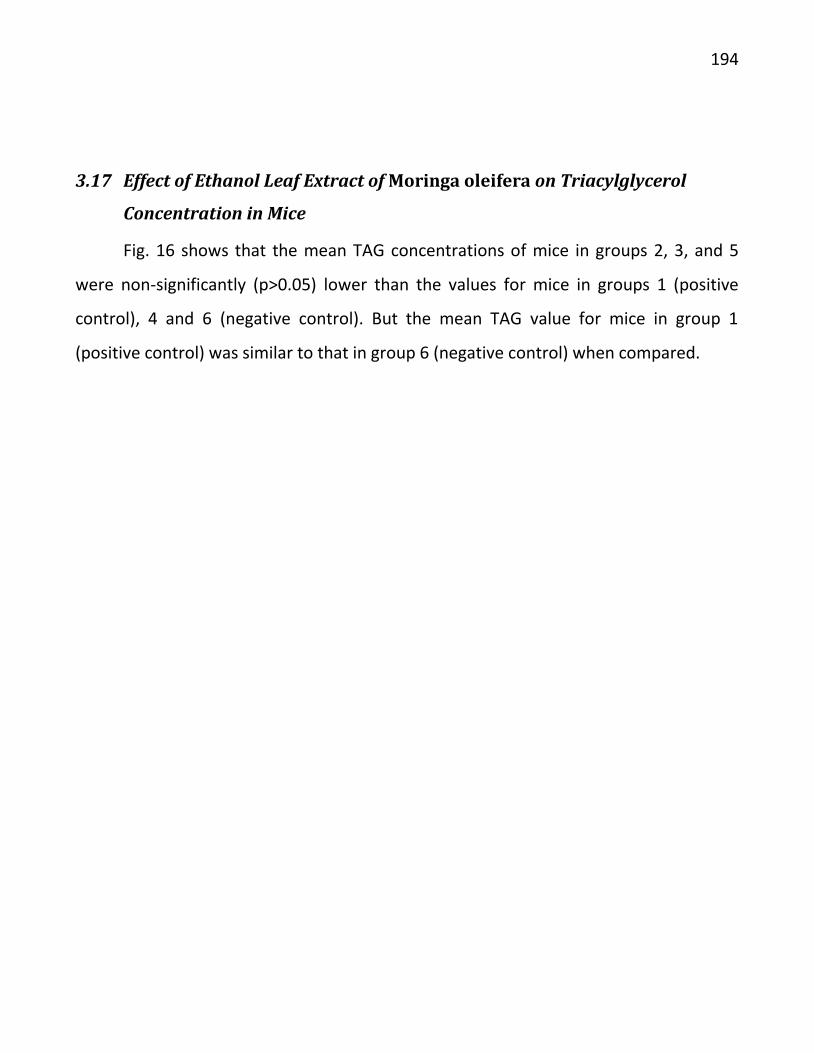
194
3.17 Effect of Ethanol Leaf Extract of Moringa oleifera on Triacylglycerol
Concentration in Mice
Fig. 16 shows that the mean TAG concentrations of mice in groups 2, 3, and 5
were non-significantly (p>0.05) lower than the values for mice in groups 1 (positive
control), 4 and 6 (negative control). But the mean TAG value for mice in group 1
(positive control) was similar to that in group 6 (negative control) when compared.

195
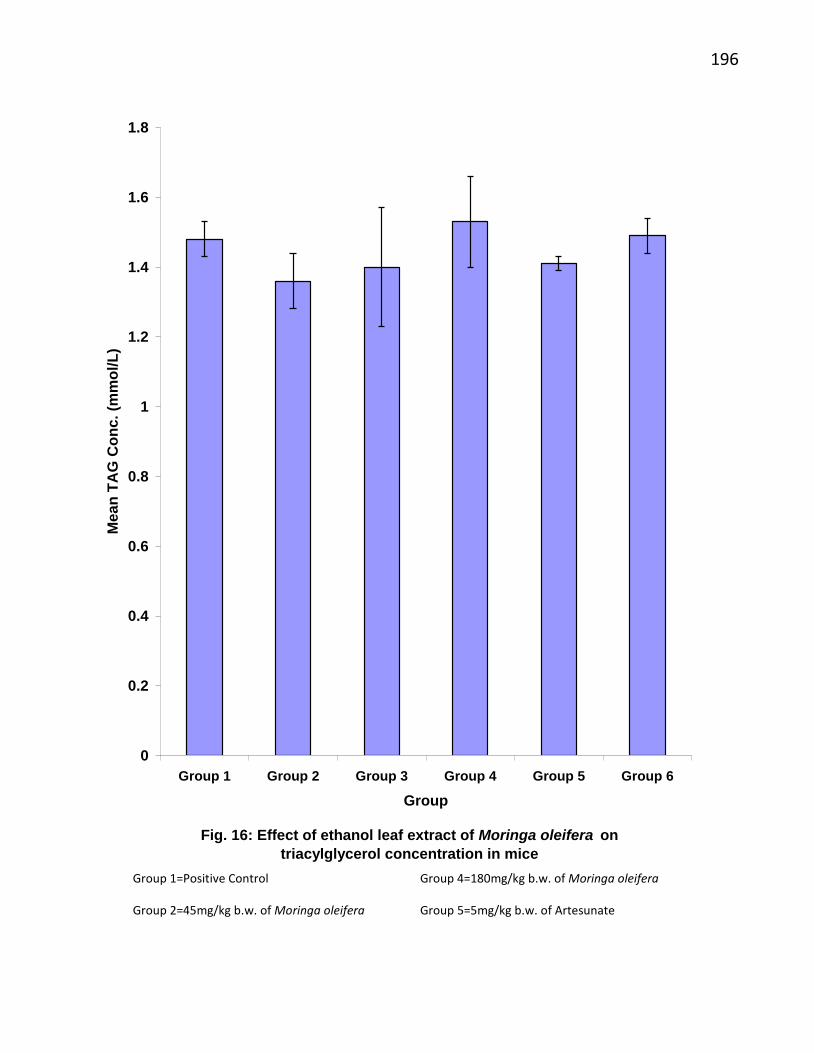
196
Fig. 16: Effect of ethanol leaf extract of Moringa oleifera on
triacylglycerol concentration in mice
0
0.2
0.4
0.6
0.8
1
1.2
1.4
1.6
1.8
Group 1 Group 2 Group 3 Group 4 Group 5 Group 6
Group
Me
an
TA
G C
on
c.
(mm
ol/
L)
Group 1=Positive Control Group 4=180mg/kg b.w. of Moringa oleifera
Group 2=45mg/kg b.w. of Moringa oleifera Group 5=5mg/kg b.w. of Artesunate
Group 3=90mg/kg b.w. of Moringa oleifera Group 6=Negative Control
197
CHAPTER FOUR
DISCUSSION
Malaria is a major public health problem and cause of much suffering and premature death in the
poorer areas of the Tropical Africa, Asia and Latin America. Human beings are exposed to malaria
through the bite of an infected female anopheles mosquito, blood transfusion and congenitally from
mother to her child (Bruce, 1981). In many endemic areas, it is becoming difficult to control, because
of the parasite resistance to antimalarial drugs and the failure of vector control measures. Due to
resistance to some of the conventional drugs used for the treatment of malaria and the impact of
malaria to world health, it is therefore necessary to search for new, cheap and easily available drug that
will be used for the treatment of malaria (Dondorp, 2007). The medicinal uses of many plants like
Moringa oleifera cannot be over-emphasised. The choice of this plant for the research work was based
on its numerous ethnomedicinal properties. The results from the phytochemical studies of the ethanol
leaf extract of Moringa oleifera indicated the presence of flavonoids, steroids, tannins, carbohydrates,
saponins, glycosides, alkaloids and phenols which may play a role in the metabolism of the plant. The
LD50 of the extract was found to be less than 5000 mg/kg but more than 2,600mg/kg body weight of the
extract.
The observation on the effect of ethanol leaf extract of Moringa oleifera on percentage parasitaemia in
mice showing a significant (p<0.05) clearance of parasitaemia in group 4 (180mg/kg body weight of
the extract) and group 5 (5mg/kg body weight of artesunate) when compared to group 1 (positive
control) is consistent with the findings of Monzon (1995) in Phillipines, who administered Moringa
oleifera leaf extract in mice that were infected with malaria and other parasitic diseases.The result
showed that the extract might be effective against the parasites. The result also showed a significant
increase (p<0.05) in parasitaemia in group 1 (positive control) treated with 5mg/kg distilled water
which could lead to the destruction of the liver, blood cells, kidney and other vital organs in the mice
(Trampuz et al., 2003). This could be as a result of the infection of the liver by the sporozoites and the
resultant multiplication of the merozoites in the blood cells.
The result of the effect of ethanol leaf extract of Moringa oleifera on the haematological parameter of
packed cell volume showed a non significant difference in packed cell volume (p>0.05) in group 4 (180
mg/kg body weight of the extract) and group 5 (5 mg/kg body weight of the artesunate) compared to
198
group 6 (negative control). But, a significant reduction (p<0.05) in packed cell volume was
observed in group 1 (positive control) when compared to group 6 (negative control). This showed that
Moringa oleifera ethanol leaf extract has ameliorated the effect of malaria parasitaemia on the packed
cell volume. This agrees with the work of Ambi et al., (2006) who showed that Moringa oleifera leaf
extract boosted heamatological parameters of packed cell volume in rats. Packed cell volume is used to
asses anaemia, erythrocytosis, haemodilution and haemoconcentration.A decrease in packed cell
volume indicates anaemia (Dacie and Lewis, 2000).
The result of the effect of ethanol leaf extract of Moringa oleifera on red blood cell count showed a non
significant difference (p>0.05) in group 4 (180 mg/kg body weight of the extract) compared to group 6
(negative control).This, also corroborates with the work of Ambi et al. ,(2006) showing that Moringa
oleifera leaf extract boost red blood cell counts in rats.. There was a significant increase (p<0.05) in red
blood cell count in group 4 (180mg/kg body weight of the extract) when compared to group 1 (positive
control) . A decrease in red blood cell could be as a result of anaemia (Dacie and Lewis, 2000).
Moringa oleifera ethanol leaf extract has probably repaired the damages caused by merozoites to the
red blood cell in mice that were infected with malaria.
The effect of ethanol leaf extract of Moringa oleifera on haemoglobin concentration in mice showed a
significant increase (p<0.05) in haemoglobin in group 4 (180 mg/kg body weight of the extract), group
5 (5mg/kg body weight of the artesunate) and group 6 (negative control) when compared to group 1
(positive control). But, group 4 (180mg/kg body weight of the extract) and group 5 (5 mg/kg body
weight of the artesunate) showed no significant difference (p>0.05) in haemoglobin concentration
when compared to group 6 (negative control). This corroborated with the work of Ambi et al. (2006)
who showed that Moringa oleifera leaf extract boosted haemoglobin concentration in rat. A complete
blood count is used to asses symptoms such as weakness, fatigue, anaemia, infection and other
disorders. Haemoglobin molecule fills up the red blood cells. It transports oxygen and gives the blood
cell its red colour. The higher the haemoglobin concentration, the higher its ability to transport oxygen
throughout the body.
The effect of ethanol leaf extract of Moringa oleifera on total white blood cell count showed a
significant increase (p<0.05) in total white blood cell count in other groups when compared to group 1
(positive control) .The Moringa oleifera ethanol leaf extract increased the total white blood cell in
group 2 (45 mg/kg body weight of the extract), group 3 (90 mg/kg body weight of the extract) and
199
group 4 (180 mg/kg body weight of the extract) when compared to group 1 (positive control). This
is also consistent with the work of Ambi et al., (2006) that showed the potency of Moringa oleifera leaf
extract in increasing white blood cell counts in rat. This could be the reason for reduced parasitaemia in
groups 2 (45mg/kg body weight of the extract) and group 3 (90 mg/kg body weight of the extract) and
total clearance of the parasitaemia in group 4 (180 mg/kg body weight of the extract) and group 5 (5
mg/kg body weight of the artesunate).
The effect of ethanol leaf extract of Moringa oleifera on serum creatinine concentration in mice
showed a significant decrease (p<0.05) in serum creatinine concentration in groups ( 2,3,4,5 and 6)
treated with 45,90,180 mg/kg body weight of the extract ,5mg/kg body weight of artesunate and
5mg/kg body weight of distilled water respectively were compared to group 1 (positive control).This
showed that the ethanol leaf extract of Moringa oleifera has reduced the level of serum creatinine in
group 2 (45 mg/kg body weight of the extract) ,group 3 (90 mg/kg body weight of the extract) and
group 4 (180 mg/kg body weight of the extract) thereby ameliorating the effects of malaria
parasitaemia on the kidney. There was no significant difference (p>0.05) in serum creatinine when
group 4 (180 mg/kg body weight of the extract) was compared to group 3 (90 mg/kg body weight of
the extract) and group 2 (45 mg/kg body weight of the extract). This is in line with the findings of
Mazumder et al. (1999) who showed the hepatorenal function of Moringa oleifera on mice.
The effect of ethanol leaf extract of Moringa oleifera on urea concentration in mice showed a non
significant difference (p>0.05) in urea concentration in groups (2, 3, 4, 5 and 6) treated with with 45,
90, 180 mg/kg body weight of the extract, 5mg/kg body weight of artesunate and 5mg/kg body weight
of distilled water respectively were compared to group 1 (positive control). This showed that malaria
had no effect on urea concentration. But there was a significant decrease (p<0.05) in urea concentration
when group 2 (45mg/kg body weight of the extract) and group 4 (180 mg/kg body weight of the
extract) were compared to group 6 (negative control). This corroborates with the work of Mazumder et
al. (1999) showing the potential effects of the ethanol leaf extract of Moringa oleifera on ameliorating
renal dysfunctions.
The effect of ethanol leaf extract of Moringa oleifera on alanine aminotransferase activity in mice
showed a significant decrease (p<0.05) in alanine aminotransferase in groups (3,4,5 and 6 ) treated
with 90, 180 mg/kg body weight of the extract ,5mg/kg body weight of artesunate and 5mg/kg body
weight of distilled water respectively were compared to the alanine aminotransferase of group 1
200
(positive control) and group 2 (45 mg/kg body weight of the extract). Alanine aminotransferase in
conjuction with aspartate aminotransferase is usually used to diagnose hepatocellular injury and
diseases. Alanine aminotransferase is cytosolic and is present in large concentrations in liver and, in
less amount in kidney, heart and skeletal muscle (Johnston, 1999). It is therefore a more specific liver
marker than aspartate aminotransferase (Song et al., 2004). This confirms the damage that was done to
the liver as a result of the malaria infection. But group 3 (90 mg/kg body weight of the extract), group 4
(180 mg/kg body weight of the extract) and group 5 (5 mg/kg body weight of the artesunate) all
showed no significant difference (p>0.05) in alanine aminotransferase compared to group 6 (negative
control). This showed the ameliorative effect of the liver damage by the Moringa oleifera ethanol leaf
extract as a result of the malaria parasitaemia. This agrees with the findings of Fakurazi et al. (2008)
and Alaaeldin (2009) that showed the preventive and ameliorative effects of Moringa oleifera on liver
injury and damages.
The effect of ethanol leaf extract of Moringa oleifera on aspartate aminotransferase activity in mice
showed no significant difference (p>0.05) in aspartate aminotransferase when group 6 (negative
control) was compared to other groups including group 1(positive control).This showed that malaria
parasitaemia, the extract and artesunate did not affect the aspartate aminotransferase activity in the
mice.
The effect of ethanol leaf extract of Moringa oleifera on alkaline phosphatase activity in mice showed a
significant decrease (p<0.05) in alkaline phosphatase in all the groups compared to group 1 (positive
control) and group 4 (180 mg/kg body weight of the extract). Alkaline phosphatase is present in all the
tissues throughout the body, but is particularly concentrated in the liver, bile duct, kidney, bone and the
placenta. It is therefore not a specific liver marker. This result showed that malaria parasitaemia had
effect on the alkaline phosphatase activity in the mice. But, in group 4 (180 mg/kg body weight of the
extract) the elevated level of alkaline phosphatase could be as a result of active bone formation
occurring as alkaline phosphatase is a by-product of osteoblast activity. But, group 2 (45 mg/kg body
weight of the extract) and group 3 (90 mg/kg body weight of the extract) showed a significant
reduction (p<0.05) in alkaline phosphatase which corroborated with the findings of Alaaeldin (2009)
and Fakurazi et al. (2008) who showed ameliorative effects of Moringa oleifera leaf extract on liver
injury.
201
The effect of ethanol leaf extract of Moringa oleifera on total bilirubin in mice showed a
significant decrease (p<0.05) in total bilirubin concentration of all the groups compared to the total
bilirubin concentration of group 1 (positive control) and group 2 (45 mg/kg body weight of the extract)
. This could be as a result of liver damage by the malaria parasitaemia. But in group 3 (90 mg/kg body
weight of the extract) and group 4 (180 mg/kg body weight of the extract) both showed a significant
reduction (p<0.05) in total bilirubin thereby ameliorating the effect of malaria on the liver. This agrees
with the findings of Alaaeldin (2009) and Pari and Kumar (2002) which showed the protective effects
of Moringa oleifera extract on the liver.
The effect of ethanol leaf extract of Moringa oleifera on total cholesterol concentration in mice
showed a non significant difference (p>0.05) in all the groups compared to group 6 (negative control).
This indicated that malaria had no effect on total cholesterol concentration of the mice. But, there was
non-significant decrease (p>0.05) in total cholesterol of group 2 (45 mg/kg body weight of the extract),
group 3 (90 mg/kg body weight of the extract), group 4 (180 mg/kg body weight of the extract) and
group 5 (5 mg/kg body weight of the artesunate) animals compared to group 6 (negative control)
animals. This result agrees with the works of Ghasi et al. (2000) and Mehta et al. (2003). Cholesterol is
essential for all animals’ life, high levels in blood circulation, depending on how it is transported within
lipoprotein, are strongly associated with progression of artherosclerosis and other cardiovascular
diseases.
The effect of ethanol leaf extract of Moringa oleifera on high density lipoprotein concentration in mice
showed non-significant difference (p>0.05) in high density lipoprotein concentration of all the groups
mice compared to the high density lipoprotein concentration of mice in group 6 (negative control). But,
there was a non-significant increase (p>0.05) in high density lipoprotein concentrations of group 2
(45mg/kg body weight of the extract), group 3 (90mg/kg body weight of the extract) and group 4
(180mg/kg body weight of the extract) mice. These are consistent with the work of Ghasi et al. (2000)
and Mehta et al. (2003). High density lipoprotein particles transport cholesterol back to the liver for
excretion or to other tissues that use cholesterol to synthesize hormones. So, having high concentrations
of high density lipoprotein correlated with better health outcomes.
The effect of ethanol leaf extract of Moringa oleifera on low density lipoprotein concentration in mice
showed a non-significant difference (p>0.05) in low density lipoprotein concentration of mice in all
the groups compared to the low density lipoprotein concentration of mice in group 6 (negative
202
control).However, there was a non-significant decrease (p>0.05) in low density lipoprotein (LDL)
concentration of groups 2 (45 mg/kg body weight of the extract), group 3 (90mg/kg body weight of the
extract), group 4 (180mg/kg body weight of the extract) and group 5 (5mg/kg body weight of the
artesunate) mice compared to group 6 (negative control). These findings are in line with the work of
Ghasi et al. (2000) and Mehta et al. (2003). High concentration of low density lipoprotein
(hypercholesterolemia) and lower concentration of functional high density lipoprotein are strongly
associated with cardiovascular diseases because these promote antheroma development in arteries
(antherosclerosis). This disease process leads to myocardial infarction (heart attack), stroke and
peripheral vascular diseases. Since higher low density lipoprotein particle concentrations and smaller
low density lipoprotein particle size contribute to this process more than the cholesterol content of the
low density lipoprotein particles, low density lipoprotein particles are called bad cholesterol because
they have been linked to antheroma formation. On the other hand, high concentrations of functional
high density lipoprotein, which can remove cholesterol from cells and antheroma, offer protection and
are referred as good cholesterol.
The effect of ethanol leaf extract of Moringa oleifera on triacylglycerol concentration in mice showed a
non significant difference (p>0.05) in triacylglycerol in all the groups compared to the triacylglycerol
concentration of mice in group 6 (negative control). This showed that malaria had no effect on the
triacylglycerol concentration in the mice.But there was a non significant decrease (p>0.05) in
triacylglycerol concentration in group 2(45mg/kg body weight of the extract), group 3 (90mg/kg body
weight of the extract) and group 5 (5mg/kg body weight of the artesunate) when compared to group 1
(positive control) and these are consistent with the works of Ghasi et al. (2000) and Mehta et al.
(2003). Triacylglycerol (TAG) is a major component of very low density lipoprotein and chylomicrons
which play important role in metabolism as energy sources and transporters of dietary fats (Mehta et
al., 2003).
4.2 Conclusion
In conclusion, the results shown in this work indicate that ethanol leaf extract of Moringa oleifera
might have some antimalarial properties. The extract cleared parasitaemia in mice that were infected
with malaria. This research work also suggests that the ethanol leaf extract of Moringa oleifera
(Agbaji) has the potential or efficacy of boosting the haematological parameters. These help in the
protection of the liver, kidney and other vital organs from damages due to malaria parasitaemia. The
extract helped in ameliorating the adverse effect of malaria on the liver and kidney of the mice. The
203
extract was found to have non-significant effects on lipid metabolism. These findings support the
reports that Moringa oleifera commonly known as Agbaji is used for the local treatment of malaria
and is an important ingredient of polyherbal formulations marketed for the treatment of malaria and
other parasitic diseases. Therefore, leaf extract of Moringa oleifera should be encouraged as an
efficacious drug for malaria.
4.3 Suggestions for Further Research
1. Comparative analyses of antimalarial effect of ethanol leaf extract of Moringa oleifera singly
and in combination with another known antimalarial drugs should be carried out.
2. Comparative analyses of all the different parts of Moringa oleifera tree should be analysed in
order to determine the part with highest antimalaria potency.
3. Effect of the ethanol leaf extract of Moringa oleifera on protein and carbohydrate metabolism
should be carried out.
4. A thorough research on whether the ethanol leaf extract of Moringa oleifera is best for
chemotherapy and chemoprophylaxis of malaria should be assayed.
5. The plant extract should be used in a more purified form.
6. REFERENCES
7.
8. Adams, S., Brown, H. and Turner, G. (2002). Breaking down the blood-brain
barrier. Signaling a path to cerebral malaria. Trends in Parasistol, 18: 6-360.
9.
10. Alaaeldin, A.H. (2009). Ameliorative effects of Moringa oleifera Lam. Seed extract
on liver fibrosis in rats. Foochem Toxicol, 50: 4-6.
11.
12. Albers, J. J., Warmick, G. R. and Cheng, M. C. (1978). Determination of high
density lipoprotein (HDL)–cholesterol. Lipids, 13: 926–932.
13.
14. Allain, C. C., Poon, L. S., Chan, C. S. G., Richmond, W. and Fu, P. C. (1976).
Enzymatic determination of serum total cholesterol. Clinical Chemistry, 20: 470–
475.
204
15.
16. Amador, R. and Patarroyo, M.E. (1996). Malaria vaccines. J. Clin. Immunol,
16:183-189.
17.
18. Ambi, A.A., Abdurahman, E.M. Ibrahim, N.D., Pateh, U.U. and Sule, I. (2006).
Metal Constituents and effect of Moringa oleifera leaf extract on some
hematological parameters in rat. Journal of Pharmacy and Bioresources, 3: 102.
19.
20. Anamika, G., Manish, K.G., Rahul, K.S., Kumar, V.M., Rao, C.V., Goel, R.K. and
Shampa, A. (2010). Immunomodulatory effect of Moringa oleifera Lam extract on
cyclophosphamide induced toxicity in mice. Indian Journal of Experimental
Biology, 48:1157-1160.
21. 22. Anwar, F., Latir, S., Ashraf, M. and Gilan, A. (2007). Moringa oleifera a food with multiple
medicinal uses. Phytother Res, 21: 17-25.
23. Assmann, G., Jabs, H. U., Kohnert, U., Nolte, W. and Schriewer, H. (1984). Determination of
low density lipoprotein (LDL)–cholesterol. Clinica Chimica Acta, 140: 77–83.
24. Beare, N.A., Taylor, T.E., Harding, S.P., Lewallen, S. and Molyneux, M.E. (2006).
Newly established diagnostic Signs in severe malaria. Am. J. Tropical Medical
Hygiene, 5: 7-20.
25.
26. Biovin, M.J. (2002). Effects of early Cerebral malaria on cognitive ability in
Senegalese Children. J. Den. Behav. Pediatr, 5: 64-353.
27.
28. Bodeker, G. and Willcox, M. (2000). New research initiative on a plant based
antimalarials. Lancet, 355: 761-780.
29.
30. Boland, P.B. (2001). Drug resistance in malaria. Journal of Medicine, 20: 32-40.
205
31.
32. Bruce, C.L. (1981). Alphonse Laveran’s discovery 100 years ago and today’s global
fight against malaria. J.R. Soc Med, 74: 531-600.
33. Caceres, A., Cabrera, O., Morales, O., Mollinedo, P. and Mendia, P. (1991).
Pharmacological properties of Moringa Oleifera. Preliminary screening of
antimicrobial activity. J. Ethnopharmacol, 36: 233-237.
34.
35. Clark, I.A. and Cowden, W. B. (2003). The Pathophysiology of Falciparum malaria.
Pharmacology and Therapeutics, 99: 221-260.
36.
37. Cox, F. (2002). History of human parasitology. Clinical Microbiology Review, 15:
595-612.
38.
39. Dacie, J.V. and Lewis, S.M. (2000). Practical Haematology. 9th Edition Churchill
Livingstone.
40.
41. Dondorp, A.M (2007). The treatment of Severe Malaria. Trans R Soc Trop Med
Hyg, 101: 633-634.
42.
43. Dondorp, A.M., Fanello, C.L. and Hendriksen, I.C. (2010). Artesunate versus
quinine in the treatment of severe Falciparum malaria in Africa children. Lancet,
373: 57-1647.
44.
45. Fakurazi., Hairuszah, I. And Nanthini, U. (2008). Moringa oleifera Lam, Prevents
acetaminophen induced liver injury through the restoration of glutathione level.
Food Chem Toxicol, 4: 1-3.
206
46.
47. Foidl, N., Makkar, H. and Becker, K. (2001). The miracle tree: The multiple uses of
Moringa wageningen, Netherlands. pp. 45- 76.
48.
49. Fuglie, L. (2001). The miracle Tree. The multiple Attributes of Moringa, Dakar. Pp.
25-30.
50.
51. Gardner, I., Mallom, O., Tettelin, H., Carucci, D.J., Cummings, L.M., Aravind, L.,
Koonin, E.V., Shallom, S.and Mason, S. (1998). Chromosome. –2- sequence of the
human malaria Plasmodium Falciparum. Science, 282: 1126-1132.
52.
53. Ghasi, S., Nwobodo, E. and Ofili, J.O. (2000). Hypocholesterolemic effects of
crude extract of Leaf of Moringa oleifera Lam. In high fat diet fed Wistar rats,
Journal of Experimental Biology, 21:12-14.
54.
55. Harborne, J.B. (1973). Phytochemical Methods: A Guide to Modern Technique of
Plant Analysis. Chapman and Hall. Thompson Science, London. Pp 107.
56.
57. Humphreys, M. (2001). Malaria: Poverty, Race and Public Health in the United
States. John Hopkins University Press. pp. 256-270.
58.
59. Hyde, J.E. (2007). Drug – resistant malaria, an insight. FEBS Journal, 274: 4688-
4698.
60.
61. Idro, R., Jenkins, N.E. and Newton, C.R.J.C. (2005). Pathogenesis, clinical features
and neurological outcome of cerebral malaria. The Lancet Neurology, 7: 827-840.
207
62. 63. James, L.A. and Webb, J.(2009). A Global History of malaria. Cambridge University Press
pp.20-30.
64.
65. Jendrasskik, J. and Grof. P. (1938). In vitro determination of total and direct
bilirubin in serum or plasma. Biochemistry, 297: 81–89.
66.
67. Johnston, D. E. (1999). Special Considerations in Interpreting Liver function Test:
American Academy of Family Physical.
68.
69. Kilama, W. and Ntoumi, F. (2009). A research agenda for the eradication of
malaria. Lancet, 374: 2-1480.
70.
71. Kilama, W. and Ntoumi, F. (2009) Malaria: A research agenda for the eradication
era. Lancet, 374: 1480-1482.
72.
73. Klein, B., Read, P.A. and Babson, L.A. (1960). In vitro determination of alkaline
phosphate in serum or plasma. Clinical Chemistry, 6: 269-275.
74.
75. Lorke, D. (1989) A new approach to practical acute toxicity testing. Archive of
Toxicology, 54: 275-287.
76.
77. Mackintosh, C.L. Beeson, J.G. and Marsh, K. (2004). Clinical features and
pathogenesis of severe malaria, Trends in Parasitology, 20: 597-603.
78.
79. Makkar, H. and Becker, K. (2007). Nutrients and anti-quality factors in different
morphological parts of the Moringa Oleifera tree. Journal of Agricultural Science,
123: 311-322.
208
80.
81. Mazumder, U.K., Gupta, M., Chakrabarti, S. and Pal, O. (1999). Evaluation of
hematological and hepatorenal functions of methanolic extract of Moringa
Oleifera Lam. root treated Mice. Food Chem Toxicol, 37: 612-614.
82.
83. Mc Cutchan, O., Thomas, F., Robert, C. and Michale, T.M. (2008). “Use of Malaria
Rapid Diagnostic Test to identify Plasmodium Knowlesi infection” Centers for
Disease Control, 11: 17-50-1752.
84.
85. Mehta, K., Balaraman, R., Amin, A.H., Bafna, P.A. and Gulati, O.D. (2003). Effect
of fruits of Moringa oleifera on lipid profile of normal and hypercholesterolaemic
rabbits. Journal of Ethnopharmacology, 86: 5–191.
86.
87. Miller, L.H., Baruch, D.I., Marsh, K. and Doumbo, O.K. (2002). The pathogenic
basis of malaria. Nature 415: 673 – 679.
88.
89. Mino, G. and Gros. (2005). Erythrocyte variants and nature of their malaria
protective effect. Cellular Microbiology, 7: 752-763.
90.
91. Monzon, R.B. (1995). Traditional medicine in the treatment of parasitic disease in
Philippines. South East Asian Journal of Tropical Medicine, 7: 4-6.
92.
93. Mueller, I., Zimmerman, P.A. and Reeder, J.C. (2007). Plasmodium malariae and
Plasmodium ovale. The bashful malaria parasites. Trends parasistol, 6: 278-290.
94.
209
95. Newton, P. and White, N.J. (1999). New developments in treatments and
prevention of malaria. Annual Medical Review, 2: 50-179.
96.
97. Ogwal, O.J.W. (1998) pharmacology and therapeutics makere university, Kampala. pp. 21- 40.
98. Omulokoli, E., Khan, B. and Chhabra, S.C. (1997). Antiplasmodial activity of four
Kenya medical plants. Journal of Ethnopharmacology, 65: 133-137.
99.
100. Pari, L. and Kumar, N.A. (2002). Hepatoprotective activity of Moringa
oliefera on antitubercular drug-induced liver damage in rats. J. Med Food, 5: 7-
171.
101.
102. Pasvol, G. (2006). The treatment of complicated and severe malaria. British
Medical Bull, 1: 75-76.
103.
104. Phillip and Nicky, O. (2010). Gorillas in the Midst of Malaria Mystery. Journal of
Medicine, 8: 7-0.
105.
106. Phillips, R.S. (2001). Current Status of malaria and potential for control.
Clinical Microbiological Review, 2: 14-208.
107.
108. Redd, S., Kazembe, P., Luby, S., Nwanyanwu, O., Hightower, A., Ziba, C.,
Wirima, J., Chitsulo, L., Franco, C. and Oliver. M. (2002). “Clinical algorithm for
treatment of Plasmodium Falciparum malaria in children”. Lancet , 347: 80-140.
109.
110. Reitman, S. and Frankel, S. (1957). In vitro determination of glutamic-
pyruvic transaminase in serum. American Journal of Clinical Pathology, 28:56.
111.
210
112. Sachs, J. and Malaney, (2002). The economic and social burden of
malaria. Nature, 415: 6-180.
113.
114. Samba, E.M. (1997). The burden of malaria in Africa. Africa Health, 19: 17-
18.
115.
116. Song, Z., Joshi-Barve, S., Barve, S. and McClain, C. J. (2004). Advances in
alcoholic liver disease. Curr Gastroenterol Rep, 6: 71-76.
117.
118. Talman,A.,Domarie, O., Mckenzie, F., Ariey, F. and Robert, V. (2004).
Gametocytogenesis. The Puberty of Plamodium falciparum. Malaria Journal, 3: 24-29.
119.
120. Tietz, N. W. (1994). Textbook of Clinical Chemistry. 2nd Edn. Burtis CA,
Ashwood ER, W.B. Saunders Company, Philadelphia. Pp 751.
121. Trampuz, A., Jereb, M., Muzlovic, I. and Prabhu, R.M. (2003). Clinical
review of severe malaria. Critical Care,7: 315-323.
122.
123. Trease, G.E. and Evans, M.C. (1989). “Textbook of Pharmacognosy” 13th
Edition Bailiere Tindall. Pp. 200 – 775.
124.
125. Warhurst, D.C. and Williams, J.E. (1996). “Laboratory diagnosis of malaria”
J clin. Pathol, 7: 533-38.
126.
127. Warhust. D. (2001). New developments: Chloroquine – resistance in
Plasmodium Falciparum. Drug Resistance updates, 4: 141-150.
128.
211
129. Wellems, T. E. and Plowe, C.V. (2001). Chloroquine – resistant malaria J
Inf Dis , 184: 770-780.
130.
131. Wellems, T.E. (2002). Plasmodium chloroquine resistance and the search
for a replacement antimalarial drug. Science, 298: 6-124.
132.
133. White, N.J. (1996). The treatment of malaria. New England Journal of
Medicine, 5: 335 – 800.
134.
135. White, N.J. (2004). Antimalarial drug resistance. J Clin invest, 113: 92-1084.
136.
137. White, N.J. (2008) Qinghaosu (Artemisinin). The price of success. Science,
320: 330- 334.
138.
139. Willcox, M., Resoanairo, P. and Bodeker, G. (2005). Traditional Medicinal
Plants and Malaria, Harwood press, London. Pp.10-12.
140.
141. Willcox, M.L. (1999). A clinical trial of lam, a Ugandan herbal remedy for
malaria, J Public Health Med, 3: 318-324.
142.
143. Williams, T.N. (2006). Human red blood cell polymorphisms and Malaria.
Current Opinion in Microbiology, 9: 3988-94.
144.
145. Winstainley, P.A. (2000). Chemotherapy for falciparum malaria. The
armoury, problems and the prospects. Parasitology Today, 16: 146-153.
146.
212
147. Wongsrichanalai, C., Pickard, A.L., Wernsdorfer, W. H. and Meshnick,
S.R. (2002). Epidemiology of drug-resistant malaria. Lancet Infect Dis, 2: 209-211.
148.
149. World Health Organization. (1999). The World Health Organization report.
Making a difference. Rolling Back malaria. Pp. 46-61
150.
151. World Health Organization. (2000). Severe falciparum malaria .
Transactions of the Royal Society of Tropical medicine and hygiene, 94: 1-90.
152.
153. World Health Organization. (2005). World malaria Report. Rolling Back
Malaria. Pp. 20-40.
154.
155. Wright, C.W. and Phillipson, J.O.D. (1990). Natural Products and the
development of selective anti-protozoa. Phytotherapy Research, 4: 127-139.
APPENDICES
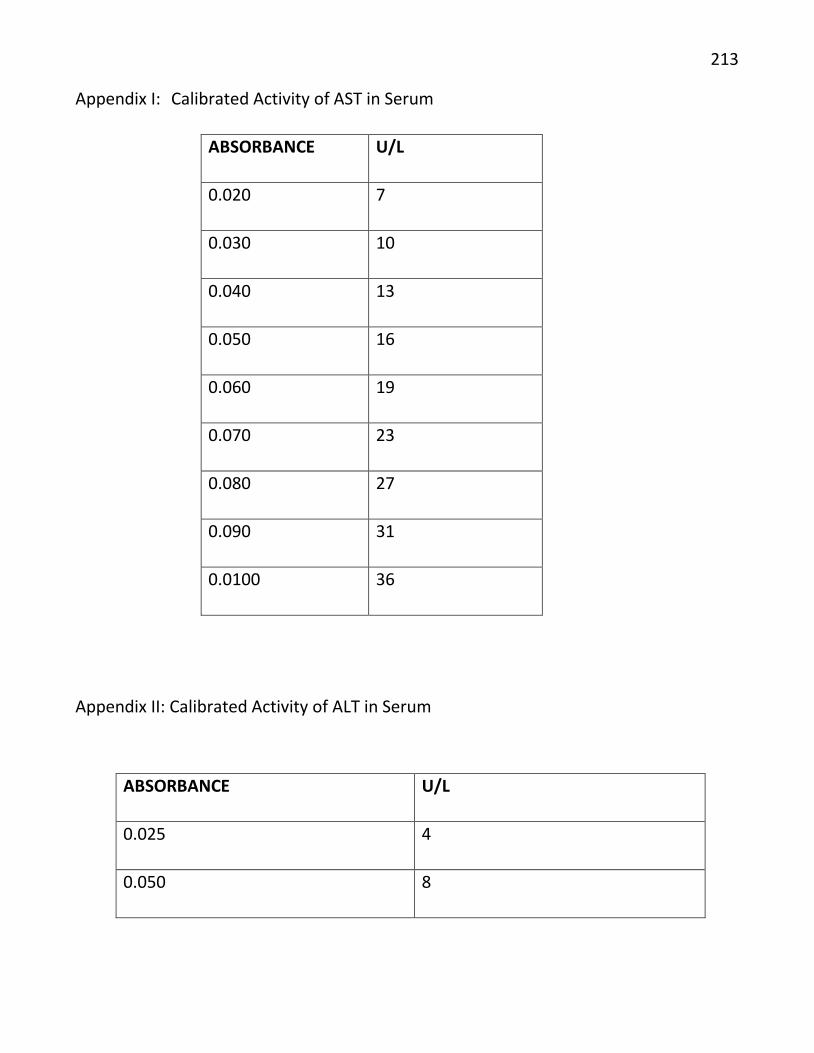
213
Appendix I: Calibrated Activity of AST in Serum
ABSORBANCE U/L
0.020 7
0.030 10
0.040 13
0.050 16
0.060 19
0.070 23
0.080 27
0.090 31
0.0100 36
Appendix II: Calibrated Activity of ALT in Serum
ABSORBANCE U/L
0.025 4
0.050 8
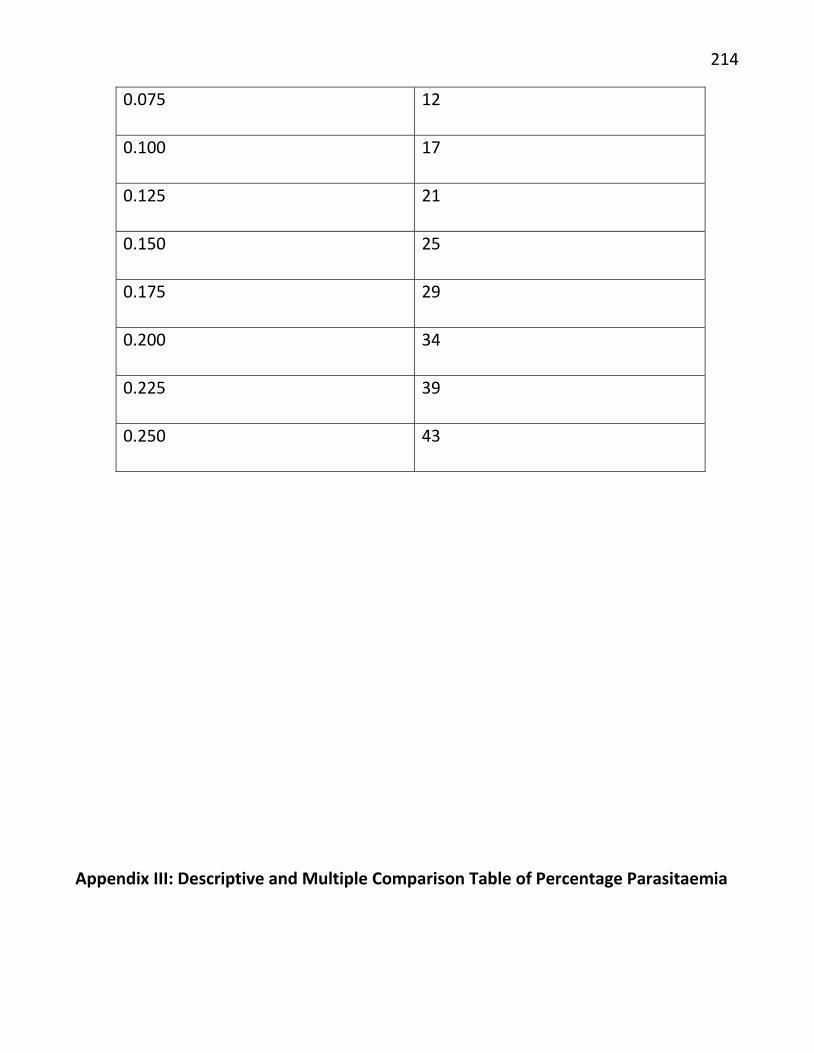
214
0.075 12
0.100 17
0.125 21
0.150 25
0.175 29
0.200 34
0.225 39
0.250 43
Appendix III: Descriptive and Multiple Comparison Table of Percentage Parasitaemia
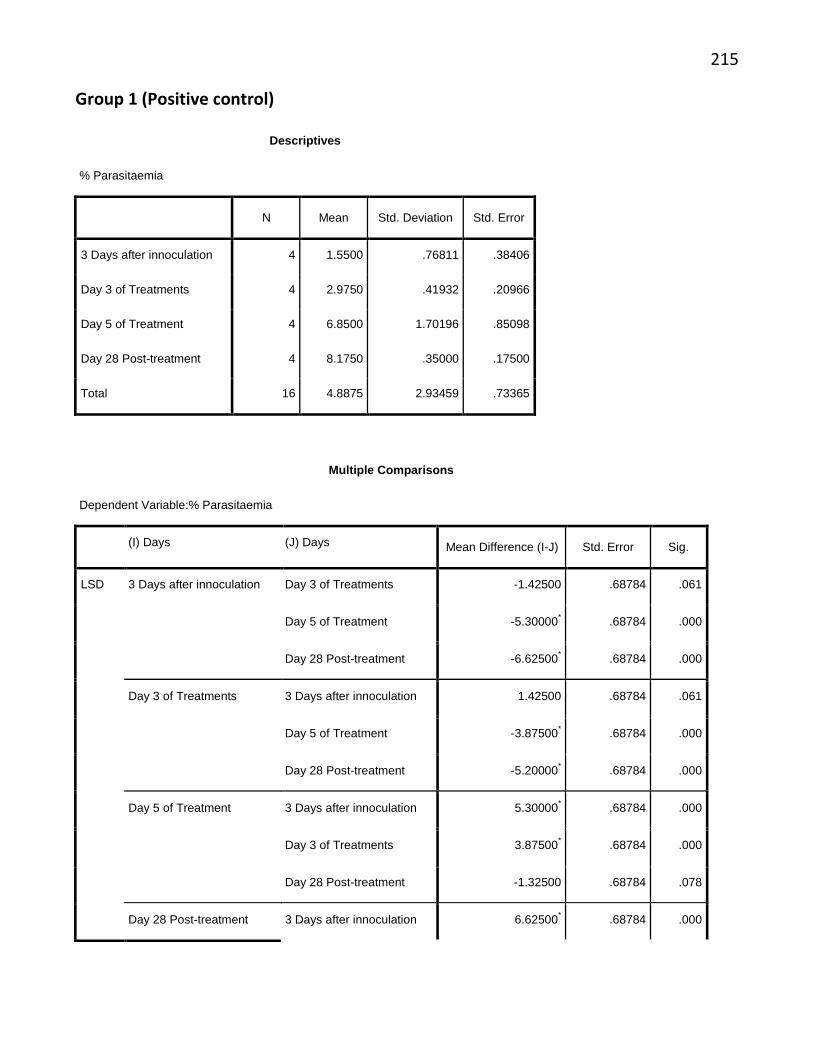
215
Group 1 (Positive control)
Descriptives
% Parasitaemia
N Mean Std. Deviation Std. Error
3 Days after innoculation 4 1.5500 .76811 .38406
Day 3 of Treatments 4 2.9750 .41932 .20966
Day 5 of Treatment 4 6.8500 1.70196 .85098
Day 28 Post-treatment 4 8.1750 .35000 .17500
Total 16 4.8875 2.93459 .73365
Multiple Comparisons
Dependent Variable:% Parasitaemia
(I) Days (J) Days Mean Difference (I-J) Std. Error Sig.
LSD 3 Days after innoculation Day 3 of Treatments -1.42500 .68784 .061
Day 5 of Treatment -5.30000* .68784 .000
Day 28 Post-treatment -6.62500* .68784 .000
Day 3 of Treatments 3 Days after innoculation 1.42500 .68784 .061
Day 5 of Treatment -3.87500* .68784 .000
Day 28 Post-treatment -5.20000* .68784 .000
Day 5 of Treatment 3 Days after innoculation 5.30000* .68784 .000
Day 3 of Treatments 3.87500* .68784 .000
Day 28 Post-treatment -1.32500 .68784 .078
Day 28 Post-treatment 3 Days after innoculation 6.62500* .68784 .000
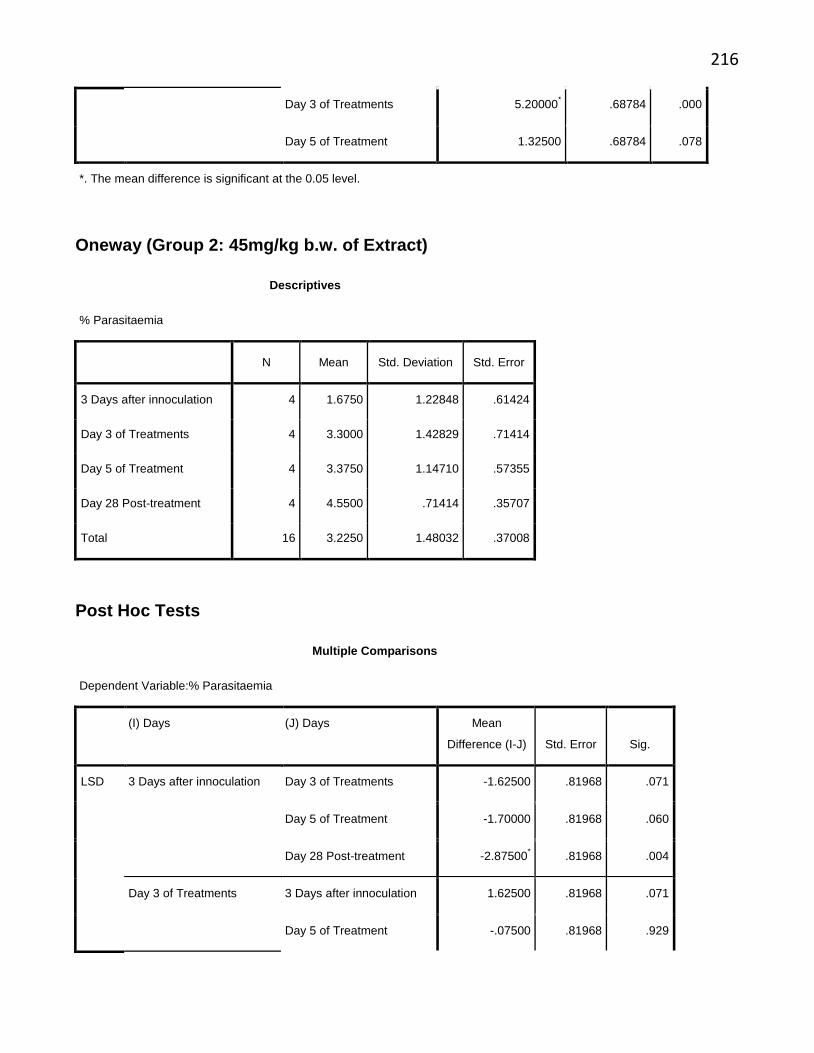
216
Day 3 of Treatments 5.20000* .68784 .000
Day 5 of Treatment 1.32500 .68784 .078
*. The mean difference is significant at the 0.05 level.
Oneway (Group 2: 45mg/kg b.w. of Extract)
Descriptives
% Parasitaemia
N Mean Std. Deviation Std. Error
3 Days after innoculation 4 1.6750 1.22848 .61424
Day 3 of Treatments 4 3.3000 1.42829 .71414
Day 5 of Treatment 4 3.3750 1.14710 .57355
Day 28 Post-treatment 4 4.5500 .71414 .35707
Total 16 3.2250 1.48032 .37008
Post Hoc Tests
Multiple Comparisons
Dependent Variable:% Parasitaemia
(I) Days (J) Days Mean
Difference (I-J) Std. Error Sig.
LSD 3 Days after innoculation Day 3 of Treatments -1.62500 .81968 .071
Day 5 of Treatment -1.70000 .81968 .060
Day 28 Post-treatment -2.87500* .81968 .004
Day 3 of Treatments 3 Days after innoculation 1.62500 .81968 .071
Day 5 of Treatment -.07500 .81968 .929
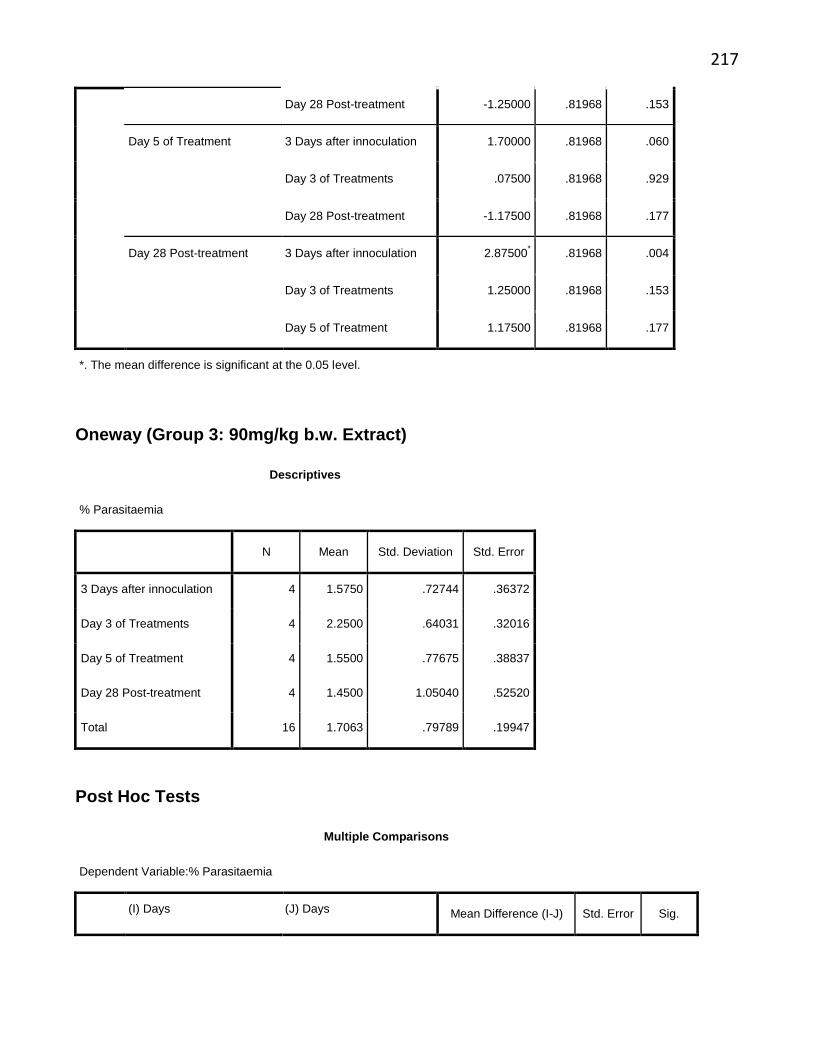
217
Day 28 Post-treatment -1.25000 .81968 .153
Day 5 of Treatment 3 Days after innoculation 1.70000 .81968 .060
Day 3 of Treatments .07500 .81968 .929
Day 28 Post-treatment -1.17500 .81968 .177
Day 28 Post-treatment 3 Days after innoculation 2.87500* .81968 .004
Day 3 of Treatments 1.25000 .81968 .153
Day 5 of Treatment 1.17500 .81968 .177
*. The mean difference is significant at the 0.05 level.
Oneway (Group 3: 90mg/kg b.w. Extract)
Descriptives
% Parasitaemia
N Mean Std. Deviation Std. Error
3 Days after innoculation 4 1.5750 .72744 .36372
Day 3 of Treatments 4 2.2500 .64031 .32016
Day 5 of Treatment 4 1.5500 .77675 .38837
Day 28 Post-treatment 4 1.4500 1.05040 .52520
Total 16 1.7063 .79789 .19947
Post Hoc Tests
Multiple Comparisons
Dependent Variable:% Parasitaemia
(I) Days (J) Days Mean Difference (I-J) Std. Error Sig.
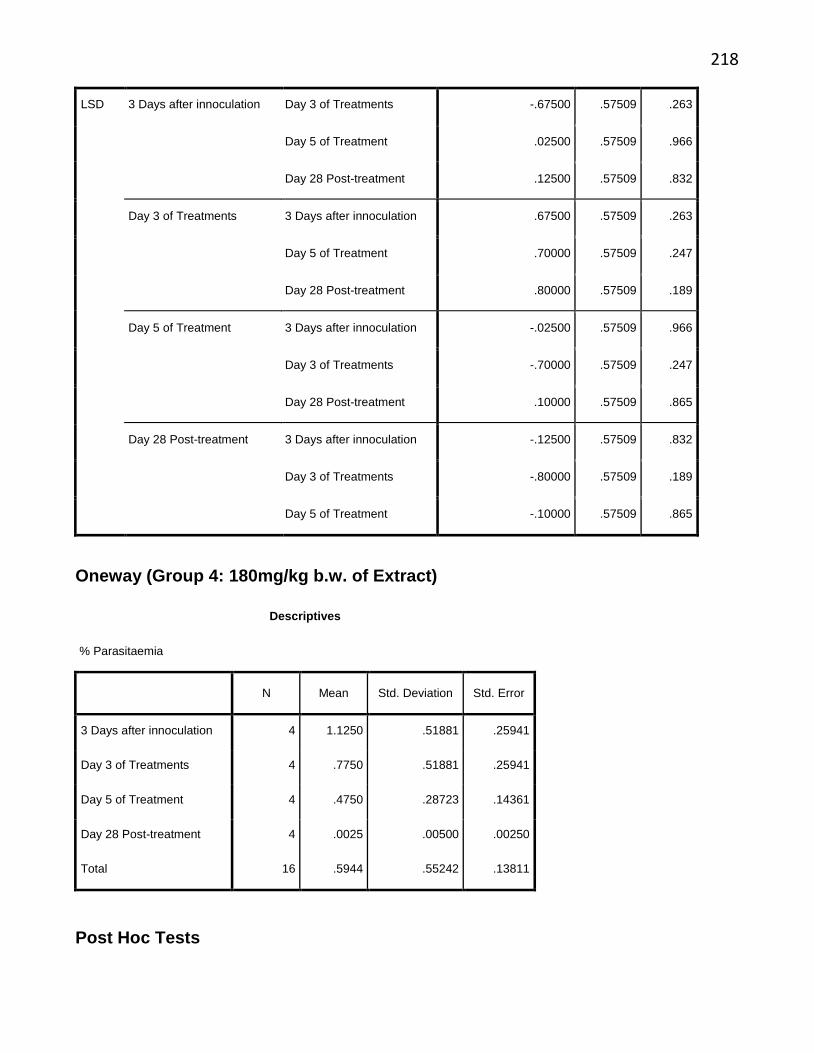
218
LSD 3 Days after innoculation Day 3 of Treatments -.67500 .57509 .263
Day 5 of Treatment .02500 .57509 .966
Day 28 Post-treatment .12500 .57509 .832
Day 3 of Treatments 3 Days after innoculation .67500 .57509 .263
Day 5 of Treatment .70000 .57509 .247
Day 28 Post-treatment .80000 .57509 .189
Day 5 of Treatment 3 Days after innoculation -.02500 .57509 .966
Day 3 of Treatments -.70000 .57509 .247
Day 28 Post-treatment .10000 .57509 .865
Day 28 Post-treatment 3 Days after innoculation -.12500 .57509 .832
Day 3 of Treatments -.80000 .57509 .189
Day 5 of Treatment -.10000 .57509 .865
Oneway (Group 4: 180mg/kg b.w. of Extract)
Descriptives
% Parasitaemia
N Mean Std. Deviation Std. Error
3 Days after innoculation 4 1.1250 .51881 .25941
Day 3 of Treatments 4 .7750 .51881 .25941
Day 5 of Treatment 4 .4750 .28723 .14361
Day 28 Post-treatment 4 .0025 .00500 .00250
Total 16 .5944 .55242 .13811
Post Hoc Tests
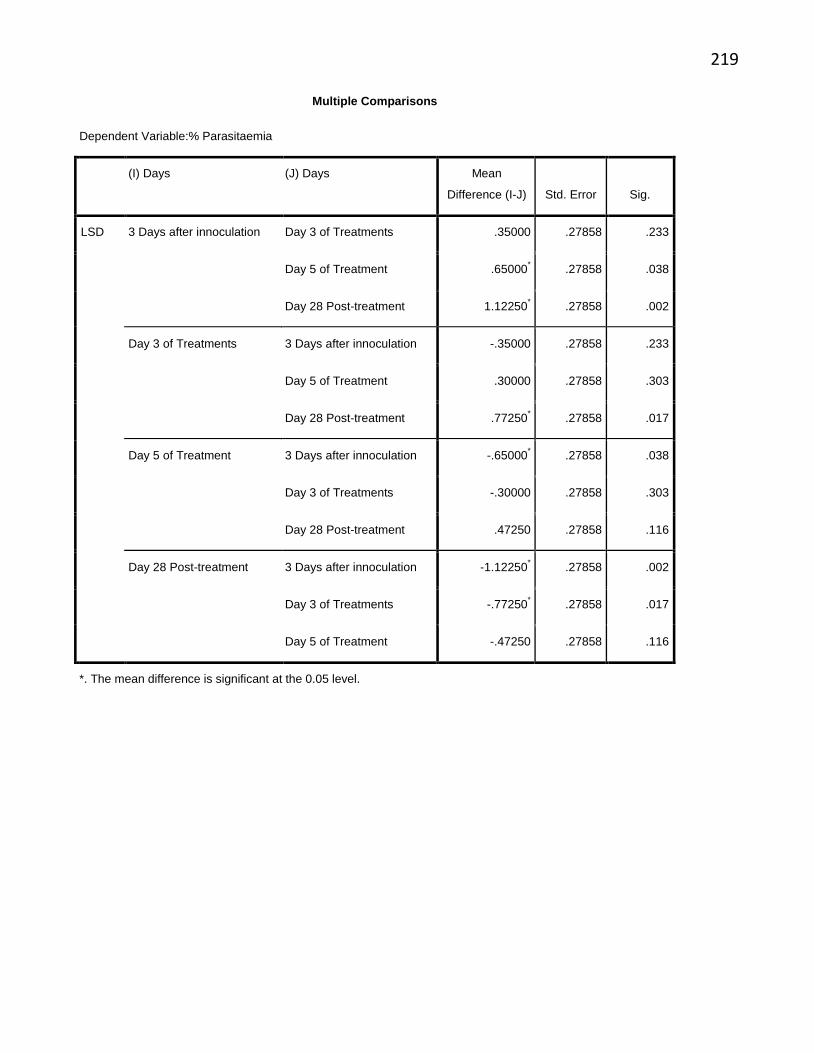
219
Multiple Comparisons
Dependent Variable:% Parasitaemia
(I) Days (J) Days Mean
Difference (I-J) Std. Error Sig.
LSD 3 Days after innoculation Day 3 of Treatments .35000 .27858 .233
Day 5 of Treatment .65000* .27858 .038
Day 28 Post-treatment 1.12250* .27858 .002
Day 3 of Treatments 3 Days after innoculation -.35000 .27858 .233
Day 5 of Treatment .30000 .27858 .303
Day 28 Post-treatment .77250* .27858 .017
Day 5 of Treatment 3 Days after innoculation -.65000* .27858 .038
Day 3 of Treatments -.30000 .27858 .303
Day 28 Post-treatment .47250 .27858 .116
Day 28 Post-treatment 3 Days after innoculation -1.12250* .27858 .002
Day 3 of Treatments -.77250* .27858 .017
Day 5 of Treatment -.47250 .27858 .116
*. The mean difference is significant at the 0.05 level.
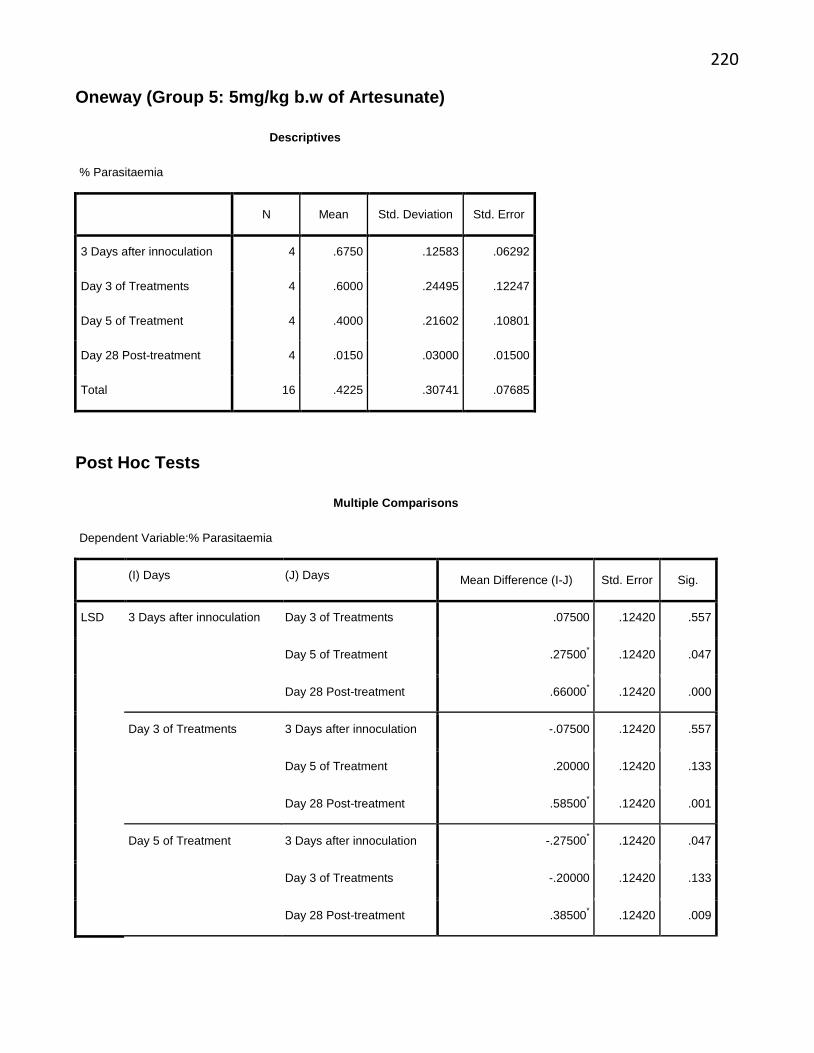
220
Oneway (Group 5: 5mg/kg b.w of Artesunate)
Descriptives
% Parasitaemia
N Mean Std. Deviation Std. Error
3 Days after innoculation 4 .6750 .12583 .06292
Day 3 of Treatments 4 .6000 .24495 .12247
Day 5 of Treatment 4 .4000 .21602 .10801
Day 28 Post-treatment 4 .0150 .03000 .01500
Total 16 .4225 .30741 .07685
Post Hoc Tests
Multiple Comparisons
Dependent Variable:% Parasitaemia
(I) Days (J) Days Mean Difference (I-J) Std. Error Sig.
LSD 3 Days after innoculation Day 3 of Treatments .07500 .12420 .557
Day 5 of Treatment .27500* .12420 .047
Day 28 Post-treatment .66000* .12420 .000
Day 3 of Treatments 3 Days after innoculation -.07500 .12420 .557
Day 5 of Treatment .20000 .12420 .133
Day 28 Post-treatment .58500* .12420 .001
Day 5 of Treatment 3 Days after innoculation -.27500* .12420 .047
Day 3 of Treatments -.20000 .12420 .133
Day 28 Post-treatment .38500* .12420 .009
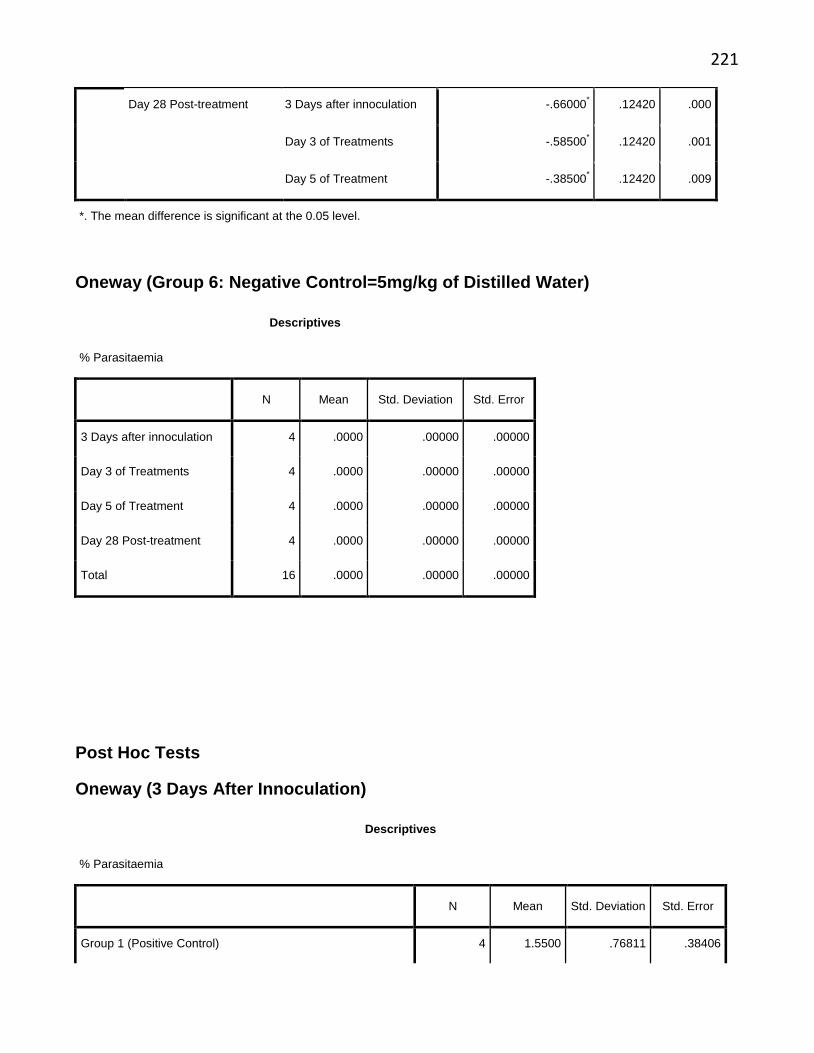
221
Day 28 Post-treatment 3 Days after innoculation -.66000* .12420 .000
Day 3 of Treatments -.58500* .12420 .001
Day 5 of Treatment -.38500* .12420 .009
*. The mean difference is significant at the 0.05 level.
Oneway (Group 6: Negative Control=5mg/kg of Distilled Water)
Descriptives
% Parasitaemia
N Mean Std. Deviation Std. Error
3 Days after innoculation 4 .0000 .00000 .00000
Day 3 of Treatments 4 .0000 .00000 .00000
Day 5 of Treatment 4 .0000 .00000 .00000
Day 28 Post-treatment 4 .0000 .00000 .00000
Total 16 .0000 .00000 .00000
Post Hoc Tests
Oneway (3 Days After Innoculation)
Descriptives
% Parasitaemia
N Mean Std. Deviation Std. Error
Group 1 (Positive Control) 4 1.5500 .76811 .38406
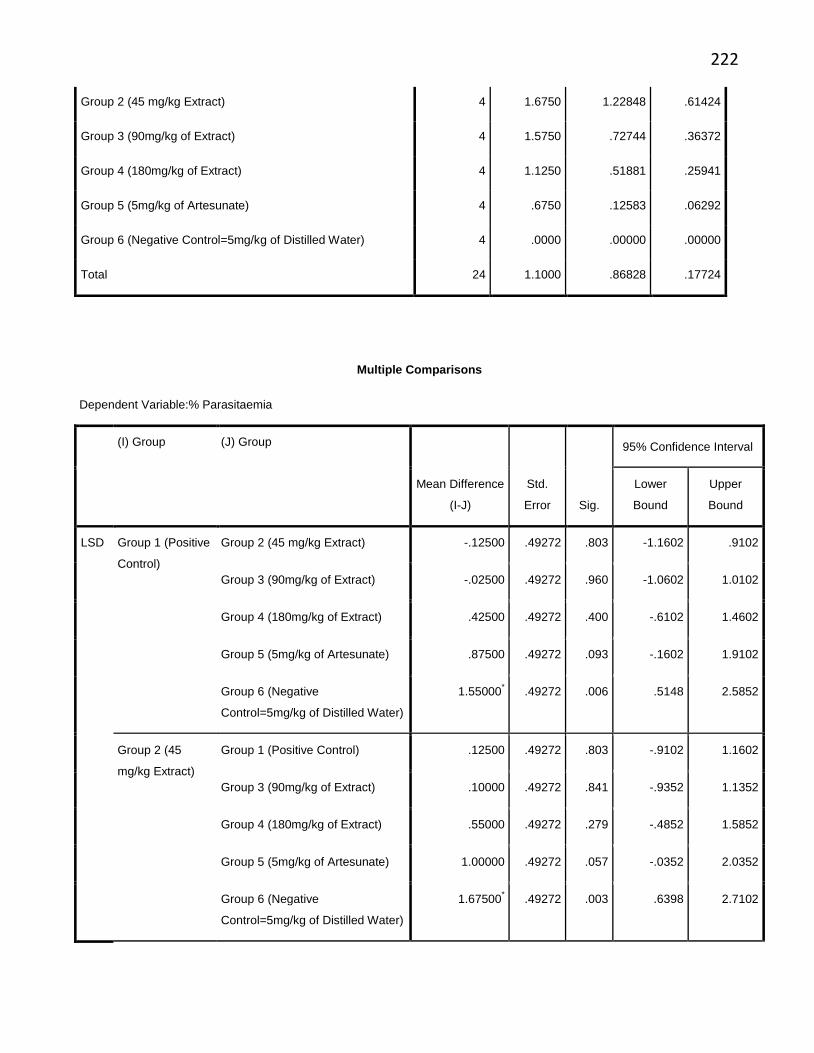
222
Group 2 (45 mg/kg Extract) 4 1.6750 1.22848 .61424
Group 3 (90mg/kg of Extract) 4 1.5750 .72744 .36372
Group 4 (180mg/kg of Extract) 4 1.1250 .51881 .25941
Group 5 (5mg/kg of Artesunate) 4 .6750 .12583 .06292
Group 6 (Negative Control=5mg/kg of Distilled Water) 4 .0000 .00000 .00000
Total 24 1.1000 .86828 .17724
Multiple Comparisons
Dependent Variable:% Parasitaemia
(I) Group (J) Group
Mean Difference
(I-J)
Std.
Error Sig.
95% Confidence Interval
Lower
Bound
Upper
Bound
LSD Group 1 (Positive
Control)
Group 2 (45 mg/kg Extract) -.12500 .49272 .803 -1.1602 .9102
Group 3 (90mg/kg of Extract) -.02500 .49272 .960 -1.0602 1.0102
Group 4 (180mg/kg of Extract) .42500 .49272 .400 -.6102 1.4602
Group 5 (5mg/kg of Artesunate) .87500 .49272 .093 -.1602 1.9102
Group 6 (Negative
Control=5mg/kg of Distilled Water)
1.55000* .49272 .006 .5148 2.5852
Group 2 (45
mg/kg Extract)
Group 1 (Positive Control) .12500 .49272 .803 -.9102 1.1602
Group 3 (90mg/kg of Extract) .10000 .49272 .841 -.9352 1.1352
Group 4 (180mg/kg of Extract) .55000 .49272 .279 -.4852 1.5852
Group 5 (5mg/kg of Artesunate) 1.00000 .49272 .057 -.0352 2.0352
Group 6 (Negative
Control=5mg/kg of Distilled Water)
1.67500* .49272 .003 .6398 2.7102
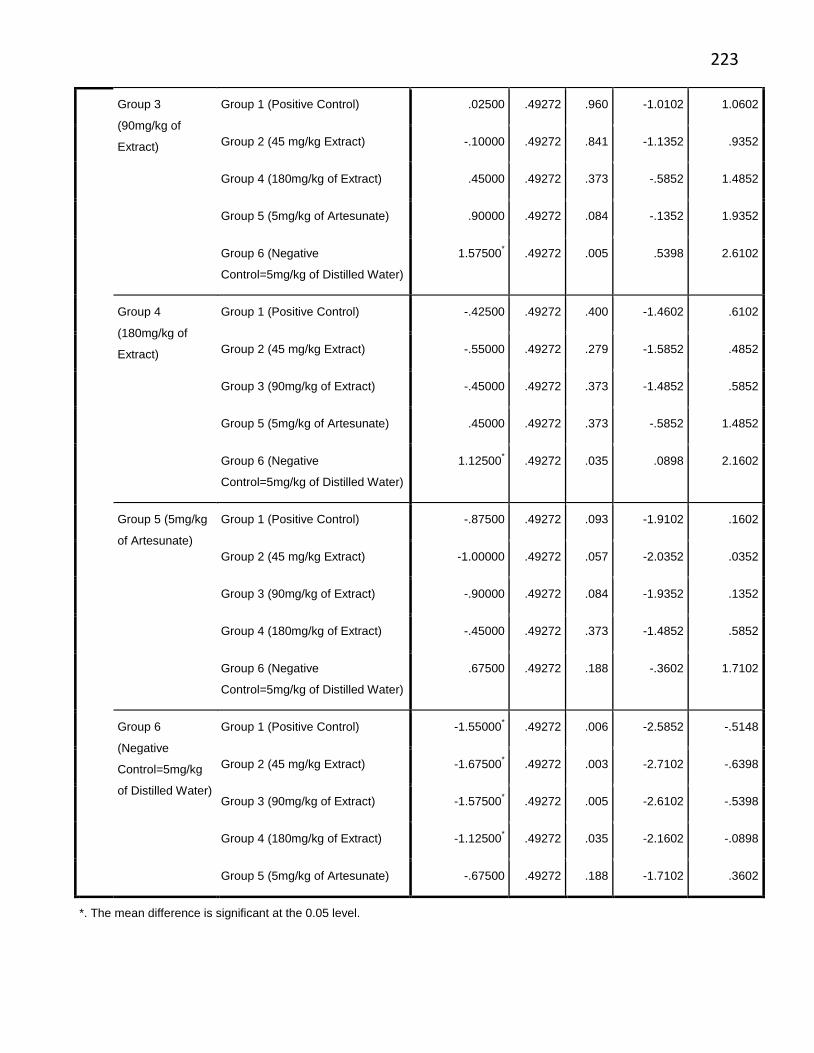
223
Group 3
(90mg/kg of
Extract)
Group 1 (Positive Control) .02500 .49272 .960 -1.0102 1.0602
Group 2 (45 mg/kg Extract) -.10000 .49272 .841 -1.1352 .9352
Group 4 (180mg/kg of Extract) .45000 .49272 .373 -.5852 1.4852
Group 5 (5mg/kg of Artesunate) .90000 .49272 .084 -.1352 1.9352
Group 6 (Negative
Control=5mg/kg of Distilled Water)
1.57500* .49272 .005 .5398 2.6102
Group 4
(180mg/kg of
Extract)
Group 1 (Positive Control) -.42500 .49272 .400 -1.4602 .6102
Group 2 (45 mg/kg Extract) -.55000 .49272 .279 -1.5852 .4852
Group 3 (90mg/kg of Extract) -.45000 .49272 .373 -1.4852 .5852
Group 5 (5mg/kg of Artesunate) .45000 .49272 .373 -.5852 1.4852
Group 6 (Negative
Control=5mg/kg of Distilled Water)
1.12500* .49272 .035 .0898 2.1602
Group 5 (5mg/kg
of Artesunate)
Group 1 (Positive Control) -.87500 .49272 .093 -1.9102 .1602
Group 2 (45 mg/kg Extract) -1.00000 .49272 .057 -2.0352 .0352
Group 3 (90mg/kg of Extract) -.90000 .49272 .084 -1.9352 .1352
Group 4 (180mg/kg of Extract) -.45000 .49272 .373 -1.4852 .5852
Group 6 (Negative
Control=5mg/kg of Distilled Water)
.67500 .49272 .188 -.3602 1.7102
Group 6
(Negative
Control=5mg/kg
of Distilled Water)
Group 1 (Positive Control) -1.55000* .49272 .006 -2.5852 -.5148
Group 2 (45 mg/kg Extract) -1.67500* .49272 .003 -2.7102 -.6398
Group 3 (90mg/kg of Extract) -1.57500* .49272 .005 -2.6102 -.5398
Group 4 (180mg/kg of Extract) -1.12500* .49272 .035 -2.1602 -.0898
Group 5 (5mg/kg of Artesunate) -.67500 .49272 .188 -1.7102 .3602
*. The mean difference is significant at the 0.05 level.
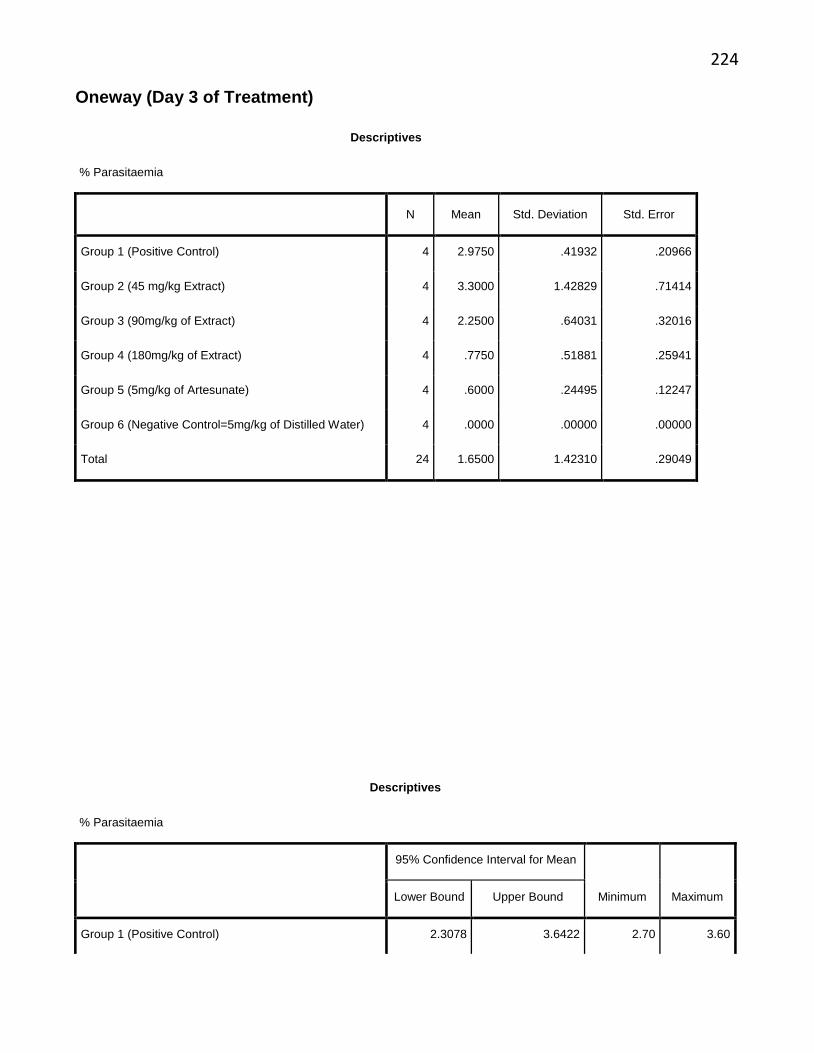
224
Oneway (Day 3 of Treatment)
Descriptives
% Parasitaemia
N Mean Std. Deviation Std. Error
Group 1 (Positive Control) 4 2.9750 .41932 .20966
Group 2 (45 mg/kg Extract) 4 3.3000 1.42829 .71414
Group 3 (90mg/kg of Extract) 4 2.2500 .64031 .32016
Group 4 (180mg/kg of Extract) 4 .7750 .51881 .25941
Group 5 (5mg/kg of Artesunate) 4 .6000 .24495 .12247
Group 6 (Negative Control=5mg/kg of Distilled Water) 4 .0000 .00000 .00000
Total 24 1.6500 1.42310 .29049
Descriptives
% Parasitaemia
95% Confidence Interval for Mean
Minimum Maximum Lower Bound Upper Bound
Group 1 (Positive Control) 2.3078 3.6422 2.70 3.60
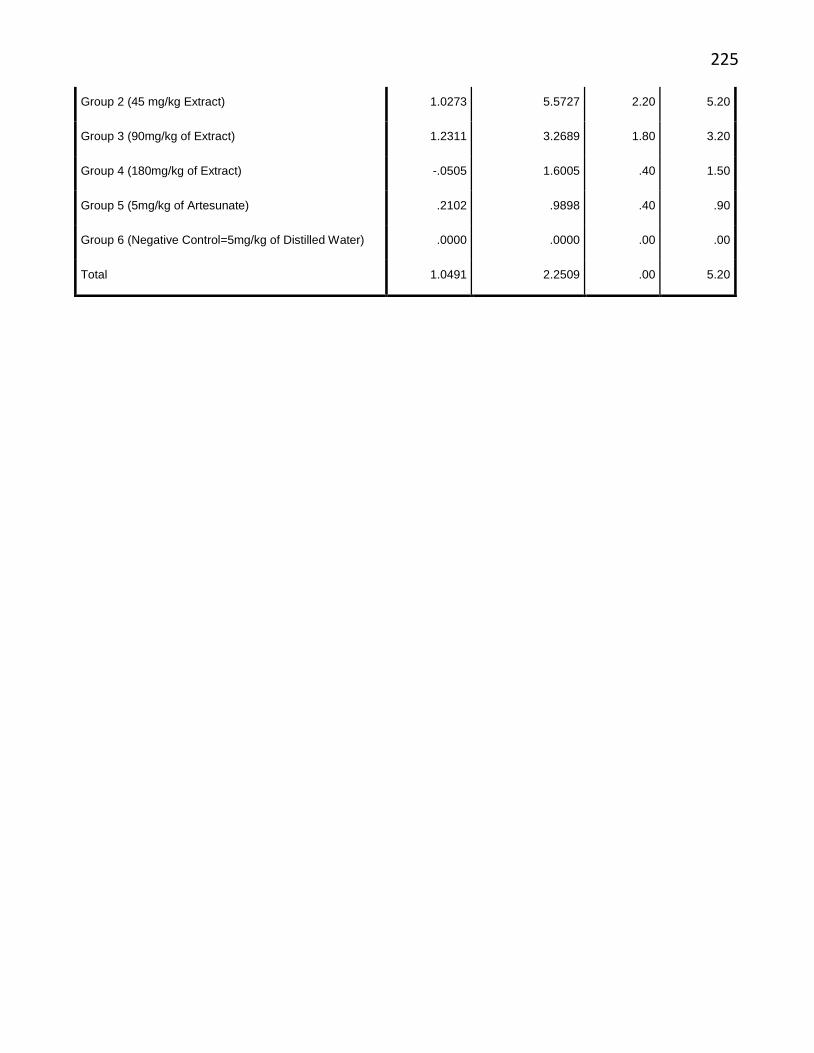
225
Group 2 (45 mg/kg Extract) 1.0273 5.5727 2.20 5.20
Group 3 (90mg/kg of Extract) 1.2311 3.2689 1.80 3.20
Group 4 (180mg/kg of Extract) -.0505 1.6005 .40 1.50
Group 5 (5mg/kg of Artesunate) .2102 .9898 .40 .90
Group 6 (Negative Control=5mg/kg of Distilled Water) .0000 .0000 .00 .00
Total 1.0491 2.2509 .00 5.20

226
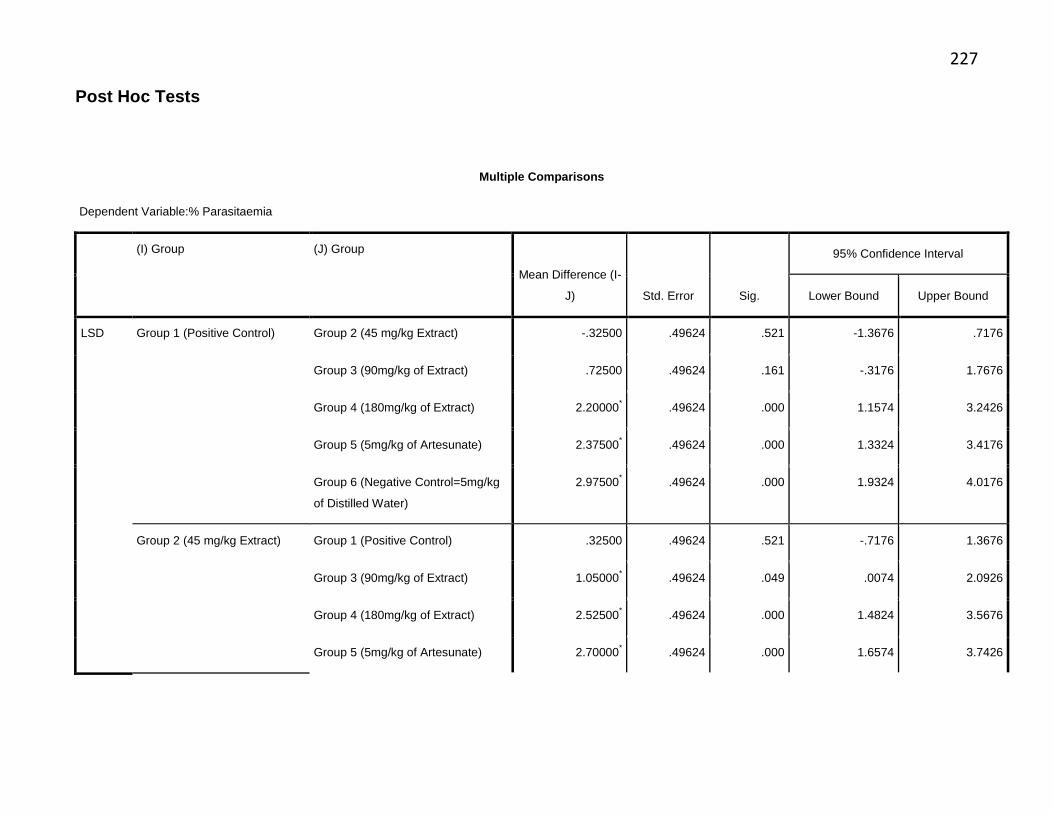
227
Post Hoc Tests
Multiple Comparisons
Dependent Variable:% Parasitaemia
(I) Group (J) Group
Mean Difference (I-
J) Std. Error Sig.
95% Confidence Interval
Lower Bound Upper Bound
LSD Group 1 (Positive Control) Group 2 (45 mg/kg Extract) -.32500 .49624 .521 -1.3676 .7176
Group 3 (90mg/kg of Extract) .72500 .49624 .161 -.3176 1.7676
Group 4 (180mg/kg of Extract) 2.20000* .49624 .000 1.1574 3.2426
Group 5 (5mg/kg of Artesunate) 2.37500* .49624 .000 1.3324 3.4176
Group 6 (Negative Control=5mg/kg
of Distilled Water)
2.97500* .49624 .000 1.9324 4.0176
Group 2 (45 mg/kg Extract) Group 1 (Positive Control) .32500 .49624 .521 -.7176 1.3676
Group 3 (90mg/kg of Extract) 1.05000* .49624 .049 .0074 2.0926
Group 4 (180mg/kg of Extract) 2.52500* .49624 .000 1.4824 3.5676
Group 5 (5mg/kg of Artesunate) 2.70000* .49624 .000 1.6574 3.7426
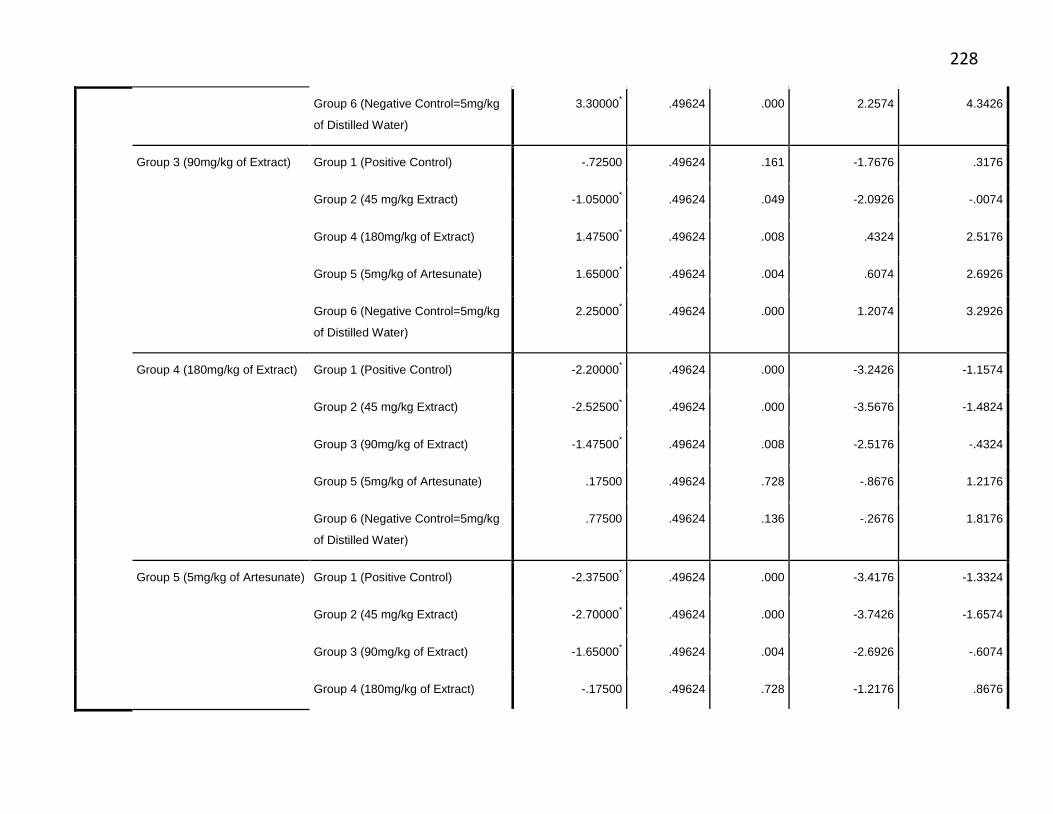
228
Group 6 (Negative Control=5mg/kg
of Distilled Water)
3.30000* .49624 .000 2.2574 4.3426
Group 3 (90mg/kg of Extract) Group 1 (Positive Control) -.72500 .49624 .161 -1.7676 .3176
Group 2 (45 mg/kg Extract) -1.05000* .49624 .049 -2.0926 -.0074
Group 4 (180mg/kg of Extract) 1.47500* .49624 .008 .4324 2.5176
Group 5 (5mg/kg of Artesunate) 1.65000* .49624 .004 .6074 2.6926
Group 6 (Negative Control=5mg/kg
of Distilled Water)
2.25000* .49624 .000 1.2074 3.2926
Group 4 (180mg/kg of Extract) Group 1 (Positive Control) -2.20000* .49624 .000 -3.2426 -1.1574
Group 2 (45 mg/kg Extract) -2.52500* .49624 .000 -3.5676 -1.4824
Group 3 (90mg/kg of Extract) -1.47500* .49624 .008 -2.5176 -.4324
Group 5 (5mg/kg of Artesunate) .17500 .49624 .728 -.8676 1.2176
Group 6 (Negative Control=5mg/kg
of Distilled Water)
.77500 .49624 .136 -.2676 1.8176
Group 5 (5mg/kg of Artesunate) Group 1 (Positive Control) -2.37500* .49624 .000 -3.4176 -1.3324
Group 2 (45 mg/kg Extract) -2.70000* .49624 .000 -3.7426 -1.6574
Group 3 (90mg/kg of Extract) -1.65000* .49624 .004 -2.6926 -.6074
Group 4 (180mg/kg of Extract) -.17500 .49624 .728 -1.2176 .8676
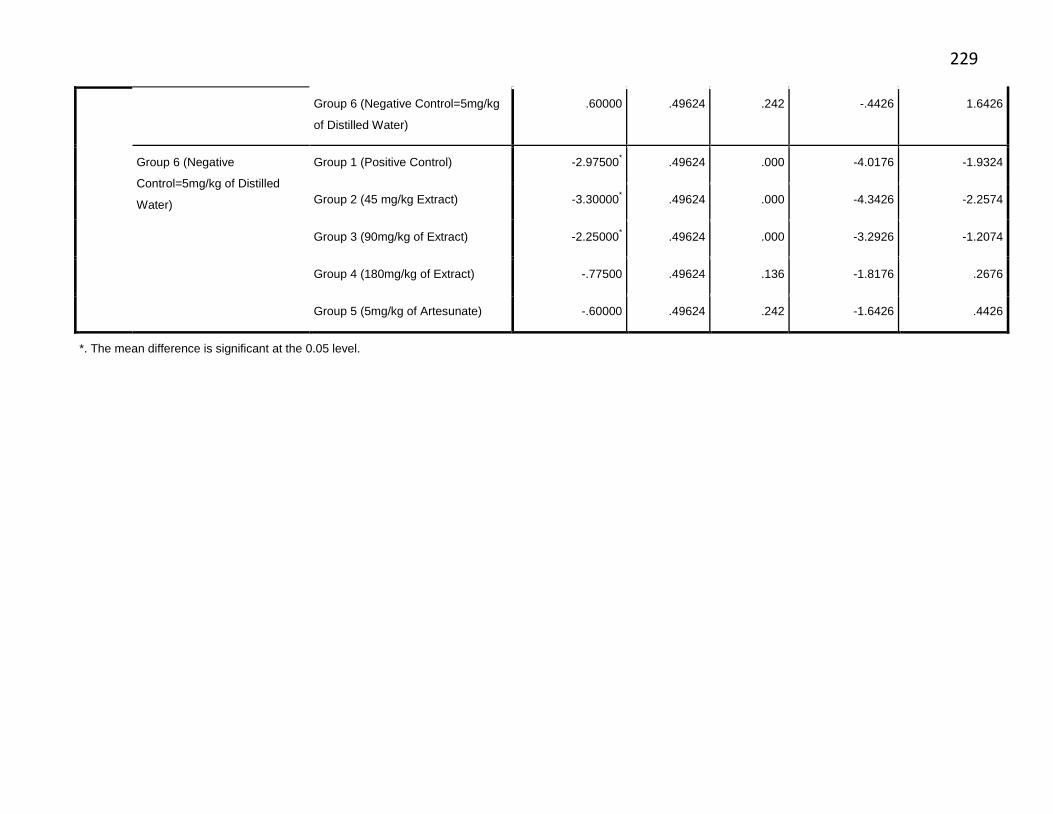
229
Group 6 (Negative Control=5mg/kg
of Distilled Water)
.60000 .49624 .242 -.4426 1.6426
Group 6 (Negative
Control=5mg/kg of Distilled
Water)
Group 1 (Positive Control) -2.97500* .49624 .000 -4.0176 -1.9324
Group 2 (45 mg/kg Extract) -3.30000* .49624 .000 -4.3426 -2.2574
Group 3 (90mg/kg of Extract) -2.25000* .49624 .000 -3.2926 -1.2074
Group 4 (180mg/kg of Extract) -.77500 .49624 .136 -1.8176 .2676
Group 5 (5mg/kg of Artesunate) -.60000 .49624 .242 -1.6426 .4426
*. The mean difference is significant at the 0.05 level.
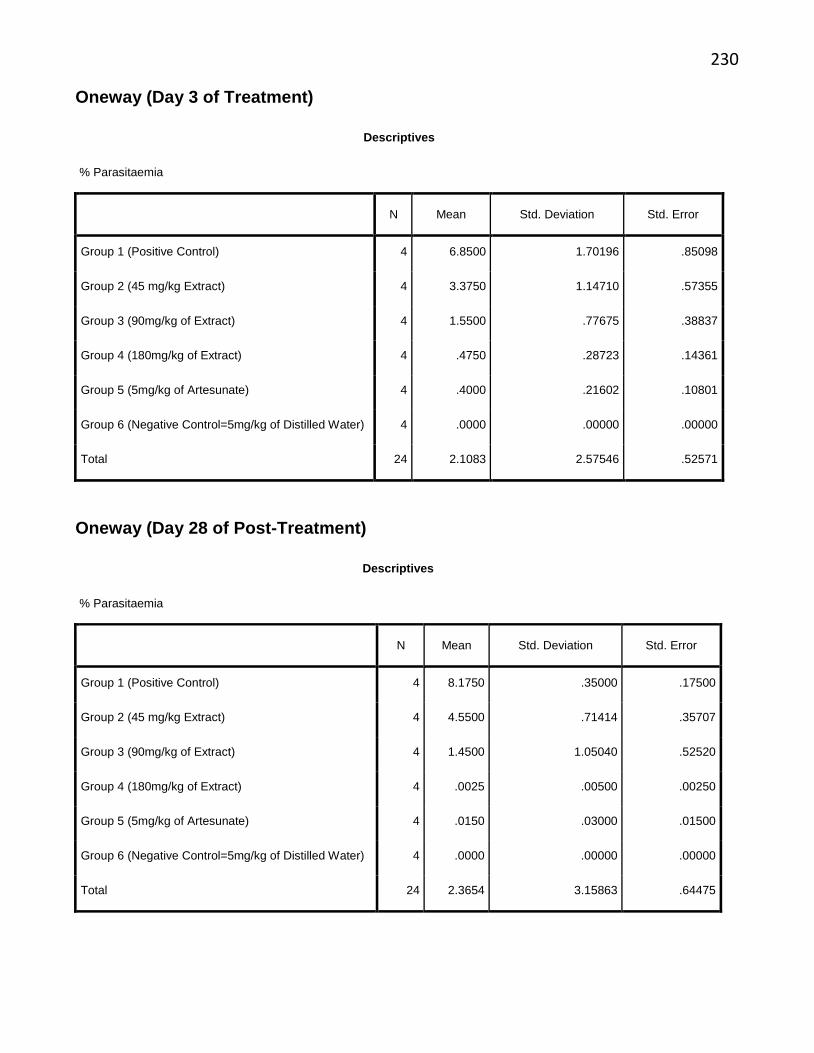
230
Oneway (Day 3 of Treatment)
Descriptives
% Parasitaemia
N Mean Std. Deviation Std. Error
Group 1 (Positive Control) 4 6.8500 1.70196 .85098
Group 2 (45 mg/kg Extract) 4 3.3750 1.14710 .57355
Group 3 (90mg/kg of Extract) 4 1.5500 .77675 .38837
Group 4 (180mg/kg of Extract) 4 .4750 .28723 .14361
Group 5 (5mg/kg of Artesunate) 4 .4000 .21602 .10801
Group 6 (Negative Control=5mg/kg of Distilled Water) 4 .0000 .00000 .00000
Total 24 2.1083 2.57546 .52571
Oneway (Day 28 of Post-Treatment)
Descriptives
% Parasitaemia
N Mean Std. Deviation Std. Error
Group 1 (Positive Control) 4 8.1750 .35000 .17500
Group 2 (45 mg/kg Extract) 4 4.5500 .71414 .35707
Group 3 (90mg/kg of Extract) 4 1.4500 1.05040 .52520
Group 4 (180mg/kg of Extract) 4 .0025 .00500 .00250
Group 5 (5mg/kg of Artesunate) 4 .0150 .03000 .01500
Group 6 (Negative Control=5mg/kg of Distilled Water) 4 .0000 .00000 .00000
Total 24 2.3654 3.15863 .64475
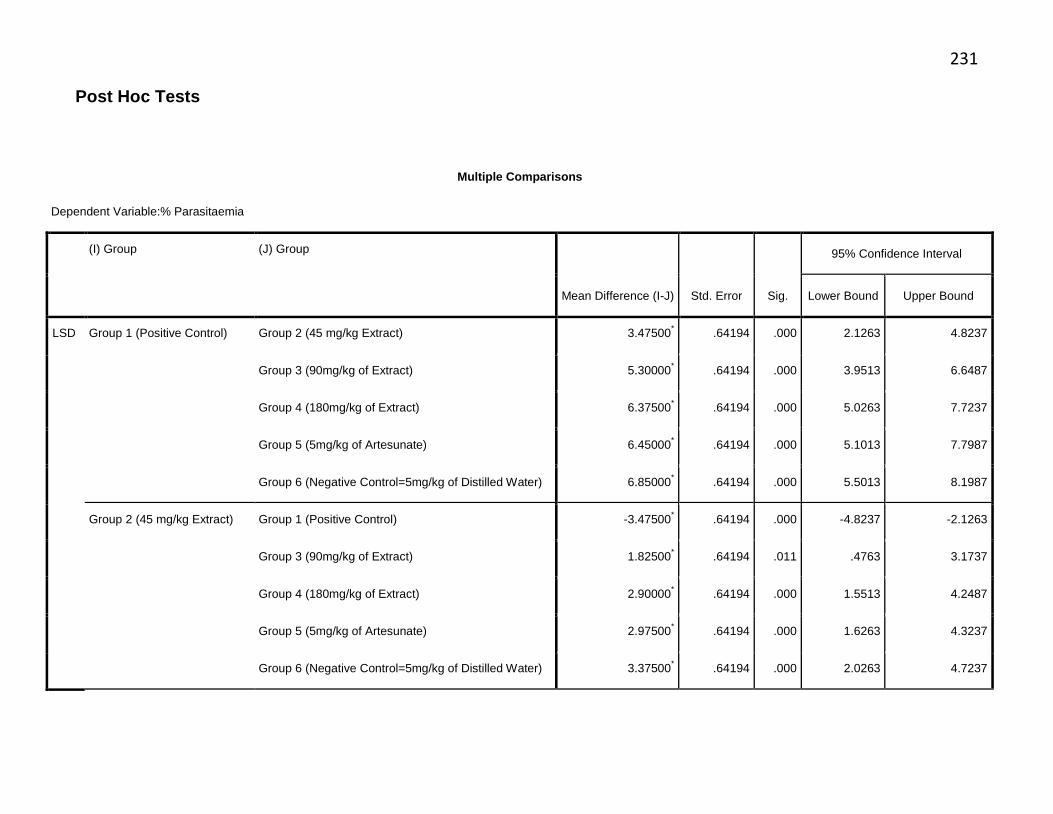
231
Post Hoc Tests
Multiple Comparisons
Dependent Variable:% Parasitaemia
(I) Group (J) Group
Mean Difference (I-J) Std. Error Sig.
95% Confidence Interval
Lower Bound Upper Bound
LSD Group 1 (Positive Control) Group 2 (45 mg/kg Extract) 3.47500* .64194 .000 2.1263 4.8237
Group 3 (90mg/kg of Extract) 5.30000* .64194 .000 3.9513 6.6487
Group 4 (180mg/kg of Extract) 6.37500* .64194 .000 5.0263 7.7237
Group 5 (5mg/kg of Artesunate) 6.45000* .64194 .000 5.1013 7.7987
Group 6 (Negative Control=5mg/kg of Distilled Water) 6.85000* .64194 .000 5.5013 8.1987
Group 2 (45 mg/kg Extract) Group 1 (Positive Control) -3.47500* .64194 .000 -4.8237 -2.1263
Group 3 (90mg/kg of Extract) 1.82500* .64194 .011 .4763 3.1737
Group 4 (180mg/kg of Extract) 2.90000* .64194 .000 1.5513 4.2487
Group 5 (5mg/kg of Artesunate) 2.97500* .64194 .000 1.6263 4.3237
Group 6 (Negative Control=5mg/kg of Distilled Water) 3.37500* .64194 .000 2.0263 4.7237
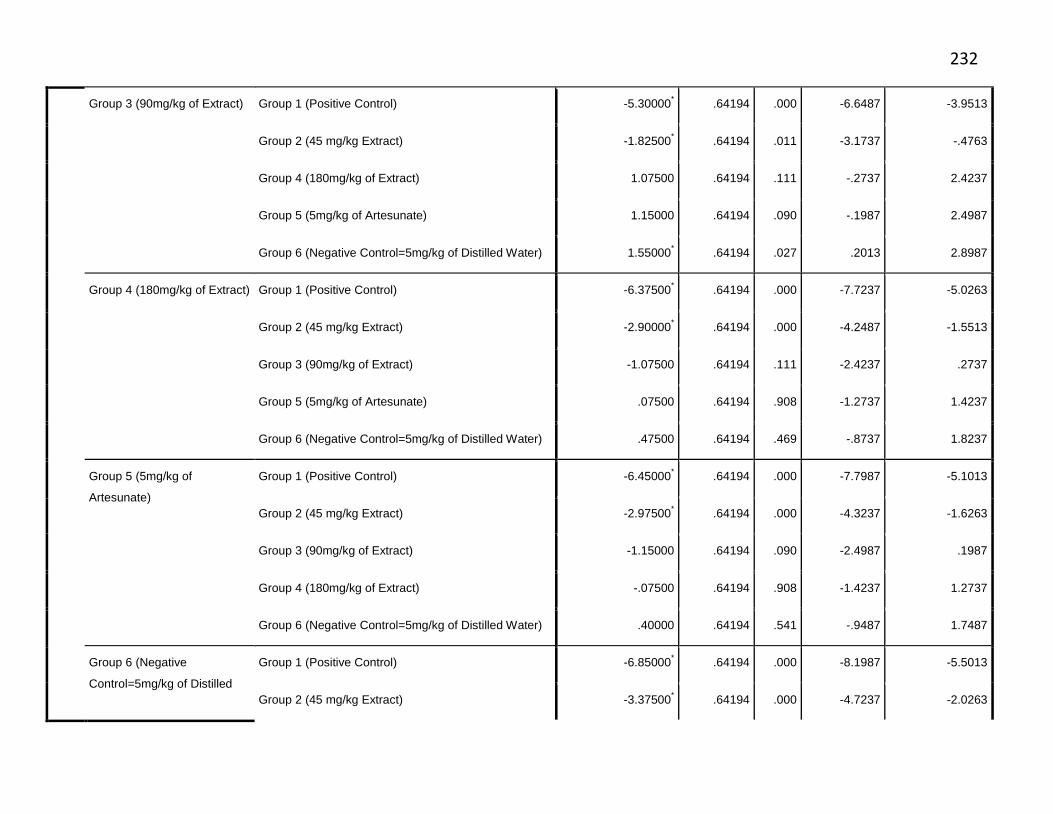
232
Group 3 (90mg/kg of Extract) Group 1 (Positive Control) -5.30000* .64194 .000 -6.6487 -3.9513
Group 2 (45 mg/kg Extract) -1.82500* .64194 .011 -3.1737 -.4763
Group 4 (180mg/kg of Extract) 1.07500 .64194 .111 -.2737 2.4237
Group 5 (5mg/kg of Artesunate) 1.15000 .64194 .090 -.1987 2.4987
Group 6 (Negative Control=5mg/kg of Distilled Water) 1.55000* .64194 .027 .2013 2.8987
Group 4 (180mg/kg of Extract) Group 1 (Positive Control) -6.37500* .64194 .000 -7.7237 -5.0263
Group 2 (45 mg/kg Extract) -2.90000* .64194 .000 -4.2487 -1.5513
Group 3 (90mg/kg of Extract) -1.07500 .64194 .111 -2.4237 .2737
Group 5 (5mg/kg of Artesunate) .07500 .64194 .908 -1.2737 1.4237
Group 6 (Negative Control=5mg/kg of Distilled Water) .47500 .64194 .469 -.8737 1.8237
Group 5 (5mg/kg of
Artesunate)
Group 1 (Positive Control) -6.45000* .64194 .000 -7.7987 -5.1013
Group 2 (45 mg/kg Extract) -2.97500* .64194 .000 -4.3237 -1.6263
Group 3 (90mg/kg of Extract) -1.15000 .64194 .090 -2.4987 .1987
Group 4 (180mg/kg of Extract) -.07500 .64194 .908 -1.4237 1.2737
Group 6 (Negative Control=5mg/kg of Distilled Water) .40000 .64194 .541 -.9487 1.7487
Group 6 (Negative
Control=5mg/kg of Distilled
Group 1 (Positive Control) -6.85000* .64194 .000 -8.1987 -5.5013
Group 2 (45 mg/kg Extract) -3.37500* .64194 .000 -4.7237 -2.0263
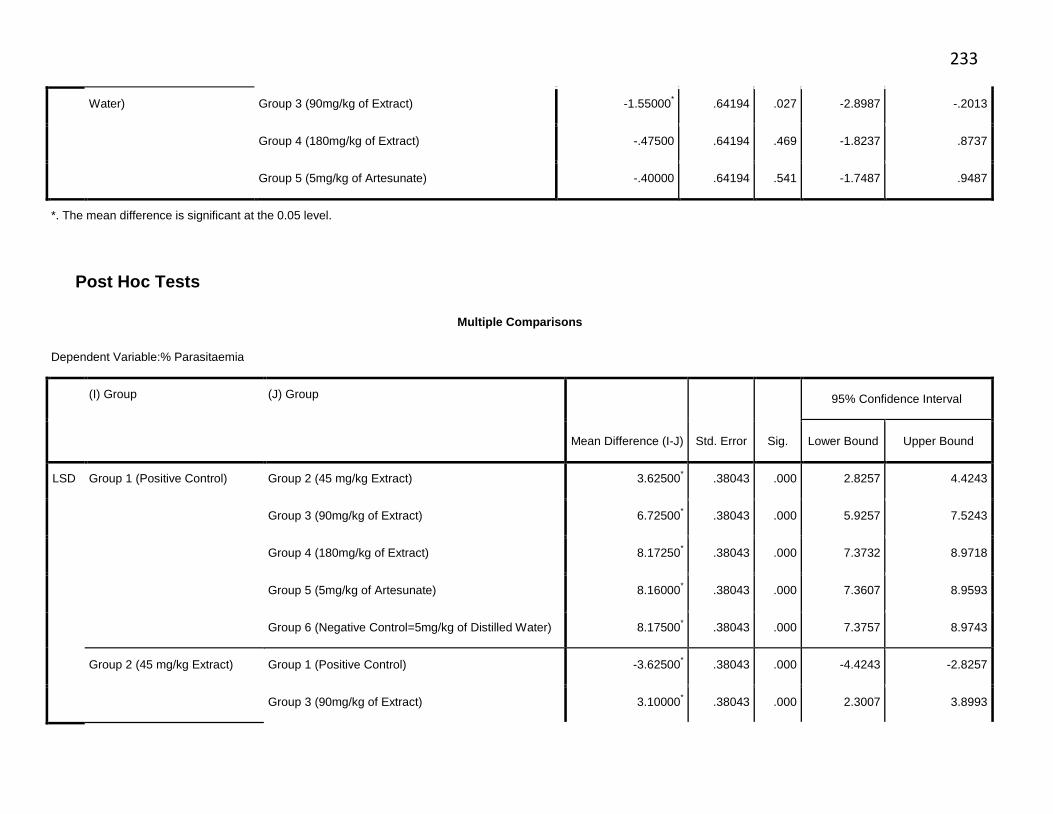
233
Water) Group 3 (90mg/kg of Extract) -1.55000* .64194 .027 -2.8987 -.2013
Group 4 (180mg/kg of Extract) -.47500 .64194 .469 -1.8237 .8737
Group 5 (5mg/kg of Artesunate) -.40000 .64194 .541 -1.7487 .9487
*. The mean difference is significant at the 0.05 level.
Post Hoc Tests
Multiple Comparisons
Dependent Variable:% Parasitaemia
(I) Group (J) Group
Mean Difference (I-J) Std. Error Sig.
95% Confidence Interval
Lower Bound Upper Bound
LSD Group 1 (Positive Control) Group 2 (45 mg/kg Extract) 3.62500* .38043 .000 2.8257 4.4243
Group 3 (90mg/kg of Extract) 6.72500* .38043 .000 5.9257 7.5243
Group 4 (180mg/kg of Extract) 8.17250* .38043 .000 7.3732 8.9718
Group 5 (5mg/kg of Artesunate) 8.16000* .38043 .000 7.3607 8.9593
Group 6 (Negative Control=5mg/kg of Distilled Water) 8.17500* .38043 .000 7.3757 8.9743
Group 2 (45 mg/kg Extract) Group 1 (Positive Control) -3.62500* .38043 .000 -4.4243 -2.8257
Group 3 (90mg/kg of Extract) 3.10000* .38043 .000 2.3007 3.8993
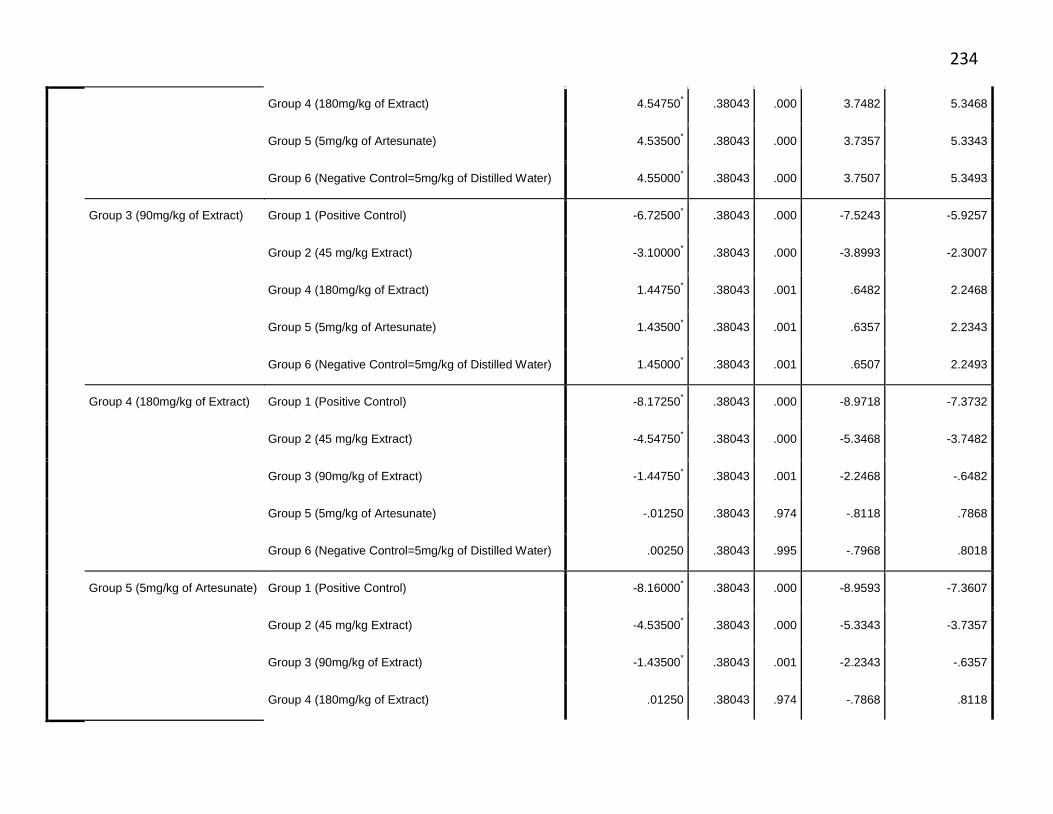
234
Group 4 (180mg/kg of Extract) 4.54750* .38043 .000 3.7482 5.3468
Group 5 (5mg/kg of Artesunate) 4.53500* .38043 .000 3.7357 5.3343
Group 6 (Negative Control=5mg/kg of Distilled Water) 4.55000* .38043 .000 3.7507 5.3493
Group 3 (90mg/kg of Extract) Group 1 (Positive Control) -6.72500* .38043 .000 -7.5243 -5.9257
Group 2 (45 mg/kg Extract) -3.10000* .38043 .000 -3.8993 -2.3007
Group 4 (180mg/kg of Extract) 1.44750* .38043 .001 .6482 2.2468
Group 5 (5mg/kg of Artesunate) 1.43500* .38043 .001 .6357 2.2343
Group 6 (Negative Control=5mg/kg of Distilled Water) 1.45000* .38043 .001 .6507 2.2493
Group 4 (180mg/kg of Extract) Group 1 (Positive Control) -8.17250* .38043 .000 -8.9718 -7.3732
Group 2 (45 mg/kg Extract) -4.54750* .38043 .000 -5.3468 -3.7482
Group 3 (90mg/kg of Extract) -1.44750* .38043 .001 -2.2468 -.6482
Group 5 (5mg/kg of Artesunate) -.01250 .38043 .974 -.8118 .7868
Group 6 (Negative Control=5mg/kg of Distilled Water) .00250 .38043 .995 -.7968 .8018
Group 5 (5mg/kg of Artesunate) Group 1 (Positive Control) -8.16000* .38043 .000 -8.9593 -7.3607
Group 2 (45 mg/kg Extract) -4.53500* .38043 .000 -5.3343 -3.7357
Group 3 (90mg/kg of Extract) -1.43500* .38043 .001 -2.2343 -.6357
Group 4 (180mg/kg of Extract) .01250 .38043 .974 -.7868 .8118
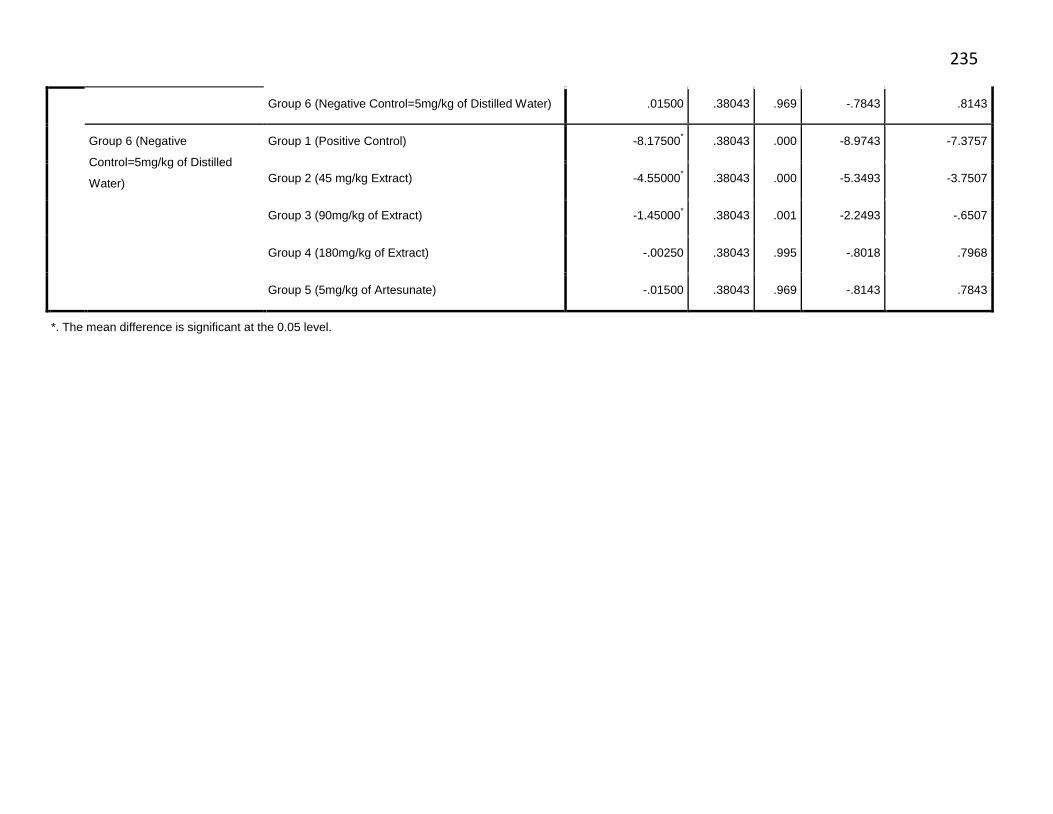
235
Group 6 (Negative Control=5mg/kg of Distilled Water) .01500 .38043 .969 -.7843 .8143
Group 6 (Negative
Control=5mg/kg of Distilled
Water)
Group 1 (Positive Control) -8.17500* .38043 .000 -8.9743 -7.3757
Group 2 (45 mg/kg Extract) -4.55000* .38043 .000 -5.3493 -3.7507
Group 3 (90mg/kg of Extract) -1.45000* .38043 .001 -2.2493 -.6507
Group 4 (180mg/kg of Extract) -.00250 .38043 .995 -.8018 .7968
Group 5 (5mg/kg of Artesunate) -.01500 .38043 .969 -.8143 .7843
*. The mean difference is significant at the 0.05 level.

236
APPENDIX IV: Multiple Comparison of Biochemical Parameters
Descriptives
N Mean Std. Deviation Std. Error
95% Confidence Interval for Mean
Minimum Maximum Lower Bound Upper Bound
ALT Group 1 (Positive Control) 4 42.5000 7.32575 3.66288 30.8431 54.1569 34.00 50.00
Group 2 (45 mg/kg Extract) 4 34.2500 2.50000 1.25000 30.2719 38.2281 31.00 37.00
Group 3 (90mg/kg of Extract) 4 27.0000 4.69042 2.34521 19.5365 34.4635 22.00 33.00
Group 4 (180mg/kg of Extract) 4 27.2500 3.20156 1.60078 22.1556 32.3444 24.00 30.00
Group 5 (5mg/kg of Artesunate) 4 26.2500 2.98608 1.49304 21.4985 31.0015 23.00 30.00
Group 6 (Negative Control=5mg/kg of
Distilled Water)
4 24.7500 2.87228 1.43614 20.1796 29.3204 23.00 29.00
Total 24 30.3333 7.38781 1.50803 27.2137 33.4529 22.00 50.00
AST Group 1 (Positive Control) 4 209.5000 8.58293 4.29146 195.8426 223.1574 199.00 220.00
Group 2 (45 mg/kg Extract) 4 207.0000 7.39369 3.69685 195.2350 218.7650 200.00 216.00
Group 3 (90mg/kg of Extract) 4 212.0000 8.32666 4.16333 198.7504 225.2496 202.00 222.00
Group 4 (180mg/kg of Extract) 4 205.0000 15.29706 7.64853 180.6590 229.3410 189.00 220.00
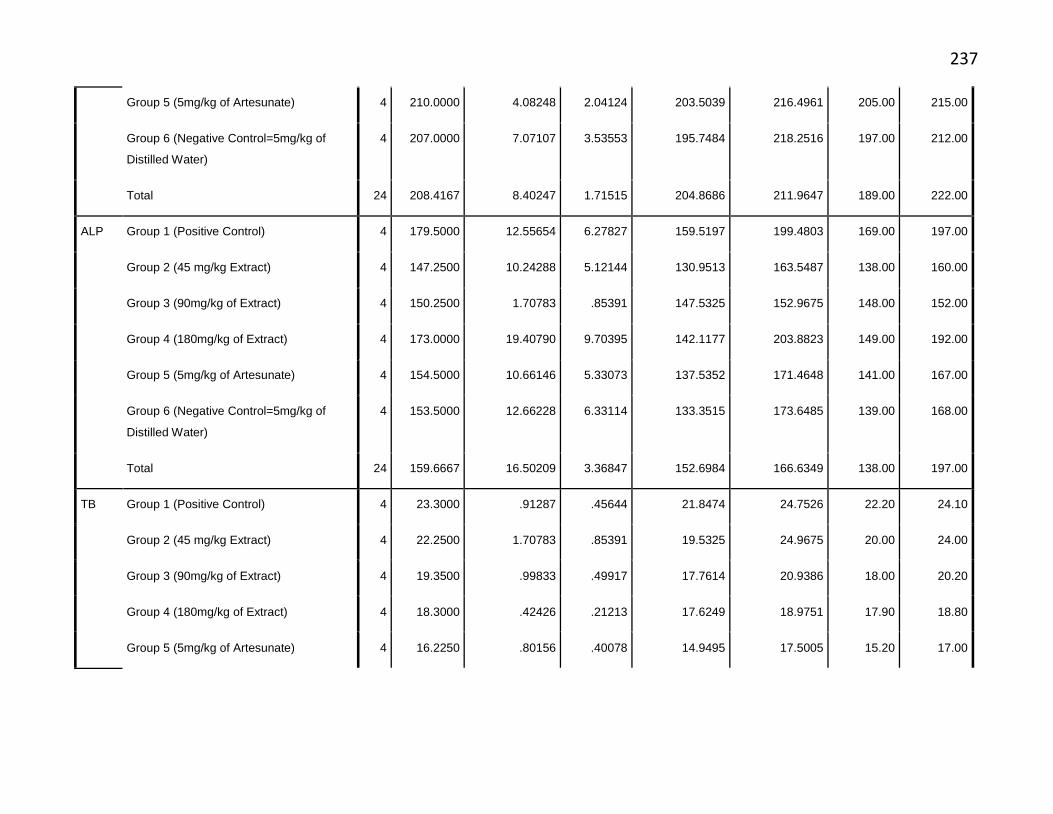
237
Group 5 (5mg/kg of Artesunate) 4 210.0000 4.08248 2.04124 203.5039 216.4961 205.00 215.00
Group 6 (Negative Control=5mg/kg of
Distilled Water)
4 207.0000 7.07107 3.53553 195.7484 218.2516 197.00 212.00
Total 24 208.4167 8.40247 1.71515 204.8686 211.9647 189.00 222.00
ALP Group 1 (Positive Control) 4 179.5000 12.55654 6.27827 159.5197 199.4803 169.00 197.00
Group 2 (45 mg/kg Extract) 4 147.2500 10.24288 5.12144 130.9513 163.5487 138.00 160.00
Group 3 (90mg/kg of Extract) 4 150.2500 1.70783 .85391 147.5325 152.9675 148.00 152.00
Group 4 (180mg/kg of Extract) 4 173.0000 19.40790 9.70395 142.1177 203.8823 149.00 192.00
Group 5 (5mg/kg of Artesunate) 4 154.5000 10.66146 5.33073 137.5352 171.4648 141.00 167.00
Group 6 (Negative Control=5mg/kg of
Distilled Water)
4 153.5000 12.66228 6.33114 133.3515 173.6485 139.00 168.00
Total 24 159.6667 16.50209 3.36847 152.6984 166.6349 138.00 197.00
TB Group 1 (Positive Control) 4 23.3000 .91287 .45644 21.8474 24.7526 22.20 24.10
Group 2 (45 mg/kg Extract) 4 22.2500 1.70783 .85391 19.5325 24.9675 20.00 24.00
Group 3 (90mg/kg of Extract) 4 19.3500 .99833 .49917 17.7614 20.9386 18.00 20.20
Group 4 (180mg/kg of Extract) 4 18.3000 .42426 .21213 17.6249 18.9751 17.90 18.80
Group 5 (5mg/kg of Artesunate) 4 16.2250 .80156 .40078 14.9495 17.5005 15.20 17.00
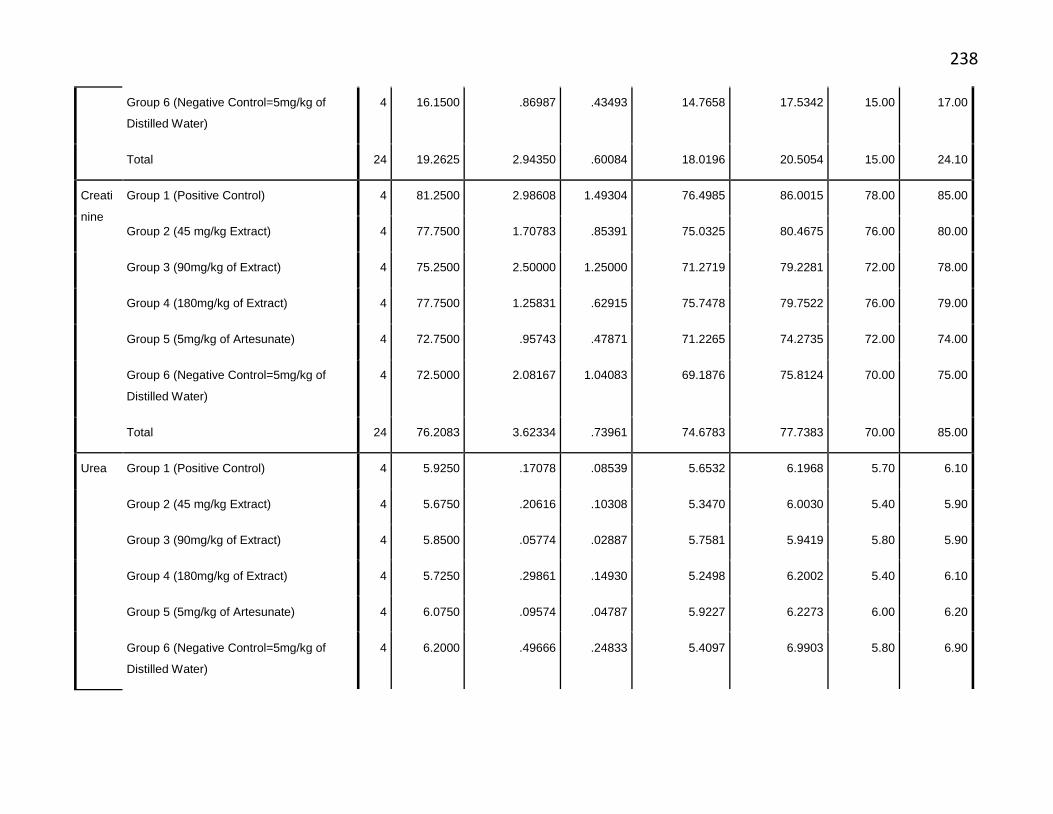
238
Group 6 (Negative Control=5mg/kg of
Distilled Water)
4 16.1500 .86987 .43493 14.7658 17.5342 15.00 17.00
Total 24 19.2625 2.94350 .60084 18.0196 20.5054 15.00 24.10
Creati
nine
Group 1 (Positive Control) 4 81.2500 2.98608 1.49304 76.4985 86.0015 78.00 85.00
Group 2 (45 mg/kg Extract) 4 77.7500 1.70783 .85391 75.0325 80.4675 76.00 80.00
Group 3 (90mg/kg of Extract) 4 75.2500 2.50000 1.25000 71.2719 79.2281 72.00 78.00
Group 4 (180mg/kg of Extract) 4 77.7500 1.25831 .62915 75.7478 79.7522 76.00 79.00
Group 5 (5mg/kg of Artesunate) 4 72.7500 .95743 .47871 71.2265 74.2735 72.00 74.00
Group 6 (Negative Control=5mg/kg of
Distilled Water)
4 72.5000 2.08167 1.04083 69.1876 75.8124 70.00 75.00
Total 24 76.2083 3.62334 .73961 74.6783 77.7383 70.00 85.00
Urea Group 1 (Positive Control) 4 5.9250 .17078 .08539 5.6532 6.1968 5.70 6.10
Group 2 (45 mg/kg Extract) 4 5.6750 .20616 .10308 5.3470 6.0030 5.40 5.90
Group 3 (90mg/kg of Extract) 4 5.8500 .05774 .02887 5.7581 5.9419 5.80 5.90
Group 4 (180mg/kg of Extract) 4 5.7250 .29861 .14930 5.2498 6.2002 5.40 6.10
Group 5 (5mg/kg of Artesunate) 4 6.0750 .09574 .04787 5.9227 6.2273 6.00 6.20
Group 6 (Negative Control=5mg/kg of
Distilled Water)
4 6.2000 .49666 .24833 5.4097 6.9903 5.80 6.90
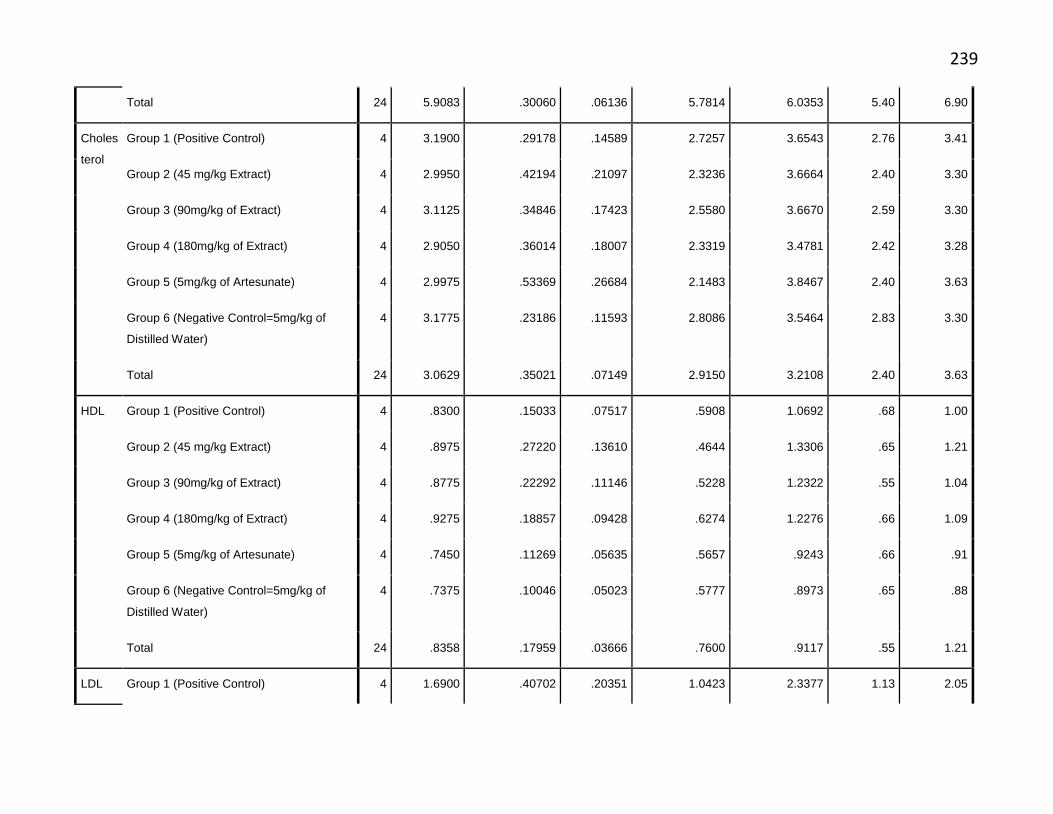
239
Total 24 5.9083 .30060 .06136 5.7814 6.0353 5.40 6.90
Choles
terol
Group 1 (Positive Control) 4 3.1900 .29178 .14589 2.7257 3.6543 2.76 3.41
Group 2 (45 mg/kg Extract) 4 2.9950 .42194 .21097 2.3236 3.6664 2.40 3.30
Group 3 (90mg/kg of Extract) 4 3.1125 .34846 .17423 2.5580 3.6670 2.59 3.30
Group 4 (180mg/kg of Extract) 4 2.9050 .36014 .18007 2.3319 3.4781 2.42 3.28
Group 5 (5mg/kg of Artesunate) 4 2.9975 .53369 .26684 2.1483 3.8467 2.40 3.63
Group 6 (Negative Control=5mg/kg of
Distilled Water)
4 3.1775 .23186 .11593 2.8086 3.5464 2.83 3.30
Total 24 3.0629 .35021 .07149 2.9150 3.2108 2.40 3.63
HDL Group 1 (Positive Control) 4 .8300 .15033 .07517 .5908 1.0692 .68 1.00
Group 2 (45 mg/kg Extract) 4 .8975 .27220 .13610 .4644 1.3306 .65 1.21
Group 3 (90mg/kg of Extract) 4 .8775 .22292 .11146 .5228 1.2322 .55 1.04
Group 4 (180mg/kg of Extract) 4 .9275 .18857 .09428 .6274 1.2276 .66 1.09
Group 5 (5mg/kg of Artesunate) 4 .7450 .11269 .05635 .5657 .9243 .66 .91
Group 6 (Negative Control=5mg/kg of
Distilled Water)
4 .7375 .10046 .05023 .5777 .8973 .65 .88
Total 24 .8358 .17959 .03666 .7600 .9117 .55 1.21
LDL Group 1 (Positive Control) 4 1.6900 .40702 .20351 1.0423 2.3377 1.13 2.05
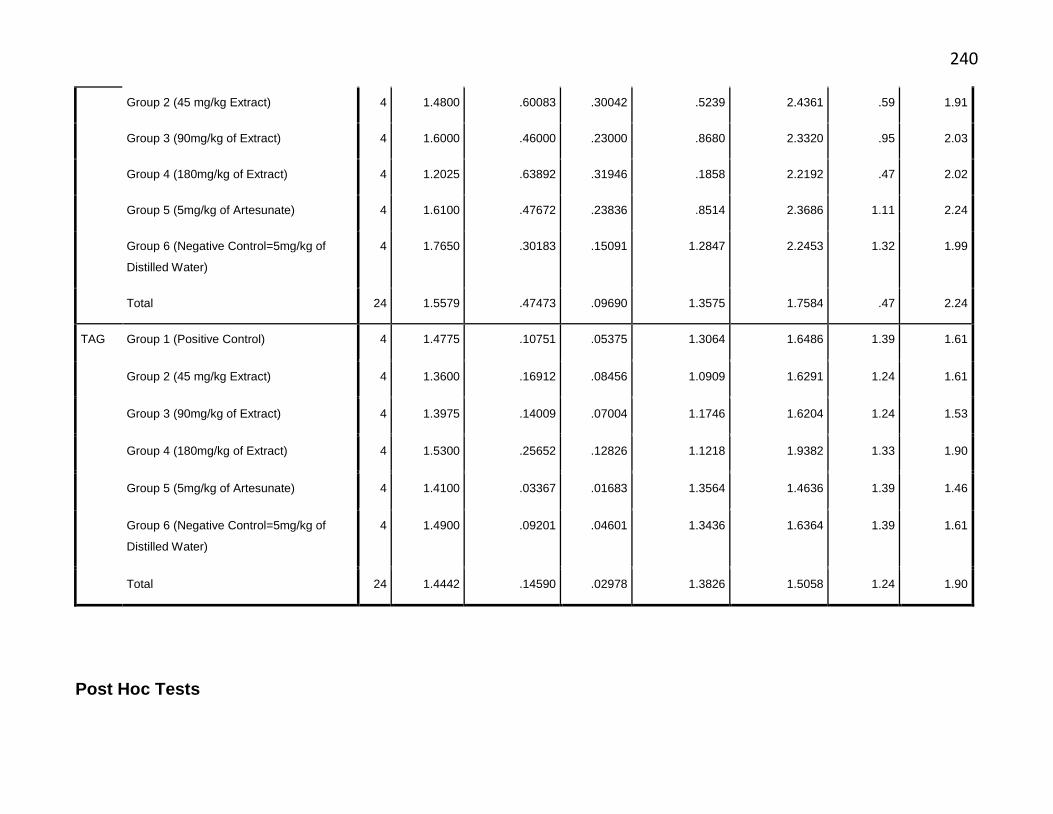
240
Group 2 (45 mg/kg Extract) 4 1.4800 .60083 .30042 .5239 2.4361 .59 1.91
Group 3 (90mg/kg of Extract) 4 1.6000 .46000 .23000 .8680 2.3320 .95 2.03
Group 4 (180mg/kg of Extract) 4 1.2025 .63892 .31946 .1858 2.2192 .47 2.02
Group 5 (5mg/kg of Artesunate) 4 1.6100 .47672 .23836 .8514 2.3686 1.11 2.24
Group 6 (Negative Control=5mg/kg of
Distilled Water)
4 1.7650 .30183 .15091 1.2847 2.2453 1.32 1.99
Total 24 1.5579 .47473 .09690 1.3575 1.7584 .47 2.24
TAG Group 1 (Positive Control) 4 1.4775 .10751 .05375 1.3064 1.6486 1.39 1.61
Group 2 (45 mg/kg Extract) 4 1.3600 .16912 .08456 1.0909 1.6291 1.24 1.61
Group 3 (90mg/kg of Extract) 4 1.3975 .14009 .07004 1.1746 1.6204 1.24 1.53
Group 4 (180mg/kg of Extract) 4 1.5300 .25652 .12826 1.1218 1.9382 1.33 1.90
Group 5 (5mg/kg of Artesunate) 4 1.4100 .03367 .01683 1.3564 1.4636 1.39 1.46
Group 6 (Negative Control=5mg/kg of
Distilled Water)
4 1.4900 .09201 .04601 1.3436 1.6364 1.39 1.61
Total 24 1.4442 .14590 .02978 1.3826 1.5058 1.24 1.90
Post Hoc Tests
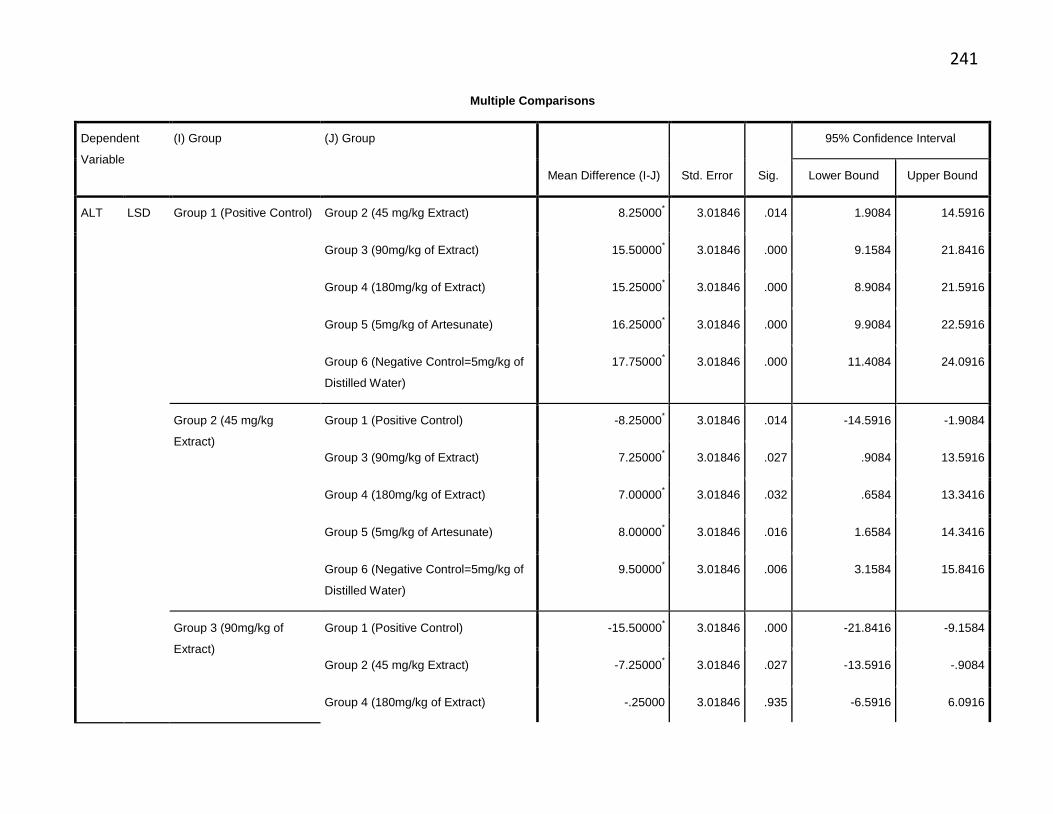
241
Multiple Comparisons
Dependent
Variable
(I) Group (J) Group
Mean Difference (I-J) Std. Error Sig.
95% Confidence Interval
Lower Bound Upper Bound
ALT LSD Group 1 (Positive Control) Group 2 (45 mg/kg Extract) 8.25000* 3.01846 .014 1.9084 14.5916
Group 3 (90mg/kg of Extract) 15.50000* 3.01846 .000 9.1584 21.8416
Group 4 (180mg/kg of Extract) 15.25000* 3.01846 .000 8.9084 21.5916
Group 5 (5mg/kg of Artesunate) 16.25000* 3.01846 .000 9.9084 22.5916
Group 6 (Negative Control=5mg/kg of
Distilled Water)
17.75000* 3.01846 .000 11.4084 24.0916
Group 2 (45 mg/kg
Extract)
Group 1 (Positive Control) -8.25000* 3.01846 .014 -14.5916 -1.9084
Group 3 (90mg/kg of Extract) 7.25000* 3.01846 .027 .9084 13.5916
Group 4 (180mg/kg of Extract) 7.00000* 3.01846 .032 .6584 13.3416
Group 5 (5mg/kg of Artesunate) 8.00000* 3.01846 .016 1.6584 14.3416
Group 6 (Negative Control=5mg/kg of
Distilled Water)
9.50000* 3.01846 .006 3.1584 15.8416
Group 3 (90mg/kg of
Extract)
Group 1 (Positive Control) -15.50000* 3.01846 .000 -21.8416 -9.1584
Group 2 (45 mg/kg Extract) -7.25000* 3.01846 .027 -13.5916 -.9084
Group 4 (180mg/kg of Extract) -.25000 3.01846 .935 -6.5916 6.0916
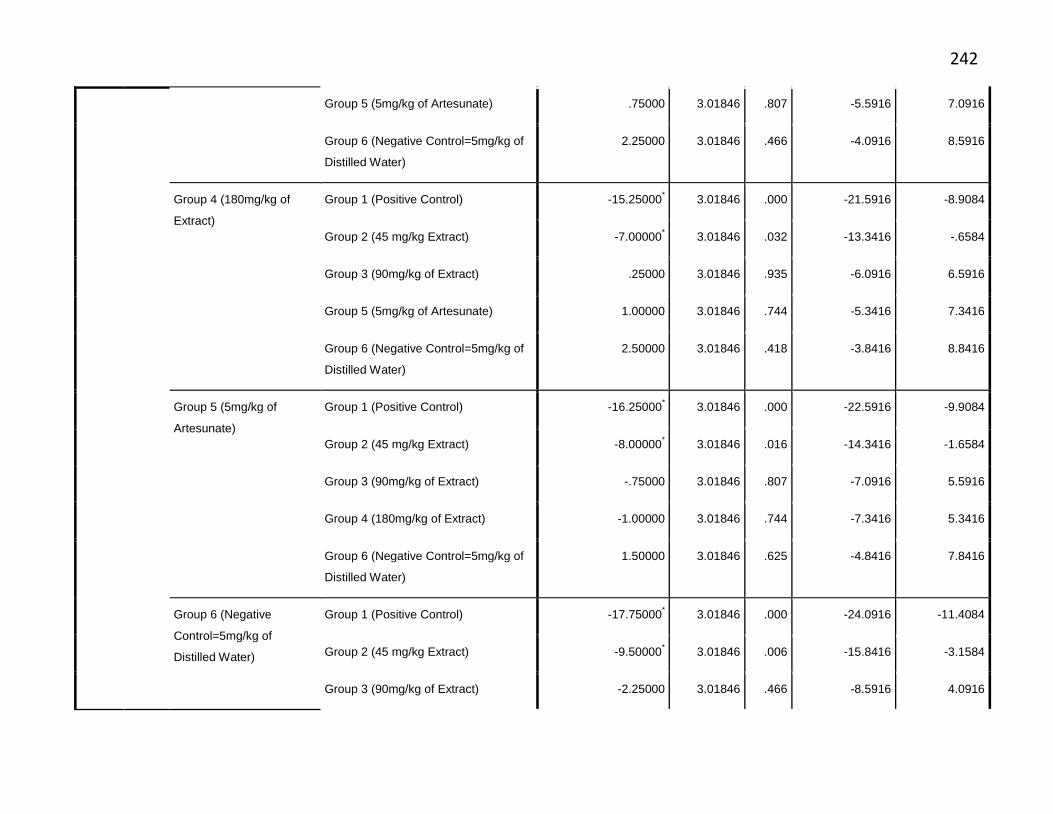
242
Group 5 (5mg/kg of Artesunate) .75000 3.01846 .807 -5.5916 7.0916
Group 6 (Negative Control=5mg/kg of
Distilled Water)
2.25000 3.01846 .466 -4.0916 8.5916
Group 4 (180mg/kg of
Extract)
Group 1 (Positive Control) -15.25000* 3.01846 .000 -21.5916 -8.9084
Group 2 (45 mg/kg Extract) -7.00000* 3.01846 .032 -13.3416 -.6584
Group 3 (90mg/kg of Extract) .25000 3.01846 .935 -6.0916 6.5916
Group 5 (5mg/kg of Artesunate) 1.00000 3.01846 .744 -5.3416 7.3416
Group 6 (Negative Control=5mg/kg of
Distilled Water)
2.50000 3.01846 .418 -3.8416 8.8416
Group 5 (5mg/kg of
Artesunate)
Group 1 (Positive Control) -16.25000* 3.01846 .000 -22.5916 -9.9084
Group 2 (45 mg/kg Extract) -8.00000* 3.01846 .016 -14.3416 -1.6584
Group 3 (90mg/kg of Extract) -.75000 3.01846 .807 -7.0916 5.5916
Group 4 (180mg/kg of Extract) -1.00000 3.01846 .744 -7.3416 5.3416
Group 6 (Negative Control=5mg/kg of
Distilled Water)
1.50000 3.01846 .625 -4.8416 7.8416
Group 6 (Negative
Control=5mg/kg of
Distilled Water)
Group 1 (Positive Control) -17.75000* 3.01846 .000 -24.0916 -11.4084
Group 2 (45 mg/kg Extract) -9.50000* 3.01846 .006 -15.8416 -3.1584
Group 3 (90mg/kg of Extract) -2.25000 3.01846 .466 -8.5916 4.0916
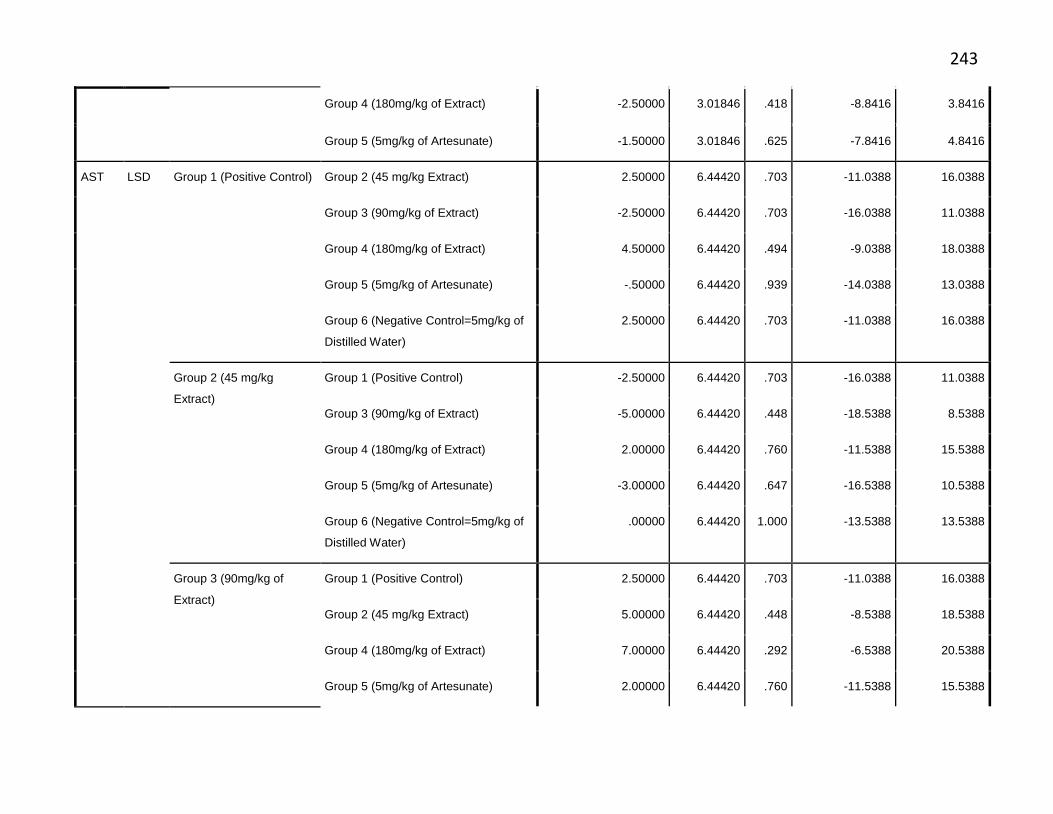
243
Group 4 (180mg/kg of Extract) -2.50000 3.01846 .418 -8.8416 3.8416
Group 5 (5mg/kg of Artesunate) -1.50000 3.01846 .625 -7.8416 4.8416
AST LSD Group 1 (Positive Control) Group 2 (45 mg/kg Extract) 2.50000 6.44420 .703 -11.0388 16.0388
Group 3 (90mg/kg of Extract) -2.50000 6.44420 .703 -16.0388 11.0388
Group 4 (180mg/kg of Extract) 4.50000 6.44420 .494 -9.0388 18.0388
Group 5 (5mg/kg of Artesunate) -.50000 6.44420 .939 -14.0388 13.0388
Group 6 (Negative Control=5mg/kg of
Distilled Water)
2.50000 6.44420 .703 -11.0388 16.0388
Group 2 (45 mg/kg
Extract)
Group 1 (Positive Control) -2.50000 6.44420 .703 -16.0388 11.0388
Group 3 (90mg/kg of Extract) -5.00000 6.44420 .448 -18.5388 8.5388
Group 4 (180mg/kg of Extract) 2.00000 6.44420 .760 -11.5388 15.5388
Group 5 (5mg/kg of Artesunate) -3.00000 6.44420 .647 -16.5388 10.5388
Group 6 (Negative Control=5mg/kg of
Distilled Water)
.00000 6.44420 1.000 -13.5388 13.5388
Group 3 (90mg/kg of
Extract)
Group 1 (Positive Control) 2.50000 6.44420 .703 -11.0388 16.0388
Group 2 (45 mg/kg Extract) 5.00000 6.44420 .448 -8.5388 18.5388
Group 4 (180mg/kg of Extract) 7.00000 6.44420 .292 -6.5388 20.5388
Group 5 (5mg/kg of Artesunate) 2.00000 6.44420 .760 -11.5388 15.5388
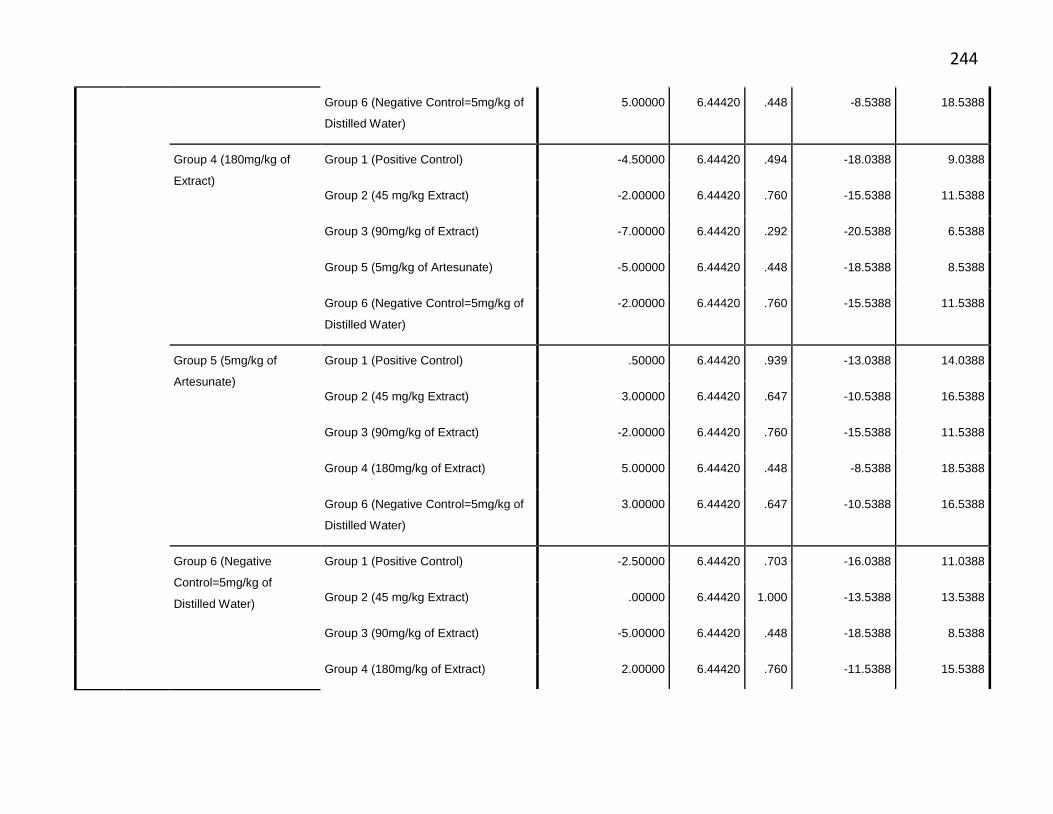
244
Group 6 (Negative Control=5mg/kg of
Distilled Water)
5.00000 6.44420 .448 -8.5388 18.5388
Group 4 (180mg/kg of
Extract)
Group 1 (Positive Control) -4.50000 6.44420 .494 -18.0388 9.0388
Group 2 (45 mg/kg Extract) -2.00000 6.44420 .760 -15.5388 11.5388
Group 3 (90mg/kg of Extract) -7.00000 6.44420 .292 -20.5388 6.5388
Group 5 (5mg/kg of Artesunate) -5.00000 6.44420 .448 -18.5388 8.5388
Group 6 (Negative Control=5mg/kg of
Distilled Water)
-2.00000 6.44420 .760 -15.5388 11.5388
Group 5 (5mg/kg of
Artesunate)
Group 1 (Positive Control) .50000 6.44420 .939 -13.0388 14.0388
Group 2 (45 mg/kg Extract) 3.00000 6.44420 .647 -10.5388 16.5388
Group 3 (90mg/kg of Extract) -2.00000 6.44420 .760 -15.5388 11.5388
Group 4 (180mg/kg of Extract) 5.00000 6.44420 .448 -8.5388 18.5388
Group 6 (Negative Control=5mg/kg of
Distilled Water)
3.00000 6.44420 .647 -10.5388 16.5388
Group 6 (Negative
Control=5mg/kg of
Distilled Water)
Group 1 (Positive Control) -2.50000 6.44420 .703 -16.0388 11.0388
Group 2 (45 mg/kg Extract) .00000 6.44420 1.000 -13.5388 13.5388
Group 3 (90mg/kg of Extract) -5.00000 6.44420 .448 -18.5388 8.5388
Group 4 (180mg/kg of Extract) 2.00000 6.44420 .760 -11.5388 15.5388
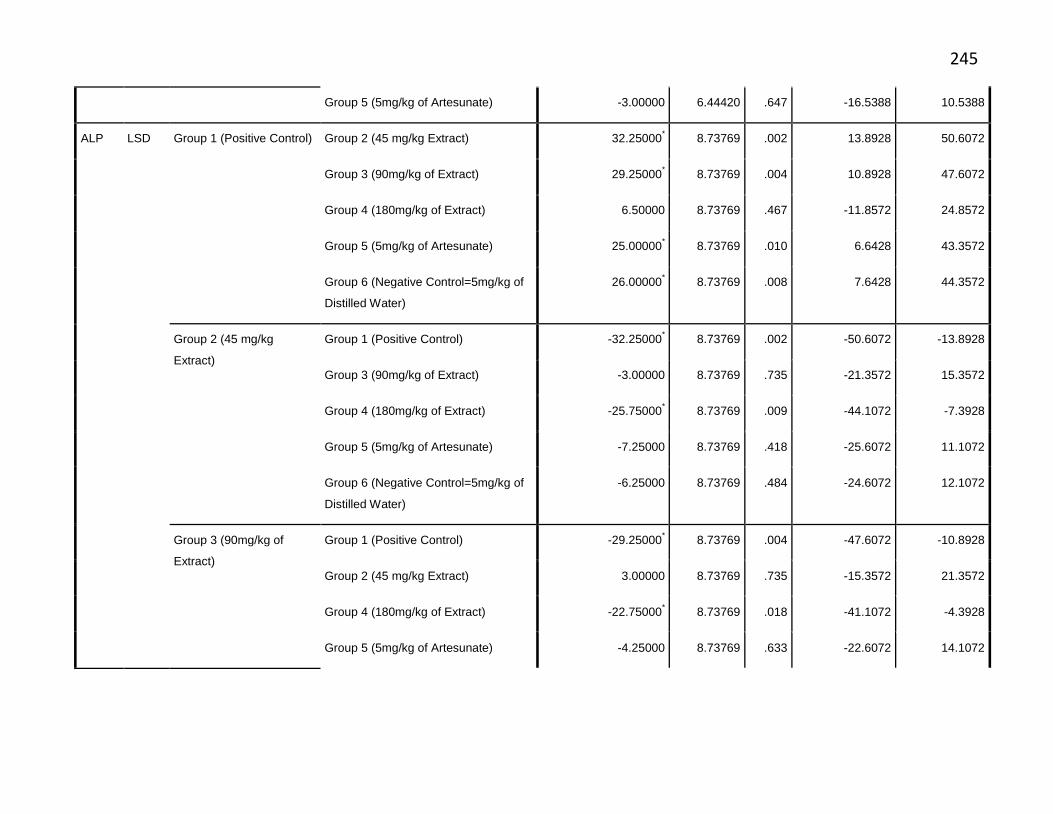
245
Group 5 (5mg/kg of Artesunate) -3.00000 6.44420 .647 -16.5388 10.5388
ALP LSD Group 1 (Positive Control) Group 2 (45 mg/kg Extract) 32.25000* 8.73769 .002 13.8928 50.6072
Group 3 (90mg/kg of Extract) 29.25000* 8.73769 .004 10.8928 47.6072
Group 4 (180mg/kg of Extract) 6.50000 8.73769 .467 -11.8572 24.8572
Group 5 (5mg/kg of Artesunate) 25.00000* 8.73769 .010 6.6428 43.3572
Group 6 (Negative Control=5mg/kg of
Distilled Water)
26.00000* 8.73769 .008 7.6428 44.3572
Group 2 (45 mg/kg
Extract)
Group 1 (Positive Control) -32.25000* 8.73769 .002 -50.6072 -13.8928
Group 3 (90mg/kg of Extract) -3.00000 8.73769 .735 -21.3572 15.3572
Group 4 (180mg/kg of Extract) -25.75000* 8.73769 .009 -44.1072 -7.3928
Group 5 (5mg/kg of Artesunate) -7.25000 8.73769 .418 -25.6072 11.1072
Group 6 (Negative Control=5mg/kg of
Distilled Water)
-6.25000 8.73769 .484 -24.6072 12.1072
Group 3 (90mg/kg of
Extract)
Group 1 (Positive Control) -29.25000* 8.73769 .004 -47.6072 -10.8928
Group 2 (45 mg/kg Extract) 3.00000 8.73769 .735 -15.3572 21.3572
Group 4 (180mg/kg of Extract) -22.75000* 8.73769 .018 -41.1072 -4.3928
Group 5 (5mg/kg of Artesunate) -4.25000 8.73769 .633 -22.6072 14.1072

246
Group 6 (Negative Control=5mg/kg of
Distilled Water)
-3.25000 8.73769 .714 -21.6072 15.1072
Group 4 (180mg/kg of
Extract)
Group 1 (Positive Control) -6.50000 8.73769 .467 -24.8572 11.8572
Group 2 (45 mg/kg Extract) 25.75000* 8.73769 .009 7.3928 44.1072
Group 3 (90mg/kg of Extract) 22.75000* 8.73769 .018 4.3928 41.1072
Group 5 (5mg/kg of Artesunate) 18.50000* 8.73769 .048 .1428 36.8572
Group 6 (Negative Control=5mg/kg of
Distilled Water)
19.50000* 8.73769 .039 1.1428 37.8572
Group 5 (5mg/kg of
Artesunate)
Group 1 (Positive Control) -25.00000* 8.73769 .010 -43.3572 -6.6428
Group 2 (45 mg/kg Extract) 7.25000 8.73769 .418 -11.1072 25.6072
Group 3 (90mg/kg of Extract) 4.25000 8.73769 .633 -14.1072 22.6072
Group 4 (180mg/kg of Extract) -18.50000* 8.73769 .048 -36.8572 -.1428
Group 6 (Negative Control=5mg/kg of
Distilled Water)
1.00000 8.73769 .910 -17.3572 19.3572
Group 6 (Negative
Control=5mg/kg of
Distilled Water)
Group 1 (Positive Control) -26.00000* 8.73769 .008 -44.3572 -7.6428
Group 2 (45 mg/kg Extract) 6.25000 8.73769 .484 -12.1072 24.6072
Group 3 (90mg/kg of Extract) 3.25000 8.73769 .714 -15.1072 21.6072
Group 4 (180mg/kg of Extract) -19.50000* 8.73769 .039 -37.8572 -1.1428

247
Group 5 (5mg/kg of Artesunate) -1.00000 8.73769 .910 -19.3572 17.3572
TB LSD Group 1 (Positive Control) Group 2 (45 mg/kg Extract) 1.05000 .72605 .165 -.4754 2.5754
Group 3 (90mg/kg of Extract) 3.95000* .72605 .000 2.4246 5.4754
Group 4 (180mg/kg of Extract) 5.00000* .72605 .000 3.4746 6.5254
Group 5 (5mg/kg of Artesunate) 7.07500* .72605 .000 5.5496 8.6004
Group 6 (Negative Control=5mg/kg of
Distilled Water)
7.15000* .72605 .000 5.6246 8.6754
Group 2 (45 mg/kg
Extract)
Group 1 (Positive Control) -1.05000 .72605 .165 -2.5754 .4754
Group 3 (90mg/kg of Extract) 2.90000* .72605 .001 1.3746 4.4254
Group 4 (180mg/kg of Extract) 3.95000* .72605 .000 2.4246 5.4754
Group 5 (5mg/kg of Artesunate) 6.02500* .72605 .000 4.4996 7.5504
Group 6 (Negative Control=5mg/kg of
Distilled Water)
6.10000* .72605 .000 4.5746 7.6254
Group 3 (90mg/kg of
Extract)
Group 1 (Positive Control) -3.95000* .72605 .000 -5.4754 -2.4246
Group 2 (45 mg/kg Extract) -2.90000* .72605 .001 -4.4254 -1.3746
Group 4 (180mg/kg of Extract) 1.05000 .72605 .165 -.4754 2.5754
Group 5 (5mg/kg of Artesunate) 3.12500* .72605 .000 1.5996 4.6504
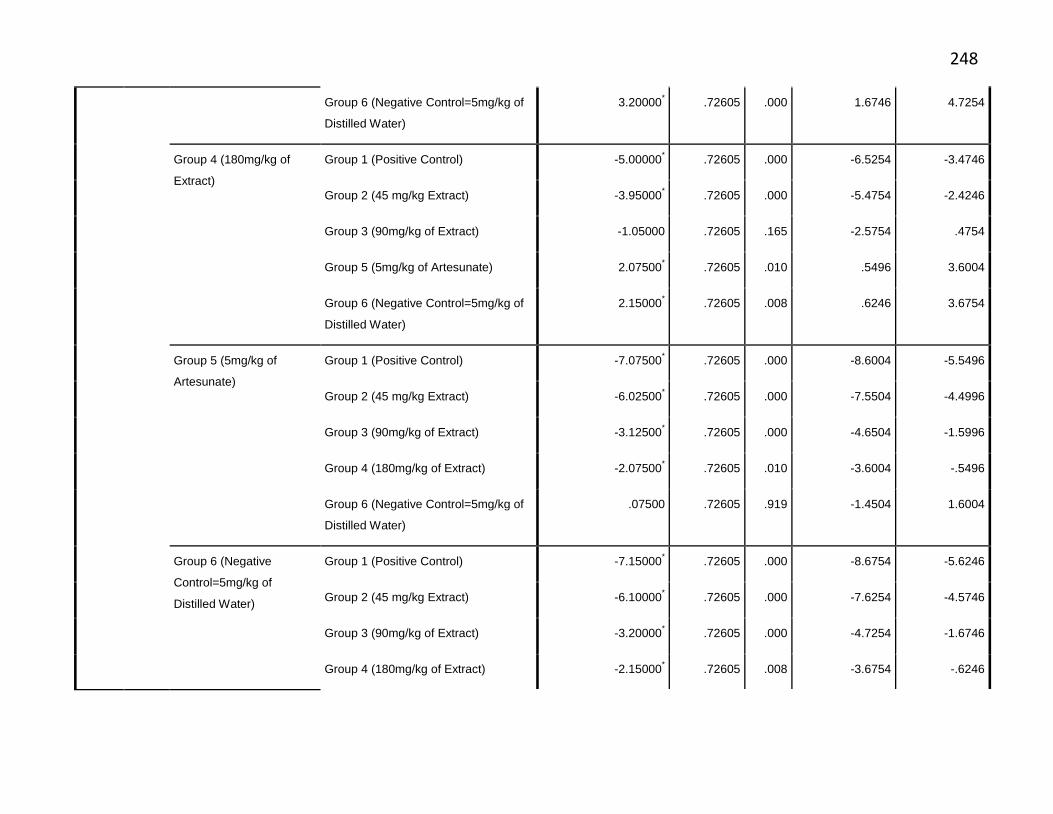
248
Group 6 (Negative Control=5mg/kg of
Distilled Water)
3.20000* .72605 .000 1.6746 4.7254
Group 4 (180mg/kg of
Extract)
Group 1 (Positive Control) -5.00000* .72605 .000 -6.5254 -3.4746
Group 2 (45 mg/kg Extract) -3.95000* .72605 .000 -5.4754 -2.4246
Group 3 (90mg/kg of Extract) -1.05000 .72605 .165 -2.5754 .4754
Group 5 (5mg/kg of Artesunate) 2.07500* .72605 .010 .5496 3.6004
Group 6 (Negative Control=5mg/kg of
Distilled Water)
2.15000* .72605 .008 .6246 3.6754
Group 5 (5mg/kg of
Artesunate)
Group 1 (Positive Control) -7.07500* .72605 .000 -8.6004 -5.5496
Group 2 (45 mg/kg Extract) -6.02500* .72605 .000 -7.5504 -4.4996
Group 3 (90mg/kg of Extract) -3.12500* .72605 .000 -4.6504 -1.5996
Group 4 (180mg/kg of Extract) -2.07500* .72605 .010 -3.6004 -.5496
Group 6 (Negative Control=5mg/kg of
Distilled Water)
.07500 .72605 .919 -1.4504 1.6004
Group 6 (Negative
Control=5mg/kg of
Distilled Water)
Group 1 (Positive Control) -7.15000* .72605 .000 -8.6754 -5.6246
Group 2 (45 mg/kg Extract) -6.10000* .72605 .000 -7.6254 -4.5746
Group 3 (90mg/kg of Extract) -3.20000* .72605 .000 -4.7254 -1.6746
Group 4 (180mg/kg of Extract) -2.15000* .72605 .008 -3.6754 -.6246

249
Group 5 (5mg/kg of Artesunate) -.07500 .72605 .919 -1.6004 1.4504
Creati-
nine
LSD Group 1 (Positive Control) Group 2 (45 mg/kg Extract) 3.50000* 1.44097 .026 .4726 6.5274
Group 3 (90mg/kg of Extract) 6.00000* 1.44097 .001 2.9726 9.0274
Group 4 (180mg/kg of Extract) 3.50000* 1.44097 .026 .4726 6.5274
Group 5 (5mg/kg of Artesunate) 8.50000* 1.44097 .000 5.4726 11.5274
Group 6 (Negative Control=5mg/kg of
Distilled Water)
8.75000* 1.44097 .000 5.7226 11.7774
Group 2 (45 mg/kg
Extract)
Group 1 (Positive Control) -3.50000* 1.44097 .026 -6.5274 -.4726
Group 3 (90mg/kg of Extract) 2.50000 1.44097 .100 -.5274 5.5274
Group 4 (180mg/kg of Extract) .00000 1.44097 1.000 -3.0274 3.0274
Group 5 (5mg/kg of Artesunate) 5.00000* 1.44097 .003 1.9726 8.0274
Group 6 (Negative Control=5mg/kg of
Distilled Water)
5.25000* 1.44097 .002 2.2226 8.2774
Group 3 (90mg/kg of
Extract)
Group 1 (Positive Control) -6.00000* 1.44097 .001 -9.0274 -2.9726
Group 2 (45 mg/kg Extract) -2.50000 1.44097 .100 -5.5274 .5274
Group 4 (180mg/kg of Extract) -2.50000 1.44097 .100 -5.5274 .5274
Group 5 (5mg/kg of Artesunate) 2.50000 1.44097 .100 -.5274 5.5274

250
Group 6 (Negative Control=5mg/kg of
Distilled Water)
2.75000 1.44097 .072 -.2774 5.7774
Group 4 (180mg/kg of
Extract)
Group 1 (Positive Control) -3.50000* 1.44097 .026 -6.5274 -.4726
Group 2 (45 mg/kg Extract) .00000 1.44097 1.000 -3.0274 3.0274
Group 3 (90mg/kg of Extract) 2.50000 1.44097 .100 -.5274 5.5274
Group 5 (5mg/kg of Artesunate) 5.00000* 1.44097 .003 1.9726 8.0274
Group 6 (Negative Control=5mg/kg of
Distilled Water)
5.25000* 1.44097 .002 2.2226 8.2774
Group 5 (5mg/kg of
Artesunate)
Group 1 (Positive Control) -8.50000* 1.44097 .000 -11.5274 -5.4726
Group 2 (45 mg/kg Extract) -5.00000* 1.44097 .003 -8.0274 -1.9726
Group 3 (90mg/kg of Extract) -2.50000 1.44097 .100 -5.5274 .5274
Group 4 (180mg/kg of Extract) -5.00000* 1.44097 .003 -8.0274 -1.9726
Group 6 (Negative Control=5mg/kg of
Distilled Water)
.25000 1.44097 .864 -2.7774 3.2774
Group 6 (Negative
Control=5mg/kg of
Distilled Water)
Group 1 (Positive Control) -8.75000* 1.44097 .000 -11.7774 -5.7226
Group 2 (45 mg/kg Extract) -5.25000* 1.44097 .002 -8.2774 -2.2226
Group 3 (90mg/kg of Extract) -2.75000 1.44097 .072 -5.7774 .2774
Group 4 (180mg/kg of Extract) -5.25000* 1.44097 .002 -8.2774 -2.2226

251
Group 5 (5mg/kg of Artesunate) -.25000 1.44097 .864 -3.2774 2.7774
Urea LSD Group 1 (Positive Control) Group 2 (45 mg/kg Extract) .25000 .18708 .198 -.1430 .6430
Group 3 (90mg/kg of Extract) .07500 .18708 .693 -.3180 .4680
Group 4 (180mg/kg of Extract) .20000 .18708 .299 -.1930 .5930
Group 5 (5mg/kg of Artesunate) -.15000 .18708 .433 -.5430 .2430
Group 6 (Negative Control=5mg/kg of
Distilled Water)
-.27500 .18708 .159 -.6680 .1180
Group 2 (45 mg/kg
Extract)
Group 1 (Positive Control) -.25000 .18708 .198 -.6430 .1430
Group 3 (90mg/kg of Extract) -.17500 .18708 .362 -.5680 .2180
Group 4 (180mg/kg of Extract) -.05000 .18708 .792 -.4430 .3430
Group 5 (5mg/kg of Artesunate) -.40000* .18708 .046 -.7930 -.0070
Group 6 (Negative Control=5mg/kg of
Distilled Water)
-.52500* .18708 .012 -.9180 -.1320
Group 3 (90mg/kg of
Extract)
Group 1 (Positive Control) -.07500 .18708 .693 -.4680 .3180
Group 2 (45 mg/kg Extract) .17500 .18708 .362 -.2180 .5680
Group 4 (180mg/kg of Extract) .12500 .18708 .513 -.2680 .5180
Group 5 (5mg/kg of Artesunate) -.22500 .18708 .245 -.6180 .1680

252
Group 6 (Negative Control=5mg/kg of
Distilled Water)
-.35000 .18708 .078 -.7430 .0430
Group 4 (180mg/kg of
Extract)
Group 1 (Positive Control) -.20000 .18708 .299 -.5930 .1930
Group 2 (45 mg/kg Extract) .05000 .18708 .792 -.3430 .4430
Group 3 (90mg/kg of Extract) -.12500 .18708 .513 -.5180 .2680
Group 5 (5mg/kg of Artesunate) -.35000 .18708 .078 -.7430 .0430
Group 6 (Negative Control=5mg/kg of
Distilled Water)
-.47500* .18708 .021 -.8680 -.0820
Group 5 (5mg/kg of
Artesunate)
Group 1 (Positive Control) .15000 .18708 .433 -.2430 .5430
Group 2 (45 mg/kg Extract) .40000* .18708 .046 .0070 .7930
Group 3 (90mg/kg of Extract) .22500 .18708 .245 -.1680 .6180
Group 4 (180mg/kg of Extract) .35000 .18708 .078 -.0430 .7430
Group 6 (Negative Control=5mg/kg of
Distilled Water)
-.12500 .18708 .513 -.5180 .2680
Group 6 (Negative
Control=5mg/kg of
Distilled Water)
Group 1 (Positive Control) .27500 .18708 .159 -.1180 .6680
Group 2 (45 mg/kg Extract) .52500* .18708 .012 .1320 .9180
Group 3 (90mg/kg of Extract) .35000 .18708 .078 -.0430 .7430
Group 4 (180mg/kg of Extract) .47500* .18708 .021 .0820 .8680

253
Group 5 (5mg/kg of Artesunate) .12500 .18708 .513 -.2680 .5180
Choles
-terol
LSD Group 1 (Positive Control) Group 2 (45 mg/kg Extract) .19500 .26660 .474 -.3651 .7551
Group 3 (90mg/kg of Extract) .07750 .26660 .775 -.4826 .6376
Group 4 (180mg/kg of Extract) .28500 .26660 .299 -.2751 .8451
Group 5 (5mg/kg of Artesunate) .19250 .26660 .480 -.3676 .7526
Group 6 (Negative Control=5mg/kg of
Distilled Water)
.01250 .26660 .963 -.5476 .5726
Group 2 (45 mg/kg
Extract)
Group 1 (Positive Control) -.19500 .26660 .474 -.7551 .3651
Group 3 (90mg/kg of Extract) -.11750 .26660 .665 -.6776 .4426
Group 4 (180mg/kg of Extract) .09000 .26660 .740 -.4701 .6501
Group 5 (5mg/kg of Artesunate) -.00250 .26660 .993 -.5626 .5576
Group 6 (Negative Control=5mg/kg of
Distilled Water)
-.18250 .26660 .502 -.7426 .3776
Group 3 (90mg/kg of
Extract)
Group 1 (Positive Control) -.07750 .26660 .775 -.6376 .4826
Group 2 (45 mg/kg Extract) .11750 .26660 .665 -.4426 .6776
Group 4 (180mg/kg of Extract) .20750 .26660 .446 -.3526 .7676
Group 5 (5mg/kg of Artesunate) .11500 .26660 .671 -.4451 .6751
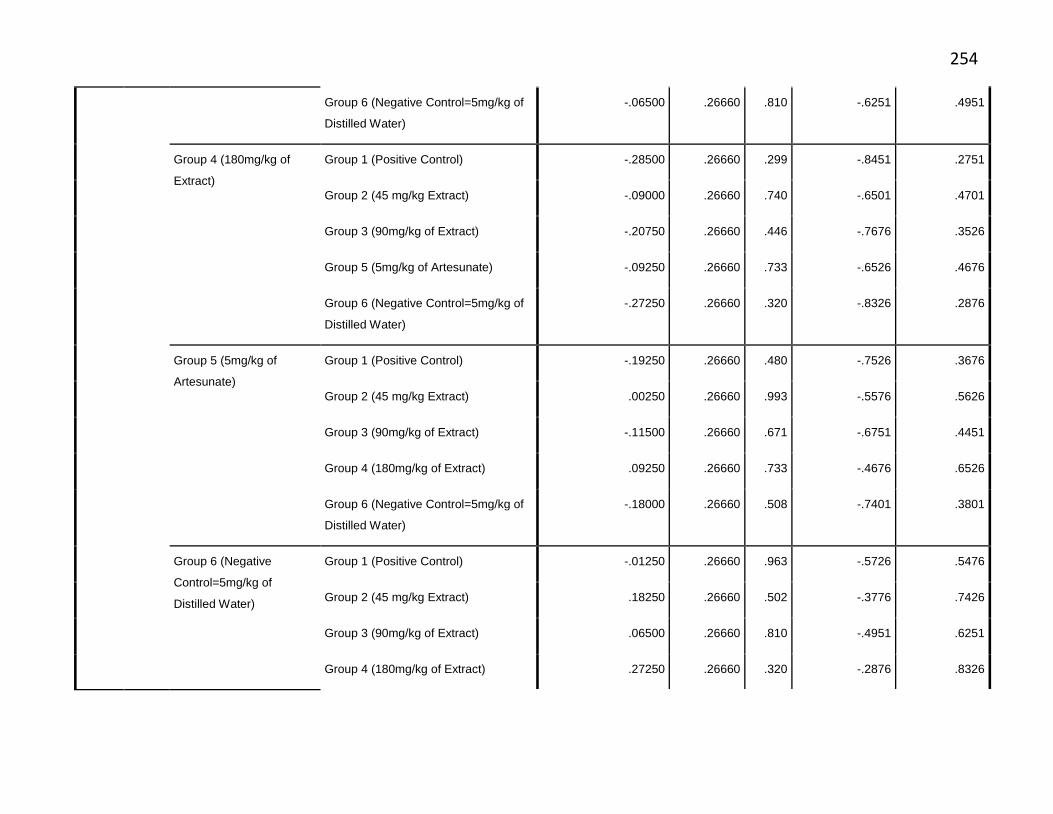
254
Group 6 (Negative Control=5mg/kg of
Distilled Water)
-.06500 .26660 .810 -.6251 .4951
Group 4 (180mg/kg of
Extract)
Group 1 (Positive Control) -.28500 .26660 .299 -.8451 .2751
Group 2 (45 mg/kg Extract) -.09000 .26660 .740 -.6501 .4701
Group 3 (90mg/kg of Extract) -.20750 .26660 .446 -.7676 .3526
Group 5 (5mg/kg of Artesunate) -.09250 .26660 .733 -.6526 .4676
Group 6 (Negative Control=5mg/kg of
Distilled Water)
-.27250 .26660 .320 -.8326 .2876
Group 5 (5mg/kg of
Artesunate)
Group 1 (Positive Control) -.19250 .26660 .480 -.7526 .3676
Group 2 (45 mg/kg Extract) .00250 .26660 .993 -.5576 .5626
Group 3 (90mg/kg of Extract) -.11500 .26660 .671 -.6751 .4451
Group 4 (180mg/kg of Extract) .09250 .26660 .733 -.4676 .6526
Group 6 (Negative Control=5mg/kg of
Distilled Water)
-.18000 .26660 .508 -.7401 .3801
Group 6 (Negative
Control=5mg/kg of
Distilled Water)
Group 1 (Positive Control) -.01250 .26660 .963 -.5726 .5476
Group 2 (45 mg/kg Extract) .18250 .26660 .502 -.3776 .7426
Group 3 (90mg/kg of Extract) .06500 .26660 .810 -.4951 .6251
Group 4 (180mg/kg of Extract) .27250 .26660 .320 -.2876 .8326

255
Group 5 (5mg/kg of Artesunate) .18000 .26660 .508 -.3801 .7401
HDL LSD Group 1 (Positive Control) Group 2 (45 mg/kg Extract) -.06750 .13062 .612 -.3419 .2069
Group 3 (90mg/kg of Extract) -.04750 .13062 .720 -.3219 .2269
Group 4 (180mg/kg of Extract) -.09750 .13062 .465 -.3719 .1769
Group 5 (5mg/kg of Artesunate) .08500 .13062 .523 -.1894 .3594
Group 6 (Negative Control=5mg/kg of
Distilled Water)
.09250 .13062 .488 -.1819 .3669
Group 2 (45 mg/kg
Extract)
Group 1 (Positive Control) .06750 .13062 .612 -.2069 .3419
Group 3 (90mg/kg of Extract) .02000 .13062 .880 -.2544 .2944
Group 4 (180mg/kg of Extract) -.03000 .13062 .821 -.3044 .2444
Group 5 (5mg/kg of Artesunate) .15250 .13062 .258 -.1219 .4269
Group 6 (Negative Control=5mg/kg of
Distilled Water)
.16000 .13062 .236 -.1144 .4344
Group 3 (90mg/kg of
Extract)
Group 1 (Positive Control) .04750 .13062 .720 -.2269 .3219
Group 2 (45 mg/kg Extract) -.02000 .13062 .880 -.2944 .2544
Group 4 (180mg/kg of Extract) -.05000 .13062 .706 -.3244 .2244
Group 5 (5mg/kg of Artesunate) .13250 .13062 .324 -.1419 .4069
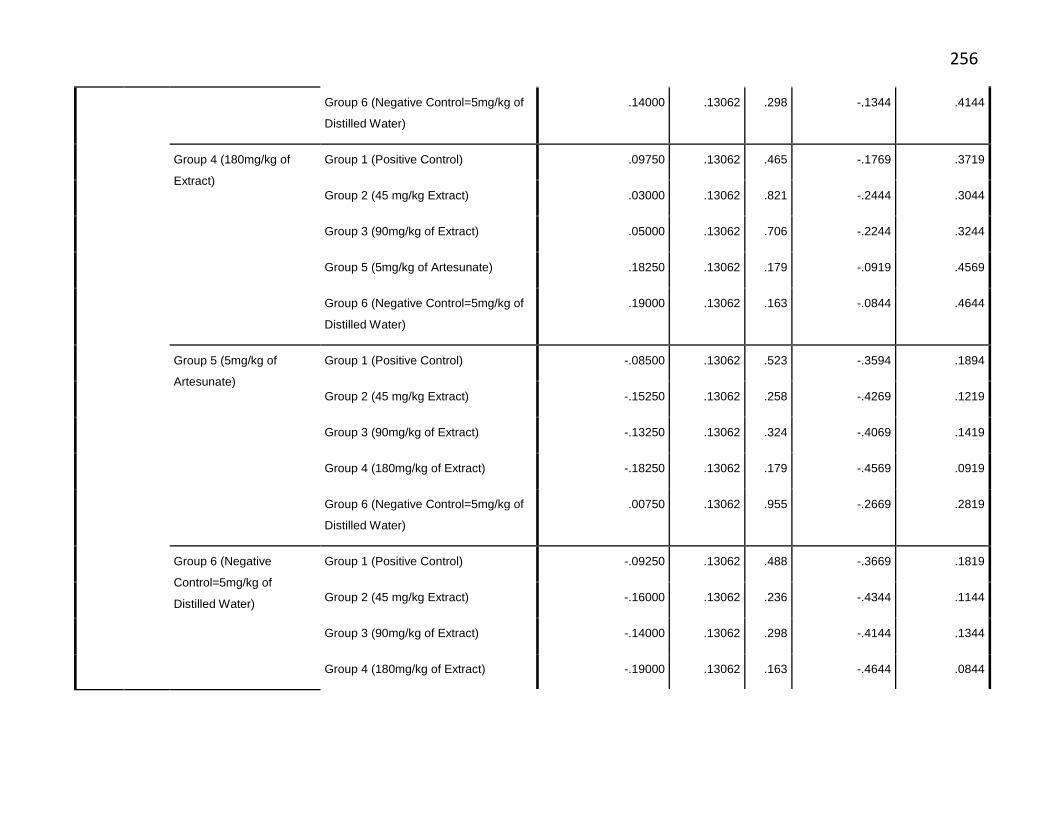
256
Group 6 (Negative Control=5mg/kg of
Distilled Water)
.14000 .13062 .298 -.1344 .4144
Group 4 (180mg/kg of
Extract)
Group 1 (Positive Control) .09750 .13062 .465 -.1769 .3719
Group 2 (45 mg/kg Extract) .03000 .13062 .821 -.2444 .3044
Group 3 (90mg/kg of Extract) .05000 .13062 .706 -.2244 .3244
Group 5 (5mg/kg of Artesunate) .18250 .13062 .179 -.0919 .4569
Group 6 (Negative Control=5mg/kg of
Distilled Water)
.19000 .13062 .163 -.0844 .4644
Group 5 (5mg/kg of
Artesunate)
Group 1 (Positive Control) -.08500 .13062 .523 -.3594 .1894
Group 2 (45 mg/kg Extract) -.15250 .13062 .258 -.4269 .1219
Group 3 (90mg/kg of Extract) -.13250 .13062 .324 -.4069 .1419
Group 4 (180mg/kg of Extract) -.18250 .13062 .179 -.4569 .0919
Group 6 (Negative Control=5mg/kg of
Distilled Water)
.00750 .13062 .955 -.2669 .2819
Group 6 (Negative
Control=5mg/kg of
Distilled Water)
Group 1 (Positive Control) -.09250 .13062 .488 -.3669 .1819
Group 2 (45 mg/kg Extract) -.16000 .13062 .236 -.4344 .1144
Group 3 (90mg/kg of Extract) -.14000 .13062 .298 -.4144 .1344
Group 4 (180mg/kg of Extract) -.19000 .13062 .163 -.4644 .0844
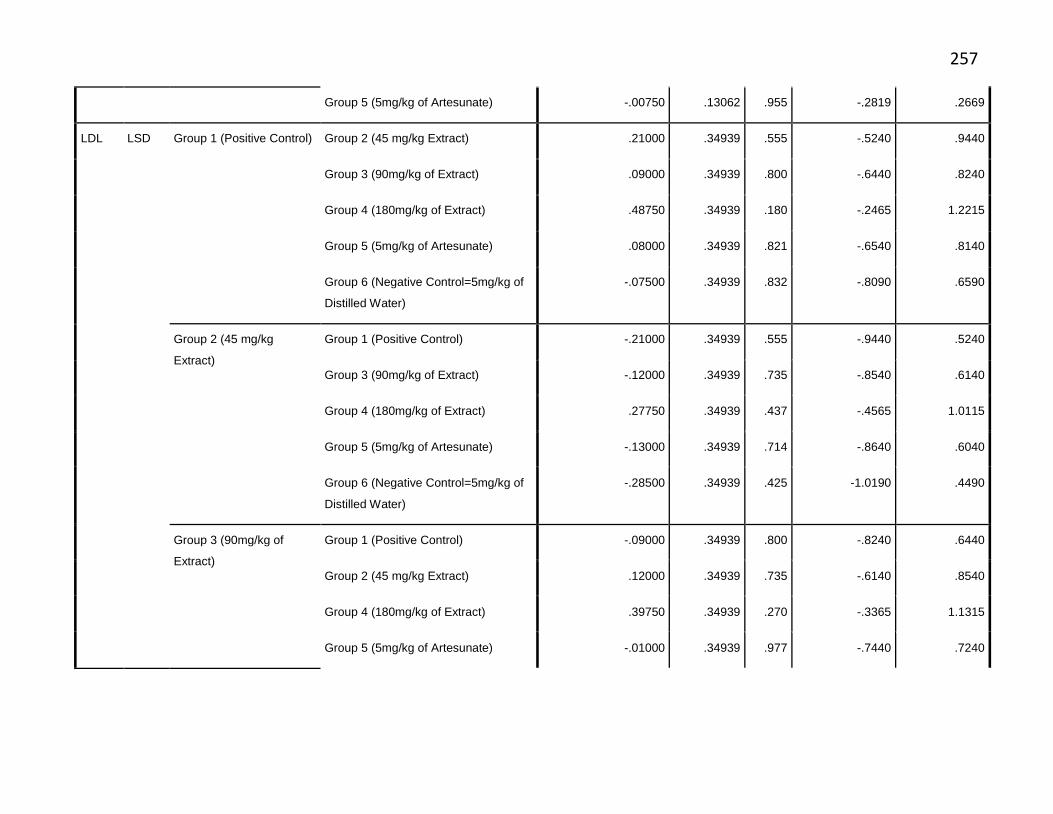
257
Group 5 (5mg/kg of Artesunate) -.00750 .13062 .955 -.2819 .2669
LDL LSD Group 1 (Positive Control) Group 2 (45 mg/kg Extract) .21000 .34939 .555 -.5240 .9440
Group 3 (90mg/kg of Extract) .09000 .34939 .800 -.6440 .8240
Group 4 (180mg/kg of Extract) .48750 .34939 .180 -.2465 1.2215
Group 5 (5mg/kg of Artesunate) .08000 .34939 .821 -.6540 .8140
Group 6 (Negative Control=5mg/kg of
Distilled Water)
-.07500 .34939 .832 -.8090 .6590
Group 2 (45 mg/kg
Extract)
Group 1 (Positive Control) -.21000 .34939 .555 -.9440 .5240
Group 3 (90mg/kg of Extract) -.12000 .34939 .735 -.8540 .6140
Group 4 (180mg/kg of Extract) .27750 .34939 .437 -.4565 1.0115
Group 5 (5mg/kg of Artesunate) -.13000 .34939 .714 -.8640 .6040
Group 6 (Negative Control=5mg/kg of
Distilled Water)
-.28500 .34939 .425 -1.0190 .4490
Group 3 (90mg/kg of
Extract)
Group 1 (Positive Control) -.09000 .34939 .800 -.8240 .6440
Group 2 (45 mg/kg Extract) .12000 .34939 .735 -.6140 .8540
Group 4 (180mg/kg of Extract) .39750 .34939 .270 -.3365 1.1315
Group 5 (5mg/kg of Artesunate) -.01000 .34939 .977 -.7440 .7240

258
Group 6 (Negative Control=5mg/kg of
Distilled Water)
-.16500 .34939 .642 -.8990 .5690
Group 4 (180mg/kg of
Extract)
Group 1 (Positive Control) -.48750 .34939 .180 -1.2215 .2465
Group 2 (45 mg/kg Extract) -.27750 .34939 .437 -1.0115 .4565
Group 3 (90mg/kg of Extract) -.39750 .34939 .270 -1.1315 .3365
Group 5 (5mg/kg of Artesunate) -.40750 .34939 .259 -1.1415 .3265
Group 6 (Negative Control=5mg/kg of
Distilled Water)
-.56250 .34939 .125 -1.2965 .1715
Group 5 (5mg/kg of
Artesunate)
Group 1 (Positive Control) -.08000 .34939 .821 -.8140 .6540
Group 2 (45 mg/kg Extract) .13000 .34939 .714 -.6040 .8640
Group 3 (90mg/kg of Extract) .01000 .34939 .977 -.7240 .7440
Group 4 (180mg/kg of Extract) .40750 .34939 .259 -.3265 1.1415
Group 6 (Negative Control=5mg/kg of
Distilled Water)
-.15500 .34939 .663 -.8890 .5790
Group 6 (Negative
Control=5mg/kg of
Distilled Water)
Group 1 (Positive Control) .07500 .34939 .832 -.6590 .8090
Group 2 (45 mg/kg Extract) .28500 .34939 .425 -.4490 1.0190
Group 3 (90mg/kg of Extract) .16500 .34939 .642 -.5690 .8990
Group 4 (180mg/kg of Extract) .56250 .34939 .125 -.1715 1.2965
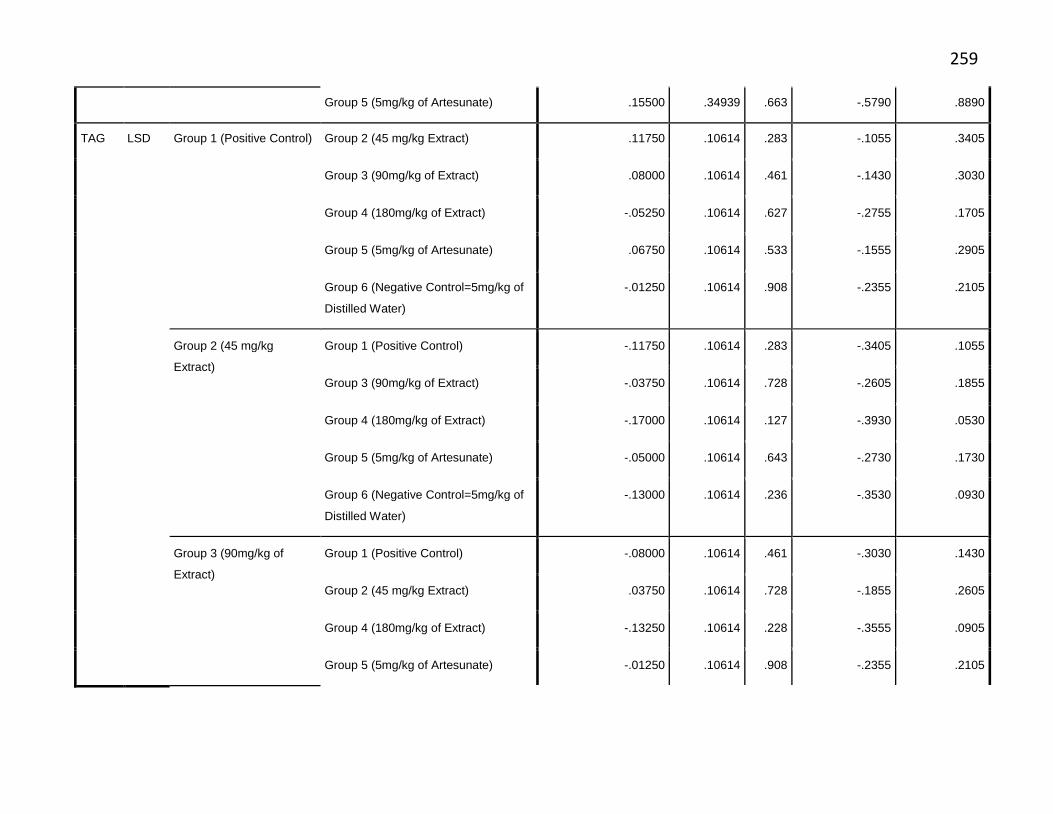
259
Group 5 (5mg/kg of Artesunate) .15500 .34939 .663 -.5790 .8890
TAG LSD Group 1 (Positive Control) Group 2 (45 mg/kg Extract) .11750 .10614 .283 -.1055 .3405
Group 3 (90mg/kg of Extract) .08000 .10614 .461 -.1430 .3030
Group 4 (180mg/kg of Extract) -.05250 .10614 .627 -.2755 .1705
Group 5 (5mg/kg of Artesunate) .06750 .10614 .533 -.1555 .2905
Group 6 (Negative Control=5mg/kg of
Distilled Water)
-.01250 .10614 .908 -.2355 .2105
Group 2 (45 mg/kg
Extract)
Group 1 (Positive Control) -.11750 .10614 .283 -.3405 .1055
Group 3 (90mg/kg of Extract) -.03750 .10614 .728 -.2605 .1855
Group 4 (180mg/kg of Extract) -.17000 .10614 .127 -.3930 .0530
Group 5 (5mg/kg of Artesunate) -.05000 .10614 .643 -.2730 .1730
Group 6 (Negative Control=5mg/kg of
Distilled Water)
-.13000 .10614 .236 -.3530 .0930
Group 3 (90mg/kg of
Extract)
Group 1 (Positive Control) -.08000 .10614 .461 -.3030 .1430
Group 2 (45 mg/kg Extract) .03750 .10614 .728 -.1855 .2605
Group 4 (180mg/kg of Extract) -.13250 .10614 .228 -.3555 .0905
Group 5 (5mg/kg of Artesunate) -.01250 .10614 .908 -.2355 .2105
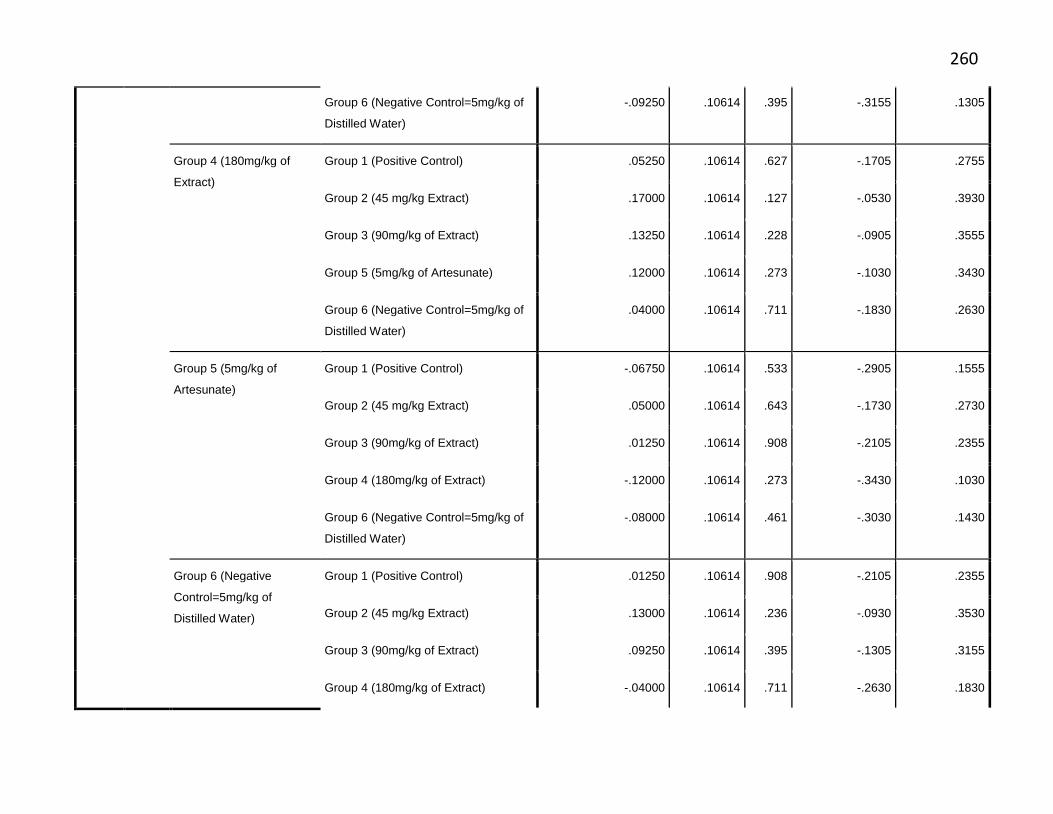
260
Group 6 (Negative Control=5mg/kg of
Distilled Water)
-.09250 .10614 .395 -.3155 .1305
Group 4 (180mg/kg of
Extract)
Group 1 (Positive Control) .05250 .10614 .627 -.1705 .2755
Group 2 (45 mg/kg Extract) .17000 .10614 .127 -.0530 .3930
Group 3 (90mg/kg of Extract) .13250 .10614 .228 -.0905 .3555
Group 5 (5mg/kg of Artesunate) .12000 .10614 .273 -.1030 .3430
Group 6 (Negative Control=5mg/kg of
Distilled Water)
.04000 .10614 .711 -.1830 .2630
Group 5 (5mg/kg of
Artesunate)
Group 1 (Positive Control) -.06750 .10614 .533 -.2905 .1555
Group 2 (45 mg/kg Extract) .05000 .10614 .643 -.1730 .2730
Group 3 (90mg/kg of Extract) .01250 .10614 .908 -.2105 .2355
Group 4 (180mg/kg of Extract) -.12000 .10614 .273 -.3430 .1030
Group 6 (Negative Control=5mg/kg of
Distilled Water)
-.08000 .10614 .461 -.3030 .1430
Group 6 (Negative
Control=5mg/kg of
Distilled Water)
Group 1 (Positive Control) .01250 .10614 .908 -.2105 .2355
Group 2 (45 mg/kg Extract) .13000 .10614 .236 -.0930 .3530
Group 3 (90mg/kg of Extract) .09250 .10614 .395 -.1305 .3155
Group 4 (180mg/kg of Extract) -.04000 .10614 .711 -.2630 .1830
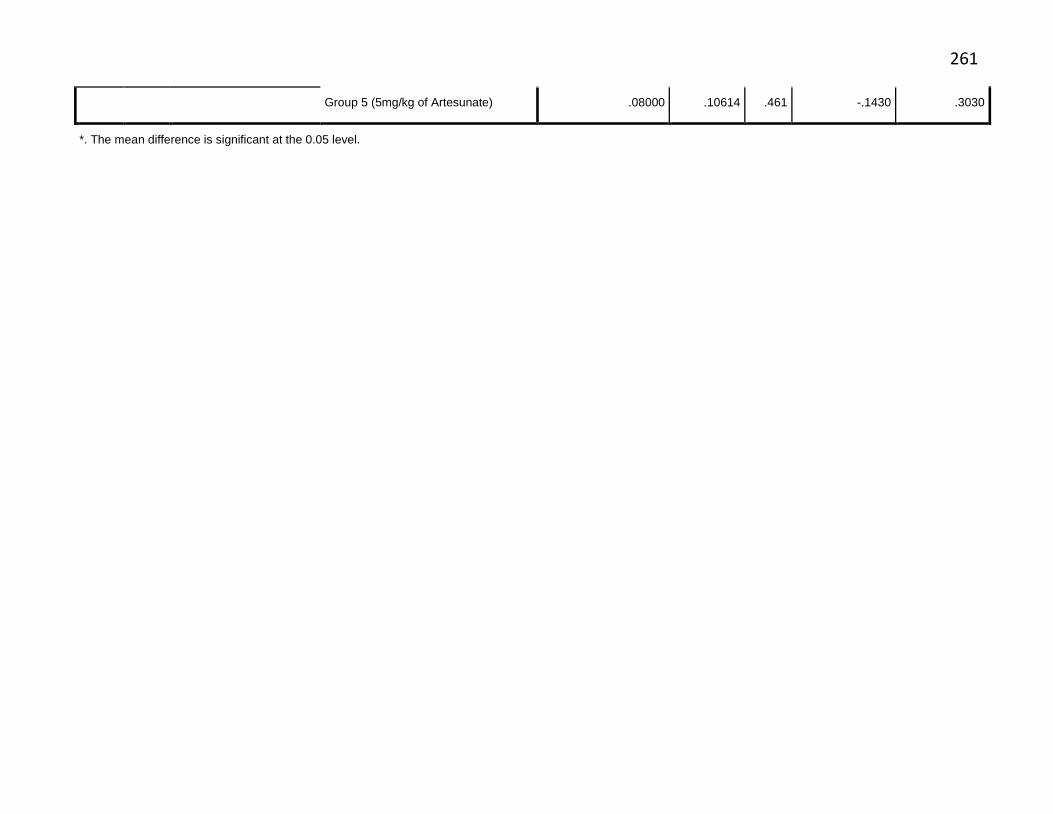
261
Group 5 (5mg/kg of Artesunate) .08000 .10614 .461 -.1430 .3030
*. The mean difference is significant at the 0.05 level.
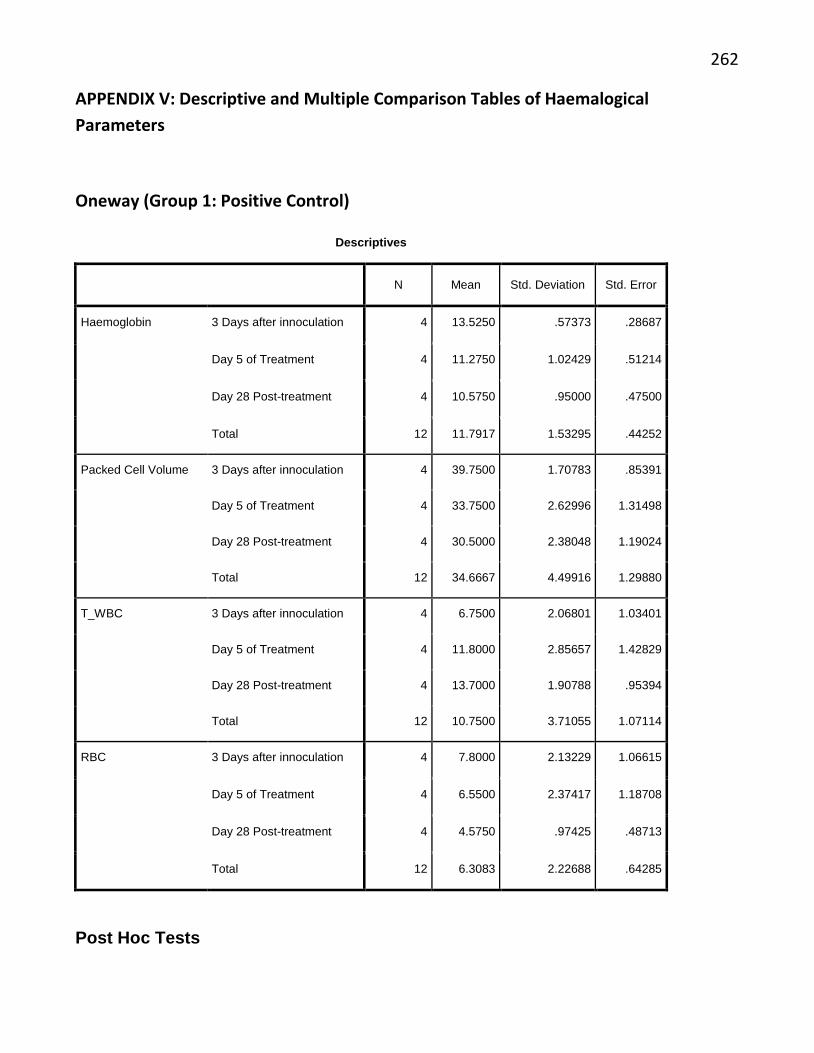
262
APPENDIX V: Descriptive and Multiple Comparison Tables of Haemalogical
Parameters
Oneway (Group 1: Positive Control)
Descriptives
N Mean Std. Deviation Std. Error
Haemoglobin 3 Days after innoculation 4 13.5250 .57373 .28687
Day 5 of Treatment 4 11.2750 1.02429 .51214
Day 28 Post-treatment 4 10.5750 .95000 .47500
Total 12 11.7917 1.53295 .44252
Packed Cell Volume 3 Days after innoculation 4 39.7500 1.70783 .85391
Day 5 of Treatment 4 33.7500 2.62996 1.31498
Day 28 Post-treatment 4 30.5000 2.38048 1.19024
Total 12 34.6667 4.49916 1.29880
T_WBC 3 Days after innoculation 4 6.7500 2.06801 1.03401
Day 5 of Treatment 4 11.8000 2.85657 1.42829
Day 28 Post-treatment 4 13.7000 1.90788 .95394
Total 12 10.7500 3.71055 1.07114
RBC 3 Days after innoculation 4 7.8000 2.13229 1.06615
Day 5 of Treatment 4 6.5500 2.37417 1.18708
Day 28 Post-treatment 4 4.5750 .97425 .48713
Total 12 6.3083 2.22688 .64285
Post Hoc Tests
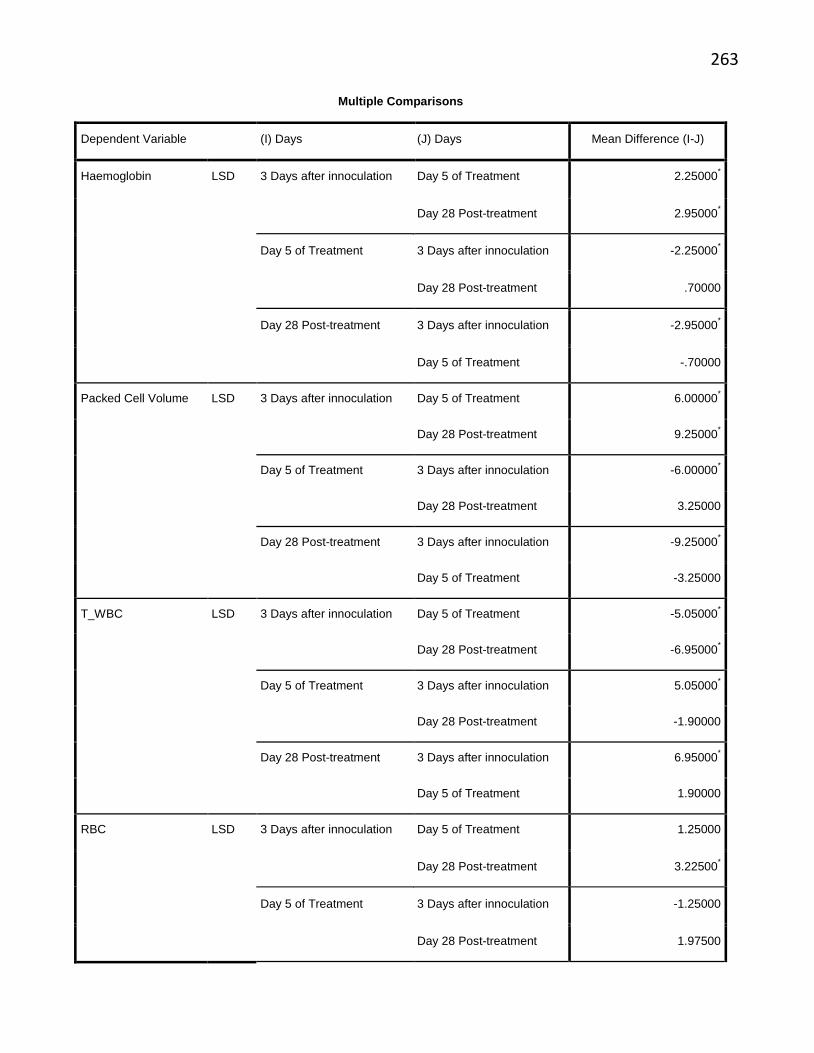
263
Multiple Comparisons
Dependent Variable (I) Days (J) Days Mean Difference (I-J)
Haemoglobin LSD 3 Days after innoculation Day 5 of Treatment 2.25000*
Day 28 Post-treatment 2.95000*
Day 5 of Treatment 3 Days after innoculation -2.25000*
Day 28 Post-treatment .70000
Day 28 Post-treatment 3 Days after innoculation -2.95000*
Day 5 of Treatment -.70000
Packed Cell Volume LSD 3 Days after innoculation Day 5 of Treatment 6.00000*
Day 28 Post-treatment 9.25000*
Day 5 of Treatment 3 Days after innoculation -6.00000*
Day 28 Post-treatment 3.25000
Day 28 Post-treatment 3 Days after innoculation -9.25000*
Day 5 of Treatment -3.25000
T_WBC LSD 3 Days after innoculation Day 5 of Treatment -5.05000*
Day 28 Post-treatment -6.95000*
Day 5 of Treatment 3 Days after innoculation 5.05000*
Day 28 Post-treatment -1.90000
Day 28 Post-treatment 3 Days after innoculation 6.95000*
Day 5 of Treatment 1.90000
RBC LSD 3 Days after innoculation Day 5 of Treatment 1.25000
Day 28 Post-treatment 3.22500*
Day 5 of Treatment 3 Days after innoculation -1.25000
Day 28 Post-treatment 1.97500
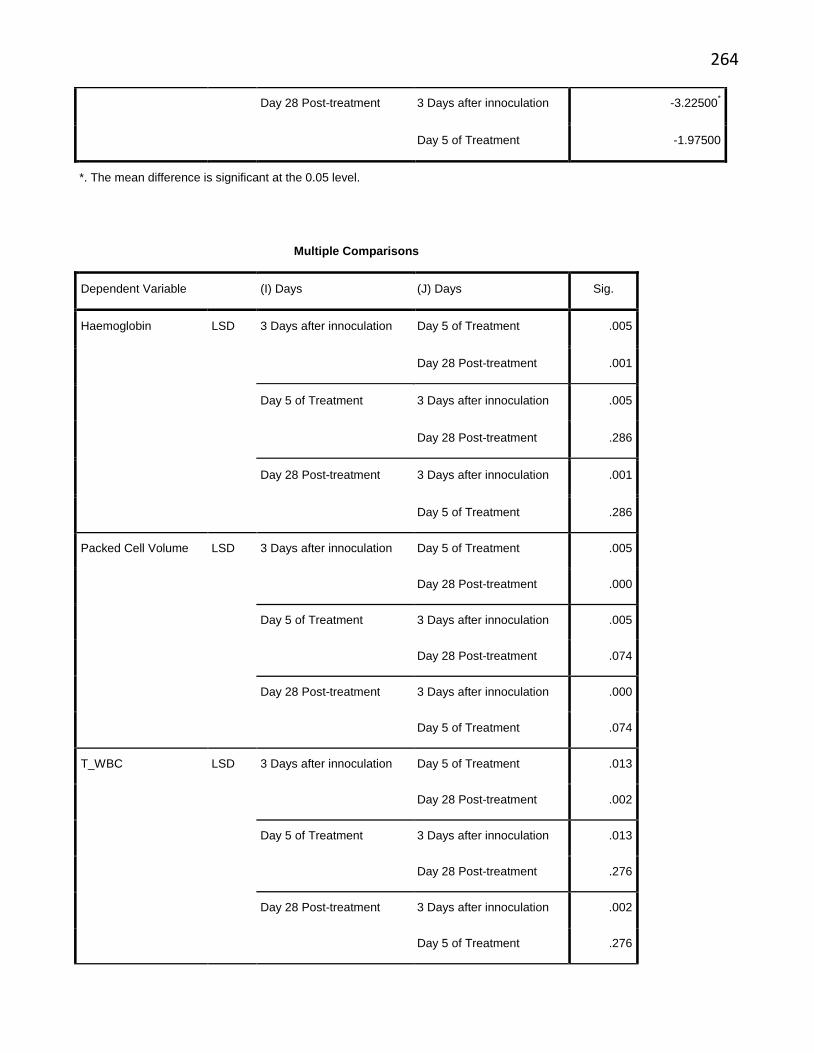
264
Day 28 Post-treatment 3 Days after innoculation -3.22500*
Day 5 of Treatment -1.97500
*. The mean difference is significant at the 0.05 level.
Multiple Comparisons
Dependent Variable (I) Days (J) Days Sig.
Haemoglobin LSD 3 Days after innoculation Day 5 of Treatment .005
Day 28 Post-treatment .001
Day 5 of Treatment 3 Days after innoculation .005
Day 28 Post-treatment .286
Day 28 Post-treatment 3 Days after innoculation .001
Day 5 of Treatment .286
Packed Cell Volume LSD 3 Days after innoculation Day 5 of Treatment .005
Day 28 Post-treatment .000
Day 5 of Treatment 3 Days after innoculation .005
Day 28 Post-treatment .074
Day 28 Post-treatment 3 Days after innoculation .000
Day 5 of Treatment .074
T_WBC LSD 3 Days after innoculation Day 5 of Treatment .013
Day 28 Post-treatment .002
Day 5 of Treatment 3 Days after innoculation .013
Day 28 Post-treatment .276
Day 28 Post-treatment 3 Days after innoculation .002
Day 5 of Treatment .276
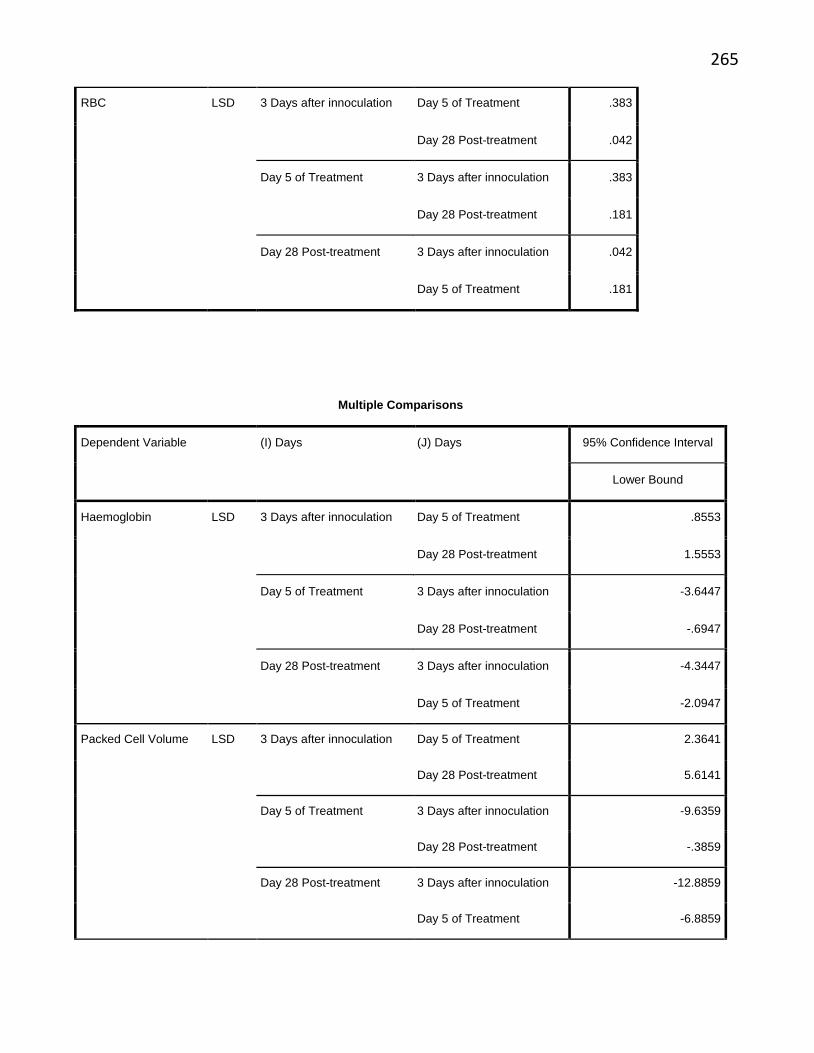
265
RBC LSD 3 Days after innoculation Day 5 of Treatment .383
Day 28 Post-treatment .042
Day 5 of Treatment 3 Days after innoculation .383
Day 28 Post-treatment .181
Day 28 Post-treatment 3 Days after innoculation .042
Day 5 of Treatment .181
Multiple Comparisons
Dependent Variable (I) Days (J) Days 95% Confidence Interval
Lower Bound
Haemoglobin LSD 3 Days after innoculation Day 5 of Treatment .8553
Day 28 Post-treatment 1.5553
Day 5 of Treatment 3 Days after innoculation -3.6447
Day 28 Post-treatment -.6947
Day 28 Post-treatment 3 Days after innoculation -4.3447
Day 5 of Treatment -2.0947
Packed Cell Volume LSD 3 Days after innoculation Day 5 of Treatment 2.3641
Day 28 Post-treatment 5.6141
Day 5 of Treatment 3 Days after innoculation -9.6359
Day 28 Post-treatment -.3859
Day 28 Post-treatment 3 Days after innoculation -12.8859
Day 5 of Treatment -6.8859
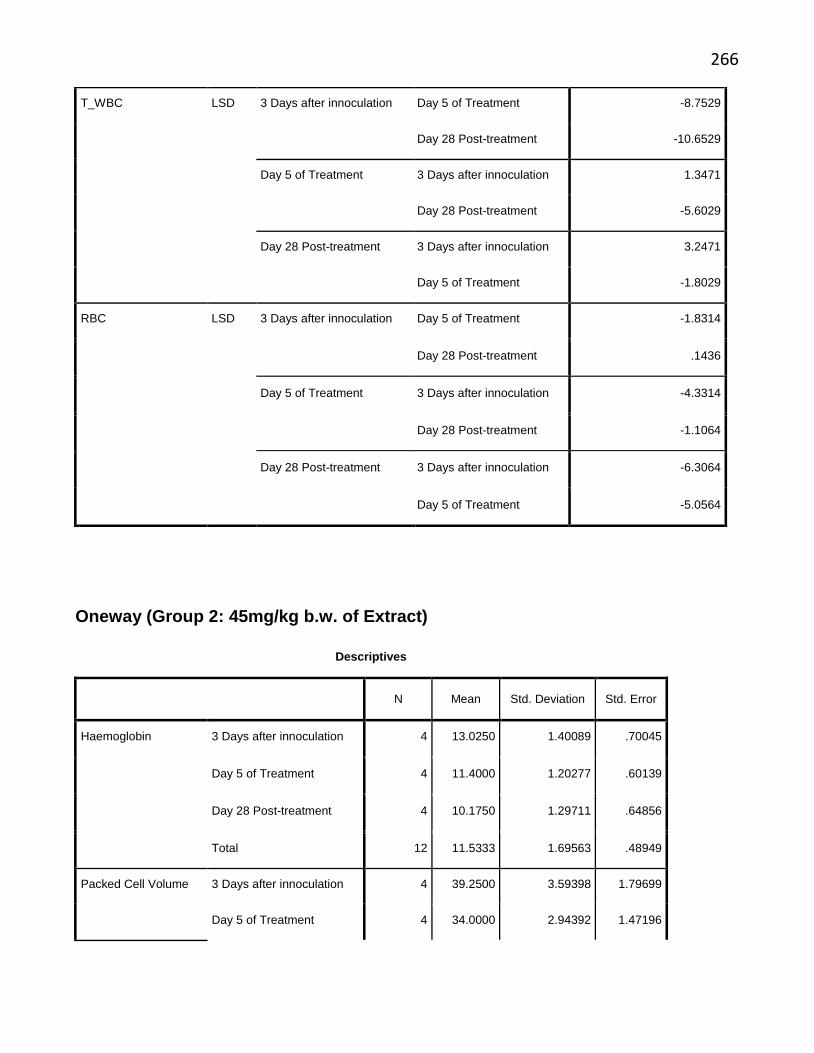
266
T_WBC LSD 3 Days after innoculation Day 5 of Treatment -8.7529
Day 28 Post-treatment -10.6529
Day 5 of Treatment 3 Days after innoculation 1.3471
Day 28 Post-treatment -5.6029
Day 28 Post-treatment 3 Days after innoculation 3.2471
Day 5 of Treatment -1.8029
RBC LSD 3 Days after innoculation Day 5 of Treatment -1.8314
Day 28 Post-treatment .1436
Day 5 of Treatment 3 Days after innoculation -4.3314
Day 28 Post-treatment -1.1064
Day 28 Post-treatment 3 Days after innoculation -6.3064
Day 5 of Treatment -5.0564
Oneway (Group 2: 45mg/kg b.w. of Extract)
Descriptives
N Mean Std. Deviation Std. Error
Haemoglobin 3 Days after innoculation 4 13.0250 1.40089 .70045
Day 5 of Treatment 4 11.4000 1.20277 .60139
Day 28 Post-treatment 4 10.1750 1.29711 .64856
Total 12 11.5333 1.69563 .48949
Packed Cell Volume 3 Days after innoculation 4 39.2500 3.59398 1.79699
Day 5 of Treatment 4 34.0000 2.94392 1.47196
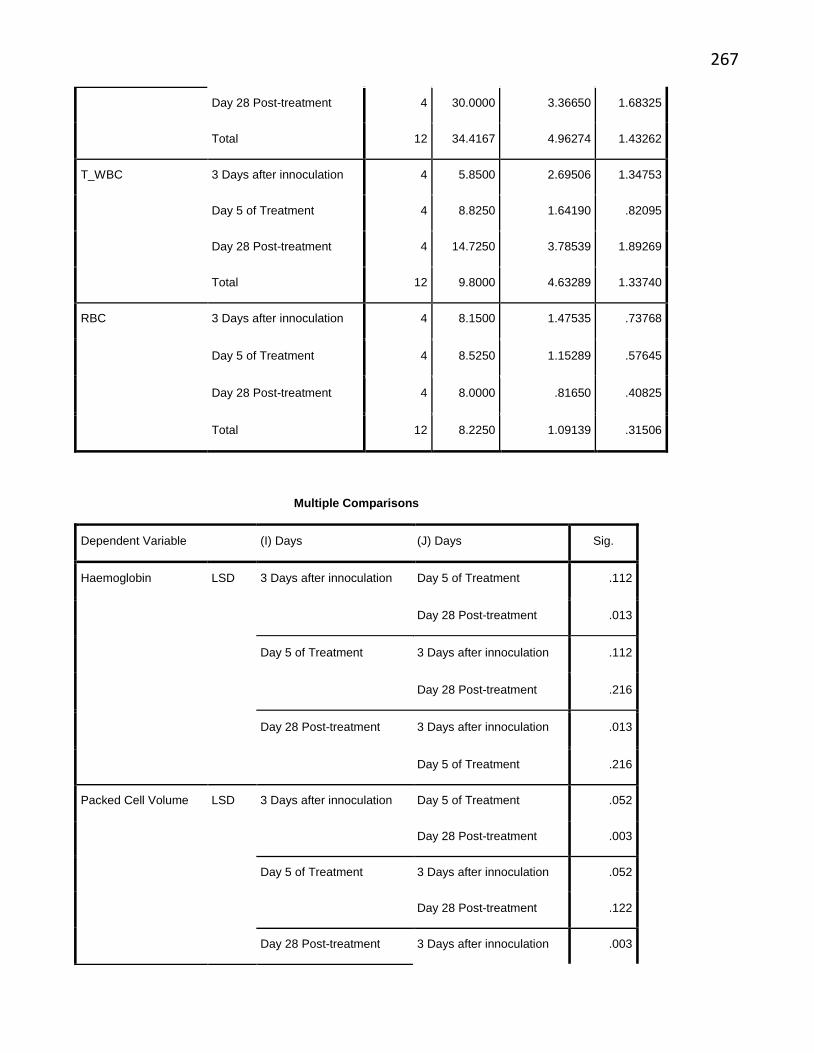
267
Day 28 Post-treatment 4 30.0000 3.36650 1.68325
Total 12 34.4167 4.96274 1.43262
T_WBC 3 Days after innoculation 4 5.8500 2.69506 1.34753
Day 5 of Treatment 4 8.8250 1.64190 .82095
Day 28 Post-treatment 4 14.7250 3.78539 1.89269
Total 12 9.8000 4.63289 1.33740
RBC 3 Days after innoculation 4 8.1500 1.47535 .73768
Day 5 of Treatment 4 8.5250 1.15289 .57645
Day 28 Post-treatment 4 8.0000 .81650 .40825
Total 12 8.2250 1.09139 .31506
Multiple Comparisons
Dependent Variable (I) Days (J) Days Sig.
Haemoglobin LSD 3 Days after innoculation Day 5 of Treatment .112
Day 28 Post-treatment .013
Day 5 of Treatment 3 Days after innoculation .112
Day 28 Post-treatment .216
Day 28 Post-treatment 3 Days after innoculation .013
Day 5 of Treatment .216
Packed Cell Volume LSD 3 Days after innoculation Day 5 of Treatment .052
Day 28 Post-treatment .003
Day 5 of Treatment 3 Days after innoculation .052
Day 28 Post-treatment .122
Day 28 Post-treatment 3 Days after innoculation .003
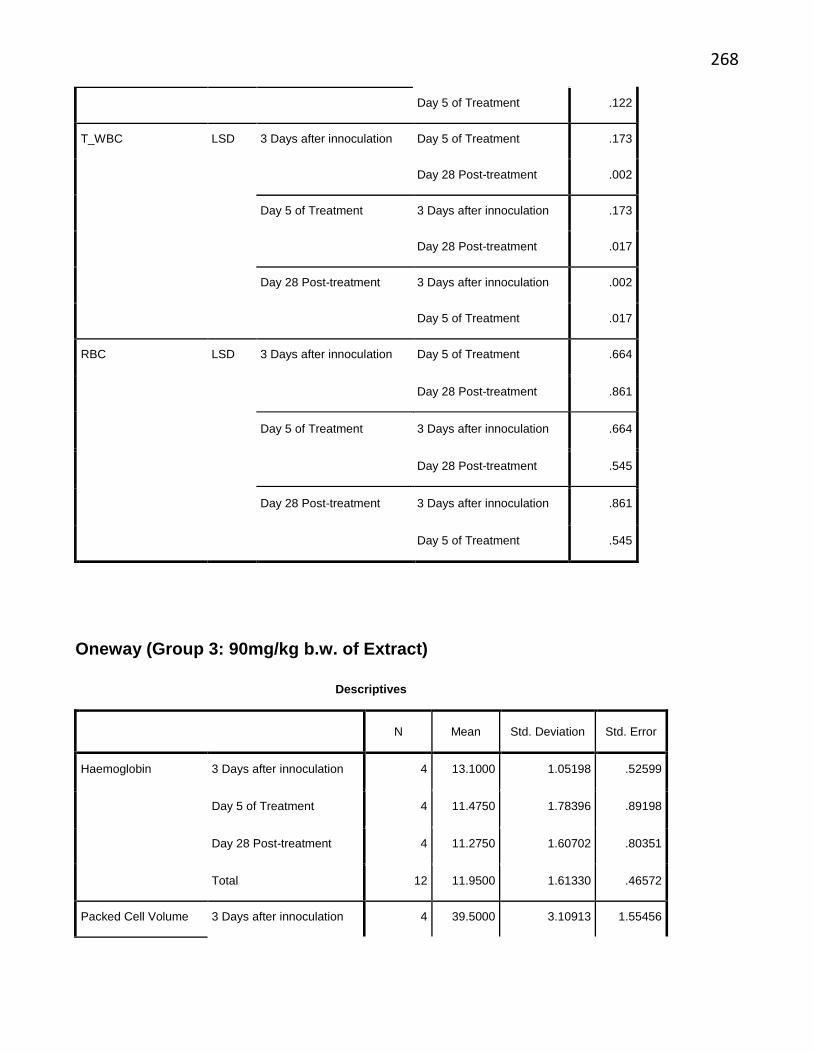
268
Day 5 of Treatment .122
T_WBC LSD 3 Days after innoculation Day 5 of Treatment .173
Day 28 Post-treatment .002
Day 5 of Treatment 3 Days after innoculation .173
Day 28 Post-treatment .017
Day 28 Post-treatment 3 Days after innoculation .002
Day 5 of Treatment .017
RBC LSD 3 Days after innoculation Day 5 of Treatment .664
Day 28 Post-treatment .861
Day 5 of Treatment 3 Days after innoculation .664
Day 28 Post-treatment .545
Day 28 Post-treatment 3 Days after innoculation .861
Day 5 of Treatment .545
Oneway (Group 3: 90mg/kg b.w. of Extract)
Descriptives
N Mean Std. Deviation Std. Error
Haemoglobin 3 Days after innoculation 4 13.1000 1.05198 .52599
Day 5 of Treatment 4 11.4750 1.78396 .89198
Day 28 Post-treatment 4 11.2750 1.60702 .80351
Total 12 11.9500 1.61330 .46572
Packed Cell Volume 3 Days after innoculation 4 39.5000 3.10913 1.55456
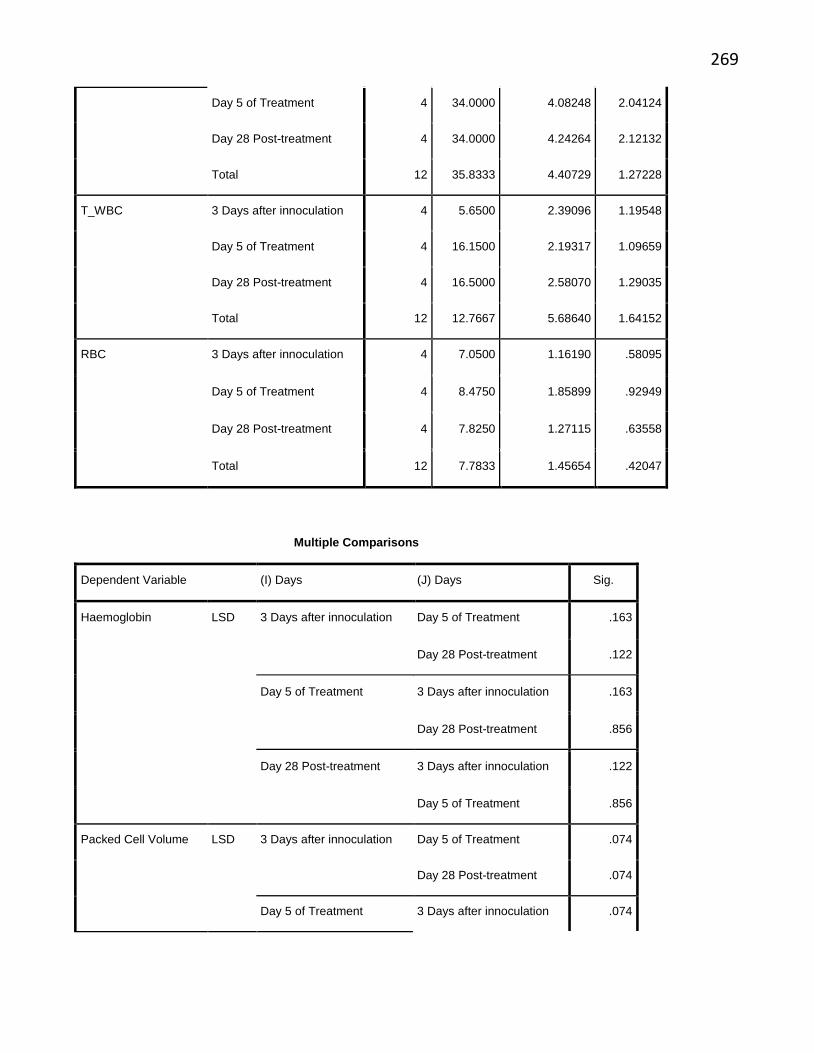
269
Day 5 of Treatment 4 34.0000 4.08248 2.04124
Day 28 Post-treatment 4 34.0000 4.24264 2.12132
Total 12 35.8333 4.40729 1.27228
T_WBC 3 Days after innoculation 4 5.6500 2.39096 1.19548
Day 5 of Treatment 4 16.1500 2.19317 1.09659
Day 28 Post-treatment 4 16.5000 2.58070 1.29035
Total 12 12.7667 5.68640 1.64152
RBC 3 Days after innoculation 4 7.0500 1.16190 .58095
Day 5 of Treatment 4 8.4750 1.85899 .92949
Day 28 Post-treatment 4 7.8250 1.27115 .63558
Total 12 7.7833 1.45654 .42047
Multiple Comparisons
Dependent Variable (I) Days (J) Days Sig.
Haemoglobin LSD 3 Days after innoculation Day 5 of Treatment .163
Day 28 Post-treatment .122
Day 5 of Treatment 3 Days after innoculation .163
Day 28 Post-treatment .856
Day 28 Post-treatment 3 Days after innoculation .122
Day 5 of Treatment .856
Packed Cell Volume LSD 3 Days after innoculation Day 5 of Treatment .074
Day 28 Post-treatment .074
Day 5 of Treatment 3 Days after innoculation .074
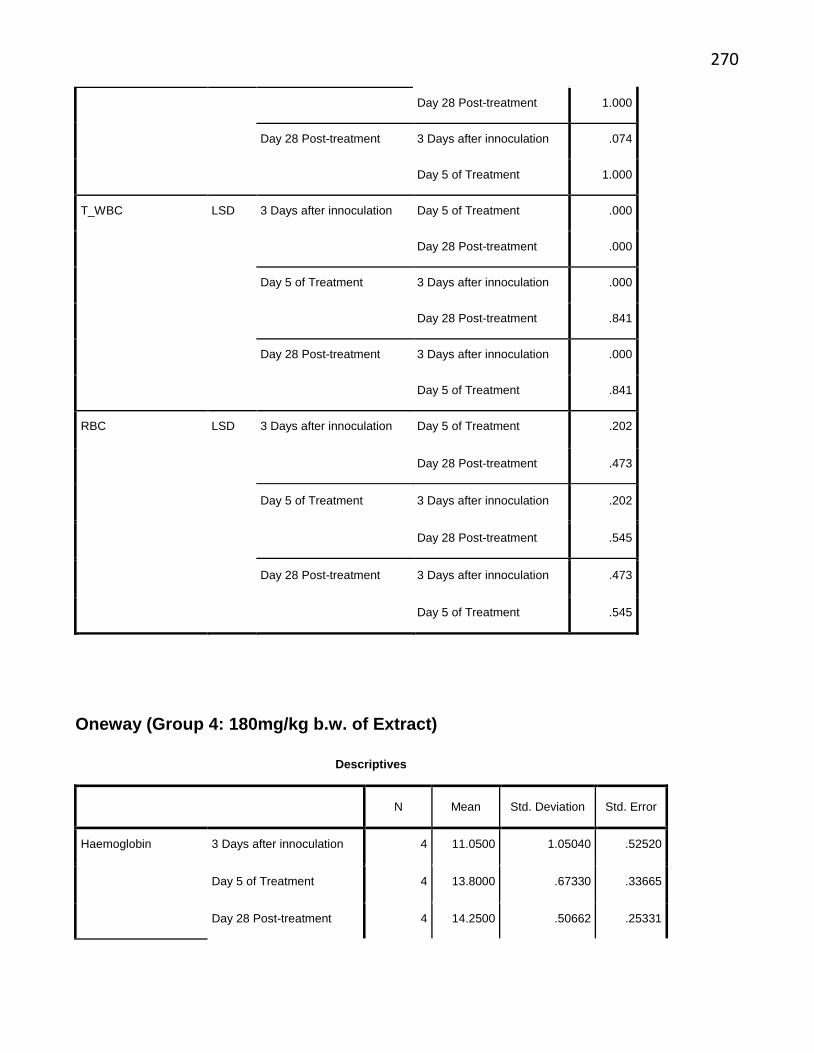
270
Day 28 Post-treatment 1.000
Day 28 Post-treatment 3 Days after innoculation .074
Day 5 of Treatment 1.000
T_WBC LSD 3 Days after innoculation Day 5 of Treatment .000
Day 28 Post-treatment .000
Day 5 of Treatment 3 Days after innoculation .000
Day 28 Post-treatment .841
Day 28 Post-treatment 3 Days after innoculation .000
Day 5 of Treatment .841
RBC LSD 3 Days after innoculation Day 5 of Treatment .202
Day 28 Post-treatment .473
Day 5 of Treatment 3 Days after innoculation .202
Day 28 Post-treatment .545
Day 28 Post-treatment 3 Days after innoculation .473
Day 5 of Treatment .545
Oneway (Group 4: 180mg/kg b.w. of Extract)
Descriptives
N Mean Std. Deviation Std. Error
Haemoglobin 3 Days after innoculation 4 11.0500 1.05040 .52520
Day 5 of Treatment 4 13.8000 .67330 .33665
Day 28 Post-treatment 4 14.2500 .50662 .25331
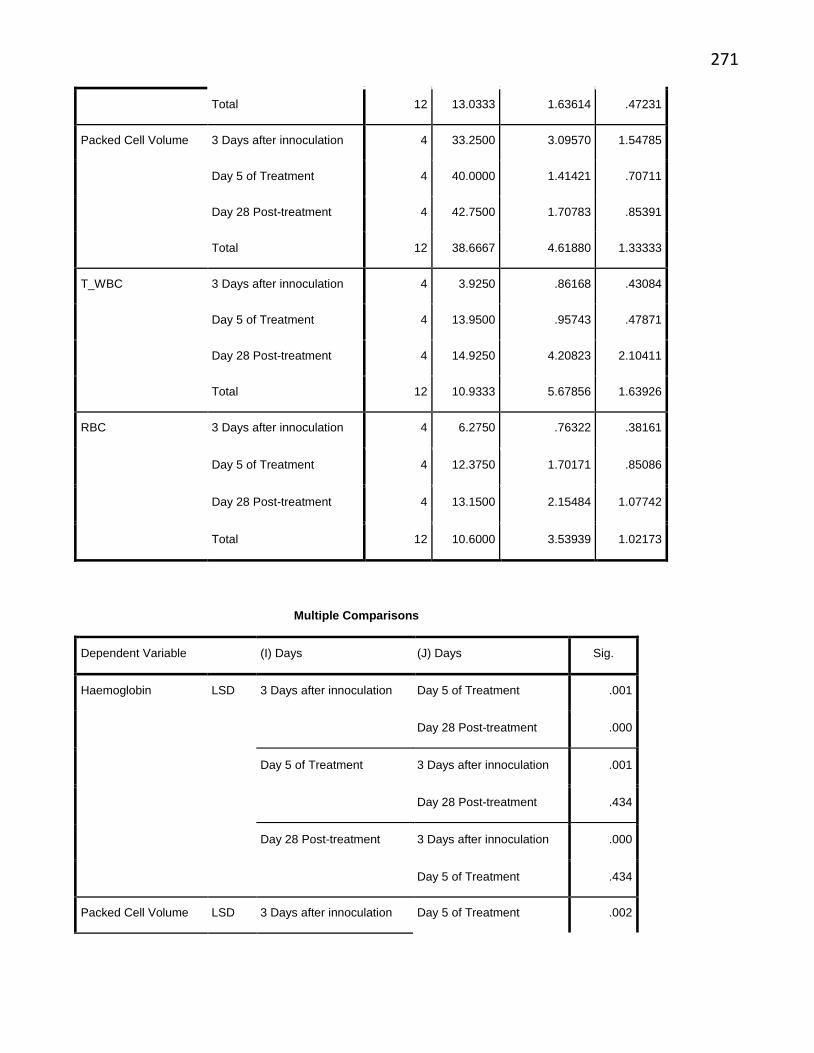
271
Total 12 13.0333 1.63614 .47231
Packed Cell Volume 3 Days after innoculation 4 33.2500 3.09570 1.54785
Day 5 of Treatment 4 40.0000 1.41421 .70711
Day 28 Post-treatment 4 42.7500 1.70783 .85391
Total 12 38.6667 4.61880 1.33333
T_WBC 3 Days after innoculation 4 3.9250 .86168 .43084
Day 5 of Treatment 4 13.9500 .95743 .47871
Day 28 Post-treatment 4 14.9250 4.20823 2.10411
Total 12 10.9333 5.67856 1.63926
RBC 3 Days after innoculation 4 6.2750 .76322 .38161
Day 5 of Treatment 4 12.3750 1.70171 .85086
Day 28 Post-treatment 4 13.1500 2.15484 1.07742
Total 12 10.6000 3.53939 1.02173
Multiple Comparisons
Dependent Variable (I) Days (J) Days Sig.
Haemoglobin LSD 3 Days after innoculation Day 5 of Treatment .001
Day 28 Post-treatment .000
Day 5 of Treatment 3 Days after innoculation .001
Day 28 Post-treatment .434
Day 28 Post-treatment 3 Days after innoculation .000
Day 5 of Treatment .434
Packed Cell Volume LSD 3 Days after innoculation Day 5 of Treatment .002
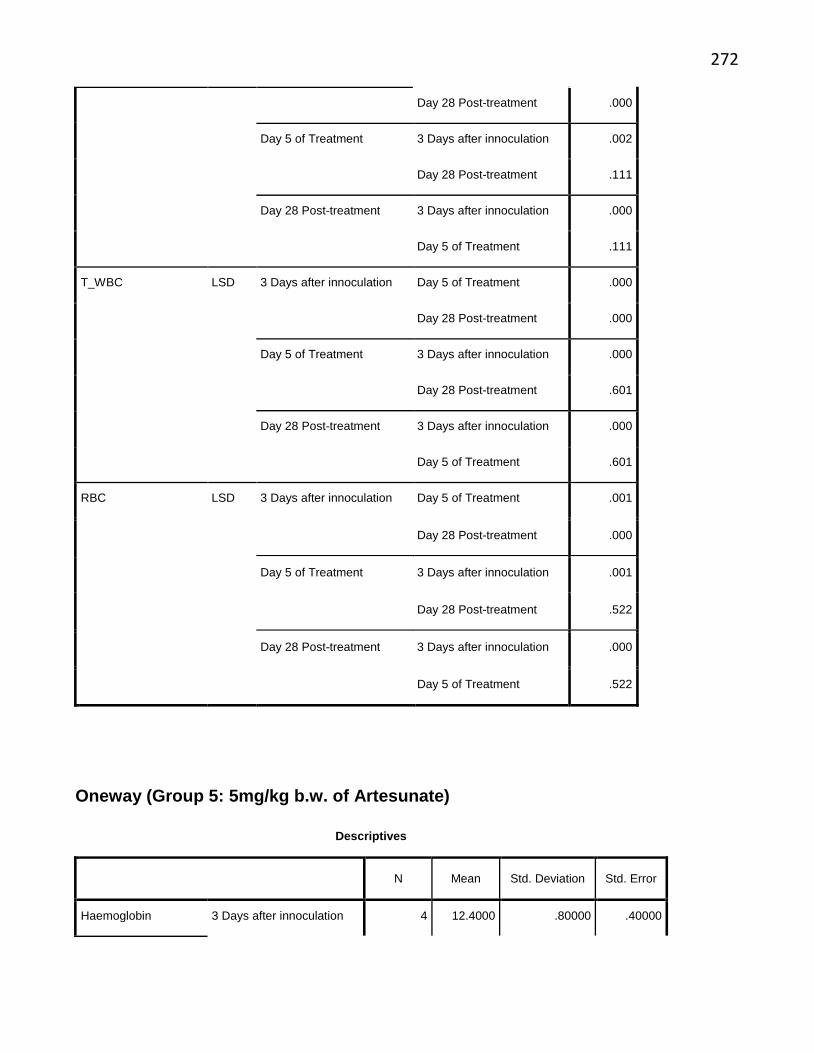
272
Day 28 Post-treatment .000
Day 5 of Treatment 3 Days after innoculation .002
Day 28 Post-treatment .111
Day 28 Post-treatment 3 Days after innoculation .000
Day 5 of Treatment .111
T_WBC LSD 3 Days after innoculation Day 5 of Treatment .000
Day 28 Post-treatment .000
Day 5 of Treatment 3 Days after innoculation .000
Day 28 Post-treatment .601
Day 28 Post-treatment 3 Days after innoculation .000
Day 5 of Treatment .601
RBC LSD 3 Days after innoculation Day 5 of Treatment .001
Day 28 Post-treatment .000
Day 5 of Treatment 3 Days after innoculation .001
Day 28 Post-treatment .522
Day 28 Post-treatment 3 Days after innoculation .000
Day 5 of Treatment .522
Oneway (Group 5: 5mg/kg b.w. of Artesunate)
Descriptives
N Mean Std. Deviation Std. Error
Haemoglobin 3 Days after innoculation 4 12.4000 .80000 .40000
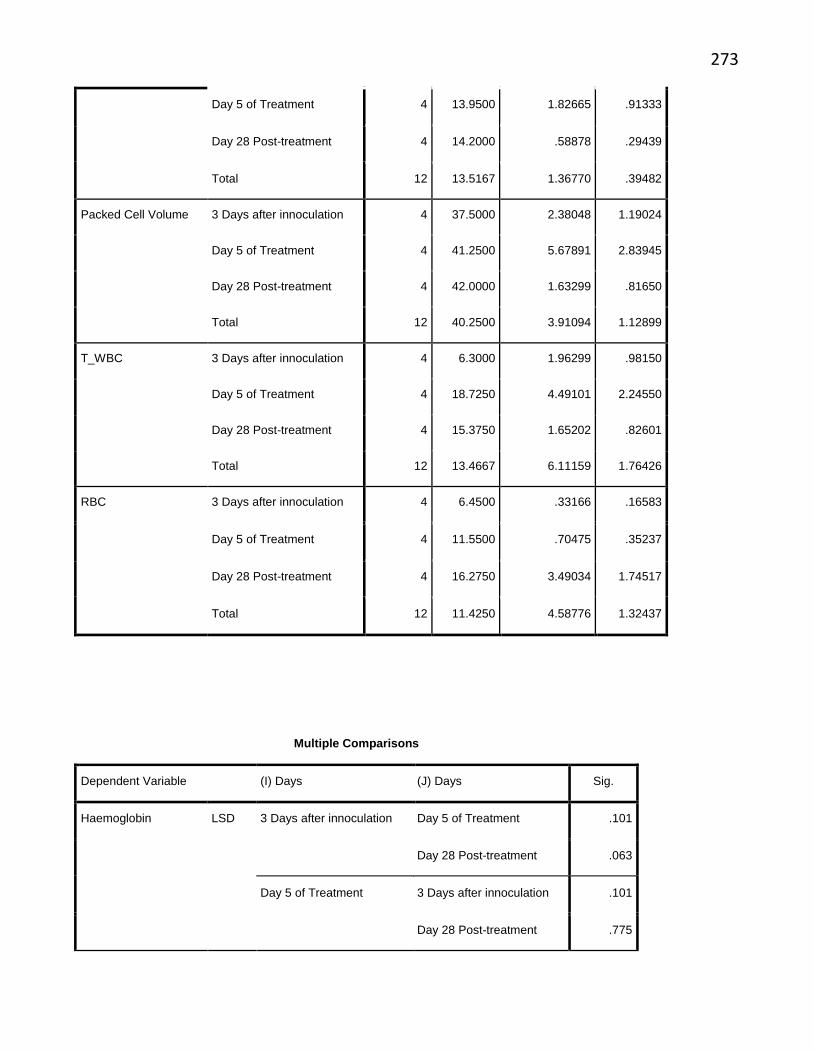
273
Day 5 of Treatment 4 13.9500 1.82665 .91333
Day 28 Post-treatment 4 14.2000 .58878 .29439
Total 12 13.5167 1.36770 .39482
Packed Cell Volume 3 Days after innoculation 4 37.5000 2.38048 1.19024
Day 5 of Treatment 4 41.2500 5.67891 2.83945
Day 28 Post-treatment 4 42.0000 1.63299 .81650
Total 12 40.2500 3.91094 1.12899
T_WBC 3 Days after innoculation 4 6.3000 1.96299 .98150
Day 5 of Treatment 4 18.7250 4.49101 2.24550
Day 28 Post-treatment 4 15.3750 1.65202 .82601
Total 12 13.4667 6.11159 1.76426
RBC 3 Days after innoculation 4 6.4500 .33166 .16583
Day 5 of Treatment 4 11.5500 .70475 .35237
Day 28 Post-treatment 4 16.2750 3.49034 1.74517
Total 12 11.4250 4.58776 1.32437
Multiple Comparisons
Dependent Variable (I) Days (J) Days Sig.
Haemoglobin LSD 3 Days after innoculation Day 5 of Treatment .101
Day 28 Post-treatment .063
Day 5 of Treatment 3 Days after innoculation .101
Day 28 Post-treatment .775
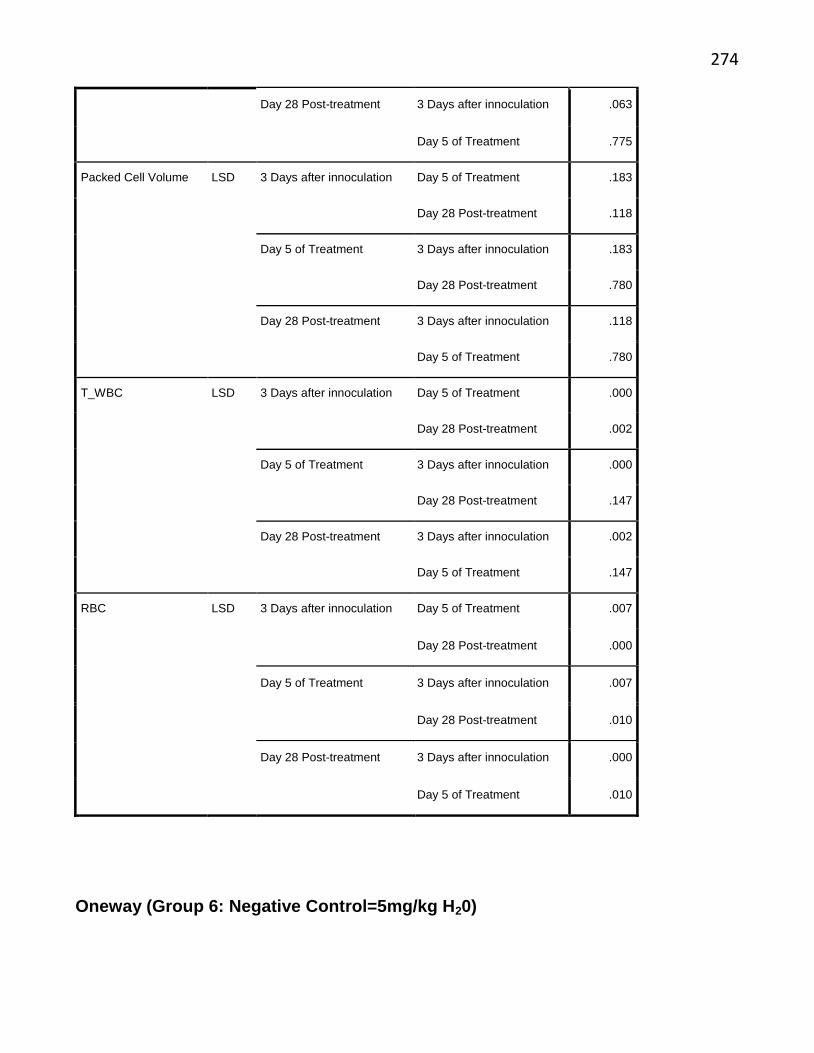
274
Day 28 Post-treatment 3 Days after innoculation .063
Day 5 of Treatment .775
Packed Cell Volume LSD 3 Days after innoculation Day 5 of Treatment .183
Day 28 Post-treatment .118
Day 5 of Treatment 3 Days after innoculation .183
Day 28 Post-treatment .780
Day 28 Post-treatment 3 Days after innoculation .118
Day 5 of Treatment .780
T_WBC LSD 3 Days after innoculation Day 5 of Treatment .000
Day 28 Post-treatment .002
Day 5 of Treatment 3 Days after innoculation .000
Day 28 Post-treatment .147
Day 28 Post-treatment 3 Days after innoculation .002
Day 5 of Treatment .147
RBC LSD 3 Days after innoculation Day 5 of Treatment .007
Day 28 Post-treatment .000
Day 5 of Treatment 3 Days after innoculation .007
Day 28 Post-treatment .010
Day 28 Post-treatment 3 Days after innoculation .000
Day 5 of Treatment .010
Oneway (Group 6: Negative Control=5mg/kg H20)
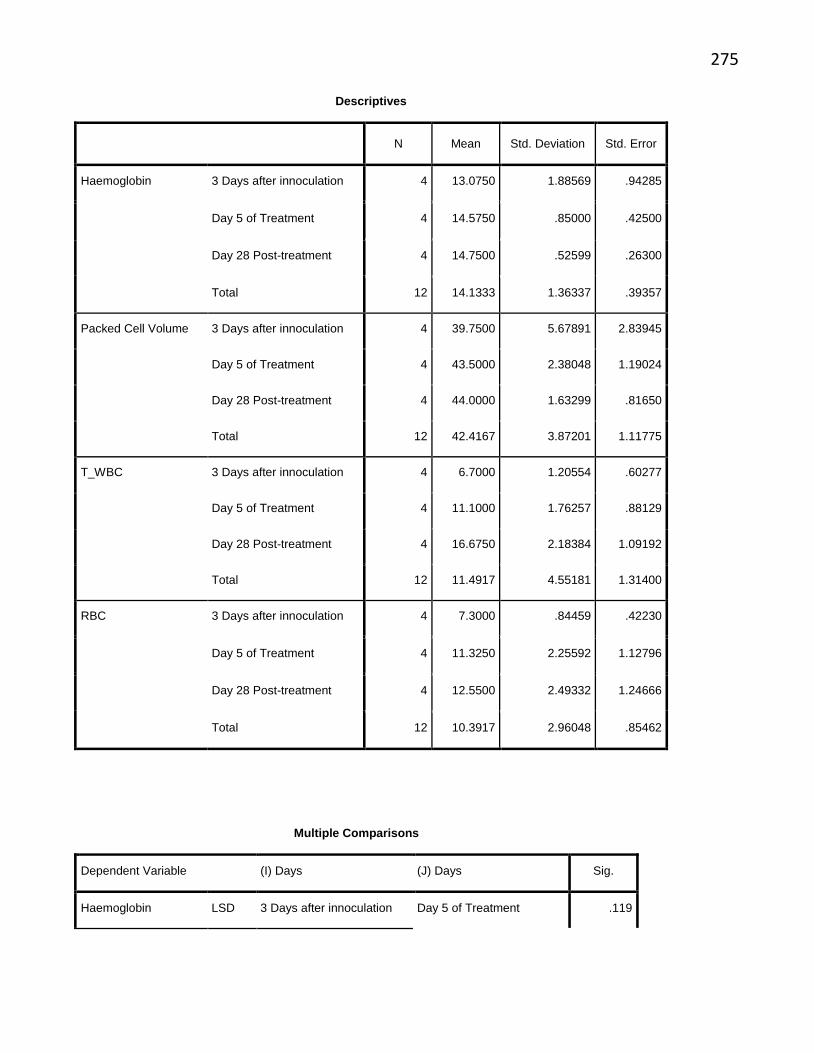
275
Descriptives
N Mean Std. Deviation Std. Error
Haemoglobin 3 Days after innoculation 4 13.0750 1.88569 .94285
Day 5 of Treatment 4 14.5750 .85000 .42500
Day 28 Post-treatment 4 14.7500 .52599 .26300
Total 12 14.1333 1.36337 .39357
Packed Cell Volume 3 Days after innoculation 4 39.7500 5.67891 2.83945
Day 5 of Treatment 4 43.5000 2.38048 1.19024
Day 28 Post-treatment 4 44.0000 1.63299 .81650
Total 12 42.4167 3.87201 1.11775
T_WBC 3 Days after innoculation 4 6.7000 1.20554 .60277
Day 5 of Treatment 4 11.1000 1.76257 .88129
Day 28 Post-treatment 4 16.6750 2.18384 1.09192
Total 12 11.4917 4.55181 1.31400
RBC 3 Days after innoculation 4 7.3000 .84459 .42230
Day 5 of Treatment 4 11.3250 2.25592 1.12796
Day 28 Post-treatment 4 12.5500 2.49332 1.24666
Total 12 10.3917 2.96048 .85462
Multiple Comparisons
Dependent Variable (I) Days (J) Days Sig.
Haemoglobin LSD 3 Days after innoculation Day 5 of Treatment .119
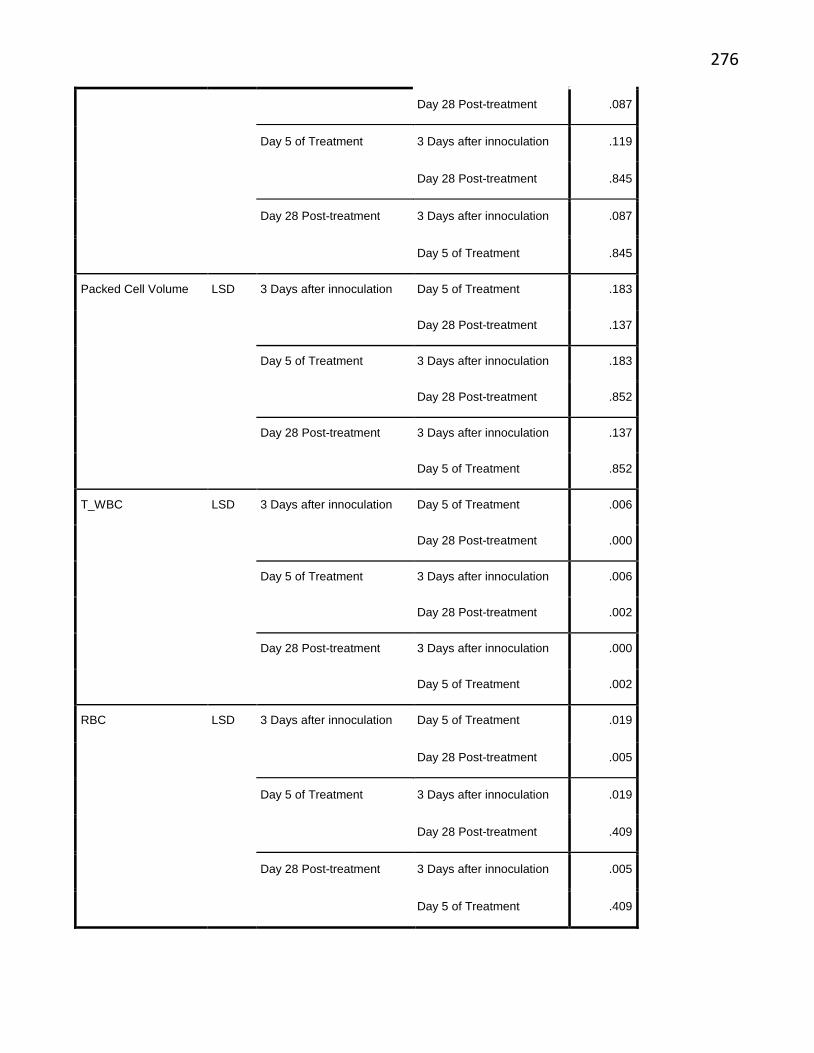
276
Day 28 Post-treatment .087
Day 5 of Treatment 3 Days after innoculation .119
Day 28 Post-treatment .845
Day 28 Post-treatment 3 Days after innoculation .087
Day 5 of Treatment .845
Packed Cell Volume LSD 3 Days after innoculation Day 5 of Treatment .183
Day 28 Post-treatment .137
Day 5 of Treatment 3 Days after innoculation .183
Day 28 Post-treatment .852
Day 28 Post-treatment 3 Days after innoculation .137
Day 5 of Treatment .852
T_WBC LSD 3 Days after innoculation Day 5 of Treatment .006
Day 28 Post-treatment .000
Day 5 of Treatment 3 Days after innoculation .006
Day 28 Post-treatment .002
Day 28 Post-treatment 3 Days after innoculation .000
Day 5 of Treatment .002
RBC LSD 3 Days after innoculation Day 5 of Treatment .019
Day 28 Post-treatment .005
Day 5 of Treatment 3 Days after innoculation .019
Day 28 Post-treatment .409
Day 28 Post-treatment 3 Days after innoculation .005
Day 5 of Treatment .409
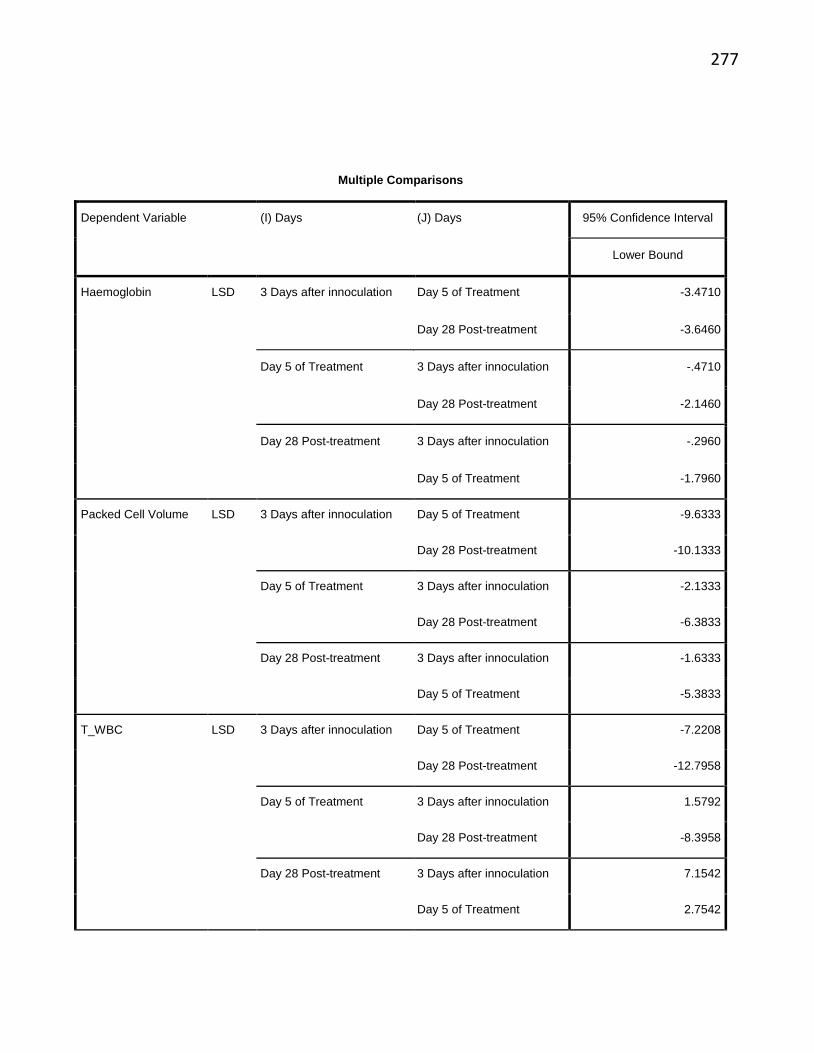
277
Multiple Comparisons
Dependent Variable (I) Days (J) Days 95% Confidence Interval
Lower Bound
Haemoglobin LSD 3 Days after innoculation Day 5 of Treatment -3.4710
Day 28 Post-treatment -3.6460
Day 5 of Treatment 3 Days after innoculation -.4710
Day 28 Post-treatment -2.1460
Day 28 Post-treatment 3 Days after innoculation -.2960
Day 5 of Treatment -1.7960
Packed Cell Volume LSD 3 Days after innoculation Day 5 of Treatment -9.6333
Day 28 Post-treatment -10.1333
Day 5 of Treatment 3 Days after innoculation -2.1333
Day 28 Post-treatment -6.3833
Day 28 Post-treatment 3 Days after innoculation -1.6333
Day 5 of Treatment -5.3833
T_WBC LSD 3 Days after innoculation Day 5 of Treatment -7.2208
Day 28 Post-treatment -12.7958
Day 5 of Treatment 3 Days after innoculation 1.5792
Day 28 Post-treatment -8.3958
Day 28 Post-treatment 3 Days after innoculation 7.1542
Day 5 of Treatment 2.7542
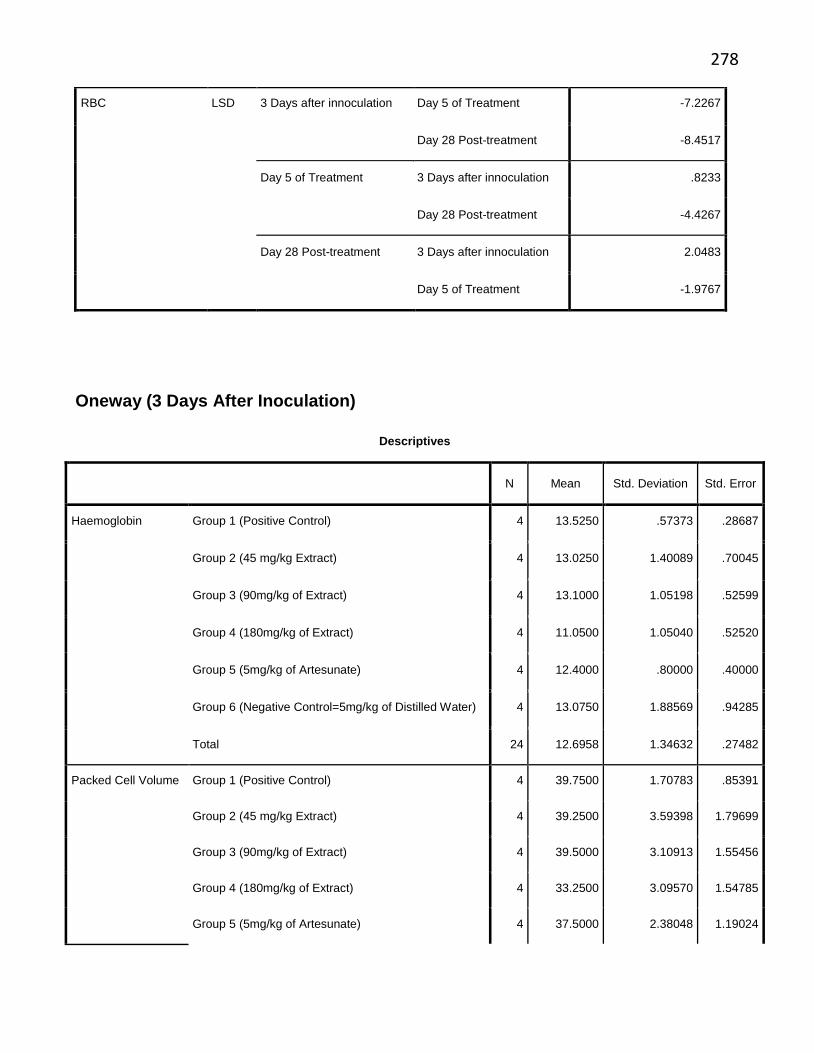
278
RBC LSD 3 Days after innoculation Day 5 of Treatment -7.2267
Day 28 Post-treatment -8.4517
Day 5 of Treatment 3 Days after innoculation .8233
Day 28 Post-treatment -4.4267
Day 28 Post-treatment 3 Days after innoculation 2.0483
Day 5 of Treatment -1.9767
Oneway (3 Days After Inoculation)
Descriptives
N Mean Std. Deviation Std. Error
Haemoglobin Group 1 (Positive Control) 4 13.5250 .57373 .28687
Group 2 (45 mg/kg Extract) 4 13.0250 1.40089 .70045
Group 3 (90mg/kg of Extract) 4 13.1000 1.05198 .52599
Group 4 (180mg/kg of Extract) 4 11.0500 1.05040 .52520
Group 5 (5mg/kg of Artesunate) 4 12.4000 .80000 .40000
Group 6 (Negative Control=5mg/kg of Distilled Water) 4 13.0750 1.88569 .94285
Total 24 12.6958 1.34632 .27482
Packed Cell Volume Group 1 (Positive Control) 4 39.7500 1.70783 .85391
Group 2 (45 mg/kg Extract) 4 39.2500 3.59398 1.79699
Group 3 (90mg/kg of Extract) 4 39.5000 3.10913 1.55456
Group 4 (180mg/kg of Extract) 4 33.2500 3.09570 1.54785
Group 5 (5mg/kg of Artesunate) 4 37.5000 2.38048 1.19024
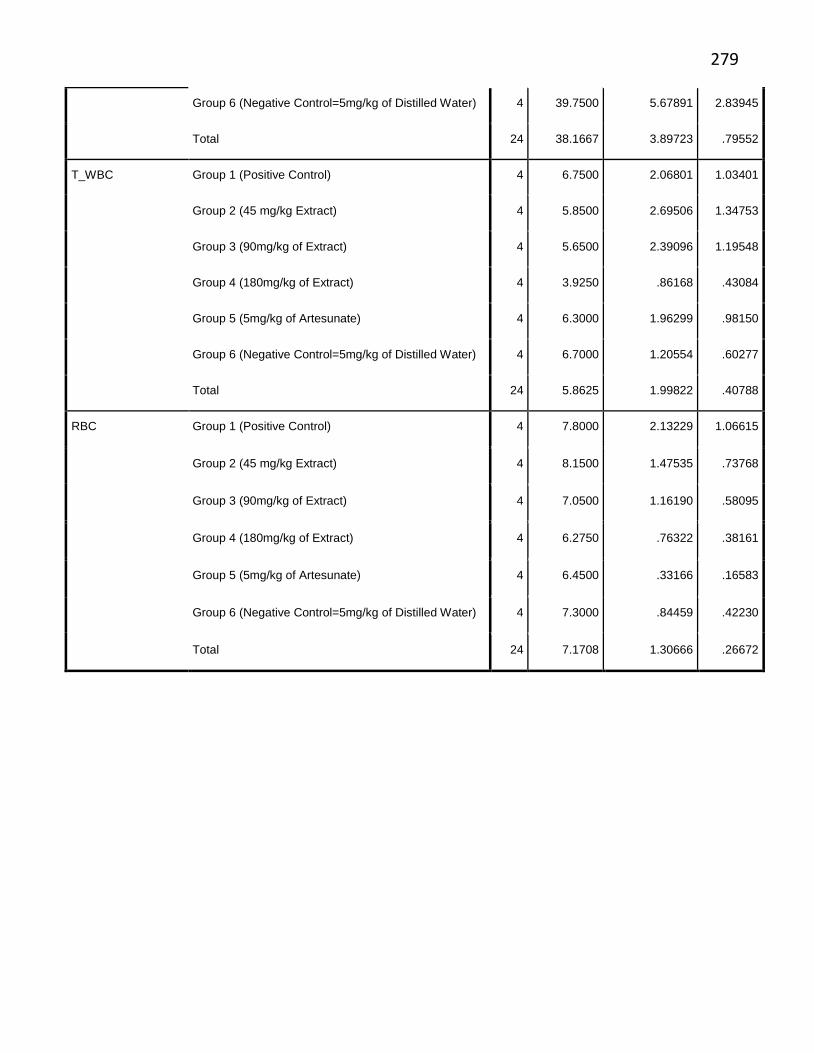
279
Group 6 (Negative Control=5mg/kg of Distilled Water) 4 39.7500 5.67891 2.83945
Total 24 38.1667 3.89723 .79552
T_WBC Group 1 (Positive Control) 4 6.7500 2.06801 1.03401
Group 2 (45 mg/kg Extract) 4 5.8500 2.69506 1.34753
Group 3 (90mg/kg of Extract) 4 5.6500 2.39096 1.19548
Group 4 (180mg/kg of Extract) 4 3.9250 .86168 .43084
Group 5 (5mg/kg of Artesunate) 4 6.3000 1.96299 .98150
Group 6 (Negative Control=5mg/kg of Distilled Water) 4 6.7000 1.20554 .60277
Total 24 5.8625 1.99822 .40788
RBC Group 1 (Positive Control) 4 7.8000 2.13229 1.06615
Group 2 (45 mg/kg Extract) 4 8.1500 1.47535 .73768
Group 3 (90mg/kg of Extract) 4 7.0500 1.16190 .58095
Group 4 (180mg/kg of Extract) 4 6.2750 .76322 .38161
Group 5 (5mg/kg of Artesunate) 4 6.4500 .33166 .16583
Group 6 (Negative Control=5mg/kg of Distilled Water) 4 7.3000 .84459 .42230
Total 24 7.1708 1.30666 .26672

280
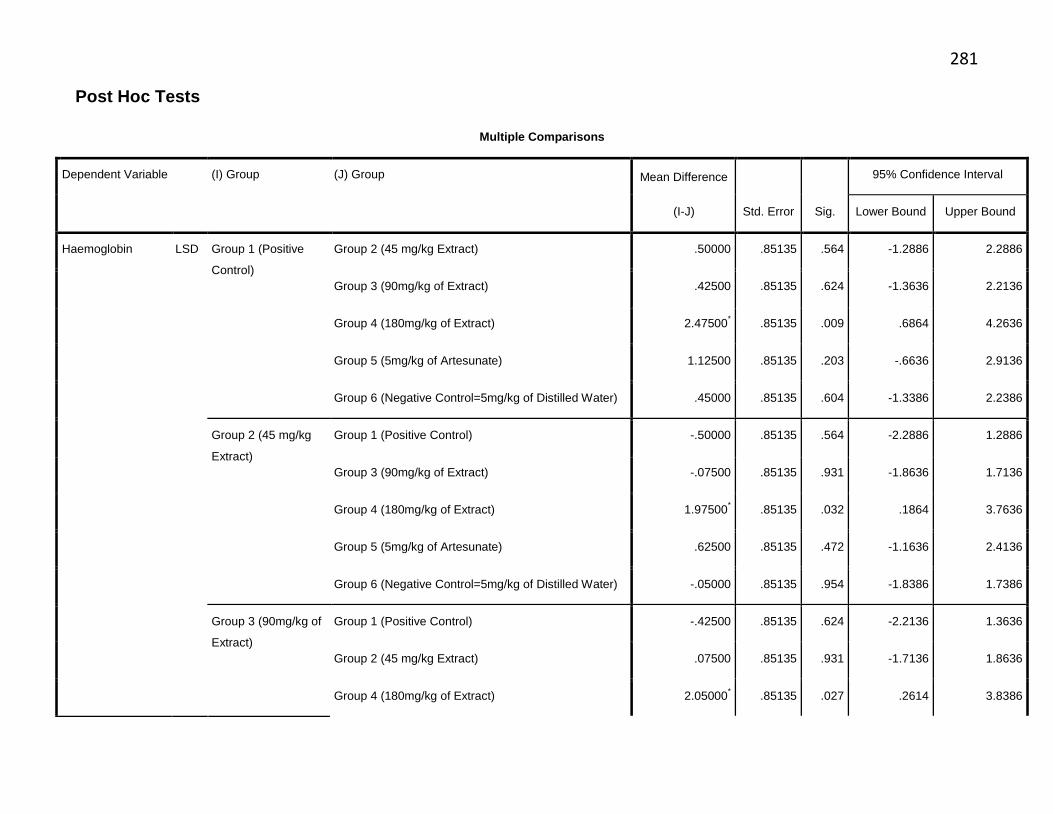
281
Post Hoc Tests
Multiple Comparisons
Dependent Variable (I) Group (J) Group Mean Difference
(I-J) Std. Error Sig.
95% Confidence Interval
Lower Bound Upper Bound
Haemoglobin LSD Group 1 (Positive
Control)
Group 2 (45 mg/kg Extract) .50000 .85135 .564 -1.2886 2.2886
Group 3 (90mg/kg of Extract) .42500 .85135 .624 -1.3636 2.2136
Group 4 (180mg/kg of Extract) 2.47500* .85135 .009 .6864 4.2636
Group 5 (5mg/kg of Artesunate) 1.12500 .85135 .203 -.6636 2.9136
Group 6 (Negative Control=5mg/kg of Distilled Water) .45000 .85135 .604 -1.3386 2.2386
Group 2 (45 mg/kg
Extract)
Group 1 (Positive Control) -.50000 .85135 .564 -2.2886 1.2886
Group 3 (90mg/kg of Extract) -.07500 .85135 .931 -1.8636 1.7136
Group 4 (180mg/kg of Extract) 1.97500* .85135 .032 .1864 3.7636
Group 5 (5mg/kg of Artesunate) .62500 .85135 .472 -1.1636 2.4136
Group 6 (Negative Control=5mg/kg of Distilled Water) -.05000 .85135 .954 -1.8386 1.7386
Group 3 (90mg/kg of
Extract)
Group 1 (Positive Control) -.42500 .85135 .624 -2.2136 1.3636
Group 2 (45 mg/kg Extract) .07500 .85135 .931 -1.7136 1.8636
Group 4 (180mg/kg of Extract) 2.05000* .85135 .027 .2614 3.8386
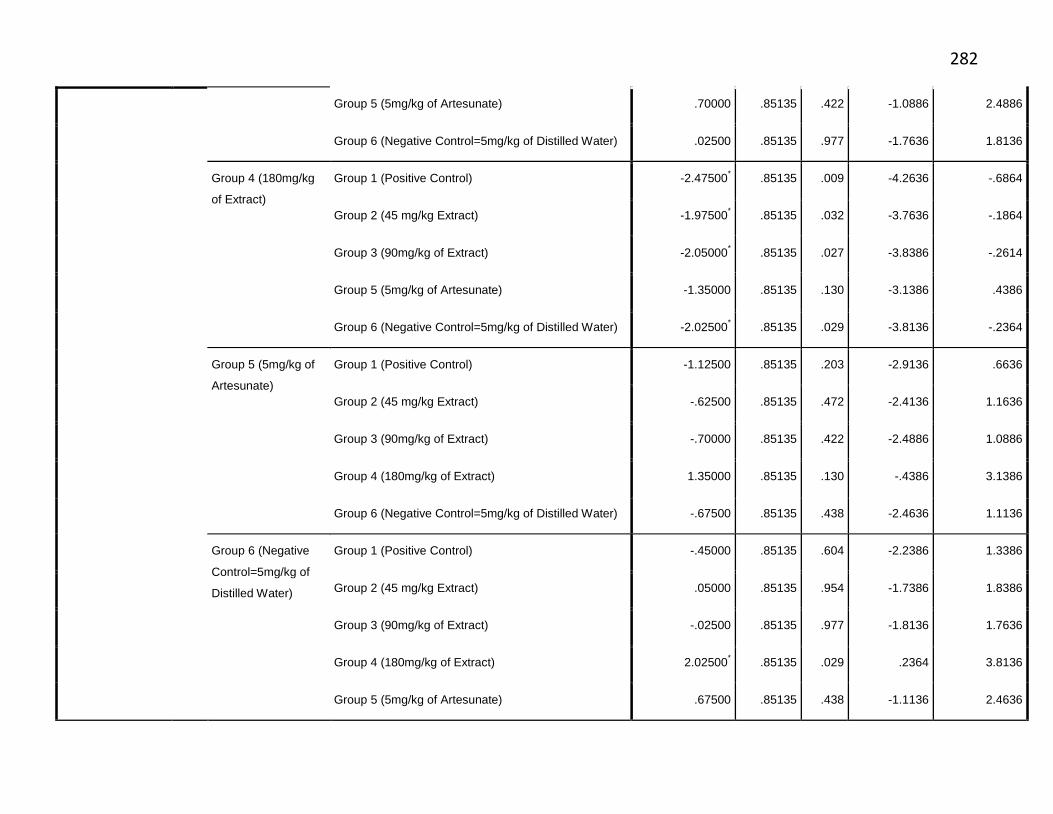
282
Group 5 (5mg/kg of Artesunate) .70000 .85135 .422 -1.0886 2.4886
Group 6 (Negative Control=5mg/kg of Distilled Water) .02500 .85135 .977 -1.7636 1.8136
Group 4 (180mg/kg
of Extract)
Group 1 (Positive Control) -2.47500* .85135 .009 -4.2636 -.6864
Group 2 (45 mg/kg Extract) -1.97500* .85135 .032 -3.7636 -.1864
Group 3 (90mg/kg of Extract) -2.05000* .85135 .027 -3.8386 -.2614
Group 5 (5mg/kg of Artesunate) -1.35000 .85135 .130 -3.1386 .4386
Group 6 (Negative Control=5mg/kg of Distilled Water) -2.02500* .85135 .029 -3.8136 -.2364
Group 5 (5mg/kg of
Artesunate)
Group 1 (Positive Control) -1.12500 .85135 .203 -2.9136 .6636
Group 2 (45 mg/kg Extract) -.62500 .85135 .472 -2.4136 1.1636
Group 3 (90mg/kg of Extract) -.70000 .85135 .422 -2.4886 1.0886
Group 4 (180mg/kg of Extract) 1.35000 .85135 .130 -.4386 3.1386
Group 6 (Negative Control=5mg/kg of Distilled Water) -.67500 .85135 .438 -2.4636 1.1136
Group 6 (Negative
Control=5mg/kg of
Distilled Water)
Group 1 (Positive Control) -.45000 .85135 .604 -2.2386 1.3386
Group 2 (45 mg/kg Extract) .05000 .85135 .954 -1.7386 1.8386
Group 3 (90mg/kg of Extract) -.02500 .85135 .977 -1.8136 1.7636
Group 4 (180mg/kg of Extract) 2.02500* .85135 .029 .2364 3.8136
Group 5 (5mg/kg of Artesunate) .67500 .85135 .438 -1.1136 2.4636
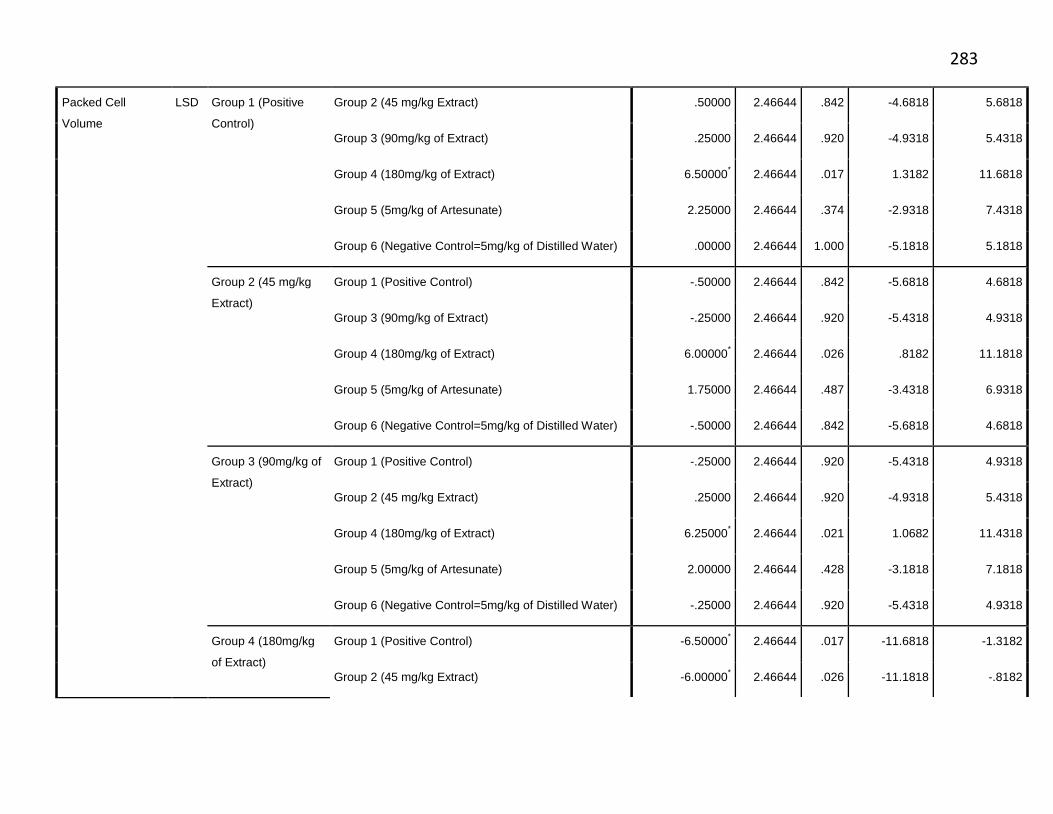
283
Packed Cell
Volume
LSD Group 1 (Positive
Control)
Group 2 (45 mg/kg Extract) .50000 2.46644 .842 -4.6818 5.6818
Group 3 (90mg/kg of Extract) .25000 2.46644 .920 -4.9318 5.4318
Group 4 (180mg/kg of Extract) 6.50000* 2.46644 .017 1.3182 11.6818
Group 5 (5mg/kg of Artesunate) 2.25000 2.46644 .374 -2.9318 7.4318
Group 6 (Negative Control=5mg/kg of Distilled Water) .00000 2.46644 1.000 -5.1818 5.1818
Group 2 (45 mg/kg
Extract)
Group 1 (Positive Control) -.50000 2.46644 .842 -5.6818 4.6818
Group 3 (90mg/kg of Extract) -.25000 2.46644 .920 -5.4318 4.9318
Group 4 (180mg/kg of Extract) 6.00000* 2.46644 .026 .8182 11.1818
Group 5 (5mg/kg of Artesunate) 1.75000 2.46644 .487 -3.4318 6.9318
Group 6 (Negative Control=5mg/kg of Distilled Water) -.50000 2.46644 .842 -5.6818 4.6818
Group 3 (90mg/kg of
Extract)
Group 1 (Positive Control) -.25000 2.46644 .920 -5.4318 4.9318
Group 2 (45 mg/kg Extract) .25000 2.46644 .920 -4.9318 5.4318
Group 4 (180mg/kg of Extract) 6.25000* 2.46644 .021 1.0682 11.4318
Group 5 (5mg/kg of Artesunate) 2.00000 2.46644 .428 -3.1818 7.1818
Group 6 (Negative Control=5mg/kg of Distilled Water) -.25000 2.46644 .920 -5.4318 4.9318
Group 4 (180mg/kg
of Extract)
Group 1 (Positive Control) -6.50000* 2.46644 .017 -11.6818 -1.3182
Group 2 (45 mg/kg Extract) -6.00000* 2.46644 .026 -11.1818 -.8182
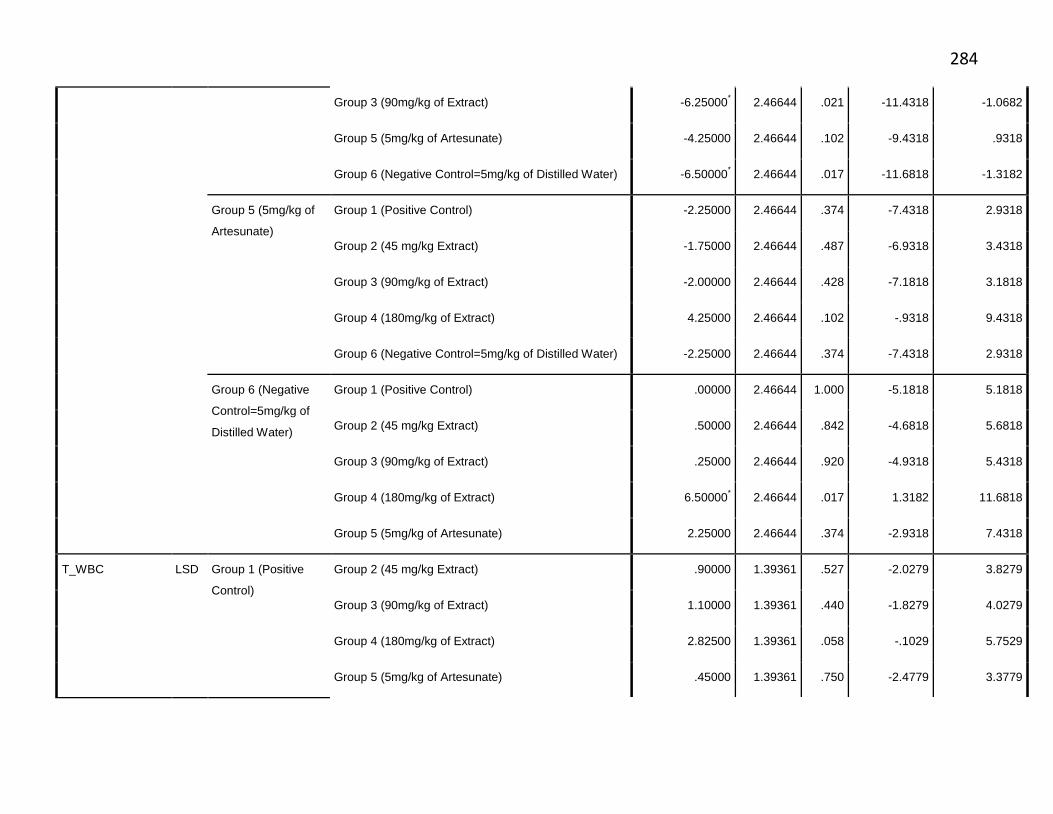
284
Group 3 (90mg/kg of Extract) -6.25000* 2.46644 .021 -11.4318 -1.0682
Group 5 (5mg/kg of Artesunate) -4.25000 2.46644 .102 -9.4318 .9318
Group 6 (Negative Control=5mg/kg of Distilled Water) -6.50000* 2.46644 .017 -11.6818 -1.3182
Group 5 (5mg/kg of
Artesunate)
Group 1 (Positive Control) -2.25000 2.46644 .374 -7.4318 2.9318
Group 2 (45 mg/kg Extract) -1.75000 2.46644 .487 -6.9318 3.4318
Group 3 (90mg/kg of Extract) -2.00000 2.46644 .428 -7.1818 3.1818
Group 4 (180mg/kg of Extract) 4.25000 2.46644 .102 -.9318 9.4318
Group 6 (Negative Control=5mg/kg of Distilled Water) -2.25000 2.46644 .374 -7.4318 2.9318
Group 6 (Negative
Control=5mg/kg of
Distilled Water)
Group 1 (Positive Control) .00000 2.46644 1.000 -5.1818 5.1818
Group 2 (45 mg/kg Extract) .50000 2.46644 .842 -4.6818 5.6818
Group 3 (90mg/kg of Extract) .25000 2.46644 .920 -4.9318 5.4318
Group 4 (180mg/kg of Extract) 6.50000* 2.46644 .017 1.3182 11.6818
Group 5 (5mg/kg of Artesunate) 2.25000 2.46644 .374 -2.9318 7.4318
T_WBC LSD Group 1 (Positive
Control)
Group 2 (45 mg/kg Extract) .90000 1.39361 .527 -2.0279 3.8279
Group 3 (90mg/kg of Extract) 1.10000 1.39361 .440 -1.8279 4.0279
Group 4 (180mg/kg of Extract) 2.82500 1.39361 .058 -.1029 5.7529
Group 5 (5mg/kg of Artesunate) .45000 1.39361 .750 -2.4779 3.3779
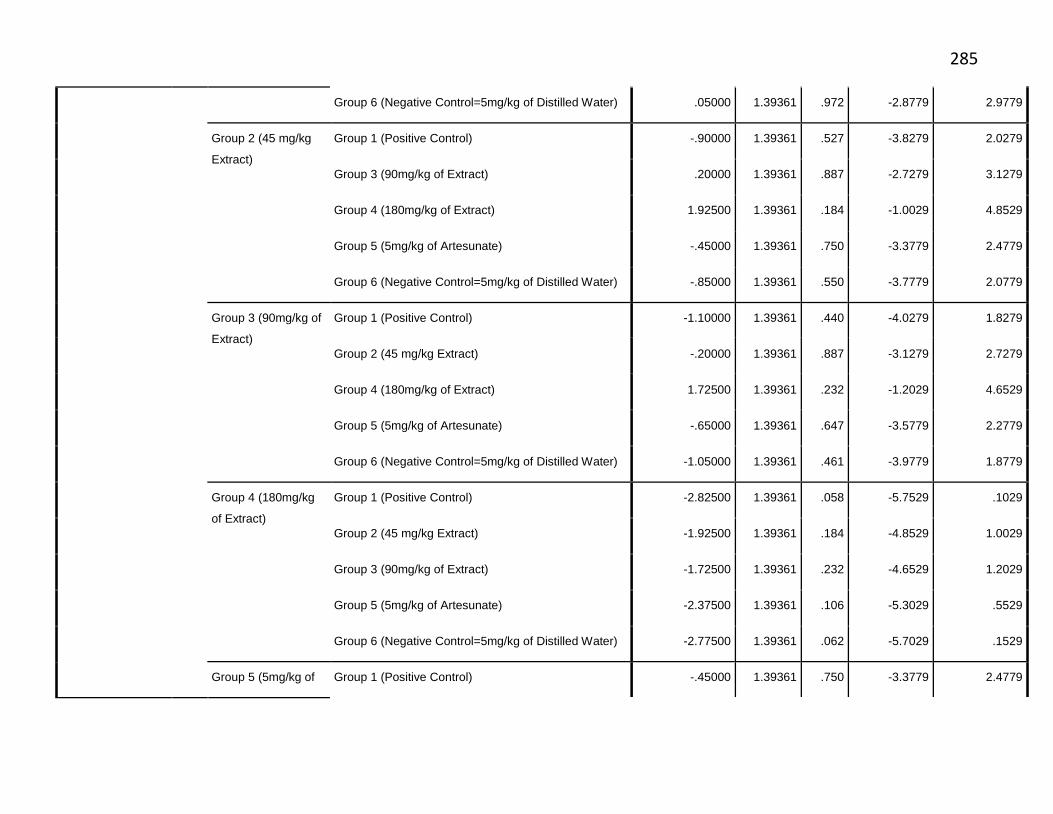
285
Group 6 (Negative Control=5mg/kg of Distilled Water) .05000 1.39361 .972 -2.8779 2.9779
Group 2 (45 mg/kg
Extract)
Group 1 (Positive Control) -.90000 1.39361 .527 -3.8279 2.0279
Group 3 (90mg/kg of Extract) .20000 1.39361 .887 -2.7279 3.1279
Group 4 (180mg/kg of Extract) 1.92500 1.39361 .184 -1.0029 4.8529
Group 5 (5mg/kg of Artesunate) -.45000 1.39361 .750 -3.3779 2.4779
Group 6 (Negative Control=5mg/kg of Distilled Water) -.85000 1.39361 .550 -3.7779 2.0779
Group 3 (90mg/kg of
Extract)
Group 1 (Positive Control) -1.10000 1.39361 .440 -4.0279 1.8279
Group 2 (45 mg/kg Extract) -.20000 1.39361 .887 -3.1279 2.7279
Group 4 (180mg/kg of Extract) 1.72500 1.39361 .232 -1.2029 4.6529
Group 5 (5mg/kg of Artesunate) -.65000 1.39361 .647 -3.5779 2.2779
Group 6 (Negative Control=5mg/kg of Distilled Water) -1.05000 1.39361 .461 -3.9779 1.8779
Group 4 (180mg/kg
of Extract)
Group 1 (Positive Control) -2.82500 1.39361 .058 -5.7529 .1029
Group 2 (45 mg/kg Extract) -1.92500 1.39361 .184 -4.8529 1.0029
Group 3 (90mg/kg of Extract) -1.72500 1.39361 .232 -4.6529 1.2029
Group 5 (5mg/kg of Artesunate) -2.37500 1.39361 .106 -5.3029 .5529
Group 6 (Negative Control=5mg/kg of Distilled Water) -2.77500 1.39361 .062 -5.7029 .1529
Group 5 (5mg/kg of Group 1 (Positive Control) -.45000 1.39361 .750 -3.3779 2.4779
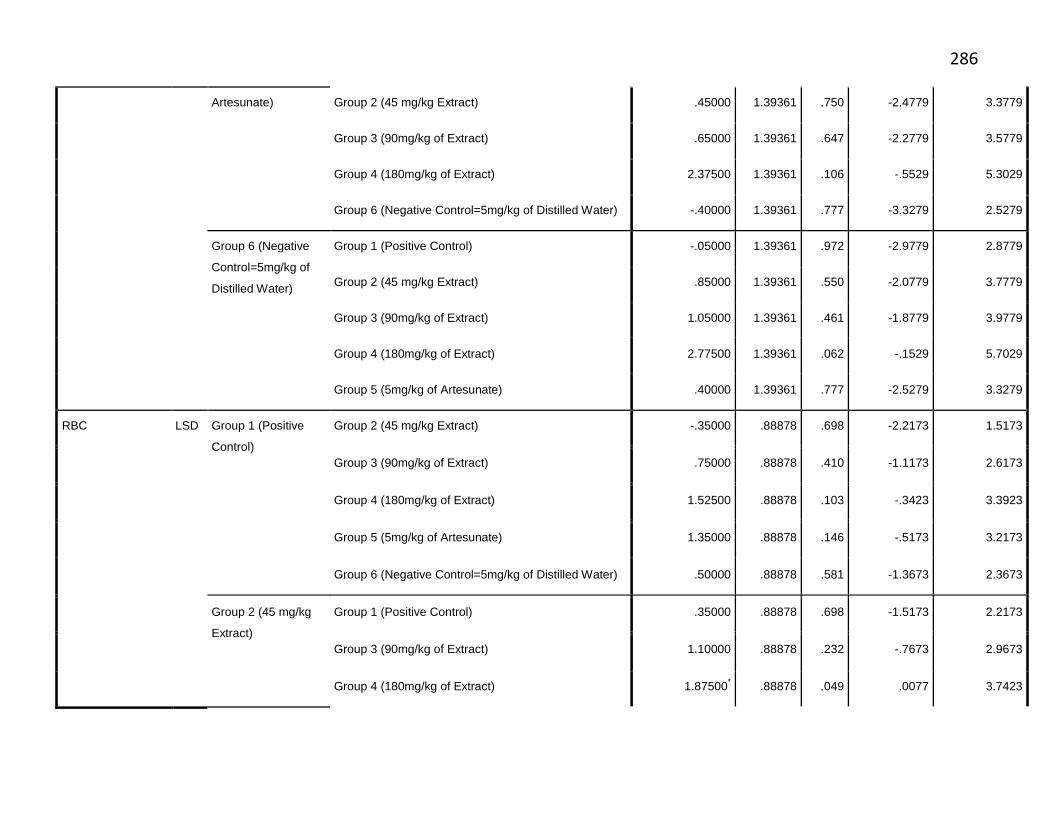
286
Artesunate) Group 2 (45 mg/kg Extract) .45000 1.39361 .750 -2.4779 3.3779
Group 3 (90mg/kg of Extract) .65000 1.39361 .647 -2.2779 3.5779
Group 4 (180mg/kg of Extract) 2.37500 1.39361 .106 -.5529 5.3029
Group 6 (Negative Control=5mg/kg of Distilled Water) -.40000 1.39361 .777 -3.3279 2.5279
Group 6 (Negative
Control=5mg/kg of
Distilled Water)
Group 1 (Positive Control) -.05000 1.39361 .972 -2.9779 2.8779
Group 2 (45 mg/kg Extract) .85000 1.39361 .550 -2.0779 3.7779
Group 3 (90mg/kg of Extract) 1.05000 1.39361 .461 -1.8779 3.9779
Group 4 (180mg/kg of Extract) 2.77500 1.39361 .062 -.1529 5.7029
Group 5 (5mg/kg of Artesunate) .40000 1.39361 .777 -2.5279 3.3279
RBC LSD Group 1 (Positive
Control)
Group 2 (45 mg/kg Extract) -.35000 .88878 .698 -2.2173 1.5173
Group 3 (90mg/kg of Extract) .75000 .88878 .410 -1.1173 2.6173
Group 4 (180mg/kg of Extract) 1.52500 .88878 .103 -.3423 3.3923
Group 5 (5mg/kg of Artesunate) 1.35000 .88878 .146 -.5173 3.2173
Group 6 (Negative Control=5mg/kg of Distilled Water) .50000 .88878 .581 -1.3673 2.3673
Group 2 (45 mg/kg
Extract)
Group 1 (Positive Control) .35000 .88878 .698 -1.5173 2.2173
Group 3 (90mg/kg of Extract) 1.10000 .88878 .232 -.7673 2.9673
Group 4 (180mg/kg of Extract) 1.87500* .88878 .049 .0077 3.7423
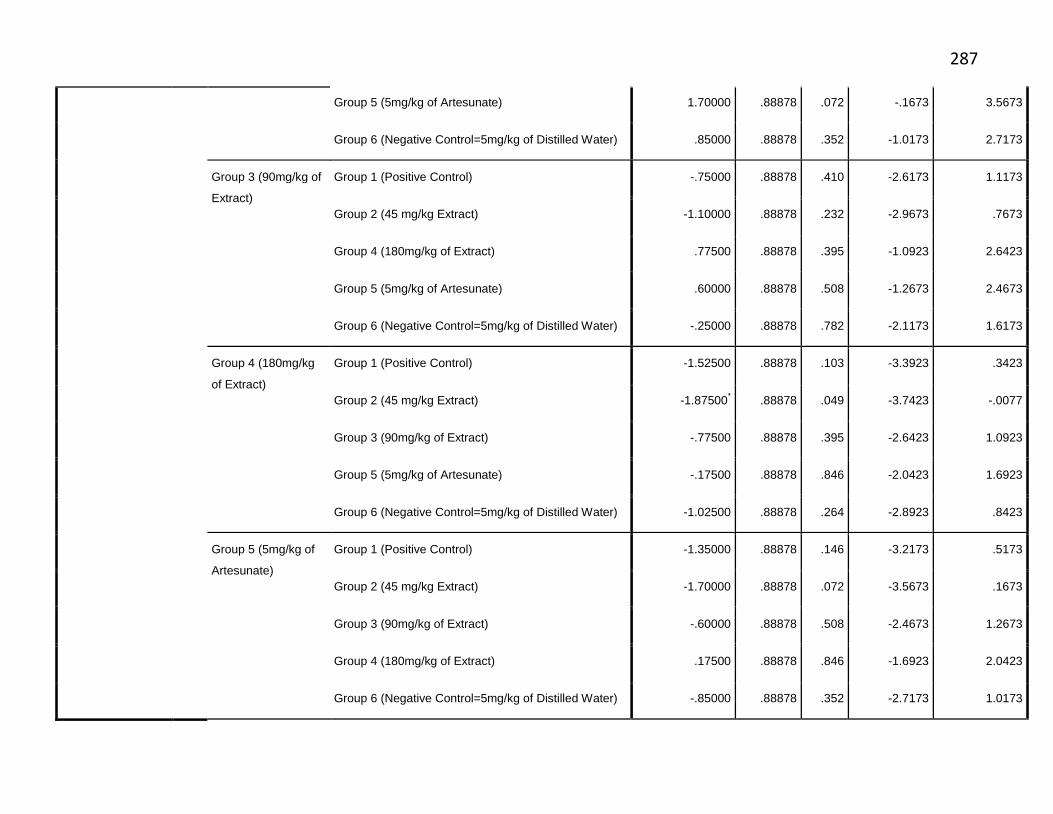
287
Group 5 (5mg/kg of Artesunate) 1.70000 .88878 .072 -.1673 3.5673
Group 6 (Negative Control=5mg/kg of Distilled Water) .85000 .88878 .352 -1.0173 2.7173
Group 3 (90mg/kg of
Extract)
Group 1 (Positive Control) -.75000 .88878 .410 -2.6173 1.1173
Group 2 (45 mg/kg Extract) -1.10000 .88878 .232 -2.9673 .7673
Group 4 (180mg/kg of Extract) .77500 .88878 .395 -1.0923 2.6423
Group 5 (5mg/kg of Artesunate) .60000 .88878 .508 -1.2673 2.4673
Group 6 (Negative Control=5mg/kg of Distilled Water) -.25000 .88878 .782 -2.1173 1.6173
Group 4 (180mg/kg
of Extract)
Group 1 (Positive Control) -1.52500 .88878 .103 -3.3923 .3423
Group 2 (45 mg/kg Extract) -1.87500* .88878 .049 -3.7423 -.0077
Group 3 (90mg/kg of Extract) -.77500 .88878 .395 -2.6423 1.0923
Group 5 (5mg/kg of Artesunate) -.17500 .88878 .846 -2.0423 1.6923
Group 6 (Negative Control=5mg/kg of Distilled Water) -1.02500 .88878 .264 -2.8923 .8423
Group 5 (5mg/kg of
Artesunate)
Group 1 (Positive Control) -1.35000 .88878 .146 -3.2173 .5173
Group 2 (45 mg/kg Extract) -1.70000 .88878 .072 -3.5673 .1673
Group 3 (90mg/kg of Extract) -.60000 .88878 .508 -2.4673 1.2673
Group 4 (180mg/kg of Extract) .17500 .88878 .846 -1.6923 2.0423
Group 6 (Negative Control=5mg/kg of Distilled Water) -.85000 .88878 .352 -2.7173 1.0173
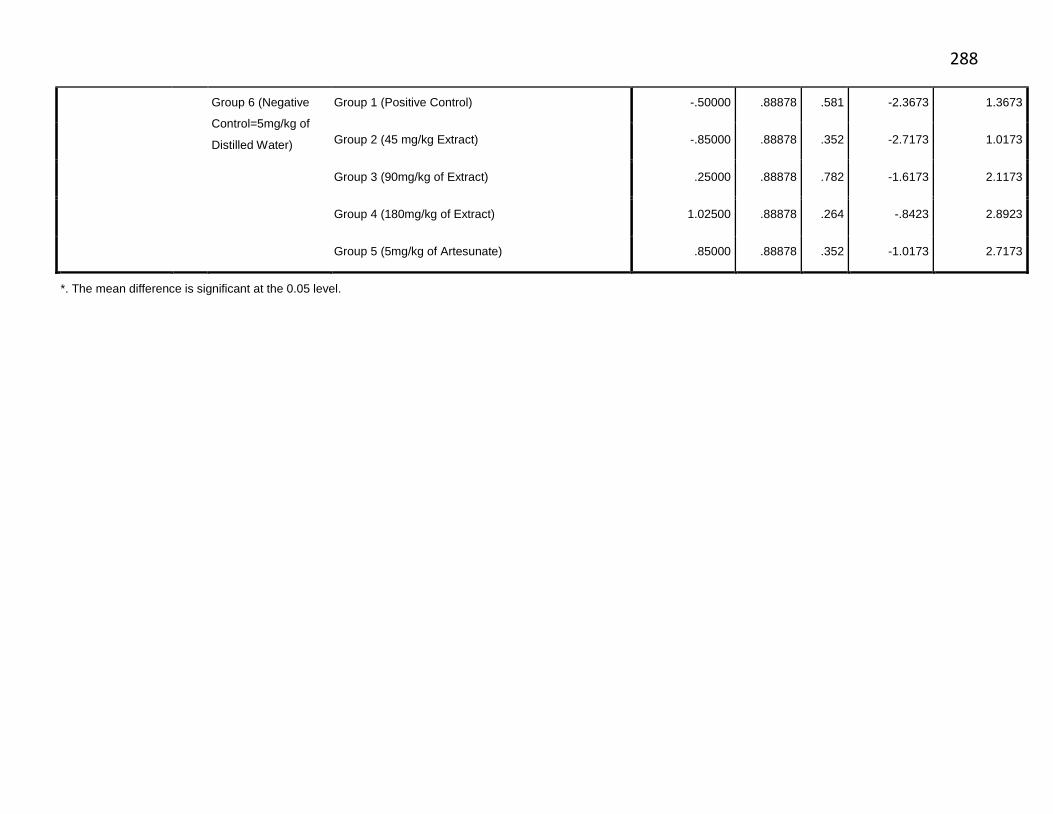
288
Group 6 (Negative
Control=5mg/kg of
Distilled Water)
Group 1 (Positive Control) -.50000 .88878 .581 -2.3673 1.3673
Group 2 (45 mg/kg Extract) -.85000 .88878 .352 -2.7173 1.0173
Group 3 (90mg/kg of Extract) .25000 .88878 .782 -1.6173 2.1173
Group 4 (180mg/kg of Extract) 1.02500 .88878 .264 -.8423 2.8923
Group 5 (5mg/kg of Artesunate) .85000 .88878 .352 -1.0173 2.7173
*. The mean difference is significant at the 0.05 level.
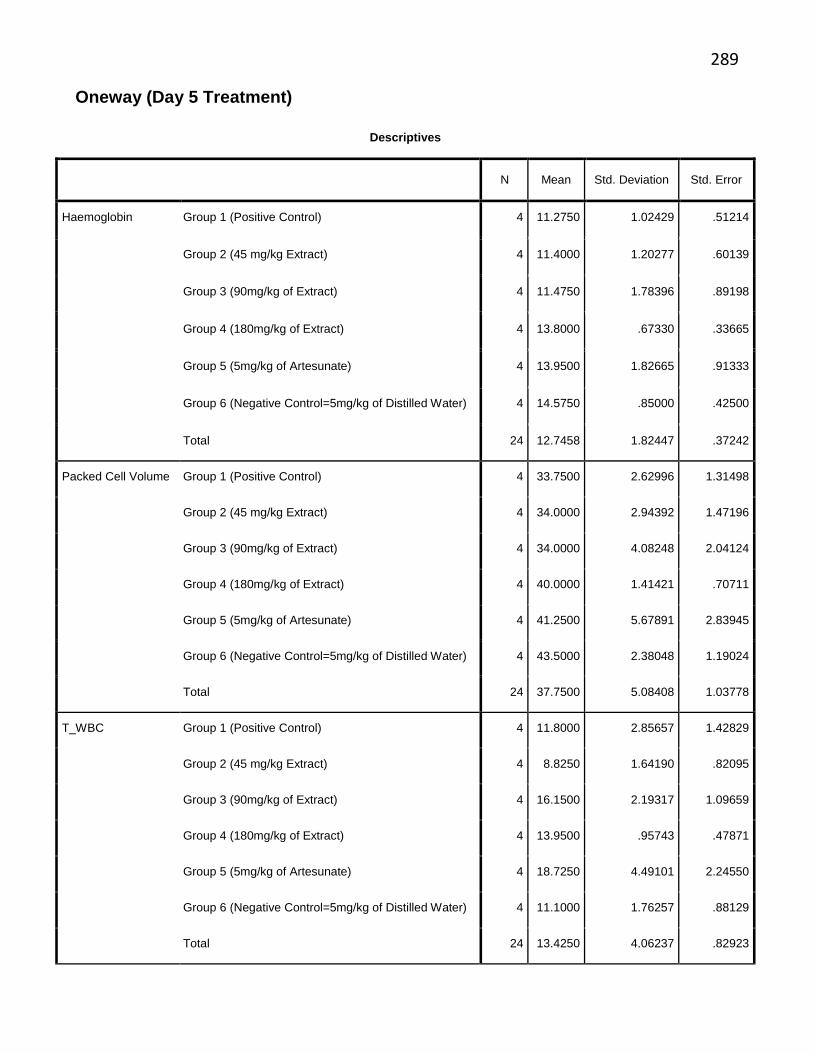
289
Oneway (Day 5 Treatment)
Descriptives
N Mean Std. Deviation Std. Error
Haemoglobin Group 1 (Positive Control) 4 11.2750 1.02429 .51214
Group 2 (45 mg/kg Extract) 4 11.4000 1.20277 .60139
Group 3 (90mg/kg of Extract) 4 11.4750 1.78396 .89198
Group 4 (180mg/kg of Extract) 4 13.8000 .67330 .33665
Group 5 (5mg/kg of Artesunate) 4 13.9500 1.82665 .91333
Group 6 (Negative Control=5mg/kg of Distilled Water) 4 14.5750 .85000 .42500
Total 24 12.7458 1.82447 .37242
Packed Cell Volume Group 1 (Positive Control) 4 33.7500 2.62996 1.31498
Group 2 (45 mg/kg Extract) 4 34.0000 2.94392 1.47196
Group 3 (90mg/kg of Extract) 4 34.0000 4.08248 2.04124
Group 4 (180mg/kg of Extract) 4 40.0000 1.41421 .70711
Group 5 (5mg/kg of Artesunate) 4 41.2500 5.67891 2.83945
Group 6 (Negative Control=5mg/kg of Distilled Water) 4 43.5000 2.38048 1.19024
Total 24 37.7500 5.08408 1.03778
T_WBC Group 1 (Positive Control) 4 11.8000 2.85657 1.42829
Group 2 (45 mg/kg Extract) 4 8.8250 1.64190 .82095
Group 3 (90mg/kg of Extract) 4 16.1500 2.19317 1.09659
Group 4 (180mg/kg of Extract) 4 13.9500 .95743 .47871
Group 5 (5mg/kg of Artesunate) 4 18.7250 4.49101 2.24550
Group 6 (Negative Control=5mg/kg of Distilled Water) 4 11.1000 1.76257 .88129
Total 24 13.4250 4.06237 .82923

290
RBC Group 1 (Positive Control) 4 6.5500 2.37417 1.18708
Group 2 (45 mg/kg Extract) 4 8.5250 1.15289 .57645
Group 3 (90mg/kg of Extract) 4 8.4750 1.85899 .92949
Group 4 (180mg/kg of Extract) 4 12.3750 1.70171 .85086
Group 5 (5mg/kg of Artesunate) 4 11.5500 .70475 .35237
Group 6 (Negative Control=5mg/kg of Distilled Water) 4 11.3250 2.25592 1.12796
Total 24 9.8000 2.64213 .53932
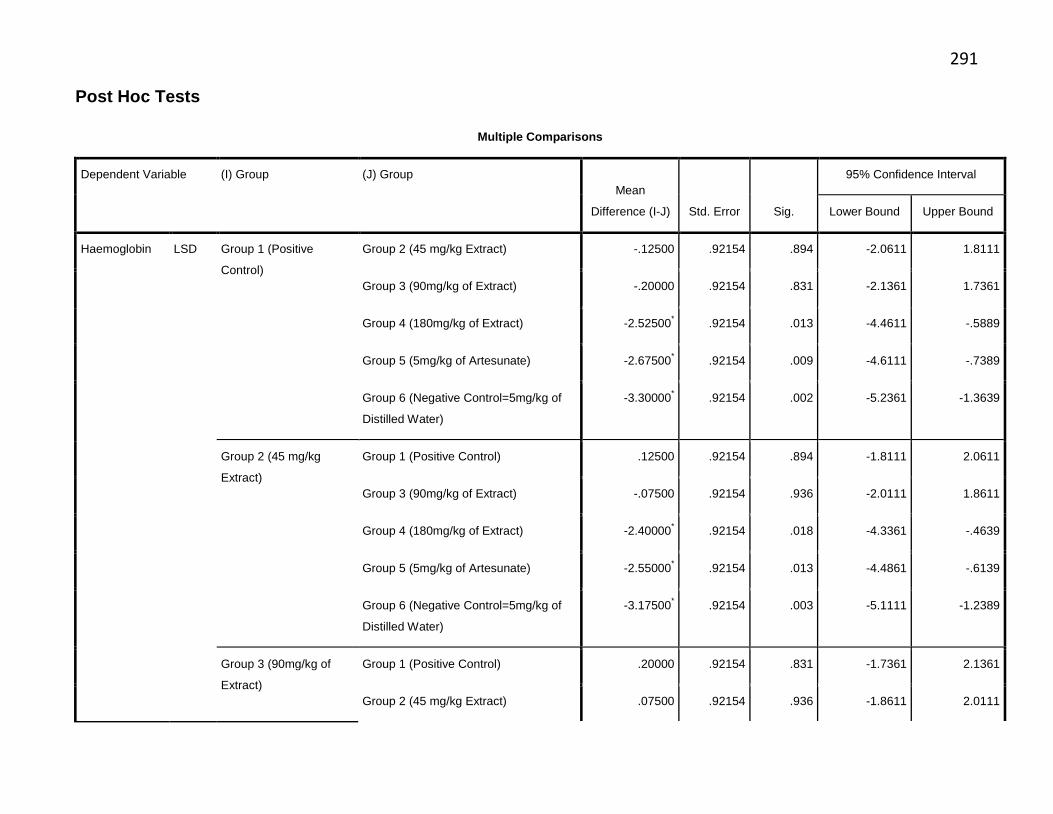
291
Post Hoc Tests
Multiple Comparisons
Dependent Variable (I) Group (J) Group
Mean
Difference (I-J) Std. Error Sig.
95% Confidence Interval
Lower Bound Upper Bound
Haemoglobin LSD Group 1 (Positive
Control)
Group 2 (45 mg/kg Extract) -.12500 .92154 .894 -2.0611 1.8111
Group 3 (90mg/kg of Extract) -.20000 .92154 .831 -2.1361 1.7361
Group 4 (180mg/kg of Extract) -2.52500* .92154 .013 -4.4611 -.5889
Group 5 (5mg/kg of Artesunate) -2.67500* .92154 .009 -4.6111 -.7389
Group 6 (Negative Control=5mg/kg of
Distilled Water)
-3.30000* .92154 .002 -5.2361 -1.3639
Group 2 (45 mg/kg
Extract)
Group 1 (Positive Control) .12500 .92154 .894 -1.8111 2.0611
Group 3 (90mg/kg of Extract) -.07500 .92154 .936 -2.0111 1.8611
Group 4 (180mg/kg of Extract) -2.40000* .92154 .018 -4.3361 -.4639
Group 5 (5mg/kg of Artesunate) -2.55000* .92154 .013 -4.4861 -.6139
Group 6 (Negative Control=5mg/kg of
Distilled Water)
-3.17500* .92154 .003 -5.1111 -1.2389
Group 3 (90mg/kg of
Extract)
Group 1 (Positive Control) .20000 .92154 .831 -1.7361 2.1361
Group 2 (45 mg/kg Extract) .07500 .92154 .936 -1.8611 2.0111
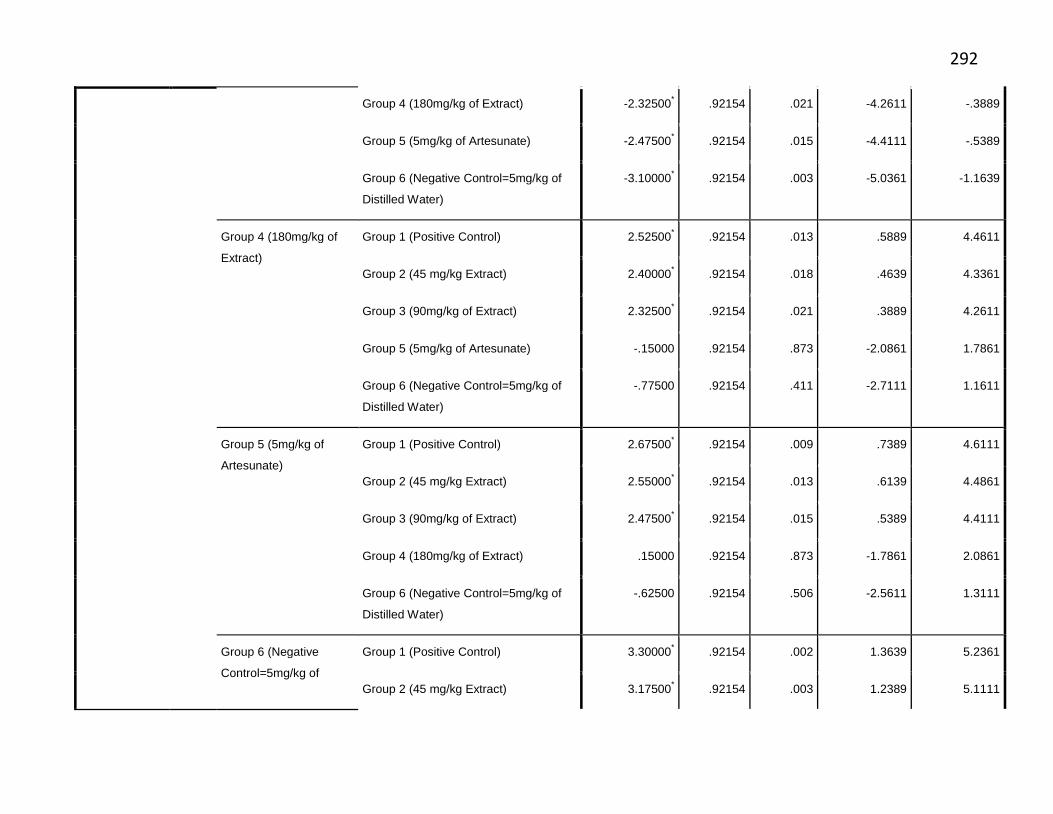
292
Group 4 (180mg/kg of Extract) -2.32500* .92154 .021 -4.2611 -.3889
Group 5 (5mg/kg of Artesunate) -2.47500* .92154 .015 -4.4111 -.5389
Group 6 (Negative Control=5mg/kg of
Distilled Water)
-3.10000* .92154 .003 -5.0361 -1.1639
Group 4 (180mg/kg of
Extract)
Group 1 (Positive Control) 2.52500* .92154 .013 .5889 4.4611
Group 2 (45 mg/kg Extract) 2.40000* .92154 .018 .4639 4.3361
Group 3 (90mg/kg of Extract) 2.32500* .92154 .021 .3889 4.2611
Group 5 (5mg/kg of Artesunate) -.15000 .92154 .873 -2.0861 1.7861
Group 6 (Negative Control=5mg/kg of
Distilled Water)
-.77500 .92154 .411 -2.7111 1.1611
Group 5 (5mg/kg of
Artesunate)
Group 1 (Positive Control) 2.67500* .92154 .009 .7389 4.6111
Group 2 (45 mg/kg Extract) 2.55000* .92154 .013 .6139 4.4861
Group 3 (90mg/kg of Extract) 2.47500* .92154 .015 .5389 4.4111
Group 4 (180mg/kg of Extract) .15000 .92154 .873 -1.7861 2.0861
Group 6 (Negative Control=5mg/kg of
Distilled Water)
-.62500 .92154 .506 -2.5611 1.3111
Group 6 (Negative
Control=5mg/kg of
Group 1 (Positive Control) 3.30000* .92154 .002 1.3639 5.2361
Group 2 (45 mg/kg Extract) 3.17500* .92154 .003 1.2389 5.1111
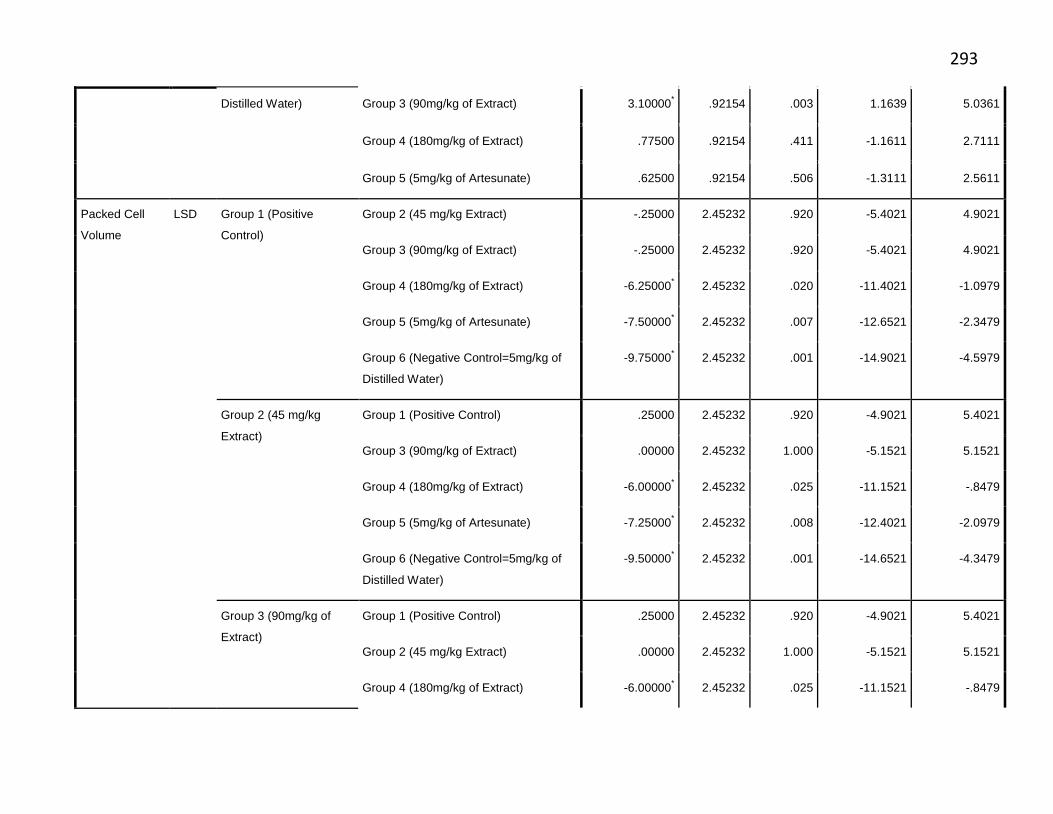
293
Distilled Water) Group 3 (90mg/kg of Extract) 3.10000* .92154 .003 1.1639 5.0361
Group 4 (180mg/kg of Extract) .77500 .92154 .411 -1.1611 2.7111
Group 5 (5mg/kg of Artesunate) .62500 .92154 .506 -1.3111 2.5611
Packed Cell
Volume
LSD Group 1 (Positive
Control)
Group 2 (45 mg/kg Extract) -.25000 2.45232 .920 -5.4021 4.9021
Group 3 (90mg/kg of Extract) -.25000 2.45232 .920 -5.4021 4.9021
Group 4 (180mg/kg of Extract) -6.25000* 2.45232 .020 -11.4021 -1.0979
Group 5 (5mg/kg of Artesunate) -7.50000* 2.45232 .007 -12.6521 -2.3479
Group 6 (Negative Control=5mg/kg of
Distilled Water)
-9.75000* 2.45232 .001 -14.9021 -4.5979
Group 2 (45 mg/kg
Extract)
Group 1 (Positive Control) .25000 2.45232 .920 -4.9021 5.4021
Group 3 (90mg/kg of Extract) .00000 2.45232 1.000 -5.1521 5.1521
Group 4 (180mg/kg of Extract) -6.00000* 2.45232 .025 -11.1521 -.8479
Group 5 (5mg/kg of Artesunate) -7.25000* 2.45232 .008 -12.4021 -2.0979
Group 6 (Negative Control=5mg/kg of
Distilled Water)
-9.50000* 2.45232 .001 -14.6521 -4.3479
Group 3 (90mg/kg of
Extract)
Group 1 (Positive Control) .25000 2.45232 .920 -4.9021 5.4021
Group 2 (45 mg/kg Extract) .00000 2.45232 1.000 -5.1521 5.1521
Group 4 (180mg/kg of Extract) -6.00000* 2.45232 .025 -11.1521 -.8479
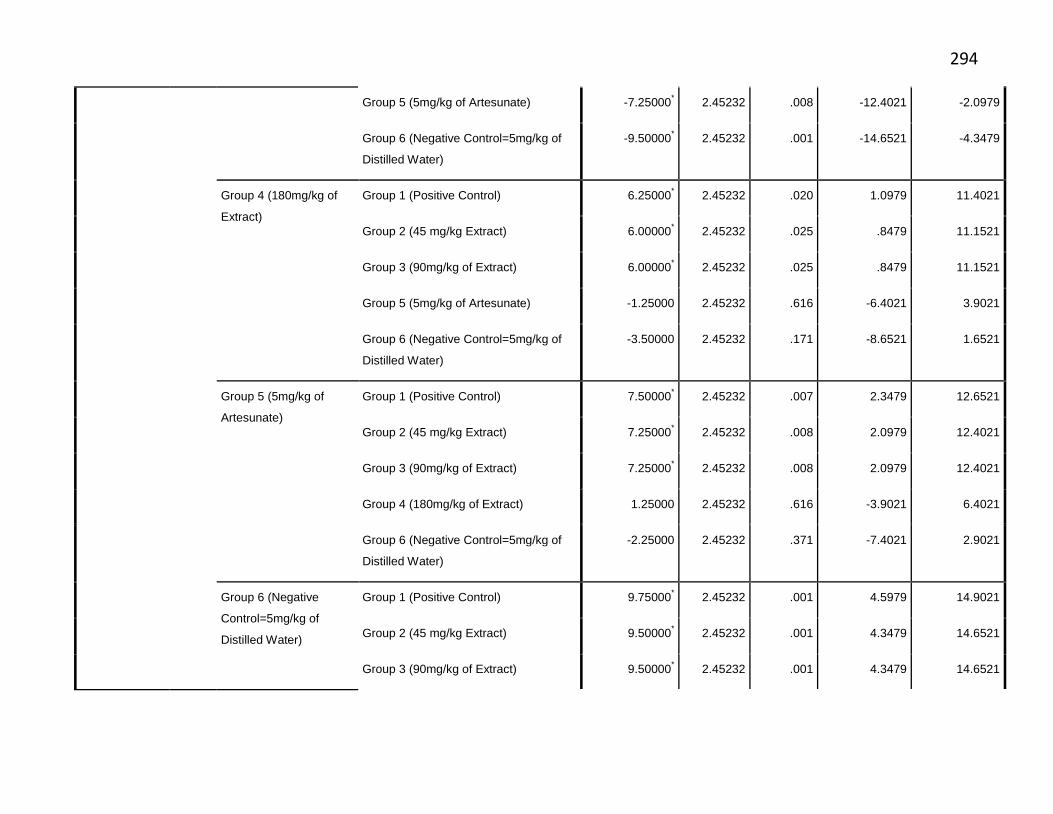
294
Group 5 (5mg/kg of Artesunate) -7.25000* 2.45232 .008 -12.4021 -2.0979
Group 6 (Negative Control=5mg/kg of
Distilled Water)
-9.50000* 2.45232 .001 -14.6521 -4.3479
Group 4 (180mg/kg of
Extract)
Group 1 (Positive Control) 6.25000* 2.45232 .020 1.0979 11.4021
Group 2 (45 mg/kg Extract) 6.00000* 2.45232 .025 .8479 11.1521
Group 3 (90mg/kg of Extract) 6.00000* 2.45232 .025 .8479 11.1521
Group 5 (5mg/kg of Artesunate) -1.25000 2.45232 .616 -6.4021 3.9021
Group 6 (Negative Control=5mg/kg of
Distilled Water)
-3.50000 2.45232 .171 -8.6521 1.6521
Group 5 (5mg/kg of
Artesunate)
Group 1 (Positive Control) 7.50000* 2.45232 .007 2.3479 12.6521
Group 2 (45 mg/kg Extract) 7.25000* 2.45232 .008 2.0979 12.4021
Group 3 (90mg/kg of Extract) 7.25000* 2.45232 .008 2.0979 12.4021
Group 4 (180mg/kg of Extract) 1.25000 2.45232 .616 -3.9021 6.4021
Group 6 (Negative Control=5mg/kg of
Distilled Water)
-2.25000 2.45232 .371 -7.4021 2.9021
Group 6 (Negative
Control=5mg/kg of
Distilled Water)
Group 1 (Positive Control) 9.75000* 2.45232 .001 4.5979 14.9021
Group 2 (45 mg/kg Extract) 9.50000* 2.45232 .001 4.3479 14.6521
Group 3 (90mg/kg of Extract) 9.50000* 2.45232 .001 4.3479 14.6521
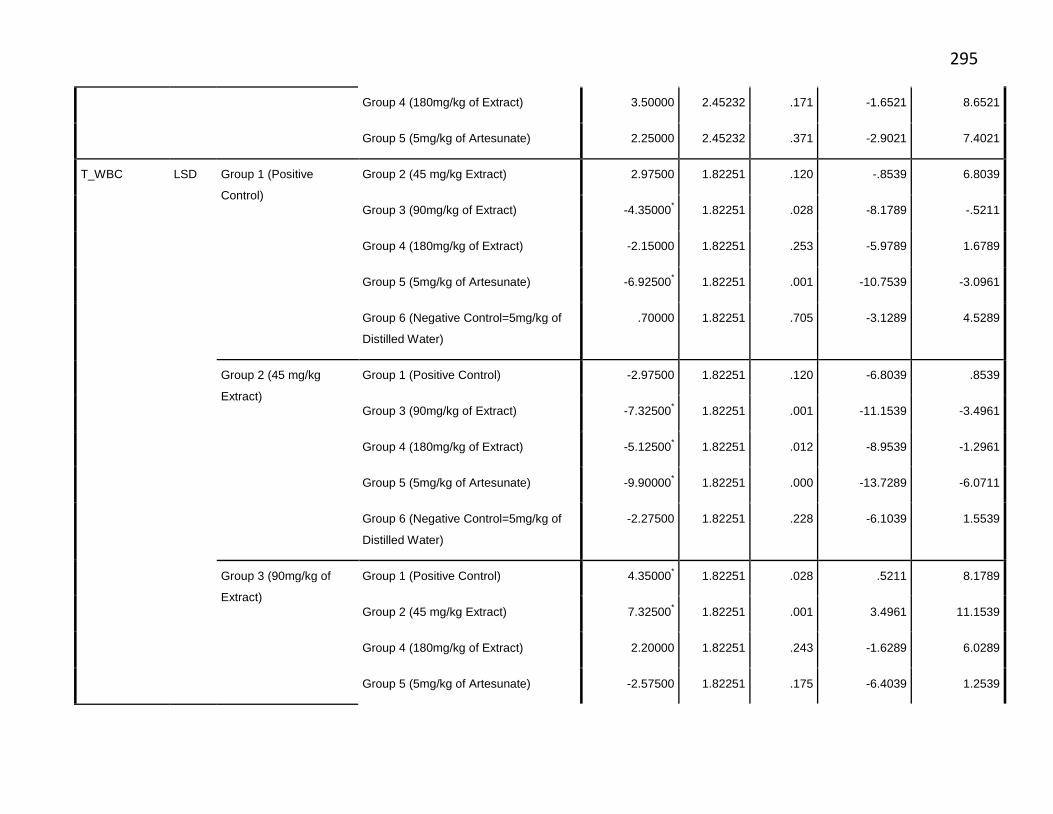
295
Group 4 (180mg/kg of Extract) 3.50000 2.45232 .171 -1.6521 8.6521
Group 5 (5mg/kg of Artesunate) 2.25000 2.45232 .371 -2.9021 7.4021
T_WBC LSD Group 1 (Positive
Control)
Group 2 (45 mg/kg Extract) 2.97500 1.82251 .120 -.8539 6.8039
Group 3 (90mg/kg of Extract) -4.35000* 1.82251 .028 -8.1789 -.5211
Group 4 (180mg/kg of Extract) -2.15000 1.82251 .253 -5.9789 1.6789
Group 5 (5mg/kg of Artesunate) -6.92500* 1.82251 .001 -10.7539 -3.0961
Group 6 (Negative Control=5mg/kg of
Distilled Water)
.70000 1.82251 .705 -3.1289 4.5289
Group 2 (45 mg/kg
Extract)
Group 1 (Positive Control) -2.97500 1.82251 .120 -6.8039 .8539
Group 3 (90mg/kg of Extract) -7.32500* 1.82251 .001 -11.1539 -3.4961
Group 4 (180mg/kg of Extract) -5.12500* 1.82251 .012 -8.9539 -1.2961
Group 5 (5mg/kg of Artesunate) -9.90000* 1.82251 .000 -13.7289 -6.0711
Group 6 (Negative Control=5mg/kg of
Distilled Water)
-2.27500 1.82251 .228 -6.1039 1.5539
Group 3 (90mg/kg of
Extract)
Group 1 (Positive Control) 4.35000* 1.82251 .028 .5211 8.1789
Group 2 (45 mg/kg Extract) 7.32500* 1.82251 .001 3.4961 11.1539
Group 4 (180mg/kg of Extract) 2.20000 1.82251 .243 -1.6289 6.0289
Group 5 (5mg/kg of Artesunate) -2.57500 1.82251 .175 -6.4039 1.2539
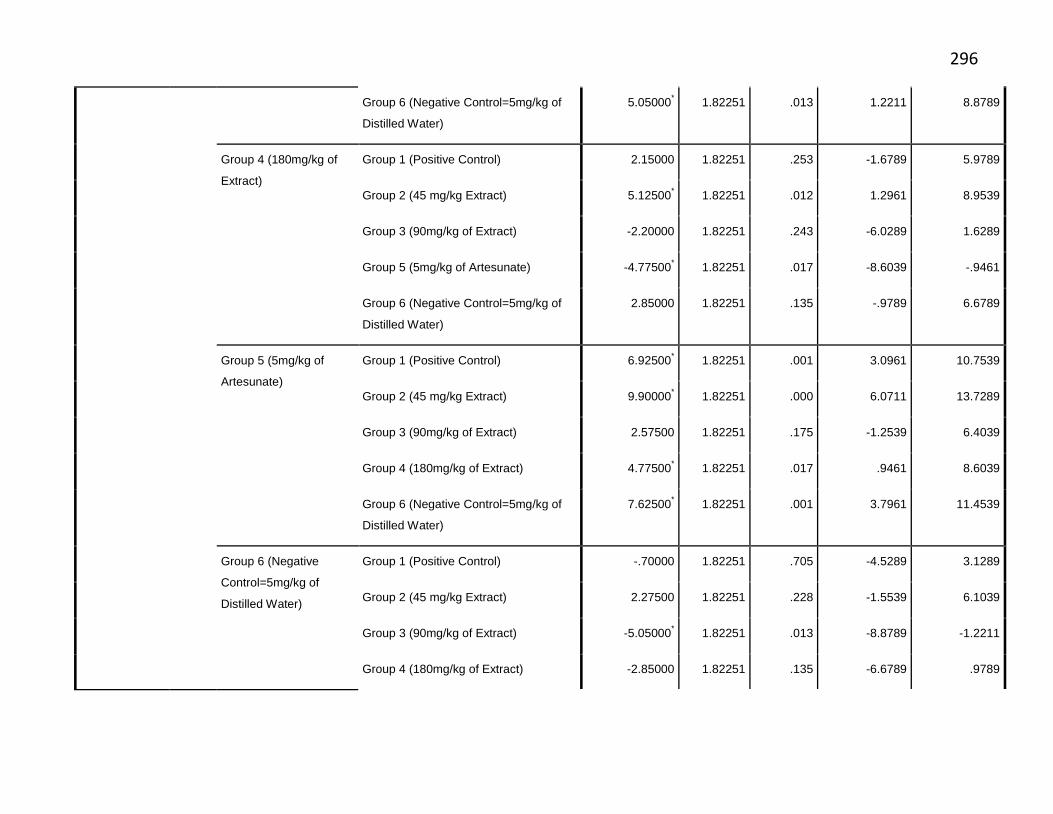
296
Group 6 (Negative Control=5mg/kg of
Distilled Water)
5.05000* 1.82251 .013 1.2211 8.8789
Group 4 (180mg/kg of
Extract)
Group 1 (Positive Control) 2.15000 1.82251 .253 -1.6789 5.9789
Group 2 (45 mg/kg Extract) 5.12500* 1.82251 .012 1.2961 8.9539
Group 3 (90mg/kg of Extract) -2.20000 1.82251 .243 -6.0289 1.6289
Group 5 (5mg/kg of Artesunate) -4.77500* 1.82251 .017 -8.6039 -.9461
Group 6 (Negative Control=5mg/kg of
Distilled Water)
2.85000 1.82251 .135 -.9789 6.6789
Group 5 (5mg/kg of
Artesunate)
Group 1 (Positive Control) 6.92500* 1.82251 .001 3.0961 10.7539
Group 2 (45 mg/kg Extract) 9.90000* 1.82251 .000 6.0711 13.7289
Group 3 (90mg/kg of Extract) 2.57500 1.82251 .175 -1.2539 6.4039
Group 4 (180mg/kg of Extract) 4.77500* 1.82251 .017 .9461 8.6039
Group 6 (Negative Control=5mg/kg of
Distilled Water)
7.62500* 1.82251 .001 3.7961 11.4539
Group 6 (Negative
Control=5mg/kg of
Distilled Water)
Group 1 (Positive Control) -.70000 1.82251 .705 -4.5289 3.1289
Group 2 (45 mg/kg Extract) 2.27500 1.82251 .228 -1.5539 6.1039
Group 3 (90mg/kg of Extract) -5.05000* 1.82251 .013 -8.8789 -1.2211
Group 4 (180mg/kg of Extract) -2.85000 1.82251 .135 -6.6789 .9789
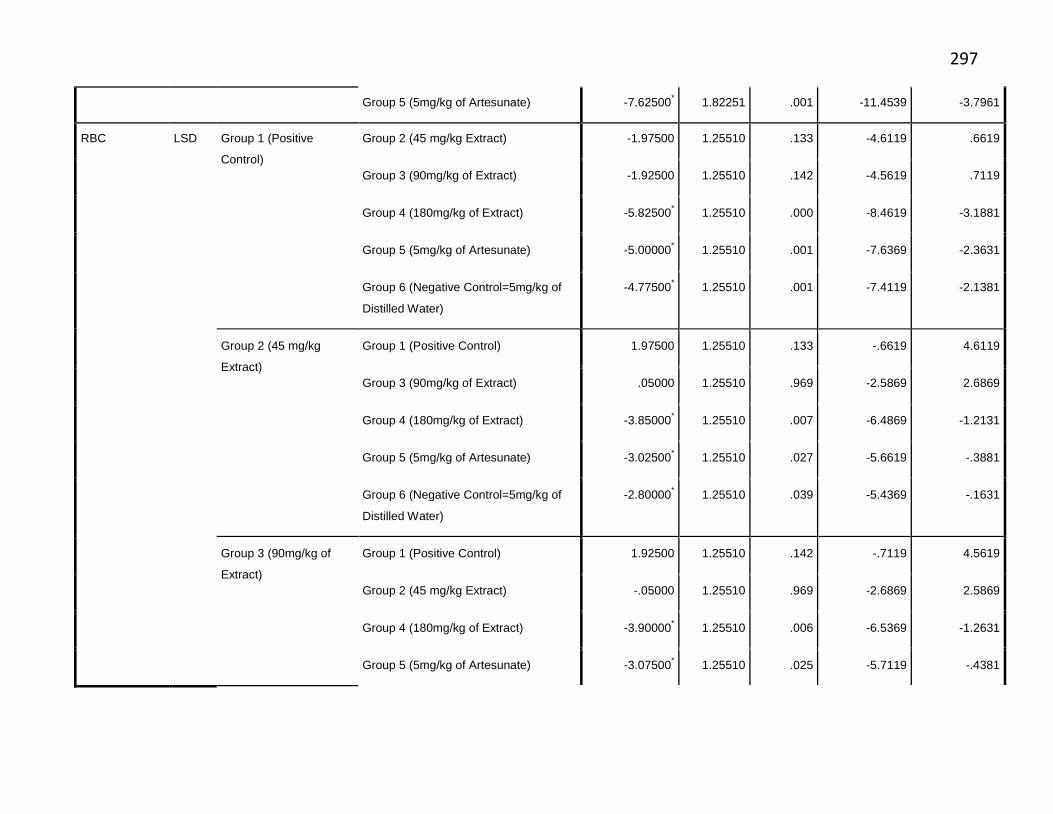
297
Group 5 (5mg/kg of Artesunate) -7.62500* 1.82251 .001 -11.4539 -3.7961
RBC LSD Group 1 (Positive
Control)
Group 2 (45 mg/kg Extract) -1.97500 1.25510 .133 -4.6119 .6619
Group 3 (90mg/kg of Extract) -1.92500 1.25510 .142 -4.5619 .7119
Group 4 (180mg/kg of Extract) -5.82500* 1.25510 .000 -8.4619 -3.1881
Group 5 (5mg/kg of Artesunate) -5.00000* 1.25510 .001 -7.6369 -2.3631
Group 6 (Negative Control=5mg/kg of
Distilled Water)
-4.77500* 1.25510 .001 -7.4119 -2.1381
Group 2 (45 mg/kg
Extract)
Group 1 (Positive Control) 1.97500 1.25510 .133 -.6619 4.6119
Group 3 (90mg/kg of Extract) .05000 1.25510 .969 -2.5869 2.6869
Group 4 (180mg/kg of Extract) -3.85000* 1.25510 .007 -6.4869 -1.2131
Group 5 (5mg/kg of Artesunate) -3.02500* 1.25510 .027 -5.6619 -.3881
Group 6 (Negative Control=5mg/kg of
Distilled Water)
-2.80000* 1.25510 .039 -5.4369 -.1631
Group 3 (90mg/kg of
Extract)
Group 1 (Positive Control) 1.92500 1.25510 .142 -.7119 4.5619
Group 2 (45 mg/kg Extract) -.05000 1.25510 .969 -2.6869 2.5869
Group 4 (180mg/kg of Extract) -3.90000* 1.25510 .006 -6.5369 -1.2631
Group 5 (5mg/kg of Artesunate) -3.07500* 1.25510 .025 -5.7119 -.4381
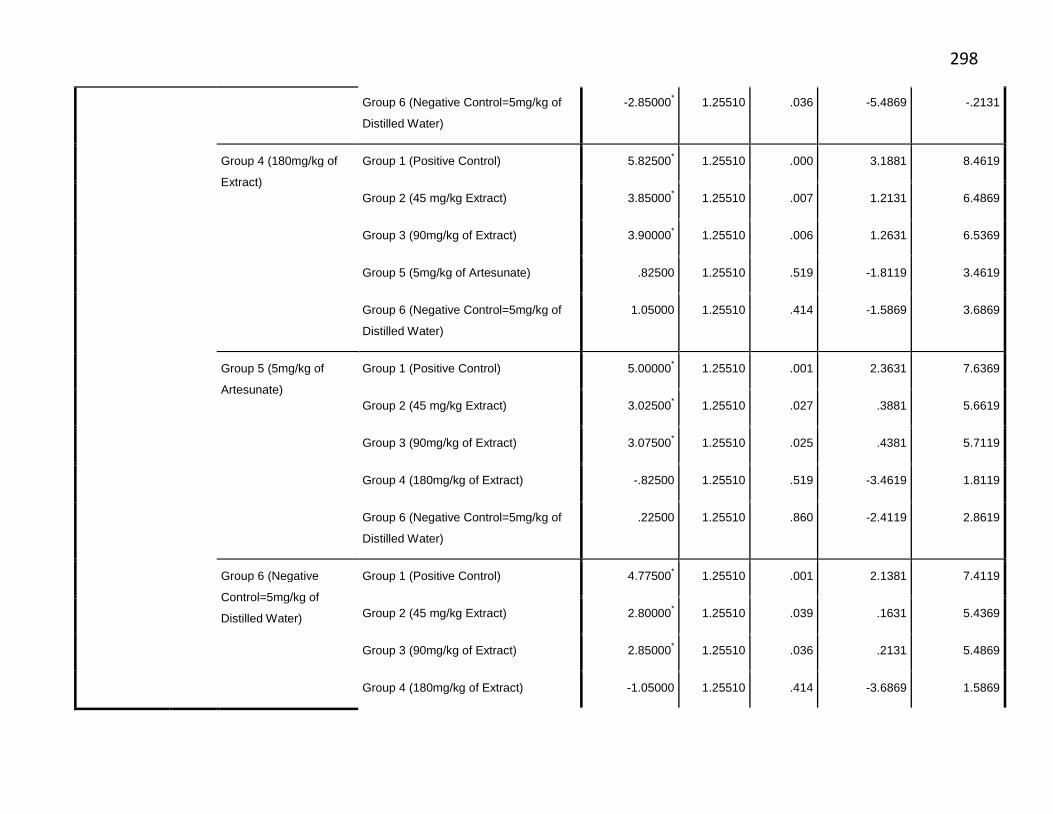
298
Group 6 (Negative Control=5mg/kg of
Distilled Water)
-2.85000* 1.25510 .036 -5.4869 -.2131
Group 4 (180mg/kg of
Extract)
Group 1 (Positive Control) 5.82500* 1.25510 .000 3.1881 8.4619
Group 2 (45 mg/kg Extract) 3.85000* 1.25510 .007 1.2131 6.4869
Group 3 (90mg/kg of Extract) 3.90000* 1.25510 .006 1.2631 6.5369
Group 5 (5mg/kg of Artesunate) .82500 1.25510 .519 -1.8119 3.4619
Group 6 (Negative Control=5mg/kg of
Distilled Water)
1.05000 1.25510 .414 -1.5869 3.6869
Group 5 (5mg/kg of
Artesunate)
Group 1 (Positive Control) 5.00000* 1.25510 .001 2.3631 7.6369
Group 2 (45 mg/kg Extract) 3.02500* 1.25510 .027 .3881 5.6619
Group 3 (90mg/kg of Extract) 3.07500* 1.25510 .025 .4381 5.7119
Group 4 (180mg/kg of Extract) -.82500 1.25510 .519 -3.4619 1.8119
Group 6 (Negative Control=5mg/kg of
Distilled Water)
.22500 1.25510 .860 -2.4119 2.8619
Group 6 (Negative
Control=5mg/kg of
Distilled Water)
Group 1 (Positive Control) 4.77500* 1.25510 .001 2.1381 7.4119
Group 2 (45 mg/kg Extract) 2.80000* 1.25510 .039 .1631 5.4369
Group 3 (90mg/kg of Extract) 2.85000* 1.25510 .036 .2131 5.4869
Group 4 (180mg/kg of Extract) -1.05000 1.25510 .414 -3.6869 1.5869
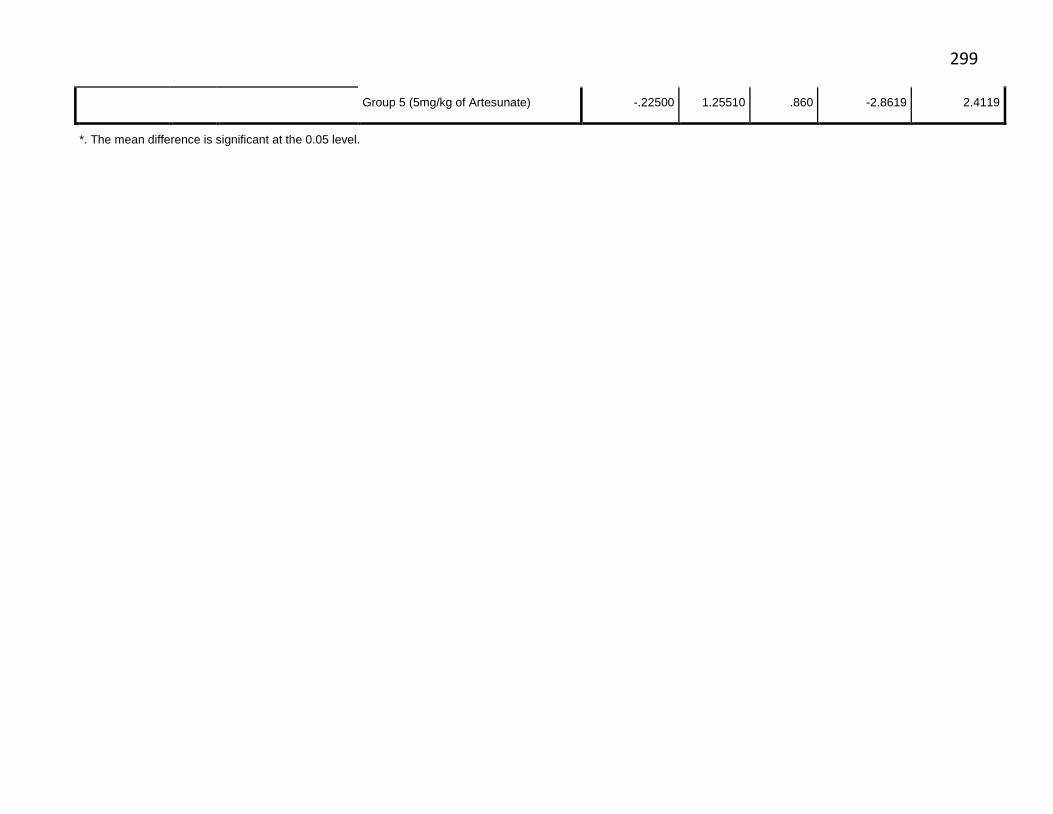
299
Group 5 (5mg/kg of Artesunate) -.22500 1.25510 .860 -2.8619 2.4119
*. The mean difference is significant at the 0.05 level.

300
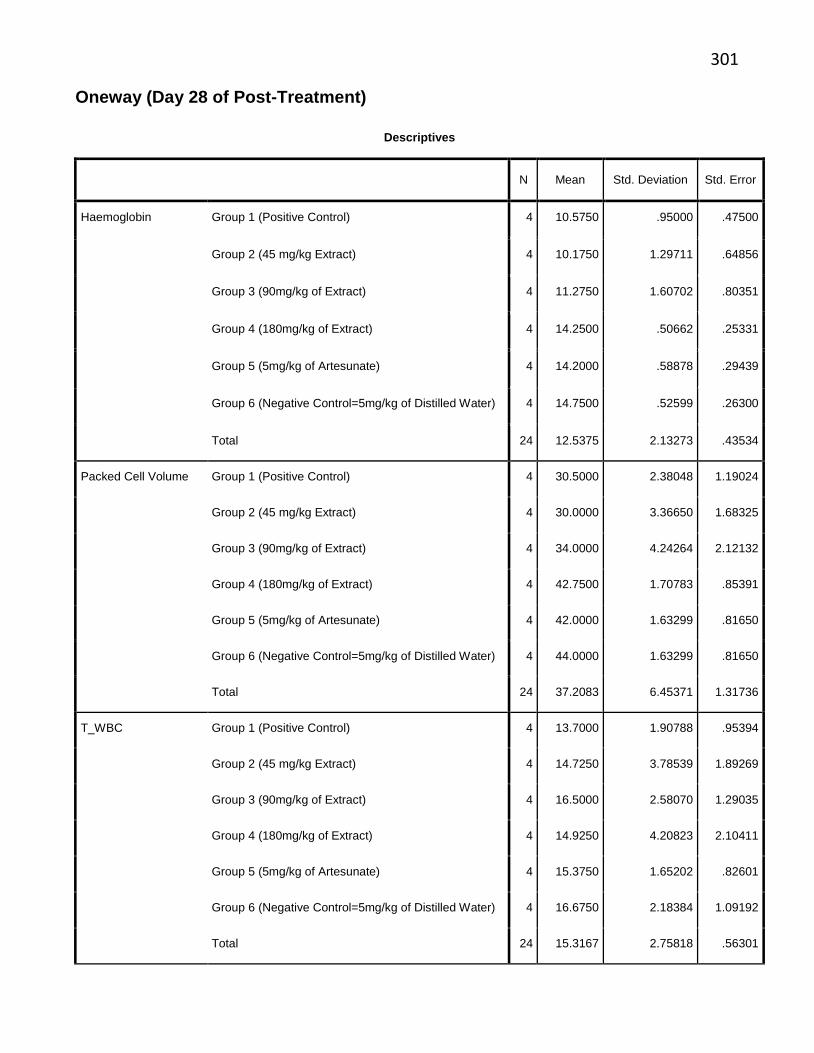
301
Oneway (Day 28 of Post-Treatment)
Descriptives
N Mean Std. Deviation Std. Error
Haemoglobin Group 1 (Positive Control) 4 10.5750 .95000 .47500
Group 2 (45 mg/kg Extract) 4 10.1750 1.29711 .64856
Group 3 (90mg/kg of Extract) 4 11.2750 1.60702 .80351
Group 4 (180mg/kg of Extract) 4 14.2500 .50662 .25331
Group 5 (5mg/kg of Artesunate) 4 14.2000 .58878 .29439
Group 6 (Negative Control=5mg/kg of Distilled Water) 4 14.7500 .52599 .26300
Total 24 12.5375 2.13273 .43534
Packed Cell Volume Group 1 (Positive Control) 4 30.5000 2.38048 1.19024
Group 2 (45 mg/kg Extract) 4 30.0000 3.36650 1.68325
Group 3 (90mg/kg of Extract) 4 34.0000 4.24264 2.12132
Group 4 (180mg/kg of Extract) 4 42.7500 1.70783 .85391
Group 5 (5mg/kg of Artesunate) 4 42.0000 1.63299 .81650
Group 6 (Negative Control=5mg/kg of Distilled Water) 4 44.0000 1.63299 .81650
Total 24 37.2083 6.45371 1.31736
T_WBC Group 1 (Positive Control) 4 13.7000 1.90788 .95394
Group 2 (45 mg/kg Extract) 4 14.7250 3.78539 1.89269
Group 3 (90mg/kg of Extract) 4 16.5000 2.58070 1.29035
Group 4 (180mg/kg of Extract) 4 14.9250 4.20823 2.10411
Group 5 (5mg/kg of Artesunate) 4 15.3750 1.65202 .82601
Group 6 (Negative Control=5mg/kg of Distilled Water) 4 16.6750 2.18384 1.09192
Total 24 15.3167 2.75818 .56301
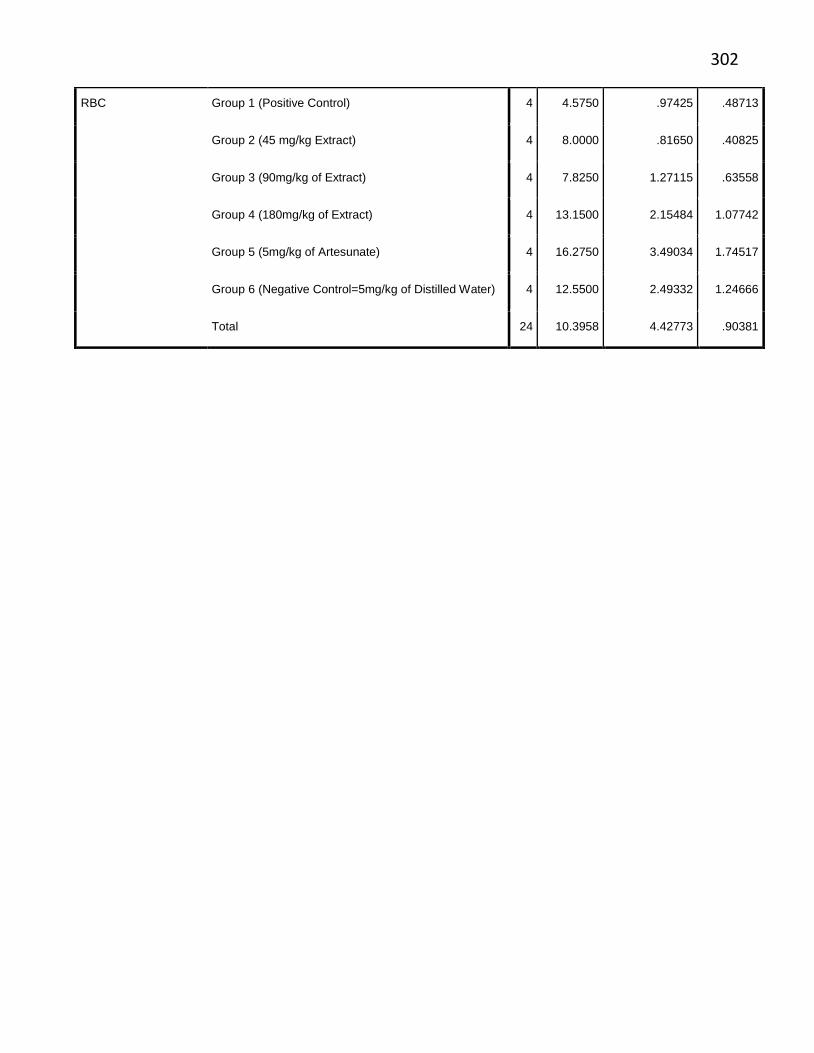
302
RBC Group 1 (Positive Control) 4 4.5750 .97425 .48713
Group 2 (45 mg/kg Extract) 4 8.0000 .81650 .40825
Group 3 (90mg/kg of Extract) 4 7.8250 1.27115 .63558
Group 4 (180mg/kg of Extract) 4 13.1500 2.15484 1.07742
Group 5 (5mg/kg of Artesunate) 4 16.2750 3.49034 1.74517
Group 6 (Negative Control=5mg/kg of Distilled Water) 4 12.5500 2.49332 1.24666
Total 24 10.3958 4.42773 .90381
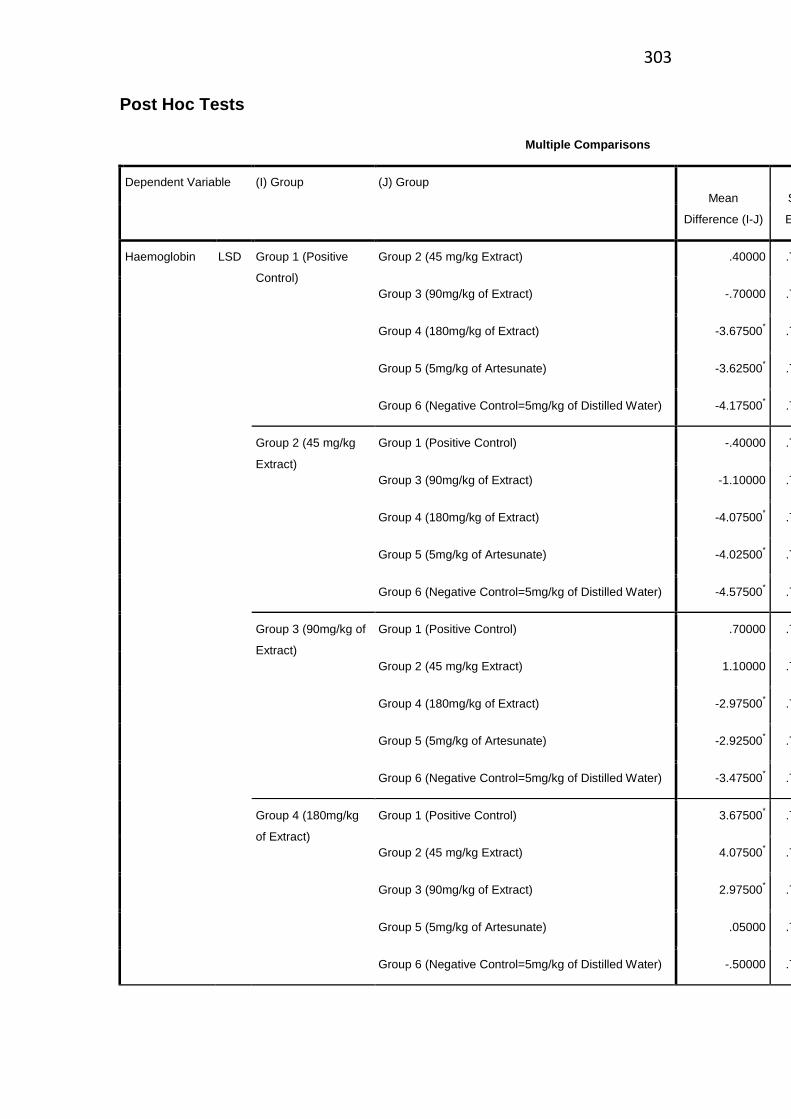
303
Post Hoc Tests
Multiple Comparisons
Dependent Variable (I) Group (J) Group
Mean
Difference (I-J)
Std.
Error Sig.
95% Confidence Interval
Lower Bound Upper Bound
Haemoglobin LSD Group 1 (Positive
Control)
Group 2 (45 mg/kg Extract) .40000 .70990 .580 -1.0914 1.8914
Group 3 (90mg/kg of Extract) -.70000 .70990 .337 -2.1914 .7914
Group 4 (180mg/kg of Extract) -3.67500* .70990 .000 -5.1664 -2.1836
Group 5 (5mg/kg of Artesunate) -3.62500* .70990 .000 -5.1164 -2.1336
Group 6 (Negative Control=5mg/kg of Distilled Water) -4.17500* .70990 .000 -5.6664 -2.6836
Group 2 (45 mg/kg
Extract)
Group 1 (Positive Control) -.40000 .70990 .580 -1.8914 1.0914
Group 3 (90mg/kg of Extract) -1.10000 .70990 .139 -2.5914 .3914
Group 4 (180mg/kg of Extract) -4.07500* .70990 .000 -5.5664 -2.5836
Group 5 (5mg/kg of Artesunate) -4.02500* .70990 .000 -5.5164 -2.5336
Group 6 (Negative Control=5mg/kg of Distilled Water) -4.57500* .70990 .000 -6.0664 -3.0836
Group 3 (90mg/kg of
Extract)
Group 1 (Positive Control) .70000 .70990 .337 -.7914 2.1914
Group 2 (45 mg/kg Extract) 1.10000 .70990 .139 -.3914 2.5914
Group 4 (180mg/kg of Extract) -2.97500* .70990 .001 -4.4664 -1.4836
Group 5 (5mg/kg of Artesunate) -2.92500* .70990 .001 -4.4164 -1.4336
Group 6 (Negative Control=5mg/kg of Distilled Water) -3.47500* .70990 .000 -4.9664 -1.9836
Group 4 (180mg/kg
of Extract)
Group 1 (Positive Control) 3.67500* .70990 .000 2.1836 5.1664
Group 2 (45 mg/kg Extract) 4.07500* .70990 .000 2.5836 5.5664
Group 3 (90mg/kg of Extract) 2.97500* .70990 .001 1.4836 4.4664
Group 5 (5mg/kg of Artesunate) .05000 .70990 .945 -1.4414 1.5414
Group 6 (Negative Control=5mg/kg of Distilled Water) -.50000 .70990 .490 -1.9914 .9914
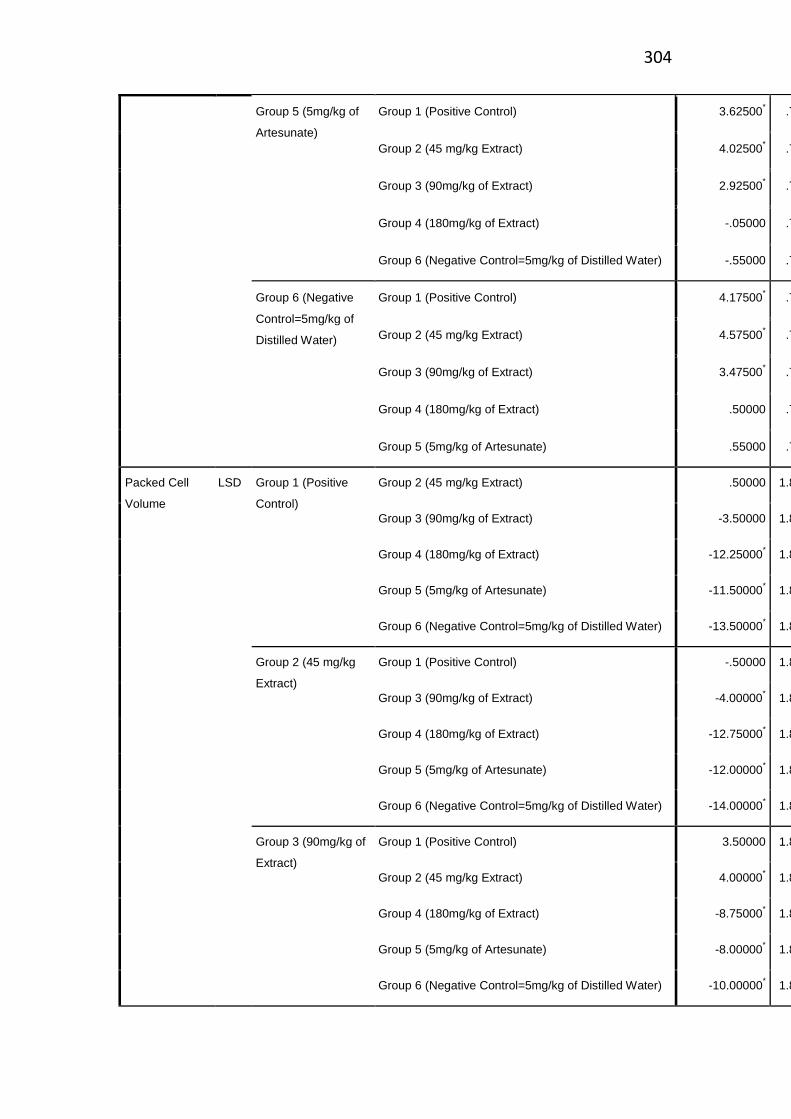
304
Group 5 (5mg/kg of
Artesunate)
Group 1 (Positive Control) 3.62500* .70990 .000 2.1336 5.1164
Group 2 (45 mg/kg Extract) 4.02500* .70990 .000 2.5336 5.5164
Group 3 (90mg/kg of Extract) 2.92500* .70990 .001 1.4336 4.4164
Group 4 (180mg/kg of Extract) -.05000 .70990 .945 -1.5414 1.4414
Group 6 (Negative Control=5mg/kg of Distilled Water) -.55000 .70990 .449 -2.0414 .9414
Group 6 (Negative
Control=5mg/kg of
Distilled Water)
Group 1 (Positive Control) 4.17500* .70990 .000 2.6836 5.6664
Group 2 (45 mg/kg Extract) 4.57500* .70990 .000 3.0836 6.0664
Group 3 (90mg/kg of Extract) 3.47500* .70990 .000 1.9836 4.9664
Group 4 (180mg/kg of Extract) .50000 .70990 .490 -.9914 1.9914
Group 5 (5mg/kg of Artesunate) .55000 .70990 .449 -.9414 2.0414
Packed Cell
Volume
LSD Group 1 (Positive
Control)
Group 2 (45 mg/kg Extract) .50000 1.89846 .795 -3.4885 4.4885
Group 3 (90mg/kg of Extract) -3.50000 1.89846 .082 -7.4885 .4885
Group 4 (180mg/kg of Extract) -12.25000* 1.89846 .000 -16.2385 -8.2615
Group 5 (5mg/kg of Artesunate) -11.50000* 1.89846 .000 -15.4885 -7.5115
Group 6 (Negative Control=5mg/kg of Distilled Water) -13.50000* 1.89846 .000 -17.4885 -9.5115
Group 2 (45 mg/kg
Extract)
Group 1 (Positive Control) -.50000 1.89846 .795 -4.4885 3.4885
Group 3 (90mg/kg of Extract) -4.00000* 1.89846 .049 -7.9885 -.0115
Group 4 (180mg/kg of Extract) -12.75000* 1.89846 .000 -16.7385 -8.7615
Group 5 (5mg/kg of Artesunate) -12.00000* 1.89846 .000 -15.9885 -8.0115
Group 6 (Negative Control=5mg/kg of Distilled Water) -14.00000* 1.89846 .000 -17.9885 -10.0115
Group 3 (90mg/kg of
Extract)
Group 1 (Positive Control) 3.50000 1.89846 .082 -.4885 7.4885
Group 2 (45 mg/kg Extract) 4.00000* 1.89846 .049 .0115 7.9885
Group 4 (180mg/kg of Extract) -8.75000* 1.89846 .000 -12.7385 -4.7615
Group 5 (5mg/kg of Artesunate) -8.00000* 1.89846 .001 -11.9885 -4.0115
Group 6 (Negative Control=5mg/kg of Distilled Water) -10.00000* 1.89846 .000 -13.9885 -6.0115
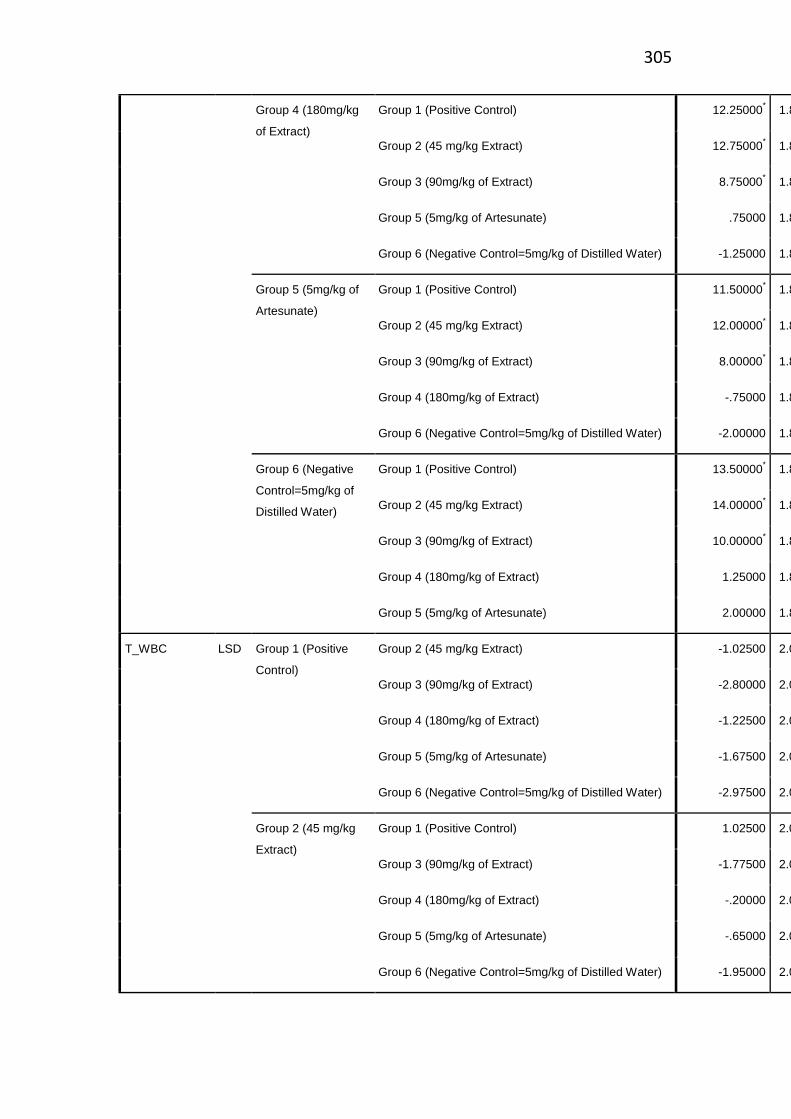
305
Group 4 (180mg/kg
of Extract)
Group 1 (Positive Control) 12.25000* 1.89846 .000 8.2615 16.2385
Group 2 (45 mg/kg Extract) 12.75000* 1.89846 .000 8.7615 16.7385
Group 3 (90mg/kg of Extract) 8.75000* 1.89846 .000 4.7615 12.7385
Group 5 (5mg/kg of Artesunate) .75000 1.89846 .697 -3.2385 4.7385
Group 6 (Negative Control=5mg/kg of Distilled Water) -1.25000 1.89846 .519 -5.2385 2.7385
Group 5 (5mg/kg of
Artesunate)
Group 1 (Positive Control) 11.50000* 1.89846 .000 7.5115 15.4885
Group 2 (45 mg/kg Extract) 12.00000* 1.89846 .000 8.0115 15.9885
Group 3 (90mg/kg of Extract) 8.00000* 1.89846 .001 4.0115 11.9885
Group 4 (180mg/kg of Extract) -.75000 1.89846 .697 -4.7385 3.2385
Group 6 (Negative Control=5mg/kg of Distilled Water) -2.00000 1.89846 .306 -5.9885 1.9885
Group 6 (Negative
Control=5mg/kg of
Distilled Water)
Group 1 (Positive Control) 13.50000* 1.89846 .000 9.5115 17.4885
Group 2 (45 mg/kg Extract) 14.00000* 1.89846 .000 10.0115 17.9885
Group 3 (90mg/kg of Extract) 10.00000* 1.89846 .000 6.0115 13.9885
Group 4 (180mg/kg of Extract) 1.25000 1.89846 .519 -2.7385 5.2385
Group 5 (5mg/kg of Artesunate) 2.00000 1.89846 .306 -1.9885 5.9885
T_WBC LSD Group 1 (Positive
Control)
Group 2 (45 mg/kg Extract) -1.02500 2.03790 .621 -5.3065 3.2565
Group 3 (90mg/kg of Extract) -2.80000 2.03790 .186 -7.0815 1.4815
Group 4 (180mg/kg of Extract) -1.22500 2.03790 .555 -5.5065 3.0565
Group 5 (5mg/kg of Artesunate) -1.67500 2.03790 .422 -5.9565 2.6065
Group 6 (Negative Control=5mg/kg of Distilled Water) -2.97500 2.03790 .162 -7.2565 1.3065
Group 2 (45 mg/kg
Extract)
Group 1 (Positive Control) 1.02500 2.03790 .621 -3.2565 5.3065
Group 3 (90mg/kg of Extract) -1.77500 2.03790 .395 -6.0565 2.5065
Group 4 (180mg/kg of Extract) -.20000 2.03790 .923 -4.4815 4.0815
Group 5 (5mg/kg of Artesunate) -.65000 2.03790 .753 -4.9315 3.6315
Group 6 (Negative Control=5mg/kg of Distilled Water) -1.95000 2.03790 .351 -6.2315 2.3315
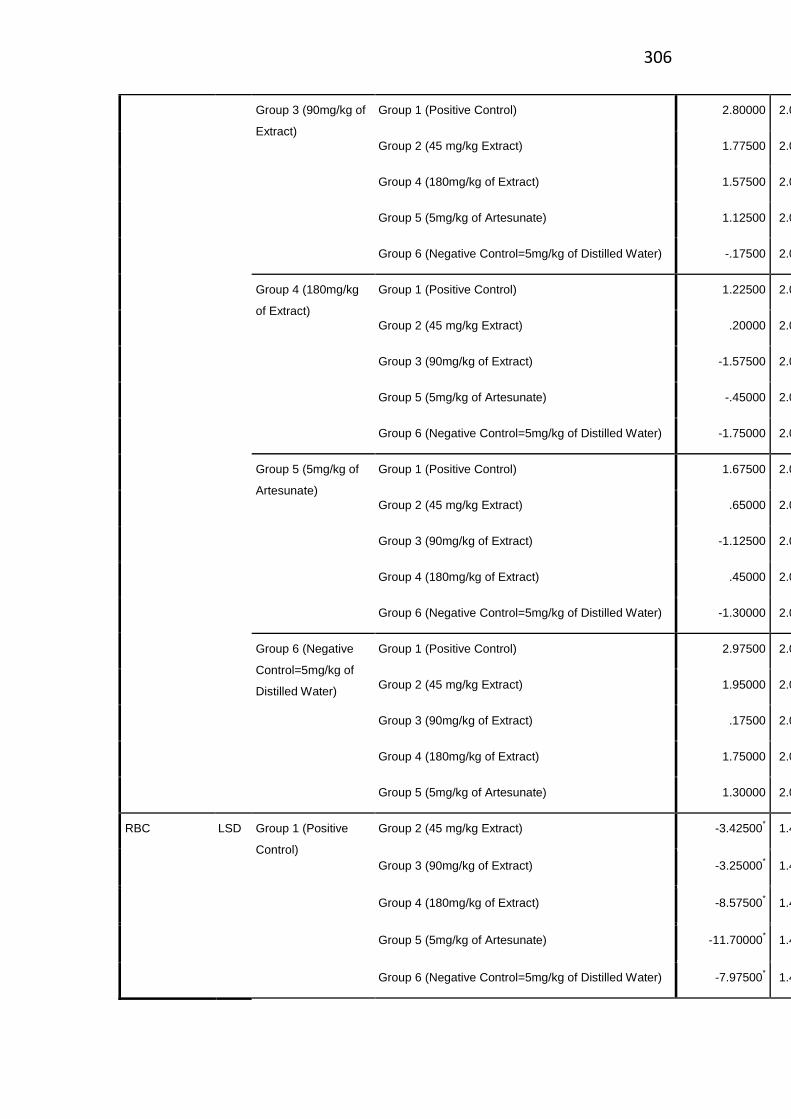
306
Group 3 (90mg/kg of
Extract)
Group 1 (Positive Control) 2.80000 2.03790 .186 -1.4815 7.0815
Group 2 (45 mg/kg Extract) 1.77500 2.03790 .395 -2.5065 6.0565
Group 4 (180mg/kg of Extract) 1.57500 2.03790 .450 -2.7065 5.8565
Group 5 (5mg/kg of Artesunate) 1.12500 2.03790 .588 -3.1565 5.4065
Group 6 (Negative Control=5mg/kg of Distilled Water) -.17500 2.03790 .933 -4.4565 4.1065
Group 4 (180mg/kg
of Extract)
Group 1 (Positive Control) 1.22500 2.03790 .555 -3.0565 5.5065
Group 2 (45 mg/kg Extract) .20000 2.03790 .923 -4.0815 4.4815
Group 3 (90mg/kg of Extract) -1.57500 2.03790 .450 -5.8565 2.7065
Group 5 (5mg/kg of Artesunate) -.45000 2.03790 .828 -4.7315 3.8315
Group 6 (Negative Control=5mg/kg of Distilled Water) -1.75000 2.03790 .402 -6.0315 2.5315
Group 5 (5mg/kg of
Artesunate)
Group 1 (Positive Control) 1.67500 2.03790 .422 -2.6065 5.9565
Group 2 (45 mg/kg Extract) .65000 2.03790 .753 -3.6315 4.9315
Group 3 (90mg/kg of Extract) -1.12500 2.03790 .588 -5.4065 3.1565
Group 4 (180mg/kg of Extract) .45000 2.03790 .828 -3.8315 4.7315
Group 6 (Negative Control=5mg/kg of Distilled Water) -1.30000 2.03790 .532 -5.5815 2.9815
Group 6 (Negative
Control=5mg/kg of
Distilled Water)
Group 1 (Positive Control) 2.97500 2.03790 .162 -1.3065 7.2565
Group 2 (45 mg/kg Extract) 1.95000 2.03790 .351 -2.3315 6.2315
Group 3 (90mg/kg of Extract) .17500 2.03790 .933 -4.1065 4.4565
Group 4 (180mg/kg of Extract) 1.75000 2.03790 .402 -2.5315 6.0315
Group 5 (5mg/kg of Artesunate) 1.30000 2.03790 .532 -2.9815 5.5815
RBC LSD Group 1 (Positive
Control)
Group 2 (45 mg/kg Extract) -3.42500* 1.47970 .033 -6.5337 -.3163
Group 3 (90mg/kg of Extract) -3.25000* 1.47970 .041 -6.3587 -.1413
Group 4 (180mg/kg of Extract) -8.57500* 1.47970 .000 -11.6837 -5.4663
Group 5 (5mg/kg of Artesunate) -11.70000* 1.47970 .000 -14.8087 -8.5913
Group 6 (Negative Control=5mg/kg of Distilled Water) -7.97500* 1.47970 .000 -11.0837 -4.8663
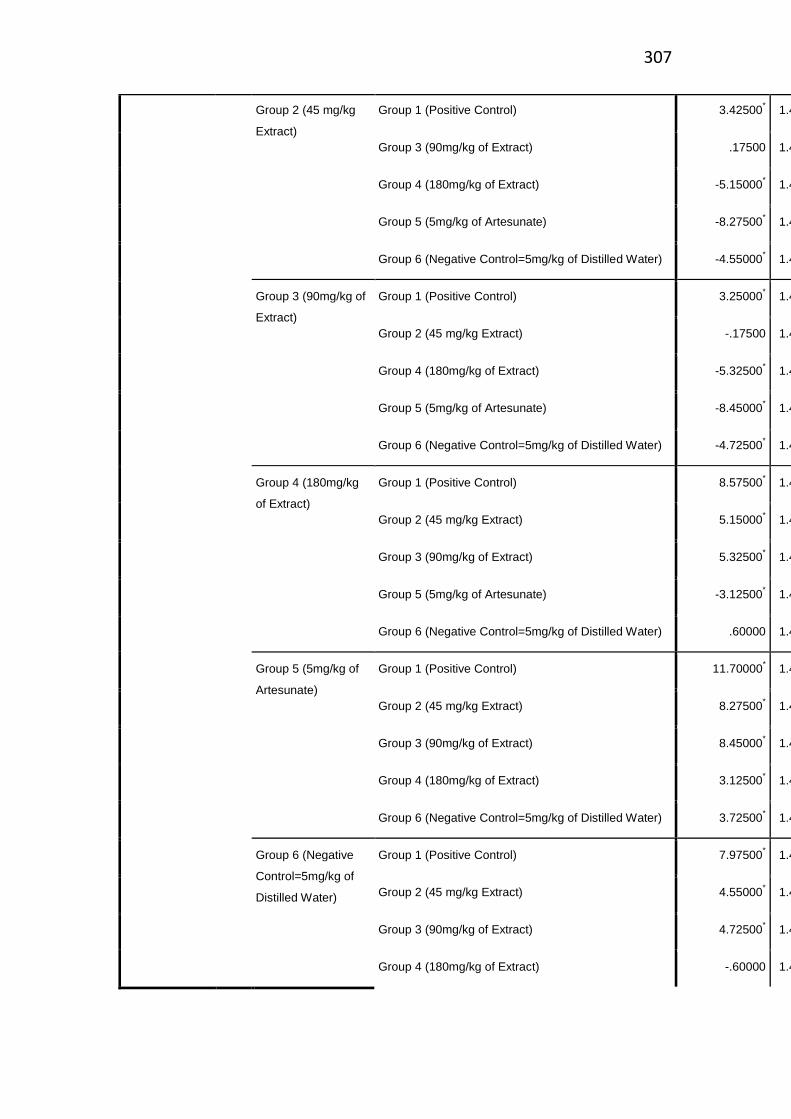
307
Group 2 (45 mg/kg
Extract)
Group 1 (Positive Control) 3.42500* 1.47970 .033 .3163 6.5337
Group 3 (90mg/kg of Extract) .17500 1.47970 .907 -2.9337 3.2837
Group 4 (180mg/kg of Extract) -5.15000* 1.47970 .003 -8.2587 -2.0413
Group 5 (5mg/kg of Artesunate) -8.27500* 1.47970 .000 -11.3837 -5.1663
Group 6 (Negative Control=5mg/kg of Distilled Water) -4.55000* 1.47970 .007 -7.6587 -1.4413
Group 3 (90mg/kg of
Extract)
Group 1 (Positive Control) 3.25000* 1.47970 .041 .1413 6.3587
Group 2 (45 mg/kg Extract) -.17500 1.47970 .907 -3.2837 2.9337
Group 4 (180mg/kg of Extract) -5.32500* 1.47970 .002 -8.4337 -2.2163
Group 5 (5mg/kg of Artesunate) -8.45000* 1.47970 .000 -11.5587 -5.3413
Group 6 (Negative Control=5mg/kg of Distilled Water) -4.72500* 1.47970 .005 -7.8337 -1.6163
Group 4 (180mg/kg
of Extract)
Group 1 (Positive Control) 8.57500* 1.47970 .000 5.4663 11.6837
Group 2 (45 mg/kg Extract) 5.15000* 1.47970 .003 2.0413 8.2587
Group 3 (90mg/kg of Extract) 5.32500* 1.47970 .002 2.2163 8.4337
Group 5 (5mg/kg of Artesunate) -3.12500* 1.47970 .049 -6.2337 -.0163
Group 6 (Negative Control=5mg/kg of Distilled Water) .60000 1.47970 .690 -2.5087 3.7087
Group 5 (5mg/kg of
Artesunate)
Group 1 (Positive Control) 11.70000* 1.47970 .000 8.5913 14.8087
Group 2 (45 mg/kg Extract) 8.27500* 1.47970 .000 5.1663 11.3837
Group 3 (90mg/kg of Extract) 8.45000* 1.47970 .000 5.3413 11.5587
Group 4 (180mg/kg of Extract) 3.12500* 1.47970 .049 .0163 6.2337
Group 6 (Negative Control=5mg/kg of Distilled Water) 3.72500* 1.47970 .022 .6163 6.8337
Group 6 (Negative
Control=5mg/kg of
Distilled Water)
Group 1 (Positive Control) 7.97500* 1.47970 .000 4.8663 11.0837
Group 2 (45 mg/kg Extract) 4.55000* 1.47970 .007 1.4413 7.6587
Group 3 (90mg/kg of Extract) 4.72500* 1.47970 .005 1.6163 7.8337
Group 4 (180mg/kg of Extract) -.60000 1.47970 .690 -3.7087 2.5087
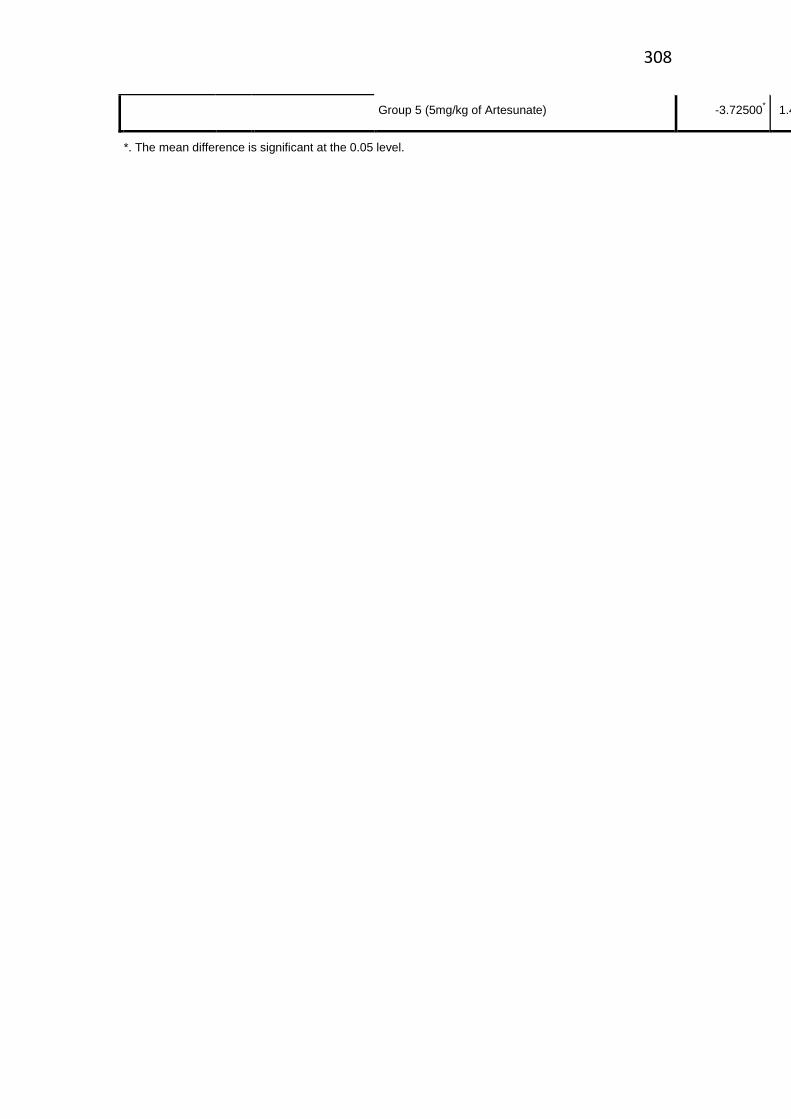
308
Group 5 (5mg/kg of Artesunate) -3.72500* 1.47970 .022 -6.8337 -.6163
*. The mean difference is significant at the 0.05 level.
Related Documents