IN DEGREE PROJECT ELECTRICAL ENGINEERING, SECOND CYCLE, 30 CREDITS , STOCKHOLM SWEDEN 2019 Anti-Islanding Protection in Distribution Grids JIANAN ZHANG KTH ROYAL INSTITUTE OF TECHNOLOGY SCHOOL OF ELECTRICAL ENGINEERING AND COMPUTER SCIENCE

Welcome message from author
This document is posted to help you gain knowledge. Please leave a comment to let me know what you think about it! Share it to your friends and learn new things together.
Transcript

IN DEGREE PROJECT ELECTRICAL ENGINEERING,SECOND CYCLE, 30 CREDITS
, STOCKHOLM SWEDEN 2019
Anti-Islanding Protection in Distribution Grids
JIANAN ZHANG
KTH ROYAL INSTITUTE OF TECHNOLOGYSCHOOL OF ELECTRICAL ENGINEERING AND COMPUTER SCIENCE


Anti-Islanding Protection inDistribution Grids
JIANAN ZHANG
Master in Electric Power EngineeringDate: June 20, 2019Supervisor: Tin RabuzinExaminer: Lars NordströmSchool of Electrical Engineering and Computer ScienceHost company: Ellevio


iii
AbstractThe growing number of distributed generation in the electrical system in-creases the risk of unintentional islanding. Power system islanding is the eventthat a part of the grid is continuously powered by the distributed generation,while it is already electrically separated from the power grid[1]. Several con-sequences can be caused by unintentional islanding, such as endangerment ofpersonnel, uncontrolled voltage and frequency operation and equipment dam-age due to unsynchronised reclosing. Therefore, it’s important to detect is-landing events quickly and reliably.
The main objective of this thesis was to investigate the performance ofthree passive islanding detection methods for Ellevio’s 50kV distribution net-work. These detectionmethods were under/over voltage, under/over frequencyand rate of change of frequency (ROCOF). Aiming at the objective, a dy-namic model was built in MATLAB/Simulink for Ellevio’s distribution net-work, where the three methods were implemented and applied to the DGs.Moreover, the performance of the methods was evaluated by the non detectionzone (NDZ) and detection time, and it was studied under several simulations.
Firstly, a NDZ of each method was found for a Single Machine Infinite Bus(SMIB) system and compared with the results obtained in Ellevio’s network.Besides, the detection time was measured under various islanding conditionsto evaluate the response speed of the detection methods. Apart from the sen-sitivity and response speed, the reliability of the detection methods was alsoinvestigated because the detection methods should not mistakenly operate inthe case of non-islanding events. Thus, the load switchings and short-circuitfaults were simulated as the disturbance events to test the reliability of detec-tion methods. In the end, all three methods were compared, and their advan-tages and disadvantages were summarized.

iv
SammanfattningDet växande antalet av distribuerad generering i elsystemet ökar risken föroavsiktlig ö-drift. Ö-drift innebär att en del av elnätet kontinuerligt drivs avden distribuerade genereringen, medan den redan är elektriskt separerad frånelnätet [1]. Flera konsekvenser kan orsakas av oavsiktlig ö-drift, till exempelutsätta personal för fara, okontrollerad spänning och frekvens och skador påutrustning på grund av osynkroniserad återinkoppling. Därför är det viktigt attupptäcka ö-drift snabbt och tillförlitligt.
Huvudsyftet med denna avhandling var att undersöka prestanda av tre pas-siva metoder för att upptäcka ö-drift för Ellevios 50kV distributionsnät. Des-sa detektionsmetoder var under-/överspänning, under-/överfrekvens och fre-kvensförändring (ROCOF). I syfte att uppnå målet byggdes en dynamisk mo-dell i MATLAB / Simulink för Ellevios distributionsnät, där de tre metodernaimplementerades och tillämpades på den distribuerade genereringen. Dess-utom utvärderades metodens prestanda av icke-detekteringszonen (NDZ) ochdetekteringstiden, och det studerades under flera simuleringar.
För det första hittades en NDZ av varje metod för ett SMIB-system ochde jämfördes med de funna NDZ i Ellevios nätverk. Vidare uppmättes detek-teringstiden under olika ö-driftsförhållanden för att utvärdera svarshastighe-ten hos detekteringsmetoderna. Bortsett från känslighets- och svarshastighe-ten undersöktes också detekteringsmetodernas tillförlitlighet, eftersom detek-teringsmetoderna inte skulle fungera felaktigt då ö-drift inte sker. Sålunda si-mulerades belastningsomkopplingarna och kortslutningsfel som störningshän-delser för att testa pålitligheten för detekteringsmetoderna. I slutet jämfördesalla tre metoderna, och deras fördelar och nackdelar sammanfattades.

Acknowledgements
I would like to thank the Tin Rabuzin for being my thesis supervisor for thelast five months, who gave me the biggest support during the darkest time.I would like to thank the professor Lars Nordström for being my examiner, toenable this master thesis.I would like to thank the Ellevio AB company for providing much technicalsupport regarding the distribution grid model.I would like to thank my parents for supporting my abroad study and theirforever encouragement.I would like to thank the KTH for providing such a good two years’ masterprogram.
v

vi
AbbreviationsAC Alternating current
DG Distributed Generation
NDZ Non Detection Zone
PCC Point of Common Coupling
PLL Phase Locked Loop
ROCOF Rate Of Change Of Frequency
SMIB Single Machine Infinite Bus
Nomenclature∆P Active power difference
∆Q Reactive power difference

Contents
1 Introduction 11.1 Objectives . . . . . . . . . . . . . . . . . . . . . . . . . . . . 21.2 Thesis Outline . . . . . . . . . . . . . . . . . . . . . . . . . . 3
2 Literature Review 42.1 Formation of an island . . . . . . . . . . . . . . . . . . . . . 42.2 Review of the islanding detection method . . . . . . . . . . . 5
2.2.1 Local passive detection methods . . . . . . . . . . . . 62.2.2 Non detection zone . . . . . . . . . . . . . . . . . . . 82.2.3 Challenges . . . . . . . . . . . . . . . . . . . . . . . 9
3 Methodology 103.1 Power system modelling . . . . . . . . . . . . . . . . . . . . 10
3.1.1 Component models . . . . . . . . . . . . . . . . . . . 123.2 Implementation of the detection methods . . . . . . . . . . . . 173.3 Simulation cases . . . . . . . . . . . . . . . . . . . . . . . . 18
3.3.1 Islanding cases . . . . . . . . . . . . . . . . . . . . . 183.3.2 Short-circuit fault cases . . . . . . . . . . . . . . . . . 193.3.3 Load switching cases . . . . . . . . . . . . . . . . . . 19
3.4 Non Detection Zone application . . . . . . . . . . . . . . . . 203.4.1 Non detection zone study area . . . . . . . . . . . . . 203.4.2 Computation of NDZs . . . . . . . . . . . . . . . . . 22
3.5 Detection time in SMIB system . . . . . . . . . . . . . . . . . 22
4 Result and Discussion 244.1 Non detection zone . . . . . . . . . . . . . . . . . . . . . . . 24
4.1.1 Single Machine Infinite Bus system . . . . . . . . . . 244.1.2 Ellevio network under islanding case 3 . . . . . . . . 26
4.2 Detection time in the SMIB system . . . . . . . . . . . . . . . 284.3 Islanding case . . . . . . . . . . . . . . . . . . . . . . . . . . 29
vii

4.3.1 Islanding case 1 . . . . . . . . . . . . . . . . . . . . . 294.3.2 Islanding case 2 . . . . . . . . . . . . . . . . . . . . . 304.3.3 Islanding case 3 . . . . . . . . . . . . . . . . . . . . . 30
4.4 Detection variable during islanding . . . . . . . . . . . . . . . 304.4.1 Under/over voltage detection method . . . . . . . . . 314.4.2 Under/over frequency detection method . . . . . . . . 314.4.3 Rate of change of frequency detection method . . . . . 32
4.5 Fault case . . . . . . . . . . . . . . . . . . . . . . . . . . . . 334.6 Load switching case . . . . . . . . . . . . . . . . . . . . . . . 37
5 Conclusions 39
6 Future work 41
Bibliography 42

List of Figures
2.1 Islanding formation in the distribution system with DG . . . . 52.2 Islanding detection methods . . . . . . . . . . . . . . . . . . 62.3 Non detection zone in the power mismatch space . . . . . . . 9
3.1 Ellevio network . . . . . . . . . . . . . . . . . . . . . . . . . 113.2 Part 1 of the Simulink Model . . . . . . . . . . . . . . . . . . 133.3 Part 2 of the Simulink Model . . . . . . . . . . . . . . . . . . 143.4 Generator subsystem model . . . . . . . . . . . . . . . . . . . 153.5 PI line model . . . . . . . . . . . . . . . . . . . . . . . . . . 153.6 Under/over voltage detection method . . . . . . . . . . . . . . 173.7 Under/over frequency detection method . . . . . . . . . . . . 183.8 Rate of change of frequency detection method . . . . . . . . . 183.9 NDZ study area in Single Machine Infinite Bus system . . . . 203.10 NDZ study area in Ellevio’s network under islanding case 3 . . 213.11 Non detection zone test grid . . . . . . . . . . . . . . . . . . 22
4.1 Non detection zone of under/over voltage detection method inthe SMIB system . . . . . . . . . . . . . . . . . . . . . . . . 24
4.2 Non detection zone of under/over frequency detection methodin the SMIB system . . . . . . . . . . . . . . . . . . . . . . . 25
4.3 Non detection zone of rate of change of frequency method inthe SMIB system . . . . . . . . . . . . . . . . . . . . . . . . 25
4.4 Non detection zone of all three detection methods in the SMIBsystem . . . . . . . . . . . . . . . . . . . . . . . . . . . . . . 26
4.5 Non detection zone of under/over voltage detection method inEllevio’s network . . . . . . . . . . . . . . . . . . . . . . . . 26
4.6 Non detection zone of under/over frequency detection methodin Ellevio’s network . . . . . . . . . . . . . . . . . . . . . . . 27
4.7 Non detection zone of rate of change of frequency detectionmethod in Ellevio’s network . . . . . . . . . . . . . . . . . . 27
ix

x LIST OF FIGURES
4.8 Detection time . . . . . . . . . . . . . . . . . . . . . . . . . . 294.9 Voltage variation during islanding case 3 . . . . . . . . . . . . 324.10 Frequency variation during islanding case 3 . . . . . . . . . . 324.11 Rate of change of frequency variation during islanding . . . . 334.12 Voltage variation during faults in under/over voltage detection
method . . . . . . . . . . . . . . . . . . . . . . . . . . . . . 344.13 Frequency variation during faults in under/over frequency de-
tection method . . . . . . . . . . . . . . . . . . . . . . . . . 354.14 df/dt variation during faults in ROCOF detection method . . . 364.15 Voltage variation during load 3752 switching case in under/over
voltage detection method . . . . . . . . . . . . . . . . . . . . 374.16 Frequency variation during load 3752 switching case in un-
der/over frequency detection method . . . . . . . . . . . . . . 374.17 df/dt variation during load 3752 switching case in the rate of
change of frequency detection method . . . . . . . . . . . . . 38

List of Tables
3.1 Colors for different elements in the model . . . . . . . . . . . 123.2 Simulation Parameter . . . . . . . . . . . . . . . . . . . . . . 123.3 Transformer Impedance from IEC 60076 . . . . . . . . . . . . 163.4 Islanding cases formed by openning different circuit breakers . 18
4.1 Circuit breaker status with different detection methods I . . . 294.2 Circuit breaker status with different detection methods II . . . 304.3 Circuit breaker status with different detection methods III . . 31
xi

Chapter 1
Introduction
The presence of distributed generation (DG) in power systems has grown rapidlyin recent years. Traditionally, energy is produced in large power plants andtransmitted to remote customers. In contrast to that approach, distributed en-ergy is a decentralized energy source, and it usually locates at the consumerside or the network’s distribution side[2]. A large number of DG units userenewable energy sources, such as wind power, solar power, hydropower andgeothermal power[2]. It’s one of the potential solutions to the environmentalissues caused by traditional coal and oil energy power plants. Furthermore,the EU government set the renewable energy target to achieve 20% consumedenergy comes from renewable power by the year 2020[3]. Recently, this re-newable energy target was updated to 30%by the year 2030. It can be predictedthat the distributed generation will be much popular in the future grid.
However, as much distributed generation is connected to the main grid,several issues arise. Islanding is one of the typical problems which may occurwhen DG is present. It is the event when a part of the grid is continuouslypowered by the distributed generation while it is already separated from therest of the network[1]. In other words, islanding creates a self-powered elec-trical island. The consequences of unintentional islanding are reduced powerquality, endangerment of personnel, potentially unsafe and unstable voltageand frequency control, and equipment damage due to unsynchronised reclos-ing[4]. Thus, it’s important to take preventive actions after unintentional is-landing events, and this process refers to anti-islanding. The IEEE 1547-2018standard sets 2s as a maximum time for detection and disconnection of an is-landed distributed generation source[5].
The report contains three parts. The first part is the study of three pas-sive islanding detection methods for synchronous machine based DG. These
1

2 CHAPTER 1. INTRODUCTION
detection methods are under/over voltage, under/over frequency and rate ofchange of frequency (ROCOF). Firstly, a dynamic model of Ellevio’s networkwas built in MATLAB/Simulink. Secondly, the operation algorithm of threedetection methods was implemented and applied to Ellevio’s network model.
In the second part, the performance of detection methods was evaluated bythe non detection zone (NDZ) and detection time. Firstly, a NDZ of each de-tection method was found in the Single Machine Infinite Bus (SMIB) systemand compared with the NDZ results obtained from the simulations in Elle-vio’s network. Secondly, the detection time was measured in islanding caseswhere various power imbalances between generation and load were simulated.The detection time can be used to evaluate the response speed of the detec-tion methods. Furthermore, several events, such as load switchings and short-circuit faults, were simulated to assess the reliability of the detection methods,because qualified detection methods should not mistakenly operate in the caseof non-islanding events. Lastly, all three detection methods were compared,and their advantages and disadvantages were summarized.
To be mentioned, the DG units normally can be of two different types,inverter-interfaced or synchronously connected[6]. Since the generation in theconsidered Ellevio’s network is based on synchronous machines, this reportonly discusses relevant detection methods applicable to those type of units.
1.1 ObjectivesThis thesis aims to propose suitable islanding detection methods for Ellevio’s50 kV distribution grid. The islanding detection methods should reliably op-erate when the system is islanded and other disturbance events, such as loadswitching and short-circuit faults, should not trigger the operation of islandingdetection methods. The thesis work was carried out in five stages:
1. Build a model of Ellevio’s distribution grid in MATLAB/Simulink. Allcomponents in the grid were modeled as accurately as possible. Theelements of the model include synchronous machines, lines, loads andtransformers.
2. All the three aforementioned islanding detection methods were imple-mented in MATLAB/Simulink.
3. The methods were applied to the modeled grid. For each of them, theperformance of the method was evaluated and analyzed when the systemwas subjected to different conditions.

CHAPTER 1. INTRODUCTION 3
4. The non detection zone and detection time were found for the three pas-sive islanding detection methods. Firstly obtain the NDZ in the SingleMachine Infinite Bus system with only one DG, one load and one infi-nite bus. Secondly, repeat the same process to find the NDZ in Ellevio’snetwork. These two NDZs were compared. As for the detection time,it was studied under various islanding cases in Single Machine InfiniteBus system. Simulation results were analyzed, and the characteristicsof detection methods were concluded.
1.2 Thesis OutlineThe thesis report consists of 7 chapters. In Chapter 1, the general thesis back-ground, objectives were introduced. Chapter 2 presents a literature review onislanding detection, the concept of NDZ, and associated challenges. Further-more, the three detection methods were reviewed in more detail. Chapter 3discusses the modeling of Ellevio’s network. Besides, the implementation ofdetection methods was discussed in more detail. Also, the methodology offinding non detection zone and detection time was introduced. Then chapter4 presents the simulation results of NDZ, detection time and use cases. Basedon the previous chapters, the overall conclusions to answer the research ques-tion were summarized in Chapter 5. And some future work was suggested inChapter 6.

Chapter 2
Literature Review
2.1 Formation of an islandAs mentioned in the introduction, an island is formed when a part of a localnetwork is continuously powered by the distributed generation even though theutility grid is disconnected from the local network. As shown in Fig. 2.1, dueto a fault event in the electrical system, the circuit breaker between distributedgeneration and utility tripped, which created an isolated power island.
Islanding is generally classified into intentional islanding and unintentionalislanding. Intentional islanding is the islanding event initiated on purpose dur-ing, e.g., a system disturbance[4]. Intentional islanding can assure a reliablepower supply for critical loads if well designed[7]. During a sudden poweroutage case, if several DG units are out of step from each other, it’s betterto form intentional islanding in the place where the power mismatch betweengeneration and load is the minimum[8]. In contrast, unintentional islandingis an islanding event which is not expected. Since it is not supposed to hap-pen, the formation of unintentional islanding can cause unexpected personnelelectric shock, because people are likely to touch the line which is supposednot to have electricity but can be powered due to islanding. Also, the severeconsequences contain electrical device damage and the uncontrolled voltageand frequency operation.
4

CHAPTER 2. LITERATURE REVIEW 5
Tripped circuit breaker
Power island
Utility Utility Load Local Load DG
Figure 2.1: Islanding formation in the distribution system with DG
2.2 Reviewof the islanding detectionmethod
A lot of islanding detection methods have been developed, and they can beclassified into local and remote detection methods.
Local methods can be further divided into passive, active and hybrid meth-ods. The relation between methods are shown in Fig. 2.2. The principle ofpassive methods is to monitor system variables (e.g., voltage magnitude, fre-quency, phase shift, rate of change of frequency) at the point of common cou-pling (PCC) of a DG. If the system variable is out of predetermined range,then this would indicate islanding. Active methods base their operation on theintroduction of small perturbations and observing the system’s output. It isexpected that in the operation of grid-connected mode, the response to pertur-bations would be negligible. Conversely, in islanded mode, the perturbationswould cause more significant changes in the system’s response[1]. Hybridmethods are the combination of passive and active methods. For instance, inthe study led by W. Chang[9], a two steps based hybrid method was proposedto obtain higher effectiveness: the passive method was applied as the primarydetectionmechanism, while the active method was used subsequently to detectthe islanding event again.
Remote detection methods are based on the communication of signals be-tween a DG and utility. It usually uses a central processor to check the state ofcircuit breakers to determine the islanding event with the help of method algo-

6 CHAPTER 2. LITERATURE REVIEW
Detection
methods
Local Remote
Passive Active Hybrid
Figure 2.2: Islanding detection methods
rithm[6]. Remote methods are usually more reliable than the local detectionmethods, but more expensive to implement[1].
Among all the islanding detection methods, passive detection method hasthe demerit of large NDZ, but it’s simple to implement in practice. Activedetection method has smaller NDZ problem, but it introduces additional dis-turbance into the power system, and usually, it costs a lot to implement. Then,the hybrid detection method is discovered to combine passive and active de-tection methods. But it’s not simple enough. Thus, in one way, the currentdevelopment of islanding detection methods gives people various options tochoose from. In the other way, it’s hard to select one best detection methodand make a balanced decision in terms of different consideration.
Since Ellevio is not able to modify the control systems of the DGs, this re-port didn’t consider the use of active nor hybrid detection methods. Moreover,due to cost considerations, studies of remote methods are also not includedin this report. Therefore, what follows is the overview of applicable passivedetection methods.
2.2.1 Local passive detection methodsThe common system’s variables observed by passive detection methods arevoltage, frequency or various derivatives of those. These parameters are ex-pected to have a detectable change during islanding.

CHAPTER 2. LITERATURE REVIEW 7
Under/over voltage
Under/over voltage based detection method is one of the common passive de-tection methods. It identifies the islanding event when voltage is out of the pre-specified range. For voltage threshold, the CIGRE report[10] provides somerelay setting used in different countries. Norway and Finland used the 85%and 110% of base voltage as the under and over voltage thresholds respec-tively. Since the relay setting in Sweden was not mentioned in the report, thevoltage thresholds in Norway will be referred to the islanding protection set-ting here. Thus, if voltage magnitude at the PCC is out of this range, islandingis identified. The relationship between voltage deviation and DG power im-balance is different in inverter-interfaced devices and synchronously rotatingmachines. A study in [11] shows that in the case of synchronous machines,the deviation of voltage magnitude at the terminals is related to the reactivepower balance between the machine’s output and local load consumption. Inthe case of inverter-interfaced devices, the voltage variation depends on activepower imbalance.
Therefore, for the synchronous generators, if there is no reactive powerdifference, the voltage magnitude will not change, which can lead to a faileddetection. However, not only islanding will cause the voltage level change, butother events will make the voltage deviate. Short-circuit fault is an instance tocause a system voltage drop. Thus, it’s crucial to make use of the under/overvoltage operation idea to detect islanding reliably.
Under/over frequency
Similar as in the case of under/over voltage detection method, islanding eventcan be detected if the frequency is not in the pre-specified range. In Sweden,the national normal frequency range is 49.9-50.1 Hz. But the specific fre-quency setting for islanding protection is vague. According to the Norwegianfrequency setting in the CIGRE report[10], 48Hz and 51 Hz were selected asthe under and over frequency thresholds in Ellevio’s network.
In synchronousmachine basedDG system, the frequency variation ismostlyrelated to active power mismatch between DG and local load. The governingmechanism is described by a swing equation shown in Eq.2.1[12].
2H
ω0
dω
dt= PM − PL = ∆P (2.1)
In Eq. (2.1), H is the generator inertia constant; ω0 is the synchronous speed;ω is the rotor speed of generator; t is the time; PM is the mechanical power;PL is the load electrical power;∆P is the power difference[13].

8 CHAPTER 2. LITERATURE REVIEW
Therefore, the system frequency increases when the DG output power ex-ceeds the local load. Conversely, the frequency will decrease if the load islarger than the active power supplied by a DG. And during islanding, powermismatch is large, which leads to a much greater frequency deviation. As aresult, the frequency can serve as the indicator of system islanding. However,if there is no active power imbalance, the system’s frequency will not change.The method is thus only effective if there is a certain active power mismatch.
Rate of change of frequency (ROCOF)
Rate of change of frequency detection method monitors the voltage wave-form at the PCC and calculates the value of the rate of change of frequencydf/dt[13][14].
Under a given ∆P active power mismatch, ROCOF can be much largerduring islanding situation. The reason is that when DG is grid-connected,the total inertia time constant is large. When a DG is islanded, the systeminertia constant only consists of the DG inertia constant. The smaller iner-tia constant will cause an increase of ROCOF. So if the ROCOF exceeds thepre-defined threshold, it indicates the appearance of islanding. The thresh-old setting should be chosen properly to distinguish islanding from the rest ofthe system events. Typically the ROCOF threshold is between 0.1-1.2 Hz/saccording to [14].
In the real ROCOF computation introduced in [15], the monitored voltagewaveform is used to calculate the frequency by the three phase locked loop(PLL). Then, the calculated frequency is differentiated to obtain the value ofROCOF.
Compared with under/over frequency detection method, the ROCOF de-tectionmethod has faster detection speedwhen the powermismatch is small[16].However, it can be difficult to find a suitable ROCOF threshold. Moreover, ifthe active power mismatch between generation and load is zero, there will beno ROCOF value, which will lead to a failed detection.
2.2.2 Non detection zoneNon detection zone (NDZ) is an area where a detection method cannot de-tect the islanding event in a certain time[17]. It is a parameter to evaluatethe performance of detection methods, in particular for the passive detectionmethods. Because the passive islanding detection methods have the disadvan-tage that they are not able to work when the DG generation matches local loadperfectly, or the power difference between them is small.

CHAPTER 2. LITERATURE REVIEW 9
Q
P
Non detection zone
Figure 2.3: Non detection zone in the power mismatch space
Non detection zone can be either defined in the power mismatch space(∆P and ∆Q) or RLC load space according to [18]. In this report, the powermismatch space was considered to present the NDZ.
The power mismatch space is defined by establishing a coordinate systemusing an active power mismatch axis and a reactive power mismatch axis. TheNDZ is plotted as a zone as shown in Fig. 2.3. The method with smaller NDZwill detect islanding event more effective under small power mismatch situa-tion.
2.2.3 ChallengesAs it was shown, each detection method comes with the inherent drawbacksarising from the operating principles. One issue is, as was mentioned, the ex-istence of a NDZ under balanced power conditions, it reduces the effectivenessof a detection method. Another is the sensitivity of the detection methods tonon-islanding disturbances in the grid. For example, a load switching or ashort circuit fault can cause deviations of frequency and voltage, which canmake a detection method operate mistakenly and reduce the reliability of adetection method.

Chapter 3
Methodology
In this thesis, islanding detection methods in Ellevio’s grid are the main analy-sis objects. Three islanding detection methods are applied to the DGs in Elle-vio’s model. The NDZ, detection time and the trip signals for islanding events,are observed as the performance parameters. The NDZwas found firstly in theSingleMachine Infinite Bus system and secondly in Ellevio’s network. The de-tection time was measured in the SMIB system under various islanding cases.Also, three places in Ellevio’s network were selected as the locations whereislanding could occur. Moreover, events such as load switchings and short-circuit faults were applied to Ellevio’s model to test the reliability of detectionmethods.
In a nutshell, a qualified islanding detection method should only respondto islanding event and protect the grid promptly. Correct trip signals, short de-tection time and small NDZ are the three characteristics of a suitable islandingdetection method.
The Ellevio’s network is a 50 kV distribution grid located in Dalarna, Swe-den. As shown in Fig. 3.1, it contains 21 buses, three DGs, three transformersand nine loads. The base voltage of the black bus bars is 55kV, while thebase voltage of the red bus bars is 135kV. All the network data is provided byEllevio.
3.1 Power system modellingAmodel of Ellevio’s network was built in MATLAB/Simulink. The two partsof the model, connected at bus 3751, are shown in Fig. 3.2 and Fig. 3.3. Dif-ferent colors are used to distinguish the elements of the model as shown inTab. 3.1. The three-phase constant voltage sources in color yellow, represent
10

CHAPTER 3. METHODOLOGY 11
3759
3758
3757
3761
3760
3756
3751
3752
3753
3754
3802
3801
33980
33990
33977
3803
3755
33975
3762
Breaker 3758
Breaker 3755
Breaker 3756
3763
Breaker 1
Breaker 3
Breaker 2
33970
Legend
Load
Generator
Transformer
Circuit breaker
Figure 3.1: Ellevio network

12 CHAPTER 3. METHODOLOGY
Table 3.1: Colors for different elements in the model
Color ElementOrange Load flow busesBlue Power plantsRed Circuit breakers to form islanding casesPink Circuit breakers applied with detection methodsGreen Constant impedance loadsWhite AC linesGrey TransformersYellow Three-phase constant voltage sources
Table 3.2: Simulation Parameter
Simulation type DiscreteSample time 50µsSolver type Fixed-stepSolver Runge-Kutta methods
the Thevenin equivalent circuits of the rest of Ellevio’s network.The model was simulated with the parameters shown in Tab. 3.2. Before
each simulation, system power load flow is calculated first to obtain the initialconditions for the dynamic simulation.
3.1.1 Component modelsIn the Simulinkmodel, the generators were modeled by synchronous machinesequipped with hydraulic turbine governors and excitation systems. Then, thegenerators were connected to the distribution grid via step-up transformers.
The synchronous generator is the electrical machine converting the me-chanical power into electrical power and working under synchronous speed.
The hydraulic turbine is the machine that converts the hydropower intomechanical energy, which serves as the mechanical power provider for thesynchronous generator. The hydraulic turbine works under the control of thegovernor, who plays a role in adjusting the water flow through the turbine tochange the turbine’s speed or control the output power[19].
The excitation system supplies field current to the synchronous generator’sfield winding and controls the power system operation by adjusting the fieldvoltage and field current[12].

CHAPTER 3. METHODOLOGY 13
Figure 3.2: Part 1 of the Simulink Model

14 CHAPTER 3. METHODOLOGY
Figure 3.3: Part 2 of the Simulink Model

CHAPTER 3. METHODOLOGY 15
An example of generator model is shown in Fig. 3.4. The other two gen-erator models have the same structure but with their respective parameters.
Step-up transformer
Hydraulic turbine
Excitation system
Synchronous machine
A
B
C
Pm
Vf
Measurement
m
A
B
C
a
b
c
Figure 3.4: Generator subsystem model
The PI line model was used as the model of AC lines, as shown in Fig. 3.5.The line resistance and inductance are represented as R and L respectively,and the line susceptance is distributed evenly at the two terminals of the line.Since the capacitance is in direct ratio with susceptance, the capacitance ofeach terminal is half of the total line capacitance. The line parameters wereprovided in the per-unit system, which should be expressed in absolute values.
There are six transformers in the Simulink model. Three of them are thestep-up transformers given in the percentage of impedance; The other threetransformers connect 50kV and 110kV networks and their equivalent resis-tances and reactances were given. In the Simulinkmodel, the given impedancedata had to be converted into two separate windings’ resistances and reac-tances.
R L
C/2 C/2
Figure 3.5: PI line model
For each of the step-up transformers connected with generators, the per-centage of transformer impedance is equivalent to the per-unit impedanceZpu.

16 CHAPTER 3. METHODOLOGY
Table 3.3: Transformer Impedance from IEC 60076
MVA Z% X/R Tolerance on Z%<0.630 4.00 1.5 ±10
0.631-1.25 5.00 3.5 ±10
1.251-3.15 6.25 6.0 ±10
3.151-6.3 7.15 8.5 ±10
6.301-12.5 8.35 13.0 ±10
12.501-25.0 10.00 20.00 ±7.5
25.001-200 12.5 45.0 ±7.5
The IEC 60076 standard[20] gives some typical transformer impedance inTab. 3.3. The value of the ratio between X and R refers to it.
The mathematical relation between impedance Zpu, resistanceRpu and re-actance Xpu is shown below
R2pu + X2
pu = Z2pu (3.1)
An example of step-up transformer impedance calculation is shown for thetransformer connected with generator 3758. The power capacity of the step-up transformer is 5 MVA. Referring to the Tab. 3.3, a transformer with thecapacity between 3.151-6.3 MVA has the X/R value of 8.5. Thus, Xpu =
8.5Rpu. Since the value of Zpu is provided by Ellevio, then the values of Rpu
and Xpu can be calculated respectively by solving the system of equations.However, no information is provided about the impedances of the pri-
mary and secondary windings. It was thus assumed that primary and sec-ondary impedances have the same per unit values. Neglecting the magnetiza-tion impedance, the equivalent impedance of transformerZpu can be expressedby the two windings as
Zpu = 2 · Zwpu = (Rpu + jXpu) (3.2)
Then the primary winding and secondary winding both have half of theequivalent Rpu and Xpu.
Lastly, all the loads in the distribution grid were assumed as the constantimpedance loads. The impedance values were calculated from the initial pow-ers supplied by Ellevio.

CHAPTER 3. METHODOLOGY 17
3.2 Implementation of the detectionmethodsThe three passive islanding detection methods described in Chapter 2 wereimplemented in MATLAB/Simulink and applied to DGs in Ellevio’s model.The trip signals of themethodswere sent directly to the circuit breakers locatedbetween DGs and the rest of the grid. The parameters and threshold settingsfor each method were found experimentally.
For under/over voltage detection method, the protection should trip whenthe generator output voltage is smaller than the lower boundary or bigger thanthe higher boundary for at least 0.2s. The base voltage is 55kV for the gener-ators. As shown in Fig. 3.6, Vpu is the per-unit three-phase voltage from thegenerator output. When the magnitude of Vpu is less than 0.85 or larger than1.1, it will give an activation signal to the timer. When the integration timeof timer reaches the delay time 0.2s, it means the voltage magnitude has beenout of 0.85-1.1 range for 0.2s. Then the timer will give a true value to S-RFlip-Flop, which will issue a trip command to open the circuit breaker.
Voltage
measurement
>=1.1pu
<=0.85pu
Timer
t>=0.2sS-R Flip
Flop
Open
circuit
breaker
Or
Figure 3.6: Under/over voltage detection method
For under/over frequency detectionmethod, the protection should tripwhenthe system frequency is out of pre-specified operation range for at least 0.2s.The under and over frequency threshold settings for this method are 48Hzand 51Hz. As shown in Fig. 3.7, the system frequency is obtained from thegenerator output voltage after passing through the Phase Locked Loop (PLL).The delay time is set as 0.2s as well. The timer operation algorithm of thismethod and the following method are the same as what was introduced in theunder/over voltage detection method.
For the rate of change of frequency detectionmethod, the protection shouldtrip when themeasured df/dt value exceeds 0.2Hz/s for at least 0.2s. As shownin Fig. 3.8, the rate of change of frequency is calculated by the derivative block.
There is some signal disturbance coming from the generator, because thesynchronous machine starting brings some frequency deviation when the sim-ulation starts. Even though the frequency deviation is very small, it can pro-

18 CHAPTER 3. METHODOLOGY
>=51Hz
<=48Hz
Timert>=0.2s
S-R Flip Flop
Open circuit
breakerOrPhase
Locked LoopVoltage
measurement
frequency
Figure 3.7: Under/over frequency detection method
Table 3.4: Islanding cases formed by openning different circuit breakers
Islanding case Breaker 1 Breaker 2 Breaker 31 Open Closed Closed2 Closed Open Closed3 Closed Closed Open
duce very large rate of change of frequency value after differentiation. Ac-cording to simulations, the machine starting time is less than 0.2s in Ellevio’snetwork. Therefore, setting delay time to 0.2s can make sure that the operationof this method will not be affected by the machine starting. The rate of changeof frequency threshold was set to 0.2 Hz/s, which is the experience choice aftermany test simulations.
Timer
t>=0.2s
S-R Flip
Flop
Open
circuit
breaker
Phase
Locked Loop
Voltage
measurement
frequencyDerivative
Absolute
value
>=0.2
Hz/s
df/dt
Figure 3.8: Rate of change of frequency detection method
3.3 Simulation casesThere are several cases simulated to analyze the performance of islanding de-tection methods.
3.3.1 Islanding casesEach islanding event was simulated by opening the circuit breakers specifiedin Tab. 3.4. Ellevio’s islanding event history shows that an islanding event hap-pened at bus 3751. So the part 1 of Ellevio’s network, as pictured in Fig. 3.2,can be the power island with high possibility. So this area should be studiedin detail. There are three possible islanding location scenarios, named as is-landing case 1 to islanding case 3, as shown in Tab. 3.4. In Fig. 3.2, the circuit

CHAPTER 3. METHODOLOGY 19
breakers used to form island are colored in red and the circuit breakers to beapplied with detection methods are colored in pink.
3.3.2 Short-circuit fault casesIn the power system, the three-phase short-circuit fault is the most seriousfault. The other faults, such as the single-phase line to ground faults, are morecommon to happen. But in Ellevio’s model, it is not able to simulate a single-phase line to ground fault because only positive sequence data was provided.Usually, a fault should be cleared by the respective protection relays. An idealislanding detection method should be immune to fault disturbances. There-fore, three-phase short-circuit faults were simulated at the bus 3751 and bus3758 respectively, which can investigate the stability of the detection methods.
There are some specifiedmaximum fault clearing time for the transmissionsystem in the high voltage level. For example, in the British grid protectioncode, at the voltage level lower than 132 kV, the national grid specifies thefault clearing time should be longer than 120ms[21]. However, the distribu-tion system has longer fault clearing time than the transmission system at highvoltage level. As introduced in the [22], the fault clearing time is usually be-tween 50ms to 300ms in distance and differential protection system; while itbecomes 200ms to 2000ms in over-current protection system with some delaytime. Here it is assumed that the fault clearing time is 120ms. Under suchfault events, the behavior of the detection methods was observed.
3.3.3 Load switching casesTo test the performance of detection methods under load switching distur-bances, load 3752was switched off from the Ellevio’s network and then switchedback after a certain time. The reason why choosing load 3752 instead of otherloads is that load 3752 is the maximum single load value in the initial loadconfiguration. And this load value is even bigger than any of the generators’nominal power. During the simulation, when a load switches in the network,the system variables (voltage and frequency) would change, which leads tothe change of the islanding detection parameters. Therefore, if a detectionmethod operates mistakenly, then this detection method is more sensitive toload switching disturbances.

20 CHAPTER 3. METHODOLOGY
3.4 Non Detection Zone applicationThis section presents the two NDZ study areas and how the NDZ can be found.
3.4.1 Non detection zone study areaSingle Machine Infinite Bus system
A study of NDZs was performed in a SMIB system. This was done to check ifa single model could be used to find NDZs of the detection methods with thehope that it could generalize well on the NDZs obtained using a more accuratemodel.
As shown in Fig. 3.9, a SMIB system consists of a generator with its localload. The generator here was modeled by the specific parameters of generator3756 in Ellevio’s grid. The local load was modeled as a constant impedanceload. And there is a power line between DG and an infinite bus. Further-more, the opening of the circuit breaker at the generator terminals islands thegenerator. As will be mentioned, changing the power mismatch between thegenerator and the load can be utilized to find the NDZs of the methods.
Protection breaker
Disconnection
DG Local load
Infinite busIsland
Figure 3.9: NDZ study area in Single Machine Infinite Bus system
Ellevio’s network under Islanding case 3
When studying the NDZs in Ellevio’s network, islanding case 3 was usedto simulate the islanding event. As it was discussed before, the opening ofbreaker 3 isolates the part 1 of Ellevio’s network from the rest of the grid. As-sume that the line losses can be ignored, then the total power consumption onthe island is the sum of the loads on the island, which is expressed by Eq. 3.3and Eq. 3.4. The total power generation on the island is the production sum ofgenerator 3758 and generator 3756, which is expressed by Eq. 3.5 and Eq. 3.6.

CHAPTER 3. METHODOLOGY 21
Thus, the power mismatch between total generation and total loads on the is-land can be calculated by Eq. 3.7 and Eq. 3.8. Keep the generator productionconstant and change the load value to obtain different power mismatch values.By running dynamic simulations of the model in these power mismatch cases,it is possible to find the NDZs for the three detection methods.
PL = PL3759 + PL3757 + PL3761 + PL3756 + PL3762 (3.3)
QL = QL3759 + QL3757 + QL3761 + QL3756 + QL3762 (3.4)
PG = PG3758 + PG3756 (3.5)
QG = QG3758 + QG3756 (3.6)
∆P = PG − PL (3.7)
∆Q = QG −QL (3.8)
3759
3758
3757
3761
3760
3756
3751
3762
Breaker 3758
Breaker 3756
3763
Breaker 1
Breaker 3
Breaker 2
Rest of Ellevio’s grid
Disconnection
Island
Figure 3.10: NDZ study area in Ellevio’s network under islanding case 3

22 CHAPTER 3. METHODOLOGY
3.4.2 Computation of NDZsThe algorithm of finding the NDZ can be described by three steps.
Firstly, create a point grid which contains some test points in the powermismatch space. Each test point represents one value of the power mismatch,as shown in Fig. 3.11.
Secondly, a new load flow was calculated for each load value, then themodel was initialized, and the dynamic simulation was run. The trip signals ofthe breakers applied with detection methods were observed two seconds afterthe islanding event. If the islanding is not detected, then it implies this powermismatch case is a non detection zone case. The test point will be colored inred, which means it is a real NDZ point.
In the end, iterating the second step over all of the points in the definedgrid. Then the NDZ can be found for the detection methods.
Since in the islanding case 3, both the generator 3758 and generator 3756are islanded. So, for each detection method, two NDZs can be found based onthe trip signal of breaker 3758 and the trip signal of breaker 3756.
Test point
NDZ point
Q
P
Figure 3.11: Non detection zone test grid
3.5 Detection time in SMIB systemDetection time was measured under several islanding cases where the powerdifference between generation and local load varies. The detection time can be

CHAPTER 3. METHODOLOGY 23
used to assess the response speed of detection methods. In the SMIB system,a group of power difference was created from 0% to 100% of the generator’sapparent power. The power difference can be produced by keeping the DGoutput power constant and changing the local load value. For instance, a loadwith 150%PG + 150%QG · j value belongs to the 50% power difference case.
Assume t1 is the time when the islanding occurs and t2 is the time whenthe islanding is detected by a detection method. Then the detection time is thetime difference between t1 and t2 as shown in Eq. 3.9. The simulation was runfor each load value, and detection time was recorded.
∆t = t2 − t1 (3.9)
Chapter 4
Result and Discussion
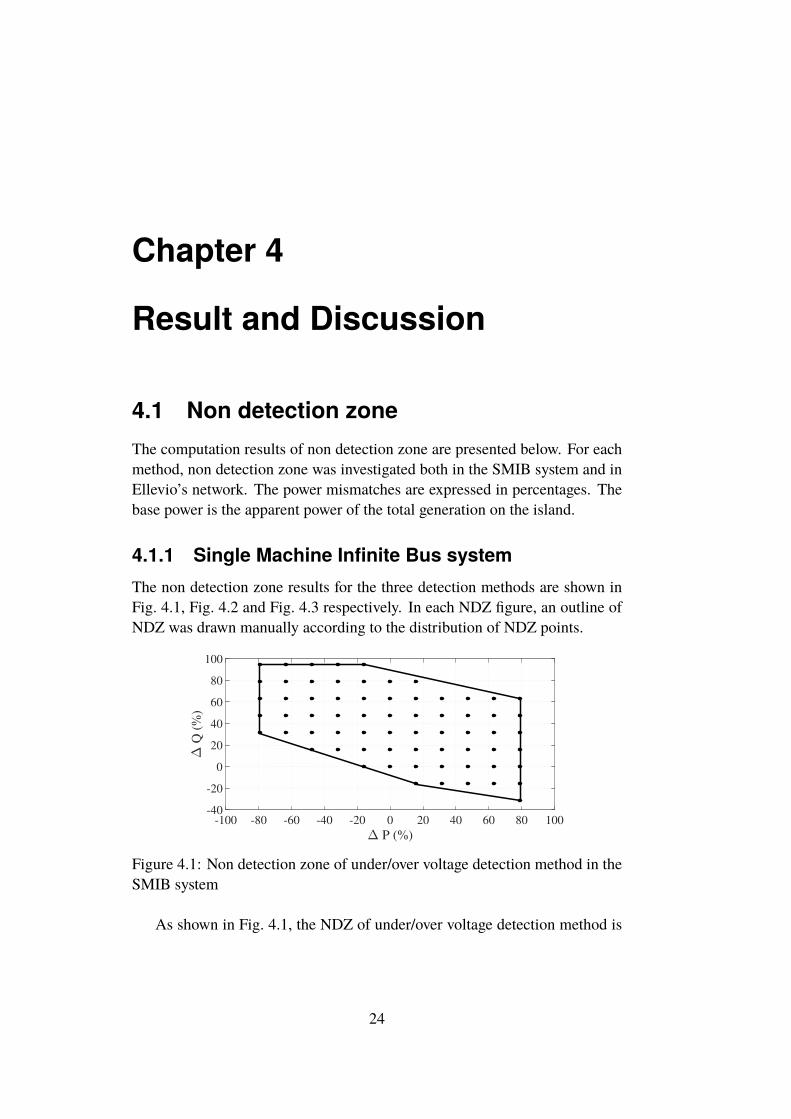
4.1 Non detection zoneThe computation results of non detection zone are presented below. For eachmethod, non detection zone was investigated both in the SMIB system and inEllevio’s network. The power mismatches are expressed in percentages. Thebase power is the apparent power of the total generation on the island.
4.1.1 Single Machine Infinite Bus systemThe non detection zone results for the three detection methods are shown inFig. 4.1, Fig. 4.2 and Fig. 4.3 respectively. In each NDZ figure, an outline ofNDZ was drawn manually according to the distribution of NDZ points.
-100 -80 -60 -40 -20 0 20 40 60 80 100
P (%)
-40
-20
0
20
40
60
80
100
Q (
%)
Figure 4.1: Non detection zone of under/over voltage detection method in theSMIB system
As shown in Fig. 4.1, the NDZ of under/over voltage detection method is
24

CHAPTER 4. RESULT AND DISCUSSION 25
between -80% to 80% of active power mismatch and between -35% to 95% ofreactive power mismatch.
-100 -80 -60 -40 -20 0 20 40 60 80 100
P (%)
-40
-20
0
20
40
60
80
100
Q (
%)
Figure 4.2: Non detection zone of under/over frequency detection method inthe SMIB system
As shown in Fig. 4.2, the NDZ of under/over frequency detection methodis between -20% to 12% of active power mismatch and between -35% to 92%of reactive power mismatch.
-100 -80 -60 -40 -20 0 20 40 60 80 100
P (%)
-40
-20
0
20
40
60
80
100
Q (
%)
Figure 4.3: Non detection zone of rate of change of frequency method in theSMIB system
As shown in Fig. 4.3, the NDZ of the rate of change of frequency detectionmethod is between -2% to 3% of active power mismatch and between -20% to40% of reactive power mismatch.
If plotting the above three NDZs in one figure, as shown in Fig. 4.4, it canbe found that the under/over voltage detection method has the largest NDZ,the under/over frequency detection method has the second largest NDZ andthe ROCOF detection method has the smallest NDZ.

26 CHAPTER 4. RESULT AND DISCUSSION
-100 -80 -60 -40 -20 0 20 40 60 80 100
P (%)
-40
-20
0
20
40
60
80
100
Q (
%)
U/o voltage
U/o frequency
ROCOF
Figure 4.4: Non detection zone of all three detection methods in the SMIBsystem
4.1.2 Ellevio network under islanding case 3When finding the NDZ in Ellevio’s network under islanding case 3, two NDZscan be obtained for each method. The first NDZ was obtained by observingthe trip signal of generator 3758’s protection breaker, and the second NDZwas found by using the trip signal of generator 3756’s protection breaker. Andthese two NDZs were plotted in one figure and distinguished by different col-ors.
-120 -100 -80 -60 -40 -20 0 20 40 60 80 100
P (%)
-40
-20
0
20
40
60
80
100
Q (
%)
G3758
G3756
Figure 4.5: Non detection zone of under/over voltage detectionmethod in Elle-vio’s network
The NDZs of under/over voltage detection method in Ellevio’s network areshown in Fig. 4.5. The NDZ obtained from the detection method applied togenerator 3758 is a bit larger than the NDZ found by the detection methodapplied to generator 3756. The reason is that the generator 3758 producedmore reactive power than generator 3756. When there was a load increase

CHAPTER 4. RESULT AND DISCUSSION 27
after islanding event, the reactive power difference between generator 3758and loads was less than the reactive power difference between generator 3756and loads. Thus, less reactive power difference means less voltage drop duringislanding. So the NDZ obtained from generator 3758 was larger than the NDZcomputed from generator 3756.
-100 -80 -60 -40 -20 0 20 40 60 80 100
P (%)
-40
-20
0
20
40
60
80
100
Q (
%)
G3758
G3756
Figure 4.6: Non detection zone of under/over frequency detection method inEllevio’s network
-100 -80 -60 -40 -20 0 20 40 60 80 100
P (%)
-40
-20
0
20
40
60
80
100
Q (
%)
G3758
G3756
Figure 4.7: Non detection zone of rate of change of frequency detectionmethod in Ellevio’s network
The NDZs of the under/over frequency detection method are presented inFig. 4.6 and the NDZs of the ROCOF detection method are shown in Fig. 4.7.In these two figures, the NDZs obtained from generator 3756 system werelarger than the NDZs computed from generator 3758 system. Because bothmethods rely on the system frequency to indicate islanding, while the fre-quency is mostly related to active power imbalance of a synchronous machine.And the generator 3756 produced more active power than generator 3758 in

28 CHAPTER 4. RESULT AND DISCUSSION
the simulation. So during the islanding event, the active power imbalance ofgenerator 3756 was less than the active power imbalance of generator 3758.Less active power imbalance means less frequency deviation. So the NDZsfrom generator 3756 was smaller than the NDZs from generator 3758.
Overall, on the power island containing multiple DGs, several NDZ resultscan be found for different DGs. Since the generator 3756 model was alsoused to model the DG in the SMIB system, here the NDZs obtained fromgenerator 3756 were compared with the NDZs in the SMIB system. Two smallconclusions can be made.
1. When studying the NDZs in Ellevio’s network, the under/over voltagedetection method has the largest NDZ. The under/over frequency detec-tion method has the second largest NDZ. The ROCOF detection methodhas the smallest NDZ.
2. For each method, after comparing the NDZ obtained in Ellevio’s net-work with the NDZ computed in the SMIB system, it can be found thatthe two NDZs were approximately similar. They were not the same be-cause the simulation environment was different. However, it is enoughto use the SMIB system to find the approximate NDZ results, especiallyin the case of comparing the size of different NDZs.
4.2 Detection time in the SMIB systemThe simulation results of detection time are shown in Fig. 4.8. The detectiontime is related to the power difference between generation and loads, and therelation is different for different detection methods.
For under/over frequency detection method, its detection time becomesshorter as the power difference becomes larger. For under/over voltage detec-tion method, its detection time is at constant 0.2s since 20% power difference.For the ROCOF detection method, the situation is a little different. When thepower difference is less than 40%, the detection time is around 0.3s. When thepower difference is more than 40%, the detection time is around 0.5s. The in-creased detection time after 40% power difference can be explained by the os-cillation behavior of df/dt during islanding. Because the oscillation of df/dtcan activate and reset the timer without tripping the operation, but it increasesthe detection time.

CHAPTER 4. RESULT AND DISCUSSION 29
0 10 20 30 40 50 60 70 80 90 100
Power difference (%)
0
0.5
1
1.5
2
2.5
3
3.5
4
Det
ecti
on t
ime
(s)
Under over voltage
Under over frequency
ROCOF
Figure 4.8: Detection time
4.3 Islanding caseThe simulation results in this section indicate the three detection methods canwork properly and selectively under islanding cases. The initial load configu-ration provided by Ellevio was used to run the simulations.
4.3.1 Islanding case 1When opening the breaker 1 to form an island, generator 3758 should be dis-connected from the island. The final status of the breakers applied with detec-tion methods is shown in Tab. 4.1. It implies the generator 3758 was discon-nected by the detection methods successfully. And the other generators werenot affected.
Table 4.1: Circuit breaker status with different detection methods I
Method Circuit breaker Status
Under/over voltageThree-phase circuit breaker 3755 ClosedThree-phase circuit breaker 3756 ClosedThree-phase circuit breaker 3758 Open
Under/overfrequency
Three-phase circuit breaker 3755 ClosedThree-phase circuit breaker 3756 ClosedThree-phase circuit breaker 3758 Open
Rate of change offrequency
Three-phase circuit breaker 3755 ClosedThree-phase circuit breaker 3756 ClosedThree-phase circuit breaker 3758 Open

30 CHAPTER 4. RESULT AND DISCUSSION
4.3.2 Islanding case 2When islanding event is simulated by opening the breaker 2, the generator3756 should be cut off from the power island. The final status of the breakersis shown in Tab. 4.2. It implies that only generator 3756 was disconnectedduring islanding case 2 with the help of detection methods.
Table 4.2: Circuit breaker status with different detection methods II
Method Circuit breaker Status
Under/over voltageThree-phase circuit breaker 3755 ClosedThree-phase circuit breaker 3756 OpenThree-phase circuit breaker 3758 Closed
Under/overfrequency
Three-phase circuit breaker 3755 ClosedThree-phase circuit breaker 3756 OpenThree-phase circuit breaker 3758 Closed
Rate of change offrequency
Three-phase circuit breaker 3755 ClosedThree-phase circuit breaker 3756 OpenThree-phase circuit breaker 3758 Closed
4.3.3 Islanding case 3The last islanding case was simulated by opening the breaker 3. Then a powerisland was formed which contained both generator 3758 and generator 3756.So both generators should be cut off from the island. The final status of break-ers is shown in Tab. 4.3. It indicates the generator 3756 and generator 3758were disconnected by opening breaker 3756 and breaker 3758 respectively.Besides, breaker 3755 was still closed because generator 3755 was not is-landed.
Overall, in the above islanding cases, all three detectionmethods can detectislanding event successfully and disconnect the DGs selectively.
4.4 Detection variable during islandingIn this section, the detection variables, such as voltage, frequency and rateof change of frequency, were observed over time. Islanding case 3 is usedto simulate the islanding event. In the simulation, islanding occurred at timet=0.5s, and the total simulation time was 3s.

CHAPTER 4. RESULT AND DISCUSSION 31
Table 4.3: Circuit breaker status with different detection methods III
Method Circuit breaker Status
Under/over voltageThree-phase circuit breaker 3755 ClosedThree-phase circuit breaker 3756 OpenThree-phase circuit breaker 3758 Open
Under/overfrequency
Three-phase circuit breaker 3755 ClosedThree-phase circuit breaker 3756 OpenThree-phase circuit breaker 3758 Open
Rate of change offrequency
Three-phase circuit breaker 3755 ClosedThree-phase circuit breaker 3756 OpenThree-phase circuit breaker 3758 Open
4.4.1 Under/over voltage detection methodIn under/over voltage detection method, the detection variables are the out-put voltages at the terminals of generators. As shown in Fig. 4.9, the out-put voltage at the terminal of generator 3755 increased a little bit after timet=0.5s, because the main grid suddenly stopped supplying power to the othertwo generators. During this time, the system generation was more than loadconsumption, which made the voltage increase. Conversely, for the generator3756 and generator 3758, they lost the power supply from the main grid, sotheir output voltages decreased. The threshold boundaries are drawn as thered dashed lines at V=0.85pu and V=1.1pu respectively. During the wholesimulation, the voltage at bus 3755 was always inside the boundaries, so no is-landing signal was triggered for generator 3755. However, the voltages at bus3756 and bus 3758 both decreased to the values that were lower than 0.85pu,which triggered the operation of the detection method.
4.4.2 Under/over frequency detection methodIn under/over frequency detection method, frequency is the detection variable.The frequencies are shown in Fig. 4.10. At time t=0.5s, islanding caused asmall frequency deviation in generator 3755 system, later the frequency wentback to a new steady state. However, the frequencies in the generator 3756and 3758 systems started to decrease after time t=0.5s. Because after islandingevent, the load demand on the power island wasmore than the local generation.Thus, the decreasing frequencies triggered the detection method to disconnect

32 CHAPTER 4. RESULT AND DISCUSSION
0 0.1 0.2 0.3 0.4 0.5 0.6 0.7 0.8 0.9 1
Time (s)
0.4
0.5
0.6
0.7
0.8
0.9
1
1.1
1.2
Volt
age
(pu)
V3755
V3756
V3758
Figure 4.9: Voltage variation during islanding case 3
the generators.
Figure 4.10: Frequency variation during islanding case 3
4.4.3 Rate of change of frequency detection methodIn the ROCOFdetectionmethod, the detection variable is the frequency deriva-tive (df/dt). The df/dt variation during islanding is shown in Fig. 4.11. Fromtime t=0.5s, islanding caused some df/dt oscillation in the generator 3756 and3758 system. After the oscillation, the df/dt began to decrease until trigger-ing the operation of the detection method. For df/dt in generator 3755 system,even though it oscillated for a some time, it didn’t trigger the islanding protec-tion due to the short activation time of the timer. It is obvious to observe therate of change of frequency variation during islanding.

CHAPTER 4. RESULT AND DISCUSSION 33
0 0.5 1 1.5
Time (s)
-15
-10
-5
0
5
10
RO
CO
F (
Hz/s
)
df/dt3755
df/dt3756
df/dt3758
Figure 4.11: Rate of change of frequency variation during islanding
4.5 Fault caseThis section presents the behavior of detection variables in the case of three-phase short-circuit faults. The faults were simulated at bus 3751 and bus 3758respectively. In the simulation, fault happened at time t=1s and ended at timet=1.12s.
For under/over voltage detection method, it didn’t operate under fault dis-turbances. The voltage variation during faults was shown in Fig. 4.12. Whenfault happened at t=1s, the voltage dropped suddenly. After the faults werecleared, the voltage went back to a normal level. It can be found that thetime duration when the voltage was below the under voltage threshold wasaround the fault lasting time. Because the assumed fault lasting time (0.12s)is shorter than the setting time of timer (0.2s), so the method didn’t operate.It is also a limitation of this method. Because this method can only avoid thefault disturbances if the fault lasting time is less than the method’s delay time.Furthermore, when a fault was simulated at bus 3758, the voltage at bus 3758dropped to around zero, while the voltage at bus 3755 and bus 3756 did notdeviate a lot. Because generator 3758 was located closer to the fault location.It indicates the effect of faults is also determined by the location of faults.
For under/over frequency detection method, it can work reliably in faultcases. The frequency variation during fault is shown in Fig. 4.13. In bothfault locations, the frequency oscillated without violating the under or overfrequency threshold. So the fault events didn’t cause the operation of the de-tection method. Thus, the under/over frequency detection method was reliableunder such fault disturbances.
For the rate of change of frequency detection method, it operated mistak-enly. The DGs in Ellevio’s grid were disconnected from the network. The

34 CHAPTER 4. RESULT AND DISCUSSION
0 0.5 1 1.5 2
Time (s)
0
0.2
0.4
0.6
0.8
1
1.2
Volt
age
(pu
)
V3755
V3756
V3758
(a) When fault occurred at bus 3751
0 0.5 1 1.5 2
Time (s)
0
0.2
0.4
0.6
0.8
1
1.2
Vo
ltag
e (p
u)
V3755
V3756
V3758
(b) When fault occurred at bus 3758
Figure 4.12: Voltage variation during faults in under/over voltage detectionmethod

CHAPTER 4. RESULT AND DISCUSSION 35
(a) When fault occurred at bus 3751
(b) When fault occurred at bus 3758
Figure 4.13: Frequency variation during faults in under/over frequency detec-tion method

36 CHAPTER 4. RESULT AND DISCUSSION
0 0.5 1 1.5 2
Time (s)
-12-10-8-6-4-202468
1012
RO
CO
F (
Hz/s
)
df/dt3755
df/dt3756
df/dt3758
(a) When fault occurred at bus 3751
0 0.5 1 1.5 2
Time (s)
-12-10-8-6-4-202468
1012
RO
CO
F (
Hz/s
)
df/dt3755
df/dt3756
df/dt3758
(b) When fault occurred at bus 3758
Figure 4.14: df/dt variation during faults in ROCOF detection method

CHAPTER 4. RESULT AND DISCUSSION 37
df/dt variation is shown in Fig. 4.14. During faults, the df/dt oscillation trig-gered the operation of the detection method. Thus, the ROCOF method wasnot reliable in such fault disturbances.
4.6 Load switching caseThis section presents the behavior of the detection variables during load switch-ing cases. In the simulation, the load 3752 switched off from grid at time t=1s,and switched on back at time t=2s.
0 1 2 3Time (s)
0.75
0.85
0.95
1.05
1.15
Volt
age
(pu)
V3755
V3756
V3758
Figure 4.15: Voltage variation during load 3752 switching case in under/overvoltage detection method
Figure 4.16: Frequency variation during load 3752 switching case in un-der/over frequency detection method
The simulation results demonstrate that all three detection methods werestill reliable under load 3752 switching disturbances. As shown in Fig. 4.15and Fig. 4.16, the voltage and frequency deviated at time t=1s and t=2s. How-ever, the deviation ranges were too small to trigger the detection method. As

38 CHAPTER 4. RESULT AND DISCUSSION
0 0.5 1 1.5 2 2.5 3
Time (s)
-12-10-8-6-4-202468
1012
RO
CO
F (
Hz/s
)
df/dt3755
df/dt3756
df/dt3758
Figure 4.17: df/dt variation during load 3752 switching case in the rate ofchange of frequency detection method
shown in Fig. 4.17, the df/dt oscillation violated the thresholds for a certaintime, but since the accumulated time of threshold violation was shorter thanthe delay time of the timer. The ROCOF detection method avoided false op-eration.
In a short, all three detection methods did not operate mistakenly, and theywere reliable under load 3752 switching disturbances.

Chapter 5
Conclusions
Some conclusions were made based on the simulation results.
1. When studying the non detection zone either in the Single Machine Infi-nite Bus system or in Ellevio’s network, it was found that the under/overvoltage detection method had the largest non detection zone, the un-der/over frequency detection method had the second largest non detec-tion zone, and the rate of change of frequency detection method had thesmallest non detection zone.
2. For each detection method, after comparing the non detection zone ob-tained in Ellevio’s network with the one computed in the SingleMachineInfinite Bus system, it was found that the two non detection zones wereapproximately similar. It is enough to use the Single Machine InfiniteBus system to find the approximate non detection zone. It is useful tocompare the non detection zone of several detection methods.
3. In Single Machine Infinite Bus system, the under/over voltage detectionmethod had the shortest detection time, the rate of change of frequencydetection method had the second shortest detection time, and the un-der/over frequency detection method had the longest detection time.
4. The detection time can vary under different power difference betweengeneration and local loads. And the detection time of under/over fre-quency detection method was more sensitive to the change of powerdifference.
5. The three detection methods worked properly and selectively in the caseof islanding. The basic function of the detection methods was achieved.
39

40 CHAPTER 5. CONCLUSIONS
6. Under three-phase short-circuit fault disturbances, the under/over volt-age and under/over frequency detection methods were reliable. Whilethe rate of change of frequency detection method operated mistakenly,so it was not as reliable as the other two methods.
7. Under a load switching case, it was found that all three detection meth-ods had the ability to tolerate load switching disturbance. The three de-tection methods were reliable under load 3752 switching disturbances.
Overall, all three islanding detection methods have their merits and disad-vantages. The rate of change of frequency detection method has the smallestnon detection zone and very short detection time. It is more reliable in the caseof load switching disturbances. However, it can operate mistakenly in the caseof fault disturbance. The under/over voltage and under/over frequency detec-tion methods are reliable in the case of load switching and fault disturbances.And the under/over voltage detection method can detect islanding event veryquickly. However, both the under/over voltage and under/over frequency de-tection methods have the problem of large non detection zone. Thus, the threedetection methods should be considered respectively regarding the specificsituation.

Chapter 6
Future work
This chapter lists some future work which can be done further based on thecurrent results.
1. More islanding locations can be investigated in Ellevio’s network. Forexample, in the bottom part of Ellevio’s network, there are some loca-tions where the islanding is likely to occur.
2. The behavior of detection methods can be studied under different loadconfiguration. In the current work, only the initial load configurationprovided by Ellevio was used to do the simulations.
3. The non-islanding disturbances can be applied at other locations in Elle-vio’s network.
41

Bibliography
[1] Pukar Mahat, Zhe Chen, and Birgitte Bak-Jensen. “Review of islandingdetection methods for distributed generation”. In: 2008 third interna-tional conference on electric utility deregulation and restructuring andpower technologies. IEEE. 2008, pp. 2743–2748.
[2] ThomasAckermann, GöranAndersson, and Lennart Söder. “Distributedgeneration: a definition”. In:Electric power systems research 57.3 (2001),pp. 195–204.
[3] Europäische Union. “Directive 2009/28/EC of the European Parliamentand of the Council of 23 April 2009 on the promotion of the use of en-ergy from renewable sources and amending and subsequently repealingDirectives 2001/77/EC and 2003/30/EC”. In:Official Journal of the Eu-ropean Union 5 (2009), p. 2009.
[4] Aziah Khamis et al. “A review of islanding detection techniques forrenewable distributed generation systems”. In: Renewable and sustain-able energy reviews 28 (2013), pp. 483–493.
[5] DG Photovoltaics and E Storage. “IEEE standard for interconnectionand interoperability of distributed energy resourceswith associated elec-tric power systems interfaces”. In: IEEE Std (2018), pp. 1547–2018.
[6] John Mulhausen et al. “Anti-islanding today, successful islanding inthe future”. In: 2010 63rd Annual Conference for Protective Relay En-gineers. IEEE. 2010, pp. 1–8.
[7] Geethi Krishnan and DN Gaonkar. “Intentional islanding operationsof distributed generation systems with a load shedding algorithm”. In:2012 IEEE International Conference on Power Electronics, Drives andEnergy Systems (PEDES). IEEE. 2012, pp. 1–6.
42

BIBLIOGRAPHY 43
[8] Farhan Noor, R Arumugam, and MY Vaziri. “Unintentional islandingand comparison of prevention techniques”. In: Proceedings of the 37thAnnual North American Power Symposium, 2005. IEEE. 2005, pp. 90–96.
[9] Wen-Yeau Chang. “A hybrid islanding detection method for distributedsynchronous generators”. In: The 2010 International Power ElectronicsConference-ECCE ASIA-. IEEE. 2010, pp. 1326–1330.
[10] CIGRE. Protection of Distribution System with Distributed Energy Re-sources. ELECTRA. CIGRE, Mar. 2015.
[11] M Yingram and S Premrudeepreechacharn. “Investigation of relation-ship between voltage and nondetection zone of OUV/OUF of local is-landing detection techniques”. In: Journal of Clean Energy Technolo-gies 2.4 (2014), pp. 299–304.
[12] Prabha Kundur, Neal J Balu, and Mark G Lauby. Power system stabilityand control. Vol. 7. McGraw-hill New York, 1994, p. 128.
[13] Daniel Motter, José CM Vieira, and Denis V Coury. “Development offrequency-based anti-islanding protection models for synchronous dis-tributed generators suitable for real-time simulations”. In: IET Genera-tion, Transmission & Distribution 9.8 (2015), pp. 708–718.
[14] Suman Khichar and Mahendra Lalwani. “An Analytical Survey of theIslandingDetection Techniques of DistributedGeneration Systems”. In:Technology and Economics of Smart Grids and Sustainable Energy 3.1(2018), p. 10.
[15] PraveenKumar, Vishal Kumar, andRajendra Pratap. “Rate of Change ofFrequency Deviation Based Unintentional Islanding Detection for Mi-crogrids”. In: 2018 International Conference on Control, Power, Com-munication andComputing Technologies (ICCPCCT). IEEE. 2018, pp. 90–95.
[16] ASAljankawey et al. “Passivemethod-based islanding detection of renewable-based distributed generation: The issues”. In: 2010 IEEEElectrical Power& Energy Conference. IEEE. 2010, pp. 1–8.
[17] Haidar Samet, Farid Hashemi, and Teymoor Ghanbari. “Minimum nondetection zone for islanding detection using an optimal Artificial Neu-ral Network algorithm based on PSO”. In: Renewable and SustainableEnergy Reviews 52 (2015), pp. 1–18.

44 BIBLIOGRAPHY
[18] Z Ye et al. “Evaluation of anti-islanding schemes based on nondetectionzone concept”. In: IEEE 34th Annual Conference on Power ElectronicsSpecialist, 2003. PESC’03. Vol. 4. IEEE. 2003, pp. 1735–1741.
[19] O Thapar. “Modern hydroelectric engineering practice in India: electro-mechanical works”. In:AlternateHydro EnergyCentre, Roorkee (2002).
[20] International Electrotechnical Commission et al. IEC 60076-5 Powertransformers-Part 5: Ability to withstand short circuit. 2006.
[21] National Grid ESO. Grid Code Protection Obligations. 2008.
[22] Mikael Wämundson. “Calculating voltage dips in power systems”. In:Chalmers University of Technology, Göteborg, Sweden (2007).


www.kth.seTRITA-EECS-EX-2019:298
Related Documents