Anti-diabetic rosiglitazone remodels the adipocyte transcriptome by redistributing transcription to PPARg-driven enhancers Sonia E. Step, 1,2,3,4,8 Hee-Woong Lim, 4,5,8 Jill M. Marinis, 1,2,4 Andreas Prokesch, 1,2,4,6,7 David J. Steger, 1,2,4 Seo-Hee You, 1,2,4 Kyoung-Jae Won, 4,5 and Mitchell A. Lazar 1,2,3,4,5,9 1 Division of Endocrinology, Diabetes, and Metabolism, 2 Department of Medicine, 3 Department of Pharmacology, 4 The Institute for Diabetes, Obesity, and Metabolism, 5 Department of Genetics, Perelman School of Medicine, University of Pennsylvania, Philadelphia, Pennsylvania 19104, USA; 6 Institute for Genomics and Bioinformatics, 7 Institute of Biochemistry, Graz University of Technology, Graz 8010, Austria Rosiglitazone (rosi) is a powerful insulin sensitizer, but serious toxicities have curtailed its widespread clinical use. Rosi functions as a high-affinity ligand for peroxisome proliferator-activated receptor g (PPARg), the adipocyte- predominant nuclear receptor (NR). The classic model, involving binding of ligand to the NR on DNA, explains positive regulation of gene expression, but ligand-dependent repression is not well understood. We addressed this issue by studying the direct effects of rosi on gene transcription using global run-on sequencing (GRO-seq). Rosi- induced changes in gene body transcription were pronounced after 10 min and correlated with steady-state mRNA levels as well as with transcription at nearby enhancers (enhancer RNAs [eRNAs]). Up-regulated eRNAs occurred almost exclusively at PPARg-binding sites, to which rosi treatment recruited coactivators, including MED1, p300, and CBP. In contrast, transcriptional repression by rosi involved a loss of coactivators from eRNA sites devoid of PPARg and enriched for other transcription factors, including AP-1 factors and C/EBPs. Thus, rosi activates and represses transcription by fundamentally different mechanisms that could inform the future development of anti- diabetic drugs. [Keywords: adipocyte; diabetes; rosiglitazone; transcription; PPARg; enhancer RNA] Supplemental material is available for this article. Received January 9, 2014; revised version accepted March 31, 2014. Peroxisome proliferator-activated receptor g (PPARg) is a nuclear receptor (NR) that is dramatically induced during adipogenesis and expressed predominantly in adipose tissue (Chawla and Lazar 1994; Tontonoz et al. 1994a). It is necessary (Rosen et al. 1999) and sufficient (Tontonoz et al. 1994b) for adipogenesis and is also critical for the functions of mature adipocytes, including lipid metabolism, adipokine secretion, and insulin sensitivity (Rangwala and Lazar 2004). PPARg binds near most adipo- genic genes as a heterodimer with retinoid X receptor (RXR) (Lefterova et al. 2008; Nielsen et al. 2008). PPARg, like most NRs, is a ligand-dependent transcrip- tion factor (TF) (Glass and Rosenfeld 2000). High-affinity ligands for PPARg include the thiazolidinediones (TZDs) (Lehmann et al. 1995), which are insulin-sensitizing drugs (Nolan et al. 1994). TZDs contribute to insulin sensitization by acting on adipose tissue to regulate gene transcription both positively and negatively. For example, TZDs induce insulin-sensitizing factors adiponectin (Maeda et al. 2001) and FGF-21 (Moyers et al. 2007) while suppressing the expression of genes promoting insulin resistance, including TNFa (Hofmann et al. 1994), resistin (Steppan et al. 2001), and retinol-binding protein 4 (Yang et al. 2005). The most potent T Z D in the clinic is rosiglitazone (rosi) (Lehmann et al. 1995), which has durable anti-diabetic effects but, unfortunately, has toxicities that limit its widespread use (Kung and Henry 2012; Ahmadian et al. 2013). Because PPARg expression in adipose tissue is required for the in vivo systemic insulin-sensitizing effects of TZDs (Chao et al. 2000; He et al. 2003), it is critical to understand how rosi binding to PPARg modulates gene expression. Binding of rosi to PPARg results in recruitment of coactivators, including SRC-1, CBP, p300, and MED1, Ó 2014 Step et al. This article is distributed exclusively by Cold Spring Harbor Laboratory Press for the first six months after the full-issue publication date (see http://genesdev.cshlp.org/site/misc/terms.xhtml). After six months, it is available under a Creative Commons License (Attribution- NonCommercial 4.0 International), as described at http://creativecommons. org/licenses/by-nc/4.0/. 8 These authors contributed equally to this work. 9 Corresponding author E-mail [email protected] Article is online at http://www.genesdev.org/cgi/doi/10.1101/gad.237628.114. 1018 GENES & DEVELOPMENT 28:1018–1028 Published by Cold Spring Harbor Laboratory Press; ISSN 0890-9369/14; www.genesdev.org Cold Spring Harbor Laboratory Press on April 13, 2018 - Published by genesdev.cshlp.org Downloaded from

Welcome message from author
This document is posted to help you gain knowledge. Please leave a comment to let me know what you think about it! Share it to your friends and learn new things together.
Transcript

Anti-diabetic rosiglitazone remodels theadipocyte transcriptome by redistributingtranscription to PPARg-driven enhancers
Sonia E. Step,1,2,3,4,8 Hee-Woong Lim,4,5,8 Jill M. Marinis,1,2,4 Andreas Prokesch,1,2,4,6,7
David J. Steger,1,2,4 Seo-Hee You,1,2,4 Kyoung-Jae Won,4,5 and Mitchell A. Lazar1,2,3,4,5,9
1Division of Endocrinology, Diabetes, and Metabolism, 2Department of Medicine, 3Department of Pharmacology, 4The Institutefor Diabetes, Obesity, and Metabolism, 5Department of Genetics, Perelman School of Medicine, University of Pennsylvania,Philadelphia, Pennsylvania 19104, USA; 6Institute for Genomics and Bioinformatics, 7Institute of Biochemistry, Graz Universityof Technology, Graz 8010, Austria
Rosiglitazone (rosi) is a powerful insulin sensitizer, but serious toxicities have curtailed its widespread clinical use.Rosi functions as a high-affinity ligand for peroxisome proliferator-activated receptor g (PPARg), the adipocyte-predominant nuclear receptor (NR). The classic model, involving binding of ligand to the NR on DNA, explainspositive regulation of gene expression, but ligand-dependent repression is not well understood. We addressed thisissue by studying the direct effects of rosi on gene transcription using global run-on sequencing (GRO-seq). Rosi-induced changes in gene body transcription were pronounced after 10 min and correlated with steady-state mRNAlevels as well as with transcription at nearby enhancers (enhancer RNAs [eRNAs]). Up-regulated eRNAs occurredalmost exclusively at PPARg-binding sites, to which rosi treatment recruited coactivators, including MED1, p300,and CBP. In contrast, transcriptional repression by rosi involved a loss of coactivators from eRNA sites devoid ofPPARg and enriched for other transcription factors, including AP-1 factors and C/EBPs. Thus, rosi activates andrepresses transcription by fundamentally different mechanisms that could inform the future development of anti-diabetic drugs.
[Keywords: adipocyte; diabetes; rosiglitazone; transcription; PPARg; enhancer RNA]
Supplemental material is available for this article.
Received January 9, 2014; revised version accepted March 31, 2014.
Peroxisome proliferator-activated receptor g (PPARg) isa nuclear receptor (NR) that is dramatically inducedduring adipogenesis and expressed predominantly inadipose tissue (Chawla and Lazar 1994; Tontonoz et al.1994a). It is necessary (Rosen et al. 1999) and sufficient(Tontonoz et al. 1994b) for adipogenesis and is also criticalfor the functions of mature adipocytes, including lipidmetabolism, adipokine secretion, and insulin sensitivity(Rangwala and Lazar 2004). PPARg binds near most adipo-genic genes as a heterodimer with retinoid X receptor (RXR)(Lefterova et al. 2008; Nielsen et al. 2008).
PPARg, like most NRs, is a ligand-dependent transcrip-tion factor (TF) (Glass and Rosenfeld 2000). High-affinityligands for PPARg include the thiazolidinediones (TZDs)(Lehmann et al. 1995), which are insulin-sensitizing drugs(Nolan et al. 1994). TZDs contribute to insulin sensitizationby acting on adipose tissue to regulate gene transcription
both positively and negatively. For example, TZDs induceinsulin-sensitizing factors adiponectin (Maeda et al. 2001)and FGF-21 (Moyers et al. 2007) while suppressing theexpression of genes promoting insulin resistance, includingTNFa (Hofmann et al. 1994), resistin (Steppan et al. 2001),and retinol-binding protein 4 (Yang et al. 2005). The mostpotent TZD in the clinic is rosiglitazone (rosi) (Lehmannet al. 1995), which has durable anti-diabetic effects but,unfortunately, has toxicities that limit its widespread use(Kung and Henry 2012; Ahmadian et al. 2013). BecausePPARg expression in adipose tissue is required for the invivo systemic insulin-sensitizing effects of TZDs (Chaoet al. 2000; He et al. 2003), it is critical to understand howrosi binding to PPARg modulates gene expression.
Binding of rosi to PPARg results in recruitment ofcoactivators, including SRC-1, CBP, p300, and MED1,
� 2014 Step et al. This article is distributed exclusively by Cold SpringHarbor Laboratory Press for the first six months after the full-issuepublication date (see http://genesdev.cshlp.org/site/misc/terms.xhtml). Aftersix months, it is available under a Creative Commons License (Attribution-NonCommercial 4.0 International), as described at http://creativecommons.org/licenses/by-nc/4.0/.
8These authors contributed equally to this work.9Corresponding authorE-mail [email protected] is online at http://www.genesdev.org/cgi/doi/10.1101/gad.237628.114.
1018 GENES & DEVELOPMENT 28:1018–1028 Published by Cold Spring Harbor Laboratory Press; ISSN 0890-9369/14; www.genesdev.org
Cold Spring Harbor Laboratory Press on April 13, 2018 - Published by genesdev.cshlp.orgDownloaded from

that function to induce gene expression (Westin et al. 1998;Gelman et al. 1999; Ge et al. 2002; Bugge et al. 2009).However, the mechanism by which rosi represses tran-scription is not well understood. In macrophages, studiesimplicate rosi-dependent SUMOylation of PPARg, whichtethers to the NR corepressor (NCoR) to prevent theinduction of inflammatory genes by endotoxin (Pascualet al. 2005). However, this mechanism pertains only toprevention of induction by toll-like receptor stimulationand has not been demonstrated in other cell types (Huangand Glass 2010). Another proposed mechanism involvesthe ligand-dependent recruitment of corepressors, in whichrosi treatment results in the recruitment of corepressorsCTBP1 and CTBP2 to C/EBPa by an unknown mechanism(Vernochet et al. 2009).
Ligand binding to other NRs has been suggested torepress gene expression by recruiting limiting coactivatorsaway from other TFs, thereby repressing those target genes.Support for this coactivator competition model, oftenreferred to as squelching, has been largely based on TFoverexpression experiments in transfection systems (Gilland Ptashne 1988; Kelleher et al. 1990; Kamei et al. 1996;Fronsdal et al. 1998; Lee et al. 2000; Li et al. 2000; Kim et al.2001; Zhang and Teng 2001; Manna and Stocco 2007; Heet al. 2012; Pascual-Garcia et al. 2013), although a recentstudy demonstrated coactivator redistribution with endog-enous factors and chromatin on a genome-wide scale in thecontext of E2-treated MCF-7 cells (He et al. 2012).
Many studies have used transcriptome analysis to inferthe effects of rosi on steady-state gene expression inadipocytes (Li and Lazar 2002; Sears et al. 2007; Choiet al. 2010; Rong et al. 2011). However, steady-statemRNA levels are determined by their rates of bothtranscription and degradation. Here, for the first time,we directly measured rates of adipocyte transcriptiongenome-wide using global run-on followed by sequencing(GRO-seq) (Core et al. 2008). We found that rosi rapidlyup-regulates or down-regulates the transcription of thou-sands of adipocyte genes, and this regulation correlateshighly with steady-state mRNA regulation. We also iden-tified thousands of bidirectional, intergenic transcriptsthat fit the criteria of enhancer RNAs (eRNAs) (De Santaet al. 2010; Kim et al. 2010), which have been shown tomark functional enhancers and regulate the transcriptionof the nearest gene (Kaikkonen et al. 2013; Lam et al. 2013;Li et al. 2013; Melo et al. 2013), and demonstrate that rosiregulates eRNA transcription in a manner that is related toactivation of the nearby gene bodies.
Rosi-up-regulated eRNAs occurred at sites of strongPPARg binding to which coactivators such as MED1, CBP,and p300 were recruited. Remarkably, however, down-regulation of eRNA transcription occurred at sites that aredevoid of PPARg but enriched for C/EBP and AP-1 familymembers. MED1 and other coactivators were dismissed atthese down-regulated sites, strongly supporting a mecha-nism of negative regulation involving coactivator redistri-bution upon rosi binding to PPARg. Thus, analysis ofregulated eRNAs reveals a novel mechanism by whichrosi represses adipocyte gene transcription at endogenouslevels of PPARg and other TFs on a genome-wide scale.
Results
Rosi rapidly and robustly regulates gene transcriptionin adipocytes
GRO-seq (Core et al. 2008; Wang et al. 2011) was used tomeasure nascent gene transcription in mouse 3T3-L1adipocytes and after treatment with rosi for 10 min,30 min, 1 h, and 3 h. The Fabp4 locus, a classic adipocytePPARg gene target (Spiegelman and Green 1980; Rivalet al. 2004), showed increased transcription with rositreatment (Fig. 1A). In contrast, transcription from theRgs2 gene body was rapidly repressed by rosi (Fig. 1B),consistent with the behavior of the mRNA (Sears et al.2007). Overall, 1951 annotated RefSeq genes were tran-scriptionally regulated by rosi at one or more of the timepoints tested (Fig. 1C). Interestingly, 71% of regulatednascent transcripts were repressed, whereas only 29%were activated by rosi.
Regulation of nascent gene transcription by rosicorrelates with changes in mRNA levels
To assess the temporal and gene-specific relationship be-tween nascent gene transcription and steady-state mRNAlevels, we determined the adipocyte transcriptome usinggene expression microarrays after 30 min, 1 h, 2 h, 6 h,12 h, 24 h, 36 h, and 48 h of rosi treatment, with threebiological replicates at each time point (Fig. 2). While thenascent transcription of many genes was regulated as earlyas 10 and 30 min after rosi, very few mRNA transcriptschanged during this time period and for at least 2 h afterrosi treatment. This was not surprising, as the timerequired to reach new steady-state levels is related tothe rate of degradation rather than the rate of synthesis(Schimke and Doyle 1970). However, the correlationbetween nascent transcription and steady-state mRNAlevels was high at later time points, with the greatestcorrelation noted between the transcription regulation at3 h and the mRNA regulation measured 6 h after rosi. Thelower correlation with later microarray time pointssuggests that steady-state regulation at these later timesmay be dependent on secondary transcriptional changesoccurring later than 3 h of treatment. Importantly, directtranscriptional regulation by rosi in this model washighly similar to recently published regulation of in vivoadipose tissue gene expression in rosi-treated mice, sug-gesting that many of the rosi-dependent changes thatwe describe are physiologically relevant (SupplementalFig. S1; Ohno et al. 2012).
Rosi regulates transcription of eRNAs that correlatewith gene transcription
In addition to gene body transcription, GRO-seq revealedrobust bidirectional transcripts at enhancers or eRNAs(Core et al. 2008; Kim et al. 2010), which were identifiedand quantified in an unbiased, genome-wide analysis (Fig.3A). For example, bidirectional eRNAs were identified atenhancers upstream of the Fabp4 locus, and their tran-scription was observed to be up-regulated by rosi (Fig. 3B).Indeed, unbiased de novo calling of bidirectional inter-
TZDs redistribute adipocyte enhancer transcription
GENES & DEVELOPMENT 1019
Cold Spring Harbor Laboratory Press on April 13, 2018 - Published by genesdev.cshlp.orgDownloaded from

genic transcripts confirmed that the transcription ofmany eRNAs was strongly and rapidly regulated by rosi,and down-regulated eRNAs greatly outnumbered up-reg-ulated eRNAs (Fig. 3C). This was similar to the effect ofrosi on gene body transcription, and, as has been observedin other systems (De Santa et al. 2010; Kim et al. 2010), theeffect of rosi on eRNA transcription correlated stronglywith transcription at the nearby gene bodies (Fig. 3D;Supplemental Fig. S2A). The correlation was confirmedat eRNA/gene body pairs by quantitative PCR (qPCR),which also demonstrated that eRNA induction often pre-ceded gene induction (Fig. 3E; Supplemental Fig. S2B). Thecorrelation was validated at repressed eRNA/gene pairs aswell (Supplemental Fig. S2C). Although intragenic eRNAswere excluded from downstream analysis because ofdifficulties in identifying them reliably, we observedthat many follow a similar pattern of correlation withthe target gene (Supplemental Fig. S3).
PPARg directly mediates the induction of eRNAand gene transcription by rosi
De novo motif-finding analysis at sites of rosi-inducedeRNAs revealed strong enrichment for a sequence that ishighly similar to the canonical PPARg/RXR-binding site(Fig. 4A; Supplemental Fig. S4). Indeed, up-regulated eRNAswere extremely likely to have PPARg bound nearby (85%),much more so than unregulated or down-regulated eRNAs
(Fig. 4B). In fact, down-regulated eRNAs were relativelydevoid of PPARg binding, as discussed below. Furthermore,strong PPARg binding as measured by total normalized tagcounts from chromatin immunoprecipitation (ChIP) cou-pled with deep sequencing (ChIP-seq) was enriched at up-regulated eRNAs, but not at down-regulated eRNAs, rela-tive to unregulated eRNAs (Fig. 4C). PPARg-binding sitesthat overlap with eRNAs had higher PPARg occupancythan those that lack eRNAs, further suggesting thatenhancers with eRNAs are more likely to be functional(Supplemental Fig. S5). Moreover, knockdown of PPARg
abrogated basal eRNA transcription at rosi-up-regulatedsites (Fig. 4D; Supplemental Fig. S6), indicating thatPPARg binding was required for eRNA transcription atthese sites.
In addition to regulating eRNAs, PPARg binding wascritical for the regulation of gene body transcription as well.Up-regulated genes were statistically significantly enrichedfor PPARg sites closer to the transcription start site (TSS)compared with down-regulated or unregulated genes(Fig. 4E). Furthermore, up-regulated genes had signifi-cantly more PPARg-binding sites within 100 kb of theTSS (Fig. 4F). Together, these data strongly support the
Figure 1. Rosi rapidly increases and represses gene transcrip-tion in adipocytes. GRO-seq was performed on mature 3T3-L1adipocytes treated for 0, 10 min, 30 min, 1 h, or 3 h with rosi. (A)Increased transcription at the Fabp4 locus with rosi treatment.(B) The Rgs2 gene shows repressed transcription upon rositreatment. (C) The heat map shows 1951 genes that displayeda significant change in transcription (false discovery rate [FDR]<0.05) due to rosi treatment in at least one time point.
Figure 2. Adipocyte gene body transcription levels correlatewith steady-state mRNA levels. Correlation between micro-array mRNA levels and GRO-seq transcription levels is plottedat each time point. The Pearson correlation coefficient is givenfor each pair of time points.
Step et al.
1020 GENES & DEVELOPMENT
Cold Spring Harbor Laboratory Press on April 13, 2018 - Published by genesdev.cshlp.orgDownloaded from

model that rosi up-regulates gene expression by bindingto PPARg at enhancer sites proximal to the TSS, whereit directly stimulates eRNA as well as gene bodytranscription.
Repression of eRNA transcription by rosi is not directlymediated by PPARg
In contrast to the up-regulation of transcription by rosi,the PPARg motif and strength of binding were notenriched at rosi-repressed eRNAs. Although 23.6% ofdown-regulated eRNAs had PPARg bound (Fig. 4B), thispercent was far less than at unregulated eRNAs, and thebinding tended to be extremely weak (Fig. 4C). Inaddition, in contrast to its effect on up-regulated eRNAs,knockdown of PPARg did not affect basal expression ofrosi-down-regulated eRNAs (Fig. 4D). Moreover, unlikeup-regulated genes, the number, strength, and proximityof PPARg binding were not enriched near the TSS of
down-regulated genes relative to unchanged genes (Fig.4E,F). Together, these data strongly suggest that PPARg
does not mediate the repression of eRNA and gene bodytranscription by rosi directly; i.e., by binding in cis withthe regulated gene body, as was the case at the majorityof rosi-up-regulated eRNAs.
De novo motif analysis of sites with down-regulatedeRNAs produced two highly enriched motifs that mostresembled a C/EBP:AP-1 hybrid motif and the canonicalAP-1 motif (Fig. 5A; Supplemental Fig. S7). ChIP-seqanalysis for C/EBP and AP-1 factors that are abundant inadipocytes revealed significant enrichment at down-reg-ulated eRNAs of both C/EBPa and FOSL2 (Fig. 5B), whichhas been shown to play a role in adipocyte gene expres-sion (Wrann et al. 2012). A higher percentage of down-regulated eRNAs, compared with up-regulated and non-regulated, had C/EBPa and FOSL2 bound, and, interest-ingly, although C/EBPa has been shown to be enrichednear genes repressed after rosi treatment (Vernochetet al. 2009; Haakonsson et al. 2013), the enrichment was
Figure 3. Adipocyte eRNA transcription is stimulated by rosiand correlates with gene body transcription. (A) Genome-wideaverage signal of intergenic bidirectional transcripts in untreatedadipocytes from the plus and minus strands. (B) Two bidirectionaleRNAs are transcribed at enhancers upstream of the Fabp4 TSSand up-regulated by rosi treatment. eRNA centers are indicatedby arrows. (C) Heat map showing all rosi-regulated eRNAs foundin an unbiased manner (N = 2251). (D) Correlation between rosi-regulated eRNAs and the regulation of the nearby gene for allpairs of matching time points (N = 462). For each gene, eRNAswithin 100 kb of the TSS were included in the analysis. (E)Correlation between gene and eRNA rosi regulation as measuredby RT-qPCR for two example genes, Fabp4 and Pdk4. N = 3. Errorbars indicate SEM.
Figure 4. Rosi-up-regulated eRNAs are dependent on genomicbinding of PPARg. (A) Top hit from Homer de novo motif search atup-regulated eRNAs. The closest known motif, the DR1 motif, isshown for reference. The enrichment for this motif was 45% in thetarget sites and 13.5% in the background sites. (B) Percentage of up-regulated, down-regulated, and unregulated eRNA sites that overlapwith a called PPARg peak from ChIP-seq. There were 14,604 calledPPARg peaks in our data set. Among those, 5819 sites wereextragenic, and 3642 sites had eRNAs. (C) Total PPARg tag countin reads per million (RPM) within 1 kb of up-regulated, down-regulated, and unregulated eRNA sites. (*) P = 7.7 3 10�95 versusunregulated; (**) P = 1.8 3 10�20 versus unregulated. (D) RT-qPCR ofeRNAs 24 h after siRNA knockdown of PPARg. N = 3. Error barsindicate SEM. (E) Distance from TSS to the closest PPARg sites forregulated genes. P < 10�10 for up-regulated versus unregulated sitesby x2 test. (F) Number of PPARg-binding sites within 100 kb of theTSS for regulated genes. P < 10�10 for up-regulated versus un-regulated sites by x2 test.
TZDs redistribute adipocyte enhancer transcription
GENES & DEVELOPMENT 1021
Cold Spring Harbor Laboratory Press on April 13, 2018 - Published by genesdev.cshlp.orgDownloaded from
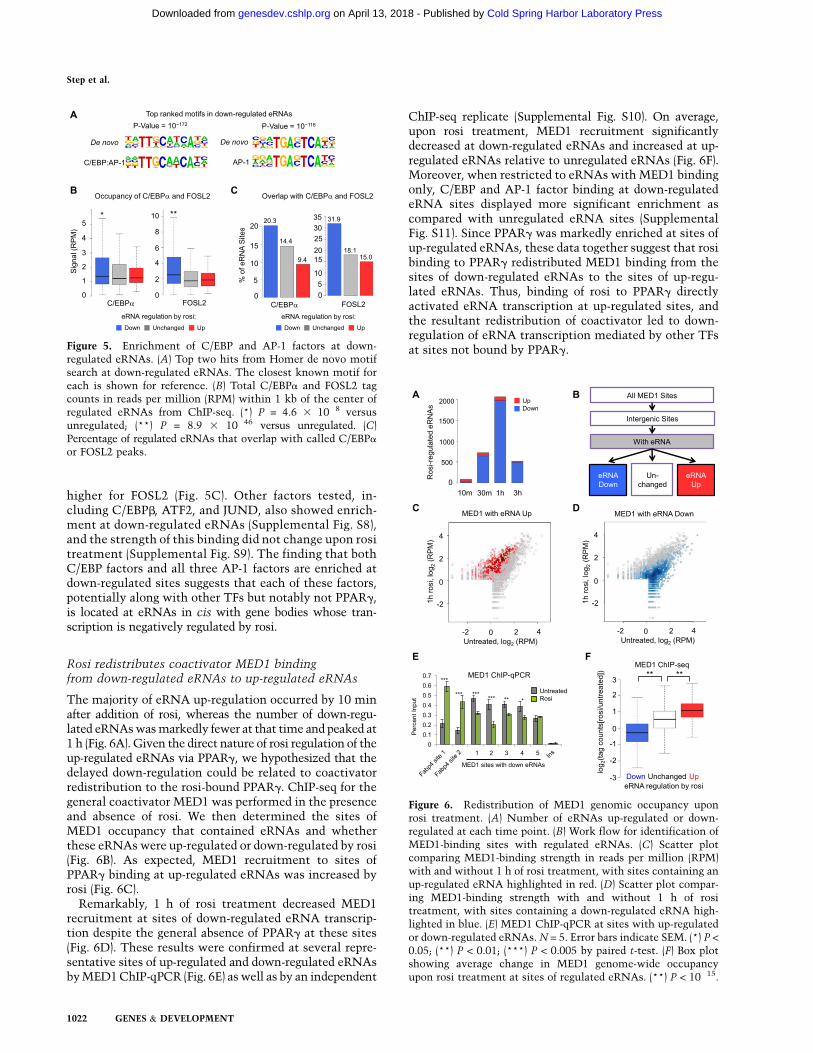
higher for FOSL2 (Fig. 5C). Other factors tested, in-cluding C/EBPb, ATF2, and JUND, also showed enrich-ment at down-regulated eRNAs (Supplemental Fig. S8),and the strength of this binding did not change upon rositreatment (Supplemental Fig. S9). The finding that bothC/EBP factors and all three AP-1 factors are enriched atdown-regulated sites suggests that each of these factors,potentially along with other TFs but notably not PPARg,is located at eRNAs in cis with gene bodies whose tran-scription is negatively regulated by rosi.
Rosi redistributes coactivator MED1 bindingfrom down-regulated eRNAs to up-regulated eRNAs
The majority of eRNA up-regulation occurred by 10 minafter addition of rosi, whereas the number of down-regu-lated eRNAs was markedly fewer at that time and peaked at1 h (Fig. 6A). Given the direct nature of rosi regulation of theup-regulated eRNAs via PPARg, we hypothesized that thedelayed down-regulation could be related to coactivatorredistribution to the rosi-bound PPARg. ChIP-seq for thegeneral coactivator MED1 was performed in the presenceand absence of rosi. We then determined the sites ofMED1 occupancy that contained eRNAs and whetherthese eRNAs were up-regulated or down-regulated by rosi(Fig. 6B). As expected, MED1 recruitment to sites ofPPARg binding at up-regulated eRNAs was increased byrosi (Fig. 6C).
Remarkably, 1 h of rosi treatment decreased MED1recruitment at sites of down-regulated eRNA transcrip-tion despite the general absence of PPARg at these sites(Fig. 6D). These results were confirmed at several repre-sentative sites of up-regulated and down-regulated eRNAsby MED1 ChIP-qPCR (Fig. 6E) as well as by an independent
ChIP-seq replicate (Supplemental Fig. S10). On average,upon rosi treatment, MED1 recruitment significantlydecreased at down-regulated eRNAs and increased at up-regulated eRNAs relative to unregulated eRNAs (Fig. 6F).Moreover, when restricted to eRNAs with MED1 bindingonly, C/EBP and AP-1 factor binding at down-regulatedeRNA sites displayed more significant enrichment ascompared with unregulated eRNA sites (SupplementalFig. S11). Since PPARg was markedly enriched at sites ofup-regulated eRNAs, these data together suggest that rosibinding to PPARg redistributed MED1 binding from thesites of down-regulated eRNAs to the sites of up-regu-lated eRNAs. Thus, binding of rosi to PPARg directlyactivated eRNA transcription at up-regulated sites, andthe resultant redistribution of coactivator led to down-regulation of eRNA transcription mediated by other TFsat sites not bound by PPARg.Figure 5. Enrichment of C/EBP and AP-1 factors at down-
regulated eRNAs. (A) Top two hits from Homer de novo motifsearch at down-regulated eRNAs. The closest known motif foreach is shown for reference. (B) Total C/EBPa and FOSL2 tagcounts in reads per million (RPM) within 1 kb of the center ofregulated eRNAs from ChIP-seq. (*) P = 4.6 3 10�8 versusunregulated; (**) P = 8.9 3 10�46 versus unregulated. (C)Percentage of regulated eRNAs that overlap with called C/EBPa
or FOSL2 peaks.
Figure 6. Redistribution of MED1 genomic occupancy uponrosi treatment. (A) Number of eRNAs up-regulated or down-regulated at each time point. (B) Work flow for identification ofMED1-binding sites with regulated eRNAs. (C) Scatter plotcomparing MED1-binding strength in reads per million (RPM)with and without 1 h of rosi treatment, with sites containing anup-regulated eRNA highlighted in red. (D) Scatter plot compar-ing MED1-binding strength with and without 1 h of rositreatment, with sites containing a down-regulated eRNA high-lighted in blue. (E) MED1 ChIP-qPCR at sites with up-regulatedor down-regulated eRNAs. N = 5. Error bars indicate SEM. (*) P <
0.05; (**) P < 0.01; (***) P < 0.005 by paired t-test. (F) Box plotshowing average change in MED1 genome-wide occupancyupon rosi treatment at sites of regulated eRNAs. (**) P < 10�15.
Step et al.
1022 GENES & DEVELOPMENT
Cold Spring Harbor Laboratory Press on April 13, 2018 - Published by genesdev.cshlp.orgDownloaded from

In support of this, at the minority of down-regulatedeRNAs where PPARg binding was observed, the strengthof PPARg binding was markedly reduced relative to up-regulated sites (Supplemental Fig. S12A). Furthermore,in stark contrast to the PPARg-associated up-regulatedeRNAs (but consistent with the non-PPARg-associateddown-regulated eRNAs), knockdown of PPARg did notsignificantly alter basal eRNA transcription at thesedown-regulated eRNAs (Supplemental Fig. S12B), indi-cating that the weakly bound PPARg was not functional.Consistent with this, rosi treatment led to loss of MED1at these sites (Supplemental Fig. S12C), just as was notedat down-regulated eRNAs devoid of PPARg binding.The basal magnitude of binding of MED1 at unchangedeRNAs was not significantly different from at down-regulated eRNAs (Supplemental Fig. 13). The reasonfor this is not clear, but presumably, additional factors,potentially including histone marks or cooperating TFs,may be involved in determining which eRNAs will bedown-regulated by rosi treatment.
Furthermore, redistribution of a coactivator to up-regu-lated sites and away from repressed sites was not limited toonly MED1. ChIP-seq for the coactivators CREB-bindingprotein (CBP) and p300 in the presence and absence of rosishowed a modest but consistent and statistically signifi-cant redistribution upon rosi treatment similar to MED1(Supplemental Fig. S14). These data support the model thatupon rosi treatment, coactivators are redistributed tostrong, functional PPARg sites and away from enhancerscontaining weakly bound PPARg and other TFs. Surpris-ingly, we did not observe significant changes in H3K27acat sites of eRNAs regulated after 1 h of rosi treatment,although we cannot rule out changes in chromatin marksat later time points (Supplemental Fig. S15). Also, incontrast to the three coactivators tested, rosi treatmentdid not cause global redistribution of NCoR (Supplemen-tal Fig. S16).
Discussion
The present analysis of how rosi influences genome-widetranscription rates in adipocytes has revealed much aboutthe mechanisms of action of this anti-diabetic PPARg
ligand. These studies provide a higher-resolution andmore dynamic portrait of rosi-regulated gene transcrip-tion than previously possible. Earlier reports of rosi-regulated gene expression using microarray or RNA poly-merase II ChIP-seq found a few hundred regulated genes,with half or slightly more than half of those being up-regulated by rosi (Choi et al. 2010; Haakonsson et al.2013). In contrast, we found that transcription is regu-lated at almost 2000 gene bodies, more than two-thirds ofwhich are repressed in response to ligand treatment. Webelieve that this increased sensitivity arises from theGRO-seq technique as well as from the use of multipletime points to capture various dynamics of direct tran-scriptional regulation.
Rosi regulates nascent gene transcription within 10 minof treatment, and this correlates well with steady-statemRNA regulation. The correlation is delayed, as expected,
since changes in gene body transcription precede those ofthe mRNAs and because the time to reach a new steady-state mRNA level is independent of the rate of synthesisand dependent solely on the mRNA half-life (Schimkeand Doyle 1970). The correlation between early transcrip-tion rates and steady-state mRNA levels waned at latertime points, presumably due to secondary effects of rosi,such as induction of other TFs or mRNA-degradingsystems.
eRNAs are of great interest, as they have been shown tocontribute to enhancer function and influence transcriptionat the target gene body (Kaikkonen et al. 2013; Lam et al.2013; Li et al. 2013; Melo et al. 2013). We were able todetect adipocyte eRNAs, and quantification of theirbasal and rosi-regulated rates of transcription revealeda high correlation between eRNA transcription andtranscription at the nearby genes. At rosi-up-regulatedeRNAs, PPARg binding was highly enriched and wasactually required for eRNA transcription. Up-regulationof transcription by rosi was correlated with recruitmentof the coactivators MED1, CBP, and p300 to the site ofeRNA transcription, in agreement with a recent studythat found that MED1 was recruited to PPARg-bindingsites (Haakonsson et al. 2013). Up-regulation of genetranscription by rosi was also favored by the number,strength, and proximity of PPARg-binding sites relativeto the TSS. Thus, activation of gene transcription by rosifits a general model of NR function in which ligandbinding facilitates the recruitment of coactivators toPPARg bound in cis with a regulated gene body. The siteof PPARg binding functions as an enhancer, generatingeRNAs that correlate with the level of gene bodytranscription. The effect is greatest when multiplestrong PPARg-binding events occur in relatively closeproximity to the TSS.
In contrast, rosi-down-regulated eRNAs are quite dif-ferent. They are depleted of PPARg binding comparedwith background levels but are enriched for other TFs,especially members of the C/EBP and AP-1 TF families.These eRNAs were not dependent on PPARg expression,further indicating the absence of a direct role of PPARg intheir transcription. Nevertheless, despite the fact thatPPARg is not bound in the vicinity, rosi treatment leads todismissal of the coactivators from these sites. This sug-gests that a primary mechanism of rosi-dependent tran-scriptional repression involves squelching of essentialcoactivators from enhancers lacking PPARg. Consistentwith this, the induction of the PPARg-dependent, rosi-induced eRNAs preceded the down-regulation of non-PPARg-dependent eRNAs.
In contrast to up-regulated enhancers, which depend onactivation of PPARg and recruitment of coactivators suchas MED1, down-regulated sites where MED1 bindingwas lost were enriched for TFs other than PPARg. Thissuggests that, in principle, any TF driving transcriptionat a PPARg-independent enhancer would be susceptibleto the repressive effects of rosi redistributing coactiva-tors to PPARg. Indeed, this may explain why the down-regulated enhancers are enriched for binding of multiplefactors, including C/EBPa, C/EBPb, FOSL2, ATF2, and
TZDs redistribute adipocyte enhancer transcription
GENES & DEVELOPMENT 1023
Cold Spring Harbor Laboratory Press on April 13, 2018 - Published by genesdev.cshlp.orgDownloaded from

JUND. Of these, only C/EBPa has previously beenimplicated in rosi-mediated transcriptional repression(Vernochet et al. 2009; Haakonsson et al. 2013), andnotably, in our studies, C/EBPa was less enriched atdown-regulated sites relative to the AP-1 TFs.
A role for coactivator redistribution or squelching hasbeen previously suggested to explain transcriptional re-pression by NRs, but most of those studies were per-formed using transfection to overexpress receptors orcoactivators and used reporter genes as readouts (Kameiet al. 1996; Fronsdal et al. 1998; Lee et al. 2000; Li et al.2000; Kim et al. 2001; Zhang and Teng 2001; Manna andStocco 2007; He et al. 2012; Pascual-Garcia et al. 2013).This model gained further support recently with evidencethat the endogenous coactivator NCOA3 is lost fromsites of diminished DNase I hypersensitivity upon E2hormone treatment in MCF-7 cells (He et al. 2012). Hereour analysis of eRNAs has allowed us to focus onregulated enhancers and interrogate this mechanism inthe context of the endogenous genome and TFs in adipo-cytes, where the only manipulation was treatment withthe PPARg ligand, and link the coactivator redistributionto changes in transcriptional levels of both eRNAs andgenes.
In macrophages, the transrepression model has becomethe primary mechanism to explain PPARg-mediated generepression (Glass and Saijo 2010). In this model, rositreatment causes the SUMOylation and subsequenttethering of bound PPARg to promoters of inflammatorygenes already bound by NF-kB and other factors, block-ing the dismissal of the corepressor complex from thosesites (Pascual et al. 2005). However, this has only beendemonstrated at select promoters of inflammatory genesand pertains only to the role of rosi in blocking theactivating effect of endotoxin. Hence, it likely does notexplain the majority of genome-wide transcriptionalrepression. It should be noted that the transrepressionmodel requires PPARg binding, albeit by a tetheringmodel, whereas we observed that the majority of rosi-down-regulated eRNAs in adipocytes are actually de-pleted of PPARg.
Thus, our study of nascent gene transcription in adipo-cytes has not only revealed a rapid transcriptional responseto rosi that precedes yet is highly correlated with steady-state mRNA levels but has also demonstrated that rosiregulates adipocyte eRNAs in a manner that is highlycorrelated with gene body transcription. Bioinformatic,genomic, and genetic analysis of these eRNAs has pro-vided strong evidence that rosi-dependent activation andrepression of transcription are mediated by two funda-mentally different mechanisms, with activation occur-ring at sites of PPARg binding and repression occurring atsites that are basally activated by other TFs and whosecoactivator recruitment is destabilized when rosi binds toPPARg and increases its affinity for coactivators. Adipo-cytes express PPARg at very high levels, which likelycontributes to both the strength of PPARg binding at rosi-up-regulated eRNAs and the redistribution of coactiva-tors away from other TFs in the setting of ligand activa-tion of PPARg.
Materials and methods
Cell culture
3T3-L1 cells were obtained from American Type Culture Col-lection and grown in DMEM (Invitrogen) supplemented with10% fetal bovine serum (Tissue Culture Biologics), 100 U/mLpenicillin, and 100 mg/mL streptomycin (Invitrogen). Two dayspost-confluence, differentiation medium (growth medium with1 mM dexamethasone, 10 mg/mL human insulin, and 0.5 mM3-isobutyl-1-methylxanthine [Invitrogen]) was added. Cells weredifferentiated as described previously (Lefterova et al. 2008) bygrowth in differentiation medium for 2 d, followed by growthmedium with insulin for 2 d, followed by growth medium only.When indicated, mature 3T3-L1 adipocytes were treated with1 mM rosi (Biomol) dissolved in DMSO.
Gene expression analysis
RNA was isolated from cells using TRIzol (Invitrogen) followedby the RNeasy minikit (Qiagen). RT–PCR was performed using1 mg of RNA (Applied Biosystems) following the manufacturer’sinstructions, and qPCR was performed using primers listed inSupplemental Table S1 using Power SYBR Green master mix(Applied Biosystems) on the PRISM 7500 and 7900HT instru-ments (Applied Biosystems). Analysis was performed using thestandard curve method, and all genes were normalized to thehousekeeping gene Arbp. For the microarray, RNA integrity wasexamined using an Agilent 2100 Bioanalyzer. RNA samples (150ng) with RNA integrity number >7 were used for target ampli-fication and labeling via the Ambion WT Expression kit (no.4411974) and Affymetrix WT Terminal-Labeling kit (no. 900671)following the manufacturer’s protocol. Mouse Gene 1.1 ST arrayplates (no. 901418, Affymetrix) were used for microarray hybrid-ization, wash, stain, and scan with GeneTitan hyb-wash-stain kits(no. 901622, Affymetrix) and a GeneTitan instrument. GeneTitanscanner data were collected with default parameters and furtheranalyzed using the Partek genomics suite. Data were normalizedusing the default Robust Multichip Average (RMA) method. Foreach gene, an average was taken across replicates for the compar-ative analysis with GRO-seq gene transcriptional level.
GRO-seq library preparation
GRO-seq was performed as previously described (Core et al.2008; Wang et al. 2011). Cells were washed twice with ice-coldPBS and then swelled in cold swelling buffer (10 mM Tris at pH7.5, 2 mM MgCl2, 3 mM CaCl2) for 5 min on ice. Cells werescraped off and centrifuged at 400g for 10 min, resuspended in 10mL of lysis buffer (swelling buffer with 10% glycerol, 1% Igepal),and incubated for 5 min on ice. Nuclei were washed twice withlysis buffer and then resuspended in freezing buffer (50 mM Trisat pH 8.3, 40% glycerol, 5 mM MgCl2, 0.1 mM EDTA). Nucleiwere counted and pelleted, and 5 3 106 nuclei were resuspendedin 100 mL of freezing buffer. For each library, run-on was performedon four tubes of 5 3 106 nuclei.
For the run-on, cells were mixed with an equal volume of run-on buffer (10 mM Tris at pH 8.0; 5 mM MgCl2; 1 mM DTT; 300mM KCl; 20 U of SUPERase-In; 1% Sarkosyl; 500 mM ATP, GTP,and Br-UTP; 2 mM CTP) preheated to 30°C and incubatedfor 5 min at 30°C. Nuclear RNA was extracted with TRIzol(Invitrogen) and chloroform and precipitated with NaCl andethanol overnight. The RNA pellet was resuspended in water,and the RNA was DNase-treated (Ambion) for 30 min. RNA washydrolyzed using fragmentation reagents (Ambion) for 13 min at70°C and purified through a Micro Bio-Spin p-30 column (Bio-
Step et al.
1024 GENES & DEVELOPMENT
Cold Spring Harbor Laboratory Press on April 13, 2018 - Published by genesdev.cshlp.orgDownloaded from

Rad) according to the manufacturer’s instructions. RNA wasincubated with 1.5 mL of T4 polynucleotide kinase (New EnglandBiolabs) for 1 h at 37°C and then with an additional 1 mL for 1 hmore. RNA was denatured for 5 min at 65°C.
Anti-BrU agarose beads (Santa Cruz Biotechnology) were ro-tated for 1 h in blocking buffer (0.53 SSPE, 1 mM EDTA, 0.05%Tween-20, 0.1% PVP, 1 mg/mL BSA). Run-on RNA was rotatedwith beads for 1 h, followed by 5-min washes twice in bindingbuffer (0.53 SSPE, 1 mM EDTA, 0.05% Tween-20), twice in low-salt buffer (0.23 SSPE, 1 mM EDTA, 0.05% Tween-20), once inhigh-salt buffer (0.53 SSPE, 1 mM EDTA, 0.05% Tween-20,150 mM NaCl), and twice in TET buffer (TE at pH 7.4, 0.05%Tween-20). BrU-labeled RNA was eluted from the beads fourtimes for 15 min with 100 mL of elution buffer preheated to 42°C.RNA was ethanol-precipitated overnight.
The RNA pellet was resuspended in water, denatured, andtreated with poly(A)-polymerase (New England Biolabs) for30 min at 37°C. cDNA synthesis was performed as describedpreviously (Wang et al. 2011) using the oNTI223 primer (59-pGATCGTCGGACTGTAGAACTCT;CAAGCAGAAGACGGCATACGATTTTTTTTTTTTTTTTTTTTVN-39), where ‘‘p’’ repre-sents 59 phosphorylation, ‘‘;’’ represents the abasic dSpacer furan,and ‘‘VN’’ represents degenerate nucleotides. The reaction wastreated with 3 mL of exonuclease I (Fermentas) for 15 min at 37°Cfollowed by 2 mL of 1 M NaOH for 20 min at 98°C and neutralizedwith 1 mL of 2 M HCl. cDNA was run on a 10% TBE-urea gel, andproducts were excised and eluted from shredded gel pieces for 4 hin TE + 0.1% Tween and precipitated in ethanol overnight.
First strand cDNA was circularized for 1 h with CircLigase(Epicentre), denatured for 10 min at 80°C, and relinearized withAPE I (New England Biolabs). Relinearized DNA was PCR-amplified using the Phusion Hot Start II kit, according to themanufacturer’s instructions, with the primers oNTI200 (59-CAAGCAGAAGACGGCATA-39) and oNTI201 (59-AATGATACGGCGACCACCGACAGGTTCAGAGTTCTACAGTCCGACG-39). The PCR product was run on a 10% TBE gel and elutedas in the previous step. Libraries were sequenced on an Illumina hi-Seq2000 with sequencing primer 59-CGACAGGTTCAGAGTTCTACAGTCCGACGATC-39.
Transfection
For PPARg siRNA knockdown, mature differentiated 3T3-L1adipocytes were electroporated using Amaxa Cell Line L (pro-gram A-033, Lonza). One-quarter of a 10-cm dish of cells wastreated with 200 pmol of siRNA (sequences in SupplementalTable S3) and plated onto one well of a 12-well dish. Cells wereharvested 24–30 h post-transfection.
ChIP-seq
ChIP was performed as described previously (Steger et al. 2008).The following antibodies were used in this study: C/EBPa (sc-61x, Santa Cruz Biotechnology), C/EBPb (sc-150x, Santa CruzBiotechnology), FOSL2 (sc-13017x, Santa Cruz Biotechnology),JUND (sc-74x, Santa Cruz Biotechnology), ATF2 (sc-6233x, SantaCruz Biotechnology), MED1 (A300-793A, Bethyl Laboratories),H3K27ac (ab4729, Abcam), CBP (sc-369x, Santa Cruz Biotechnol-ogy), p300 (sc-585x, Santa Cruz Biotechnology), and NCoR (rabbitpolyclonal, generated in our laboratory). Primer sequences usedfor ChIP-qPCR are provided in Supplemental Table S2. ChIP DNAwas prepared for sequencing according to the amplification pro-tocol provided by Illumina. Next-generation sequencing of ChIP-seq libraries was performed by the Functional Genomics Core atthe University of Pennsylvania, including preprocessing andalignment of the raw tags.
GRO-seq data processing
First, adapter and poly-A sequences were trimmed off from theraw tags, and remaining tags were converted into FASTA formatbefore alignment. Trimmed tags were aligned to the mousegenome mm8 using Bowtie (Langmead et al. 2009) with thefollowing options: Inputs were in FASTA format (-f), threemismatches were allowed for each tag (-v 3), and only uniquelymapped tags were retained (-m 1). All of the alignments wereadjusted to 50 base pairs (bp) by extending toward the 39 endif their size was shorter than that to make libraries comparable.For the visualization of GRO-seq data, we pooled two replicatesfor each time point and extended each tag to 150 bp to makesmooth profiles. bedGraph files were generated first usinggenomeCoverageBed command in the BEDTools suite (Quinlanand Hall 2010) for plus and minus strands separately and wereconverted to bigwig format using the bedGraphToBigWig com-mand in BLAT suite (Kent et al. 2010). All of the microarray andhigh-throughput sequencing data have been deposited in GeneExpression Omnibus under the accession number GSE56747.
ChIP-seq data processing
All of the ChIP-seq tags for C/EBPa, C/EBPb, FOSL2, ATF2,JUND, NCoR, and MED1 were aligned to mouse genome mm8using Bowtie with options ’’-k 1 -m 1–best –strata,’’ and all of theredundant tags were eliminated except one before downstreamanalysis. For PPARg, we used two public PPARg ChIP-seq data,GSM340799 and GSM678393 (Nielsen et al. 2008; Schmidt et al.2011) from Gene Expression Omnibus, where all of the redun-dant tags were eliminated in each data set, and the remainingtags were pooled into a single data set. Peak calling was performedusing the findPeaks command in Homer (Heinz et al. 2010). Afterinitial calling, all of the peaks were resized to 200 bp; the 2 readsper million (RPM) cutoff was applied for C/EBPa, C/EBPb, FOSL2,ATF2, JUND, and PPARg to select strong peaks; and the 1 RPMcutoff was applied for MED1, CBP, p300, and NCoR because oftheir indirect genomic binding.
Gene transcription analysis
To determine rosi-induced regulation of gene transcription, weused normalized tag counts within a window between +0.5 kband 12 kb of the TSS to capture acute changes and yet minimizethe bias from paused signal at promoters. When counting tags,we ignored the tags aligned onto rRNA, small nucleolar RNA(snoRNA), small nuclear RNA (snRNA), or tRNA to avoid anyfalse contribution to gene body GRO-seq signal due to thesehighly abundant elements. To identify rosi-regulated genes, weperformed an exact test with edgeR package (Robinson et al.2010) for each time point—10 min, 30 min, 1 h, and 3 h—using0 min as a control. Genes were considered rosi-regulated if thefalse discover rate (FDR) was <0.05 at any time point, but thosewith low GRO-seq signal (<0.5 RPKM [reads per kilobase permillion]) or poor gene body coverage (<70%) at every time pointwere discarded before downstream analysis. Temporal patternsof rosi-induced regulation were graphically presented by hierar-chical clustering, where GRO-seq levels were RPKM-normalizedand 1 � (correlation coefficient) was used as a distance measurebetween genes. The initial dendrogram was first created based onWard’s criterion using the fastcluster R package (http://danifold.net/fastcluster.html) and then subjected to optimal leaf ordering(Bar-Joseph et al. 2001). In the visualization of clustering heatmaps, RPKM values were converted into log2(fold change over0 min) for intuitive color representation of up-regulation or down-regulation. Gene ontology analysis was performed using DAVID(Huang et al. 2008), and top ranked GO FAT terms were presented.
TZDs redistribute adipocyte enhancer transcription
GENES & DEVELOPMENT 1025
Cold Spring Harbor Laboratory Press on April 13, 2018 - Published by genesdev.cshlp.orgDownloaded from
eRNA analysis
For eRNA analysis, we defined an enhancer as an intergeniccenter of a bidirectional transcript. After pooling both replicatesto improve transcript coverage for each time point, we identifiedall of the putative transcripts in plus and minus strands using thefindPeaks command in Homer. Two start sites of a plus tran-script and a minus transcript were paired together if theirdistance was <1 kb, and then their midpoint was defined asa center of a bidirectional transcript. Any of these centers werediscarded if they are located within 2 kb from RefSeq genes orSatellite regions to avoid potential bias from gene body tran-scripts or abundant signal from Satellite regions. To investigaterosi-induced eRNA regulation, we used a pipeline similar to thegene transcript analysis with the following differences. Whencounting tags for eRNA, we considered a 2-kb window onlyaround the previously defined enhancer and summed plus andminus tags. A coverage cutoff was not applied, yet the 0.5 RPKMcutoff was still applied. Among eRNAs that passed the cutoff,those with a FDR of <0.05 were considered rosi-regulated, andthe others were considered nonregulated. For the clusteringanalysis, we used log2(fold change over untreated) in each timepoint and Euclidean distance. The initial dendrogram wascreated by Ward’s criterion and then further subjected to optimalleaf ordering. A de novo motif search was performed usingHomer more than once for a given set of genomic loci, and theconsensus motifs were considered for downstream analysis onlyif they appeared consistently with a significant P-value.
Acknowledgments
We thank members of the Lazar laboratory for helpful discus-sions and reagents, and Klaus Kaestner for critically reading themanuscript. We also thank Leighton Core, John Lis, MinnaKaikkonen, and Chris Glass for help with the GRO-seq pro-tocol; Fang Chen and Don Baldwin for performing the micro-arrays; and the Functional Genomics Core of the Penn DiabetesCenter (DK19525) for deep sequencing. A.P. was supported bya GEN-AU mobility grant from the Austrian Ministry ofScience and Research. This work was also supported by Na-tional Institutes of Health grants R01 DK49780 (to M.A.L.),R21DK098769 (to K.-J.W.), and 5T32GM008076 (to S.E.S.) andthe JPB Foundation.
References
Ahmadian M, Suh JM, Hah N, Liddle C, Atkins AR, Downes M,Evans RM. 2013. PPARg signaling and metabolism: the good,the bad and the future. Nat Med 19: 557–566.
Bar-Joseph Z, Gifford DK, Jaakkola TS. 2001. Fast optimal leafordering for hierarchical clustering. Bioinformatics 17: S22–S29.
Bugge A, Grontved L, Aagaard MM, Borup R, Mandrup S. 2009.The PPARg2 A/B-domain plays a gene-specific role in trans-activation and cofactor recruitment. Methods Enzymol 23:794–808.
Chao L, Marcus-Samuels B, Mason MM, Moitra J, Vinson C,Arioglu E, Gavrilova O, Reitman ML. 2000. Adipose tissue isrequired for the antidiabetic, but not for the hypolipidemic,effect of thiazolidinediones. J Clin Invest 106: 1221–1228.
Chawla A, Lazar MA. 1994. Peroxisome proliferator and retinoidsignaling pathways co-regulate preadipocyte phenotype andsurvival. Proc Natl Acad Sci 91: 1786–1790.
Choi JH, Banks AS, Estall JL, Kajimura S, Bostrom P, Laznik D,Ruas JL, Chalmers MJ, Kamenecka TM, Bluher M, et al.2010. Anti-diabetic drugs inhibit obesity-linked phosphory-lation of PPARg by Cdk5. Nature 466: 451–456.
Core LJ, Waterfall JJ, Lis JT. 2008. Nascent RNA sequencingreveals widespread pausing and divergent initiation at hu-man promoters. Science 322: 1845–1848.
De Santa F, Barozzi I, Mietton F, Ghisletti S, Polletti S, Tusi BK,Muller H, Ragoussis J, Wei CL, Natoli G. 2010. A largefraction of extragenic RNA pol II transcription sites overlapenhancers. PLoS Biol 8: e1000384.
Fronsdal K, Engedal N, Slagsvold T, Saatcioglu F. 1998. CREBbinding protein is a coactivator for the androgen receptor andmediates cross-talk with AP-1. J Biol Chem 273: 31853–31859.
Ge K, Guermah M, Yuan CX, Ito M, Wallberg AE, SpiegelmanBM, Roeder RG. 2002. Transcription coactivator TRAP220 isrequired for PPARg2-stimulated adipogenesis. Nature 417:563–567.
Gelman L, Zhou G, Fajas L, Raspe E, Fruchart JC, Auwerx J.1999. p300 interacts with the N- and C-terminal part ofPPARg2 in a ligand-independent and -dependent manner,respectively. J Biol Chem 274: 7681–7688.
Gill G, Ptashne M. 1988. Negative effect of the transcriptionalactivator GAL4. Nature 334: 721–724.
Glass CK, Rosenfeld MG. 2000. The coregulator exchange intranscriptional functions of nuclear receptors. Genes Dev 14:121–141.
Glass CK, Saijo K. 2010. Nuclear receptor transrepression path-ways that regulate inflammation in macrophages and T cells.Nat Rev Immunol 10: 365–376.
Haakonsson AK, Stahl Madsen M, Nielsen R, Sandelin A,Mandrup S. 2013. Acute genome-wide effects of rosiglitazoneon PPARg transcriptional networks in adipocytes. Methods
Enzymol 27: 1536–1549.He W, Barak Y, Hevener A, Olson P, Liao D, Le J, Nelson M, Ong
E, Olefsky JM, Evans RM. 2003. Adipose-specific peroxisomeproliferator-activated receptor g knockout causes insulinresistance in fat and liver but not in muscle. Proc Natl AcadSci 100: 15712–15717.
He HH, Meyer CA, Chen MW, Jordan VC, Brown M, Liu XS.2012. Differential DNase I hypersensitivity reveals factor-dependent chromatin dynamics. Genome Res 22: 1015–1025.
Heinz S, Benner C, Spann N, Bertolino E, Lin YC, Laslo P, ChengJX, Murre C, Singh H, Glass CK. 2010. Simple combinationsof lineage-determining transcription factors prime cis-regu-latory elements required for macrophage and B cell identi-ties. Mol Cell 38: 576–589.
Hofmann C, Lorenz K, Braithwaite SS, Colca JR, Palazuk BJ,Hotamisligil GS, Spiegelman BM. 1994. Altered gene expres-sion for tumor necrosis factor-a and its receptors during drugand dietary modulation of insulin resistance. Endocrinology
134: 264–270.Huang W, Glass CK. 2010. Nuclear receptors and inflammation
control: molecular mechanisms and pathophysiological rel-evance. Arterioscler Thromb Vasc Biol 30: 1542–1549.
Huang DW, Sherman BT, Lempicki RA. 2008. Systematic andintegrative analysis of large gene lists using DAVID bioin-formatics resources. Nat Protoc 4: 44–57.
Kaikkonen MU, Spann NJ, Heinz S, Romanoski CE, Allison KA,Stender JD, Chun HB, Tough DF, Prinjha RK, Benner C, et al.2013. Remodeling of the enhancer landscape during macro-phage activation is coupled to enhancer transcription. Mol
Cell 51: 310–325.Kamei Y, Xu L, Heinzel T, Torchia J, Kurokawa R, Gloss B,
Lin SC, Heyman RA, Rose DW, Glass CK, et al. 1996. ACBP integrator complex mediates transcriptional activa-tion and AP-1 inhibition by nuclear receptors. Cell 85:403–414.
Step et al.
1026 GENES & DEVELOPMENT
Cold Spring Harbor Laboratory Press on April 13, 2018 - Published by genesdev.cshlp.orgDownloaded from

Kelleher RJ, Flanagan PM, Kornberg RD. 1990. A novel mediatorbetween activator proteins and the RNA polymerase IItranscription apparatus. Cell 61: 1209–1215.
Kent WJ, Zweig AS, Barber G, Hinrichs AS, Karolchik D. 2010.BigWig and BigBed: enabling browsing of large distributeddatasets. Bioinformatics 26: 2204–2207.
Kim SW, Kim HJ, Jung DJ, Lee SK, Kim YS, Kim JH, Kim TS, LeeJW. 2001. Retinoid-dependent antagonism of serum responsefactor transactivation mediated by transcriptional coactiva-tor proteins. Oncogene 20: 6638–6642.
Kim TK, Hemberg M, Gray JM, Costa AM, Bear DM, Wu J,Harmin DA, Laptewicz M, Barbara-Haley K, Kuersten S,et al. 2010. Widespread transcription at neuronal activity-regulated enhancers. Nature 465: 182–187.
Kung J, Henry RR. 2012. Thiazolidinedione safety. Expert Opin
Drug Saf 11: 565–579.Lam MT, Cho H, Lesch HP, Gosselin D, Heinz S, Tanaka-Oishi
Y, Benner C, Kaikkonen MU, Kim AS, Kosaka M, et al. 2013.Rev-Erbs repress macrophage gene expression by inhibitingenhancer-directed transcription. Nature 498: 511–515.
Langmead B, Trapnell C, Pop M, Salzberg SL. 2009. Ultrafast andmemory-efficient alignment of short DNA sequences to thehuman genome. Genome Biol 10: R25.
Lee YK, Dell H, Dowhan DH, Hadzopoulou-Cladaras M, MooreDD. 2000. The orphan nuclear receptor SHP inhibits hepa-tocyte nuclear factor 4 and retinoid X receptor transactiva-tion: two mechanisms for repression. Mol Cell Biol 20: 187–195.
Lefterova MI, Zhang Y, Steger DJ, Schupp M, Schug J, CristanchoA, Feng D, Zhuo D, Stoeckert CJ Jr, Liu XS, et al. 2008.PPARg and C/EBP factors orchestrate adipocyte biology viaadjacent binding on a genome-wide scale. Genes Dev 22:2941–2952.
Lehmann JM, Moore LB, Smith-Oliver TA, Wilkison WO, WillsonTM, Kliewer SA. 1995. An antidiabetic thiazolidinedione isa high affinity ligand for peroxisome proliferator-activatedreceptor g (PPARg). J Biol Chem 270: 12953–12956.
Li Y, Lazar MA. 2002. Differential gene regulation by PPARg
agonist and constitutively active PPARg2. Methods Enzymol16: 1040–1048.
Li M, Pascual G, Glass CK. 2000. Peroxisome proliferator-activated receptor g-dependent repression of the induciblenitric oxide synthase gene. Mol Cell Biol 20: 4699–4707.
Li W, Notani D, Ma Q, Tanasa B, Nunez E, Chen AY, MerkurjevD, Zhang J, Ohgi K, Song X, et al. 2013. Functional roles ofenhancer RNAs for oestrogen-dependent transcriptional ac-tivation. Nature 498: 516–520.
Maeda N, Takahashi M, Funahashi T, Kihara S, Nishizawa H,Kishida K, Nagaretani H, Matsuda M, Komuro R, Ouchi N,et al. 2001. PPARg ligands increase expression and plasmaconcentrations of adiponectin, an adipose-derived protein.Diabetes 50: 2094–2099.
Manna PR, Stocco DM. 2007. Crosstalk of CREB and Fos/Jun ona single cis-element: transcriptional repression of the ste-roidogenic acute regulatory protein gene. J Mol Endocrinol
39: 261–277.Melo CA, Drost J, Wijchers PJ, van de Werken H, de Wit E, Oude
Vrielink JA, Elkon R, Melo SA, Leveille N, Kalluri R, et al.2013. eRNAs are required for p53-dependent enhancer acti-vity and gene transcription. Mol Cell 49: 524–535.
Moyers JS, Shiyanova TL, Mehrbod F, Dunbar JD, Noblitt TW,Otto KA, Reifel-Miller A, Kharitonenkov A. 2007. Moleculardeterminants of FGF-21 activity–synergy and cross-talk withPPARg signaling. J Cell Physiol 210: 1–6.
Nielsen R, Pedersen TA, Hagenbeek D, Moulos P, Siersbaek R,Megens E, Denissov S, Borgesen M, Francoijs KJ, Mandrup S,
et al. 2008. Genome-wide profiling of PPARg:RXR and RNApolymerase II occupancy reveals temporal activation ofdistinct metabolic pathways and changes in RXR dimercomposition during adipogenesis. Genes Dev 22: 2953–2967.
Nolan JJ, Ludvik B, Beerdsen P, Joyce M, Olefsky J. 1994.Improvement in glucose tolerance and insulin resistance inobese subjects treated with troglitazone. N Engl J Med 331:1188–1193.
Ohno H, Shinoda K, Spiegelman BM, Kajimura S. 2012. PPARg
agonists induce a white-to-brown fat conversion throughstabilization of PRDM16 protein. Cell Metab 15: 395–404.
Pascual G, Fong AL, Ogawa S, Gamliel A, Li AC, Perissi V,Rose DW, Willson TM, Rosenfeld MG, Glass CK. 2005. ASUMOylation-dependent pathway mediates transrepres-sion of inflammatory response genes by PPAR-g. Nature437: 759–763.
Pascual-Garcia M, Rue L, Leon T, Julve J, Carbo JM, Matalonga J,Auer H, Celada A, Escola-Gil JC, Steffensen KR, et al. 2013.Reciprocal negative cross-talk between liver X receptors(LXRs) and STAT1: effects on IFN-g-induced inflammatoryresponses and LXR-dependent gene expression. J Immunol
190: 6520–6532.Quinlan AR, Hall IM. 2010. BEDTools: a flexible suite of utilities
for comparing genomic features. Bioinformatics 26: 841–842.
Rangwala SM, Lazar MA. 2004. Peroxisome proliferator-acti-vated receptor g in diabetes and metabolism. Trends Phar-macol Sci 25: 331–336.
Rival Y, Stennevin A, Puech L, Rouquette A, Cathala C,Lestienne F, Dupont-Passelaigue E, Patoiseau JF, Wurch T,Junquero D. 2004. Human adipocyte fatty acid-binding pro-tein (aP2) gene promoter-driven reporter assay discriminatesnonlipogenic peroxisome proliferator-activated receptor g li-gands. J Pharmacol Exp Ther 311: 467–475.
Robinson MD, McCarthy DJ, Smyth GK. 2010. edgeR: a Bio-conductor package for differential expression analysis ofdigital gene expression data. Bioinformatics 26: 139–140.
Rong JX, Klein JL, Qiu Y, Xie M, Johnson JH, Waters KM,Zhang V, Kashatus JA, Remlinger KS, Bing N, et al. 2011.Rosiglitazone induces mitochondrial biogenesis in differen-tiated murine 3T3-L1 and C3H/10T1/2 adipocytes. PPARRes 2011: 179454.
Rosen ED, Sarraf P, Troy AE, Bradwin G, Moore K, Milstone DS,Spiegelman BM, Mortensen RM. 1999. PPARg is required forthe differentiation of adipose tissue in vivo and in vitro. MolCell 4: 611–617.
Schimke RT, Doyle D. 1970. Control of enzyme levels in animaltissues. Annu Rev Biochem 39: 929–976.
Schmidt SF, Jorgensen M, Chen Y, Nielsen R, Sandelin A,Mandrup S. 2011. Cross species comparison of C/EBPa andPPARg profiles in mouse and human adipocytes revealsinterdependent retention of binding sites. BMC Genomics12: 152.
Sears DD, Hsiao A, Ofrecio JM, Chapman J, He W, Olefsky JM.2007. Selective modulation of promoter recruitment andtranscriptional activity of PPARg. Biochem Biophys ResCommun 364: 515–521.
Spiegelman BM, Green H. 1980. Control of specific proteinbiosynthesis during the adipose conversion of 3T3 cells.J Biol Chem 255: 8811–8818.
Steger DJ, Lefterova MI, Ying L, Stonestrom AJ, Schupp M, ZhuoD, Vakoc AL, Kim JE, Chen J, Lazar MA, et al. 2008. DOT1L/KMT4 recruitment and H3K79 methylation are ubiquitouslycoupled with gene transcription in mammalian cells. MolCell Biol 28: 2825–2839.
TZDs redistribute adipocyte enhancer transcription
GENES & DEVELOPMENT 1027
Cold Spring Harbor Laboratory Press on April 13, 2018 - Published by genesdev.cshlp.orgDownloaded from
Steppan CM, Bailey ST, Bhat S, Brown EJ, Banerjee RR, WrightCM, Patel HR, Ahima RS, Lazar MA. 2001. The hormoneresistin links obesity to diabetes. Nature 409: 307–312.
Tontonoz P, Hu E, Graves RA, Budavari AI, Spiegelman BM.1994a. mPPARg2: tissue-specific regulator of an adipocyteenhancer. Genes Dev 8: 1224–1234.
Tontonoz P, Hu E, Spiegelman BM. 1994b. Stimulation ofadipogenesis in fibroblasts by PPARg2, a lipid-activated tran-scription factor. Cell 79: 1147–1156.
Vernochet C, Peres SB, Davis KE, McDonald ME, Qiang L, WangH, Scherer PE, Farmer SR. 2009. C/EBPa and the corepres-sors CtBP1 and CtBP2 regulate repression of select visceralwhite adipose genes during induction of the brown pheno-type in white adipocytes by peroxisome proliferator-acti-vated receptor g agonists. Mol Cell Biol 29: 4714–4728.
Wang D, Garcia-Bassets I, Benner C, Li W, Su X, Zhou Y, Qiu J,Liu W, Kaikkonen MU, Ohgi KA, et al. 2011. Reprogram-ming transcription by distinct classes of enhancers function-ally defined by eRNA. Nature 474: 390–394.
Westin S, Kurokawa R, Nolte RT, Wisely GB, McInerney EM,Rose DW, Milburn MV, Rosenfeld MG, Glass CK. 1998.Interactions controlling the assembly of nuclear-receptorheterodimers and co-activators. Nature 395: 199–202.
Wrann CD, Eguchi J, Bozec A, Xu Z, Mikkelsen T, Gimble J,Nave H, Wagner EF, Ong SE, Rosen ED. 2012. FOSL2 pro-motes leptin gene expression in human and mouse adipo-cytes. J Clin Invest 122: 1010–1021.
Yang Q, Graham TE, Mody N, Preitner F, Peroni OD, ZabolotnyJM, Kotani K, Quadro L, Kahn BB. 2005. Serum retinolbinding protein 4 contributes to insulin resistance in obesityand type 2 diabetes. Nature 436: 356–362.
Zhang Z, Teng CT. 2001. Estrogen receptor a and estrogenreceptor-related receptor a1 compete for binding and coac-tivator. Mol Cell Endocrinol 172: 223–233.
Step et al.
1028 GENES & DEVELOPMENT
Cold Spring Harbor Laboratory Press on April 13, 2018 - Published by genesdev.cshlp.orgDownloaded from
10.1101/gad.237628.114Access the most recent version at doi: 28:2014, Genes Dev.
Sonia E. Step, Hee-Woong Lim, Jill M. Marinis, et al.
-driven enhancersγredistributing transcription to PPARAnti-diabetic rosiglitazone remodels the adipocyte transcriptome by
Material
Supplemental
http://genesdev.cshlp.org/content/suppl/2014/04/29/28.9.1018.DC1
References
http://genesdev.cshlp.org/content/28/9/1018.full.html#ref-list-1
This article cites 65 articles, 21 of which can be accessed free at:
License
Commons Creative
.http://creativecommons.org/licenses/by-nc/4.0/at Creative Commons License (Attribution-NonCommercial 4.0 International), as described
). After six months, it is available under ahttp://genesdev.cshlp.org/site/misc/terms.xhtmlsix months after the full-issue publication date (see This article is distributed exclusively by Cold Spring Harbor Laboratory Press for the first
ServiceEmail Alerting
click here.right corner of the article or
Receive free email alerts when new articles cite this article - sign up in the box at the top
© 2014 Step et al.; Published by Cold Spring Harbor Laboratory Press
Cold Spring Harbor Laboratory Press on April 13, 2018 - Published by genesdev.cshlp.orgDownloaded from
Related Documents