Anthropometry, CT, and DXA as predictors of GH deficiency in premenopausal women: ROC curve analysis Miriam A. Bredella 1 , Andrea L. Utz 2 , Martin Torriani 1 , Bijoy Thomas 1 , David A. Schoenfeld 3 , Karen K. Miller 2 1 Department of Radiology, Massachusetts General Hospital, Yawkey 6 E, 55 Fruit Street Boston, MA 02114 2 Neuroendocrine Unit, Massachusetts General Hospital, Bulfinch 457B, 55 Fruit Street Boston, MA 02114 3 Department of Biostatistics, Massachusetts General Hospital, 50 Staniford Street - Suite 560, Boston, MA 02114 Corresponding author: Miriam A. Bredella Department of Radiology, Yawkey 6E, 55 Fruit Street Boston, MA 02114 Phone: 617-726-7717 Fax: 617-726-5282 E-mail: [email protected] Running head: Body composition predictors of GH deficiency Articles in PresS. J Appl Physiol (December 18, 2008). doi:10.1152/japplphysiol.90998.2008 Copyright © 2008 by the American Physiological Society. by 10.220.33.1 on August 16, 2016 http://jap.physiology.org/ Downloaded from

Welcome message from author
This document is posted to help you gain knowledge. Please leave a comment to let me know what you think about it! Share it to your friends and learn new things together.
Transcript
Anthropometry, CT, and DXA as predictors of GH deficiency in premenopausal
women: ROC curve analysis
Miriam A. Bredella1, Andrea L. Utz2, Martin Torriani1, Bijoy Thomas1, David A.
Schoenfeld3, Karen K. Miller2
1Department of Radiology, Massachusetts General Hospital, Yawkey 6 E, 55 Fruit Street
Boston, MA 02114
2Neuroendocrine Unit, Massachusetts General Hospital, Bulfinch 457B, 55 Fruit Street
Boston, MA 02114
3Department of Biostatistics, Massachusetts General Hospital, 50 Staniford Street - Suite
560, Boston, MA 02114
Corresponding author:
Miriam A. Bredella
Department of Radiology, Yawkey 6E, 55 Fruit Street
Boston, MA 02114
Phone: 617-726-7717
Fax: 617-726-5282
E-mail: [email protected]
Running head: Body composition predictors of GH deficiency
Articles in PresS. J Appl Physiol (December 18, 2008). doi:10.1152/japplphysiol.90998.2008
Copyright © 2008 by the American Physiological Society.
by 10.220.33.1 on August 16, 2016
http://jap.physiology.org/D
ownloaded from
1
Abstract
Visceral adiposity is a strong determinant of GH secretion and states of GH deficiency
are associated with increased visceral adiposity, and decreased lean body mass. The
purpose of our study was to determine the sensitivity and specificity of different methods
of assessing body composition (anthropometry, DXA, and CT) to predict GH deficiency
in premenopausal women and threshold values for each technique to predict GH
deficiency, using ROC curve analysis. We studied a group of 45 healthy lean,
overweight, and obese premenopausal women who underwent anthropometric
measurements (BMI, waist and hip circumferences, skin fold thickness), DXA, CT and a
GHRH-arginine stimulation test. ROC curve analysis was used to determine cut-off
values for each method to identify GH deficiency. Visceral adiposity measured by CT
showed the highest sensitivity and specificity for identifying subjects with GH deficiency
with a cut-off of >9962 mm2 (AUC: 0.95, sensitivity:100%, specificity:77.8%,
p=0.0001). Largest waist circumference showed high sensitivity and specificity with a
cut-off of >101.7 cm (AUC: 0.89, sensitivity:88.9%, specificity:75%, p=0.0001). When
comparing the ROC curves of visceral fat measured by CT and largest waist
circumference, the difference between the two methods was not statistically significant
(p=0.36). Our study showed that the largest waist circumference predicts the presence of
GH deficiency in healthy premenopausal women with high sensitivity and specificity and
nearly as well as CT measurement of visceral adiposity. It can be used to identify women
in whom GH deficiency is likely and therefore in whom formal GH stimulation testing
might be indicated.
by 10.220.33.1 on August 16, 2016
http://jap.physiology.org/D
ownloaded from

2
Keywords: obesity, body composition, Growth Hormone deficiency, waist
circumference, ROC curve analysis
by 10.220.33.1 on August 16, 2016
http://jap.physiology.org/D
ownloaded from
3
Introduction
Obesity is highly prevalent in the western world, and visceral adiposity is an independent
predictor of metabolic complications such as dyslipidemia, type 2 diabetes and
cardiovascular disease (25, 35). Prior studies have established that visceral adiposity is a
strong determinant of growth hormone (GH) secretion (11, 31, 32), and that GH plays a
role in modulating body composition. States of GH deficiency are associated with
increased body fat, including visceral adiposity, and decreased lean body mass (10, 14);
whereas states of GH excess are associated with decreased body fat and increased lean
body mass (4).
The GHRH-arginine stimulation test is a sensitive and specific test for diagnosing GH
deficiency, and a cut-off limit of 5 ng/ml has been used to diagnose GH deficiency in
adults (6). However, this test is invasive, time-consuming, and expensive. Should GH
deficiency be determined to be a treatable condition in young women with visceral
adiposity, it would be useful to be able to perform a simple body composition
measurement to identify subjects who may be at risk for GH deficiency and for whom
formal GH simulation testing may be more likely to yield a positive result. Computed
tomography (CT) can quantify visceral and subcutaneous fat depots (7) and is the gold
standard for measuring visceral fat. However, it is expensive and involves radiation
exposure. Several clinical methods, including anthropometry, and dual energy X-ray
absorptiometry (DXA), have been used as surrogates for estimating body fat (8, 15, 19,
by 10.220.33.1 on August 16, 2016
http://jap.physiology.org/D
ownloaded from
4
20, 27, 28, 34), but these measurements do not allow for the evaluation of visceral fat
content. The purpose of our study was to compare sensitivity and specificity of simple
less invasive measures of body composition, such as anthropometry to CT and DXA to
predict GH deficiency in a group of lean, overweight, and obese premenopausal women.
In addition, we wanted to determine threshold values for each technique to predict GH
deficiency, using receiver operator characteristic (ROC) curve analysis.
by 10.220.33.1 on August 16, 2016
http://jap.physiology.org/D
ownloaded from
5
Materials and Methods
The study was approved by the institutional review board of Partners Healthcare Inc. and
was Health Insurance Portability and Accountability Act compliant. Written informed
consent was obtained from all subjects prior to the study.
Subjects
The study group comprised 45 healthy premenopausal women who were recruited from
the community through advertisements. Exclusion criteria included hypothalamic or
pituitary disorders, diabetes mellitus or other chronic illnesses, estrogen or glucocorticoid
use and weight greater than 280 pounds (due to the limitations of the DXA and CT
scanners). Participants were admitted to the General Clinical Research Center at the
Massachusetts General Hospital, where testing was performed. Each participant
underwent anthropometric measurements, DXA, and CT, as detailed below, and a
GHRH-arginine stimulation test. For the GHRH-arginine stimulation test, GHRH 1
mcg/kg plus arginine 0.5 g/kg (maximum 30 gm) IV were administered and GH levels
drawn at baseline and every 30 minutes for two hours (6). GH deficiency was based on
standard criteria used to diagnose adults with hypopituitarism (peak GH after stimulation
with GHRH and arginine <5ng/ml) (6). Clinical characteristics, peak GH after GHRH-
arginine stimulation, and fat mass, measured by DXA, have been previously published
(29, 30).
Biochemical Analyses
by 10.220.33.1 on August 16, 2016
http://jap.physiology.org/D
ownloaded from
6
Serum samples were collected and stored at -80˚ C. Serum GH was measured using an
immunoradiometric assay (IRMA) kit, with a minimum detection limit of 0.01 ng/ml, an
intra-assay coefficient of variation (cv) of 3.1-5.4% and an inter-assay cv of 5.9-11.5%.
Anthropometry
Body weight was measured at a standard balance beam scale to the nearest 0.1 kg in
triplicate and averaged. Height was measured barefoot to the nearest 0.1cm in triplicate
and averaged. Body mass index (BMI) was calculated as weight divided by height
squared (kg/m2).
Skin fold thickness of the triceps, biceps, subscapular and suprailiac areas was measured
using metal calipers in triplicate and averaged. Skin fold measurements were used to
estimate % body fat.
Body circumferences were measured at the waist at the smallest circumference between
the lowest rib and iliac crest, at the level of the umbilicus, the midpoint between the
lowest rib and iliac crest, the iliac crest, and at the hip using a metal tape to the nearest
0.1 cm in triplicate and averaged. The largest circumference represents the largest value
obtained from the above measures. Iliac waist-to-hip and largest hip-to-waist ratios were
determined from the circumferential measurements of the waist at the level of the
umbilicus and the hips at the level of the iliac crest taken with the patient in a standing
position.
by 10.220.33.1 on August 16, 2016
http://jap.physiology.org/D
ownloaded from
7
All measurements were performed by research bionutritionists who had been previously
trained and certified to perform these procedures.
Dual X-ray Absorptiometry
DXA measurements of body composition were performed using a Hologic QDR 4500
scanner (Hologic Inc., Waltham, MA). The following parameters were obtained: % fat of
the right and left upper and lower extremities, % trunk fat, and total % body fat. In
addition, the amount of fat (in g) of the upper and lower extremities, trunk, and total body
was obtained. Coefficients of variation of DXA have been reported as 3% for body fat
mass (21).
Computed Tomography (CT)
Each subject underwent cross-sectional CT scan of the abdomen at the level of L4.
Assessment of visceral and subcutaneous abdominal fat compartments by single-slice CT
image of the abdomen was performed. Patients were placed supine, feet first in the
scanner and with flexion of the knees to minimize lumbar lordosis. A lateral scout image
was obtained to identify the level of L4, which served as the landmark for the single slice
image. Scan parameters for each image were standardized (144 table height, 80kV, 70
mA, 2 seconds, 1 cm slice thickness, 48 FOV). Fat attenuation coefficients were set at
-50 to -250 HU as described by Borkan et al. (7). Total abdominal cross-sectional area
was computed by outlining the outer contour of the abdomen. A second outline of the
back and abdominal wall musculature (inner contour) was used to define the
subcutaneous fat area. Visceral abdominal fat was defined as the area within the inner
by 10.220.33.1 on August 16, 2016
http://jap.physiology.org/D
ownloaded from
8
contour comprising all pixels with attenuation coefficients between -50 and -250 HU.
The total fat area was calculated as the sum of subcutaneous fat and visceral abdominal
fat. These values were used to calculate area of subcutaneous adipose tissue, visceral
adipose tissue and total adipose tissue.
Statistical analysis
JMP Statistical Discoveries (version 4.0.2, SAS Institute, Inc., Cary, NC) and MedCalc
(version 9.2.1.0, MedCalc, Mariakerke, Belgium) were used for statistical analysis. The
means and standard deviations (SD) were calculated and groups were compared using the
Student’s t-test. ROC curve analysis of different methods of body composition
measurements was performed to determine sensitivity and specificity, area under the
ROC curve, confidence intervals (CI) as well as cut-off values for each method to detect
GH deficiency.
Since this was an exploratory study we did not perform a validation study. However, we
performed a cross validated error estimate to determine the error estimate for each
measure.
Power calculation: The t-test power was used to approximate the power of the ROC curve
test. With a proposed sample size of 9 for the GH deficient and 36 for the GH sufficient
group, the study will have a power of 82.3% to yield a statistically significant result, that
the area under the ROC curve is greater than 0.5. This computation assumes that the
mean difference is 1.1 (corresponding to means of 1.1 versus 0.0) and the common
within-group standard deviation is 1.0.
by 10.220.33.1 on August 16, 2016
http://jap.physiology.org/D
ownloaded from
9
Results
Clinical Characteristics of Study Subjects
Subject characteristics are shown in Table 1. Study participants ranged from 19-45 years,
mean 33±8.3 years (SD). Study participants ranged in BMI from 19.2 to 43.6 kg/m2,
mean 30.9±6.5 kg/m2 (SD) and were categorized as lean (n=10) if BMI < 25 kg/m2,
overweight (n=12) if BMI ≥ 25 kg/m2 and < 30 kg/m2, and obese (n=23) if BMI ≥30
kg/m2, based on WHO definitions (1). Nine patients had GH deficiency as determined by
the GHRH-arginine stimulation test, and 36 subjects were GH sufficient. Subjects with
GH deficiency were slightly older and had higher weight, BMI, total, subcutaneous and
visceral fat, as determined by CT, compared to the GH sufficient subjects. Clinical
characteristics of the two groups are shown in Table 2.
Body composition determinants of GH deficiency
Results of ROC curve analyses are summarized in Table 3. On the basis of ROC curves,
visceral adiposity measured by CT showed the highest sensitivity and specificity for
identifying subjects with GH deficiency. The area under the curve (AUC) was 0.95 and
with a cut-off value of >9962 mm2, sensitivity was 100% and specificity was 77.8%
(p=0.0001). Sensitivity and specificity of the cross validated error estimate were 89% and
75%, respectively. The largest waist circumference was the umbilical waist
circumference in 75% of patients. Largest waist circumference showed high sensitivity
and specificity when a cut-off value of >101.7 cm was used (AUC: 0.89, sensitivity
88.9%, specificity 75%, p=0.0001). Sensitivity and specificity of the cross validated error
by 10.220.33.1 on August 16, 2016
http://jap.physiology.org/D
ownloaded from
10
estimate were 67% and 72%, respectively. Using a cut-off value of >80cm for largest
waist circumference as used to diagnose metabolic syndrome by the International
Diabetes Federation (3), sensitivity was 100% but specificity was only 9%. Using a cut-
off value of >88cm for the largest waist circumference as proposed by Lean at al (18) to
determine visceral adiposity, sensitivity was 100% but specificity dropped to 25%. When
comparing the ROC curves of visceral fat measured by CT and largest waist
circumference (cut-off value of >101.7cm), the difference between the two methods was
not statistically significant (p=0.36) (Figure 1).
Determination of total and trunk fat content as measured by DXA showed an AUC of
0.87 and 0.88 with sensitivity of 100% and specificity of 69.4% and 66.7% , respectively,
when using a cut-off value of >16246g and >31677g, respectively (p=0.0001). Sensitivity
and specificity of the cross validated error estimate were 67% and 64%, respectively for
total fat and 67% and 67%, respectively, for trunk fat. Comparing ROC curves of visceral
fat measured by CT and trunk fat (g) measured by DXA, the difference between the two
methods was not statistically significant (p=0.36). The largest waist-to-hip ratio
demonstrated an AUC of 0.85 and sensitivity was 100% and specificity was 66.6% when
a cut-off value of >0.85 was used (p= 0.0001). Sensitivity and specificity of the cross
validated error estimate were 67% and 57%, respectively. Comparing the ROC curves of
visceral fat as measured by CT and largest hip to waist ratio, the difference between the
two methods was not statistically significant (p=0.3).
by 10.220.33.1 on August 16, 2016
http://jap.physiology.org/D
ownloaded from
11
Discussion
Our study showed that the largest waist circumference can predict GH deficiency in
premenopausal women and that this measurement is almost as sensitive and specific for
predicting GH deficiency as visceral fat measured by abdominal CT. These data may be
of importance if further research confirms the association of GH deficiency with
increased cardiovascular risk.
An increased prevalence of visceral adiposity and cardiovascular events has been
established in women with GH deficiency due to hypopituitarism. Studies have shown
that decreased GH secretion is an independent risk factor for visceral obesity and
cardiovascular disease in this patient population. Higher cardiovascular mortality in
female GH deficient patients than in males has been found (9, 24). This may reflect a
relatively more severe state of GH deficiency in women compared with men, as GH
secretion is nearly twice as high in young, healthy women as in men (11). Therefore, we
focused our study on healthy overweight and obese women and the relationship between
visceral adiposity and GH deficiency in this patient population.
Multiple studies have demonstrated decreases in visceral adiposity, without a change in
overall weight or BMI in GH deficient patients during physiologic GH administration (5,
15). Although not FDA approved for clinical use, GH replacement has been studied in
subjects with visceral adiposity without pituitary or hypothalamic disease, and may
improve insulin sensitivity over time, potentially due to adipose reduction. In a study by
by 10.220.33.1 on August 16, 2016
http://jap.physiology.org/D
ownloaded from
12
Johannsson et al. (17), administration of low-dose GH to obese men resulted in decreased
visceral fat mass, suggesting a possible therapeutic role for GH in patients with visceral
obesity. In a study evaluating GH administration in obese postmenopausal women (12),
12 months of GH administration reduced the amount of visceral fat and increased thigh
muscle mass, whereas no change in subcutaneous adipose tissue was observed.
Therefore, if further research confirms these effects, it might be useful to develop
diagnostic tools in order to identify subjects with visceral adiposity who might be at risk
for being GH deficient and in whom formal GH stimulation testing should be performed.
Sophisticated imaging modalities such as CT or MRI are able to distinguish visceral from
subcutaneous fat with a high level of precision, but these methods are expensive, time
consuming, and CT involves radiation exposure (2, 26). Simple anthropometric variables
such as waist circumference and waist-to-hip ratio have been used to estimate visceral
adipose tissue. Several studies have indicated that the waist circumference is strongly
related to health risks associated with obesity and that it correlates with visceral fat
measured by CT (13, 16). Our study showed that the largest waist circumference is an
easy and reliable method that can predict GH deficiency in premenopausal women. Waist
circumferences can be measured at several locations. In our study, the waist
circumference measured at the umbilicus corresponded in 75% of study participants to
the largest waist circumference. Visceral adiposity measured with CT showed a higher
sensitivity and specificity in detecting GH deficiency than largest waist circumference.
However, the difference between the two methods was not statistically significant. On the
basis of ROC curves, the most sensitive and specific cut-off was >102 cm in women for
by 10.220.33.1 on August 16, 2016
http://jap.physiology.org/D
ownloaded from
13
largest waist circumference. Current guidelines suggest a cut-off of >88 cm in women on
the basis of detecting many metabolic risk factors (16). In our study, the specificity of
detecting GH deficiency dropped from 75% to 25% when using 88cm as a cut-off. The
International Diabetes Federation suggests a cut-off value for largest waist circumference
of >80 cm to diagnose metabolic syndrome. Using this cut-off value, the specificity in
our study dropped to 9%. In a study by Wahrenberg et al (33) a cut-off of >100 cm was
sensitive and specific for predicting insulin resistance in men and women. Based on our
data, a waist circumference of >102 cm in premenopausal women provides a useful
reference value to identify obese women who may be at risk for GH deficiency and who
should undergo formal GH stimulation testing.
In our study, BMI and iliac waist-to-hip ratio measurements showed low sensitivity and
specificity in predicting GH deficiency. Trunk and total fat as determined by DXA
showed high sensitivity and specificity in detecting GH deficiency. However, sensitivity
and specificity were higher for the largest waist circumference. In addition, DXA requires
radiation exposure. As expected, skin fold measurements did not predict GH deficiency
in our population. We performed skin fold thickness measurements of the triceps, bceps,
subscapular, and suprailiac areas to present the complete spectrum of anthropometric
measurements.
Our study had several limitations. First is the relatively small number of subjects who
were GH deficient (n=9) compared to the GH sufficient subjects (n=36). Second, we only
studied premenopausal women. There are sex- and age-related differences in the relation
of waist measurement to accumulation of visceral adipose tissue (22, 23). Thus, it is
by 10.220.33.1 on August 16, 2016
http://jap.physiology.org/D
ownloaded from
14
likely that different cut-off values for waist circumference as predictors of GH deficiency
would be found in pre and postmenopausal women and in men. We also did not perform
a validation study to test the proposed cut-off values derived in our study in a different
population. However, we performed a cross validated error estimate which confirmed our
cut-off values. Without a larger sample size and without appropriate cross validation data
our cut-off values for waist circumference should be viewed with caution until results of
larger studies have become available. Since there were only 9 cases in our sample,
estimates of sensitivity would have a standard error of 13% (calculated at 80%
sensitivity). A measured sensitivity of 100% would have a 95% lower confidence bound
of 72%. For many clinical applications this is not adequate and further validation studies
in larger patient populations should be performed.
In conclusion, the largest waist circumference predicts the presence of GH deficiency in
premenopausal women without hypothalamic or pituitary disease with high sensitivity
and specificity and nearly as well as CT measurement of visceral adiposity. This provides
further evidence of the importance of visceral fat mass as a predictor and possible
mechanism for GH deficiency in young healthy women. GH replacement has not been
established to be a safe and effective treatment for young overweight or obese women
and is not FDA approved. However, should GH deficiency be established to have
important cardiovascular risk or metabolic consequences in the future, we raise the
possibility that a simple test that can be performed in any office with a tape measure
might be able to identify women in whom GH deficiency is likely and therefore in whom
formal GH stimulation testing might be indicated.
by 10.220.33.1 on August 16, 2016
http://jap.physiology.org/D
ownloaded from

15
Grants
This work was supported in part by the following grants: HL077674, MO1 RR01066, and
K23RR23090
by 10.220.33.1 on August 16, 2016
http://jap.physiology.org/D
ownloaded from
16
References
1. Obesity: preventing and managing the global epidemic. Report of a WHO consultation. World Health Organ Tech Rep Ser 894: i-xii, 1-253, 2000. 2. Abate N, Burns D, Peshock RM, Garg A, and Grundy SM. Estimation of adipose tissue mass by magnetic resonance imaging: validation against dissection in human cadavers. J Lipid Res 35: 1490-1496, 1994. 3. Alberti KG, Zimmet P, and Shaw J. The metabolic syndrome--a new worldwide definition. Lancet 366: 1059-1062, 2005. 4. Bengtsson BA, Brummer RJ, Eden S, and Bosaeus I. Body composition in acromegaly. Clin Endocrinol (Oxf) 30: 121-130, 1989. 5. Bengtsson BA, Eden S, Lonn L, Kvist H, Stokland A, Lindstedt G, Bosaeus I, Tolli J, Sjostrom L, and Isaksson OG. Treatment of adults with growth hormone (GH) deficiency with recombinant human GH. J Clin Endocrinol Metab 76: 309-317, 1993. 6. Biller BM, Samuels MH, Zagar A, Cook DM, Arafah BM, Bonert V, Stavrou S, Kleinberg DL, Chipman JJ, and Hartman ML. Sensitivity and specificity of six tests for the diagnosis of adult GH deficiency. J Clin Endocrinol Metab 87: 2067-2079, 2002. 7. Borkan GA, Gerzof SG, Robbins AH, Hults DE, Silbert CK, and Silbert JE. Assessment of abdominal fat content by computed tomography. Am J Clin Nutr 36: 172-177, 1982. 8. Bosaeus I, Johannsson G, Rosen T, Hallgren P, Tolli J, Sjostrom L, and Bengtsson BA. Comparison of methods to estimate body fat in growth hormone deficient adults. Clin Endocrinol (Oxf) 44: 395-402, 1996. 9. Bulow B, Hagmar L, Mikoczy Z, Nordstrom CH, and Erfurth EM. Increased cerebrovascular mortality in patients with hypopituitarism. Clin Endocrinol (Oxf) 46: 75-81, 1997. 10. Carrel AL and Allen DB. Effects of growth hormone on adipose tissue. J Pediatr Endocrinol Metab 13 Suppl 2: 1003-1009, 2000. 11. Clasey JL, Weltman A, Patrie J, Weltman JY, Pezzoli S, Bouchard C, Thorner MO, and Hartman ML. Abdominal visceral fat and fasting insulin are important predictors of 24-hour GH release independent of age, gender, and other physiological factors. J Clin Endocrinol Metab 86: 3845-3852, 2001. 12. Franco C, Brandberg J, Lonn L, Andersson B, Bengtsson BA, and Johannsson G. Growth hormone treatment reduces abdominal visceral fat in postmenopausal women with abdominal obesity: a 12-month placebo-controlled trial. J Clin Endocrinol Metab 90: 1466-1474, 2005. 13. Freiberg MS, Pencina MJ, D'Agostino RB, Lanier K, Wilson PW, and Vasan RS. BMI vs. waist circumference for identifying vascular risk. Obesity (Silver Spring) 16: 463-469, 2008. 14. Gerver WJ, De Bruin R, Delemarre v d Waal HA, Aldewereld B, Theunissen P, and Westerterp KR. Effects of discontinuation of growth hormone treatment on body composition and metabolism. Horm Res 53: 215-220, 2000. 15. Han TS and Lean ME. Bioelectrical impedance analysis in nutritional research. Nutrition 14: 707-708, 1998.
by 10.220.33.1 on August 16, 2016
http://jap.physiology.org/D
ownloaded from
17
16. Han TS, van Leer EM, Seidell JC, and Lean ME. Waist circumference action levels in the identification of cardiovascular risk factors: prevalence study in a random sample. Bmj 311: 1401-1405, 1995. 17. Johannsson G, Marin P, Lonn L, Ottosson M, Stenlof K, Bjorntorp P, Sjostrom L, and Bengtsson BA. Growth hormone treatment of abdominally obese men reduces abdominal fat mass, improves glucose and lipoprotein metabolism, and reduces diastolic blood pressure. J Clin Endocrinol Metab 82: 727-734, 1997. 18. Lean ME, Han TS, and Morrison CE. Waist circumference as a measure for indicating need for weight management. Bmj 311: 158-161, 1995. 19. Lukaski HC. Methods for the assessment of human body composition: traditional and new. Am J Clin Nutr 46: 537-556, 1987. 20. Mattsson S and Thomas BJ. Development of methods for body composition studies. Phys Med Biol 51: R203-228, 2006. 21. Mazess RB, Barden HS, Bisek JP, and Hanson J. Dual-energy x-ray absorptiometry for total-body and regional bone-mineral and soft-tissue composition. Am J Clin Nutr 51: 1106-1112, 1990. 22. Misra A, Wasir JS, and Vikram NK. Waist circumference criteria for the diagnosis of abdominal obesity are not applicable uniformly to all populations and ethnic groups. Nutrition 21: 969-976, 2005. 23. Molarius A, Seidell JC, Visscher TL, and Hofman A. Misclassification of high-risk older subjects using waist action levels established for young and middle-aged adults--results from the Rotterdam Study. J Am Geriatr Soc 48: 1638-1645, 2000. 24. Nilsson B, Gustavasson-Kadaka E, Bengtsson BA, and Jonsson B. Pituitary adenomas in Sweden between 1958 and 1991: incidence, survival, and mortality. J Clin Endocrinol Metab 85: 1420-1425, 2000. 25. Rexrode KM, Carey VJ, Hennekens CH, Walters EE, Colditz GA, Stampfer MJ, Willett WC, and Manson JE. Abdominal adiposity and coronary heart disease in women. Jama 280: 1843-1848, 1998. 26. Rossner S, Bo WJ, Hiltbrandt E, Hinson W, Karstaedt N, Santago P, Sobol WT, and Crouse JR. Adipose tissue determinations in cadavers--a comparison between cross-sectional planimetry and computed tomography. Int J Obes 14: 893-902, 1990. 27. Smith SR, Lovejoy JC, Greenway F, Ryan D, deJonge L, de la Bretonne J, Volafova J, and Bray GA. Contributions of total body fat, abdominal subcutaneous adipose tissue compartments, and visceral adipose tissue to the metabolic complications of obesity. Metabolism 50: 425-435, 2001. 28. Snijder MB, Visser M, Dekker JM, Seidell JC, Fuerst T, Tylavsky F, Cauley J, Lang T, Nevitt M, and Harris TB. The prediction of visceral fat by dual-energy X-ray absorptiometry in the elderly: a comparison with computed tomography and anthropometry. Int J Obes Relat Metab Disord 26: 984-993, 2002. 29. Utz A, Yamamoto A, Sluss P, Breu J, and Miller KK. Androgens May Mediate a Relative Preservation of IGF-1 Levels in Overweight and Obese Women Despite Reduced Growth Hormone Secretion. J Clin Endocrinol Metab, 2008. 30. Utz AL, Yamamoto A, Hemphill L, and Miller KK. Growth Hormone Deficiency by GHRH/arginine Testing Criteria Predicts Increased Cardiovascular Risk Markers in Normal Young Overweight and Obese Women. J Clin Endocrinol Metab, 2008.
by 10.220.33.1 on August 16, 2016
http://jap.physiology.org/D
ownloaded from
18
31. Vahl N, Jorgensen JO, Jurik AG, and Christiansen JS. Abdominal adiposity and physical fitness are major determinants of the age associated decline in stimulated GH secretion in healthy adults. J Clin Endocrinol Metab 81: 2209-2215, 1996. 32. Vahl N, Jorgensen JO, Skjaerbaek C, Veldhuis JD, Orskov H, and Christiansen JS. Abdominal adiposity rather than age and sex predicts mass and regularity of GH secretion in healthy adults. Am J Physiol 272: E1108-1116, 1997. 33. Wahrenberg H, Hertel K, Leijonhufvud BM, Persson LG, Toft E, and Arner P. Use of waist circumference to predict insulin resistance: retrospective study. Bmj 330: 1363-1364, 2005. 34. Wajchenberg BL. Subcutaneous and visceral adipose tissue: their relation to the metabolic syndrome. Endocr Rev 21: 697-738, 2000. 35. Zhang C, Rexrode KM, van Dam RM, Li TY, and Hu FB. Abdominal obesity and the risk of all-cause, cardiovascular, and cancer mortality: sixteen years of follow-up in US women. Circulation 117: 1658-1667, 2008.
by 10.220.33.1 on August 16, 2016
http://jap.physiology.org/D
ownloaded from
19
Figure legends
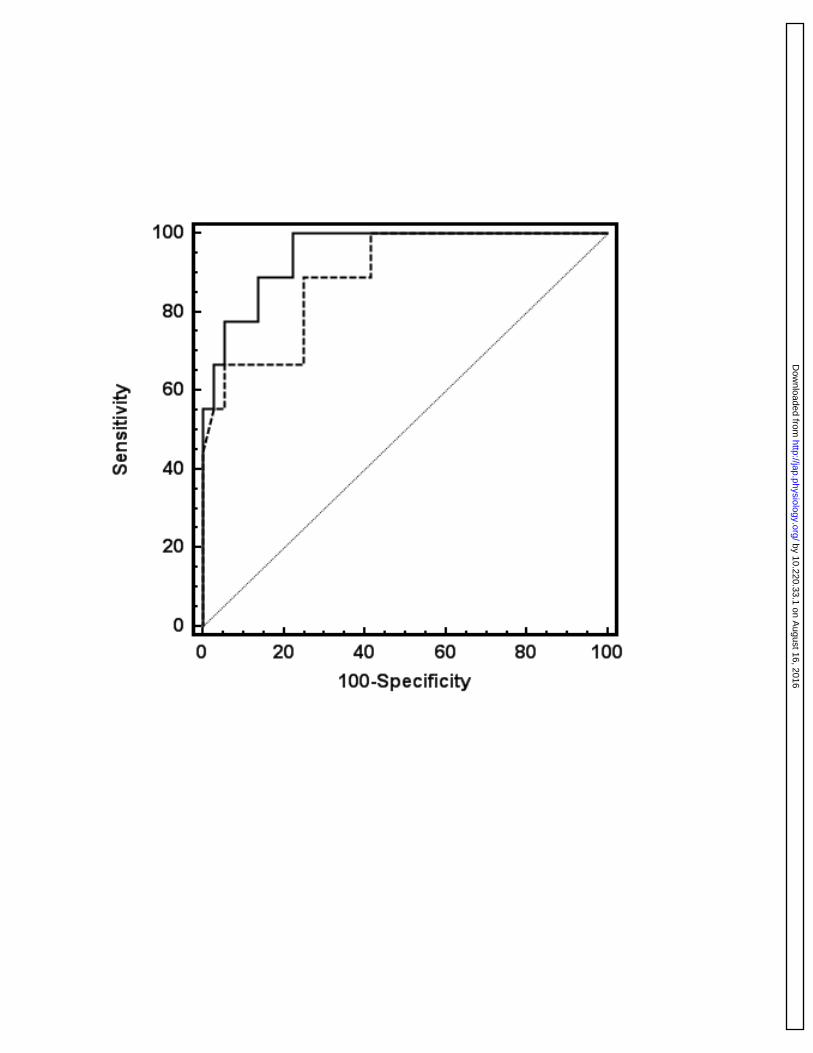
Figure 1: ROC curve of visceral fat measured by CT (solid line) and largest waist
circumference (dotted line) to detect GH deficiency. Although the AUC is larger for the
CT measurement, the difference is not significant (AUC CT: 0.95, AUC largest waist
circumference: 0.89, p=0.36).
by 10.220.33.1 on August 16, 2016
http://jap.physiology.org/D
ownloaded from
20
Table legends
Table 1: Clinical characteristics of all subjects.
Table 2: Clinical characteristics of GH deficient and GH sufficient subjects.
Table 3: ROC curve analysis of different body composition methods
by 10.220.33.1 on August 16, 2016
http://jap.physiology.org/D
ownloaded from
by 10.220.33.1 on August 16, 2016
http://jap.physiology.org/D
ownloaded from
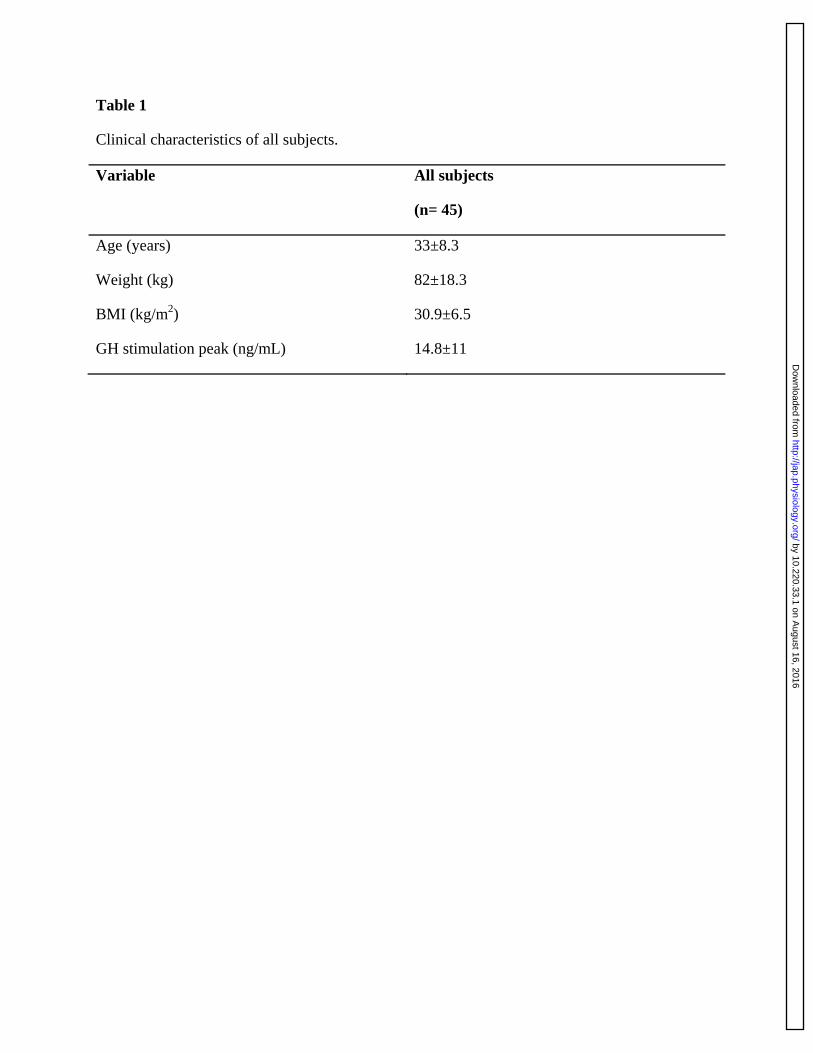
Table 1
Clinical characteristics of all subjects.
Variable All subjects
(n= 45)
Age (years) 33±8.3
Weight (kg) 82±18.3
BMI (kg/m2) 30.9±6.5
GH stimulation peak (ng/mL) 14.8±11
by 10.220.33.1 on August 16, 2016
http://jap.physiology.org/D
ownloaded from
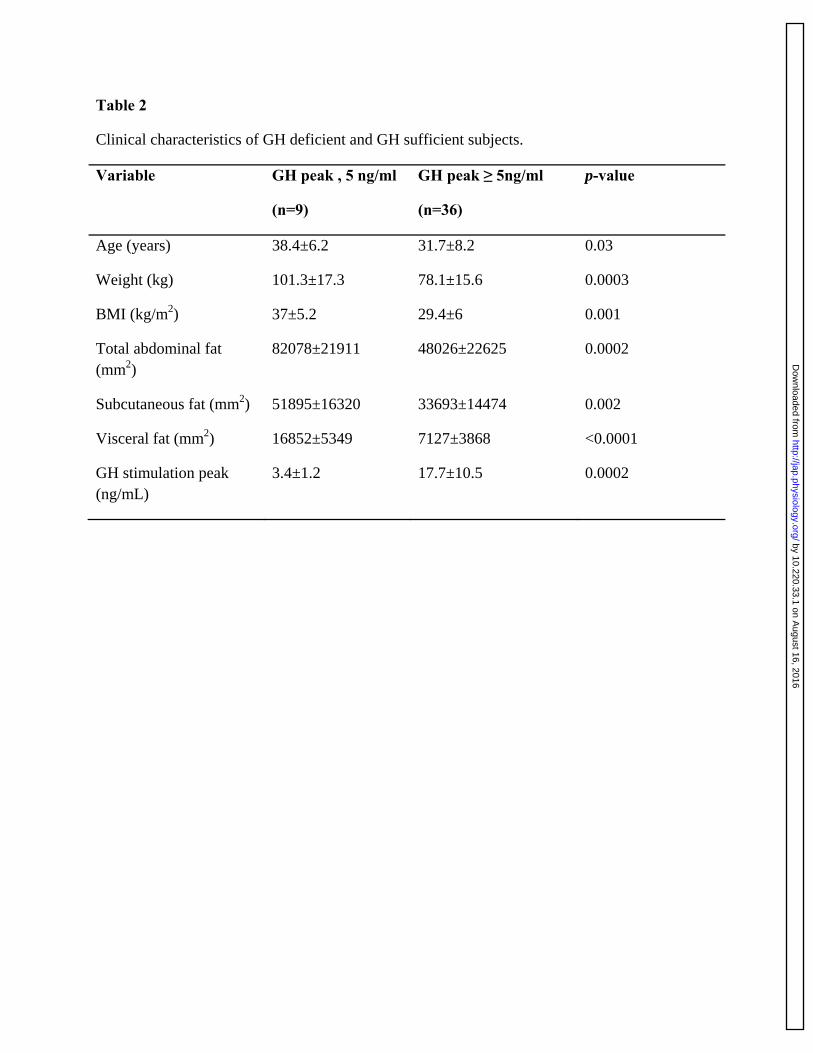
Table 2
Clinical characteristics of GH deficient and GH sufficient subjects.
Variable GH peak , 5 ng/ml
(n=9)
GH peak ≥ 5ng/ml
(n=36)
p-value
Age (years) 38.4±6.2 31.7±8.2 0.03
Weight (kg) 101.3±17.3 78.1±15.6 0.0003
BMI (kg/m2) 37±5.2 29.4±6 0.001
Total abdominal fat (mm2)
82078±21911 48026±22625 0.0002
Subcutaneous fat (mm2) 51895±16320 33693±14474 0.002
Visceral fat (mm2) 16852±5349 7127±3868 <0.0001
GH stimulation peak (ng/mL)
3.4±1.2 17.7±10.5 0.0002
by 10.220.33.1 on August 16, 2016
http://jap.physiology.org/D
ownloaded from
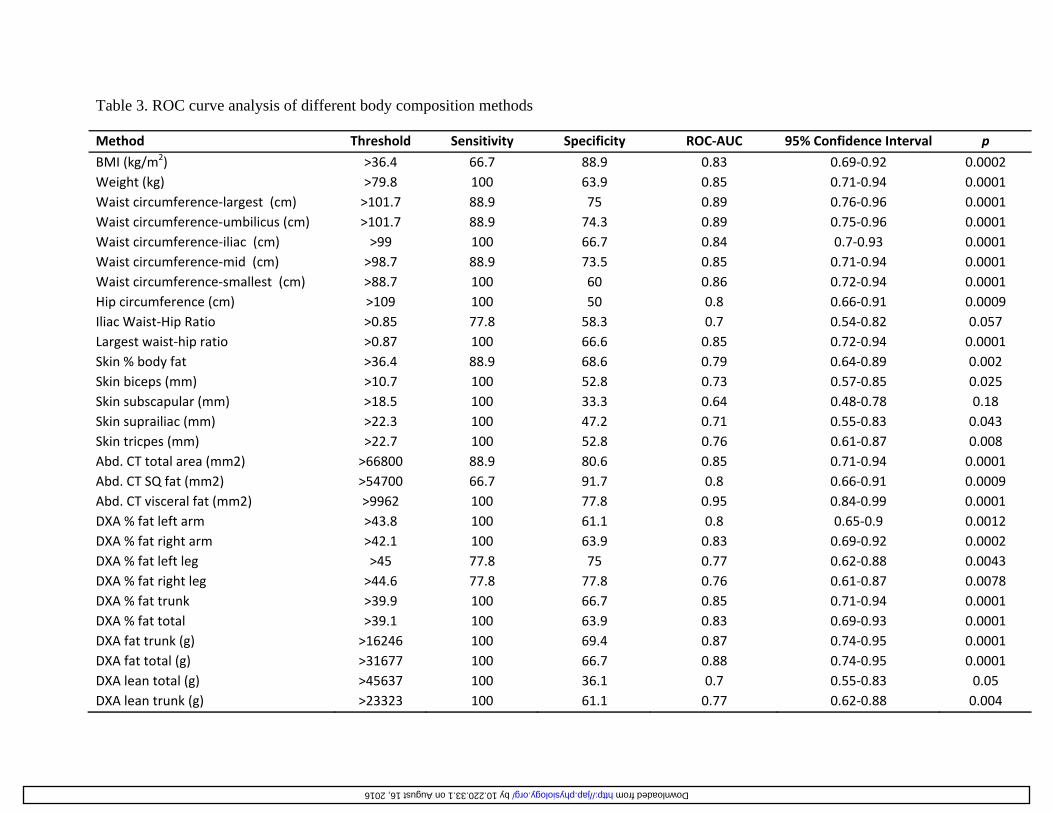
Table 3. ROC curve analysis of different body composition methods
Method Threshold Sensitivity Specificity ROC-AUC 95% Confidence Interval p
BMI (kg/m2) >36.4 66.7 88.9 0.83 0.69-0.92 0.0002 Weight (kg) >79.8 100 63.9 0.85 0.71-0.94 0.0001 Waist circumference-largest (cm) >101.7 88.9 75 0.89 0.76-0.96 0.0001 Waist circumference-umbilicus (cm) >101.7 88.9 74.3 0.89 0.75-0.96 0.0001 Waist circumference-iliac (cm) >99 100 66.7 0.84 0.7-0.93 0.0001 Waist circumference-mid (cm) >98.7 88.9 73.5 0.85 0.71-0.94 0.0001 Waist circumference-smallest (cm) >88.7 100 60 0.86 0.72-0.94 0.0001 Hip circumference (cm) >109 100 50 0.8 0.66-0.91 0.0009 Iliac Waist-Hip Ratio >0.85 77.8 58.3 0.7 0.54-0.82 0.057 Largest waist-hip ratio >0.87 100 66.6 0.85 0.72-0.94 0.0001 Skin % body fat >36.4 88.9 68.6 0.79 0.64-0.89 0.002 Skin biceps (mm) >10.7 100 52.8 0.73 0.57-0.85 0.025 Skin subscapular (mm) >18.5 100 33.3 0.64 0.48-0.78 0.18 Skin suprailiac (mm) >22.3 100 47.2 0.71 0.55-0.83 0.043 Skin tricpes (mm) >22.7 100 52.8 0.76 0.61-0.87 0.008 Abd. CT total area (mm2) >66800 88.9 80.6 0.85 0.71-0.94 0.0001 Abd. CT SQ fat (mm2) >54700 66.7 91.7 0.8 0.66-0.91 0.0009 Abd. CT visceral fat (mm2) >9962 100 77.8 0.95 0.84-0.99 0.0001 DXA % fat left arm >43.8 100 61.1 0.8 0.65-0.9 0.0012 DXA % fat right arm >42.1 100 63.9 0.83 0.69-0.92 0.0002 DXA % fat left leg >45 77.8 75 0.77 0.62-0.88 0.0043 DXA % fat right leg >44.6 77.8 77.8 0.76 0.61-0.87 0.0078 DXA % fat trunk >39.9 100 66.7 0.85 0.71-0.94 0.0001 DXA % fat total >39.1 100 63.9 0.83 0.69-0.93 0.0001 DXA fat trunk (g) >16246 100 69.4 0.87 0.74-0.95 0.0001 DXA fat total (g) >31677 100 66.7 0.88 0.74-0.95 0.0001 DXA lean total (g) >45637 100 36.1 0.7 0.55-0.83 0.05 DXA lean trunk (g) >23323 100 61.1 0.77 0.62-0.88 0.004
by 10.220.33.1 on August 16, 2016 http://jap.physiology.org/ Downloaded from

by 10.220.33.1 on August 16, 2016
http://jap.physiology.org/D
ownloaded from
Related Documents


