Antarctic deep-sea meiofauna and bacteria react to the deposition of particulate organic matter after a phytoplankton bloom Gritta Veit-K ¨ ohler a,n , Katja Guilini b , Ilka Peeken c,d , Oliver Sachs c , Eberhard J. Sauter c , Laura W ¨ urzberg e,1 a Senckenberg am Meer, DZMB – German Centre for Marine Biodiversity Research, S¨ udstrand 44, 26382 Wilhelmshaven, Germany b Ghent University (UGent), Biology Department, Marine Biology Section, B-9000 Ghent, Belgium c Alfred-Wegener-Institute for Polar and Marine Research, P.O. Box 120161, 27515 Bremerhaven, Germany d MARUM - Center for Marine Environmental Sciences, Leobener Strasse, 28359 Bremen, Germany e University of Hamburg, Zoological Museum, Martin-Luther-King Platz 3, 20146 Hamburg, Germany article info Available online 20 May 2011 Keywords: Deep-sea sediments Meiofauna Bacteria Vertical migration Benthic organic carbon flux Sediment community oxygen consumption (SCOC) Chloroplast pigments Fatty acids Southern Ocean abstract During the RV Polarstern ANT XXIV-2 cruise to the Southern Ocean and the Weddell Sea in 2007/2008, sediment samples were taken during and after a phytoplankton bloom at 521S01E. The station, located at 2960 m water depth, was sampled for the first time at the beginning of December 2007 and revisited at the end of January 2008. Fresh phytodetritus originating from the phytoplankton bloom first observed in the water column had reached the sea floor by the time of the second visit. Absolute abundances of bacteria and most major meiofauna taxa did not change between the two sampling dates. In the copepods, the second most abundant meiofauna taxon after the nematodes, the enhanced input of organic material did not lead to an observable increase of reproductive effort. However, significantly higher relative abundances of meiofauna could be observed at the sediment surface after the remains of the phytoplankton bloom reached the sea floor. Vertical shifts in meiofauna distribution between December and January may be related to changing pore-water oxygen concentration, total sediment fatty acid content, and pigment profiles measured during our study. Higher oxygen consumption after the phytoplankton bloom may have resulted from an enhanced respiratory activity of the living benthic component, as neither meiofauna nor bacteria reacted with an increase in individual numbers to the food input from the water column. Based on our results, we infer that low temperatures and ecological strategies are the underlying factors for the delayed response of benthic deep-sea copepods, in terms of egg and larval production, to the modified environmental situation. & 2011 Elsevier Ltd. All rights reserved. 1. Introduction Carbon fixation by phytoplankton and the subsequent cascade of grazing, export to deeper water layers, and sedimentation on the sea floor, often referred to as the ‘‘biological pump’’ (Longhurst and Harrison, 1989), represents one of the major CO 2 sinks on earth and is the major energy source for abyssal life (e.g., Sarmiento and Le Que ´re ´, 1996; Smith et al., 2008). The intensity of primary production in the euphotic zone, often thousands of meters above the sea floor, is directly coupled to the ecosystem structure and function in the abyss (Billet et al., 1983; Tseytlin, 1987; Graf, 1989, 1992; Sibuet et al., 1989; Gooday and Turley, 1990; Smith et al., 2008). Increasing food limitation towards the abyss leads to a shift in community biomass distribution in benthic animals from the larger macro- and megafauna, which dominate the biomass in shallower areas, to the smaller size classes of meiofauna and bacteria (Rex et al., 2006). Despite their low abundances in the abyssal deep sea, macro- fauna may nevertheless play a considerable role in the initial processing of fresh phytoplankton from the water column (Levin et al., 1999; Moodley et al., 2002; Witte et al., 2003a, b). None- theless, bacteria are the most important component for reminer- alization, and react immediately (Cahet and Sibuet, 1986; Moodley et al., 2002; Witte et al., 2003a) or with a distinct time lag (depending, e.g., on water depth; Witte et al., 2003b) to the experimental deposition of organic matter. Likewise, foraminifera are important for both remineralization and as an intermediate link in the energy flow from phytodetritus to small metazoans (Gooday et al., 1996; Moodley et al., 2002; Witte et al., 2003b; Koho et al., 2008; Nomaki et al., 2008; W¨ urzberg et al., 2011). Contents lists available at ScienceDirect journal homepage: www.elsevier.com/locate/dsr2 Deep-Sea Research II 0967-0645/$ - see front matter & 2011 Elsevier Ltd. All rights reserved. doi:10.1016/j.dsr2.2011.05.008 n Corresponding author. Tel.: þ49 4421 9475 102; fax: þ49 4421 9475 111. E-mail address: [email protected] (G. Veit-K ¨ ohler). 1 Current address: Helmholtz Zentrum M ¨ unchen, Ingolst ¨ adter Landstrasse 1, 85764 Neuherberg, Germany. Deep-Sea Research II 58 (2011) 1983–1995

Welcome message from author
This document is posted to help you gain knowledge. Please leave a comment to let me know what you think about it! Share it to your friends and learn new things together.
Transcript
Deep-Sea Research II 58 (2011) 1983–1995
Contents lists available at ScienceDirect
Deep-Sea Research II
0967-06
doi:10.1
n Corr
E-m1 Cu
85764 N
journal homepage: www.elsevier.com/locate/dsr2
Antarctic deep-sea meiofauna and bacteria react to the deposition ofparticulate organic matter after a phytoplankton bloom
Gritta Veit-Kohler a,n, Katja Guilini b, Ilka Peeken c,d, Oliver Sachs c,Eberhard J. Sauter c, Laura Wurzberg e,1
a Senckenberg am Meer, DZMB – German Centre for Marine Biodiversity Research, Sudstrand 44, 26382 Wilhelmshaven, Germanyb Ghent University (UGent), Biology Department, Marine Biology Section, B-9000 Ghent, Belgiumc Alfred-Wegener-Institute for Polar and Marine Research, P.O. Box 120161, 27515 Bremerhaven, Germanyd MARUM - Center for Marine Environmental Sciences, Leobener Strasse, 28359 Bremen, Germanye University of Hamburg, Zoological Museum, Martin-Luther-King Platz 3, 20146 Hamburg, Germany
a r t i c l e i n f o
Available online 20 May 2011
Keywords:
Deep-sea sediments
Meiofauna
Bacteria
Vertical migration
Benthic organic carbon flux
Sediment community oxygen consumption
(SCOC)
Chloroplast pigments
Fatty acids
Southern Ocean
45/$ - see front matter & 2011 Elsevier Ltd. A
016/j.dsr2.2011.05.008
esponding author. Tel.: þ49 4421 9475 102;
ail address: [email protected] (G
rrent address: Helmholtz Zentrum Munchen
euherberg, Germany.
a b s t r a c t
During the RV Polarstern ANT XXIV-2 cruise to the Southern Ocean and the Weddell Sea in 2007/2008,
sediment samples were taken during and after a phytoplankton bloom at 521S 01E. The station, located
at 2960 m water depth, was sampled for the first time at the beginning of December 2007 and revisited
at the end of January 2008. Fresh phytodetritus originating from the phytoplankton bloom first
observed in the water column had reached the sea floor by the time of the second visit. Absolute
abundances of bacteria and most major meiofauna taxa did not change between the two sampling
dates. In the copepods, the second most abundant meiofauna taxon after the nematodes, the enhanced
input of organic material did not lead to an observable increase of reproductive effort. However,
significantly higher relative abundances of meiofauna could be observed at the sediment surface after
the remains of the phytoplankton bloom reached the sea floor. Vertical shifts in meiofauna distribution
between December and January may be related to changing pore-water oxygen concentration, total
sediment fatty acid content, and pigment profiles measured during our study. Higher oxygen
consumption after the phytoplankton bloom may have resulted from an enhanced respiratory activity
of the living benthic component, as neither meiofauna nor bacteria reacted with an increase in
individual numbers to the food input from the water column. Based on our results, we infer that low
temperatures and ecological strategies are the underlying factors for the delayed response of benthic
deep-sea copepods, in terms of egg and larval production, to the modified environmental situation.
& 2011 Elsevier Ltd. All rights reserved.
1. Introduction
Carbon fixation by phytoplankton and the subsequent cascadeof grazing, export to deeper water layers, and sedimentation onthe sea floor, often referred to as the ‘‘biological pump’’(Longhurst and Harrison, 1989), represents one of the majorCO2 sinks on earth and is the major energy source for abyssallife (e.g., Sarmiento and Le Quere, 1996; Smith et al., 2008). Theintensity of primary production in the euphotic zone, oftenthousands of meters above the sea floor, is directly coupled tothe ecosystem structure and function in the abyss (Billet et al.,1983; Tseytlin, 1987; Graf, 1989, 1992; Sibuet et al., 1989;Gooday and Turley, 1990; Smith et al., 2008). Increasing food
ll rights reserved.
fax: þ49 4421 9475 111.
. Veit-Kohler).
, Ingolstadter Landstrasse 1,
limitation towards the abyss leads to a shift in communitybiomass distribution in benthic animals from the larger macro-and megafauna, which dominate the biomass in shallower areas,to the smaller size classes of meiofauna and bacteria (Rex et al.,2006).
Despite their low abundances in the abyssal deep sea, macro-fauna may nevertheless play a considerable role in the initialprocessing of fresh phytoplankton from the water column (Levinet al., 1999; Moodley et al., 2002; Witte et al., 2003a, b). None-theless, bacteria are the most important component for reminer-alization, and react immediately (Cahet and Sibuet, 1986;Moodley et al., 2002; Witte et al., 2003a) or with a distinct timelag (depending, e.g., on water depth; Witte et al., 2003b) to theexperimental deposition of organic matter. Likewise, foraminiferaare important for both remineralization and as an intermediatelink in the energy flow from phytodetritus to small metazoans(Gooday et al., 1996; Moodley et al., 2002; Witte et al., 2003b;Koho et al., 2008; Nomaki et al., 2008; Wurzberg et al., 2011).
G. Veit-Kohler et al. / Deep-Sea Research II 58 (2011) 1983–19951984
The smallest components of metazoan life in the deep sea aremeiofauna, benthic animals classically defined as passing a 1-mmmesh and being retained on a 32-mm mesh. In shallow-waterhabitats, meiofauna can contribute significantly to the regulationof benthic turnover, and also serve as food for secondaryconsumers (Coull, 1988; Giere, 1993). The reaction of deep-seametazoan meiofauna to food input has been investigated inseveral observational and experimental studies (Gooday et al.,1996; Danovaro et al., 2000; Shimanaga et al., 2000; Moodleyet al., 2002; Witte et al., 2003b; Baguley et al., 2008; Guilini et al.,2010; Ingels et al., 2010). These studies have reported a lack ofresponse or time lags of several days to months between foodpresentation and measurable reactions, such as incorporation offood or reproduction. Although respiration rates and oxygenconsumption of benthic communities (SCOC) almost immediatelyincrease when fresh food is available (e.g., Witte et al., 2003b),there is no evidence that meiofauna is involved in this. To date,only a few studies that included the reaction of metazoanmeiofauna to food input have been carried out for abyssal depths(e.g., Cahet and Sibuet, 1986; Witte et al., 2003b; Baguley et al.,2008; Ingels et al., 2010; Guilini et al., 2011).
While still very little is known about the benthic microbialcommunities in the Southern Ocean (De Wit et al., 1997),meiofauna communities of Antarctic deep-sea regions have beenstudied more intensely in recent years (Herman and Dahms,1992; Vanhove et al., 1995, 2004; Gutzmann et al., 2004).However, both the reasons for their success and their role as apotential trophic link between sedimented organic matter andhigher-level consumers are still not known.
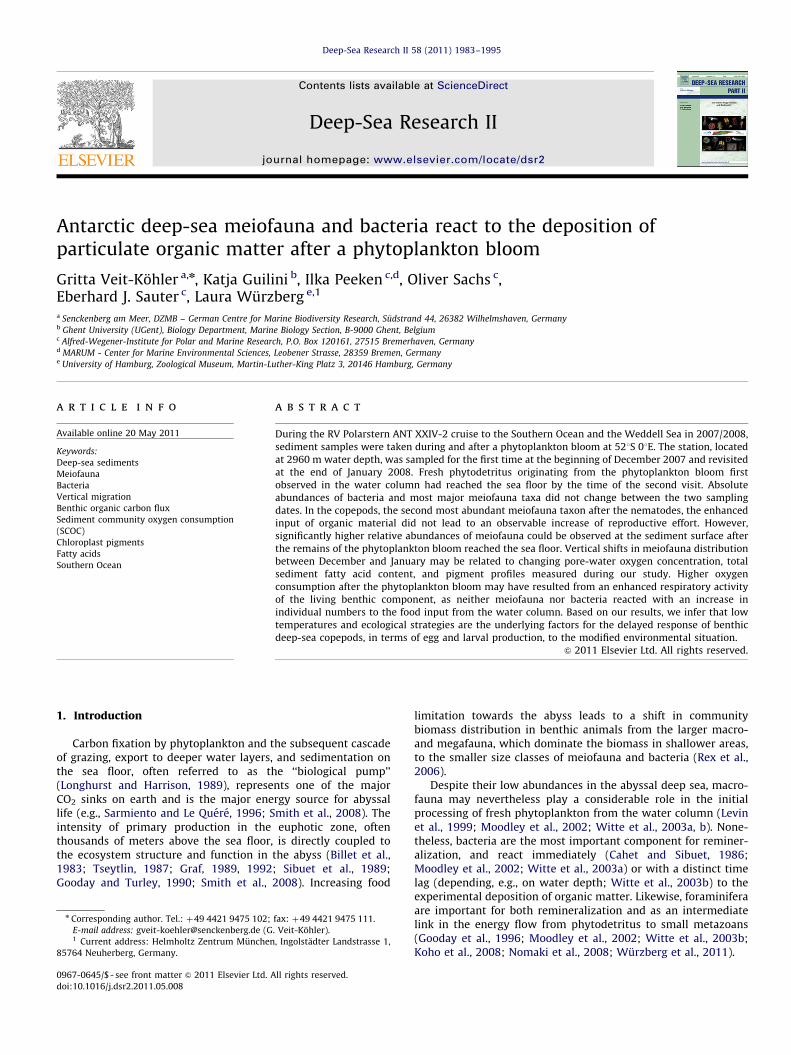
During the RV Polarstern ANT XXIV/2 expedition to the South-ern Ocean, the aim of the ANDEEP-SYSTCO project (ANtarcticbenthic DEEP-sea biodiversity: colonization history and recentcommunity patterns—SYSTem COupling; Brandt et al., 2011) wasto link biological processes occurring in the water column to thefunctioning of benthic compartments of the deep Southern Ocean.Therefore, a deep-sea station located at the 01 meridianat 521S (Fig. 1) was sampled while a phytoplankton bloom wasin progress in the water column, and the station was revisitedafter the remains of the bloom had settled to the ocean floor(detectable as a layer of greenish fluff on the sediment surface).We were able to obtain measurements of the benthic C-flux,oxygen penetration depth, oxygen consumption, pigment content,
Fig. 1. Map showing the location of stations 13 and 85 at 521S 01E in the
Southern Ocean.
and fatty acid composition in the sediment; bottom-water parti-culate organic matter (POM); and bacterial and metazoan meio-fauna abundances. Thus, it was possible to obtain an integratedview of the response to a phytodetritus fall on the Southern Oceandeep-sea floor.
In view of the findings of previous studies on the populationresponse of deep-sea meiofauna to food input (e.g., Danovaroet al., 2000), we did not expect metazoan meiofauna to react withan immediate increase of reproduction to the enhanced organicmatter supply directly after the settling event. However, becausethe reaction of meiofauna to food input had not been investigatedpreviously in the Southern Ocean, we looked for changes inreproductive effort that might be triggered by the sudden inputof food in this otherwise adverse environment. Copepods, withtheir externally carried egg sacs and their easily recognizableoffspring, the nauplius larvae, perfectly meet the requirements fora model organism to study the reaction of benthic meiofaunacommunities.
With our investigation we wanted to test the followinghypotheses:
Meiofauna and bacteria in oligotrophic Antarctic deep-seaenvironments react immediately to seasonally deposited foodinput with (1) enhanced locomotor and respiratory activity and(2) observable reproductive effort (increases in number of bacter-ial cells, production of eggs in copepods, and number of copepodnauplius larvae).
2. Materials and methods
2.1. Selection of study area and study dates
During the RV Polarstern ANT XXIV/2 expedition, continuousmeasurements of chlorophyll-a content in the upper watercolumn were carried out using standard methods based onfluorescence. When enhanced chlorophyll-a values indicated alocal phytoplankton bloom (Herrmann and Bathmann, 2010), wedecided to start the sampling at this position in order to have asufficient time lag between the initial sampling and revisiting thestation on the return leg to South Africa. The selected station waslocated at 521S, between the Polar Front (PF) and the SouthAntarctic Circumpolar Current Front (SACCF) (Fig. 1).
The first deep-sea sediment sampling took place on 5 and6 December 2007, during the phytoplankton bloom (Station PS71/13, from now on referred to as ‘‘station 13’’, between 5210.410S, 011.080 E and 5212.250S, 011.110W, 2963–2990 m). The sitewas revisited and sampled again on 26 and 27 January 2008, 52days after the bloom was observed in the surface water layer(Station PS 71/85, from now on referred to as ‘‘station 85’’,between 5211.140S, 010.070E and 5211.530S, 010.160E, 2964–2995 m; see also Table 1). The gear deployed for this studyincluded a multicorer, a free-falling lander system equipped withoxygen microprofiler systems, and a carousel bottle watersampler.
2.2. In situ measurements of oxygen microprofiles
On both sampling dates, a customized free-falling lander(Geomar-type) equipped with a 3D-oxygen microprofiler at sta-tion 13-2 and a 1D-oxygen microprofiler at station 85-1 wasdeployed (Table 1). Electronics and pressure housings of bothprofilers were purchased from Unisense AS, Aarhus, Denmark,and were equipped with identical pressure-compensated Clarktype microsensors, also supplied by Unisense AS. The landerstations were located in close vicinity to the stations sampledwith the MUC (Table 1).
Table 1Deployments of the lander and the multicorer (MUC) at the 521S station during the SYSTCO expedition (RV Polarstern cruise ANT XXIV-2). Sampling date, position (latitude
and longitude), water depth (according to winch rope length), sediment description, and cores used for this study are given.
Station/Deployment/Gear Date Latitude Longitude Depth (m) Sediment (MUC) Core distribution (MUC)
Station 13 (PS 71/13)13-2 Lander 05.12.2007 5210.410S 011.080E 2990
13-12 MUC 06.12.2007 5212.220S 011.040W 2963 Foraminiferan/diatom ooze 3 cores meiofauna
2 cores oxygen/sediment
2 cores sediment analyses
1 syringe bacteria
13-14 MUC 06.12.2007 5212.250S 011.110W 2970 Foraminiferan/diatom ooze 3 cores meiofauna
2 cores oxygen/sediment
2 cores sediment analyses
1 syringe bacteria
Station 85 (PS 71/85)85-1 Lander 26.01.08 5211.140S 010.070E 2995
85-5 MUC 26.01.08 5211.200S 010.200E 2965 Foraminiferan/diatom ooze
with greenish fluff layer
3 cores meiofauna2 cores oxygen/sediment
1 core sediment analyses
1 syringe bacteria
85-7 MUC 27.01.08 5211.530S 010.160E 2964 Foraminiferan/diatom ooze
with greenish fluff layer
3 cores meiofauna1 core sediment analyses
1 syringe bacteria
G. Veit-Kohler et al. / Deep-Sea Research II 58 (2011) 1983–1995 1985
The 3D-oxygen microprofiler system is not restricted to driv-ing sensors vertically into the sediment, but is also able to extendits sensor array (up to 12 oxygen microsensors) horizontally inorder to measure cascades of microprofiles over a target area ofapproximately 30�35 cm2. The 1D-microprofiler was equippedwith up to 5 oxygen sensors that were pre-calibrated according toSauter et al. (2001). During approximately 5–6 h at the sea floor,the sensors were lowered through the water–sediment interfaceinto the sediment with a vertical resolution of 0.5 mm (3Dprofiler) and 0.25 mm (1D profiler), respectively. Apart from thedifferent vertical resolution (related to the available time at thesea floor), the calibration method and measuring technique ofboth systems were the same. Therefore, the possibility thatdifferent profile shapes originate from technical differences canbe excluded. For porosity determination, a resistivity sensor(formation factor probe) was used. Additional ex situ oxygenmeasurements were made in the laboratory on shipboard, usingsediment cores collected with the MUC (see Sachs et al., 2009).
Oxygen microprofiles were obtained as raw data sets (mVsignal) from in situ measurements, which were converted tooxygen values via the following steps: Correction of sensor driftif necessary, adjustment of sensor height relative to the water/sediment interface, conversion of raw signal into oxygen concen-tration on the basis of a two-point calibration (bottom-wateroxygen concentration by Winkler titration, and sensor zero read-ing from oxygen-free water).
For the determination of organic carbon fluxes to the sea floor,first the diffusive oxygen uptake was calculated from the pore-water oxygen microgradient at the sediment surface, using thesoftware PROFILE of Berg et al. (1998). The oxygen uptake wasthen used to calculate the amount of carbon aerobically respired,using a modified Redfield ratio according to Anderson andSarmiento (1994). Whereas the organic carbon flux reflects a‘‘snapshot’’ of food supply at the time of measurement, themaximum depth of sediment oxygenation (oxygen penetrationdepth, OPD; below which the geochemical milieu becomesanoxic) changes much more slowly, on a time scale of years, inparticular in the oligotrophic deep Southern Ocean. Therefore theOPD was determined as a long-term measure of carbon supply tothe sea floor.
For a more detailed description of the methods see Sauter et al.(2001) and Sachs et al. (2009).
2.3. Sample collection and storage
The multicorer (MUC, internal core diameter 9.4 cm, 69.4 cm2)was deployed twice on each sampling date (Table 1).
For the meiofauna community analysis, three cores perdeployment were sliced (0–1, 1–2, 2–3, 3–4, 4–5, 5–7, 7–10,10–15, and 15–20 cm sediment depth) and preserved in a borax-buffered formaldehyde–seawater solution to a final concentrationof 4%. A sediment subsample for bacteria counts was taken fromone core per MUC-deployment by inserting a 10-ml syringe withcut-off tip (diameter 1.4 cm) to a sediment depth of 5 cm. Thesyringe samples were immediately frozen at �20 1C.
One core per sampling date was immediately cut into 1-cmsediment horizons (the first centimeter was cut in two slices at0–0.5 and 0.5–1 cm) to a depth of 25 cm and frozen at �80 1C forpigment analyses. Later, in the laboratory, these samples werestored at �30 1C. A second core was sliced (0–1, 2–5 and6–10 cm) and stored at �80 1C for fatty-acid analysis. Only thesolid component of this sediment core was sampled; the super-natant was discarded.
Bottom water was taken by means of a carousel bottle watersampler (Sea-Bird SBE 32). Water was sampled close to theseabed at station 13 (39 m above the seabed) and station 85(36 m above the seabed). Samples of particulate organic matter(POM) were collected by filtering 14 (station 13) or 18 (station85) l of water through a precombusted (4 h for 400 1C) GF/C filter(approx. 1.2 mm retention size). Filtering was conducted at300 mbar and stopped when a distinct coloring appeared on thefilter. Two filters per station were frozen at �80 1C for analysis offatty-acid composition.
2.4. Sediment parameters
The chloroplast pigments were analyzed in order to detectwhether the sediments from stations 13 and 85 contained fresh ordegraded phytodetritus. Pigment analyses were performed byhigh-performance liquid chromatography (HPLC). For analyticalpreparation, each core section was homogenized and subsamplesof 1 cm3 taken. The sediment sample was mixed with 100 ml ofinternal standard (canthaxanthin) and 1 ml of glass beads (1 mmdiameter). This mixture was extracted 3 times with 3 ml acetonein a cell mill for 3 min. After centrifugation (10 min at 4000 rpm
G. Veit-Kohler et al. / Deep-Sea Research II 58 (2011) 1983–19951986
and 0 1C) the extracts were unified and concentrated on an AlltechC18TM solid-phase extract clean column. Pigments were elutedwith 100% acetone and further concentrated under nitrogenatmosphere in the dark to a final volume of 0.3 ml. Finally,pigments were measured with a WatersTM HPLC system accord-ing to Hoffmann et al. (2006).
The composition of fatty acids contains information about thestate of degradation of organic material, and many fatty acids arebiomarkers for different producers and bacteria. Fatty acids wereanalyzed in three random subsamples (ca. 50–100 mg taken witha spoon) per depth layer (0–1, 2–5 and 6–10 cm). Extraction wasperformed with minor modifications as described by Folch et al.(1957), using ultrasonic disruption in dichloromethane : metha-nol (v:v/ 2:1) and a washing procedure with 0.08% aqueous KClsolution. Fatty acid composition was determined, with modifica-tions as described by Kattner and Fricke (1986). Fatty acids wereconverted to their methyl ester derivatives (FAME) using 3%sulfuric methanol. The composition was analyzed with a gaschromatograph (HP 6890A) equipped with a programmable tem-perature vaporizer injector (Gerstels CIS4plus) and a DB-FFAP(nitroterephthalic acid modified polyethylene glycol free fatty acidphase) column. FAMEs and free alcohols were detected by flameionization and identified by comparing retention times with thosederived from standards of known composition. For quantificationof fatty acids, 23:0 was used as internal standard.
2.5. Bacteria and meiofauna sample processing
The syringe samples for bacterial counts were sliced (0–1, 1–2,2–3, 3–4, 4–5 cm sediment depth) just before further analysis.Total bacterial counts were performed using acridine orangedirect count (AODC) (variant from Hobbie et al., 1977). Eachsediment sample of ca. 0.5–1 g was transferred into a sterile testtube and fixed to a final volume of 5 ml with 2% (v/v) formalin,after thawing. Pure formaldehyde was mixed with sterilized,prefiltered artificial seawater (on 0.2 mm-pore-size filters) andbuffered with borax (sodium tetraborate) to a pH of 8.8–9.Tetrasodium pyrophosphate was then added to a final concentra-tion of 5 mM and the sample was incubated in the dark for15 min. The sample was then sonicated for 3 min with a 30 sinterval each minute, during which it was shaken manually. Afterthe sample was centrifuged for 3 min at a maximum of 400 rpm,the supernatant was diluted 20-fold with sterile seawater. ForAODC, the sample was stained for 5 min with an acridine orangeworking solution of 0.025% (w/v) and filtered on a Milliporepolycarbonate 0.2 mm-pore-size filter that was stained in anirgalan black solution (Van Duyl and Kop, 1990). A filter waswashed 3 times with 5 ml of sterilized Milli-Q water and mountedon microscope slides. Each filter was analyzed using epifluores-cence microscopy (Zeiss Axioskop 50, excitation and emissionwavelengths: 450–490 nm and 515–565 nm, respectively).For each slide, at least 10 optical fields were randomly chosenand observed, and at least 200 cells were counted per filter.
The fixed meiofauna samples were washed with tap waterthrough a 32-mm mesh sieve (no coarser upper sieve was used).Meiofauna and organic material were extracted from the remain-ing sediment particles by centrifugation with a colloidal silicapolymer as the flotation medium (H.C. Stark, Levasil 200/40%,r¼1.17) and kaolin to hold back the heavier particles duringdecantation (McIntyre and Warwick, 1984). Centrifugation wasrepeated three times at 4000 rpm for 6 min, respectively. Aftereach centrifugation, the floating matter was decanted over a 32-mm mesh sieve and rinsed with tap water. The supernatantcontaining the meiobenthic organisms was then stained withRose Bengal, before manual sorting to major taxon level using aLeica MZ 12.5 stereomicroscope. The numbers of individuals
belonging to higher taxa, copepod nauplii, and copepods carryingeggs were counted.
For the interpretation of the vertical distribution, the numbersof bacteria and meiofauna individuals were converted into rela-tive abundances per sediment horizon. In order to obtain thesevalues, the sum of individuals from the complete core was takenas 100% and the percentages per slice were calculated.
2.6. The use of relative abundances for bacteria and meiofauna data
As indicated by the results for the fatty acids, there is alsoevidence for patchily distributed standing stocks of bacteria andmeiofauna in the deep-sea area investigated. During our expedi-tion it became clear that food availability differed on mediumscales: an additional in situ measurement of oxygen microprofileswas carried out 12 nautical miles south of 521S at station PS 71/84(water depth 3004 m). On the same day, the fluxes were found tobe approximately 20% lower (7.7 mg C m�2 d�1) at station PS 71/84 than at station 85 (Sachs et al., 2009). There is a possibility thateven at smaller scales, a slightly poorer pre-bloom food bank inthe sediment at station 85 compared to the nearby station 13 hadan effect on the abundances of benthic organisms. Absoluteindividual numbers of bacteria and meiofauna can be quitevariable between different deployments, and even between thecores of the same MUC deployment (compare Tables 3 and 4; formeiofauna see also Gutzmann et al., 2004). Therefore we decidedto use relative abundances of bacteria and meiofauna for datapresentation and statistical analyses, in order to detect differ-ences which otherwise would be obscured by the absolute (orotherwise transformed) numbers found at stations 13 and 85.
2.7. Data analysis
Principal components analysis (PCA) was used to detect andvisualize patterns in the composition of individual fatty acids insediment and bottom-water samples (PRIMER v6 package; Clarkeand Gorley, 2006).
In the graphs, relative meiofauna and copepod abundances arepresented as median values. The 25th and 75th percentile wereadded in order to visualize the distribution range of the data.According to this graph, a statistically significant difference couldbe expected between stations 13 and 85 for the first threecentimeters of the sediment. The meiofauna data for the 2–3 cmsediment horizon (station 13 vs station 85) did not pass the testfor equal variance. A nested ANOVA (after Sokal and Rohlf, 1981)was carried out to test for differences between the 0–1 and 1–2 cm sediment layers of stations 13 and 85. The use of the nesteddesign can be explained as follows: at the two stations 13 and 85(A) two MUC-deployments were carried out per station (B nestedin A), and the data for three sediment cores per deployment werethe test data. For the test for differences between the percentageof copepods with eggs per total copepods (adults and copepodids)and the percentage of nauplii per total copepods, the data for thecomplete cores (0–20 cm) were used. The nested ANOVA wascarried out using the free statistical software OpenStat (http://www.statpages.org/miller/openstat/ by William G. Miller) andconfirmed by a spreadsheet available from McDonald (2009;http://udel.edu/�mcdonald/statintro.html).
Multivariate meiofauna community analyses were carried outon abundance data for higher taxa and copepod nauplii from thefirst centimeter of sediment, using the PRIMER v6 package (Clarkeand Gorley, 2006). A Bray–Curtis similarity analysis was con-ducted and visualized with the aid of non-metric multi-dimen-sional scaling MDS. The factor ‘‘station’’ was applied for theANOSIM analysis of similarities (one-way analysis).
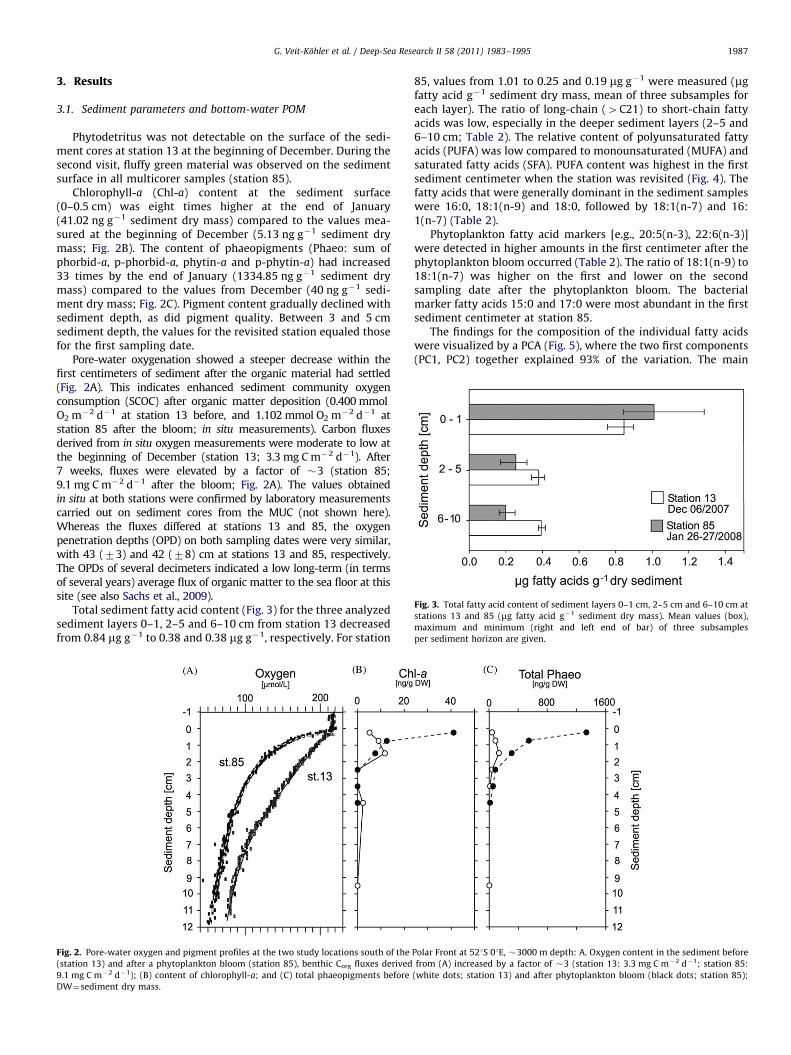
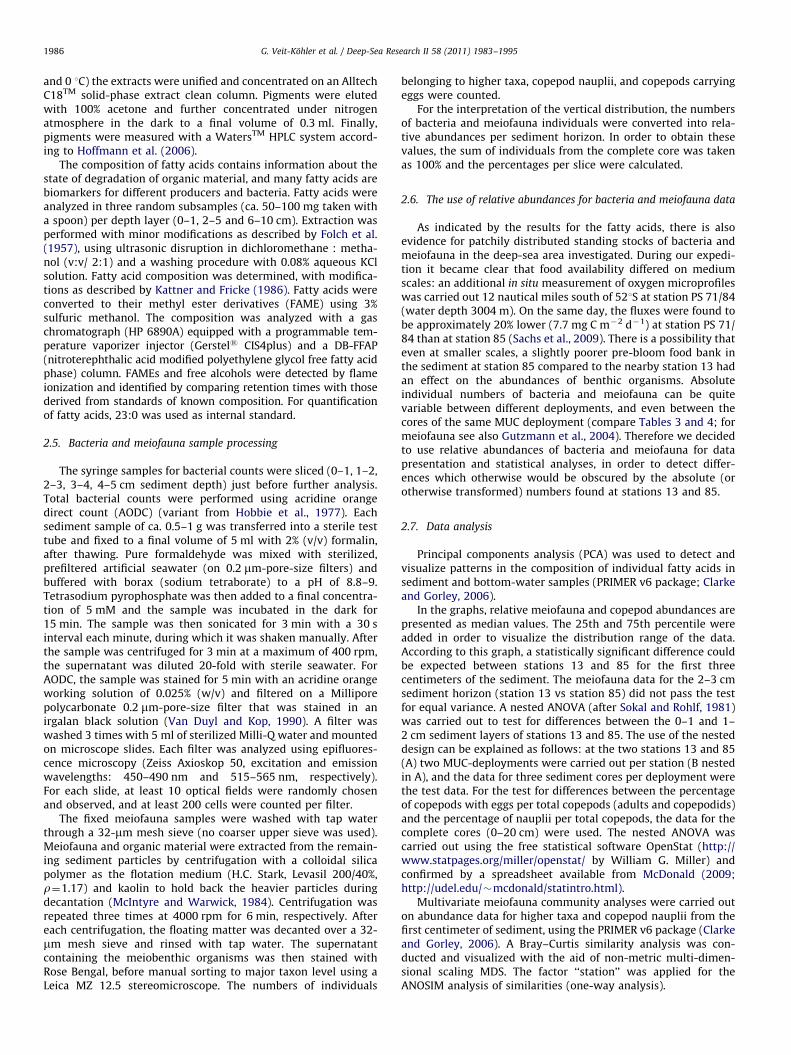
Fig. 3. Total fatty acid content of sediment layers 0–1 cm, 2–5 cm and 6–10 cm at
stations 13 and 85 (mg fatty acid g�1 sediment dry mass). Mean values (box),
maximum and minimum (right and left end of bar) of three subsamples
per sediment horizon are given.
G. Veit-Kohler et al. / Deep-Sea Research II 58 (2011) 1983–1995 1987
3. Results
3.1. Sediment parameters and bottom-water POM
Phytodetritus was not detectable on the surface of the sedi-ment cores at station 13 at the beginning of December. During thesecond visit, fluffy green material was observed on the sedimentsurface in all multicorer samples (station 85).
Chlorophyll-a (Chl-a) content at the sediment surface(0–0.5 cm) was eight times higher at the end of January(41.02 ng g�1 sediment dry mass) compared to the values mea-sured at the beginning of December (5.13 ng g�1 sediment drymass; Fig. 2B). The content of phaeopigments (Phaeo: sum ofphorbid-a, p-phorbid-a, phytin-a and p-phytin-a) had increased33 times by the end of January (1334.85 ng g�1 sediment drymass) compared to the values from December (40 ng g�1 sedi-ment dry mass; Fig. 2C). Pigment content gradually declined withsediment depth, as did pigment quality. Between 3 and 5 cmsediment depth, the values for the revisited station equaled thosefor the first sampling date.
Pore-water oxygenation showed a steeper decrease within thefirst centimeters of sediment after the organic material had settled(Fig. 2A). This indicates enhanced sediment community oxygenconsumption (SCOC) after organic matter deposition (0.400 mmolO2 m�2 d�1 at station 13 before, and 1.102 mmol O2 m�2 d�1 atstation 85 after the bloom; in situ measurements). Carbon fluxesderived from in situ oxygen measurements were moderate to low atthe beginning of December (station 13; 3.3 mg C m�2 d�1). After7 weeks, fluxes were elevated by a factor of �3 (station 85;9.1 mg C m�2 d�1 after the bloom; Fig. 2A). The values obtainedin situ at both stations were confirmed by laboratory measurementscarried out on sediment cores from the MUC (not shown here).Whereas the fluxes differed at stations 13 and 85, the oxygenpenetration depths (OPD) on both sampling dates were very similar,with 43 (73) and 42 (78) cm at stations 13 and 85, respectively.The OPDs of several decimeters indicated a low long-term (in termsof several years) average flux of organic matter to the sea floor at thissite (see also Sachs et al., 2009).
Total sediment fatty acid content (Fig. 3) for the three analyzedsediment layers 0–1, 2–5 and 6–10 cm from station 13 decreasedfrom 0.84 mg g�1 to 0.38 and 0.38 mg g�1, respectively. For station
Fig. 2. Pore-water oxygen and pigment profiles at the two study locations south of the
(station 13) and after a phytoplankton bloom (station 85), benthic Corg fluxes derived
9.1 mg C m�2 d�1); (B) content of chlorophyll-a; and (C) total phaeopigments before
DW¼sediment dry mass.
85, values from 1.01 to 0.25 and 0.19 mg g�1 were measured (mgfatty acid g�1 sediment dry mass, mean of three subsamples foreach layer). The ratio of long-chain (4C21) to short-chain fattyacids was low, especially in the deeper sediment layers (2–5 and6–10 cm; Table 2). The relative content of polyunsaturated fattyacids (PUFA) was low compared to monounsaturated (MUFA) andsaturated fatty acids (SFA). PUFA content was highest in the firstsediment centimeter when the station was revisited (Fig. 4). Thefatty acids that were generally dominant in the sediment sampleswere 16:0, 18:1(n-9) and 18:0, followed by 18:1(n-7) and 16:1(n-7) (Table 2).
Phytoplankton fatty acid markers [e.g., 20:5(n-3), 22:6(n-3)]were detected in higher amounts in the first centimeter after thephytoplankton bloom occurred (Table 2). The ratio of 18:1(n-9) to18:1(n-7) was higher on the first and lower on the secondsampling date after the phytoplankton bloom. The bacterialmarker fatty acids 15:0 and 17:0 were most abundant in the firstsediment centimeter at station 85.
The findings for the composition of the individual fatty acidswere visualized by a PCA (Fig. 5), where the two first components(PC1, PC2) together explained 93% of the variation. The main
Polar Front at 521S 01E, �3000 m depth: A. Oxygen content in the sediment before
from (A) increased by a factor of �3 (station 13: 3.3 mg C m�2 d�1; station 85:
(white dots; station 13) and after phytoplankton bloom (black dots; station 85);
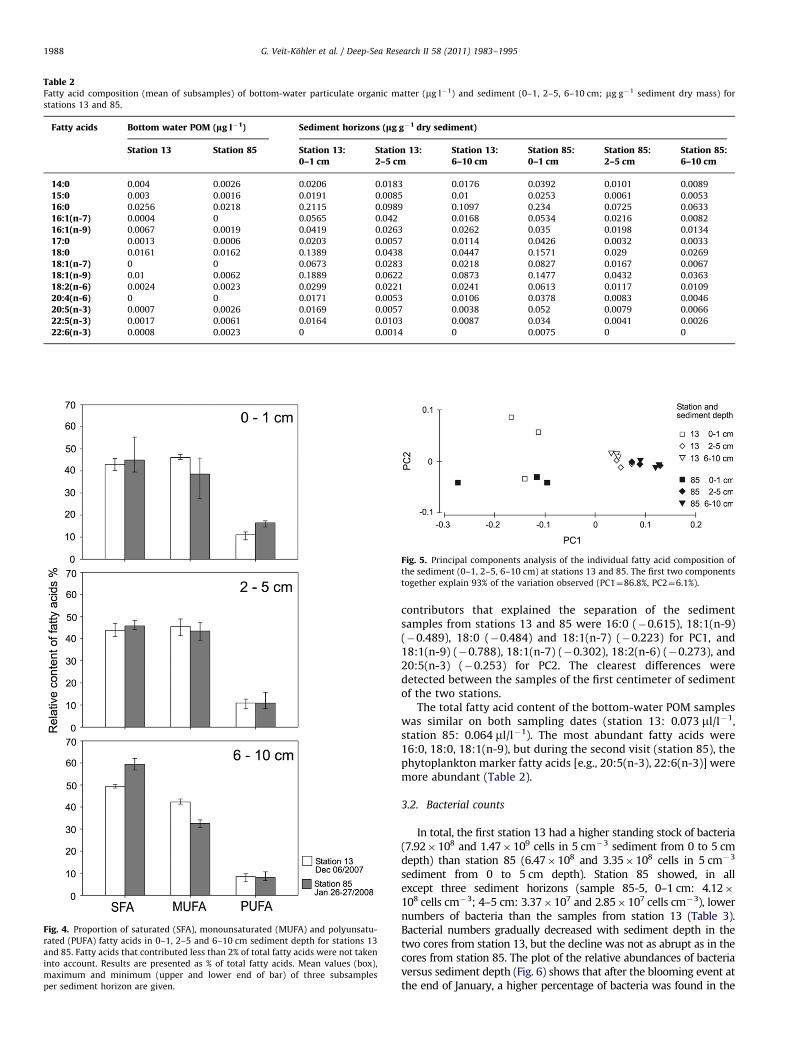
Table 2Fatty acid composition (mean of subsamples) of bottom-water particulate organic matter (mg l�1) and sediment (0–1, 2–5, 6–10 cm; mg g�1 sediment dry mass) for
stations 13 and 85.
Fatty acids Bottom water POM (lg l�1) Sediment horizons (lg g�1 dry sediment)
Station 13 Station 85 Station 13:0–1 cm
Station 13:2–5 cm
Station 13:6–10 cm
Station 85:0–1 cm
Station 85:2–5 cm
Station 85:6–10 cm
14:0 0.004 0.0026 0.0206 0.0183 0.0176 0.0392 0.0101 0.0089
15:0 0.003 0.0016 0.0191 0.0085 0.01 0.0253 0.0061 0.0053
16:0 0.0256 0.0218 0.2115 0.0989 0.1097 0.234 0.0725 0.0633
16:1(n-7) 0.0004 0 0.0565 0.042 0.0168 0.0534 0.0216 0.0082
16:1(n-9) 0.0067 0.0019 0.0419 0.0263 0.0262 0.035 0.0198 0.0134
17:0 0.0013 0.0006 0.0203 0.0057 0.0114 0.0426 0.0032 0.0033
18:0 0.0161 0.0162 0.1389 0.0438 0.0447 0.1571 0.029 0.0269
18:1(n-7) 0 0 0.0673 0.0283 0.0218 0.0827 0.0167 0.0067
18:1(n-9) 0.01 0.0062 0.1889 0.0622 0.0873 0.1477 0.0432 0.0363
18:2(n-6) 0.0024 0.0023 0.0299 0.0221 0.0241 0.0613 0.0117 0.0109
20:4(n-6) 0 0 0.0171 0.0053 0.0106 0.0378 0.0083 0.0046
20:5(n-3) 0.0007 0.0026 0.0169 0.0057 0.0038 0.052 0.0079 0.0066
22:5(n-3) 0.0017 0.0061 0.0164 0.0103 0.0087 0.034 0.0041 0.0026
22:6(n-3) 0.0008 0.0023 0 0.0014 0 0.0075 0 0
Fig. 4. Proportion of saturated (SFA), monounsaturated (MUFA) and polyunsatu-
rated (PUFA) fatty acids in 0–1, 2–5 and 6–10 cm sediment depth for stations 13
and 85. Fatty acids that contributed less than 2% of total fatty acids were not taken
into account. Results are presented as % of total fatty acids. Mean values (box),
maximum and minimum (upper and lower end of bar) of three subsamples
per sediment horizon are given.
Fig. 5. Principal components analysis of the individual fatty acid composition of
the sediment (0–1, 2–5, 6–10 cm) at stations 13 and 85. The first two components
together explain 93% of the variation observed (PC1¼86.8%, PC2¼6.1%).
G. Veit-Kohler et al. / Deep-Sea Research II 58 (2011) 1983–19951988
contributors that explained the separation of the sedimentsamples from stations 13 and 85 were 16:0 (�0.615), 18:1(n-9)(�0.489), 18:0 (�0.484) and 18:1(n-7) (�0.223) for PC1, and18:1(n-9) (�0.788), 18:1(n-7) (�0.302), 18:2(n-6) (�0.273), and20:5(n-3) (�0.253) for PC2. The clearest differences weredetected between the samples of the first centimeter of sedimentof the two stations.
The total fatty acid content of the bottom-water POM sampleswas similar on both sampling dates (station 13: 0.073 ml/l�1,station 85: 0.064 ml/l�1). The most abundant fatty acids were16:0, 18:0, 18:1(n-9), but during the second visit (station 85), thephytoplankton marker fatty acids [e.g., 20:5(n-3), 22:6(n-3)] weremore abundant (Table 2).
3.2. Bacterial counts
In total, the first station 13 had a higher standing stock of bacteria(7.92�108 and 1.47�109 cells in 5 cm�3 sediment from 0 to 5 cmdepth) than station 85 (6.47�108 and 3.35�108 cells in 5 cm�3
sediment from 0 to 5 cm depth). Station 85 showed, in allexcept three sediment horizons (sample 85-5, 0–1 cm: 4.12�108 cells cm�3; 4–5 cm: 3.37�107 and 2.85�107 cells cm�3), lowernumbers of bacteria than the samples from station 13 (Table 3).Bacterial numbers gradually decreased with sediment depth in thetwo cores from station 13, but the decline was not as abrupt as in thecores from station 85. The plot of the relative abundances of bacteriaversus sediment depth (Fig. 6) shows that after the blooming event atthe end of January, a higher percentage of bacteria was found in the
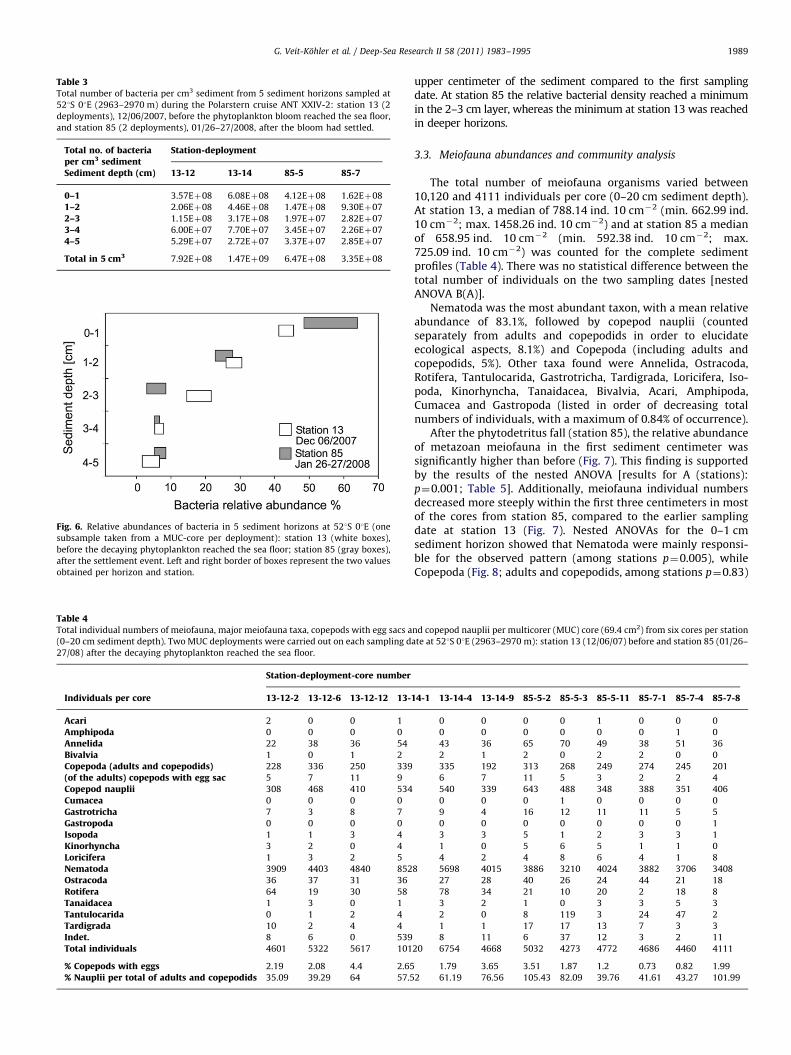
Fig. 6. Relative abundances of bacteria in 5 sediment horizons at 521S 01E (one
subsample taken from a MUC-core per deployment): station 13 (white boxes),
before the decaying phytoplankton reached the sea floor; station 85 (gray boxes),
after the settlement event. Left and right border of boxes represent the two values
obtained per horizon and station.
Table 4Total individual numbers of meiofauna, major meiofauna taxa, copepods with egg sacs a
(0–20 cm sediment depth). Two MUC deployments were carried out on each sampling d
27/08) after the decaying phytoplankton reached the sea floor.
Station-deployment-core number
Individuals per core 13-12-2 13-12-6 13-12-12 13-
Acari 2 0 0 1
Amphipoda 0 0 0 0
Annelida 22 38 36 54
Bivalvia 1 0 1 2
Copepoda (adults and copepodids) 228 336 250 339
(of the adults) copepods with egg sac 5 7 11 9
Copepod nauplii 308 468 410 534
Cumacea 0 0 0 0
Gastrotricha 7 3 8 7
Gastropoda 0 0 0 0
Isopoda 1 1 3 4
Kinorhyncha 3 2 0 4
Loricifera 1 3 2 5
Nematoda 3909 4403 4840 852
Ostracoda 36 37 31 36
Rotifera 64 19 30 58
Tanaidacea 1 3 0 1
Tantulocarida 0 1 2 4
Tardigrada 10 2 4 4
Indet. 8 6 0 539
Total individuals 4601 5322 5617 101
% Copepods with eggs 2.19 2.08 4.4 2.65
% Nauplii per total of adults and copepodids 35.09 39.29 64 57.5
Table 3Total number of bacteria per cm3 sediment from 5 sediment horizons sampled at
521S 01E (2963–2970 m) during the Polarstern cruise ANT XXIV-2: station 13 (2
deployments), 12/06/2007, before the phytoplankton bloom reached the sea floor,
and station 85 (2 deployments), 01/26–27/2008, after the bloom had settled.
Total no. of bacteriaper cm3 sediment
Station-deployment
Sediment depth (cm) 13-12 13-14 85-5 85-7
0–1 3.57Eþ08 6.08Eþ08 4.12Eþ08 1.62Eþ08
1–2 2.06Eþ08 4.46Eþ08 1.47Eþ08 9.30Eþ07
2–3 1.15Eþ08 3.17Eþ08 1.97Eþ07 2.82Eþ07
3–4 6.00Eþ07 7.70Eþ07 3.45Eþ07 2.26Eþ07
4–5 5.29Eþ07 2.72Eþ07 3.37Eþ07 2.85Eþ07
Total in 5 cm3 7.92Eþ08 1.47Eþ09 6.47Eþ08 3.35Eþ08
G. Veit-Kohler et al. / Deep-Sea Research II 58 (2011) 1983–1995 1989
upper centimeter of the sediment compared to the first samplingdate. At station 85 the relative bacterial density reached a minimumin the 2–3 cm layer, whereas the minimum at station 13 was reachedin deeper horizons.
3.3. Meiofauna abundances and community analysis
The total number of meiofauna organisms varied between10,120 and 4111 individuals per core (0–20 cm sediment depth).At station 13, a median of 788.14 ind. 10 cm�2 (min. 662.99 ind.10 cm�2; max. 1458.26 ind. 10 cm�2) and at station 85 a medianof 658.95 ind. 10 cm�2 (min. 592.38 ind. 10 cm�2; max.725.09 ind. 10 cm�2) was counted for the complete sedimentprofiles (Table 4). There was no statistical difference between thetotal number of individuals on the two sampling dates [nestedANOVA B(A)].
Nematoda was the most abundant taxon, with a mean relativeabundance of 83.1%, followed by copepod nauplii (countedseparately from adults and copepodids in order to elucidateecological aspects, 8.1%) and Copepoda (including adults andcopepodids, 5%). Other taxa found were Annelida, Ostracoda,Rotifera, Tantulocarida, Gastrotricha, Tardigrada, Loricifera, Iso-poda, Kinorhyncha, Tanaidacea, Bivalvia, Acari, Amphipoda,Cumacea and Gastropoda (listed in order of decreasing totalnumbers of individuals, with a maximum of 0.84% of occurrence).
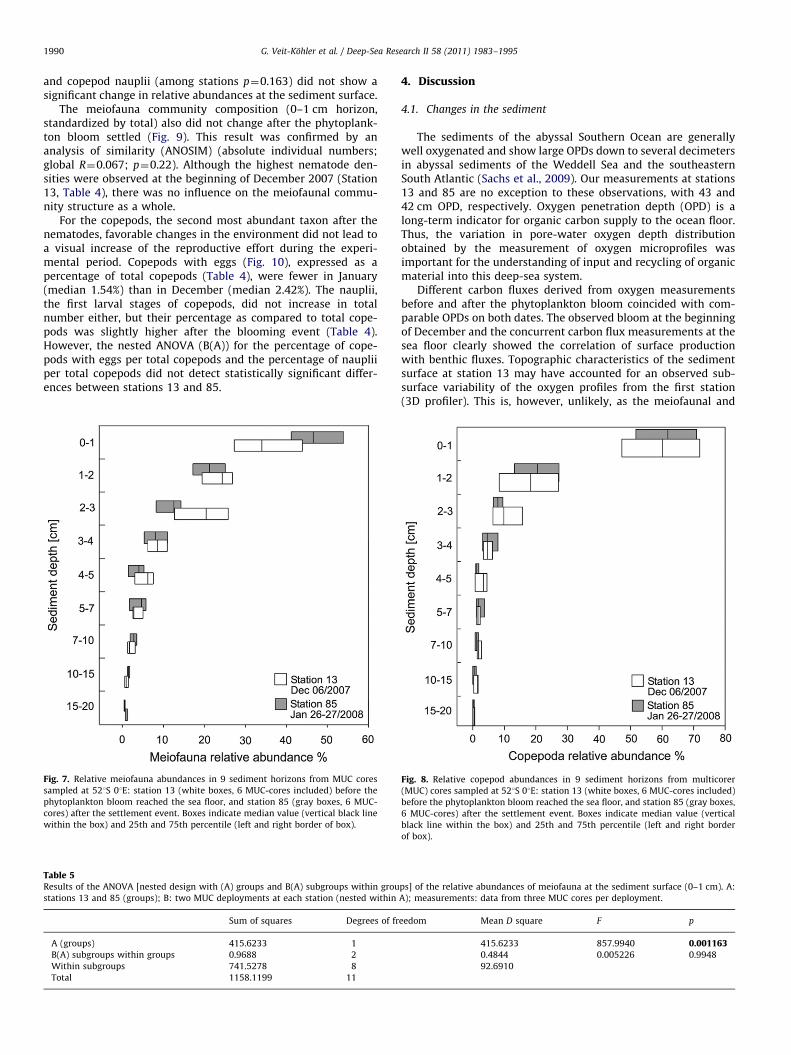
After the phytodetritus fall (station 85), the relative abundanceof metazoan meiofauna in the first sediment centimeter wassignificantly higher than before (Fig. 7). This finding is supportedby the results of the nested ANOVA [results for A (stations):p¼0.001; Table 5]. Additionally, meiofauna individual numbersdecreased more steeply within the first three centimeters in mostof the cores from station 85, compared to the earlier samplingdate at station 13 (Fig. 7). Nested ANOVAs for the 0–1 cmsediment horizon showed that Nematoda were mainly responsi-ble for the observed pattern (among stations p¼0.005), whileCopepoda (Fig. 8; adults and copepodids, among stations p¼0.83)
nd copepod nauplii per multicorer (MUC) core (69.4 cm2) from six cores per station
ate at 521S 01E (2963–2970 m): station 13 (12/06/07) before and station 85 (01/26–
14-1 13-14-4 13-14-9 85-5-2 85-5-3 85-5-11 85-7-1 85-7-4 85-7-8
0 0 0 0 1 0 0 0
0 0 0 0 0 0 1 0
43 36 65 70 49 38 51 36
2 1 2 0 2 2 0 0
335 192 313 268 249 274 245 201
6 7 11 5 3 2 2 4
540 339 643 488 348 388 351 406
0 0 0 1 0 0 0 0
9 4 16 12 11 11 5 5
0 0 0 0 0 0 0 1
3 3 5 1 2 3 3 1
1 0 5 6 5 1 1 0
4 2 4 8 6 4 1 8
8 5698 4015 3886 3210 4024 3882 3706 3408
27 28 40 26 24 44 21 18
78 34 21 10 20 2 18 8
3 2 1 0 3 3 5 3
2 0 8 119 3 24 47 2
1 1 17 17 13 7 3 3
8 11 6 37 12 3 2 11
20 6754 4668 5032 4273 4772 4686 4460 4111
1.79 3.65 3.51 1.87 1.2 0.73 0.82 1.99
2 61.19 76.56 105.43 82.09 39.76 41.61 43.27 101.99
G. Veit-Kohler et al. / Deep-Sea Research II 58 (2011) 1983–19951990
and copepod nauplii (among stations p¼0.163) did not show asignificant change in relative abundances at the sediment surface.
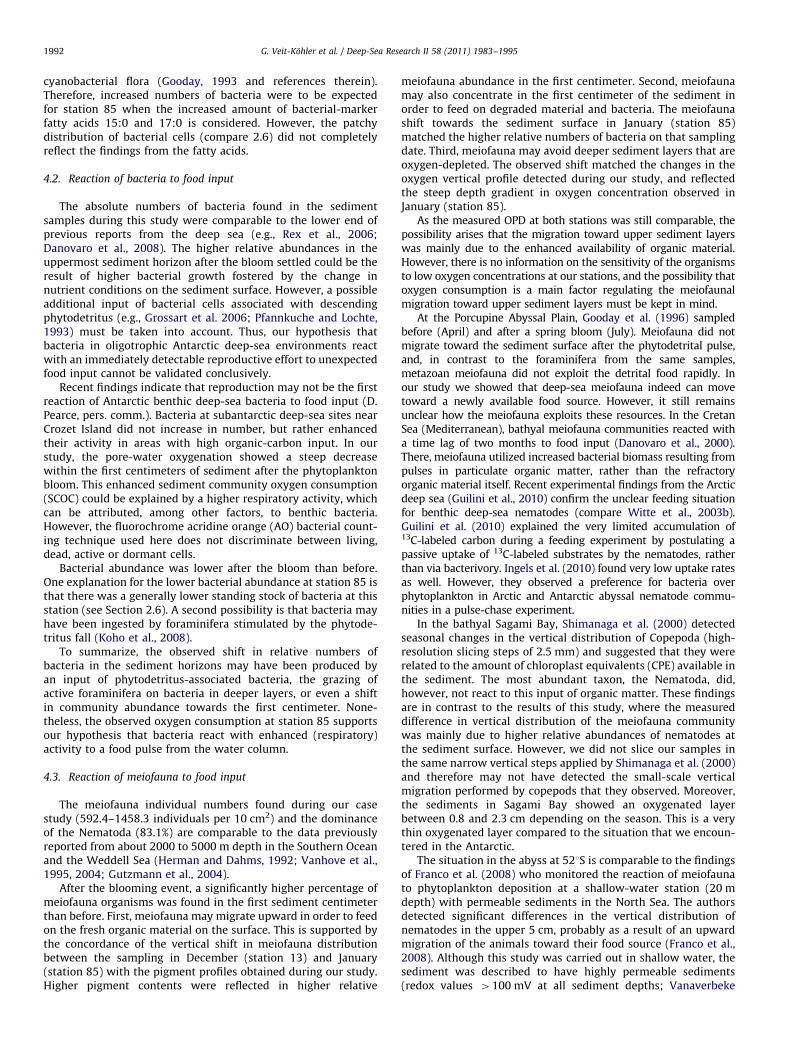
The meiofauna community composition (0–1 cm horizon,standardized by total) also did not change after the phytoplank-ton bloom settled (Fig. 9). This result was confirmed by ananalysis of similarity (ANOSIM) (absolute individual numbers;global R¼0.067; p¼0.22). Although the highest nematode den-sities were observed at the beginning of December 2007 (Station13, Table 4), there was no influence on the meiofaunal commu-nity structure as a whole.
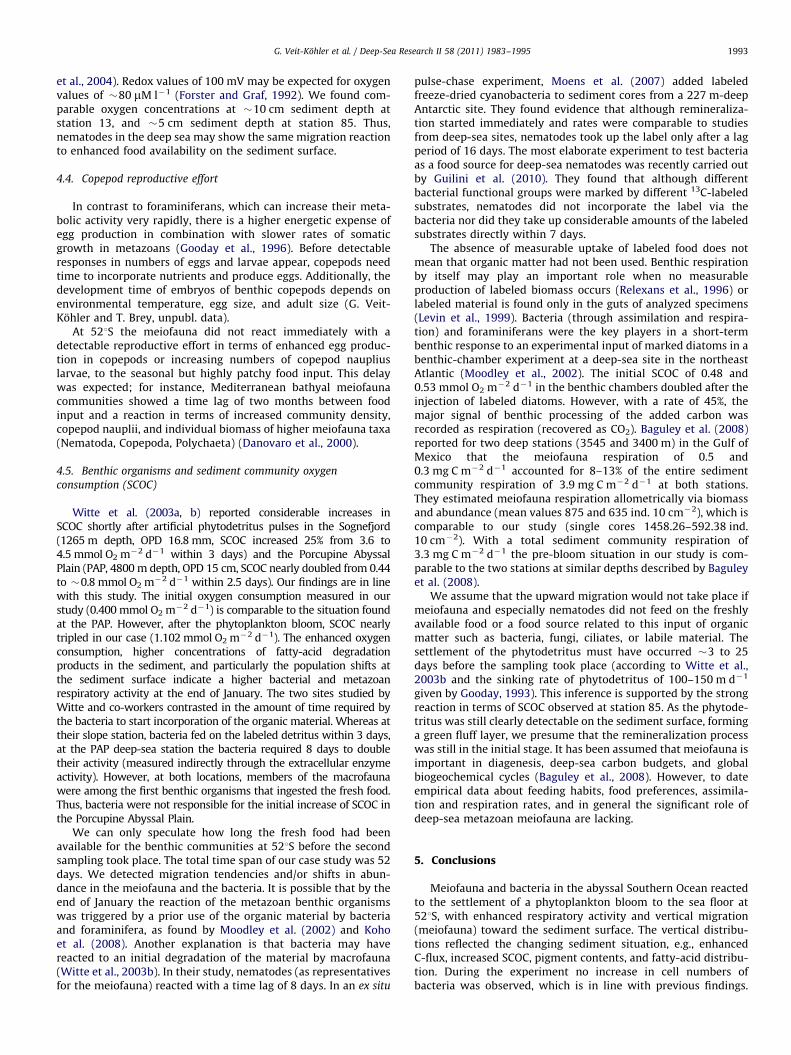
For the copepods, the second most abundant taxon after thenematodes, favorable changes in the environment did not lead toa visual increase of the reproductive effort during the experi-mental period. Copepods with eggs (Fig. 10), expressed as apercentage of total copepods (Table 4), were fewer in January(median 1.54%) than in December (median 2.42%). The nauplii,the first larval stages of copepods, did not increase in totalnumber either, but their percentage as compared to total cope-pods was slightly higher after the blooming event (Table 4).However, the nested ANOVA (B(A)) for the percentage of cope-pods with eggs per total copepods and the percentage of naupliiper total copepods did not detect statistically significant differ-ences between stations 13 and 85.
Fig. 7. Relative meiofauna abundances in 9 sediment horizons from MUC cores
sampled at 521S 01E: station 13 (white boxes, 6 MUC-cores included) before the
phytoplankton bloom reached the sea floor, and station 85 (gray boxes, 6 MUC-
cores) after the settlement event. Boxes indicate median value (vertical black line
within the box) and 25th and 75th percentile (left and right border of box).
Table 5Results of the ANOVA [nested design with (A) groups and B(A) subgroups within grou
stations 13 and 85 (groups); B: two MUC deployments at each station (nested within
Sum of squares Degrees of fr
A (groups) 415.6233 1
B(A) subgroups within groups 0.9688 2
Within subgroups 741.5278 8
Total 1158.1199 11
4. Discussion
4.1. Changes in the sediment
The sediments of the abyssal Southern Ocean are generallywell oxygenated and show large OPDs down to several decimetersin abyssal sediments of the Weddell Sea and the southeasternSouth Atlantic (Sachs et al., 2009). Our measurements at stations13 and 85 are no exception to these observations, with 43 and42 cm OPD, respectively. Oxygen penetration depth (OPD) is along-term indicator for organic carbon supply to the ocean floor.Thus, the variation in pore-water oxygen depth distributionobtained by the measurement of oxygen microprofiles wasimportant for the understanding of input and recycling of organicmaterial into this deep-sea system.
Different carbon fluxes derived from oxygen measurementsbefore and after the phytoplankton bloom coincided with com-parable OPDs on both dates. The observed bloom at the beginningof December and the concurrent carbon flux measurements at thesea floor clearly showed the correlation of surface productionwith benthic fluxes. Topographic characteristics of the sedimentsurface at station 13 may have accounted for an observed sub-surface variability of the oxygen profiles from the first station(3D profiler). This is, however, unlikely, as the meiofaunal and
ps] of the relative abundances of meiofauna at the sediment surface (0–1 cm). A:
A); measurements: data from three MUC cores per deployment.
eedom Mean D square F p
415.6233 857.9940 0.0011630.4844 0.005226 0.9948
92.6910
Fig. 8. Relative copepod abundances in 9 sediment horizons from multicorer
(MUC) cores sampled at 521S 01E: station 13 (white boxes, 6 MUC-cores included)
before the phytoplankton bloom reached the sea floor, and station 85 (gray boxes,
6 MUC-cores) after the settlement event. Boxes indicate median value (vertical
black line within the box) and 25th and 75th percentile (left and right border
of box).
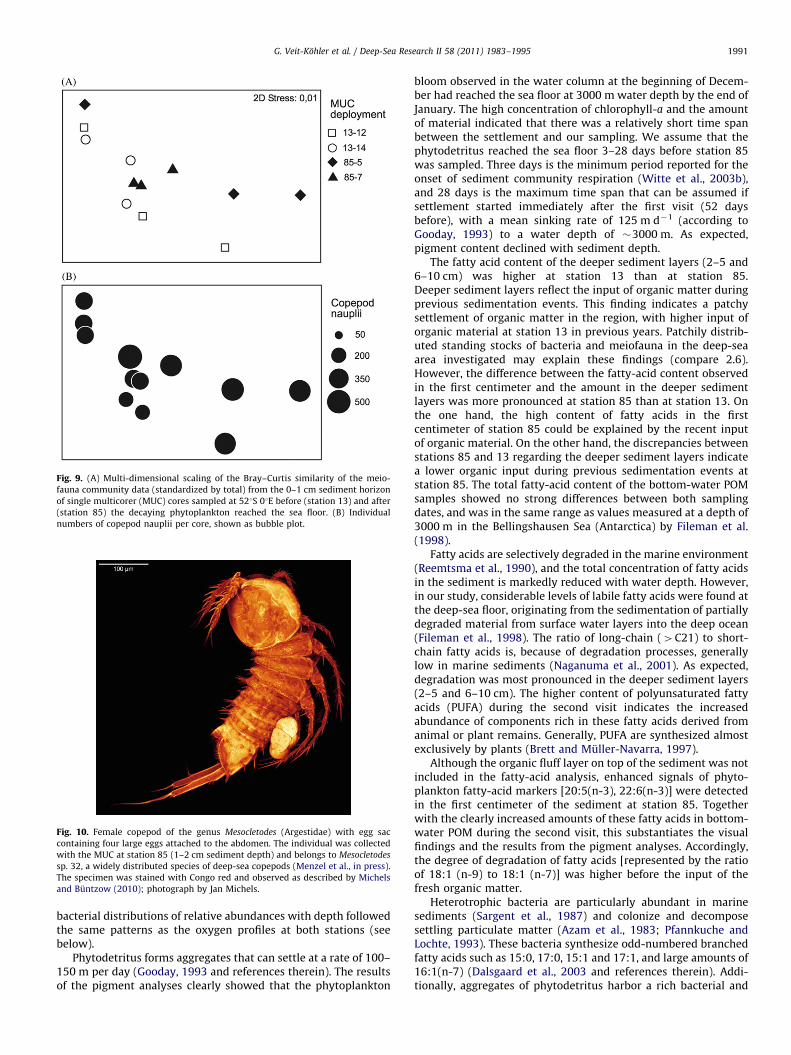
Fig. 9. (A) Multi-dimensional scaling of the Bray–Curtis similarity of the meio-
fauna community data (standardized by total) from the 0–1 cm sediment horizon
of single multicorer (MUC) cores sampled at 521S 01E before (station 13) and after
(station 85) the decaying phytoplankton reached the sea floor. (B) Individual
numbers of copepod nauplii per core, shown as bubble plot.
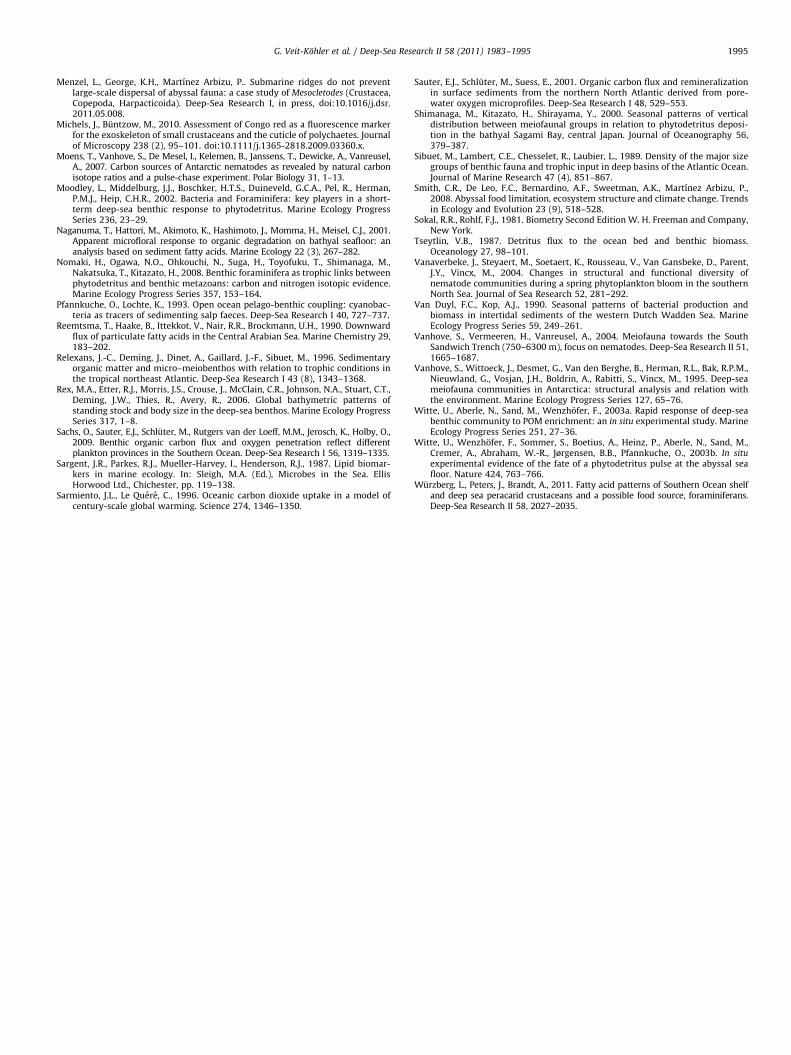
Fig. 10. Female copepod of the genus Mesocletodes (Argestidae) with egg sac
containing four large eggs attached to the abdomen. The individual was collected
with the MUC at station 85 (1–2 cm sediment depth) and belongs to Mesocletodes
sp. 32, a widely distributed species of deep-sea copepods (Menzel et al., in press).
The specimen was stained with Congo red and observed as described by Michels
and Buntzow (2010); photograph by Jan Michels.
G. Veit-Kohler et al. / Deep-Sea Research II 58 (2011) 1983–1995 1991
bacterial distributions of relative abundances with depth followedthe same patterns as the oxygen profiles at both stations (seebelow).
Phytodetritus forms aggregates that can settle at a rate of 100–150 m per day (Gooday, 1993 and references therein). The resultsof the pigment analyses clearly showed that the phytoplankton
bloom observed in the water column at the beginning of Decem-ber had reached the sea floor at 3000 m water depth by the end ofJanuary. The high concentration of chlorophyll-a and the amountof material indicated that there was a relatively short time spanbetween the settlement and our sampling. We assume that thephytodetritus reached the sea floor 3–28 days before station 85was sampled. Three days is the minimum period reported for theonset of sediment community respiration (Witte et al., 2003b),and 28 days is the maximum time span that can be assumed ifsettlement started immediately after the first visit (52 daysbefore), with a mean sinking rate of 125 m d�1 (according toGooday, 1993) to a water depth of �3000 m. As expected,pigment content declined with sediment depth.
The fatty acid content of the deeper sediment layers (2–5 and6–10 cm) was higher at station 13 than at station 85.Deeper sediment layers reflect the input of organic matter duringprevious sedimentation events. This finding indicates a patchysettlement of organic matter in the region, with higher input oforganic material at station 13 in previous years. Patchily distrib-uted standing stocks of bacteria and meiofauna in the deep-seaarea investigated may explain these findings (compare 2.6).However, the difference between the fatty-acid content observedin the first centimeter and the amount in the deeper sedimentlayers was more pronounced at station 85 than at station 13. Onthe one hand, the high content of fatty acids in the firstcentimeter of station 85 could be explained by the recent inputof organic material. On the other hand, the discrepancies betweenstations 85 and 13 regarding the deeper sediment layers indicatea lower organic input during previous sedimentation events atstation 85. The total fatty-acid content of the bottom-water POMsamples showed no strong differences between both samplingdates, and was in the same range as values measured at a depth of3000 m in the Bellingshausen Sea (Antarctica) by Fileman et al.(1998).
Fatty acids are selectively degraded in the marine environment(Reemtsma et al., 1990), and the total concentration of fatty acidsin the sediment is markedly reduced with water depth. However,in our study, considerable levels of labile fatty acids were found atthe deep-sea floor, originating from the sedimentation of partiallydegraded material from surface water layers into the deep ocean(Fileman et al., 1998). The ratio of long-chain (4C21) to short-chain fatty acids is, because of degradation processes, generallylow in marine sediments (Naganuma et al., 2001). As expected,degradation was most pronounced in the deeper sediment layers(2–5 and 6–10 cm). The higher content of polyunsaturated fattyacids (PUFA) during the second visit indicates the increasedabundance of components rich in these fatty acids derived fromanimal or plant remains. Generally, PUFA are synthesized almostexclusively by plants (Brett and Muller-Navarra, 1997).
Although the organic fluff layer on top of the sediment was notincluded in the fatty-acid analysis, enhanced signals of phyto-plankton fatty-acid markers [20:5(n-3), 22:6(n-3)] were detectedin the first centimeter of the sediment at station 85. Togetherwith the clearly increased amounts of these fatty acids in bottom-water POM during the second visit, this substantiates the visualfindings and the results from the pigment analyses. Accordingly,the degree of degradation of fatty acids [represented by the ratioof 18:1 (n-9) to 18:1 (n-7)] was higher before the input of thefresh organic matter.
Heterotrophic bacteria are particularly abundant in marinesediments (Sargent et al., 1987) and colonize and decomposesettling particulate matter (Azam et al., 1983; Pfannkuche andLochte, 1993). These bacteria synthesize odd-numbered branchedfatty acids such as 15:0, 17:0, 15:1 and 17:1, and large amounts of16:1(n-7) (Dalsgaard et al., 2003 and references therein). Addi-tionally, aggregates of phytodetritus harbor a rich bacterial and
G. Veit-Kohler et al. / Deep-Sea Research II 58 (2011) 1983–19951992
cyanobacterial flora (Gooday, 1993 and references therein).Therefore, increased numbers of bacteria were to be expectedfor station 85 when the increased amount of bacterial-markerfatty acids 15:0 and 17:0 is considered. However, the patchydistribution of bacterial cells (compare 2.6) did not completelyreflect the findings from the fatty acids.
4.2. Reaction of bacteria to food input
The absolute numbers of bacteria found in the sedimentsamples during this study were comparable to the lower end ofprevious reports from the deep sea (e.g., Rex et al., 2006;Danovaro et al., 2008). The higher relative abundances in theuppermost sediment horizon after the bloom settled could be theresult of higher bacterial growth fostered by the change innutrient conditions on the sediment surface. However, a possibleadditional input of bacterial cells associated with descendingphytodetritus (e.g., Grossart et al. 2006; Pfannkuche and Lochte,1993) must be taken into account. Thus, our hypothesis thatbacteria in oligotrophic Antarctic deep-sea environments reactwith an immediately detectable reproductive effort to unexpectedfood input cannot be validated conclusively.
Recent findings indicate that reproduction may not be the firstreaction of Antarctic benthic deep-sea bacteria to food input (D.Pearce, pers. comm.). Bacteria at subantarctic deep-sea sites nearCrozet Island did not increase in number, but rather enhancedtheir activity in areas with high organic-carbon input. In ourstudy, the pore-water oxygenation showed a steep decreasewithin the first centimeters of sediment after the phytoplanktonbloom. This enhanced sediment community oxygen consumption(SCOC) could be explained by a higher respiratory activity, whichcan be attributed, among other factors, to benthic bacteria.However, the fluorochrome acridine orange (AO) bacterial count-ing technique used here does not discriminate between living,dead, active or dormant cells.
Bacterial abundance was lower after the bloom than before.One explanation for the lower bacterial abundance at station 85 isthat there was a generally lower standing stock of bacteria at thisstation (see Section 2.6). A second possibility is that bacteria mayhave been ingested by foraminifera stimulated by the phytode-tritus fall (Koho et al., 2008).
To summarize, the observed shift in relative numbers ofbacteria in the sediment horizons may have been produced byan input of phytodetritus-associated bacteria, the grazing ofactive foraminifera on bacteria in deeper layers, or even a shiftin community abundance towards the first centimeter. None-theless, the observed oxygen consumption at station 85 supportsour hypothesis that bacteria react with enhanced (respiratory)activity to a food pulse from the water column.
4.3. Reaction of meiofauna to food input
The meiofauna individual numbers found during our casestudy (592.4–1458.3 individuals per 10 cm2) and the dominanceof the Nematoda (83.1%) are comparable to the data previouslyreported from about 2000 to 5000 m depth in the Southern Oceanand the Weddell Sea (Herman and Dahms, 1992; Vanhove et al.,1995, 2004; Gutzmann et al., 2004).
After the blooming event, a significantly higher percentage ofmeiofauna organisms was found in the first sediment centimeterthan before. First, meiofauna may migrate upward in order to feedon the fresh organic material on the surface. This is supported bythe concordance of the vertical shift in meiofauna distributionbetween the sampling in December (station 13) and January(station 85) with the pigment profiles obtained during our study.Higher pigment contents were reflected in higher relative
meiofauna abundance in the first centimeter. Second, meiofaunamay also concentrate in the first centimeter of the sediment inorder to feed on degraded material and bacteria. The meiofaunashift towards the sediment surface in January (station 85)matched the higher relative numbers of bacteria on that samplingdate. Third, meiofauna may avoid deeper sediment layers that areoxygen-depleted. The observed shift matched the changes in theoxygen vertical profile detected during our study, and reflectedthe steep depth gradient in oxygen concentration observed inJanuary (station 85).
As the measured OPD at both stations was still comparable, thepossibility arises that the migration toward upper sediment layerswas mainly due to the enhanced availability of organic material.However, there is no information on the sensitivity of the organismsto low oxygen concentrations at our stations, and the possibility thatoxygen consumption is a main factor regulating the meiofaunalmigration toward upper sediment layers must be kept in mind.
At the Porcupine Abyssal Plain, Gooday et al. (1996) sampledbefore (April) and after a spring bloom (July). Meiofauna did notmigrate toward the sediment surface after the phytodetrital pulse,and, in contrast to the foraminifera from the same samples,metazoan meiofauna did not exploit the detrital food rapidly. Inour study we showed that deep-sea meiofauna indeed can movetoward a newly available food source. However, it still remainsunclear how the meiofauna exploits these resources. In the CretanSea (Mediterranean), bathyal meiofauna communities reacted witha time lag of two months to food input (Danovaro et al., 2000).There, meiofauna utilized increased bacterial biomass resulting frompulses in particulate organic matter, rather than the refractoryorganic material itself. Recent experimental findings from the Arcticdeep sea (Guilini et al., 2010) confirm the unclear feeding situationfor benthic deep-sea nematodes (compare Witte et al., 2003b).Guilini et al. (2010) explained the very limited accumulation of13C-labeled carbon during a feeding experiment by postulating apassive uptake of 13C-labeled substrates by the nematodes, ratherthan via bacterivory. Ingels et al. (2010) found very low uptake ratesas well. However, they observed a preference for bacteria overphytoplankton in Arctic and Antarctic abyssal nematode commu-nities in a pulse-chase experiment.
In the bathyal Sagami Bay, Shimanaga et al. (2000) detectedseasonal changes in the vertical distribution of Copepoda (high-resolution slicing steps of 2.5 mm) and suggested that they wererelated to the amount of chloroplast equivalents (CPE) available inthe sediment. The most abundant taxon, the Nematoda, did,however, not react to this input of organic matter. These findingsare in contrast to the results of this study, where the measureddifference in vertical distribution of the meiofauna communitywas mainly due to higher relative abundances of nematodes atthe sediment surface. However, we did not slice our samples inthe same narrow vertical steps applied by Shimanaga et al. (2000)and therefore may not have detected the small-scale verticalmigration performed by copepods that they observed. Moreover,the sediments in Sagami Bay showed an oxygenated layerbetween 0.8 and 2.3 cm depending on the season. This is a verythin oxygenated layer compared to the situation that we encoun-tered in the Antarctic.
The situation in the abyss at 521S is comparable to the findingsof Franco et al. (2008) who monitored the reaction of meiofaunato phytoplankton deposition at a shallow-water station (20 mdepth) with permeable sediments in the North Sea. The authorsdetected significant differences in the vertical distribution ofnematodes in the upper 5 cm, probably as a result of an upwardmigration of the animals toward their food source (Franco et al.,2008). Although this study was carried out in shallow water, thesediment was described to have highly permeable sediments(redox values 4100 mV at all sediment depths; Vanaverbeke
G. Veit-Kohler et al. / Deep-Sea Research II 58 (2011) 1983–1995 1993
et al., 2004). Redox values of 100 mV may be expected for oxygenvalues of �80 mM l�1 (Forster and Graf, 1992). We found com-parable oxygen concentrations at �10 cm sediment depth atstation 13, and �5 cm sediment depth at station 85. Thus,nematodes in the deep sea may show the same migration reactionto enhanced food availability on the sediment surface.
4.4. Copepod reproductive effort
In contrast to foraminiferans, which can increase their meta-bolic activity very rapidly, there is a higher energetic expense ofegg production in combination with slower rates of somaticgrowth in metazoans (Gooday et al., 1996). Before detectableresponses in numbers of eggs and larvae appear, copepods needtime to incorporate nutrients and produce eggs. Additionally, thedevelopment time of embryos of benthic copepods depends onenvironmental temperature, egg size, and adult size (G. Veit-Kohler and T. Brey, unpubl. data).
At 521S the meiofauna did not react immediately with adetectable reproductive effort in terms of enhanced egg produc-tion in copepods or increasing numbers of copepod naupliuslarvae, to the seasonal but highly patchy food input. This delaywas expected; for instance, Mediterranean bathyal meiofaunacommunities showed a time lag of two months between foodinput and a reaction in terms of increased community density,copepod nauplii, and individual biomass of higher meiofauna taxa(Nematoda, Copepoda, Polychaeta) (Danovaro et al., 2000).
4.5. Benthic organisms and sediment community oxygen
consumption (SCOC)
Witte et al. (2003a, b) reported considerable increases inSCOC shortly after artificial phytodetritus pulses in the Sognefjord(1265 m depth, OPD 16.8 mm, SCOC increased 25% from 3.6 to4.5 mmol O2 m�2 d�1 within 3 days) and the Porcupine AbyssalPlain (PAP, 4800 m depth, OPD 15 cm, SCOC nearly doubled from 0.44to �0.8 mmol O2 m�2 d�1 within 2.5 days). Our findings are in linewith this study. The initial oxygen consumption measured in ourstudy (0.400 mmol O2 m�2 d�1) is comparable to the situation foundat the PAP. However, after the phytoplankton bloom, SCOC nearlytripled in our case (1.102 mmol O2 m�2 d�1). The enhanced oxygenconsumption, higher concentrations of fatty-acid degradationproducts in the sediment, and particularly the population shifts atthe sediment surface indicate a higher bacterial and metazoanrespiratory activity at the end of January. The two sites studied byWitte and co-workers contrasted in the amount of time required bythe bacteria to start incorporation of the organic material. Whereas attheir slope station, bacteria fed on the labeled detritus within 3 days,at the PAP deep-sea station the bacteria required 8 days to doubletheir activity (measured indirectly through the extracellular enzymeactivity). However, at both locations, members of the macrofaunawere among the first benthic organisms that ingested the fresh food.Thus, bacteria were not responsible for the initial increase of SCOC inthe Porcupine Abyssal Plain.
We can only speculate how long the fresh food had beenavailable for the benthic communities at 521S before the secondsampling took place. The total time span of our case study was 52days. We detected migration tendencies and/or shifts in abun-dance in the meiofauna and the bacteria. It is possible that by theend of January the reaction of the metazoan benthic organismswas triggered by a prior use of the organic material by bacteriaand foraminifera, as found by Moodley et al. (2002) and Kohoet al. (2008). Another explanation is that bacteria may havereacted to an initial degradation of the material by macrofauna(Witte et al., 2003b). In their study, nematodes (as representativesfor the meiofauna) reacted with a time lag of 8 days. In an ex situ
pulse-chase experiment, Moens et al. (2007) added labeledfreeze-dried cyanobacteria to sediment cores from a 227 m-deepAntarctic site. They found evidence that although remineraliza-tion started immediately and rates were comparable to studiesfrom deep-sea sites, nematodes took up the label only after a lagperiod of 16 days. The most elaborate experiment to test bacteriaas a food source for deep-sea nematodes was recently carried outby Guilini et al. (2010). They found that although differentbacterial functional groups were marked by different 13C-labeledsubstrates, nematodes did not incorporate the label via thebacteria nor did they take up considerable amounts of the labeledsubstrates directly within 7 days.
The absence of measurable uptake of labeled food does notmean that organic matter had not been used. Benthic respirationby itself may play an important role when no measurableproduction of labeled biomass occurs (Relexans et al., 1996) orlabeled material is found only in the guts of analyzed specimens(Levin et al., 1999). Bacteria (through assimilation and respira-tion) and foraminiferans were the key players in a short-termbenthic response to an experimental input of marked diatoms in abenthic-chamber experiment at a deep-sea site in the northeastAtlantic (Moodley et al., 2002). The initial SCOC of 0.48 and0.53 mmol O2 m�2 d�1 in the benthic chambers doubled after theinjection of labeled diatoms. However, with a rate of 45%, themajor signal of benthic processing of the added carbon wasrecorded as respiration (recovered as CO2). Baguley et al. (2008)reported for two deep stations (3545 and 3400 m) in the Gulf ofMexico that the meiofauna respiration of 0.5 and0.3 mg C m�2 d�1 accounted for 8–13% of the entire sedimentcommunity respiration of 3.9 mg C m�2 d�1 at both stations.They estimated meiofauna respiration allometrically via biomassand abundance (mean values 875 and 635 ind. 10 cm�2), which iscomparable to our study (single cores 1458.26–592.38 ind.10 cm�2). With a total sediment community respiration of3.3 mg C m�2 d�1 the pre-bloom situation in our study is com-parable to the two stations at similar depths described by Baguleyet al. (2008).
We assume that the upward migration would not take place ifmeiofauna and especially nematodes did not feed on the freshlyavailable food or a food source related to this input of organicmatter such as bacteria, fungi, ciliates, or labile material. Thesettlement of the phytodetritus must have occurred �3 to 25days before the sampling took place (according to Witte et al.,2003b and the sinking rate of phytodetritus of 100–150 m d�1
given by Gooday, 1993). This inference is supported by the strongreaction in terms of SCOC observed at station 85. As the phytode-tritus was still clearly detectable on the sediment surface, forminga green fluff layer, we presume that the remineralization processwas still in the initial stage. It has been assumed that meiofauna isimportant in diagenesis, deep-sea carbon budgets, and globalbiogeochemical cycles (Baguley et al., 2008). However, to dateempirical data about feeding habits, food preferences, assimila-tion and respiration rates, and in general the significant role ofdeep-sea metazoan meiofauna are lacking.
5. Conclusions
Meiofauna and bacteria in the abyssal Southern Ocean reactedto the settlement of a phytoplankton bloom to the sea floor at521S, with enhanced respiratory activity and vertical migration(meiofauna) toward the sediment surface. The vertical distribu-tions reflected the changing sediment situation, e.g., enhancedC-flux, increased SCOC, pigment contents, and fatty-acid distribu-tion. During the experiment no increase in cell numbers ofbacteria was observed, which is in line with previous findings.
G. Veit-Kohler et al. / Deep-Sea Research II 58 (2011) 1983–19951994
Reproductive parameters of copepods (number of egg-carryingfemales and nauplius larvae) did not differ between the twosampling dates.
Acknowledgments
We thank Captain U. Pahl and the crew of RV Polarstern, thecruise leader Prof. Dr. Ulrich Bathmann, and SYSTCO projectleader Prof. Dr. Angelika Brandt for their help and support duringthe ANT XXIV-2 expedition. Annika Hellmann (DZMB) was incharge of the SYSTCO-logistics and the multicorer deploymentson board. We acknowledge the technical assistance of WernerDimmler with lander preparation. Dr. Volker Strass and the CTD-team provided the water samples on board. At the DZMB inWilhelmshaven, Marco Bruhn coordinated sample treatment andsorted the meiofauna, and Katharina Bruch and Daniela Hugohelped considerably with sample processing. Dr. Janna Peters(IHF, Hamburg) and Solveig Buhring (University of Bremen)supported the fatty acid analyses and data interpretation.At UGent we thank Jeroen Vanwichelen and Dirk Van Gansbekefor technical support during bacterial counting. The Census ofMarine Life projects CeDAMar and CAML as well as Senckenbergam Meer – DZMB are thanked for financial and logistical supportof the SYSTCO-team. G. Veit-Kohler acknowledges a travel grantfrom the Friedrich Wilhelm und Elise Marx-Stiftung. K. Guiliniacknowledges the Flanders Fund for Scientific Research (FWO,project number 3G0346), the Special Research Fund (BOF, Therelation between FUNction and biodiversity of nematoda in theDEEP-sea (FUNDEEP), project number 01J14909), and the BelgianScience Policy [Belspo, Biodiversity of three representative groupsof the Antarctic Zoobenthos – Coping with Change (BIANZO II),research project SD/BA/02A]. L. Wurzberg was supported by aUniversity of Hamburg grant. The contribution of E.J. Sauter andO. Sachs (flux measurements) was funded by DFG grants SA1030/2-1þ2. Dr. Janet Reid proofread the English, and two anonymousreviewers are thanked for their comments, which improved themanuscript considerably.
References
Anderson, L.A., Sarmiento, J.L., 1994. Redfield ratios of remineralization deter-mined by nutrient data analysis. Global Biogeochemical Cycles 8, 65–80.
Azam, F., Fenchel, T., Field, J.G., Gray, J.S., Meyer-Reil, L.A., Thingstad, F., 1983. Theecological role of water column microbes in the sea. Marine Ecology ProgressSeries 10, 257–263.
Baguley, J.G., Montagna, P.A., Hyde, L.J., Rowe, G.T., 2008. Metazoan meiofaunabiomass, grazing, and weight-dependent respiration in the northern Gulf ofMexico deep sea. Deep-Sea Research II 55, 2607–2616.
Berg, P., Risgaard-Petersen, N., Rysgaard, S., 1998. Interpretation of measuredconcentration profiles in sediment pore water. Limnology and Oceanography43, 1500–1510.
Billet, D.S.M., Lampitt, R.S., Rice, A.L., Mantoura, R.F.C., 1983. Seasonal sedimenta-tion of phytoplankton to the deep-sea benthos. Nature 302, 520–522.
Brandt, A., Ebbe, B., Bathmann, U., 2011. Southern Ocean biodiversity — Frompelagic processes to deep-sea response. Deep-Sea Research II 58, 1945–1947.
Brett, M.T., Muller-Navarra, D.C., 1997. The role of highly unsaturated fatty acids inaquatic food web processes. Freshwater Biology 38, 483–499.
Cahet, G., Sibuet, M., 1986. Activite biologique en domaine profond: transforma-tions biochimiques in situ de composes organiques marques au carbone-14 �al’interface eau-sediment par 2000 m de profondeur dans le golfe de Gascogne.Marine Biology 90, 307–315.
Clarke, K.R., Gorley, R.N., 2006. PRIMER v6: User Manual/Tutorial. PRIMER-E,Plymouth.
Coull, B.C., 1988. 3. Ecology of the marine meiofauna. In: Higgins, R.P., Thiel, H.(Eds.), Introduction to the Study of Meiofauna. Smithsonian Institution Press,Washington, pp. 18–38.
Dalsgaard, J., St. John, M., Kattner, G., Muller-Navarra, D., Hagen, W., 2003. Fattyacid trophic markers in the pelagic marine environment. Advances in MarineBiology 46, 225–340.
Danovaro, R., Dell’Anno, A., Corinaldesi, C., Magagnini, M., Noble, R., Tamburini, C.,Weinbauer, M., 2008. Major viral impact on the functioning of benthic deep-sea ecosystems. Nature 454, 1084–1087.
Danovaro, R., Tselepides, A., Otegui, A., Della Croce, N., 2000. Dynamics ofmeiofaunal assemblages on the continental shelf and deep-sea sediments ofthe Cretan Sea (NE Mediterranean): relationships with seasonal changes infood supply. Progress in Oceanography 46, 367–400.
De Wit, R., Relexans, J.-C., Bouvier, T., Moriarty, D.J.W., 1997. Microbial respirationand diffusive oxygen uptake of deep-sea sediments in the Southern Ocean(ANTARES-I cruise). Deep-Sea Research II 44 (5), 1053–1068.
Fileman, T.W., Pond, D.W., Barlow, R.G., Mantoura, R.F.C., 1998. Vertical profiles ofpigments, fatty acids and amino acids: evidence for undegraded diatomaceousmaterial sedimenting to the deep ocean in the Bellingshausen Sea, Antarctica.Deep-Sea Research I 45, 333–346.
Folch, J., Lees, M., Sloane-Stanley, G.H., 1957. A simple method for the isolation andpurification of total lipids from animal tissues. Journal of Biological Chemistry226, 497–509.
Forster, S., Graf, G., 1992. Continuously measured changes in redox potentialinfluenced by oxygen penetrating from burrows of Callianassa subterranea.Hydrobiologia 235/236, 527–532.
Franco, M.A., Soetaert, K., Van Oevelen, D., Van Gansbeke, D., Costa, M.J., Vincx, M.,Vanaverbeke, J., 2008. Density, vertical distribution and trophic responses ofmetazoan meiobenthos to phytoplankton deposition in contrasting sedimenttypes. Marine Ecology Progress Series 358, 51–62.
Giere, O., 1993. Meiobenthology—The Microscopic Fauna in Aquatic Sediments.Springer Verlag, Berlin, Heidelberg.
Graf, G., 1989. Benthic–pelagic coupling in a deep-sea benthic community. Nature341, 437–439.
Graf, G., 1992. Benthic–pelagic coupling: a benthic view. Oceanography andMarine Biology. An Annual Review 30, 149–190.
Gooday, A.J., 1993. Deep-sea benthic foraminiferal species which exploit phytode-tritus: characteristic features and controls on distribution. Marine Micropa-leontology 22, 187–205.
Gooday, A.J., Pfannkuche, O., Lambshead, P.J.D., 1996. An apparent lack of responseby metazoan meiofauna to phytodetritus deposition in the bathyal north-eastern Atlantic. Journal of the Marine Biological Association of the UnitedKingdom 76, 297–310.
Gooday, A.J., Turley, C.M., 1990. Responses by benthic organisms to inputs oforganic material to the ocean floor: a review. Philosophical Transactions of theRoyal Society of London Series A 331, 119–138.
Grossart, H.-P., Czub, G., Meinhard, S., 2006. Algae–bacteria interactions and theireffects on aggregation and organic matter flux in the sea. EnvironmentalMicrobiology 8 (6), 1074–1084. doi:10.1111/j.1462-2920.2006.00999.x.
Guilini, K., Van Oevelen, D., Soetaert, K., Middelburg, J.J., Vanreusel, A., 2010.Nutritional importance of benthic bacteria for deep-sea nematodes from theArctic ice margin: results of an isotope tracer experiment. Limnology andOceanography 55 (5), 1977–1989. doi:10.4319/lo.2010.55.5.1977.
Guilini, K., Soltwedel, T., van Oevelen, D., Vanreusel, A., 2011. Deep-sea nematodesactively colonise sediments, irrespective of the presence of a pulse of organicmatter: results from an in situ experiment. PLoS ONE 6 (4), e18912.doi:10.1371/journal.pone.0018912.
Gutzmann, E., Martınez Arbizu, P., Rose, A., Veit-Kohler, G., 2004. Meiofaunacommunities along an abyssal depth gradient in the Drake Passage. Deep-SeaResearch II 51 (14–16), 1617–1628. doi:10.1016/j.dsr2.2004.06.026.
Herman, R.L., Dahms, H.U., 1992. Meiofauna communities along a depthtransect off Halley Bay (Weddell Sea—Antarctica). Polar Biology 12,313–320.
Herrmann, S., Bathmann, U., 2010. Plankton parameters: Chlorophyll a, particulateorganic carbon, biological silica. In: Bathmann, U. (Ed.), The Expedition of theResearch Vessel ‘‘Polarstern’’ to the Antarctic in 2007/2008 (ANT-XXIV/2).Berichte zur Polar- und Meeresforschung, vol. 604, pp. 21–22.
Hobbie, J.E., Daley, R.J., Jasper, S., 1977. A method for counting bacteria onnuclepore filters. Applied and Environmental Microbiology 33, 1225–1228.
Hoffmann, L., Peeken, I., Lochte, K., Assmy, P., Veldhuis, M., 2006. Differentreactions of Southern Ocean phytoplankton size classes to iron fertilization.Limnology and Oceanography 51, 1217–1229.
Ingels, J., Van den Driessche, P., De Mesel, I., Vanhove, S., Moens, T., Vanreusel, A.,2010. Preferred use of bacteria over phytoplankton by deep-sea nematodes inpolar regions. Marine Ecology Progress Series 406, 121–133. doi:10.3354/meps08535.
Kattner, G., Fricke, H.S.G., 1986. Simple gas–liquid chromatography method forsimultaneous determination of fatty acids and alcohols in wax esters ofmarine organisms. Journal of Chromatography 361, 263–268.
Koho, K.A., Langezaal, A.M., Van Lith, Y.A., Duijnstee, I.A.P., Van Der Zwaan, G.J.,2008. The influence of a simulated diatom bloom on deep-sea benthicforaminifera and the activity of bacteria: a mesocosm study. Deep-SeaResearch I 55, 696–719. doi:10.1016/j.dsr.2008.02.003.
Levin, L.A., Blair, N.E., Martin, C.M., Demaster, D.J., Plaia, G., Thomas, C.J., 1999.Macrofaunal processing of phytodetritus at two sites on the Carolina margin:in situ experiments using 13C-labeled diatoms. Marine Ecology Progress Series182, 37–54. doi:10.3354/meps182037.
Longhurst, A.R., Harrison, W.G., 1989. The biological pump: profiles of planktonproduction and consumption in the upper ocean. Progress in Oceanography 22(1), 47–123.
McDonald, J.H., 2009. Handbook of Biological Statistics 2nd ed. Sparky HousePublishing, Baltimore, Maryland.
McIntyre, A.D., Warwick, R.M., 1984. Meiofauna techniques. In: Holme, N.A.,McIntyre, A.D. (Eds.), Methods for the Study of Marine Benthos 2nd ed.Blackwell, pp. 217–244.
G. Veit-Kohler et al. / Deep-Sea Research II 58 (2011) 1983–1995 1995
Menzel, L., George, K.H., Martınez Arbizu, P.. Submarine ridges do not preventlarge-scale dispersal of abyssal fauna: a case study of Mesocletodes (Crustacea,Copepoda, Harpacticoida). Deep-Sea Research I, in press, doi:10.1016/j.dsr.2011.05.008.
Michels, J., Buntzow, M., 2010. Assessment of Congo red as a fluorescence markerfor the exoskeleton of small crustaceans and the cuticle of polychaetes. Journalof Microscopy 238 (2), 95–101. doi:10.1111/j.1365-2818.2009.03360.x.
Moens, T., Vanhove, S., De Mesel, I., Kelemen, B., Janssens, T., Dewicke, A., Vanreusel,A., 2007. Carbon sources of Antarctic nematodes as revealed by natural carbonisotope ratios and a pulse-chase experiment. Polar Biology 31, 1–13.
Moodley, L., Middelburg, J.J., Boschker, H.T.S., Duineveld, G.C.A., Pel, R., Herman,P.M.J., Heip, C.H.R., 2002. Bacteria and Foraminifera: key players in a short-term deep-sea benthic response to phytodetritus. Marine Ecology ProgressSeries 236, 23–29.
Naganuma, T., Hattori, M., Akimoto, K., Hashimoto, J., Momma, H., Meisel, C.J., 2001.Apparent microfloral response to organic degradation on bathyal seafloor: ananalysis based on sediment fatty acids. Marine Ecology 22 (3), 267–282.
Nomaki, H., Ogawa, N.O., Ohkouchi, N., Suga, H., Toyofuku, T., Shimanaga, M.,Nakatsuka, T., Kitazato, H., 2008. Benthic foraminifera as trophic links betweenphytodetritus and benthic metazoans: carbon and nitrogen isotopic evidence.Marine Ecology Progress Series 357, 153–164.
Pfannkuche, O., Lochte, K., 1993. Open ocean pelago-benthic coupling: cyanobac-teria as tracers of sedimenting salp faeces. Deep-Sea Research I 40, 727–737.
Reemtsma, T., Haake, B., Ittekkot, V., Nair, R.R., Brockmann, U.H., 1990. Downwardflux of particulate fatty acids in the Central Arabian Sea. Marine Chemistry 29,183–202.
Relexans, J.-C., Deming, J., Dinet, A., Gaillard, J.-F., Sibuet, M., 1996. Sedimentaryorganic matter and micro–meiobenthos with relation to trophic conditions inthe tropical northeast Atlantic. Deep-Sea Research I 43 (8), 1343–1368.
Rex, M.A., Etter, R.J., Morris, J.S., Crouse, J., McClain, C.R., Johnson, N.A., Stuart, C.T.,Deming, J.W., Thies, R., Avery, R., 2006. Global bathymetric patterns ofstanding stock and body size in the deep-sea benthos. Marine Ecology ProgressSeries 317, 1–8.
Sachs, O., Sauter, E.J., Schluter, M., Rutgers van der Loeff, M.M., Jerosch, K., Holby, O.,2009. Benthic organic carbon flux and oxygen penetration reflect differentplankton provinces in the Southern Ocean. Deep-Sea Research I 56, 1319–1335.
Sargent, J.R., Parkes, R.J., Mueller-Harvey, I., Henderson, R.J., 1987. Lipid biomar-kers in marine ecology. In: Sleigh, M.A. (Ed.), Microbes in the Sea. EllisHorwood Ltd., Chichester, pp. 119–138.
Sarmiento, J.L., Le Quere, C., 1996. Oceanic carbon dioxide uptake in a model ofcentury-scale global warming. Science 274, 1346–1350.
Sauter, E.J., Schluter, M., Suess, E., 2001. Organic carbon flux and remineralizationin surface sediments from the northern North Atlantic derived from pore-water oxygen microprofiles. Deep-Sea Research I 48, 529–553.
Shimanaga, M., Kitazato, H., Shirayama, Y., 2000. Seasonal patterns of verticaldistribution between meiofaunal groups in relation to phytodetritus deposi-tion in the bathyal Sagami Bay, central Japan. Journal of Oceanography 56,379–387.
Sibuet, M., Lambert, C.E., Chesselet, R., Laubier, L., 1989. Density of the major sizegroups of benthic fauna and trophic input in deep basins of the Atlantic Ocean.Journal of Marine Research 47 (4), 851–867.
Smith, C.R., De Leo, F.C., Bernardino, A.F., Sweetman, A.K., Martınez Arbizu, P.,2008. Abyssal food limitation, ecosystem structure and climate change. Trendsin Ecology and Evolution 23 (9), 518–528.
Sokal, R.R., Rohlf, F.J., 1981. Biometry Second Edition W. H. Freeman and Company,New York.
Tseytlin, V.B., 1987. Detritus flux to the ocean bed and benthic biomass.Oceanology 27, 98–101.
Vanaverbeke, J., Steyaert, M., Soetaert, K., Rousseau, V., Van Gansbeke, D., Parent,J.Y., Vincx, M., 2004. Changes in structural and functional diversity ofnematode communities during a spring phytoplankton bloom in the southernNorth Sea. Journal of Sea Research 52, 281–292.
Van Duyl, F.C., Kop, A.J., 1990. Seasonal patterns of bacterial production andbiomass in intertidal sediments of the western Dutch Wadden Sea. MarineEcology Progress Series 59, 249–261.
Vanhove, S., Vermeeren, H., Vanreusel, A., 2004. Meiofauna towards the SouthSandwich Trench (750–6300 m), focus on nematodes. Deep-Sea Research II 51,1665–1687.
Vanhove, S., Wittoeck, J., Desmet, G., Van den Berghe, B., Herman, R.L., Bak, R.P.M.,Nieuwland, G., Vosjan, J.H., Boldrin, A., Rabitti, S., Vincx, M., 1995. Deep-seameiofauna communities in Antarctica: structural analysis and relation withthe environment. Marine Ecology Progress Series 127, 65–76.
Witte, U., Aberle, N., Sand, M., Wenzhofer, F., 2003a. Rapid response of deep-seabenthic community to POM enrichment: an in situ experimental study. MarineEcology Progress Series 251, 27–36.
Witte, U., Wenzhofer, F., Sommer, S., Boetius, A., Heinz, P., Aberle, N., Sand, M.,Cremer, A., Abraham, W.-R., Jørgensen, B.B., Pfannkuche, O., 2003b. In situexperimental evidence of the fate of a phytodetritus pulse at the abyssal seafloor. Nature 424, 763–766.
Wurzberg, L., Peters, J., Brandt, A., 2011. Fatty acid patterns of Southern Ocean shelfand deep sea peracarid crustaceans and a possible food source, foraminiferans.Deep-Sea Research II 58, 2027–2035.
Related Documents