Antarctic climate signature in the Greenland ice core record Stephen Barker † and Gregor Knorr School of Earth, Ocean and Planetary Sciences, Cardiff University, Main Building, Park Place, Cardiff CF10 3YE, United Kingdom Communicated by Wallace S. Broecker, Lamont–Doherty Earth Observatory of Columbia University, Palisades, NY, September 11, 2007 (received for review June 26, 2007) A numerical algorithm is applied to the Greenland Ice Sheet Project 2 (GISP2) dust record from Greenland to remove the abrupt changes in dust flux associated with the Dansgaard–Oeschger (D–O) oscillations of the last glacial period. The procedure is based on the assumption that the rapid changes in dust are associated with large-scale changes in atmospheric transport and implies that D–O oscillations (in terms of their atmospheric imprint) are more symmetric in form than can be inferred from Greenland tempera- ture records. After removal of the abrupt shifts the residual, dejumped dust record is found to match Antarctic climate variabil- ity with a temporal lag of several hundred years. It is argued that such variability may reflect changes in the source region of Green- land dust (thought to be the deserts of eastern Asia). Other records from this region and more globally also reveal Antarctic-style variability and suggest that this signal is globally pervasive. This provides the potential basis for suggesting a more important role for gradual changes in triggering more abrupt transitions in the climate system. Dansgaard–Oeschger events rapid climate change GISP2 dust record T he discovery of repeated, abrupt, high-amplitude shifts in Northern Hemisphere climate during the last glacial period (e.g., refs. 1 and 2) has provided a major stimulus for paleo- climate research and fuelled debate over the possible nature of future climate change. The millennial-scale Dansgaard– Oeschger (D–O) oscillations, first observed in temperature records from Greenland ice cores, are characterized by the repeated asymmetric alternation between cold (stadial) and warmer (interstadial) conditions (Fig. 1). The transition from stadial to interstadial state is typically abrupt (10°C temper- ature rise within a few decades) and is followed by more gradual (century-scale) interstadial cooling before a final transition back to stadial conditions. The close correspondence between tem- perature variations across the North Atlantic (3–5) and over Greenland leads to the argument for a direct physical connection between D–O variability and the mode of ocean circulation within the Atlantic basin (6). In contrast to that observed in Greenland, glacial age temperature variability recorded by Ant- arctic ice cores is characterized by a more gradual and symmetric behavior that is approximately out-of-phase with the high- latitude northern hemisphere (7) (Fig. 1). This relationship provides the basis for the so-called bipolar seesaw hypothesis (8, 9) whereby changes in ocean circulation associated with cooling (warming) across the North Atlantic and Greenland drive a corresponding warming (cooling) across the Southern Ocean and Antarctica. However, the precise link between northern and southern ice-core temperature records has proven controversial (10–13). More recently a direct relationship between the am- plitude of warming in Antarctica and the duration of northern stadial events has been demonstrated (14), providing clear evidence of a link between the northern and southern high latitudes on millennial time scales. The observation of D–O type climate variability during Ma- rine Isotope Stage (MIS) 3 [60–30 thousand years (kyr) ago] is not confined to Greenland but has been reported from several far-field locations including the North East Pacific (15), the Arabian Sea (16), China (17), and the West Equatorial Pacific (WEP) (18). However, there is increasing evidence that ‘‘Antarctic-style’’ climate variability may have been globally pervasive during the last glacial period (19–23). In particular, atmospheric CO 2 variability during MIS 3 (as well as on orbital time scales) appears to be intimately related to regional changes around Antarctica and the Southern Ocean (24–26). Here we demonstrate that a previously unrecognized Antarctic-style sig- nal within the dust record from the Greenland Ice Sheet Project 2 (GISP2) ice core in Greenland provides further evidence for a direct link between these bipolar climate archives and high- lights the global influence of Antarctic-style climate variability during the last glacial period. Greenland Dust as an Indicator of Global Climate Ice cores from both polar regions demonstrate that the Earth’s atmosphere was significantly dustier during glacial times relative to the modern (27, 28). Furthermore, high-resolution chemical records from Greenland ice cores reveal a strong link between dust loading over Greenland and D–O temperature variability, with stadials being more dusty than interstadial periods (28, 29) (Fig. 1). Dust records obtained from ice cores must be consid- ered as a composite signal containing information about the Author contributions: S.B. designed research; S.B. performed research; S.B. analyzed data; and S.B. and G.K. wrote the paper. The authors declare no conflict of interest. Abbreviations: D–O, Dansgaard–Oeschger; MIS, Marine Isotope Stage; kyr, thousand years; GISP2, Greenland Ice Sheet Project 2; DD, dejumped dust; WEP, West Equatorial Pacific. † To whom correspondence should be addressed. E-mail: [email protected]. This article contains supporting information online at www.pnas.org/cgi/content/full/ 0708494104/DC1. © 2007 by The National Academy of Sciences of the USA 3 4 5 6 30 40 50 60 Age (kyr) 10 10 2 10 3 [Ca] ppb -44 -40 -36 GISP [Ca] 34 5 6 7 8 9 10 11 12 13 14 15 16 17 18 Fig. 1. Relations between dustiness over Greenland (represented by [Ca] from the GISP2 ice-core; ref. 31) and temperature variability in Antarctica (7) and Greenland (54) during the last glacial period (all records are temporally aligned using methane correlation; ref. 36). Upper numbers denote Heinrich events, and lower numbers denote canonical D–O events (2). Changes in Greenland dust during Heinrich stadials tend to resemble Antarctic temper- ature variability. 17278 –17282 PNAS October 30, 2007 vol. 104 no. 44 www.pnas.orgcgidoi10.1073pnas.0708494104

Welcome message from author
This document is posted to help you gain knowledge. Please leave a comment to let me know what you think about it! Share it to your friends and learn new things together.
Transcript
Antarctic climate signature in the Greenland icecore recordStephen Barker† and Gregor Knorr
School of Earth, Ocean and Planetary Sciences, Cardiff University, Main Building, Park Place, Cardiff CF10 3YE, United Kingdom
Communicated by Wallace S. Broecker, Lamont–Doherty Earth Observatory of Columbia University, Palisades, NY, September 11, 2007 (received for reviewJune 26, 2007)
A numerical algorithm is applied to the Greenland Ice Sheet Project2 (GISP2) dust record from Greenland to remove the abruptchanges in dust flux associated with the Dansgaard–Oeschger(D–O) oscillations of the last glacial period. The procedure is basedon the assumption that the rapid changes in dust are associatedwith large-scale changes in atmospheric transport and implies thatD–O oscillations (in terms of their atmospheric imprint) are moresymmetric in form than can be inferred from Greenland tempera-ture records. After removal of the abrupt shifts the residual,dejumped dust record is found to match Antarctic climate variabil-ity with a temporal lag of several hundred years. It is argued thatsuch variability may reflect changes in the source region of Green-land dust (thought to be the deserts of eastern Asia). Other recordsfrom this region and more globally also reveal Antarctic-stylevariability and suggest that this signal is globally pervasive. Thisprovides the potential basis for suggesting a more important rolefor gradual changes in triggering more abrupt transitions in theclimate system.
Dansgaard–Oeschger events � rapid climate change � GISP2 dust record
The discovery of repeated, abrupt, high-amplitude shifts inNorthern Hemisphere climate during the last glacial period
(e.g., refs. 1 and 2) has provided a major stimulus for paleo-climate research and fuelled debate over the possible nature offuture climate change. The millennial-scale Dansgaard–Oeschger (D–O) oscillations, first observed in temperaturerecords from Greenland ice cores, are characterized by therepeated asymmetric alternation between cold (stadial) andwarmer (interstadial) conditions (Fig. 1). The transition fromstadial to interstadial state is typically abrupt (�10°C temper-ature rise within a few decades) and is followed by more gradual(century-scale) interstadial cooling before a final transition backto stadial conditions. The close correspondence between tem-perature variations across the North Atlantic (3–5) and overGreenland leads to the argument for a direct physical connectionbetween D–O variability and the mode of ocean circulationwithin the Atlantic basin (6). In contrast to that observed inGreenland, glacial age temperature variability recorded by Ant-arctic ice cores is characterized by a more gradual and symmetricbehavior that is approximately out-of-phase with the high-latitude northern hemisphere (7) (Fig. 1). This relationshipprovides the basis for the so-called bipolar seesaw hypothesis (8,9) whereby changes in ocean circulation associated with cooling(warming) across the North Atlantic and Greenland drive acorresponding warming (cooling) across the Southern Oceanand Antarctica. However, the precise link between northern andsouthern ice-core temperature records has proven controversial(10–13). More recently a direct relationship between the am-plitude of warming in Antarctica and the duration of northernstadial events has been demonstrated (14), providing clearevidence of a link between the northern and southern highlatitudes on millennial time scales.
The observation of D–O type climate variability during Ma-rine Isotope Stage (MIS) 3 [�60–30 thousand years (kyr) ago]is not confined to Greenland but has been reported from several
far-field locations including the North East Pacific (15), theArabian Sea (16), China (17), and the West Equatorial Pacific(WEP) (18). However, there is increasing evidence that‘‘Antarctic-style’’ climate variability may have been globallypervasive during the last glacial period (19–23). In particular,atmospheric CO2 variability during MIS 3 (as well as on orbitaltime scales) appears to be intimately related to regional changesaround Antarctica and the Southern Ocean (24–26). Here wedemonstrate that a previously unrecognized Antarctic-style sig-nal within the dust record from the Greenland Ice Sheet Project2 (GISP2) ice core in Greenland provides further evidence fora direct link between these bipolar climate archives and high-lights the global influence of Antarctic-style climate variabilityduring the last glacial period.
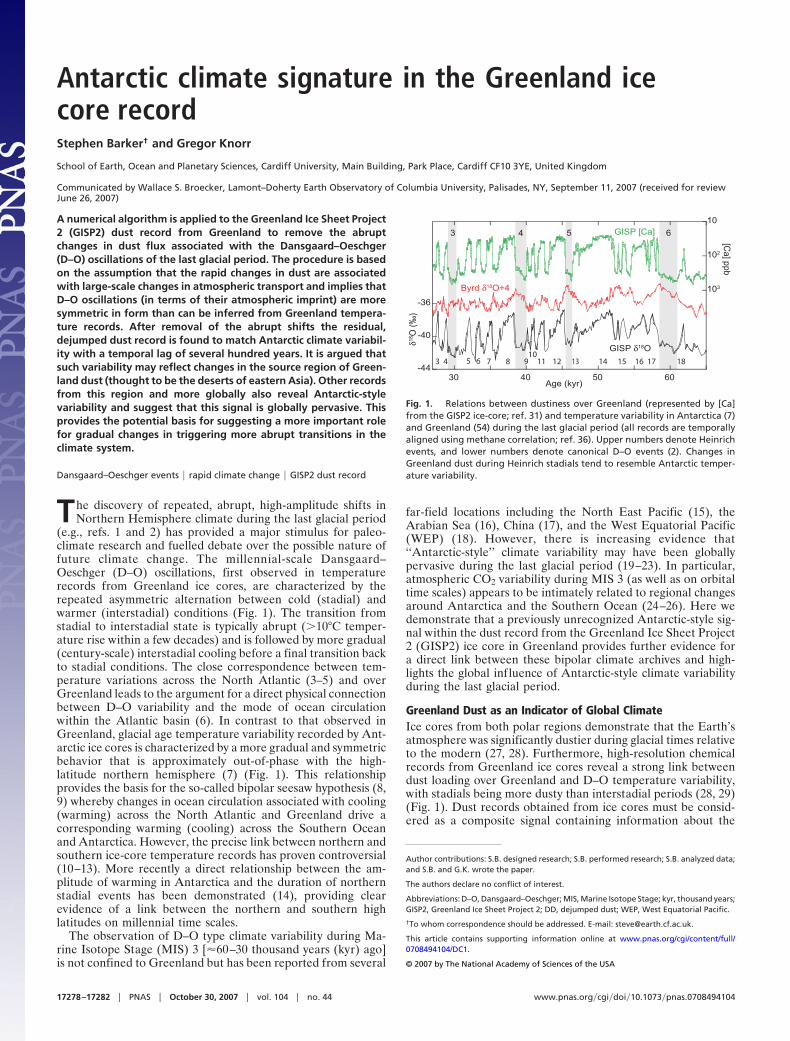
Greenland Dust as an Indicator of Global ClimateIce cores from both polar regions demonstrate that the Earth’satmosphere was significantly dustier during glacial times relativeto the modern (27, 28). Furthermore, high-resolution chemicalrecords from Greenland ice cores reveal a strong link betweendust loading over Greenland and D–O temperature variability,with stadials being more dusty than interstadial periods (28, 29)(Fig. 1). Dust records obtained from ice cores must be consid-ered as a composite signal containing information about the
Author contributions: S.B. designed research; S.B. performed research; S.B. analyzed data;and S.B. and G.K. wrote the paper.
The authors declare no conflict of interest.
Abbreviations: D–O, Dansgaard–Oeschger; MIS, Marine Isotope Stage; kyr, thousand years;GISP2, Greenland Ice Sheet Project 2; DD, dejumped dust; WEP, West Equatorial Pacific.
†To whom correspondence should be addressed. E-mail: [email protected].
This article contains supporting information online at www.pnas.org/cgi/content/full/0708494104/DC1.
© 2007 by The National Academy of Sciences of the USA
3 4 5 6
30 40 50 60Age (kyr)
10
102
103
[Ca] ppb
-44
-40
-36
GISP [Ca]
3 4 5 6 7 8 910
11 12 13 14 15 16 17 18
Fig. 1. Relations between dustiness over Greenland (represented by [Ca]from the GISP2 ice-core; ref. 31) and temperature variability in Antarctica (7)and Greenland (54) during the last glacial period (all records are temporallyaligned using methane correlation; ref. 36). Upper numbers denote Heinrichevents, and lower numbers denote canonical D–O events (2). Changes inGreenland dust during Heinrich stadials tend to resemble Antarctic temper-ature variability.
17278–17282 � PNAS � October 30, 2007 � vol. 104 � no. 44 www.pnas.org�cgi�doi�10.1073�pnas.0708494104
supply of dust in the source region, its uplift to the high (severalkm) atmosphere and subsequent transport to the polar regions(29). Previous studies have gone some way toward differentiatingbetween the relative importance of these factors (28–30), butexplicit deconvolution between variations in source and trans-port is not straightforward. Mayewski et al. (28) used an empir-ical orthogonal function decomposition of the GISP2 chemicaldata to define the ‘‘Polar Circulation Index’’ (PCI), able toexplain 92% of the total variance of six chemical species over thelast 41 kyr. Although the PCI is used to describe changes inlarge-scale atmospheric circulation, it implicitly includes varia-tions in dust source extent and availability. Ditlevsen and Marsh(30) divided the GISP2 [Ca] record (31) into fast and slowcomponents (distinguished by frequencies above and below f �1/200 yr�1) and further divided the slow component into threedominant source vectors: continental, oceanic and biochemical.However, the authors state that these vectors include both sourcearea and transport effects. Fuhrer et al. (29) suggested that thelarge and rapid stadial–interstadial jumps were superimposed ona longer-term trend that reflected global climate variability (e.g.,global ice volume).
We develop this idea by starting with the basic premise thatchanges in the atmospheric circulation responsible for transportingdust to Greenland (e.g., the westerly jet stream; refs. 29 and 32)might be expected to share more variability with regional conditionsover Greenland (i.e., D–O type variability) than might changeswithin the source area (in this case eastern Asia; refs. 33 and 34).This may be contrasted with those studies that start by assumingthat the large-scale D–O jumps directly reflect source regionvariability (e.g., ref. 35). We suggest that on millennial time scalesthe large D–O type jumps are superimposed on a backgroundvariability that reflects changes in the source region; the abruptshifts are then telling us whether or not dust is focused towardGreenland. Removal of the abrupt D–O shifts by ‘‘defocusing’’the raw dust record (see below) would then allow recognition of thebackground changes in dust supply. Our argument stems from thevisual observation that variations occurring before certain stadial–interstadial transitions in the GISP2 dust record appear to resembleAntarctic temperature variability (Fig. 1). Specifically, throughoutstadial periods that contain Heinrich events, the level of dust tendsto decrease continuously until the abrupt decrease associated withinterstadial warming. Heinrich events tend to be associated withprolonged periods of warming in Antarctica, which themselves arethought to be directly related to the extended duration of coldconditions over Greenland through the bipolar seesaw mechanism(14). Indeed, the clearest evidence for decreasing stadial dust is seenduring periods of significant warming in Antarctica. The resem-blance of ‘‘non-D–O type’’ dust variability to Antarctic temperature(which is essentially inversely related to Greenland temperature) isused here as the basis for arguing that this mode of variation is likelyto originate from outside of Greenland.
Deconvolution of the GISP2 Dust RecordIsolating the underlying source variability within the GISP2 dustrecord, as described above, requires the identification andremoval of the rapid jumps associated with D–O transitions. Tothis end, we developed a numerical algorithm to pick D–Otransitions based on the rapidity of changes in dust loadingthrough time. Picking D–O transitions using the Greenland dustrecord has the advantage over use of the temperature recordthanks to the generally more obvious (large and rapid) transi-tions from interstadial to stadial as well as from stadial tointerstadial state. By our method all canonical D–O events (2)are identified in addition to a few others that tend to representincomplete transitions between states [see supporting informa-tion (SI) Text and SI Fig. 5]. The algorithm generates a ‘‘defo-cusing function,’’ based on each individual D–O transition, whichis then combined with the dust record to produce a DD record
(Fig. 2). The defocusing function is similar to a trapezoidal waveform, alternating between two states; interstadial and stadial.When combined with the dust record the function acts to scalestadial dust values by a constant factor (�1) to align them withthe interstadial portions of the record. The procedure thereforeimplies that stadial states were anomalously dusty (the specificdefocusing factor used for stadial periods is set to achievemaximum contiguity of the resulting dejumped record). Onlytwo focusing states are defined to maintain simplicity, althoughthis may be too simplistic for the last glacial maximum (LGM)interval when the magnitude and direction of abrupt shiftsappears less uniformed than for other intervals (see SI Text). Forthis reason, the LGM is omitted from further discussion. Theprocedure also implies that the atmospheric expression of D–Ooscillations in Greenland ice cores is quite symmetric (i.e., withsimilar transitions in both directions) and perhaps not as asym-
Byrd vs dust
-2 -1 0 1 2 3-0.6
-0.4
-0.2
0
0.2
0.4
0.6
Lag (kyr)-3
Byrd vs DD
Cor
rela
tion
South leadsNorth leads
Byrd vs -defocus
-0.7
-0.6
-0.5
-0.4
-0.3
-0.2
-0.1
0
-2 -1 0 1 2 3Lag (kyr)
-3
South leadsNorth leads
Byrd vs dust Byrd vs DD
B C
10
102
DD
[Ca]
(pp
m)
LGM
AR
A
-42
-38
-34
-5
0
5
d[C
a]*
/ dt
(100
0 yr
-1)
defo
cus
fact
or
10
102
103
GIS
P2
[Ca]
(pp
m)
0 20 40 60 80 100Age (kyr)
DFIS
DFS
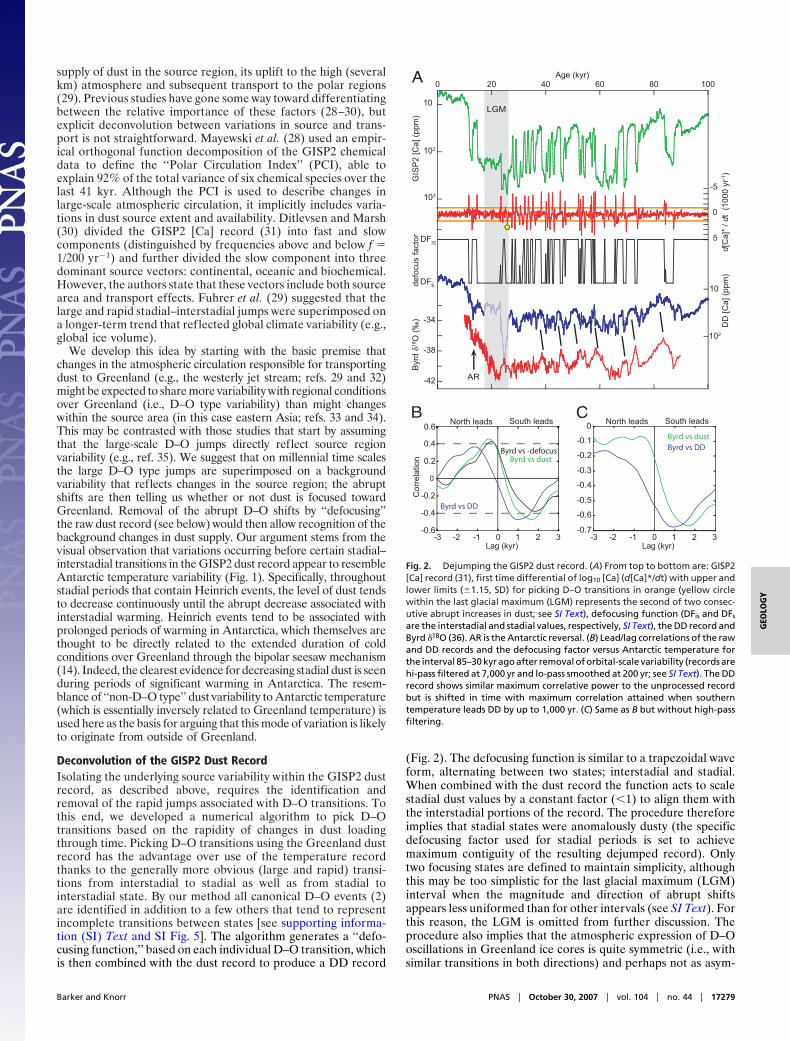
Fig. 2. Dejumping the GISP2 dust record. (A) From top to bottom are: GISP2[Ca] record (31), first time differential of log10 [Ca] (d[Ca]*/dt) with upper andlower limits (�1.15, SD) for picking D–O transitions in orange (yellow circlewithin the last glacial maximum (LGM) represents the second of two consec-utive abrupt increases in dust; see SI Text), defocusing function (DFis and DFs
are the interstadial and stadial values, respectively, SI Text), the DD record andByrd �18O (36). AR is the Antarctic reversal. (B) Lead/lag correlations of the rawand DD records and the defocusing factor versus Antarctic temperature forthe interval 85–30 kyr ago after removal of orbital-scale variability (records arehi-pass filtered at 7,000 yr and lo-pass smoothed at 200 yr; see SI Text). The DDrecord shows similar maximum correlative power to the unprocessed recordbut is shifted in time with maximum correlation attained when southerntemperature leads DD by up to 1,000 yr. (C) Same as B but without high-passfiltering.
Barker and Knorr PNAS � October 30, 2007 � vol. 104 � no. 44 � 17279
GEO
LOG
Y
metric as might be inferred from the Greenland temperaturerecords.
After applying the defocusing routine to the GISP2 [Ca]record (31), a visual similarity between the DD record andAntarctic temperature variability is apparent (Fig. 2). In additionto the general increase in dustiness during the glacial period,millennial-scale decreases in DD tend to correspond to Antarcticwarming events, whereas the deglacial Antarctic cold reversal isapparently aligned with a transient maximum in the DD record.This observation begs the question: Does climatic variability inthe source region of Greenland dust contain an Antarctic-typesignature and hence suggest a more global nature of this signal?
Also apparent in Fig. 2 is a temporal lag of the DD recordbehind Antarctic temperature during the glacial period (�85–30kyr ago). A lead/lag analysis of the raw and DD records withAntarctic temperature over the interval 85–30 kyr ago (afterfiltering out orbital-scale variability below f � 1/7,000 yr) revealsthat the �500 year positive lead of northern dust over southerntemperature (equivalent to the anticorrelation between therespective temperature records; ref. 10) is not present in the DDrecord (Fig. 2B). This is a direct effect of removing the abruptD–O transitions, as illustrated by the presence of the same lagbetween the defocusing function and Antarctic temperature.Therefore, the DD record is not a damped version of the rawdust record; rather, it is phase shifted and shows strongest(negative) correlation with Antarctic temperature with a lag ofseveral hundred years behind the southern signal. This lag is alsoseen for the same records without orbital filtering (Fig. 2C) (allrecords are temporally aligned by methane correlation; ref. 36).Although dejumping the dust record alters the phasing betweennorthern and southern records, it does not improve the correl-ative power between the records. To test the hypothesis thatclimatic variability in the source region more closely matchesAntarctic variability than it does Greenland it is necessary toevaluate other records from this region and beyond.
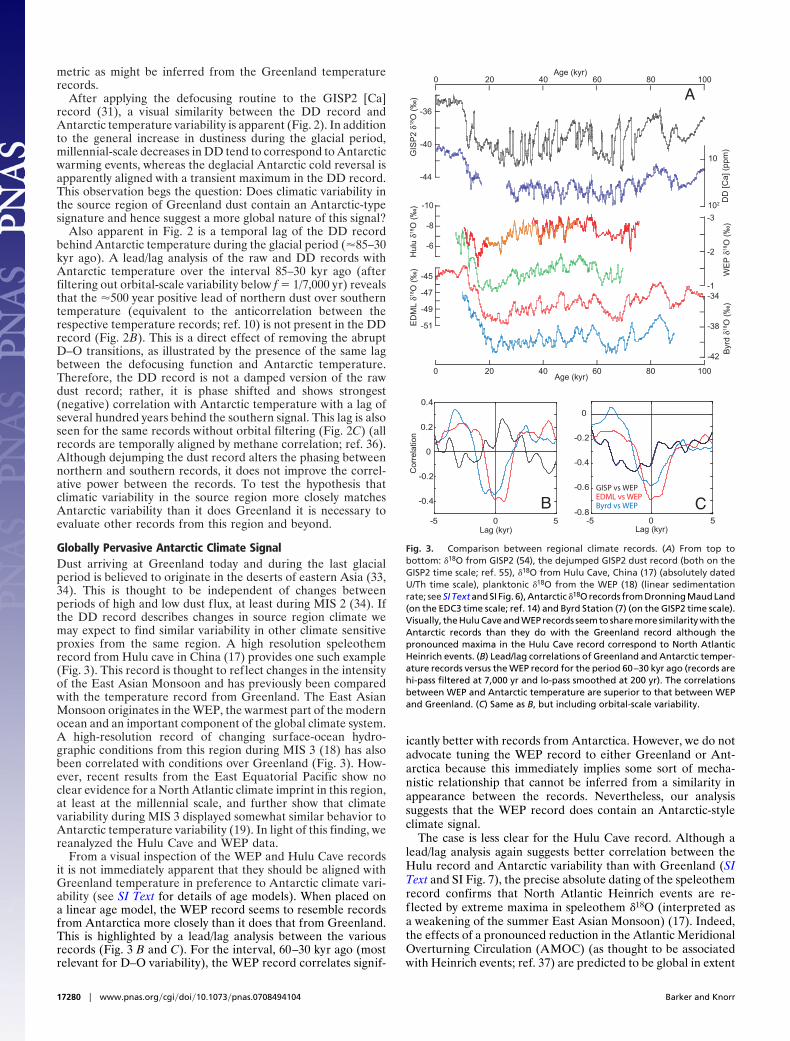
Globally Pervasive Antarctic Climate SignalDust arriving at Greenland today and during the last glacialperiod is believed to originate in the deserts of eastern Asia (33,34). This is thought to be independent of changes betweenperiods of high and low dust flux, at least during MIS 2 (34). Ifthe DD record describes changes in source region climate wemay expect to find similar variability in other climate sensitiveproxies from the same region. A high resolution speleothemrecord from Hulu cave in China (17) provides one such example(Fig. 3). This record is thought to reflect changes in the intensityof the East Asian Monsoon and has previously been comparedwith the temperature record from Greenland. The East AsianMonsoon originates in the WEP, the warmest part of the modernocean and an important component of the global climate system.A high-resolution record of changing surface-ocean hydro-graphic conditions from this region during MIS 3 (18) has alsobeen correlated with conditions over Greenland (Fig. 3). How-ever, recent results from the East Equatorial Pacific show noclear evidence for a North Atlantic climate imprint in this region,at least at the millennial scale, and further show that climatevariability during MIS 3 displayed somewhat similar behavior toAntarctic temperature variability (19). In light of this finding, wereanalyzed the Hulu Cave and WEP data.
From a visual inspection of the WEP and Hulu Cave recordsit is not immediately apparent that they should be aligned withGreenland temperature in preference to Antarctic climate vari-ability (see SI Text for details of age models). When placed ona linear age model, the WEP record seems to resemble recordsfrom Antarctica more closely than it does that from Greenland.This is highlighted by a lead/lag analysis between the variousrecords (Fig. 3 B and C). For the interval, 60–30 kyr ago (mostrelevant for D–O variability), the WEP record correlates signif-
icantly better with records from Antarctica. However, we do notadvocate tuning the WEP record to either Greenland or Ant-arctica because this immediately implies some sort of mecha-nistic relationship that cannot be inferred from a similarity inappearance between the records. Nevertheless, our analysissuggests that the WEP record does contain an Antarctic-styleclimate signal.
The case is less clear for the Hulu Cave record. Although alead/lag analysis again suggests better correlation between theHulu record and Antarctic variability than with Greenland (SIText and SI Fig. 7), the precise absolute dating of the speleothemrecord confirms that North Atlantic Heinrich events are re-f lected by extreme maxima in speleothem �18O (interpreted asa weakening of the summer East Asian Monsoon) (17). Indeed,the effects of a pronounced reduction in the Atlantic MeridionalOverturning Circulation (AMOC) (as thought to be associatedwith Heinrich events; ref. 37) are predicted to be global in extent
10
102 DD
[Ca]
(pp
m)
A
-42
-38
-34
-3
-2
-1
-51
-49
-47
-45
-44
-40
-36
0 20 40 60 80 100Age (kyr)
0 20 40 60 80 100Age (kyr)
-10
-8
-6
-5 0 5
-0.4
-0.2
0
0.2
0.4
Lag (kyr)-5 0 5
-0.8
-0.6
-0.4
-0.2
0C
orre
latio
n
GISP vs WEP
Byrd vs WEPEDML vs WEP
Lag (kyr)
CB
Fig. 3. Comparison between regional climate records. (A) From top tobottom: �18O from GISP2 (54), the dejumped GISP2 dust record (both on theGISP2 time scale; ref. 55), �18O from Hulu Cave, China (17) (absolutely datedU/Th time scale), planktonic �18O from the WEP (18) (linear sedimentationrate; see SI Text and SI Fig. 6), Antarctic �18O records from Dronning Maud Land(on the EDC3 time scale; ref. 14) and Byrd Station (7) (on the GISP2 time scale).Visually, the Hulu Cave and WEP records seem to share more similarity with theAntarctic records than they do with the Greenland record although thepronounced maxima in the Hulu Cave record correspond to North AtlanticHeinrich events. (B) Lead/lag correlations of Greenland and Antarctic temper-ature records versus the WEP record for the period 60–30 kyr ago (records arehi-pass filtered at 7,000 yr and lo-pass smoothed at 200 yr). The correlationsbetween WEP and Antarctic temperature are superior to that between WEPand Greenland. (C) Same as B, but including orbital-scale variability.
17280 � www.pnas.org�cgi�doi�10.1073�pnas.0708494104 Barker and Knorr
(e.g., ref. 38). These effects include reduced precipitation overlarge parts of the northern hemisphere and increased rainfall inSouth America and Africa caused by a southward shift in theIntertropical Convergence Zone (38). However, although thenear-instantaneous effects of Heinrich AMOC collapses may beglobal, this does not necessarily imply that all D–O events shouldbe expected to have the same influence. It is clear that Heinrichstadial events should be considered distinct from ‘‘regular’’ D–Ostadials, as evidenced by a range of oceanic proxies (e.g., refs. 3and 39–41). Further evidence from Brazilian speleothems alsosuggests that southward migration of the ITCZ during MIS 3 wasparticularly pronounced only during Heinrich events, highlight-ing the anomalous conditions during these periods. We arguethat records such as that from Hulu Cave may well be expectedto show a composite signal comprising the effects of near-instantaneous shifts in atmospheric circulation superimposed ona background variability that we contend reflects Antarctic-styleclimate fluctuations. This argument is based on the observationof the Antarctic signal in influential regions such as the tropicalPacific as well as its appearance in the DD record.
A question may then be raised concerning the DD record;should this not also reflect Heinrich events? In fact, the recorddoes show maxima (perhaps corresponding to the dry conditionsassociated with a weakened monsoon) during Heinrich stadials.This directly reflects the fact that the highest values in the rawdust record occur during these intervals (Fig. 1). This observa-tion in itself may be used to argue for a relationship between theHulu Cave monsoon record and the Greenland dust record thatis not shared by the Greenland temperature record; namely thatHeinrich events (which are reflected by extrema in both Green-land dust and Hulu �18O) are not marked by ‘‘extremely’’ coldconditions over Greenland (42). If records such as that fromHulu Cave and the surrounding region do contain signals ofmultiple origin (notably D–O type variability superimposedupon an Antarctic-style modulation) it is possible that thedeconvolution method applied here may obscure D–O typevariability associated with the source region as well as thatassociated with transport to Greenland. Future work is requiredto better constrain the individual components of climate signalsfrom this region and more generally.
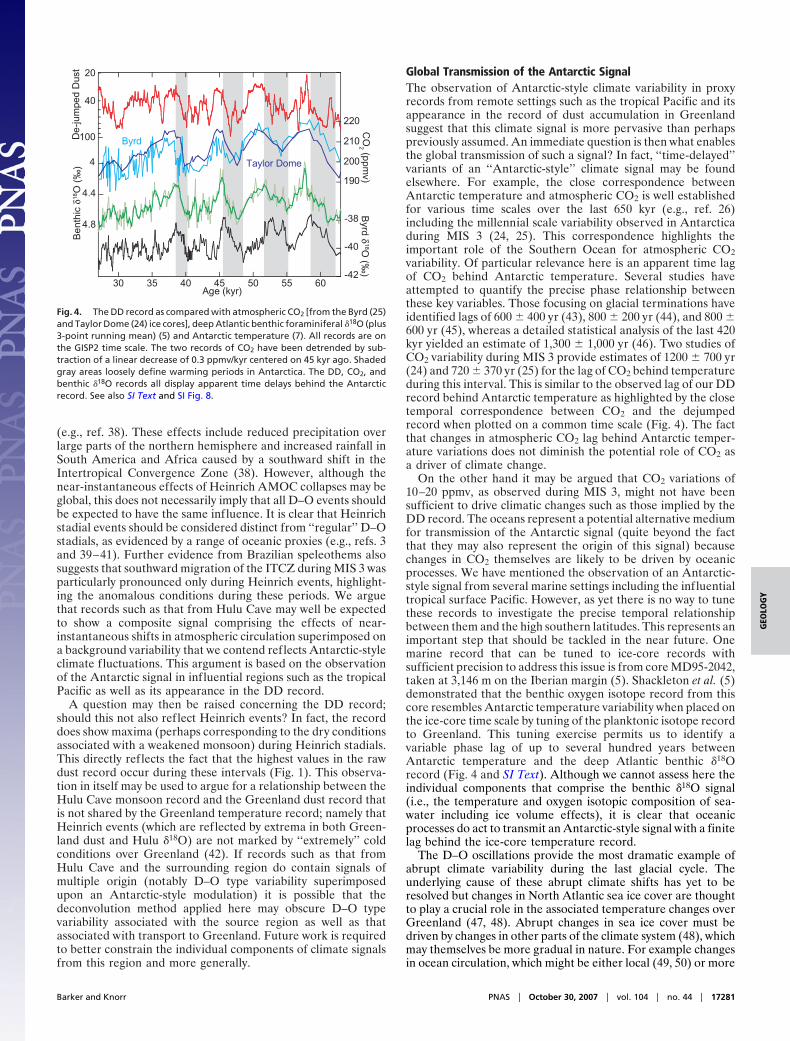
Global Transmission of the Antarctic SignalThe observation of Antarctic-style climate variability in proxyrecords from remote settings such as the tropical Pacific and itsappearance in the record of dust accumulation in Greenlandsuggest that this climate signal is more pervasive than perhapspreviously assumed. An immediate question is then what enablesthe global transmission of such a signal? In fact, ‘‘time-delayed’’variants of an ‘‘Antarctic-style’’ climate signal may be foundelsewhere. For example, the close correspondence betweenAntarctic temperature and atmospheric CO2 is well establishedfor various time scales over the last 650 kyr (e.g., ref. 26)including the millennial scale variability observed in Antarcticaduring MIS 3 (24, 25). This correspondence highlights theimportant role of the Southern Ocean for atmospheric CO2variability. Of particular relevance here is an apparent time lagof CO2 behind Antarctic temperature. Several studies haveattempted to quantify the precise phase relationship betweenthese key variables. Those focusing on glacial terminations haveidentified lags of 600 � 400 yr (43), 800 � 200 yr (44), and 800 �600 yr (45), whereas a detailed statistical analysis of the last 420kyr yielded an estimate of 1,300 � 1,000 yr (46). Two studies ofCO2 variability during MIS 3 provide estimates of 1200 � 700 yr(24) and 720 � 370 yr (25) for the lag of CO2 behind temperatureduring this interval. This is similar to the observed lag of our DDrecord behind Antarctic temperature as highlighted by the closetemporal correspondence between CO2 and the dejumpedrecord when plotted on a common time scale (Fig. 4). The factthat changes in atmospheric CO2 lag behind Antarctic temper-ature variations does not diminish the potential role of CO2 asa driver of climate change.
On the other hand it may be argued that CO2 variations of10–20 ppmv, as observed during MIS 3, might not have beensufficient to drive climatic changes such as those implied by theDD record. The oceans represent a potential alternative mediumfor transmission of the Antarctic signal (quite beyond the factthat they may also represent the origin of this signal) becausechanges in CO2 themselves are likely to be driven by oceanicprocesses. We have mentioned the observation of an Antarctic-style signal from several marine settings including the influentialtropical surface Pacific. However, as yet there is no way to tunethese records to investigate the precise temporal relationshipbetween them and the high southern latitudes. This represents animportant step that should be tackled in the near future. Onemarine record that can be tuned to ice-core records withsufficient precision to address this issue is from core MD95-2042,taken at 3,146 m on the Iberian margin (5). Shackleton et al. (5)demonstrated that the benthic oxygen isotope record from thiscore resembles Antarctic temperature variability when placed onthe ice-core time scale by tuning of the planktonic isotope recordto Greenland. This tuning exercise permits us to identify avariable phase lag of up to several hundred years betweenAntarctic temperature and the deep Atlantic benthic �18Orecord (Fig. 4 and SI Text). Although we cannot assess here theindividual components that comprise the benthic �18O signal(i.e., the temperature and oxygen isotopic composition of sea-water including ice volume effects), it is clear that oceanicprocesses do act to transmit an Antarctic-style signal with a finitelag behind the ice-core temperature record.
The D–O oscillations provide the most dramatic example ofabrupt climate variability during the last glacial cycle. Theunderlying cause of these abrupt climate shifts has yet to beresolved but changes in North Atlantic sea ice cover are thoughtto play a crucial role in the associated temperature changes overGreenland (47, 48). Abrupt changes in sea ice cover must bedriven by changes in other parts of the climate system (48), whichmay themselves be more gradual in nature. For example changesin ocean circulation, which might be either local (49, 50) or more
20
40
100De
-jum
ped
Dus
t
190
200
210
220
CO
2 (ppm
v)
30 35 40 45 50 55 60Age (kyr)
Byrd
Taylor Dome
-42
-40
-38
Byrd δ
18O
(‰)
4
4.4
4.8
Be
nthi
c δ1
8O
(‰
)
Fig. 4. The DD record as compared with atmospheric CO2 [from the Byrd (25)and Taylor Dome (24) ice cores], deep Atlantic benthic foraminiferal �18O (plus3-point running mean) (5) and Antarctic temperature (7). All records are onthe GISP2 time scale. The two records of CO2 have been detrended by sub-traction of a linear decrease of 0.3 ppmv/kyr centered on 45 kyr ago. Shadedgray areas loosely define warming periods in Antarctica. The DD, CO2, andbenthic �18O records all display apparent time delays behind the Antarcticrecord. See also SI Text and SI Fig. 8.
Barker and Knorr PNAS � October 30, 2007 � vol. 104 � no. 44 � 17281
GEO
LOG
Y
distal in origin (such as the southern high latitudes; ref. 51),could provide the trigger for an abrupt sea ice retreat in theNorth Atlantic (48). Changes in surface wind stress in the NorthAtlantic may represent an alternative trigger (52). Such changesmight also have nonlocal origins; e.g., the interaction of atmo-spheric circulation with land-based ice sheets or changes in thetropical ocean-atmosphere system (48, 53). The one-to-onecoupling between millennial-scale temperature variations in thehigh northern and southern latitudes (14) provides evidence foran oceanic role in the global manifestation of D–O variability(i.e., the bipolar seesaw). Our findings suggest the more globalexpression of a time-delayed ‘‘Antarctic-style’’ climate signalthat may be the product of Antarctic temperature variabilityitself or the oceanic mechanism that controls it. By extension, itmay be argued that an analogous (although not necessarilyidentical) time-delayed Antarctic-style climate signal may becapable of providing a trigger for the rapid climate shiftsrecorded in Greenland and the North Atlantic region duringMIS 3, thereby representing a potential feedback on northernglacial climate variability.
ConclusionsA numerical algorithm was developed for the identification of rapidshifts in the Greenland dust record associated with the D–Otransitions of the last glacial period and their removal to reveal
millennial-scale variations in the source region. The algorithm relieson the similarly abrupt changes in dust accumulation duringinterstadial-to-stadial and stadial-to-interstadial transitions and im-plies that the D–O oscillations (at least in terms of their atmosphericimprint) were rather more symmetric in form than can be inferredfrom Greenland temperature records. Deconvolution of theGreenland dust record by removal of the abrupt D–O jumps revealsa previously unrecognized variability that is reminiscent of Ant-arctic temperature fluctuations. Such variability is likely to reflectchanges in the deserts of eastern Asian, the source region forGreenland dust. Similar variability in records from the surroundingregion strengthens the contention that changes in the East AsianMonsoon system may also share variability in common with Ant-arctica. Furthermore, the global effects of Heinrich stadial eventswould be expected to overprint this background variability, givingrise to complex signals of multiple origin. Evidence for the physicalexpression of an Antarctic-style climate signal in a remote locationdemonstrates the global significance of this signal characteristic andprovides a potential basis for suggesting a more important role forgradual changes in triggering more abrupt transitions in the climatesystem.
We thank two reviewers for their thoughtful comments and W. Broecker,D. Battisti, and J. Shepherd for helpful discussions. This work was supportedin part by a Comer Rapid Climate Change Fellowship (to S.B.).
1. Johnsen SJ, Clausen HB, Dansgaard W, Fuhrer K, Gundestrup N, HammerCU, Iversen P, Jouzel J, Stauffer B, Steffensen JP (1992) Nature 359:311–313.
2. Dansgaard W, Johnsen SJ, Clausen HB, Dahl-Jensen D, Gundestrup NS,Hammer CU, Hvidberg CS, Steffensen JP, Sveinbjornsdottir AE, Jouzel J,Bond G (1993) Nature 364:218–220.
3. Bond G, Broecker W, Johnsen S, McManus J, Labeyrie L, Jouzel J, Bonani G(1993) Nature 365:143–147.
4. Cacho I, Grimalt JO, Pelejero C, Canals M, Sierro FJ, Flores JA, ShackletonN (1999) Paleoceanography 14:698–705.
5. Shackleton NJ, Hall MA, Vincent E (2000) Paleoceanography 15:565–569.6. Broecker WS, Bond G, Klas M (1990) Paleoceanography 5:469–477.7. Johnsen SJ, Clausen HB, Dansgaar W, Langway CC (1972) Nature 235:429–
434.8. Broecker WS (1998) Paleoceanography 13:119–121.9. Stocker TF (1998) Science 282:61–62.
10. Schmittner A, Saenko OA, Weaver AJ (2003) Q Sci Rev 22:659–671.11. Steig EJ, Alley RB (2002) Ann Glaciol 35:451–456.12. Huybers P (2004) Q Sci Rev 23:207–210.13. Wunsch C (2003) Q Sci Rev 22:1631–1646.14. EPICA Community Members (2006) Nature 444:195–198.15. Hendy IL, Kennett JP (2000) Paleoceanography 15:30–42.16. Schulz H, von Rad U, Erlenkeuser H (1998) Nature 393:54–57.17. Wang YJ, Cheng H, Edwards RL, An ZS, Wu JY, Shen CC, Dorale JA (2001)
Science 294:2345–2348.18. Stott L, Poulsen C, Lund S, Thunell R (2002) Science 297:222–226.19. Lea DW, Pak DK, Belanger CL, Spero HJ, Hall MA, Shackleton NJ (2006) Q
Sci Rev 25:1152–1167.20. Altabet MA, Higginson MJ, Murray DW (2002) Nature 415:159–162.21. Robinson RS, Mix A, Martinez P (2007) Q Sci Rev 26:201–212.22. Pahnke K, Zahn R, Elderfield H, Schulz M (2003) Science 301:948–952.23. Kaiser J, Lamy F, Hebbeln D (2005) Paleoceanography 20:PA4009.24. Indermuhle A, Monnin E, Stauffer B, Stocker TF, Wahlen M (2000) Geophys
Res Lett 27:735–738.25. Ahn J, Brook E (2007) Geophys Res Lett 34:L10703.26. Siegenthaler U, Stocker TF, Monnin E, Luthi D, Schwander J, Stauffer B,
Raynaud D, Barnola JM, Fischer H, Masson-Delmotte V, Jouzel J (2005)Science 310:1313–1317.
27. Petit JR, Jouzel J, Raynaud D, Barkov NI, Barnola JM, Basile I, Bender M,Chappellaz J, Davis M, Delaygue G, et al. (1999) Nature 399:429–436.
28. Mayewski PA, Meeker LD, Whitlow S, Twickler MS, Morrison MC, BloomfieldP, Bond GC, Alley RB, Gow AJ, Grootes PM, et al. (1994) Science 263:1747–1751.
29. Fuhrer K, Wolff EW, Johnsen SJ (1999) J Geophys Res Atmos 104:31043–31052.30. Ditlevsen PD, Marsh ND (1998) J Geophys Res Atmos 103:5649–5659.31. Mayewski PA, Meeker LD, Twickler MS, Whitlow S, Yang QZ, Lyons WB,
Prentice M (1997) J Geophys Res Oceans 102:26345–26366.32. Sun JM, Zhang MY, Liu TS (2001) J Geophys Res Atmos 106:10325–10333.33. Bory AJM, Biscaye PE, Piotrowski AM, Steffensen JP (2003) Geochem
Geophys Geosyst 4:1107.34. Biscaye PE, Grousset FE, Revel M, VanderGaast S, Zielinski GA, Vaars A,
Kukla G (1997) J Geophys Res Oceans 102:26765–26781.35. Ruth U, Bigler M, Rothlisberger R, Siggaard-Andersen ML, Kipfstuhl S,
Goto-Azuma K, Hansson ME, Johnsen SJ, Lu HY, Steffensen JP (2007)Geophys Res Lett 34:L03706.
36. Blunier T, Brook EJ (2001) Science 291:109–112.37. McManus JF, Francois R, Gherardi JM, Keigwin LD, Brown-Leger S (2004)
Nature 428:834–837.38. Vellinga M, Wood RA (2002) Clim Change 54:251–267.39. Sachs JP, Anderson RF (2005) Nature 434:1118–1121.40. Zahn R, Schonfeld J, Kudrass HR, Park MH, Erlenkeuser H, Grootes P (1997)
Paleoceanography 12:696–710.41. Vidal L, Labeyrie L, Cortijo E, Arnold M, Duplessy JC, Michel E, Becque S,
vanWeering TCE (1997) Earth Planet Sci Lett 146:13–27.42. Alley RB, Clark PU (1999) Annu Rev Earth Planet Sci 27:149–182.43. Fischer H, Wahlen M, Smith J, Mastroianni D, Deck B (1999) Science
283:1712–1714.44. Caillon N, Severinghaus JP, Jouzel J, Barnola JM, Kang JC, Lipenkov VY
(2003) Science 299:1728–1731.45. Monnin E, Indermuhle A, Dallenbach A, Fluckiger J, Stauffer B, Stocker TF,
Raynaud D, Barnola JM (2001) Science 291:112–114.46. Mudelsee M (2001) Q Sci Rev 20:583–589.47. Denton GH, Alley RB, Comer GC, Broecker WS (2005) Q Sci Rev 24:1159–
1182.48. Li C, Battisti DS, Schrag DP, Tziperman E (2005) Geophys Res Lett 32.49. Ganopolski A, Rahmstorf S (2001) Nature 409:153–158.50. Knutti R, Fluckiger J, Stocker TF, Timmermann A (2004) Nature 430:851–856.51. Knorr G, Lohmann G (2003) Nature 424:532–536.52. Fang ZF, Wallace JM (1994) J Clim 7:1897–1914.53. Yin JH, Battisti DS (2001) J Clim 14:565–581.54. Stuiver M, Grootes PM (2000) Q Res 53:277–283.55. Meese DA, Gow AJ, Grootes P, Mayewski PA, Ram M, Stuiver M, Taylor KC,
Waddington ED, Zielinski GA (1994) Science 266:1680–1682.
17282 � www.pnas.org�cgi�doi�10.1073�pnas.0708494104 Barker and Knorr
Related Documents