Anonymity and Confidentiality Presented to NSF Conference on the Future of Survey Research Roger Tourangeau, Westat November 9, 2012

Welcome message from author
This document is posted to help you gain knowledge. Please leave a comment to let me know what you think about it! Share it to your friends and learn new things together.
Transcript

Anonymity and Confidentiality
Presented to NSF Conference on the Future of Survey Research Roger Tourangeau, Westat November 9, 2012

Outline • Privacy, Confidentiality, and Anonymity
• “Sensitive Questions”
• Self-Administration: Does it really work?
• Going Beyond Self-Administration
• Conclusions
2
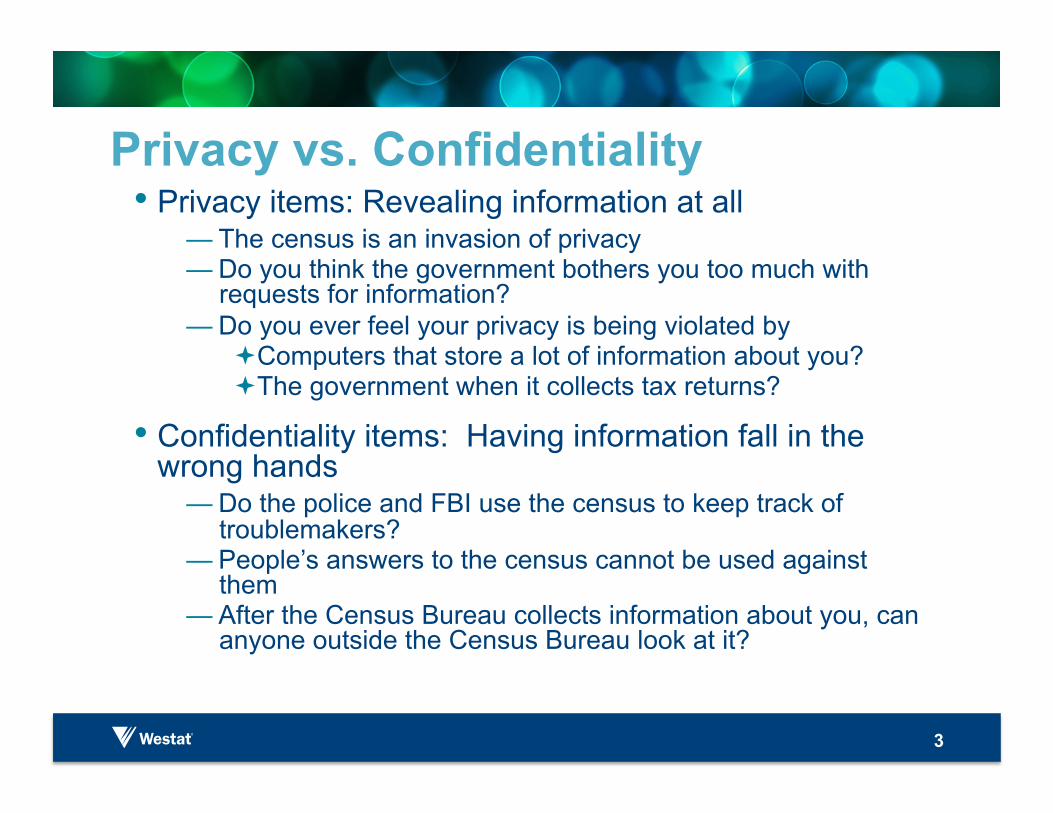
Privacy vs. Confidentiality • Privacy items: Revealing information at all
— The census is an invasion of privacy — Do you think the government bothers you too much with
requests for information? — Do you ever feel your privacy is being violated by
Computers that store a lot of information about you? The government when it collects tax returns?
• Confidentiality items: Having information fall in the wrong hands
— Do the police and FBI use the census to keep track of troublemakers?
— People’s answers to the census cannot be used against them
— After the Census Bureau collects information about you, can anyone outside the Census Bureau look at it?
3

Privacy of Interview Settings: 3rd Parties
Source: Zeina Mneimneh’s dissertation
4
Percent (Standard Error) of World Mental Health Interviews Conducted in the Presence of a Third Party
Country N Any 3rd Person Parent Partner Belgium 1,015 25.4 (1.4) 2.1 (0.5) 18.7 (1.2) Brazil 2,942 59.0 (0.9) 8.2 (0.5) 26.7 (0.8) Bulgaria 2,232 39.3 (1.0) 3.9 (0.4) 26.1 (0.9) China 1,628 36.1 (1.2) 8.7 (0.7) 19.9 (1.0) Germany 1,315 25.9 (1.2) 2.4 (0.4) 16.4 (1.0) India 1,368 70.0 (1.2) 12.4 (0.9) 31.0 (1.3) Italy 1,768 36.0 (1.1) 6.4 (0.6) 21.2 (1.0)) Japan 1,374 12.6 (0.9) 1.4 (0.3) 6.2 (0.7) Lebanon 1,031 66.4 (1.5) 11.8 (1.0) 31.7 (1.5) Mexico 2,350 34.6 (1.0) 7.0 (0.5) 11.4 (0.7) Nigeria 2,141 32.0 (1.0) 3.1 (0.4) 8.4 (0.6) Romania 2,356 35.4 (1,0) 3.7 (0.4) 20.7 (0.8) Spain 2,121 41.2 (1.1) 6.7 (0.5) 23.4 (0.9) United States 5,327 30.2 (0.6) 2.8 (0.2) 17.3 (0.5)

Causes and Effects of Lack of Privacy • Three major factors (Mneimneh)
— Is someone else likely to be there (household size, marital status, spouse’s employment)?
— What are the cultural norms regarding privacy — How much effort do the interviewers make?
• Consequences — Aquilino’s model: Depends on whether person already
knows (e.g., a partner re smoking or past drug use) and, if not, whether there likely to be repercussions if he or she finds out
— Lower levels of reporting when parents around — Mneimneh founds signs of increased SD bias
5
Anonymity • Collecting data without collecting identifying
information
• Hard to do convincingly in surveys, especially household surveys
• Still, sometimes done (Monitoring the Future)
• Does this lower accountability? Three recent studies by Lelkes, Krosnick, Marx, Judd, and Park say yes; not very realistic as survey studies, but still worrisome
6

Sensitive Questions in Surveys? • Three separate meanings
• Intrusiveness: Question is inherently offensive — Sensitive questions vs. sensitive answers
• Disclosure to third parties (various types of third parties)
— Other family members, private persons — Other agencies — Analysts, hackers (Disclosure avoidance methods
designed to reduce likelihood that this will happen)
• Social desirability
7

Social Desirability • Social desirability (Sudman and Bradburn, 1974, pp.
9-10): Some questions call for the respondent to provide information on topics that have highly desirable answers ... If the respondent has a socially undesirable attitude or if he has engaged in socially undesirable behavior, he may … desire to appear to the interviewer to be in the socially desirable category. It is frequently assumed that most respondents resolve this conflict in favor of biasing their answer in the direction of social desirability.
• Depends on topic, presence of interviewer, facts of the case
• Older conception: Social desirability as a trait
8
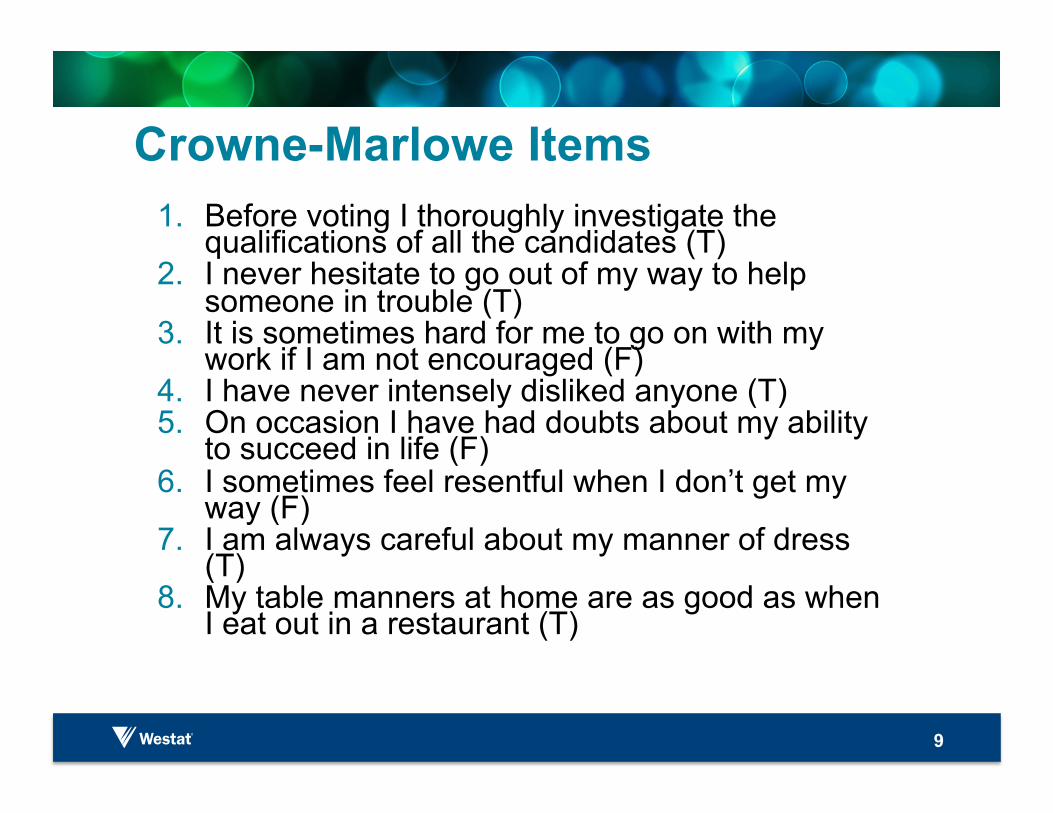
Crowne-Marlowe Items 1. Before voting I thoroughly investigate the
qualifications of all the candidates (T) 2. I never hesitate to go out of my way to help
someone in trouble (T) 3. It is sometimes hard for me to go on with my
work if I am not encouraged (F) 4. I have never intensely disliked anyone (T) 5. On occasion I have had doubts about my ability
to succeed in life (F) 6. I sometimes feel resentful when I don’t get my
way (F) 7. I am always careful about my manner of dress
(T) 8. My table manners at home are as good as when
I eat out in a restaurant (T)
9

What’s Sensitive? • Respondent may not want to disclose information to
researcher, to interviewer, to outside parties
• Which topics?
10

Consequences of Sensitivity • Unit Nonresponse: People fail to participate at all
• Missing Data: They skip offensive, embarrassing questions
• Reporting Errors: They overreport and underreport; sometimes they do both
11

What Helps Improve Reporting? • Since the mid-70’s have known some basic truths
— Self-administration helps (addresses concerns about disclosure to an interviewer)
— Open items better than closed items — Randomized response technique — Bogus pipeline
• Two key papers by Bradburn and colleagues — Blair, Sudman, Bradburn, and Stocking (1977) — Locander, Sudman, & Bradburn (1976)

Underreporting Undesirable Behaviors

Is More More Accurate? • Kreuter, Presser, and Tourangeau (2008) compared survey answers
to University records
14
CATI IVR Web True Status %
False Negative
% False
Positive
% False
Negative
% False
Positive
% False
Negative
% False
Positive GPA < 2.5 83.3 0.0 69.2 0.8 61.5 0.7 At least one D or F 33.0 3.3 28.3 5.4 19.9 2.2
Dropped a class 34.3 6.3 34.2 9.1 31.6 7.6 Warning or probation
33.3 9.1 33.3 11.8 25.0 12.4
GPA > 3.5 16.7 7.4 19.1 1.9 6.8 6.0 Honors 5.3 5.2 0.0 5.7 2.8 6.4 Donations ever 31.5 24.3 25.4 19.2 30.5 20.3 Donations in last year
8.8 25.6 22.2 25.9 20.0 23.3
Member of Alumni Assoc.
2.0 10.7 11.1 10.1 3.2 8.1

Tourangeau, Groves, and Redline (2011)
15
Mode of Data Collection
Mail Telephone Χ 2 Reported voting in: 2004 general election 2006 general election 2008 primary election
Overreported voting in: 2004 general election 2006 general election
78.3 (548) 73.8 (550) 62.8 (550)
52.8 (235) 45.8 (240)
83.0 (342) 79.4 (345) 72.3 (347)
59.8 (132) 54.2 (144)
5.13* 3.68 (p < .06) 6.23*
4.70* 3.32 (p <.07)

Randomized Response Technique • Suppose that every person in the population belongs to either
Group A or Group B … Before the interviews, each interviewer is furnished with an identical spinner with a face marked so that the spinner points to the letter A with probability p and to the letter B with probability (1 - p). Then, in each interview, the interviewee is asked to spin the spinner unobserved by the interviewer and report only whether the spinner points to the letter representing the group to which the interviewee belongs. That is, the interviewee is required only to say yes or no according to whether or not the spinner points to the correct group. (Warner, page 64)
• For example, the respondent might receive one of two statements about a controversial issue (A: I am for legalized abortion on demand; B: I am against legalized abortion on demand) with fixed probabilities. The respondent reports whether he or she agrees with the statement.
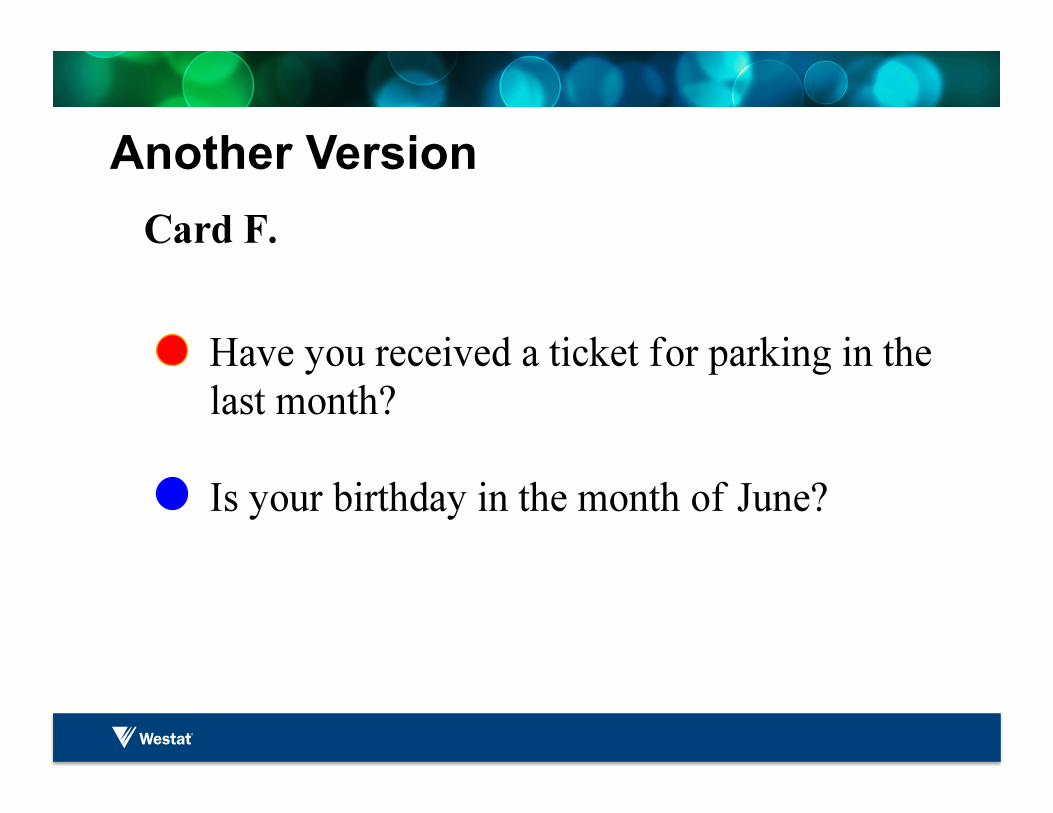
Another Version


19
The Item Count Technique • Holbrook and Krosnick (2010) report four experiments with
voting question
• ICT only helps when questions not self-administered?
• See also Tourangeau and Yan (2007), who question effectiveness of ICT
Direct ICT
National RDD 72.0 52.4
KN sample 66.1 66.4
KN sample 2 59.5 58.1
Six Internet samples 69.9 66.8
20
The Bogus Pipeline
• Device respondent believes can detect lies
• Sometimes not bogus — Bauman and Dent (1982) took breath samples
— Teens more likely to admit smoking when they were forewarned that breath samples would reveal whether they smoked
— Similar studies by Yacoubian and Wish

Entire Sample (Frame Data)
Respondents (Frame Data)
Respondents (Survey Report)
Bias Estimates
Nonresponse Measurement
Voted in 2004 Overall
Telephone Mail
Voter Nonvoter
Voted in 2006 Overall
Telephone Mail
Voter Nonvoter
47.6 (2689)
47.8(1020) 47.5(1669)
95.2 (1346) 0.0 (1343)
43.7 (2689)
43.2(1020) 43.9(1669)
87.2 (1346) 0.0 (1343)
58.3 (904)
60.3 (350) 57.0 (554)
94.8 (556) 0.0 (348)
57.0 (904)
57.4 (350) 56.7 (554)
92.6 (556) 0.0 (348)
80.1 (890)
83.0(342) 78.3(548)
96.7 (551) 53.1 (339)
76.0 (895)
79.4 (345) 73.8 (550)
94.4 (551) 46.5 (344)
10.7
12.5 9.5
-0.4 0.0
13.3
14.2 12.8
5.4 0.0
21.8
22.7 21.3
1.5 53.1
19.0
22.0 17.1
1.8 46.5
21
Conclusions • People worry about privacy and confidentiality, but many
surveys done in presence of other people
• Measurement error can be very large in surveys on sensitive topics, swamping other sources of error at least at high levels of aggregation
• Self-administration seems to help, but hardly eliminates misreporting
• Lots of clever methods (RRT, ICT, etc.) but it is not clear whether they add much; rarely used in practice
• We need to devise new methods for collecting accurate information on sensitive topics
22

Thank You!!!
23
Related Documents