Bachelorarbeit Ivan Morozov Anomaly Detection in Financial Data by Using Machine Learning Methods Fakultät Technik und Informatik Studiendepartment Informatik Faculty of Engineering and Computer Science Department of Computer Science

Welcome message from author
This document is posted to help you gain knowledge. Please leave a comment to let me know what you think about it! Share it to your friends and learn new things together.
Transcript

BachelorarbeitIvan Morozov
Anomaly Detection in Financial Data by Using MachineLearning Methods
Fakultät Technik und InformatikStudiendepartment Informatik
Faculty of Engineering and Computer ScienceDepartment of Computer Science

Ivan Morozov
Anomaly Detection in Financial Data by Using MachineLearning Methods
Bachelorarbeit eingereicht im Rahmen der Bachelorprüfung
im Studiengang Bachelor of Science Angewandte Informatik
am Department Informatik
der Fakultät Technik und Informatik
der Hochschule für Angewandte Wissenschaften Hamburg
Betreuender Prüfer: Prof. Dr. Kai von Luck
Zweitgutachter: Prof. Dr. Klaus-Peter Schoeneberg
Eingereicht am: 9. Mai 2016

Ivan Morozov
Thema der ArbeitAnomaly Detection in Financial Data by Using Machine Learning Methods
StichworteMaschinelles Lernen, Betrugserkennung, Finanzdaten, Datenverarbeitung, Support Vector
Machine, CRISP-DM, Hauptkomponentenanalyse, Ensemblemethoden, Verhaltensdaten
KurzzusammenfassungDie vergabe von Sofort-Krediten online ist eine moderne Business-Lösung. Ein Algorithmus ba-
sierend auf der Theorie vom maschinellen lernen entscheidet, ob ein Kredit vergeben wird oder
nicht. Es ist nicht unüblich, dass Personen mit betrügerischen Absichten versuchen, das System
zu umgehen - mit dem Ziel, einen Kredit zu bekommen. Diese Arbeit hat das Ziel, Methoden
des maschinellen Lernens zu nutzen, um mögliche Betrugsfälle prognostizieren zu können.
Die dafür verwendeten Daten werden während des Kreditantragsverfahrens gesammelt.
Betrugs- bzw. anomale Fälle sind selten, so verwenden die Methoden in dieser Arbeit nur
positive (Kunden die Kredite zurückzahlen) und unmarkierte (Kunden mit einem unbekannten
Status der Rückzahlung) Daten um Betrugsfälle zu identizieren.
Eine Analyse der zugrunde liegenden Daten wurde durchführt und diverse Merkmale und
Probleme wie z. B. die hohe Anzahl von fehlenden Daten wird diskutiert.
Drei Maschinen-Lern-Algorithmen werden vorgestellt. Die one-class SVM verwendet nur
positive Instanzen im Gegensatz zu Positive and Unlabeled Learning (PUL) und PUL Ensemble,
wo beide - sowohl positive als auch unmarkierte - Daten verwendet werden.
Ein Experiment unter der Verwendung von Vorverarbeitungsoperationen und der disku-
tierten Algorithmen wurde durchgeführt. Dieser zeigte eine viel versprechende Betrugser-
kennungsrate bei der Verwendung von one-class SVM auf Kosten einer großen Anzahl von
vertrauenswürdigen Bewerbern, die als Betrüger klassiziert wurden. PUL verringerte die
Anzahl der falsch vorhergesagten Rückzahler, während ein PUL Ensemble alle vertrauenswür-
digen Bewerber richtig klassizierte und die Betrugserkennungsrate auf etwa 73% brachte.
Zusätzlich wurde ein positiver Eekt der Vorverarbeitung von Daten und eine negative Aus-
wirkung der Hauptkomponentenanalyse entdeckt. Schließlich wurde der mögliche Eekt von
PUL-Ensemble als ein Teil des Kredit-Scoring-Systems berechnet.
Die Arbeit kommt zu dem Schluss, dass eine erfolgreiche Betrugserkennung auch ohne die
Verwendung bereits dokumentierter Betrugsfälle möglich ist.

Ivan Morozov
Title of the paperAnomaly Detection in Financial Data by using Machine Learning Methods
KeywordsMachine Learning, Fraud Detection, Financial Data, Big Data, Support Vector Machine, CRISP-
DM, One Class Support Vector Machine, Principal Component Analysis, Ensemble Methods,
Behavior Data, Positive and Unlabeled Learning
AbstractThe instant online issuing of micro-loans is a modern credit lending business solution. It is
based on a machine learning algorithm that automatically scores loan applications. It is not
uncommon that some malicious persons try to bypass the system and get a loan. This thesis
aims to utilize advanced machine learning methods to predict possible fraud on data collected
during the credit-application process.
Fraudulent/anomalous cases are by denition rare, thus, the machine learning methods
discussed in this thesis are based on discriminating fraudsters by using only positive (good
customers that repay loans) and unlabeled (customers with a still unknown repayment status)
data.
A brief analysis of the underlying data is performed and several characteristics and issues
like the high amount of missing values are discussed.
Three machine learning algorithms able to learn only from positive and unlabeled data
are introduced. The one-class Support Vector Machine (SVM) uses only positive instances in
contrast to Positive and Unlabeled Learning (PUL) and PUL Ensemble, where both - positive
and unlabeled data are used.
An experiment that utilizes the preprocessing operations and the machine learning algo-
rithms showed that a one-class SVM can deliver a promising fraud detection rate but at the
expense of a large number of trustworthy applicants being misclassied; PUL signicantly
decreases the false negative rate but failed to detect more fraud cases, whereas a PUL ensemble
achieves a zero false negative rate while driving the fraud detection rate to about 73%. In
addition, a positive eect of the preprocessing pipeline and a negative impact of Principal
Component Analysis is discovered. Finally, a business value of deploying a PUL ensemble as a
part of credit scoring system is calculated for a given test set.
The thesis came to the conclusion that a successful fraud detection is possible even when
fraud cases are rare or unavailable.
iv

Acknowledgement
At this point I would like to acknowledge all the people who supported and assisted me through
the work on this thesis.
First, I would like to thank my advisors Prof. Dr. Kai von Luck and Prof. Dr. Klaus-Peter
Schoeneberg at HAW-Hamburg. Prof. von Luck was always available to answer any questions
I had and has played an important part in keeping me motivated. I am also very thankful for all
the valuable comments and recommendations provided by Prof. Schoeneberg. The expertise
of Prof. von Luck and Prof. Schoeneberg has left a huge impact on me and on my work.
I also want to express my deepest gratitude to Dr. Oleg Okun who was one of my advisors
at Kreditech. His patience, support and valuable advice have helped me move in the right
direction. His ability to explain complex things in a simple way is unique and made my work a
lot easier.
Additional gratitude goes to Dr. Liuben Siarov who was also an advisor to me at Kreditech.
He guided me in my research, helped me structure my work and motivated me to approach
advanced topics.
Further acknowledgement and thanks are due to Alexander Graubner-Müller, CEO at Kred-
itech, who was the one who suggested the idea of anomaly detection and created the environ-
ment to work on it in his company.
Finally, I want to thank all my colleagues at Kreditech for their support. They have made
the writing of this thesis in a real-world company as convenient as possible by answering all
my questions and providing me with information and tools necessary to complete my work.
v

Contents
1 Introduction 11.1 Types of Anomalies . . . . . . . . . . . . . . . . . . . . . . . . . . . . . . . . . 2
1.2 Challenges and Problems . . . . . . . . . . . . . . . . . . . . . . . . . . . . . . 3
1.3 Statistical and Machine Learning Approaches to Anomaly Detection . . . . . . 3
1.3.1 Extreme-Value Analysis . . . . . . . . . . . . . . . . . . . . . . . . . . 3
1.3.2 Proximity-Based Approach . . . . . . . . . . . . . . . . . . . . . . . . 3
1.3.3 Classication Approach . . . . . . . . . . . . . . . . . . . . . . . . . . 4
1.4 Current State in Research . . . . . . . . . . . . . . . . . . . . . . . . . . . . . . 5
1.5 Thesis Goal and Structure . . . . . . . . . . . . . . . . . . . . . . . . . . . . . . 5
2 Data Processing 72.1 Data Acquisition . . . . . . . . . . . . . . . . . . . . . . . . . . . . . . . . . . . 9
2.2 Dataset Overview . . . . . . . . . . . . . . . . . . . . . . . . . . . . . . . . . . 10
2.3 Feature Description . . . . . . . . . . . . . . . . . . . . . . . . . . . . . . . . . 11
2.4 Data Exploration . . . . . . . . . . . . . . . . . . . . . . . . . . . . . . . . . . . 11
2.4.1 Statistical Summary of Data . . . . . . . . . . . . . . . . . . . . . . . . 12
2.4.2 Visual Summary of Data . . . . . . . . . . . . . . . . . . . . . . . . . . 13
2.4.3 Data Quality (missing values) . . . . . . . . . . . . . . . . . . . . . . . 14
2.5 Preprocessing . . . . . . . . . . . . . . . . . . . . . . . . . . . . . . . . . . . . 18
2.5.1 Categorical to Numeric Transformation . . . . . . . . . . . . . . . . . 18
2.5.2 Missing Value Imputation . . . . . . . . . . . . . . . . . . . . . . . . . 19
2.5.3 Removing Corrupted Examples (acquisition error) . . . . . . . . . . . 19
2.5.4 Removing Zero- and Near-Zero Variance Features . . . . . . . . . . . 20
2.5.5 Principle Component Analysis (PCA) . . . . . . . . . . . . . . . . . . . 20
3 Machine Learning Methods 223.1 Support Vector Machines (SVM) . . . . . . . . . . . . . . . . . . . . . . . . . . 22
3.1.1 One Class SVM . . . . . . . . . . . . . . . . . . . . . . . . . . . . . . . 26
3.2 Positive and Unlabeled Learning . . . . . . . . . . . . . . . . . . . . . . . . . . 27
3.3 PUL Ensemble . . . . . . . . . . . . . . . . . . . . . . . . . . . . . . . . . . . . 28
4 Performance Evaluation of Machine Learning Methods 314.1 Receiver Operating Characteristic Analysis (ROC) . . . . . . . . . . . . . . . . 31
5 Experimental Protocol 345.1 Experimental Setting . . . . . . . . . . . . . . . . . . . . . . . . . . . . . . . . 34
5.1.1 Dataset Description . . . . . . . . . . . . . . . . . . . . . . . . . . . . . 34
vi

Contents
5.1.2 Preprocessing Settings . . . . . . . . . . . . . . . . . . . . . . . . . . . 35
5.1.3 Modelling Settings . . . . . . . . . . . . . . . . . . . . . . . . . . . . . 36
5.2 Experimental Results . . . . . . . . . . . . . . . . . . . . . . . . . . . . . . . . 37
5.2.1 Preprocessing Results . . . . . . . . . . . . . . . . . . . . . . . . . . . 37
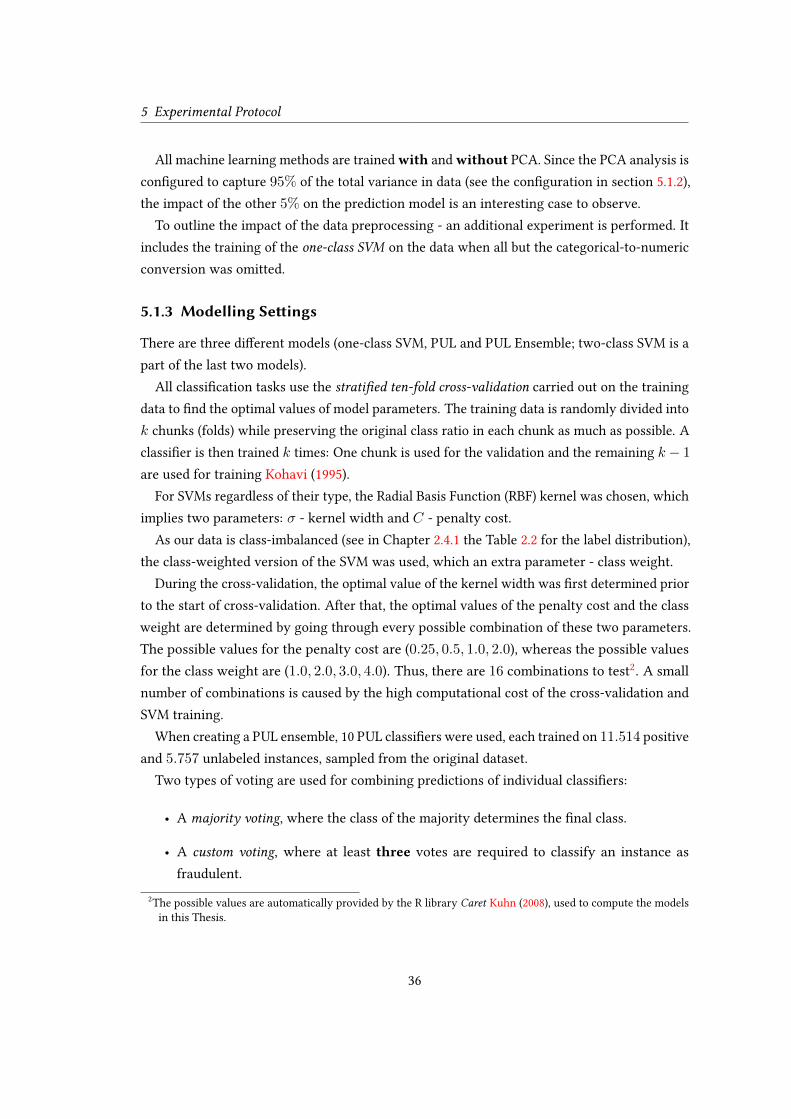
5.2.2 Modelling / Machine Learning Results . . . . . . . . . . . . . . . . . . 38
6 Evaluation of Results: Value for Business 42
7 Conclusion 447.1 Empirical Findings . . . . . . . . . . . . . . . . . . . . . . . . . . . . . . . . . . 45
7.2 Research Implications . . . . . . . . . . . . . . . . . . . . . . . . . . . . . . . . 46
7.3 Policy Implications . . . . . . . . . . . . . . . . . . . . . . . . . . . . . . . . . 46
7.4 Limitation of this Study . . . . . . . . . . . . . . . . . . . . . . . . . . . . . . . 47
7.5 Recommendation for Future Research . . . . . . . . . . . . . . . . . . . . . . . 47
7.6 Last Words . . . . . . . . . . . . . . . . . . . . . . . . . . . . . . . . . . . . . . 48
vii

List of Tables
2.1 Feature-type summary. . . . . . . . . . . . . . . . . . . . . . . . . . . . . . . . 11
2.2 Instance-type/Class-label summary . . . . . . . . . . . . . . . . . . . . . . . . 12
2.3 A summarized analysis of the variance and the mean values about numerical
data. . . . . . . . . . . . . . . . . . . . . . . . . . . . . . . . . . . . . . . . . . . 12
2.4 A summary of missing values in the entire dataset. . . . . . . . . . . . . . . . 15
2.5 A summary of missing values about logical-typed data. . . . . . . . . . . . . . 15
2.6 A summary of missing values about numeric-typed data. . . . . . . . . . . . . 15
2.7 A summary of missing values about categorical-typed data. . . . . . . . . . . . 16
2.8 Missing pattern analysis on four random variables/features in the available data. 16
2.9 An example of a categorical-feature and its levels/categories. . . . . . . . . . . 18
2.10 The result of categorical-to-numeric transformation for the example given in
Table 2.9. . . . . . . . . . . . . . . . . . . . . . . . . . . . . . . . . . . . . . . . 19
5.1 Operations included into data preprocessing. . . . . . . . . . . . . . . . . . . . 35
5.2 Machine learning methods used in experiments. . . . . . . . . . . . . . . . . . 35
5.3 Performance evaluation techniques used in experiments. . . . . . . . . . . . . 35
5.4 The preprocessing impact on the amount of Features. . . . . . . . . . . . . . . 38
5.5 Two-Class SVM - optimal parameters. . . . . . . . . . . . . . . . . . . . . . . . 40
5.6 One-Class SVM - optimal parameters. . . . . . . . . . . . . . . . . . . . . . . . 40
viii

List of Figures
2.1 CRISP-DM process. From: The Figure is taken from the work of Chapman u. a.
(2000) . . . . . . . . . . . . . . . . . . . . . . . . . . . . . . . . . . . . . . . . . 8
2.2 An abstract overview of the data collection process. . . . . . . . . . . . . . . . 10
2.3 A histogram, visualizing a summary of passed time, which the loan applicants
are focused on the web-form eld monthly income, in seconds. . . . . . . . . . 13
2.4 A correlation-plot including the features that are describing the user-behavior
on the web-form eld income. . . . . . . . . . . . . . . . . . . . . . . . . . . . 14
2.5 Two plots, visualizing the missing patterns of the example given in Table 2.8. . 17
3.1 A hyperplane for separating 2-dimensional data.
From: The Figure is taken from the work of Okun (2011) . . . . . . . . . . . . . 23
3.2 A visualization of mapping data into a feature space.
From: The Figure is taken from the work of Okun (2011) . . . . . . . . . . . . . 24
3.3 The margin of a set of points. From: The Figure is taken from the work of Okun
(2011) . . . . . . . . . . . . . . . . . . . . . . . . . . . . . . . . . . . . . . . . 25
3.4 A visualization of the classication with one-class SVM. From:The gure istaken from the work of Shen u. a. (2012) . . . . . . . . . . . . . . . . . . . . . . 27
4.1 Confusion Matrix. . . . . . . . . . . . . . . . . . . . . . . . . . . . . . . . . . . 32
4.2 ROC-Graph for a discrete classier. From: Figure is taken from the workof Fawcett (2006) . . . . . . . . . . . . . . . . . . . . . . . . . . . . . . . . . . . 33
4.3 ROC-Curve for a probabilistic classier. From: Figure is taken from the workof Fawcett (2006) . . . . . . . . . . . . . . . . . . . . . . . . . . . . . . . . . . . 33
5.1 A general experiment pattern. . . . . . . . . . . . . . . . . . . . . . . . . . . . 34
5.2 Changes in the feature amount during the preprocessing. . . . . . . . . . . . . 37
5.3 Confusion Matrices visualizing the Performance of the one-class SVM. . . . . 38
5.4 Confusion Matrices visualizing the Performance of the PUL. . . . . . . . . . . 39
5.5 Confusion Matrices visualizing the Performance of the PUL Ensemble. . . . . 39
5.6 An ROC-Graph visualizing the accuracy of the models involved in the experiment. 41
ix

1 Introduction
All positive examples are alike, each
negative example is negative in its own
way.
Referring to the Anna Karenina principle.
Anomaly is rare and it represents an outlier, i.e., atypical case. The Concise Oxford Dictionary
of Mathematics Clapham (2013) denes an anomaly as an unusual and possibly erroneous
observation that does not follow the general pattern of a drawn population. Anomaly detection
is a branch of data mining that seeks to nd data points or patterns that do not t the overall
pattern of the data. Studying anomalous behavior has been done in many applied areas such as
network security Peddabachigari u. a. (2007), nancial transactions Eskin u. a. (2002); Ahmed
u. a. (2015), medical imaging Spence u. a. (2001), industrial damage detection Hollier und Austin
(2002) and in earth science Das und Parthasarathy (2009), to name a few. As rare observations
often carry important information, their proper detection is of great importance in practice.
This thesis concentrates on anomaly detection in consumer micro-credit lending by using
the state-of-the-art data mining methods.
A micro-credit is usually a small to medium sized loan issued to a private person for a
relatively short period of time. A borrower that needs a loan submits an application via a
web interface that gathers borrower’s personal and nancial information, such as name, the
address of residence, monthly or yearly income, other loans, etc. An data mining algorithm
behind the automatic loan application scoring utilizes this information as well as any extra
available information, e.g., such as data on creditworthiness of an applicant from credit bureaus,
technical characteristics of a device used to submit an application and information describing
the behaviour on the web-site, in order to make a decision of whether to issue a loan or to
reject the application.
It is not uncommon that malicious people known as fraudsters attempt to cheat a scoring
algorithm so as to look as legitimate and trustworthy applicants. Once such a fraudster got
a loan, a micro-crediting company loses money. As the by-product of missed fraud attempt,
a bad debt is accumulated too, which handicaps the ability of such a company to issue loans
1

1 Introduction
to legitimate applicants in the future. Because a loan decision is automatic and it has to be
fast (made in a few dozen minutes), reliable fraud detection is of paramount importance for
lending businesses.
In this chapter, the taxonomy of anomalies will rst be introduced, followed by a list of
challenges and problems encountered in anomaly detection. After that, typical approaches to
anomaly detection are briey sketched together with examples from the literature. Finally, the
goal and the structure of the thesis are outlined.
1.1 Types of Anomalies
According to Chandola u. a. (2009), anomalies can be divided into three categories:
• Point is the simplest type of an anomaly. Given that an observation is described by
several features (attributes, characteristics), the point anomaly only aects one of them,
thus treating any feature independently of the others. For instance, a loan decision is
made based on applicant’s salary only. A salary is, therefore, a feature to consider. A
salary that is extremely high with respect to the rest of salaries is thus the point anomaly.
• Context is an extension of the point anomaly when several features are taken into account
at once, thus assuming certain dependence among features. By extending the example
above, not only salary but also a country of residence are taken into account. In this
case, a salary is linked to the country where a loan applicant lives: a salary of 1,000
euros can be seen as too high in one country while in another country the same amount
corresponds to a typical (average) salary.
• Collective anomalies can be detected by observing a collection of observations. The
context anomaly still views each observation somewhat in isolation from other observa-
tions. The collective anomaly manifests itself only when a few observations are jointly
analyzed. Each observation by itself does not look anomalous, but a group of such
observations occurred together constitutes the anomaly. It is often that such a group
is formed when considering the time dimension. For example, somebody did not yet
repaid one loan but already got the next one, even though the rules explicitly prohibit
this. In isolation, getting a loan is a normal event, but getting two loans when the rst
loan is not yet fully repaid is likely to be abnormal.
The collective anomaly is out of the scope in this work as it requires approaches drastically
dierent from those used to address the rst two types of anomalies.
2

1 Introduction
1.2 Challenges and Problems
Given a statistical/machine learning/data mining algorithm, determining whether an observa-
tion is an anomaly or not is closely tied to the questions: What is a normal state and how this
state can be characterized so that an algorithm can distinguish the normal and abnormal state?
The following challenges are common:
• Rarity of labeled anomalous observations Weiss (2004). Human observers can manually
label few of anomalies, but this is tedious and requires domain knowledge experts. In
addition, anomalous patterns may not yet occur, so that there are representatives of one
(normal) class only.
• Distinguishing between noise in normal data and genuine anomalies is hard and mis-
classication leads to a high false positive (false alarm) or false negative (no alarm)
rate Chandola u. a. (2009).
• Due to the rarity of anomalous observations, it is hard to establish the ground-truth to
objectively judge on algorithm performance Aggarwal (2013).
• Anomalous pattern is not static and can evolve over time. A pattern that is anomalous
at a given point in time may not be anomalous in the future Chandola u. a. (2009).
1.3 Statistical and Machine Learning Approaches to AnomalyDetection
According to to Aggarwal (2013), there are the following approaches to anomaly detection that
rely on either statistical or machine learning algorithms.
1.3.1 Extreme-Value Analysis
This approach is based on the extreme value theory Castillo u. a. (2004). It is a distribution
based and is typically applied to 1-dimensional data by looking at the tails of a data distribution.
This limits its usefulness to the point anomaly detection.
1.3.2 Proximity-Based Approach
The major idea of the proximity-based approach is to pool related data sets to groups or cluster
based on available data. Data points that are not been allocated to any groups are likely
3
1 Introduction
the outliers. There are two main subgroups in this approach: density-based and clustering
approaches. Regardless of this division, the main operation is distance computation between
pairs of observations. For high-dimensional data, however, distances tend to become almost
identical, thus making outlier detection hard Aggarwal (2013).
1.3.3 Classification Approach
Anomaly detection can be modeled as a two- or one-class classication (supervised learning)
problem.
In the former case, two classes of data are assumed to be available: normal and abnormal. To
mitigate class imbalance caused by very few representatives of an anomaly, the cost-sensitive
learning is applied that assigns dierent misclassication costs to dierent classes (cost of
misclassifying an anomalous observation is set to be much higher than that of misclassifying a
normal observation) Elkan (2001).
In one-class classication, only representatives of the normal class are given and an algorithm
is trained to detect them. What cannot be assigned to the normal class is considered to be an
anomaly Amer u. a. (2013).
Although the two-class approach might look more attractive since the conventional super-
vised learning algorithms modied to deal with misclassication costs can readily be applied,
setting these costs is not a trivial task often demanding expert’s knowledge. The one-class
approach that does not need the prior cost specication is, therefore, more appealing and will
be pursued in this thesis.
It should be noted that with either approach there is a risk of the inated false positive
rate, compared to the cases with well-balanced classes. However, this is a challenge and an
unavoidable price to pay when anomalous observations are scarce or unavailable.
In recent years, scholars came to the idea of utilizing unlabeled data to complement labeled
data and use both types of data for training a predictive algorithm. This type of learning is
termed semi-supervised learning Zhu (2008). One example of this approach is positive and
unlabeled learning (PUL) Elkan und Noto (2008), that is particularly suitable for our task as
will be explained below.
As anomaly is caused by dierent reasons and accurate anomaly detection is often hard
to achieve, it is advisable to apply an ensemble of classiers where predictions of individual
classiers - ensemble members - are combined into a single prediction Seni und Elder (2010).
Ensemble learning is a machine learning paradigm where multiple learners are trained to solve
the same problem. In contrast to ordinary machine learning approaches which try to learn
4
1 Introduction
one hypothesis from training data, ensemble methods try to construct a set of hypotheses and
combine them to use Zhou (2012).
1.4 Current State in Research
Numerous scientic surveys Agyemang u. a. (2006); Chandola u. a. (2009, 2012); Pimentel u. a.
(2014) discuss anomaly detection for particular domains from dierent points of view. To
provide a more specic review, this survey considers only domains that are treating topics
where anomalies are representing malicious behavior. Anomaly detection in use case of Credit
Card Fraud is well researched for dierent techniques like Clustering, Nearest Neighbor, SVM,
Eskin u. a. (2002), Neural Networks Ghosh und Reilly (1994) or Statistical modeling Agarwal
(2005) to name a few. The domain of Intrusion Detection treat anomalies indicative for malicious
actions in networks, some techniques which are used for this problem are Positive Unlabeled
Learning (PUL) Eskin u. a. (2002), one class SVM Amer u. a. (2013), Clustering Chandola u. a.
(2006) or Rule based systems Salvador und Chan (2005). However, none of these reviewed
works treat anomaly detection in case of Credit Application Fraud, however, the insights made
in those works could be helpful to develop an own outlier detection model. This work will stick
on the classication 1.3.3 approach by using Two Class SVM Cortes und Vapnik (1995) and
One Class SVM Tax und Duin (2004) as classication algorithms, Positive Unlabeled Learning
(PUL) Elkan und Noto (2008) as the methodology to utilize positive and unlabeled data and
the ensemble approach Mordelet und Vert (2014), that combine SVM, PUL and Bagging (a
technique for sampling of training data) Breiman (1996).
1.5 Thesis Goal and Structure
The key goal of this work is to nd anomalies in credit applicant data which can be indicative
of fraud cases. In many practical situations, examples of fraud are either unavailable or very
few in number. Therefore, several known and new machine learning approaches that are based
on learning from data when fraud examples are unavailable will be used and their performance
will be evaluated in order to investigate challenges and obstacles in nancial data anomaly
detection.
This thesis is structured as follows: After analyzing the state-of-the-art in anomaly detection
in this chapter, Chapter 2 presents the data discovery as specied by the standard CRISP-DM
process, data preprocessing tasks relevant to credit data, and characteristics of the data used in
this thesis. The theoretical overview and discussion of machine learning algorithms used in
5

1 Introduction
this thesis are provided in Chapter 3. Chapter 4 deals with performance evaluation of predictive
models. Experiments done are presented in Chapter 5. The business value of the ndings is
discussed in Chapter 6. Finally, Chapter 7 concludes with a summary of the entire work and
an overview of perspectives for the future research.
6
2 Data Processing
On two occasions I have been asked,
Pray, Mr. Babbage, if you put into themachine wrong gures, will the rightanswers come out? ... I am not able rightly
to apprehend the kind of confusion of
ideas that could provoke such a question.
Charles Babbage
The goal of data mining can be dened as the process of obtaining knowledge from underlying
data by systematic using of analytic methods on it. This Thesis is up to detect anomalies that
are indicative for fraud cases, and the analytic methods are the machine learning algorithms
discussed later in Chapter 3.
However, data-mining is more than applying algorithms on data. Extracting of valuable
results eorts among other things the consideration of a basis principle in the eld of computer
science known as Garbage In Garbage Out (GIGO). The business dictionary1
denes GIGO as
an axiom used in context of computer science that signifying that no matter how sophisticated
an information processing system is, the quality (accuracy, completeness, relevance, timeliness,
etc) of the information coming out of it cannot be better than the quality of the information
that went in. A program working on inaccurate data will only yield misleading results. The
preparation of data has thus a signicant contribution to the success of a data-mining goal.
There are several established standards in the industry like KDD, SEMMA, CRISP 2to name
a few, invented to structure a data-mining process. This thesis will partially3
adapt methods
from the Cross-industry process for data mining (CRISP-DM) Chapman u. a. (2000) which is a
proved data-mining process approach described in terms of a hierarchical process model.
The CRISP-DM process is a cycle. Although the whole cycle contains various components
(see Figure 2.1). This Chapter will focus in particular on the rst three items (namely Business1
http://www.businessdictionary.com/denition/garbage-in-garbage-out-GIGO.html
2
See the work of Azevedo und Santos (2008).
3
CRISP-DM is an industry standard, thus not completely implementable in the scope of research for a Thesis.
However it will be used as an alignment for structural approaching a data-mining goal.
7

2 Data Processing
Figure 2.1: CRISP-DM process. From: The Figure is taken from the work of Chapman u. a. (2000)
Understanding, Data Understanding and Data Preparation) which represent a fundamental part
of the planning process. The interdependencies of these components is not subject for further
analysis as the main objective is to outline the potential operations such as analytics and
preprocessing actions. The results of the pre-processing operations will then be pinpointed
and discussed in Chapter 5. The CRISP-DM process is well dening the chronological and
iterative steps which are necessary to guarantee the appropriate handling of the data and
further evaluations of potential limitations Chapman u. a. (2000).
This chapter will rst provide a macro view of a loan application process to point out the
steps our data is come from. Then, the rst three phases of CRISP-DM process are described
with respect to the context of this thesis:
• Business Understanding
– Data acquisition (section 2.1).
– Dataset overview (section 2.2) – a macro view of the entire dataset.
8

2 Data Processing
• Data Understanding
– Feature description (section 2.3) – a micro view of feature characteristics and type.
– Data exploration (section 2.4) – statistical and visual summaries, data quality,
correlated features.
• Data Preparation
– Data preprocessing (section 2.5) – preparation for data mining.
2.1 Data Acquisition
The underlying data treated in this thesis contain information, collected during the credit
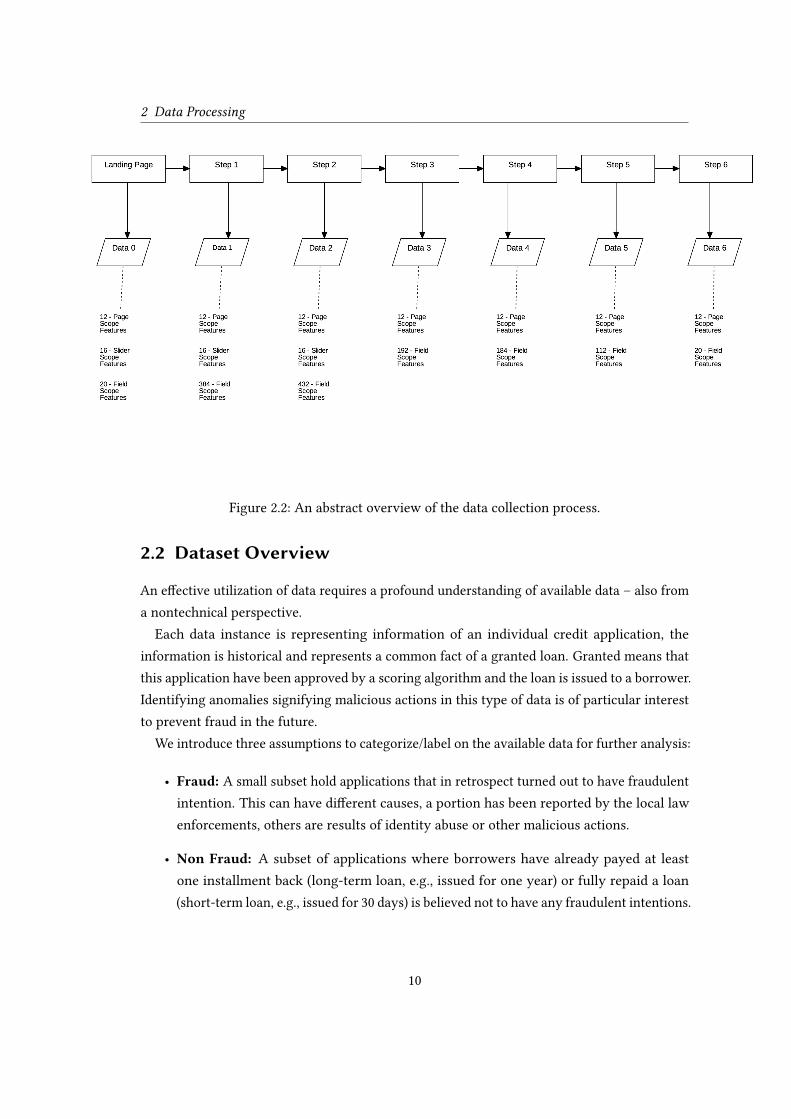
request process, briey illustrated in Figure 2.2. In the course of the application, the potential
borrower provides his personal information by stepping through a number of steps in the
web-application form. His/her interactions with web-form elements, such as pressed keys or
tracked time between actions, are also collected. Figure 2.2 shows an overview of data collecting
process steps. Each step signies an abstract step that the potential borrower has to accomplish
to get a loan, beginning by visiting the initial web-page (Landing Page). Behavioral features
are collected in each of the particular steps. There are three dierent scopes of behavioral
features: the scope of the particular web-page, the scope of web-form elements and the scope
of the web-slider (a web-form element). After the application process is nished, the data is
stored in a database.
After fetching from an SQL database, the data is represented by a matrix whose rows are
loan applications and columns are features associated with each loan application.
The features are either categorical or numeric and come from the two dierent sources:
• Applicant input collected from a loan applicant.
• System input collected by the application processing system.
User input (data an applicant reports about himself/herself) may be inaccurate (for example,
due to mistyping or deliberate attempt of cheating) and therefore it is dismissed from further
analysis. More objective information is deemed to be collected from applicant’s behavior
when he/she is lling web-forms. Manipulation of behavioral information is signicantly more
dicult than lling in false personal data.
As fraud intended to bypass a scoring system and get a loan despite false information is one
of the anomalies, behavioral features serve as a basis for anomaly detection.
9
2 Data Processing
Figure 2.2: An abstract overview of the data collection process.
2.2 Dataset Overview
An eective utilization of data requires a profound understanding of available data – also from
a nontechnical perspective.
Each data instance is representing information of an individual credit application, the
information is historical and represents a common fact of a granted loan. Granted means that
this application have been approved by a scoring algorithm and the loan is issued to a borrower.
Identifying anomalies signifying malicious actions in this type of data is of particular interest
to prevent fraud in the future.
We introduce three assumptions to categorize/label on the available data for further analysis:
• Fraud: A small subset hold applications that in retrospect turned out to have fraudulent
intention. This can have dierent causes, a portion has been reported by the local law
enforcements, others are results of identity abuse or other malicious actions.
• Non Fraud: A subset of applications where borrowers have already payed at least
one installment back (long-term loan, e.g., issued for one year) or fully repaid a loan
(short-term loan, e.g., issued for 30 days) is believed not to have any fraudulent intentions.
10

2 Data Processing
• Unlabeled: A notable subset of applications not labeled as fraud but also not having
positive cash ow; thus, this data could not be labeled with absolute certainty.
In total the underlying dataset holds 95.951 instances of individual credit applications.
2.3 Feature Description
The underlying dataset contains in total 1.804 features for each loan application (instance).
A description of each feature is thus not practical. However, a more consolidated analysis is
reported in Table 2.1.
Table 2.1: Feature-type summary.
Type No. of Features PercentageCategorical 196 11%
Logical 90 5%
Numeric 1519 84%
As could be seen, a vast majority of features is numeric, i.e., they can be represented by
a number. The examples of numeric features are the number of keys pressed or time to ll a
eld in the application form. Features that may take only binary values (Yes/No, True/False)
are boolean or logical like did an applicant read the term conditions? or did email address given
exist?. Features that can be represented by words (or categories) like a city of residence or place
of work - are categorical.
Although there are machine learning algorithms that can manage features of dierent types,
a majority requires to convert logical and categorical features into a numeric format. How this
is typically done will be explained in section 2.5.
2.4 Data Exploration
This task addresses data mining questions by using database querying, visualization, and
reporting techniques. These include distributions of key features, relationships between
pairs or small numbers of features, results of simple aggregations, properties of signicant
subpopulations, and simple statistical analyses. These analyses may directly address the data
mining goals, they may also contribute to or rene the data description and quality reports,
and feed into the transformation and other data preparation steps needed for further analysis
Chapman u. a. (2000).
11
2 Data Processing
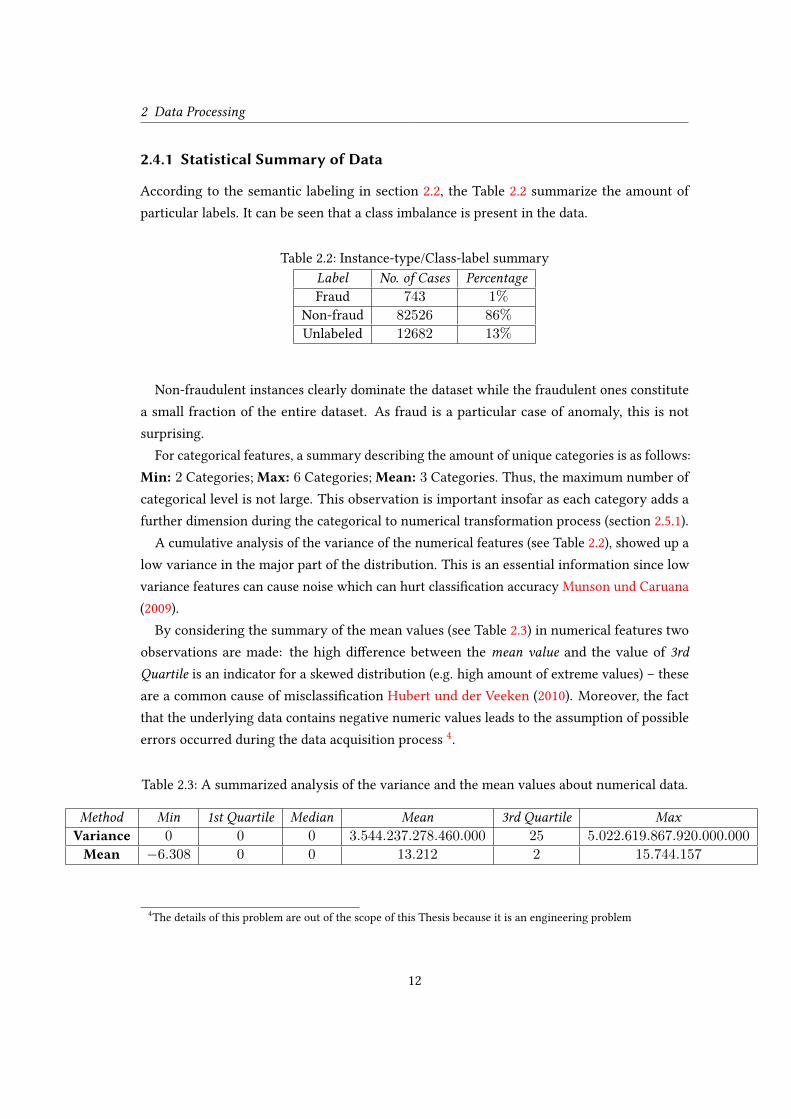
2.4.1 Statistical Summary of Data
According to the semantic labeling in section 2.2, the Table 2.2 summarize the amount of
particular labels. It can be seen that a class imbalance is present in the data.
Table 2.2: Instance-type/Class-label summary
Label No. of Cases PercentageFraud 743 1%
Non-fraud 82526 86%
Unlabeled 12682 13%
Non-fraudulent instances clearly dominate the dataset while the fraudulent ones constitute
a small fraction of the entire dataset. As fraud is a particular case of anomaly, this is not
surprising.
For categorical features, a summary describing the amount of unique categories is as follows:
Min: 2 Categories; Max: 6 Categories; Mean: 3 Categories. Thus, the maximum number of
categorical level is not large. This observation is important insofar as each category adds a
further dimension during the categorical to numerical transformation process (section 2.5.1).
A cumulative analysis of the variance of the numerical features (see Table 2.2), showed up a
low variance in the major part of the distribution. This is an essential information since low
variance features can cause noise which can hurt classication accuracy Munson und Caruana
(2009).
By considering the summary of the mean values (see Table 2.3) in numerical features two
observations are made: the high dierence between the mean value and the value of 3rd
Quartile is an indicator for a skewed distribution (e.g. high amount of extreme values) – these
are a common cause of misclassication Hubert und der Veeken (2010). Moreover, the fact
that the underlying data contains negative numeric values leads to the assumption of possible
errors occurred during the data acquisition process4.
Table 2.3: A summarized analysis of the variance and the mean values about numerical data.
Method Min 1st Quartile Median Mean 3rd Quartile MaxVariance 0 0 0 3.544.237.278.460.000 25 5.022.619.867.920.000.000
Mean −6.308 0 0 13.212 2 15.744.157
4
The details of this problem are out of the scope of this Thesis because it is an engineering problem
12

2 Data Processing
2.4.2 Visual Summary of Data
Visualization has the ability to present information directly to the vision of a human, whose
capability of pattern recognition is still unmatched to other analytical techniques like computers,
thus, visual summarizing often helps to expose salience in data like extreme values, relationships
or interactions to name a few Li (2004).
Let consider the feature describing the time a loan applicant focuses his mouse on the input
eld for monthly income. A histogram of its values (see Figure 2.3) shows a Poison distribution
without extremes.
Figure 2.3: A histogram, visualizing a summary of passed time, which the loan applicants are
focused on the web-form eld monthly income, in seconds.
Some values in Figure 2.3 are unusually large, possibly implying suspicious behavior when
a would-be applicant tries to guess the income of a legitimate person.
An often used mathematical tool to demonstrate relationships between features is correlation
analysis. The correlation plot (see Figure 2.4) illustrates correlations between features related to
the eld for monthly income. It shows near zero correlation between the focus time (observed
above) and others, whereby for example the time past during changes and the count of tries to
edit the particular eld have an quite high correlation factor. However, some other features are
moderately correlated. Visual exploration like this often guides a choice of data preprocessing
to be applied and may reveal data quality issues.
13

2 Data Processing
Figure 2.4: A correlation-plot including the features that are describing the user-behavior on
the web-form eld income.
2.4.3 Data ality (missing values)
The only really good solution to the
missing data problem is not to have any.
Statistical adjustments can never make
up for sloppy research.
Paul D. Allison, 2001
Lack of information or missing data in a given dataset is a common obstacle in eld statistics
and data mining Allison (2002). Below analysis is done in order to identify the amount of
missing data.
Table 2.4 presents a statistical summary about the amount of missing values in the source
data. It can be seen that there are some features containing all but missing values, and there
are a plenty of features with about a half of values missing, implying that removal of rows
with missing values is not an option because this would dramatically reduce the dataset size.
14

2 Data Processing
Table 2.4: A summary of missing values in the entire dataset.
Min 1st Quartile Max Median Mean 3rd Quartile0% 8% 99% 31% 43% 77%
Since the lack of data is present, a deeper investigation is required. Missing data can have
dierent types (in the context of statistical analysis). According to Allison (2002) there are
three categories of missing data:
• Missing Completely At Random (MCAR) means that the probability of missing is
unrelated to the feature itself or other features.
• Missing At Random (MAR) addresses the missing in features that is unrelated to itself.
For example, the probability of missing income-value may depends on the employment
status - value, but does not depend on the income-value itself.
• Not Missing At Random (NMAR) eventuates when MAR is gone to be violated, ergo
the probability of the missing depend on the particular value.
Identifying the right category is important to select the correct treatment. However, classify
the category of missing is not straight forward. An assumption about the membership is always
based on observations on data and domain specic knowledge of data collection process.
Below (2.5, 2.6, 2.7) the missing value analysis is broken down into summaries that are
grouped by datatypes of the features.
Table 2.5: A summary of missing values about logical-typed data.
Min 1st Quartile Max Median Mean 3rd Quartile5% 9% 99% 31% 43% 76%
Table 2.6: A summary of missing values about numeric-typed data.
Min 1st Quartile Max Median Mean 3rd Quartile0% 8% 99% 30% 41% 76%
As follows from these (2.5, 2.6, 2.7) tables, missing values are present in each group of
features. The statistics for logical and numeric data are quite similar: This fact can lead to the
15
2 Data Processing
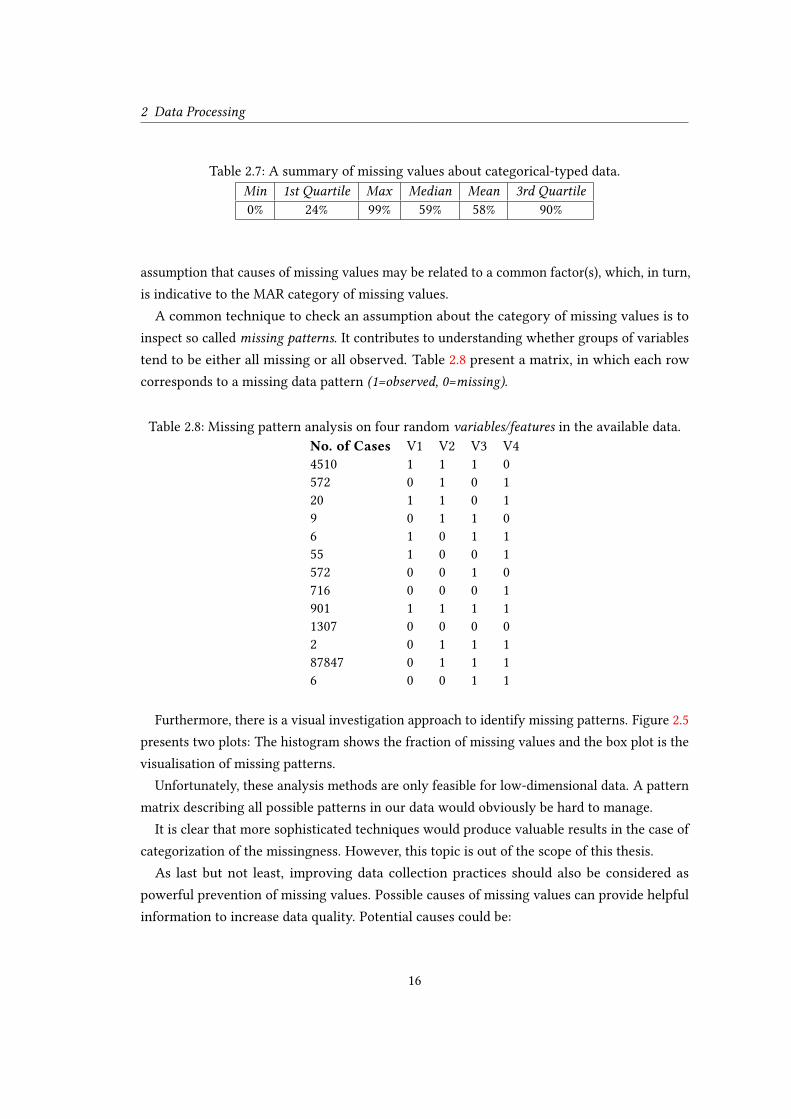
Table 2.7: A summary of missing values about categorical-typed data.
Min 1st Quartile Max Median Mean 3rd Quartile0% 24% 99% 59% 58% 90%
assumption that causes of missing values may be related to a common factor(s), which, in turn,
is indicative to the MAR category of missing values.
A common technique to check an assumption about the category of missing values is to
inspect so called missing patterns. It contributes to understanding whether groups of variables
tend to be either all missing or all observed. Table 2.8 present a matrix, in which each row
corresponds to a missing data pattern (1=observed, 0=missing).
Table 2.8: Missing pattern analysis on four random variables/features in the available data.
No. of Cases V1 V2 V3 V4
4510 1 1 1 0
572 0 1 0 1
20 1 1 0 1
9 0 1 1 0
6 1 0 1 1
55 1 0 0 1
572 0 0 1 0
716 0 0 0 1
901 1 1 1 1
1307 0 0 0 0
2 0 1 1 1
87847 0 1 1 1
6 0 0 1 1
Furthermore, there is a visual investigation approach to identify missing patterns. Figure 2.5
presents two plots: The histogram shows the fraction of missing values and the box plot is the
visualisation of missing patterns.
Unfortunately, these analysis methods are only feasible for low-dimensional data. A pattern
matrix describing all possible patterns in our data would obviously be hard to manage.
It is clear that more sophisticated techniques would produce valuable results in the case of
categorization of the missingness. However, this topic is out of the scope of this thesis.
As last but not least, improving data collection practices should also be considered as
powerful prevention of missing values. Possible causes of missing values can provide helpful
information to increase data quality. Potential causes could be:
16
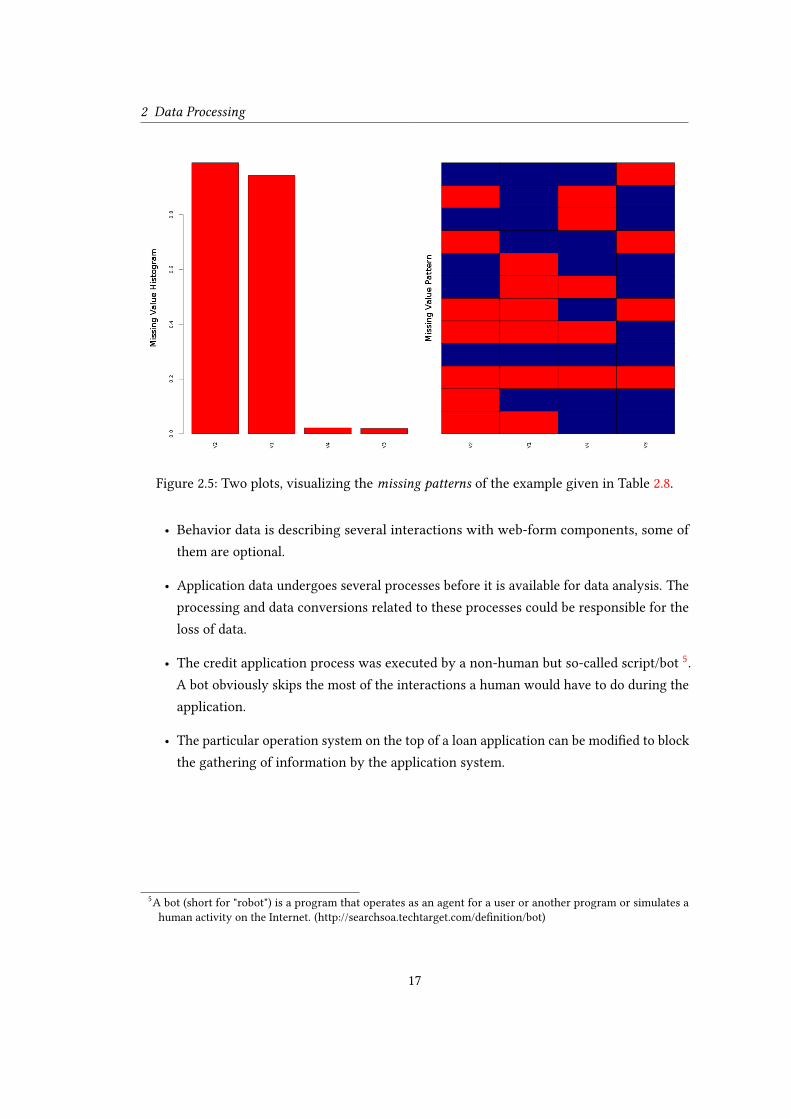
2 Data Processing
Figure 2.5: Two plots, visualizing the missing patterns of the example given in Table 2.8.
• Behavior data is describing several interactions with web-form components, some of
them are optional.
• Application data undergoes several processes before it is available for data analysis. The
processing and data conversions related to these processes could be responsible for the
loss of data.
• The credit application process was executed by a non-human but so-called script/bot5.
A bot obviously skips the most of the interactions a human would have to do during the
application.
• The particular operation system on the top of a loan application can be modied to block
the gathering of information by the application system.
5
A bot (short for "robot") is a program that operates as an agent for a user or another program or simulates a
human activity on the Internet. (http://searchsoa.techtarget.com/denition/bot)
17

2 Data Processing
2.5 Preprocessing
Based on the observations obtained through acquisition and exploration of our data, this section
explains the necessary steps of data transformation to be made before building a predictive
model.
2.5.1 Categorical to Numeric Transformation
Many machine learning algorithms like those in Chapter 3 cannot deal with other than nu-
merical data types. Therefore logical and categorical data should be converted to a numeric
representation before predictive modeling begins. The logical features are easy to convert: one
value is replaced with 0 while the other with 1.
As for categorical features, the common approach is to replace each category level with a
set of binary dummy variables, where the number of such variables is equal to the number of
dierent levels.
Let us consider a categorical feature "Feature-Action" with the following possible levels/cate-
gories :
ButtonClick,MouseClick,Other
For the sake of simplicity we consider a subset with only four instances as given in Table 2.9.
Table 2.9: An example of a categorical-feature and its levels/categories.
Instance-ID Feature-ActionA Other
B MouseClick
C ButtonClick
D Other
Using binary dummy variables results in three additional features with a numerical value of
either 1 or 0. Table 2.10 shows the result of transformation the categorical features to numeric.
18

2 Data Processing
Table 2.10: The result of categorical-to-numeric transformation for the example given in Ta-
ble 2.9.
Instance-ID Feature-Action.ButtonClick Feature-Action.MouseClick Feature-Action.OtherA 0 0 1
B 0 1 0
C 1 0 0
D 0 0 1
However, if the number of levels is too large, data dimensionality rapidly increases with
each such a feature, thus contributing to noise and increased computation time Briscoe und
Feldman (2006).
2.5.2 Missing Value Imputation
Bellow, some techniques how to impute missing values are described:
• Mean imputation: each empty eld will be replaced with a arithmetical average of a
given distribution. However, this method is not robust, since it is largely inuenced by
outliers.
• Median imputation: where the empty elds are replaced by a value which represent a
separation point of the higher half - from the lower half in a distribution.
• Categorical imputation: an imputation technique for categorical data, where each empty
value is imputed with a new invented category. For example an empty value in the
categorical feature "place of work" will be imputed with the category other.
2.5.3 Removing Corrupted Examples (acquisition error)
Since the process of data acquisition become more and more complex the chance to nd a
subset of awed data points in the underlying dataset increase. Examples for corrupted data
can be type errors (e.g. a categorical value in a numeric eld), extreme values (e.g. a negative
value in the eld for monthly income) or missing values (separately discussed in section 2.4.3).
The causes are initially wrong input by user, erroneous type conversions or data transmission
dropouts to name a few.
19
2 Data Processing
A summary of the mean value (see section 2.4.1) showed up the existing of negative numerical
values in behavior data. However, behavior information can not be positive by denition6.
Correcting such awed entries eorts a detailed root-cause analysis. However, this is an
engineering-heavy task and would go beyond the scope of this thesis. So the treatment in this
Thesis will be to identify and exclude such corruptions from further analysis.
2.5.4 Removing Zero- and Near-Zero Variance Features
Once all features become numeric, one can proceed with other transformations, namely a
removal of features with zero and near zero variance as such features possess little or no power
in discriminating classes of data. Think of the extreme example when all values for a given
feature are the same, regardless a class label. The variance of such values is exactly zero and it
is impossible to distinguish classes based on this feature alone.
Near-zero variance means that a feature takes very few unique values (relative to the number
of instances) or has a large ratio of the rst most common value to the second most common
value.
Observations made by inspecting the data quality (see section 2.4.3) showed a signicant
number of missing values for some features, which implies that the data may likely contain
features with zero and near-zero variance.
Although removal near-zero variance features seems to be desirable, there are situations
where this might not be the case: For example, a native binary feature with a lot of zeroes
and few ones could be a good discriminator between classes but the near-zero variance check
could possibly remove it.
2.5.5 Principle Component Analysis (PCA)
Principle Component Analysis is one of the main methods to reduce dimensionality, rst
introduced by Karl Pearson in Pearson (1901). The main idea behind PCA is to reduce the
number of features through a linear transformation aiming at nding directions of maximal
data variance. Given a large number of features in our dataset, doing PCA is a reasonable
preprocessing step. PCA also makes features uncorrelated, which is an attractive characteristic
when there is suspicion of correlation among the original features.
Formally, the goal of PCA is to map data instances from higher- to lower-dimensional space:
x ∈ X ∈ IRnto z ∈ Z ∈ IRk
6
Behavior data of type numeric that is considered in this Thesis can only have values ≥ 0, to be correct by
denition.
20
2 Data Processing
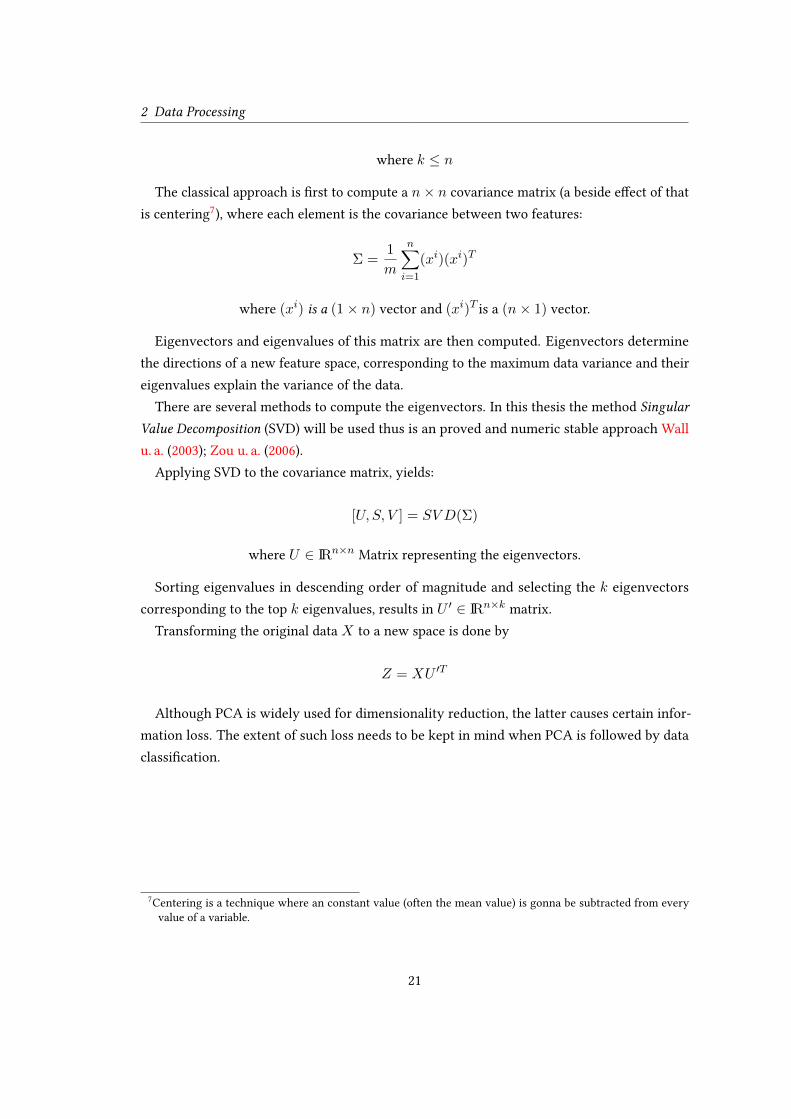
where k ≤ n
The classical approach is rst to compute a n× n covariance matrix (a beside eect of that
is centering7), where each element is the covariance between two features:
Σ =1
m
n∑i=1
(xi)(xi)T
where (xi) is a (1× n) vector and (xi)T is a (n× 1) vector.
Eigenvectors and eigenvalues of this matrix are then computed. Eigenvectors determine
the directions of a new feature space, corresponding to the maximum data variance and their
eigenvalues explain the variance of the data.
There are several methods to compute the eigenvectors. In this thesis the method Singular
Value Decomposition (SVD) will be used thus is an proved and numeric stable approach Wall
u. a. (2003); Zou u. a. (2006).
Applying SVD to the covariance matrix, yields:
[U, S, V ] = SV D(Σ)
where U ∈ IRn×nMatrix representing the eigenvectors.
Sorting eigenvalues in descending order of magnitude and selecting the k eigenvectors
corresponding to the top k eigenvalues, results in U ′ ∈ IRn×kmatrix.
Transforming the original data X to a new space is done by
Z = XU ′T
Although PCA is widely used for dimensionality reduction, the latter causes certain infor-
mation loss. The extent of such loss needs to be kept in mind when PCA is followed by data
classication.
7
Centering is a technique where an constant value (often the mean value) is gonna be subtracted from every
value of a variable.
21
3 Machine Learning Methods
This chapter will treat the machine learning methods applied in this thesis. The subsection
Support Vector Machines: 3.1, will point out the idea of SVM including an introduction into
the theoretical parts. Followed by: 3.2 where the Positive Unlabeled Learning (PUL) strategy
for training of our prediction model is discussed. The subjecting section: 3.1.1 approach on
One Class SVM, it will cover the concept and the gaps in respect to the ordinary SVM. At the
end of this chapter, the subsection: 3.3 will introduce the concept of Ensembles in the scope of
machine learning especially to improve the classication accuracy.
The purpose of the following introduction is:
• Understand the core concept of the particular algorithms.
• Get a brief understanding of the theoretical concepts driving the algorithms.
• Became familiar with the possible tuning options that the algorithms contain and be
able to track the motivation of adjusting them.
One last note before starting: the theoretical concepts will be presented in an aggregated form.
The goal is to provide only the information necessary to follow up in the further chapter.
3.1 Support Vector Machines (SVM) 1
Support Vector Machines (SVM) Cortes und Vapnik (1995) is a well proven method with a solid
background in statistical learning theory. It can be used for both classication and regression
tasks. What distinguishes an SVM from other methods is a better ability to deal with high
dimensional data and the guarantee of the globally optimal solution. The solution an SVM
produces is sparse in many cases as only a fraction of training set instances is relevant for
the task at hand. These instances, called support vectors, lie close to a hyperplane separating
data into classes. Thus, an SVM tries to transform nonlinearly separable classes into linearly
separable ones because the latter case is simpler to solve than the former. Without loss of
1
The following chapter is based on the chapter 8 of the book Okun (2011), and provides a brief summary of SVM
important for further work in this thesis.
22
3 Machine Learning Methods
generality and for the purpose of this thesis, only one or two classes are assumed to be present
in the data.
Let us assume that we are given a data set as:
S = (x1, y2), (x2, y2), ..., (xn, yn) xi ∈ Rd yi ∈ −1, 1,
where xi is the i−th input instance or data point and yi is its class label. Thus, xi is a d−dimensional column vector whereas yi is a scalar.
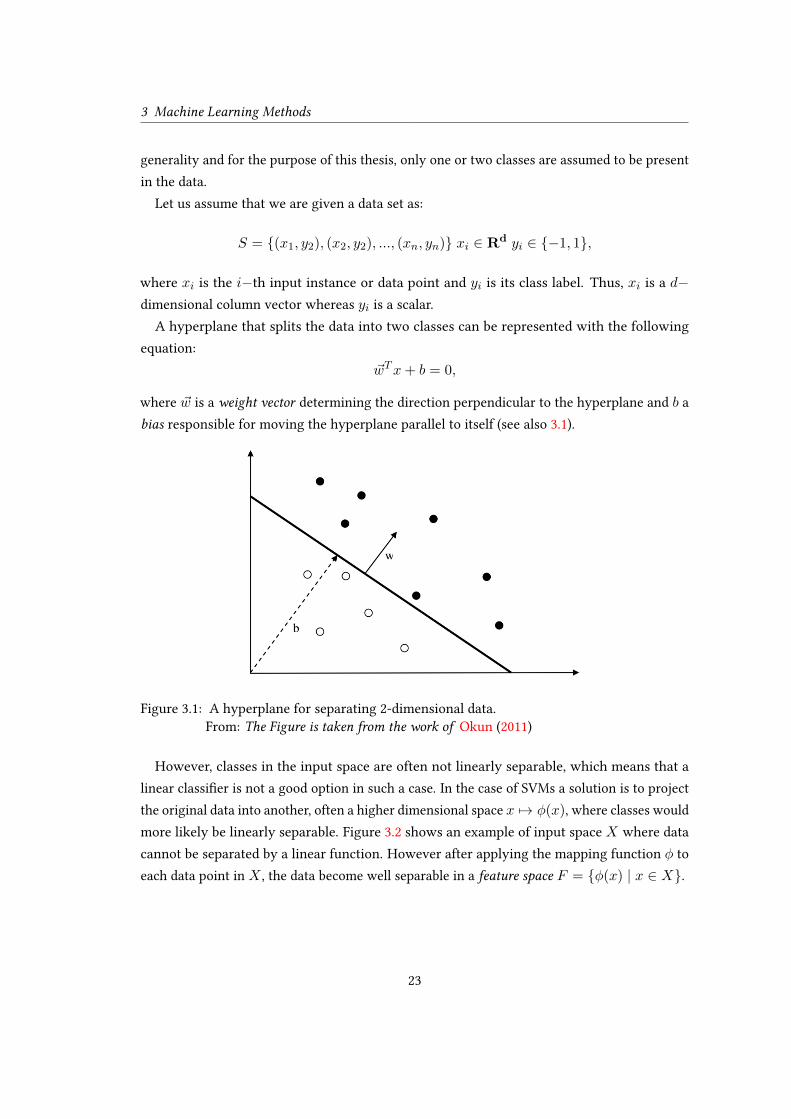
A hyperplane that splits the data into two classes can be represented with the following
equation:
~wTx+ b = 0,
where ~w is a weight vector determining the direction perpendicular to the hyperplane and b a
bias responsible for moving the hyperplane parallel to itself (see also 3.1).
Figure 3.1: A hyperplane for separating 2-dimensional data.
From: The Figure is taken from the work of Okun (2011)
However, classes in the input space are often not linearly separable, which means that a
linear classier is not a good option in such a case. In the case of SVMs a solution is to project
the original data into another, often a higher dimensional space x 7→ φ(x), where classes would
more likely be linearly separable. Figure 3.2 shows an example of input space X where data
cannot be separated by a linear function. However after applying the mapping function φ to
each data point in X , the data become well separable in a feature space F = φ(x) | x ∈ X.
23

3 Machine Learning Methods
Figure 3.2: A visualization of mapping data into a feature space.
From: The Figure is taken from the work of Okun (2011)
Thus, a straightforward solution seems to transforms data into a feature space where a linear
classier can be built. These two operations are combined with the help of a kernel function.
The typical kernel functions are:
• K(x, z) = x′z - linear kernel
• K(x, z) = (τ + x′z)p - polynomial kernel of degree p
• K(x, z) = exp(−σ||x− z||2) - Gaussian or Radial Basis Function (RBF) kernel
In these denitions, only x and z are vectors while other symbols denote scalars.
As one can see, the kernel representation eliminates the necessity to map each input indi-
vidually: the inputs never appear isolated but in the form of inner products between pairs
of vectors. Because of this, we don’t need to know the underlying feature map! Also, the
dimensionality of the feature space does not aect the computation as the inner product is a
number. As a result, the only information that is necessary is a n× n kernel matrix.
Kernels provide one pillar of SVMs. The other is the optimization theory as the SVM solution
is formulated as an optimization task, subject to certain constraints. The primal optimization
problem where w and b are involved is dicult to solve due to inequality constraints. Instead,
the dual problem based on Lagrangian theory2
transforms the task into a quadratic program
where the function to be optimized is quadratic while the constraints are all equalities rather
than inequalities. The solution of such a problem is known to be unique and global. It is also
sparse by implying that only a small fraction of the original data matters for class separation,
which results in a very ecient classier.
2
Lagrangian theory is a basic mathematical tool for constrained optimization of dierentiable functions, especially
for nonlinear constrained optimization Li (2008).
24
3 Machine Learning Methods
Below both primal and dual optimization problems are given. The maximal (or hard) margin
problem assumes two classes are only linearly separable in the feature space. To remedy its
deciency, the soft margin problem is then presented that works with nonlinearly separable
classes by introducing slack variables measuring non-separability (see below).
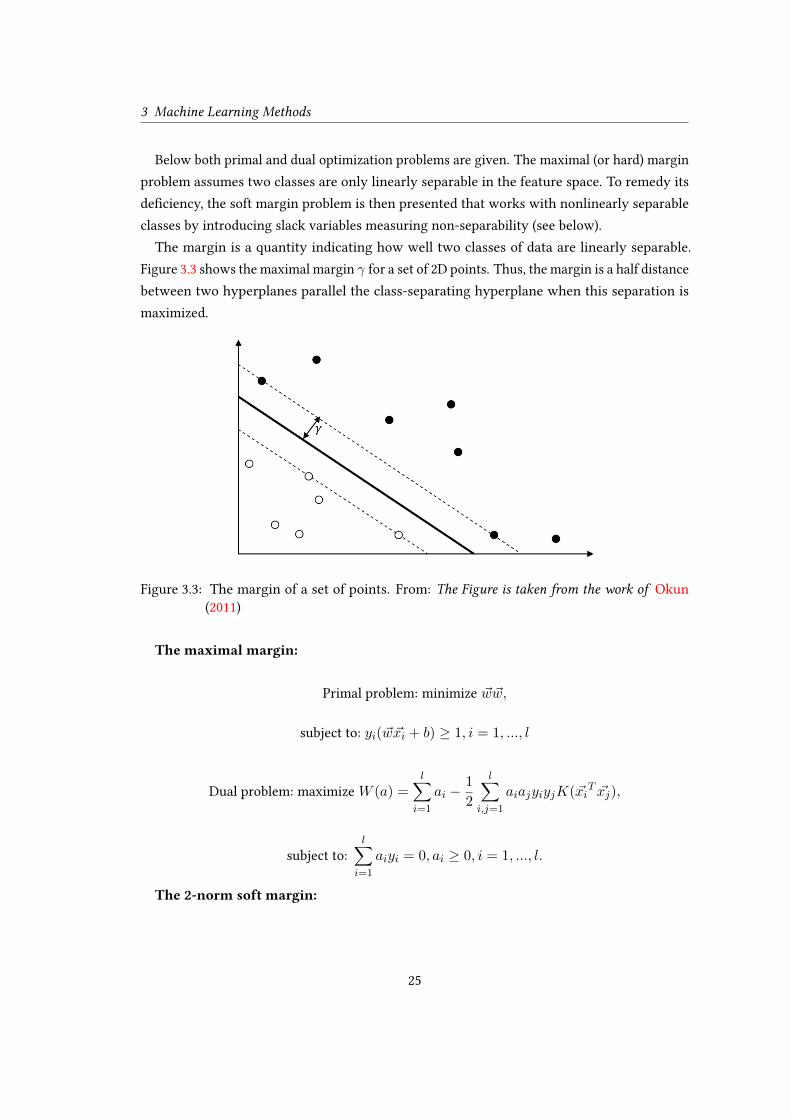
The margin is a quantity indicating how well two classes of data are linearly separable.
Figure 3.3 shows the maximal margin γ for a set of 2D points. Thus, the margin is a half distance
between two hyperplanes parallel the class-separating hyperplane when this separation is
maximized.
Figure 3.3: The margin of a set of points. From: The Figure is taken from the work of Okun
(2011)
The maximal margin:
Primal problem: minimize ~w~w,
subject to: yi(~w~xi + b) ≥ 1, i = 1, ..., l
Dual problem: maximize W (a) =l∑
i=1
ai −1
2
l∑i,j=1
aiajyiyjK(~xiT ~xj),
subject to:
l∑i=1
aiyi = 0, ai ≥ 0, i = 1, ..., l.
The 2-norm soft margin:
25
3 Machine Learning Methods
Primal problem: minimize ~w~w + Cl∑
i=1
ξ2i over ξ, ~w, b
subject to: yi(~w~xi + b) ≥ 1− ξi, , i = 1, ..., l
Dual problem: maximize W (a) =l∑
i=1
ai −1
2
l∑i,j=1
aiajyiyj(K(~xi
T ~xj) +1
cδi),
subject to:
l∑i=1
aiyi = 0, ai ≥ 0, i = 1, ..., l.
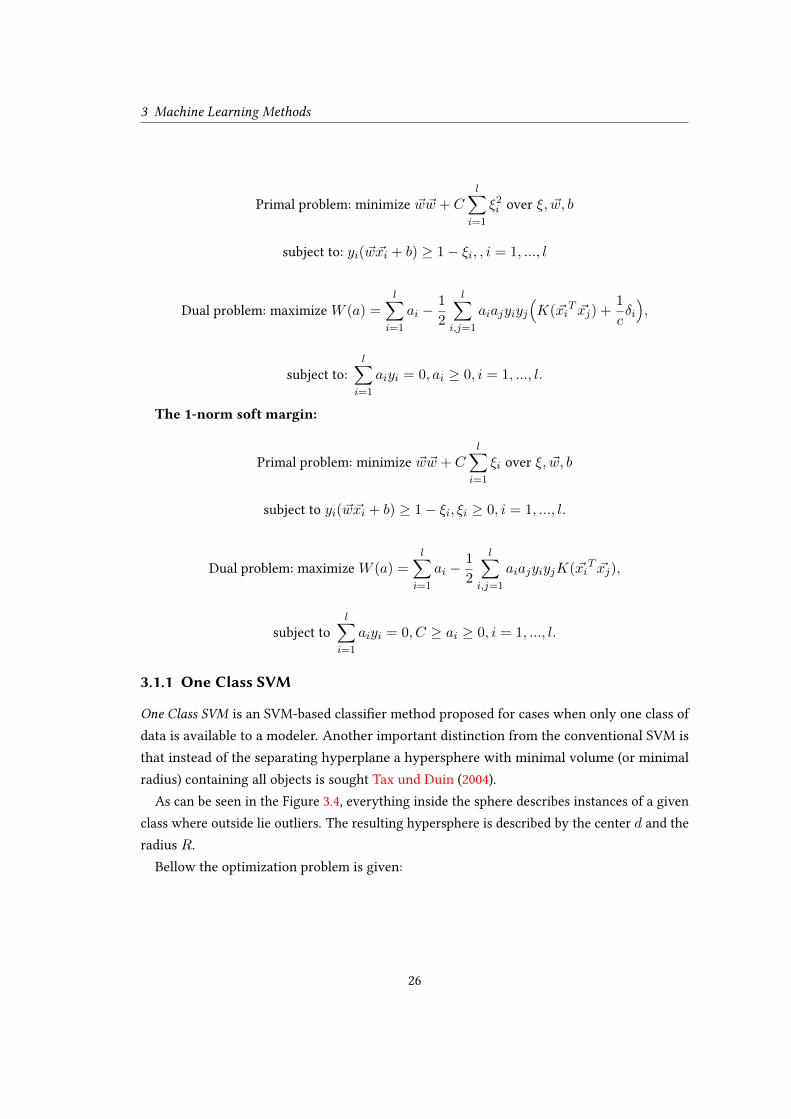
The 1-norm soft margin:
Primal problem: minimize ~w~w + Cl∑
i=1
ξi over ξ, ~w, b
subject to yi(~w~xi + b) ≥ 1− ξi, ξi ≥ 0, i = 1, ..., l.
Dual problem: maximize W (a) =l∑
i=1
ai −1
2
l∑i,j=1
aiajyiyjK(~xiT ~xj),
subject to
l∑i=1
aiyi = 0, C ≥ ai ≥ 0, i = 1, ..., l.
3.1.1 One Class SVM
One Class SVM is an SVM-based classier method proposed for cases when only one class of
data is available to a modeler. Another important distinction from the conventional SVM is
that instead of the separating hyperplane a hypersphere with minimal volume (or minimal
radius) containing all objects is sought Tax und Duin (2004).
As can be seen in the Figure 3.4, everything inside the sphere describes instances of a given
class where outside lie outliers. The resulting hypersphere is described by the center d and the
radius R.
Bellow the optimization problem is given:
26

3 Machine Learning Methods
Figure 3.4: A visualization of the classication with one-class SVM. From:The gure is takenfrom the work of Shen u. a. (2012)
Minimize R2 + Cn∑
i=1
ξi,
subject to: ||xi − d||2 ≤ R2 + ξi, ξi ≥ 0, i = 1, ..., n
Where ξ are the slack variables for soft margin optimization and C is the penalty parameter
that gives the trade-o between the volume of the sphere and the number of errors.
3.2 Positive and Unlabeled Learning3
Positive Unlabeled Learning (PUL) is an approach on the learning a classier from positive and
unlabeled data problem. Because only one class is available (positive), PUL could be considered
as a kind of one-class task. However, using unlabeled data, which are plenty, given modern
data collection technologies, turns this task into two-class classication. Unlabeled data are
assumed to contain both positive and negative instances but their labels are unknown to an
observer. Because in PUL settings the amount of one class of data often far exceeds the amount
of the other class, the classication problem becomes imbalanced. One of the ways to solve
3
The description of Positive and Unlabeled Learning algorithm in this chapter is based on the work of Elkan und
Noto (2008).
27

3 Machine Learning Methods
class imbalance is to use cost-sensitive learning where errors made on dierent classes have
dierent costs.
The goal of the PUL technique by Elkan und Noto (2008) is to learn the true function f(.)
that can predict the positive P examples as closely as possible, by learning another function
g(.) from positive and unlabeled U data. Also a validation set, separate from the training data,
is needed in order to nd a normalizing constant c for g(.). After that, given a test (unseen)
vector x, f(x) is found as g(x)/c.
PUL pseudocode is given below: 1.
Algorithm 1 PUL by using SVM.
1: D ← P ∪ U . Positive and Unlabeled data, where Unlabeled is implicitly a label.
2: Train, V alid, Test ← split(D) . Split the original data into training, validation, and
test sets.
3: g ← svm(Train) . Train a cost-sensitive 2-class SVM.
4: Prob = g(V alid) . Get probabilities of being positive for positive instances of the
validation set.
5: c = mean(Prob) . Calculate the normalizing constant as the mean probability.
6: Prob = g(Test)/c . Compute the probability of being positive for test data.
7: If this probability is larger than 0.5, label a test instance as positive
There the data is rst divided into training, validation, and test sets. Then a cost-sensitive
SVM is used to train a classier, able to predict the probability of an instance being positive.
The result of applying the classier on the validation set yields the normalizing constant (by
taking the mean probability) that is then used for generating test set predictions.
In other works on PUL, experimental results showed that this approach signicantly reduces
the eort of labeling the data, while yielding competitive results, compared to the case when
both positive and negative labels must be known before learning (see Li u. a. (2011)).
3.3 PUL Ensemble
PUL Ensemble is an approach to combine multiple PUL algorithms in order to improve classi-
cation performance and outperform a single PUL algorithm. One of the common techniques to
create an ensemble is to associate a separate training set with/for each ensemble member. In
this thesis the Robust Ensemble of Support Vector Machines algorithm Claesen u. a. (2014) is
selected, in order to implement the ensemble.
The problem of PU learning can be considered as a supervised task with label noise in
the negative set Claesen u. a. (2014). However, the assumption that only the negative set can
28

3 Machine Learning Methods
contain label noise can be violated due to various reasons Frénay und Verleysen (2014). For
example, our assumption that borrowers which have already paid at least one installment
back are believed not having fraudulent intentions (see Chapter 2.2) could be violated when
some borrowers are paying a small amount of money back in order to hide their fraudulent
intentions - that would mean those positive examples P can contain label noise.
Robust Ensemble of Support Vector Machines (RESVM) is an ensemble algorithm with the
goal to improve classication performance of PU Learning tasks where label noise is assumed
to be present in both positive and negative sets of instances Claesen u. a. (2014). The RESVM is
based on following two methods that already treat the problem of label noise in U :
Bagging SVM algorithm by Mordelet und Vert (2014), which consists of aggregating SVM
trained on random resamples of U to discriminate P .
Class-weighted SVM (CWSVM) is a classication technique where the penality parameter
for misclassications C diers from class to class Liu u. a. (2003). Applied to a PU Learning
problem the misclassication of positive examples is penalized more than the misclassication
of unlabeled examples to emphasize the higher degree of certainty on positive labels Claesen
u. a. (2014).
Additionally to that, the RESVM introduces the concept of resampling both P and U in con-
trast to the Bagging SVM where only U is resampled. The resampled sets will have a dierent
amount of label noise without increasing the bias. Training based on randomly resampled sets
decreases the variance and thus helps to increase the classication accuracy Breiman (2000).
As our implementation of the PUL algorithm is also based on class weighted penalties (see
the Algorithm 1), CWSVM is in fact identical to a single PUL algorithm.
Below the algorithm of RESVM is given 2.
Algorithm 2 RESVM
nmodels . Number of base models (SVM) in the ensemble.
nunl . Size of resample of U .
npos . Size of resample of P .
k(.) . Kernel function to be used by SVM.
1: Ω← ∅ . Output with nmodels base models.
2: for i:=1 do nmodels
3: P i ← sample(P, npos) . Sample npos instances with replacement from P .
4: U i ← sample(U, nunl) . Sample nunl instances with replacement from U .
5: Di ← P i ∪ U i . Combine two sets of instances to form a training set.
6: ψi ← train(Di, k) . Train CWSVM to discriminate P vs U , with kernel k.
7: Ω← Ω ∪ ψi . Add a trained model to the output.
end for
29

3 Machine Learning Methods
In each iteration, a random sample of P and U is drawn separately. Then both samples
are combined to form a training set for a Class-Weighted SVM (P vs U ). Once all ensemble
members have been trained, the nal prediction is dened by a majority voting. In case of a
tie, a random decision is made.
30

4 Performance Evaluation of MachineLearning Methods
You want to evaluate future borrowers,
but in order to train an algorithm that
will help you identify future defaults,
you have to train it and evaluate it on
past data.
Anthony Goldbloom
Evaluating results of outlier detection algorithms and measuring their eectiveness is an
essential task. The main requirement for evaluation is the availability of ground-truth about
the class membership. Since the ground truth is available, a part of the data can be used for
training and the remaining for evaluation.
This chapter describe the measurement technique which is used in Chapter 5.2 to evaluate
the experimental (classication) results.
4.1 Receiver Operating Characteristic Analysis (ROC) 1.
ROC analysis is a technique to measure and visualize the performance of a classier through
calculating the tradeo between hit rates and false alarms Fawcett (2006). This performance
evaluation technique is mostly applied to binary classiers.
Regardless of a classier, there are four types of a prediction outcome, covering all possible
scenarios:
• True Positive (TP): If an instance is positive and it was classied as positive.
• False Positive (FP): If an instance is negative and it was classied as positive.
1
The terms in the scope of ROC analysis can vary (e.g true positive rate = hit rate ...), for the sake of consistency
the below explanation will follow notation in Fawcett (2006)
31
4 Performance Evaluation of Machine Learning Methods
• True Negative (TN): If an instance is negative and it was classied as negative.
• False Negative (FN): If an instance is positive and it was classied as negative.
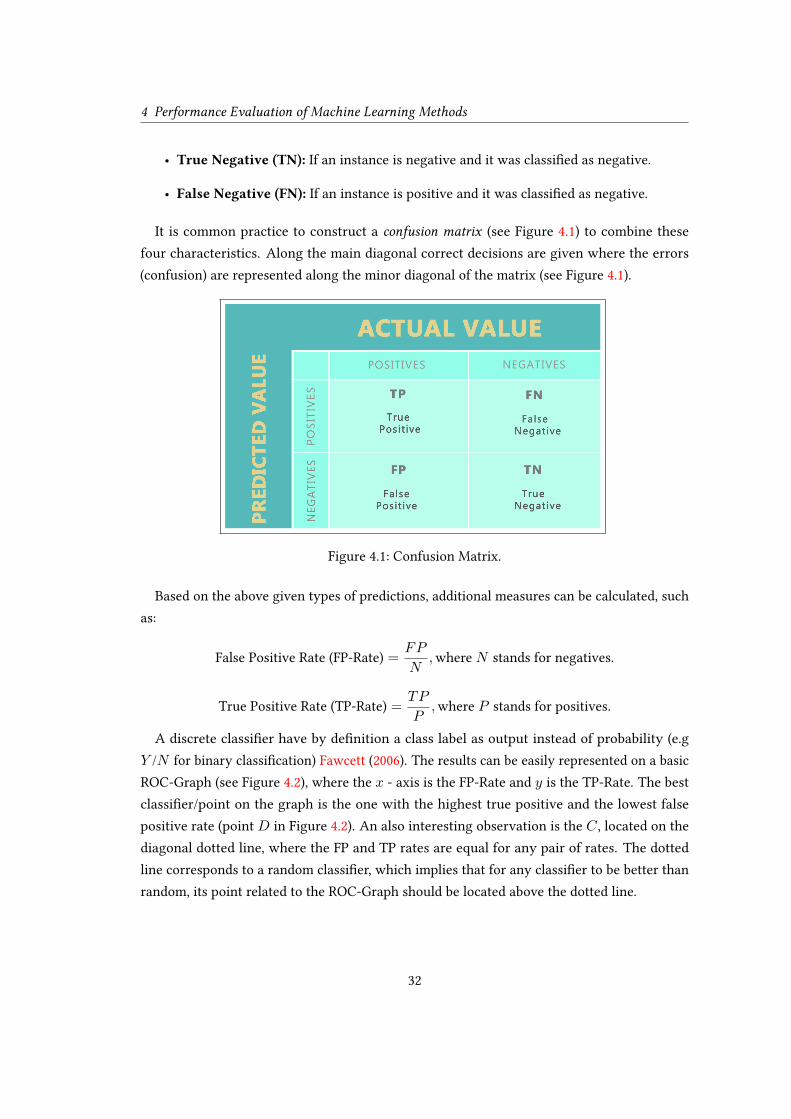
It is common practice to construct a confusion matrix (see Figure 4.1) to combine these
four characteristics. Along the main diagonal correct decisions are given where the errors
(confusion) are represented along the minor diagonal of the matrix (see Figure 4.1).
Figure 4.1: Confusion Matrix.
Based on the above given types of predictions, additional measures can be calculated, such
as:
False Positive Rate (FP-Rate) =FP
N,where N stands for negatives.
True Positive Rate (TP-Rate) =TP
P,where P stands for positives.
A discrete classier have by denition a class label as output instead of probability (e.g
Y /N for binary classication) Fawcett (2006). The results can be easily represented on a basic
ROC-Graph (see Figure 4.2), where the x - axis is the FP-Rate and y is the TP-Rate. The best
classier/point on the graph is the one with the highest true positive and the lowest false
positive rate (point D in Figure 4.2). An also interesting observation is the C , located on the
diagonal dotted line, where the FP and TP rates are equal for any pair of rates. The dotted
line corresponds to a random classier, which implies that for any classier to be better than
random, its point related to the ROC-Graph should be located above the dotted line.
32

4 Performance Evaluation of Machine Learning Methods
Figure 4.2: ROC-Graph for a discrete classier.
From: Figure is taken from the workof Fawcett (2006)
Figure 4.3: ROC-Curve for a probabilistic clas-
sier. From: Figure is taken from thework of Fawcett (2006)
Some classiers yields numeric (real) values as an output. These values are either strict
probabilities or they can be uncalibrated scores that may be turned into probability. These
values can be converted into binary labels by using a threshold, e.g., if the value is above the
threshold then the label is Y else N . So, each threshold would produce a dierent point in
ROC space, and connecting the points together produces the ROC-Curve (see Figure 4.3).
ROC analysis is thus a useful tool for measuring classier performance. Whenever a discrete
classier is used yielding crisp labels, a confusion matrix provides an additional view on
classier performance that complements a ROC-Graph. With a classier capable of calculating
the probabilities, a ROC-Curve is a natural choice for performance evalution. For imbalanced
data sets like the one used in this thesis, the ROC analysis results in unbiased performance
evaluation that is not inuenced (dominated) by a majority class, in contrast to such measures
as classication accuracy Fawcett (2006).
33

5 Experimental Protocol
In this chapter the design aspects introduced in previous chapters (2,3,4) are brought together
and nd their practical application. The goal is to produce measurable performance results by
applying of preprocessing and machine learning algorithms.
The general pattern that this chapter follows is partially attributed to the CRISP-DM process
(see Figure 2.1) and contains three sub-processes: DataPreparation, Modelling, Evaluation. Each
of them contains techniques previously described in this thesis.
Figure 5.1: A general experiment pattern.
An experiment is dened as an process that follows the general experimental pattern (see
Figure 5.1), where the particular methods (see Tables 5.1, 5.2, 5.3) and their parameters can
vary.
5.1 Experimental Seing
5.1.1 Dataset Description
The initial data set has 95.951 instances with 1.804 features per instance. Each instance
represents a single credit-application (a detailed overview of underlying data can be found in
Chapter 2.3).
The data is divided into Training/Validation/Test sets in the proportion1 (≈ 60%/ ≈ 30%/ ≈
10%). All instances that are labeled as Fraud (743) are assigned to the test set since the
predictive algorithms expects Positive and Unlabeled data only. Thus, fraud instances are not a
part of training/validation sets.
1
A common suggested size for the training set is 60%− 80% Good (2005).
34

5 Experimental Protocol
Operation Reference
Removing Corrupted Instances 2.5.3
Categorical to Numeric Transformation 2.5.1
Missing Value Imputation 2.5.2
Removing Zero- and Near-Zero Variance Features 2.5.4
Principle Component Analysis (PCA) 2.5.5
Table 5.1: Operations included into data preprocessing.
Method Reference
Two-Class SVM 3.1
One-Class SVM 3.1.1
PUL 3.2
PUL Ensemble 3.3
Table 5.2: Machine learning methods used in experiments.
Technique Reference
ROC analysis 4.1
Table 5.3: Performance evaluation techniques used in experiments.
5.1.2 Preprocessing Seings
Below the conguration settings for (all) the preprocessing operations (see Table 5.1) used in
the experiment are given:
• Corrupted instances will be completely excluded from the data set.
• The imputation of missing values is done by imputing the median value for numerical
features and by adding of a new level, such as ’OTHER’, to the categorical features.
• All categorical features are then transformed to a numerical representation.
• Low variance features are removed with thresholds freqCut = 95/5 (the cuto for the
ratio of the most common value to the second most common value) and uniqueCut = 10
(the cuto for the percentage of distinct values out of the total number of instances).
• Data dimensionality is reduced with the PCA analysis in order to preserve ≈ 95% of the
total data variance. The R implementation of PCA explicitly performs the zero-mean,
unit-variance normalization (scaling) of each feature.
35
5 Experimental Protocol
All machine learning methods are trained with and without PCA. Since the PCA analysis is
congured to capture 95% of the total variance in data (see the conguration in section 5.1.2),
the impact of the other 5% on the prediction model is an interesting case to observe.
To outline the impact of the data preprocessing - an additional experiment is performed. It
includes the training of the one-class SVM on the data when all but the categorical-to-numeric
conversion was omitted.
5.1.3 Modelling Seings
There are three dierent models (one-class SVM, PUL and PUL Ensemble; two-class SVM is a
part of the last two models).
All classication tasks use the stratied ten-fold cross-validation carried out on the training
data to nd the optimal values of model parameters. The training data is randomly divided into
k chunks (folds) while preserving the original class ratio in each chunk as much as possible. A
classier is then trained k times: One chunk is used for the validation and the remaining k − 1
are used for training Kohavi (1995).
For SVMs regardless of their type, the Radial Basis Function (RBF) kernel was chosen, which
implies two parameters: σ - kernel width and C - penalty cost.
As our data is class-imbalanced (see in Chapter 2.4.1 the Table 2.2 for the label distribution),
the class-weighted version of the SVM was used, which an extra parameter - class weight.
During the cross-validation, the optimal value of the kernel width was rst determined prior
to the start of cross-validation. After that, the optimal values of the penalty cost and the class
weight are determined by going through every possible combination of these two parameters.
The possible values for the penalty cost are (0.25, 0.5, 1.0, 2.0), whereas the possible values
for the class weight are (1.0, 2.0, 3.0, 4.0). Thus, there are 16 combinations to test2. A small
number of combinations is caused by the high computational cost of the cross-validation and
SVM training.
When creating a PUL ensemble, 10 PUL classiers were used, each trained on 11.514 positive
and 5.757 unlabeled instances, sampled from the original dataset.
Two types of voting are used for combining predictions of individual classiers:
• A majority voting, where the class of the majority determines the nal class.
• A custom voting, where at least three votes are required to classify an instance as
fraudulent.
2
The possible values are automatically provided by the R library Caret Kuhn (2008), used to compute the models
in this Thesis.
36

5 Experimental Protocol
5.2 Experimental Results
5.2.1 Preprocessing Results
The eect of preprocessing on the number of features and the number of instances is analyzed
below.
Impact on FeaturesFigure 5.2 shows the change in the number of features after each preprocessing operation. The
preprocessing reduced the number of features from 1.804 to 271, this corresponds reduction
by ≈ 85%.
Figure 5.2: Changes in the feature amount during the preprocessing.
Table 5.4 present a detailed description of preprocessing operations visualized at Figure 5.2
and their impact on the amount of features after the particular operation was applied.
Impact on Instances and their ValuesRemoving of instances contaminated by data acquisition errors reduced the sample size by
≈ 1% to 95.829 instances. There were a lot of missing values in the data: ≈ 40% of all numeric
values and about ≈ 53% of all categorical and logical values were imputed.
37
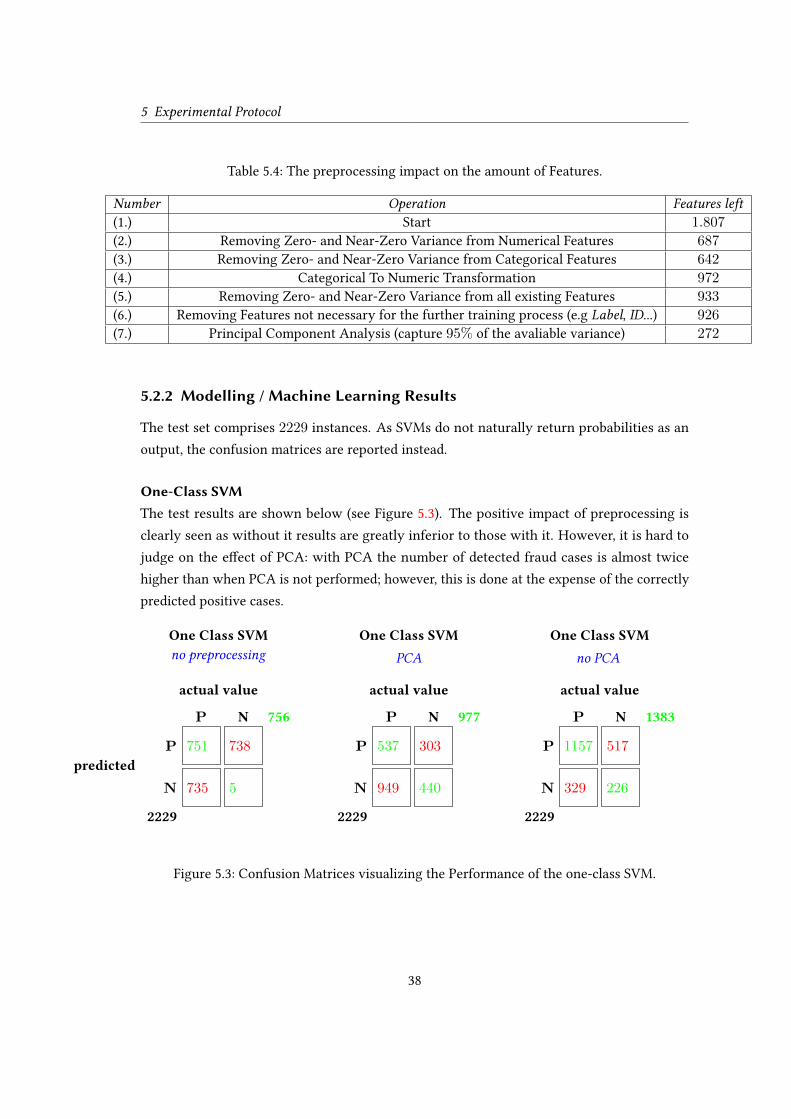
5 Experimental Protocol
Table 5.4: The preprocessing impact on the amount of Features.
Number Operation Features left(1.) Start 1.807
(2.) Removing Zero- and Near-Zero Variance from Numerical Features 687
(3.) Removing Zero- and Near-Zero Variance from Categorical Features 642
(4.) Categorical To Numeric Transformation 972
(5.) Removing Zero- and Near-Zero Variance from all existing Features 933
(6.) Removing Features not necessary for the further training process (e.g Label, ID...) 926
(7.) Principal Component Analysis (capture 95% of the avaliable variance) 272
5.2.2 Modelling / Machine Learning Results
The test set comprises 2229 instances. As SVMs do not naturally return probabilities as an
output, the confusion matrices are reported instead.
One-Class SVMThe test results are shown below (see Figure 5.3). The positive impact of preprocessing is
clearly seen as without it results are greatly inferior to those with it. However, it is hard to
judge on the eect of PCA: with PCA the number of detected fraud cases is almost twice
higher than when PCA is not performed; however, this is done at the expense of the correctly
predicted positive cases.
751P
P
738
756N
735
2229
N 5
predicted
One Class SVMno preprocessing
actual value
537P
P
303
N 977
949N
2229
440
One Class SVMPCA
actual value
1157P
P
517
N 1383
329N
2229
226
One Class SVMno PCA
actual value
Figure 5.3: Confusion Matrices visualizing the Performance of the one-class SVM.
38
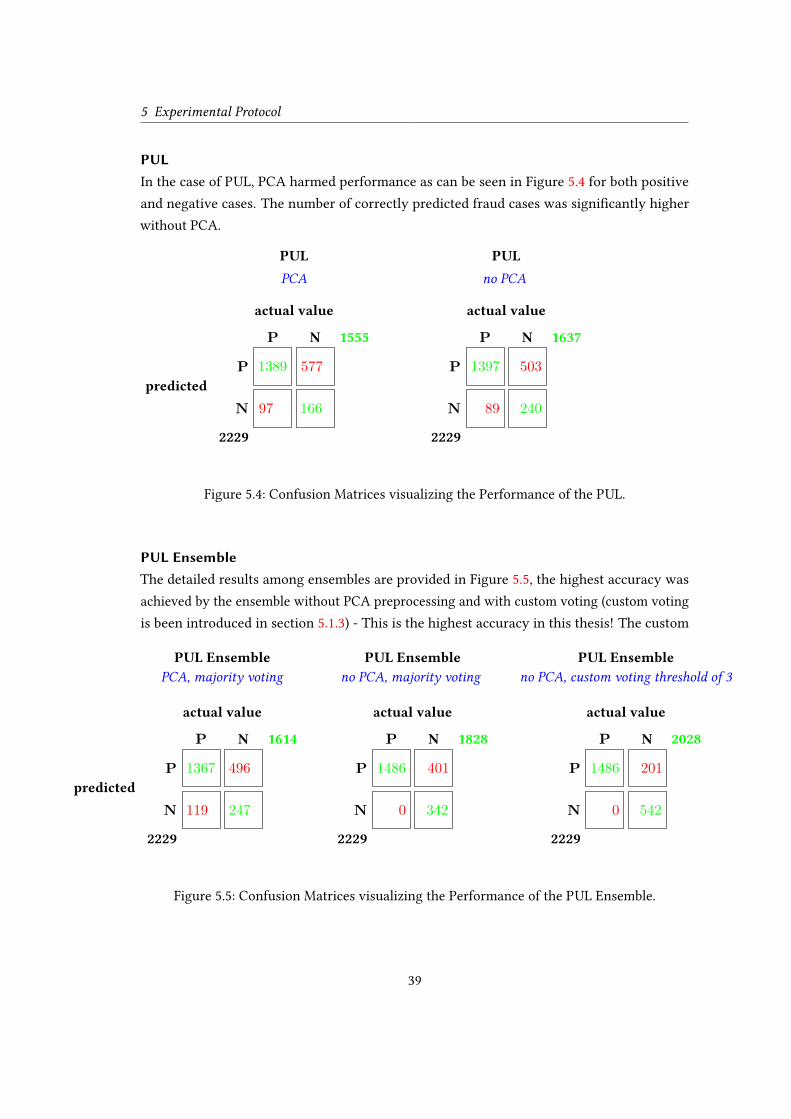
5 Experimental Protocol
PULIn the case of PUL, PCA harmed performance as can be seen in Figure 5.4 for both positive
and negative cases. The number of correctly predicted fraud cases was signicantly higher
without PCA.
1389P
P
577
N 1555
97N
2229
166
predicted
PULPCA
actual value
1397P
P
503
N 1637
89N
2229
240
PULno PCA
actual value
Figure 5.4: Confusion Matrices visualizing the Performance of the PUL.
PUL EnsembleThe detailed results among ensembles are provided in Figure 5.5, the highest accuracy was
achieved by the ensemble without PCA preprocessing and with custom voting (custom voting
is been introduced in section 5.1.3) - This is the highest accuracy in this thesis! The custom
1367P
P
496
N 1614
119N
2229
247
predicted
PUL EnsemblePCA, majority voting
actual value
1486P
P
401
N 1828
0N
2229
342
PUL Ensembleno PCA, majority voting
actual value
1486P
P
201
N 2028
0N
2229
542
PUL Ensembleno PCA, custom voting threshold of 3
actual value
Figure 5.5: Confusion Matrices visualizing the Performance of the PUL Ensemble.
39
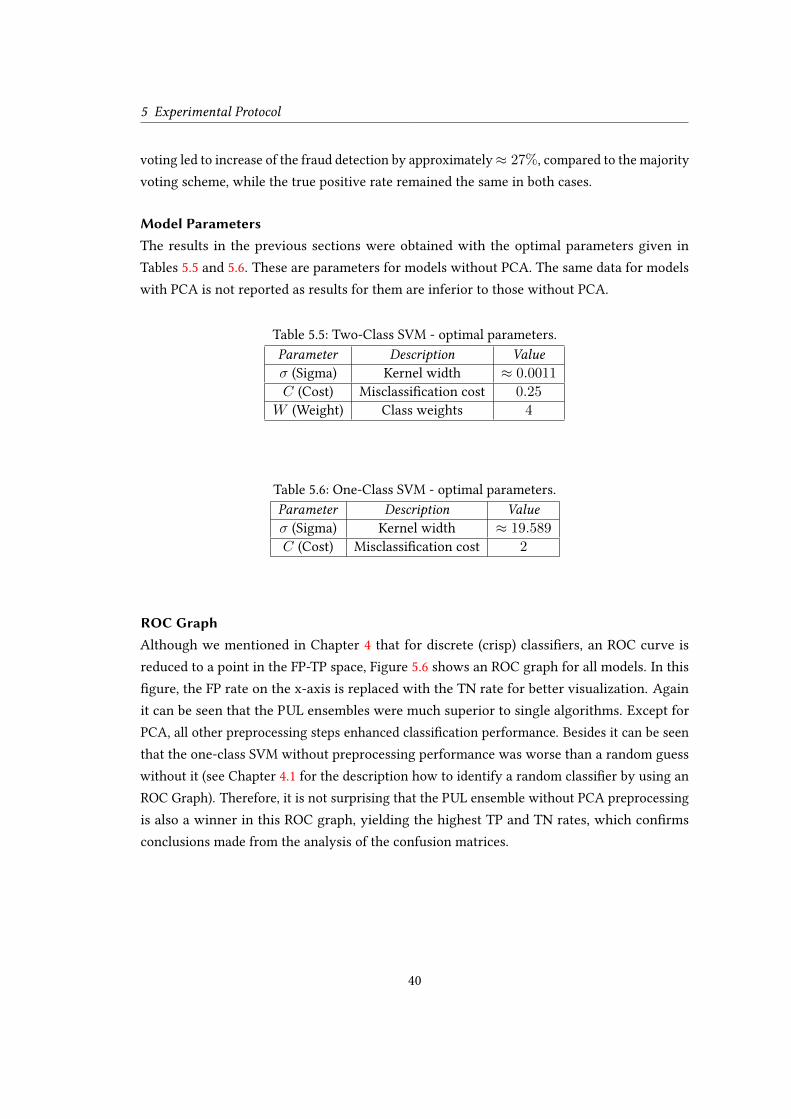
5 Experimental Protocol
voting led to increase of the fraud detection by approximately≈ 27%, compared to the majority
voting scheme, while the true positive rate remained the same in both cases.
Model ParametersThe results in the previous sections were obtained with the optimal parameters given in
Tables 5.5 and 5.6. These are parameters for models without PCA. The same data for models
with PCA is not reported as results for them are inferior to those without PCA.
Table 5.5: Two-Class SVM - optimal parameters.
Parameter Description Valueσ (Sigma) Kernel width ≈ 0.0011
C (Cost) Misclassication cost 0.25
W (Weight) Class weights 4
Table 5.6: One-Class SVM - optimal parameters.
Parameter Description Valueσ (Sigma) Kernel width ≈ 19.589
C (Cost) Misclassication cost 2
ROC GraphAlthough we mentioned in Chapter 4 that for discrete (crisp) classiers, an ROC curve is
reduced to a point in the FP-TP space, Figure 5.6 shows an ROC graph for all models. In this
gure, the FP rate on the x-axis is replaced with the TN rate for better visualization. Again
it can be seen that the PUL ensembles were much superior to single algorithms. Except for
PCA, all other preprocessing steps enhanced classication performance. Besides it can be seen
that the one-class SVM without preprocessing performance was worse than a random guess
without it (see Chapter 4.1 for the description how to identify a random classier by using an
ROC Graph). Therefore, it is not surprising that the PUL ensemble without PCA preprocessing
is also a winner in this ROC graph, yielding the highest TP and TN rates, which conrms
conclusions made from the analysis of the confusion matrices.
40

5 Experimental Protocol
Figure 5.6: An ROC-Graph visualizing the accuracy of the models involved in the experiment.
41

6 Evaluation of Results: Value for Business
Since the confusion matrices for all predictive models are available (see Chapter 5.2), it is
possible to analyze the potential monetary impact of a model on the micro-lending business.
In this chapter, the value of a model for business is calculated.
Please note that some nancial indicators used in calculations below are only approximate
but in the range of real gures of a micro-lending company. For business-related reasons, the
exact gures cannot be reported in this work.
The business value calculations utilize the following characteristics:
(Cost of Customer Acquisition (marketing cost)) CAC = 0.5
(Mean value of the interest rate) r = 10%
(Mean value of a loan taken by a legitimate applicant) Cp = 550
(Mean value of a loan taken by a fraudster) Cn = 2.100
First, the marketing costs for all negative (fraud) cases are calculated:
McostN = CAC ∗ |N |
Once a malicious person got a loan, the company loses money. This loss is dened as:
RcostN = Cn ∗ |N |
So, the monetary loss in case if a fraud detection model is not deployed can be calculated as
follows:
Loss′ = RcostN +McostN
Loss′ = (2.100 ∗ 743) + (0.5 ∗ 743)
Loss′ = 1.560.671.5
42

6 Evaluation of Results: Value for Business
The next step is to determine the possible impact of our best fraud detection model (PUL
Ensemble without PCA and with custom voting, see the Figure 5.5 for the detailed performance
result) on the calculated costs.
The possible loss during the wrong classication of trustworthy applicants as fraudsters
(missed prot here is the interest on loans) is calculated with the number of false positives:
FNcost = r ∗ |FN | ∗ Cp = 0
because
|FN | = 0.
Finally the gain caused by the correct classication of fraud attempts is given by:
Gain = Cn ∗ |TN | = 2.100 ∗ 542 = 1.138.200
The losses incurred due to wrongly issued loans to fraudsters and the marketing costs are
2.100 ∗ 201 + 0.5 ∗ 201 = 422.200.5
. Coupled with FNcost, the total loss amounts to 422.200.5.
Thus as gains largely exceed losses when the PUL ensemble is applied, this justies the
business value of the proposed model for a given test data.
The calculations in this chapter are only preliminary and should be considered as a starting
point. In the future, other business related factors, such as Customer Lifetime Value (CLF),
need to be taken into account.
43

7 Conclusion
In this thesis, several known and new machine learning methods were investigated for anomaly
(fraud) detection in credit application data.
A micro-credit company is issuing instant loans online by using an automatic credit-scoring
algorithm. Fraudsters often attempt to cheat the credit-scoring algorithm with the ultimate
the result of obtaining a loan. Apart from a nancial loss, a successful fraud attempt provokes
further fraud attempts and jeopardizes the loan issuance to trustworthy borrowers due to
tighten security, leading to longer application processing times. Thus, a predictive model for
automatic fraud detection has paramount importance for business.
The theoretical literature related to the topic of anomaly/fraud detection primarily covers
elds like intrusion detection in networks or credit card fraud among others. However, at
this point of time, works related to credit application fraud could not be found. This is not
surprising since instant online issuing of micro-loans is a new business area and is not yet
under focus of academic research.
Although previous documented research in this eld could not be found, a literature survey
on similar topics related to anomaly detection provided a good enough foundation to build
this dissertation. In this work,answers to the following questions were sought:
• Which machine learning algorithms to use in order to detect fraud when fraudulent data
is rare or unavailable, how they perform and can they contribute to nancial success in
a micro-lending business?
• How to utilize and modify dierent types of complex credit application data to t these
algorithms?
• What is the optimal treatment of challenges and obstacles occurring throughout the
entire process?
The conclusion Chapter rst provides a synthesis of the empirical ndings discovered during
the study in Section 7.1. Then, research implications of the empirical ndings are outlined in
Section 7.2 to provide additional application knowledge to the already existing on the particular
44

7 Conclusion
subject. The policy implications in Section 7.3 pronounces the relevance of the study with
respect to the theoretical framework of fraud detection. Finally, recommendation for future
research 7.5 and limitations 7.4 of the study are provided.
7.1 Empirical Findings
The empirical ndings are chapter specic and discussed in Chapters (2, 5, 6). In this section
some empirical ndings are synthesized to answer questions asked by this thesis and questions
occurred during the work on it:
• (1.) Is it possible to identify fraud cases by using machine learning methods applied in this
work?
– a. The experimental results in Chapter 5 show that the PUL ensemble is able to
identify fraud with the high degree of accuracy at zero false negative rate, i.e.,
without classifying good customers as fraudsters.
– b. The data preprocessing pipeline modeled in this work was a signicant contrib-
utor to the success of the predictive models implemented in this work. Although
only the one-class SVM was tested on data without preprocessing, an accuracy loss
can also be assumed in the other models, since the one-class SVM was the base-
line model with the most inaccurate results. Out of all preprocessing techniques,
PCA seems to harm rather than help: As PCA is a linear dimensionality reduction
technique while our classication problem is likely highly nonlinear, this might
explain of a PCA failure.
– c. PUL Ensemble showed the best classication results. This is a strong argument for
the hypothesis that positive data can be contaminated with label noise/mislabeled
instances and ensembles are the right methods to deal with such noise.
– d. The problem of rare fraud cases could be successfully managed by utilizing algo-
rithms based on positive and unlabeled learning that don’t require fraud instances
in training/validation data.
• (2.) Can the implemented model contribute to the nancial success of a micro-lending
company?
– a. Analysis made in Chapter 6 showed that a fraud classier can drastically reduce
the cost incurred by fraud.
45
7 Conclusion
• (3.) Was all the given data important for the question of fraud detection?
– b. Removing features with zero and near zero variance during the prepossessing
had positive impact on model accuracy.
• (4.) Which obstacles complicated successful fraud detection?
– a. A signicant amount (≥ 50%) of missing values is the main factor to blame.
Skipping all instances where missing values are present would mean to lose a major
part of the data, and thus was not considered as an option.
– c. Acquisition errors were also present and have to be identied prior to modeling.
– d. A signicant number of features had low or zero variance. This is caused by the
high amount of missing values.
7.2 Research Implications
Although previous works related to credit application fraud for instant loans could not be
found, several contributions to the state-of-the-art were made.
Previous studies treating the topic of learning from Positive and Unlabeled data concerned
Remote Sensing data Li u. a. (2011), Breast Cancer data, Forest Cover Type data, Vehicle Classi-
cation and Digit Recognition Claesen u. a. (2014). This study shows the success of the PUL
methods also on nancial data utilized for fraud detection.
The impact of PCA on nancial data for the purpose of anomaly detection by using algorithms
based on Positive and Unlabeled data was not discussed in the literature cited in this work.
The experiments made during this work (see Chapter 5.2) could clearly emphasize the negative
impact of PCA on the classier performance.
7.3 Policy Implications
This study was made based on a data set from a real-world company specialized in lending
of micro-loans online. Since instantly issuing loans online is a relative modern business and
considering that nancial data is often private (e.g only a few public data sets are available) -
previous works on the topic of fraud detection with a similar type of data could not be found
for a comparison. Thus, this thesis is one of few open publications in the eld and may serve
as a guideline for further research and commercial implementations.
46
7 Conclusion
7.4 Limitation of this Study
In following some limitations of this work are summarized:
• The statistical and visual summary of data was limited by the high number of features
and instances. A deeper analysis by using more advanced techniques was beyond the
scope of this thesis.
• Although several missing value imputation techniques exist, only the median imputation
was used as one of the straightforward options.
• The evaluation of predictive models was made on a test set that was signicantly smaller
than the training or validation sets – obviously because of the lack of fraud examples.
• SVM with the RBF kernel was only tested. Other kernels were not included in the
experiments.
• The calculation of the business value of the fraud detection model was done without
considering the Customer life time value factor.
7.5 Recommendation for Future Research
Based on the results made in this thesis, further work can be of interest.
Regarding the data quality, the work of Mohan und Pearl (2014) provides promising ap-
proaches to identify the categories of missing data and impute them.
High-dimensional data can be handled by feature selection. This can have several advantages
like speeding up computations or be more transparent in explaining classication decisions.
Among others, a ranked based approach for feature selection already achieved good results in
the topic of anomaly detection Li u. a. (2013) and could be used for further research.
The problem of rarity of negative instances can be approached by applying unsupervised
methods (e.g Clustering Alzate und Suykens (2012)) to identify similarities in the data and
therefore identify more negative instances.
A more consolidated analysis on data acquisition process could be useful to improve the
data quality.
Since the SVM is a kernel-based algorithm experimenting with other than RBF kernels could
provide more results of SVM performance on the given data.
Since the data preprocessing contributed to an essential part of the success in fraud de-
tection, it is worth to repeat the experiments by permuting the preprocessing methods and
47

7 Conclusion
their parameters (e.g try out dierent variance thresholds or other missing value imputation
techniques).
7.6 Last Words
This thesis gave an introduction to anomaly detection in nancial data. In spite of the rarity of
fraud cases, a very encouraging result was achieved by utilizing only positive and unlabeled
data and a carefully constructed data preprocessing pipeline.
The author thanks for readers for comments and suggestions.
48

Bibliography
[Agarwal 2005] Agarwal, D.: An empirical Bayes approach to detect anomalies in dynamic
multidimensional arrays. In: Data Mining, Fifth IEEE International Conference on, 2005, S. 8
[Aggarwal 2013] Aggarwal, Charu C.: Outlier Analysis. Springer Science+Business Media
New York, 2013. – ISBN 978-1-4614-6395-5, 978-1-4614-6396-2
[Agyemang u. a. 2006] Agyemang, Malik ; Barker, Ken ; Alhajj, Rada: A Comprehensive
Survey of Numeric and Symbolic Outlier Mining Techniques. In: Intell. Data Anal. 10 (2006),
Nr. 6, S. 521–538
[Ahmed u. a. 2015] Ahmed, Mohiuddin ; Mahmood, Abdun ; Islam, Md. R.: A survey of
anomaly detection techniques in nancial domain. In: Future Generation Computer Systems
55 (2015), S. 278–288
[Allison 2002] Allison, Paul D.: Missing Data. Thousand Oaks, London, New Delhi : Sage,
2002
[Alzate und Suykens 2012] Alzate, Carlos ; Suykens, Johan A. K.: A semi-supervised
formulation to binary kernel spectral clustering. In: IJCNN, IEEE, 2012, S. 1–8
[Amer u. a. 2013] Amer, Mennatallah ; Goldstein, Markus ; Abdennadher, Slim: Enhancing
One-class Support Vector Machines for Unsupervised Anomaly Detection. (2013), S. 8–15.
ISBN 978-1-4503-2335-2
[Azevedo und Santos 2008] Azevedo, Ana ; Santos, Manuel F.: KDD, SEMMA and CRISP-
DM: a parallel overview. In: Abraham, Ajith (Hrsg.): IADIS European Conf. Data Mining,
2008, S. 182–185. – ISBN 978-972-8924-63-8
[Breiman 1996] Breiman, Leo: Bagging predictors. In: Machine Learning, 1996, S. 123–140
[Breiman 2000] Breiman, Leo: Randomizing Outputs to Increase Prediction Accuracy. In:
Machine Learning 40 (2000), Nr. 3, S. 229–242
49
Bibliography
[Briscoe und Feldman 2006] Briscoe, E. ; Feldman, J.: Conceptual complexity and the
bias-variance tradeo. In: Proceedings of the 28th Annual Conference of the Cognitive Science
Society, 2006
[Castillo u. a. 2004] Castillo, E. ; Hadi, A.S. ; Balakrishnan, N. ; Sarabia, J.M.: Extreme
Value and Related Models with Applications in Engineering and Science. Wiley, 2004 (Wiley
Series in Probability and Statistics). – ISBN 9780471671725
[Chandola u. a. 2009] Chandola, Varun ; Banerjee, Arindam ; Kumar, Vipin: Anomaly
Detection: A Survey. In: ACM Comput. Surv. 41 (2009), Nr. 3, S. 15:1–15:58
[Chandola u. a. 2012] Chandola, Varun ; Banerjee, Arindam ; Kumar, Vipin: Anomaly
Detection for Discrete Sequences: A Survey. In: IEEE Trans. on Knowl. and Data Eng. 24
(2012), Nr. 5, S. 823–839
[Chandola u. a. 2006] Chandola, Varun ; Eilertson, Eric ; Ertoz, Levent ; Simon, Gyorgy ;
Kumar, Vipin: Data mining for cyber security. In: Data Warehousing and Data Mining
Techniques for Computer Security 20 (2006)
[Chapman u. a. 2000] Chapman, Pete ; Clinton, Julian ; Kerber, Randy ; Khabaza, Thomas ;
Reinartz, Thomas ; Shearer, Colin ; Wirth, Rudiger: CRISP-DM 1.0 Step-by-step data
mining guide. 2000. – Forschungsbericht. ’
[Claesen u. a. 2014] Claesen, Marc ; Smet, Frank D. ; Suykens, Johan A. K. ; Moor, Bart D.:
A Robust Ensemble Approach to Learn From Positive and Unlabeled Data Using SVM Base
Models. In: CoRR abs/1402.3144 (2014)
[Clapham 2013] Clapham, Nicholson: The Concise Oxford Dictionary ofMathematics. Oxford
University Press, 2013. – 575:3 S. – ISBN 9780191727122
[Cortes und Vapnik 1995] Cortes, C. ; Vapnik, V.: Support Vector Networks. In: Machine
Learning 20 (1995), S. 273–297
[Das und Parthasarathy 2009] Das, Mahashweta ; Parthasarathy, Srinivasan: Anomaly
Detection and Spatio-temporal Analysis of Global Climate System. In: Proceedings of the
Third International Workshop on Knowledge Discovery from Sensor Data, 2009 (SensorKDD
’09), S. 142–150. – ISBN 978-1-60558-668-7
[Elkan 2001] Elkan, Charles: The Foundations of Cost-sensitive Learning. In: Proceedings of
the 17th International Joint Conference on Articial Intelligence - Volume 2, 2001 (IJCAI’01),
S. 973–978. – ISBN 1-55860-812-5, 978-1-558-60812-2
50

Bibliography
[Elkan und Noto 2008] Elkan, Charles ; Noto, Keith: Learning Classiers from Only Positive
and Unlabeled Data. In: Proceedings of the 14th ACM SIGKDD International Conference on
Knowledge Discovery and DataMining, 2008 (KDD ’08), S. 213–220. – ISBN 978-1-60558-193-4
[Eskin u. a. 2002] Eskin, E. ; Arnold, A. ; Prerau, M. ; Portnoy, L. ; o, S. S.: A Geometric
Framework for Unsupervised Anomaly Detection: Detecting Intrusions in Unlabeled Data. In:
Barbara, D. (Hrsg.) ; Jajodia, S. (Hrsg.): Applications of Data Mining in Computer Security.
2002, S. 77–101
[Fawcett 2006] Fawcett, Tom: An Introduction to ROC Analysis. In: Pattern Recogn. Lett.
27 (2006), Nr. 8, S. 861–874
[Frénay und Verleysen 2014] Frénay, Benoît ; Verleysen, Michel: Classication in the
Presence of Label Noise: A Survey. In: IEEE Trans. Neural Netw. Learning Syst. 25 (2014),
Nr. 5, S. 845–869
[Ghosh und Reilly 1994] Ghosh, S. ; Reilly, D.L.: Credit card fraud detection with a neural-
network. In: System Sciences, 1994. Proceedings of the Twenty-Seventh Hawaii International
Conference on Bd. 3, 1994, S. 621–630
[Good 2005] Good, Phillip I.: Permutation, parametric and bootstrap tests of hypotheses. 2005.
– XIX, 315 S. S
[Hollier und Austin 2002] Hollier, Garry ; Austin, Jim: Novelty detection for strain-gauge
degradation using maximally correlated components. In: ESANN, 2002, S. 257–262. – ISBN
2-930307-02-1
[Hubert und der Veeken 2010] Hubert, Mia ; Veeken, Stephan V. der: Robust classication
for skewed data. In: Adv. Data Analysis and Classication 4 (2010), Nr. 4, S. 239–254
[Kohavi 1995] Kohavi, Ron: A Study of Cross-Validation and Bootstrap for Accuracy Esti-
mation and Model Selection. In: Proceedings of the Fourteenth International Joint Conference
on Articial Intelligence, 1995, S. 1137–1145
[Kuhn 2008] Kuhn, Max: Building Predictive Models in R Using the caret Package. In:
Journal of Statistical Software 28 (2008), Nr. 1, S. 1–26
[Li 2008] Li, Huijuan: Lagrange Multipliers and their Applications. (2008)
[Li 2004] Li, James X.: Visualization of high-dimensional data with relational perspective
map. In: Information Visualization 3 (2004), Nr. 1, S. 49–59
51

Bibliography
[Li u. a. 2013] Li, Rui ; Zhao, Jizhong ; Liu, Kebin ; He, Yuan: Ranking-based Feature Selection
for Anomaly Detection in Sensor Networks. In: Ad Hoc and Sensor Wireless Networks 19
(2013), Nr. 1-2, S. 119–139
[Li u. a. 2011] Li, Wenkai ; Guo, Qinghua ; Elkan, Charles: A Positive and Unlabeled Learning
Algorithm for One-Class Classication of Remote-Sensing Data. In: IEEE T. Geoscience and
Remote Sensing 49 (2011), Nr. 2, S. 717–725
[Liu u. a. 2003] Liu, Bing ; Dai, Yang ; Li, Xiaoli ; Lee, Wee S. ; Yu, Philip S.: Building
Text Classiers Using Positive and Unlabeled Examples. In: Proceedings of the 3rd IEEE
International Conference on Data Mining (ICDM 2003), 2003, S. 179–188
[Mohan und Pearl 2014] Mohan, Karthika ; Pearl, Judea: On the Testability of Models with
Missing Data. In: AISTATS Bd. 33, JMLR.org, 2014, S. 643–650
[Mordelet und Vert 2014] Mordelet, Fantine ; Vert, Jean-Philippe: A bagging SVM to learn
from positive and unlabeled examples. In: Pattern Recognition Letters 37 (2014), S. 201–209
[Munson und Caruana 2009] Munson, M. A. ; Caruana, Rich: On Feature Selection,
Bias-Variance, and Bagging. In: ECML/PKDD (2), 2009, S. 144–159
[Okun 2011] Okun, Oleg: Feature Selection and Ensemble Methods for Bioinformatics: Algo-
rithmic Classication and Implementations. IGI Global, 2011. – ISBN 978-1609605575
[Pearson 1901] Pearson, K.: On lines and planes of closest t to points in space. In: Philos.
Mag 2, (1901), S. 559–572
[Peddabachigari u. a. 2007] Peddabachigari, Sandhya ; Abraham, Ajith ; Grosan, Crina ;
Thomas, Johnson: Modeling intrusion detection system using hybrid intelligent systems.
In: Journal of Network and Computer Applications 30 (2007), Nr. 1, S. 114 – 132
[Pimentel u. a. 2014] Pimentel, Marco A. F. ; Clifton, David A. ; Clifton, Lei ; Tarassenko,
Lionel: Review: A Review of Novelty Detection. In: Signal Process. 99 (2014), S. 215–249
[Salvador und Chan 2005] Salvador, Stan ; Chan, Philip: Learning States and Rules for
Detecting Anomalies in Time Series. In: Applied Intelligence 23 (2005), Nr. 3, S. 241–255
[Seni und Elder 2010] Seni, Giovanni ; Elder, John: Ensemble Methods in Data Mining:
Improving Accuracy Through Combining Predictions. 2010. – ISBN 1608452840
52
Bibliography
[Shen u. a. 2012] Shen, Zhongjie ; He, Zhengjia ; Chen, Xuefeng ; Sun, Chuang ; Liu, Zhiwen:
A Monotonic Degradation Assessment Index of Rolling Bearings Using Fuzzy Support Vector
Data Description and Running Time. In: Sensors 12 (2012), Nr. 8, S. 10109
[Spence u. a. 2001] Spence, Clay ; Parra, Lucas ; Sajda, Paul: Detection, Synthesis and
Compression in Mammographic Image Analysis with a Hierarchical Image Probability Model.
In: Proceedings of the IEEEWorkshop on Mathematical Methods in Biomedical Image Analysis
(MMBIA’01), 2001, S. 3–. – ISBN 0-7695-1336-0
[Tax und Duin 2004] Tax, David M. J. ; Duin, Robert P. W.: Support Vector Data Description.
In: Mach. Learn. 54 (2004), Nr. 1, S. 45–66
[Wall u. a. 2003] Wall, M.E. ; Rechtsteiner, A. ; Rocha, L.M.: Singular value decomposition
and principal component analysis. In: A Practical Approach to Microarray Data Analysis
(2003), S. 91–109
[Weiss 2004] Weiss, Gary M.: Mining with Rarity: A Unifying Framework. In: SIGKDD
Explor. Newsl. 6 (2004), Nr. 1, S. 7–19
[Zhou 2012] Zhou, Zhi-Hua: Ensemble Methods: Foundations and Algorithms. 1st. Chapman
& Hall/CRC, 2012. – ISBN 1439830037, 9781439830031
[Zhu 2008] Zhu, Xiaojin: Semi-Supervised Learning Literature Survey. 2008
[Zou u. a. 2006] Zou, H. ; Hastie, T. ; Tibshirani, R.: Sparse principal component analysis.
In: Journal of Computational and Graphical Statistics 15 (2006), S. 262–286
53

Hiermit versichere ich, dass ich die vorliegende Arbeit ohne fremde Hilfe selbständig verfasst und
nur die angegebenen Hilfsmittel benutzt habe.
Hamburg, 9. Mai 2016 Ivan Morozov
Related Documents