15, A. Metaxa 145 64 Kifisia, Athens, Greece Tel: +30 210 616 5700, Fax: +30 210 619 9097 www. frigoglass.com DESIGN: ARGYROPOULOS DESIGNWORKS, PRINTING: HAIDEMENOS

annualreport_2005
Mar 30, 2016
http://frigoglass.lab.wedia.gr/sites/default/files/annualreport_2005.pdf
Welcome message from author
This document is posted to help you gain knowledge. Please leave a comment to let me know what you think about it! Share it to your friends and learn new things together.
Transcript

15, A. Metaxa 145 64 Kifisia, Athens, GreeceTel: +30 210 616 5700, Fax: +30 210 619 9097www. frigoglass.com
DE
SIG
N: A
RG
YR
OP
OU
LOS
DE
SIG
NW
OR
KS
, PR
INTI
NG
: HA
IDE
ME
NO
S

05annual report

It’s beena great year...
2003
234
SALES
in million €
EBITDA
in million €
EATin millio
n €
2004
2005
262
307
48
50
61
8.712.7
23.5

2003
234
SALES
in million €
EBITDA
in million €
EATin millio
n €
2004
2005
262
307
48
50
61
8.712.7
23.5

After a decade of impressive growth, for the past three years Frigoglass
has pursued a strategy of increasingly focusing its resources on its
greatest strength – the design, production and marketing of Ice Cold
Merchandisers to its growing client base around the world. This is
what we do best. With manufacturing capacity in 10 countries on 3
continents, and with customers in more than 100 countries worldwide,
Frigoglass is a global company, in structure, strength and mentality.
Having built a solid platform for long-term, sustainable growth and
profit, 2005 was the year in which all of our investment and careful
strategic planning led to accelerated growth and an indication of the
company’s future prospects. By any measure of performance, from
revenue and operating profit to shareholder returns, Frigoglass posted
an extraordinary year. But behind those glowing figures lie some key
decisions – and relationships - which will continue to deliver results
far into the future. The key to our success continues to be our people,
whose ongoing development drives the company’s progress. Our
Capital Redeployment Plan has made available crucial resources that
will allow our core business to continue to grow organically in markets
where we have already established a leading presence and to penetrate
and develop important new markets as well. More importantly, the
company’s relations with its customers grew significantly in 2005, in
both depth and value. Because of Frigoglass’ reputation for helping
improve its customers’ sales and profits, increasing numbers of
beverage companies chose us to supply Ice Cold Merchandising
solutions for their varied needs. Significantly, our client base in the
Beer sector grew dramatically and now comprises a reliable and
growing source of both revenue and profits. By focusing on Ice Cold
Merchandising in a world which is increasingly turning to the solutions
we provide – and by continuing to play a key role in our customers’
success, Frigoglass was able to achieve and surpass all of its goals for
2005. More important, we firmly established the foundations for even
greater success in the future.
It truly has been a great year.
Dimitris LoisManaging Director
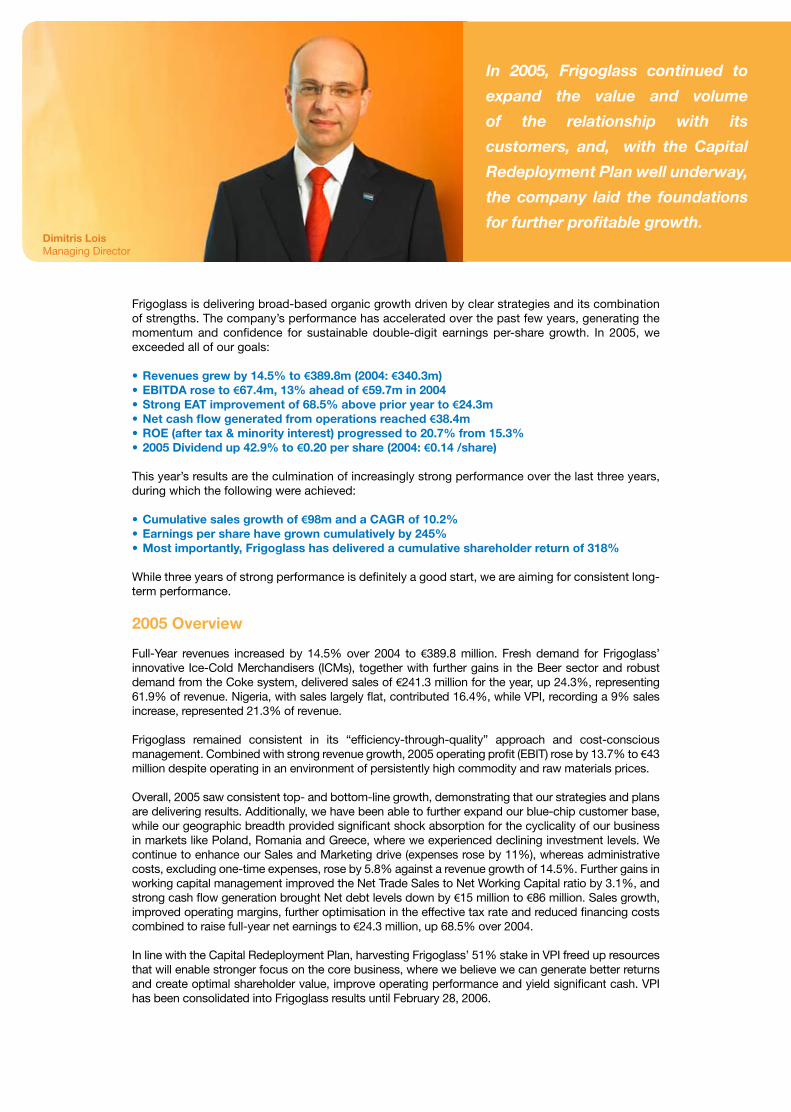
Frigoglass is delivering broad-based organic growth driven by clear strategies and its combination of strengths. The company’s performance has accelerated over the past few years, generating the momentum and confidence for sustainable double-digit earnings per-share growth. In 2005, we exceeded all of our goals:
• Revenues grew by 14.5% to €389.8m (2004: €340.3m)• EBITDA rose to €67.4m, 13% ahead of €59.7m in 2004• Strong EAT improvement of 68.5% above prior year to €24.3m• Net cash flow generated from operations reached €38.4m • ROE (after tax & minority interest) progressed to 20.7% from 15.3%• 2005 Dividend up 42.9% to €0.20 per share (2004: €0.14 /share)
This year’s results are the culmination of increasingly strong performance over the last three years, during which the following were achieved:
• Cumulative sales growth of €98m and a CAGR of 10.2%• Earnings per share have grown cumulatively by 245%• Most importantly, Frigoglass has delivered a cumulative shareholder return of 318% While three years of strong performance is definitely a good start, we are aiming for consistent long-term performance.
2005 Overview
Full-Year revenues increased by 14.5% over 2004 to €389.8 million. Fresh demand for Frigoglass’ innovative Ice-Cold Merchandisers (ICMs), together with further gains in the Beer sector and robust demand from the Coke system, delivered sales of €241.3 million for the year, up 24.3%, representing 61.9% of revenue. Nigeria, with sales largely flat, contributed 16.4%, while VPI, recording a 9% sales increase, represented 21.3% of revenue.
Frigoglass remained consistent in its “efficiency-through-quality” approach and cost-conscious management. Combined with strong revenue growth, 2005 operating profit (EBIT) rose by 13.7% to €43 million despite operating in an environment of persistently high commodity and raw materials prices.
Overall, 2005 saw consistent top- and bottom-line growth, demonstrating that our strategies and plans are delivering results. Additionally, we have been able to further expand our blue-chip customer base, while our geographic breadth provided significant shock absorption for the cyclicality of our business in markets like Poland, Romania and Greece, where we experienced declining investment levels. We continue to enhance our Sales and Marketing drive (expenses rose by 11%), whereas administrative costs, excluding one-time expenses, rose by 5.8% against a revenue growth of 14.5%. Further gains in working capital management improved the Net Trade Sales to Net Working Capital ratio by 3.1%, and strong cash flow generation brought Net debt levels down by €15 million to €86 million. Sales growth, improved operating margins, further optimisation in the effective tax rate and reduced financing costs combined to raise full-year net earnings to €24.3 million, up 68.5% over 2004.
In line with the Capital Redeployment Plan, harvesting Frigoglass’ 51% stake in VPI freed up resources that will enable stronger focus on the core business, where we believe we can generate better returns and create optimal shareholder value, improve operating performance and yield significant cash. VPI has been consolidated into Frigoglass results until February 28, 2006.
In 2005, Frigoglass continued to
expand the value and volume
of the relationship with its
customers, and, with the Capital
Redeployment Plan well underway,
the company laid the foundations
for further profitable growth.

COOL
Leveraging our competence for providing successful ICM solutions, not just “beverage coolers”, defines our Innovation drive. New products, launched during and since the Athens 2004 Olympic Games, have proven their effectiveness in the marketplace as Impulse Purchase Creators - building our customers’ sales. An increasing number of beverage companies select them as their preferred Ice Cold Merchandising solutions to their trade channel needs. These newly launched ICMs represented 30.6% of Cool Operations sales in 2005, up from the 12.9% contribution in 2004.
Three years ago, we embarked on a quest to penetrate and grow the Beer sector. We devoted time and effort to understanding the market as well as our customers’ perceptions regarding cold-drink merchandising opportunities. We structured our sales teams around key global brewery accounts, devoted a significant part of our New Product Development program to designing specific solutions and started accumulating valuable product - placement learnings. Our customer base today includes leading brewers such as: BBH, SAB, InBev, Efes and Heineken. Sales to breweries grew more than in any other category, up 118% versus the previous year, representing 23% of Cool Operations sales in 2005, against 13% in 2004.
Our long-term synchronization with the Coca-Cola system has greatly influenced the evolution of our abilities and competencies, and, together with our commitment to providing superior solutions, this has further strengthened our relationship. Sales to the Coke system continue to account for more than 60% of total sales. CCHBC demand remained strong and consistent with previous years, but in the face of growing demand from other customers it now represents 43.8% of total Cool Operations sales, down from 53.6% in the previous year. Sales increased significantly in India, Indonesia, Germany and Africa from key customers including Coca-Cola Enterprises, Coca-Cola Amatil and Coca-Cola Sabco, to the extent that demand from other Coca-Cola bottlers rose by a very strong 62%, representing 18.7% of 2005 sales, in comparison to 14.4% in 2004.
Investments in production capacity, automation and quality enhancement were executed throughout the year. Continuing the manufacturing consolidation plan, the Spanish production capacity was transferred to the lower-cost plants in Poland and India. This plan was initiated a few years ago and has contributed to the gross profit margin development by consolidating production and increasing utilisation levels as well as capitalising on optimised cost structures in low-cost countries.
Nigeria
In anticipation of the cycling of the domestic beer sector, which brought to an end the recent high-investment period by both major breweries in Nigeria, we prioritised segments such as spirits, cosmetics, pharmaceuticals as well as exports. In 2005, sales volume to breweries fell by 67.6% and to soft drink bottlers by 22%, but their effect was dampened by volume gains of 48% in spirits and 47.1% in exports, consolidating our position as the leading glass container supplier in the West Africa region.
Sales from other operations continued to grow, representing 55% of Nigeria Operations revenue - an increase of 15.7% versus last year. Most noteworthy was the performance of the Nigerian Cool Operations, with revenues up 49.3% versus 2004.

Increased efficiency and higher utilisation rates saw the full-year operating profit sustained, and, combined with significantly more efficient financing, net profit rose by 64.6% against the previous year. It is important to note that utilisation levels are higher after consolidating glass production in only two furnaces instead of four at the end of 2004.
VPI Operations
VPI continued to experience substantial raw-materials cost pressures during 2005, and the commodity nature of the market gave less flexibility to compensate by increasing selling prices. Margins were therefore depressed, and, despite sales increases of 9%, operating profit fell by 51.5%.
On December 15, 2005, Frigoglass announced the sale of its stockholding in VPI SA. The sale was completed on February 28, 2006, from which date VPI’s financial performance will cease to be consolidated in the Frigoglass results.
Plastics
Frigoglass’ significantly smaller plastics business traded consistent with expectations during the year, and its focus on cost containment enabled it to record a small like-for-like profit. Year-on-year, revenues fell, reflecting divestments during 2004.
Our Strengths
As we move forward, we will continue to develop and rely on key strengths that include:
• A unique blend of competencies gained from the company’s long-term involvement and focus on the ICM segment. These include the ability to design and produce refrigeration systems that optimally and reliably meet the performance requirements of each application, combined with a core expertise in designing ICMs that achieve higher sales of our customers’ products. The “Cool & Sell” delivery to the market place, coupled with a strong orientation of a “business-to-business” organisation, provide us with a deep-rooted advantage that is not easy to emulate.
• Our Geographical Diversity is unmatched! In a marketplace that is simultaneously global and local, Frigoglass has the ability to understand and respond to local market needs, while the company’s global structure provides important advantages of scale and synergy. With manufacturing capacity in 10 countries across 3 continents, on-the-ground sales operations in 15 countries, a network of representatives and functional leadership at its head offices, Frigoglass effectively combines proximity to the market with the advantages of Value-Chain integration and coordination of a global organisation.
• The ability to develop for its customers the most effective ICM solutions for a particular consumer occasion at a specific trade channel across a number of countries is one of Frigoglass’ greatest strengths. Through its expert understanding of trade channels, Frigoglass captures customer priorities into ICM solutions. Global R&D centres in Greece and India are entrusted with a systematic approach to “commercialising” innovation that aims at generating elevated levels of Impulse Purchases at the point of sale. At the same time, our ICMs meet energy-consumption and environmental impact levels that a few years ago seemed unattainable.
We are continuing to work towards developing Frigoglass into the global reference point in Ice Cold Merchandising solutions and services. To do that, we are passionately committed to continue driving our customers’ sales, to have ICM solutions that are preferred by the retail trade and to enhance and upgrade consumer interaction.

• While Frigoglass remains focused on its segment, it serves a balanced portfolio of geographies, sectors and channels. In a business that is characterised by pronounced fluctuations in investment cycles, Frigoglass can sustain its growth velocity though a substantial and balanced portfolio of market activities.
Despite the fact that our businesses are strong, and future prospects are bright, there are challenges that we must acknowledge and manage. There are business issues that we need to address, ranging from optimum capacity planning to the rising cost of raw materials. We also have to face the risks of complacency and complexity, as we want to remain focused on our efforts to build the business profitably. “Being in a Race”, we have to carefully manage our People Development, which will not only allow us to cover a part of our growing needs from within but also to create opportunities that will attract “Best Fit talent” to further enhance Frigoglass’ organisational capability and enrich our culture.
These are significant challenges, but by relying on our strengths we will ensure that such challenges do not affect the achievement of our growth targets.
Outlook
We are continuing to work towards developing Frigoglass into the global reference point in Ice Cold Merchandising solutions and services. To do that, we are passionately committed to continue driving our customers’ sales, to have ICM solutions that are preferred by the retail trade and to enhance and upgrade consumer interaction.
Developing further our geographical breadth, we are considering entering new countries that offer attractive growth prospects and, at the same time, contribute to our global interweave in terms of supplier base, optimum cost structure and access to the international talent pool.
With a strong core business that we will keep strong, we are now in a position to begin pushing into new segments that are synergistic, complementary to the core and substantial in magnitude.
As we expand the core, we will be continuing to evaluate our current operations and, where it makes sense, harvesting activities that fall short of a long-term fit.
Behind every idea, every strategy, every implementation plan, every project, every production-lot completion, every marketplace win, you have the Frigoglass people. It is these men and women that have delivered results and who provide the best guarantee of consistent and reliable growth. We have been extraordinarily served by people across three continents to whom we extend, on behalf of our shareholders, a very warm “Thank You”.
Finally, we would like to express our appreciation to our shareholders, who have placed their trust in the people of Frigoglass - “we realise that we have to continue earning your trust.”
Dimitris Lois,Managing Director, Frigoglass Group S.A.

THE BOARD OF DIRECTORS
Dimitrios Krontiras Chairman
Ioannis Androutsopoulos Vice Chairman, Non-Executive Member
Dimitris Lois Managing Director, Executive Member
Loucas Komis Member and Secretary, Non-Executive Member
Christodoulos Leventis Non-Executive Member
Harry David Non-Executive Member
Vassilios Fourlis Non-Executive, Independent Member
Alexandra Papalexopoulou Non-Executive, Independent Member
Samir-Issa Toubassy Non-Executive, Member
THE AUDIT COMMITTEE
Ioannis Androutsopoulos Chairman
Harry David Member
Loucas Komis Member
THE HUMAN RESOURCES COMMITTEE
Loucas Komis Chairman
Dimitrios Krontiras Member
Samir-Issa Toubassy Member

MANAGEMENT
Tom Aas Engineering Director
Panagiotis Giannopoulos Nigeria Operations Director
Petros Diamantides Business Development Director
Nikolaos Dimellas Human Resources Director
Dimitrios Kouniakis Pool Purchasing Director
PanagiotisTabourlos CFO
Elias Vafopoulos PET Operations Director
Dimitris Valachis Cool Operations Director
Constantinos Vossos Marketing Director
Certified Auditors
PriceWaterhouseCoopers, 268 Kifissias Avenue, 152 32 Halandri, Athens, Greece
Legal Advisors
KYRIAKIDES-GEORGOPOULOS , Law Firm
Leonidas Georgopoulos


By focusing on cooling and on serving our customers in ways no other company in the market can, we have built our core business into a rock-solid foundation – not only for sustained profit and growth – but for future expansion as well. Thanks to our strategic presence in key regions around the world, our enviable fundamentals, and our innovative technologies and marketing solutions, Frigoglass is better positioned than ever to expand in markets where we are already established and to enter new high-potential markets as well, markets characterized by booming economies, expanding prosperity and increasing demand for our customers’ products. There are no geographical or cultural limits to our growth. Wherever our customers want to sell cool products and beverages, Frigoglass will be there beside them, helping them turn opportunity into success.
Warsaw (student’s bar) 52° 15´ N, 21° 00´ E
Pour it on
Our opportunities have no borders

%breweries 118%
sales increase*16Russia 98%
Indonesia 104%
Germany 400%UK 97%
Italy 105%South Africa 41%
*continuing operations only

Having created a solid network for sales and service, a dynamic team of dedicated people, a reputation for quality and demonstrable effects on our customers’ profits, it is no surprise that Frigoglass’ sales continue to increase, year after year. The strong growth in sales in 2005 was a result of two main factors: sustained organic growth, especially in countries with explosive growth rates, such as Indonesia, Russia, Germany and Italy, and a strong expansion of our client base, including new customers among breweries worldwide and in the Coca-Cola bottling network. Both trends will continue in 2006 and well beyond because they reflect a basic reality of our company, namely, that we deliver what the market needs. While our sales to the soft - drink sector made remarkable gains, and our relationship with Coca-Cola bottlers throughout the world deepened and expanded, our sales to breweries increased 118% over the previous year, representing 23% of our total Cool Operations sales, up from 13% in 2004. This significant expansion of our customer base among breweries was the result of concentrated efforts to develop innovative “cool and sell” solutions for their products in both traditional and new locations – and to increase impulse sales among their consumers. In addition to organic growth and an expansion of our client base, Frigoglass also offered a product mix which, in 2005, met with an enthusiastic reception in such fast-growth trade channels as supermarkets and gas stations. When you deliver what the market wants, sales follow.
sales increase*


OUR VISION Moscow 55° 45´ N, 37° 37´ E
Leadership requires passion – and compassion. It means standing in our customers’ shoes and striving to achieve what they want to achieve. It means looking forward and far ahead. It means doing whatever it takes to be the best, and to continue to be the best.

D w
*continuing operations only
%22EBITDA*
0.59earnings per share

D w
Along with a strong growth in sales, Frigoglass enjoyed a similarly robust increase in profits. In fact, through redeployment of resources and greatly enhanced efficiency throughout the organization, Frigoglass’ EBITDA increased at an even higher rate than last year – despite higher prices for raw materials. In 2005, we continued the manufacturing consolidation plan, transferring production from Spain to Poland and India. We also reduced the cost and complexity of our manufacturing processes, increasing utilization rates. We managed our working capital more efficiently, reduced our debt and were able to bring the group’s effective tax rate from 45.4% to 32.5%. Finally, we concentrated more of our resources where the greatest present and future profits lie. The profit growth in 2005 reflects a more efficient global enterprise, more tightly focused on its core business - and more profitable than ever. And with our increases in sales, market share and profitability, it is only natural that Frigoglass has continued to return real value, and double-digit earnings-per-share growth, to its investors. Earnings per share climbed from 0.32 in 2004 to 0.59 in 2005, while the company’s share-price level reached new heights.
EBITDA*
0.59earnings per share

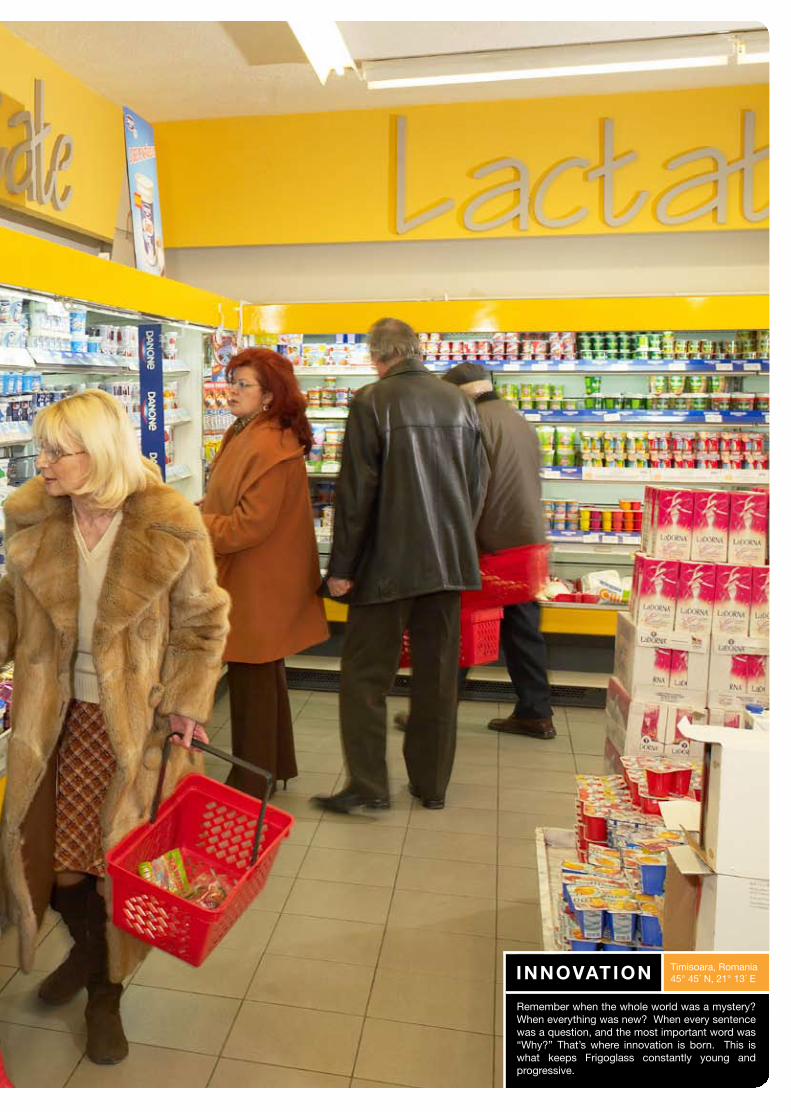
INNOVATION
Remember when the whole world was a mystery? When everything was new? When every sentence was a question, and the most important word was “Why?” That’s where innovation is born. This is what keeps Frigoglass constantly young and progressive.
Timisoara, Romania 45° 45´ N, 21° 13´ E
In a world that isconstantly growing,demand for Frigoglass’products, services andknow-how in coolingand selling is growingeven faster.
For Frigoglass, the future looks good. The company is focused and efficient and can take maximum advantage of many exciting new growth opportunities.While strong organic growth will continue to drive sales and profits and solidify our reputation as the industry leader, the company has mapped out a bold strategy for entering and capturing important new markets as well. First of all, three closely connected demographic trends (population growth, expanding prosperity, worldwide growth of the urban workforce) in such regions as Eastern Europe and South East Asia combine to lift sales across the board and open up profitable new markets. These trends, like a rising tide, will lift both its customers and Frigoglass together – because we are well positioned to take advantage of these developments. Second, our geographic diversity gives us a global platform for regional expansion. Frigoglass is now preparing to enter new countries and markets where research tells us that demand for our products and services is poised to explode. Finally, Frigoglass is currently developing a generation of new products which are set to capture a wide range of important new customers all over the world.


Jakarta, Indonesia 6° 10´ S, 106° 49´ E
Bright and big. Looking East, looking West, looking North and South - everywhere we look we see opportunity, new markets and customers. The world is rapidly changing, and we are ready.
OPPORTUNITY


Impulse is the heart and soul of shopping. It is a momentary response to a complex pattern of messages, both loud and subtle. By understanding the customer, Frigoglass is able to create the perfect merchandising solution for every consumer occasion, desire or need.
IMPULSE Bucharest, Romania 44° 25´ N, 26° 07´ E

It’s not enough to sell things in a community, or even to provide good jobs at fair wages. A company with heart has to go one step further. We are in the store with Mama Jerry, helping her business succeed, but we are also active in the local school and on the soccer pitch, and in dozens of social and educational programs around the world. It’s our community too.
COMMUNITY Nairobi, Kenya 1° 17´ S, 36° 49´ E


Frigoglass defines success in terms of its relationships with employees, suppliers, customers and shareholders. Is everyone doing well? Are there any suggestions, complaints or good ideas? A relationship requires dialogue and dedication. We listen carefully… and we are very dedicated.
RELATIONSHIPS Casablanca, Morocco 33° 32´ N, 7° 35´ W


OUR FUTURE
At Frigoglass, our customers , and their customers, are our family, our future and our sole focus of attention. Thinking ahead, with all we have learned, the goal is quite simple:
A HEALTHY FUTURE
30 31
Sales 389.782 340.297
Cost of goods sold -291.780 -253.458
Gross profit 98.002 86.839
Other operating income 11.604 8.333
Administration expenses -39.742 -35.197
Selling & marketing expenses -22.106 -19.890
Research & Development expenses -2.602 -2.219
Losses from restructuring activities -2.111
Total operating expenses -66.561 -57.306
Operating Profit 43.045 37.866
Finance costs -4.200 -7.065
Profit before income tax 38.845 30.801
Income tax expense -12.637 -13.371
Profit for the year after income tax expenses 26.208 17.430
Attributable to:
Minority interest 1.923 3.014
Shareholders of the Company 24.285 14.416
Weighted Average number of shares (in thousands) 40.000 39.994
Earnings per share attributable to the shareholders of the company during the year (in € per share)
0,61 0,36
Depreciation 22.285 21.809
Earnings before interest, tax, depreciation and amortization and invested results 67.441 59.675
Group
From : 01/ 01 ´till
Continuing Operations & Discontinuing Operations 31/12/2005 31/12/2004
Frigoglass Group & Frigoglass S.A.I.C - Parent Company-Annual Financial Statements: 1 January – 31 December 2005
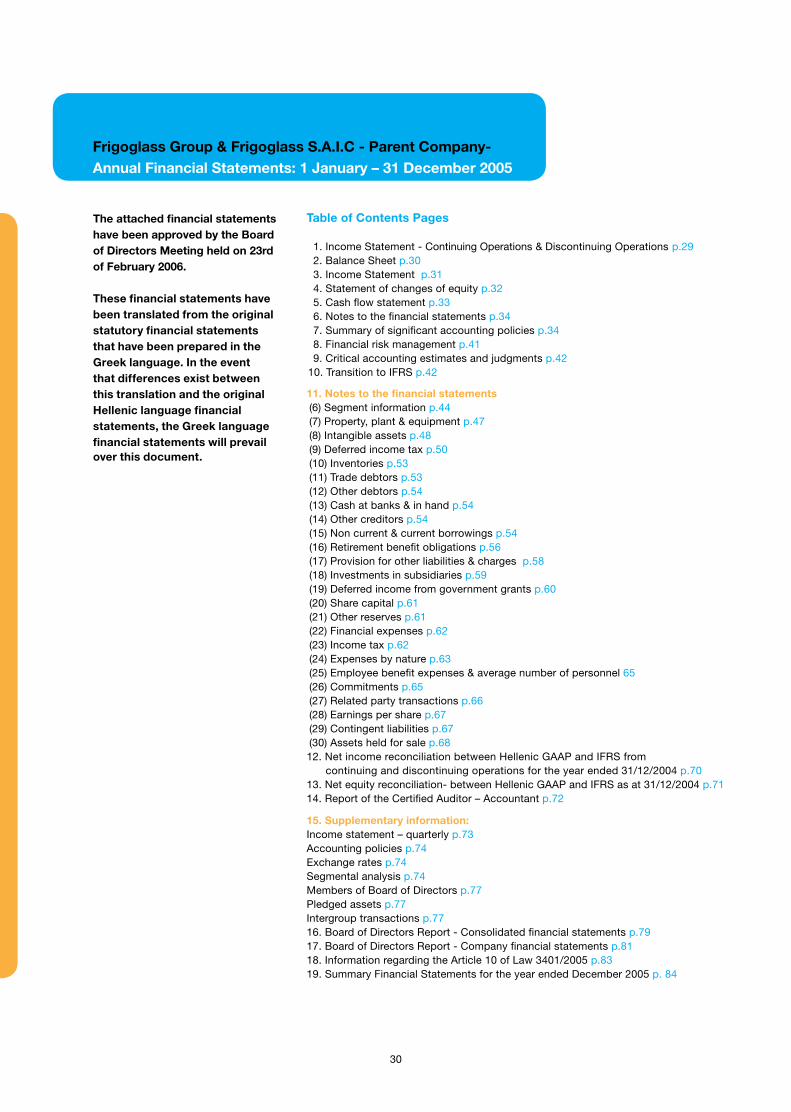
Table of Contents Pages
1. Income Statement - Continuing Operations & Discontinuing Operations p.292. Balance Sheet p.303. Income Statement p.314. Statement of changes of equity p.325. Cash flow statement p.336. Notes to the financial statements p.347. Summary of significant accounting policies p.34 8. Financial risk management p.419. Critical accounting estimates and judgments p.42
10. Transition to IFRS p.42
11. Notes to the financial statements (6) Segment information p.44 (7) Property, plant & equipment p.47 (8) Intangible assets p.48 (9) Deferred income tax p.50 (10) Inventories p.53 (11) Trade debtors p.53 (12) Other debtors p.54 (13) Cash at banks & in hand p.54 (14) Other creditors p.54 (15) Non current & current borrowings p.54 (16) Retirement benefit obligations p.56 (17) Provision for other liabilities & charges p.58 (18) Investments in subsidiaries p.59 (19) Deferred income from government grants p.60 (20) Share capital p.61 (21) Other reserves p.61 (22) Financial expenses p.62 (23) Income tax p.62 (24) Expenses by nature p.63 (25) Employee benefit expenses & average number of personnel 65 (26) Commitments p.65 (27) Related party transactions p.66 (28) Earnings per share p.67 (29) Contingent liabilities p.67 (30) Assets held for sale p.6812. Net income reconciliation between Hellenic GAAP and IFRS from continuing and discontinuing operations for the year ended 31/12/2004 p.7013. Net equity reconciliation- between Hellenic GAAP and IFRS as at 31/12/2004 p.7114. Report of the Certified Auditor – Accountant p.72
15. Supplementary information: Income statement – quarterly p.73Accounting policies p.74Exchange rates p.74Segmental analysis p.74Members of Board of Directors p.77Pledged assets p.77Intergroup transactions p.7716. Board of Directors Report - Consolidated financial statements p.7917. Board of Directors Report - Company financial statements p.8118. Information regarding the Article 10 of Law 3401/2005 p.8319. Summary Financial Statements for the year ended December 2005 p. 84
The attached financial statements have been approved by the Board of Directors Meeting held on 23rd of February 2006.
These financial statements have been translated from the original statutory financial statements that have been prepared in the Greek language. In the event that differences exist between this translation and the original Hellenic language financial statements, the Greek language financial statements will prevail over this document.

30 31
Sales 389.782 340.297
Cost of goods sold -291.780 -253.458
Gross profit 98.002 86.839
Other operating income 11.604 8.333
Administration expenses -39.742 -35.197
Selling & marketing expenses -22.106 -19.890
Research & Development expenses -2.602 -2.219
Losses from restructuring activities -2.111
Total operating expenses -66.561 -57.306
Operating Profit 43.045 37.866
Finance costs -4.200 -7.065
Profit before income tax 38.845 30.801
Income tax expense -12.637 -13.371
Profit for the year after income tax expenses 26.208 17.430
Attributable to:
Minority interest 1.923 3.014
Shareholders of the Company 24.285 14.416
Weighted Average number of shares (in thousands) 40.000 39.994
Earnings per share attributable to the shareholders of the company during the year (in € per share)
0,61 0,36
Depreciation 22.285 21.809
Earnings before interest, tax, depreciation and amortization and invested results 67.441 59.675
Group
From : 01/ 01 ´till
Continuing Operations & Discontinuing Operations 31/12/2005 31/12/2004
Income Statement in (€ 000’s)

32 33
Group Parent Company
Assets: Note 31/12/2005 31/12/2004 31/12/2005 31/12/2004
Property, plant and equipment 7 116.697 151.953 14.483 14.698
Intangible assets 8 4.451 4.720 3.407 3.161
Investments in subsidiaries 18 44.895 57.893
Deferred income tax assets 9 1.241 814
Other long term assets 1.184 251 156 173
Total Non - current assets 123.573 157.738 62.941 75.925
Inventories 10 81.217 74.990 9.271 10.627
Trade debtors 11 49.787 59.566 9.463 6.707
Other debtors 12 28.677 22.351 12.529 8.003
Intergroup receivables 31.670 30.514
Cash at banks & in hand 13 12.106 10.420 393 584
Assets held for sale 30 66.552 12.998
Total current assets 238.339 167.327 76.324 56.435
Total Assets 361.912 325.065 139.265 132.360
Liabilities:
Long - term borrowings 15 18.304 35.531 17.000 29.000
Deferred Income tax liabilities 9 9.673 11.230 572 2.334
Retirement benefit obligations 16 13.488 11.326 5.821 4.083
Provisions for other liabilities & charges 17 6.421 3.379 3.462 1.032
Deferred income from government grants 19 366 5.619 251 152
Total Non - current liabilities 48.252 67.085 27.106 36.601
Trade creditors 27.059 34.038 8.602 6.148
Other creditors 14 26.933 15.729 5.376 2.777
Current income tax liabilities 5.945 4.770 3.065 1.155
Intergroup payables 705 2.341
Short - term borrowings 15 62.259 75.465 17.107 6.976
Liabilities associated with assets classified as held for sale 30 36.890
Total current liabilities 159.086 130.002 34.855 19.397
Total Liabilities 207.338 197.087 61.961 55.998
Equity:
Share capital 20 40.000 40.000 40.000 40.000
Share premium 20 57.245 57.245 57.245 57.245
Other reserves 21 29.048 21.055 22.857 20.215
Accumulated Deficit -8.809 -24.008 -42.798 -41.098
Net Equity attributable to Company Shareholders 117.484 94.292 77.304 76.362
Minority Interest 37.090 33.686
Total Equity 154.574 127.978 77.304 76.362
Total Liabilities and equity 361.912 325.065 139.265 132.360
The attached financial statements have been approved by the Board of Directors meeting held on the 23rd of February 2006 and are hereby signed by:
Kifissia, 23 February 2006
The Chairman of the Board - Dimitrios Krontiras, The Managing Director - Dimitrios Lois,The Group Chief Financial Officer - Panagiotis Tabourlos, The Finance Manager - Vassilios Stergiou
The notes on pages 34 to 71 are an integral part of these financial statements
Continuing Operations
Balance Sheet in (€ 000’s)

32 33
GroupFor the year ended
Parent CompanyFor the year ended
Note 31/12/2005 31/12/2004 31/12/2005 31/12/2004
Sales 6 306.829 264.202 61.554 49.801
Cost of goods sold 24 -214.573 -186.050 -52.787 -45.020
Gross profit 92.256 78.152 8.767 4.781
Other operating income 10.991 7.721 19.910 17.490
Administration expenses 24 -36.415 -32.126 -18.861 -13.878
Selling & marketing expenses 24 -21.942 -19.520 -5.197 -4.631
Research & Development expenses 24 -2.555 -2.189 -2.007 -1.825
Losses from restructuring activities -1.111
Total operating expenses -62.023 -53.835 -26.065 -20.334
Operating Profit 41.224 32.038 2.612 1.937
Dividend income 8.961 5.860
Finance costs 22 -3.519 -6.275 -1.414 -1.311
Profit before income tax 37.705 25.763 10.159 6.486
Income tax expense 23 -11.946 -11.689 -3.454 -2.578
Profit for the year from continuing operations 25.759 14.074 6.705 3.908
Discontinuing Operations
Profit for the year after income tax from discontinued operations 30 449 3.356 1.011 1.011
Profit for the year after income tax expenses 26.208 17.430 7.716 4.919
Attributable to:
Minority interest 1.923 3.014
Shareholders of the Company 24.285 14.416 7.716 4.919
Weighted Average number of shares (in thousands) 28 40.000 39.994 40.000 39.994
Earnings per share from continuing operations attributable to the shareholders of the company during the year ( in € per share) 28 0,60 0,32 0,17 0,10
Earnings per share from discontinuing operations attributable to the shareholders of the company during the year ( in € per share) 28 0,01 0,04 0,03 0,03
The notes on pages 34 to 71 are an integral part of these financial statements
Continuing Operations
Income Statement in (€ 000’s)

34 35
GroupShare capital
Share premium
Other reserves
Accumulated Deficit
Minority Interest Total
Balance 01/01/2004 39.252 57.245 16.975 -32.305 35.626 116.793
Disposal of treasury shares 748 748
Profit for the year 14.416 3.014 17.430
Dividends to Company’s shareholders -4.000 -4.000
Acquisition of Minority -2.724 -2.724
Currency Translation differences 2.116 -435 -438 1.243
Dividends to Minorities -1.792 -1.792
Reserves for distribution -1.550 1.550 -
Transfer to Reserves 3.514 -3.514 -
Net income recognized directly in equity 280 280
Balance 31/12/2004 40.000 57.245 21.055 -24.008 33.686 127.978
Balance 01/01/2005 40.000 57.245 21.055 -24.008 33.686 127.978
Profit for the year 24.285 1.923 26.208
Dividends to Company’s shareholders -5.600 -5.600
Dividends to Minorities -1.169 -1.169
Actuarial losses net of deferred taxes -1.174 -1.174
Currency Translation differences 3.930 1.493 2.650 8.073
Reserves for distribution 4.063 -4.063 -
Net income recognized directly in equity 258 258
Balance 31/12/2005 40.000 57.245 29.048 -8.809 37.090 154.574
Parent Company
Balance 01/01/2004 39.252 57.245 19.961 -42.043 74.415
Disposal of treasury shares 748 748
Profit for the year 4.919 4.919
Dividends to Company’s shareholders -4.000 -4.000
Reserves for distribution -1.550 1.550 -
Transfer to Reserves 1.804 -1.804 -
Net income recognized directly in equity 280 280
Balance 31/12/2004 40.000 57.245 20.215 -41.098 76.362
Balance 01/01/2005 40.000 57.245 20.215 -41.098 76.362
Profit for the year 7.716 7.716
Dividends to Company’s shareholders -5.600 -5.600
Actuarial losses net of deferred taxes -1.174 -1.174
Transfer to Reserves 2.642 -2.642 -
Balance 31/12/2005 40.000 57.245 22.857 -42.798 77.304
The notes on pages 34 to 71 are an integral part of these financial statements
Net increase / (decrease) in cash and cash equivalents 2.191 1.551 -191 139
Cash and cash equivalents at beginning of the year 10.420 8.869 584 445
Cash and cash equivalents at the end of the year 12.611 10.420 393 584
Cash and cash equivalents at the end of the year attributable to discontinuing operations -505 - - -
Cash and cash equivalents at the end of the year 12.106 10.420 393 584
The notes on pages 34 to 71 are an integral part of these financial statements
Profit before income tax from continuing operation 37.705 25.763 11.170 7.497
Profit before tax from discontinuing operation 1.140 5.038
Profit before tax 38.845 30.801
Adjustments for:
Depreciation 7 22.285 21.809 3.812 3.429
Provisions 8.782 8.135 3.142 1.182
Dividend Income - -9.972 -6.871
Exchange difference 411 1.334 - -
Changes in Working Capital:
Decrease / (increase) of inventories -18.254 -2.057 1.356 765
Decrease / (increase) of trade debtors -5.916 -8.568 -2.756 2.908
Decrease / (increase) of Intergroup receivables - - -1.156 -20.829
Decrease / (increase) of other receivables -7.863 -4.432 -4.526 -495
(Decrease) / increase of suppliers 3.861 6.005 2.454 1.528
(Decrease) / increase of Intergroup payables - - -1.636 2.378
(Decrease) / increase of other liabilities (except borrowing) 9.037 621 1.863 570
Less:
Income Tax paid -12.813 -9.124 -2.873 -1.549
(a) Net cash generated from operating activities 38.375 44.524 878 -9.487
Cash Flow from investing activities
Purchase of property, plant and equipment 7 -15.230 -28.345 -2.005 -2.874
Purchase of intangible assets 8 -1.868 -3.185 -1.574 -2.344
Proceeds from subsidiaries share capital return - - - 4.804
Proceeds from investment disposal - - - 1.050
Proceeds from disposal of property, plant, equipment and intangible assets - - - 1.055
Dividends received - - 9.972 6.871
(b) Net cash generated from investing activities -17.098 -31.530 6.393 8.562
Net cash generated from operatingand investing activities 21.277 12.994 7.271 -925
Cash Flow from financing activities
Increase / (decrease) of borrowing -12.325 -5.679 -1.870 5.036
Dividends paid to Company’s shareholders -5.592 -3.972 -5.592 -3.972
Dividends paid to minority interests -1.169 -1.792 - -
(c) Net cash generated from financing activities -19.086 -11.443 -7.462 1.064
GroupFor the year ended
Parent CompanyFor the year ended
Cash Flow from operating activities Note 31/12/2005 31/12/2004 31/12/2005 31/12/2004
Statement of Changes in Equity (in € 000’s)

34 35
Net increase / (decrease) in cash and cash equivalents 2.191 1.551 -191 139
Cash and cash equivalents at beginning of the year 10.420 8.869 584 445
Cash and cash equivalents at the end of the year 12.611 10.420 393 584
Cash and cash equivalents at the end of the year attributable to discontinuing operations -505 - - -
Cash and cash equivalents at the end of the year 12.106 10.420 393 584
The notes on pages 34 to 71 are an integral part of these financial statements
Profit before income tax from continuing operation 37.705 25.763 11.170 7.497
Profit before tax from discontinuing operation 1.140 5.038
Profit before tax 38.845 30.801
Adjustments for:
Depreciation 7 22.285 21.809 3.812 3.429
Provisions 8.782 8.135 3.142 1.182
Dividend Income - -9.972 -6.871
Exchange difference 411 1.334 - -
Changes in Working Capital:
Decrease / (increase) of inventories -18.254 -2.057 1.356 765
Decrease / (increase) of trade debtors -5.916 -8.568 -2.756 2.908
Decrease / (increase) of Intergroup receivables - - -1.156 -20.829
Decrease / (increase) of other receivables -7.863 -4.432 -4.526 -495
(Decrease) / increase of suppliers 3.861 6.005 2.454 1.528
(Decrease) / increase of Intergroup payables - - -1.636 2.378
(Decrease) / increase of other liabilities (except borrowing) 9.037 621 1.863 570
Less:
Income Tax paid -12.813 -9.124 -2.873 -1.549
(a) Net cash generated from operating activities 38.375 44.524 878 -9.487
Cash Flow from investing activities
Purchase of property, plant and equipment 7 -15.230 -28.345 -2.005 -2.874
Purchase of intangible assets 8 -1.868 -3.185 -1.574 -2.344
Proceeds from subsidiaries share capital return - - - 4.804
Proceeds from investment disposal - - - 1.050
Proceeds from disposal of property, plant, equipment and intangible assets - - - 1.055
Dividends received - - 9.972 6.871
(b) Net cash generated from investing activities -17.098 -31.530 6.393 8.562
Net cash generated from operatingand investing activities 21.277 12.994 7.271 -925
Cash Flow from financing activities
Increase / (decrease) of borrowing -12.325 -5.679 -1.870 5.036
Dividends paid to Company’s shareholders -5.592 -3.972 -5.592 -3.972
Dividends paid to minority interests -1.169 -1.792 - -
(c) Net cash generated from financing activities -19.086 -11.443 -7.462 1.064
GroupFor the year ended
Parent CompanyFor the year ended
Cash Flow from operating activities Note 31/12/2005 31/12/2004 31/12/2005 31/12/2004
Cash Flow Statement (in € 000’s)

36 37
1. Notes to the financial statements
1.1 General InformationThese financial statements include the annual financial statements of the parent company FRIGOGLASS S.A.I.C. (the“Company”) and the consolidated annual financial statements of the Company and its subsidiaries (the “Group”). The names of the subsidiaries are presented in Note 18 of the financial statements.
Frigoglass S.A.I.C. and its subsidiaries are engaged in the manufacturing, trade and distribution of commercial refrigeration units and packaging materials for the beverage industry. The Group has manufacturing plants and sales offices in Europe, Asia, and Africa.
The Company is a limited liability company incorporated and based in Kifissia, Attica.The Company’s’ shares are listed on the Athens Stock Exchange.
The address of its registered office is:
15, A. Metaxa StreetGR 145 64, KifissiaAthens, Hellas
The company’s web page is: www.frigoglass.com
2. Summary of significant accounting policies
The principal accounting policies adopted in the preparation of these financial statements are set out below. These policies have been consistently applied to all years presented, unless otherwise stated.
2.1 Basis of PreparationThese financial statements have been prepared by management in accordance with International Financial Reporting Standards (IFRS) and IFRIC interpretations as adopted by the European Union, and International Financial Reporting Standards issued by the IASB.
All International Financial Reporting Standards issued by the IASB and effective at the time of preparing these financial statements have been adopted by the European Commission through the endorsement procedure established by the European Commission, with the exception of International Accounting Standard 39 “Financial Instruments: Recognition and Measurement”. Following recommendations from the Accounting Regulatory Committee, the Commission adopted Regulations 2086/2004 and 1864/2005 requiring the use of IAS 39, minus certain provisions on portfolio hedging of core deposits, by all listed companies from 1 January 2005.
Since the Group and the Company are not affected by the provisions regarding portfolio hedging that are not required by the EU-endorsed version of IAS 39, the accompanying financial statements comply with both IFRS as adopted by the EU and IFRS issued by the IASB.
The financial statements of Frigoglass as at 31 December 2003, which were issued by the Company on 2 February 2004, were prepared in accordance with generally accepted accounting principles in Greece (Hellenic GAAP). These were considered to be the previous GAAP as defined in IFRS 1 for the preparation of the preliminary opening IFRS balance sheet as at 1 January 2004. The Company also issued on 8 February 2005 its financial statements as at 31 December 2004 in accordance with Hellenic GAAP. Hellenic GAAP differs in certain respects from IFRS.
The policies set out below have been consistently applied to all the periods presented except for those relating to the classification and measurement of financial instruments. The Company has made use of the exemption available under IFRS 1 to only apply IAS 32 and IAS 39 from 1 January 2005. The policies applied to financial instruments for 2004 and 2005 are disclosed separately below.
The Company’s financial statements were previously prepared in accordance with Hellenic GAAP until 31 December 2004. Hellenic GAAP differs in some areas from IFRS. In preparing the IFRS financial statements, management has amended certain accounting and valuation methods applied in the Hellenic GAAP financial statements, and has presented financial statements, statement of changes in equity, cash flow statements and more comprehensive explanatory notes, to comply with IFRS. The comparative figures in respect for the year ended 31 December 2004 were restated to reflect these adjustments, except as described in the accounting policies.
Reconciliations and descriptions of the adjustments from Hellenic GAAP 2003 and 2004 financial statements to the opening IFRS balance sheet as of 1 January 2004, and 31 December 2004 IFRS equity and profit and loss respectively are provided in pages 70-71.
The financial statements have been prepared under the historical cost convention.
The preparation of financial statements in accordance with IFRS requires the use of certain critical accounting estimates. It also requires management to exercise judgement in the process of applying the accounting policies. The areas involving a higher degree of judgment or complexity, or areas where assumptions and estimates are significant to the financial statements are disclosed in Note 4.
2.2 Consolidation
2.2.1 SubsidiariesSubsidiaries are all entities (including special purpose entities) over which the Group has the power to govern their financial and operating policies, generally accompanying a shareholding of more than one half of the voting rights. The existence and effect of potential voting rights that are currently exercisable or convertible are considered when assessing whether the Group controls another entity. Subsidiaries
36 37
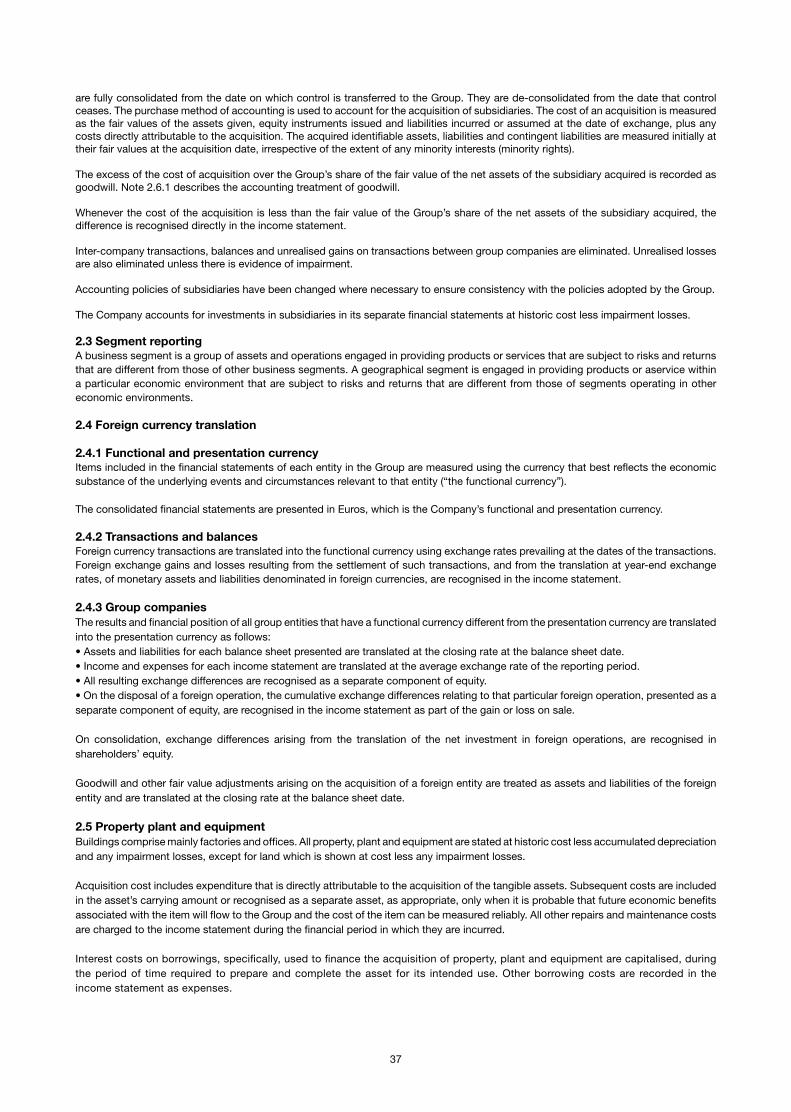
are fully consolidated from the date on which control is transferred to the Group. They are de-consolidated from the date that control ceases. The purchase method of accounting is used to account for the acquisition of subsidiaries. The cost of an acquisition is measured as the fair values of the assets given, equity instruments issued and liabilities incurred or assumed at the date of exchange, plus any costs directly attributable to the acquisition. The acquired identifiable assets, liabilities and contingent liabilities are measured initially at their fair values at the acquisition date, irrespective of the extent of any minority interests (minority rights).
The excess of the cost of acquisition over the Group’s share of the fair value of the net assets of the subsidiary acquired is recorded as goodwill. Note 2.6.1 describes the accounting treatment of goodwill.
Whenever the cost of the acquisition is less than the fair value of the Group’s share of the net assets of the subsidiary acquired, the difference is recognised directly in the income statement.
Inter-company transactions, balances and unrealised gains on transactions between group companies are eliminated. Unrealised losses are also eliminated unless there is evidence of impairment.
Accounting policies of subsidiaries have been changed where necessary to ensure consistency with the policies adopted by the Group.
The Company accounts for investments in subsidiaries in its separate financial statements at historic cost less impairment losses.
2.3 Segment reportingA business segment is a group of assets and operations engaged in providing products or services that are subject to risks and returns that are different from those of other business segments. A geographical segment is engaged in providing products or aservice within a particular economic environment that are subject to risks and returns that are different from those of segments operating in other economic environments.
2.4 Foreign currency translation
2.4.1 Functional and presentation currencyItems included in the financial statements of each entity in the Group are measured using the currency that best reflects the economic substance of the underlying events and circumstances relevant to that entity (“the functional currency”).
The consolidated financial statements are presented in Euros, which is the Company’s functional and presentation currency.
2.4.2 Transactions and balancesForeign currency transactions are translated into the functional currency using exchange rates prevailing at the dates of the transactions. Foreign exchange gains and losses resulting from the settlement of such transactions, and from the translation at year-end exchange rates, of monetary assets and liabilities denominated in foreign currencies, are recognised in the income statement.
2.4.3 Group companiesThe results and financial position of all group entities that have a functional currency different from the presentation currency are translated into the presentation currency as follows:• Assets and liabilities for each balance sheet presented are translated at the closing rate at the balance sheet date.• Income and expenses for each income statement are translated at the average exchange rate of the reporting period.• All resulting exchange differences are recognised as a separate component of equity.• On the disposal of a foreign operation, the cumulative exchange differences relating to that particular foreign operation, presented as a separate component of equity, are recognised in the income statement as part of the gain or loss on sale.
On consolidation, exchange differences arising from the translation of the net investment in foreign operations, are recognised in shareholders’ equity.
Goodwill and other fair value adjustments arising on the acquisition of a foreign entity are treated as assets and liabilities of the foreign entity and are translated at the closing rate at the balance sheet date.
2.5 Property plant and equipmentBuildings comprise mainly factories and offices. All property, plant and equipment are stated at historic cost less accumulated depreciation and any impairment losses, except for land which is shown at cost less any impairment losses.
Acquisition cost includes expenditure that is directly attributable to the acquisition of the tangible assets. Subsequent costs are included in the asset’s carrying amount or recognised as a separate asset, as appropriate, only when it is probable that future economic benefits associated with the item will flow to the Group and the cost of the item can be measured reliably. All other repairs and maintenance costs are charged to the income statement during the financial period in which they are incurred.
Interest costs on borrowings, specifically, used to finance the acquisition of property, plant and equipment are capitalised, during the period of time required to prepare and complete the asset for its intended use. Other borrowing costs are recorded in the income statement as expenses.

38 39
Depreciation is calculated using the straight-line method to write off the cost of each asset to its residual value over its estimated useful life as follows:
Buildings • up to 40 yearsVehicles • 5 to 6 yearsGlass Furnaces • 5 yearsGlass Moulds • 2 yearsMachinery • 15 years (Pet Division)Machinery up to • 10 years (Other Divisions)Furniture & Fixtures • 3 to 6 years
The cost of subsequent expenditures is depreciated during the estimated useful life of the asset and costs for major periodic renovations are depreciated to the date of the next scheduled renovation. When an item of plant and machinery comprises major components with different useful lives, the components are accounted for as separate items of plant and machinery.
The tangible assets’ residual values and useful lives are reviewed, and adjusted if appropriate, at each balance sheet date.
In the case where an asset’s carrying amount is greater than its estimated recoverable amount, it is written down immediately to its recoverable amount and the difference (impairment loss) is recorded as expense in the income statement.
Gains and losses on disposals are determined by the difference between the sales proceeds and the carrying amount of the asset. These gains or losses are included in the income statement.
2.6 Intangible assets
2.6.1 GoodwillGoodwill represents the excess of the cost of an acquisition over the fair value of the Group’s share in the acquired subsidiary’s net assets at the date of acquisition. Goodwill on acquisitions of associates is included in investments in associates.
Goodwill is tested annually for impairment and carried at cost less accumulated impairment losses. At each balance sheet date the Group assesses whether there is any indication of impairment. If such indications exist, an analysis is performed to assess whether the carrying amount of goodwill is fully recoverable.
Goodwill is allocated to cash-generating units for the purpose of impairment testing.The allocation is performed on the cash-generating units that are expected to benefit from the acquisition from which goodwill was derived.
Loss from impairment is recognised if the carrying amount exceeds the recoverable amount. Gains and losses on the disposal of an entity include the carrying amount of goodwill relating to the entity sold.
2.6.2 Research Expenses
Research expenditure is recognised as an expense as incurred.
2.6.3 Development ExpensesCosts incurred on development projects (relating to the design and testing of new or improved products) are recognised as intangible assets when it is probable that the project will be successful, considering its commercial and technological feasibility, and also the costs can be measured reliably. Other development expenditures are recognised as an expense in the income statement as incurred. Development costs that have a finite useful life and that have been capitalised, are amortised from the commencement of their production on a straight line basis over the period of its useful life, not exceeding 5 years.
2.6.4 Computer softwareCapitalised software licenses are carried at acquisition cost less accumulated amortisation, less any accumulated impairment.They are amortised using the straightline method over their useful lives, not exceeding a period of 5 years. Computer software development or maintenance costs are recognised as expenses in the income statement as they incur.
2.6.5 Other intangible assetsPatents, trademarks and licences are shown at historical cost less accumulated amortisation.These intangible assets have a definite useful life, and their cost is amortised using the straight-line method over their useful lives.
2.7 Impairment of assetsAssets that have an indefinite useful life are not subject to amortisation and are tested for impairment annually and whenever events or changes in circumstances indicate that their carrying amount may not be recoverable. Assets that are subject to amortisation are reviewed for impairment whenever events or changes in circumstances indicate that the carrying amount may not be recoverable.
An impairment loss is recognised as an expense immediately, for the amount by which the asset’s carrying amount exceeds its recoverable amount.
The recoverable amount is the higher of an asset’s fair value less costs to sell and value in use. For the purposes of assessing impairment, assets are grouped at the lowest levels for which there are separately identifiable cash flows (cash-generating units).

38 39
2.8 Financial assetsThe Group classifies its financial assets in the following categories: at fair value through profit and loss, loans and receivables, and available for sale.The classification depends on the purpose for which the financial assets were acquired. Management determines the classification of its financial assets at initial recognition and re-evaluates this designation at every reporting date.
(a) Financial assets at fair value through profit and lossThis category has two sub-categories: financial assets held for trading, and those designated at fair value through profit or loss at inception. A financial asset is classified in this category if acquired principally for the purpose of selling in the short term or if so designated by management.
The Group and the Company did not own any financial assets, including derivatives held for trading, that are recorded at fair value through the income statement for the periods presented in these financial statements.
(b) Loans and receivablesLoans and receivables are non-derivative financial assets with fixed or determinable payments that are not quoted in an active market. They are included in current assets, except for maturities greater than 12 months after the balance sheet date, which are classified as non-current assets. Loans and receivables are classified as ‘trade and other receivables’ in the balance sheet (Note 2.11). The Group did not have any loan receivables during the periods presented in these financial statements.
(c) Available-for-sale financial assetsAvailable-for-sale financial assets are non-derivatives that are either designated in this category or not classified in any of the other categories. They are included in non-current assets unless management intends to dispose of the investment within 12 months of the balance sheet date.
The Group did not own any financial assets that can be characterised as available-forsale financial assets during the periods presented in these financial statements.
Equity investments in subsidiaries are measured at cost less impairment losses in the separate financial statements of the parent. Impairment losses are recognised in the income statement.
2.9 Leases
2.9.1 When a Group company is the lesseeLeases where the lessor retains a significant portion of the risks and rewards of ownership are classified as operating leases. Payments made under operating leases (net of any incentives received by the lessor) are charged to the income statement on a straight-line basis over the period of the lease.
Leases of property, plant and equipment where a Group entity has substantially all the risks and rewards of ownership are classified as finance leases. Finance leases are capitalised at the inception of the lease at the lower of the fair value of the leased assets and the present value of the minimum lease payments. Each lease payment is allocated between the liability and finance charges so as to achieve a constant rate on the finance lease liability outstanding. The corresponding rental obligations, net of finance charges, are included in liabilities as other long-term payables. The interest element of the finance cost is charged to the income statement over the lease period so as to produce a constant periodic rate of interest on the remaining balance of the liability for each period.Property, plant and equipment, acquired under finance leases are depreciated over the shorter of the asset’s useful life and the lease term.
2.9.2 When a Group company is the lessorWhen assets are leased out under a finance lease, the present value of the lease payments is recognised as a receivable. The difference between the gross receivable and the present value of the receivable is recognised as unearned finance income. Lease income is recognised over the term of the lease using the net investment method, which reflects a constant periodic rate of return.
Assets leased out under operating leases are included within tangible assets in the balance sheet. They are depreciated over their expected useful lives, which are defined on the basis of similar tangible assets owned by the Group. Rental income (net of any incentives given to lessees) is recognised on a straight-line basis over the lease term.
2.10 InventoriesInventories are recorded at the lower of cost and net realisable value. Net realisable value is the estimated selling price in the ordinary course of business, less any applicable selling expenses.
The cost of finished goods and work in progress comprises raw materials, direct labour cost and other related production overheads.
Appropriate allowance is made for excessive, obsolete and slow moving items. Writedowns to net realisable value and inventory losses are expensed in the period in which the write-downs or losses occur.
2.11 Trade receivablesTrade receivables are recognised initially at fair value and subsequently measured at amortised cost using the effective interest method less provision for impairment. A provision for impairment of trade receivables is established when there is objective evidence that the Group entity will not be able to collect all amounts due according to the original terms of receivables. The amount of the provision is the difference between the asset’s carrying amount and the recoverable amount.

40 41
The recoverable amount, if the receivable is more than 1 year is equal to the present value of expected cash flow, discounted at the market rate of interest for similar borrowers. The amount of the provision is recognised as an expense in the income statement.
2.12 Cash and cash equivalentsCash and cash equivalents include cash on hand, deposits held at call with banks, other short-term, highly liquid investments with original maturities of three months or less. Bank overdrafts are included within borrowings in current liabilities on the balance sheet.
2.13 Share capital• Ordinary shares are classified as equity.• Incremental external costs directly attributable to the issue of new shares are shown in equity as a deduction, net of tax, from the proceeds.• When the Company or its subsidiaries purchase the Company’s own equity share the amount paid - including any attributable incremental external costs net of income taxes - is deducted from total shareholders’ equity as treasury shares until they are cancelled or reissued. Where such shares are subsequently sold or reissued, any proceed received is included in shareholders’ equity.
2.14 BorrowingsBorrowings are recognised initially at fair value, as the proceeds received, net of any transaction cost incurred. Borrowings are subsequently recorded at amortised cost. Any difference between the proceeds (net of transaction costs) and the redemption value is recognised in the income statement over the period of the borrowings.
Borrowings are classified as current liabilities unless the Group entity has an unconditional right to defer settlement for at least 12 months after the balance sheet date.
2.15 Deferred income taxesDeferred income tax is provided in full, using the balance sheet liability method, on temporary differences arising between the tax bases of assets and liabilities and their carrying amounts in the consolidated financial statements.
The deferred income tax that arises from initial recognition of an asset or liability in a transaction other than a business combination, that at the time of the transaction affects neither accounting nor taxable profit nor loss, is not accounted for.
Deferred tax assets are recognised to the extent that future taxable profit, against which the temporary differences can be utilised, is probable.
Deferred tax liabilities are provided for taxable temporary differences arising on investments in subsidiaries, except for when the Group is able to control the reversal of the temporary difference, thus it is probable that the temporary difference will not reverse in the foreseeable future.
Deferred income taxation is determined using tax rates that have been enacted at the balance sheet date and are expected to apply when the related deferred income tax asset is realised or the related deferred income tax liability is settled. Deferred tax is charged or credited in the income statement, unless it relates to items credited or charged directly to equity, in which case the deferred tax is also recorded in equity.
2.16 Employee benefits
2.16.1 Retirement BenefitsGroup entities operate various pension and retirement schemes in accordance with the local conditions and practices in the countries they operate. These schemes include both funded and unfunded schemes. The funded schemes are funded through payments to insurance companies or trustee-administered funds, as determined by periodic actuarial calculations.
A defined benefit plan is a pension or voluntary redundancy plan that is not a defined contribution plan. Typically, defined benefit plans define an amount of pension benefit that an employee will receive on retirement, usually dependent on one or more factors such as age, years of service and compensation. A defined contribution plan is a pension plan under which the Group pays fixed contributions into a separate entity. The Group has no legal or constructive obligations to pay further contributions if the fund does not hold sufficient assets to pay all employees the benefits relating to employee service in the current and prior periods.
The liability regarding defined benefit pension or voluntary redundancy plans, including certain unfunded termination indemnity benefits plans, is measured as the present value of the defined benefit obligation at the balance sheet date minus the fair value of plan assets (when the program is funded), together with adjustments for actuarial gains/losses and past service cost. The defined benefit obligation is calculated at periodic intervals not exceeding two years, by independent actuaries using the projected unit credit method. The present value of the defined benefit obligation is determined by the estimated future cash outflows using interest rates applicable to high quality corporate bonds or government securities with terms to maturity approximating the terms of the related pension liability.
Actuarial gains and losses arising from experience adjustments, changes in actuarial assumptions and amendments to pension plans are charged or credited to equity during the assessment period by external actuaries.
Past service cost is recognised as expense on a constant basis during the average period until the contributions are vested. To the extent that these contributions have been vested directly after the amendments or the establishment of a defined benefit plan, the company directly records the past service cost.
As for defined contribution plans, the Group entity pays contributions into a separate fund to publicly or privately administered pension insurance plans on a mandatory, contractual or voluntary basis. Once the contributions have been paid, the Group entity has no further payment obligations. The regular contributions are recorded as net periodic expenses for the year in which they are due, and as such are included in staff costs.

40 41
2.16.2 Termination benefitsTermination benefits are payable whenever an employee’s employment is terminated before the normal retirement date or whenever an employee accepts voluntary redundancy in exchange for these benefits.
The Group recognises termination benefits when it is demonstrably committed either to terminate the employment of current employees according to a detailed formal plan without possibility of withdrawal, or to provide termination benefits as a result of an offer made to encourage voluntary redundancy. Benefits falling due more than 12 months after balance sheet date are discounted to present value.
2.16.3 Bonus plansThe Company and the Group recognizes a liability for bonuses that are expected to be settled within 12 months and based on amounts expected to be paid upon the settlement of the liability.
2.16.4 Share-based payments (Stock Appreciation Right-SARs Phantom Option Plan)The Company operates a phantom share option scheme for its senior executives in the form of Stock Appreciation Rights depending on their performance, employment period in the company, and their positions’ responsibilities. The terms of the SARs are based upon the basic terms and conditions of stock option plans except that instead of shares the holders receive a payment equal to the difference between the market price of the company’s shares at the date of exercise and the exercise price. The options are subject to a two-year service vesting condition after granting and may be exercised during a period of three years from the date of award. At each balance sheet date, the fair value of the rights rendered is measured and is recognized as a liability in the balance sheet and as an expense in the income statement. Any subsequent changes in the fair value of the liability are recorded in the income statement for the period until the liability is settled.
2.17 ProvisionsProvisions are recognised when a) a Group entity has a present legal or constructive obligation as a result of past events, b) it is probable that an outflow of resources will be required to settle the obligation, c) and of the amount can be reliably estimated. Restructuring provisions comprise lease termination penalties and employee termination payments and are recognised in the period during which the Group entity is legally or constructively bound to pay the respective amounts. Provisions are not recognised for future operating losses related to the Group’s ongoing activities.
When there are a number of similar obligations, the likelihood that an outflow will be required in settlement is determined by considering the class of obligations as a whole. A provision is recognised even if the likelihood of an outflow with respect to any one item included in the same class of obligations may be small.
In the case that a Group entity expects a provision to be reimbursed from a third party, for example under an insurance contract, the reimbursement is recognised as a separate asset provided that the reimbursement is virtually certain.
The Group entity recognises a provision for onerous contracts when the expected benefits to be derived from a contract are less than the unavoidable costs of settling the obligations under the contract.
Provisions are measured at the present value of the expenditures that, according to the management’s best estimations, are expected in order to settle the current obligation at the balance sheet date (note 4.1). The discounting rate used for the calculation of the present value reflects current market assessments of the time value of money and the risks specific to the obligation.
2.18 Revenue recognitionRevenue comprises the fair value for the sale of goods and services net of value-added tax, rebates and discounts, and after eliminating sales within the Group in the consolidated financial statements. Revenue is recognised as follows:
• Sales of goodsRevenue from the sale of goods is recognised when the significant risks and rewards of owning the goods are transferred to the buyer, (usually upon delivery and customer acceptance) and the collectibility of the related receivable is reasonably assured.
• Sales of servicesSales of services are recognised in the accounting period in which the services are rendered, by reference to completion of the specific transaction assessed on the basis of the actual service provided as a proportion of the total services to be provided.
• Interest income Interest income is recognised on a time-proportion basis using the effective interest method. When a receivable is impaired, the Group reduces the carrying amount to its recoverable amount, being the estimated future cash flow discounted at original effective interest rate of the instrument, and continues unwinding the discount as interest income. Interest income on impaired loans is recognised using the original effective interest rate.
• Dividend incomeDividend income is recognised when the right to receive payment is established.
2.19 Dividend distributionDividends are recorded in the financial statements, as a liability, in the period in which they are approved by the Annual Shareholder Meeting.
2.20 Government GrantsGrants from the government are recognized at their fair value where there is a reasonable assurance that the grant will be received and the Group entity will comply with anticipated conditions.

42 43
Government grants relating to costs are deferred and recognized in the income statement over the period corresponding to the costs they are intended to compensate.
Government grants relating to the purchase of property, plant and equipment are included in long-term liabilities as deferred income and are credited to the income statement on a straight-line basis over the expected lives of the related assets.
2.21 Assets Held for SaleAssets classified as Assets Held for Sale (VPI SA) are stated at the lower of carrying amount and fair value less costs to sell, if their carrying amount is to be recovered principally through a sale transaction rather than through continuing use.
The Group adopted IFRS 5 from January 1, 2005 prospectively in accordance with the standard’s provisions. The assets held for sale were previously neither classified nor presented as current assets or liabilities. Such assets were not previously measured differently from other assets and liabilities.
2.22 New accounting standards and IFRIC interpretationsCertain new accounting standards and IFRIC interpretations have been published that are mandatory for accounting periods beginning as of or after January 1, 2006. The Group and the Company have applied the choice granted by IAS 19 (Amendment) Employee Benefits, concerning the recognition of actuarial differences directly within equity, in these financial statements. Group management’s assessment of the impact of these new standards and interpretations on the Group’s financial statements is presented below:
IAS 39 (Amendment), Cash Flow Hedge Accounting of Forecast Intragroup Transactions (effective from January 1, 2006).
The amendment allows the foreign currency risk of a highly probable forecasted intragroup transaction to qualify as a hedged item in the consolidated financial statements, provided that: (a) the transaction is denominated in a currency other than the functional currency of the entity entering into that transaction; and (b) the foreign currency risk will affect consolidated profit or loss. This amendment is not relevant to the Group’s operations, as the Group does not have any intragroup transactions that would qualify as a hedged item in the consolidated financial statements as of 31 December 2005 and 2004.
IAS 39 (Amendment), The Fair Value Option (effective from 1 January 2006).
This amendment changes the definition of financial instruments classified at fair value through profit or loss and restricts the ability to designate financial instruments as part of this category. The Group believes that this amendment should not have a significant impact on the classification of financial instruments, as the Group should be able to comply with the amended criteria for the designation of financial instruments at fair value through profit and loss. Group management has assessed the impact of this amendment and concluded that it does not apply to the Group.
IAS 39 and IFRS 4 (Amendment), Financial Guarantee Contracts (effective from 1 January 2006).
This amendment requires issued financial guarantees, other than those previously asserted by the entity to be insurance contracts, to be initially recognised at their fair value, and subsequently measured at the higher of (a) the unamortized balance of the related fees received and deferred, and (b) the expenditure required to settle the commitment at the balance sheet date. Management considered this amendment to IAS 39 and concluded that it is not relevant to the Group.
IFRS 1 (Amendment), First-time Adoption of International Financial Reporting Standards and IFRS 6 (Amendment), Exploration for and Evaluation of Mineral Resources (effective from 1 January 2006)
These amendments are not relevant to the Group’s operations, as the Group does not carry out exploration for and evaluation of mineral resources.
IFRS 6, Exploration for and Evaluation of Mineral Resources (effective from 1 January 2006). It is not relevant to the Group’s operations.
IFRS 7, Financial Instruments: Disclosures, and a complementary Amendment to IAS 1, Presentation of Financial Statements - Capital Disclosures (effective from 1 January 2007)
IFRS 7 introduces new disclosures to improve the information about financial instruments. It requires the disclosure of qualitative and quantitative information about exposure to risks arising from financial instruments, including specified minimum disclosures about credit risk, liquidity risk and market risk, including sensitivity analysis to market risk. It replaces IAS 30, Disclosures in the Financial Statements of Banks and Similar Financial Institutions, and disclosure requirements in IAS 32, Financial Instruments: Disclosure and Presentation. It is applicable to all entities that report under IFRS. The amendment to IAS 1 introduces disclosures about the level of an entity’s capital and how it manages capital. The Group assessed the impact of IFRS 7 and the amendment to IAS 1 and concluded that the main additional disclosures will be the sensitivity analysis to market risk and the capital disclosures required by the amendment of IAS 1. The Group will apply IFRS 7 and the amendment to IAS 1 from annual periods beginning 1 January 2007.
IFRIC 4, Determining whether an Arrangement contains a Lease (effective from 1 January 2006)
IFRIC 4 requires the determination of whether an arrangement is or contains a lease to be based on the substance of the arrangement. It requires an assessment of whether: (a) fulfilment of the arrangement is dependent on the use of a specific asset or assets (the asset); and (b) the arrangement conveys a right to use the asset. Management is currently assessing the impact of IFRIC 4 on the Group’s operations.
IFRIC 5, Rights to Interests arising from Decommissioning, Restoration and Environmental Rehabilitation Funds (effective from 1 January 2006) IFRIC 5 is not relevant to the Group’s operations.

42 43
3 Financial risk management
3.1 Financial risk factorsThe Group’s activities expose it to a variety of financial risks: market risk (price risk and currency risk), credit risk, liquidity risk and cash flow interest rate risk. The Group’s overall risk management programme focuses on the unpredictability of financial markets and seeks to minimise potential adverse effects on the Group’s financial performance.
Risk management is carried out by a central treasury department (Group Treasury) under policies approved by the Board of Directors. Group Treasury identifies, evaluates and hedges financial risks in close co-operation with the Group’s operating units. The Board provides written principles for overall risk management, as well as written policies covering specific areas, such as foreign exchange risk, interest rate risk, credit risk, use of derivative financial instruments and non-derivative financial instruments, and investment of excess liquidity.
The Group Treasury does not perform speculative transactions or transactions that are not related to the Group’s operations.
The Company’s and the Group’s financial instruments consist mainly of deposits with banks, bank overdrafts, trade accounts receivable and payable, loans to and from subsidiaries, associates, joint ventures, equity investments, dividends payable and leases obligations.
The Group’s overall risk management program focuses on the natural hedging in order to minimize the unpredictability of financial markets and seeks to minimize potential adverse effects on the Group’s financial performance.
The Group/Company does not use derivative financial instruments to hedge for risk exposures. The Group/Company does not participate in any financial instruments that could expose it foreign exchange and interest rates fluctuations.
a) Market Riski) Foreign exchange riskThe Group/Company operates internationally and is exposed to foreign exchange risk arising from various currency exposures, primarily with respect to the US dollar, Nigerian Naira, South African Rand, Indian Rupee, Norwegian Crone, Swedish Crone and the Russian rouble.
Entities in the Group use natural heading, transacted with the Group Treasury, to hedge their exposure to foreign currency risk in connection with the presentation currency.
The Group has certain investments in subsidiaries that operate in foreign countries, whose net positions are exposed to foreign exchange risk during the consolidation of their financial statements to the Group’s financial statements. The Group is not substantially exposed to this type of risk since most of its subsidiaries use Euro as their functional currency with the exception of the subsidiaries in Nigeria and Poland.
ii) Price riskThe Group is exposed to price variations due to fluctuations in PET prices as they change internationally. This risk is to a large extend limited because raw materials price fluctuations are absorbed by the customers through the selling price in the medium term. It is noted that the Group intends to sell off its participation in PET sector (VPI SA).
The Group is not exposed to risks from changes in the prices of equity securities since it does not own securities that can be characterised either as available for sale assets or financial assets recorded at fair value in the financial statements.
b) Credit riskThe Group/Company has policies in place to ensure that sales of products and services are made to customers with an appropriate credit history.
Trade accounts receivable consist mainly of a large, widespread customer base. All Group companies monitor the financial position of their debtors on an ongoing basis.
Where necessary, credit guarantee insurance cover is purchased. The granting of credit is controlled by credit limits and application of certain terms. Appropriate provision for impairment losses is made for specific credit risks. At the year-end management considered that there was no material credit risk exposure that had not already been covered by credit guarantee insurance or a doubtful debt provision. The Group and the Company do not use derivative financial products.
The Group and the Company have a significant concentration of credit risk exposures regarding cash and cash equivalent balance and revenues from the sale of products and merchandise. However, losses are not expected since sales are transacted with customers with good credit history and cash transactions are limited only to financial institutions with high quality credit credentials.
c) Liquidity riskPrudent liquidity risk management implies maintaining sufficient cash and the availability of funding through an adequate amount of committed credit facilities and the ability to close out adverse market positions.
Due to the dynamic nature of the underlying businesses, Group treasury aims at maintaining flexibility in funding by maintaining committed (exclusive) credit lines.
The Group manages liquidity risk by proper management of working capital and cash flows. It monitors forecasted cash flows and ensures that adequate banking facilities and reserve borrowing facilities are maintained. The Group has sufficient undrawn call/demand borrowing facilities that could be utilised to fund any potential shortfall in cash resources.

44 45
d) Interest-rate riskThe Group’s/Company’s income and operating cash flows are substantially independent of changes in market interest rates since the Group does not hold any interest bearing assets other than short-term time deposits. Exposure to interest rate risk on liabilities is limited to cash flow risk from changes in floating rates.
The Group continuously reviews interest rate trends and the tenure of financing needs. Consequently, all short, medium and long term borrowings are entered into at floating rates with re-evaluation dates in less than 6 months.
3.2 Fair value estimationThe nominal value less impairment provision of trade receivables is assumed to approximate their fair values. The fair value of financial liabilities for disclosure purposes is estimated by discounting the future contractual cash flows at the current market interest rate that is available to the Group for similar financial instruments.
4. Critical accounting estimates and judgementsEstimates and judgements are continually evaluated and are based on historical experience and other factors, including expectations of future events that are believed to be reasonable under current circumstances.
4.1 Critical accounting estimates and assumptionsThe Group makes estimates and assumptions concerning the future. The estimates and assumptions that have a significant risk of causing a material adjustment to the carrying amounts of assets and liabilities within the next financial year concern income tax.
Significant judgement is required by the Group Management in determining the worldwide provision for income taxes. There are many transactions and calculations for which the ultimate tax determination is uncertain. If the final tax outcome is different from the amounts that were initially recorded, such differences will impact the income tax and deferred tax.
4.2 Critical judgements in applying the entity’s accounting policiesThere are no areas that Management required to make critical judgements in applying accounting policies.
5. Transition to the IFRS
5.1 Basic Transition Principles to IFRS
5.1.1 First Time Adoption of IFRSThe Company’s and Group’s financial statements for the year ended December 31, 2005 are the first annual financial statements in accordance with IFRS. These financial statements have been prepared according to IFRS and the accounting principles mentioned in note 2. The Company and the Group have applied IFRS 1 for the preparation of the statements.
The Company’s and Group’s transition date to IFRS is January 1, 2004. Management prepared its opening IFRS balance sheet for the Company and the Group at that date. The presentation date of these financial statements is 31 December 2005. The IFRS implementation date for the Group and the Company is January 1, 2005.
In preparing these financial statements in accordance with IFRS 1, The Group and the Company have applied the mandatory exceptions and certain of the optional exemptions from full retrospective application of IFRS as explained below:
5.1.2 Optional Exemptions from full retrospective application adopted by Company and Group:
(a) Business combinationsBusiness combinations that took place prior to the transition date have not been restated; goodwill arising from business combinations, previously charged or credited directly against / to equity under Greek GAAP, has also not been restated.
(b) Fair value as deemed costCertain properties have been measured at their fair values as at the transition date.
(c) Employee benefitsAll cumulative actuarial gains and losses at the transition date relating to employee defined benefit plans have been fully recognised.
(d) Cumulative translation differences exemptionThe Group did not elect to reset cumulative translation differences previously recognised under Greek GAAP to zero although permitted by IFRS 1.(e) Compound financial instruments exemptionThis exemption has not been elected since the Company has not previously issued any compound financial instruments.
(f) Assets and liabilities of subsidiariesThis exemption is not applicable since the use of the exemption is made for a subsidiary entity that adopts IFRS at a date subsequent to the parent entity.
(g) Restatement of comparatives for IAS 32 and IAS 39Management has elected to apply this exemption. Accordingly, it applies previous Greek GAAP rules to financial assets and liabilities for the 2004 comparative information.

44 45
(h) Designation of financial assets and financial liabilitiesThe Company and Group did not make use of this exemption to reclassify various securities as available for sale investments and as financial assets at fair value through profit and loss since it did not hold any such securities.
(i) Share-based payment transactionsThe Company has elected to apply the share-based payment exemption. Accordingly, it applies IFRS 2 from the transition date and to all cash settled share-based payment transactions granted prior to 7 November 2002.
(j) Insurance contractsNot applicable since no insurance contracts exist.
(k) Decommissioning liabilities included in property, plant and equipmentThe Company and Group have not applied the exemption to recognize a provision in respect of environmental liabilities relating to contamination caused to land from the installation of assets and from its production processes because it does not apply.
(l) Fair value measurement of financial assets or liabilities upon initial recognitionThe Company has not applied the exemption offered by the revision of IAS 39 on the initial recognition of financial instruments measured at fair value through profit and loss because there is no active market since the Group and the Company do not hold such assets.
5.1.3 Mandatory Exceptions from full retrospective application followed by Company and Group
(a) De-recognition of financial assets and liabilitiesFinancial assets and liabilities derecognised prior to 1 January 2004 are not rerecognised under IFRS. This exception does not apply to these special purpose financial statement since there were no financial assets and liabilities previously derecognised under Hellenic GAAP that would not satisfy the de-recognition criteria under IAS 39.
(b) Hedge accountingHedge accounting is to be applied from 1 January 2005 only if the hedging relationship meets all hedge accounting conditions required by IAS 39. No adjustment was necessary to these financial statements since no derivative financial instruments existed for the Group and the Company.
(c) EstimatesEstimates under IFRS as each balance sheet date should be consistent with prior estimates made under previous Hellenic GAAP, unless there is evidence that were errors in those estimates.
(d) Assets held for sale and discontinued operationsIFRS 5 is to be applied from 1 January 2005. Therefore, any assets held for sale or discontinued operations must be recognised in accordance with IFRS 5 only from 1st January 2005.
Apart from its investment in the PET division (VPI SA), the sale of which was decided by the management in December 2005, the Group did not have any other assets or divisions held for sale that should have been recorded according to IFRS 5 for the years presented in the Financial Statements.
Reconciliations and descriptions of the effect of the transition from Hellenic GAAP to IFRS on the Company’s and Group’s equity, its net income and balance sheet are set out on pages 70-71.

46 47
A business segment is a group of assets and operations engaged in providing products or services that are subject to risks and returns that are different from those of other business segments.A geographical segment is engaged in providing products or services within a particular economic environment that are subject to risks and returns that are different from those of segments operating in other economic environments.
A. Analysis per business segments
1. Cool Operation2. Glass Operation3. Pet Operation4. Crown, Plastics & Vehicle operationThe discontinuing operations comprise to the Pet Operation of VPI SA
B. Analysis per Geographical segments
1. Europe2. Africa3. Asia & Oceania
The consolidated balance sheet and profit & loss accounts per business and geographical segments are described below:
Analysis per business & geographical segments
a) Analysis per Operation (in € 000’s)
Profit & Loss Account analysis
Continuing Operation
Cool Operation
GlassOperation
PetOperation
Crowns PlasticsVehicles
DiscontinuingOperation
Period end: 31/12/2005
Sales 306.829 247.443 29.244 7.796 22.346 82.953
Operating Profit 41.224 36.552 1.706 2.214 752 2.821
Finance costs -3.519 -681
Income tax expense -11.946 -691
Profit for the year 25.759
Depreciation 18.283 10.007 6.097 667 1.512 4.002
Period end: 31/12/2004
Sales 264.202 198.558 36.027 6.372 23.245 76.095
Operating Profit 32.038 27.279 3.074 2.351 -666 5.828
Finance costs -6.275 -790
Income tax expense -11.689 -1.682
Profit for the year 14.074
Depreciation 17.641 9.569 5.778 540 1.754 4.168
Balance Sheet TotalCool
OperationGlass
OperationPet
OperationCrowns Plastics
VehiclesDiscountinuing
Operation
Period end: 31/12/2005
Total Assets 361.912 204.651 55.851 6.898 27.960 66.552
Total Liabilities 207.338 129.951 14.462 333 25.702 36.890
Capital Expenditure 17.098 8.211 5.860 793 1.458 776
Period end: 31/12/2004
Total Assets 325.065 180.703 47.756 5.047 22.210 69.349
Total Liabilities 197.087 118.876 13.767 114 25.177 39.153
Capital Expenditure 31.530 17.062 8.822 2.185 1.561 1.900
Continuing Operation Discontinuing Operation
Period end: 31/12/2005 31/12/2004 31/12/2005 31/12/2004
Sales
Europe 208.266 176.493 82.953 76.095
Africa 76.025 74.331
Asia & Oceania 22.538 13.378
Total 306.829 264.202 82.953 76.095
Period end: 31/12/2005 31/12/2004 31/12/2005 31/12/2004
Total Assets
Europe 172.306 156.567 66.552 69.349
Africa 100.152 82.970
Asia & Oceania 22.902 16.179
Total 295.360 255.716 66.552 69.349
Capital Expenditure
Europe 7.136 16.649 776 1.900
Africa 7.831 12.465
Asia & Oceania 1.355 516
Total 16.322 29.630 776 1.900
c) Analysis per Geographical area (Country that customer is located) in € 000’s
Group Parent Company
Continuing Operations 2005 2004 2005 2004
Cool Operation
Europe 214.190 176.644 56.247 46.269
Africa 23.221 15.228 3.532 1.403
Asia 8.278 5.133 998 1.766
Other Countries 3.876 2.650 777 363
Total 249.565 199.655 61.554 49.801
Glass Operation
Africa 29.244 36.027
Total 29.244 36.027
Pet Operation
Africa 7.795 6.372
Total 7.795 6.372
Crown. Plastics & Vehicle operations
Europe 3.432 4.914
Africa 18.812 18.331
Asia 103 0
Total 22.347 23.245
Intergroup Sales -2.122 -1.097
Total Sales 306.829 264.202 61.554 49.801
b) Analysis per Geographical Area (Based on entity location) in € 000’s
Notes to the Financial Statements ( in € 000’s)Note 6 - Segment Information

46 47
Continuing Operation Discontinuing Operation
Period end: 31/12/2005 31/12/2004 31/12/2005 31/12/2004
Sales
Europe 208.266 176.493 82.953 76.095
Africa 76.025 74.331
Asia & Oceania 22.538 13.378
Total 306.829 264.202 82.953 76.095
Period end: 31/12/2005 31/12/2004 31/12/2005 31/12/2004
Total Assets
Europe 172.306 156.567 66.552 69.349
Africa 100.152 82.970
Asia & Oceania 22.902 16.179
Total 295.360 255.716 66.552 69.349
Capital Expenditure
Europe 7.136 16.649 776 1.900
Africa 7.831 12.465
Asia & Oceania 1.355 516
Total 16.322 29.630 776 1.900
c) Analysis per Geographical area (Country that customer is located) in € 000’s
Group Parent Company
Continuing Operations 2005 2004 2005 2004
Cool Operation
Europe 214.190 176.644 56.247 46.269
Africa 23.221 15.228 3.532 1.403
Asia 8.278 5.133 998 1.766
Other Countries 3.876 2.650 777 363
Total 249.565 199.655 61.554 49.801
Glass Operation
Africa 29.244 36.027
Total 29.244 36.027
Pet Operation
Africa 7.795 6.372
Total 7.795 6.372
Crown. Plastics & Vehicle operations
Europe 3.432 4.914
Africa 18.812 18.331
Asia 103 0
Total 22.347 23.245
Intergroup Sales -2.122 -1.097
Total Sales 306.829 264.202 61.554 49.801
b) Analysis per Geographical Area (Based on entity location) in € 000’s

48 49
For the Year endedDecember 2005 Land
Building & Technical
Works
MachineryTechnical
InstallationMotor
VehiclesFurniture & Fixture
Advances & Constructionin Progress Total
Historic Cost
Open Balance on 01/01/2005 7.465 55.420 151.866 3.226 8.041 7.909 233.927
Plus: Additions 734 6.901 447 1.096 6.052 15.230
Disposals -12 -1.240 -165 -116 -750 -2.283
Transfers from work in progress 3.271 3.988 11 31 -7.301
Transfer to / from & reclassification 63 699 18 184 -1.065 -101
Exchange Differences 555 212 9.461 278 480 280 11.266
Impairment Charge -230 -230
Assets held for sale -1.504 -8.783 -49.868 -80 -987 -75 -61.297
Closing Balance on 31/12/2005 6.516 50.905 121.577 3.735 8.729 5.050 196.512
Depreciation
Open Balance on 01/01/2005 30 10.123 64.191 1.912 5.718 81.974
Plus: Additions 2.350 16.231 501 1.105 20.187
Disposals -47 -1.231 -127 -111 -1.516
Transfers from work in progress -119 7 112
Exchange Differences -18 -1.499 4.545 163 390 3.581
Assets held for sale -2.162 -21.503 -47 -699 -24.411
Total Charge of the year -18 -1.358 -2.077 497 797 -2.159
Closing Balance on 31/12/2005 12 8.765 62.114 2.409 6.515 79.815
Net Book Value on 31/12/2005 6.504 42.140 59.463 1.326 2.214 5.050 116.697
Historic Cost (For the Year ended December 2004)
Open Balance on 01/01/2004 8.280 57.956 141.198 3.148 10.159 10.164 230.905
Plus: Additions 1.983 14.118 582 754 10.908 28.345
Disposals -117 -2.957 -4.207 -276 -630 -552 -8.739
Transfers from work in progress 1.103 9.739 21 104 -11.705 -738
Transfer to / from & reclassification -95 48 715 52 -326 -774 -380
Exchange Differences -460 -52 -1.712 -59 -33 28 -2.288
Reorganisation of subsidiaries -143 -2.661 -7.985 -242 -1.987 -160 -13.178
Closing balance on 31/12/2004 7.465 55.420 151.866 3.226 8.041 7.909 233.927
Depreciation
Open Balance on 01/01/2004 29 12.004 58.774 1.896 7.381 80.084
Plus: Additions 2.026 15.100 463 1.028 18.617
Disposals -2.957 -4.152 -261 -519 -7.889
Transfer to / from & reclassification 230 33 -273 -10
Exchange Differences 1 -76 -670 -35 -20 -800
Reorganisation of subsidiaries -874 -5.091 -184 -1.879 -8.028
Total Charge of the year 1 -1.881 5.417 16 -1.663 1.890
Closing balance on 31/12/2004 30 10.123 64.191 1.912 5.718 81.974
Net Book Value on 31/12/2004 7.435 45.297 87.675 1.314 2.323 7.909 151.95
Group
Discontinuing Operations 2005 2004
Pet Operation (Discontinuing Operations)
Europe 78.563 74.986
Africa 1.150 327
Asia 1.742 37
Other Countries 1.498 745
Total Pet Operation 82.953 76.095
Total Sales
Europe 217.622 181.558 56.247 46.269
Africa 79.072 75.958 3.532 1.403
Asia 8.304 5.133 998 1.766
Other Countries 3.953 2.650 777 363
Total Sales 308.951 265.299 61.554 49.801
Intergroup sales -2.122 -1.097
Total Group (Continuing Operations) 306.829 264.202 61.554 49.801
Group Parent Company
Continuing Operations 2005 2004 2005 2004
c) Analysis per Geographical area (Country where customer is located) in € 000’s (continued from previous page)
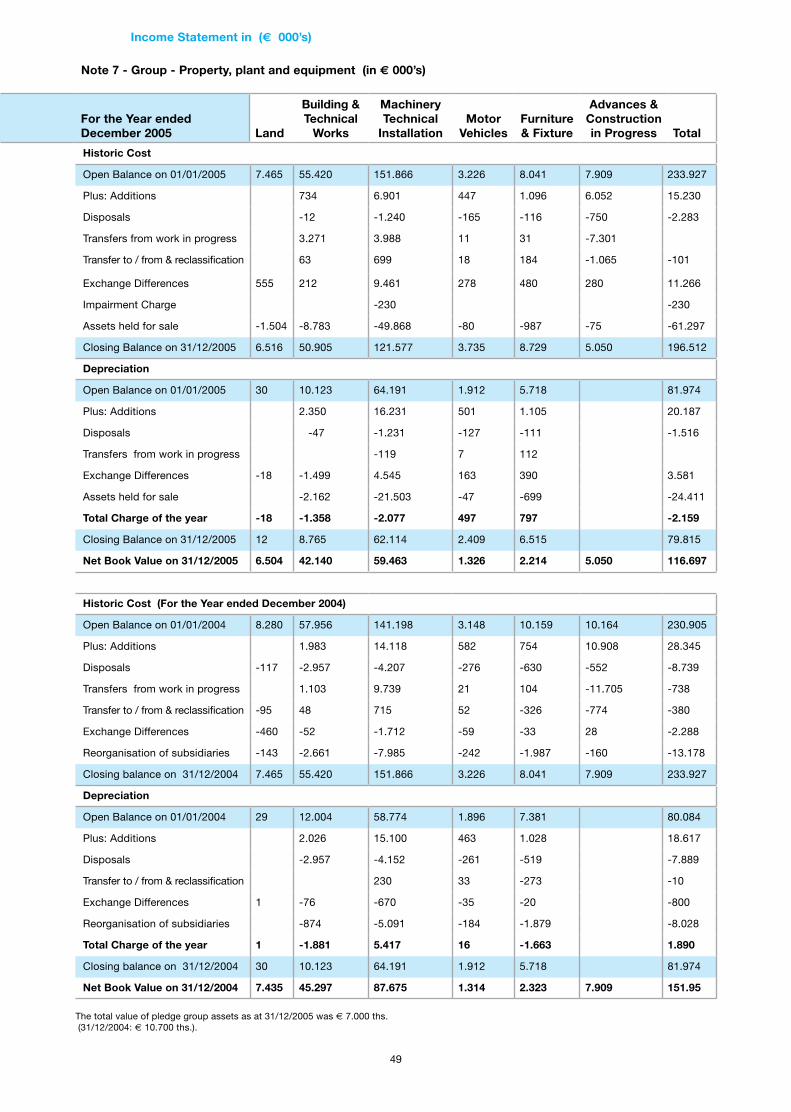
48 49
Note 7 - Group - Property, plant and equipment (in € 000’s)
The total value of pledge group assets as at 31/12/2005 was € 7.000 ths. (31/12/2004: € 10.700 ths.).
For the Year endedDecember 2005 Land
Building & Technical
Works
MachineryTechnical
InstallationMotor
VehiclesFurniture & Fixture
Advances & Constructionin Progress Total
Historic Cost
Open Balance on 01/01/2005 7.465 55.420 151.866 3.226 8.041 7.909 233.927
Plus: Additions 734 6.901 447 1.096 6.052 15.230
Disposals -12 -1.240 -165 -116 -750 -2.283
Transfers from work in progress 3.271 3.988 11 31 -7.301
Transfer to / from & reclassification 63 699 18 184 -1.065 -101
Exchange Differences 555 212 9.461 278 480 280 11.266
Impairment Charge -230 -230
Assets held for sale -1.504 -8.783 -49.868 -80 -987 -75 -61.297
Closing Balance on 31/12/2005 6.516 50.905 121.577 3.735 8.729 5.050 196.512
Depreciation
Open Balance on 01/01/2005 30 10.123 64.191 1.912 5.718 81.974
Plus: Additions 2.350 16.231 501 1.105 20.187
Disposals -47 -1.231 -127 -111 -1.516
Transfers from work in progress -119 7 112
Exchange Differences -18 -1.499 4.545 163 390 3.581
Assets held for sale -2.162 -21.503 -47 -699 -24.411
Total Charge of the year -18 -1.358 -2.077 497 797 -2.159
Closing Balance on 31/12/2005 12 8.765 62.114 2.409 6.515 79.815
Net Book Value on 31/12/2005 6.504 42.140 59.463 1.326 2.214 5.050 116.697
Historic Cost (For the Year ended December 2004)
Open Balance on 01/01/2004 8.280 57.956 141.198 3.148 10.159 10.164 230.905
Plus: Additions 1.983 14.118 582 754 10.908 28.345
Disposals -117 -2.957 -4.207 -276 -630 -552 -8.739
Transfers from work in progress 1.103 9.739 21 104 -11.705 -738
Transfer to / from & reclassification -95 48 715 52 -326 -774 -380
Exchange Differences -460 -52 -1.712 -59 -33 28 -2.288
Reorganisation of subsidiaries -143 -2.661 -7.985 -242 -1.987 -160 -13.178
Closing balance on 31/12/2004 7.465 55.420 151.866 3.226 8.041 7.909 233.927
Depreciation
Open Balance on 01/01/2004 29 12.004 58.774 1.896 7.381 80.084
Plus: Additions 2.026 15.100 463 1.028 18.617
Disposals -2.957 -4.152 -261 -519 -7.889
Transfer to / from & reclassification 230 33 -273 -10
Exchange Differences 1 -76 -670 -35 -20 -800
Reorganisation of subsidiaries -874 -5.091 -184 -1.879 -8.028
Total Charge of the year 1 -1.881 5.417 16 -1.663 1.890
Closing balance on 31/12/2004 30 10.123 64.191 1.912 5.718 81.974
Net Book Value on 31/12/2004 7.435 45.297 87.675 1.314 2.323 7.909 151.95
Income Statement in (€ 000’s)
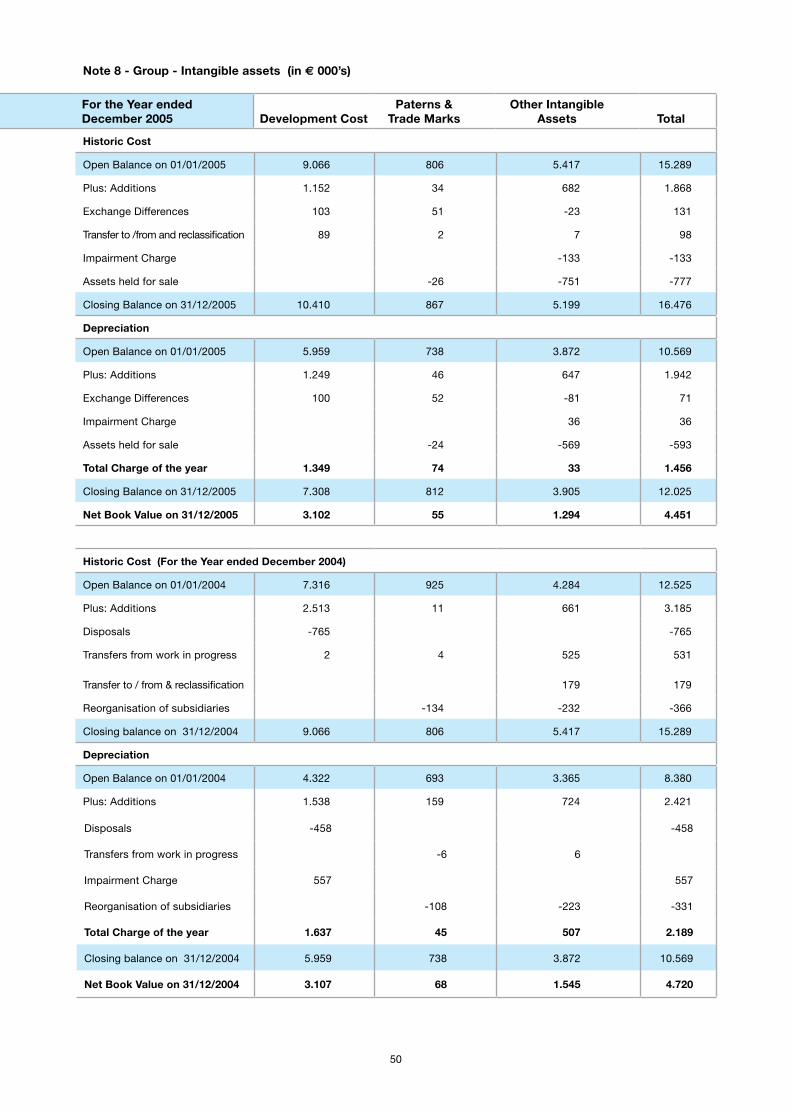
50 51
For the Year endedDecember 2005 Development Cost
Paterns & Trade Marks
Other Intangible Assets Total
Historic Cost
Open Balance on 01/01/2005 9.066 806 5.417 15.289
Plus: Additions 1.152 34 682 1.868
Exchange Differences 103 51 -23 131
Transfer to /from and reclassification 89 2 7 98
Impairment Charge -133 -133
Assets held for sale -26 -751 -777
Closing Balance on 31/12/2005 10.410 867 5.199 16.476
Depreciation
Open Balance on 01/01/2005 5.959 738 3.872 10.569
Plus: Additions 1.249 46 647 1.942
Exchange Differences 100 52 -81 71
Impairment Charge 36 36
Assets held for sale -24 -569 -593
Total Charge of the year 1.349 74 33 1.456
Closing Balance on 31/12/2005 7.308 812 3.905 12.025
Net Book Value on 31/12/2005 3.102 55 1.294 4.451
Historic Cost (For the Year ended December 2004)
Open Balance on 01/01/2004 7.316 925 4.284 12.525
Plus: Additions 2.513 11 661 3.185
Disposals -765 -765
Transfers from work in progress 2 4 525 531
Transfer to / from & reclassification 179 179
Reorganisation of subsidiaries -134 -232 -366
Closing balance on 31/12/2004 9.066 806 5.417 15.289
Depreciation
Open Balance on 01/01/2004 4.322 693 3.365 8.380
Plus: Additions 1.538 159 724 2.421
Disposals -458 -458
Transfers from work in progress -6 6
Impairment Charge 557 557
Reorganisation of subsidiaries -108 -223 -331
Total Charge of the year 1.637 45 507 2.189
Closing balance on 31/12/2004 5.959 738 3.872 10.569
Net Book Value on 31/12/2004 3.107 68 1.545 4.720
For the Year endedDecember 2005 Land
Building & Technical
Works
MachineryTechnical
InstallationMotor
VehiclesFurniture & Fixture
Advances & Constructionin Progress Total
Note 8 - Group - Intangible assets (in € 000’s)

50 51
Historic Cost
Open Balance on 01/01/2005 303 8.456 12.756 294 2.478 99 24.386
Plus: Additions 223 826 50 557 349 2.005
Intergroup: Purchases/ <Disposals> -56 -45 -101
Disposals -25 -6 -31
Transfers from work in progress 69 20 -100 -11
Transfer to / from & reclassification -52 52
Closing Balance on 31/12/2005 303 8.654 13.543 390 3.010 348 26.248
Depreciation
Open Balance on 01/01/2005 347 7.120 250 1.971 9.688
Plus: Additions 387 1.393 36 319 2.135
Disposals -10 -1 -11
Intergroup:Purchases/ <Disposals> -3 -44 -47
Transfer to / from & reclassification 10 1 -11
Total Charge of the year 377 1.400 36 264 2.077
Closing Balance on 31/12/2005 724 8.520 286 2.235 11.765
Net Book Value on 31/12/2005
303 7.930 5.023 104 775 348 14.483
Historic Cost (For the Year ended December 2004)
Open Balance on 01/01/2004 303 8.168 12.348 277 2.262 166 23.524
Plus: Additions 276 729 17 219 1.633 2.874
Disposals -1.593 -56 -1.649
Transfers from work in progress 12 1.272 53 -1.700 -363
Closing balance on 31/12/2004 303 8.456 12.756 294 2.478 99 24.386
Depreciation
Open Balance on 01/01/2004 20 6.783 212 1.761 8.776
Plus: Additions 327 1.290 35 266 1.918
Disposals -953 3 -56 -1.006
Total Charge of the year 327 337 38 210 912
Closing balance on 31/12/2004 347 7.120 250 1.971 9.688
Net Book Value on 31/12/2004 303 8.109 5.636 44 507 99 14.698
For the Year endedDecember 2005 Land
Building & Technical
Works
MachineryTechnical
InstallationMotor
VehiclesFurniture & Fixture
Advances & Constructionin Progress Total
There are no pledged assets for the parent company
Note 7 - Parent Company - Property, plant and equipment (in € 000’s)

52 53
Historic Cost
Open Balance on 01/01/2005 6.192 35 3.381 9.608
Plus: Additions 941 633 1.574
Transfers from work in progress 7 7
Transfer to / from & reclassification 2 1 3
Closing Balance on 31/12/2005 7.135 35 4.022 11.192
Depreciation
Open Balance on 01/01/2005 3.682 35 2.730 6.447
Plus: Additions 984 351 1.335
Transfer to / from& reclassification 2 1 3
Total Charge of the year 986 352 1.338
Closing Balance on 31/12/2005 4.668 35 3.082 7.785
Net Book Value on 31/12/2005 2.467 940 3.407
Historic Cost (For the Year ended December 2004)
Open Balance on 01/01/2004 4.553 35 2.933 7.521
Plus: Additions 1.896 448 2.344
Disposals -257 -257
Closing balance on 31/12/2004 6.192 35 3.381 9.608
Depreciation
Open Balance on 01/01/2004 2.680 35 2.215 4.930
Plus: Additions 1.055 515 1.570
Disposals -53 -53
Total Charge of the year 1.002 515 1.517
Closing balance on 31/12/2004 3.682 35 2.730 6.447
Net Book Value on 31/12/2004 2.510 651 3.161
For the Year endedDecember 2005 Development Cost
Paterns & Trade Marks
Other Intangible Assets Total
Note 9 - Group - Deferred Income Tax (in € 000’s)
For the Year ended December 2005
Deferred Tax AssetProvisions
& LiabilitiesTax losses
carry forwardImpairment of Assets
Pensions & Employee Benefit Plan Other Total
Open Balance on 01/01/2005 754 67 884 462 2.167
Charged /<credited> to P&L 1.503 30 5 339 83 1.960
Charged to equity 391 391
Assets held for sale -60 -100 -250 -410
Exchange Differences -27 -27
Closing Balance on 31/12/2005 2.230 37 5 1.514 295 4.081
Deferred Tax Liabilities
Acceleratedtax
depreciationFair value
GainsAsset
RevaluationIncome tax at
preferential rates Other Total
Open Balance on 01/01/2005 8.268 2.436 1.879 12.583
Charged /<credited> to P&L 175 -231 454 398
Assets held for sale -602 -471 -405 -1.478
Exchange Differences 1.010 1.010
Closing Balance on31/12/2005 8.851 1.734 1.928 12.513
Net Deferred Income Tax Asset (liability) -6.621 37 -1.729 1.514 1.633 -8.432
Deferred Tax AssetProvisions
& LiabilitiesTax losses
carry forwardImpairment of Assets
Pensions & Employee Benefit Plan Other Total
Note 8 - Parent Company - Intangible assets (in € 000’s)

52 53
Deferred Tax Liabilities
Acceleratedtax
depreciationFair value
GainsAsset
RevaluationIncome tax at
preferential rates Other Total
Open Balance on 01/01/2005 8.268 2.436 1.879 12.583
Charged /<credited> to P&L 175 -231 454 398
Assets held for sale -602 -471 -405 -1.478
Exchange Differences 1.010 1.010
Closing Balance on31/12/2005 8.851 1.734 1.928 12.513
Net Deferred Income Tax Asset (liability) -6.621 37 -1.729 1.514 1.633 -8.432
Closing Balance at: 31/12/2005 31/12/2004
Deferred tax assets 1.241 814
Deferred tax liabilities 9.673 11.230
Net Deferred Income Tax Asset (liability) -8.432 -10.416
Deferred income tax assets and liabilities are offset when there is a legally enforceable right to offset current tax assets against tax liabilities and when the deferred income taxes relate to the same fiscal authority. This offset took place for the Parent Company, and for the subsidiaries of the Group (VPI SA & Scandinavian Appliances).
Open balance on 01/01/2004 930 1.271 150 104 2.455
Charged/<credited> to P&L -176 -1.027 734 358 -111
Charged to equity -68 -68
Exchange Differences -109 -109
Closing Balance on 31/12/2004 754 67
884 462 2.167
Deferred Tax LiabilitiesAccelerated
tax depreciation
Fair value Gains
Asset Revaluation
Income tax at preferential rates Other Total
Open balance on 01/01/2004 7.835 3.381 1.240 12.456
Charged/<credited> to P&L 659 -439 626 846
Charged to equity 3 13 16
Disposal of subsidiary -509 -509
Exchange Differences -226 -226
Closing Balance on 31/12/2004 8.268 2.436 1.879 12.583
Net Deferred Income Tax Asset (liability) -7.514 67 -2.436 884 -1.417 10.416
Deferred Tax AssetProvisions
& LiabilitiesTax losses
carry forwardImpairment of Assets
Pensions & Employee Benefit Plan Other Total
For the Year ended December 2004
For the Year ended December 2005
Note 9 - Group - Deferred Income Tax (in € 000’s) (continuing from previous page)
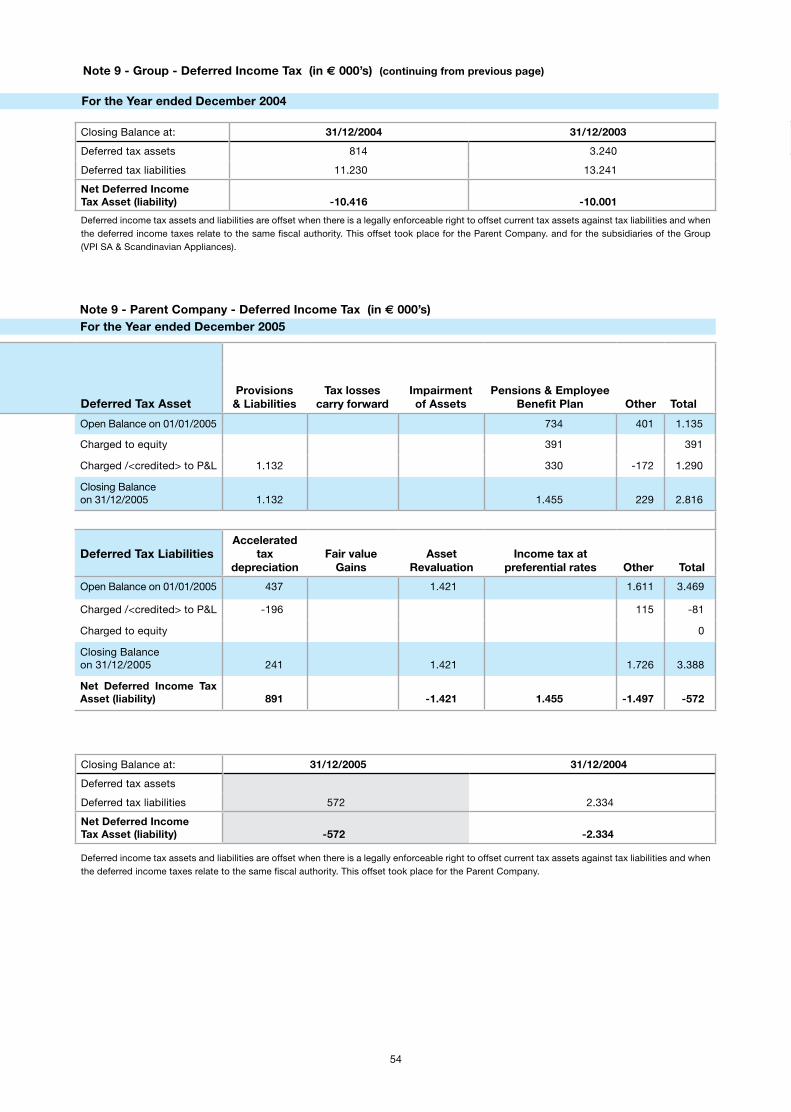
54 55
For the Year ended December 2005Note 9 - Parent Company - Deferred Income Tax (in € 000’s)
Closing Balance at: 31/12/2004 31/12/2003
Deferred tax assets 814 3.240
Deferred tax liabilities 11.230 13.241
Net Deferred Income Tax Asset (liability) -10.416 -10.001
Deferred income tax assets and liabilities are offset when there is a legally enforceable right to offset current tax assets against tax liabilities and when the deferred income taxes relate to the same fiscal authority. This offset took place for the Parent Company. and for the subsidiaries of the Group (VPI SA & Scandinavian Appliances).
Open Balance on 01/01/2005 734 401 1.135
Charged to equity 391 391
Charged /<credited> to P&L 1.132 330 -172 1.290
Closing Balanceon 31/12/2005 1.132 1.455 229 2.816
Deferred Tax LiabilitiesAccelerated
tax depreciation
Fair value Gains
Asset Revaluation
Income tax at preferential rates Other Total
Open Balance on 01/01/2005 437 1.421 1.611 3.469
Charged /<credited> to P&L -196 115 -81
Charged to equity 0
Closing Balance on 31/12/2005 241 1.421 1.726 3.388
Net Deferred Income Tax Asset (liability) 891 -1.421 1.455 -1.497 -572
Deferred Tax AssetProvisions
& LiabilitiesTax losses
carry forwardImpairment of Assets
Pensions & Employee Benefit Plan Other Total
Closing Balance at: 31/12/2005 31/12/2004
Deferred tax assets
Deferred tax liabilities 572 2.334
Net Deferred Income Tax Asset (liability) -572 -2.334
Deferred income tax assets and liabilities are offset when there is a legally enforceable right to offset current tax assets against tax liabilities and when the deferred income taxes relate to the same fiscal authority. This offset took place for the Parent Company.
Group Parent Company
Inventories 31/12/2005 31/12/2004 31/12/2005 31/12/2004
Deferred Tax AssetProvisions
& LiabilitiesTax losses
carry forwardImpairment of Assets
Pensions & Employee Benefit Plan Other Total
For the Year ended December 2004
Note 9 - Group - Deferred Income Tax (in € 000’s) (continuing from previous page)

54 55
For the Year ended December 2004
Note 10 - Inventories (in € 000’s)
Group Parent Company
Inventories 31/12/2005 31/12/2004 31/12/2005 31/12/2004
Raw Materials 48.079 44.974 3.371 4.471
Work in progress 3.462 2.323 1.043 521
Finished goods 36.793 33.260 5.250 6.309
Less: Provisions -7.117 -5.567 -393 -674
Total Inventories 81.217 74.990 9.271 10.627
Note 11 - Trade debtors (in € 000’s)
Trade Debtors 31/12/2005 31/12/2004 31/12/2005 31/12/2004
Trade Debtors 52.120 62.884 9.710 6.999
Less: Provisions for impairment of receivables -2.333 -3.318 -247 -292
Total Trade Debtors 49.787 59.566 9.463 6.707
Open balance on 01/01/2004
Charged /<credited> to P&L 734 401 1.135
Closing Balance on 31/12/2004 734 401 1.135
Deferred Tax LiabilitiesAccelerated
tax depreciation
Fair value Gains
Asset Revaluation
Income tax at preferential rates Other Total
Open balance on 01/01/2004 1.421 872 2.293
Charged /<credited> to P&L 437 739 1.176
Closing Balance on 31/12/2004 437 1.421
1.611 3.469
Net Deferred Income Tax Asset (liability) -437 -1.421 734 1.210 -2.334
Deferred Tax AssetProvisions
& LiabilitiesTax losses
carry forwardImpairment of Assets
Pensions & Employee Benefit Plan Other Total
Closing Balance at: 31/12/2004 31/12/2003
Deferred tax assets
Deferred tax liabilities 2.334 2.293
Net Deferred Income Tax Asset (liability) -2.334 -2.293
Deferred income tax assets and liabilities are offset when there is a legally enforceable right to offset current tax assets against tax liabilities and when the deferred income taxes relate to the same fiscal authority. This offset took place for the Parent Company.
Note 9 - Parent Company - Deferred Income Tax (in € 000’s)
The fair value of trade debtors closely approximate their carrying value. The Group and the company have a significant concentration of credit risk with specific customers.
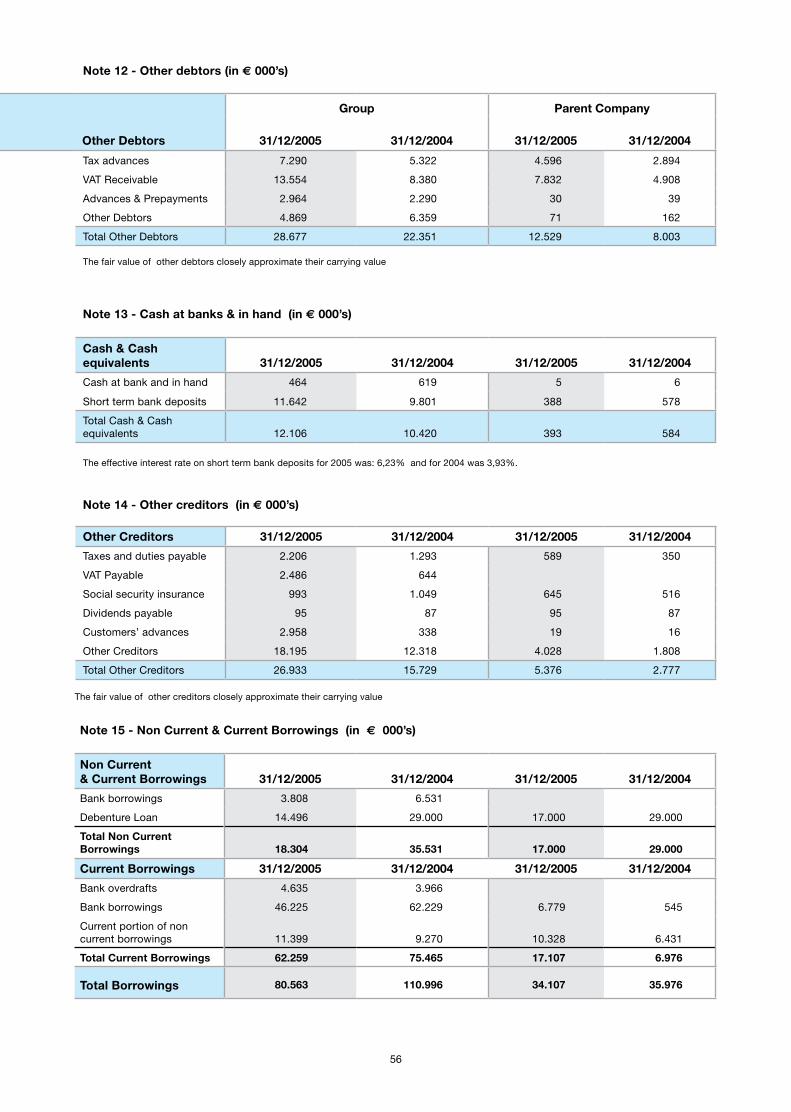
56 57
Tax advances 7.290 5.322 4.596 2.894
VAT Receivable 13.554 8.380 7.832 4.908
Advances & Prepayments 2.964 2.290 30 39
Other Debtors 4.869 6.359 71 162
Total Other Debtors 28.677 22.351 12.529 8.003
The fair value of other debtors closely approximate their carrying value
Note 13 - Cash at banks & in hand (in € 000’s)
Cash & Cash equivalents 31/12/2005 31/12/2004 31/12/2005 31/12/2004
Cash at bank and in hand 464 619 5 6
Short term bank deposits 11.642 9.801 388 578
Total Cash & Cash equivalents 12.106 10.420 393 584
The effective interest rate on short term bank deposits for 2005 was: 6,23% and for 2004 was 3,93%.
Note 14 - Other creditors (in € 000’s)
Other Creditors 31/12/2005 31/12/2004 31/12/2005 31/12/2004
Taxes and duties payable 2.206 1.293 589 350
VAT Payable 2.486 644
Social security insurance 993 1.049 645 516
Dividends payable 95 87 95 87
Customers’ advances 2.958 338 19 16
Other Creditors 18.195 12.318 4.028 1.808
Total Other Creditors 26.933 15.729 5.376 2.777
The fair value of other creditors closely approximate their carrying value
Note 15 - Non Current & Current Borrowings (in € 000’s)
Non Current & Current Borrowings 31/12/2005 31/12/2004 31/12/2005 31/12/2004
Bank borrowings 3.808 6.531
Debenture Loan 14.496 29.000 17.000 29.000
Total Non Current Borrowings 18.304 35.531 17.000 29.000
Current Borrowings 31/12/2005 31/12/2004 31/12/2005 31/12/2004
Bank overdrafts 4.635 3.966
Bank borrowings 46.225 62.229 6.779 545
Current portion of non current borrowings 11.399 9.270 10.328 6.431
Total Current Borrowings 62.259 75.465 17.107 6.976
Total Borrowings 80.563 110.996 34.107 35.976
Group Parent Company
Other Debtors 31/12/2005 31/12/2004 31/12/2005 31/12/2004
31/12/2005 31/12/2004
Group Group
Current Borrowings
Non Current Borrowings Total
Current Borrowings
Non Current Borrowings Total
Note 12 - Other debtors (in € 000’s)
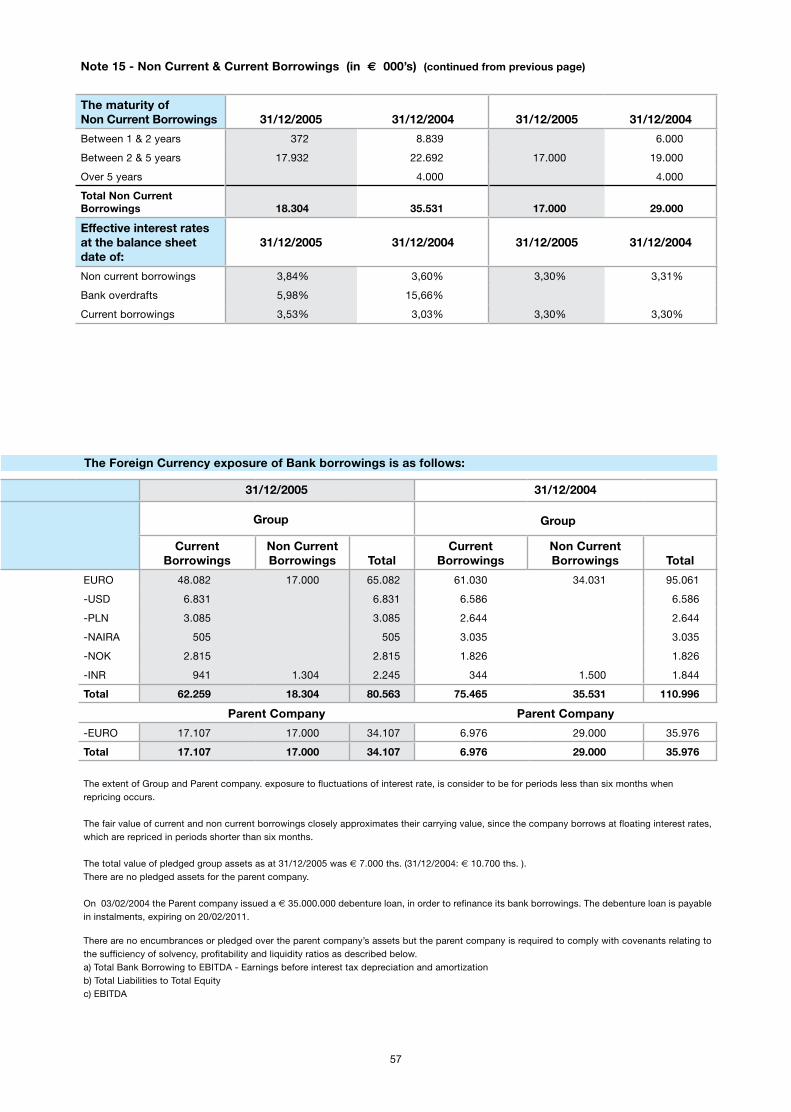
56 57
Note 15 - Non Current & Current Borrowings (in € 000’s) (continued from previous page)
The maturity of Non Current Borrowings 31/12/2005 31/12/2004 31/12/2005 31/12/2004
Between 1 & 2 years 372 8.839 6.000
Between 2 & 5 years 17.932 22.692 17.000 19.000
Over 5 years 4.000 4.000
Total Non Current Borrowings 18.304 35.531 17.000 29.000
Effective interest rates at the balance sheet date of:
31/12/2005 31/12/2004 31/12/2005 31/12/2004
Non current borrowings 3,84% 3,60% 3,30% 3,31%
Bank overdrafts 5,98% 15,66%
Current borrowings 3,53% 3,03% 3,30% 3,30%
EURO 48.082 17.000 65.082 61.030 34.031 95.061
-USD 6.831 6.831 6.586 6.586
-PLN 3.085 3.085 2.644 2.644
-NAIRA 505 505 3.035 3.035
-NOK 2.815 2.815 1.826 1.826
-INR 941 1.304 2.245 344 1.500 1.844
Total 62.259 18.304 80.563 75.465 35.531 110.996
Parent Company Parent Company
-EURO 17.107 17.000 34.107 6.976 29.000 35.976
Total 17.107 17.000 34.107 6.976 29.000 35.976
The extent of Group and Parent company. exposure to fluctuations of interest rate, is consider to be for periods less than six months when repricing occurs.
The fair value of current and non current borrowings closely approximates their carrying value, since the company borrows at floating interest rates, which are repriced in periods shorter than six months.
The total value of pledged group assets as at 31/12/2005 was € 7.000 ths. (31/12/2004: € 10.700 ths. ).There are no pledged assets for the parent company.
On 03/02/2004 the Parent company issued a € 35.000.000 debenture loan, in order to refinance its bank borrowings. The debenture loan is payable in instalments, expiring on 20/02/2011.
There are no encumbrances or pledged over the parent company’s assets but the parent company is required to comply with covenants relating to the sufficiency of solvency, profitability and liquidity ratios as described below.a) Total Bank Borrowing to EBITDA - Earnings before interest tax depreciation and amortizationb) Total Liabilities to Total Equityc) EBITDA
31/12/2005 31/12/2004
Group Group
Current Borrowings
Non Current Borrowings Total
Current Borrowings
Non Current Borrowings Total
The Foreign Currency exposure of Bank borrowings is as follows:

58 59
Retirement Benefit 13.123 11.346 5.821 4.083
Pension Plan 365 -20
Total Retirement Benefit Obligations 13.488 11.326 5.821 4.083
The movement of the retirement benefit obligation during the period is as follows:
Opening Balance 11.683 9.155 4.083 3.494
Exchange difference -357 -167
Opening Balance as restated 11.326 8.988 4.083 3.494
Additional provision for the period 3.177 4.698 1.666 1.471
Unused amounts reversed -94 -491 -185 -144
Charged to income statement 3.083 4.207 1.481 1.327
Utilized during the year -2.492 -1.637 -1.308 -738
Liabilities associated with assets classified as held for sale -398
Recognized actuarial <gain> / losses 1.565 1.565
Exchange Difference 404 -232
Closing Balance 13.488 11.326 5.821 4.083
A. Retirement Benefit 31/12/2005 31/12/2004 31/12/2005 31/12/2004
The amounts recognized in the balance sheet are as follows:
Present Value of obligations 13.559 11.361 5.880 4.083
Fair value of plan assets -14 -20
13.545 11.341 5.880 4.083
Immediate recognition of (Asset)/ Obligation as Transition 5
Recognized actuarial losses / (gain) 5
Unrecognized past service cost -59 -59
Liabilities associated with assets classifiedas held for sale -368
Net Liability in the balance sheet 13.123 11.346 5.821 4.083
The amounts recognized in the income statement are determined as follows:
Current service cost 962 1.426 487 352
Interest Cost 961 2.198 205 175
Expected return on plan assets -54
Recognized past service cost 12
Regular P & L charge 1.869 3.636 692 527
Additional Cost of Extra Benefits 974 721 974 719
Other Expenses (income) -145 243 225
Total P & L charge 2.698 4.600 1.666 1.471
Movement in the Net Liability recognized in the Balance Sheet
Net Liability in BS at the beginning of the period 11.618 9.155 4.083 3.494
Exchange differences -357 -167
11.261 8.988 4.083 3.494
Group Parent Company
Retirement Benefit Obligations 31/12/2005 31/12/2004 31/12/2005 31/12/2004
Note 16 - Retirement Benefit Obligations (in € 000’s)

58 59
A. Retirement Benefit 31/12/2005 31/12/2004 31/12/2005 31/12/2004
Movement in the Net Liability recognized in the Balance Sheet
Actual Contributions paid -1.556 -1.287 -1.493
Benefits paid directly -1.411 -723 -882
Total expenses recognized in the income statement 2.698 4.600 1.666 1.471
Recognized actuarial <gain> / loss charged directly to equity 1.565 1.565
Exchange difference 934 -232
Net Liability in BS at the closing of the period 13.491 11.346 5.821 4.083
Liabilities associated with assets classified as held for sale -368
Net Liability in BS at the closing of the period 13.123 11.346 5.821 4.083
Assumptions
Discount Rate 11,49% 11,88% 5,00% 5,00%
Rate of compensation increase 10,49% 9,98% 5,00% 4,50%
Average future working life 15,30 15,78 19,05 19,05
B- Pension Plan 31/12/2005 31/12/2005 31/12/2005 31/12/2005
The amounts recognized in the balance sheet are as follows:
Present Value of obligations 710 326
Fair value of plan assets -405 -302
305 24
Recognized actuarial <gain> / loss charged directly to equity 48 -44
Unrecognized past service cost 12
Net Liability / (Asset) in the balance sheet 365 -20
The amounts recognized in the income statement are determined as follows:
Current service cost 282 84
Interest Cost 28 4
Expected return on plan assets -17 -6
Recognized actuarial <gain> / loss 120 1
Recognized past service cost 51
Regular P & L charge 464 83
Other Expenses (income) 15 15
Total P & L charge 479 98
Movement in the Net Liability recognized in the Balance Sheet
Net Liability in BS at the beginning of the period 65
Exchange Difference -30
35
Benefits paid directly -149 -118
Total expenses recognized in the income statement 479 98
Net Liability/ (Asset) in BS at the closing of the period 365 -20
Assumptions
Discount Rate 5,16% 5,16%
Expected return on plan asset 5,28% 5,28%
Rate of compensation increase 4,47% 4,47%
Interest on advances 2,46% 2,46%
Average future working life 11,39 11,39
Note 16 - Retirement Benefit Obligations (in € 000’s) (continued from previous page)

60 61
Group Parent Company
31/12/2005 31/12/2004 31/12/2005 31/12/2004
a) Provision for Stock Option Plan (Phantom Option Plan) 2.356 458 2.356 458
b) Provisions for warranty 2.310 1.623 340 200
c) Other Provisions 1.755 1.298 766 374
Total provision for other liabilities and charges 6.421 3.379 3.462 1.032
a) Provision for Stock Option Plan
Opening Balance as restated 458 107 458 107
Additional provision for the period 1.898 351 1.898 351
Charged to income statement 1.898 351 1.898 351
Closing Balance 2.356 458 2.356 458
The following table summarizes information for Stock Appreciation Right (SARs Phantom Option Plan)
Phantom Option Plan Exercise Price
Vestin status 31/12/2005
Start of exer-cise period
End of exercise period
Number of SARs outstanding (in ths)
2001 5,70 Fully Vested 01/01/2003 31/12/2005
2002 3,25 Fully Vested 01/01/2004 31/12/2006 60
2003 A 1,60 Fully Vested 01/01/2005 31/12/2007 332
2003 B 3,60 Fully Vested 01/01/2005 31/12/2007 17
2004 3,70 none 01/01/2006 31/12/2008 281
2005 3,37 none 01/01/2007 31/12/2009 380
Total 1.071
A summary of the movement for the SARs is presented below :
Number of SARs 2005 (in ths.)
Weighted average exercise price 2005
Number of SARs 2004
Weighted average exercise price 2004 (in ths.)
Outstanding on 1 January 959 2,99 651 2,65
Granted 411 3,37 308 3,70
Exercised / Cancelled -299 7,07
Outstanding on 31 December 1.071 2,90 959 2,99
Exercisable on 31 December 409 1,92 253 4,16
The compensation expense relating to SARs recorded for 2005 amounted to € 774 ths. (2004: 0)
The company operates a phantom share option scheme for its senior executives in the form of Stock Appreciation Rights depending on their perform-ance, employment period in the company, and their positions’ responsibilities. The terms of the SARs are based upon the basic terms and conditions of stock option plans except that instead of shares the holders receive a payment equal to the difference between the market price of the company’s shares at the date of exercise and the exercise price. The options are subject to a two - year vesting condition after granting and may be exercised during a period of three years after vesting.
Group Parent Company
b) Provisions for warranty 31/12/2005 31/12/2004 31/12/2005 31/12/2004
Companies 31/12/2005 31/12/2004 Countries
Note 17 - Provision for Other liabilities & charges (in € 000’s)

60 61
Note 18 - Parent Company - Investments in subsidiaries (in € 000’s)
Opening Balance as restated 1.623 759 200 200
Additional provision for the period 715 910 140
Unused amounts reversed -73 -91
Charged to income statement 642 819 140
Utilized during the year -1
Exchange Difference 45 46
Closing Balance 2.310 1.623 340 200
c) Other Provisions
Opening Balance as restated 1.298 842 374 6
Additional provision for the period 692 659 392 374
Unused amounts reversed -62 -23 -6
Charged to income statement 630 636 392 368
Utilized during the year -165 -251
Exchange Difference -8 71 -
Closing Balance 1.755 1.298 766 374
The category “Other provisions” includes mainly : provisions for discount on sales, provisions for unused paid holidays, sales on tax and provisions for obsolete fix assets.
Total provisions for other liabilities and charges (a+b+c) 6.421 3.379 3.462 1.032
Group Parent Company
b) Provisions for warranty 31/12/2005 31/12/2004 31/12/2005 31/12/2004
Companies 31/12/2005 31/12/2004 Countries
Frigoglass Romania SRL 2.558 Romania
Frigoglass Limited 4.750 Ireland
VPI S.A 12.998 Hellas
Coolinvest Holding Limited 24.397 21.839 Cyprus
Frigorex Cyprus Limited 482 481 Cyprus
Letel Holding Limited 60.254 55.504 Cyprus
Nigerinvest Holding Limited 7.384 7.385 Cyprus
Provision for impairment of investments -47.622 -47.622
Total 44.895 57.893
The subsidiaries of the Group, the nature of their operation and their shareholding status as at 31/12/2005 are described below:
CompaniesCountry of
IncorporationNature of the
OperationConsolidation
MethodGroup
Percentage
Frigoglass SAIC - Parent Compnay HellasIce Cold Merchandisers
(ICMs) Fully 100%
Frigoglass Romania SRL RomaniaIce Cold Merchandisers
(ICMs) Fully 100%
Frigorex Indonesia PT IndonesiaIce Cold Merchandisers
(ICMs) Fully 100%
Frigoglass South Africa Ltd S. AfricaIce Cold Merchandisers
(ICMs) Fully 100%
Note 17 - Provision for other liabilities & charges (in € 000’s) (continued from previous page)
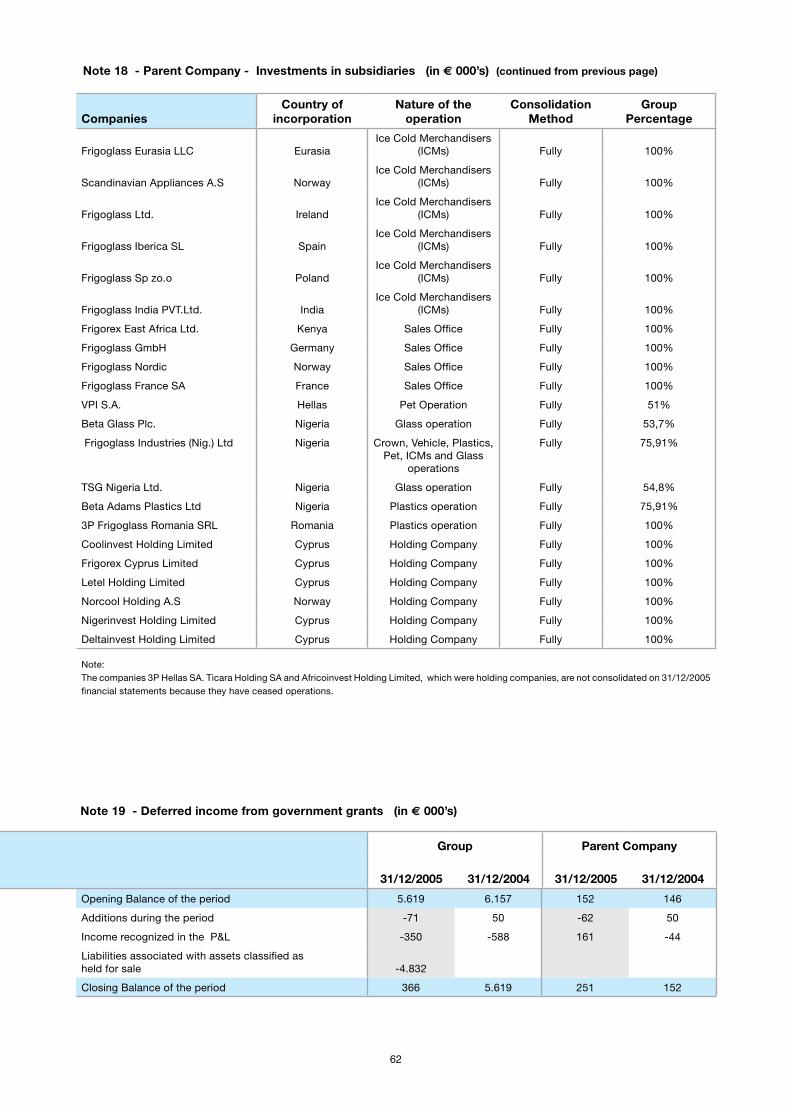
62 63
CompaniesCountry of
incorporationNature of the
operationConsolidation
MethodGroup
Percentage
Frigoglass Eurasia LLC EurasiaIce Cold Merchandisers
(ICMs) Fully 100%
Scandinavian Appliances A.S NorwayIce Cold Merchandisers
(ICMs) Fully 100%
Frigoglass Ltd. IrelandIce Cold Merchandisers
(ICMs) Fully 100%
Frigoglass Iberica SL SpainIce Cold Merchandisers
(ICMs) Fully 100%
Frigoglass Sp zo.o PolandIce Cold Merchandisers
(ICMs) Fully 100%
Frigoglass India PVT.Ltd. IndiaIce Cold Merchandisers
(ICMs) Fully 100%
Frigorex East Africa Ltd. Kenya Sales Office Fully 100%
Frigoglass GmbH Germany Sales Office Fully 100%
Frigoglass Nordic Norway Sales Office Fully 100%
Frigoglass France SA France Sales Office Fully 100%
VPI S.A. Hellas Pet Operation Fully 51%
Beta Glass Plc. Nigeria Glass operation Fully 53,7%
Frigoglass Industries (Nig.) Ltd Nigeria Crown, Vehicle, Plastics, Pet, ICMs and Glass
operations
Fully 75,91%
TSG Nigeria Ltd. Nigeria Glass operation Fully 54,8%
Beta Adams Plastics Ltd Nigeria Plastics operation Fully 75,91%
3P Frigoglass Romania SRL Romania Plastics operation Fully 100%
Coolinvest Holding Limited Cyprus Holding Company Fully 100%
Frigorex Cyprus Limited Cyprus Holding Company Fully 100%
Letel Holding Limited Cyprus Holding Company Fully 100%
Norcool Holding A.S Norway Holding Company Fully 100%
Nigerinvest Holding Limited Cyprus Holding Company Fully 100%
Deltainvest Holding Limited Cyprus Holding Company Fully 100%
Note:The companies 3P Hellas SA. Ticara Holding SA and Africoinvest Holding Limited, which were holding companies, are not consolidated on 31/12/2005 financial statements because they have ceased operations.
Opening Balance of the period 5.619 6.157 152 146
Additions during the period -71 50 -62 50
Income recognized in the P&L -350 -588 161 -44
Liabilities associated with assets classified as held for sale -4.832
Closing Balance of the period 366 5.619 251 152
Group Parent Company
31/12/2005 31/12/2004 31/12/2005 31/12/2004
Note 19 - Deferred income from government grants (in € 000’s)
GroupStatutory Reserves
Reserves by article of incorporation based on Tax legistration
Extraordinary reserves
Tax-free reserves
Currency Translation Differences Total
Number Shares (in ths.) Ordinary shares Share premium Total
Note 18 - Parent Company - Investments in subsidiaries (in € 000’s) (continued from previous page)

62 63
Note 21 - Other Reserves (in € 000’s)
Balance on 01/01/2005 40.000 40.000 57.245 97.245
Balance on 31/12/2005 40.000 40.000 57.245 97.245
The company does not operate or have stock option plan in which its employees participate in (other than the SARs) .
Open Balance on 01/01/2004 1.722 571 5.920 15.378 -6.617 16.974
Transfer to retained earnings -1.550 1.804 254
Exchange Differences -286 630 -284 1.334 1.394
Transfer from P&L of the year 411 1.614 408 2.433
Closing Balance on 31/12/2004 1.847 571 6.614 17.306 -5.283 21.055
Open Balance on 01/01/2005 1.847 571 6.614 17.306 -5.283 21.055
Transfer to retained earnings 0
Exchange Differences -191 1.372 4.171 5.352
Transfer from P&L of the year 1.796 845 2.641
Closing Balance on 31/12/2005 1.656 571 9.782 18.151 -1.112 29.048
Parent Company
Open Balance on 01/01/2004 962 571 4.017 14.126 19.676
Transfer to retained earnings -1.550 1.804 254
Transfer from P&L of the year 285 285
Closing Balance on 31/12/2004 1.247 571 2.467 15.930 20.215
Open Balance on 01/01/2005 1.247 571 2.467 15.930 20.215
Transfer to retained earnings 0
Transfer from P&L of the year 1.797 845 2.642
Closing Balance on 31/12/2005 1.247 571 4.264 16.775 22.857
A statutory reserve is created under the provisions of Hellenic law (Law 2190/20, articles 44 and 45) according to which, an amount of at least 5% of the profit (after tax) for the year must be transferred to this reserve until it reaches one third of the paid share capital. The statutory reserve can not be distributed to the shareholders of the Company except in the case of liquidation.
The Company has created tax-free reserves, taking advances off various Hellenic Taxation laws, during the years, in order to achieve tax deductions,either by postponing the tax liability till the reserves are distributed to the shareholders, or by eliminating any future income tax pay-ment by issuing new shares for the shareholders of the company. Should the reserves be distributed to the shareholders as dividends, the distrib-uted profits will be taxed with the rate that was in effect at the time of the creation of the reserves. No provision has been created in regard to the possible income tax liability in case such a future distribution of the reserves the shareholders of the company as such liabilities are recognized simultaneously with the dividends distribution.
GroupStatutory Reserves
Reserves by article of incorporation based on Tax legistration
Extraordinary reserves
Tax-free reserves
Currency Translation Differences Total
Number Shares (in ths.) Ordinary shares Share premium Total
The share capital of the company comprises of 40.000.000 fully paid up shares of € 1.0 each.The share premium accounts represents the difference between the issue of shares (in cash) and their par value cost
Note 20 - Share capital (in € 000’s)

64 65
Group Parent Company
From 01/01 to 31/12 From 01/01 to 31/12
Financial Expenses (in € 000’s) 2005 2004 2005 2004
Finance Income 4.510 5.699 1.519 1.337
Finance Expense -235 -196 -21 -48
Exchange Loss/ (Gain) -756 772 -84 22
Finance Cost of Continuous Operations 3.519 6.275 1.414 1.311
Finance Cost of VPI (Discontinuing Operations) 681 790
Group Finance Cost 4.200 7.065
Note 23 - Income Tax (in € 000’s)
Corporate Tax 14.186 11.494 4.825 2.537
Deferred Tax ( Note 9) -2.240 195 -1.371 41
Total Tax 11.946 11.689 3.454 2.578
Total Group ( Continuing Operations) 23.892 23.378
VPI - Income Tax 11 919
VPI - Deferred Tax -(Note 9) 679 763
Total 24.571 24.141
Unaudited Tax Years
Note: For some countries the tax audit is not obligatory and takes place under specific requirements
Company Country Periods Operation
Frigoglass SAIC - Parent Company Hellas 2000-2005 Ice Cold Merchandisers (ICMs)
Frigoglass Romania SRL Romania 2005 Ice Cold Merchandisers (ICMs)
Frigorex Indonesia PT Indonesia 2005 Ice Cold Merchandisers (ICMs)
Frigoglass South Africa Ltd S. Africa 2003-2005 Ice Cold Merchandisers (ICMs)
Frigoglass Eurasia LLC Eurasia 2005 Ice Cold Merchandisers (ICMs)
Scandinavian Appliances A.S Norway 2005 Ice Cold Merchandisers (ICMs)
Frigoglass Ltd. Ireland 1999-2005 Ice Cold Merchandisers (ICMs)
Frigoglass Iberica SL Spain 1999-2005 Ice Cold Merchandisers (ICMs)
Frigoglass Sp zo.o Poland 2002-2005 Ice Cold Merchandisers (ICMs)
Frigoglass India PVT.Ltd. India 2002-2005 Ice Cold Merchandisers (ICMs)
VPI SA Hellas 2001-2005 Pet Operation
Beta Glass Plc. Nigeria 2005 Glass Operation
Frigoglass Industries (Nig.) Ltd Nigeria 1999-2005 Crown, Vehicle, Plastics, Pet, ICMs and Glass operations
TSG Nigeria Ltd. Nigeria 1999-2005 Glass Operation
Beta Adams Plastics Nigeria 1999-2005 Plastics Operation
3P Frigoglass Romania SRL Romania 2005 Plastics Operation
Frigorex East Africa Ltd. Kenya 2002-2005 Sales Office
Frigoglass Gmbh Germany 2005 Sales Office
Frigoglass Nordic Norway 2005 Sales Office
Frigoglass France SA France 2003-2005 Sales Office
Group Parent Company
Continuing operationsamounts in 000’s Euro 12 months 2005 12 months 2004 12 months 2005 12 months 2004
Note 22 - Financial Expenses (in € 000’s)

64 65
Company Country Periods Operation
Coolinvest Holding Limited Cyprus 1997-2005 Holding Company
Frigorex Cyprus Limited Cyprus 1997-2005 Holding Company
Letel Holding Limited Cyprus 1997-2005 Holding Company
Norcool Holding A.S Norway 1999-2005 Holding Company
Nigerinvest Holding Limited Cyprus 1997-2005 Holding Company
Deltainvest Holding Limited Cyprus 1997-2005 Holding Company
The tax rates in the countries where the Group operates are between 10% and 40%.Some of non - deductible expenses and the different tax rates in the countries that the Group operates create a tax rate for the Group approximately of 32,53% (Greek Taxation Rate is 32%).
The main reasons that the 2004 effective tax rate of 43,41% reduced to 32,53% for 2005 are disclosed below:a) There is a significant reduction of non profitable companiesb) The tax rates, in the countries where the Group operates, have been reduced.
The tax returns for the Parent Company and for the Group subsidiaries have not been assessed by tax authorities for different periods. Until the tax audit assessment for the companies described in the table above is completed, the tax liability can not be finalized for those years. The management of the Group believes that no significant additional taxes besides those recognised in the financial statements will be finally assessed.
Income tax from continuing operations
Note 24 - Expenses by nature (in € 000’s)
The expenses of the Group and Parent company for the periods of 2005 and 2004 are analyzed below:
Parent Company
in 000’s Euro 31/12/2005 31/12/2004
Profit before tax 10.159 6.486
Plus:
Expenses not deductible for tax purposes 1.481 2.390
Less:
Tax - free reserves 846 1.510
Taxable profit 10.794 7.366
Tax Rate 32,0% 35,0%
Income tax expenses, recognised in P&L statement 3.454 2.578
Raw materials, consumables,energy & maintenance 162.931 135.957 40.207 34.320
Wages & Salaries 43.297 40.113 16.948 14.008
Depreciation 18.283 17.641 3.812 3.429
Transportation Expenses 10.087 7.224 1.924 1.794
Employee benefits, personel expenses, travel expenses 11.739 9.403 4.062 3.022
Group Parent Company
Continuing operationsamounts in 000’s Euro 12 months 2005 12 months 2004 12 months 2005 12 months 2004
Note 23 - Income Tax (in € 000’s) (continued from previous page)

66 67
Provision for staff leaving indemnities 3.933 6.315 1.480 1.566
Audit & third - party fees 5.012 6.046 2.323 3.074
Rent, insurance, leasing payments and security expenses 4.073 3.893 831 916
Provisions for trade debtors,inventories, warranties and free of charge goods 6.611 5.723 1.512 758
Promotion and after - sales expenses 1.898 2.884 492 912
Telecommunications,subscriptions and office supply expenses 1.810 2.006 491 531
Provision for stock option 2.673 348 2.673 348
Other expenses 3.138 2.332 2.097 676
Total Expenses 275.485 239.885 78.852 65.354
Categorized as:
Cost of goods sold 214.573 186.050 52.787 45.020
Administration expenses 36.415 32.126 18.861 13.878
Selling & marketing expenses 21.942 19.520 5.197 4.631
Research & Development expenses 2.555 2.189 2.007 1.825
Total Expenses 275.485 239.885 78.852 65.354
Depreciation:
Continuing operations
Cost of goods sold 14.923 13.976 2.103 1.556
Administration expenses 1.973 2.147 549 602
Selling & marketing expenses 190 216 163 175
Research & Development expenses 1.197 1.302 997 1.096
Total Group(Continuous Operations) 18.283 17.641 3.812 3.429
VPI - Discontinuing operations
Cost of goods sold 3.844 4.026
Administration expenses 149 136
Selling & marketing expenses 8 7
VPI (Discontinuing Operations) 4.001 4.169
Group Parent Company
Continuing operationsamounts in 000’s Euro 12 months 2005 12 months 2004 12 months 2005 12 months 2004
Note 24 - Expenses by nature (in € 000’s) (continued from previous page)

66 67
Note 26 - Commitments
Capital CommitmentsThe capital commitments that have been contracted for but not yet incurred at the balance sheet date for the Group for 2005 was € 800 ths. (2004: € 6.500 ths.)
Operating lease commitmentThe Group leases buildings and vehicles under operating leases. Total future lease payments under operating leases are as follows:
Operations 12 months 2005 12 months 2004
Cool Operation 2.478 2.008
Nigeria Operations 1.773 2.466
Plastics Operation 67 102
Group - Continuing operations 4.318 4.576
VPI - Discontinuing operations 106 107
Total Group 4.424 4.683
Parent Company 431 413
Group Parent Company
Continuing operations 2005 2004 2005 2004
Wages & Salaries 37.109 34.259 13.967 11.453
Social Security Insurance 6.188 5.854 2.981 2.555
Total Payroll 43.297 40.113 16.948 14.008
Pension plan (define contribution)- see note 16 1.489 772 1.170 417
Retirement Benefit (define contribution)- see note 16 2.654 4.169 1.666 1.471
Pension plan (define benefit) 479 185
Actual cost of stock option(Phantom Option Plan) 625 625
Provision for stock option (Phantom Option Plan) 2.048 348 2.048 348
Total Group - Continuing operations 50.592 45.587 22.457 16.244
VPI - Discontinuing operations 2005 2004
Wages & Salaries 2.994 2.822
Social Security Insurance 682 656
Total Payroll 3.676 3.478
Retirement Benefit 44
VPI (Discontinuing Operations) 3.720 3.478
Average number of personnel per operation for the Group & for the Parent company are listed below:
Note 25 - Employee benefit expenses & average number of personnel (in € 000’s)

68 69
The component of the company’s shareholders on 31/12/2005 was: BOVAL S.A. 44,1%, Institutional investors 24,07%, COMPETROL ESTABLISHMENT 7,3%, and Other Investors 24,53%.The Coca Cola Hellenic Bottling Company is a non alcoholic beverage company listed on the stock exchanges of Athens, New York,London & Australia. Except from the common share capital involvement of BOVAL S.A at 30,2%, with CCHBC, Frigoglass is the majority shareholder in Frigoglass Industries Limited based on Nigeria, where CCHBC also owns an 18% equity interest.
a) The amounts of related - party transactions (sales and receivables) were:
Note 27 - Related Party Transactions
Within 1 year 753 317 1.070 704 305 1.009
Between 1 to 5 years 1.840 896 2.736 175 822 997
Over 5 years 2.482 0 2.482 154 - 154
Total 5.075 1.213 6.288 1.033 1.127 2.160
Parent Company
Within 1 year 392 266 658 269 231 500
Between 1 to 5 years 1.467 692 2.159 14 625 639
Over 5 years 2.322 0 2.322 - - -
Total 4.181 958 5.139 283 856 1.139
Sales 177.631 173.567 23.898 18.773
Receivables 17.423 21.620 5.368 3.238
Based on a contract signed in 1999, which was renewed in 2004 and expires on 31/12/2008, the CCHBC Group is going to purchase, in negotiable prices, yearly at least 60% of its needs in ICM’s, Bottles, Pet & Crowns.The above transactions are executed at arm’s length.
b) Fees to members of the Board of Directors and Management compensation (including wages, stock option, indemnities and other employee benefits)
Fees of member of Boardof Directors 191 162 191 162
Management compensation 3.422 1.870 3.422 1.870
c) The intercompany transaction of the Parent Company with the rest of subsidiaries are analyzed in the supplementary F.
Group Parent Company
in € 000’s 31/12/2005 31/12/2004 31/12/2005 31/12/2004
Group
31/12/2005 31/12/2004
amounts in 000’s € Buildings Vehicles Total Buildings Vehicles Total
Group
Continuing Operationsamounts in 000’s Euro (except per share) 31/12/2005 31/12/2004
In 000’s shares Date Description Issue Shares Own shares Shares in circulation
The Parent company has contingent liabilities in respect of bank guarantIes arising from the ordinary course of business as follows:
31/12/2005 31/12/2004
in € 000’s 124.237 136.812
Note 26 - Commitments (continued from previous page)
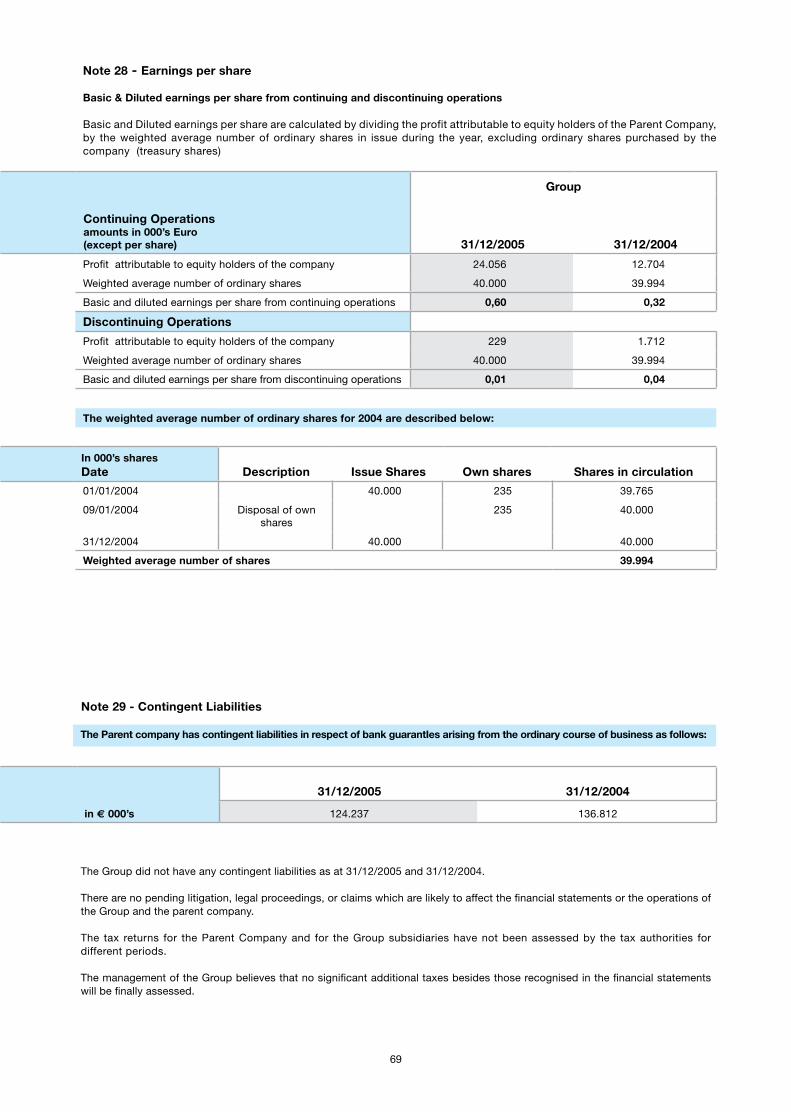
68 69
Note 28 - Earnings per share
Basic & Diluted earnings per share from continuing and discontinuing operations
Basic and Diluted earnings per share are calculated by dividing the profit attributable to equity holders of the Parent Company, by the weighted average number of ordinary shares in issue during the year, excluding ordinary shares purchased by the company (treasury shares)
The Group did not have any contingent liabilities as at 31/12/2005 and 31/12/2004.
There are no pending litigation, legal proceedings, or claims which are likely to affect the financial statements or the operations of the Group and the parent company.
The tax returns for the Parent Company and for the Group subsidiaries have not been assessed by the tax authorities for different periods.
The management of the Group believes that no significant additional taxes besides those recognised in the financial statements will be finally assessed.
Note 29 - Contingent Liabilities
Group
Continuing Operationsamounts in 000’s Euro (except per share) 31/12/2005 31/12/2004
01/01/2004 40.000 235 39.765
09/01/2004 Disposal of own shares
235 40.000
31/12/2004 40.000 40.000
Weighted average number of shares 39.994
In 000’s shares Date Description Issue Shares Own shares Shares in circulation
Profit attributable to equity holders of the company 24.056 12.704
Weighted average number of ordinary shares 40.000 39.994
Basic and diluted earnings per share from continuing operations 0,60 0,32
Discontinuing Operations
Profit attributable to equity holders of the company 229 1.712
Weighted average number of ordinary shares 40.000 39.994
Basic and diluted earnings per share from discontinuing operations 0,01 0,04
The weighted average number of ordinary shares for 2004 are described below:
The Parent company has contingent liabilities in respect of bank guarantIes arising from the ordinary course of business as follows:
31/12/2005 31/12/2004
in € 000’s 124.237 136.812
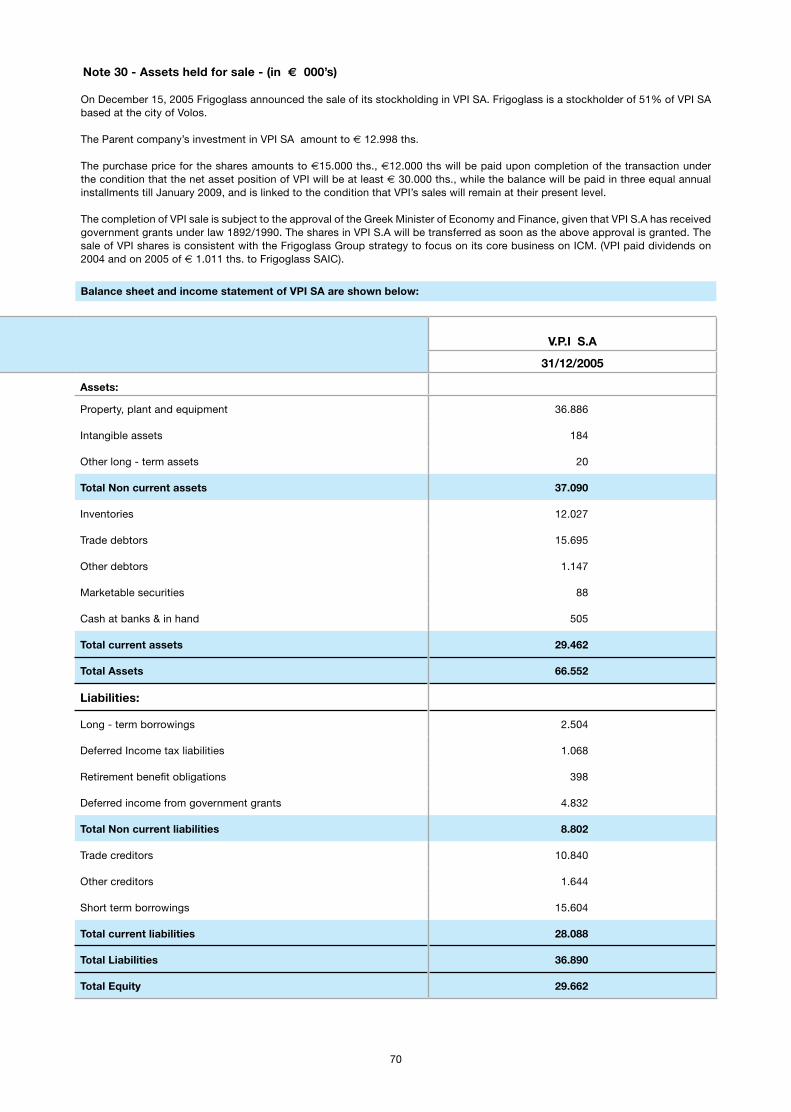
70 71
On December 15, 2005 Frigoglass announced the sale of its stockholding in VPI SA. Frigoglass is a stockholder of 51% of VPI SA based at the city of Volos.
The Parent company’s investment in VPI SA amount to € 12.998 ths.
The purchase price for the shares amounts to €15.000 ths., €12.000 ths will be paid upon completion of the transaction under the condition that the net asset position of VPI will be at least € 30.000 ths., while the balance will be paid in three equal annual installments till January 2009, and is linked to the condition that VPI’s sales will remain at their present level.
The completion of VPI sale is subject to the approval of the Greek Minister of Economy and Finance, given that VPI S.A has received government grants under law 1892/1990. The shares in VPI S.A will be transferred as soon as the above approval is granted. The sale of VPI shares is consistent with the Frigoglass Group strategy to focus on its core business on ICM. (VPI paid dividends on 2004 and on 2005 of € 1.011 ths. to Frigoglass SAIC).
Balance sheet and income statement of VPI SA are shown below:
V.P.I S.A
31/12/2005
Assets:
Property, plant and equipment 36.886
Intangible assets 184
Other long - term assets 20
Total Non current assets 37.090
Inventories 12.027
Trade debtors 15.695
Other debtors 1.147
Marketable securities 88
Cash at banks & in hand 505
Total current assets 29.462
Total Assets 66.552
Liabilities:
Long - term borrowings 2.504
Deferred Income tax liabilities 1.068
Retirement benefit obligations 398
Deferred income from government grants 4.832
Total Non current liabilities 8.802
Trade creditors 10.840
Other creditors 1.644
Short term borrowings 15.604
Total current liabilities 28.088
Total Liabilities 36.890
Total Equity 29.662
From : 01/ 01 ´till
Income Statement 31/12/2005 31/12/2004
31/12/2005 31/12/2004
Note 30 - Assets held for sale - (in € 000’s)
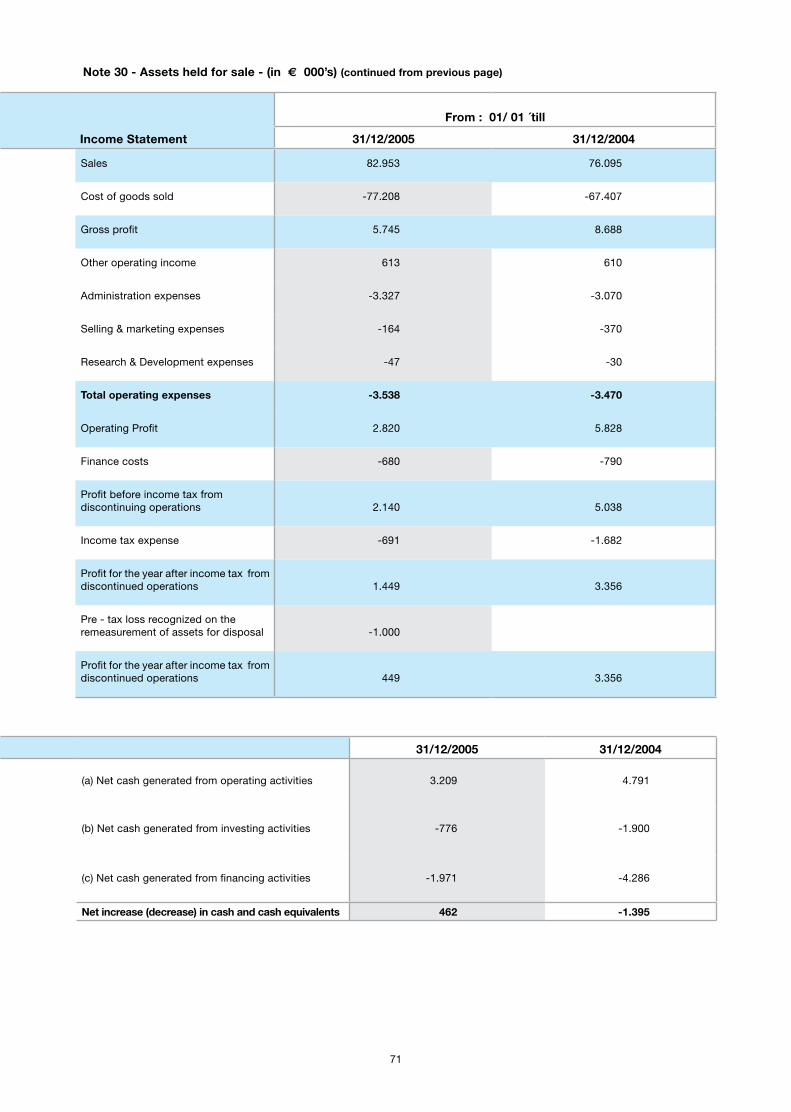
70 71
(a) Net cash generated from operating activities 3.209 4.791
(b) Net cash generated from investing activities -776 -1.900
(c) Net cash generated from financing activities -1.971 -4.286
Net increase (decrease) in cash and cash equivalents 462 -1.395
Sales 82.953 76.095
Cost of goods sold -77.208 -67.407
Gross profit 5.745 8.688
Other operating income 613 610
Administration expenses -3.327 -3.070
Selling & marketing expenses -164 -370
Research & Development expenses -47 -30
Total operating expenses -3.538 -3.470
Operating Profit 2.820 5.828
Finance costs -680 -790
Profit before income tax from discontinuing operations 2.140 5.038
Income tax expense -691 -1.682
Profit for the year after income tax from discontinued operations 1.449 3.356
Pre - tax loss recognized on the remeasurement of assets for disposal -1.000
Profit for the year after income tax from discontinued operations 449 3.356
From : 01/ 01 ´till
Income Statement 31/12/2005 31/12/2004
31/12/2005 31/12/2004
Note 30 - Assets held for sale - (in € 000’s) (continued from previous page)

72 73
Profit after tax according Hellenic GAAP 17.605 6.215
adjusted for:
Revision of useful lives of property plant & equipment 2.783 365
Revision of amortization of Government grants according the useful life of Property Plant & Equipment -408
Profit from sales of own share recognized directly to the equity -280 -280
Provision for Stock Options -348 -348
Capitalized expenses not recognized according IFRS net of amortization -560 -560
Provisions for warranties -200 -200
Government grants not recognized according IFRS -232 -232
Recognition of deferred taxes -930 -41
Profit after tax according IFRS 17.430 4.919
Group Parent Company
Sales 340.297 340.297 49.801 49.801
Cost of goods sold -255.843 -253.458 -45.352 -45.020
Gross profit 84.454 86.839 4.449 4.781
Other operating income 9.242 8.332 18.003 17.490
Administration expenses -34.357 -35.196 -12.700 -13.878
Selling & marketing expenses -19.911 -19.890 -4.631 -4.631
Research & Development expenses -2.322 -2.219 -1.928 -1.825
Total operating expenses -56.590 -57.305 -19.259 -20.334
Operating Profit 37.106 37.866 3.193 1.937
Dividend income 6.871 6.871
Finance costs -7.061 -7.065 -1.311 -1.311
Profit before income tax 30.045 30.801 8.753 7.497
Income tax expense -12.440 -13.371 -2.538 -2.578
Profit for the year after income tax expenses 17.605 17.430 6.215 4.919
Group Parent Company
Hellenic GAAP IFRS Hellenic GAAP IFRS
Net equity reconciliation - Between Hellenic GAAP and IFRS operation as at 31/12/2004 (in € 000’s)
Group Parent CompanyBalance according Hellenic GAAP as at 31/12/2004: 131.336 118.185
Adjusted for:
Provision for retirement obligations -2.339 -2.339
Reclassification of Government Grants from equity to Liabilities -5.806 -145
Write off intangible assets -650 -474
Provisions for warranties -213 -213
Profit from sales of own share recognized directly in equity -280 -280
Revaluation / <Devaluation> of Land & building 5.741 5.683
Provision for impairment of investment -47.622
Capitalized expenses not recognized according IFRS net of amortization -560 -560
Assets:
Property, plant and equipment 144.778 151.953 7.175 7.797 14.698 6.901
Intangible assets 6.177 4.720 -1.457 4.427 3.161 -1.266
Investments in subsidiaries 110.554 57.893 -52.661
Deferred income tax assets 814 814
Other long - term assets 251 251 0 172 173 1
Total Non current assets 151.206 157.738 6.532 122.950 75.925 -47.025
Inventories 76.347 74.990 -1.357 10.627 10.627 0
Trade debtors 59.566 59.566 0 6.707 6.707 0
Other debtors 22.351 22.351 0 8.003 8.003 0
Intergroup receivables 25.475 30.514 5.039
Cash at banks & in hand 10.420 10.420 0 584 584 0
Total current assets 168.684 167.327 -1.357 51.396 56.435 5.039
Total Assets 319.890 325.065 5.175 174.346 132.360 -41.986
Liabilities:
Long - term borrowings 35.531 35.531 0 29.000 29.000 0
Deferred Income tax liabilities 5.736 11.230 5.494 2.334 2.334
Retirement benefit obligations 9.041 11.326 2.285 1.788 4.083 2.295
Provisions for other liabilities & charges 3.117 3.379 262 835 1.032 197
Deferred income from government grants 5.619 5.619 152 152
Total Non current liabilities
53.425 67.085 13.660 31.623 36.601 4.978
Trade creditors 34.038 34.038 0 6.148 6.148 0
Other creditors 25.627 20.499 -5.128 9.073 3.932 -5.141
Intergroup payables 2.341 2.341 0
Short term borrowings 75.464 75.465 1 6.976 6.976 0
Total current liabilities 135.129 130.002 -5.127 24.538 19.397 -5.141
Total Liabilities 188.554 197.087 8.533 56.161 55.998 -163
Total Equity 131.336 127.978 -3.358 118.185 76.362 -41.823
Total Liabilities and equity 319.890 325.065 5.175 174.346 132.360 -41.986
Group Parent Company
Hellenic GAAP IFRS Difference
Hellenic GAAP IFRS Difference
Net income reconciliation between Hellenic GAAP and IFRS from continuing and discontinuing operationsfor the year ended 31/12/2004 (in € 000’s)
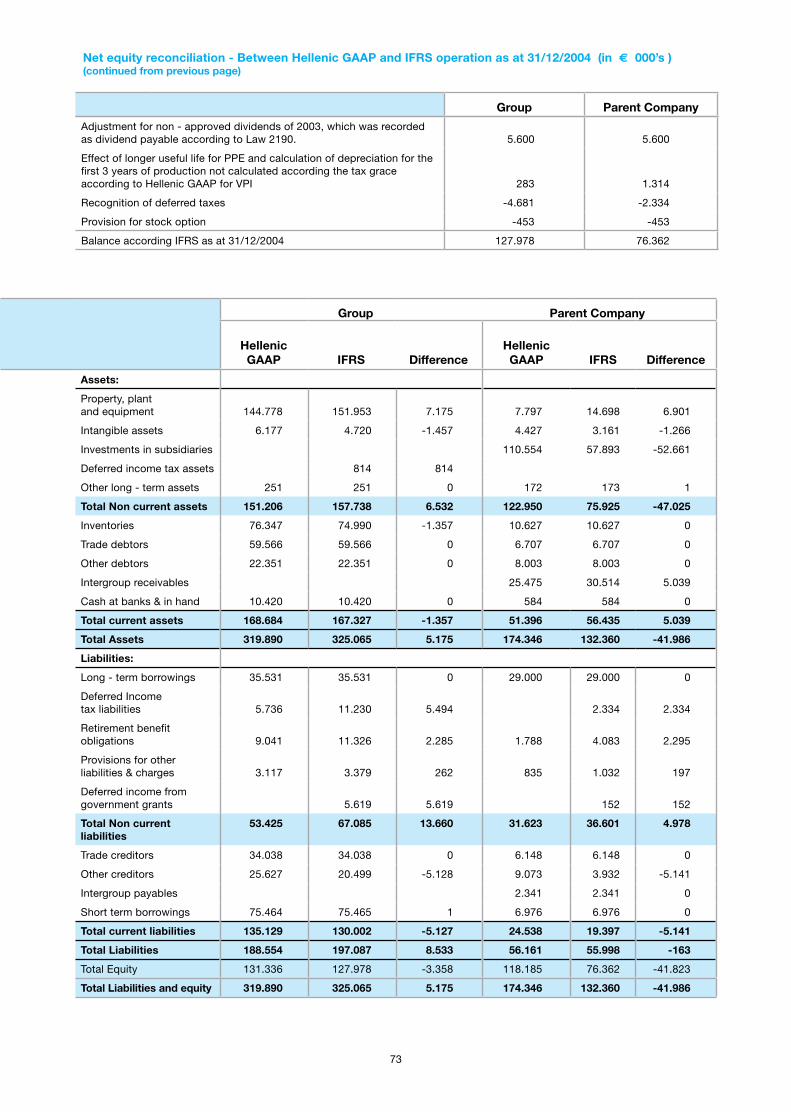
72 73
Group Parent Company
Adjustment for non - approved dividends of 2003, which was recorded as dividend payable according to Law 2190. 5.600 5.600
Effect of longer useful life for PPE and calculation of depreciation for the first 3 years of production not calculated according the tax grace according to Hellenic GAAP for VPI 283 1.314
Recognition of deferred taxes -4.681 -2.334
Provision for stock option -453 -453
Balance according IFRS as at 31/12/2004 127.978 76.362
Assets:
Property, plant and equipment 144.778 151.953 7.175 7.797 14.698 6.901
Intangible assets 6.177 4.720 -1.457 4.427 3.161 -1.266
Investments in subsidiaries 110.554 57.893 -52.661
Deferred income tax assets 814 814
Other long - term assets 251 251 0 172 173 1
Total Non current assets 151.206 157.738 6.532 122.950 75.925 -47.025
Inventories 76.347 74.990 -1.357 10.627 10.627 0
Trade debtors 59.566 59.566 0 6.707 6.707 0
Other debtors 22.351 22.351 0 8.003 8.003 0
Intergroup receivables 25.475 30.514 5.039
Cash at banks & in hand 10.420 10.420 0 584 584 0
Total current assets 168.684 167.327 -1.357 51.396 56.435 5.039
Total Assets 319.890 325.065 5.175 174.346 132.360 -41.986
Liabilities:
Long - term borrowings 35.531 35.531 0 29.000 29.000 0
Deferred Income tax liabilities 5.736 11.230 5.494 2.334 2.334
Retirement benefit obligations 9.041 11.326 2.285 1.788 4.083 2.295
Provisions for other liabilities & charges 3.117 3.379 262 835 1.032 197
Deferred income from government grants 5.619 5.619 152 152
Total Non current liabilities
53.425 67.085 13.660 31.623 36.601 4.978
Trade creditors 34.038 34.038 0 6.148 6.148 0
Other creditors 25.627 20.499 -5.128 9.073 3.932 -5.141
Intergroup payables 2.341 2.341 0
Short term borrowings 75.464 75.465 1 6.976 6.976 0
Total current liabilities 135.129 130.002 -5.127 24.538 19.397 -5.141
Total Liabilities 188.554 197.087 8.533 56.161 55.998 -163
Total Equity 131.336 127.978 -3.358 118.185 76.362 -41.823
Total Liabilities and equity 319.890 325.065 5.175 174.346 132.360 -41.986
Group Parent Company
Hellenic GAAP IFRS Difference
Hellenic GAAP IFRS Difference
Net equity reconciliation - Between Hellenic GAAP and IFRS operation as at 31/12/2004 (in € 000’s )(continued from previous page)

74 75
(Translation from the Greek Language original)
Report of the Certified Auditor - Accountant
To the Shareholders of Frigoglass SAIC
We have audited the accompanying separate and consolidated balance sheets of Frigoglass SAIC (the Company)
and its subsidiaries (collectively the Group) as of 31 December 2005 and the related separate and consolidated
statements of income, cash flows and changes in shareholders’ equity for the year then ended. These financial
statements are the responsibility of the Company’s management. Our responsibility is to express an opinion on
these financial statements based on our audit.
We conducted our audit in accordance with Greek Auditing Standards, which conform with International Standards
on Auditing. Those Standards require that we plan and perform the audit to obtain reasonable assurance about
whether the financial statements are free of material misstatement. An audit includes examining, on a test basis,
evidence supporting the amounts and disclosures in the financial statements. An audit also includes assessing the
accounting principles used and significant estimates made by management, as well as evaluating the overall fi-
nancial statements presentation. We believe that our audit provides a reasonable basis for our opinion.
In our opinion, the accompanying separate and consolidated financial statements present fairly, in all material
respects, the financial position of the Company and the Group as of 31 December 2005, and of the results of their
operations and cash flows for the year then ended in accordance with International Financial Reporting Standards
as adopted by the European Union.
Athens, 23 February 2006
The Certified Auditor – Accountant
Kyriacos RirisSOEL Reg. No. 12111
Group Parent Company
From : 01/ 01 ´till From : 01/ 01 ´till
Continuing Operations 31/12/2005 31/12/2004 31/12/2005 31/12/2004

74 75
Sales 63.306 52.590 17.428 9.325
Cost of goods sold -46.005 -39.478 -15.110 -9.075
Gross profit 17.301 13.112 2.318 250
Other operating income 3.459 1.453 5.654 5.209
Administration expenses -11.125 -8.398 -6.642 -3.713
Selling & marketing expenses -5.579 -4.851 -1.512 -1.049
Research & Development expenses -961 -589 -851 -524
Losses from restructuring activities -1.111 0 0 0
Total operating expenses -18.776 -13.838 -9.005 -5.286
Operating Profit 1.984 727 -1.033 173
Dividend income 0 0 -2.022 28
Finance costs -612 -1.855 -244 -343
Profit before income tax 1.372 -1.128 -3.299 -142
Income tax expense 322 357 314 -305
Profit for the year from continuing operations 1.694 -771 -2.985 -447
Profit for the year after income tax from discontinued operations -824 889 1.011 1.011
Profit for the year after income tax expenses 870 118 -1.974 564
Attributable to:
Minority interest 337 1.174 0 0
Shareholders of the Company 533 -1.056 -1.974 564
Weighted Average number of shares (in thousands) 40.000 39.994 40.000 39.994
Earnings per share from continuing operations attributable to the shareholders of the company during the year ( in € per share) 0,04 -0,02 -0,07 -0,01
Earnings per share from discontinuing operations attributable to the shareholders of the company during the year ( in € per share) -0,02 0,02 0,03 0,03
Depreciation 4.202 3.905 891 675
Earnings before interest, tax, depreciation and amortization and invested results 7.297 4.632 -142 848
Group Parent Company
From : 01/ 01 ´till From : 01/ 01 ´till
Continuing Operations 31/12/2005 31/12/2004 31/12/2005 31/12/2004
Supplementary Information for the year ended 31/12/2004 (in € 000’s)Income Statement (in € 000’s) - Note: not audited
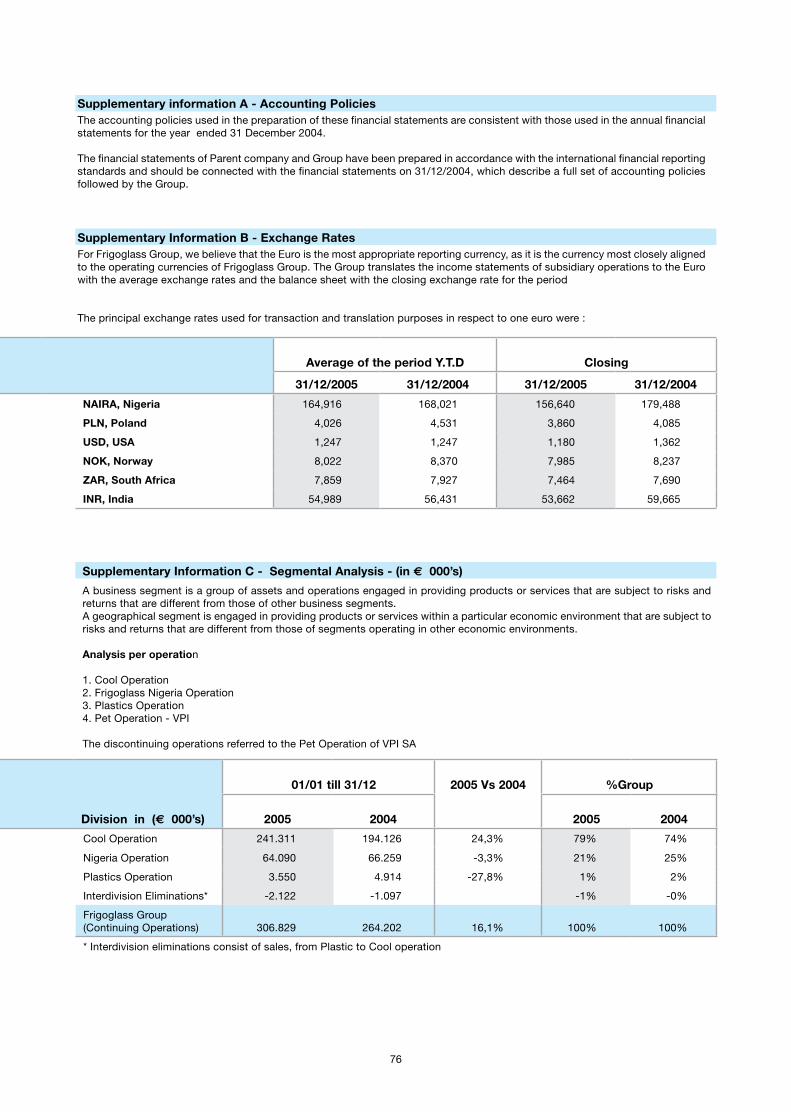
76 77
Supplementary information A - Accounting PoliciesThe accounting policies used in the preparation of these financial statements are consistent with those used in the annual financial statements for the year ended 31 December 2004.
The financial statements of Parent company and Group have been prepared in accordance with the international financial reporting standards and should be connected with the financial statements on 31/12/2004, which describe a full set of accounting policies followed by the Group.
Supplementary Information B - Exchange RatesFor Frigoglass Group, we believe that the Euro is the most appropriate reporting currency, as it is the currency most closely aligned to the operating currencies of Frigoglass Group. The Group translates the income statements of subsidiary operations to the Euro with the average exchange rates and the balance sheet with the closing exchange rate for the period
The principal exchange rates used for transaction and translation purposes in respect to one euro were :
NAIRA, Nigeria 164,916 168,021 156,640 179,488
PLN, Poland 4,026 4,531 3,860 4,085
USD, USA 1,247 1,247 1,180 1,362
NOK, Norway 8,022 8,370 7,985 8,237
ZAR, South Africa 7,859 7,927 7,464 7,690
INR, India 54,989 56,431 53,662 59,665
Average of the period Y.T.D Closing
31/12/2005 31/12/2004 31/12/2005 31/12/2004
Supplementary Information C - Segmental Analysis - (in € 000’s)
A business segment is a group of assets and operations engaged in providing products or services that are subject to risks and returns that are different from those of other business segments.A geographical segment is engaged in providing products or services within a particular economic environment that are subject to risks and returns that are different from those of segments operating in other economic environments.
Analysis per operation
1. Cool Operation2. Frigoglass Nigeria Operation3. Plastics Operation4. Pet Operation - VPI
The discontinuing operations referred to the Pet Operation of VPI SA
Cool Operation 241.311 194.126 24,3% 79% 74%
Nigeria Operation 64.090 66.259 -3,3% 21% 25%
Plastics Operation 3.550 4.914 -27,8% 1% 2%
Interdivision Eliminations* -2.122 -1.097 -1% -0%
Frigoglass Group (Continuing Operations) 306.829 264.202 16,1% 100% 100%
* Interdivision eliminations consist of sales, from Plastic to Cool operation
01/01 till 31/12 2005 Vs 2004 %Group
Division in (€ 000’s) 2005 2004 2005 2004
01/01 ´till 31/12 2005 Vs 2004 %Group
Division in (€ 000’s) 2005 2004 2005 2004
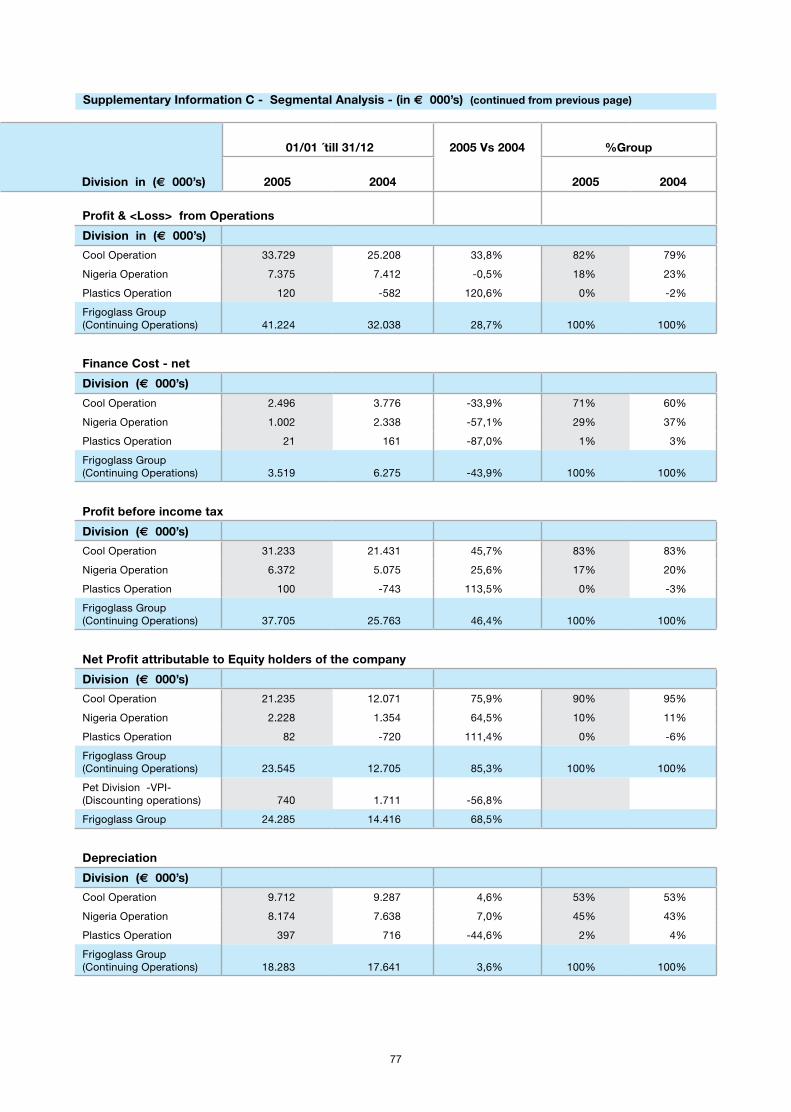
76 77
Profit & <Loss> from Operations
Division in (€ 000’s)
Cool Operation 33.729 25.208 33,8% 82% 79%
Nigeria Operation 7.375 7.412 -0,5% 18% 23%
Plastics Operation 120 -582 120,6% 0% -2%
Frigoglass Group (Continuing Operations) 41.224 32.038 28,7% 100% 100%
Finance Cost - net
Division (€ 000’s)
Cool Operation 2.496 3.776 -33,9% 71% 60%
Nigeria Operation 1.002 2.338 -57,1% 29% 37%
Plastics Operation 21 161 -87,0% 1% 3%
Frigoglass Group (Continuing Operations) 3.519 6.275 -43,9% 100% 100%
Profit before income tax
Division (€ 000’s)
Cool Operation 31.233 21.431 45,7% 83% 83%
Nigeria Operation 6.372 5.075 25,6% 17% 20%
Plastics Operation 100 -743 113,5% 0% -3%
Frigoglass Group (Continuing Operations) 37.705 25.763 46,4% 100% 100%
Net Profit attributable to Equity holders of the company
Division (€ 000’s)
Cool Operation 21.235 12.071 75,9% 90% 95%
Nigeria Operation 2.228 1.354 64,5% 10% 11%
Plastics Operation 82 -720 111,4% 0% -6%
Frigoglass Group (Continuing Operations) 23.545 12.705 85,3% 100% 100%
Pet Division -VPI- (Discounting operations) 740 1.711 -56,8%
Frigoglass Group 24.285 14.416 68,5%
Depreciation
Division (€ 000’s)
Cool Operation 9.712 9.287 4,6% 53% 53%
Nigeria Operation 8.174 7.638 7,0% 45% 43%
Plastics Operation 397 716 -44,6% 2% 4%
Frigoglass Group (Continuing Operations) 18.283 17.641 3,6% 100% 100%
01/01 ´till 31/12 2005 Vs 2004 %Group
Division in (€ 000’s) 2005 2004 2005 2004
Supplementary Information C - Segmental Analysis - (in € 000’s) (continued from previous page)

78 79
EBITDA
Division (€ 000’s)
Cool Operation 44.552 34.494 29,2% 73% 69%
Nigeria Operation 15.548 15.051 3,3% 26% 30%
Plastics Operation 518 134 286,6% 1% 0%
Frigoglass Group (Continuing Operations) 60.618 49.679 22,0% 100% 100%
Capital Expenditure
Division (€ 000’s)
Cool Operation 8.059 16.835 49% 57%
Nigeria Operation 7.768 12.505 48% 42%
Plastics Operation 495 290 3% 1%
Frigoglass Group (Continuing Operations) 16.322 29.630 100% 100%
Pet Division -VPI- (Discounting operations) 776 1.900
Frigoglass Group 17.098 31.530
Capital Expenditure consists of expenditures for tangible & intangible assets.
Total Assets
Division (€ 000’s)
Cool Operation 222.379 200.381 11,0% 72% 75%
Nigeria Operation 84.152 67.016 25,6% 27% 25%
Plastics Operation 1.827 1.317 38,7% 1% 1%
Frigoglass Group (Continuing Operations) 308.358 268.714 14,8% 100% 100%
Pet Division -VPI- (Discounting operations) 53.554 56.351
Frigoglass Group 361.912 325.065
Divisional ‘s asset include mainly intangible assets, tangible assets, inventories, receivables and cash and cash equivalents
Total Liabilities
Division (€ 000’s)
Cool Operation 122.434 116.662 4,9% 72% 74%
Nigeria Operation 46.282 40.115 15,4% 27% 25%
Plastics Operation 1.732 1.157 49,7% 1% 1%
Frigoglass Group (Continuing Operations) 170.448 157.934 7,9% 100% 100%
Pet Division -VPI- (Discounting operations) 36.890 39.153
Frigoglass Group 207.338 197.087
01/01 ´till 31/12 2005 Vs 2004 %Group
Division in (€ 000’s) 2005 2004 2005 2004
Net Trade Sales Management FeesTransportation
Income Purchase
Name of the company Dec.2005 Dec.2004 Dec.2005 Dec.2004 Dec.2005 Dec.2004 Dec.2005 Dec.2004
Supplementary Information C - Segmental Analysis - (in € 000’s) (continued from previous page)
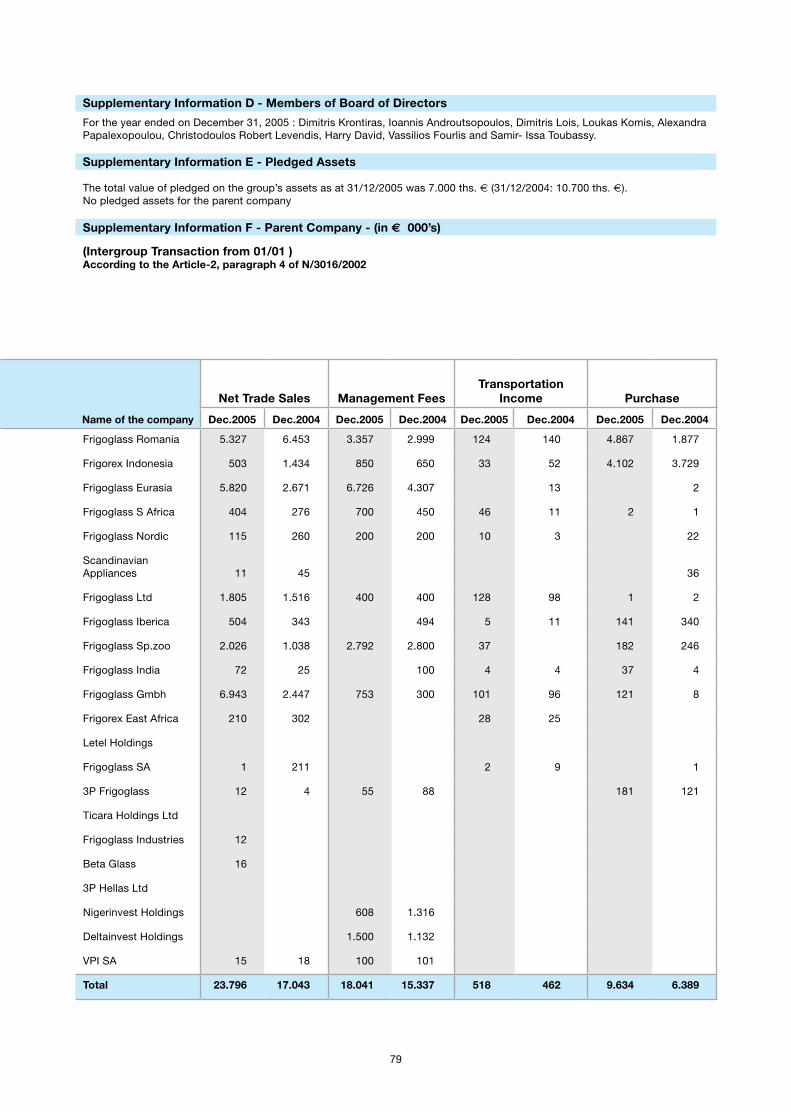
78 79
Net Trade Sales Management FeesTransportation
Income Purchase
Name of the company Dec.2005 Dec.2004 Dec.2005 Dec.2004 Dec.2005 Dec.2004 Dec.2005 Dec.2004
Frigoglass Romania 5.327 6.453 3.357 2.999 124 140 4.867 1.877
Frigorex Indonesia 503 1.434 850 650 33 52 4.102 3.729
Frigoglass Eurasia 5.820 2.671 6.726 4.307 13 2
Frigoglass S Africa 404 276 700 450 46 11 2 1
Frigoglass Nordic 115 260 200 200 10 3 22
Scandinavian Appliances 11 45 36
Frigoglass Ltd 1.805 1.516 400 400 128 98 1 2
Frigoglass Iberica 504 343 494 5 11 141 340
Frigoglass Sp.zoo 2.026 1.038 2.792 2.800 37 182 246
Frigoglass India 72 25 100 4 4 37 4
Frigoglass Gmbh 6.943 2.447 753 300 101 96 121 8
Frigorex East Africa 210 302 28 25
Letel Holdings
Frigoglass SA 1 211 2 9 1
3P Frigoglass 12 4 55 88 181 121
Ticara Holdings Ltd
Frigoglass Industries 12
Beta Glass 16
3P Hellas Ltd
Nigerinvest Holdings 608 1.316
Deltainvest Holdings 1.500 1.132
VPI SA 15 18 100 101
Total 23.796 17.043 18.041 15.337 518 462 9.634 6.389
Supplementary Information D - Members of Board of Directors
For the year ended on December 31, 2005 : Dimitris Krontiras, Ioannis Androutsopoulos, Dimitris Lois, Loukas Komis, Alexandra Papalexopoulou, Christodoulos Robert Levendis, Harry David, Vassilios Fourlis and Samir- Issa Toubassy.
Supplementary Information E - Pledged Assets
The total value of pledged on the group’s assets as at 31/12/2005 was 7.000 ths. € (31/12/2004: 10.700 ths. €).No pledged assets for the parent company
Supplementary Information F - Parent Company - (in € 000’s)
(Intergroup Transaction from 01/01 )According to the Article-2, paragraph 4 of N/3016/2002

80 81
Frigoglass Romania 8.961 5.860 9.100 7.858 50 1.064 4.747 4.111
Frigorex Indonesia 1.247 1.491 513 1.351 8.815 7.121
Frigoglass Eurasia 6.299 6.328 7.000 7.000
Frigoglass S Africa 958 1.345 1.425 1.425
Frigoglass Nordic 59 125 1 3.757 3.647
Scandinavian Appliances 11 22
Frigoglass Ltd 1.764 1.513 1 2.500 2.500
Frigoglass Iberica 257 2.137 1.500 1.500
Frigoglass Sp.zoo 1.205 1.314 44 11.300 11.300
Frigoglass India 466 387 23 4.379 3.939
Frigoglass Gmbh 5.965 543 27 2 1.000 1.000
Frigorex East Africa 103 336 1.272 1.101
Frigoglass SA 68 1
3P Frigoglass 150 82 47 -78 1.000
Frigorex Cyprus 2.221 6.000 12.000
Frigoglass Industries 12
Beta Glass 16
Letel Holdings 7.000 7.000
Coolinvest Holdings 10.350 9.500
Norcool Holdings 10.500 10.500
3P Hellas Ltd 2.819 3.602
Nigerinvest Holdings 1.376 881 17.500 17.500
Deltainvest Holdings 2.632 1.018
Norcool AS 3.161
Crown International 311
VPI SA 1.011 1.012 50 26 24.192 28.594
Total 9.972 6.871 31.670 30.514 705 2.341 124.237 136.812
Supplementary Information F - Group (see Note 27 )
Dividend Income Receivables Payables Corporate Guaranties
Name of the company Dec.2005 Dec.2004 Dec.2005 Dec.2004 Dec.2005 Dec.2004 Dec.2005 Dec.2004
(Intergroup Transaction from 01/01 ) According to the Article-2, paragraph 4 of N/3016/2002
Supplementary Information F - Parent Company - (in € 000’s) (continued from previous page)

80 81
(Translation from the Greek Language original)
BOARD OF DIRECTORS REPORT
To the Annual General Meeting of the shareholders of FRIGOGLASS SAIC
Concerning the Consolidated Financial Statements for the year ended 31.12.2005
Kifissia, 23 February 2006
Dear Shareholders,
In conjunction with the submission, for your approval, of the Consolidated Financial Statements for the fiscal year ended 31st December
2005, we submit the present Directors’ report, concerning the consolidated financial performance of the Group.
General
The present fiscal year is the tenth consecutive one for which consolidated statements are prepared and concerns the period from the1st
January 2005 until the 31st December 2005.
Taking into account the Group’s activities, the Balance Sheet, the Income Statement, the Statement of Changes in Equity and the Cash
Flow Statement, which have been prepared according to IFRS as adopted by the European Union, the Board of Directors would like to
inform you of the following:
Strong sales growth, improved operating margins, further improvement in the rationalisation of the effective tax rate and reduced
financing costs, combined to raise full year net earnings to € 24,3 million, up 68,5% over 2004.
In line with the Capital Redeployment Plan, the sale of Frigoglass’ 51% stake in VPI will free up resources that will enable the Group
to focus on its core business, improve operating performance and yield significant cash. VPI will be consolidated into Frigoglass
Group results until February 28th, 2006. The sale of our stake in VPI is part of Frigoglass’ strategy to focus on its core business, from
which the Group expects to achieve greater returns and maximize shareholder value. The revenues from the sale will be used for
repayment of loans.
EBITDA from continuing operations before losses from restructuring activities increased by 22% and reached € 60,6m compared
to € 49,7m in year 2004.
Consolidated Profit before Tax and before Minority interest reached € 37,7m, an increase of 46, 3% in comparison to 2004.
Consolidated Profit After Tax and After Minority interests for all operations reached € 24,3m compared to € 14,4m in 2004,
increasing by 68,5%.
Consolidated Group Sales from Continuing Operations reached € 306,8m, increasing by 16,13% relative to 2004.
The aforementioned increase was due to sales increases in the commercial refrigeration division, whereas the sales of the Nigeria
division remained at the same level with last year.
Group Capital investments for 2005 reached € 17m and were focused primarily on increasing production capacity, driving the
quality and competitiveness of Frigoglass products and services and improving the Group’s operating efficiency. Specifically, key Capex
investments focused on equipment and machinery in the Cool operations and on equipment in the glass operation in Nigeria.
In 2005, the total Net Book value of the Group’s Fixed Assets reduced by € 35,5m due to the transfer of VPI’s fixed assets in the
balance sheet account “Assets Held for Sale”. Without this reclassification, the total Net Book value of the Fixed Assets for 2005
increased by € 1,5m as a result of the Group’s 2005 Capex plans.
Trade Debtors reduced by € 9,8m compared to the previous year after transferring VPI’s trade debtors in the balance sheet account
“Assets Held for Sale”. Without this reclassification, trade debtors increased € 5,9m (a 10% increase).
Average days of sales outstanding improved by 5 days for the Group and by 9 days for the commercial refrigeration operations with
respect to the previous year.

82 83
Net Working Capital (Trade Debtors + Inventory - Trade Creditors)
Working Capital management improved the average annual Net Trade Sales to Net Working Capital ratio by 3, 1% compared to 2004.
Significant improvements were achieved in the collection of receivables, while our payables management remained satisfactory. On the
other hand, inventory value increased, partially due to the raw material price increases but primarily due to the build up of finished goods
inventory at the end of the year, in order to cope with the increased demand for the first half of 2006.
Long - term and short - term borrowings at year end reached € 80,5m compared to € 111,0m in 2004. This corresponds to a € 30,5m
reduction, given the transfer of VPI’s debt obligations in the balance sheet account “Liabilities Associated with Assets Held for Sale”.
Without this transfer, total Group borrowings reduced by € 12m as a result of more efficient working capital management.
Other Information
No significant events took place during the period between the preparation of the Balance Sheet of the companies included in the
consolidation and the date of preparation of the consolidated financial statements.
No significant losses are present at the time of our report’s submission, nor are any expected to occur in the future as a result of
possible events.
No significant events have occurred from the end of the fiscal year under consideration and until the time of this report’s submission.
According to our estimates for the year 2006, and based on the current progress of the Group’s activities, the consolidated sales and
consolidated profits of the Group are expected to increase.
Based on the above, on the audit report and on the annual financial statements of 31st December 2005, we consider that all the available
information is at your disposal so as to proceed with the approval of the consolidated financial statements for the fiscal year that ended
on 31st December 2005 and to relieve the Board of Directors and the auditors of any further responsibility.
Yours Faithfully,
THE BOARD OF DIRECTORS
Exact copy from Register of the minutes of Board of Directors Meetings
Dimitrios P. Lois - Managing Director

82 83
(Translation from the Greek Language original) BOARD OF DIRECTORS REPORT
To the Annual General Meeting of the Shareholders of FRIGOGLASS SAIC
Concerning the Company Financial Statements for the year ended 31.12.2005
Kifissia, 23 February 2006
Dear Shareholders,
In conjunction with the submission, for your approval, of the Company Financial Statements for the fiscal year ended December 31st,
2005, we submit the present report concerning the financial performance of the company.
General
The present fiscal year is the twelfth consecutive one for which financial statements are prepared and concerns the period from January
1st, 2005 to December 31st, 2005.
During the above-mentioned financial year, the company’s activities were in accordance with the current legislation, as defined in the
company’s Articles of Association.
The Balance Sheet, the Income Statement, the Statement of Changes in Equity and the Cash Flow Statement of the above - mentioned
financial year, which have been published and are submitted to the Annual General Meeting of the Shareholders, have been prepared
according to IFRS as adopted by the European Union.
The Board of Directors, attempting an overview of the company’s operations, the Balance sheet and the Income statement, would like
to inform you of the following:
The Company’s Net Sales reached € 61,5m, and increased by 23,6% compared to the previous year. The increase is mainly attributable
to the increased sales volume of new products.
Gross Profit amounted to € 8,8m, compared to € 4,8m in 2004, increased by 83% as a result of increased sales volume.
Earnings Before Tax reached € 10,2m, and increased by 56,6% compared to 2004, mainly due to the increase in gross profit and
dividends from subsidiaries.
Earnings after Tax increased by 57% to reach € 7,7m.
The increase in investments in Fixed Assets for 2005 was € 2m and primarily concerned machinery and equipment.
The increase in Intangible Assets amounted to € 1,6m derived mainly from the purchase and installation of new computer software
and the capitalisation of new product development expenditure.
Our Investments in Subsidiaries amounted to € 44,9m; lower than 2004, since the investment in VPI has been transferred to the
balance sheet account “Assets Held for Sale”.
The Company’s Working Capital (the net balance of inventories, trade debtors and trade creditors) decreased by € 1m to € 10,1m
compared to 2004, as a result of more efficient inventory management.
Trade Debtors increased by € 2,8m, mainly due to 2005 Q4’s increased sales of €8m versus the same quarter of 2004.
Inter-group Receivables increased by € 1,2m as charges for technical and managerial support grew and as the triangular trade
transactions of the Parent Company in Greece with its subsidiaries in Germany and Romania also increased.
Other Debtors include receivables from the State and increased by € 4,5m mainly due to VAT receivable and Income Tax prepaid. The
Company has already requested a VAT rebate of € 6,8m.

84 85
Other information
No significant events have occurred from the end of the fiscal year under consideration to the date of this report that have any affect
on the reported fiscal year.
No significant losses are present at the time of our report’s submission, nor are any expected to occur in the future as a result of possible events.
According to our estimates for the year 2006, and based on the current progress of the company’s activities, this year’s performance
is expected to be satisfactory.
Based on the above, on the audit report and on the annual financial statements of December 31st, 2005, we consider that all the
available information is at your disposal so as to proceed with the approval of the financial statements for the fiscal year that ended on
December 31st, 2005 and to relieve the Board of Directors and the auditors of any further responsibility.
Yours Faithfully,
THE BOARD OF DIRECTORS
Exact copy from register of the minutes of Board of Directors Meetings
Dimitrios P. Lois - Managing Director

84 85
Information regarding the Article 10 of Law 3401/2005
The below - mentioned Press Releases / Announcements have been sent to the Daily Official List Announcements and may be retrieved from the ATHEX webpage as well as in the company’s webpage: www.frigoglass.com
DECEMBER 30, 2005 RESOLUTIONS OF THE EXTRAORDINARY GENERAL MEETING OF THE SHAREHOLDERS OF “FRIGOGLASS S.A.I.C.”
DECEMBER 15, 2005 SALE OF V.P.I. S.A. SHAREHOLDING
DECEMBER 7, 2005 FRIGOGLASS S.A.I.C.: INVITATION OF THE SHAREHOLDERS TO AN EXTRAORDINARY GENERAL MEETING
NOVEMBER 16, 2005 RESULTS FOR THE NINE MONTHS ENDED 30 SEPTEMBER 2005: SUSTAINED STRONG SALES AND PROFIR GROWTH
OCTOBER 31, 2005 FRIGOGLASS ANNOUNCEMENT OF 9 MONTHS 2005 IFRS RESULTS
AUGUST 9, 2005 RESULTS FOR THE SIX MONTHS ENDED 30 JUNE 2005: CONTINUED STRONG SALES AND PROFITABILITY GROWTH
AUGUST 1, 2005 ANNOUNCEMENT REGARDING BUSINESS DEVELOPMENTS AT FRIGOGLASS
JULY 28, 2005 FRIGOGLASS ANNOUNCEMENT OF FIRST HALF 2005 RESULTS
JUNE 15, 2005 ANNOUNCEMENT OF THE DIVIDEND FOR THE YEAR 2004
JUNE 10, 2005 RESOLUTIONS OF THE ANNUAL GENERAL MEETING OF THE SHAREHOLDERS OF “FRIGOGLASS S.A.I.C.” OF 10 JUNE 2005
JUNE 10, 2005 ANNOUNCEMENT OF THE DIVIDEND FOR FRIGOGLASS OF THE YEAR 2004
MAY 24, 2005 RESULTS FOR THE THREE MONTHS ENDED 31 MARCH 2005:STRONG SALES AND MARGIN GROWTH
MAY 18, 2005 INVITATION TO THE SHAREHOLDERS OF THE SOCIETE ANONYME UNDER THE TRADENAME “FRIGOGLASS S.A.I.C” TO AN ANNUAL GENERAL MEETING
MAY 11, 2005 RESOLUTIONS OF EXTRAORDINARY GENERAL MEETING
MAY 9, 2005 FRIGOGLASS SA ANNOUNCEMENT OF FIRST QUARTER 2005 & FULL YEAR 2004 IFRS RESULTS
FEBRUARY 22, 2005 RESULTS FOR THE YEAR ENDED 31 DECEMBER 2004STRONG REVENUE AND PROFIT GROWTH - PROMISING OUTLOOK
JANUARY 31, 2005 FRIGOGLASS SCHEDULES FULL - YEAR 2004 RESULTS
You may retrieve the financial statements of those subsidiaries whose country/local statutory system provides the option for reporting under IFRS In the company’s webpage: www.frigoglass.com.

86
FRIGOGLASS S.A.I.C.COMMERCIAL REFRIGERATORS
SUMMARY FINANCIAL STATEMENTS for the year ended 31 December 2005(In terms of article 135 of Law 2190, for the companies publishing annual financial statements in accordance with IAS/IFRS)
The following information aims to provide a broad overview of the financial position and results of FRIGOGLASS S.A.I.C. and its subsidiaries. We advise the reader, before entering into any investment or other transaction with the company, to visit the company's site wherethe full financial statements and notes for the year, prepared in accordance with IFRS, together with the auditor's report can be found.
COMPANY's STATUTORY INFORMATION
BALANCE SHEET as at 31 DECEMBER 2005
STATEMENT OF CHANGES IN EQUITY for the year 1 January - 31 December 2005
CASH FLOW STATEMENT for the year 1 January - 31 December 2005
INCOME STATEMENT for the year 1 January - 31 December 2005
ADDITIONAL INFORMATION
Head Office and Registered Address: 15, A. Metaxa Street, GR -145 64 Kifissia, AthensCompany's Number in the Register of Societes Anonymes: 29454/06/Β/93/32Supervising Authority: Ministry of Development (Department for Limited companies)Board of Directors: Chairman : D. Krontiras
Vice Chairman : Ι. AndroutsopoulosManaging Director - executive member : D. LoisSecretary - non-executive member : L. KomisMember - non-executive : V. FourlisMember - non-executive : H. DavidMember - non-executive : Α. PapalexopoulouMember - non-executive : H.H. LeventisMember - non-executive : S.I. Toubassy
Date of Approval of the Financial Statements : 23 February 2006Auditor's Name: Kyriacos RirisAuditors Firm: PricewaterhouseCoopersReport of the Auditors: Without qualification
Company's Web Address: www.frigoglass.com
(Amounts in thousand euro) GROUP COMPANY
ASSETS: 31/12/05 31/12/04 31/12/05 31/12/04
Total Fixed Assets 158.218 156.673 17.890 17.859
Investments in Subsidiaries 0 0 57.893 57.893
Deferred income tax assets 1.241 814 0 0
Other Long term assets ~~1.204 ~~~251 ~~~156 ~~~173Total non current assets 160.663 157.738 75.939 75.925Inventories 93.244 74.990 9.271 10.627
Trade Debtors 65.482 59.566 9.463 6.707
Other Debtors 29.912 22.351 12.529 8.003
Intergroup receivables 0 0 31.670 30.514
Cash at banks & in hand ~12.611 ~10.420 ~~~393 ~~~584Total Current Assets 201.249 167.327 63.326 56.435Total Assets 361.912 325.065 139.265 132.360
LIABILITIES:
Long term borrowings 20.808 35.531 17.000 29.000
Deferred income tax liabilities 10.741 11.230 572 2.334
Retirement benefit obligations 13.886 11.326 5.821 4.083
Provisions for other liabilities & charges 6.421 3.379 3.462 1.032
Deferred income from government grants ~~5.198 ~~5.619 ~~~251 ~~152Total Non current Liabilities ~57.054 ~67.085 ~27.106 ~36.601Trade creditors 37.899 34.038 8.602 6.148
Other creditors 28.577 15.729 5.376 2.777
Current income tax liabilities 5.945 4.770 3.065 1.155
Intergroup payables 0 0 705 2.341
Short term borrowings ~77.863 ~75.465 ~17.107 ~~6.976Total Current Liabilities 150.284 130.002 34.855 19.397Total Liabilities 207.338 197.087 61.961 55.998
EQUITY:
Equity 117.484 ~94.292 ~77.304 ~76.362Minority Interest ~37.090 ~33.686 ~~~~`0 ~~~~`0Total Equity 154.574 127.978 77.304 76.362TOTAL LIABILITIES AND EQUITY 361.912 325.065 139.265 132.360
(Amounts in thousand euro) GROUP COMPANY31/12/05 31/12/04 31/12/05 31/12/04
Opening balance 01/01 2004 & 2005 127.978 116.793 76.362 74.415Dividends to Company's shareholders -5.600 -4.000 -5.600 -4.000 Disposal of treasury shares 0 748 0 748 Actuarial losses net of deferred taxes -1.174 -1.174 Net Income recognised directly in equity 258 280 0 280 Profit for the year 26.208 17.430 7.716 4.919 Acquisition of minority 0 -2.724 0 0 Currency translation difference 8.073 1.243 0 0 Dividends to minorities ~-1.169 ~-1.792 ~~~~`0 ~~~~`0Closing balance 31/12 2004 & 2005 154.574 127.978 77.304 76.362
(Amounts in thousand euro) GROUP COMPANYFor the year ended For the year ended
31/12/05 31/12/04 31/12/05 31/12/04Cash Flow from Operating activitiesProfit before Tax 38.844 30.801 11.170 7.497 Adjustments for:Depreciation 22.285 21.809 3.812 3.429 Provisions 8.782 8.135 3.142 1.182 Dividend income 0 0 -9.972 -6.871 Exchange difference 411 1.334 0 0 Changes in working capital: Decrease / (increase) in inventories -18.254 -2.057 1.356 765 Decrease / (increase) in Trade debtors -5.916 -8.568 -2.756 2.908 Decrease / (increase) in intergroup receivables 0 0 -1.156 -20.829 Decrease / (increase) in other receivables -7.863 -4.432 -4.526 -495 (Decrease) / increase in suppliers 3.861 6.005 2.454 1.528 (Decrease) / increase in intergoup payables 0 0 -1.636 2.378 (Decrease) / increase in other liabilities (except borrowings) 9.037 621 1.863 570 Less:Income tax paid -12.812 -9.124 -2.873 -1.549(a) Net Cash generated from Operating activities 38.375 44.524 ~~878 -9.487
Cash Flow from Investing activitiesPurchase of property, plant & equipment -15.230 -28.345 -2.005 -2.874 Purchase of intangible assets -1.868 -3.185 -1.574 -2.344 Proceeds from subsidiaries share capital return 0 0 0 4.804 Proceeds from investment disposal 0 0 0 1.050 Proceeds from disposal of property, plant, equipment and intangible assets 0 0 0 1.055 Dividends received ~~~~`0 ~~~~`0 ~9.972 ~6.871(b) Net Cash generated from Investing activities -17.098 -31.530 6.393 8.562
Net Cash generated from Operating and Investing activities 21.277 12.994 7.271 -925
Cash Flow from Financing activitiesIncrease / (Decrease) in Borrowing -12.325 -5.679 -1.870 5.036 Dividends paid to the Company's shareholders -5.592 -3.972 -5.592 -3.972 Dividends paid to minority interests ~-1.169 ~-1.792 ~~~~`0 ~~~~`0(c) Net Cash generated from Financing activities -19.086 -11.443 -7.462 1.064
Net increase (decrease) in cash and cash equivalents (a)+ (b) + ( c ) ~~2.191 ~~1.551 ~~-191 ~~~139Cash and cash equivalents at the beginning of the year ~10.420 ~~8.869 ~~~584 ~~~445Cash and cash equivalents at the end of the year ~12.611 ~10.420 ~~~393 ~~~584
(Amounts in thousand euro) GROUP COMPANYFrom: 01/ 01 to From: 01/ 01 to
31/12/05 31/12/04 31/12/05 31/12/04Sales 389.782 340.297 61.554 49.801Gross Profit 98.002 86.839 8.767 4.781Earnings before taxes, interest expense & depreciation and amortisation (EBITDA) 67.440 59.675 6.424 5.366Earnings before taxes, interest expense 43.044 37.866 2.612 1.937Dividend income 0 0 9.972 6.871 Finance cost -4.200 -7.065 -1.414 -1.311 Profit before income tax 38.844 30.801 11.170 7.497 Less: Income Tax -12.636 -13.371 -3.454 -2.578 Profit for the year after income tax expenses 26.208 17.430 7.716 4.919 Attributable as follows:Minority interest 1.923 3.014 0 0Shareholders of the Company 24.285 14.416 7.716 4.919Earnings per share attributable to the shareholders of the Company during the year (in euro) 0,61 0,36 0,19 0,12 Proposed Dividend per share (in euro) 0,20 0,14
1.Group companies that are included in the consolidated financial statements with their respective locations, percentage of ownership as well as theinformation regarding the fiscal years unaudited by the Tax authorities by company are listed below:
Note: For certain countries, tax audit is not compulsory and is performed only under specific conditions.
Consolidation Percentage Fiscal YearsCompany Name Country Method in Group % UnauditedFrigoglass S.A.I.C. - Parent Company Hellas Full Parent 2000-2005Frigoglass Romania SRL Romania Full 100% 2005Frigorex Indonesia PT Indonesia Full 100% 2005Frigoglass South Africa Ltd S. Africa Full 100% 2003-2005Frigoglass Eurasia LLC Russia Full 100% 2005Scandinavian Appliances A.S Norway Full 100% 2005Frigoglass Ltd. Ireland Full 100% 1999-2005Frigoglass Iberica SL Spain Full 100% 1999-2005Frigoglass Sp zo.o Poland Full 100% 2002-2005Frigoglass India PVT.Ltd. India Full 100% 2002-2005VPI ΑΒΕΕ Hellas Full 51% 2001-2005Beta Glass Plc. Nigeria Full 53.7% 2005Frigoglass Industries (Nig.) Ltd Nigeria Full 75.91% 1999-2005TSG Nigeria Ltd. Nigeria Full 54.8% 1999-2005Beta Adams Plastics Nigeria Full 75.91% 1999-20053P Frigoglass Romania SRL Romania Full 100% 2005Frigorex East Africa Ltd. Kenya Full 100% 2002-2005Frigoglass GmbH Germany Full 100% 2005Frigoglass Nordic Norway Full 100% 2005Frigoglass France SA France Full 100% 2003-2005Coolinvest Holding Limited Cyprus Full 100% 1997-2005Frigorex Cyprus Limited Cyprus Full 100% 1997-2005Letel Holding Limited Cyprus Full 100% 1997-2005Norcool Holding A.S Norway Full 100% 1999-2005Nigerinvest Holding Limited Cyprus Full 100% 1997-2005Deltainvest Holding Limited Cyprus Full 100% 1997-2005
The companies 3P HELLAS S.A., Ticara Holding S.A and Africoinvest Holding Limited, holding companies, were not consolidated in present financialstatements, as at 31/12/2004, due to cease of operations.2. The published Financial Statements present both the continuing operations and the non-continuing PET operations.3. The main accounting principles as of the balance sheet of 31.12.2004 have been applied. There has been a re-classifications in the accounts of
the financial statements of the year ended 31.12.2004, according to IFRS, so as to be comparable with those in the statements of the year ended31.12.2005. The re-classifications had no effect on earnings, total assets or total liabilities of the Company or the Group.
4. The pledges on the Group's assets at 31.12.2005 stand at euro 7 mil. There are no pledges on the Parent company's assets. 5. Capital expenditure for the year 2005 stood at: Group: euro 17 mil. (2004: euro 31.5 mil ), Parent company euro 3.6 mil.(2004: euro 5.2 mil.).6. There are no litigation matters which have a material impact on the financial position or operation of the Company and the Group.7. The average number of employees for the period stood at: Group 4,424 employees and Parent Company 431 employees.8. The amounts of sales and purchases and outstanding balances of receivables and payables of the Company to and from its related parties
(according to the provisions of IAS 24) for the period 01.01.2005 - 31.12.2005 were as follows:31/12/2005
Group Companya) Sales of goods and services 17. 631 23.898 b) Receivables from related parties 17.423 5.368 c) Purchases from and payables to related parties 0 0 d) Intergroup Sales of goods and services 0 42.355 e) Dividend income from subsidiaries 0 9.972 f) Receivables from subsidiaries 0 31.670 g) Intergroup Purchases of goods and services 0 9.634 h) Payables to subsidiaries 0 705
9. On December 15, 2005 Frigoglass announced the sale of its stockholding in VPI S.A. Frigoglass is a stockholder of 51% of VPI S.A. based at thecity of Volos.
10. Earnings Per Share have been calculated based on the weighted average number of shares during the year.
Κifisia, 23 February 2006
THE CHAIRMAN OF THE BOARD OF DIRECTORS THE MANAGING DIRECTOR
DIMITRIOS P. KRONTIRAS DIMITRIOS P. LOIS
THE GROUP CHIEF FINANCIAL OFFICER THE FINANCE MANAGER
PANAGIOTIS D. TABOURLOS VASSILIOS Α. STERGIOU