ANNUAL WORKFORCE REPORT First Quarter FISCAL YEAR 2020-21 State of Michigan Civil Service Commission Civil Service Commissioners: Janet McClelland, Chair James Barrett Jase Bolger Jeff Steffel Janine M. Winters, State Personnel Director

Welcome message from author
This document is posted to help you gain knowledge. Please leave a comment to let me know what you think about it! Share it to your friends and learn new things together.
Transcript
ANNUAL WORKFORCE REPORT
First Quarter
FISCAL YEAR 2020-21
State of Michigan Civil Service Commission
Civil Service Commissioners:
Janet McClelland, Chair James Barrett
Jase Bolger Jeff Steffel
Janine M. Winters, State Personnel Director

STATISTICAL HIGHLIGHTS First Quarter FY 2020-21
PROFILE OF CLASSIFIED EMPLOYEES
Average Age .................................................................................................... 45.1 Average Annual Salary 1 ............................................................................ $66,002 Average Years of Service ................................................................................ 11.9
WORK FORCE CHARACTERISTICS
Females ........................................................................................................ 54.2% Males ............................................................................................................. 45.8% Eligible for Longevity ..................................................................................... 64.3% Less than Six Years of Service ..................................................................... 34.2% Six to Ten Years of Service ........................................................................... 20.1% Over Ten Years of Service ............................................................................ 45.7% Exclusively Represented for Collective Bargaining ....................................... 68.3%
FEDERALLY DEFINED RACE/ETHNIC GROUP DISTRIBUTION
American Indian or Alaska Native ................................................................... 1.0% Asian ............................................................................................................... 1.7% Black or African American ............................................................................. 18.2% Hispanic or Latino ........................................................................................... 3.0% Native Hawaiian or Other Pacific Islander ....................................................... 0.1% Two or More Races ......................................................................................... 0.6% White ............................................................................................................. 75.4%
1 Average annual salary is calculated based on each employee’s hourly rate of pay multiplied by 2,088 hours, regardless of their work schedule.
i
ii
TABLE OF CONTENTS
STATISTICAL HIGHLIGHTS ..................................................................................................................................... i
TABLE OF CONTENTS ............................................................................................................................................ ii
SECTION ONE - TRENDS IN THE STATE CLASSIFIED WORK FORCE
Table 1-1 - Active Classified Employees by Employee Status ....................................................................... 1-1
Table 1-2 - Full-Time Equated Position Report by Department ...................................................................... 1-5
Table 1-3 - Number and Percent of Active Classified Employees by Department ......................................... 1-9
Table 1-4 - Fiscal Year to Date Average Number of Active Classified Employees by Department .............. 1-10
SECTION TWO - CHARACTERISTICS OF CLASSIFIED EMPLOYEES
Table 2-1 - Average Age, Average Pay Rate, and Longevity Analysis by Department .................................. 2-1
Table 2-4 - Active Classified Employees Enrolled in State Sponsored Insurance Plans by Department ....... 2-2
Table 2-10 - Age Distribution for Active Classified Employees by Department and Statewide ........................ 2-4
Graph 2-4 - Employment Trend of Job Categories, Fiscal Years 2016-17 through First Quarter 2021 .......... 2-5
Table 2-11 - Active Classified Employees by Work County ............................................................................... 2-6
SECTION THREE - EMPLOYEE CONTINUITY OVERVIEW
Graph 3-1 - Average Years of Service by Department .................................................................................... 3-1
Table 3-1 - Active Classified Employee Distribution by Department and Years of Service, Race/Ethnic Group, Gender, and Disability Analysis ........................................................................................ 3-2
Table 3-2 - Statewide Separations by Reason, First Quarter 2021 .............................................................. 3-24
Table 3-3 - New Hires, Returns and Separations by Department ................................................................. 3-25
SECTION FOUR - EQUAL EMPLOYMENT OPPORTUNITY REPORTING
SECTION FIVE - BARGAINING UNIT CHARACTERISTICS
Graph 5-1 - Breakdown of State Classified Employment by Bargaining Unit .................................................. 5-1
Table 5-1 - Active Employees Paying Union Dues by Bargaining Unit ........................................................... 5-2
Graph 5-2 - Average Years of Service by Bargaining Unit .............................................................................. 5-3
Table 5-2 - Active Classified Employee Distribution by Bargaining Unit and Years of Service, Race/Ethnic Group, Gender, and Disability Analysis ................................................................... 5-4
iii
Table 5-3 - Average Age, Average Pay Rate, and Longevity Analysis by Bargaining Unit .......................... 5-20
Table 5-4 - Active Classified Employees Enrolled in State Sponsored Insurance Plans by
Bargaining Unit ........................................................................................................................... 5-21
Table 5-9 - Bargaining Unit Analysis by Department, Exclusively Represented .......................................... 5-23
Table 5-10 - Bargaining Unit Analysis by Department, Non-Exclusively Represented ................................... 5-24
GLOSSARY
Glossary ........................................................................................................................................................ G-1
SECTION ONE
TRENDS IN THE
STATE CLASSIFIED WORKFORCE
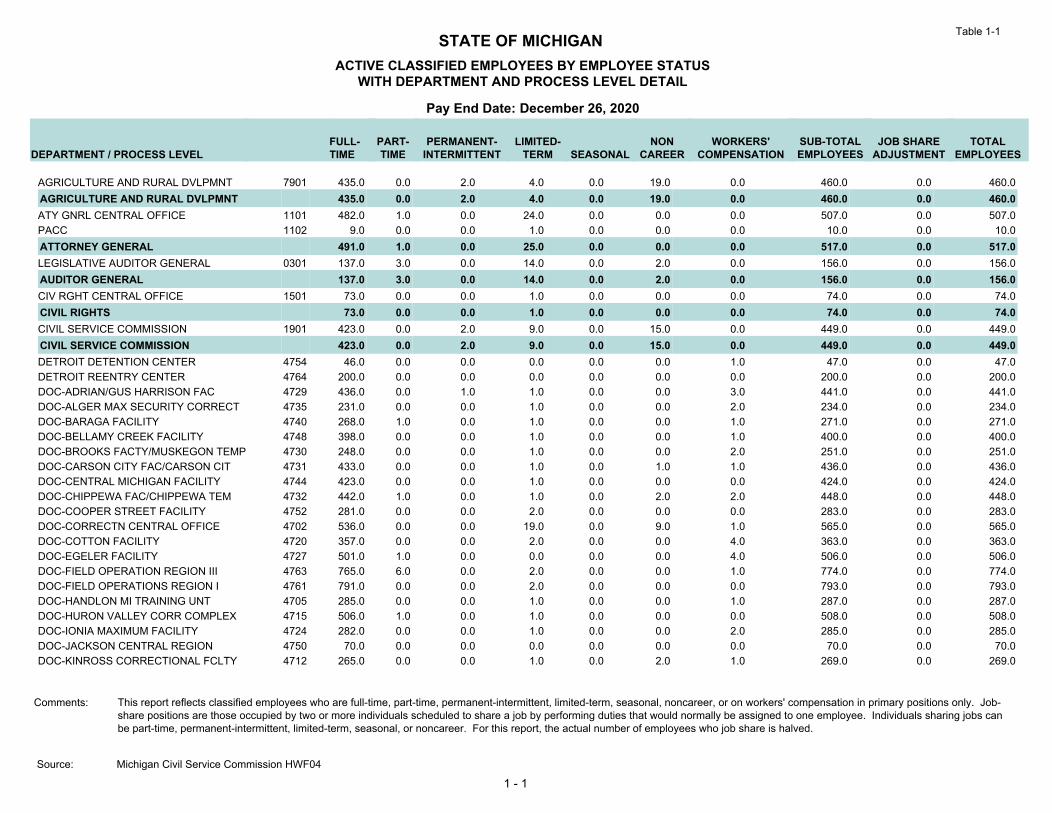
STATE OF MICHIGANACTIVE CLASSIFIED EMPLOYEES BY EMPLOYEE STATUS
WITH DEPARTMENT AND PROCESS LEVEL DETAIL
Pay End Date: December 26, 2020
TOTALEMPLOYEES
SUB-TOTALEMPLOYEES
NONCAREERSEASONAL
LIMITED-TERM
PERMANENT-INTERMITTENT
PART-TIME
FULL-TIMEDEPARTMENT / PROCESS LEVEL
JOB SHAREADJUSTMENT
WORKERS'COMPENSATION
Table 1-1
AGRICULTURE AND RURAL DVLPMNT 7901 435.0 0.0 2.0 4.0 0.0 19.0 0.0 460.0 0.0 460.0AGRICULTURE AND RURAL DVLPMNT 435.0 0.0 2.0 4.0 0.0 19.0 0.0 460.0 0.0 460.0ATY GNRL CENTRAL OFFICE 1101 482.0 1.0 0.0 24.0 0.0 0.0 0.0 507.0 0.0 507.0PACC 1102 9.0 0.0 0.0 1.0 0.0 0.0 0.0 10.0 0.0 10.0ATTORNEY GENERAL 491.0 1.0 0.0 25.0 0.0 0.0 0.0 517.0 0.0 517.0LEGISLATIVE AUDITOR GENERAL 0301 137.0 3.0 0.0 14.0 0.0 2.0 0.0 156.0 0.0 156.0AUDITOR GENERAL 137.0 3.0 0.0 14.0 0.0 2.0 0.0 156.0 0.0 156.0CIV RGHT CENTRAL OFFICE 1501 73.0 0.0 0.0 1.0 0.0 0.0 0.0 74.0 0.0 74.0CIVIL RIGHTS 73.0 0.0 0.0 1.0 0.0 0.0 0.0 74.0 0.0 74.0CIVIL SERVICE COMMISSION 1901 423.0 0.0 2.0 9.0 0.0 15.0 0.0 449.0 0.0 449.0CIVIL SERVICE COMMISSION 423.0 0.0 2.0 9.0 0.0 15.0 0.0 449.0 0.0 449.0DETROIT DETENTION CENTER 4754 46.0 0.0 0.0 0.0 0.0 0.0 1.0 47.0 0.0 47.0DETROIT REENTRY CENTER 4764 200.0 0.0 0.0 0.0 0.0 0.0 0.0 200.0 0.0 200.0DOC-ADRIAN/GUS HARRISON FAC 4729 436.0 0.0 1.0 1.0 0.0 0.0 3.0 441.0 0.0 441.0DOC-ALGER MAX SECURITY CORRECT 4735 231.0 0.0 0.0 1.0 0.0 0.0 2.0 234.0 0.0 234.0DOC-BARAGA FACILITY 4740 268.0 1.0 0.0 1.0 0.0 0.0 1.0 271.0 0.0 271.0DOC-BELLAMY CREEK FACILITY 4748 398.0 0.0 0.0 1.0 0.0 0.0 1.0 400.0 0.0 400.0DOC-BROOKS FACTY/MUSKEGON TEMP 4730 248.0 0.0 0.0 1.0 0.0 0.0 2.0 251.0 0.0 251.0DOC-CARSON CITY FAC/CARSON CIT 4731 433.0 0.0 0.0 1.0 0.0 1.0 1.0 436.0 0.0 436.0DOC-CENTRAL MICHIGAN FACILITY 4744 423.0 0.0 0.0 1.0 0.0 0.0 0.0 424.0 0.0 424.0DOC-CHIPPEWA FAC/CHIPPEWA TEM 4732 442.0 1.0 0.0 1.0 0.0 2.0 2.0 448.0 0.0 448.0DOC-COOPER STREET FACILITY 4752 281.0 0.0 0.0 2.0 0.0 0.0 0.0 283.0 0.0 283.0DOC-CORRECTN CENTRAL OFFICE 4702 536.0 0.0 0.0 19.0 0.0 9.0 1.0 565.0 0.0 565.0DOC-COTTON FACILITY 4720 357.0 0.0 0.0 2.0 0.0 0.0 4.0 363.0 0.0 363.0DOC-EGELER FACILITY 4727 501.0 1.0 0.0 0.0 0.0 0.0 4.0 506.0 0.0 506.0DOC-FIELD OPERATION REGION III 4763 765.0 6.0 0.0 2.0 0.0 0.0 1.0 774.0 0.0 774.0DOC-FIELD OPERATIONS REGION I 4761 791.0 0.0 0.0 2.0 0.0 0.0 0.0 793.0 0.0 793.0DOC-HANDLON MI TRAINING UNT 4705 285.0 0.0 0.0 1.0 0.0 0.0 1.0 287.0 0.0 287.0DOC-HURON VALLEY CORR COMPLEX 4715 506.0 1.0 0.0 1.0 0.0 0.0 0.0 508.0 0.0 508.0DOC-IONIA MAXIMUM FACILITY 4724 282.0 0.0 0.0 1.0 0.0 0.0 2.0 285.0 0.0 285.0DOC-JACKSON CENTRAL REGION 4750 70.0 0.0 0.0 0.0 0.0 0.0 0.0 70.0 0.0 70.0DOC-KINROSS CORRECTIONAL FCLTY 4712 265.0 0.0 0.0 1.0 0.0 2.0 1.0 269.0 0.0 269.0
1 - 1
Comments: This report reflects classified employees who are full-time, part-time, permanent-intermittent, limited-term, seasonal, noncareer, or on workers' compensation in primary positions only. Job-share positions are those occupied by two or more individuals scheduled to share a job by performing duties that would normally be assigned to one employee. Individuals sharing jobs can be part-time, permanent-intermittent, limited-term, seasonal, or noncareer. For this report, the actual number of employees who job share is halved.
Michigan Civil Service Commission HWF04Source:

STATE OF MICHIGANACTIVE CLASSIFIED EMPLOYEES BY EMPLOYEE STATUS
WITH DEPARTMENT AND PROCESS LEVEL DETAIL
Pay End Date: December 26, 2020
TOTALEMPLOYEES
SUB-TOTALEMPLOYEES
NONCAREERSEASONAL
LIMITED-TERM
PERMANENT-INTERMITTENT
PART-TIME
FULL-TIMEDEPARTMENT / PROCESS LEVEL
JOB SHAREADJUSTMENT
WORKERS'COMPENSATION
Table 1-1
DOC-LAKELAND MENS FACILITY 4718 272.0 0.0 0.0 1.0 0.0 0.0 0.0 273.0 0.0 273.0DOC-MACOMB FACILITY 4741 305.0 2.0 0.0 0.0 0.0 1.0 0.0 308.0 0.0 308.0DOC-MARQUETTE BRANCH PRISON 4706 312.0 1.0 0.0 1.0 0.0 0.0 1.0 315.0 0.0 315.0DOC-MAXEY CORRECTIONAL 4749 306.0 0.0 0.0 1.0 0.0 0.0 1.0 308.0 0.0 308.0DOC-MICHIGAN REFORMATORY 4707 287.0 0.0 0.0 1.0 0.0 1.0 0.0 289.0 0.0 289.0DOC-MICHIGAN STATE INDUSTRIES 4709 42.0 0.0 0.0 0.0 0.0 1.0 0.0 43.0 0.0 43.0DOC-MUSKEGON FACILITY 4704 210.0 0.0 0.0 1.0 0.0 0.0 2.0 213.0 0.0 213.0DOC-NEWBERRY FACILITY 4743 189.0 0.0 2.0 1.0 0.0 0.0 0.0 192.0 0.0 192.0DOC-OAKS FACILITY 4739 286.0 1.0 0.0 1.0 0.0 0.0 0.0 288.0 0.0 288.0DOC-PARNALL FACILITY 4751 267.0 0.0 0.0 11.0 0.0 0.0 1.0 279.0 0.0 279.0DOC-SAGINAW FACILITY 4742 291.0 0.0 0.0 0.0 0.0 1.0 0.0 292.0 0.0 292.0DOC-ST. LOUIS FACILITY 4733 322.0 0.0 0.0 2.0 0.0 0.0 4.0 328.0 0.0 328.0DOC-THUMB FACILITY 4725 297.0 0.0 0.0 2.0 0.0 1.0 0.0 300.0 0.0 300.0NTHRN REGION ADMIN AND SUPPORT 4714 25.0 0.0 0.0 0.0 0.0 0.0 0.0 25.0 0.0 25.0SOUTHERN REGION - IONIA 4711 23.0 0.0 0.0 0.0 0.0 0.0 0.0 23.0 0.0 23.0CORRECTIONS 11,198.0 14.0 3.0 61.0 0.0 19.0 36.0 11,331.0 0.0 11,331.0EDUCATION 3103 437.0 3.0 4.0 15.0 34.0 13.0 0.0 506.0 0.0 506.0EDUCATION 437.0 3.0 4.0 15.0 34.0 13.0 0.0 506.0 0.0 506.0ENVIRON, GREAT LAKES & ENERGY 7601 1,155.0 2.0 12.0 23.0 0.0 16.0 0.0 1,208.0 0.5 1,207.5ENVIRONMENT, GREAT LAKES & ENERGY 1,155.0 2.0 12.0 23.0 0.0 16.0 0.0 1,208.0 0.5 1,207.5OFFICE OF THE GOVERNOR 0101 0.0 0.0 0.0 74.0 0.0 1.0 0.0 75.0 0.0 75.0EXECUTIVE OFFICE 0.0 0.0 0.0 74.0 0.0 1.0 0.0 75.0 0.0 75.0DEPT OF INS AND FIN SERVICE 6501 290.0 1.0 0.0 19.0 0.0 7.0 0.0 317.0 0.0 317.0INSURANCE AND FINANCIAL SERV 290.0 1.0 0.0 19.0 0.0 7.0 0.0 317.0 0.0 317.0LEO - LABOR & ECON OPPORTUNITY 1801 1,713.0 1.0 0.0 419.0 34.0 20.0 0.0 2,187.0 0.0 2,187.0LEO - LANDBANK AUTHORITY 1802 7.0 0.0 0.0 2.0 0.0 0.0 0.0 9.0 0.0 9.0LEO - MSF-MEDC 1804 111.0 0.0 0.0 0.0 0.0 2.0 0.0 113.0 0.0 113.0LEO - MSHDA 1803 228.0 3.0 2.0 7.0 0.0 7.0 0.0 247.0 0.0 247.0LABOR & ECONOMIC OPPORTUNITY 2,059.0 4.0 2.0 428.0 34.0 29.0 0.0 2,556.0 0.0 2,556.0LICENSING & REGULATORY AFFAIRS 6401 1,495.0 2.0 11.0 23.0 0.0 23.0 0.0 1,554.0 0.0 1,554.0LICENSING & REGULATORY AFFAIRS 1,495.0 2.0 11.0 23.0 0.0 23.0 0.0 1,554.0 0.0 1,554.0MDHHS-CARO CENTER 3902 299.0 3.0 2.0 79.0 0.0 0.0 3.0 386.0 0.0 386.0
1 - 2
Comments: This report reflects classified employees who are full-time, part-time, permanent-intermittent, limited-term, seasonal, noncareer, or on workers' compensation in primary positions only. Job-share positions are those occupied by two or more individuals scheduled to share a job by performing duties that would normally be assigned to one employee. Individuals sharing jobs can be part-time, permanent-intermittent, limited-term, seasonal, or noncareer. For this report, the actual number of employees who job share is halved.
Michigan Civil Service Commission HWF04Source:
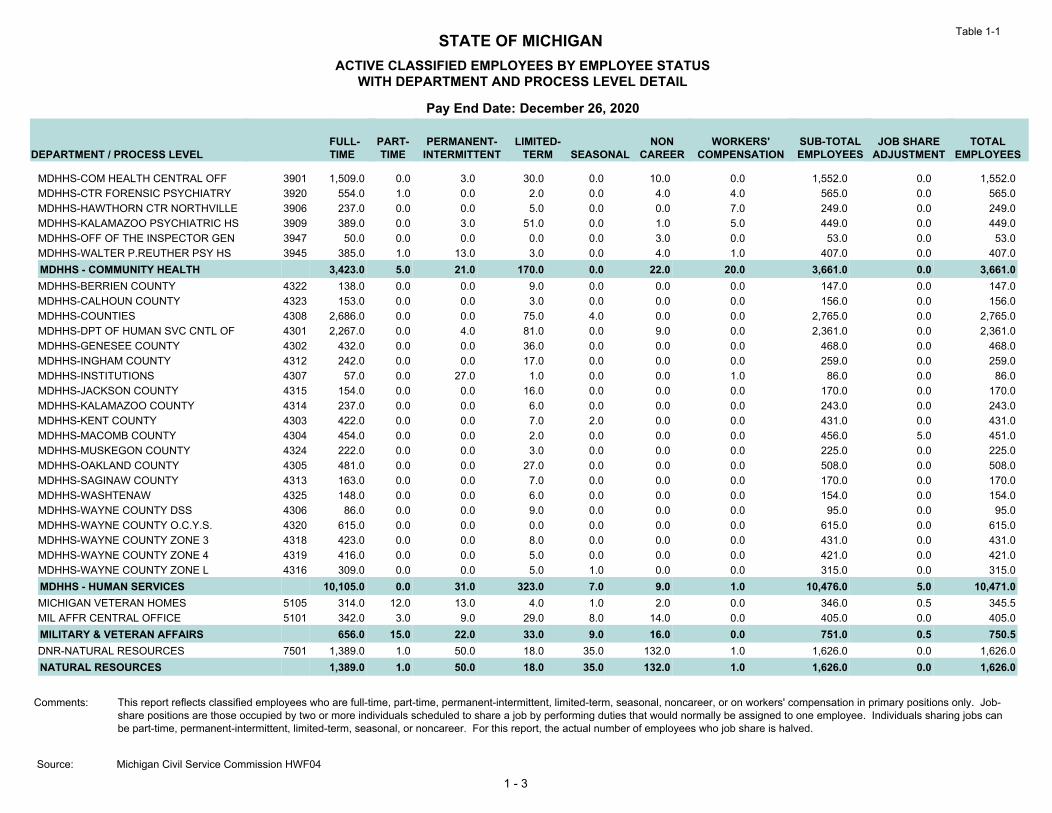
STATE OF MICHIGANACTIVE CLASSIFIED EMPLOYEES BY EMPLOYEE STATUS
WITH DEPARTMENT AND PROCESS LEVEL DETAIL
Pay End Date: December 26, 2020
TOTALEMPLOYEES
SUB-TOTALEMPLOYEES
NONCAREERSEASONAL
LIMITED-TERM
PERMANENT-INTERMITTENT
PART-TIME
FULL-TIMEDEPARTMENT / PROCESS LEVEL
JOB SHAREADJUSTMENT
WORKERS'COMPENSATION
Table 1-1
MDHHS-COM HEALTH CENTRAL OFF 3901 1,509.0 0.0 3.0 30.0 0.0 10.0 0.0 1,552.0 0.0 1,552.0MDHHS-CTR FORENSIC PSYCHIATRY 3920 554.0 1.0 0.0 2.0 0.0 4.0 4.0 565.0 0.0 565.0MDHHS-HAWTHORN CTR NORTHVILLE 3906 237.0 0.0 0.0 5.0 0.0 0.0 7.0 249.0 0.0 249.0MDHHS-KALAMAZOO PSYCHIATRIC HS 3909 389.0 0.0 3.0 51.0 0.0 1.0 5.0 449.0 0.0 449.0MDHHS-OFF OF THE INSPECTOR GEN 3947 50.0 0.0 0.0 0.0 0.0 3.0 0.0 53.0 0.0 53.0MDHHS-WALTER P.REUTHER PSY HS 3945 385.0 1.0 13.0 3.0 0.0 4.0 1.0 407.0 0.0 407.0MDHHS - COMMUNITY HEALTH 3,423.0 5.0 21.0 170.0 0.0 22.0 20.0 3,661.0 0.0 3,661.0MDHHS-BERRIEN COUNTY 4322 138.0 0.0 0.0 9.0 0.0 0.0 0.0 147.0 0.0 147.0MDHHS-CALHOUN COUNTY 4323 153.0 0.0 0.0 3.0 0.0 0.0 0.0 156.0 0.0 156.0MDHHS-COUNTIES 4308 2,686.0 0.0 0.0 75.0 4.0 0.0 0.0 2,765.0 0.0 2,765.0MDHHS-DPT OF HUMAN SVC CNTL OF 4301 2,267.0 0.0 4.0 81.0 0.0 9.0 0.0 2,361.0 0.0 2,361.0MDHHS-GENESEE COUNTY 4302 432.0 0.0 0.0 36.0 0.0 0.0 0.0 468.0 0.0 468.0MDHHS-INGHAM COUNTY 4312 242.0 0.0 0.0 17.0 0.0 0.0 0.0 259.0 0.0 259.0MDHHS-INSTITUTIONS 4307 57.0 0.0 27.0 1.0 0.0 0.0 1.0 86.0 0.0 86.0MDHHS-JACKSON COUNTY 4315 154.0 0.0 0.0 16.0 0.0 0.0 0.0 170.0 0.0 170.0MDHHS-KALAMAZOO COUNTY 4314 237.0 0.0 0.0 6.0 0.0 0.0 0.0 243.0 0.0 243.0MDHHS-KENT COUNTY 4303 422.0 0.0 0.0 7.0 2.0 0.0 0.0 431.0 0.0 431.0MDHHS-MACOMB COUNTY 4304 454.0 0.0 0.0 2.0 0.0 0.0 0.0 456.0 5.0 451.0MDHHS-MUSKEGON COUNTY 4324 222.0 0.0 0.0 3.0 0.0 0.0 0.0 225.0 0.0 225.0MDHHS-OAKLAND COUNTY 4305 481.0 0.0 0.0 27.0 0.0 0.0 0.0 508.0 0.0 508.0MDHHS-SAGINAW COUNTY 4313 163.0 0.0 0.0 7.0 0.0 0.0 0.0 170.0 0.0 170.0MDHHS-WASHTENAW 4325 148.0 0.0 0.0 6.0 0.0 0.0 0.0 154.0 0.0 154.0MDHHS-WAYNE COUNTY DSS 4306 86.0 0.0 0.0 9.0 0.0 0.0 0.0 95.0 0.0 95.0MDHHS-WAYNE COUNTY O.C.Y.S. 4320 615.0 0.0 0.0 0.0 0.0 0.0 0.0 615.0 0.0 615.0MDHHS-WAYNE COUNTY ZONE 3 4318 423.0 0.0 0.0 8.0 0.0 0.0 0.0 431.0 0.0 431.0MDHHS-WAYNE COUNTY ZONE 4 4319 416.0 0.0 0.0 5.0 0.0 0.0 0.0 421.0 0.0 421.0MDHHS-WAYNE COUNTY ZONE L 4316 309.0 0.0 0.0 5.0 1.0 0.0 0.0 315.0 0.0 315.0MDHHS - HUMAN SERVICES 10,105.0 0.0 31.0 323.0 7.0 9.0 1.0 10,476.0 5.0 10,471.0MICHIGAN VETERAN HOMES 5105 314.0 12.0 13.0 4.0 1.0 2.0 0.0 346.0 0.5 345.5MIL AFFR CENTRAL OFFICE 5101 342.0 3.0 9.0 29.0 8.0 14.0 0.0 405.0 0.0 405.0MILITARY & VETERAN AFFAIRS 656.0 15.0 22.0 33.0 9.0 16.0 0.0 751.0 0.5 750.5DNR-NATURAL RESOURCES 7501 1,389.0 1.0 50.0 18.0 35.0 132.0 1.0 1,626.0 0.0 1,626.0NATURAL RESOURCES 1,389.0 1.0 50.0 18.0 35.0 132.0 1.0 1,626.0 0.0 1,626.0
1 - 3
Comments: This report reflects classified employees who are full-time, part-time, permanent-intermittent, limited-term, seasonal, noncareer, or on workers' compensation in primary positions only. Job-share positions are those occupied by two or more individuals scheduled to share a job by performing duties that would normally be assigned to one employee. Individuals sharing jobs can be part-time, permanent-intermittent, limited-term, seasonal, or noncareer. For this report, the actual number of employees who job share is halved.
Michigan Civil Service Commission HWF04Source:
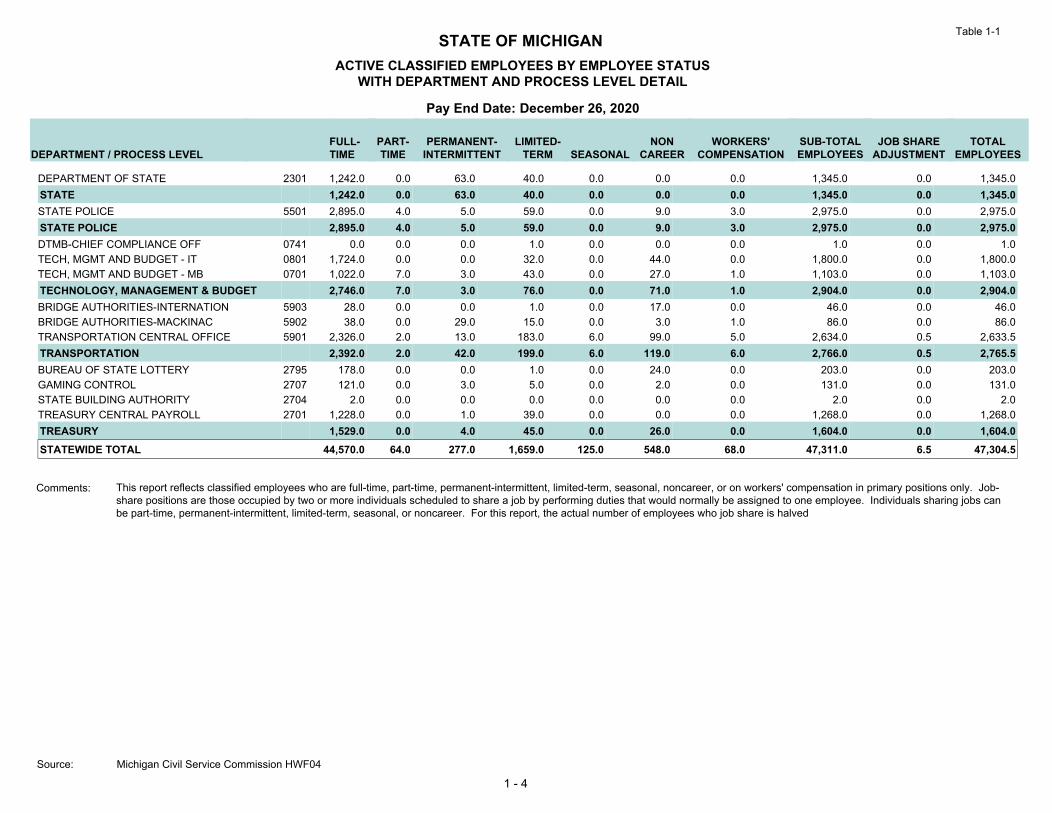
STATE OF MICHIGANACTIVE CLASSIFIED EMPLOYEES BY EMPLOYEE STATUS
WITH DEPARTMENT AND PROCESS LEVEL DETAIL
Pay End Date: December 26, 2020
TOTALEMPLOYEES
SUB-TOTALEMPLOYEES
NONCAREERSEASONAL
LIMITED-TERM
PERMANENT-INTERMITTENT
PART-TIME
FULL-TIMEDEPARTMENT / PROCESS LEVEL
JOB SHAREADJUSTMENT
WORKERS'COMPENSATION
Table 1-1
DEPARTMENT OF STATE 2301 1,242.0 0.0 63.0 40.0 0.0 0.0 0.0 1,345.0 0.0 1,345.0STATE 1,242.0 0.0 63.0 40.0 0.0 0.0 0.0 1,345.0 0.0 1,345.0STATE POLICE 5501 2,895.0 4.0 5.0 59.0 0.0 9.0 3.0 2,975.0 0.0 2,975.0STATE POLICE 2,895.0 4.0 5.0 59.0 0.0 9.0 3.0 2,975.0 0.0 2,975.0DTMB-CHIEF COMPLIANCE OFF 0741 0.0 0.0 0.0 1.0 0.0 0.0 0.0 1.0 0.0 1.0TECH, MGMT AND BUDGET - IT 0801 1,724.0 0.0 0.0 32.0 0.0 44.0 0.0 1,800.0 0.0 1,800.0TECH, MGMT AND BUDGET - MB 0701 1,022.0 7.0 3.0 43.0 0.0 27.0 1.0 1,103.0 0.0 1,103.0TECHNOLOGY, MANAGEMENT & BUDGET 2,746.0 7.0 3.0 76.0 0.0 71.0 1.0 2,904.0 0.0 2,904.0BRIDGE AUTHORITIES-INTERNATION 5903 28.0 0.0 0.0 1.0 0.0 17.0 0.0 46.0 0.0 46.0BRIDGE AUTHORITIES-MACKINAC 5902 38.0 0.0 29.0 15.0 0.0 3.0 1.0 86.0 0.0 86.0TRANSPORTATION CENTRAL OFFICE 5901 2,326.0 2.0 13.0 183.0 6.0 99.0 5.0 2,634.0 0.5 2,633.5TRANSPORTATION 2,392.0 2.0 42.0 199.0 6.0 119.0 6.0 2,766.0 0.5 2,765.5BUREAU OF STATE LOTTERY 2795 178.0 0.0 0.0 1.0 0.0 24.0 0.0 203.0 0.0 203.0GAMING CONTROL 2707 121.0 0.0 3.0 5.0 0.0 2.0 0.0 131.0 0.0 131.0STATE BUILDING AUTHORITY 2704 2.0 0.0 0.0 0.0 0.0 0.0 0.0 2.0 0.0 2.0TREASURY CENTRAL PAYROLL 2701 1,228.0 0.0 1.0 39.0 0.0 0.0 0.0 1,268.0 0.0 1,268.0TREASURY 1,529.0 0.0 4.0 45.0 0.0 26.0 0.0 1,604.0 0.0 1,604.0STATEWIDE TOTAL 44,570.0 64.0 277.0 1,659.0 125.0 548.0 68.0 47,311.0 6.5 47,304.5
1 - 4
Comments:
Michigan Civil Service Commission HWF04Source:
This report reflects classified employees who are full-time, part-time, permanent-intermittent, limited-term, seasonal, noncareer, or on workers' compensation in primary positions only. Job-share positions are those occupied by two or more individuals scheduled to share a job by performing duties that would normally be assigned to one employee. Individuals sharing jobs can be part-time, permanent-intermittent, limited-term, seasonal, or noncareer. For this report, the actual number of employees who job share is halved
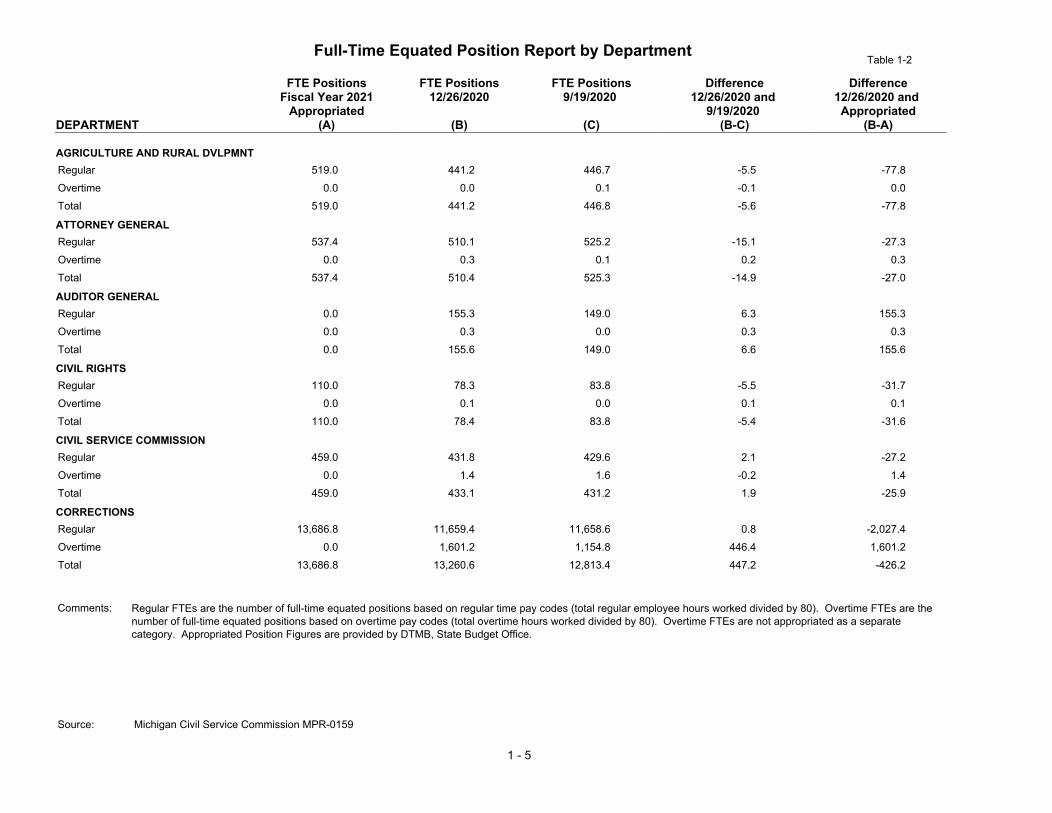
Full-Time Equated Position Report by Department
FTE PositionsFiscal Year 2021
Appropriated(A)
FTE Positions12/26/2020
(B)
FTE Positions9/19/2020
(C)
Difference12/26/2020 and
9/19/2020 (B-C)
Difference12/26/2020 and Appropriated
(B-A)DEPARTMENT
Regular 519.0 441.2 446.7 -5.5 -77.8Overtime 0.0 0.0 0.1 -0.1 0.0Total 519.0 441.2 446.8 -5.6 -77.8
AGRICULTURE AND RURAL DVLPMNT
Regular 537.4 510.1 525.2 -15.1 -27.3Overtime 0.0 0.3 0.1 0.2 0.3Total 537.4 510.4 525.3 -14.9 -27.0
ATTORNEY GENERAL
Regular 0.0 155.3 149.0 6.3 155.3Overtime 0.0 0.3 0.0 0.3 0.3Total 0.0 155.6 149.0 6.6 155.6
AUDITOR GENERAL
Regular 110.0 78.3 83.8 -5.5 -31.7Overtime 0.0 0.1 0.0 0.1 0.1Total 110.0 78.4 83.8 -5.4 -31.6
CIVIL RIGHTS
Regular 459.0 431.8 429.6 2.1 -27.2Overtime 0.0 1.4 1.6 -0.2 1.4Total 459.0 433.1 431.2 1.9 -25.9
CIVIL SERVICE COMMISSION
Regular 13,686.8 11,659.4 11,658.6 0.8 -2,027.4Overtime 0.0 1,601.2 1,154.8 446.4 1,601.2Total 13,686.8 13,260.6 12,813.4 447.2 -426.2
CORRECTIONS
Table 1-2
Comments:
Michigan Civil Service Commission MPR-0159
Regular FTEs are the number of full-time equated positions based on regular time pay codes (total regular employee hours worked divided by 80). Overtime FTEs are the number of full-time equated positions based on overtime pay codes (total overtime hours worked divided by 80). Overtime FTEs are not appropriated as a separate category. Appropriated Position Figures are provided by DTMB, State Budget Office.
Source:
1 - 5
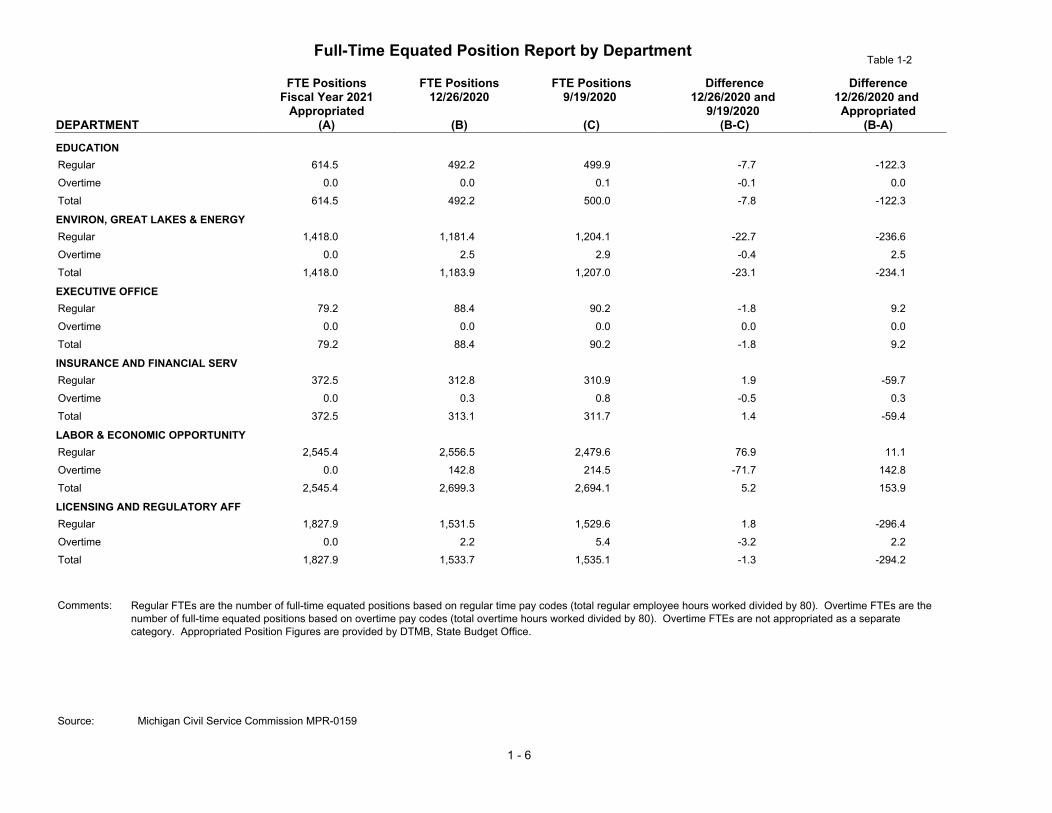
Full-Time Equated Position Report by Department
FTE PositionsFiscal Year 2021
Appropriated(A)
FTE Positions12/26/2020
(B)
FTE Positions9/19/2020
(C)
Difference12/26/2020 and
9/19/2020 (B-C)
Difference12/26/2020 and Appropriated
(B-A)DEPARTMENT
Regular 614.5 492.2 499.9 -7.7 -122.3Overtime 0.0 0.0 0.1 -0.1 0.0Total 614.5 492.2 500.0 -7.8 -122.3
EDUCATION
Regular 1,418.0 1,181.4 1,204.1 -22.7 -236.6Overtime 0.0 2.5 2.9 -0.4 2.5Total 1,418.0 1,183.9 1,207.0 -23.1 -234.1
ENVIRON, GREAT LAKES & ENERGY
Regular 79.2 88.4 90.2 -1.8 9.2Overtime 0.0 0.0 0.0 0.0 0.0Total 79.2 88.4 90.2 -1.8 9.2
EXECUTIVE OFFICE
Regular 372.5 312.8 310.9 1.9 -59.7Overtime 0.0 0.3 0.8 -0.5 0.3Total 372.5 313.1 311.7 1.4 -59.4
INSURANCE AND FINANCIAL SERV
Regular 2,545.4 2,556.5 2,479.6 76.9 11.1Overtime 0.0 142.8 214.5 -71.7 142.8Total 2,545.4 2,699.3 2,694.1 5.2 153.9
LABOR & ECONOMIC OPPORTUNITY
Regular 1,827.9 1,531.5 1,529.6 1.8 -296.4Overtime 0.0 2.2 5.4 -3.2 2.2Total 1,827.9 1,533.7 1,535.1 -1.3 -294.2
LICENSING AND REGULATORY AFF
Table 1-2
Comments:
Michigan Civil Service Commission MPR-0159
Regular FTEs are the number of full-time equated positions based on regular time pay codes (total regular employee hours worked divided by 80). Overtime FTEs are the number of full-time equated positions based on overtime pay codes (total overtime hours worked divided by 80). Overtime FTEs are not appropriated as a separate category. Appropriated Position Figures are provided by DTMB, State Budget Office.
Source:
1 - 6

Full-Time Equated Position Report by Department
FTE PositionsFiscal Year 2021
Appropriated(A)
FTE Positions12/26/2020
(B)
FTE Positions9/19/2020
(C)
Difference12/26/2020 and
9/19/2020 (B-C)
Difference12/26/2020 and Appropriated
(B-A)DEPARTMENT
Regular 4,076.2 3,652.5 3,655.3 -2.8 -423.7Overtime 0.0 294.3 255.4 38.9 294.3Total 4,076.2 3,946.8 3,910.8 36.0 -129.4
MDHHS - COMMUNITY HEALTH
Regular 11,404.8 10,245.3 10,466.7 -221.3 -1,159.5Overtime 0.0 80.8 102.9 -22.1 80.8Total 11,404.8 10,326.2 10,569.6 -243.4 -1,078.6
MDHHS - HUMAN SERVICES
Regular 1,052.5 727.8 734.3 -6.5 -324.7Overtime 0.0 31.1 32.7 -1.6 31.1Total 1,052.5 758.9 766.9 -8.1 -293.6
MILITARY & VETERAN AFFAIRS
Regular 2,346.1 1,512.4 2,300.3 -787.8 -833.7Overtime 0.0 7.1 138.1 -131.0 7.1Total 2,346.1 1,519.5 2,438.3 -918.8 -826.6
NATURAL RESOURCES
Regular 1,586.0 1,304.1 1,340.5 -36.4 -281.9Overtime 0.0 4.1 111.4 -107.4 4.1Total 1,586.0 1,308.1 1,451.9 -143.8 -277.9
STATE
Regular 3,596.0 2,912.7 2,970.4 -57.7 -683.3Overtime 0.0 246.7 318.2 -71.5 246.7Total 3,596.0 3,159.4 3,288.6 -129.2 -436.6
STATE POLICE
Table 1-2
Comments:
Michigan Civil Service Commission MPR-0159
Regular FTEs are the number of full-time equated positions based on regular time pay codes (total regular employee hours worked divided by 80). Overtime FTEs are the number of full-time equated positions based on overtime pay codes (total overtime hours worked divided by 80). Overtime FTEs are not appropriated as a separate category. Appropriated Position Figures are provided by DTMB, State Budget Office.
Source:
1 - 7
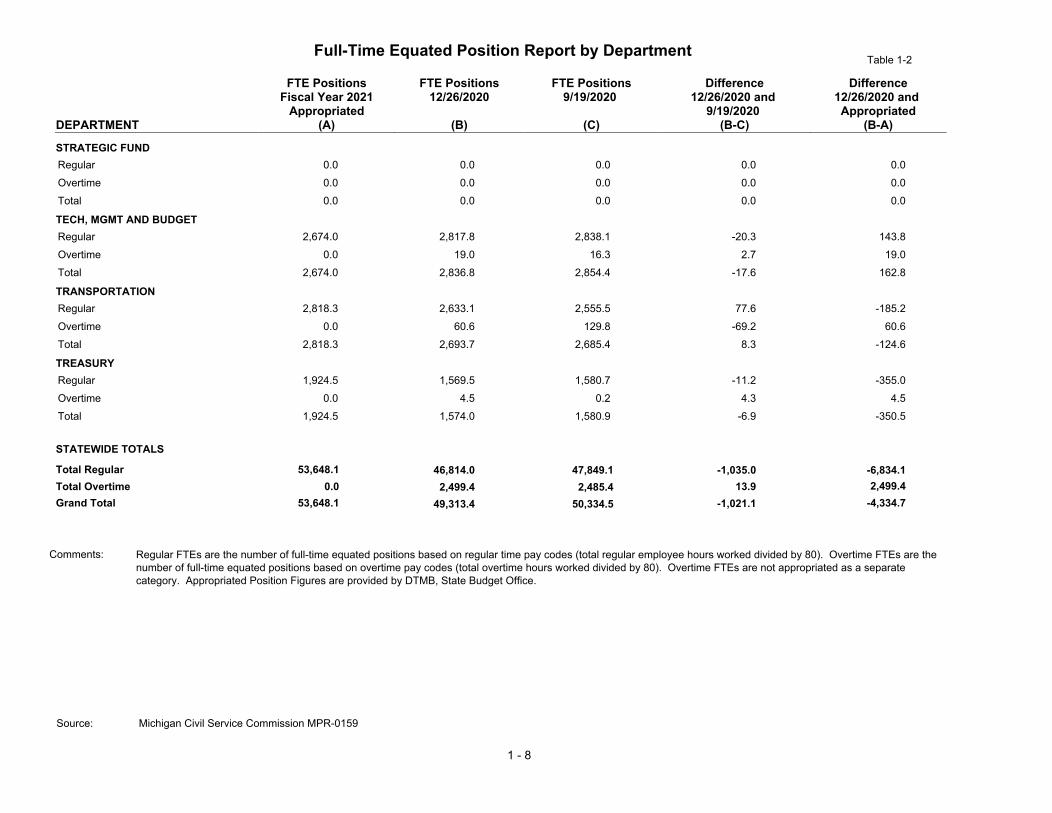
Full-Time Equated Position Report by Department
FTE PositionsFiscal Year 2021
Appropriated(A)
FTE Positions12/26/2020
(B)
FTE Positions9/19/2020
(C)
Difference12/26/2020 and
9/19/2020 (B-C)
Difference12/26/2020 and Appropriated
(B-A)DEPARTMENT
Regular 0.0 0.0 0.0 0.0 0.0Overtime 0.0 0.0 0.0 0.0 0.0Total 0.0 0.0 0.0 0.0 0.0
STRATEGIC FUND
Regular 2,674.0 2,817.8 2,838.1 -20.3 143.8Overtime 0.0 19.0 16.3 2.7 19.0Total 2,674.0 2,836.8 2,854.4 -17.6 162.8
TECH, MGMT AND BUDGET
Regular 2,818.3 2,633.1 2,555.5 77.6 -185.2Overtime 0.0 60.6 129.8 -69.2 60.6Total 2,818.3 2,693.7 2,685.4 8.3 -124.6
TRANSPORTATION
Regular 1,924.5 1,569.5 1,580.7 -11.2 -355.0Overtime 0.0 4.5 0.2 4.3 4.5Total 1,924.5 1,574.0 1,580.9 -6.9 -350.5
TREASURY
Total RegularTotal OvertimeGrand Total
46,814.0 47,849.1 -1,035.0 -6,834.10.0 2,499.4 2,485.4 13.9 2,499.4
49,313.4 50,334.5 -1,021.1 -4,334.7
STATEWIDE TOTALS
53,648.1
53,648.1
Table 1-2
Comments:
Michigan Civil Service Commission MPR-0159
Regular FTEs are the number of full-time equated positions based on regular time pay codes (total regular employee hours worked divided by 80). Overtime FTEs are the number of full-time equated positions based on overtime pay codes (total overtime hours worked divided by 80). Overtime FTEs are not appropriated as a separate category. Appropriated Position Figures are provided by DTMB, State Budget Office.
Source:
1 - 8

Table 1-3
Department
Number of
Employees
Percent of
Total
Classified
Employees
Number of
Employees
Percent of
Total
Classified
Employees
AGRICULTURE AND RURAL DVLPMNT 465.0 1.0 % 460.0 1.0 %
ATTORNEY GENERAL 523.0 1.1 % 517.0 1.1 %
AUDITOR GENERAL 152.0 0.3 % 156.0 0.3 %
CIVIL RIGHTS 80.0 0.2 % 74.0 0.2 %
CIVIL SERVICE COMMISSION 450.0 0.9 % 449.0 0.9 %
CORRECTIONS 11,450.0 23.6 % 11,331.0 24.0 %
EDUCATION 506.0 1.1 % 506.0 1.1 %
ENVIRONMENT, GREAT LAKES & ENERGY 1,229.5 2.5 % 1,207.5 2.6 %
EXECUTIVE OFFICE 70.0 0.1 % 75.0 0.2 %
INSURANCE AND FINANCIAL SERV 315.0 0.7 % 317.0 0.7 %
LABOR & ECONOMIC OPPORTUNITY 2,458.0 5.1 % 2,556.0 5.4 %
LICENSING & REGULATORY AFFAIRS 1,548.0 3.2 % 1,554.0 3.3 %
MDHHS-COMMUNITY HEALTH 3,663.0 7.6 % 3,661.0 7.7 %
MDHHS-HUMAN SERVICES 10,556.0 21.8 % 10,471.0 22.1 %
MILITARY & VETERAN AFFAIRS 750.5 1.5 % 750.5 1.6 %
NATURAL RESOURCES 2,651.0 5.5 % 1,626.0 3.4 %
STATE 1,378.0 2.8 % 1,345.0 2.8 %
STATE POLICE 3,006.0 6.2 % 2,975.0 6.3 %
TECHNOLOGY, MANAGEMENT & BUDGET 2,924.0 6.0 % 2,904.0 6.1 %
TRANSPORTATION 2,671.5 5.5 % 2,765.5 5.8 %
TREASURY 1,611.0 3.3 % 1,604.0 3.4 %
TOTAL: 48,457.5 100.0 % 47,304.5 100.0 %
September 19, 2020 December 26, 2020
Comments:
STATE OF MICHIGANNUMBER AND PERCENT OF ACTIVE CLASSIFIED EMPLOYEES BY DEPARTMENT
PRIOR AND CURRENT PAY END DATES
Source:
1 - 9
This report reflects classified employees who are full-time, part-time, permanent-intermittent, limited-term, seasonal, noncareer, or on workers' compensation in primary positions only. Job-share positions are those occupied by two or more individuals scheduled to share a job by performing the duties which would normally be assigned to one employee. Individuals sharing jobs can be part-time, permanent-intermittent, limited-term, seasonal, noncareer, or on workers' compensation. For this report, the actual number of employees who job share is halved.
Statewide, the number of classified employees decreased by 1153 from September 19, 2020 to December 26, 2020.
Michigan Civil Service Commission HWF03
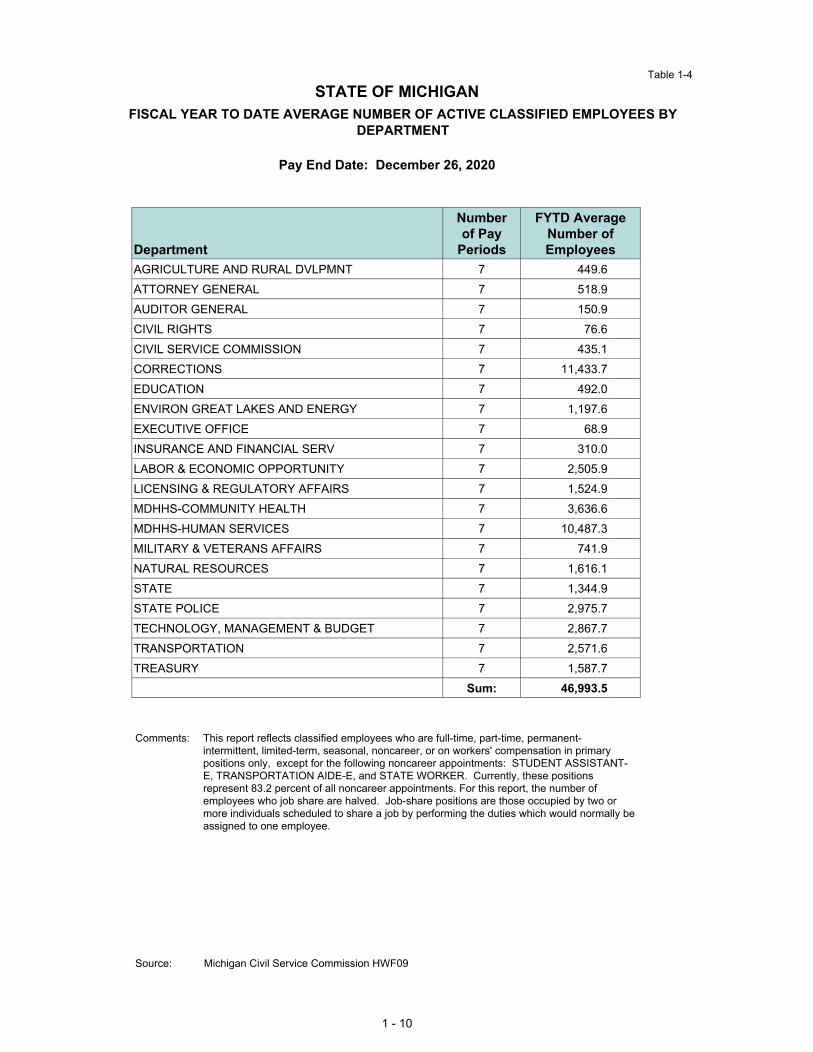
FISCAL YEAR TO DATE AVERAGE NUMBER OF ACTIVE CLASSIFIED EMPLOYEES BY DEPARTMENT
Department
Numberof Pay
Periods
FYTD AverageNumber ofEmployees
AGRICULTURE AND RURAL DVLPMNT 7 449.6ATTORNEY GENERAL 7 518.9AUDITOR GENERAL 7 150.9CIVIL RIGHTS 7 76.6CIVIL SERVICE COMMISSION 7 435.1CORRECTIONS 7 11,433.7EDUCATION 7 492.0ENVIRON GREAT LAKES AND ENERGY 7 1,197.6EXECUTIVE OFFICE 7 68.9INSURANCE AND FINANCIAL SERV 7 310.0LABOR & ECONOMIC OPPORTUNITY 7 2,505.9LICENSING & REGULATORY AFFAIRS 7 1,524.9MDHHS-COMMUNITY HEALTH 7 3,636.6MDHHS-HUMAN SERVICES 7 10,487.3MILITARY & VETERANS AFFAIRS 7 741.9NATURAL RESOURCES 7 1,616.1STATE 7 1,344.9STATE POLICE 7 2,975.7TECHNOLOGY, MANAGEMENT & BUDGET 7 2,867.7TRANSPORTATION 7 2,571.6TREASURY 7 1,587.7
Sum: 46,993.5
STATE OF MICHIGAN
Pay End Date: December 26, 2020
Table 1-4
Comments:
Source:
This report reflects classified employees who are full-time, part-time, permanent-intermittent, limited-term, seasonal, noncareer, or on workers' compensation in primary positions only, except for the following noncareer appointments: STUDENT ASSISTANT-E, TRANSPORTATION AIDE-E, and STATE WORKER. Currently, these positions represent 83.2 percent of all noncareer appointments. For this report, the number of employees who job share are halved. Job-share positions are those occupied by two or more individuals scheduled to share a job by performing the duties which would normally be assigned to one employee.
Michigan Civil Service Commission HWF09
1 - 10

SECTION TWO
CHARACTERISTICS OF
CLASSIFIED EMPLOYEES
STATE OF MICHIGAN
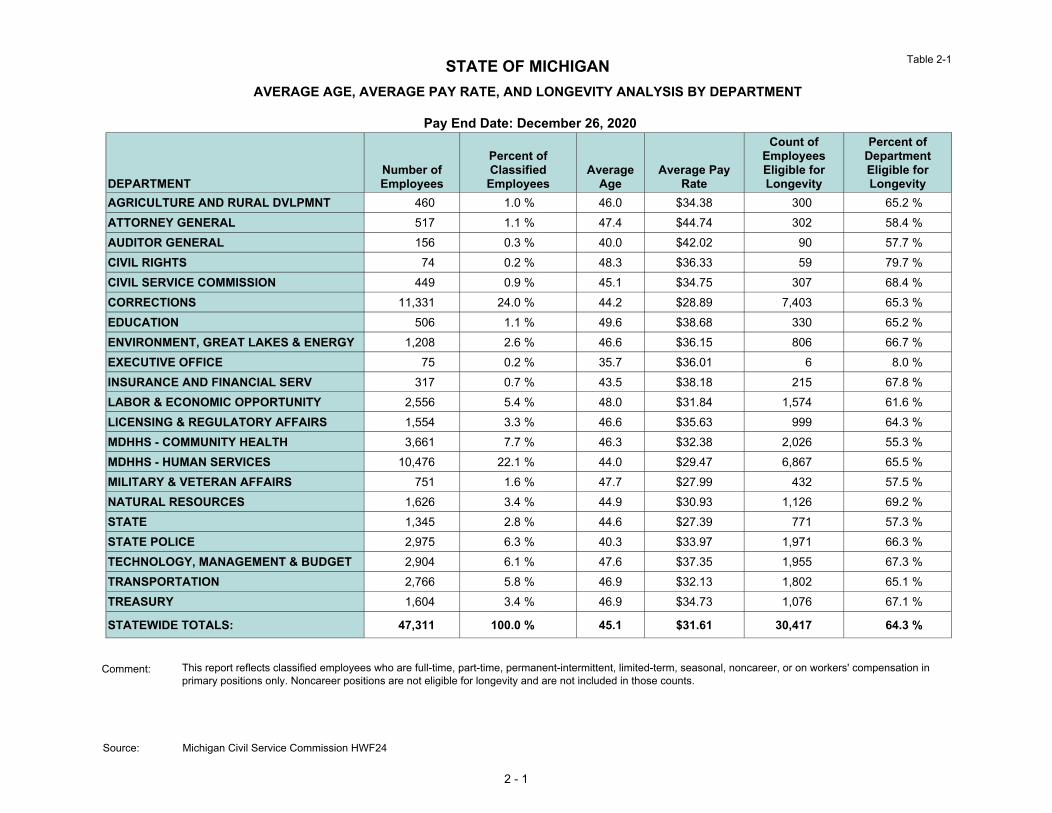
DEPARTMENT Number ofEmployees
Percent ofClassifiedEmployees
AverageAge
Average PayRate
Count ofEmployeesEligible forLongevity
Percent ofDepartmentEligible forLongevity
AGRICULTURE AND RURAL DVLPMNT 460 1.0 % 46.0 $34.38 300 65.2 %ATTORNEY GENERAL 517 1.1 % 47.4 $44.74 302 58.4 %AUDITOR GENERAL 156 0.3 % 40.0 $42.02 90 57.7 %CIVIL RIGHTS 74 0.2 % 48.3 $36.33 59 79.7 %CIVIL SERVICE COMMISSION 449 0.9 % 45.1 $34.75 307 68.4 %CORRECTIONS 11,331 24.0 % 44.2 $28.89 7,403 65.3 %EDUCATION 506 1.1 % 49.6 $38.68 330 65.2 %ENVIRONMENT, GREAT LAKES & ENERGY 1,208 2.6 % 46.6 $36.15 806 66.7 %EXECUTIVE OFFICE 75 0.2 % 35.7 $36.01 6 8.0 %INSURANCE AND FINANCIAL SERV 317 0.7 % 43.5 $38.18 215 67.8 %LABOR & ECONOMIC OPPORTUNITY 2,556 5.4 % 48.0 $31.84 1,574 61.6 %LICENSING & REGULATORY AFFAIRS 1,554 3.3 % 46.6 $35.63 999 64.3 %MDHHS - COMMUNITY HEALTH 3,661 7.7 % 46.3 $32.38 2,026 55.3 %MDHHS - HUMAN SERVICES 10,476 22.1 % 44.0 $29.47 6,867 65.5 %MILITARY & VETERAN AFFAIRS 751 1.6 % 47.7 $27.99 432 57.5 %NATURAL RESOURCES 1,626 3.4 % 44.9 $30.93 1,126 69.2 %STATE 1,345 2.8 % 44.6 $27.39 771 57.3 %STATE POLICE 2,975 6.3 % 40.3 $33.97 1,971 66.3 %TECHNOLOGY, MANAGEMENT & BUDGET 2,904 6.1 % 47.6 $37.35 1,955 67.3 %TRANSPORTATION 2,766 5.8 % 46.9 $32.13 1,802 65.1 %TREASURY 1,604 3.4 % 46.9 $34.73 1,076 67.1 %
STATEWIDE TOTALS: 47,311 100.0 % 45.1 $31.61 30,417 64.3 %
AVERAGE AGE, AVERAGE PAY RATE, AND LONGEVITY ANALYSIS BY DEPARTMENT
Table 2-1
Pay End Date: December 26, 2020
2 - 1
Michigan Civil Service Commission HWF24
Comment:
Source:
This report reflects classified employees who are full-time, part-time, permanent-intermittent, limited-term, seasonal, noncareer, or on workers' compensation in primary positions only. Noncareer positions are not eligible for longevity and are not included in those counts.

Pay End Date: December 26, 2020
STATE OF MICHIGAN Table 2-4
Health Insurance Dental Insurance
Department
TotalEmployees
Enrolled
StateSponsored
Health % HMO %Catastrophic
Health %COPSTrust %
StateSponsored
Dental %Preventive
Dental %AGRICULTURE & RURAL DEVELOPMENT 441 174 39 % 229 52 % 4 1 % 0 0 % 416 94 % 1 0 %
ATTORNEY GENERAL 517 183 35 % 264 51 % 5 1 % 0 0 % 483 93 % 3 1 %
AUDITOR GENERAL 154 51 33 % 80 52 % 4 3 % 0 0 % 144 94 % 0 0 %
CIVIL RIGHTS 74 31 42 % 40 54 % 2 3 % 0 0 % 73 99 % 0 0 %
CIVIL SERVICE COMMISSION 434 89 21 % 284 65 % 1 0 % 0 0 % 392 90 % 0 0 %
CORRECTIONS 11,312 5,745 51 % 4,599 41 % 35 0 % 0 0 % 10,626 94 % 33 0 %
EDUCATION 493 189 38 % 232 47 % 4 1 % 0 0 % 443 90 % 2 0 %
ENVIRONMENT, GREAT LAKES & ENERGY 1,192 395 33 % 664 56 % 11 1 % 0 0 % 1,095 92 % 8 1 %
EXECUTIVE OFFICE 74 32 43 % 23 31 % 1 1 % 0 0 % 54 73 % 0 0 %
INSURANCE AND FINANCIAL SERV 310 89 29 % 193 62 % 2 1 % 0 0 % 293 95 % 2 1 %
LABOR & ECONOMIC OPPORTUNITY 2,527 957 38 % 1,264 50 % 24 1 % 0 0 % 2,328 92 % 11 0 %
LICENSING & REGULATORY AFFAIRS 1,531 549 36 % 820 54 % 2 0 % 0 0 % 1,424 93 % 5 0 %
MDHHS - COMMUNITY HEALTH 3,639 1,454 40 % 1,848 51 % 14 0 % 0 0 % 3,409 94 % 16 0 %
MDHHS - HUMAN SERVICES 10,467 3,938 38 % 5,588 53 % 47 0 % 0 0 % 9,882 94 % 20 0 %
MILITARY & VETERAN AFFAIRS 735 300 41 % 307 42 % 10 1 % 0 0 % 661 90 % 2 0 %
NATURAL RESOURCES 1,494 796 53 % 547 37 % 17 1 % 0 0 % 1,401 94 % 5 0 %
STATE 1,345 536 40 % 665 49 % 15 1 % 0 0 % 1,261 94 % 4 0 %
STATE POLICE 2,966 930 31 % 768 26 % 13 0 % 1,028 35 % 2,818 95 % 7 0 %
TECHNOLOGY, MANAGEMENT & BUDGET 2,833 866 31 % 1,673 59 % 18 1 % 0 0 % 2,620 92 % 8 0 %
TRANSPORTATION 2,647 1,034 39 % 1,289 49 % 21 1 % 0 0 % 2,414 91 % 10 0 %
TREASURY 1,578 470 30 % 943 60 % 16 1 % 0 0 % 1,482 94 % 5 0 %
STATEWIDE TOTALS: 46,763 18,808 40 % 22,320 48 % 266 1 % 1,028 2 % 43,719 93 % 142 0 %
ENROLLED IN STATE SPONSORED INSURANCE PLANS BY DEPARTMENTACTIVE CLASSIFIED EMPLOYEES
2 - 2
This report reflects classified employees who are full-time, part-time, permanent-intermittent, limited-term, seasonal, or on workers' compensation in primary positions only.Total employees enrolled does not reflect employees enrolled as a spouse or dependent on another employee's benefits.
Source: Michigan Civil Service Commission HWF47
Comments:

Pay End Date: December 26, 2020
STATE OF MICHIGAN Table 2-4
Vision Insurance Disability Insurance Life Insurance
Department
TotalEmployees
Enrolled
StateSponsored
Vision % CMI % Reliance %Minnesota
Life %
MinnesotaLife
Reduced % Prudential %AGRICULTURE & RURAL DEVELOPMENT 441 417 95 % 359 81 % 0 0 % 423 96 % 17 4 % 0 0 %
ATTORNEY GENERAL 517 488 94 % 351 68 % 0 0 % 488 94 % 29 6 % 0 0 %
AUDITOR GENERAL 154 146 95 % 125 81 % 0 0 % 130 84 % 23 15 % 0 0 %
CIVIL RIGHTS 74 73 99 % 61 82 % 0 0 % 70 95 % 4 5 % 0 0 %
CIVIL SERVICE COMMISSION 434 399 92 % 403 93 % 0 0 % 421 97 % 13 3 % 0 0 %
CORRECTIONS 11,312 10,682 94 % 10,158 90 % 0 0 % 10,847 96 % 412 4 % 0 0 %
EDUCATION 493 450 91 % 343 70 % 0 0 % 462 94 % 29 6 % 0 0 %
ENVIRONMENT, GREAT LAKES & ENERGY 1,192 1,111 93 % 944 79 % 0 0 % 1,104 93 % 86 7 % 0 0 %
EXECUTIVE OFFICE 74 58 78 % 31 42 % 0 0 % 69 93 % 4 5 % 0 0 %
INSURANCE AND FINANCIAL SERV 310 298 96 % 252 81 % 0 0 % 293 95 % 16 5 % 0 0 %
LABOR & ECONOMIC OPPORTUNITY 2,527 2,356 93 % 1,952 77 % 0 0 % 2,384 94 % 137 5 % 0 0 %
LICENSING & REGULATORY AFFAIRS 1,531 1,430 93 % 1,239 81 % 0 0 % 1,446 94 % 80 5 % 0 0 %
MDHHS - COMMUNITY HEALTH 3,639 3,433 94 % 3,088 85 % 0 0 % 3,447 95 % 184 5 % 0 0 %
MDHHS - HUMAN SERVICES 10,467 9,915 95 % 8,952 86 % 0 0 % 9,952 95 % 499 5 % 0 0 %
MILITARY & VETERAN AFFAIRS 735 666 91 % 523 71 % 0 0 % 697 95 % 24 3 % 0 0 %
NATURAL RESOURCES 1,494 1,412 95 % 1,236 83 % 0 0 % 1,423 95 % 70 5 % 0 0 %
STATE 1,345 1,277 95 % 1,014 75 % 0 0 % 1,265 94 % 76 6 % 0 0 %
STATE POLICE 2,966 2,841 96 % 2,688 91 % 1,378 46 % 2,823 95 % 116 4 % 1,123 38 %
TECHNOLOGY, MANAGEMENT & BUDGET 2,833 2,634 93 % 2,134 75 % 24 1 % 2,683 95 % 137 5 % 16 1 %
TRANSPORTATION 2,647 2,454 93 % 2,220 84 % 0 0 % 2,490 94 % 141 5 % 0 0 %
TREASURY 1,578 1,500 95 % 1,280 81 % 0 0 % 1,491 94 % 87 6 % 0 0 %
STATEWIDE TOTALS: 46,763 44,040 94 % 39,353 84 % 1,402 3 % 44,408 95 % 2,184 5 % 1,139 2 %
ENROLLED IN STATE SPONSORED INSURANCE PLANS BY DEPARTMENTACTIVE CLASSIFIED EMPLOYEES
2 - 3
Comments: This report reflects classified employees who are full-time, part-time, permanent-intermittent, limited-term, seasonal, or on workers' compensation in primary positions only. Total employees enrolled does not reflect employees enrolled as a spouse or dependent on another employee's benefits.
Source: Michigan Civil Service Commission HWF47

STATE OF MICHIGANAGE DISTRIBUTION FOR ACTIVE CLASSIFIED EMPLOYEES BY DEPARTMENT
Department19 &
Under 20-24 25-29 30-34 35-39 40-44 45-49 50-54 55-59 60-64 65-6970 &Over Total
AGRICULTURE AND RURAL DVLPMNT 0 16 49 40 52 68 51 44 71 40 23 6 460ATTORNEY GENERAL 0 2 26 66 57 70 64 83 74 50 19 6 517AUDITOR GENERAL 1 12 34 20 16 13 17 19 19 4 1 0 156CIVIL RIGHTS 0 0 3 8 9 11 11 13 7 6 3 3 74CIVIL SERVICE COMMISSION 1 22 38 40 50 57 67 68 63 30 13 0 449CORRECTIONS 29 439 972 1,299 1,249 1,451 2,025 1,948 1,155 574 155 35 11,331EDUCATION 0 9 12 26 56 74 74 94 61 61 29 10 506ENVIRONMENT, GREAT LAKES & ENERGY 0 23 125 111 115 181 136 156 181 112 58 10 1,208EXECUTIVE OFFICE 0 9 21 10 14 6 5 7 2 0 1 0 75INSURANCE AND FINANCIAL SERV 0 14 31 37 42 51 43 42 33 19 3 2 317LABOR & ECONOMIC OPPORTUNITY 3 49 133 198 300 337 382 375 359 266 110 44 2,556LICENSING & REGULATORY AFFAIRS 3 44 102 142 214 206 211 203 194 145 66 24 1,554MDHHS - COMMUNITY HEALTH 0 75 291 404 469 452 472 488 491 354 124 41 3,661MDHHS - HUMAN SERVICES 2 227 918 1,313 1,601 1,624 1,567 1,363 970 616 207 68 10,476MILITARY & VETERAN AFFAIRS 0 11 42 64 93 84 97 123 131 79 23 4 751NATURAL RESOURCES 6 49 156 171 206 224 255 204 178 104 50 23 1,626STATE 0 45 143 179 132 175 163 195 181 99 29 4 1,345STATE POLICE 0 133 562 510 295 346 461 368 207 73 16 4 2,975TECHNOLOGY, MANAGEMENT & BUDGET 4 71 152 243 306 381 419 451 460 299 96 22 2,904TRANSPORTATION 3 102 174 226 266 390 394 452 401 259 74 25 2,766TREASURY 2 36 88 164 196 235 197 221 230 164 57 14 1,604
Statewide Total: 54 1,388 4,072 5,271 5,738 6,436 7,111 6,917 5,468 3,354 1,157 345 47,311Average Age: 19.5 23.3 27.7 32.5 37.5 42.5 47.6 52.4 57.4 62.2 66.9 72.9 45.1
Table 2-10
Pay End Date: December 26, 2020
Comments:
Source:
This report reflects classified employees who are full-time, part-time, permanent-intermittent, limited-term, seasonal, noncareer, or on workers' compensation in primary positions only.
2 - 4
Michigan Civil Service Commission HWF23
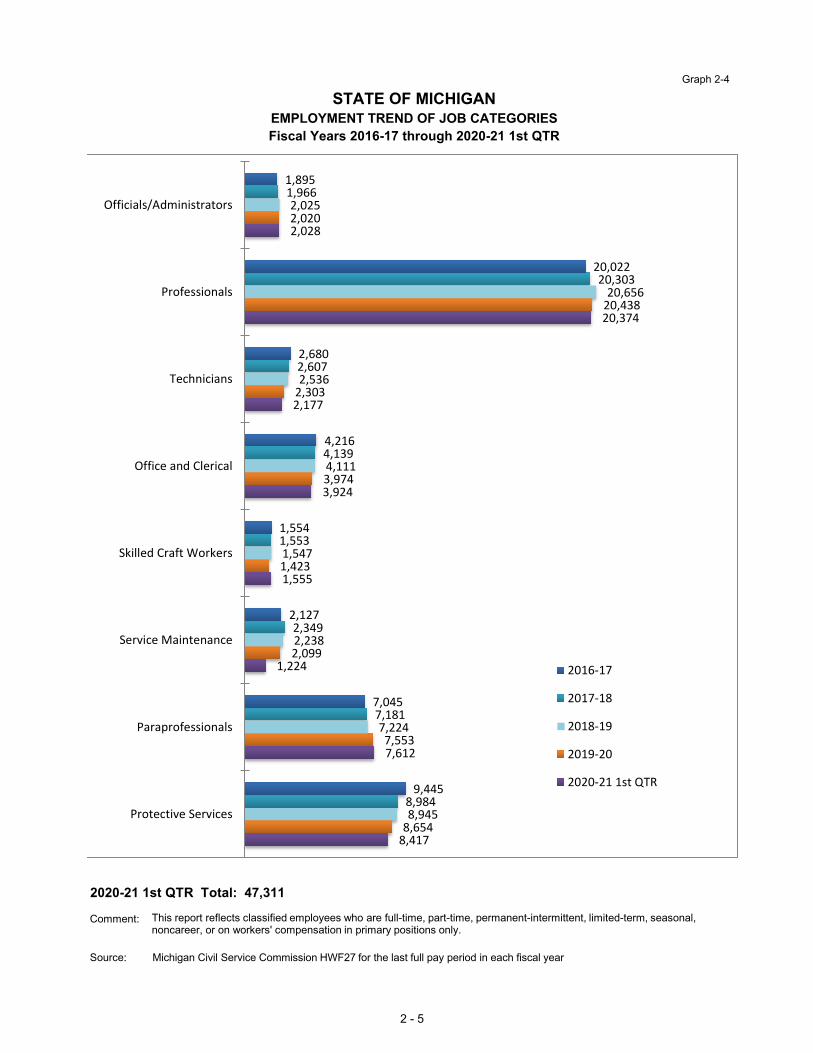
Graph 2-4
STATE OF MICHIGANEMPLOYMENT TREND OF JOB CATEGORIES Fiscal Years 2016-17 through 2020-21 1st QTR
20656 206562536 25368945 89457224 72244111 41111547 15472238 2238
47257 47257
2020-21 1st QTR Total: 47,311
Source: Michigan Civil Service Commission HWF27 for the last full pay period in each fiscal year
8,417
7,612
1,224
1,555
3,924
2,177
20,374
2,028
8,654
7,553
2,099
1,423
3,974
2,303
20,438
2,020
8,945
7,224
2,238
1,547
4,111
2,536
20,656
2,025
8,984
7,181
2,349
1,553
4,139
2,607
20,303
1,966
9,445
7,045
2,127
1,554
4,216
2,680
20,022
1,895
Protective Services
Paraprofessionals
Service Maintenance
Skilled Craft Workers
Office and Clerical
Technicians
Professionals
Officials/Administrators
2016‐17
2017‐18
2018‐19
2019‐20
2020‐21 1st QTR
This report reflects classified employees who are full-time, part-time, permanent-intermittent, limited-term, seasonal, noncareer, or on workers' compensation in primary positions only.
Comment:
2 - 5
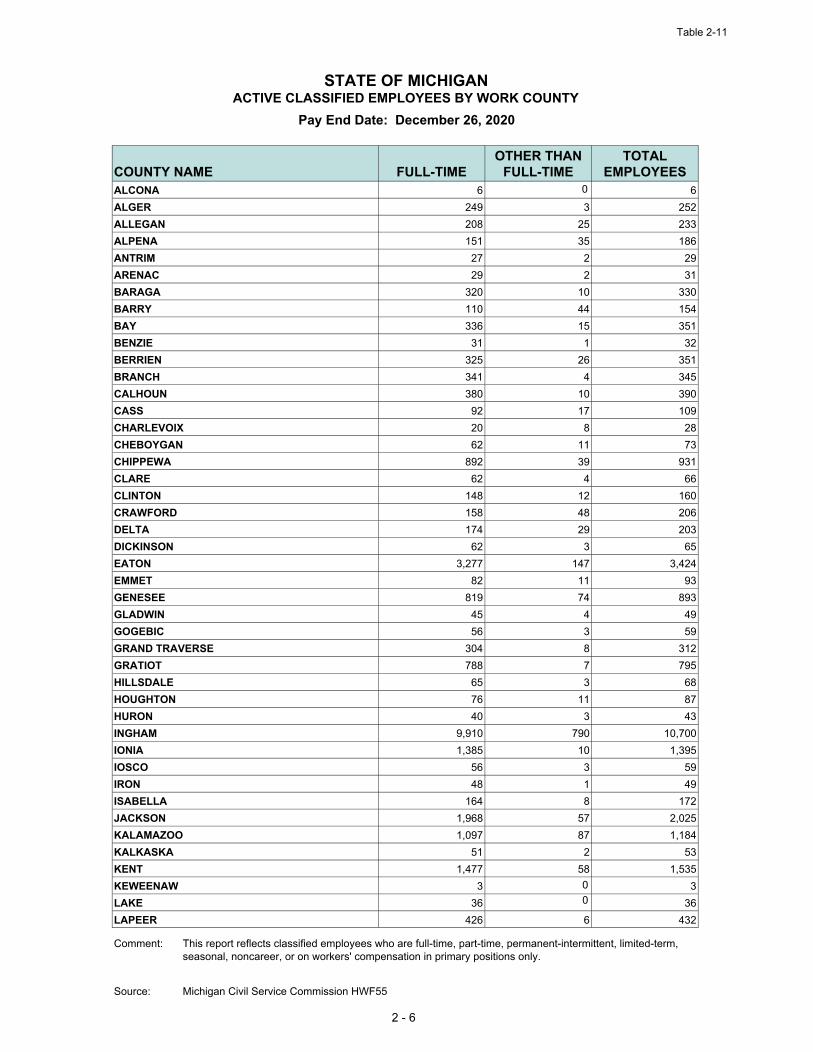
Table 2-11
COUNTY NAME FULL-TIMEOTHER THAN
FULL-TIMETOTAL
EMPLOYEESALCONA 6 6ALGER 249 3 252ALLEGAN 208 25 233ALPENA 151 35 186ANTRIM 27 2 29ARENAC 29 2 31BARAGA 320 10 330BARRY 110 44 154BAY 336 15 351BENZIE 31 1 32BERRIEN 325 26 351BRANCH 341 4 345CALHOUN 380 10 390CASS 92 17 109CHARLEVOIX 20 8 28CHEBOYGAN 62 11 73CHIPPEWA 892 39 931CLARE 62 4 66CLINTON 148 12 160CRAWFORD 158 48 206DELTA 174 29 203DICKINSON 62 3 65EATON 3,277 147 3,424EMMET 82 11 93GENESEE 819 74 893GLADWIN 45 4 49GOGEBIC 56 3 59GRAND TRAVERSE 304 8 312GRATIOT 788 7 795HILLSDALE 65 3 68HOUGHTON 76 11 87HURON 40 3 43INGHAM 9,910 790 10,700IONIA 1,385 10 1,395IOSCO 56 3 59IRON 48 1 49ISABELLA 164 8 172JACKSON 1,968 57 2,025KALAMAZOO 1,097 87 1,184KALKASKA 51 2 53KENT 1,477 58 1,535KEWEENAW 3 3LAKE 36 36LAPEER 426 6 432
ACTIVE CLASSIFIED EMPLOYEES BY WORK COUNTYSTATE OF MICHIGAN
Pay End Date: December 26, 2020
Michigan Civil Service Commission HWF55Source:
This report reflects classified employees who are full-time, part-time, permanent-intermittent, limited-term,seasonal, noncareer, or on workers' compensation in primary positions only.
Comment:
2 - 6
0
00
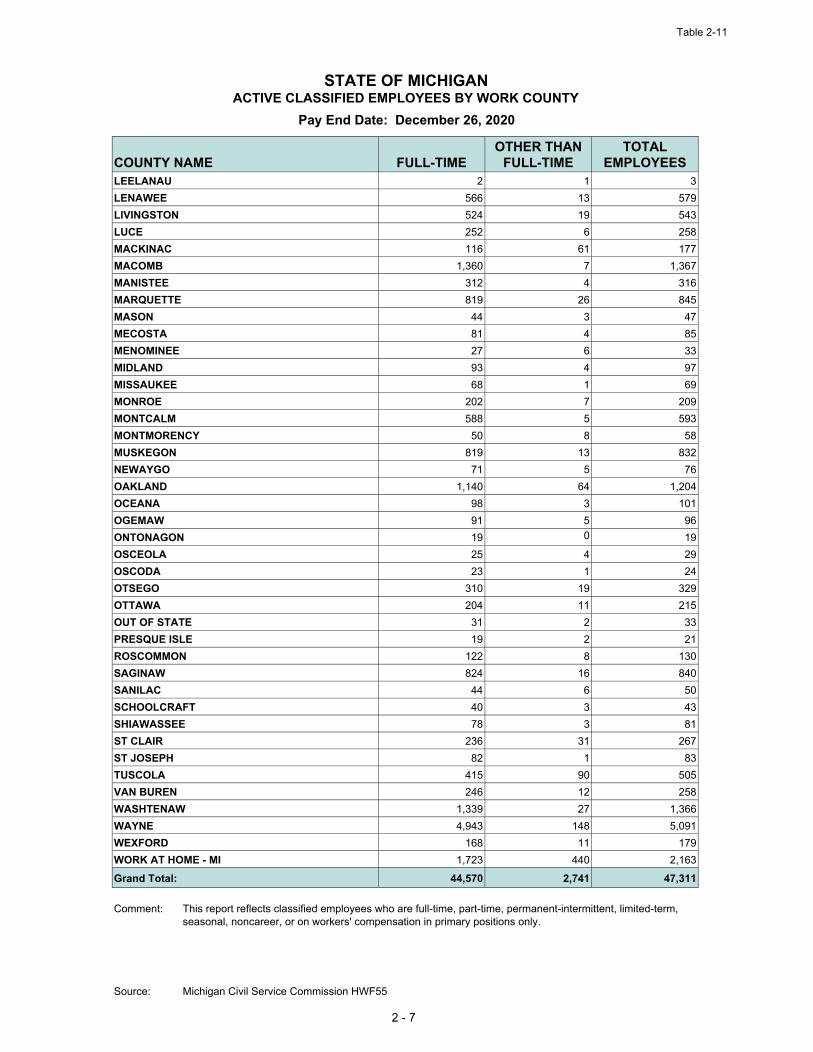
Table 2-11
COUNTY NAME FULL-TIMEOTHER THAN
FULL-TIMETOTAL
EMPLOYEESLEELANAU 2 1 3LENAWEE 566 13 579LIVINGSTON 524 19 543LUCE 252 6 258MACKINAC 116 61 177MACOMB 1,360 7 1,367MANISTEE 312 4 316MARQUETTE 819 26 845MASON 44 3 47MECOSTA 81 4 85MENOMINEE 27 6 33MIDLAND 93 4 97MISSAUKEE 68 1 69MONROE 202 7 209MONTCALM 588 5 593MONTMORENCY 50 8 58MUSKEGON 819 13 832NEWAYGO 71 5 76OAKLAND 1,140 64 1,204OCEANA 98 3 101OGEMAW 91 5 96ONTONAGON 19 19OSCEOLA 25 4 29OSCODA 23 1 24OTSEGO 310 19 329OTTAWA 204 11 215OUT OF STATE 31 2 33PRESQUE ISLE 19 2 21ROSCOMMON 122 8 130SAGINAW 824 16 840SANILAC 44 6 50SCHOOLCRAFT 40 3 43SHIAWASSEE 78 3 81ST CLAIR 236 31 267ST JOSEPH 82 1 83TUSCOLA 415 90 505VAN BUREN 246 12 258WASHTENAW 1,339 27 1,366WAYNE 4,943 148 5,091WEXFORD 168 11 179WORK AT HOME - MI 1,723 440 2,163
Grand Total: 44,570 2,741 47,311
ACTIVE CLASSIFIED EMPLOYEES BY WORK COUNTYSTATE OF MICHIGAN
Pay End Date: December 26, 2020
Michigan Civil Service Commission HWF55Source:
This report reflects classified employees who are full-time, part-time, permanent-intermittent, limited-term,seasonal, noncareer, or on workers' compensation in primary positions only.
Comment:
2 - 7
0
SECTION THREE
EMPLOYEE CONTINUITY OVERVIEW
Graph 3-1
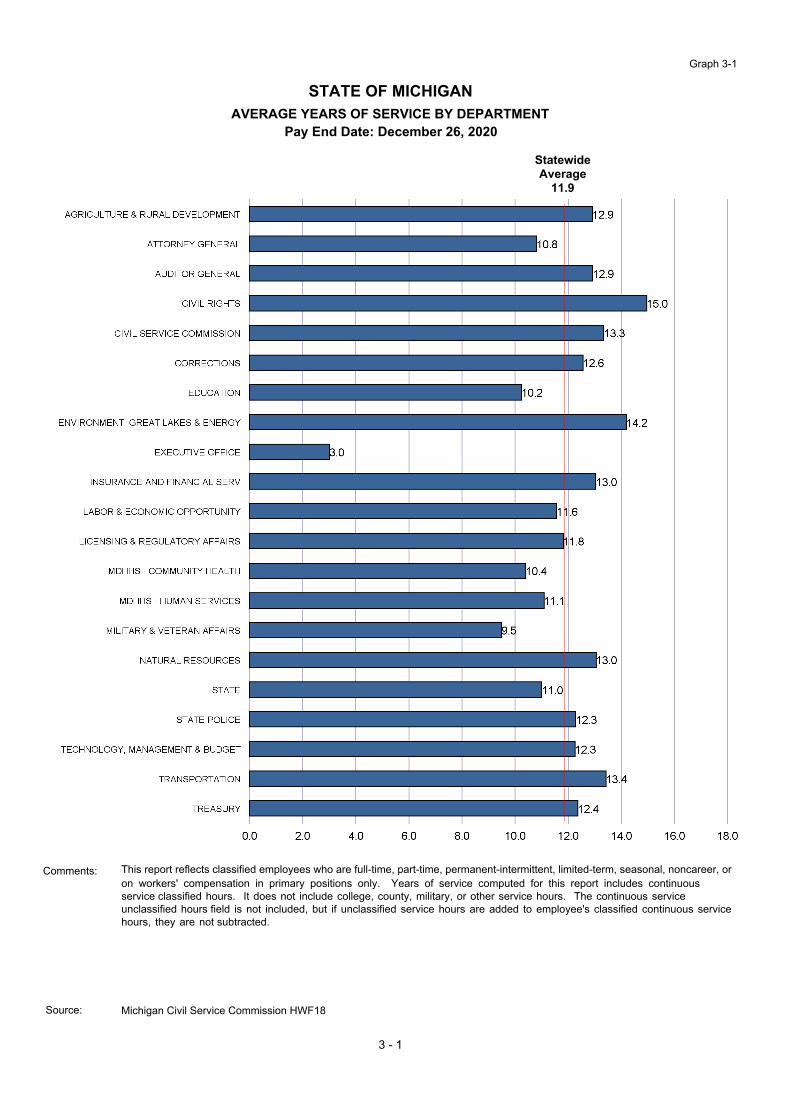
AVERAGE YEARS OF SERVICE BY DEPARTMENTSTATE OF MICHIGAN
Pay End Date: December 26, 2020
StatewideAverage
11.9
Comments: This report reflects classified employees who are full-time, part-time, permanent-intermittent, limited-term, seasonal, noncareer, or on workers' compensation in primary positions only. Years of service computed for this report includes continuous service classified hours. It does not include college, county, military, or other service hours. The continuous service unclassified hours field is not included, but if unclassified service hours are added to employee's classified continuous service hours, they are not subtracted.
Michigan Civil Service Commission HWF18
3 - 1
Source:
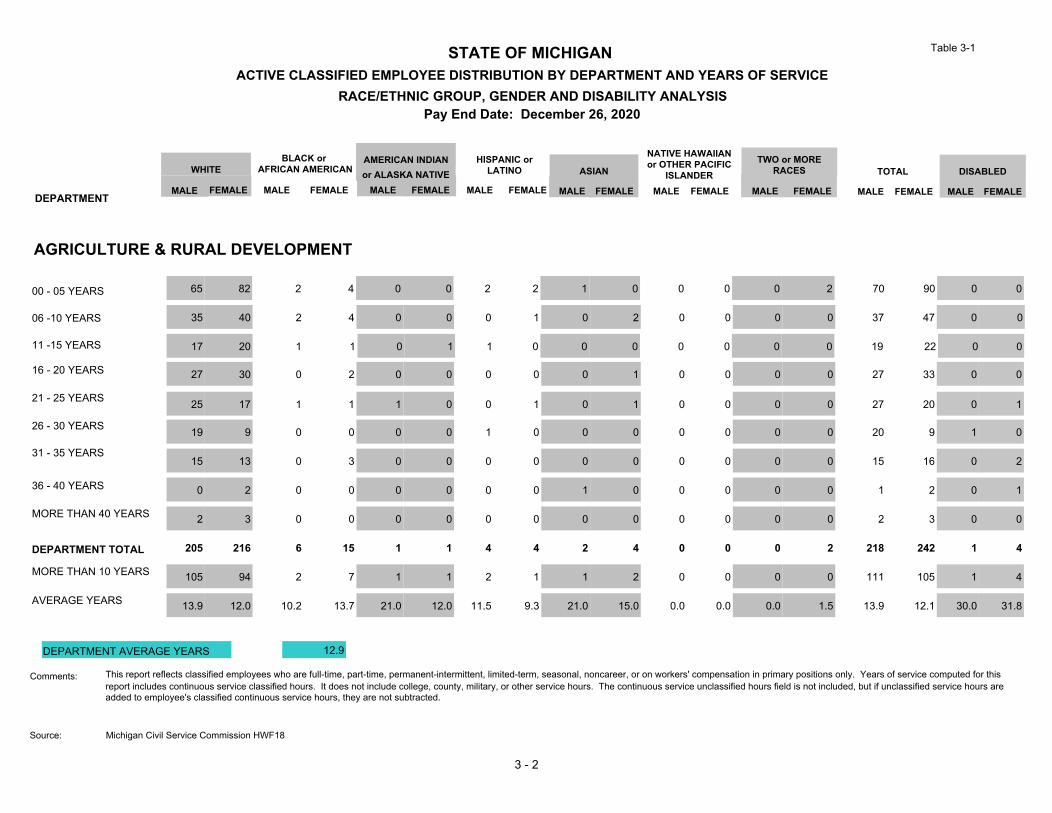
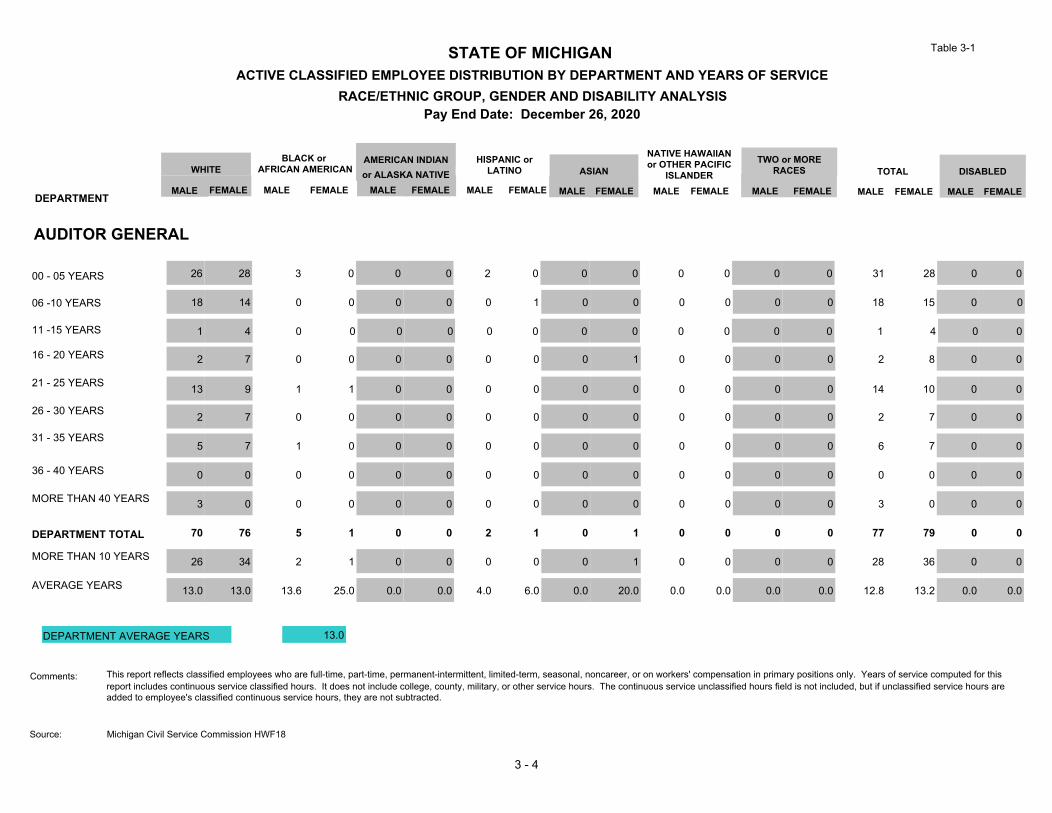
STATE OF MICHIGANACTIVE CLASSIFIED EMPLOYEE DISTRIBUTION BY DEPARTMENT AND YEARS OF SERVICE
RACE/ETHNIC GROUP, GENDER AND DISABILITY ANALYSISPay End Date: December 26, 2020
DEPARTMENTMALE FEMALE
WHITE
MALE MALEFEMALE
BLACK or AFRICAN AMERICAN
FEMALEor ALASKA NATIVEAMERICAN INDIAN HISPANIC or
LATINO
MALE FEMALE
ASIAN
MALE FEMALE
NATIVE HAWAIIANor OTHER PACIFIC
ISLANDERMALE FEMALE
TOTAL
MALE FEMALE
DISABLED
MALE FEMALE
Table 3-1
AGRICULTURE & RURAL DEVELOPMENT
12.9 # # ##
205 216 6 15 1 1 4 4 2 4 0 0 0 2 218 242 1 4
13.9 12.0 10.2 13.7 21.0 12.0 11.5 9.3 21.0 15.0 0.0 0.0 0.0 1.5 13.9 12.1 30.0 31.8
105 94 2 7 1 1 2 1 1 2 0 0 0 0 111 105 1 4
2 3 0 0 0 0 0 0 0 0 0 0 0 0 2 3 0 0
0 2 0 0 0 0 0 0 1 0 0 0 0 0 1 2 0 1
15 13 0 3 0 0 0 0 0 0 0 0 0 0 15 16 0 2
25 17 1 1 1 0 0 1 0 1 0 0 0 0 27 20 0 1
27 30 0 2 0 0 0 0 0 1 0 0 0 0 27 33 0 0
17 20 1 1 0 1 1 0 0 0 0 0 0 0 19 22 0 0
65 82 2 4 0 0 2 2 1 0 0 0 0 2 70 90 0 000 - 05 YEARS
06 -10 YEARS
16 - 20 YEARS
21 - 25 YEARS
26 - 30 YEARS
31 - 35 YEARS
36 - 40 YEARS
MORE THAN 40 YEARS
DEPARTMENT TOTAL
MORE THAN 10 YEARS
AVERAGE YEARS
DEPARTMENT AVERAGE YEARS
11 -15 YEARS
19 9 0 0 0 0 1 0 0 0 0 0 0 0 20 9 1 0
35 40 2 4 0 0 0 1 0 2 0 0 0 0 37 47 0 0
TWO or MORERACES
MALE FEMALE
Comments: This report reflects classified employees who are full-time, part-time, permanent-intermittent, limited-term, seasonal, noncareer, or on workers' compensation in primary positions only. Years of service computed for this report includes continuous service classified hours. It does not include college, county, military, or other service hours. The continuous service unclassified hours field is not included, but if unclassified service hours are added to employee's classified continuous service hours, they are not subtracted.
Source:
3 - 2
Michigan Civil Service Commission HWF18
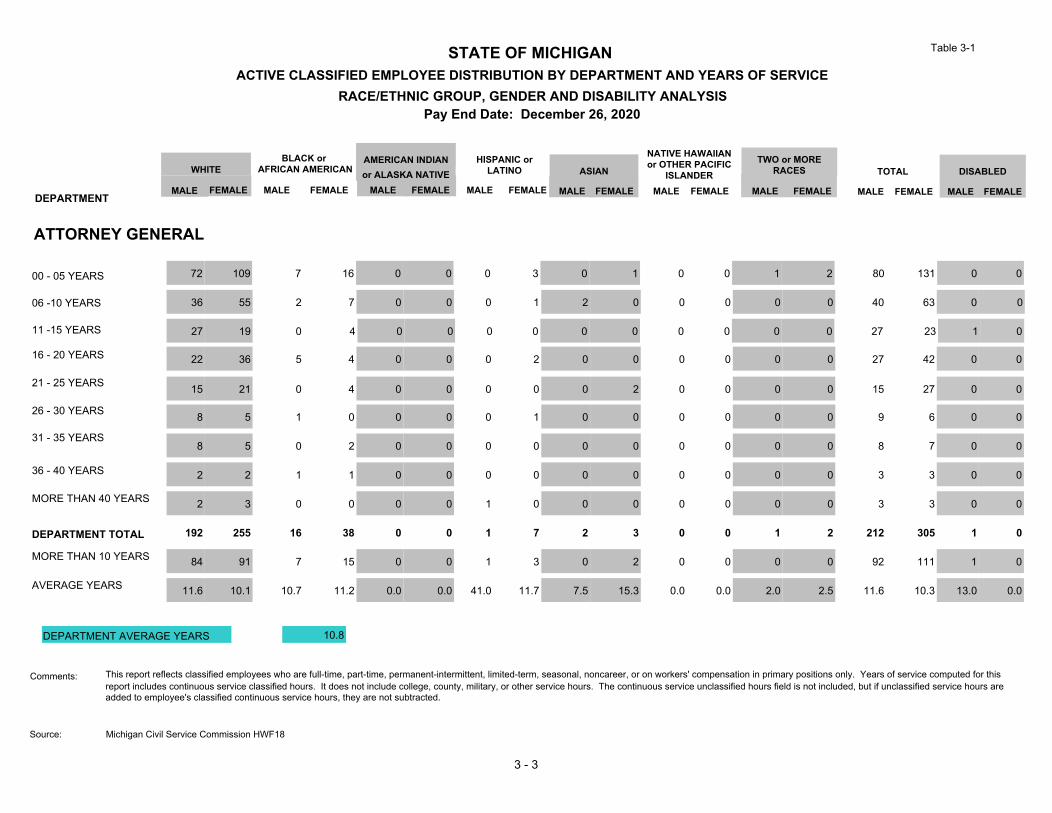
STATE OF MICHIGANACTIVE CLASSIFIED EMPLOYEE DISTRIBUTION BY DEPARTMENT AND YEARS OF SERVICE
RACE/ETHNIC GROUP, GENDER AND DISABILITY ANALYSISPay End Date: December 26, 2020
DEPARTMENTMALE FEMALE
WHITE
MALE MALEFEMALE
BLACK or AFRICAN AMERICAN
FEMALEor ALASKA NATIVEAMERICAN INDIAN HISPANIC or
LATINO
MALE FEMALE
ASIAN
MALE FEMALE
NATIVE HAWAIIANor OTHER PACIFIC
ISLANDERMALE FEMALE
TOTAL
MALE FEMALE
DISABLED
MALE FEMALE
Table 3-1
ATTORNEY GENERAL
10.8 # # ##
192 255 16 38 0 0 1 7 2 3 0 0 1 2 212 305 1 0
11.6 10.1 10.7 11.2 0.0 0.0 41.0 11.7 7.5 15.3 0.0 0.0 2.0 2.5 11.6 10.3 13.0 0.0
84 91 7 15 0 0 1 3 0 2 0 0 0 0 92 111 1 0
2 3 0 0 0 0 1 0 0 0 0 0 0 0 3 3 0 0
2 2 1 1 0 0 0 0 0 0 0 0 0 0 3 3 0 0
8 5 0 2 0 0 0 0 0 0 0 0 0 0 8 7 0 0
15 21 0 4 0 0 0 0 0 2 0 0 0 0 15 27 0 0
22 36 5 4 0 0 0 2 0 0 0 0 0 0 27 42 0 0
27 19 0 4 0 0 0 0 0 0 0 0 0 0 27 23 1 0
72 109 7 16 0 0 0 3 0 1 0 0 1 2 80 131 0 000 - 05 YEARS
06 -10 YEARS
16 - 20 YEARS
21 - 25 YEARS
26 - 30 YEARS
31 - 35 YEARS
36 - 40 YEARS
MORE THAN 40 YEARS
DEPARTMENT TOTAL
MORE THAN 10 YEARS
AVERAGE YEARS
DEPARTMENT AVERAGE YEARS
11 -15 YEARS
8 5 1 0 0 0 0 1 0 0 0 0 0 0 9 6 0 0
36 55 2 7 0 0 0 1 2 0 0 0 0 0 40 63 0 0
TWO or MORERACES
MALE FEMALE
Comments: This report reflects classified employees who are full-time, part-time, permanent-intermittent, limited-term, seasonal, noncareer, or on workers' compensation in primary positions only. Years of service computed for this report includes continuous service classified hours. It does not include college, county, military, or other service hours. The continuous service unclassified hours field is not included, but if unclassified service hours are added to employee's classified continuous service hours, they are not subtracted.
Source:
3 - 3
Michigan Civil Service Commission HWF18
STATE OF MICHIGANACTIVE CLASSIFIED EMPLOYEE DISTRIBUTION BY DEPARTMENT AND YEARS OF SERVICE
RACE/ETHNIC GROUP, GENDER AND DISABILITY ANALYSISPay End Date: December 26, 2020
DEPARTMENTMALE FEMALE
WHITE
MALE MALEFEMALE
BLACK or AFRICAN AMERICAN
FEMALEor ALASKA NATIVEAMERICAN INDIAN HISPANIC or
LATINO
MALE FEMALE
ASIAN
MALE FEMALE
NATIVE HAWAIIANor OTHER PACIFIC
ISLANDERMALE FEMALE
TOTAL
MALE FEMALE
DISABLED
MALE FEMALE
Table 3-1
AUDITOR GENERAL
13.0 # # ##
70 76 5 1 0 0 2 1 0 1 0 0 0 0 77 79 0 0
13.0 13.0 13.6 25.0 0.0 0.0 4.0 6.0 0.0 20.0 0.0 0.0 0.0 0.0 12.8 13.2 0.0 0.0
26 34 2 1 0 0 0 0 0 1 0 0 0 0 28 36 0 0
3 0 0 0 0 0 0 0 0 0 0 0 0 0 3 0 0 0
0 0 0 0 0 0 0 0 0 0 0 0 0 0 0 0 0 0
5 7 1 0 0 0 0 0 0 0 0 0 0 0 6 7 0 0
13 9 1 1 0 0 0 0 0 0 0 0 0 0 14 10 0 0
2 7 0 0 0 0 0 0 0 1 0 0 0 0 2 8 0 0
1 4 0 0 0 0 0 0 0 0 0 0 0 0 1 4 0 0
26 28 3 0 0 0 2 0 0 0 0 0 0 0 31 28 0 000 - 05 YEARS
06 -10 YEARS
16 - 20 YEARS
21 - 25 YEARS
26 - 30 YEARS
31 - 35 YEARS
36 - 40 YEARS
MORE THAN 40 YEARS
DEPARTMENT TOTAL
MORE THAN 10 YEARS
AVERAGE YEARS
DEPARTMENT AVERAGE YEARS
11 -15 YEARS
2 7 0 0 0 0 0 0 0 0 0 0 0 0 2 7 0 0
18 14 0 0 0 0 0 1 0 0 0 0 0 0 18 15 0 0
TWO or MORERACES
MALE FEMALE
Comments: This report reflects classified employees who are full-time, part-time, permanent-intermittent, limited-term, seasonal, noncareer, or on workers' compensation in primary positions only. Years of service computed for this report includes continuous service classified hours. It does not include college, county, military, or other service hours. The continuous service unclassified hours field is not included, but if unclassified service hours are added to employee's classified continuous service hours, they are not subtracted.
Source:
3 - 4
Michigan Civil Service Commission HWF18
STATE OF MICHIGANACTIVE CLASSIFIED EMPLOYEE DISTRIBUTION BY DEPARTMENT AND YEARS OF SERVICE
RACE/ETHNIC GROUP, GENDER AND DISABILITY ANALYSISPay End Date: December 26, 2020
DEPARTMENTMALE FEMALE
WHITE
MALE MALEFEMALE
BLACK or AFRICAN AMERICAN
FEMALEor ALASKA NATIVEAMERICAN INDIAN HISPANIC or
LATINO
MALE FEMALE
ASIAN
MALE FEMALE
NATIVE HAWAIIANor OTHER PACIFIC
ISLANDERMALE FEMALE
TOTAL
MALE FEMALE
DISABLED
MALE FEMALE
Table 3-1
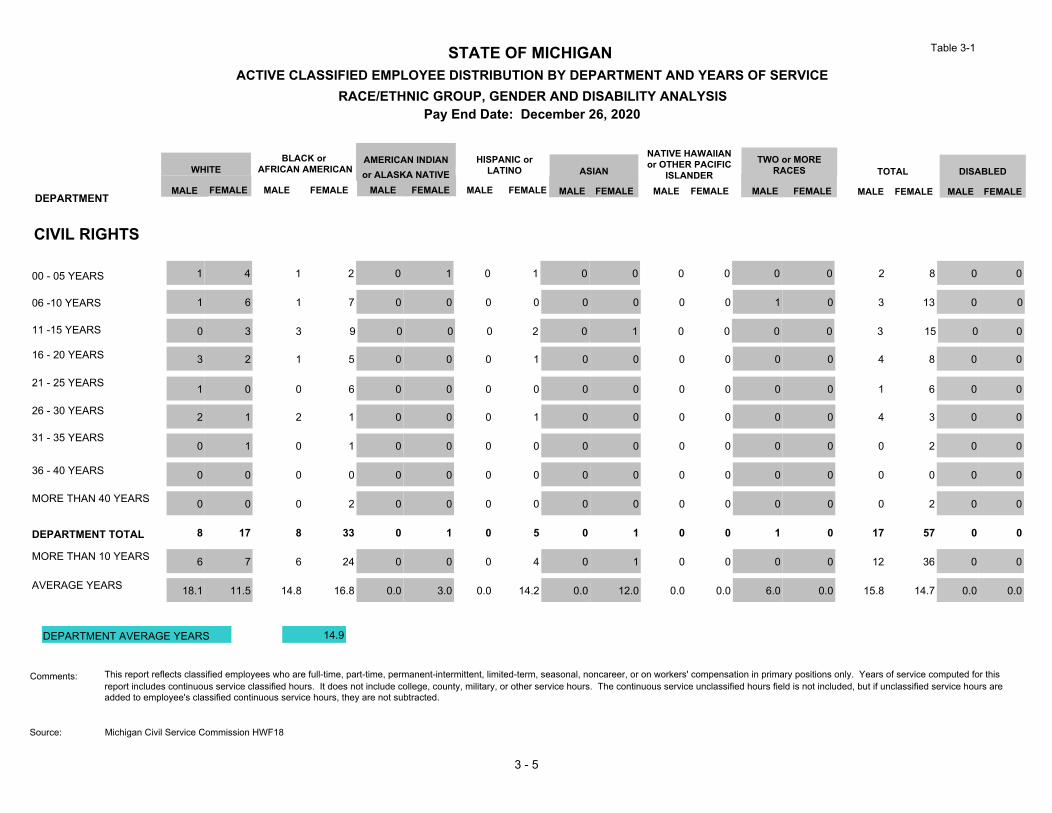
CIVIL RIGHTS
14.9 # # ##
8 17 8 33 0 1 0 5 0 1 0 0 1 0 17 57 0 0
18.1 11.5 14.8 16.8 0.0 3.0 0.0 14.2 0.0 12.0 0.0 0.0 6.0 0.0 15.8 14.7 0.0 0.0
6 7 6 24 0 0 0 4 0 1 0 0 0 0 12 36 0 0
0 0 0 2 0 0 0 0 0 0 0 0 0 0 0 2 0 0
0 0 0 0 0 0 0 0 0 0 0 0 0 0 0 0 0 0
0 1 0 1 0 0 0 0 0 0 0 0 0 0 0 2 0 0
1 0 0 6 0 0 0 0 0 0 0 0 0 0 1 6 0 0
3 2 1 5 0 0 0 1 0 0 0 0 0 0 4 8 0 0
0 3 3 9 0 0 0 2 0 1 0 0 0 0 3 15 0 0
1 4 1 2 0 1 0 1 0 0 0 0 0 0 2 8 0 000 - 05 YEARS
06 -10 YEARS
16 - 20 YEARS
21 - 25 YEARS
26 - 30 YEARS
31 - 35 YEARS
36 - 40 YEARS
MORE THAN 40 YEARS
DEPARTMENT TOTAL
MORE THAN 10 YEARS
AVERAGE YEARS
DEPARTMENT AVERAGE YEARS
11 -15 YEARS
2 1 2 1 0 0 0 1 0 0 0 0 0 0 4 3 0 0
1 6 1 7 0 0 0 0 0 0 0 0 1 0 3 13 0 0
TWO or MORERACES
MALE FEMALE
Comments: This report reflects classified employees who are full-time, part-time, permanent-intermittent, limited-term, seasonal, noncareer, or on workers' compensation in primary positions only. Years of service computed for this report includes continuous service classified hours. It does not include college, county, military, or other service hours. The continuous service unclassified hours field is not included, but if unclassified service hours are added to employee's classified continuous service hours, they are not subtracted.
Source:
3 - 5
Michigan Civil Service Commission HWF18
STATE OF MICHIGANACTIVE CLASSIFIED EMPLOYEE DISTRIBUTION BY DEPARTMENT AND YEARS OF SERVICE
RACE/ETHNIC GROUP, GENDER AND DISABILITY ANALYSISPay End Date: December 26, 2020
DEPARTMENTMALE FEMALE
WHITE
MALE MALEFEMALE
BLACK or AFRICAN AMERICAN
FEMALEor ALASKA NATIVEAMERICAN INDIAN HISPANIC or
LATINO
MALE FEMALE
ASIAN
MALE FEMALE
NATIVE HAWAIIANor OTHER PACIFIC
ISLANDERMALE FEMALE
TOTAL
MALE FEMALE
DISABLED
MALE FEMALE
Table 3-1
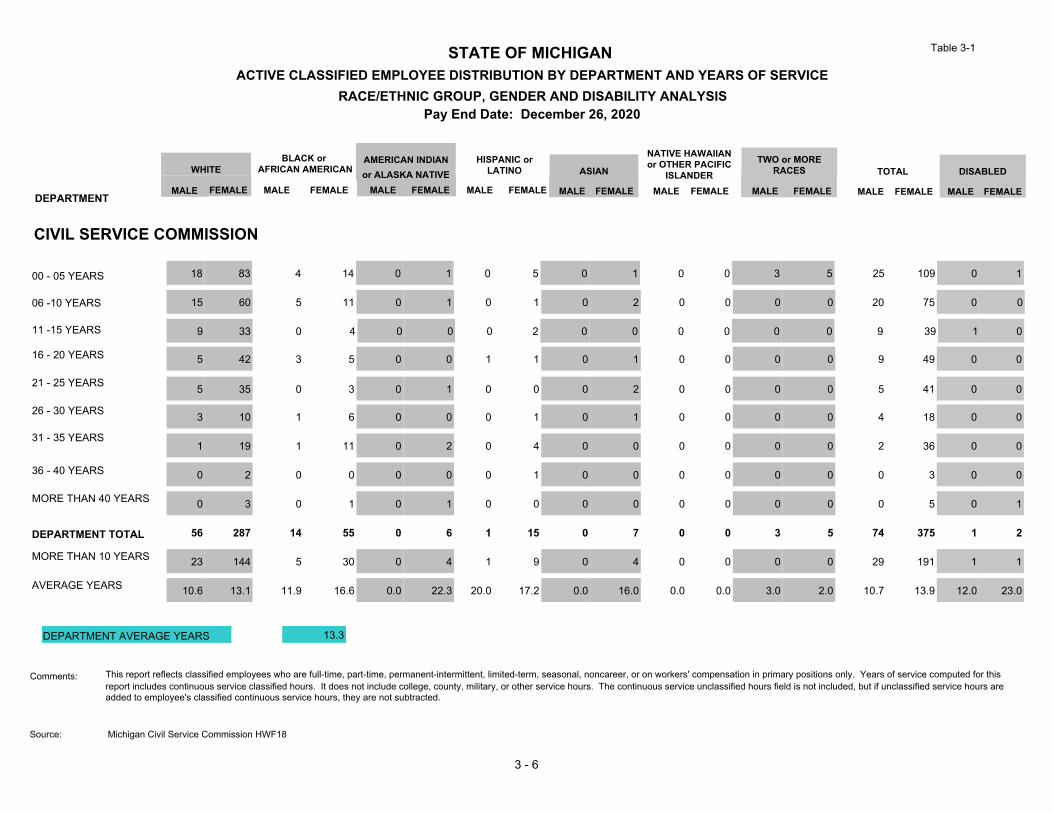
CIVIL SERVICE COMMISSION
13.3 # # ##
56 287 14 55 0 6 1 15 0 7 0 0 3 5 74 375 1 2
10.6 13.1 11.9 16.6 0.0 22.3 20.0 17.2 0.0 16.0 0.0 0.0 3.0 2.0 10.7 13.9 12.0 23.0
23 144 5 30 0 4 1 9 0 4 0 0 0 0 29 191 1 1
0 3 0 1 0 1 0 0 0 0 0 0 0 0 0 5 0 1
0 2 0 0 0 0 0 1 0 0 0 0 0 0 0 3 0 0
1 19 1 11 0 2 0 4 0 0 0 0 0 0 2 36 0 0
5 35 0 3 0 1 0 0 0 2 0 0 0 0 5 41 0 0
5 42 3 5 0 0 1 1 0 1 0 0 0 0 9 49 0 0
9 33 0 4 0 0 0 2 0 0 0 0 0 0 9 39 1 0
18 83 4 14 0 1 0 5 0 1 0 0 3 5 25 109 0 100 - 05 YEARS
06 -10 YEARS
16 - 20 YEARS
21 - 25 YEARS
26 - 30 YEARS
31 - 35 YEARS
36 - 40 YEARS
MORE THAN 40 YEARS
DEPARTMENT TOTAL
MORE THAN 10 YEARS
AVERAGE YEARS
DEPARTMENT AVERAGE YEARS
11 -15 YEARS
3 10 1 6 0 0 0 1 0 1 0 0 0 0 4 18 0 0
15 60 5 11 0 1 0 1 0 2 0 0 0 0 20 75 0 0
TWO or MORERACES
MALE FEMALE
Comments: This report reflects classified employees who are full-time, part-time, permanent-intermittent, limited-term, seasonal, noncareer, or on workers' compensation in primary positions only. Years of service computed for this report includes continuous service classified hours. It does not include college, county, military, or other service hours. The continuous service unclassified hours field is not included, but if unclassified service hours are added to employee's classified continuous service hours, they are not subtracted.
Source:
3 - 6
Michigan Civil Service Commission HWF18
STATE OF MICHIGANACTIVE CLASSIFIED EMPLOYEE DISTRIBUTION BY DEPARTMENT AND YEARS OF SERVICE
RACE/ETHNIC GROUP, GENDER AND DISABILITY ANALYSISPay End Date: December 26, 2020
DEPARTMENTMALE FEMALE
WHITE
MALE MALEFEMALE
BLACK or AFRICAN AMERICAN
FEMALEor ALASKA NATIVEAMERICAN INDIAN HISPANIC or
LATINO
MALE FEMALE
ASIAN
MALE FEMALE
NATIVE HAWAIIANor OTHER PACIFIC
ISLANDERMALE FEMALE
TOTAL
MALE FEMALE
DISABLED
MALE FEMALE
Table 3-1
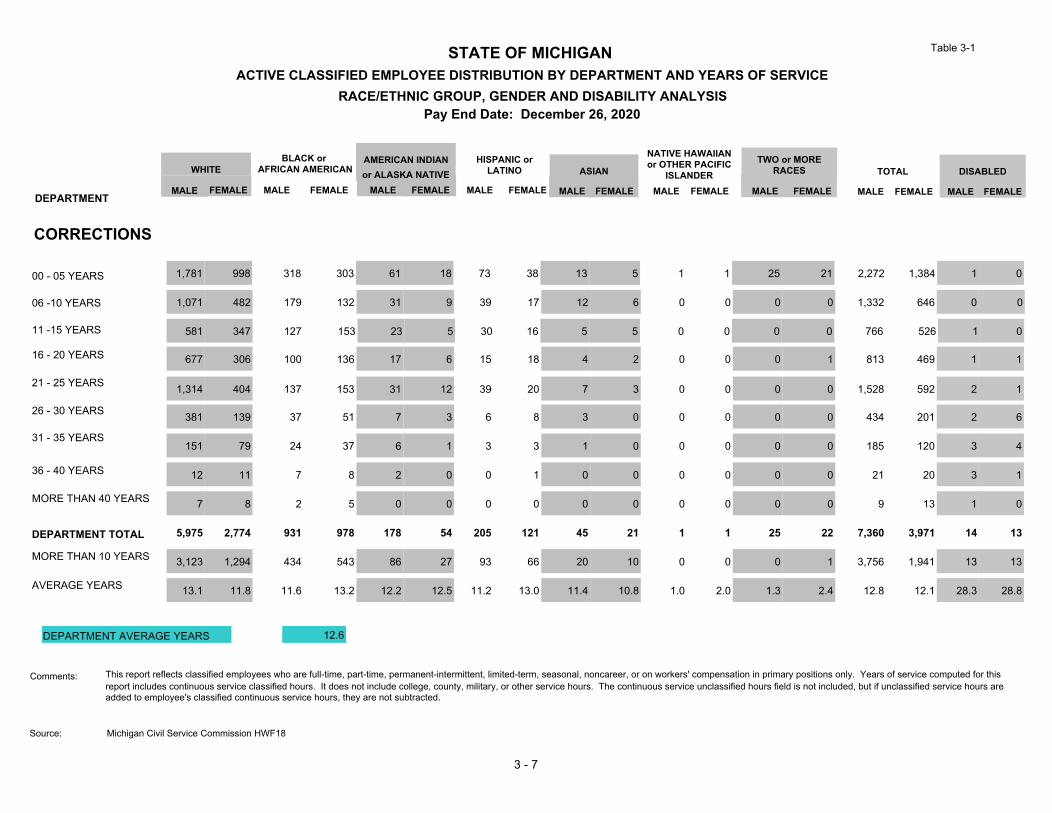
CORRECTIONS
12.6 # # ##
5,975 2,774 931 978 178 54 205 121 45 21 1 1 25 22 7,360 3,971 14 13
13.1 11.8 11.6 13.2 12.2 12.5 11.2 13.0 11.4 10.8 1.0 2.0 1.3 2.4 12.8 12.1 28.3 28.8
3,123 1,294 434 543 86 27 93 66 20 10 0 0 0 1 3,756 1,941 13 13
7 8 2 5 0 0 0 0 0 0 0 0 0 0 9 13 1 0
12 11 7 8 2 0 0 1 0 0 0 0 0 0 21 20 3 1
151 79 24 37 6 1 3 3 1 0 0 0 0 0 185 120 3 4
1,314 404 137 153 31 12 39 20 7 3 0 0 0 0 1,528 592 2 1
677 306 100 136 17 6 15 18 4 2 0 0 0 1 813 469 1 1
581 347 127 153 23 5 30 16 5 5 0 0 0 0 766 526 1 0
1,781 998 318 303 61 18 73 38 13 5 1 1 25 21 2,272 1,384 1 000 - 05 YEARS
06 -10 YEARS
16 - 20 YEARS
21 - 25 YEARS
26 - 30 YEARS
31 - 35 YEARS
36 - 40 YEARS
MORE THAN 40 YEARS
DEPARTMENT TOTAL
MORE THAN 10 YEARS
AVERAGE YEARS
DEPARTMENT AVERAGE YEARS
11 -15 YEARS
381 139 37 51 7 3 6 8 3 0 0 0 0 0 434 201 2 6
1,071 482 179 132 31 9 39 17 12 6 0 0 0 0 1,332 646 0 0
TWO or MORERACES
MALE FEMALE
Comments: This report reflects classified employees who are full-time, part-time, permanent-intermittent, limited-term, seasonal, noncareer, or on workers' compensation in primary positions only. Years of service computed for this report includes continuous service classified hours. It does not include college, county, military, or other service hours. The continuous service unclassified hours field is not included, but if unclassified service hours are added to employee's classified continuous service hours, they are not subtracted.
Source:
3 - 7
Michigan Civil Service Commission HWF18
STATE OF MICHIGANACTIVE CLASSIFIED EMPLOYEE DISTRIBUTION BY DEPARTMENT AND YEARS OF SERVICE
RACE/ETHNIC GROUP, GENDER AND DISABILITY ANALYSISPay End Date: December 26, 2020
DEPARTMENTMALE FEMALE
WHITE
MALE MALEFEMALE
BLACK or AFRICAN AMERICAN
FEMALEor ALASKA NATIVEAMERICAN INDIAN HISPANIC or
LATINO
MALE FEMALE
ASIAN
MALE FEMALE
NATIVE HAWAIIANor OTHER PACIFIC
ISLANDERMALE FEMALE
TOTAL
MALE FEMALE
DISABLED
MALE FEMALE
Table 3-1
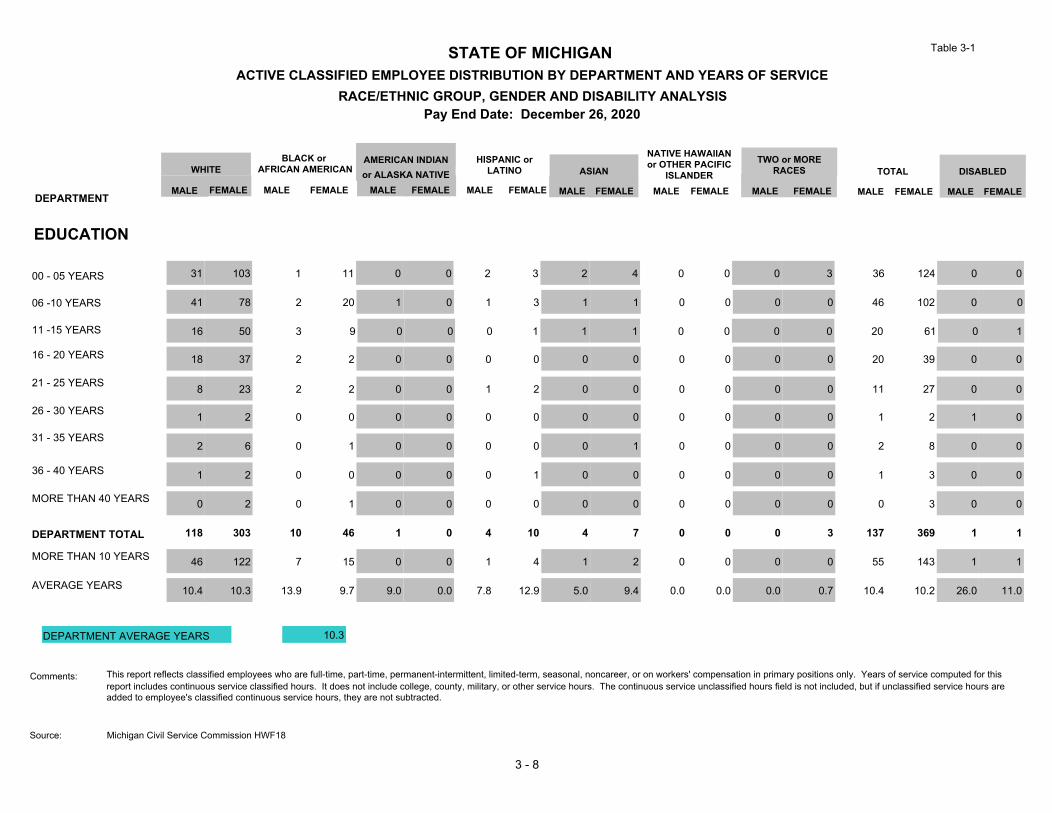
EDUCATION
10.3 # # ##
118 303 10 46 1 0 4 10 4 7 0 0 0 3 137 369 1 1
10.4 10.3 13.9 9.7 9.0 0.0 7.8 12.9 5.0 9.4 0.0 0.0 0.0 0.7 10.4 10.2 26.0 11.0
46 122 7 15 0 0 1 4 1 2 0 0 0 0 55 143 1 1
0 2 0 1 0 0 0 0 0 0 0 0 0 0 0 3 0 0
1 2 0 0 0 0 0 1 0 0 0 0 0 0 1 3 0 0
2 6 0 1 0 0 0 0 0 1 0 0 0 0 2 8 0 0
8 23 2 2 0 0 1 2 0 0 0 0 0 0 11 27 0 0
18 37 2 2 0 0 0 0 0 0 0 0 0 0 20 39 0 0
16 50 3 9 0 0 0 1 1 1 0 0 0 0 20 61 0 1
31 103 1 11 0 0 2 3 2 4 0 0 0 3 36 124 0 000 - 05 YEARS
06 -10 YEARS
16 - 20 YEARS
21 - 25 YEARS
26 - 30 YEARS
31 - 35 YEARS
36 - 40 YEARS
MORE THAN 40 YEARS
DEPARTMENT TOTAL
MORE THAN 10 YEARS
AVERAGE YEARS
DEPARTMENT AVERAGE YEARS
11 -15 YEARS
1 2 0 0 0 0 0 0 0 0 0 0 0 0 1 2 1 0
41 78 2 20 1 0 1 3 1 1 0 0 0 0 46 102 0 0
TWO or MORERACES
MALE FEMALE
Comments: This report reflects classified employees who are full-time, part-time, permanent-intermittent, limited-term, seasonal, noncareer, or on workers' compensation in primary positions only. Years of service computed for this report includes continuous service classified hours. It does not include college, county, military, or other service hours. The continuous service unclassified hours field is not included, but if unclassified service hours are added to employee's classified continuous service hours, they are not subtracted.
Source:
3 - 8
Michigan Civil Service Commission HWF18

STATE OF MICHIGANACTIVE CLASSIFIED EMPLOYEE DISTRIBUTION BY DEPARTMENT AND YEARS OF SERVICE
RACE/ETHNIC GROUP, GENDER AND DISABILITY ANALYSISPay End Date: December 26, 2020
DEPARTMENTMALE FEMALE
WHITE
MALE MALEFEMALE
BLACK or AFRICAN AMERICAN
FEMALEor ALASKA NATIVEAMERICAN INDIAN HISPANIC or
LATINO
MALE FEMALE
ASIAN
MALE FEMALE
NATIVE HAWAIIANor OTHER PACIFIC
ISLANDERMALE FEMALE
TOTAL
MALE FEMALE
DISABLED
MALE FEMALE
Table 3-1
ENVIRONMENT, GREAT LAKES & ENERGY
14.2 # # ##
563 536 16 25 2 4 10 9 18 17 0 0 1 7 610 598 6 3
15.3 12.9 22.8 12.4 22.0 14.0 17.3 16.7 14.1 14.1 0.0 0.0 4.0 1.1 15.5 12.8 36.3 38.0
313 263 14 9 1 2 6 6 9 8 0 0 0 0 343 288 6 3
12 7 1 1 1 0 0 0 0 0 0 0 0 0 14 8 3 2
7 4 3 1 0 0 0 0 0 0 0 0 0 0 10 5 0 0
46 29 2 2 0 1 1 1 0 0 0 0 0 0 49 33 2 0
68 51 1 2 0 0 1 1 2 4 0 0 0 0 72 58 0 0
85 74 4 0 0 1 1 2 1 0 0 0 0 0 91 77 0 0
32 57 2 1 0 0 0 1 0 1 0 0 0 0 34 60 0 0
173 186 2 13 1 2 3 2 9 4 0 0 1 7 189 214 0 000 - 05 YEARS
06 -10 YEARS
16 - 20 YEARS
21 - 25 YEARS
26 - 30 YEARS
31 - 35 YEARS
36 - 40 YEARS
MORE THAN 40 YEARS
DEPARTMENT TOTAL
MORE THAN 10 YEARS
AVERAGE YEARS
DEPARTMENT AVERAGE YEARS
11 -15 YEARS
63 41 1 2 0 0 3 1 6 3 0 0 0 0 73 47 1 1
77 87 0 3 0 0 1 1 0 5 0 0 0 0 78 96 0 0
TWO or MORERACES
MALE FEMALE
Comments: This report reflects classified employees who are full-time, part-time, permanent-intermittent, limited-term, seasonal, noncareer, or on workers' compensation in primary positions only. Years of service computed for this report includes continuous service classified hours. It does not include college, county, military, or other service hours. The continuous service unclassified hours field is not included, but if unclassified service hours are added to employee's classified continuous service hours, they are not subtracted.
Source:
3 - 9
Michigan Civil Service Commission HWF18
STATE OF MICHIGANACTIVE CLASSIFIED EMPLOYEE DISTRIBUTION BY DEPARTMENT AND YEARS OF SERVICE
RACE/ETHNIC GROUP, GENDER AND DISABILITY ANALYSISPay End Date: December 26, 2020
DEPARTMENTMALE FEMALE
WHITE
MALE MALEFEMALE
BLACK or AFRICAN AMERICAN
FEMALEor ALASKA NATIVEAMERICAN INDIAN HISPANIC or
LATINO
MALE FEMALE
ASIAN
MALE FEMALE
NATIVE HAWAIIANor OTHER PACIFIC
ISLANDERMALE FEMALE
TOTAL
MALE FEMALE
DISABLED
MALE FEMALE
Table 3-1
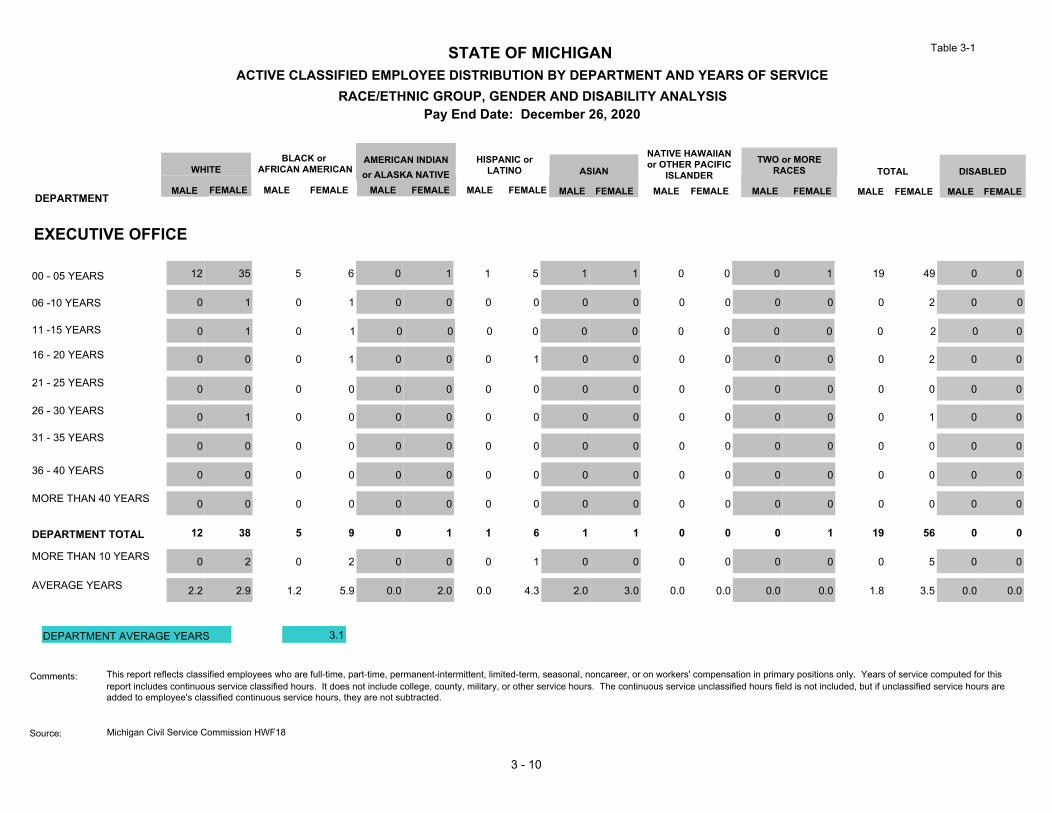
EXECUTIVE OFFICE
3.1 # # ##
12 38 5 9 0 1 1 6 1 1 0 0 0 1 19 56 0 0
2.2 2.9 1.2 5.9 0.0 2.0 0.0 4.3 2.0 3.0 0.0 0.0 0.0 0.0 1.8 3.5 0.0 0.0
0 2 0 2 0 0 0 1 0 0 0 0 0 0 0 5 0 0
0 0 0 0 0 0 0 0 0 0 0 0 0 0 0 0 0 0
0 0 0 0 0 0 0 0 0 0 0 0 0 0 0 0 0 0
0 0 0 0 0 0 0 0 0 0 0 0 0 0 0 0 0 0
0 0 0 0 0 0 0 0 0 0 0 0 0 0 0 0 0 0
0 0 0 1 0 0 0 1 0 0 0 0 0 0 0 2 0 0
0 1 0 1 0 0 0 0 0 0 0 0 0 0 0 2 0 0
12 35 5 6 0 1 1 5 1 1 0 0 0 1 19 49 0 000 - 05 YEARS
06 -10 YEARS
16 - 20 YEARS
21 - 25 YEARS
26 - 30 YEARS
31 - 35 YEARS
36 - 40 YEARS
MORE THAN 40 YEARS
DEPARTMENT TOTAL
MORE THAN 10 YEARS
AVERAGE YEARS
DEPARTMENT AVERAGE YEARS
11 -15 YEARS
0 1 0 0 0 0 0 0 0 0 0 0 0 0 0 1 0 0
0 1 0 1 0 0 0 0 0 0 0 0 0 0 0 2 0 0
TWO or MORERACES
MALE FEMALE
Comments: This report reflects classified employees who are full-time, part-time, permanent-intermittent, limited-term, seasonal, noncareer, or on workers' compensation in primary positions only. Years of service computed for this report includes continuous service classified hours. It does not include college, county, military, or other service hours. The continuous service unclassified hours field is not included, but if unclassified service hours are added to employee's classified continuous service hours, they are not subtracted.
Source:
3 - 10
Michigan Civil Service Commission HWF18

STATE OF MICHIGANACTIVE CLASSIFIED EMPLOYEE DISTRIBUTION BY DEPARTMENT AND YEARS OF SERVICE
RACE/ETHNIC GROUP, GENDER AND DISABILITY ANALYSISPay End Date: December 26, 2020
DEPARTMENTMALE FEMALE
WHITE
MALE MALEFEMALE
BLACK or AFRICAN AMERICAN
FEMALEor ALASKA NATIVEAMERICAN INDIAN HISPANIC or
LATINO
MALE FEMALE
ASIAN
MALE FEMALE
NATIVE HAWAIIANor OTHER PACIFIC
ISLANDERMALE FEMALE
TOTAL
MALE FEMALE
DISABLED
MALE FEMALE
Table 3-1
INSURANCE AND FINANCIAL SERV
13.0 # # ##
114 154 8 23 0 1 5 6 1 4 0 0 1 0 129 188 0 3
11.5 14.1 16.6 13.0 0.0 9.0 8.6 17.5 18.0 9.3 0.0 0.0 1.0 0.0 11.7 14.0 0.0 29.3
49 96 5 14 0 0 1 5 1 2 0 0 0 0 56 117 0 3
1 1 0 0 0 0 0 0 0 0 0 0 0 0 1 1 0 0
2 3 0 0 0 0 0 0 0 0 0 0 0 0 2 3 0 0
7 9 2 1 0 0 0 1 0 0 0 0 0 0 9 11 0 1
6 21 0 3 0 0 0 2 0 0 0 0 0 0 6 26 0 1
13 23 2 2 0 0 1 0 1 0 0 0 0 0 17 25 0 0
13 33 1 7 0 0 0 2 0 2 0 0 0 0 14 44 0 0
48 38 1 6 0 0 1 1 0 1 0 0 1 0 51 46 0 000 - 05 YEARS
06 -10 YEARS
16 - 20 YEARS
21 - 25 YEARS
26 - 30 YEARS
31 - 35 YEARS
36 - 40 YEARS
MORE THAN 40 YEARS
DEPARTMENT TOTAL
MORE THAN 10 YEARS
AVERAGE YEARS
DEPARTMENT AVERAGE YEARS
11 -15 YEARS
7 6 0 1 0 0 0 0 0 0 0 0 0 0 7 7 0 1
17 20 2 3 0 1 3 0 0 1 0 0 0 0 22 25 0 0
TWO or MORERACES
MALE FEMALE
Comments: This report reflects classified employees who are full-time, part-time, permanent-intermittent, limited-term, seasonal, noncareer, or on workers' compensation in primary positions only. Years of service computed for this report includes continuous service classified hours. It does not include college, county, military, or other service hours. The continuous service unclassified hours field is not included, but if unclassified service hours are added to employee's classified continuous service hours, they are not subtracted.
Source:
3 - 11
Michigan Civil Service Commission HWF18
STATE OF MICHIGANACTIVE CLASSIFIED EMPLOYEE DISTRIBUTION BY DEPARTMENT AND YEARS OF SERVICE
RACE/ETHNIC GROUP, GENDER AND DISABILITY ANALYSISPay End Date: December 26, 2020
DEPARTMENTMALE FEMALE
WHITE
MALE MALEFEMALE
BLACK or AFRICAN AMERICAN
FEMALEor ALASKA NATIVEAMERICAN INDIAN HISPANIC or
LATINO
MALE FEMALE
ASIAN
MALE FEMALE
NATIVE HAWAIIANor OTHER PACIFIC
ISLANDERMALE FEMALE
TOTAL
MALE FEMALE
DISABLED
MALE FEMALE
Table 3-1
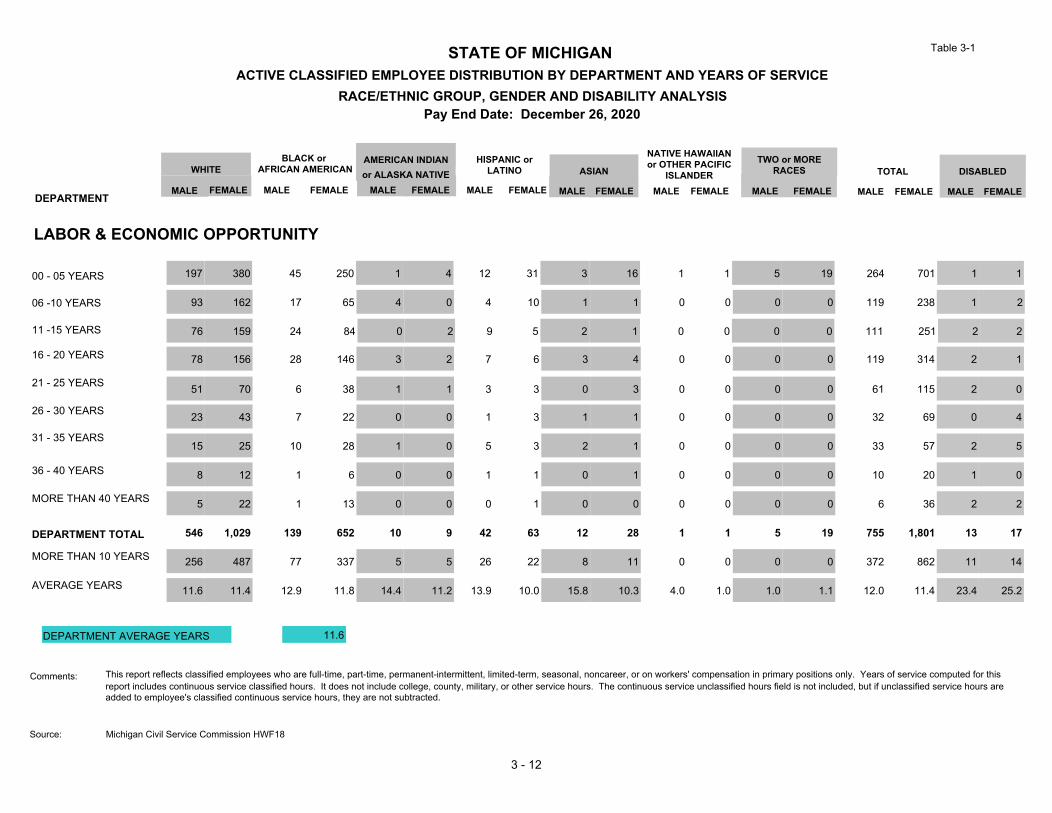
LABOR & ECONOMIC OPPORTUNITY
11.6 # # ##
546 1,029 139 652 10 9 42 63 12 28 1 1 5 19 755 1,801 13 17
11.6 11.4 12.9 11.8 14.4 11.2 13.9 10.0 15.8 10.3 4.0 1.0 1.0 1.1 12.0 11.4 23.4 25.2
256 487 77 337 5 5 26 22 8 11 0 0 0 0 372 862 11 14
5 22 1 13 0 0 0 1 0 0 0 0 0 0 6 36 2 2
8 12 1 6 0 0 1 1 0 1 0 0 0 0 10 20 1 0
15 25 10 28 1 0 5 3 2 1 0 0 0 0 33 57 2 5
51 70 6 38 1 1 3 3 0 3 0 0 0 0 61 115 2 0
78 156 28 146 3 2 7 6 3 4 0 0 0 0 119 314 2 1
76 159 24 84 0 2 9 5 2 1 0 0 0 0 111 251 2 2
197 380 45 250 1 4 12 31 3 16 1 1 5 19 264 701 1 100 - 05 YEARS
06 -10 YEARS
16 - 20 YEARS
21 - 25 YEARS
26 - 30 YEARS
31 - 35 YEARS
36 - 40 YEARS
MORE THAN 40 YEARS
DEPARTMENT TOTAL
MORE THAN 10 YEARS
AVERAGE YEARS
DEPARTMENT AVERAGE YEARS
11 -15 YEARS
23 43 7 22 0 0 1 3 1 1 0 0 0 0 32 69 0 4
93 162 17 65 4 0 4 10 1 1 0 0 0 0 119 238 1 2
TWO or MORERACES
MALE FEMALE
Comments: This report reflects classified employees who are full-time, part-time, permanent-intermittent, limited-term, seasonal, noncareer, or on workers' compensation in primary positions only. Years of service computed for this report includes continuous service classified hours. It does not include college, county, military, or other service hours. The continuous service unclassified hours field is not included, but if unclassified service hours are added to employee's classified continuous service hours, they are not subtracted.
Source:
3 - 12
Michigan Civil Service Commission HWF18

STATE OF MICHIGANACTIVE CLASSIFIED EMPLOYEE DISTRIBUTION BY DEPARTMENT AND YEARS OF SERVICE
RACE/ETHNIC GROUP, GENDER AND DISABILITY ANALYSISPay End Date: December 26, 2020
DEPARTMENTMALE FEMALE
WHITE
MALE MALEFEMALE
BLACK or AFRICAN AMERICAN
FEMALEor ALASKA NATIVEAMERICAN INDIAN HISPANIC or
LATINO
MALE FEMALE
ASIAN
MALE FEMALE
NATIVE HAWAIIANor OTHER PACIFIC
ISLANDERMALE FEMALE
TOTAL
MALE FEMALE
DISABLED
MALE FEMALE
Table 3-1
LICENSING & REGULATORY AFFAIRS
11.8 # # ##
514 759 41 155 3 6 12 28 9 15 0 0 1 11 580 974 1 4
10.9 11.9 14.1 14.2 6.3 15.2 8.9 15.0 15.3 12.3 0.0 0.0 1.0 1.8 11.1 12.2 28.0 34.8
208 353 20 92 0 4 3 17 7 8 0 0 0 0 238 474 1 4
8 9 2 0 0 0 0 0 0 0 0 0 0 0 10 9 0 1
2 4 2 1 0 0 0 0 0 0 0 0 0 0 4 5 0 0
12 27 1 14 0 0 0 4 2 1 0 0 0 0 15 46 0 3
41 61 3 25 0 2 1 3 0 2 0 0 0 0 45 93 0 0
43 94 6 25 0 1 1 3 1 0 0 0 0 0 51 123 0 0
77 117 5 24 0 1 1 5 4 4 0 0 0 0 87 151 0 0
190 255 14 34 0 0 5 9 2 4 0 0 1 11 212 313 0 000 - 05 YEARS
06 -10 YEARS
16 - 20 YEARS
21 - 25 YEARS
26 - 30 YEARS
31 - 35 YEARS
36 - 40 YEARS
MORE THAN 40 YEARS
DEPARTMENT TOTAL
MORE THAN 10 YEARS
AVERAGE YEARS
DEPARTMENT AVERAGE YEARS
11 -15 YEARS
25 41 1 3 0 0 0 2 0 1 0 0 0 0 26 47 1 0
116 151 7 29 3 2 4 2 0 3 0 0 0 0 130 187 0 0
TWO or MORERACES
MALE FEMALE
Comments: This report reflects classified employees who are full-time, part-time, permanent-intermittent, limited-term, seasonal, noncareer, or on workers' compensation in primary positions only. Years of service computed for this report includes continuous service classified hours. It does not include college, county, military, or other service hours. The continuous service unclassified hours field is not included, but if unclassified service hours are added to employee's classified continuous service hours, they are not subtracted.
Source:
3 - 13
Michigan Civil Service Commission HWF18

STATE OF MICHIGANACTIVE CLASSIFIED EMPLOYEE DISTRIBUTION BY DEPARTMENT AND YEARS OF SERVICE
RACE/ETHNIC GROUP, GENDER AND DISABILITY ANALYSISPay End Date: December 26, 2020
DEPARTMENTMALE FEMALE
WHITE
MALE MALEFEMALE
BLACK or AFRICAN AMERICAN
FEMALEor ALASKA NATIVEAMERICAN INDIAN HISPANIC or
LATINO
MALE FEMALE
ASIAN
MALE FEMALE
NATIVE HAWAIIANor OTHER PACIFIC
ISLANDERMALE FEMALE
TOTAL
MALE FEMALE
DISABLED
MALE FEMALE
Table 3-1
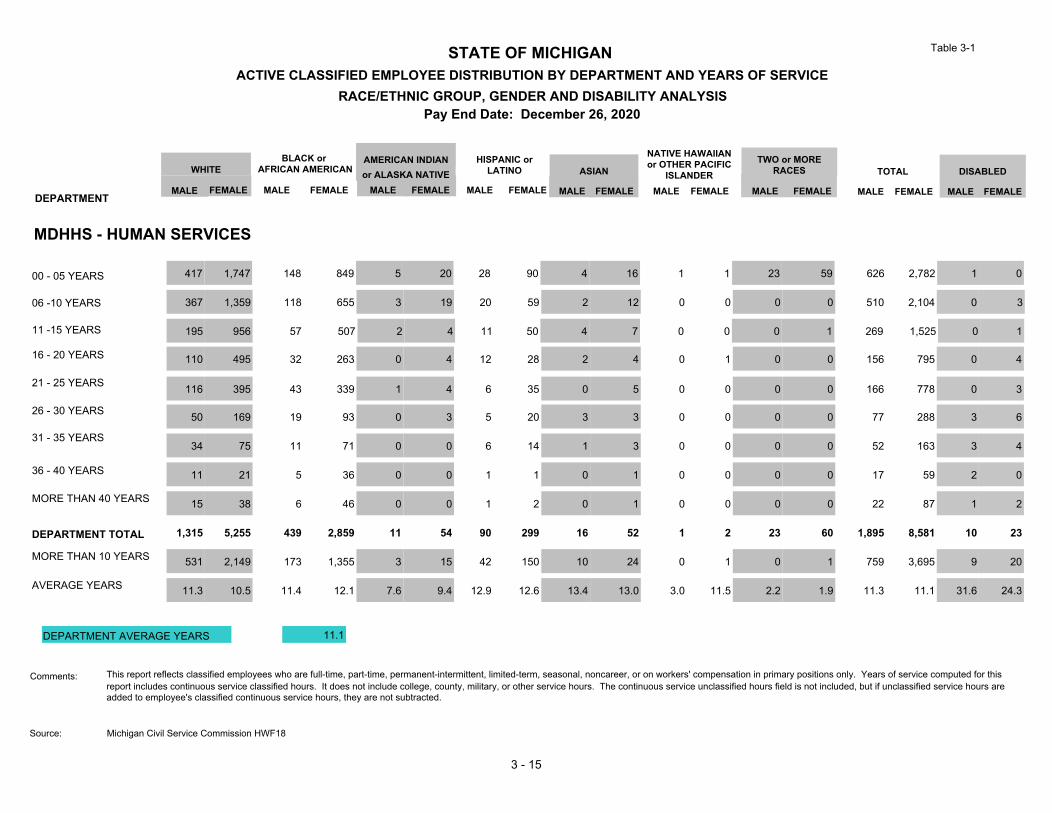
MDHHS - COMMUNITY HEALTH
10.4 # # ##
824 1,598 337 654 5 13 31 68 41 60 1 0 10 19 1,249 2,412 4 13
10.9 10.8 10.1 9.3 12.4 15.5 12.2 9.2 9.2 10.7 4.0 0.0 1.0 1.3 10.6 10.3 31.0 31.4
334 634 111 211 2 7 13 21 13 22 0 0 0 0 473 895 4 12
10 25 6 3 0 1 1 0 1 0 0 0 0 0 18 29 1 3
6 12 2 3 0 0 1 1 1 0 0 0 0 0 10 16 0 2
20 49 16 20 0 1 1 3 1 1 0 0 0 0 38 74 0 2
78 131 18 46 1 3 2 2 3 6 0 0 0 0 102 188 1 0
89 170 26 66 0 0 4 8 3 7 0 0 0 0 122 251 0 1
99 199 31 51 0 2 3 7 4 5 0 0 0 0 137 264 0 0
320 649 155 326 2 3 12 32 22 19 1 0 10 19 522 1,048 0 000 - 05 YEARS
06 -10 YEARS
16 - 20 YEARS
21 - 25 YEARS
26 - 30 YEARS
31 - 35 YEARS
36 - 40 YEARS
MORE THAN 40 YEARS
DEPARTMENT TOTAL
MORE THAN 10 YEARS
AVERAGE YEARS
DEPARTMENT AVERAGE YEARS
11 -15 YEARS
32 48 12 22 1 0 1 0 0 3 0 0 0 0 46 73 2 4
170 315 71 117 1 3 6 15 6 19 0 0 0 0 254 469 0 1
TWO or MORERACES
MALE FEMALE
Comments: This report reflects classified employees who are full-time, part-time, permanent-intermittent, limited-term, seasonal, noncareer, or on workers' compensation in primary positions only. Years of service computed for this report includes continuous service classified hours. It does not include college, county, military, or other service hours. The continuous service unclassified hours field is not included, but if unclassified service hours are added to employee's classified continuous service hours, they are not subtracted.
Source:
3 - 14
Michigan Civil Service Commission HWF18
STATE OF MICHIGANACTIVE CLASSIFIED EMPLOYEE DISTRIBUTION BY DEPARTMENT AND YEARS OF SERVICE
RACE/ETHNIC GROUP, GENDER AND DISABILITY ANALYSISPay End Date: December 26, 2020
DEPARTMENTMALE FEMALE
WHITE
MALE MALEFEMALE
BLACK or AFRICAN AMERICAN
FEMALEor ALASKA NATIVEAMERICAN INDIAN HISPANIC or
LATINO
MALE FEMALE
ASIAN
MALE FEMALE
NATIVE HAWAIIANor OTHER PACIFIC
ISLANDERMALE FEMALE
TOTAL
MALE FEMALE
DISABLED
MALE FEMALE
Table 3-1
MDHHS - HUMAN SERVICES
11.1 # # ##
1,315 5,255 439 2,859 11 54 90 299 16 52 1 2 23 60 1,895 8,581 10 23
11.3 10.5 11.4 12.1 7.6 9.4 12.9 12.6 13.4 13.0 3.0 11.5 2.2 1.9 11.3 11.1 31.6 24.3
531 2,149 173 1,355 3 15 42 150 10 24 0 1 0 1 759 3,695 9 20
15 38 6 46 0 0 1 2 0 1 0 0 0 0 22 87 1 2
11 21 5 36 0 0 1 1 0 1 0 0 0 0 17 59 2 0
34 75 11 71 0 0 6 14 1 3 0 0 0 0 52 163 3 4
116 395 43 339 1 4 6 35 0 5 0 0 0 0 166 778 0 3
110 495 32 263 0 4 12 28 2 4 0 1 0 0 156 795 0 4
195 956 57 507 2 4 11 50 4 7 0 0 0 1 269 1,525 0 1
417 1,747 148 849 5 20 28 90 4 16 1 1 23 59 626 2,782 1 000 - 05 YEARS
06 -10 YEARS
16 - 20 YEARS
21 - 25 YEARS
26 - 30 YEARS
31 - 35 YEARS
36 - 40 YEARS
MORE THAN 40 YEARS
DEPARTMENT TOTAL
MORE THAN 10 YEARS
AVERAGE YEARS
DEPARTMENT AVERAGE YEARS
11 -15 YEARS
50 169 19 93 0 3 5 20 3 3 0 0 0 0 77 288 3 6
367 1,359 118 655 3 19 20 59 2 12 0 0 0 0 510 2,104 0 3
TWO or MORERACES
MALE FEMALE
Comments: This report reflects classified employees who are full-time, part-time, permanent-intermittent, limited-term, seasonal, noncareer, or on workers' compensation in primary positions only. Years of service computed for this report includes continuous service classified hours. It does not include college, county, military, or other service hours. The continuous service unclassified hours field is not included, but if unclassified service hours are added to employee's classified continuous service hours, they are not subtracted.
Source:
3 - 15
Michigan Civil Service Commission HWF18
STATE OF MICHIGANACTIVE CLASSIFIED EMPLOYEE DISTRIBUTION BY DEPARTMENT AND YEARS OF SERVICE
RACE/ETHNIC GROUP, GENDER AND DISABILITY ANALYSISPay End Date: December 26, 2020
DEPARTMENTMALE FEMALE
WHITE
MALE MALEFEMALE
BLACK or AFRICAN AMERICAN
FEMALEor ALASKA NATIVEAMERICAN INDIAN HISPANIC or
LATINO
MALE FEMALE
ASIAN
MALE FEMALE
NATIVE HAWAIIANor OTHER PACIFIC
ISLANDERMALE FEMALE
TOTAL
MALE FEMALE
DISABLED
MALE FEMALE
Table 3-1
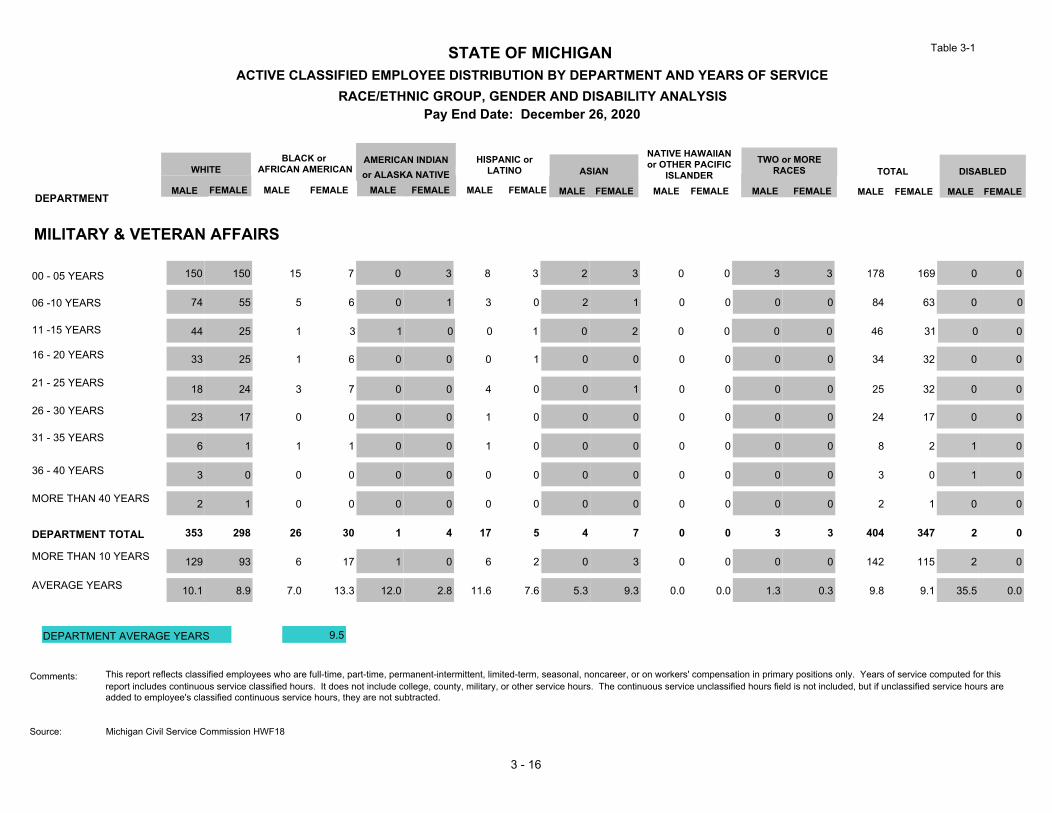
MILITARY & VETERAN AFFAIRS
9.5 # # ##
353 298 26 30 1 4 17 5 4 7 0 0 3 3 404 347 2 0
10.1 8.9 7.0 13.3 12.0 2.8 11.6 7.6 5.3 9.3 0.0 0.0 1.3 0.3 9.8 9.1 35.5 0.0
129 93 6 17 1 0 6 2 0 3 0 0 0 0 142 115 2 0
2 1 0 0 0 0 0 0 0 0 0 0 0 0 2 1 0 0
3 0 0 0 0 0 0 0 0 0 0 0 0 0 3 0 1 0
6 1 1 1 0 0 1 0 0 0 0 0 0 0 8 2 1 0
18 24 3 7 0 0 4 0 0 1 0 0 0 0 25 32 0 0
33 25 1 6 0 0 0 1 0 0 0 0 0 0 34 32 0 0
44 25 1 3 1 0 0 1 0 2 0 0 0 0 46 31 0 0
150 150 15 7 0 3 8 3 2 3 0 0 3 3 178 169 0 000 - 05 YEARS
06 -10 YEARS
16 - 20 YEARS
21 - 25 YEARS
26 - 30 YEARS
31 - 35 YEARS
36 - 40 YEARS
MORE THAN 40 YEARS
DEPARTMENT TOTAL
MORE THAN 10 YEARS
AVERAGE YEARS
DEPARTMENT AVERAGE YEARS
11 -15 YEARS
23 17 0 0 0 0 1 0 0 0 0 0 0 0 24 17 0 0
74 55 5 6 0 1 3 0 2 1 0 0 0 0 84 63 0 0
TWO or MORERACES
MALE FEMALE
Comments: This report reflects classified employees who are full-time, part-time, permanent-intermittent, limited-term, seasonal, noncareer, or on workers' compensation in primary positions only. Years of service computed for this report includes continuous service classified hours. It does not include college, county, military, or other service hours. The continuous service unclassified hours field is not included, but if unclassified service hours are added to employee's classified continuous service hours, they are not subtracted.
Source:
3 - 16
Michigan Civil Service Commission HWF18
STATE OF MICHIGANACTIVE CLASSIFIED EMPLOYEE DISTRIBUTION BY DEPARTMENT AND YEARS OF SERVICE
RACE/ETHNIC GROUP, GENDER AND DISABILITY ANALYSISPay End Date: December 26, 2020
DEPARTMENTMALE FEMALE
WHITE
MALE MALEFEMALE
BLACK or AFRICAN AMERICAN
FEMALEor ALASKA NATIVEAMERICAN INDIAN HISPANIC or
LATINO
MALE FEMALE
ASIAN
MALE FEMALE
NATIVE HAWAIIANor OTHER PACIFIC
ISLANDERMALE FEMALE
TOTAL
MALE FEMALE
DISABLED
MALE FEMALE
Table 3-1
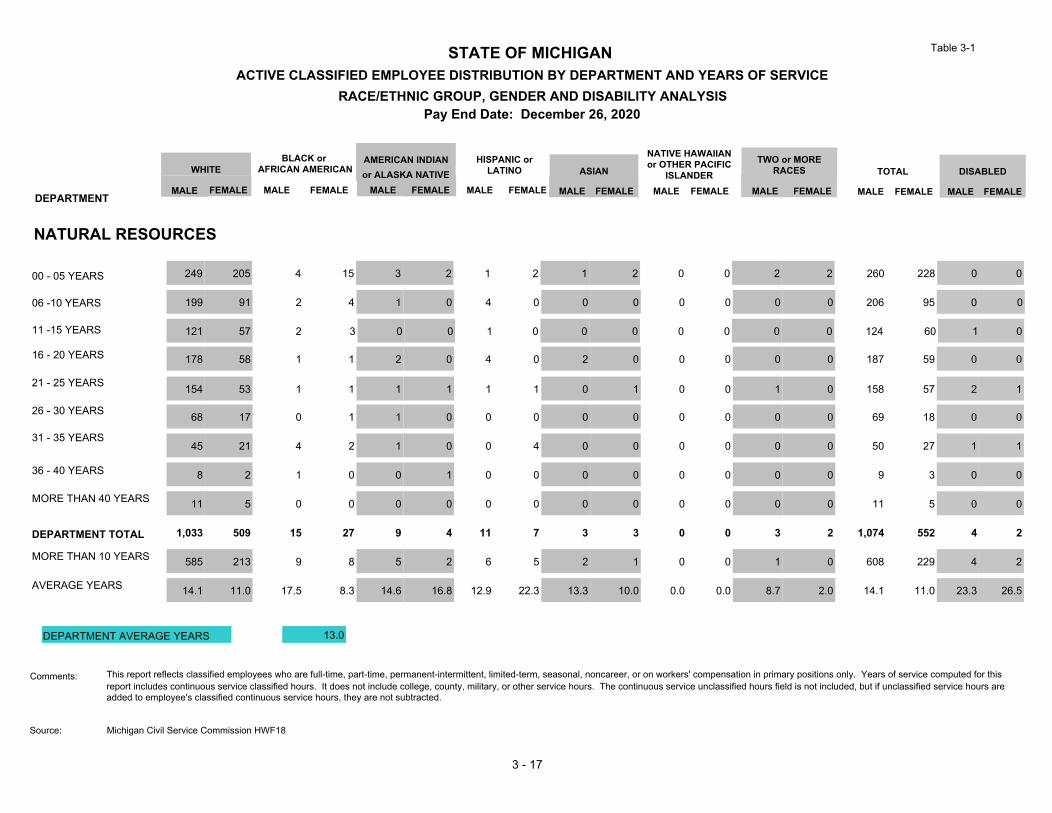
NATURAL RESOURCES
13.0 # # ##
1,033 509 15 27 9 4 11 7 3 3 0 0 3 2 1,074 552 4 2
14.1 11.0 17.5 8.3 14.6 16.8 12.9 22.3 13.3 10.0 0.0 0.0 8.7 2.0 14.1 11.0 23.3 26.5
585 213 9 8 5 2 6 5 2 1 0 0 1 0 608 229 4 2
11 5 0 0 0 0 0 0 0 0 0 0 0 0 11 5 0 0
8 2 1 0 0 1 0 0 0 0 0 0 0 0 9 3 0 0
45 21 4 2 1 0 0 4 0 0 0 0 0 0 50 27 1 1
154 53 1 1 1 1 1 1 0 1 0 0 1 0 158 57 2 1
178 58 1 1 2 0 4 0 2 0 0 0 0 0 187 59 0 0
121 57 2 3 0 0 1 0 0 0 0 0 0 0 124 60 1 0
249 205 4 15 3 2 1 2 1 2 0 0 2 2 260 228 0 000 - 05 YEARS
06 -10 YEARS
16 - 20 YEARS
21 - 25 YEARS
26 - 30 YEARS
31 - 35 YEARS
36 - 40 YEARS
MORE THAN 40 YEARS
DEPARTMENT TOTAL
MORE THAN 10 YEARS
AVERAGE YEARS
DEPARTMENT AVERAGE YEARS
11 -15 YEARS
68 17 0 1 1 0 0 0 0 0 0 0 0 0 69 18 0 0
199 91 2 4 1 0 4 0 0 0 0 0 0 0 206 95 0 0
TWO or MORERACES
MALE FEMALE
Comments: This report reflects classified employees who are full-time, part-time, permanent-intermittent, limited-term, seasonal, noncareer, or on workers' compensation in primary positions only. Years of service computed for this report includes continuous service classified hours. It does not include college, county, military, or other service hours. The continuous service unclassified hours field is not included, but if unclassified service hours are added to employee's classified continuous service hours, they are not subtracted.
Source:
3 - 17
Michigan Civil Service Commission HWF18
STATE OF MICHIGANACTIVE CLASSIFIED EMPLOYEE DISTRIBUTION BY DEPARTMENT AND YEARS OF SERVICE
RACE/ETHNIC GROUP, GENDER AND DISABILITY ANALYSISPay End Date: December 26, 2020
DEPARTMENTMALE FEMALE
WHITE
MALE MALEFEMALE
BLACK or AFRICAN AMERICAN
FEMALEor ALASKA NATIVEAMERICAN INDIAN HISPANIC or
LATINO
MALE FEMALE
ASIAN
MALE FEMALE
NATIVE HAWAIIANor OTHER PACIFIC
ISLANDERMALE FEMALE
TOTAL
MALE FEMALE
DISABLED
MALE FEMALE
Table 3-1
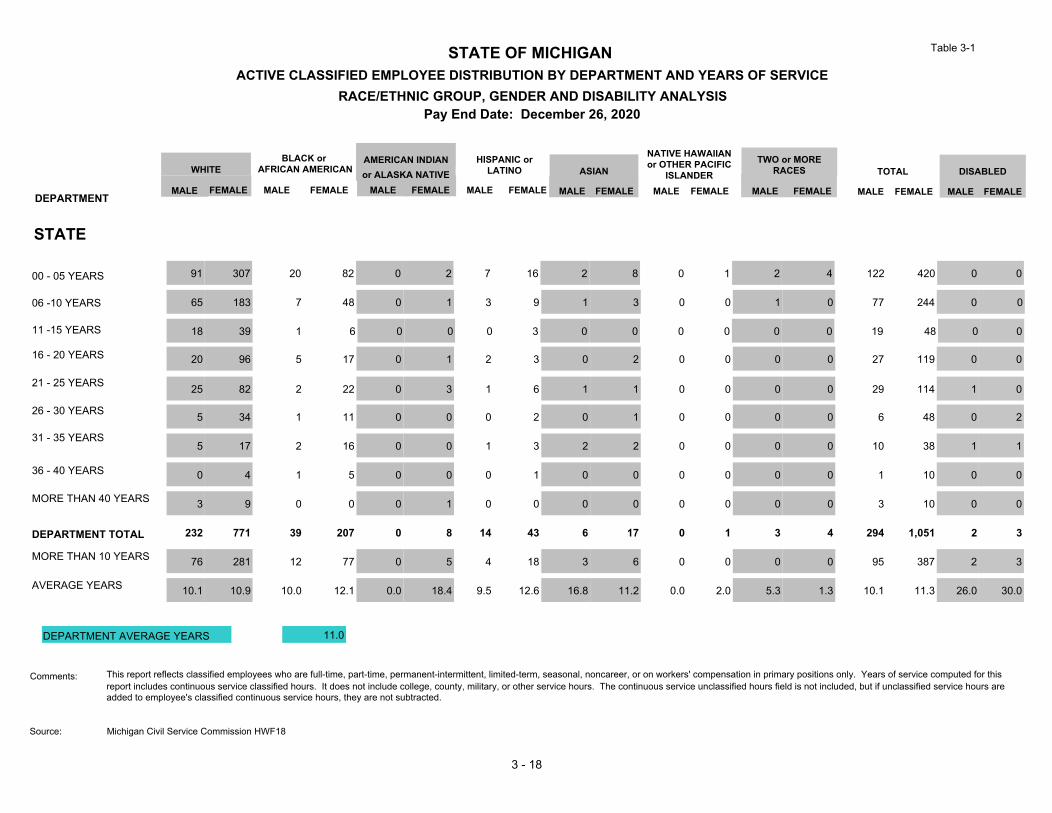
STATE
11.0 # # ##
232 771 39 207 0 8 14 43 6 17 0 1 3 4 294 1,051 2 3
10.1 10.9 10.0 12.1 0.0 18.4 9.5 12.6 16.8 11.2 0.0 2.0 5.3 1.3 10.1 11.3 26.0 30.0
76 281 12 77 0 5 4 18 3 6 0 0 0 0 95 387 2 3
3 9 0 0 0 1 0 0 0 0 0 0 0 0 3 10 0 0
0 4 1 5 0 0 0 1 0 0 0 0 0 0 1 10 0 0
5 17 2 16 0 0 1 3 2 2 0 0 0 0 10 38 1 1
25 82 2 22 0 3 1 6 1 1 0 0 0 0 29 114 1 0
20 96 5 17 0 1 2 3 0 2 0 0 0 0 27 119 0 0
18 39 1 6 0 0 0 3 0 0 0 0 0 0 19 48 0 0
91 307 20 82 0 2 7 16 2 8 0 1 2 4 122 420 0 000 - 05 YEARS
06 -10 YEARS
16 - 20 YEARS
21 - 25 YEARS
26 - 30 YEARS
31 - 35 YEARS
36 - 40 YEARS
MORE THAN 40 YEARS
DEPARTMENT TOTAL
MORE THAN 10 YEARS
AVERAGE YEARS
DEPARTMENT AVERAGE YEARS
11 -15 YEARS
5 34 1 11 0 0 0 2 0 1 0 0 0 0 6 48 0 2
65 183 7 48 0 1 3 9 1 3 0 0 1 0 77 244 0 0
TWO or MORERACES
MALE FEMALE
Comments: This report reflects classified employees who are full-time, part-time, permanent-intermittent, limited-term, seasonal, noncareer, or on workers' compensation in primary positions only. Years of service computed for this report includes continuous service classified hours. It does not include college, county, military, or other service hours. The continuous service unclassified hours field is not included, but if unclassified service hours are added to employee's classified continuous service hours, they are not subtracted.
Source:
3 - 18
Michigan Civil Service Commission HWF18

STATE OF MICHIGANACTIVE CLASSIFIED EMPLOYEE DISTRIBUTION BY DEPARTMENT AND YEARS OF SERVICE
RACE/ETHNIC GROUP, GENDER AND DISABILITY ANALYSISPay End Date: December 26, 2020
DEPARTMENTMALE FEMALE
WHITE
MALE MALEFEMALE
BLACK or AFRICAN AMERICAN
FEMALEor ALASKA NATIVEAMERICAN INDIAN HISPANIC or
LATINO
MALE FEMALE
ASIAN
MALE FEMALE
NATIVE HAWAIIANor OTHER PACIFIC
ISLANDERMALE FEMALE
TOTAL
MALE FEMALE
DISABLED
MALE FEMALE
Table 3-1
STATE POLICE
12.3 # # ##
1,966 720 116 44 24 2 46 24 16 5 0 0 10 2 2,178 797 2 3
12.9 10.9 12.7 12.3 14.1 10.0 13.0 10.6 13.4 6.4 0.0 0.0 1.9 1.5 12.8 10.9 32.0 28.3
906 289 48 21 12 1 21 8 8 1 0 0 0 0 995 320 2 3
1 3 0 0 0 0 0 0 0 0 0 0 0 0 1 3 0 0
4 3 0 1 0 0 0 1 0 0 0 0 0 0 4 5 1 0
55 22 5 4 0 0 2 1 1 0 0 0 0 0 63 27 0 2
363 77 16 8 4 0 8 1 5 0 0 0 0 0 396 86 0 0
226 74 4 3 3 0 3 4 0 0 0 0 0 0 236 81 0 1
92 80 3 5 0 1 4 1 2 1 0 0 0 0 101 88 0 0
600 276 49 21 8 0 13 10 6 3 0 0 10 2 686 312 0 000 - 05 YEARS
06 -10 YEARS
16 - 20 YEARS
21 - 25 YEARS
26 - 30 YEARS
31 - 35 YEARS
36 - 40 YEARS
MORE THAN 40 YEARS
DEPARTMENT TOTAL
MORE THAN 10 YEARS
AVERAGE YEARS
DEPARTMENT AVERAGE YEARS
11 -15 YEARS
165 30 20 0 5 0 4 0 0 0 0 0 0 0 194 30 1 0
460 155 19 2 4 1 12 6 2 1 0 0 0 0 497 165 0 0
TWO or MORERACES
MALE FEMALE
Comments: This report reflects classified employees who are full-time, part-time, permanent-intermittent, limited-term, seasonal, noncareer, or on workers' compensation in primary positions only. Years of service computed for this report includes continuous service classified hours. It does not include college, county, military, or other service hours. The continuous service unclassified hours field is not included, but if unclassified service hours are added to employee's classified continuous service hours, they are not subtracted.
Source:
3 - 19
Michigan Civil Service Commission HWF18
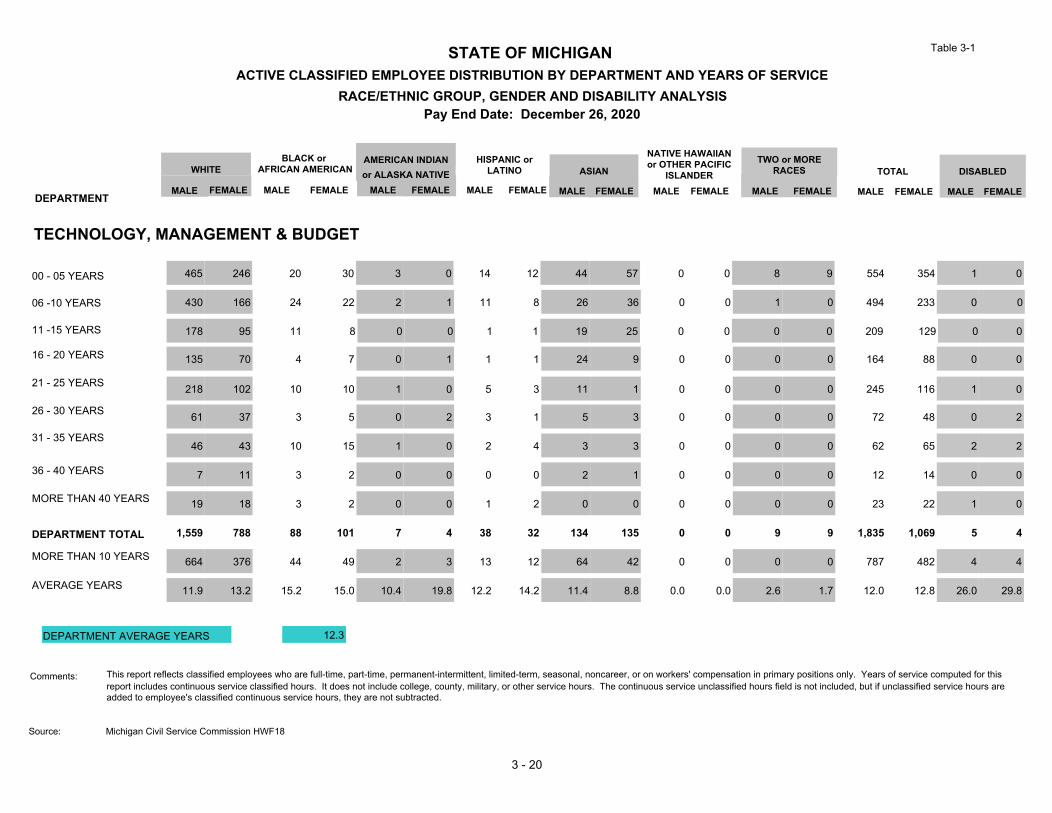
STATE OF MICHIGANACTIVE CLASSIFIED EMPLOYEE DISTRIBUTION BY DEPARTMENT AND YEARS OF SERVICE
RACE/ETHNIC GROUP, GENDER AND DISABILITY ANALYSISPay End Date: December 26, 2020
DEPARTMENTMALE FEMALE
WHITE
MALE MALEFEMALE
BLACK or AFRICAN AMERICAN
FEMALEor ALASKA NATIVEAMERICAN INDIAN HISPANIC or
LATINO
MALE FEMALE
ASIAN
MALE FEMALE
NATIVE HAWAIIANor OTHER PACIFIC
ISLANDERMALE FEMALE
TOTAL
MALE FEMALE
DISABLED
MALE FEMALE
Table 3-1
TECHNOLOGY, MANAGEMENT & BUDGET
12.3 # # ##
1,559 788 88 101 7 4 38 32 134 135 0 0 9 9 1,835 1,069 5 4
11.9 13.2 15.2 15.0 10.4 19.8 12.2 14.2 11.4 8.8 0.0 0.0 2.6 1.7 12.0 12.8 26.0 29.8
664 376 44 49 2 3 13 12 64 42 0 0 0 0 787 482 4 4
19 18 3 2 0 0 1 2 0 0 0 0 0 0 23 22 1 0
7 11 3 2 0 0 0 0 2 1 0 0 0 0 12 14 0 0
46 43 10 15 1 0 2 4 3 3 0 0 0 0 62 65 2 2
218 102 10 10 1 0 5 3 11 1 0 0 0 0 245 116 1 0
135 70 4 7 0 1 1 1 24 9 0 0 0 0 164 88 0 0
178 95 11 8 0 0 1 1 19 25 0 0 0 0 209 129 0 0
465 246 20 30 3 0 14 12 44 57 0 0 8 9 554 354 1 000 - 05 YEARS
06 -10 YEARS
16 - 20 YEARS
21 - 25 YEARS
26 - 30 YEARS
31 - 35 YEARS
36 - 40 YEARS
MORE THAN 40 YEARS
DEPARTMENT TOTAL
MORE THAN 10 YEARS
AVERAGE YEARS
DEPARTMENT AVERAGE YEARS
11 -15 YEARS
61 37 3 5 0 2 3 1 5 3 0 0 0 0 72 48 0 2
430 166 24 22 2 1 11 8 26 36 0 0 1 0 494 233 0 0
TWO or MORERACES
MALE FEMALE
Comments: This report reflects classified employees who are full-time, part-time, permanent-intermittent, limited-term, seasonal, noncareer, or on workers' compensation in primary positions only. Years of service computed for this report includes continuous service classified hours. It does not include college, county, military, or other service hours. The continuous service unclassified hours field is not included, but if unclassified service hours are added to employee's classified continuous service hours, they are not subtracted.
Source:
3 - 20
Michigan Civil Service Commission HWF18

STATE OF MICHIGANACTIVE CLASSIFIED EMPLOYEE DISTRIBUTION BY DEPARTMENT AND YEARS OF SERVICE
RACE/ETHNIC GROUP, GENDER AND DISABILITY ANALYSISPay End Date: December 26, 2020
DEPARTMENTMALE FEMALE
WHITE
MALE MALEFEMALE
BLACK or AFRICAN AMERICAN
FEMALEor ALASKA NATIVEAMERICAN INDIAN HISPANIC or
LATINO
MALE FEMALE
ASIAN
MALE FEMALE
NATIVE HAWAIIANor OTHER PACIFIC
ISLANDERMALE FEMALE
TOTAL
MALE FEMALE
DISABLED
MALE FEMALE
Table 3-1
TRANSPORTATION
13.4 # # ##
1,750 679 83 70 37 14 39 17 37 32 0 0 6 2 1,952 814 8 10
13.3 13.1 17.8 17.6 11.1 12.9 15.6 9.1 14.1 12.6 0.0 0.0 0.7 1.5 13.4 13.4 29.9 33.0
945 354 52 45 15 6 22 4 21 16 0 0 0 0 1,055 425 8 10
12 11 5 3 0 0 1 0 1 0 0 0 0 0 19 14 0 2
19 5 4 3 0 0 2 0 1 0 0 0 0 0 26 8 1 1
117 40 9 11 3 2 5 2 4 2 0 0 0 0 138 57 2 4
201 75 13 5 4 3 4 1 4 7 0 0 0 0 226 91 0 0
300 109 8 6 5 1 3 1 7 7 0 0 0 0 323 124 1 1
187 74 6 11 2 0 4 0 3 0 0 0 0 0 202 85 0 0
588 235 21 17 17 7 14 9 16 14 0 0 6 2 662 284 0 000 - 05 YEARS
06 -10 YEARS
16 - 20 YEARS
21 - 25 YEARS
26 - 30 YEARS
31 - 35 YEARS
36 - 40 YEARS
MORE THAN 40 YEARS
DEPARTMENT TOTAL
MORE THAN 10 YEARS
AVERAGE YEARS
DEPARTMENT AVERAGE YEARS
11 -15 YEARS
109 40 7 6 1 0 3 0 1 0 0 0 0 0 121 46 4 2
217 90 10 8 5 1 3 4 0 2 0 0 0 0 235 105 0 0
TWO or MORERACES
MALE FEMALE
Comments: This report reflects classified employees who are full-time, part-time, permanent-intermittent, limited-term, seasonal, noncareer, or on workers' compensation in primary positions only. Years of service computed for this report includes continuous service classified hours. It does not include college, county, military, or other service hours. The continuous service unclassified hours field is not included, but if unclassified service hours are added to employee's classified continuous service hours, they are not subtracted.
Source:
3 - 21
Michigan Civil Service Commission HWF18
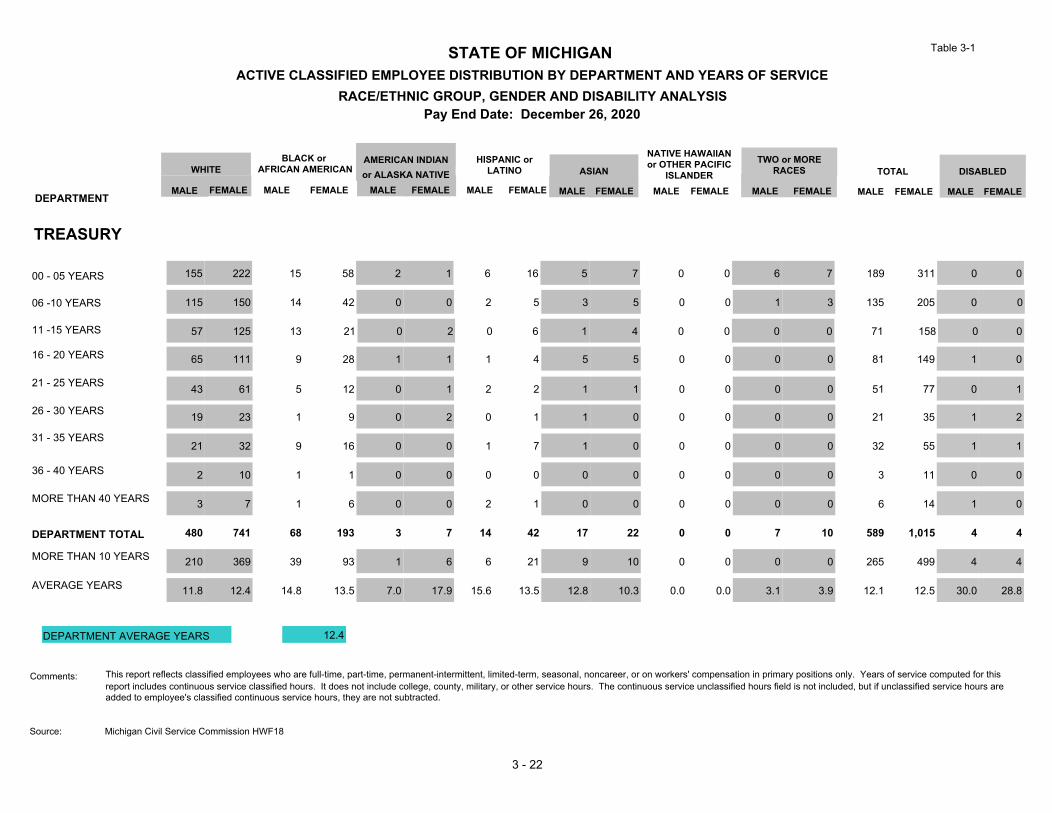
STATE OF MICHIGANACTIVE CLASSIFIED EMPLOYEE DISTRIBUTION BY DEPARTMENT AND YEARS OF SERVICE
RACE/ETHNIC GROUP, GENDER AND DISABILITY ANALYSISPay End Date: December 26, 2020
DEPARTMENTMALE FEMALE
WHITE
MALE MALEFEMALE
BLACK or AFRICAN AMERICAN
FEMALEor ALASKA NATIVEAMERICAN INDIAN HISPANIC or
LATINO
MALE FEMALE
ASIAN
MALE FEMALE
NATIVE HAWAIIANor OTHER PACIFIC
ISLANDERMALE FEMALE
TOTAL
MALE FEMALE
DISABLED
MALE FEMALE
Table 3-1
TREASURY
12.4 # # ##
480 741 68 193 3 7 14 42 17 22 0 0 7 10 589 1,015 4 4
11.8 12.4 14.8 13.5 7.0 17.9 15.6 13.5 12.8 10.3 0.0 0.0 3.1 3.9 12.1 12.5 30.0 28.8
210 369 39 93 1 6 6 21 9 10 0 0 0 0 265 499 4 4
3 7 1 6 0 0 2 1 0 0 0 0 0 0 6 14 1 0
2 10 1 1 0 0 0 0 0 0 0 0 0 0 3 11 0 0
21 32 9 16 0 0 1 7 1 0 0 0 0 0 32 55 1 1
43 61 5 12 0 1 2 2 1 1 0 0 0 0 51 77 0 1
65 111 9 28 1 1 1 4 5 5 0 0 0 0 81 149 1 0
57 125 13 21 0 2 0 6 1 4 0 0 0 0 71 158 0 0
155 222 15 58 2 1 6 16 5 7 0 0 6 7 189 311 0 000 - 05 YEARS
06 -10 YEARS
16 - 20 YEARS
21 - 25 YEARS
26 - 30 YEARS
31 - 35 YEARS
36 - 40 YEARS
MORE THAN 40 YEARS
DEPARTMENT TOTAL
MORE THAN 10 YEARS
AVERAGE YEARS
DEPARTMENT AVERAGE YEARS
11 -15 YEARS
19 23 1 9 0 2 0 1 1 0 0 0 0 0 21 35 1 2
115 150 14 42 0 0 2 5 3 5 0 0 1 3 135 205 0 0
TWO or MORERACES
MALE FEMALE
Comments: This report reflects classified employees who are full-time, part-time, permanent-intermittent, limited-term, seasonal, noncareer, or on workers' compensation in primary positions only. Years of service computed for this report includes continuous service classified hours. It does not include college, county, military, or other service hours. The continuous service unclassified hours field is not included, but if unclassified service hours are added to employee's classified continuous service hours, they are not subtracted.
Source:
3 - 22
Michigan Civil Service Commission HWF18
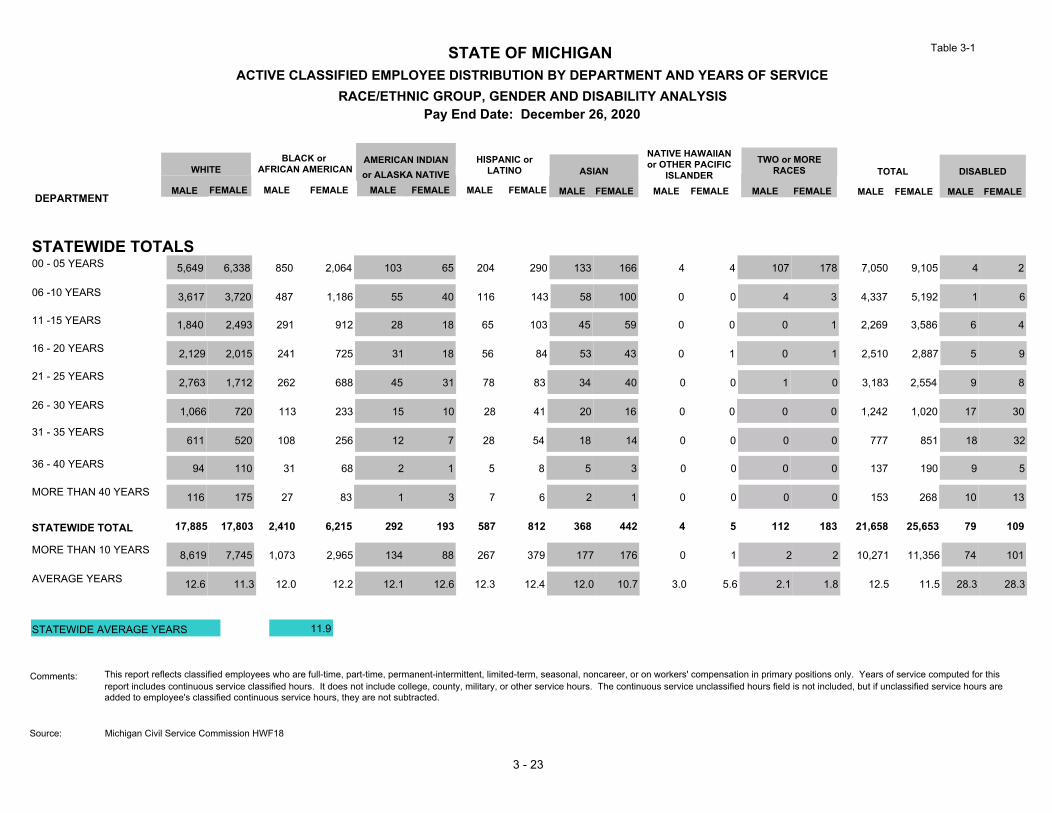
STATE OF MICHIGANACTIVE CLASSIFIED EMPLOYEE DISTRIBUTION BY DEPARTMENT AND YEARS OF SERVICE
RACE/ETHNIC GROUP, GENDER AND DISABILITY ANALYSISPay End Date: December 26, 2020
DEPARTMENTMALE FEMALE
WHITE
MALE MALEFEMALE
BLACK or AFRICAN AMERICAN
FEMALEor ALASKA NATIVEAMERICAN INDIAN HISPANIC or
LATINO
MALE FEMALE
ASIAN
MALE FEMALE
NATIVE HAWAIIANor OTHER PACIFIC
ISLANDERMALE FEMALE
TOTAL
MALE FEMALE
DISABLED
MALE FEMALE
Table 3-1
5,649 6,338 850 2,064 103 65 204 290 133 166 4 4 107 178 7,050 9,105 4 200 - 05 YEARS
3,617 3,720 487 1,186 55 40 116 143 58 100 0 0 4 3 4,337 5,192 1 6
1,840 2,493 291 912 28 18 65 103 45 59 0 0 0 1 2,269 3,586 6 4
2,129 2,015 241 725 31 18 56 84 53 43 0 1 0 1 2,510 2,887 5 9
2,763 1,712 262 688 45 31 78 83 34 40 0 0 1 0 3,183 2,554 9 8
1,066 720 113 233 15 10 28 41 20 16 0 0 0 0 1,242 1,020 17 30
611 520 108 256 12 7 28 54 18 14 0 0 0 0 777 851 18 32
94 110 31 68 2 1 5 8 5 3 0 0 0 0 137 190 9 5
17,885 17,803 2,410 6,215 292 193 587 812 368 442 4 5 112 183 21,658 25,653 79 109
8,619 7,745 1,073 2,965 134 88 267 379 177 176 0 1 2 2 10,271 11,356 74 101
12.6 11.3 12.0 12.2 12.1 12.6 12.3 12.4 12.0 10.7 3.0 5.6 2.1 1.8 12.5 11.5 28.3 28.3
06 -10 YEARS
11 -15 YEARS
16 - 20 YEARS
21 - 25 YEARS
26 - 30 YEARS
31 - 35 YEARS
36 - 40 YEARS
MORE THAN 40 YEARS
STATEWIDE TOTAL
MORE THAN 10 YEARS
AVERAGE YEARS
STATEWIDE TOTALS
116 175 27 83 1 3 7 6 2 1 0 0 0 0 153 268 10 13
STATEWIDE AVERAGE YEARS 11.9 # # ##
TWO or MORERACES
MALE FEMALE
Comments: This report reflects classified employees who are full-time, part-time, permanent-intermittent, limited-term, seasonal, noncareer, or on workers' compensation in primary positions only. Years of service computed for this report includes continuous service classified hours. It does not include college, county, military, or other service hours. The continuous service unclassified hours field is not included, but if unclassified service hours are added to employee's classified continuous service hours, they are not subtracted.
Source:
3 - 23
Michigan Civil Service Commission HWF18

SEPARATION REASON TOTAL SEPARATIONS
Death 17 1.4%Dismissal 80 6.5%Expired Appointment 48 3.9%Total Involuntary Separations 145 11.8%
Resigned Classified Employment 581 47.4%Layoff/Leave of Absence Rights Expired 70 5.7%Waived Rights Leave of Absence 55 4.5%Settlement 0 0.0%Total Voluntary Separations 706 57.6%
Retirement 359 29.2%Disability Retirement 9 0.7%Deferred Retirement 9 0.7%Total Retirements 377 30.6%
Undefined Separations 0 0.0%
TOTAL SEPARATIONS 1,228 100.0%
Comment: This report reflects classified employees who are full-time, part-time, permanent-intermittent, limited-term, seasonal, and noncareer in primary positions only, except for the following noncareer appointments: STUDENT ASSISTANT-E, TRANSPORTATION AIDE-E, and STATE WORKER. These positions represent approximately 83.2 percent of all noncareer appointments at this time.
Source:
RETIREMENT
UNDEFINED SEPARATIONS
Table 3-2
STATE OF MICHIGANSTATEWIDE SEPARATIONS BY REASON
First Quarter of FY 2021PERCENT OF
INVOLUNTARY SEPARATIONS
VOLUNTARY SEPARATIONS
3 - 24
Michigan Civil Service Commission HWF10
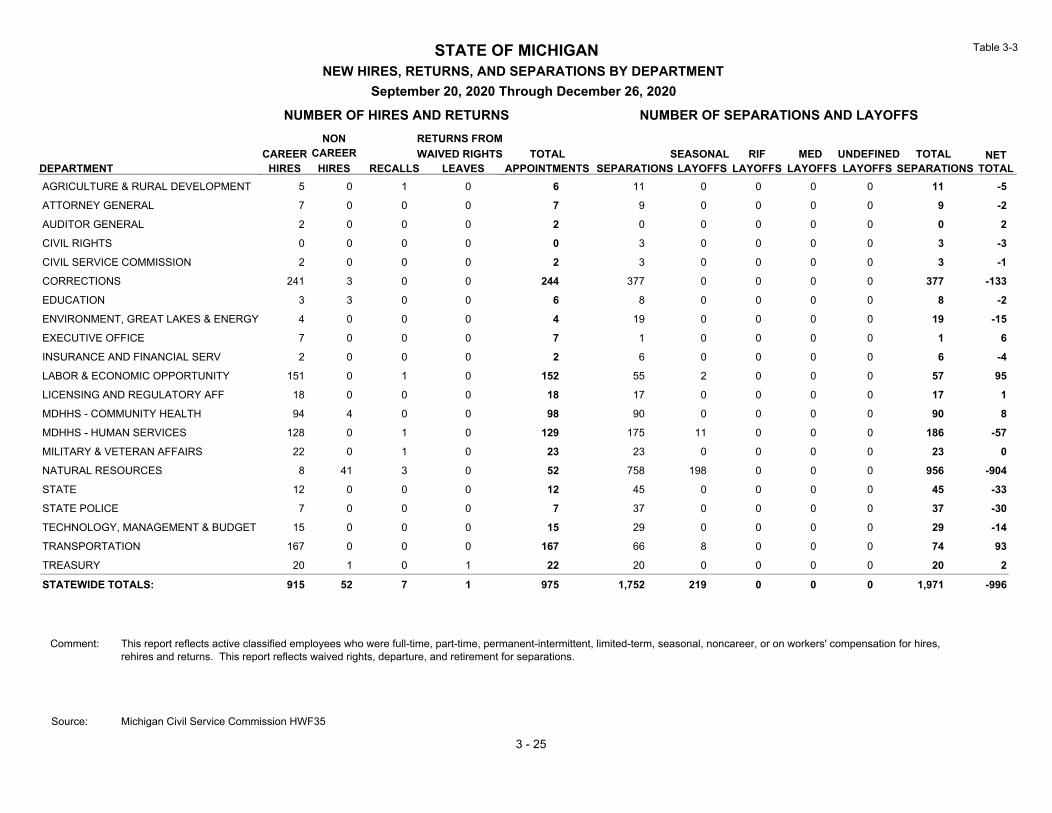
STATE OF MICHIGANNEW HIRES, RETURNS, AND SEPARATIONS BY DEPARTMENT
CAREERHIRES
NONCAREER
HIRES RECALLS LEAVESWAIVED RIGHTSRETURNS FROM
APPOINTMENTSTOTAL
SEPARATIONS LAYOFFSSEASONAL
LAYOFFSRIF
LAYOFFSMED
LAYOFFSUNDEFINED
SEPARATIONS TOTALNET
AGRICULTURE & RURAL DEVELOPMENT 5 0 1 0 6 11 0 0 0 0 11 -5ATTORNEY GENERAL 7 0 0 0 7 9 0 0 0 0 9 -2AUDITOR GENERAL 2 0 0 0 2 0 0 0 0 0 0 2CIVIL RIGHTS 0 0 0 0 0 3 0 0 0 0 3 -3CIVIL SERVICE COMMISSION 2 0 0 0 2 3 0 0 0 0 3 -1CORRECTIONS 241 3 0 0 244 377 0 0 0 0 377 -133EDUCATION 3 3 0 0 6 8 0 0 0 0 8 -2ENVIRONMENT, GREAT LAKES & ENERGY 4 0 0 0 4 19 0 0 0 0 19 -15EXECUTIVE OFFICE 7 0 0 0 7 1 0 0 0 0 1 6INSURANCE AND FINANCIAL SERV 2 0 0 0 2 6 0 0 0 0 6 -4LABOR & ECONOMIC OPPORTUNITY 151 0 1 0 152 55 2 0 0 0 57 95LICENSING AND REGULATORY AFF 18 0 0 0 18 17 0 0 0 0 17 1MDHHS - COMMUNITY HEALTH 94 4 0 0 98 90 0 0 0 0 90 8MDHHS - HUMAN SERVICES 128 0 1 0 129 175 11 0 0 0 186 -57MILITARY & VETERAN AFFAIRS 22 0 1 0 23 23 0 0 0 0 23 0NATURAL RESOURCES 8 41 3 0 52 758 198 0 0 0 956 -904STATE 12 0 0 0 12 45 0 0 0 0 45 -33STATE POLICE 7 0 0 0 7 37 0 0 0 0 37 -30TECHNOLOGY, MANAGEMENT & BUDGET 15 0 0 0 15 29 0 0 0 0 29 -14TRANSPORTATION 167 0 0 0 167 66 8 0 0 0 74 93TREASURY 20 1 0 1 22 20 0 0 0 0 20 2
STATEWIDE TOTALS: 915 52 7 1 975 1,752 219 0 0 0 1,971 -996
NUMBER OF HIRES AND RETURNS NUMBER OF SEPARATIONS AND LAYOFFS
DEPARTMENT
September 20, 2020 Through December 26, 2020
TOTAL
Table 3-3
Michigan Civil Service Commission HWF35
3 - 25
Source:
Comment: This report reflects active classified employees who were full-time, part-time, permanent-intermittent, limited-term, seasonal, noncareer, or on workers' compensation for hires,rehires and returns. This report reflects waived rights, departure, and retirement for separations.

SECTION FOUR
EQUAL EMPLOYMENT
OPPORTUNITY REPORT
Section Four provides information required by the federal Equal Employment Opportunity Commission, the Office of Federal Contract Compliance, and the state’s Equal Employment Opportunity Plan. The state maintains and reports data on the race/ethnic groups, gender, and disability status of its workforce.
BREAKDOWNS
Race/Ethnic Group. State employees are identified by their race/ethnic status in the following federally-defined groups:
1. White2. Black or African American3. American Indian or Alaska Native4. Hispanic or Latino5. Asian6. Native Hawaiian or Other Pacific Islander7. Two or More Races
Disabled. Employees have been permitted to identify themselves as “disabled.” There is no uniform or objective definition of “disabled.” Identification as “disabled” does not imply that the employee meets the definition of “disabled” in Civil Service Rule 1-9 or state and federal discrimination statutes.
Gender. Each race/ethnic group is further broken down by gender of male or female.
Job Categories. The workforce data is broken down into eight broad job categories reported in the state’s workforce analysis (EEO-4 Report). The job categories are the following:
1. Official/Administrator2. Professional3. Technician4. Protective Services5. Para-Professional6. Administrative Support7. Skilled Craft8. Service/Maintenance
SECTION FIVE
BARGAINING UNIT CHARACTERISTICS
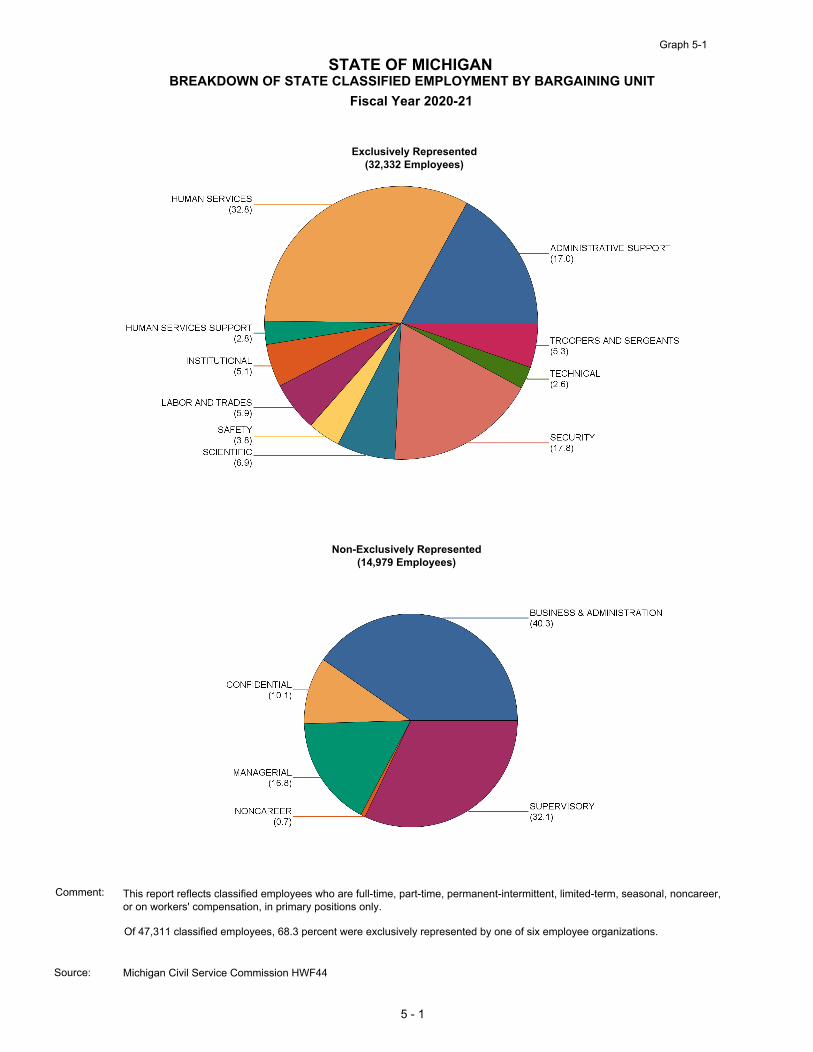
Graph 5-1
STATE OF MICHIGANBREAKDOWN OF STATE CLASSIFIED EMPLOYMENT BY BARGAINING UNIT
Fiscal Year 2020-21
Non-Exclusively Represented(14,979 Employees)
Exclusively Represented(32,332 Employees)
Comment:
Source:
This report reflects classified employees who are full-time, part-time, permanent-intermittent, limited-term, seasonal, noncareer, or on workers' compensation, in primary positions only.
Of 47,311 classified employees, 68.3 percent were exclusively represented by one of six employee organizations.
5 - 1
Michigan Civil Service Commission HWF44

A02
A31
C12
E42
H21
L32
T01
U11
W22
W41
Y23
Y51
Y52
Y98
Y99
EXCLUSIVELY REPRESENTED TOTAL
NON-EXCLUSIVELY REPRESENTED TOTAL
STATEWIDE TOTAL
STATE OF MICHIGANACTIVE EMPLOYEES PAYING UNION DUES BY BARGAINING UNIT
Pay End Date: December 26, 2020
AFSCME
COUNCIL 25
Table 5-1
14,979
2.41,1133.51,6401.15033.11,4741.257810.44,92324.111,3953.71,76547,311
15.24,92335.211,3955.51,76532,332 1,113
0.000.000.000.000.000.000.000.00
HSS, SEIU
LOCAL 517M
EMPLS
3.45.11,6401.65034.61,4741.8578
0
0
0
0
0
0
0
0
MCO, SEIU
LOCAL 526M
0
0
4,923
EMPLS
0.0
0.0
0.0
0.0
0.0
0.0
0.0
0.0
0.0
0.0
0.0
0.0
0.0
0.0
85.4
PCT
0
0
0
0
0
0
0
0
0
0
0
0
0.0
0.0
0.0
0.0
0.0
0.0
PCT
UAW LOCAL
6000
0
0
0
0
0
8,018
3,377
0
0
0
0
EMPLS
0.0
0.0
0.0
0.0
0.0
75.7
61.4
0.0
0.0
0.0
0.0
0.0
0.0
0.0
0.0
0.0
0.0
0.0
0.0
0.0
0
0
0
0
0.0
0
0
0
0
0
0
0
0
EMPLS
683
1,082
0
MSEA
894
2,230
842
1,713
1,641
10,598
5,501
6,042
4,804
103
2,512
1,518
0
0
0
0
BUSINESS & ADMINISTRATION
SUPERVISORY
NONCAREER
MANAGERIAL
CONFIDENTIAL
SAFETY
LABOR AND TRADES
SECURITY
TOTAL EMPLOYEES
1,244
1,901
5,768
PCTBARGAINING UNIT CODE/NAME
HUMAN SERVICES SUPPORT
SCIENTIFIC
TECHNICAL
TROOPERS AND SERGEANTS
INSTITUTIONAL
HUMAN SERVICES
ADMINISTRATIVE SUPPORT
PCT
54.9
56.9
0.0
578
0
0
0
0
0
0
0
0
0
EMPLS
0.0
0.0
0.0
0.0
67.8
0.0
0.0
0.0
0.0
0.0
0.0
0.0
0.0
0.0
0.0
0
0
0
0
1,113
0
0
0
0
0
0
0
0
0
0
MSPTA
EMPLS
0.0
0.0
0.0
95.7
0.0
0.0
0.0
0.0
0.0
0.0
0.0
0.0
0.0
0.0
0.0
PCT
0
0
0
1,640
0
0
0
0
0
0
0
0
0
0
0
TECH, SEIU
LOCAL 517M
EMPLS
0.0
0.0
59.7
0.0
0.0
0.0
0.0
0.0
0.0
0.0
0.0
0.0
0.0
0.0
0.0
PCT
0
0
503
0
0
0
0
0
0
0
0
0
0
0
0
S & E, SEIU
LOCAL 517M
EMPLS
0.0
66.1
0.0
0.0
0.0
0.0
0.0
0.0
0.0
0.0
0.0
0.0
0.0
0.0
0.0
PCT
0
1,474
0
0
0
0
0
0
0
0
0
0
64.7
0.0
0.0
0.0
0.0
0.0
0.0
0.0
0.0
0.0
0.0
0.0
0.0
0.0
0.0
PCT
Comment: This report reflects classified employees who are full-time, part-time, permanent-intermittent, limited-term, seasonal, noncareer, or on workers' compensation in primary positions only. The number and percentage under each union represents those paying member dues.
Source: Michigan Civil Service Commission HWF44
5 - 2
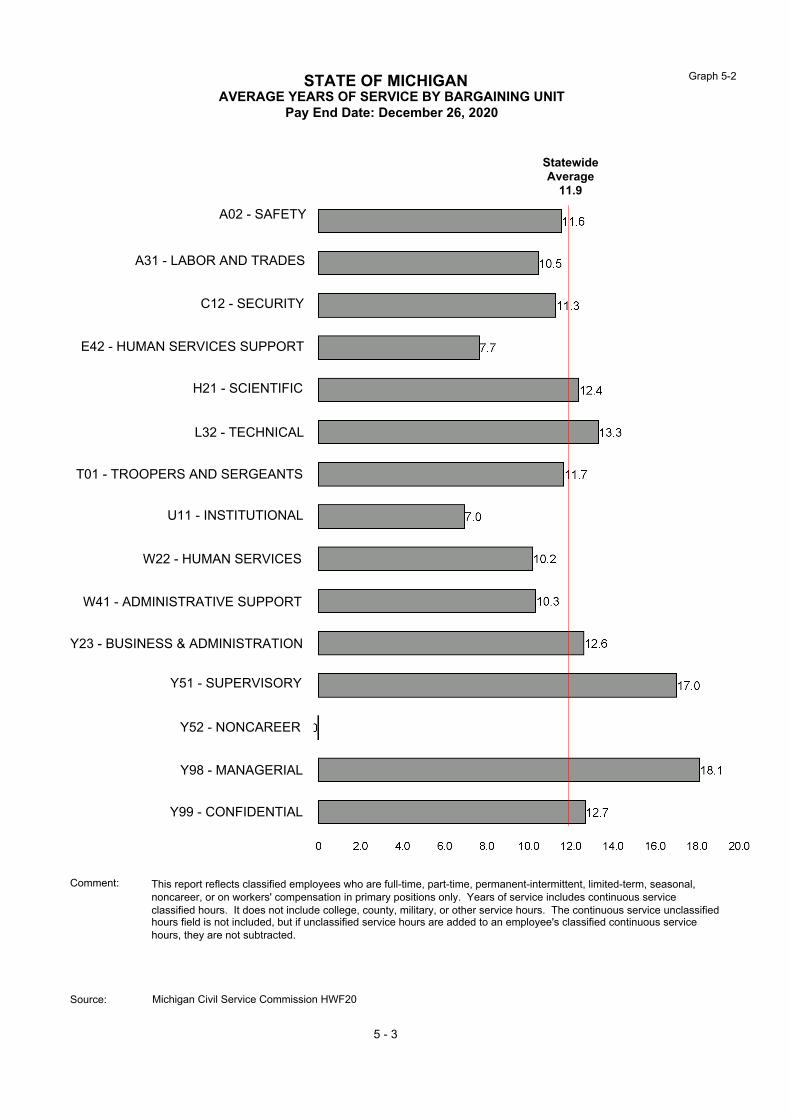
STATE OF MICHIGANAVERAGE YEARS OF SERVICE BY BARGAINING UNIT
Pay End Date: December 26, 2020
StatewideAverage
11.9
Comment: This report reflects classified employees who are full-time, part-time, permanent-intermittent, limited-term, seasonal, noncareer, or on workers' compensation in primary positions only. Years of service includes continuous service classified hours. It does not include college, county, military, or other service hours. The continuous service unclassified hours field is not included, but if unclassified service hours are added to an employee's classified continuous service hours, they are not subtracted.
Michigan Civil Service Commission HWF20
5 - 3
Source:
A02 - SAFETY
A31 - LABOR AND TRADES
L32 - TECHNICAL
T01 - TROOPERS AND SERGEANTS
U11 - INSTITUTIONAL
W22 - HUMAN SERVICES
W41 - ADMINISTRATIVE SUPPORT
Y23 - BUSINESS & ADMINISTRATION
Y51 - SUPERVISORY
Y52 - NONCAREER
Y98 - MANAGERIAL
Y99 - CONFIDENTIAL
C12 - SECURITY
E42 - HUMAN SERVICES SUPPORT
H21 - SCIENTIFIC
Graph 5-2
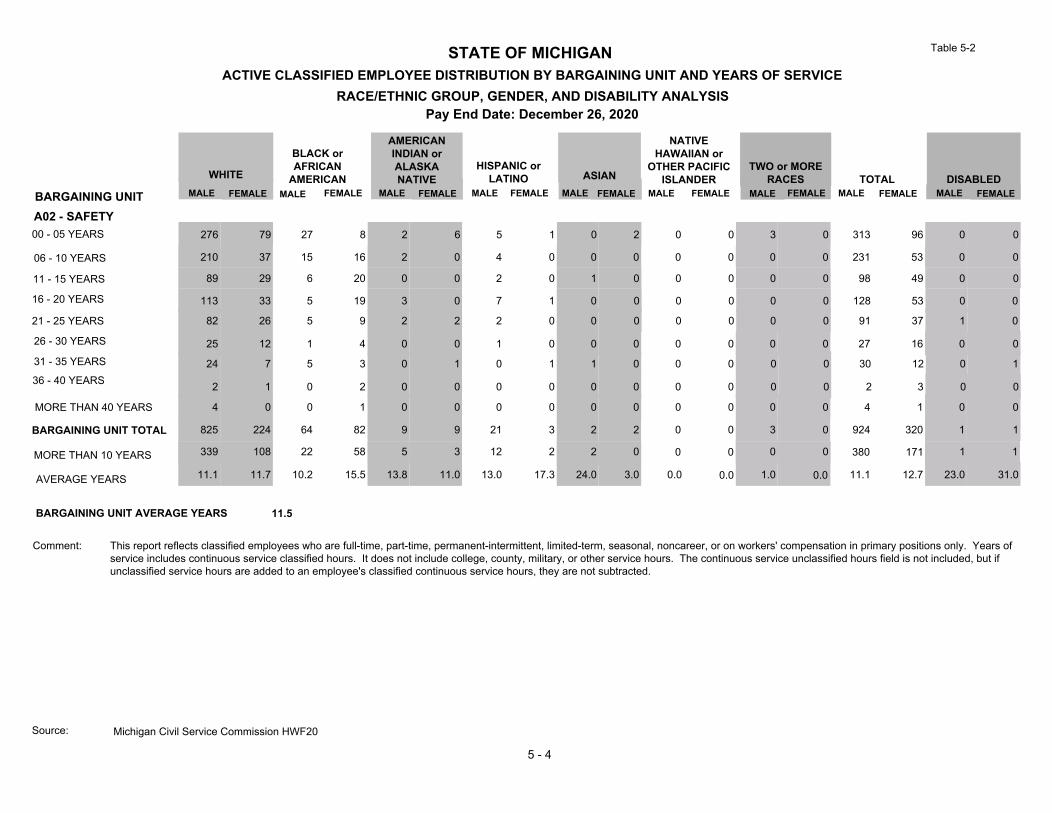
STATE OF MICHIGANACTIVE CLASSIFIED EMPLOYEE DISTRIBUTION BY BARGAINING UNIT AND YEARS OF SERVICE
RACE/ETHNIC GROUP, GENDER, AND DISABILITY ANALYSISPay End Date: December 26, 2020
BARGAINING UNIT FEMALE MALE MALEFEMALE
BLACK orAFRICAN
AMERICANFEMALE
AMERICANINDIAN orALASKANATIVE
HISPANIC orLATINO
MALE FEMALE MALE FEMALE MALE FEMALE MALE FEMALEDISABLED
MALE FEMALE
Table 5-2
89 29 6 20 0 0 2 0 1 0 0 0 0 0 98 49 0 0
11.1 11.7 10.2 15.5 13.8 11.0 13.0 17.3 24.0 3.0 0.0 0.0 1.0 0.0 11.1 12.7 23.0 31.0
339 108 22 58 5 3 12 2 2 0 0 0 1 1339 108 22 58 5 3 12 2 2 0 0 0 0 0 380 171 1 1
825 224 64 82 9 9 21 3 2 2 0 0 3 0 924 320 1 1
4 0 0 1 0 0 0 0 0 0 0 0 0 0 4 1 0 0
2 1 0 2 0 0 0 0 0 0 0 0 0 0 2 3 0 0
24 7 5 3 0 1 0 1 1 0 0 0 0 0 30 12 0 1
25 12 1 4 0 0 1 0 0 0 0 0 0 0 27 16 0 0
113 33 5 19 3 0 7 1 0 0 0 0 0 0 128 53 0 0
82 26 5 9 2 2 2 0 0 0 0 0 0 0 91 37 1 0
210 37 15 16 2 0 4 0 0 0 0 0 0 0 231 53 0 0
276 79 27 8 2 6 5 1 0 2 0 0 3 0 313 96 0 000 - 05 YEARS
06 - 10 YEARS
11 - 15 YEARS
16 - 20 YEARS
21 - 25 YEARS
26 - 30 YEARS
31 - 35 YEARS
36 - 40 YEARS
MORE THAN 40 YEARS
BARGAINING UNIT TOTAL
MORE THAN 10 YEARS
AVERAGE YEARS
11.5 # # ##BARGAINING UNIT AVERAGE YEARS
A02 - SAFETY
MALE
NATIVEHAWAIIAN or
OTHER PACIFICISLANDER
MALE FEMALE
WHITE ASIANTWO or MORE
RACES TOTAL
Comment:
Michigan Civil Service Commission HWF20Source:
5 - 4
This report reflects classified employees who are full-time, part-time, permanent-intermittent, limited-term, seasonal, noncareer, or on workers' compensation in primary positions only. Years of service includes continuous service classified hours. It does not include college, county, military, or other service hours. The continuous service unclassified hours field is not included, but if unclassified service hours are added to an employee's classified continuous service hours, they are not subtracted.
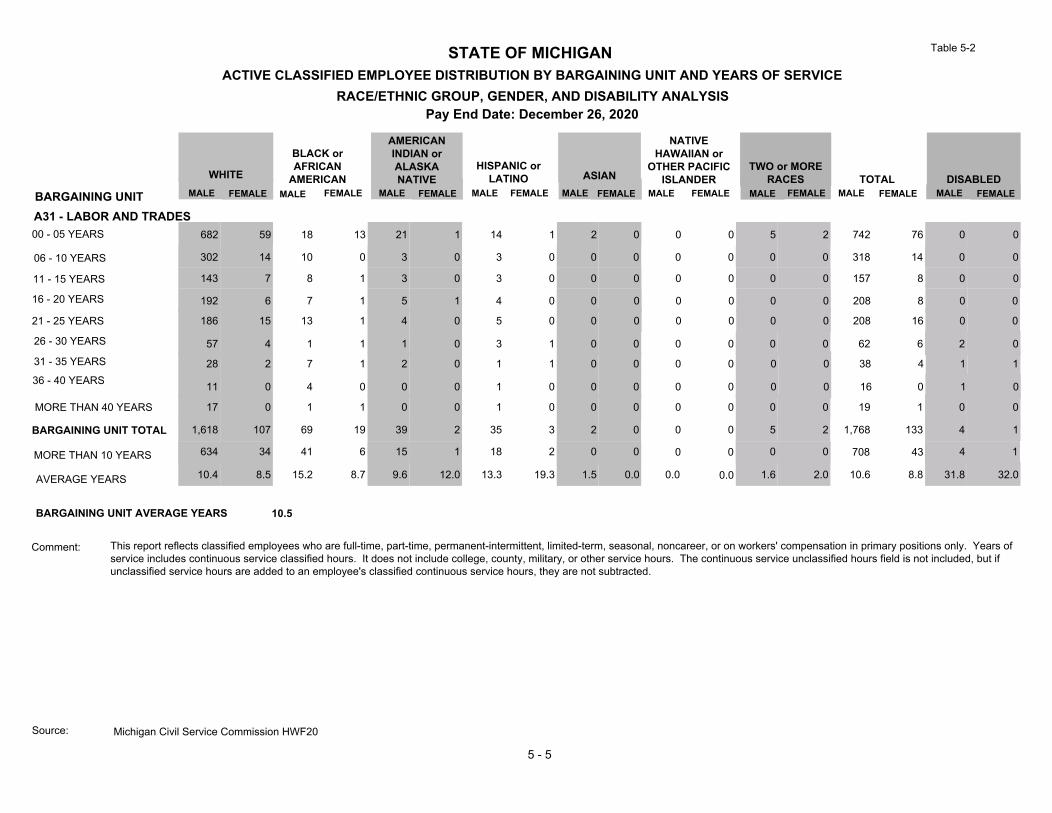
STATE OF MICHIGANACTIVE CLASSIFIED EMPLOYEE DISTRIBUTION BY BARGAINING UNIT AND YEARS OF SERVICE
RACE/ETHNIC GROUP, GENDER, AND DISABILITY ANALYSISPay End Date: December 26, 2020
BARGAINING UNIT FEMALE MALE MALEFEMALE
BLACK orAFRICAN
AMERICANFEMALE
AMERICANINDIAN orALASKANATIVE
HISPANIC orLATINO
MALE FEMALE MALE FEMALE MALE FEMALE MALE FEMALEDISABLED
MALE FEMALE
Table 5-2
143 7 8 1 3 0 3 0 0 0 0 0 0 0 157 8 0 0
10.4 8.5 15.2 8.7 9.6 12.0 13.3 19.3 1.5 0.0 0.0 0.0 1.6 2.0 10.6 8.8 31.8 32.0
634 34 41 6 15 1 18 2 0 0 0 0 4 1634 34 41 6 15 1 18 2 0 0 0 0 0 0 708 43 4 1
1,618 107 69 19 39 2 35 3 2 0 0 0 5 2 1,768 133 4 1
17 0 1 1 0 0 1 0 0 0 0 0 0 0 19 1 0 0
11 0 4 0 0 0 1 0 0 0 0 0 0 0 16 0 1 0
28 2 7 1 2 0 1 1 0 0 0 0 0 0 38 4 1 1
57 4 1 1 1 0 3 1 0 0 0 0 0 0 62 6 2 0
192 6 7 1 5 1 4 0 0 0 0 0 0 0 208 8 0 0
186 15 13 1 4 0 5 0 0 0 0 0 0 0 208 16 0 0
302 14 10 0 3 0 3 0 0 0 0 0 0 0 318 14 0 0
682 59 18 13 21 1 14 1 2 0 0 0 5 2 742 76 0 000 - 05 YEARS
06 - 10 YEARS
11 - 15 YEARS
16 - 20 YEARS
21 - 25 YEARS
26 - 30 YEARS
31 - 35 YEARS
36 - 40 YEARS
MORE THAN 40 YEARS
BARGAINING UNIT TOTAL
MORE THAN 10 YEARS
AVERAGE YEARS
10.5 # # ##BARGAINING UNIT AVERAGE YEARS
A31 - LABOR AND TRADES
MALE
NATIVEHAWAIIAN or
OTHER PACIFICISLANDER
MALE FEMALE
WHITE ASIANTWO or MORE
RACES TOTAL
Comment:
Michigan Civil Service Commission HWF20Source:
5 - 5
This report reflects classified employees who are full-time, part-time, permanent-intermittent, limited-term, seasonal, noncareer, or on workers' compensation in primary positions only. Years of service includes continuous service classified hours. It does not include college, county, military, or other service hours. The continuous service unclassified hours field is not included, but if unclassified service hours are added to an employee's classified continuous service hours, they are not subtracted.
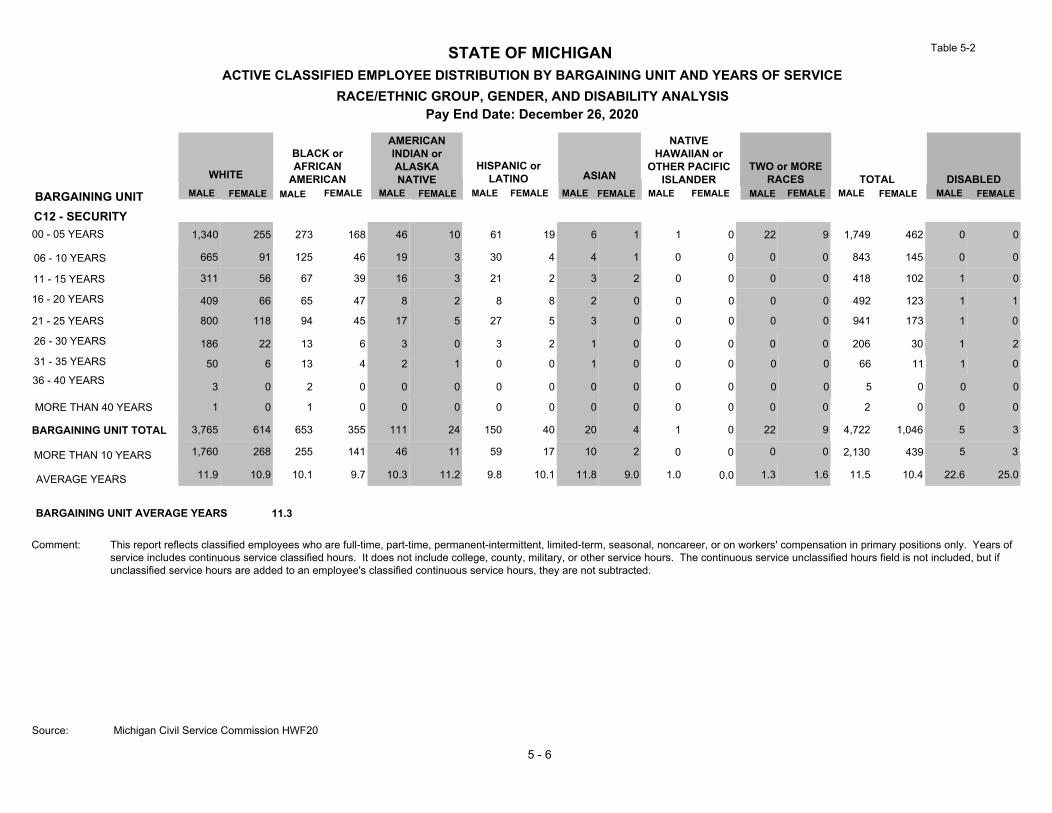
STATE OF MICHIGANACTIVE CLASSIFIED EMPLOYEE DISTRIBUTION BY BARGAINING UNIT AND YEARS OF SERVICE
RACE/ETHNIC GROUP, GENDER, AND DISABILITY ANALYSISPay End Date: December 26, 2020
BARGAINING UNIT FEMALE MALE MALEFEMALE
BLACK orAFRICAN
AMERICANFEMALE
AMERICANINDIAN orALASKANATIVE
HISPANIC orLATINO
MALE FEMALE MALE FEMALE MALE FEMALE MALE FEMALEDISABLED
MALE FEMALE
Table 5-2
311 56 67 39 16 3 21 2 3 2 0 0 0 0 418 102 1 0
11.9 10.9 10.1 9.7 10.3 11.2 9.8 10.1 11.8 9.0 1.0 0.0 1.3 1.6 11.5 10.4 22.6 25.0
1,760 268 255 141 46 11 59 17 10 2 0 0 5 31,760 268 255 141 46 11 59 17 10 2 0 0 0 0 2,130 439 5 3
3,765 614 653 355 111 24 150 40 20 4 1 0 22 9 4,722 1,046 5 3
1 0 1 0 0 0 0 0 0 0 0 0 0 0 2 0 0 0
3 0 2 0 0 0 0 0 0 0 0 0 0 0 5 0 0 0
50 6 13 4 2 1 0 0 1 0 0 0 0 0 66 11 1 0
186 22 13 6 3 0 3 2 1 0 0 0 0 0 206 30 1 2
409 66 65 47 8 2 8 8 2 0 0 0 0 0 492 123 1 1
800 118 94 45 17 5 27 5 3 0 0 0 0 0 941 173 1 0
665 91 125 46 19 3 30 4 4 1 0 0 0 0 843 145 0 0
1,340 255 273 168 46 10 61 19 6 1 1 0 22 9 1,749 462 0 000 - 05 YEARS
06 - 10 YEARS
11 - 15 YEARS
16 - 20 YEARS
21 - 25 YEARS
26 - 30 YEARS
31 - 35 YEARS
36 - 40 YEARS
MORE THAN 40 YEARS
BARGAINING UNIT TOTAL
MORE THAN 10 YEARS
AVERAGE YEARS
11.3 # # ##BARGAINING UNIT AVERAGE YEARS
C12 - SECURITY
MALE
NATIVEHAWAIIAN or
OTHER PACIFICISLANDER
MALE FEMALE
WHITE ASIANTWO or MORE
RACES TOTAL
Comment:
Michigan Civil Service Commission HWF20Source:
5 - 6
This report reflects classified employees who are full-time, part-time, permanent-intermittent, limited-term, seasonal, noncareer, or on workers' compensation in primary positions only. Years of service includes continuous service classified hours. It does not include college, county, military, or other service hours. The continuous service unclassified hours field is not included, but if unclassified service hours are added to an employee's classified continuous service hours, they are not subtracted.

STATE OF MICHIGANACTIVE CLASSIFIED EMPLOYEE DISTRIBUTION BY BARGAINING UNIT AND YEARS OF SERVICE
RACE/ETHNIC GROUP, GENDER, AND DISABILITY ANALYSISPay End Date: December 26, 2020
BARGAINING UNIT FEMALE MALE MALEFEMALE
BLACK orAFRICAN
AMERICANFEMALE
AMERICANINDIAN orALASKANATIVE
HISPANIC orLATINO
MALE FEMALE MALE FEMALE MALE FEMALE MALE FEMALEDISABLED
MALE FEMALE
Table 5-2
21 46 9 41 1 0 3 3 0 1 0 0 0 0 34 91 1 0
7.0 7.1 9.1 8.3 8.8 7.3 8.6 8.2 12.7 4.0 0.0 1.0 1.3 0.7 7.8 7.6 13.0 22.0
38 109 28 146 1 1 5 12 2 2 0 0 1 238 109 28 146 1 1 5 12 2 2 0 0 0 0 74 270 1 2
104 296 56 355 5 4 10 34 3 9 0 1 3 14 181 713 1 3
0 3 0 4 0 0 0 0 0 0 0 0 0 0 0 7 0 1
0 0 0 0 0 0 0 0 0 0 0 0 0 0 0 0 0 0
0 1 0 4 0 0 0 0 0 0 0 0 0 0 0 5 0 0
0 5 0 7 0 0 0 3 0 0 0 0 0 0 0 15 0 0
14 48 17 85 0 1 2 5 2 1 0 0 0 0 35 140 0 1
3 6 2 5 0 0 0 1 0 0 0 0 0 0 5 12 0 0
11 11 2 23 4 1 1 2 0 0 0 0 0 0 18 37 0 0
55 176 26 186 0 2 4 20 1 7 0 1 3 14 89 406 0 100 - 05 YEARS
06 - 10 YEARS
11 - 15 YEARS
16 - 20 YEARS
21 - 25 YEARS
26 - 30 YEARS
31 - 35 YEARS
36 - 40 YEARS
MORE THAN 40 YEARS
BARGAINING UNIT TOTAL
MORE THAN 10 YEARS
AVERAGE YEARS
7.6 # # ##BARGAINING UNIT AVERAGE YEARS
E42 - HUMAN SERVICES SUPPORT
MALE
NATIVEHAWAIIAN or
OTHER PACIFICISLANDER
MALE FEMALE
WHITE ASIANTWO or MORE
RACES TOTAL
Comment:
Michigan Civil Service Commission HWF20Source:
5 - 7
This report reflects classified employees who are full-time, part-time, permanent-intermittent, limited-term, seasonal, noncareer, or on workers' compensation in primary positions only. Years of service includes continuous service classified hours. It does not include college, county, military, or other service hours. The continuous service unclassified hours field is not included, but if unclassified service hours are added to an employee's classified continuous service hours, they are not subtracted.

STATE OF MICHIGANACTIVE CLASSIFIED EMPLOYEE DISTRIBUTION BY BARGAINING UNIT AND YEARS OF SERVICE
RACE/ETHNIC GROUP, GENDER, AND DISABILITY ANALYSISPay End Date: December 26, 2020
BARGAINING UNIT FEMALE MALE MALEFEMALE
BLACK orAFRICAN
AMERICANFEMALE
AMERICANINDIAN orALASKANATIVE
HISPANIC orLATINO
MALE FEMALE MALE FEMALE MALE FEMALE MALE FEMALEDISABLED
MALE FEMALE
Table 5-2
122 101 2 2 0 0 2 0 2 3 0 0 0 0 128 106 0 0
13.2 11.0 19.7 11.4 22.4 7.3 14.0 5.8 15.1 10.7 0.0 0.0 5.0 2.3 13.4 10.9 25.0 20.0
637 336 21 11 3 1 11 1 25 17 1 0 1 2637 336 21 11 3 1 11 1 25 17 0 0 1 0 698 366 1 2
1,251 787 30 26 5 3 21 11 44 43 0 0 6 3 1,357 873 1 2
12 1 2 0 1 0 0 0 2 0 0 0 0 0 17 1 0 0
9 3 1 0 0 0 0 0 1 0 0 0 0 0 11 3 0 0
65 31 4 3 1 0 1 0 2 1 0 0 0 0 73 35 0 0
87 40 4 2 0 0 4 0 6 2 0 0 0 0 101 44 0 0
208 101 6 4 0 1 1 1 7 3 0 0 0 0 222 110 0 1
134 59 2 0 1 0 3 0 5 8 0 0 1 0 146 67 1 1
202 140 4 4 2 0 1 4 0 6 0 0 0 0 209 154 0 0
412 311 5 11 0 2 9 6 19 20 0 0 5 3 450 353 0 000 - 05 YEARS
06 - 10 YEARS
11 - 15 YEARS
16 - 20 YEARS
21 - 25 YEARS
26 - 30 YEARS
31 - 35 YEARS
36 - 40 YEARS
MORE THAN 40 YEARS
BARGAINING UNIT TOTAL
MORE THAN 10 YEARS
AVERAGE YEARS
12.4 # # ##BARGAINING UNIT AVERAGE YEARS
H21 - SCIENTIFIC
MALE
NATIVEHAWAIIAN or
OTHER PACIFICISLANDER
MALE FEMALE
WHITE ASIANTWO or MORE
RACES TOTAL
Comment:
Michigan Civil Service Commission HWF20Source:
5 - 8
This report reflects classified employees who are full-time, part-time, permanent-intermittent, limited-term, seasonal, noncareer, or on workers' compensation in primary positions only. Years of service includes continuous service classified hours. It does not include college, county, military, or other service hours. The continuous service unclassified hours field is not included, but if unclassified service hours are added to an employee's classified continuous service hours, they are not subtracted.
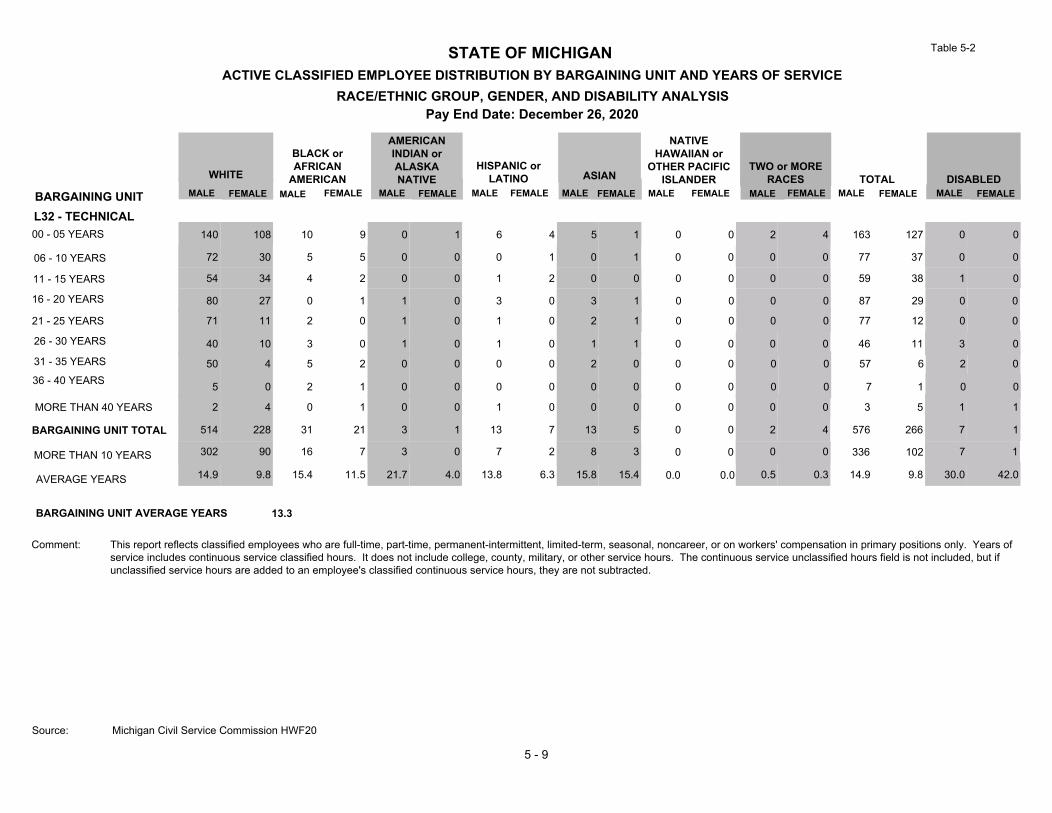
STATE OF MICHIGANACTIVE CLASSIFIED EMPLOYEE DISTRIBUTION BY BARGAINING UNIT AND YEARS OF SERVICE
RACE/ETHNIC GROUP, GENDER, AND DISABILITY ANALYSISPay End Date: December 26, 2020
BARGAINING UNIT FEMALE MALE MALEFEMALE
BLACK orAFRICAN
AMERICANFEMALE
AMERICANINDIAN orALASKANATIVE
HISPANIC orLATINO
MALE FEMALE MALE FEMALE MALE FEMALE MALE FEMALEDISABLED
MALE FEMALE
Table 5-2
54 34 4 2 0 0 1 2 0 0 0 0 0 0 59 38 1 0
14.9 9.8 15.4 11.5 21.7 4.0 13.8 6.3 15.8 15.4 0.0 0.0 0.5 0.3 14.9 9.8 30.0 42.0
302 90 16 7 3 0 7 2 8 3 0 0 7 1302 90 16 7 3 0 7 2 8 3 0 0 0 0 336 102 7 1
514 228 31 21 3 1 13 7 13 5 0 0 2 4 576 266 7 1
2 4 0 1 0 0 1 0 0 0 0 0 0 0 3 5 1 1
5 0 2 1 0 0 0 0 0 0 0 0 0 0 7 1 0 0
50 4 5 2 0 0 0 0 2 0 0 0 0 0 57 6 2 0
40 10 3 0 1 0 1 0 1 1 0 0 0 0 46 11 3 0
80 27 0 1 1 0 3 0 3 1 0 0 0 0 87 29 0 0
71 11 2 0 1 0 1 0 2 1 0 0 0 0 77 12 0 0
72 30 5 5 0 0 0 1 0 1 0 0 0 0 77 37 0 0
140 108 10 9 0 1 6 4 5 1 0 0 2 4 163 127 0 000 - 05 YEARS
06 - 10 YEARS
11 - 15 YEARS
16 - 20 YEARS
21 - 25 YEARS
26 - 30 YEARS
31 - 35 YEARS
36 - 40 YEARS
MORE THAN 40 YEARS
BARGAINING UNIT TOTAL
MORE THAN 10 YEARS
AVERAGE YEARS
13.3 # # ##BARGAINING UNIT AVERAGE YEARS
L32 - TECHNICAL
MALE
NATIVEHAWAIIAN or
OTHER PACIFICISLANDER
MALE FEMALE
WHITE ASIANTWO or MORE
RACES TOTAL
Comment:
Michigan Civil Service Commission HWF20Source:
5 - 9
This report reflects classified employees who are full-time, part-time, permanent-intermittent, limited-term, seasonal, noncareer, or on workers' compensation in primary positions only. Years of service includes continuous service classified hours. It does not include college, county, military, or other service hours. The continuous service unclassified hours field is not included, but if unclassified service hours are added to an employee's classified continuous service hours, they are not subtracted.
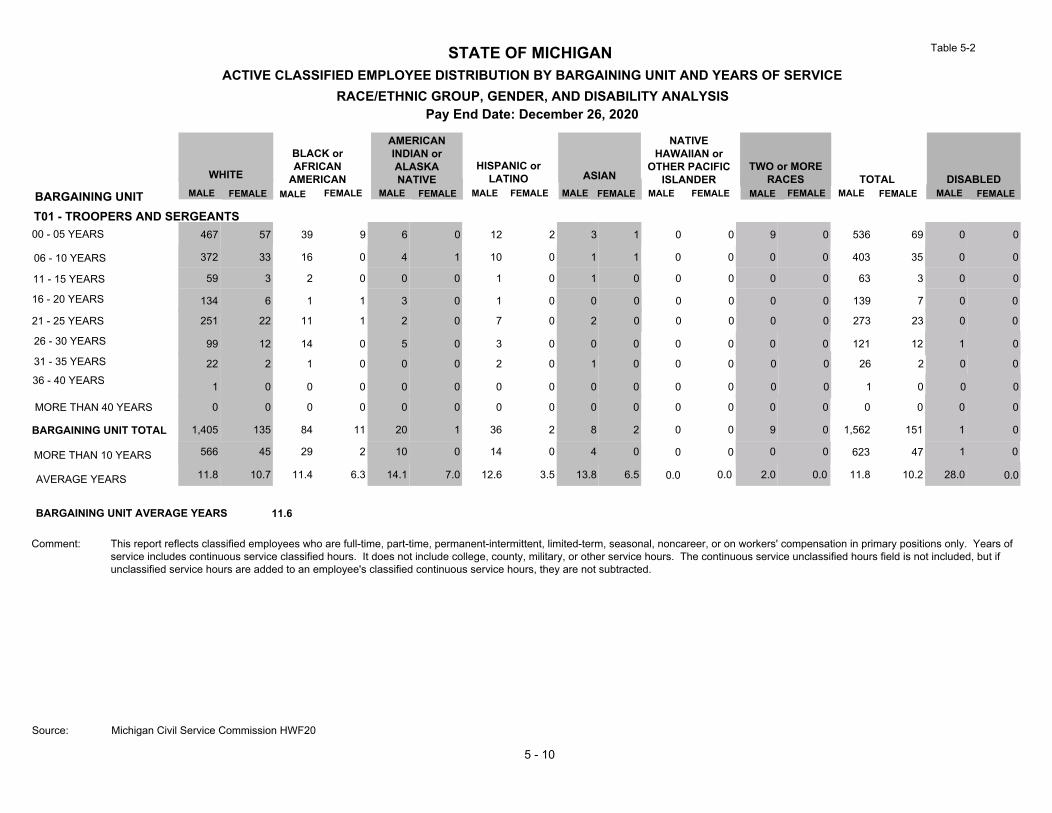
STATE OF MICHIGANACTIVE CLASSIFIED EMPLOYEE DISTRIBUTION BY BARGAINING UNIT AND YEARS OF SERVICE
RACE/ETHNIC GROUP, GENDER, AND DISABILITY ANALYSISPay End Date: December 26, 2020
BARGAINING UNIT FEMALE MALE MALEFEMALE
BLACK orAFRICAN
AMERICANFEMALE
AMERICANINDIAN orALASKANATIVE
HISPANIC orLATINO
MALE FEMALE MALE FEMALE MALE FEMALE MALE FEMALEDISABLED
MALE FEMALE
Table 5-2
59 3 2 0 0 0 1 0 1 0 0 0 0 0 63 3 0 0
11.8 10.7 11.4 6.3 14.1 7.0 12.6 3.5 13.8 6.5 0.0 0.0 2.0 0.0 11.8 10.2 28.0 0.0
566 45 29 2 10 0 14 0 4 0 0 0 1 0566 45 29 2 10 0 14 0 4 0 0 0 0 0 623 47 1 0
1,405 135 84 11 20 1 36 2 8 2 0 0 9 0 1,562 151 1 0
0 0 0 0 0 0 0 0 0 0 0 0 0 0 0 0 0 0
1 0 0 0 0 0 0 0 0 0 0 0 0 0 1 0 0 0
22 2 1 0 0 0 2 0 1 0 0 0 0 0 26 2 0 0
99 12 14 0 5 0 3 0 0 0 0 0 0 0 121 12 1 0
134 6 1 1 3 0 1 0 0 0 0 0 0 0 139 7 0 0
251 22 11 1 2 0 7 0 2 0 0 0 0 0 273 23 0 0
372 33 16 0 4 1 10 0 1 1 0 0 0 0 403 35 0 0
467 57 39 9 6 0 12 2 3 1 0 0 9 0 536 69 0 000 - 05 YEARS
06 - 10 YEARS
11 - 15 YEARS
16 - 20 YEARS
21 - 25 YEARS
26 - 30 YEARS
31 - 35 YEARS
36 - 40 YEARS
MORE THAN 40 YEARS
BARGAINING UNIT TOTAL
MORE THAN 10 YEARS
AVERAGE YEARS
11.6 # # ##BARGAINING UNIT AVERAGE YEARS
T01 - TROOPERS AND SERGEANTS
MALE
NATIVEHAWAIIAN or
OTHER PACIFICISLANDER
MALE FEMALE
WHITE ASIANTWO or MORE
RACES TOTAL
Comment:
Michigan Civil Service Commission HWF20Source:
5 - 10
This report reflects classified employees who are full-time, part-time, permanent-intermittent, limited-term, seasonal, noncareer, or on workers' compensation in primary positions only. Years of service includes continuous service classified hours. It does not include college, county, military, or other service hours. The continuous service unclassified hours field is not included, but if unclassified service hours are added to an employee's classified continuous service hours, they are not subtracted.

STATE OF MICHIGANACTIVE CLASSIFIED EMPLOYEE DISTRIBUTION BY BARGAINING UNIT AND YEARS OF SERVICE
RACE/ETHNIC GROUP, GENDER, AND DISABILITY ANALYSISPay End Date: December 26, 2020
BARGAINING UNIT FEMALE MALE MALEFEMALE
BLACK orAFRICAN
AMERICANFEMALE
AMERICANINDIAN orALASKANATIVE
HISPANIC orLATINO
MALE FEMALE MALE FEMALE MALE FEMALE MALE FEMALEDISABLED
MALE FEMALE
Table 5-2
20 46 12 22 0 1 2 2 0 0 0 0 0 0 34 71 0 0
7.5 7.1 5.9 7.0 6.0 4.2 7.2 6.2 5.8 11.9 4.0 2.0 1.1 0.7 6.8 7.0 0.0 0.0
90 147 31 87 1 1 6 5 1 5 0 0 0 090 147 31 87 1 1 6 5 1 5 0 0 0 0 129 245 0 0
378 595 197 370 5 9 25 25 9 11 1 1 8 7 623 1,018 0 0
2 0 1 1 0 0 0 0 0 0 0 0 0 0 3 1 0 0
1 1 0 0 0 0 0 0 0 0 0 0 0 0 1 1 0 0
3 2 1 4 0 0 0 0 0 0 0 0 0 0 4 6 0 0
8 13 2 6 0 0 0 1 0 0 0 0 0 0 10 20 0 0
39 52 13 42 0 0 3 2 1 2 0 0 0 0 56 98 0 0
17 33 2 12 1 0 1 0 0 3 0 0 0 0 21 48 0 0
68 89 41 57 0 2 5 3 3 3 0 0 0 0 117 154 0 0
220 359 125 226 4 6 14 17 5 3 1 1 8 7 377 619 0 000 - 05 YEARS
06 - 10 YEARS
11 - 15 YEARS
16 - 20 YEARS
21 - 25 YEARS
26 - 30 YEARS
31 - 35 YEARS
36 - 40 YEARS
MORE THAN 40 YEARS
BARGAINING UNIT TOTAL
MORE THAN 10 YEARS
AVERAGE YEARS
6.9 # # ##BARGAINING UNIT AVERAGE YEARS
U11 - INSTITUTIONAL
MALE
NATIVEHAWAIIAN or
OTHER PACIFICISLANDER
MALE FEMALE
WHITE ASIANTWO or MORE
RACES TOTAL
Comment:
Michigan Civil Service Commission HWF20Source:
5 - 11
This report reflects classified employees who are full-time, part-time, permanent-intermittent, limited-term, seasonal, noncareer, or on workers' compensation in primary positions only. Years of service includes continuous service classified hours. It does not include college, county, military, or other service hours. The continuous service unclassified hours field is not included, but if unclassified service hours are added to an employee's classified continuous service hours, they are not subtracted.
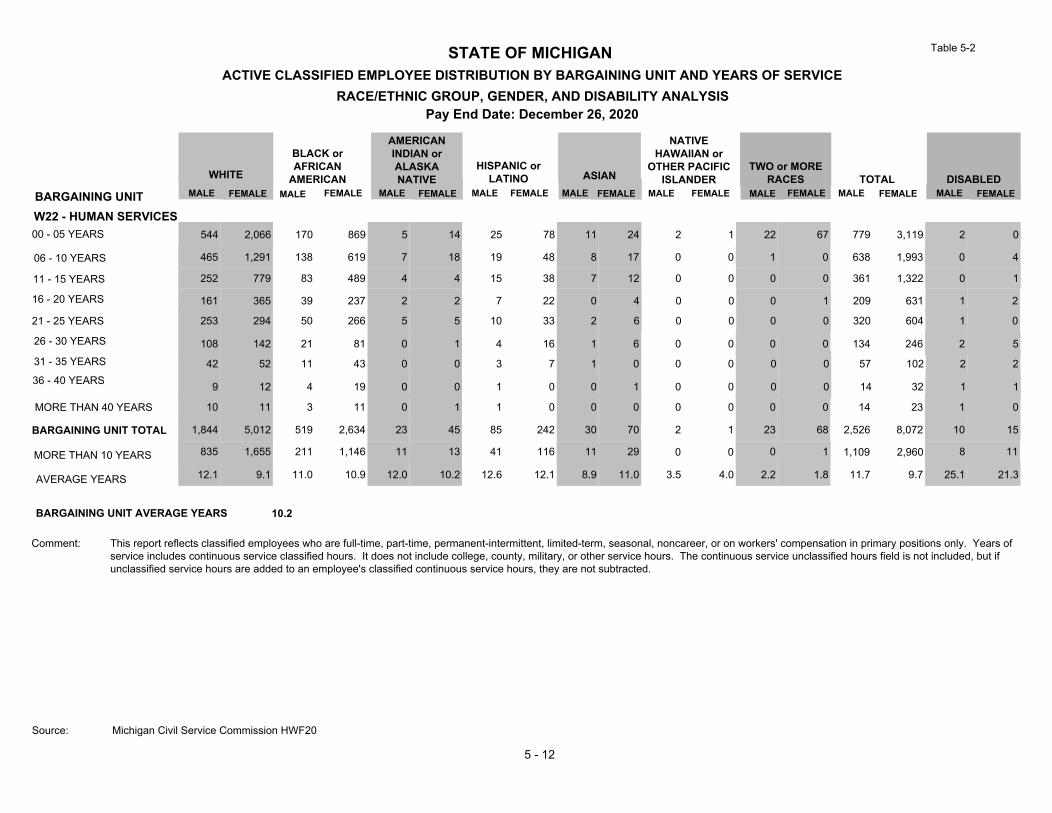
STATE OF MICHIGANACTIVE CLASSIFIED EMPLOYEE DISTRIBUTION BY BARGAINING UNIT AND YEARS OF SERVICE
RACE/ETHNIC GROUP, GENDER, AND DISABILITY ANALYSISPay End Date: December 26, 2020
BARGAINING UNIT FEMALE MALE MALEFEMALE
BLACK orAFRICAN
AMERICANFEMALE
AMERICANINDIAN orALASKANATIVE
HISPANIC orLATINO
MALE FEMALE MALE FEMALE MALE FEMALE MALE FEMALEDISABLED
MALE FEMALE
Table 5-2
252 779 83 489 4 4 15 38 7 12 0 0 0 0 361 1,322 0 1
12.1 9.1 11.0 10.9 12.0 10.2 12.6 12.1 8.9 11.0 3.5 4.0 2.2 1.8 11.7 9.7 25.1 21.3
835 1,655 211 1,146 11 13 41 116 11 29 0 1 8 11835 1,655 211 1,146 11 13 41 116 11 29 0 0 0 1 1,109 2,960 8 11
1,844 5,012 519 2,634 23 45 85 242 30 70 2 1 23 68 2,526 8,072 10 15
10 11 3 11 0 1 1 0 0 0 0 0 0 0 14 23 1 0
9 12 4 19 0 0 1 0 0 1 0 0 0 0 14 32 1 1
42 52 11 43 0 0 3 7 1 0 0 0 0 0 57 102 2 2
108 142 21 81 0 1 4 16 1 6 0 0 0 0 134 246 2 5
161 365 39 237 2 2 7 22 0 4 0 0 0 1 209 631 1 2
253 294 50 266 5 5 10 33 2 6 0 0 0 0 320 604 1 0
465 1,291 138 619 7 18 19 48 8 17 0 0 1 0 638 1,993 0 4
544 2,066 170 869 5 14 25 78 11 24 2 1 22 67 779 3,119 2 000 - 05 YEARS
06 - 10 YEARS
11 - 15 YEARS
16 - 20 YEARS
21 - 25 YEARS
26 - 30 YEARS
31 - 35 YEARS
36 - 40 YEARS
MORE THAN 40 YEARS
BARGAINING UNIT TOTAL
MORE THAN 10 YEARS
AVERAGE YEARS
10.2 # # ##BARGAINING UNIT AVERAGE YEARS
W22 - HUMAN SERVICES
MALE
NATIVEHAWAIIAN or
OTHER PACIFICISLANDER
MALE FEMALE
WHITE ASIANTWO or MORE
RACES TOTAL
Comment:
Michigan Civil Service Commission HWF20Source:
5 - 12
This report reflects classified employees who are full-time, part-time, permanent-intermittent, limited-term, seasonal, noncareer, or on workers' compensation in primary positions only. Years of service includes continuous service classified hours. It does not include college, county, military, or other service hours. The continuous service unclassified hours field is not included, but if unclassified service hours are added to an employee's classified continuous service hours, they are not subtracted.

STATE OF MICHIGANACTIVE CLASSIFIED EMPLOYEE DISTRIBUTION BY BARGAINING UNIT AND YEARS OF SERVICE
RACE/ETHNIC GROUP, GENDER, AND DISABILITY ANALYSISPay End Date: December 26, 2020
BARGAINING UNIT FEMALE MALE MALEFEMALE
BLACK orAFRICAN
AMERICANFEMALE
AMERICANINDIAN orALASKANATIVE
HISPANIC orLATINO
MALE FEMALE MALE FEMALE MALE FEMALE MALE FEMALEDISABLED
MALE FEMALE
Table 5-2
59 362 16 88 0 3 1 21 0 1 0 0 0 0 76 475 0 1
7.5 10.5 9.0 12.3 7.3 11.4 9.7 10.7 7.5 12.6 0.0 2.0 1.3 2.1 7.8 10.8 33.5 29.1
162 1,284 40 359 2 17 12 74 4 17 0 0 6 31162 1,284 40 359 2 17 12 74 4 17 0 0 0 0 220 1,751 6 31
652 3,475 126 859 9 41 39 190 17 44 0 1 7 41 850 4,651 6 33
0 54 0 24 0 1 1 1 0 1 0 0 0 0 1 81 1 3
1 39 0 18 0 0 0 2 0 0 0 0 0 0 1 59 0 3
12 98 5 50 0 0 2 12 1 5 0 0 0 0 20 165 4 10
8 109 4 31 0 0 1 3 1 0 0 0 0 0 14 143 1 9
41 331 7 62 1 4 3 17 2 3 0 0 0 0 54 417 0 1
41 291 8 86 1 9 4 18 0 7 0 0 0 0 54 411 0 4
126 741 27 165 2 7 4 34 2 11 0 0 0 2 161 960 0 2
364 1,450 59 335 5 17 23 82 11 16 0 1 7 39 469 1,940 0 000 - 05 YEARS
06 - 10 YEARS
11 - 15 YEARS
16 - 20 YEARS
21 - 25 YEARS
26 - 30 YEARS
31 - 35 YEARS
36 - 40 YEARS
MORE THAN 40 YEARS
BARGAINING UNIT TOTAL
MORE THAN 10 YEARS
AVERAGE YEARS
10.3 # # ##BARGAINING UNIT AVERAGE YEARS
W41 - ADMINISTRATIVE SUPPORT
MALE
NATIVEHAWAIIAN or
OTHER PACIFICISLANDER
MALE FEMALE
WHITE ASIANTWO or MORE
RACES TOTAL
Comment:
Michigan Civil Service Commission HWF20Source:
5 - 13
This report reflects classified employees who are full-time, part-time, permanent-intermittent, limited-term, seasonal, noncareer, or on workers' compensation in primary positions only. Years of service includes continuous service classified hours. It does not include college, county, military, or other service hours. The continuous service unclassified hours field is not included, but if unclassified service hours are added to an employee's classified continuous service hours, they are not subtracted.
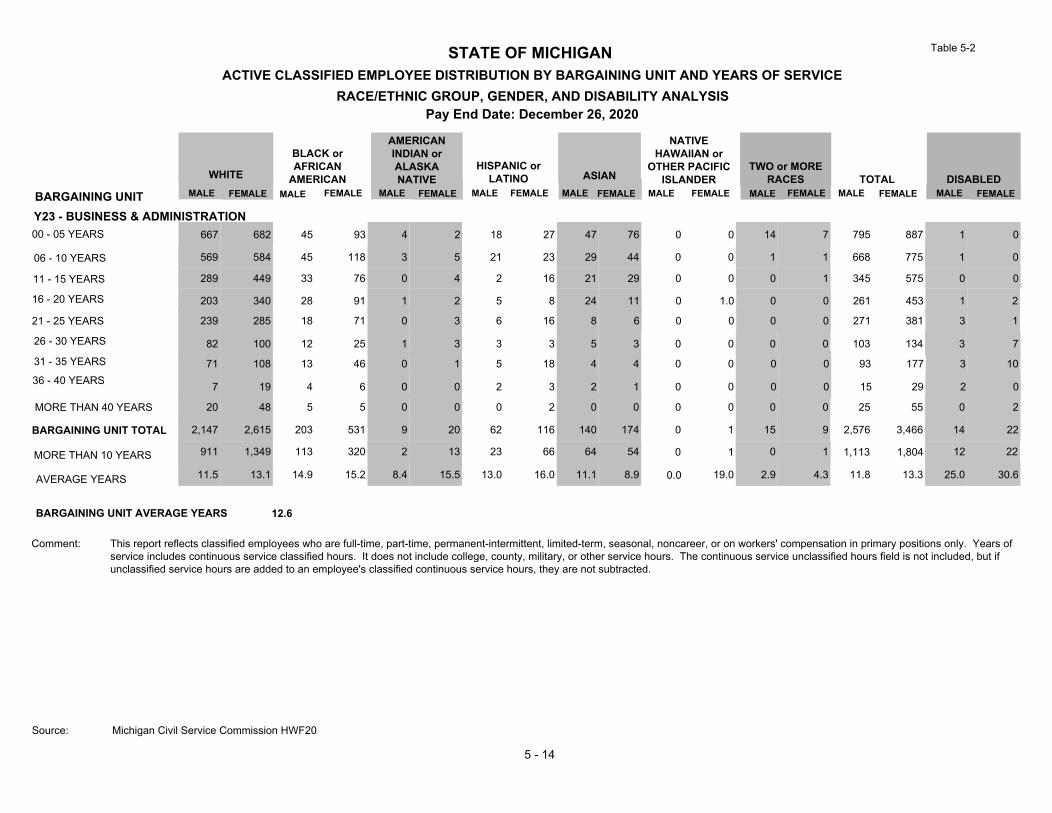
STATE OF MICHIGANACTIVE CLASSIFIED EMPLOYEE DISTRIBUTION BY BARGAINING UNIT AND YEARS OF SERVICE
RACE/ETHNIC GROUP, GENDER, AND DISABILITY ANALYSISPay End Date: December 26, 2020
BARGAINING UNIT FEMALE MALE MALEFEMALE
BLACK orAFRICAN
AMERICANFEMALE
AMERICANINDIAN orALASKANATIVE
HISPANIC orLATINO
MALE FEMALE MALE FEMALE MALE FEMALE MALE FEMALEDISABLED
MALE FEMALE
Table 5-2
289 449 33 76 0 4 2 16 21 29 0 0 0 1 345 575 0 0
11.5 13.1 14.9 15.2 8.4 15.5 13.0 16.0 11.1 8.9 0.0 19.0 2.9 4.3 11.8 13.3 25.0 30.6
911 1,349 113 320 2 13 23 66 64 54 0 1 12 22911 1,349 113 320 2 13 23 66 64 54 0 1 0 1 1,113 1,804 12 22
2,147 2,615 203 531 9 20 62 116 140 174 0 1 15 9 2,576 3,466 14 22
20 48 5 5 0 0 0 2 0 0 0 0 0 0 25 55 0 2
7 19 4 6 0 0 2 3 2 1 0 0 0 0 15 29 2 0
71 108 13 46 0 1 5 18 4 4 0 0 0 0 93 177 3 10
82 100 12 25 1 3 3 3 5 3 0 0 0 0 103 134 3 7
203 340 28 91 1 2 5 8 24 11 0 1.0 0 0 261 453 1 2
239 285 18 71 0 3 6 16 8 6 0 0 0 0 271 381 3 1
569 584 45 118 3 5 21 23 29 44 0 0 1 1 668 775 1 0
667 682 45 93 4 2 18 27 47 76 0 0 14 7 795 887 1 000 - 05 YEARS
06 - 10 YEARS
11 - 15 YEARS
16 - 20 YEARS
21 - 25 YEARS
26 - 30 YEARS
31 - 35 YEARS
36 - 40 YEARS
MORE THAN 40 YEARS
BARGAINING UNIT TOTAL
MORE THAN 10 YEARS
AVERAGE YEARS
12.6 # # ##BARGAINING UNIT AVERAGE YEARS
Y23 - BUSINESS & ADMINISTRATION
MALE
NATIVEHAWAIIAN or
OTHER PACIFICISLANDER
MALE FEMALE
WHITE ASIANTWO or MORE
RACES TOTAL
Comment:
Michigan Civil Service Commission HWF20Source:
5 - 14
This report reflects classified employees who are full-time, part-time, permanent-intermittent, limited-term, seasonal, noncareer, or on workers' compensation in primary positions only. Years of service includes continuous service classified hours. It does not include college, county, military, or other service hours. The continuous service unclassified hours field is not included, but if unclassified service hours are added to an employee's classified continuous service hours, they are not subtracted.

STATE OF MICHIGANACTIVE CLASSIFIED EMPLOYEE DISTRIBUTION BY BARGAINING UNIT AND YEARS OF SERVICE
RACE/ETHNIC GROUP, GENDER, AND DISABILITY ANALYSISPay End Date: December 26, 2020
BARGAINING UNIT FEMALE MALE MALEFEMALE
BLACK orAFRICAN
AMERICANFEMALE
AMERICANINDIAN orALASKANATIVE
HISPANIC orLATINO
MALE FEMALE MALE FEMALE MALE FEMALE MALE FEMALEDISABLED
MALE FEMALE
Table 5-2
270 309 42 94 4 2 9 12 5 7 0 0 0 0 330 424 0 0
17.8 15.6 18.2 18.2 16.6 22.2 17.7 15.8 15.3 14.2 0.0 0.0 5.0 1.4 17.8 16.3 32.8 29.4
1,469 1,117 176 455 29 15 39 39 27 22 0 0 17 81,469 1,117 176 455 29 15 39 39 27 22 0 0 0 0 1,740 1,648 17 8
2,020 1,652 249 614 45 17 58 60 43 37 0 0 2 7 2,417 2,387 18 8
29 17 6 15 0 0 1 1 0 0 0 0 0 0 36 33 5 1
26 14 9 16 1 1 1 1 1 0 0 0 0 0 38 32 4 1
142 66 26 46 4 2 9 3 2 2 0 0 0 0 183 119 3 1
201 115 22 42 4 3 3 5 3 1 0 0 0 0 233 166 2 2
340 328 31 104 6 3 7 12 7 8 0 0 0 0 391 455 2 1
461 268 40 138 10 4 9 5 9 4 0 0 0 0 529 419 1 2
341 326 49 94 8 2 12 15 7 10 0 0 1 0 418 447 0 0
210 209 24 65 8 0 7 6 9 5 0 0 1 7 259 292 1 000 - 05 YEARS
06 - 10 YEARS
11 - 15 YEARS
16 - 20 YEARS
21 - 25 YEARS
26 - 30 YEARS
31 - 35 YEARS
36 - 40 YEARS
MORE THAN 40 YEARS
BARGAINING UNIT TOTAL
MORE THAN 10 YEARS
AVERAGE YEARS
17.0 # # ##BARGAINING UNIT AVERAGE YEARS
Y51 - SUPERVISORY
MALE
NATIVEHAWAIIAN or
OTHER PACIFICISLANDER
MALE FEMALE
WHITE ASIANTWO or MORE
RACES TOTAL
Comment:
Michigan Civil Service Commission HWF20Source:
5 - 15
This report reflects classified employees who are full-time, part-time, permanent-intermittent, limited-term, seasonal, noncareer, or on workers' compensation in primary positions only. Years of service includes continuous service classified hours. It does not include college, county, military, or other service hours. The continuous service unclassified hours field is not included, but if unclassified service hours are added to an employee's classified continuous service hours, they are not subtracted.

STATE OF MICHIGANACTIVE CLASSIFIED EMPLOYEE DISTRIBUTION BY BARGAINING UNIT AND YEARS OF SERVICE
RACE/ETHNIC GROUP, GENDER, AND DISABILITY ANALYSISPay End Date: December 26, 2020
BARGAINING UNIT FEMALE MALE MALEFEMALE
BLACK orAFRICAN
AMERICANFEMALE
AMERICANINDIAN orALASKANATIVE
HISPANIC orLATINO
MALE FEMALE MALE FEMALE MALE FEMALE MALE FEMALEDISABLED
MALE FEMALE
Table 5-2
0 0 0 0 0 0 0 0 0 0 0 0 0 0 0 0
0.0 0.0 0.0 0.0 0.0 0.0 0.0 0.0 0.0 0.0 0.0 0.0 0.0 0.0 0.0 0.0 0.0 0.0
0 0 0 0 0 0 0 0 0 0 0 0 0 00 0 0 0 0 0 0 0 0 0 0 0 0 0 0 0 0 0
35 40 4 6 1 0 1 3 5 2 0 0 2 4 48 55 0 0
0 0 0 0 0 0 0 0 0 0 0 0 0 0 0 0 0 0
0 0 0 0 0 0 0 0 0 0 0 0 0 0 0 0 0 0
0 0 0 0 0 0 0 0 0 0 0 0 0 0 0 0 0 0
0 0 0 0 0 0 0 0 0 0 0 0 0 0 0 0 0 0
0 0 0 0 0 0 0 0 0 0 0 0
0
0 0 0 0 0
0 0 0 0 0 0 0 0 0 0 0 0 0 0 0 0
0 0 0 0 0 0 0 0 0 0 0 0 0 0 0 0 0 0
35 40 4 6 1 0 1 3 5 2 0 0 2 4 48 55 0 000 - 05 YEARS
06 - 10 YEARS
11 - 15 YEARS
16 - 20 YEARS
21 - 25 YEARS
26 - 30 YEARS
31 - 35 YEARS
36 - 40 YEARS
MORE THAN 40 YEARS
BARGAINING UNIT TOTAL
MORE THAN 10 YEARS
AVERAGE YEARS
0.0 # # -2BARGAINING UNIT AVERAGE YEARS
Y52 - NONCAREER
MALE
NATIVEHAWAIIAN or
OTHER PACIFICISLANDER
MALE FEMALE
WHITE ASIANTWO or MORE
RACES TOTAL
Comment:
Michigan Civil Service Commission HWF20Source:
5 - 16
0
0 0
0
This report reflects classified employees who are full-time, part-time, permanent-intermittent, limited-term, seasonal, noncareer, or on workers' compensation in primary positions only. Years of service includes continuous service classified hours. It does not include college, county, military, or other service hours. The continuous service unclassified hours field is not included, but if unclassified service hours are added to an employee's classified continuous service hours, they are not subtracted.
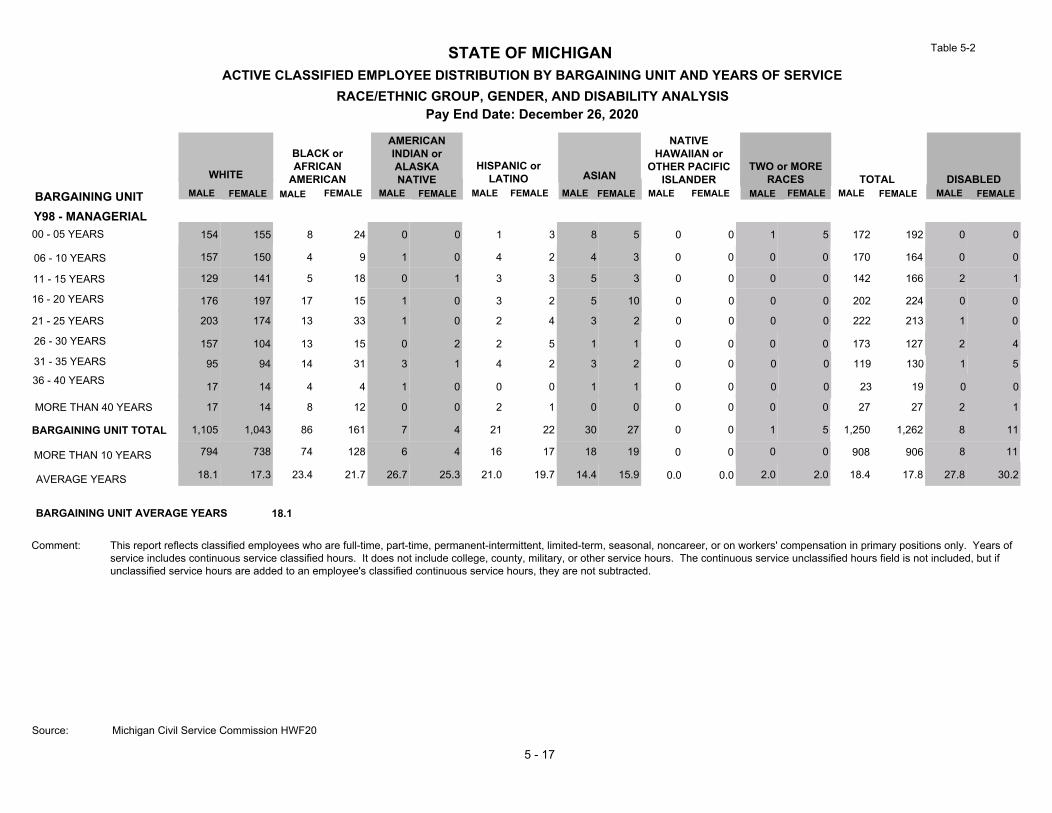
STATE OF MICHIGANACTIVE CLASSIFIED EMPLOYEE DISTRIBUTION BY BARGAINING UNIT AND YEARS OF SERVICE
RACE/ETHNIC GROUP, GENDER, AND DISABILITY ANALYSISPay End Date: December 26, 2020
BARGAINING UNIT FEMALE MALE MALEFEMALE
BLACK orAFRICAN
AMERICANFEMALE
AMERICANINDIAN orALASKANATIVE
HISPANIC orLATINO
MALE FEMALE MALE FEMALE MALE FEMALE MALE FEMALEDISABLED
MALE FEMALE
Table 5-2
129 141 5 18 0 1 3 3 5 3 0 0 0 0 142 166 2 1
18.1 17.3 23.4 21.7 26.7 25.3 21.0 19.7 14.4 15.9 0.0 0.0 2.0 2.0 18.4 17.8 27.8 30.2
794 738 74 128 6 4 16 17 18 19 0 0 8 11794 738 74 128 6 4 16 17 18 19 0 0 0 0 908 906 8 11
1,105 1,043 86 161 7 4 21 22 30 27 0 0 1 5 1,250 1,262 8 11
17 14 8 12 0 0 2 1 0 0 0 0 0 0 27 27 2 1
17 14 4 4 1 0 0 0 1 1 0 0 0 0 23 19 0 0
95 94 14 31 3 1 4 2 3 2 0 0 0 0 119 130 1 5
157 104 13 15 0 2 2 5 1 1 0 0 0 0 173 127 2 4
176 197 17 15 1 0 3 2 5 10 0 0 0 0 202 224 0 0
203 174 13 33 1 0 2 4 3 2 0 0 0 0 222 213 1 0
157 150 4 9 1 0 4 2 4 3 0 0 0 0 170 164 0 0
154 155 8 24 0 0 1 3 8 5 0 0 1 5 172 192 0 000 - 05 YEARS
06 - 10 YEARS
11 - 15 YEARS
16 - 20 YEARS
21 - 25 YEARS
26 - 30 YEARS
31 - 35 YEARS
36 - 40 YEARS
MORE THAN 40 YEARS
BARGAINING UNIT TOTAL
MORE THAN 10 YEARS
AVERAGE YEARS
18.1 # # ##BARGAINING UNIT AVERAGE YEARS
Y98 - MANAGERIAL
MALE
NATIVEHAWAIIAN or
OTHER PACIFICISLANDER
MALE FEMALE
WHITE ASIANTWO or MORE
RACES TOTAL
Comment:
Michigan Civil Service Commission HWF20Source:
5 - 17
This report reflects classified employees who are full-time, part-time, permanent-intermittent, limited-term, seasonal, noncareer, or on workers' compensation in primary positions only. Years of service includes continuous service classified hours. It does not include college, county, military, or other service hours. The continuous service unclassified hours field is not included, but if unclassified service hours are added to an employee's classified continuous service hours, they are not subtracted.
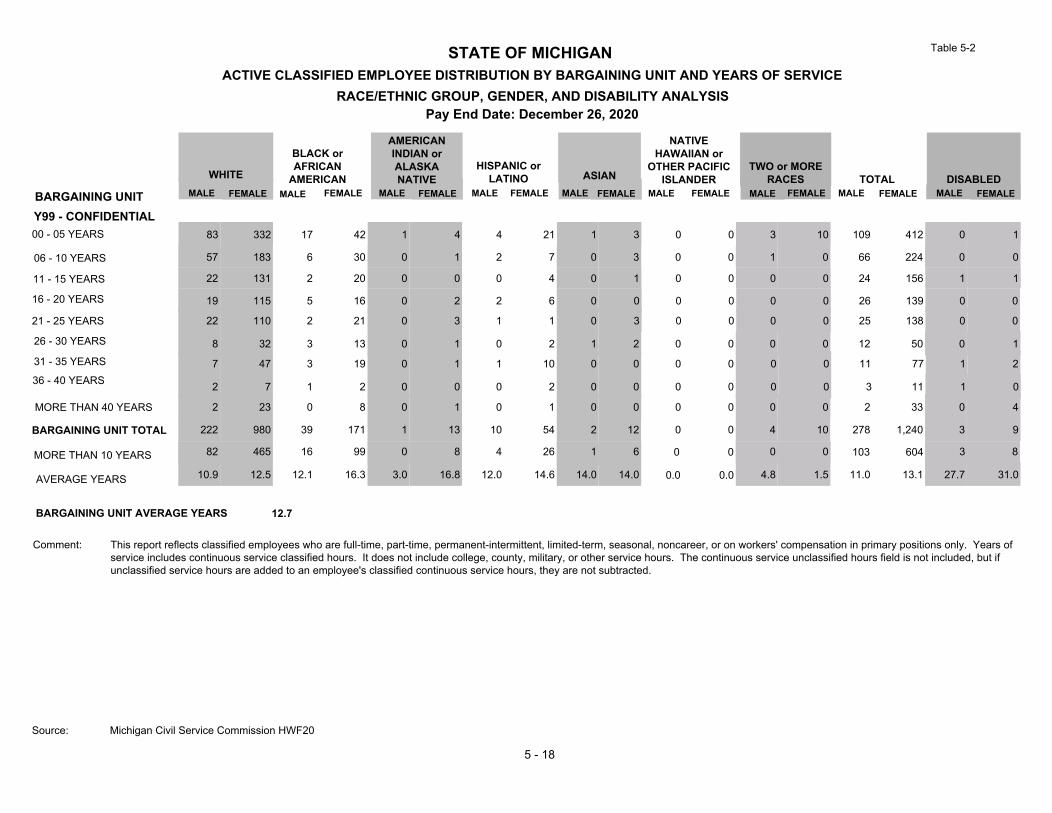
STATE OF MICHIGANACTIVE CLASSIFIED EMPLOYEE DISTRIBUTION BY BARGAINING UNIT AND YEARS OF SERVICE
RACE/ETHNIC GROUP, GENDER, AND DISABILITY ANALYSISPay End Date: December 26, 2020
BARGAINING UNIT FEMALE MALE MALEFEMALE
BLACK orAFRICAN
AMERICANFEMALE
AMERICANINDIAN orALASKANATIVE
HISPANIC orLATINO
MALE FEMALE MALE FEMALE MALE FEMALE MALE FEMALEDISABLED
MALE FEMALE
Table 5-2
22 131 2 20 0 0 0 4 0 1 0 0 0 0 24 156 1 1
10.9 12.5 12.1 16.3 3.0 16.8 12.0 14.6 14.0 14.0 0.0 0.0 4.8 1.5 11.0 13.1 27.7 31.0
82 465 16 99 0 8 4 26 1 6 0 0 3 882 465 16 99 0 8 4 26 1 6 0 0 0 0 103 604 3 8
222 980 39 171 1 13 10 54 2 12 0 0 4 10 278 1,240 3 9
2 23 0 8 0 1 0 1 0 0 0 0 0 0 2 33 0 4
2 7 1 2 0 0 0 2 0 0 0 0 0 0 3 11 1 0
7 47 3 19 0 1 1 10 0 0 0 0 0 0 11 77 1 2
8 32 3 13 0 1 0 2 1 2 0 0 0 0 12 50 0 1
19 115 5 16 0 2 2 6 0 0 0 0 0 0 26 139 0 0
22 110 2 21 0 3 1 1 0 3 0 0 0 0 25 138 0 0
57 183 6 30 0 1 2 7 0 3 0 0 1 0 66 224 0 0
83 332 17 42 1 4 4 21 1 3 0 0 3 10 109 412 0 100 - 05 YEARS
06 - 10 YEARS
11 - 15 YEARS
16 - 20 YEARS
21 - 25 YEARS
26 - 30 YEARS
31 - 35 YEARS
36 - 40 YEARS
MORE THAN 40 YEARS
BARGAINING UNIT TOTAL
MORE THAN 10 YEARS
AVERAGE YEARS
12.7 # # ##BARGAINING UNIT AVERAGE YEARS
Y99 - CONFIDENTIAL
MALE
NATIVEHAWAIIAN or
OTHER PACIFICISLANDER
MALE FEMALE
WHITE ASIANTWO or MORE
RACES TOTAL
Comment:
Michigan Civil Service Commission HWF20Source:
5 - 18
This report reflects classified employees who are full-time, part-time, permanent-intermittent, limited-term, seasonal, noncareer, or on workers' compensation in primary positions only. Years of service includes continuous service classified hours. It does not include college, county, military, or other service hours. The continuous service unclassified hours field is not included, but if unclassified service hours are added to an employee's classified continuous service hours, they are not subtracted.
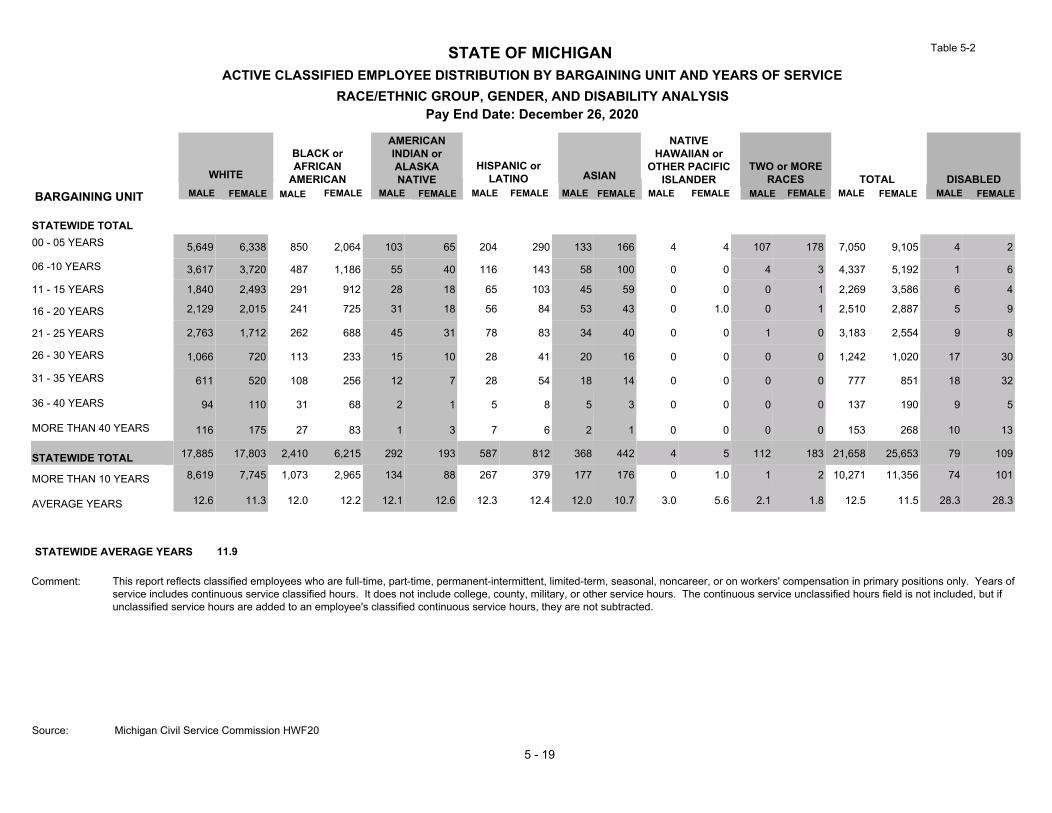
STATE OF MICHIGANACTIVE CLASSIFIED EMPLOYEE DISTRIBUTION BY BARGAINING UNIT AND YEARS OF SERVICE
RACE/ETHNIC GROUP, GENDER, AND DISABILITY ANALYSISPay End Date: December 26, 2020
BARGAINING UNIT FEMALE MALE MALEFEMALE
BLACK orAFRICAN
AMERICANFEMALE
AMERICANINDIAN orALASKANATIVE
HISPANIC orLATINO
MALE FEMALE MALE FEMALE MALE FEMALE MALE FEMALEDISABLED
MALE FEMALE
Table 5-2
12.6 11.3 12.0 12.2 12.1 12.6 12.3 12.4 12.0 10.7 3.0 5.6 2.1 1.8 12.5 11.5 28.3 28.3
8,619 7,745 1,073 2,965 134 88 267 379 177 176 0 1.0 1 2 10,271 11,356 74 101
116 175 27 83 1 3 7 6 2 1 0 0 0 0 153 268 10 13
17,885 17,803 2,410 6,215 292 193 587 812 368 442 4 5 112 183 21,658 25,653 79 109
94 110 31 68 2 1 5 8 5 3 0 0 0 0 137 190 9 5
611 520 108 256 12 7 28 54 18 14 0 0 0 0 777 851 18 32
1,066 720 113 233 15 10 28 41 20 16 0 0 0 0 1,242 1,020 17 30
2,763 1,712 262 688 45 31 78 83 34 40 0 0 1 0 3,183 2,554 9 8
2,129 2,015 241 725 31 18 56 84 53 43 0 1.0 0 1 2,510 2,887 5 9
1,840 2,493 291 912 28 18 65 103 45 59 0 0 0 1 2,269 3,586 6 4
3,617 3,720 487 1,186 55 40 116 143 58 100 0 0 4 3 4,337 5,192 1 6
5,649 6,338 850 2,064 103 65 204 290 133 166 4 4 107 178 7,050 9,105 4 200 - 05 YEARS
06 -10 YEARS
11 - 15 YEARS
16 - 20 YEARS
21 - 25 YEARS
26 - 30 YEARS
31 - 35 YEARS
36 - 40 YEARS
MORE THAN 40 YEARS
STATEWIDE TOTAL
MORE THAN 10 YEARS
AVERAGE YEARS
STATEWIDE AVERAGE YEARS
STATEWIDE TOTAL
MALE
NATIVEHAWAIIAN or
OTHER PACIFICISLANDER
MALE FEMALE
WHITE ASIANTWO or MORE
RACES TOTAL
Comment:
Michigan Civil Service Commission HWF20Source:
5 - 19
11.9
This report reflects classified employees who are full-time, part-time, permanent-intermittent, limited-term, seasonal, noncareer, or on workers' compensation in primary positions only. Years of service includes continuous service classified hours. It does not include college, county, military, or other service hours. The continuous service unclassified hours field is not included, but if unclassified service hours are added to an employee's classified continuous service hours, they are not subtracted.
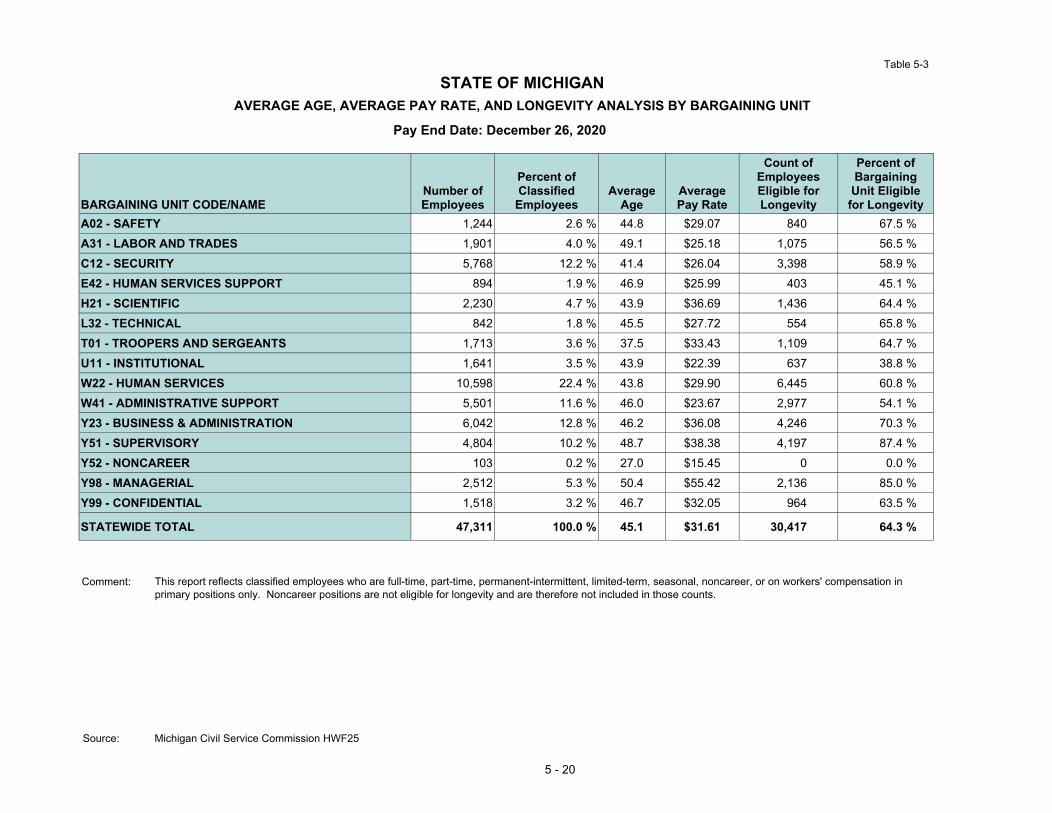
BARGAINING UNIT CODE/NAMENumber ofEmployees
Percent ofClassifiedEmployees
AverageAge
AveragePay Rate
Count ofEmployeesEligible forLongevity
Percent ofBargainingUnit Eligiblefor Longevity
A02 - SAFETY 1,244 2.6 % 44.8 $29.07 840 67.5 %A31 - LABOR AND TRADES 1,901 4.0 % 49.1 $25.18 1,075 56.5 %C12 - SECURITY 5,768 12.2 % 41.4 $26.04 3,398 58.9 %E42 - HUMAN SERVICES SUPPORT 894 1.9 % 46.9 $25.99 403 45.1 %H21 - SCIENTIFIC 2,230 4.7 % 43.9 $36.69 1,436 64.4 %L32 - TECHNICAL 842 1.8 % 45.5 $27.72 554 65.8 %T01 - TROOPERS AND SERGEANTS 1,713 3.6 % 37.5 $33.43 1,109 64.7 %U11 - INSTITUTIONAL 1,641 3.5 % 43.9 $22.39 637 38.8 %W22 - HUMAN SERVICES 10,598 22.4 % 43.8 $29.90 6,445 60.8 %W41 - ADMINISTRATIVE SUPPORT 5,501 11.6 % 46.0 $23.67 2,977 54.1 %Y23 - BUSINESS & ADMINISTRATION 6,042 12.8 % 46.2 $36.08 4,246 70.3 %Y51 - SUPERVISORY 4,804 10.2 % 48.7 $38.38 4,197 87.4 %Y52 - NONCAREER 103 0.2 % 27.0 $15.45 0 0.0 %Y98 - MANAGERIAL 2,512 5.3 % 50.4 $55.42 2,136 85.0 %Y99 - CONFIDENTIAL 1,518 3.2 % 46.7 $32.05 964 63.5 %
STATEWIDE TOTAL 47,311 100.0 % 45.1 $31.61 30,417 64.3 %
AVERAGE AGE, AVERAGE PAY RATE, AND LONGEVITY ANALYSIS BY BARGAINING UNIT
Table 5-3
STATE OF MICHIGAN
Pay End Date: December 26, 2020
5 - 20
Michigan Civil Service Commission HWF25
Comment:
Source:
This report reflects classified employees who are full-time, part-time, permanent-intermittent, limited-term, seasonal, noncareer, or on workers' compensation in primary positions only. Noncareer positions are not eligible for longevity and are therefore not included in those counts.
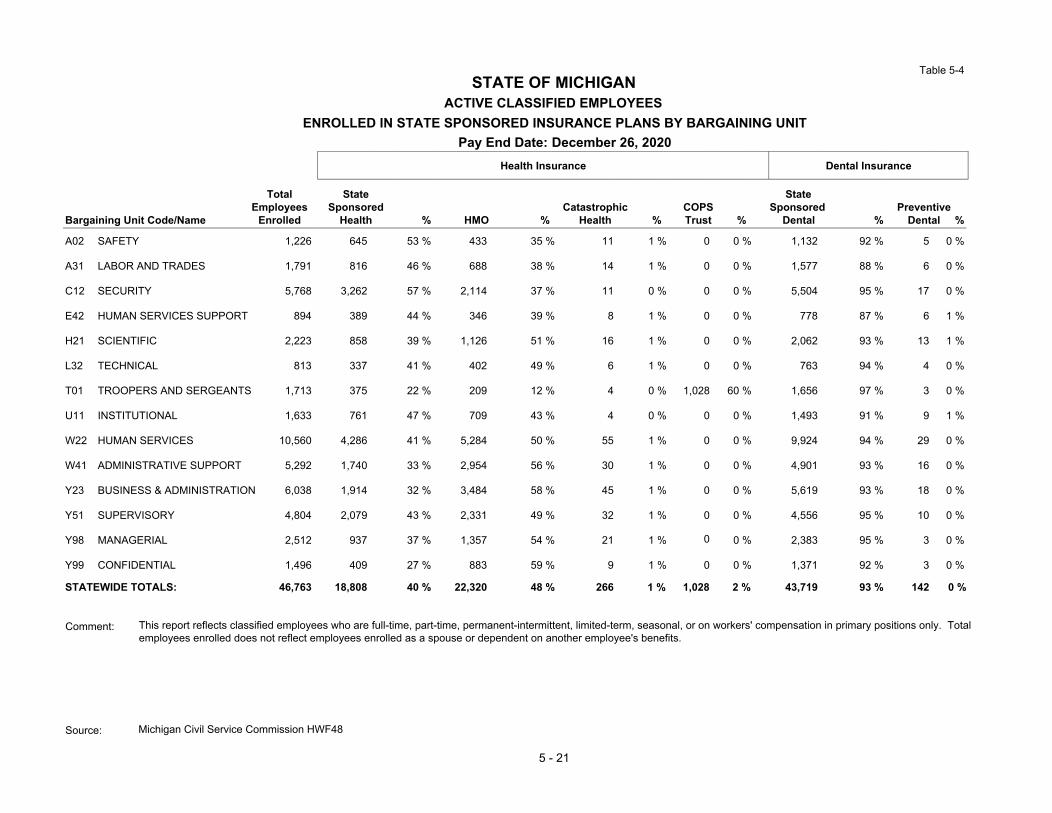
Pay End Date: December 26, 2020Health Insurance Dental Insurance
Bargaining Unit Code/Name
TotalEmployees
Enrolled
StateSponsored
Health % HMO %Catastrophic
Health %COPSTrust %
StateSponsored
Dental %Preventive
Dental
A02 SAFETY 1,226 645 53 % 433 35 % 11 1 % 0 0 % 1,132 92 % 5 0 %
A31 LABOR AND TRADES 1,791 816 46 % 688 38 % 14 1 % 0 0 % 1,577 88 % 6 0 %
C12 SECURITY 5,768 3,262 57 % 2,114 37 % 11 0 % 0 0 % 5,504 95 % 17 0 %
E42 HUMAN SERVICES SUPPORT 894 389 44 % 346 39 % 8 1 % 0 0 % 778 87 % 6 1 %
H21 SCIENTIFIC 2,223 858 39 % 1,126 51 % 16 1 % 0 0 % 2,062 93 % 13 1 %
L32 TECHNICAL 813 337 41 % 402 49 % 6 1 % 0 0 % 763 94 % 4 0 %
T01 TROOPERS AND SERGEANTS 1,713 375 22 % 209 12 % 4 0 % 1,028 60 % 1,656 97 % 3 0 %
U11 INSTITUTIONAL 1,633 761 47 % 709 43 % 4 0 % 0 0 % 1,493 91 % 9 1 %
W22 HUMAN SERVICES 10,560 4,286 41 % 5,284 50 % 55 1 % 0 0 % 9,924 94 % 29 0 %
W41 ADMINISTRATIVE SUPPORT 5,292 1,740 33 % 2,954 56 % 30 1 % 0 0 % 4,901 93 % 16 0 %
Y23 BUSINESS & ADMINISTRATION 6,038 1,914 32 % 3,484 58 % 45 1 % 0 0 % 5,619 93 % 18 0 %
Y51 SUPERVISORY 4,804 2,079 43 % 2,331 49 % 32 1 % 0 0 % 4,556 95 % 10 0 %
Y98 MANAGERIAL 2,512 937 37 % 1,357 54 % 21 1 % 0 0 % 2,383 95 % 3 0 %
Y99 CONFIDENTIAL 1,496 409 27 % 883 59 % 9 1 % 0 0 % 1,371 92 % 3 0 %
STATEWIDE TOTALS: 46,763 18,808 40 % 22,320 48 % 266 1 % 2 % 43,719 93 % 142 0 %
ENROLLED IN STATE SPONSORED INSURANCE PLANS BY BARGAINING UNITACTIVE CLASSIFIED EMPLOYEES
5 - 21
Comment: This report reflects classified employees who are full-time, part-time, permanent-intermittent, limited-term, seasonal, or on workers' compensation in primary positions only. Total employees enrolled does not reflect employees enrolled as a spouse or dependent on another employee's benefits.
Source:
1,028
Michigan Civil Service Commission HWF48
%
STATE OF MICHIGANTable 5-4
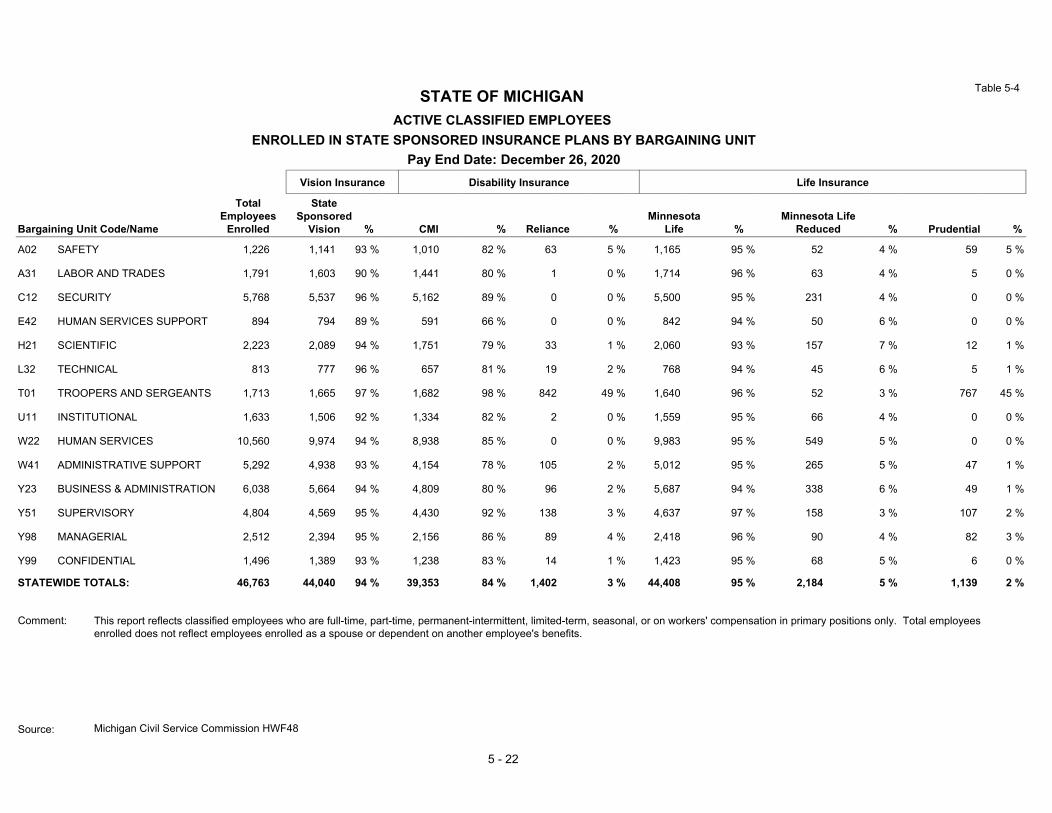
Pay End Date: December 26, 2020Vision Insurance Disability Insurance Life Insurance
Bargaining Unit Code/Name
TotalEmployees
Enrolled
StateSponsored
Vision % CMI % Reliance %Minnesota
Life %Minnesota Life
Reduced % Prudential %
A02 SAFETY 1,226 1,141 93 % 1,010 82 % 63 5 % 1,165 95 % 52 4 % 59 5 %
A31 LABOR AND TRADES 1,791 1,603 90 % 1,441 80 % 1 0 % 1,714 96 % 63 4 % 5 0 %
C12 SECURITY 5,768 5,537 96 % 5,162 89 % 0 0 % 5,500 95 % 231 4 % 0 0 %
E42 HUMAN SERVICES SUPPORT 894 794 89 % 591 66 % 0 0 % 842 94 % 50 6 % 0 0 %
H21 SCIENTIFIC 2,223 2,089 94 % 1,751 79 % 33 1 % 2,060 93 % 157 7 % 12 1 %
L32 TECHNICAL 813 777 96 % 657 81 % 19 2 % 768 94 % 45 6 % 5 1 %
T01 TROOPERS AND SERGEANTS 1,713 1,665 97 % 1,682 98 % 842 49 % 1,640 96 % 52 3 % 767 45 %
U11 INSTITUTIONAL 1,633 1,506 92 % 1,334 82 % 2 0 % 1,559 95 % 66 4 % 0 0 %
W22 HUMAN SERVICES 10,560 9,974 94 % 8,938 85 % 0 0 % 9,983 95 % 549 5 % 0 0 %
W41 ADMINISTRATIVE SUPPORT 5,292 4,938 93 % 4,154 78 % 105 2 % 5,012 95 % 265 5 % 47 1 %
Y23 BUSINESS & ADMINISTRATION 6,038 5,664 94 % 4,809 80 % 96 2 % 5,687 94 % 338 6 % 49 1 %
Y51 SUPERVISORY 4,804 4,569 95 % 4,430 92 % 138 3 % 4,637 97 % 158 3 % 107 2 %
Y98 MANAGERIAL 2,512 2,394 95 % 2,156 86 % 89 4 % 2,418 96 % 90 4 % 82 3 %
Y99 CONFIDENTIAL 1,496 1,389 93 % 1,238 83 % 14 1 % 1,423 95 % 68 5 % 6 0 %
STATEWIDE TOTALS: 46,763 44,040 94 % 39,353 84 % 1,402 3 % 44,408 95 % 2,184 5 % 1,139 2 %
ENROLLED IN STATE SPONSORED INSURANCE PLANS BY BARGAINING UNITACTIVE CLASSIFIED EMPLOYEES
5 - 22
Comment: This report reflects classified employees who are full-time, part-time, permanent-intermittent, limited-term, seasonal, or on workers' compensation in primary positions only. Total employees enrolled does not reflect employees enrolled as a spouse or dependent on another employee's benefits.
Source: Michigan Civil Service Commission HWF48
STATE OF MICHIGAN Table 5-4
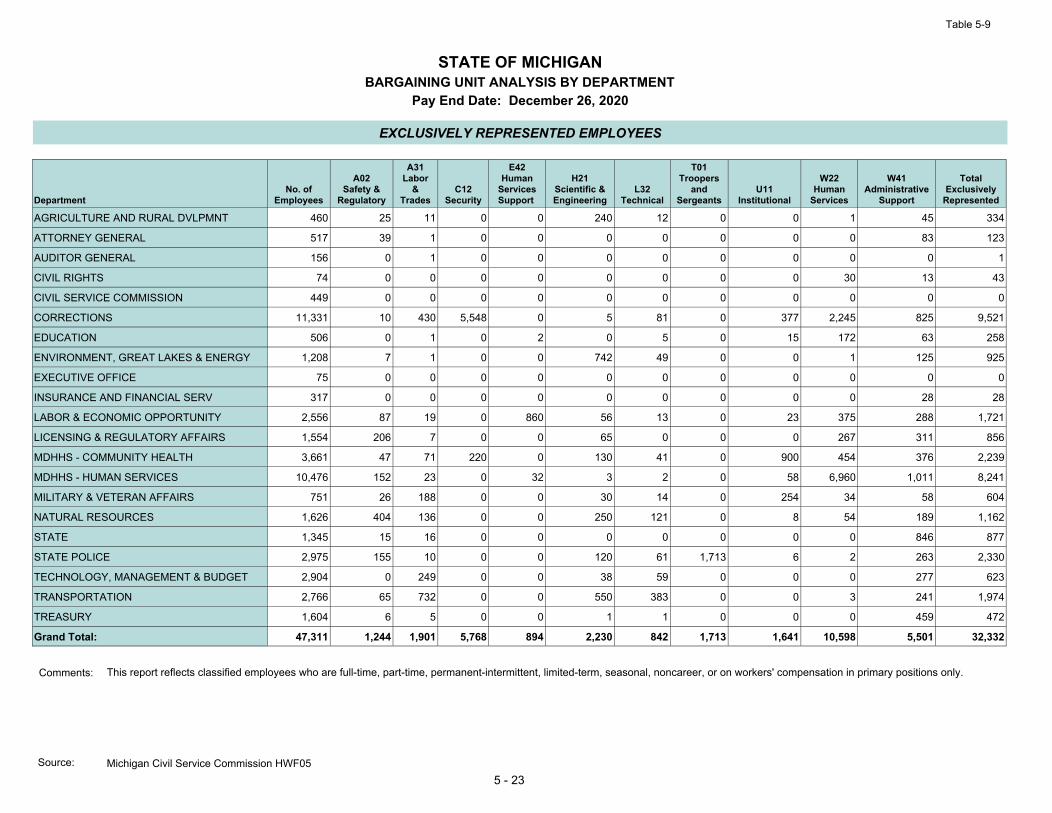
Table 5-9
DepartmentNo. of
Employees
A02Safety &
Regulatory
A31Labor
&Trades
C12Security
E42Human
ServicesSupport
H21Scientific &Engineering
L32Technical
T01Troopers
andSergeants
U11Institutional
W22Human
Services
W41Administrative
Support
TotalExclusively
Represented
AGRICULTURE AND RURAL DVLPMNT 460 25 11 0 0 240 12 0 0 1 45 334
ATTORNEY GENERAL 517 39 1 0 0 0 0 0 0 0 83 123
AUDITOR GENERAL 156 0 1 0 0 0 0 0 0 0 0 1
CIVIL RIGHTS 74 0 0 0 0 0 0 0 0 30 13 43
CIVIL SERVICE COMMISSION 449 0 0 0 0 0 0 0 0 0 0 0
CORRECTIONS 11,331 10 430 5,548 0 5 81 0 377 2,245 825 9,521
EDUCATION 506 0 1 0 2 0 5 0 15 172 63 258
ENVIRONMENT, GREAT LAKES & ENERGY 1,208 7 1 0 0 742 49 0 0 1 125 925
EXECUTIVE OFFICE 75 0 0 0 0 0 0 0 0 0 0 0
INSURANCE AND FINANCIAL SERV 317 0 0 0 0 0 0 0 0 0 28 28
LABOR & ECONOMIC OPPORTUNITY 2,556 87 19 0 860 56 13 0 23 375 288 1,721
LICENSING & REGULATORY AFFAIRS 1,554 206 7 0 0 65 0 0 0 267 311 856
MDHHS - COMMUNITY HEALTH 3,661 47 71 220 0 130 41 0 900 454 376 2,239
MDHHS - HUMAN SERVICES 10,476 152 23 0 32 3 2 0 58 6,960 1,011 8,241
MILITARY & VETERAN AFFAIRS 751 26 188 0 0 30 14 0 254 34 58 604
NATURAL RESOURCES 1,626 404 136 0 0 250 121 0 8 54 189 1,162
STATE 1,345 15 16 0 0 0 0 0 0 0 846 877
STATE POLICE 2,975 155 10 0 0 120 61 1,713 6 2 263 2,330
TECHNOLOGY, MANAGEMENT & BUDGET 2,904 0 249 0 0 38 59 0 0 0 277 623
TRANSPORTATION 2,766 65 732 0 0 550 383 0 0 3 241 1,974
TREASURY 1,604 6 5 0 0 1 1 0 0 0 459 472
Grand Total: 47,311 1,244 1,901 5,768 894 2,230 842 1,713 1,641 10,598 5,501 32,332
BARGAINING UNIT ANALYSIS BY DEPARTMENTPay End Date: December 26, 2020
EXCLUSIVELY REPRESENTED EMPLOYEES
STATE OF MICHIGAN
5 - 23Michigan Civil Service Commission HWF05
Comments:
Source:
This report reflects classified employees who are full-time, part-time, permanent-intermittent, limited-term, seasonal, noncareer, or on workers' compensation in primary positions only.

Table 5-10
DepartmentNo. of
Employees
Y23 Business &
Administrative Y99
ConfidentialY98
Managerial Y52 Non-
Career
Y00/Y50Pending
AssignmentY51
Supervisory
Total Non-Exclusively
RepresentedAGRICULTURE AND RURAL DVLPMNT 460 47 9 23 6 0 41 126
ATTORNEY GENERAL 517 14 44 330 0 0 6 394
AUDITOR GENERAL 156 1 94 42 2 0 16 155
CIVIL RIGHTS 74 3 12 9 0 0 7 31
CIVIL SERVICE COMMISSION 449 1 385 57 0 0 6 449
CORRECTIONS 11,331 242 119 126 2 0 1,321 1,810
EDUCATION 506 133 19 55 1 0 40 248
ENVIRONMENT, GREAT LAKES & ENERGY 1,208 75 12 79 6 0 111 283
EXECUTIVE OFFICE 75 0 74 1 0 0 0 75
INSURANCE AND FINANCIAL SERV 317 176 21 27 6 0 59 289
LABOR & ECONOMIC OPPORTUNITY 2,556 464 44 196 2 0 129 835
LICENSING & REGULATORY AFFAIRS 1,554 438 45 157 7 0 51 698
MDHHS - COMMUNITY HEALTH 3,661 640 100 274 8 0 400 1,422
MDHHS - HUMAN SERVICES 10,476 662 178 203 1 0 1,191 2,235
MILITARY & VETERAN AFFAIRS 751 42 7 36 0 0 62 147
NATURAL RESOURCES 1,626 129 19 85 2 0 229 464
STATE 1,345 140 52 56 0 0 220 468
STATE POLICE 2,975 227 38 143 5 0 232 645
TECHNOLOGY, MANAGEMENT & BUDGET 2,904 1,597 109 305 45 0 225 2,281
TRANSPORTATION 2,766 254 96 131 4 0 307 792
TREASURY 1,604 757 41 177 6 0 151 1,132
Grand Total: 47,311 6,042 1,518 2,512 103 0 4,804 14,979
BARGAINING UNIT ANALYSIS BY DEPARTMENT
NON-EXCLUSIVELY REPRESENTED EMPLOYEES
Pay End Date: December 26, 2020
STATE OF MICHIGAN
5 - 24
This report reflects classified employees who are full-time, part-time, permanent-intermittent, limited-term, seasonal, noncareer, or on workers' compensation in primary positions only.Comments:
Source: Michigan Civil Service Commission HWF06

GLOSSARY
G - 1
GLOSSARY
American Indian or Alaska Native (Not Hispanic or Latino). Persons having origins in any of the original peoples of North and South America (including Central America), and who maintain tribal
af f iliation or community attachment. This def inition is provided by the US Equal Employment Oppo rtunity Commission for federal reporting requirements.
Asian (Not Hispanic or Latino). Persons having origins in any of the original peoples of the Far East, Southeast Asia, or the Indian Subcontinent, including, for example, Cambodia, China, India, Japan, Korea, Malaysia, Pakistan, the Philippine Islands, Thailand, and Vietnam. This def inition is provided by
the US Equal Employment Opportunity Commission for federal reporting requirements. Average. The f igure obtained by dividing the total of a set of data by the number of f igures in the set of
data. In this report, average is used synonymously with mean. Black or African American (Not Hispanic or Latino). Persons having origins in any of the black racial
groups of Africa. This def inition is provided by the US Equal Employment Opportunity Commission for federal reporting requirements.
Career Appointment. An indef inite appointment or limited-term appointment expected to last the equivalent of 90 full-time workdays or more in a calendar year.
Classified Employees. Employees of the State of Michigan over which the Civil Service Commission has jurisdiction pursuant to the State Constitution.
Classified Service. The Michigan State classif ied civil service. Compensation. Pay and benef its received by an employee for work performed.
Employee Status Code Descriptions (active employees):
AA: Full-time (Classif ied) AB: Part-time (Classif ied) AC: Permanent-Intermittent (Classif ied)
AD: Limited-Term (Classif ied) AE: Seasonal (Classif ied) AF: Unclassif ied
AP: Workers Compensation AQ: Noncareer/Per Diem AR: Special Personal Services (Not Classif ied)
Fiscal Year. October 1 of a given year through September 30 of the next year. Before f iscal year 1975-76, the f iscal year was July 1 to June 30. Transition f iscal year 1975-76 was 15 months long.
Full-Time Employees. Employees scheduled to work 80 hours b iweekly.
Hispanic or Latino. Persons of Cuban, Mexican, Puerto Rican, South or Central American, or other Spanish culture or origin regardless of race. This def inition is provided by the US Equal Employment Opportunity Commission for federal reporting requirements.
HRMN. Human Resources Management Network (HRMN) is the integrated network delivering payroll, human resources, and employee benef its functionality and data exchange among agencies and third
parties. Stage I of HRMN implementation in March 2001 replaced PPRISM. Indefinite Appointment. A career appointment with no f ixed ending date at the time of appointment.
Job Category. Eight standard job categories f rom the Federal Equal Employment Opportunity Commission, used by state and local governments in reporting statistics to the federal government. These
are as follows:
G - 2
01: Officials and Administrators. Occupations in which employees set broad policies, exercise
overall responsibility for execution of these policies, or direct individual departments or special phases
of the agency’s operations, or provide specialized consultation on a regional, district or area basis.
Includes: department heads; bureau chiefs; division chiefs; directors; deputy directors; controllers;
wardens; superintendents; sherif fs; police and f ire chiefs and inspectors; examiners (bank, hearing,
motor vehicle, warehouse); inspectors (construction, building, safety, rent-and-housing, f ire, A.B.C.
Board, license, dairy, livestock, transportation); assessors; tax appraisers and investigators; coroners;
farm managers; and kindred workers.
02: Professionals. Occupations which require specialized and theoretical knowledge which is usually
acquired through college training or through work experience and other training which provides
comparable knowledge. Includes: personnel and labor relations workers, social workers, doctors,
psychologists, registered nurses, economists, dietitians, lawyers, systems analysts, accountants,
engineers, employment and vocational rehabilitation counselors, teachers or instructors, police and
f ire captains and lieutenants, librarians, management analysts, airplane pilots and navig ators,
surveyors and mapping scientists, and kindred workers.
03: Technicians. Occupations which require a combination of basic scientif ic or technical knowledge
and manual skill which can be obtained through specialized post -secondary school education or
through equivalent on-the-job training. Includes: computer programmers; draf ters; survey and
mapping technicians; licensed practical nurses; photographers; radio operators; technical illustrators;
highway technicians; technicians (medical, dental, electronic, physical sciences); police and f ire ser-
geants; inspectors (production or processing inspectors, testers and weighers); and kindred workers.
04: Protective Service Workers. Occupations in which workers are entrusted with public safety,
security, and protection f rom destructive forces. Includes: police patrol of ficers, f ire f ighters , guards,
deputy sherif fs, bailif fs, correctional of f icers, detectives, marshals, harbor patrol of f icers, game and
f ish wardens, park rangers (except maintenance), and kindred workers.
05: Paraprofessionals. Occupations in which workers perform some of the duties of a professional
or technician in a supportive role, which usually require less formal training and/or experience
normally required for professional or technical status. Such positions may fall within an identif ied
pattern of staf f development and promotion under a “New Careers” concept. Included: research
assistants, medical aids, child support workers, policy auxiliary welfare service aids, recreation
assistants, homemakers aides, home health aides, library assistants and clerks, ambulance drivers
and attendants, and kindred workers.
06: Office and Clerical. Occupations in which workers are responsible for internal and external
communication, recording and retrieval of data and/or information, and other paperwork required in
an of f ice. Includes: bookkeepers, messengers, clerk-typists, stenographers, court transcribers,
hearing reporters, statistical clerks, dispatchers, license distributors, payroll clerks, of f ice machine
and computer operators, telephone operators, legal assistants, sales workers, cashiers, toll
collectors, and kindred workers.
07: Skilled Craft Workers. Occupations in which workers perform jobs which require special manual
skill and a thorough and comprehensive knowledge of the processes involved in the work which is
acquired through on-the-job training and experience or through apprenticeship or other formal training
programs. Includes: mechanics and repairers, electricians, heavy equipment operators, stationary
engineers, skilled machining occupations, carpenters, compos itors and typesetters, power plant
operators, water and sewage treatment plant operators, and kindred workers.
08: Service/Maintenance Workers. Occupations in which workers perf orm duties which result in or
contribute to the comfort, convenience, hygiene or safety of the general public or which contribute to
the upkeep and care of buildings, facilities or grounds of public property. Workers in this group may
operate machinery. Includes: chauf feurs, laundry and dry cleaning operatives, truck drivers, bus
drivers, garage laborers, custodial employees, gardeners and groundskeepers, refuse collectors,
construction laborers, park rangers (maintenance), farm workers (except managers), c raf t
apprentices/trainees/helpers, and kindred workers.
G - 3
Job-Share Employees. Employees scheduled to share a portion of an 80-hour biweekly schedule with
one or more other positions that in aggregate perform the duties of a single full -time position. Limited-Term Employees. Employees hired with a f ixed appointment expirat ion date. These employees
are entitled to f ringe benef its providing they meet specif ied eligibility requirements. MAIN (Michigan Administrative Information Network). Established in 1992 to develop, implement, and
operate a fully integrated, automated administrative management information system for the State of Michigan.
Native Hawaiian or Other Pacific Islander (Not Hispanic or Latino). Persons having origins in any of the original peoples of Hawaii, Guam, Samoa, or other Pacif ic Islands. This def inition is provided by the US Equal Employment Opportunity Commission for federal reporting requirements.
Noncareer Employees. Employees hired on a noncareer basis to work 719 hours or less in a calendar year. These employees are not entitled to f ringe benef its.
Permanent-Intermittent Employees. Employees scheduled to work on an on-call or periodic basis due to demand and workf low. These employees may work an hourly or full-time schedule within an 80-hour
biweekly pay period. Position. A classif ied job identified by its respective duties and responsibilities.
Primary Position. The level one position in HRMN which determines the employee’s status and benef its eligibility.
Principal Department. One of not more than 20 executive branch departments provided for by article 5, section 2, of the Michigan Constitution.
Process Level. A HRMN term that represents principal department, autonomous entity, or agency of convenience.
Seasonal Employees. Employees scheduled to work according to seasonal department work schedules. These employees may work 80 hours biweekly during certain periods of the year.
Special Personal Services Employees. Contractors who are employees of state agencies and who are not classif ied, exempt, or excepted.
Two or More Races (Not Hispanic or Latino) – Persons who identify with more than one of the six races. This def inition is provided by the US Equal Employment Opportunity Commission for federal
reporting requirements. Unclassified Employees. Employees working in positions exempted or excepted f rom the classif ied
service pursuant to the State Constitution (e.g., elected of f icials, heads of principal departments, members of boards and commissions, employees of the legislature, employees of courts of record, etc.).
Unit Designations. A combination of union and unit codes is assigned to each classif ied position. The union code identif ies the employee organization that by election process has won recognition as the exclusive bargaining agent for the unit. The unit code represents a particular grouping of job
classif ications having related duties as established by the def inition of the unit. Generally, most positions in a class will have the same unit code. However, the nature of some positions will require their exclusion f rom the unit. In instances where this exclusion occurs, secondary class codes have been established t o
accommodate those positions excluded f rom the unit. Following are def initions of Union and Unit Codes:
G - 4
Union Codes
A Michigan State Employees Association (MSEA)
C Michigan Corrections Organization (MCO)
E Michigan Public Employees (MPE), SEIU Local 517M
H Michigan Public Employees (MPE), SEIU Local 517M
L Michigan Public Employees (MPE), SEIU Local 517M
T Michigan State Police Troopers Association (MSPTA)
U American Federation of State, County, and Municipal Employees, Council 25, AFL-CIO (AFSCME)
W United Automobile, Aerospace, and Agricultural Implement Workers of America (UAW)
Y No Exclusive Employee Organization Representation
Z Unclassif ied (No Exclusive Employee Organization)
Unit Codes
Code Unit
01 Troopers and Sergeants Unit This unit consists of all non-supervisory enlisted positions, including sergeants, in the Michigan
State Police.
02 Safety and Regulatory Unit Employees in this unit are involved in one or more of the following activities: conducting
inspections or investigations designed to detect violations of federal or state statutes, rules, regulations; enforcing these statutes, rules, or regulations; appraising the grade, condition, or sanitation of food, objects, activities, or procedures; protection of person, buildings, grounds, or
natural resources.
11 Institutional Unit
This unit includes all non-professional classif ications, which provide indirect or direct services to patients or residents of state facilities, excluding correctional security classif ications.
12 Security Unit The Security Unit includes non-professional employees involved in direct custody and treatment of inmates under the supervision of the Department of Corrections and residents of
state facilities for the criminally insane.
21 Scientific and Engineering Unit
Employees in this unit perform work in the areas of physical and biological sciences or in the f ield of engineering or architecture through applying principles, theories, practices, and methods generally learned through a four-year or advanced post-secondary course of study.
22 Human Services Unit Employees in this unit perform work in the areas of counseling, education, rehabilitation, and
other assistance for the socially disabled or disadvantaged through ap plying principles, theories, practices, and methods learned through educational degrees, special training and experience.
23 Business and Administrative Unit Employees in this unit perform work in such areas as personnel, accounting, training, auditing ,
commercial, and business f ields, information, and other f ields related to business, commerc ial, and administrative support, through applying principles, theories, practices, and methods learned through educational degrees, special training and experience.
31 Labor and Trades Unit
Employees in this unit perform skilled and semi-skilled trades work as well as general labor
activities.
G - 5
32 Technical Unit
Employees in this unit provide support services in the area of science and engineering.
41 Administrative Support Unit
This unit includes all occupational groupings engaged in preparing, transcribing, recording, f iling, systematizing, maintaining, and routinely dispensing of records, reports, communications, and information by manual process and by operating various of f ice machines
and equipment. Also, this unit includes employees who use work products f rom clerical classif ications and exercise judgment in the application of statutes, rules, regulations, or policies including positions supporting business and administrative activities.
42 Human Services Support Unit
This unit consists of classifications engaged in delivery of paraprofessional human serv ices to
the citizens of the State.
50 Pending Unit Assignment
Employees in positions in classif ications that are pending unit assignment.
51 Supervisory Unit
Employees in this unit have the authority to hire, assign, transfer, discipline for cause, lay of f , recall, promote, reallocate, or evaluate other employees, or responsibility to direct them, or to adjust their grievances, or ef fectively recommend such actions if in connection with the
foregoing. The exercise of such authority is not of a merely routine or clerical nature, but rather requires the use of independent judgment.
52 Noncareer Employees in noncareer classes that are ineligible for collective bargaining.
98 Managerial Unit The Managerial Unit is made up of employees who: (a) formulate policy, direct the work of an
agency or major subdivision thereof ; or (b) who administer and carry out policies and programs
of such principal departments or subdivisions; or manage, administer, and control local b ranc h of f ices of principal departments, including the physical, f inancial, and/or personnel resources thereof , in order to carry out the mission of the agency; or (c) represent or advise management
in legal matters; or (d) adjudicate disputes involving employees or mediate labor management relations in the public or private sector; or (e) who may reasonably be required on behalf of the State Employer or the departmental employer to assist in the preparation for conduct of
negotiations with employees; or (f ) have a major role in personnel administration labor relations, or the preparation and administration of budgets at the cent ral level of state government, or for a principal department or major subdivision thereof .
99 Confidential Unit Conf idential employees are those who assist in a conf idence capacity, persons who
(a) formulate policy, direct the work of an agency or major subdivision thereof ; or (b) who may reasonably be required on behalf of the State Employer or the Departmental Employer to assist in the preparation for conduct of negotiations with employees; or (c) have a major role in
personnel administration labor relations, or the preparation and administration of budgets at the central level of state government, or for a principal department or major subdivision thereof .
White (Not Hispanic or Latino). Persons having origins in any of the original peoples of Europe, the Middle East, or North Africa. This def inition is provided by the US Equal Employment Opportunity Commission for federal reporting requirements.
Workforce. Those persons employed in the classif ied service by the state of Michigan.
Related Documents