Fishery Management Report No. 14-22 Annual Summary of the Commercial Salmon Fisheries and Salmon Escapements in the Alaska Peninsula, Aleutian Islands, and Atka-Amlia Islands Management Areas, 2013 by Dawn M. Wilburn May 2014 Alaska Department of Fish and Game Divisions of Sport Fish and Commercial Fisheries

Welcome message from author
This document is posted to help you gain knowledge. Please leave a comment to let me know what you think about it! Share it to your friends and learn new things together.
Transcript

Fishery Management Report No. 14-22
Annual Summary of the Commercial Salmon Fisheries and Salmon Escapements in the Alaska Peninsula, Aleutian Islands, and Atka-Amlia Islands Management Areas, 2013
by
Dawn M. Wilburn
May 2014
Alaska Department of Fish and Game Divisions of Sport Fish and Commercial Fisheries

Symbols and Abbreviations The following symbols and abbreviations, and others approved for the Système International d'Unités (SI), are used without definition in the following reports by the Divisions of Sport Fish and of Commercial Fisheries: Fishery Manuscripts, Fishery Data Series Reports, Fishery Management Reports, and Special Publications. All others, including deviations from definitions listed below, are noted in the text at first mention, as well as in the titles or footnotes of tables, and in figure or figure captions. Weights and measures (metric) centimeter cm deciliter dL gram g hectare ha kilogram kg kilometer km liter L meter m milliliter mL millimeter mm Weights and measures (English) cubic feet per second ft3/s foot ft gallon gal inch in mile mi nautical mile nmi ounce oz pound lb quart qt yard yd Time and temperature day d degrees Celsius °C degrees Fahrenheit °F degrees kelvin K hour h minute min second s Physics and chemistry all atomic symbols alternating current AC ampere A calorie cal direct current DC hertz Hz horsepower hp hydrogen ion activity pH (negative log of) parts per million ppm parts per thousand ppt, ‰ volts V watts W
General Alaska Administrative Code AAC all commonly accepted abbreviations e.g., Mr., Mrs.,
AM, PM, etc. all commonly accepted professional titles e.g., Dr., Ph.D., R.N., etc. at @ compass directions:
east E north N south S west W
copyright corporate suffixes:
Company Co. Corporation Corp. Incorporated Inc. Limited Ltd.
District of Columbia D.C. et alii (and others) et al. et cetera (and so forth) etc. exempli gratia (for example) e.g. Federal Information Code FIC id est (that is) i.e. latitude or longitude lat. or long. monetary symbols (U.S.) $, ¢ months (tables and figures): first three letters Jan,...,Dec registered trademark trademark United States (adjective) U.S. United States of America (noun) USA U.S.C. United States
Code U.S. state use two-letter
abbreviations (e.g., AK, WA)
Mathematics, statistics all standard mathematical signs, symbols and abbreviations alternate hypothesis HA base of natural logarithm e catch per unit effort CPUE coefficient of variation CV common test statistics (F, t, χ2, etc.) confidence interval CI correlation coefficient (multiple) R correlation coefficient (simple) r covariance cov degree (angular ) ° degrees of freedom df expected value E greater than > greater than or equal to ≥ harvest per unit effort HPUE less than < less than or equal to ≤ logarithm (natural) ln logarithm (base 10) log logarithm (specify base) log2, etc. minute (angular) ' not significant NS null hypothesis HO percent % probability P probability of a type I error (rejection of the null hypothesis when true) α probability of a type II error (acceptance of the null hypothesis when false) β second (angular) " standard deviation SD standard error SE variance population Var sample var

FISHERY MANAGEMENT REPORT NO. 14-22
ANNUAL SUMMARY OF THE COMMERCIAL SALMON FISHERIES AND SALMON ESCAPEMENTS IN THE ALASKA PENINSULA,
ALEUTIAN ISLANDS, AND ATKA-AMLIA ISLANDS MANAGEMENT AREAS, 2013
by
Dawn M. Wilburn Alaska Department of Fish and Game, Division of Commercial Fisheries, Kodiak
Alaska Department of Fish and Game Division of Sport Fish, Research and Technical Services 333 Raspberry Road, Anchorage, Alaska, 99518-1565
May 2014

The Fishery Management Reports series was established in 1989 by the Division of Sport Fish for the publication of an overview of management activities and goals in a specific geographic area, and became a joint divisional series in 2004 with the Division of Commercial Fisheries. Fishery Management Reports are intended for fishery and other technical professionals, as well as lay persons. Fishery Management Reports are available through the Alaska State Library and on the Internet: http://www.adfg.alaska.gov/sf/publications/. This publication has undergone regional peer review.
Dawn M. Wilburn Alaska Department of Fish and Game, Division of Commercial Fisheries,
351 Research Court, Kodiak, AK 99615, USA
This document should be cited as: Wilburn, D. M. 2014. Annual summary of the commercial salmon fisheries and salmon escapements in the Alaska
Peninsula, Aleutian Islands, and Atka-Amlia Islands Management Areas, 2013. Alaska Department of Fish and Game, Fishery Management Report No. 14-22, Anchorage.
The Alaska Department of Fish and Game (ADF&G) administers all programs and activities free from discrimination based on race, color, national origin, age, sex, religion, marital status, pregnancy, parenthood, or disability. The department administers all programs and activities in compliance with Title VI of the Civil Rights Act of 1964, Section 504 of the Rehabilitation Act of 1973, Title II of the Americans with Disabilities Act (ADA) of 1990, the Age Discrimination Act of 1975, and Title IX of the Education Amendments of 1972.
If you believe you have been discriminated against in any program, activity, or facility please write: ADF&G ADA Coordinator, P.O. Box 115526, Juneau, AK 99811-5526
U.S. Fish and Wildlife Service, 4401 N. Fairfax Drive, MS 2042, Arlington, VA 22203 Office of Equal Opportunity, U.S. Department of the Interior, 1849 C Street NW MS 5230, Washington DC 20240
The department’s ADA Coordinator can be reached via phone at the following numbers: (VOICE) 907-465-6077, (Statewide Telecommunication Device for the Deaf) 1-800-478-3648,
(Juneau TDD) 907-465-3646, or (FAX) 907-465-6078 For information on alternative formats and questions on this publication, please contact:
ADF&G Division of Sport Fish, Research and Technical Services, 333 Raspberry Road, Anchorage AK 99518 (907) 267-2375.

TABLE OF CONTENTS Page
LIST OF FIGURES ........................................................................................................................................................ i
LIST OF APPENDICES ............................................................................................................................................... ii
ABSTRACT .................................................................................................................................................................. 1
INTRODUCTION ......................................................................................................................................................... 1
COMMERCIAL FISHERIES ....................................................................................................................................... 2
Exvessel Value .............................................................................................................................................................. 3 Harvest ........................................................................................................................................................................... 3 ESCAPEMENT ............................................................................................................................................................. 4
REFERENCES CITED ................................................................................................................................................. 7
FIGURES ...................................................................................................................................................................... 9
APPENDIX A. FISHERY ECONOMIC AND GEOGRAPHIC DATA ..................................................................... 25
APPENDIX B. COMMERCIAL HARVEST DATA ................................................................................................. 41
APPENDIX C. ESCAPEMENT DATA ...................................................................................................................... 63
APPENDIX D. METHOD FOR CALCULATING INDEXED TOTAL ESCAPEMENT ......................................... 69
APPENDIX E. FIELD PERSONNEL ......................................................................................................................... 71
LIST OF FIGURES Figure Page 1. Map of the Aleutian Islands, Atka-Amlia Islands, and Alaska Peninsula Management areas. ..................... 10 2. Map of the Alaska Peninsula ADF&G weir and regional office locations. ................................................... 11 3. Map of South Alaska Peninsula commercial salmon fishing districts. .......................................................... 12 4. Map of Nelson Lagoon to Cape Menshikof, showing commercial salmon fishing sections, season
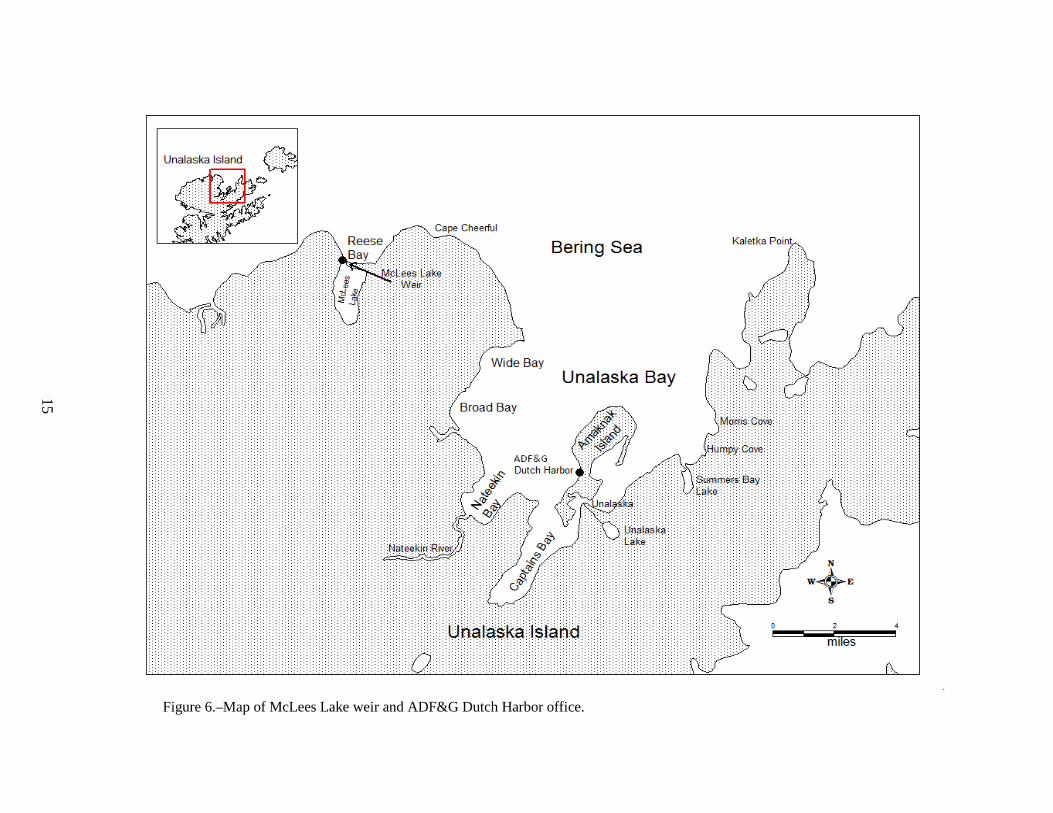
opening dates, area M and T overlap and major sockeye salmon systems. ................................................... 13 5. Map of Unalaska and Akutan commercial salmon fishing districts and sections. ......................................... 14 6. Map of McLees Lake weir and ADF&G Dutch Harbor office. ..................................................................... 15 7. The combined Alaska Peninsula, Aleutian Islands, and Atka-Amlia Islands areas harvest of Chinook
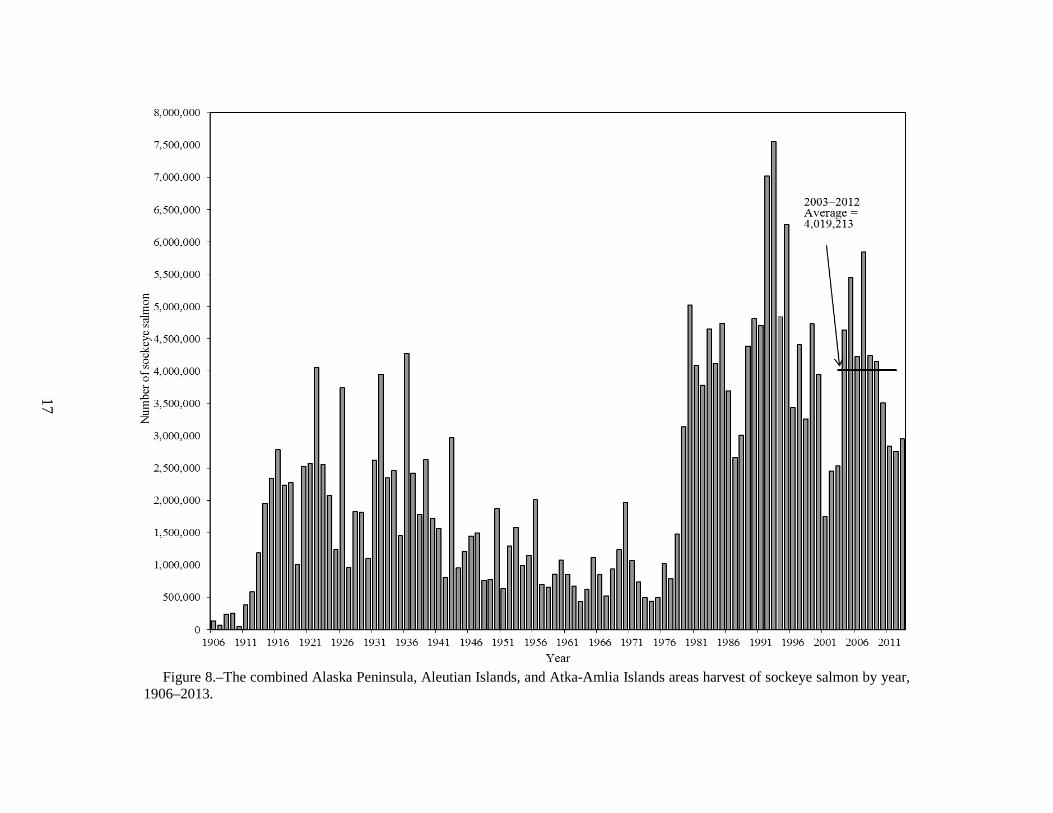
salmon by year, 1906–2013. .......................................................................................................................... 16 8. The combined Alaska Peninsula, Aleutian Islands, and Atka-Amlia Islands areas harvest of sockeye
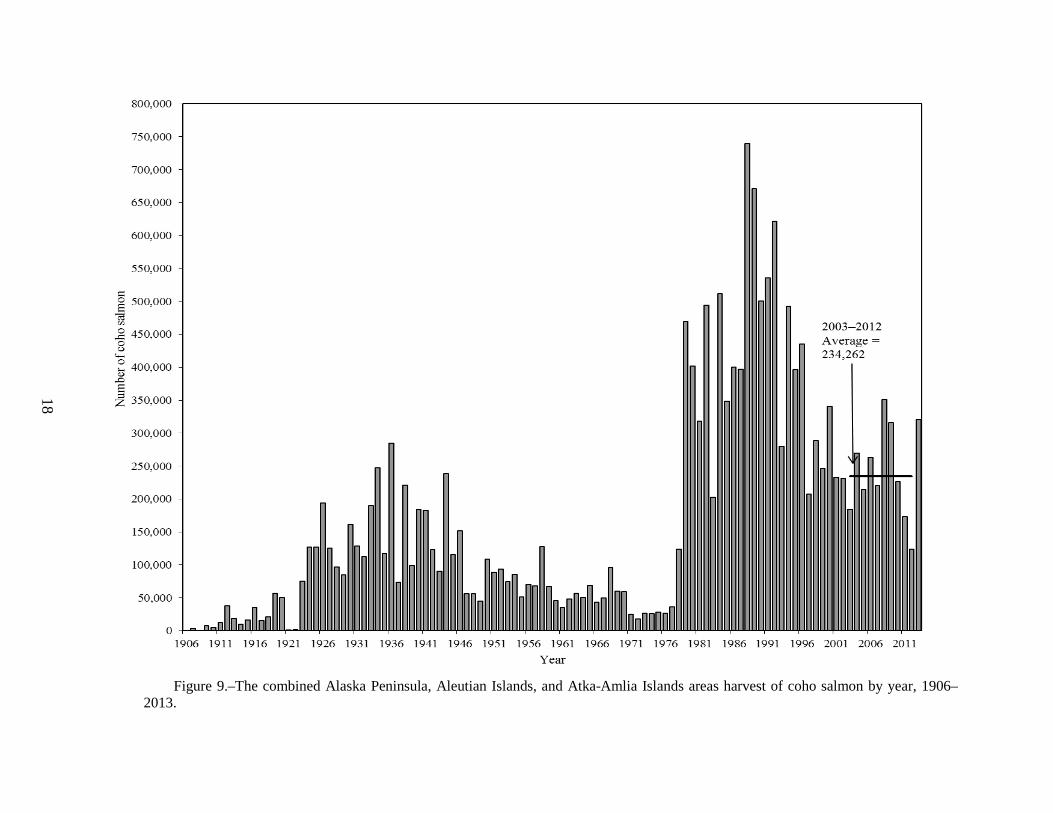
salmon by year, 1906–2013. .......................................................................................................................... 17 9. The combined Alaska Peninsula, Aleutian Islands, and Atka-Amlia Islands areas harvest of coho
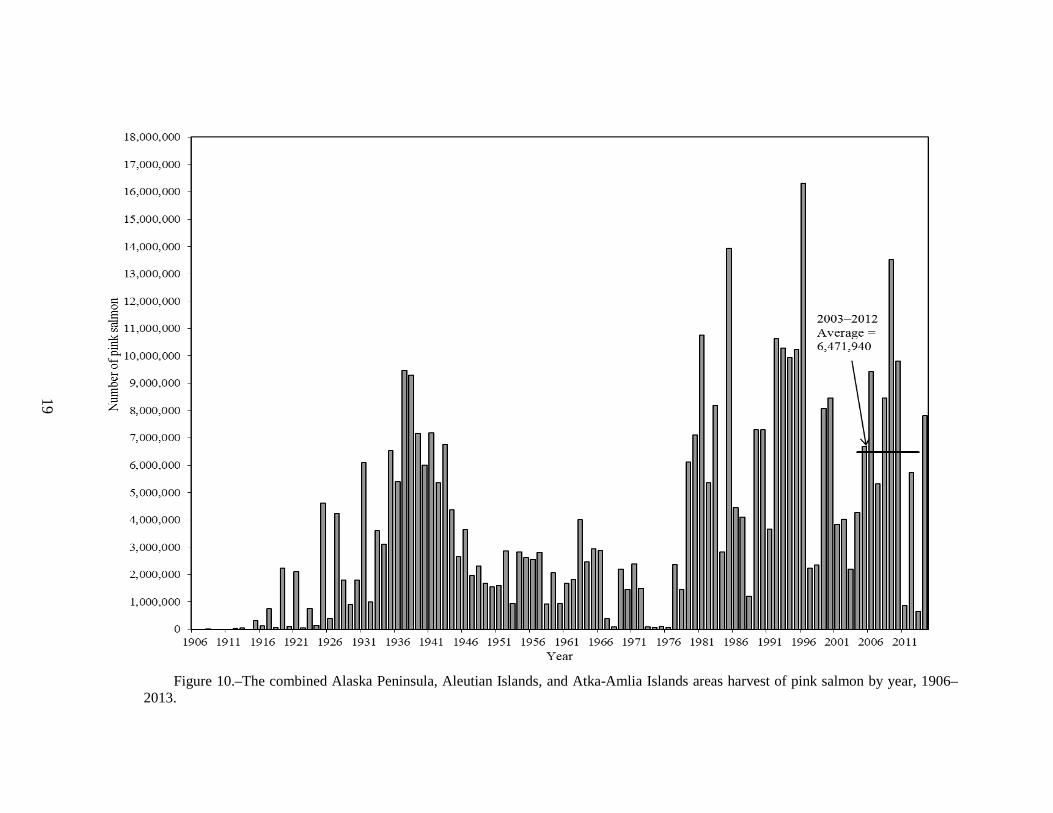
salmon by year, 1906–2013. .......................................................................................................................... 18 10. The combined Alaska Peninsula, Aleutian Islands, and Atka-Amlia Islands areas harvest of pink
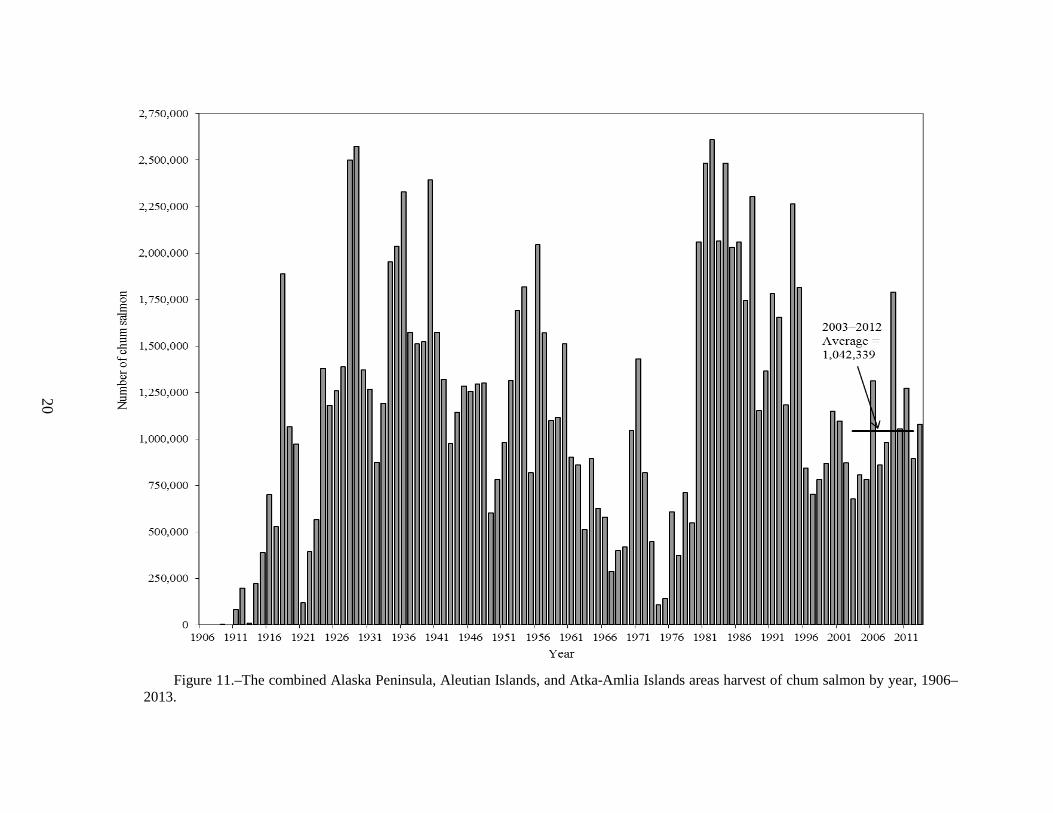
salmon by year, 1906–2013. .......................................................................................................................... 19 11. The combined Alaska Peninsula, Aleutian Islands, and Atka-Amlia Islands areas harvest of chum
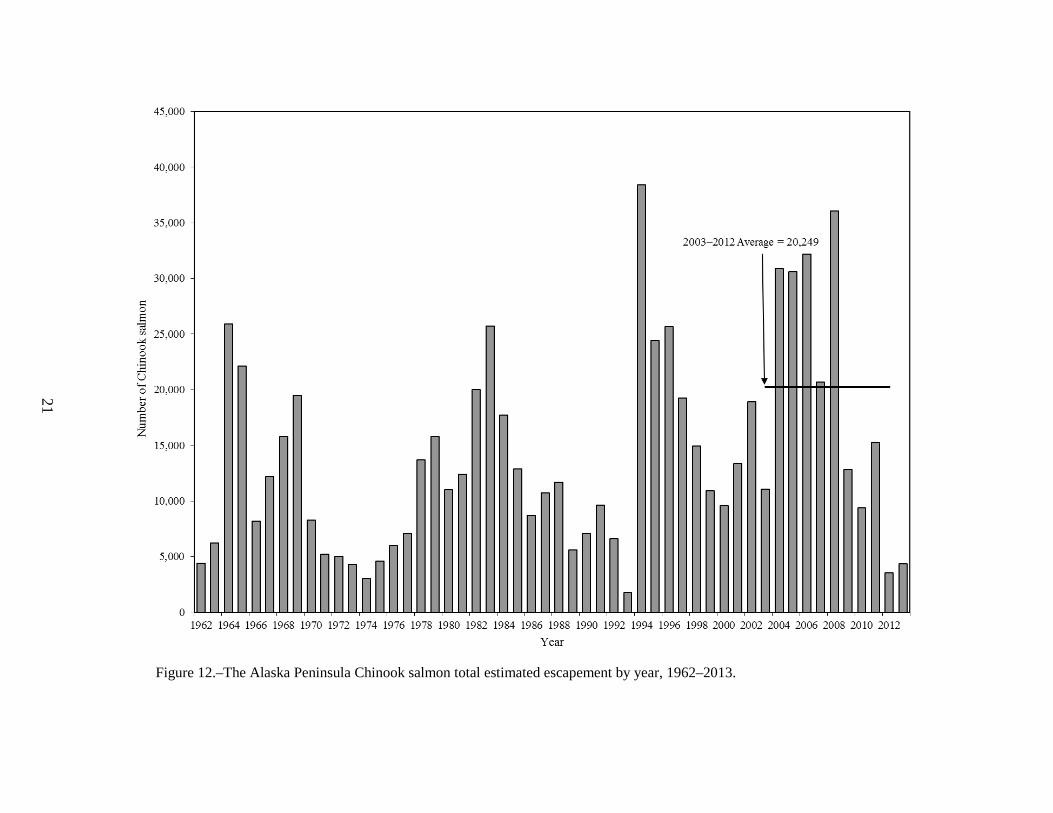
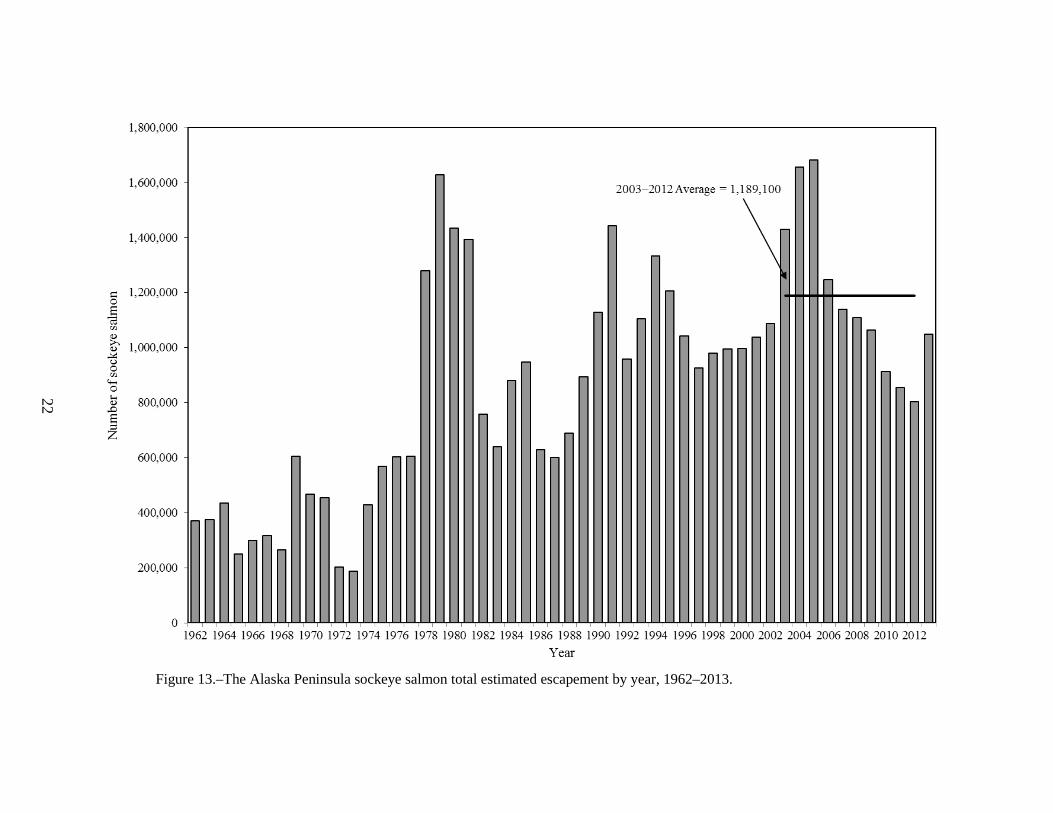
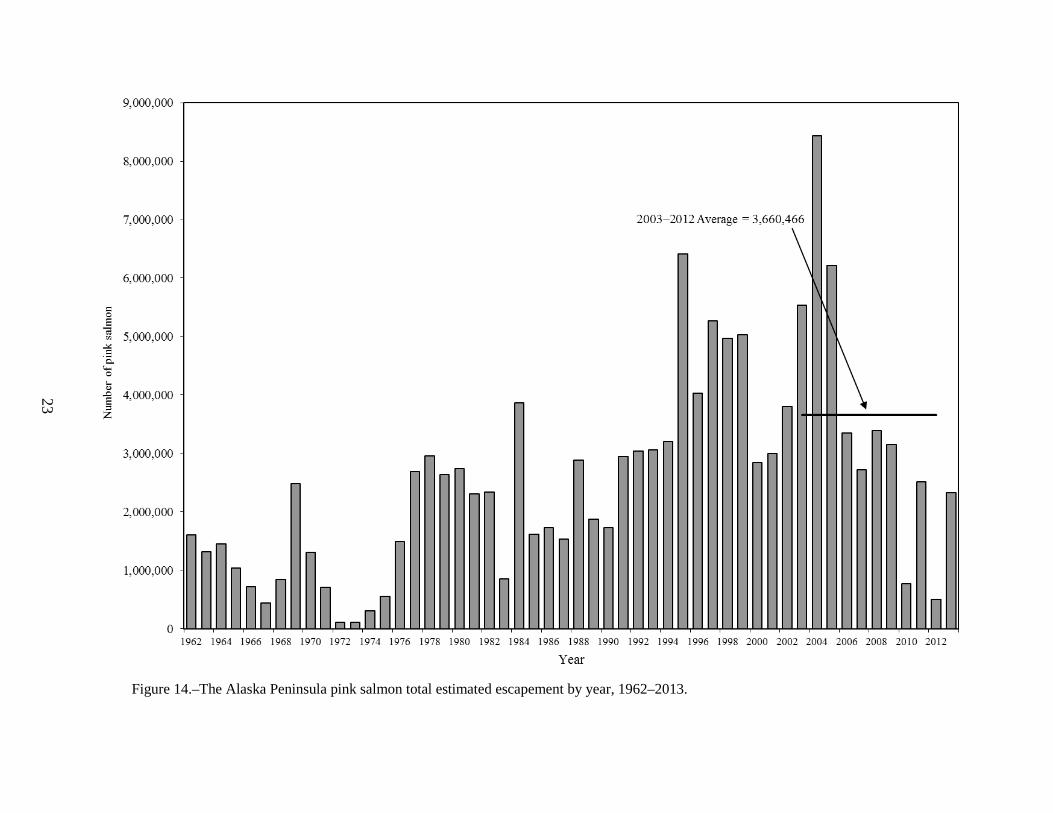
salmon by year, 1906–2013. .......................................................................................................................... 20 12. The Alaska Peninsula Chinook salmon total estimated escapement by year, 1962–2013. ............................ 21 13. The Alaska Peninsula sockeye salmon total estimated escapement by year, 1962–2013. ............................ 22 14. The Alaska Peninsula pink salmon total estimated escapement by year, 1962–2013. .................................. 23 15. The Alaska Peninsula chum salmon total estimated escapement by year, 1962–2013. ................................ 24
i

LIST OF APPENDICES Appendix Page A1. List of statistical commercial salmon fishing areas in the Alaska Peninsula, Aleutian Islands, and Atka-
Amlia Management Areas. ............................................................................................................................ 26 A2. List of processing companies purchasing salmon in the Alaska Peninsula and Aleutian Islands
Management areas, 2013. .............................................................................................................................. 28 A3. Estimated exvessel value of Alaska Peninsula and Aleutian Islands Management areas commercial
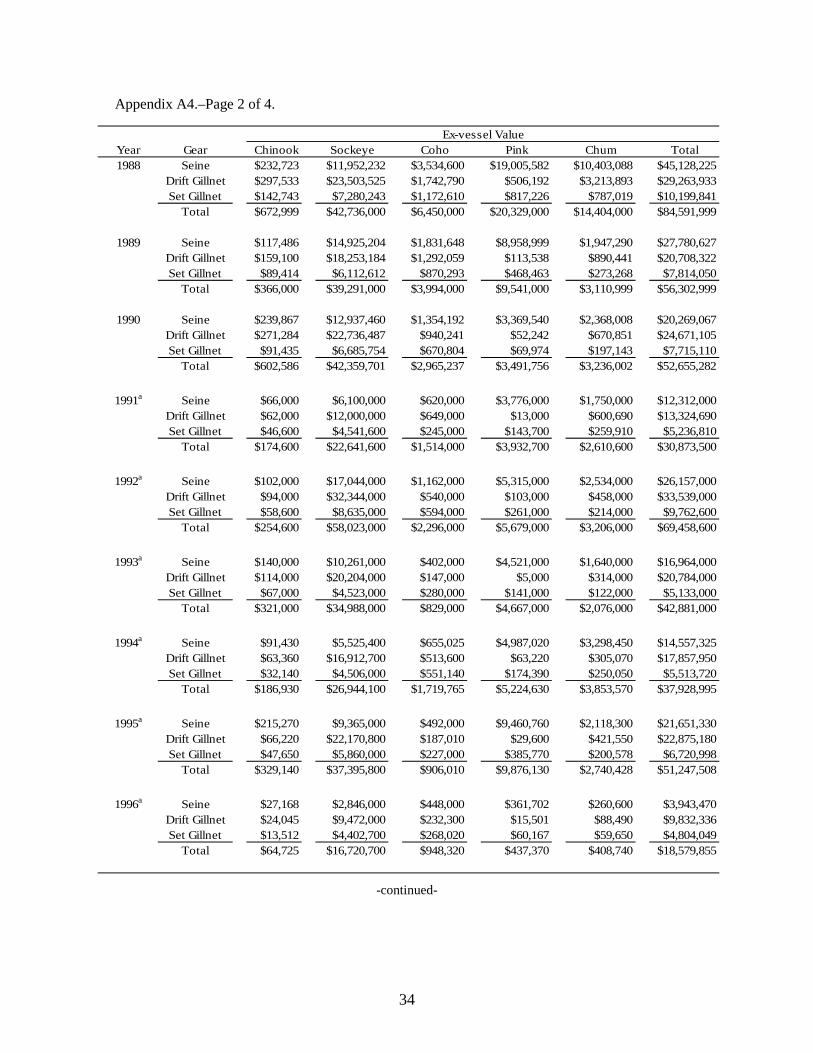
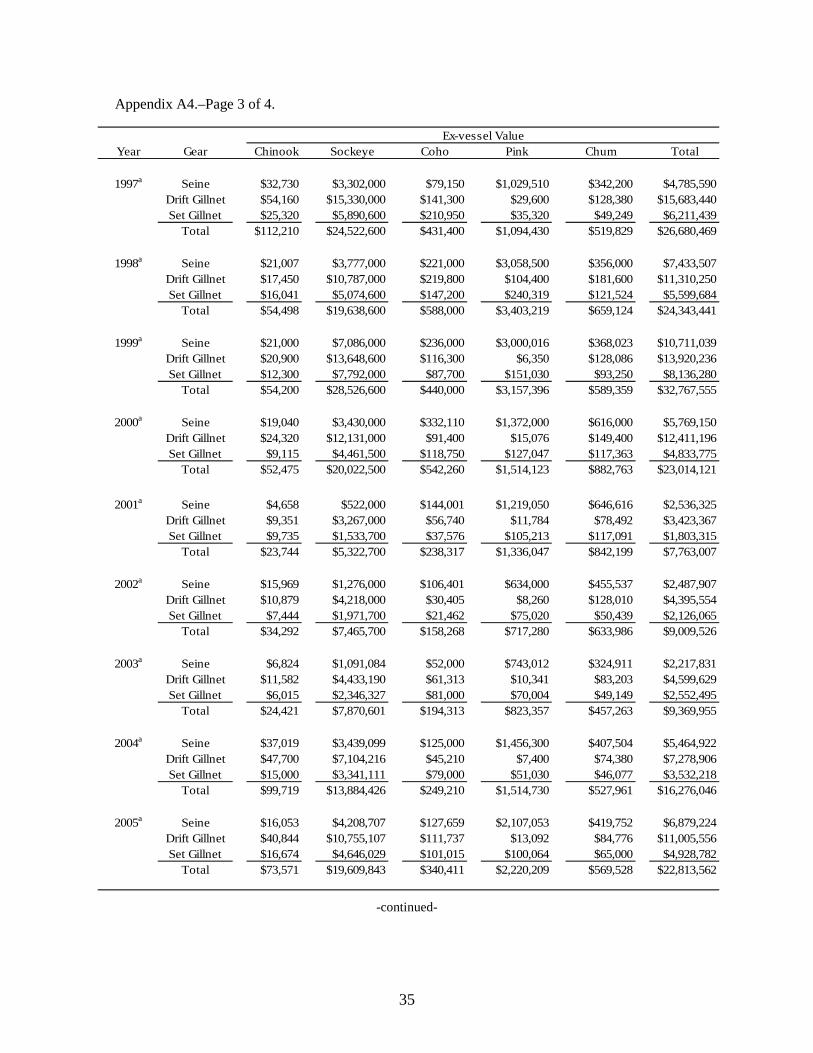
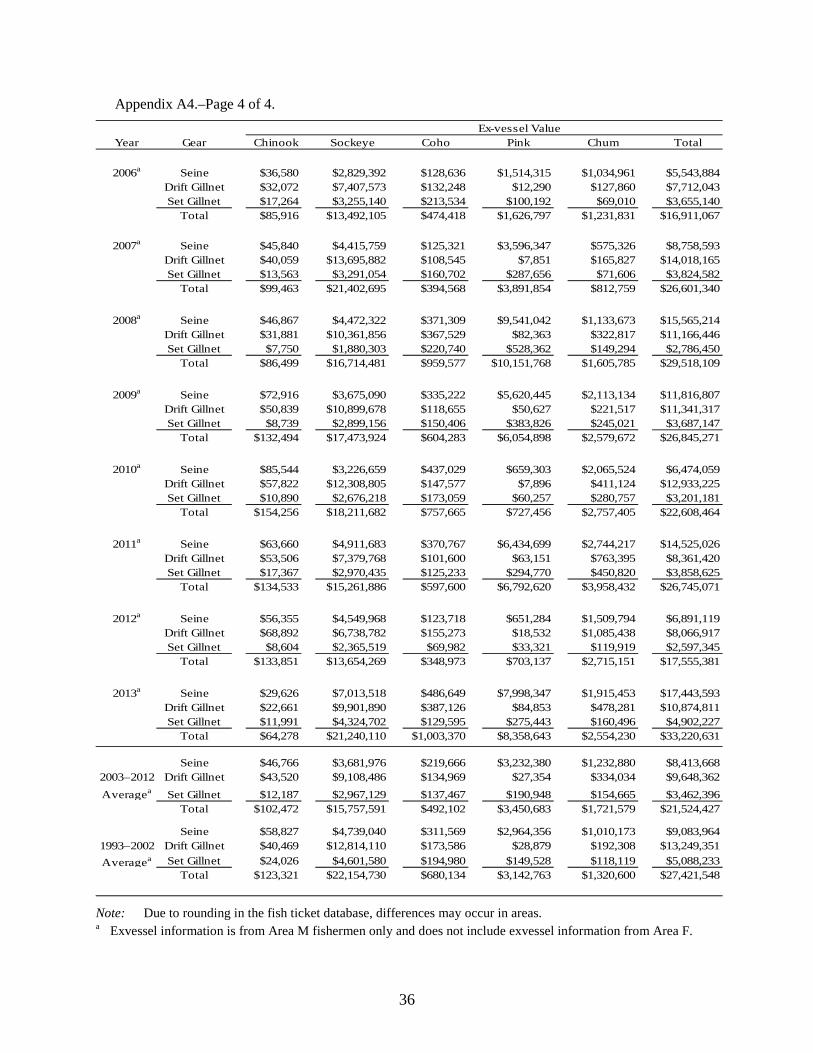
salmon fishery by gear type, 2013. ................................................................................................................ 29 A4. Alaska Peninsula and Aleutian Islands Management areas estimated exvessel value of commercially
caught salmon by year, species, and gear, 1979–2013. ................................................................................. 33 A5. Average weights and approximate exvessel prices for salmon in the Alaska Peninsula, Aleutian
Islands, and Atka-Amlia areas, 1979–2013. .................................................................................................. 37 A6. Number of Area M and Area T limited entry permits and fishing effort in the Alaska Peninsula and
Aleutian Islands Management areas, 1975–2013. ......................................................................................... 38 A7. Number of Area T permit holders fishing by general location in the Alaska Peninsula Area, 1984–
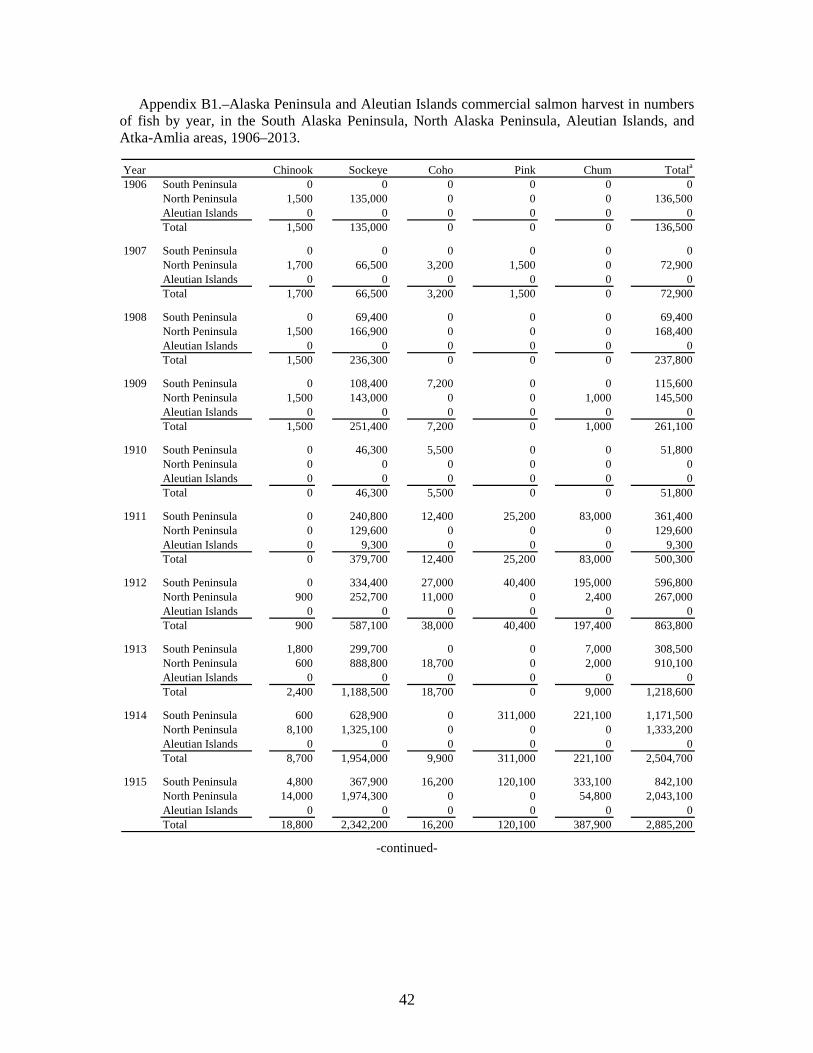
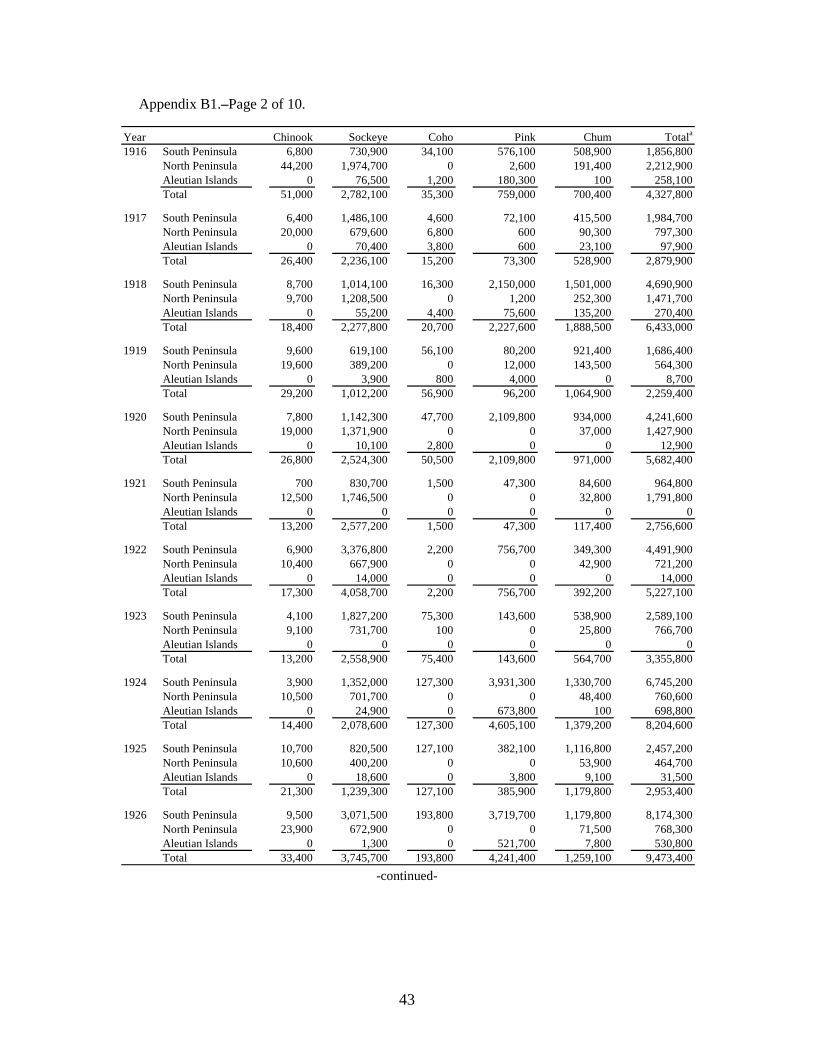
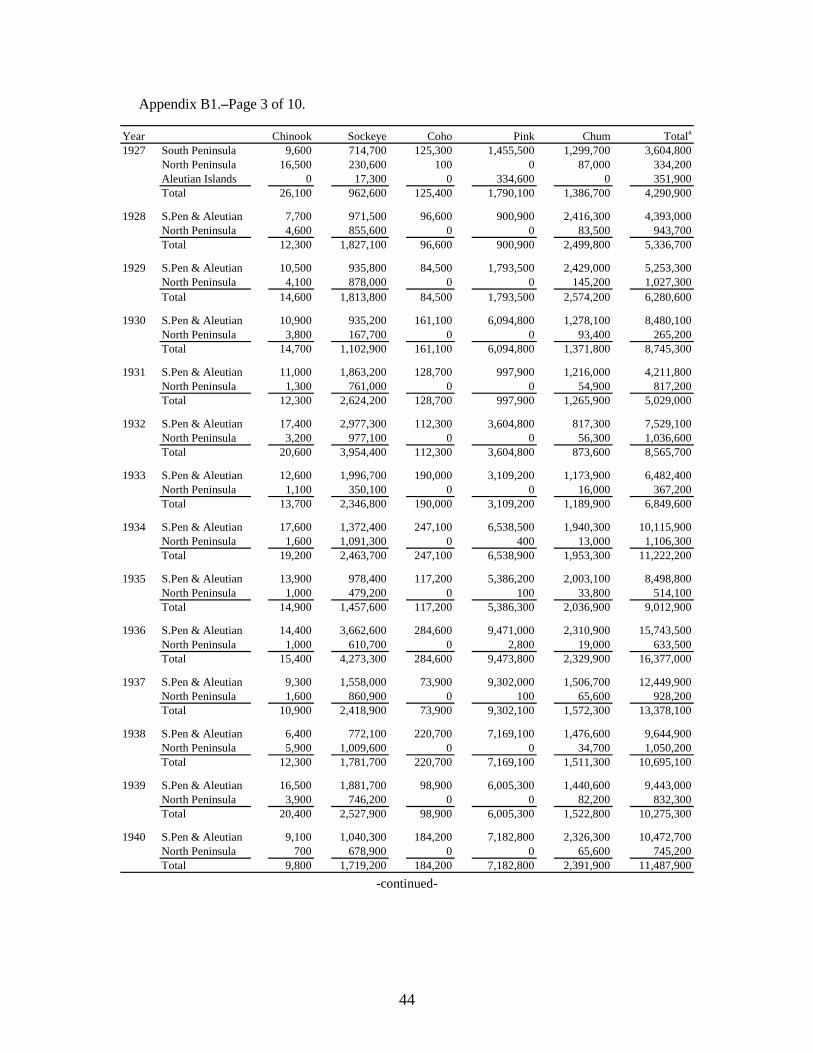
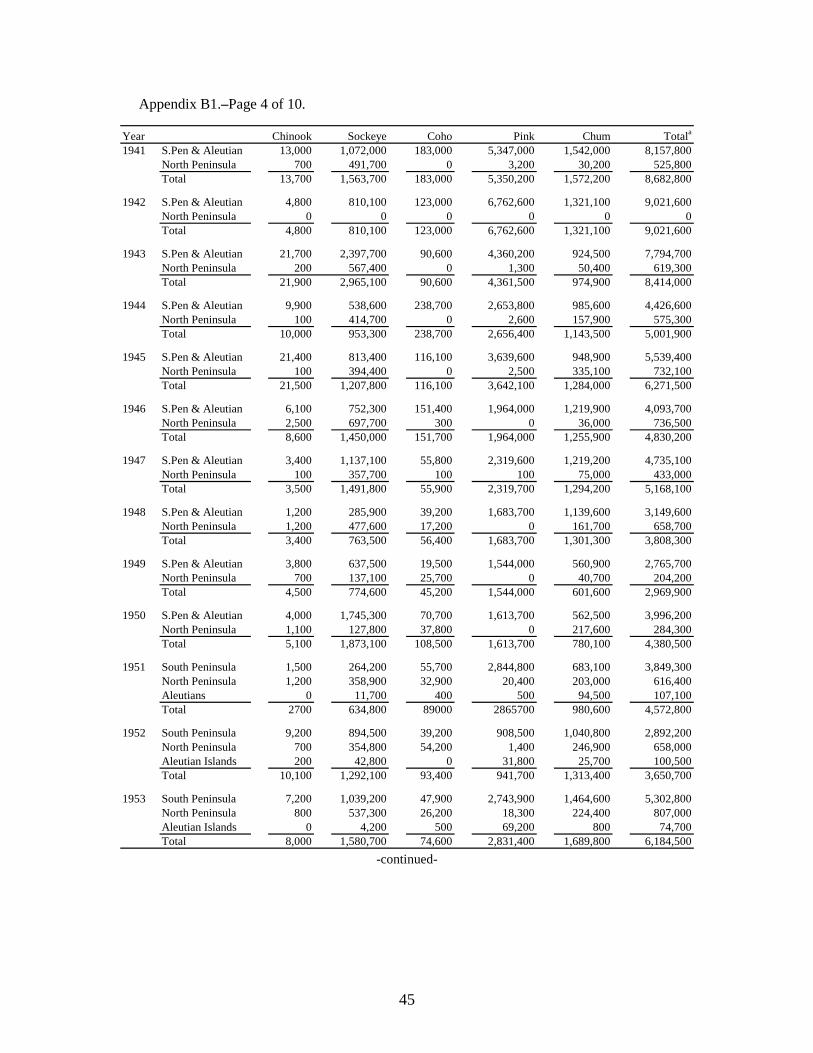
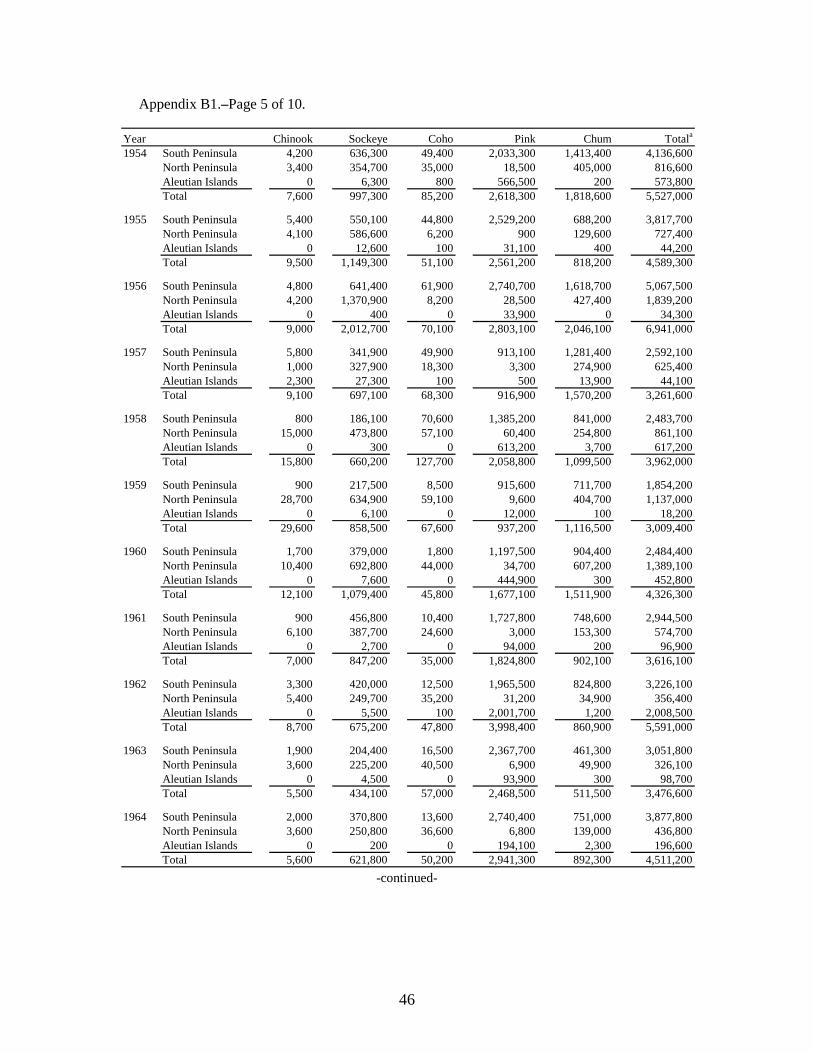
2013. .............................................................................................................................................................. 39 B1. Alaska Peninsula and Aleutian Islands commercial salmon harvest in numbers of fish by year, in the
South Alaska Peninsula, North Alaska Peninsula, Aleutian Islands, and Atka-Amlia areas, 1906–2013. .... 42 B2. Alaska Peninsula, and Aleutian Islands Management Areas commercial salmon harvest in numbers of
fish by statistical area, section, and district, 2013. ........................................................................................ 52 B3. Alaska Peninsula and Aleutian Islands areas commercial salmon harvest by gear and species, in
numbers and percent, 2013. ........................................................................................................................... 58 B4. Alaska Peninsula area salmon test fishery catches, 1989–2013. ................................................................... 59 C1. Alaska Peninsula Management area estimated total Chinook, sockeye, pink and chum salmon
escapements by species and year, 1962–2013. .............................................................................................. 64 D1. Method for calculating indexed total escapement. ........................................................................................ 70 E1. Field Personnel, 2013. ................................................................................................................................... 72
ii
ABSTRACT This report summarizes the 2013 commercial salmon fisheries of the Alaska Peninsula, Aleutian Islands, and Atka-Amlia Islands Management areas. The commercial salmon harvest in the Alaska Peninsula Area consisted of 7,223 Chinook Oncorhynchus tshawytscha, 2,956,136 sockeye O. nerka, 320,639 coho O. kisutch, 7,804,255 pink O. gorbuscha, and 1,077,703 chum salmon O. keta. The total exvessel value in the Alaska Peninsula was approximately $33,200,000. No harvest occurred in the Aleutian Islands or Atka-Amlia Management Area (Area F) in 2013.
The 2013 North Alaska Peninsula Chinook salmon escapement of 4,346 fish was well below the most recent 10-year average (2003–2012) of 20,249 fish. The total 2013 sockeye salmon escapement for the Alaska Peninsula of 1,047,786 fish was also below the 10-year average of 1,189,100 fish. The North Peninsula sockeye salmon escapements (1,010,400 fish) met or surpassed most escapement goals and was slightly below the 10-year average of 1,081,344 fish. The South Alaska Peninsula sockeye salmon escapement of 37,386 fish was well below the most recent 10-year average of 107,756 fish. Limited aerial surveys were flown for coho salmon on the Alaska Peninsula, therefore total estimated escapements were not calculated. The South Alaska Peninsula pink salmon estimated escapement of 2,320,790 fish was below the 2003–2012 average of 3,589,306 fish. The entire Alaska Peninsula chum salmon escapement of 732,651 fish was below the most recent 10-year average of 972,149 fish.
Key words: Fishery management report, Aleutian Islands, Atka-Amlia Islands, Alaska Peninsula, Area M, Area F, exvessel value, escapement, aerial surveys, commercial salmon fishery, subsistence salmon fishery, personal use salmon fishery, Chinook salmon, Oncorhynchus tshawytscha, sockeye salmon, Oncorhynchus nerka, coho salmon, Oncorhynchus kisutch, pink salmon, Oncorhynchus gorbuscha, chum salmon, Oncorhynchus keta
INTRODUCTION This report is a summary of commercial salmon exvessel value, harvest, and salmon escapement information for the Alaska Peninsula and Aleutian Islands (Area M) as well as Atka-Amlia Islands (Area F). In addition, this report provides historical information for comparison to recent harvest and escapement information. Further details of commercial harvests and escapements can be found in the following reports: (1) North Alaska Peninsula Commercial Salmon Annual Management Report, 2013 (Wilburn and Murphy 2014), (2) South Alaska Peninsula Salmon Annual Management Report, 2013 (Poetter and Nichols In prep) and (3) Aleutian Islands and Atka-Amlia Islands Management Areas Annual Salmon Management Report, 2013 (Nichols and Poetter In prep). Appendices of this report contain reference information including exvessel value information (Appendix A), commercial harvest information (Appendix B), escapement information (Appendix C), method for estimating total escapement (Appendix D), and an Alaska Department of Fish and Game (ADF&G) personnel list for the Alaska Peninsula (Appendix E). A separate report (Moore In prep) will provide estimated 2013 catch and escapement age, sex, and length data information. The Alaska Peninsula and Aleutian Islands Management Areas (collectively referred to as Area M) and the Atka-Amlia Management Area (Area F) are divided into four subareas: (1) the North Alaska Peninsula (5 AAC 09.100), consisting of Bering Sea waters extending west from Cape Menshikof to Cape Sarichef on Unimak Island; (2) the South Alaska Peninsula (5 AAC 09.100), consisting of Pacific Ocean coastal waters extending west of Kupreanof Point to Scotch Cap on Unimak Island; (3) the Aleutian Islands (5 AAC 12.100), consisting of the Bering Sea and Pacific Ocean waters of the Pribilof Islands and the Aleutian Islands west of Unimak Island and exclusive of the Atka-Amlia Management Area; and 4) the Atka-Amlia Management Area (5 AAC 11.101), consisting of Bering Sea and Pacific Ocean waters extending west of Seguam Pass (long 172°50.00' W) and east of Atka Pass (long 175°23.00' W; Figure 1). Managers in each geographical region are responsible for reporting the harvest and escapement that occur within its boundaries.
1
There are three seasonally staffed ADF&G offices in the Alaska Peninsula Management Area located in Sand Point, Cold Bay, and Port Moller (Figure 2; Appendix E1). Historically, most of the Alaska Peninsula and Aleutian Islands commercial salmon fishery management was directed from the Cold Bay office. In 1990, the Sand Point staff assumed responsibility for managing salmon in the Southeastern District (Figure 3). In 1992, the Port Moller staff assumed responsibility for managing salmon in the Herendeen-Moller Bay, Port Moller Bight, Bear River, Three Hills, and Ilnik sections (Figure 4) of the Northern District. In 2005, the Port Moller staff also assumed responsibility for managing salmon in the Cinder River, Inner Port Heiden, Nelson Lagoon, and Black Hills sections (Figure 4). In 2005, management was restructured and the Sand Point Area Management Biologist assumed management of the Northwestern, Unimak, and Southwestern districts of the Alaska Peninsula with support from the Cold Bay office. The Aleutian Islands and Atka-Amlia Islands Management Areas salmon fisheries are managed cooperatively by staff in Cold Bay and Sand Point (Figures 2–6) with assistance from the Dutch Harbor office. The balance of the South Alaska Peninsula portion of Area M is managed from the Sand Point office.
COMMERCIAL FISHERIES A list of commercial salmon statistical areas is provided in Appendix A1 for reference to the ADF&G statistical maps and the electronic fish ticket database. Physical descriptions of the districts and sections are given in 5 AAC 09.200, 5 AAC 11.101, and 5 AAC 12.200. Legal salmon gear types allowed in the Alaska Peninsula Management Area include seine, drift gillnet, and set gillnet (5 AAC 09.330). Portions of the Alaska Peninsula Management Area are closed to one or two of the three gear types. Purse, beach, and hand seines are the only legal commercial fishing method for salmon in the Aleutian Islands Management Area (5 AAC 12.330). In the Atka-Amlia Area, salmon may be taken by purse seine and set gillnet only (5 AAC 11.333).
Commercial salmon fisheries in the Alaska Peninsula Area date back to at least 1882 when canneries were reportedly constructed on the South Alaska Peninsula at Orzinski (Orzenoi) Bay and Thin Point Cove (Freeburn 1976). However, the earliest catch records for the Alaska Peninsula Management Area date back to 1906 (Figures 7–11; Appendix B1). Early season catches on the Alaska Peninsula were predominantly sockeye salmon with minimal Chinook and coho salmon harvest. Both pink and chum salmon harvests exceeded 500,000 fish for the first time in 1916. Salmon stocks targeted throughout Area M vary throughout the season. Salmon harvested in the South Unimak and Shumagin Islands June fisheries include stocks migrating to a wide range of locations, including Japan, Russia, Alaska Peninsula, South Central Alaska, Bristol Bay, and the Arctic-Yukon-Kuskokwim regions (5 AAC 09.365). The Southeastern District Mainland, located southwest of the Chignik Management Area, is managed primarily on the basis of the Chignik River sockeye salmon run prior to July 26 (Figure 3; 5 AAC 09.360). The remaining fisheries are managed on the basis of local run strength and escapements such as the sockeye salmon fishery on the North Alaska Peninsula and the South Alaska Peninsula pink and chum salmon fisheries.
The Cinder River and Inner Port Heiden sections, as well as the Ilnik Lagoon portion of the Ilnik Section, on the North Alaska Peninsula comprise an overlap area where both Alaska Peninsula (Area M) and Bristol Bay (Area T) permit holders are allowed to fish during certain periods (Figure 4; 5 AAC 39.120(d)). Area M permit holders are allowed to fish anytime during open fishing periods in the overlap area. Area T permit holders may fish during open fishing periods
2

from January 1 through December 31 in the Cinder River and Inner Port Heiden sections. Area T fishermen may fish in Ilnik Lagoon during open fishing periods from August 1 through December 31.
EXVESSEL VALUE In 2013, seven companies purchased salmon from Area M fishermen (Appendix A2) with an estimated salmon harvest value (exvessel) for all gear types of $33,248,343 (Appendix A3). This was above the previous 10-year average (2003–2012) of $21,524,427 (Appendix A4). The South Unimak and Shumagin Islands June fisheries harvest had a exvessel value of $11,376,961 or approximately 34% of the entire Area M earnings in 2013 (Appendix A3). The exvessel value for the North Alaska Peninsula was approximately $5,300,785 or about 16% of the total Area M value (Appendix A3). The total South Peninsula exvessel value, including the South Unimak and Shumigan Islands June fishery as well as the Post-June and Southeastern District Mainland fisheries was $28,144,408 or approximately 84% of the total Area M exvessel value (Appendix A3). Drift gillnet permit holders accounted for the most sockeye salmon landings in 2013 (exvessel value $9,901,890) followed by seine ($7,013,518) and set gillnet permit holders ($4,324,702; Appendix A4). Sockeye salmon provided the majority of the exvessel revenues ($21,240,110) for fishermen in Area M and accounted for about 64% of the total value of all salmon landings in 2013.
In 2013, the average exvessel price per pound for coho and pink salmon were similar to 2012 prices (Appendix A5). The price per pound for Chinook and chum salmon were both less than the 2012 prices yet higher than the most recent 10-year averages. The average exvessel price per pound for sockeye salmon ($1.22) was higher than the 2012 price and nearly double the most recent 10-year average of $0.69 per pound. The average weights remained similar to past years for each species except for Chinook salmon (Appendix A5). Chinook salmon average weight decreased from 16.0 pounds in 2012 to 11.9 pounds in 2013.
HARVEST In 2013, 61 of the 119 available seine, 133 of 162 available drift gillnet, and 90 of 113 available set gillnet Area M permits were fished (Appendix A6). The number of permits fished for drift and set gillnets was similar to the most recent 10-year average while the number of seine permits fished was slightly above the 10-year average. No Area T permit holders fished in the overlap areas in 2013 (Appendix A7).
The Alaska Peninsula 2013 commercial salmon harvest (excluding test fishery harvests) was 7,223 Chinook salmon, 2,956,136 sockeye salmon, 320,639 coho salmon, 7,804,255 pink salmon, and 1,077,703 chum salmon for a total of 12,165,956 fish (Figures 7–11; Appendices B1 and B2). The 2013 total harvest was slightly above the 2003–2012 average commercial salmon harvest of 11,778,599 fish. In 2013, the harvest of all species except Chinook and sockeye salmon were above the most recent 10-year averages. Chinook salmon harvest was about 33% below while the sockeye salmon harvest was 26% below the 10-year average. The 2013 harvest for coho and pink salmon were 27% and 17% above the 10-year average harvest, respectively. The 2013 chum salmon harvest was similar to the 10-year average harvest of 1,042,339 fish (Appendix B1). The 2013 harvest information, by area, can be found in Appendix B2.
During 2013, in the Alaska Peninsula Area, seine permit holders harvested approximately 69% of the Chinook salmon, 33% of the sockeye salmon, 49% of the coho salmon, 96% of the pink
3
salmon, and 71% of the chum salmon (Appendix B3). Drift gillnet permit holders harvested approximately 20% of the Chinook salmon, 48% of the sockeye salmon, 38% of the coho salmon, 1% of the pink salmon, and 22% of the chum salmon (Appendix B3). Set gillnet permit holders harvested about 12% of the Chinook salmon, 19% of the sockeye salmon, 12% of the coho salmon, 3% of the pink salmon, and 7% of the chum salmon (Appendix B3).
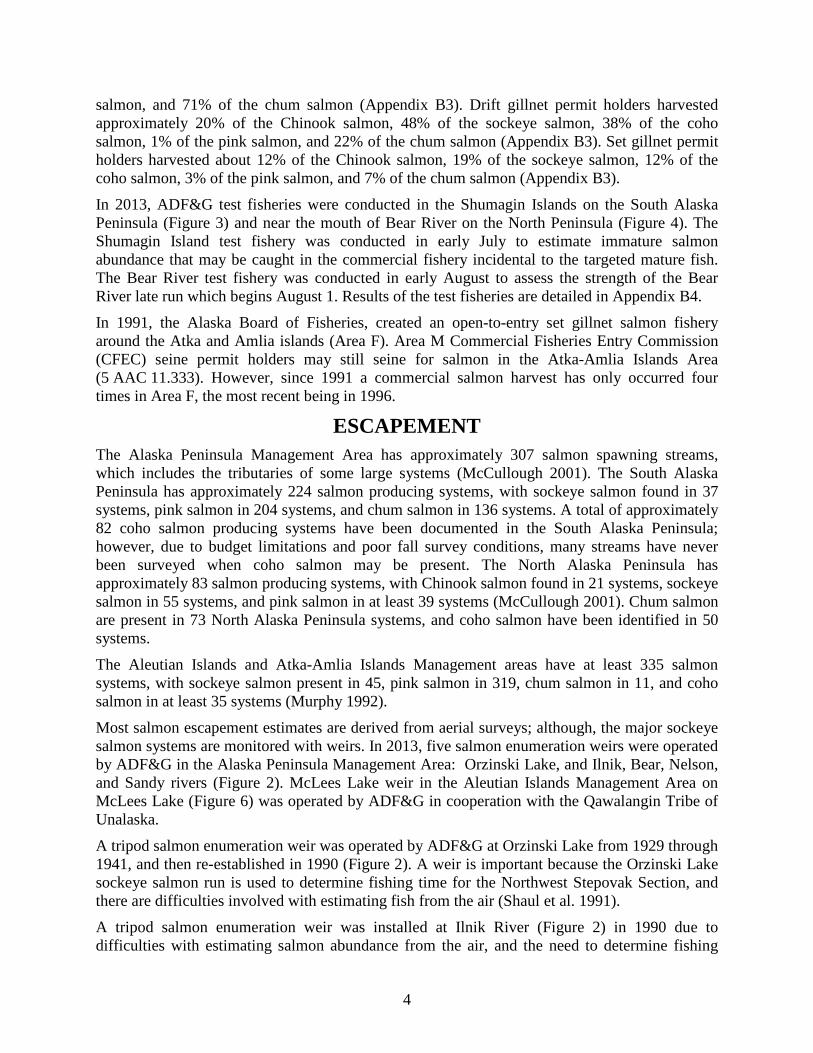
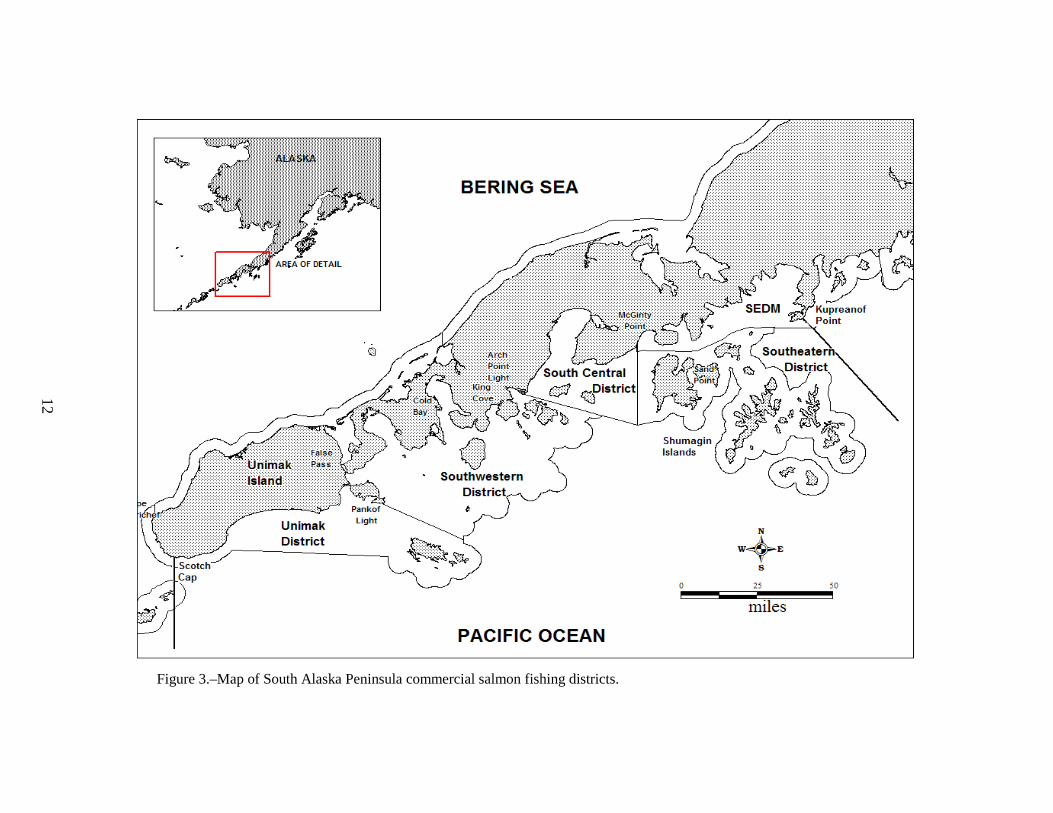
In 2013, ADF&G test fisheries were conducted in the Shumagin Islands on the South Alaska Peninsula (Figure 3) and near the mouth of Bear River on the North Peninsula (Figure 4). The Shumagin Island test fishery was conducted in early July to estimate immature salmon abundance that may be caught in the commercial fishery incidental to the targeted mature fish. The Bear River test fishery was conducted in early August to assess the strength of the Bear River late run which begins August 1. Results of the test fisheries are detailed in Appendix B4.
In 1991, the Alaska Board of Fisheries, created an open-to-entry set gillnet salmon fishery around the Atka and Amlia islands (Area F). Area M Commercial Fisheries Entry Commission (CFEC) seine permit holders may still seine for salmon in the Atka-Amlia Islands Area (5 AAC 11.333). However, since 1991 a commercial salmon harvest has only occurred four times in Area F, the most recent being in 1996.
ESCAPEMENT The Alaska Peninsula Management Area has approximately 307 salmon spawning streams, which includes the tributaries of some large systems (McCullough 2001). The South Alaska Peninsula has approximately 224 salmon producing systems, with sockeye salmon found in 37 systems, pink salmon in 204 systems, and chum salmon in 136 systems. A total of approximately 82 coho salmon producing systems have been documented in the South Alaska Peninsula; however, due to budget limitations and poor fall survey conditions, many streams have never been surveyed when coho salmon may be present. The North Alaska Peninsula has approximately 83 salmon producing systems, with Chinook salmon found in 21 systems, sockeye salmon in 55 systems, and pink salmon in at least 39 systems (McCullough 2001). Chum salmon are present in 73 North Alaska Peninsula systems, and coho salmon have been identified in 50 systems.
The Aleutian Islands and Atka-Amlia Islands Management areas have at least 335 salmon systems, with sockeye salmon present in 45, pink salmon in 319, chum salmon in 11, and coho salmon in at least 35 systems (Murphy 1992).
Most salmon escapement estimates are derived from aerial surveys; although, the major sockeye salmon systems are monitored with weirs. In 2013, five salmon enumeration weirs were operated by ADF&G in the Alaska Peninsula Management Area: Orzinski Lake, and Ilnik, Bear, Nelson, and Sandy rivers (Figure 2). McLees Lake weir in the Aleutian Islands Management Area on McLees Lake (Figure 6) was operated by ADF&G in cooperation with the Qawalangin Tribe of Unalaska.
A tripod salmon enumeration weir was operated by ADF&G at Orzinski Lake from 1929 through 1941, and then re-established in 1990 (Figure 2). A weir is important because the Orzinski Lake sockeye salmon run is used to determine fishing time for the Northwest Stepovak Section, and there are difficulties involved with estimating fish from the air (Shaul et al. 1991).
A tripod salmon enumeration weir was installed at Ilnik River (Figure 2) in 1990 due to difficulties with estimating salmon abundance from the air, and the need to determine fishing
4

periods for both the Ilnik Lagoon fishery (predominantly set gillnet gear) and the Ilnik Section outside the lagoon (predominantly drift gillnet gear). However, the 450-foot long Ilnik River weir was difficult to install and maintain, making it challenging to obtain quality escapement data. The weir was modified in 1996 to a floating panel weir. The floating panel weir was easier to install and maintain, and remains the current method for enumerating salmon in the Ilnik River (Shaul and Berceli 1997).
A sockeye salmon weir was first operated on Bear River from 1929 through 1932. During this time period, the weir was placed immediately above the mouth of the Milky River (locally called the Mad Sow River). This weir was difficult to construct and supply, and was not operated long enough during the season to estimate the total sockeye salmon escapement. From 1933 through 1952 no salmon enumerating structure was operated at Bear River. From 1953 through 1960 a weir was operated near the current weir location, close to the lake outlet (Figure 2). From 1961 through 1985, a counting tower replaced the weir. Since 1986, a tripod weir has again been used to enumerate Bear River sockeye salmon near the outlet of the lake.
A counting tower was used to enumerate salmon on the Nelson (Sapsuk) River from 1962 through 1988 (Figure 2). In 1989, the tower was replaced with the currently operating floating weir.
A counting tower was operated on the Sandy River from 1962 through 1964. After 1964, the Sandy River tower project was abandoned due to budget cuts and the fact that the river was often too muddy to count fish from a tower. Since 1994, a tripod weir has been operated on the Sandy River (Figure 2).
Sockeye salmon escapement into McLees Lake has been monitored by aerial surveys since 1967 (Hildreth and Finkle 2011). However, due to poor weather conditions, lack of aircraft availability and other factors, it is difficult to consistently and accurately monitor escapement. Sockeye salmon returning to McLees Lake are an important subsistence resource for residents of Unalaska and in 2001, the United States Fish and Wildlife Service (USFWS) Kenai Field Office and the Qawalangin Tribe of Unalaska entered into a partnership to monitor sockeye salmon returns. The USFWS operated the McLees Lake weir from 2001–2011, ADF&G took over operation of the weir in 2012. The weir is typically operated from early June through late July. A grant from the Alaska Sustainable Salmon Fund provided ADF&G with funding to run the project for the 2012–2014 seasons. The partnership with the Qawalangin tribe continued through the projects transfer from USFWS to ADF&G and the weir is now staffed seasonally by an ADF&G technician and a technician from the Qawalangin tribe.
Estimated escapements for Chinook, sockeye, pink, and chum salmon for the North and South Alaska Peninsula are presented in Appendix C1. Aerial surveys are used to estimate escapement in systems without a weir and to monitor historical trends in annual escapements. When presented in other sections of this report, coho salmon numbers are expressed in peak values (the largest number of coho salmon observed in a system in a given year). Escapement estimates in the text are estimated escapements derived from aerial surveys, except for tower or weir counts on the following systems: Bear River and Nelson River (sockeye salmon) from 1962–2013, Orzinski River (sockeye salmon) from 1990–2013, Ilnik River (sockeye salmon) from 1991–2013, Sandy River (sockeye salmon) from 1994–2013, Thin Point Cove (sockeye salmon) from 1994–1998, and Middle Lagoon (sockeye salmon) in 1996. The estimated escapement values are likely lower than the actual total escapement as aerial surveys typically underestimate
5

escapement numbers. There are differences after 1984 between escapement figures used in area management reports and those in some formally published reports (technical data reports, bulletins, etc.) due to the use of different methods to estimate escapement. Estimated Chinook, sockeye, pink, and chum salmon escapements from 1962 through 2013 are presented in Figures 12–15.
In 2013, the Alaska Peninsula estimated Chinook salmon escapement of 4,346 fish was approximately 79% below the previous 10-year average of 20,249 fish (Figure 12; Appendix C1). The estimated 2013 sockeye salmon escapement of 1,047,786 fish was 22% below the previous 10-year average of 1,189,100 fish (Figure 13; Appendix C1). The 2013 estimated pink salmon escapement was 2,328,973 fish, with 99% of that escapement occurring on the South Alaska Peninsula (2,320,790 fish). The South Alaska Peninsula pink salmon escapement was approximately 33% below the 2003–2012 average of 3,660,466 fish (Figure 14; Appendix C1). The 2013 Alaska Peninsula estimated total chum salmon escapement of 732,651 fish was about 25% below the previous 10-year average of 972,149 fish (Figure 15; Appendix C1). Coho salmon escapement data collected in 2013 were incomplete due to a variety of reasons (inclement weather, end of field season, etc.) but are presented in subsequent sections of the Alaska Peninsula Management Reports. Due to cost, logistics, and low availability of suitable aircraft, complete escapement data are not available in the Aleutian Islands and Atka-Amlia Islands areas. For further detailed escapement information including age, sex, and length composition refer to the Alaska Peninsula Management Area Salmon Escapement and Catch Sampling Results, 2013 (Moore In prep).
6

REFERENCES CITED Freeburn, L. 1976. The silver years. Alaska Northwest Publishing Co., Alaska Geographic, Volume 3, Number 4,
Anchorage.
Hildreth, D. R., and H. Finkle. 2011. Estimation of the sockeye salmon escapement into McLees Lake, Unalaska Island, Alaska, 2010. U.S. Fish and Wildlife Service, Anchorage Fishery Resource Office, Alaska Fisheries Data Series Report No. 2011-13, Anchorage.
McCullough, J. N. 2001. Alaska Peninsula Management Area systems: managers manual. Alaska Department of Fish and Game, Division of Commercial Fisheries, Regional Information Report 4K01-01, Kodiak.
Moore, M. L. In prep. Alaska Peninsula and Aleutian Islands management areas salmon escapement and catch sampling results, 2013. Alaska Department of Fish and Game Fishery Data Series, Anchorage.
Murphy, R. L. 1992. Number of salmon systems and distribution of escapements in the Alaska Peninsula and Aleutian Islands Management Areas, 1986-91. Alaska Department of Fish and Game, Division of Commercial Fisheries, Management and Development, Regional Information Report 4K92-15, Kodiak.
Nichols, N. W. and A. D. Poetter. In prep. Aleutian Islands and Atka-Amlia Islands Management Areas Annual Salmon Management Report, 2013. Alaska Department of Fish and Game, Fishery Management Report, Anchorage.
Poetter, A. D., and N. W. Nichols. In prep. South Alaska Peninsula Salmon Annual Management Report, 2013. Alaska Department of Fish and Game, Fishery Management Report, Anchorage.
Shaul, A. R., and R. S. Berceli. 1997. Annual summary of the commercial salmon fishery and a report on salmon subsistence and personal use fisheries for the Alaska Peninsula and Aleutian Islands Management Area, 1996. Alaska Department of Fish and Game, Division of Commercial Fisheries, Management and Development, Regional Information Report 4K97-23, Kodiak.
Shaul, A. R., J. N. McCullough, A. J. Quimby, R. S. Berceli, and M. E. Stopha. 1991. 1990 Alaska Peninsula - Aleutians Islands Areas salmon and herring annual management report. Alaska Department of Fish and Game, Division of Commercial Fisheries, Regional Information Report 4K91-12, Kodiak.
Wilburn, D. M., and R. L. Murphy. 2014. North Alaska Peninsula commercial salmon annual management report, 2013. Alaska Department of Fish and Game, Fishery Management Report No. 14-16, Anchorage.
7

8

FIGURES
9

10
Figure 1.–Map of the Aleutian Islands, Atka-Amlia Islands, and Alaska Peninsula Management areas.

11
Figure 2.–Map of the Alaska Peninsula ADF&G weir and regional office locations.
12
Figure 3.–Map of South Alaska Peninsula commercial salmon fishing districts.
13
Figure 4.–Map of Nelson Lagoon to Cape Menshikof, showing commercial salmon fishing sections, season opening
dates, area M and T overlap and major sockeye salmon systems.
14
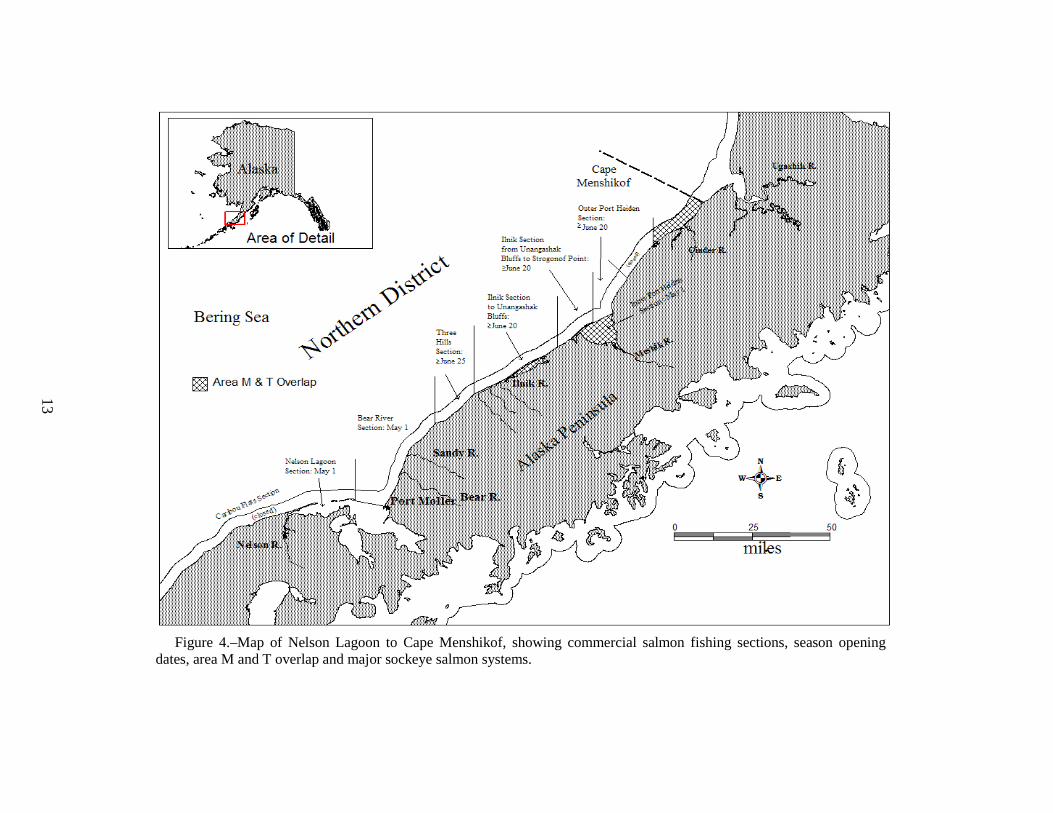
Figure 5.–Map of Unalaska and Akutan commercial salmon fishing districts and sections.
15
Figure 6.–Map of McLees Lake weir and ADF&G Dutch Harbor office.

16
Figure 7.–The combined Alaska Peninsula, Aleutian Islands, and Atka-Amlia Islands areas harvest of Chinook salmon by year, 1906–2013.
17
Figure 8.–The combined Alaska Peninsula, Aleutian Islands, and Atka-Amlia Islands areas harvest of sockeye salmon by year,
1906–2013.
18
Figure 9.–The combined Alaska Peninsula, Aleutian Islands, and Atka-Amlia Islands areas harvest of coho salmon by year, 1906–
2013.
19
Figure 10.–The combined Alaska Peninsula, Aleutian Islands, and Atka-Amlia Islands areas harvest of pink salmon by year, 1906–
2013.
20
Figure 11.–The combined Alaska Peninsula, Aleutian Islands, and Atka-Amlia Islands areas harvest of chum salmon by year, 1906–
2013.
21
Figure 12.–The Alaska Peninsula Chinook salmon total estimated escapement by year, 1962–2013.
22
Figure 13.–The Alaska Peninsula sockeye salmon total estimated escapement by year, 1962–2013.
23
Figure 14.–The Alaska Peninsula pink salmon total estimated escapement by year, 1962–2013.

24
Figure 15.–The Alaska Peninsula chum salmon total estimated escapement by year, 1962–2013.

APPENDIX A. FISHERY ECONOMIC AND GEOGRAPHIC
DATA
25

Appendix A1.–List of statistical commercial salmon fishing areas in the Alaska Peninsula, Aleutian Islands, and Atka-Amlia Management Areas.
-continued-
Area Statistical Areas
Alaska Peninsula (North and South) 28100 through 28599 plus 31111 through 31899
South Peninsula prior to 1991 28100 through 28499Southeastern District Mainlanda 28100 through 28299 plus 28370, 28375, 28380, and 28390East Stepovak Section 28134, 28135, 28136Stepovak Flats Section 28133Northwest Stepovak Section 28110 through 28132Orzinski and American Bays 28131Southwest Stepovak Section 28390Balboa Bay Section 28380Beaver Bay Sectiona 28370, 28375Shumagin Islands Section 28200 through 28299
South Central District 28361 through 28369
Southwestern District 28300 through 28352 plus 28460
Unimak District 28400 through 28450 plus 28310
South Peninsula after 1990 28100 through 28599Southeastern District 28100 through 28299Shumagin Islands Sectionb 28200 through 28299
Southeastern District Mainland (SEDM) 28100 through 28199East Stepovak Section 28100 through 28125Stepovak Flats Section 28130Northwest Stepovak Section 28140 through 28169Orzinski Bay 28150American Bay 28155Southwest Stepovak Section 28170Balboa Bay Section 28180Beaver Bay Section 28190
South Central District 28300 through 28399Mino Creek-Little Coal Bay Section 28315, 28317East Pavlof Bay Sectionb 28320, 28321, 28323Canoe Bay Sectionb 28324West Pavlof Bay Sectionb 28325, 28326
Southwestern Districtb 28400 through 28499Volcano Bay Sectionc 28436, 28437, 28438, 28439Belkofski Bay Section 28442Deer Island Section 28455Cold Bay Section 28462, 28465, 28467Thin Point Section 28475Morzhovoi Bay Section 28480Ikatan Bay Section 28490
Unimak Districtb 28500 through 28599Sanak Island Section 28510Otter Cove Section 28520, 28530Cape Lutke Section 28540
26

Appendix A1.–Page 2 of 2.
a In 1985, statistical area 28370 became two areas (28370 and 28375). In 1988, Beaver Bay (28375) became part of the
Southeastern District. The balance of 28370 remained in the South Central District. In 1991, statistical areas were changed to reflect Alaska Board of Fish management plans. As an aid in comparing statistics, catches from 1970-90 from statistical areas 28370 and 28375 have been designated as Beaver Bay catches from the Southeastern District. After 1990, these statistical areas were eliminated, Beaver Bay became 28190 (Southeastern District) and the Mino Creek-Little Coal Bay area became 28317 and 28315 (South Central District).
b This area participates in the South Unimak and Shumagin Islands June commercial salmon fishery. c In 2001, statistical area 28437 became two areas (28437 and 28439).
Area Statistical Areas
North Peninsula 31111 through 31899
Northwestern District 31111 through 31299Dublin Bay Section 31120Urilia Bay Section 31132 through 31142Swanson Lagoon Section 31152Bechevin Bay Section (prior to 2000) 31158 through 31160 Bechevin Bay Section (2000 to present)b 31160Izembek-Moffet Bay Section (prior to 2000) 31210 through 31240Izembek-Moffet Bay Section (2000 to present) 31210 through 31240 and 31158
Northern District 31300 through 31899Black Hills Section 31310Caribou Flats Section 31320Nelson Lagoon Section 31330Herendeen-Moller Bay Section 31420 through 31430Port Moller Bight Section 31412Bear River Section 31500 through 31599Three Hills Section 31610Ilnik Section 31620 through 31699Inner Port Heiden Section 31720Outer Port Heiden Section 31710Cinder River Section 31820
Aleutian Island Area 30200 through 30999Atka-Amlia Area 30500 through 30599
27

Appendix A2.–List of processing companies purchasing salmon in the Alaska Peninsula and Aleutian Islands Management areas, 2013.
Peter Pan Seafoods, Inc. 2200 6th Avenue, Suite 1000 Seattle, WA 98121 Trident Seafoods, Inc. 5303 Shilshole Avenue NW Seattle, WA 98107 Alaska Peninsula Fisherman’s Cooperative P O Box 10156 Bainbridge, WA 98101 Aleutia PO Box 408 Sand Point, AK 99661
Bering Pacific Seafoods 717 K Street, Suite 100 Anchorage, AK 99501 Klawock Oceanside Inc. 280 Bayview Blvd. Klawock, AK, 99925 Stacy Arbelovski PO Box 183 Sand Point, AK, 99661 ______________________________________________________________________________
28

Appendix A3.–Estimated exvessel value of Alaska Peninsula and Aleutian Islands Management areas commercial salmon fishery by gear type, 2013.
-continued-
Chinook Sockeye Coho Pink Chum TotalPURSE SEINE
South PeninsulaPoundage 55,386 5,522,396 957,116 23,320,850 5,012,206 34,867,954Average Weight 11.2 5.9 6.1 3.1 7.3
Exvessel Valuea $29,580 $6,811,228 $486,649 $7,995,405 $1,672,440 $16,995,302
Northwestern Districtb
Poundage 12 129,543 0 8,566 624,619 762,740Average Weight 12.0 6.4 2.8 7.8Exvessel Valuea $16 $194,315 $0 $2,998 $225,900 $423,229
Northern Districtbcd
Poundage 0 0 0 0 0 0Average WeightExvessel Valuea $0 $0 $0 $0 $0 $0
North Peninsulac
Poundage 12 129,543 0 8,566 624,619 762,740Average Weight 12.0 6.4 2.8 7.8Exvessel Valueb $16 $194,315 $0 $2,998 $225,900 $423,229
Aleutian Islands AreaPoundage 0 0 0 0 0 0Average WeightExvessel Valuea $0 $0 $0 $0 $0 $0
Alaska Peninsula and Aleutian Islands areas TotalPoundage 55,398 5,651,939 957,116 23,329,416 5,641,959 35,635,828Average Weight 11.1 5.9 6.1 3.1 7.4Exvessel Valuea $29,626 $7,013,518 $486,649 $7,998,347 $1,915,453 $17,443,593
South Unimak and Shumagin Islands June Fisheriesce
Poundage 25,328 3,748,861 463 783,599 2,000,577 6,558,828 Average Weight 19.1 5.8 5.9 2.7 7.1Exvessel Valuea $18,984 $4,060,427 $0 $151,859 $151,859 $4,383,129
29
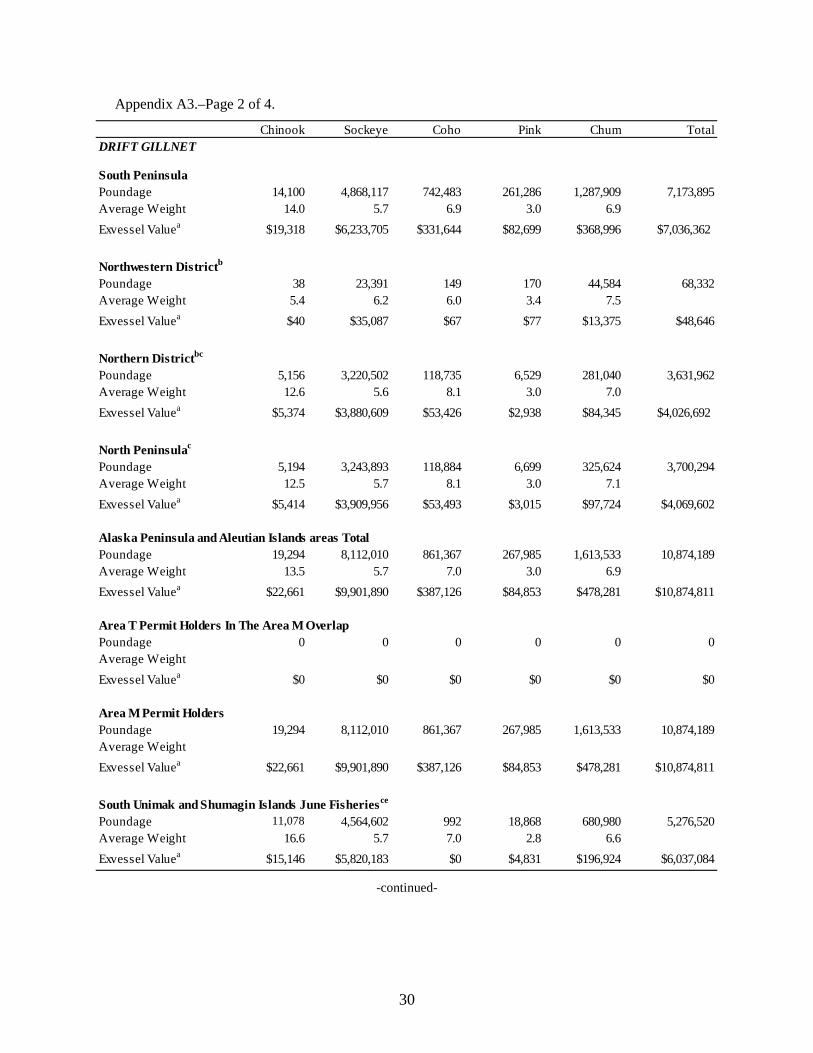
Appendix A3.–Page 2 of 4.
-continued-
Chinook Sockeye Coho Pink Chum TotalDRIFT GILLNET
South PeninsulaPoundage 14,100 4,868,117 742,483 261,286 1,287,909 7,173,895Average Weight 14.0 5.7 6.9 3.0 6.9Exvessel Valuea $19,318 $6,233,705 $331,644 $82,699 $368,996 $7,036,362
Northwestern Districtb
Poundage 38 23,391 149 170 44,584 68,332Average Weight 5.4 6.2 6.0 3.4 7.5Exvessel Valuea $40 $35,087 $67 $77 $13,375 $48,646
Northern Districtbc
Poundage 5,156 3,220,502 118,735 6,529 281,040 3,631,962Average Weight 12.6 5.6 8.1 3.0 7.0Exvessel Valuea $5,374 $3,880,609 $53,426 $2,938 $84,345 $4,026,692
North Peninsulac
Poundage 5,194 3,243,893 118,884 6,699 325,624 3,700,294Average Weight 12.5 5.7 8.1 3.0 7.1Exvessel Valuea $5,414 $3,909,956 $53,493 $3,015 $97,724 $4,069,602
Alaska Peninsula and Aleutian Islands areas TotalPoundage 19,294 8,112,010 861,367 267,985 1,613,533 10,874,189Average Weight 13.5 5.7 7.0 3.0 6.9Exvessel Valuea $22,661 $9,901,890 $387,126 $84,853 $478,281 $10,874,811
Area T Permit Holders In The Area M OverlapPoundage 0 0 0 0 0 0Average WeightExvessel Valuea $0 $0 $0 $0 $0 $0
Area M Permit Holders Poundage 19,294 8,112,010 861,367 267,985 1,613,533 10,874,189Average WeightExvessel Valuea $22,661 $9,901,890 $387,126 $84,853 $478,281 $10,874,811
South Unimak and Shumagin Islands June Fisheriesce
Poundage 11,078 4,564,602 992 18,868 680,980 5,276,520Average Weight 16.6 5.7 7.0 2.8 6.6Exvessel Valuea $15,146 $5,820,183 $0 $4,831 $196,924 $6,037,084
30
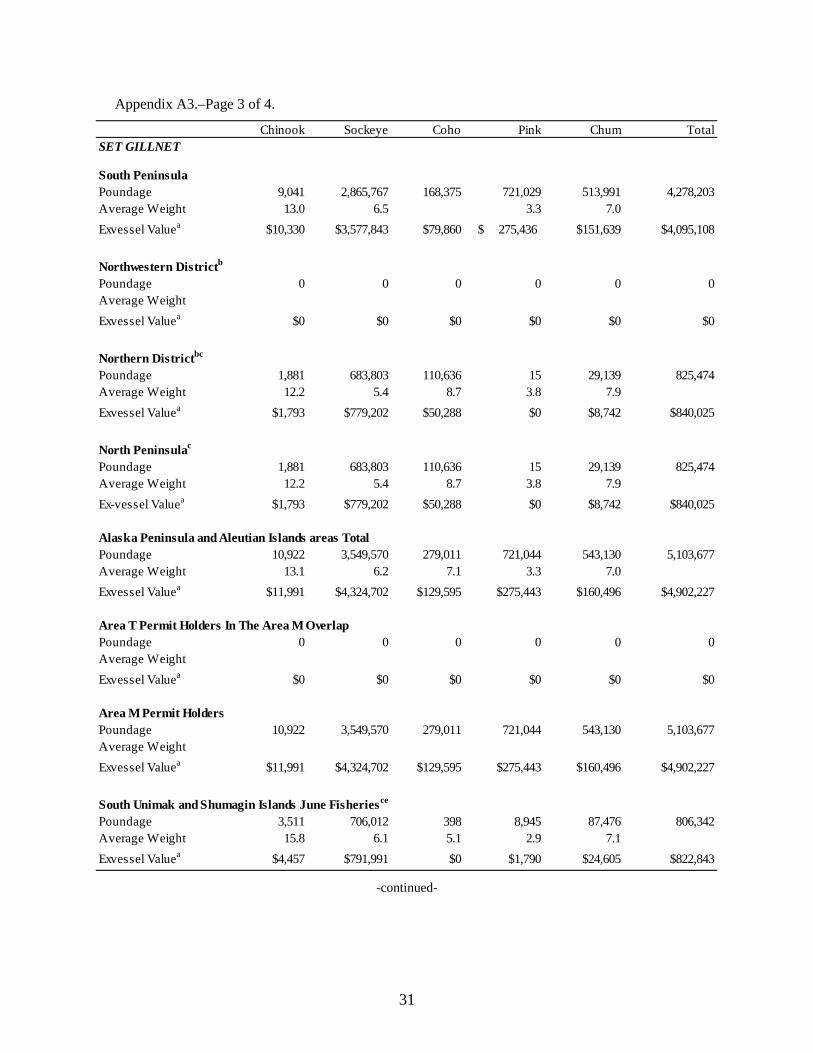
Appendix A3.–Page 3 of 4.
-continued-
Chinook Sockeye Coho Pink Chum TotalSET GILLNET
South PeninsulaPoundage 9,041 2,865,767 168,375 721,029 513,991 4,278,203Average Weight 13.0 6.5 3.3 7.0Exvessel Valuea $10,330 $3,577,843 $79,860 275,436$ $151,639 $4,095,108
Northwestern Districtb
Poundage 0 0 0 0 0 0Average WeightExvessel Valuea $0 $0 $0 $0 $0 $0
Northern Districtbc
Poundage 1,881 683,803 110,636 15 29,139 825,474Average Weight 12.2 5.4 8.7 3.8 7.9Exvessel Valuea $1,793 $779,202 $50,288 $0 $8,742 $840,025
North Peninsulac
Poundage 1,881 683,803 110,636 15 29,139 825,474Average Weight 12.2 5.4 8.7 3.8 7.9Ex-vessel Valuea $1,793 $779,202 $50,288 $0 $8,742 $840,025
Alaska Peninsula and Aleutian Islands areas TotalPoundage 10,922 3,549,570 279,011 721,044 543,130 5,103,677Average Weight 13.1 6.2 7.1 3.3 7.0Exvessel Valuea $11,991 $4,324,702 $129,595 $275,443 $160,496 $4,902,227
Area T Permit Holders In The Area M OverlapPoundage 0 0 0 0 0 0Average WeightExvessel Valuea $0 $0 $0 $0 $0 $0
Area M Permit Holders Poundage 10,922 3,549,570 279,011 721,044 543,130 5,103,677Average WeightExvessel Valuea $11,991 $4,324,702 $129,595 $275,443 $160,496 $4,902,227
South Unimak and Shumagin Islands June Fisheriesce
Poundage 3,511 706,012 398 8,945 87,476 806,342Average Weight 15.8 6.1 5.1 2.9 7.1Exvessel Valuea $4,457 $791,991 $0 $1,790 $24,605 $822,843
31
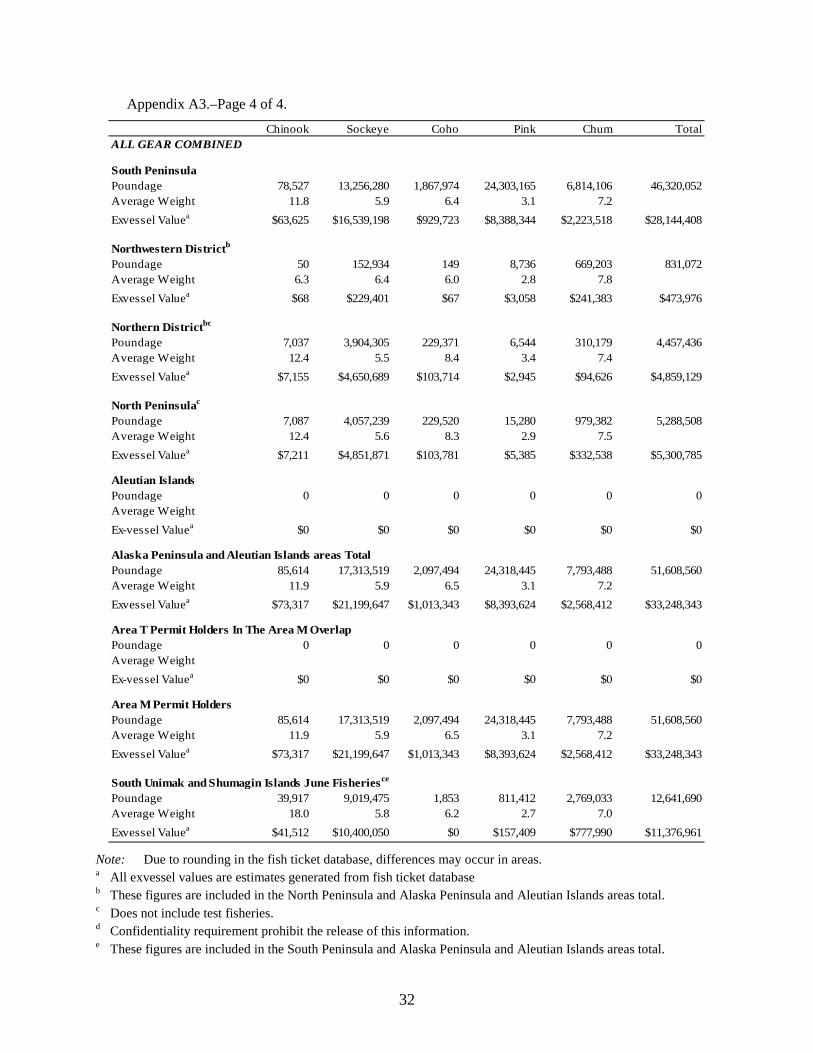
Appendix A3.–Page 4 of 4.
Note: Due to rounding in the fish ticket database, differences may occur in areas. a All exvessel values are estimates generated from fish ticket database b These figures are included in the North Peninsula and Alaska Peninsula and Aleutian Islands areas total. c Does not include test fisheries. d Confidentiality requirement prohibit the release of this information.
e These figures are included in the South Peninsula and Alaska Peninsula and Aleutian Islands areas total.
Chinook Sockeye Coho Pink Chum TotalALL GEAR COMBINED
South PeninsulaPoundage 78,527 13,256,280 1,867,974 24,303,165 6,814,106 46,320,052Average Weight 11.8 5.9 6.4 3.1 7.2Exvessel Valuea $63,625 $16,539,198 $929,723 $8,388,344 $2,223,518 $28,144,408
Northwestern Districtb
Poundage 50 152,934 149 8,736 669,203 831,072Average Weight 6.3 6.4 6.0 2.8 7.8Exvessel Valuea $68 $229,401 $67 $3,058 $241,383 $473,976
Northern Districtbc
Poundage 7,037 3,904,305 229,371 6,544 310,179 4,457,436Average Weight 12.4 5.5 8.4 3.4 7.4Exvessel Valuea $7,155 $4,650,689 $103,714 $2,945 $94,626 $4,859,129
North Peninsulac
Poundage 7,087 4,057,239 229,520 15,280 979,382 5,288,508Average Weight 12.4 5.6 8.3 2.9 7.5Exvessel Valuea $7,211 $4,851,871 $103,781 $5,385 $332,538 $5,300,785
Aleutian Islands Poundage 0 0 0 0 0 0Average WeightEx-vessel Valuea $0 $0 $0 $0 $0 $0
Alaska Peninsula and Aleutian Islands areas TotalPoundage 85,614 17,313,519 2,097,494 24,318,445 7,793,488 51,608,560Average Weight 11.9 5.9 6.5 3.1 7.2Exvessel Valuea $73,317 $21,199,647 $1,013,343 $8,393,624 $2,568,412 $33,248,343
Area T Permit Holders In The Area M OverlapPoundage 0 0 0 0 0 0Average WeightEx-vessel Valuea $0 $0 $0 $0 $0 $0
Area M Permit Holders Poundage 85,614 17,313,519 2,097,494 24,318,445 7,793,488 51,608,560Average Weight 11.9 5.9 6.5 3.1 7.2Exvessel Valuea $73,317 $21,199,647 $1,013,343 $8,393,624 $2,568,412 $33,248,343
South Unimak and Shumagin Islands June Fisheriesce
Poundage 39,917 9,019,475 1,853 811,412 2,769,033 12,641,690Average Weight 18.0 5.8 6.2 2.7 7.0Exvessel Valuea $41,512 $10,400,050 $0 $157,409 $777,990 $11,376,961
32

Appendix A4.–Alaska Peninsula and Aleutian Islands Management areas estimated exvessel value of commercially caught salmon by year, species, and gear, 1979–2013.
-continued-
Exvessel ValueYear Gear Chinook Sockeye Coho Pink Chum Total
1979 Seine $41,024 $5,806,222 $2,403,576 $9,544,217 $1,706,042 $19,501,081Drift Gillnet $240,779 $11,753,626 $441,669 $39,800 $263,172 $12,739,046Set Gillnet $201,398 $2,505,152 $355,256 $123,283 $158,286 $3,343,375
Total $483,201 $20,065,000 $3,200,501 $9,707,300 $2,127,500 $35,583,502
1980 Seine $58,969 $9,244,048 $933,974 $13,857,200 $4,534,200 $28,628,391Drift Gillnet $152,604 $5,505,669 $291,213 $9,800 $1,077,000 $7,036,286Set Gillnet $88,426 $1,250,283 $274,813 $133,000 $388,800 $2,135,322
Total $299,999 $16,000,000 $1,500,000 $14,000,000 $6,000,000 $37,799,999
1981 Seine $149,904 $7,555,092 $818,867 $7,780,053 $6,186,088 $22,490,004Drift Gillnet $227,880 $12,919,049 $402,703 $23,122 $1,387,760 $14,960,514Set Gillnet $162,216 $3,359,859 $440,430 $169,825 $485,152 $4,617,482
Total $540,000 $23,834,000 $1,662,000 $7,973,000 $8,059,000 $42,068,000
1982 Seine $159,719 $7,342,780 $1,193,753 $6,273,624 $5,222,369 $20,192,245Drift Gillnet $482,670 $9,920,524 $790,307 $53,286 $2,086,026 $13,332,813Set Gillnet $299,612 $1,690,697 $701,940 $93,090 $380,606 $3,165,945
Total $942,001 $18,954,001 $2,686,000 $6,420,000 $7,689,001 $36,691,003
1983 Seine $290,228 $7,710,942 $413,021 $2,798,538 $3,682,741 $14,895,470Drift Gillnet $264,657 $11,836,113 $106,775 $8,857 $799,006 $13,015,408Set Gillnet $138,115 $2,438,945 $233,204 $79,605 $207,254 $3,097,123
Total $693,000 $21,986,000 $753,000 $2,887,000 $4,689,001 $31,008,001
1984 Seine $162,878 $6,927,466 $1,283,032 $12,265,369 $3,384,960 $24,023,705Drift Gillnet $366,861 $8,895,318 $721,161 $88,448 $1,218,684 $11,290,472Set Gillnet $160,861 $3,680,216 $524,907 $241,183 $316,356 $4,923,523
Total $690,600 $19,503,000 $2,529,100 $12,595,000 $4,920,000 $40,237,700
1985 Seine $111,106 $8,835,393 $966,202 $3,590,683 $3,367,800 $16,871,184Drift Gillnet $313,931 $15,569,329 $528,289 $20,455 $804,537 $17,236,541Set Gillnet $196,363 $3,651,278 $559,510 $176,901 $190,663 $4,774,715
Total $621,400 $28,056,000 $2,054,001 $3,788,039 $4,363,000 $38,882,440
1986 Seine $63,512 $7,218,401 $1,109,746 $2,665,608 $4,151,941 $15,209,208Drift Gillnet $102,301 $19,594,136 $462,212 $28,793 $688,716 $20,876,158Set Gillnet $59,587 $4,274,463 $414,342 $74,198 $243,344 $5,065,934
Total $225,400 $31,087,000 $1,986,300 $2,768,599 $5,084,001 $41,151,300
1987 Seine $174,544 $7,305,460 $1,383,112 $1,691,295 $3,320,666 $13,875,077Drift Gillnet $247,653 $14,594,398 $908,674 $9,073 $1,185,440 $16,945,238Set Gillnet $98,803 $5,636,742 $664,213 $78,632 $273,894 $6,752,284
Total $521,000 $27,536,600 $2,955,999 $1,779,000 $4,780,000 $37,572,599
33
Appendix A4.–Page 2 of 4.
-continued-
Ex-vessel ValueYear Gear Chinook Sockeye Coho Pink Chum Total1988 Seine $232,723 $11,952,232 $3,534,600 $19,005,582 $10,403,088 $45,128,225
Drift Gillnet $297,533 $23,503,525 $1,742,790 $506,192 $3,213,893 $29,263,933Set Gillnet $142,743 $7,280,243 $1,172,610 $817,226 $787,019 $10,199,841
Total $672,999 $42,736,000 $6,450,000 $20,329,000 $14,404,000 $84,591,999
1989 Seine $117,486 $14,925,204 $1,831,648 $8,958,999 $1,947,290 $27,780,627Drift Gillnet $159,100 $18,253,184 $1,292,059 $113,538 $890,441 $20,708,322Set Gillnet $89,414 $6,112,612 $870,293 $468,463 $273,268 $7,814,050
Total $366,000 $39,291,000 $3,994,000 $9,541,000 $3,110,999 $56,302,999
1990 Seine $239,867 $12,937,460 $1,354,192 $3,369,540 $2,368,008 $20,269,067Drift Gillnet $271,284 $22,736,487 $940,241 $52,242 $670,851 $24,671,105Set Gillnet $91,435 $6,685,754 $670,804 $69,974 $197,143 $7,715,110
Total $602,586 $42,359,701 $2,965,237 $3,491,756 $3,236,002 $52,655,282
1991a Seine $66,000 $6,100,000 $620,000 $3,776,000 $1,750,000 $12,312,000Drift Gillnet $62,000 $12,000,000 $649,000 $13,000 $600,690 $13,324,690Set Gillnet $46,600 $4,541,600 $245,000 $143,700 $259,910 $5,236,810
Total $174,600 $22,641,600 $1,514,000 $3,932,700 $2,610,600 $30,873,500
1992a Seine $102,000 $17,044,000 $1,162,000 $5,315,000 $2,534,000 $26,157,000Drift Gillnet $94,000 $32,344,000 $540,000 $103,000 $458,000 $33,539,000Set Gillnet $58,600 $8,635,000 $594,000 $261,000 $214,000 $9,762,600
Total $254,600 $58,023,000 $2,296,000 $5,679,000 $3,206,000 $69,458,600
1993a Seine $140,000 $10,261,000 $402,000 $4,521,000 $1,640,000 $16,964,000Drift Gillnet $114,000 $20,204,000 $147,000 $5,000 $314,000 $20,784,000Set Gillnet $67,000 $4,523,000 $280,000 $141,000 $122,000 $5,133,000
Total $321,000 $34,988,000 $829,000 $4,667,000 $2,076,000 $42,881,000
1994a Seine $91,430 $5,525,400 $655,025 $4,987,020 $3,298,450 $14,557,325Drift Gillnet $63,360 $16,912,700 $513,600 $63,220 $305,070 $17,857,950Set Gillnet $32,140 $4,506,000 $551,140 $174,390 $250,050 $5,513,720
Total $186,930 $26,944,100 $1,719,765 $5,224,630 $3,853,570 $37,928,995
1995a Seine $215,270 $9,365,000 $492,000 $9,460,760 $2,118,300 $21,651,330Drift Gillnet $66,220 $22,170,800 $187,010 $29,600 $421,550 $22,875,180Set Gillnet $47,650 $5,860,000 $227,000 $385,770 $200,578 $6,720,998
Total $329,140 $37,395,800 $906,010 $9,876,130 $2,740,428 $51,247,508
1996a Seine $27,168 $2,846,000 $448,000 $361,702 $260,600 $3,943,470Drift Gillnet $24,045 $9,472,000 $232,300 $15,501 $88,490 $9,832,336Set Gillnet $13,512 $4,402,700 $268,020 $60,167 $59,650 $4,804,049
Total $64,725 $16,720,700 $948,320 $437,370 $408,740 $18,579,855
34
Appendix A4.–Page 3 of 4.
-continued-
Ex-vessel ValueYear Gear Chinook Sockeye Coho Pink Chum Total
1997a Seine $32,730 $3,302,000 $79,150 $1,029,510 $342,200 $4,785,590Drift Gillnet $54,160 $15,330,000 $141,300 $29,600 $128,380 $15,683,440Set Gillnet $25,320 $5,890,600 $210,950 $35,320 $49,249 $6,211,439
Total $112,210 $24,522,600 $431,400 $1,094,430 $519,829 $26,680,469
1998a Seine $21,007 $3,777,000 $221,000 $3,058,500 $356,000 $7,433,507Drift Gillnet $17,450 $10,787,000 $219,800 $104,400 $181,600 $11,310,250Set Gillnet $16,041 $5,074,600 $147,200 $240,319 $121,524 $5,599,684
Total $54,498 $19,638,600 $588,000 $3,403,219 $659,124 $24,343,441
1999a Seine $21,000 $7,086,000 $236,000 $3,000,016 $368,023 $10,711,039Drift Gillnet $20,900 $13,648,600 $116,300 $6,350 $128,086 $13,920,236Set Gillnet $12,300 $7,792,000 $87,700 $151,030 $93,250 $8,136,280
Total $54,200 $28,526,600 $440,000 $3,157,396 $589,359 $32,767,555
2000a Seine $19,040 $3,430,000 $332,110 $1,372,000 $616,000 $5,769,150Drift Gillnet $24,320 $12,131,000 $91,400 $15,076 $149,400 $12,411,196Set Gillnet $9,115 $4,461,500 $118,750 $127,047 $117,363 $4,833,775
Total $52,475 $20,022,500 $542,260 $1,514,123 $882,763 $23,014,121
2001a Seine $4,658 $522,000 $144,001 $1,219,050 $646,616 $2,536,325Drift Gillnet $9,351 $3,267,000 $56,740 $11,784 $78,492 $3,423,367Set Gillnet $9,735 $1,533,700 $37,576 $105,213 $117,091 $1,803,315
Total $23,744 $5,322,700 $238,317 $1,336,047 $842,199 $7,763,007
2002a Seine $15,969 $1,276,000 $106,401 $634,000 $455,537 $2,487,907Drift Gillnet $10,879 $4,218,000 $30,405 $8,260 $128,010 $4,395,554Set Gillnet $7,444 $1,971,700 $21,462 $75,020 $50,439 $2,126,065
Total $34,292 $7,465,700 $158,268 $717,280 $633,986 $9,009,526
2003a Seine $6,824 $1,091,084 $52,000 $743,012 $324,911 $2,217,831Drift Gillnet $11,582 $4,433,190 $61,313 $10,341 $83,203 $4,599,629Set Gillnet $6,015 $2,346,327 $81,000 $70,004 $49,149 $2,552,495
Total $24,421 $7,870,601 $194,313 $823,357 $457,263 $9,369,955
2004a Seine $37,019 $3,439,099 $125,000 $1,456,300 $407,504 $5,464,922Drift Gillnet $47,700 $7,104,216 $45,210 $7,400 $74,380 $7,278,906Set Gillnet $15,000 $3,341,111 $79,000 $51,030 $46,077 $3,532,218
Total $99,719 $13,884,426 $249,210 $1,514,730 $527,961 $16,276,046
2005a Seine $16,053 $4,208,707 $127,659 $2,107,053 $419,752 $6,879,224Drift Gillnet $40,844 $10,755,107 $111,737 $13,092 $84,776 $11,005,556Set Gillnet $16,674 $4,646,029 $101,015 $100,064 $65,000 $4,928,782
Total $73,571 $19,609,843 $340,411 $2,220,209 $569,528 $22,813,562
35
Appendix A4.–Page 4 of 4.
Note: Due to rounding in the fish ticket database, differences may occur in areas. a Exvessel information is from Area M fishermen only and does not include exvessel information from Area F.
Ex-vessel ValueYear Gear Chinook Sockeye Coho Pink Chum Total
2006a Seine $36,580 $2,829,392 $128,636 $1,514,315 $1,034,961 $5,543,884Drift Gillnet $32,072 $7,407,573 $132,248 $12,290 $127,860 $7,712,043Set Gillnet $17,264 $3,255,140 $213,534 $100,192 $69,010 $3,655,140
Total $85,916 $13,492,105 $474,418 $1,626,797 $1,231,831 $16,911,067
2007a Seine $45,840 $4,415,759 $125,321 $3,596,347 $575,326 $8,758,593Drift Gillnet $40,059 $13,695,882 $108,545 $7,851 $165,827 $14,018,165Set Gillnet $13,563 $3,291,054 $160,702 $287,656 $71,606 $3,824,582
Total $99,463 $21,402,695 $394,568 $3,891,854 $812,759 $26,601,340
2008a Seine $46,867 $4,472,322 $371,309 $9,541,042 $1,133,673 $15,565,214Drift Gillnet $31,881 $10,361,856 $367,529 $82,363 $322,817 $11,166,446Set Gillnet $7,750 $1,880,303 $220,740 $528,362 $149,294 $2,786,450
Total $86,499 $16,714,481 $959,577 $10,151,768 $1,605,785 $29,518,109
2009a Seine $72,916 $3,675,090 $335,222 $5,620,445 $2,113,134 $11,816,807Drift Gillnet $50,839 $10,899,678 $118,655 $50,627 $221,517 $11,341,317Set Gillnet $8,739 $2,899,156 $150,406 $383,826 $245,021 $3,687,147
Total $132,494 $17,473,924 $604,283 $6,054,898 $2,579,672 $26,845,271
2010a Seine $85,544 $3,226,659 $437,029 $659,303 $2,065,524 $6,474,059Drift Gillnet $57,822 $12,308,805 $147,577 $7,896 $411,124 $12,933,225Set Gillnet $10,890 $2,676,218 $173,059 $60,257 $280,757 $3,201,181
Total $154,256 $18,211,682 $757,665 $727,456 $2,757,405 $22,608,464
2011a Seine $63,660 $4,911,683 $370,767 $6,434,699 $2,744,217 $14,525,026Drift Gillnet $53,506 $7,379,768 $101,600 $63,151 $763,395 $8,361,420Set Gillnet $17,367 $2,970,435 $125,233 $294,770 $450,820 $3,858,625
Total $134,533 $15,261,886 $597,600 $6,792,620 $3,958,432 $26,745,071
2012a Seine $56,355 $4,549,968 $123,718 $651,284 $1,509,794 $6,891,119Drift Gillnet $68,892 $6,738,782 $155,273 $18,532 $1,085,438 $8,066,917Set Gillnet $8,604 $2,365,519 $69,982 $33,321 $119,919 $2,597,345
Total $133,851 $13,654,269 $348,973 $703,137 $2,715,151 $17,555,381
2013a Seine $29,626 $7,013,518 $486,649 $7,998,347 $1,915,453 $17,443,593Drift Gillnet $22,661 $9,901,890 $387,126 $84,853 $478,281 $10,874,811Set Gillnet $11,991 $4,324,702 $129,595 $275,443 $160,496 $4,902,227
Total $64,278 $21,240,110 $1,003,370 $8,358,643 $2,554,230 $33,220,631
Seine $46,766 $3,681,976 $219,666 $3,232,380 $1,232,880 $8,413,6682003–2012 Drift Gillnet $43,520 $9,108,486 $134,969 $27,354 $334,034 $9,648,362Averagea Set Gillnet $12,187 $2,967,129 $137,467 $190,948 $154,665 $3,462,396
Total $102,472 $15,757,591 $492,102 $3,450,683 $1,721,579 $21,524,427
Seine $58,827 $4,739,040 $311,569 $2,964,356 $1,010,173 $9,083,9641993–2002 Drift Gillnet $40,469 $12,814,110 $173,586 $28,879 $192,308 $13,249,351Averagea Set Gillnet $24,026 $4,601,580 $194,980 $149,528 $118,119 $5,088,233
Total $123,321 $22,154,730 $680,134 $3,142,763 $1,320,600 $27,421,548
36

Appendix A5.–Average weights and approximate exvessel prices for salmon in the Alaska Peninsula, Aleutian Islands, and Atka-Amlia areas, 1979–2013.
a Does not include processor bonuses, incentives, refrigerated sea water, or postseason adjustments.
Average Weight (lbs) Average Price ($/lb)a
Year Chinook Sockeye Coho Pink Chum Chinook Sockeye Coho Pink Chum
1979 22.9 5.8 7.4 3.6 7.3 1.18 1.10 0.92 0.38 0.531980 19.4 5.2 6.4 3.2 6.6 0.72 0.62 0.58 0.40 0.441981 17.9 5.8 7.5 3.6 7.2 1.02 1.00 0.70 0.42 0.451982 19.6 5.9 7.8 3.1 7.4 1.21 0.85 0.70 0.25 0.401983 17.5 5.5 7.6 3.8 6.9 0.71 0.86 0.49 0.27 0.331984 19.5 5.7 7.8 3.6 7.2 1.11 0.83 0.63 0.25 0.281985 19.5 5.4 7.8 4.1 7.0 1.06 1.09 0.75 0.21 0.311986 17.4 6.0 7.1 3.4 7.1 0.75 1.41 0.70 0.20 0.351987 18.6 6.3 7.6 3.5 7.1 1.20 1.65 0.98 0.25 0.391988 17.1 6.0 7.5 3.6 7.5 1.41 2.36 1.16 0.78 0.831989 17.9 5.8 7.3 3.8 6.8 1.14 1.54 0.82 0.35 0.401990 16.4 5.7 7.5 3.1 6.6 1.25 1.53 0.79 0.31 0.361991 16.4 5.6 6.9 3.1 6.4 0.77 0.86 0.53 0.12 0.231992 16.4 5.6 6.9 3.3 6.7 0.97 1.47 0.63 0.17 0.291993 17.2 5.7 6.3 3.4 6.3 0.80 0.82 0.49 0.14 0.281994 18.4 5.5 8.2 3.4 6.7 0.61 1.01 0.57 0.15 0.251995 19.8 5.4 6.7 3.6 7.0 0.74 1.10 0.42 0.17 0.221996 17.1 6.0 7.3 3.3 7.4 0.40 0.81 0.34 0.06 0.071997 16.0 5.8 7.4 3.3 6.8 0.55 0.97 0.40 0.15 0.111998 15.3 5.7 7.6 3.5 7.1 0.40 1.06 0.38 0.12 0.121999 15.1 5.3 6.1 3.1 6.8 0.39 1.13 0.30 0.12 0.102000 15.4 5.9 6.9 2.9 7.6 0.38 0.86 0.26 0.14 0.102001 14.2 6.0 6.9 3.7 7.7 0.25 0.51 0.15 0.09 0.102002 13.4 5.5 6.8 3.6 7.3 0.25 0.55 0.10 0.08 0.102003 13.4 6.0 7.6 3.8 6.8 0.25 0.52 0.14 0.05 0.102004 16.0 5.7 6.7 3.3 6.6 0.36 0.52 0.14 0.07 0.102005 13.5 6.1 6.9 3.2 6.6 0.40 0.59 0.24 0.07 0.112006 13.8 5.8 6.6 3.4 7.5 0.70 0.56 0.28 0.09 0.142007 12.9 5.6 6.7 3.7 7.1 0.60 0.65 0.27 0.13 0.132008 12.9 5.6 6.7 3.7 7.1 0.92 0.72 0.36 0.22 0.232009 15.9 5.9 6.6 3.2 6.9 0.92 0.71 0.29 0.18 0.212010 13.8 5.7 7.1 3.0 7.1 1.04 0.91 0.47 0.28 0.382011 13.2 5.9 6.2 3.3 6.7 1.05 0.91 0.56 0.36 0.462012 16.0 5.9 6.3 3.1 7.3 0.99 0.84 0.45 0.35 0.432013 11.9 5.9 6.5 3.1 7.2 0.86 1.22 0.48 0.35 0.33
1983–2002Average 16.9 5.7 7.2 3.5 7.0 0.76 1.12 0.54 0.21 0.26
2003–2012Average 14.1 5.8 6.7 3.4 7.0 0.72 0.69 0.32 0.18 0.23
37

Appendix A6.–Number of Area M and Area T limited entry permits and fishing effort in the Alaska Peninsula and Aleutian Islands Management areas, 1975–2013.
a Active Permits are defined as follows: all permanent permits, regardless of whether they have been renewed, and interim use
and interim entry permits that have been issued. Excluded from Active Permits are any permits that have been revoked and interim permits that have not been issued (renewed) for the given year.
b Making at least one delivery during the year. c During a portion of the season, in specific sections, Area T set and drift gillnet fishermen are allowed to fish in portions of the
Alaska Peninsula Area. d Confidentiality requirements prohibit the relase of this information.
Purse Seine Drift Gillnet Set GillnetArea M Area M Area M Area M Area T Area M Area M Area TActive Permits b Active Permits b Permits b,c Active Permits b Permits b,c
Year Permits a Fished Permits a Fished Fished Permits a Fished Fished
1975 126 56 173 102 6 110 40 d
1976 114 90 155 118 10 116 53 61977 113 87 156 114 15 109 57 81978 123 115 158 133 26 114 61 81979 123 136 161 178 21 115 86 101980 125 126 163 157 25 115 88 161981 127 122 164 155 18 117 88 211982 127 119 164 159 23 117 94 181983 127 122 166 159 18 116 94 71984 126 121 165 158 44 115 103 151985 127 123 165 158 44 115 103 181986 125 121 165 163 37 116 100 71987 125 116 165 163 48 116 108 91988 124 114 163 162 59 116 106 141989 126 119 164 158 64 116 111 181990 126 121 164 166 63 116 114 151991 126 126 164 162 68 116 111 121992 125 119 164 161 102 116 111 181993 125 123 164 162 50 116 114 111994 124 118 164 164 77 116 108 91995 124 118 164 164 81 116 110 121996 124 102 164 164 32 116 110 61997 122 82 164 158 42 116 110 101998 122 79 164 159 60 115 112 71999 121 74 164 160 21 115 107 d
2000 121 76 161 156 27 115 109 d
2001 121 64 160 137 4 115 99 d
2002 122 42 160 114 d 115 92 02003 120 46 160 110 4 115 86 02004 122 42 161 117 d 115 86 02005 121 46 162 131 10 115 93 d
2006 119 43 162 133 6 114 95 02007 118 46 162 127 0 114 90 02008 118 55 162 131 0 113 83 02009 119 54 162 143 0 113 91 d
2010 119 63 162 142 0 113 84 02011 119 59 162 144 0 113 93 02012 119 56 162 133 0 113 88 02013 119 61 162 133 0 113 90 0
2003–2012Average 119 51 162 131 2 114 89 0
38

Appendix A7.–Number of Area T permit holders fishing by general location in the Alaska Peninsula Area, 1984–2013.
a The Outer Port Heiden Section was closed to commercial salmon fishing and after 1989 the Alaska
Board of Fisheries adopted regulation that closed the Ilnik Section except Ilnik Lagoon to Area T permit holders.
b Confidentiality requirements prohibit the release of this information.
Ilnik and Outer Inner Cinder Total Inner Cinder Total
Year Port Heidena Port Heiden River Area T Port Heiden River Area T1984 8 19 25 52 4 11 151985 0 25 23 48 6 11 18
1986 13 23 b 37 7 0 71987 17 23 10 50 5 4 91988 22 28 18 68 7 7 141989 34 22 15 71 5 13 181990 0 28 39 67 5 11 151991 0 22 50 72 4 8 121992 0 20 85 105 4 14 18
1993 0 17 34 51 b 8 b
1994 0 18 59 77 b 7 b
1995 0 19 62 81 5 7 121996 0 0 32 32 0 6 6
1997 0 17 25 42 b 7 b
1998 0 10 50 60 b 6 b
1999 0 9 12 21 0 b b
2000 0 12 15 27 b b b
2001 0 0 4 4 0 b b
2002 0 0 b b 0 0 02003 0 0 4 4 0 0 0
2004 0 0 b b 0 0 0
2005 0 4 6 10 0 b b
2006 0 6 0 6 0 0 02007 0 0 0 0 0 0 02008 0 0 0 0 0 0 0
2009 0 0 0 0 0 b 02010 0 0 0 0 0 0 02011 0 0 0 0 0 0 02012 0 0 0 0 0 0 02013 0 0 0 0 0 0 0
Drift Gillnet Set Gillnet
39

40
APPENDIX B. COMMERCIAL HARVEST DATA
41
Appendix B1.–Alaska Peninsula and Aleutian Islands commercial salmon harvest in numbers of fish by year, in the South Alaska Peninsula, North Alaska Peninsula, Aleutian Islands, and Atka-Amlia areas, 1906–2013.
-continued-
Year Chinook Sockeye Coho Pink Chum Totala
1906 South Peninsula 0 0 0 0 0 0North Peninsula 1,500 135,000 0 0 0 136,500Aleutian Islands 0 0 0 0 0 0Total 1,500 135,000 0 0 0 136,500
1907 South Peninsula 0 0 0 0 0 0North Peninsula 1,700 66,500 3,200 1,500 0 72,900Aleutian Islands 0 0 0 0 0 0Total 1,700 66,500 3,200 1,500 0 72,900
1908 South Peninsula 0 69,400 0 0 0 69,400North Peninsula 1,500 166,900 0 0 0 168,400Aleutian Islands 0 0 0 0 0 0Total 1,500 236,300 0 0 0 237,800
1909 South Peninsula 0 108,400 7,200 0 0 115,600North Peninsula 1,500 143,000 0 0 1,000 145,500Aleutian Islands 0 0 0 0 0 0Total 1,500 251,400 7,200 0 1,000 261,100
1910 South Peninsula 0 46,300 5,500 0 0 51,800North Peninsula 0 0 0 0 0 0Aleutian Islands 0 0 0 0 0 0Total 0 46,300 5,500 0 0 51,800
1911 South Peninsula 0 240,800 12,400 25,200 83,000 361,400North Peninsula 0 129,600 0 0 0 129,600Aleutian Islands 0 9,300 0 0 0 9,300Total 0 379,700 12,400 25,200 83,000 500,300
1912 South Peninsula 0 334,400 27,000 40,400 195,000 596,800North Peninsula 900 252,700 11,000 0 2,400 267,000Aleutian Islands 0 0 0 0 0 0Total 900 587,100 38,000 40,400 197,400 863,800
1913 South Peninsula 1,800 299,700 0 0 7,000 308,500North Peninsula 600 888,800 18,700 0 2,000 910,100Aleutian Islands 0 0 0 0 0 0Total 2,400 1,188,500 18,700 0 9,000 1,218,600
1914 South Peninsula 600 628,900 0 311,000 221,100 1,171,500North Peninsula 8,100 1,325,100 0 0 0 1,333,200Aleutian Islands 0 0 0 0 0 0Total 8,700 1,954,000 9,900 311,000 221,100 2,504,700
1915 South Peninsula 4,800 367,900 16,200 120,100 333,100 842,100North Peninsula 14,000 1,974,300 0 0 54,800 2,043,100Aleutian Islands 0 0 0 0 0 0Total 18,800 2,342,200 16,200 120,100 387,900 2,885,200
42
Appendix B1.–Page 2 of 10.
-continued-
Year Chinook Sockeye Coho Pink Chum Totala
1916 South Peninsula 6,800 730,900 34,100 576,100 508,900 1,856,800North Peninsula 44,200 1,974,700 0 2,600 191,400 2,212,900Aleutian Islands 0 76,500 1,200 180,300 100 258,100Total 51,000 2,782,100 35,300 759,000 700,400 4,327,800
1917 South Peninsula 6,400 1,486,100 4,600 72,100 415,500 1,984,700North Peninsula 20,000 679,600 6,800 600 90,300 797,300Aleutian Islands 0 70,400 3,800 600 23,100 97,900Total 26,400 2,236,100 15,200 73,300 528,900 2,879,900
1918 South Peninsula 8,700 1,014,100 16,300 2,150,000 1,501,000 4,690,900North Peninsula 9,700 1,208,500 0 1,200 252,300 1,471,700Aleutian Islands 0 55,200 4,400 75,600 135,200 270,400Total 18,400 2,277,800 20,700 2,227,600 1,888,500 6,433,000
1919 South Peninsula 9,600 619,100 56,100 80,200 921,400 1,686,400North Peninsula 19,600 389,200 0 12,000 143,500 564,300Aleutian Islands 0 3,900 800 4,000 0 8,700Total 29,200 1,012,200 56,900 96,200 1,064,900 2,259,400
1920 South Peninsula 7,800 1,142,300 47,700 2,109,800 934,000 4,241,600North Peninsula 19,000 1,371,900 0 0 37,000 1,427,900Aleutian Islands 0 10,100 2,800 0 0 12,900Total 26,800 2,524,300 50,500 2,109,800 971,000 5,682,400
1921 South Peninsula 700 830,700 1,500 47,300 84,600 964,800North Peninsula 12,500 1,746,500 0 0 32,800 1,791,800Aleutian Islands 0 0 0 0 0 0Total 13,200 2,577,200 1,500 47,300 117,400 2,756,600
1922 South Peninsula 6,900 3,376,800 2,200 756,700 349,300 4,491,900North Peninsula 10,400 667,900 0 0 42,900 721,200Aleutian Islands 0 14,000 0 0 0 14,000Total 17,300 4,058,700 2,200 756,700 392,200 5,227,100
1923 South Peninsula 4,100 1,827,200 75,300 143,600 538,900 2,589,100North Peninsula 9,100 731,700 100 0 25,800 766,700Aleutian Islands 0 0 0 0 0 0Total 13,200 2,558,900 75,400 143,600 564,700 3,355,800
1924 South Peninsula 3,900 1,352,000 127,300 3,931,300 1,330,700 6,745,200North Peninsula 10,500 701,700 0 0 48,400 760,600Aleutian Islands 0 24,900 0 673,800 100 698,800Total 14,400 2,078,600 127,300 4,605,100 1,379,200 8,204,600
1925 South Peninsula 10,700 820,500 127,100 382,100 1,116,800 2,457,200North Peninsula 10,600 400,200 0 0 53,900 464,700Aleutian Islands 0 18,600 0 3,800 9,100 31,500Total 21,300 1,239,300 127,100 385,900 1,179,800 2,953,400
1926 South Peninsula 9,500 3,071,500 193,800 3,719,700 1,179,800 8,174,300North Peninsula 23,900 672,900 0 0 71,500 768,300Aleutian Islands 0 1,300 0 521,700 7,800 530,800Total 33,400 3,745,700 193,800 4,241,400 1,259,100 9,473,400
43
Appendix B1.–Page 3 of 10.
-continued-
Year Chinook Sockeye Coho Pink Chum Totala
1927 South Peninsula 9,600 714,700 125,300 1,455,500 1,299,700 3,604,800North Peninsula 16,500 230,600 100 0 87,000 334,200Aleutian Islands 0 17,300 0 334,600 0 351,900Total 26,100 962,600 125,400 1,790,100 1,386,700 4,290,900
1928 S.Pen & Aleutian 7,700 971,500 96,600 900,900 2,416,300 4,393,000North Peninsula 4,600 855,600 0 0 83,500 943,700Total 12,300 1,827,100 96,600 900,900 2,499,800 5,336,700
1929 S.Pen & Aleutian 10,500 935,800 84,500 1,793,500 2,429,000 5,253,300North Peninsula 4,100 878,000 0 0 145,200 1,027,300Total 14,600 1,813,800 84,500 1,793,500 2,574,200 6,280,600
1930 S.Pen & Aleutian 10,900 935,200 161,100 6,094,800 1,278,100 8,480,100North Peninsula 3,800 167,700 0 0 93,400 265,200Total 14,700 1,102,900 161,100 6,094,800 1,371,800 8,745,300
1931 S.Pen & Aleutian 11,000 1,863,200 128,700 997,900 1,216,000 4,211,800North Peninsula 1,300 761,000 0 0 54,900 817,200Total 12,300 2,624,200 128,700 997,900 1,265,900 5,029,000
1932 S.Pen & Aleutian 17,400 2,977,300 112,300 3,604,800 817,300 7,529,100North Peninsula 3,200 977,100 0 0 56,300 1,036,600Total 20,600 3,954,400 112,300 3,604,800 873,600 8,565,700
1933 S.Pen & Aleutian 12,600 1,996,700 190,000 3,109,200 1,173,900 6,482,400North Peninsula 1,100 350,100 0 0 16,000 367,200Total 13,700 2,346,800 190,000 3,109,200 1,189,900 6,849,600
1934 S.Pen & Aleutian 17,600 1,372,400 247,100 6,538,500 1,940,300 10,115,900North Peninsula 1,600 1,091,300 0 400 13,000 1,106,300Total 19,200 2,463,700 247,100 6,538,900 1,953,300 11,222,200
1935 S.Pen & Aleutian 13,900 978,400 117,200 5,386,200 2,003,100 8,498,800North Peninsula 1,000 479,200 0 100 33,800 514,100Total 14,900 1,457,600 117,200 5,386,300 2,036,900 9,012,900
1936 S.Pen & Aleutian 14,400 3,662,600 284,600 9,471,000 2,310,900 15,743,500North Peninsula 1,000 610,700 0 2,800 19,000 633,500Total 15,400 4,273,300 284,600 9,473,800 2,329,900 16,377,000
1937 S.Pen & Aleutian 9,300 1,558,000 73,900 9,302,000 1,506,700 12,449,900North Peninsula 1,600 860,900 0 100 65,600 928,200Total 10,900 2,418,900 73,900 9,302,100 1,572,300 13,378,100
1938 S.Pen & Aleutian 6,400 772,100 220,700 7,169,100 1,476,600 9,644,900North Peninsula 5,900 1,009,600 0 0 34,700 1,050,200Total 12,300 1,781,700 220,700 7,169,100 1,511,300 10,695,100
1939 S.Pen & Aleutian 16,500 1,881,700 98,900 6,005,300 1,440,600 9,443,000North Peninsula 3,900 746,200 0 0 82,200 832,300Total 20,400 2,527,900 98,900 6,005,300 1,522,800 10,275,300
1940 S.Pen & Aleutian 9,100 1,040,300 184,200 7,182,800 2,326,300 10,472,700North Peninsula 700 678,900 0 0 65,600 745,200Total 9,800 1,719,200 184,200 7,182,800 2,391,900 11,487,900
44
Appendix B1.–Page 4 of 10.
-continued-
Year Chinook Sockeye Coho Pink Chum Totala
1941 S.Pen & Aleutian 13,000 1,072,000 183,000 5,347,000 1,542,000 8,157,800North Peninsula 700 491,700 0 3,200 30,200 525,800Total 13,700 1,563,700 183,000 5,350,200 1,572,200 8,682,800
1942 S.Pen & Aleutian 4,800 810,100 123,000 6,762,600 1,321,100 9,021,600North Peninsula 0 0 0 0 0 0Total 4,800 810,100 123,000 6,762,600 1,321,100 9,021,600
1943 S.Pen & Aleutian 21,700 2,397,700 90,600 4,360,200 924,500 7,794,700North Peninsula 200 567,400 0 1,300 50,400 619,300Total 21,900 2,965,100 90,600 4,361,500 974,900 8,414,000
1944 S.Pen & Aleutian 9,900 538,600 238,700 2,653,800 985,600 4,426,600North Peninsula 100 414,700 0 2,600 157,900 575,300Total 10,000 953,300 238,700 2,656,400 1,143,500 5,001,900
1945 S.Pen & Aleutian 21,400 813,400 116,100 3,639,600 948,900 5,539,400North Peninsula 100 394,400 0 2,500 335,100 732,100Total 21,500 1,207,800 116,100 3,642,100 1,284,000 6,271,500
1946 S.Pen & Aleutian 6,100 752,300 151,400 1,964,000 1,219,900 4,093,700North Peninsula 2,500 697,700 300 0 36,000 736,500Total 8,600 1,450,000 151,700 1,964,000 1,255,900 4,830,200
1947 S.Pen & Aleutian 3,400 1,137,100 55,800 2,319,600 1,219,200 4,735,100North Peninsula 100 357,700 100 100 75,000 433,000Total 3,500 1,491,800 55,900 2,319,700 1,294,200 5,168,100
1948 S.Pen & Aleutian 1,200 285,900 39,200 1,683,700 1,139,600 3,149,600North Peninsula 1,200 477,600 17,200 0 161,700 658,700Total 3,400 763,500 56,400 1,683,700 1,301,300 3,808,300
1949 S.Pen & Aleutian 3,800 637,500 19,500 1,544,000 560,900 2,765,700North Peninsula 700 137,100 25,700 0 40,700 204,200Total 4,500 774,600 45,200 1,544,000 601,600 2,969,900
1950 S.Pen & Aleutian 4,000 1,745,300 70,700 1,613,700 562,500 3,996,200North Peninsula 1,100 127,800 37,800 0 217,600 284,300Total 5,100 1,873,100 108,500 1,613,700 780,100 4,380,500
1951 South Peninsula 1,500 264,200 55,700 2,844,800 683,100 3,849,300North Peninsula 1,200 358,900 32,900 20,400 203,000 616,400Aleutians 0 11,700 400 500 94,500 107,100Total 2700 634,800 89000 2865700 980,600 4,572,800
1952 South Peninsula 9,200 894,500 39,200 908,500 1,040,800 2,892,200North Peninsula 700 354,800 54,200 1,400 246,900 658,000Aleutian Islands 200 42,800 0 31,800 25,700 100,500Total 10,100 1,292,100 93,400 941,700 1,313,400 3,650,700
1953 South Peninsula 7,200 1,039,200 47,900 2,743,900 1,464,600 5,302,800North Peninsula 800 537,300 26,200 18,300 224,400 807,000Aleutian Islands 0 4,200 500 69,200 800 74,700Total 8,000 1,580,700 74,600 2,831,400 1,689,800 6,184,500
45
Appendix B1.–Page 5 of 10.
-continued-
Year Chinook Sockeye Coho Pink Chum Totala
1954 South Peninsula 4,200 636,300 49,400 2,033,300 1,413,400 4,136,600North Peninsula 3,400 354,700 35,000 18,500 405,000 816,600Aleutian Islands 0 6,300 800 566,500 200 573,800Total 7,600 997,300 85,200 2,618,300 1,818,600 5,527,000
1955 South Peninsula 5,400 550,100 44,800 2,529,200 688,200 3,817,700North Peninsula 4,100 586,600 6,200 900 129,600 727,400Aleutian Islands 0 12,600 100 31,100 400 44,200Total 9,500 1,149,300 51,100 2,561,200 818,200 4,589,300
1956 South Peninsula 4,800 641,400 61,900 2,740,700 1,618,700 5,067,500North Peninsula 4,200 1,370,900 8,200 28,500 427,400 1,839,200Aleutian Islands 0 400 0 33,900 0 34,300Total 9,000 2,012,700 70,100 2,803,100 2,046,100 6,941,000
1957 South Peninsula 5,800 341,900 49,900 913,100 1,281,400 2,592,100North Peninsula 1,000 327,900 18,300 3,300 274,900 625,400Aleutian Islands 2,300 27,300 100 500 13,900 44,100Total 9,100 697,100 68,300 916,900 1,570,200 3,261,600
1958 South Peninsula 800 186,100 70,600 1,385,200 841,000 2,483,700North Peninsula 15,000 473,800 57,100 60,400 254,800 861,100Aleutian Islands 0 300 0 613,200 3,700 617,200Total 15,800 660,200 127,700 2,058,800 1,099,500 3,962,000
1959 South Peninsula 900 217,500 8,500 915,600 711,700 1,854,200North Peninsula 28,700 634,900 59,100 9,600 404,700 1,137,000Aleutian Islands 0 6,100 0 12,000 100 18,200Total 29,600 858,500 67,600 937,200 1,116,500 3,009,400
1960 South Peninsula 1,700 379,000 1,800 1,197,500 904,400 2,484,400North Peninsula 10,400 692,800 44,000 34,700 607,200 1,389,100Aleutian Islands 0 7,600 0 444,900 300 452,800Total 12,100 1,079,400 45,800 1,677,100 1,511,900 4,326,300
1961 South Peninsula 900 456,800 10,400 1,727,800 748,600 2,944,500North Peninsula 6,100 387,700 24,600 3,000 153,300 574,700Aleutian Islands 0 2,700 0 94,000 200 96,900Total 7,000 847,200 35,000 1,824,800 902,100 3,616,100
1962 South Peninsula 3,300 420,000 12,500 1,965,500 824,800 3,226,100North Peninsula 5,400 249,700 35,200 31,200 34,900 356,400Aleutian Islands 0 5,500 100 2,001,700 1,200 2,008,500Total 8,700 675,200 47,800 3,998,400 860,900 5,591,000
1963 South Peninsula 1,900 204,400 16,500 2,367,700 461,300 3,051,800North Peninsula 3,600 225,200 40,500 6,900 49,900 326,100Aleutian Islands 0 4,500 0 93,900 300 98,700Total 5,500 434,100 57,000 2,468,500 511,500 3,476,600
1964 South Peninsula 2,000 370,800 13,600 2,740,400 751,000 3,877,800North Peninsula 3,600 250,800 36,600 6,800 139,000 436,800Aleutian Islands 0 200 0 194,100 2,300 196,600Total 5,600 621,800 50,200 2,941,300 892,300 4,511,200
46

Appendix B1.–Page 6 of 10.
-continued-
Year Chinook Sockeye Coho Pink Chum Totala
1965 South Peninsula 2,100 915,700 34,200 2,884,100 556,400 4,392,500North Peninsula 6,100 199,500 34,500 2,100 69,700 311,900Aleutian Islands 0 0 0 0 0 0Total 8,200 1,115,200 68,700 2,886,200 626,100 4,704,400
1966 South Peninsula 1,400 606,200 6,300 302,300 494,400 1,410,600North Peninsula 5,600 245,300 37,300 16,000 82,800 387,000Aleutian Islands 0 1,000 0 63,500 700 65,200Total 7,000 852,500 43,600 381,800 577,900 1,862,800
1967 South Peninsula 1,600 294,100 2,900 77,800 245,200 621,600North Peninsula 5,500 224,700 46,800 700 41,300 319,000Aleutians 0 200 0 7,900 0 8,100Total 7,100 519,000 49,700 86,400 286,500 948,700
1968 South Peninsula 1,400 699,800 31,100 1,287,100 325,300 2,344,700North Peninsula 4,500 237,100 64,900 200 73,500 380,200Aleutian Islands 0 2,000 100 902,800 800 905,700Total 5,900 938,900 96,100 2,190,100 399,600 3,630,600
1969 South Peninsula 1,900 912,800 10,900 1,219,400 389,200 2,534,200North Peninsula 4,800 321,300 49,100 100 28,100 403,400Aleutian Islands 0 1,900 0 242,200 1,500 245,600Total 6,700 1,236,000 60,000 1,461,700 418,800 3,183,200
1970 South Peninsula 1,806 1,779,525 32,571 1,737,985 993,349 4,545,236North Peninsula 3,829 187,793 26,327 7,904 47,989 273,842Aleutian Islands 6 208 135 644,121 3,029 647,499Total 5,644 1,967,526 59,033 2,390,010 1,044,367 5,466,580
1971 South Peninsula 2,174 716,087 16,907 1,445,031 1,365,957 3,546,156North Peninsula 2,187 353,784 8,222 297 64,154 428,644Aleutian Islands 0 333 2 45,114 58 45,507Total 4,361 1,070,204 25,131 1,490,442 1,430,169 4,020,307
1972 South Peninsula 1,332 557,422 8,021 78,221 731,814 1,376,810North Peninsula 1,790 179,325 9,684 129 84,687 275,615Aleutian Islands 0 69 1 2,784 6 2,860Total 3,122 736,816 17,706 81,134 816,507 1,655,285
1973 South Peninsula 415 330,091 6,599 58,051 292,943 688,099North Peninsula 2,569 165,388 19,776 143 152,773 340,649Aleutian Islands 0 0 0 2,042 0 2,042Total 3,042 495,481 26,375 60,236 445,716 1,030,850
1974 South Peninsula 581 197,153 9,366 100,601 71,826 379,527North Peninsula 2,710 246,209 16,799 10,599 34,417 310,734Aleutian Islands 0 0 0 0 0 0Total 3,301 443,362 26,165 111,200 106,243 690,271
1975 South Peninsula 117 243,548 67 60,642 130,750 435,124North Peninsula 2,093 233,293 28,349 295 8,770 272,800Aleutian Islands 0 19,402 0 659 1,881 21,942Total 2,210 496,243 28,422 61,596 141,401 729,872
47

Appendix B1.–Page 7 of 10.
-continued-
Year Chinook Sockeye Coho Pink Chum Totala
1976 South Peninsula 2,196 375,027 216 2,366,833 532,503 3,276,775North Peninsula 4,947 641,134 26,061 672 73,589 746,403Aleutian Islands 0 0 0 0 0 0Total 7,149 1,016,161 26,277 2,367,505 606,092 4,023,184
1977 South Peninsula 559 311,722 2,108 1,448,648 243,167 2,006,204North Peninsula 5,489 472,006 34,137 888 129,168 641,688Aleutian Islands 0 0 0 0 0 0Total 6,048 783,728 36,245 1,449,536 372,335 2,647,892
1978 South Peninsula 773 579,411 60,774 5,590,145 546,182 6,777,285North Peninsula 13,524 896,616 63,341 485,224 163,804 1,622,509Aleutian Islands 0 1,829 0 38,109 6 39,944Total 15,031 1,477,856 124,115 6,113,478 709,992 8,440,472
1979 South Peninsula 2,141 1,149,927 356,867 6,564,914 482,930 8,556,779North Peninsula 15,704 1,979,167 112,835 4,994 65,711 2,178,411Aleutian Islands 0 12,206 0 539,393 242 551,841Total 19,248 3,141,300 469,702 7,109,301 548,883 11,288,434
1980 South Peninsula 4,794 3,613,025 274,181 7,861,470 1,353,112 13,106,582North Peninsula 16,627 1,397,118 127,878 301,672 700,196 2,543,491Aleutian Islands 2 9,226 2 2,597,461 4,874 2,611,565Total 21,601 5,019,370 402,061 10,760,603 2,058,183 18,261,818
1981 South Peninsula 11,182 2,241,513 162,223 5,033,028 1,768,475 9,216,421North Peninsula 18,385 1,844,335 155,420 11,217 706,818 2,736,175Aleutian Islands 16 5,430 188 302,786 6,553 314,973Total 30,073 4,091,278 317,831 5,347,031 2,481,846 12,268,059
1982 South Peninsula 9,845 2,345,981 256,046 6,734,905 2,272,495 11,619,272North Peninsula 29,770 1,435,277 238,016 12,321 331,133 2,046,517Aleutian Islands 0 2,672 28 1,447,818 6,148 1,456,666Total 39,958 3,783,933 494,090 8,195,044 2,609,776 15,122,801
1983 South Peninsula 26,571 2,556,557 127,657 2,827,622 1,704,072 7,242,479North Peninsula 29,006 2,090,142 75,138 3,404 348,307 2,545,997Aleutian Islands 0 4,405 0 2,005 11,361 17,771Total 56,050 4,654,336 202,795 2,833,031 2,064,155 9,810,367
1984b South Peninsula 9,198 2,318,028 310,950 11,589,258 1,654,622 15,882,056North Peninsula 22,747 1,734,851 198,582 27,419 796,723 2,780,322Aleutian Islands 26 67,163 1,923 2,309,665 32,025 2,410,802Total 32,190 4,120,047 511,455 13,926,342 2,483,375 21,073,409
1985 South Peninsula 6,642 2,144,416 172,514 4,431,016 1,348,726 8,103,314North Peninsula 23,403 2,596,073 176,118 3,054 666,616 3,465,264Aleutian Islands 40 2,750 0 90 14,175 17,055Total 30,210 4,743,247 348,632 4,434,160 2,029,532 11,585,781
1986 South Peninsula 5,589 1,223,089 235,854 4,031,487 1,749,651 7,245,670North Peninsula 11,735 2,463,734 164,071 22,630 271,216 2,933,386Aleutian Islands 11 7,702 60 42,621 38,819 89,213Total 17,340 3,694,526 399,985 4,096,738 2,059,686 10,268,275
48
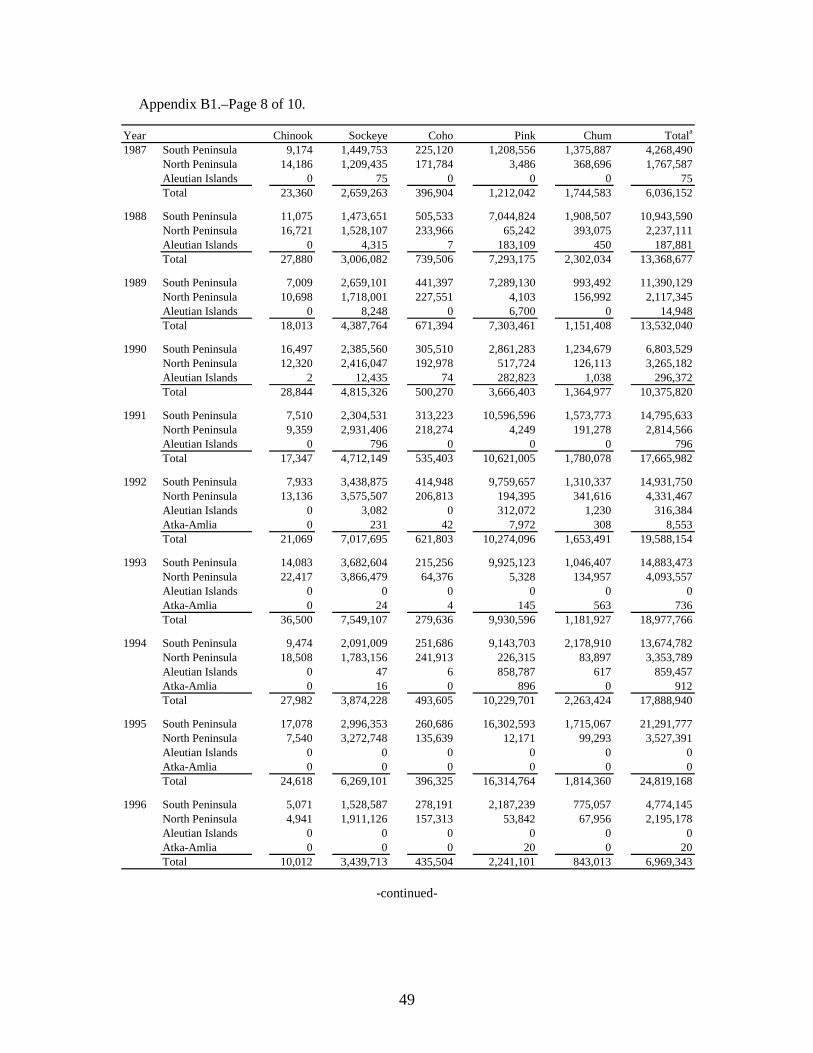
Appendix B1.–Page 8 of 10.
-continued-
Year Chinook Sockeye Coho Pink Chum Totala
1987 South Peninsula 9,174 1,449,753 225,120 1,208,556 1,375,887 4,268,490North Peninsula 14,186 1,209,435 171,784 3,486 368,696 1,767,587Aleutian Islands 0 75 0 0 0 75Total 23,360 2,659,263 396,904 1,212,042 1,744,583 6,036,152
1988 South Peninsula 11,075 1,473,651 505,533 7,044,824 1,908,507 10,943,590North Peninsula 16,721 1,528,107 233,966 65,242 393,075 2,237,111Aleutian Islands 0 4,315 7 183,109 450 187,881Total 27,880 3,006,082 739,506 7,293,175 2,302,034 13,368,677
1989 South Peninsula 7,009 2,659,101 441,397 7,289,130 993,492 11,390,129North Peninsula 10,698 1,718,001 227,551 4,103 156,992 2,117,345Aleutian Islands 0 8,248 0 6,700 0 14,948Total 18,013 4,387,764 671,394 7,303,461 1,151,408 13,532,040
1990 South Peninsula 16,497 2,385,560 305,510 2,861,283 1,234,679 6,803,529North Peninsula 12,320 2,416,047 192,978 517,724 126,113 3,265,182Aleutian Islands 2 12,435 74 282,823 1,038 296,372Total 28,844 4,815,326 500,270 3,666,403 1,364,977 10,375,820
1991 South Peninsula 7,510 2,304,531 313,223 10,596,596 1,573,773 14,795,633North Peninsula 9,359 2,931,406 218,274 4,249 191,278 2,814,566Aleutian Islands 0 796 0 0 0 796Total 17,347 4,712,149 535,403 10,621,005 1,780,078 17,665,982
1992 South Peninsula 7,933 3,438,875 414,948 9,759,657 1,310,337 14,931,750North Peninsula 13,136 3,575,507 206,813 194,395 341,616 4,331,467Aleutian Islands 0 3,082 0 312,072 1,230 316,384Atka-Amlia 0 231 42 7,972 308 8,553Total 21,069 7,017,695 621,803 10,274,096 1,653,491 19,588,154
1993 South Peninsula 14,083 3,682,604 215,256 9,925,123 1,046,407 14,883,473North Peninsula 22,417 3,866,479 64,376 5,328 134,957 4,093,557Aleutian Islands 0 0 0 0 0 0Atka-Amlia 0 24 4 145 563 736Total 36,500 7,549,107 279,636 9,930,596 1,181,927 18,977,766
1994 South Peninsula 9,474 2,091,009 251,686 9,143,703 2,178,910 13,674,782North Peninsula 18,508 1,783,156 241,913 226,315 83,897 3,353,789Aleutian Islands 0 47 6 858,787 617 859,457Atka-Amlia 0 16 0 896 0 912Total 27,982 3,874,228 493,605 10,229,701 2,263,424 17,888,940
1995 South Peninsula 17,078 2,996,353 260,686 16,302,593 1,715,067 21,291,777North Peninsula 7,540 3,272,748 135,639 12,171 99,293 3,527,391Aleutian Islands 0 0 0 0 0 0Atka-Amlia 0 0 0 0 0 0Total 24,618 6,269,101 396,325 16,314,764 1,814,360 24,819,168
1996 South Peninsula 5,071 1,528,587 278,191 2,187,239 775,057 4,774,145North Peninsula 4,941 1,911,126 157,313 53,842 67,956 2,195,178Aleutian Islands 0 0 0 0 0 0Atka-Amlia 0 0 0 20 0 20Total 10,012 3,439,713 435,504 2,241,101 843,013 6,969,343
49

Appendix B1.–Page 9 of 10.
-continued-
Year Chinook Sockeye Coho Pink Chum Totala
1997 South Peninsula 7,163 2,258,189 112,432 2,303,926 606,254 5,287,964North Peninsula 10,352 2,151,010 94,776 50,701 97,380 2,404,219Aleutian Islands 0 0 0 0 0 0Atka-Amlia 0 0 0 0 0 0Total 17,515 4,409,199 207,208 2,354,627 703,634 7,692,183
1998 South Peninsula 4,796 2,170,803 154,170 8,040,681 711,526 11,081,976North Peninsula 5,288 1,087,552 134,724 34,810 69,516 1,332,530Aleutian Islands 0 0 0 0 0 0Atka-Amlia 0 0 0 0 0 0Total 10,084 3,258,355 288,894 8,075,491 781,042 12,414,506
1999 South Peninsula 4,815 2,948,267 192,485 8,443,343 816,966 12,405,876North Peninsula 4,886 1,783,804 53,907 4,367 50,120 1,897,084Aleutian Islands 0 0 0 0 0 0Atka-Amlia 0 0 0 0 0 0Total 9,701 4,732,071 246,392 8,447,710 867,086 14,302,960
2000 South Peninsula 5,104 1,984,576 257,146 3,549,545 1,055,316 6,851,687North Peninsula 3,904 1,968,882 83,655 34,373 93,696 2,184,510Aleutian Islands 1 0 59 256,050 0 256,110Atka-Amlia 0 0 0 0 0 0Total 9,009 3,953,458 340,860 3,839,968 1,149,012 9,292,307
2001 South Peninsula 2,302 607,756 210,899 4,012,057 921,986 5,755,000North Peninsula 4,412 1,147,030 22,162 12,469 174,523 1,360,596Aleutian Islands 0 0 0 0 0 0Atka-Amlia 0 0 0 0 0 0Total 6,714 1,754,786 233,061 4,024,526 1,096,509 7,115,596
2002 South Peninsula 6,399 1,035,232 202,717 2,170,376 819,030 4,233,754North Peninsula 3,852 1,415,872 28,751 21,461 51,040 1,520,976Aleutian Islands 0 0 0 0 0 0Atka-Amlia 0 0 0 0 0 0Total 10,251 2,451,104 231,468 2,191,837 870,070 5,754,730
2003 South Peninsula 2,712 1,054,208 131,097 4,258,274 637,305 6,083,596North Peninsula 4,545 1,477,391 53,137 18,624 38,755 1,592,452Aleutian Islands 0 0 0 0 0 0Atka- Amlia 0 0 0 0 0 0Total 7,257 2,531,599 184,234 4,276,898 676,060 7,676,048
2004 South Peninsula 7,050 2,199,944 235,600 6,665,831 790,109 9,898,534North Peninsula 10,402 2,433,778 33,920 15,828 14,958 2,508,886Aleutian Islands 0 0 0 0 0 0Atka- Amlia 0 0 0 0 0 0Total 17,452 4,633,722 269,520 6,681,659 805,067 12,407,420
2005 South Peninsula 4,487 2,337,097 143,617 9,416,197 739,460 12,640,858North Peninsula 9,198 3,115,807 71,192 3,830 42,539 3,242,566Aleutian Islands 0 0 0 0 0 0Atka- Amlia 0 0 0 0 0 0Total 13,685 5,452,904 214,809 9,420,027 781,999 15,883,424
50
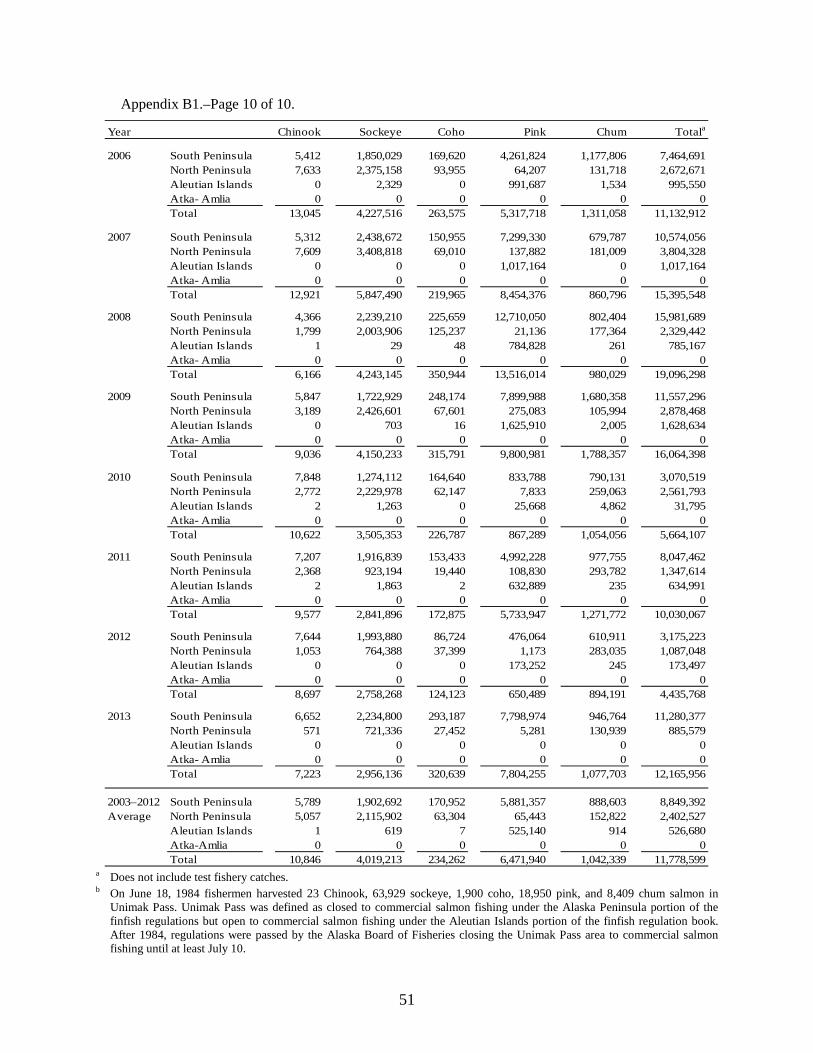
Appendix B1.–Page 10 of 10.
a Does not include test fishery catches. b On June 18, 1984 fishermen harvested 23 Chinook, 63,929 sockeye, 1,900 coho, 18,950 pink, and 8,409 chum salmon in
Unimak Pass. Unimak Pass was defined as closed to commercial salmon fishing under the Alaska Peninsula portion of the finfish regulations but open to commercial salmon fishing under the Aleutian Islands portion of the finfish regulation book. After 1984, regulations were passed by the Alaska Board of Fisheries closing the Unimak Pass area to commercial salmon fishing until at least July 10.
Year Chinook Sockeye Coho Pink Chum Totala
2006 South Peninsula 5,412 1,850,029 169,620 4,261,824 1,177,806 7,464,691North Peninsula 7,633 2,375,158 93,955 64,207 131,718 2,672,671Aleutian Islands 0 2,329 0 991,687 1,534 995,550Atka- Amlia 0 0 0 0 0 0Total 13,045 4,227,516 263,575 5,317,718 1,311,058 11,132,912
2007 South Peninsula 5,312 2,438,672 150,955 7,299,330 679,787 10,574,056North Peninsula 7,609 3,408,818 69,010 137,882 181,009 3,804,328Aleutian Islands 0 0 0 1,017,164 0 1,017,164Atka- Amlia 0 0 0 0 0 0Total 12,921 5,847,490 219,965 8,454,376 860,796 15,395,548
2008 South Peninsula 4,366 2,239,210 225,659 12,710,050 802,404 15,981,689North Peninsula 1,799 2,003,906 125,237 21,136 177,364 2,329,442Aleutian Islands 1 29 48 784,828 261 785,167Atka- Amlia 0 0 0 0 0 0Total 6,166 4,243,145 350,944 13,516,014 980,029 19,096,298
2009 South Peninsula 5,847 1,722,929 248,174 7,899,988 1,680,358 11,557,296North Peninsula 3,189 2,426,601 67,601 275,083 105,994 2,878,468Aleutian Islands 0 703 16 1,625,910 2,005 1,628,634Atka- Amlia 0 0 0 0 0 0Total 9,036 4,150,233 315,791 9,800,981 1,788,357 16,064,398
2010 South Peninsula 7,848 1,274,112 164,640 833,788 790,131 3,070,519North Peninsula 2,772 2,229,978 62,147 7,833 259,063 2,561,793Aleutian Islands 2 1,263 0 25,668 4,862 31,795Atka- Amlia 0 0 0 0 0 0Total 10,622 3,505,353 226,787 867,289 1,054,056 5,664,107
2011 South Peninsula 7,207 1,916,839 153,433 4,992,228 977,755 8,047,462North Peninsula 2,368 923,194 19,440 108,830 293,782 1,347,614Aleutian Islands 2 1,863 2 632,889 235 634,991Atka- Amlia 0 0 0 0 0 0Total 9,577 2,841,896 172,875 5,733,947 1,271,772 10,030,067
2012 South Peninsula 7,644 1,993,880 86,724 476,064 610,911 3,175,223North Peninsula 1,053 764,388 37,399 1,173 283,035 1,087,048Aleutian Islands 0 0 0 173,252 245 173,497Atka- Amlia 0 0 0 0 0 0Total 8,697 2,758,268 124,123 650,489 894,191 4,435,768
2013 South Peninsula 6,652 2,234,800 293,187 7,798,974 946,764 11,280,377North Peninsula 571 721,336 27,452 5,281 130,939 885,579Aleutian Islands 0 0 0 0 0 0Atka- Amlia 0 0 0 0 0 0Total 7,223 2,956,136 320,639 7,804,255 1,077,703 12,165,956
2003–2012 South Peninsula 5,789 1,902,692 170,952 5,881,357 888,603 8,849,392Average North Peninsula 5,057 2,115,902 63,304 65,443 152,822 2,402,527
Aleutian Islands 1 619 7 525,140 914 526,680Atka-Amlia 0 0 0 0 0 0Total 10,846 4,019,213 234,262 6,471,940 1,042,339 11,778,599
51

52
Appendix B2.–Alaska Peninsula, and Aleutian Islands Management Areas commercial salmon harvest in numbers of fish by statistical area, section, and district, 2013.
-continued-
Statistical Number of Salmona
Area Section Chinook Sockeye Coho Pink Chum Total
SOUTH PENINSULA
SOUTHEASTERN DISTRICT
281-15 Kupreanof Point 22 7,224 249 24,357 1,285 33,137281-25 Stepovak Bay 238 83,673 4,256 61,139 13,611 162,917
East Stepovak Section Total 260 90,897 4,505 85,496 14,896 196,054
281-30 Stepovak Flats Section 29 1,038 52 10,300 12,070 23,489
281-40 Grub Gulch/Clark Bay 20 16,793 16 268 537 17,634281-50 Orzinski Bay 6 1,759 18 67 60 1,910281-55 American Bay 54 21,362 21 2,597 1,430 25,464281-62 Chichagof Bay 42 13,382 26 335 416 14,201281-65 Suzy Creek 1 4,392 21 513 252 5,179281-67 Dorenoi Bay 17 5,047 21 351 299 5,735
Northwest Stepovak Section Total 140 62,735 123 4,131 2,994 70,123
281-70 Southwest Stepovak Section 249 77,058 15,490 163,298 9,259 265,354
281-80 Balboa Bay Section 27 17,454 1,411 20,409 2,603 41,904
281-90 Beaver Bay Section 0 671 51 43,707 1,132 45,561
282-10 Popof Strait/Squaw Harbor 154 50,493 5,360 199,381 26,955 282,343282-11 Unga Cape/East Popof 3,111 490,726 86,296 2,228,256 279,005 3,087,394282-20 Archeredin Bay 46 43,400 1,655 305,393 15,925 366,419282-25 West Unga Island 71 59,824 4,678 619,610 28,957 713,140282-30 Outer Zachary Bay 0 1,699 7 13,471 762 15,939282-32 Middle Zachary Bay 0 201 10 9,505 9,461 19,177
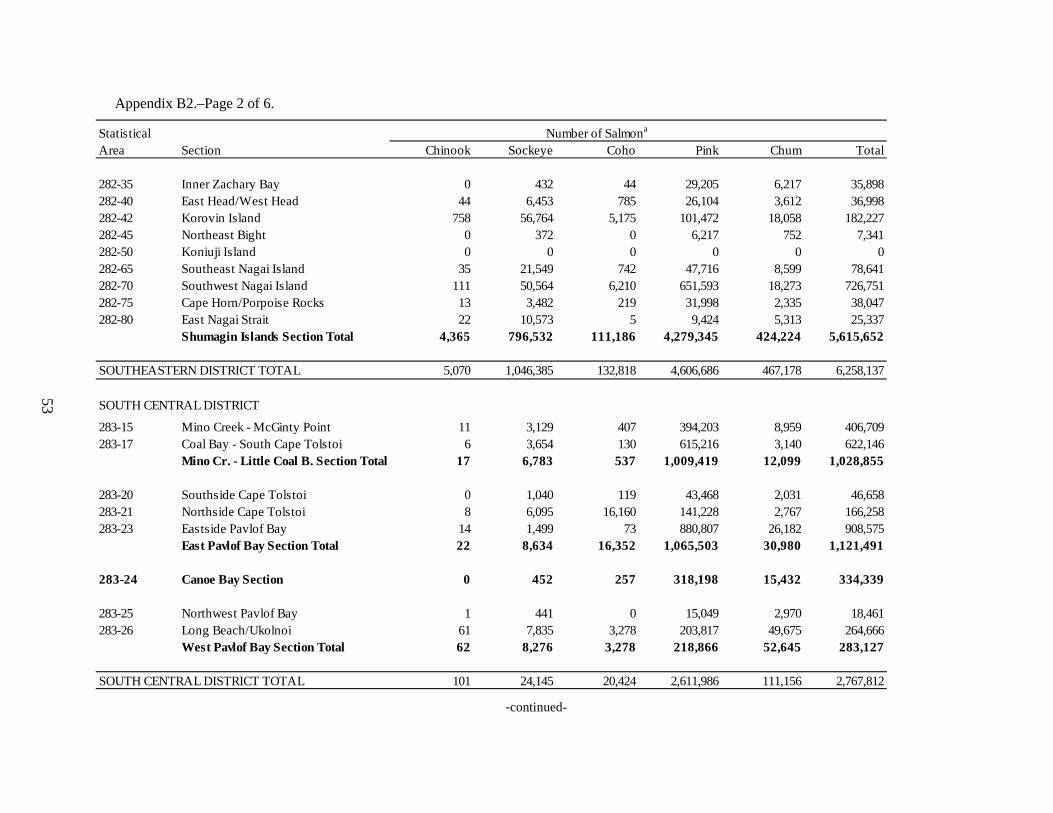
53
Appendix B2.–Page 2 of 6.
-continued-
Statistical Number of Salmona
Area Section Chinook Sockeye Coho Pink Chum Total
282-35 Inner Zachary Bay 0 432 44 29,205 6,217 35,898282-40 East Head/West Head 44 6,453 785 26,104 3,612 36,998282-42 Korovin Island 758 56,764 5,175 101,472 18,058 182,227282-45 Northeast Bight 0 372 0 6,217 752 7,341282-50 Koniuji Island 0 0 0 0 0 0282-65 Southeast Nagai Island 35 21,549 742 47,716 8,599 78,641282-70 Southwest Nagai Island 111 50,564 6,210 651,593 18,273 726,751282-75 Cape Horn/Porpoise Rocks 13 3,482 219 31,998 2,335 38,047282-80 East Nagai Strait 22 10,573 5 9,424 5,313 25,337
Shumagin Islands Section Total 4,365 796,532 111,186 4,279,345 424,224 5,615,652
SOUTHEASTERN DISTRICT TOTAL 5,070 1,046,385 132,818 4,606,686 467,178 6,258,137
SOUTH CENTRAL DISTRICT
283-15 Mino Creek - McGinty Point 11 3,129 407 394,203 8,959 406,709283-17 Coal Bay - South Cape Tolstoi 6 3,654 130 615,216 3,140 622,146
Mino Cr. - Little Coal B. Section Total 17 6,783 537 1,009,419 12,099 1,028,855
283-20 Southside Cape Tolstoi 0 1,040 119 43,468 2,031 46,658283-21 Northside Cape Tolstoi 8 6,095 16,160 141,228 2,767 166,258283-23 Eastside Pavlof Bay 14 1,499 73 880,807 26,182 908,575
East Pavlof Bay Section Total 22 8,634 16,352 1,065,503 30,980 1,121,491
283-24 Canoe Bay Section 0 452 257 318,198 15,432 334,339
283-25 Northwest Pavlof Bay 1 441 0 15,049 2,970 18,461283-26 Long Beach/Ukolnoi 61 7,835 3,278 203,817 49,675 264,666
West Pavlof Bay Section Total 62 8,276 3,278 218,866 52,645 283,127
SOUTH CENTRAL DISTRICT TOTAL 101 24,145 20,424 2,611,986 111,156 2,767,812
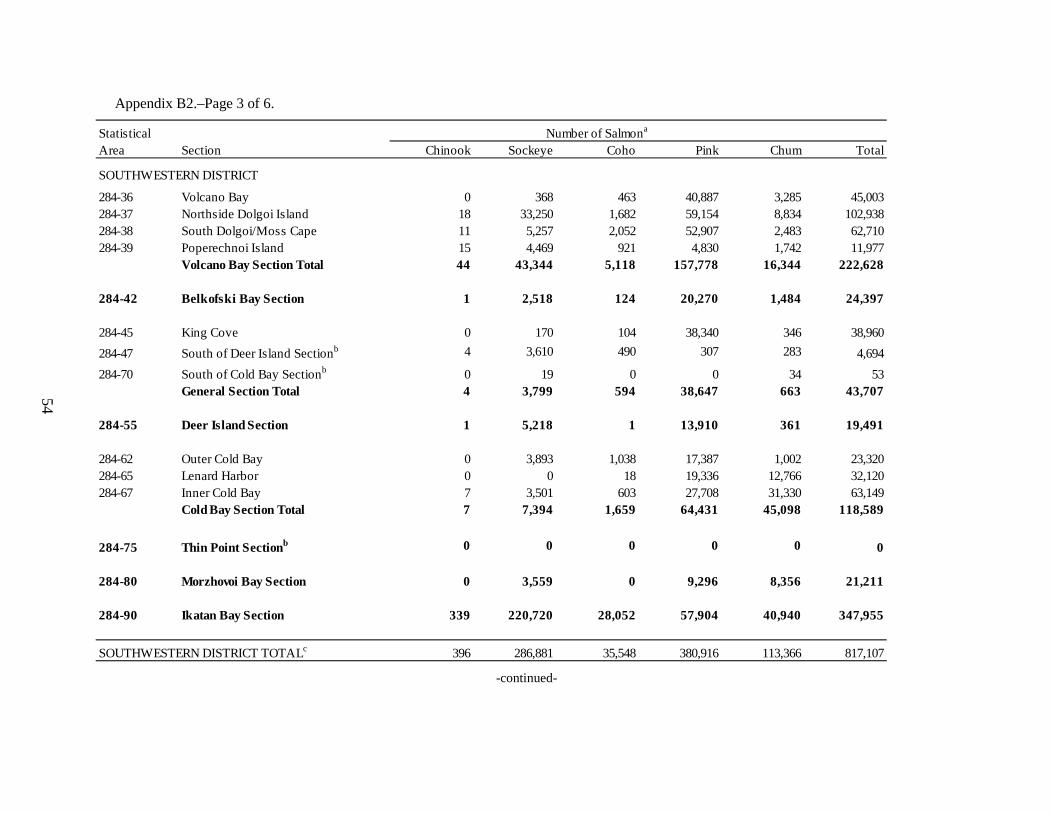
54
Appendix B2.–Page 3 of 6.
-continued-
Statistical Number of Salmona
Area Section Chinook Sockeye Coho Pink Chum Total
SOUTHWESTERN DISTRICT
284-36 Volcano Bay 0 368 463 40,887 3,285 45,003284-37 Northside Dolgoi Island 18 33,250 1,682 59,154 8,834 102,938284-38 South Dolgoi/Moss Cape 11 5,257 2,052 52,907 2,483 62,710284-39 Poperechnoi Island 15 4,469 921 4,830 1,742 11,977
Volcano Bay Section Total 44 43,344 5,118 157,778 16,344 222,628
284-42 Belkofski Bay Section 1 2,518 124 20,270 1,484 24,397
284-45 King Cove 0 170 104 38,340 346 38,960284-47 South of Deer Island Sectionb 4 3,610 490 307 283 4,694284-70 South of Cold Bay Sectionb 0 19 0 0 34 53
General Section Total 4 3,799 594 38,647 663 43,707
284-55 Deer Island Section 1 5,218 1 13,910 361 19,491
284-62 Outer Cold Bay 0 3,893 1,038 17,387 1,002 23,320284-65 Lenard Harbor 0 0 18 19,336 12,766 32,120284-67 Inner Cold Bay 7 3,501 603 27,708 31,330 63,149
Cold Bay Section Total 7 7,394 1,659 64,431 45,098 118,589
284-75 Thin Point Sectionb 0 0 0 0 0 0
284-80 Morzhovoi Bay Section 0 3,559 0 9,296 8,356 21,211
284-90 Ikatan Bay Section 339 220,720 28,052 57,904 40,940 347,955
SOUTHWESTERN DISTRICT TOTALc 396 286,881 35,548 380,916 113,366 817,107
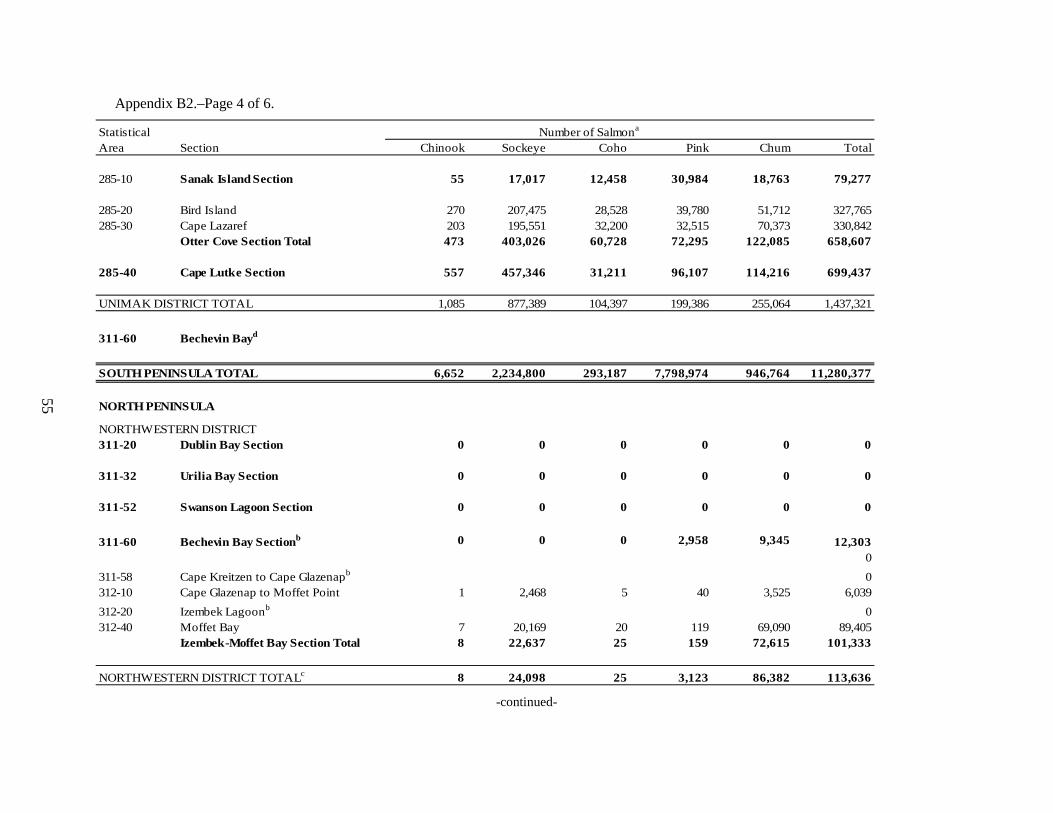
55
Appendix B2.–Page 4 of 6.
-continued-
Statistical Number of Salmona
Area Section Chinook Sockeye Coho Pink Chum Total
285-10 Sanak Island Section 55 17,017 12,458 30,984 18,763 79,277
285-20 Bird Island 270 207,475 28,528 39,780 51,712 327,765285-30 Cape Lazaref 203 195,551 32,200 32,515 70,373 330,842
Otter Cove Section Total 473 403,026 60,728 72,295 122,085 658,607
285-40 Cape Lutke Section 557 457,346 31,211 96,107 114,216 699,437
UNIMAK DISTRICT TOTAL 1,085 877,389 104,397 199,386 255,064 1,437,321
311-60 Bechevin Bayd
SOUTH PENINSULA TOTAL 6,652 2,234,800 293,187 7,798,974 946,764 11,280,377
NORTH PENINSULA
NORTHWESTERN DISTRICT311-20 Dublin Bay Section 0 0 0 0 0 0
311-32 Urilia Bay Section 0 0 0 0 0 0
311-52 Swanson Lagoon Section 0 0 0 0 0 0
311-60 Bechevin Bay Sectionb 0 0 0 2,958 9,345 12,3030
311-58 Cape Kreitzen to Cape Glazenapb 0312-10 Cape Glazenap to Moffet Point 1 2,468 5 40 3,525 6,039312-20 Izembek Lagoonb 0312-40 Moffet Bay 7 20,169 20 119 69,090 89,405
Izembek-Moffet Bay Section Total 8 22,637 25 159 72,615 101,333
NORTHWESTERN DISTRICT TOTALc 8 24,098 25 3,123 86,382 113,636
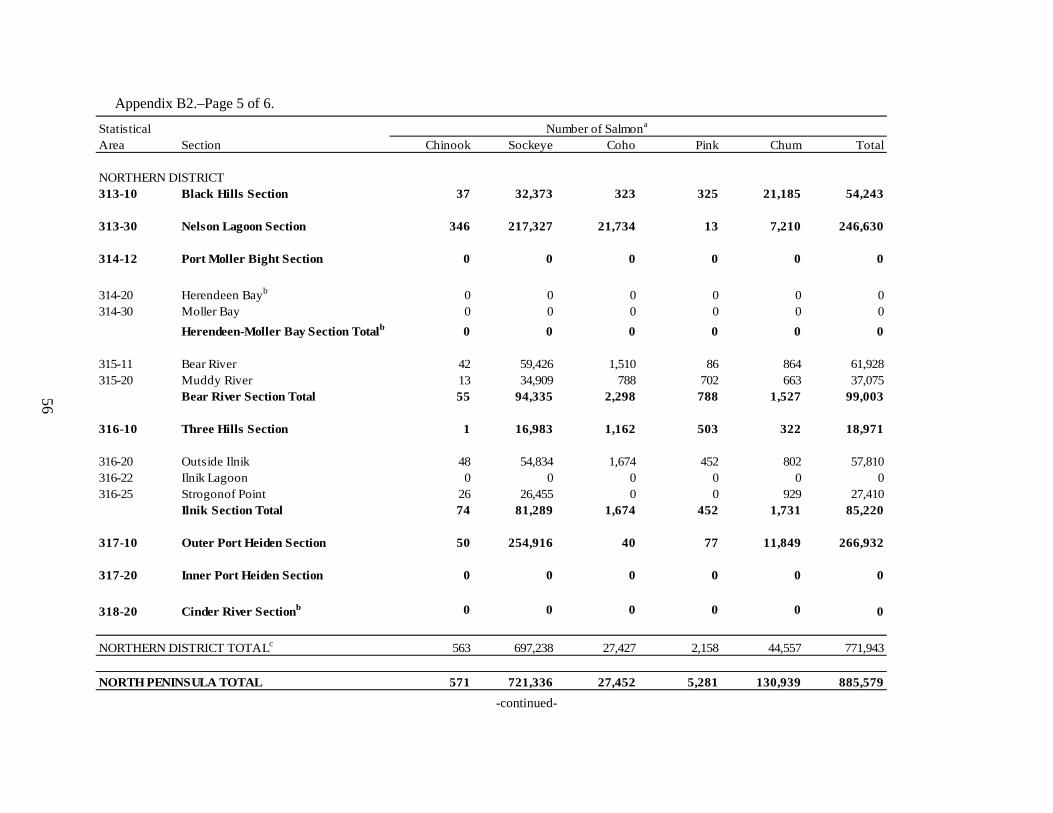
56
Appendix B2.–Page 5 of 6.
-continued-
Statistical Number of Salmona
Area Section Chinook Sockeye Coho Pink Chum Total
NORTHERN DISTRICT313-10 Black Hills Section 37 32,373 323 325 21,185 54,243
313-30 Nelson Lagoon Section 346 217,327 21,734 13 7,210 246,630
314-12 Port Moller Bight Section 0 0 0 0 0 0
314-20 Herendeen Bayb 0 0 0 0 0 0314-30 Moller Bay 0 0 0 0 0 0
Herendeen-Moller Bay Section Totalb 0 0 0 0 0 0
315-11 Bear River 42 59,426 1,510 86 864 61,928315-20 Muddy River 13 34,909 788 702 663 37,075
Bear River Section Total 55 94,335 2,298 788 1,527 99,003
316-10 Three Hills Section 1 16,983 1,162 503 322 18,971
316-20 Outside Ilnik 48 54,834 1,674 452 802 57,810316-22 Ilnik Lagoon 0 0 0 0 0 0316-25 Strogonof Point 26 26,455 0 0 929 27,410
Ilnik Section Total 74 81,289 1,674 452 1,731 85,220
317-10 Outer Port Heiden Section 50 254,916 40 77 11,849 266,932
317-20 Inner Port Heiden Section 0 0 0 0 0 0
318-20 Cinder River Sectionb 0 0 0 0 0 0
NORTHERN DISTRICT TOTALc 563 697,238 27,427 2,158 44,557 771,943
NORTH PENINSULA TOTAL 571 721,336 27,452 5,281 130,939 885,579

57
Appendix B2.–Page 6 of 6.
a Numbers do not include fish harvested for personal use and ADF&G test fisheries. b Confidentiality requirements prohibit the release of this information. c Total includes data not released due to confidentiality requirements. d The Bechevin Bay Section participates in the South Peninsula’s June fishery and therefore June harvest data in this section is reported towards the South
Peninsula’s harvest. There was no commercial fishing effort in June 2013 in the Bechevin Bay Section. e No commercial fishing effort occurred in 2013.
Statistical Number of Salmona
Area Section Chinook Sockeye Coho Pink Chum Total
UNALASKA DISTRICT-ALEUTIAN ISLANDSe 0 0 0 0 0 0
ALEUTIAN ISLANDS TOTALe 0 0 0 0 0 0
ALASKA PENINSULA ANDALEUTIAN ISLANDS AREAS TOTAL 7,223 2,956,136 320,639 7,804,255 1,077,703 12,165,956
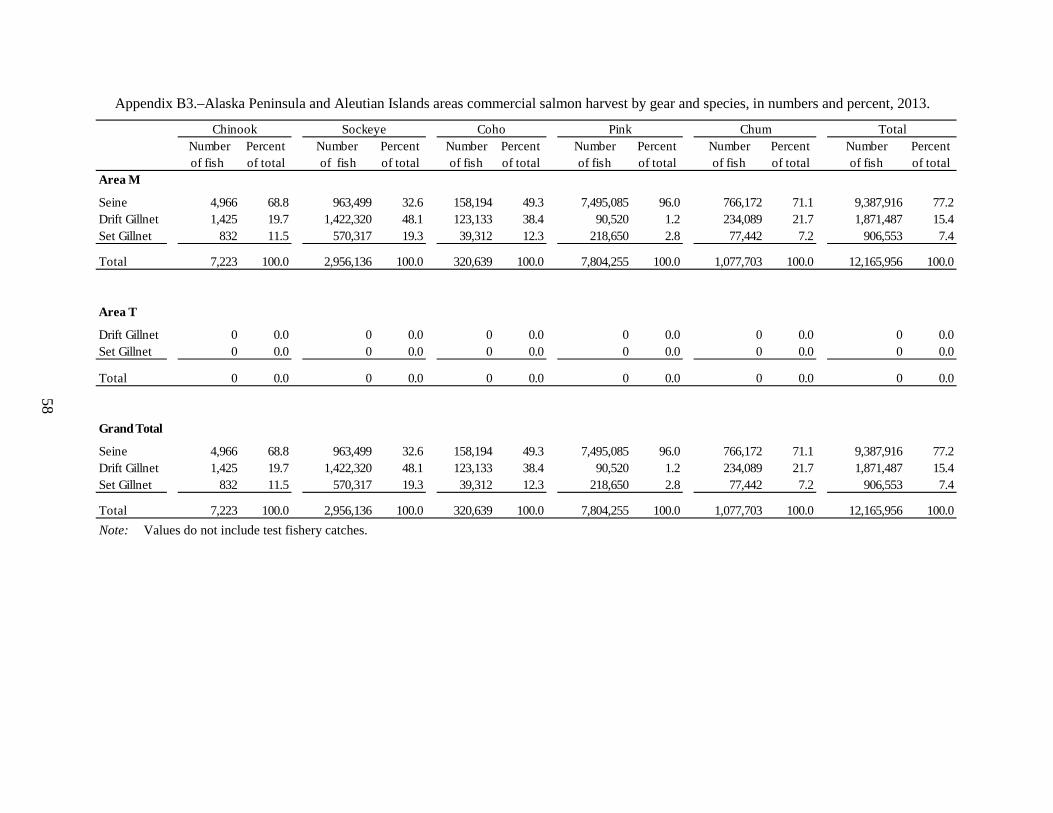
58
Appendix B3.–Alaska Peninsula and Aleutian Islands areas commercial salmon harvest by gear and species, in numbers and percent, 2013.
Note: Values do not include test fishery catches.
Chinook Sockeye Coho Pink Chum TotalNumber Percent Number Percent Number Percent Number Percent Number Percent Number Percentof fish of total of fish of total of fish of total of fish of total of fish of total of fish of total
Area M
Seine 4,966 68.8 963,499 32.6 158,194 49.3 7,495,085 96.0 766,172 71.1 9,387,916 77.2Drift Gillnet 1,425 19.7 1,422,320 48.1 123,133 38.4 90,520 1.2 234,089 21.7 1,871,487 15.4Set Gillnet 832 11.5 570,317 19.3 39,312 12.3 218,650 2.8 77,442 7.2 906,553 7.4
Total 7,223 100.0 2,956,136 100.0 320,639 100.0 7,804,255 100.0 1,077,703 100.0 12,165,956 100.0
Area T
Drift Gillnet 0 0.0 0 0.0 0 0.0 0 0.0 0 0.0 0 0.0Set Gillnet 0 0.0 0 0.0 0 0.0 0 0.0 0 0.0 0 0.0
Total 0 0.0 0 0.0 0 0.0 0 0.0 0 0.0 0 0.0
Grand Total
Seine 4,966 68.8 963,499 32.6 158,194 49.3 7,495,085 96.0 766,172 71.1 9,387,916 77.2Drift Gillnet 1,425 19.7 1,422,320 48.1 123,133 38.4 90,520 1.2 234,089 21.7 1,871,487 15.4Set Gillnet 832 11.5 570,317 19.3 39,312 12.3 218,650 2.8 77,442 7.2 906,553 7.4
Total 7,223 100.0 2,956,136 100.0 320,639 100.0 7,804,255 100.0 1,077,703 100.0 12,165,956 100.0

Appendix B4.–Alaska Peninsula area salmon test fishery catches, 1989–2013.
-continued-
Year Chinook Sockeye Coho Pink Chum Total1989 Shumagin Islands 56 1,699 2,446 3,528 739 8,468
Total South Peninsula 56 1,699 2,446 0 739 4,940North Peninsula 6 638 0 0 97 741Alaska Peninsula Total 62 2,337 2,446 3,528 836 9,209
1990 Shumagin Islands 25 1,284 1,708 4,573 3,147 10,737Total South Peninsula 25 1,284 1,708 4,573 3,147 10,737Alaska Peninsula Total 25 1,284 1,708 4,573 3,147 10,737
1991 Shumagin Islands 465 15,034 3,906 20,160 14,716 54,281South Unimak 0 377 0 0 306 683Total South Peninsula 465 15,411 3,906 20,160 15,022 54,964Alaska Peninsula Total 465 15,411 3,906 20,160 15,022 54,964
1992 Shumagin Islands 93 7,039 3,284 10,729 6,372 27,517Total South Peninsula 93 7,039 3,284 10,729 6,372 27,517Alaska Peninsula Total 93 7,039 3,284 10,729 6,372 27,517
1993 Shumagin Islands 330 6,470 4,892 2,984 1,850 16,526Total South Peninsula 330 6,470 4,892 2,984 1,850 16,526Alaska Peninsula Total 330 6,470 4,892 2,984 1,850 16,526
1994 Shumagin Islands 528 16,224 4,219 36,150 13,169 70,290Total South Peninsula 528 16,224 4,219 36,150 13,169 70,290Alaska Peninsula Total 528 16,224 4,219 36,150 13,169 70,290
1995 Shumagin Islands 290 13,410 3,660 9,072 10,005 36,437South Unimak 101 7,239 1 105 2,941 10,387Total South Peninsula 391 20,649 3,661 9,177 12,946 46,824Alaska Peninsula Total 391 20,649 3,661 9,177 12,946 46,824
1996 Shumagin Islands 375 9,049 15,183 15,261 14,372 54,240South Unimak 80 6,055 0 2,594 4,250 12,979Total South Peninsula 455 15,104 15,183 17,855 18,622 67,219Alaska Peninsula Total 455 15,104 15,183 17,855 18,622 67,219
1997 Shumagin Islands 429 11,226 3,594 8,158 10,407 33,814South Unimak 188 11,224 3 3976 10682 26073Total South Peninsula 617 22,450 3,597 12,134 21,089 59,887Alaska Peninsula Total 617 22,450 3,597 12,134 21,089 59,887
1998 Shumagin Islands 28 4,581 24 2,093 3,257 9,983South Unimak 95 8,392 0 5,224 6,285 19,996Total South Peninsula 123 12,973 24 7,317 9,542 29,979Alaska Peninsula Total 123 12,973 24 7,317 9,542 29,979
Number of Adult Salmon
59

Appendix B4.–Page 2 of 3.
-continued-
Year Chinook Sockeye Coho Pink Chum Total1999 Shumagin Islands 119 33,513 18 13,045 19,808 66,503
South Unimak 140 10,039 0 61 3,256 13,496Total South Peninsula 259 43,552 18 13,106 23,064 79,999Alaska Peninsula Total 259 43,552 18 13,106 23,064 79,999
2000 Shumagin Islands 65 9,225 99 5,385 5,790 20,564South Unimak 276 12,686 0 7,936 5,547 26,445Total South Peninsula 341 21,911 99 13,321 11,337 47,009North Peninsula 0 1,482 1 2 4 1,489Alaska Peninsula Total 341 23,393 100 13,323 11,341 48,498
2001 Shumagin Islands 318 6,258 3,353 9,382 10,772 30,083South Unimak 0 0 0 0 0 0Total South Peninsula 318 6,258 3,353 9,382 10,772 30,083North Peninsula 13 4,363 2 10 62 4,450Alaska Peninsula Total 331 10,621 3,355 9,392 10,834 34,533
2002 Shumagin Islands 29 1,020 11 443 1,227 2,730South Unimak 0 0 0 0 0 0Total South Peninsula 29 1,020 11 443 1,227 2,730North Peninsula 0 6,021 14 41 169 6,245Alaska Peninsula Total 29 7,041 25 484 1,396 8,975
2003 Shumagin Islands 26 819 1,279 4,646 2,275 9,045South Unimak 0 0 0 0 0 0Total South Peninsula 26 819 1,279 4,646 2,275 9,045North Peninsula 1 5,785 10 99 178 6,073Alaska Peninsula Total 27 6,604 1,289 4,745 2,453 15,118
2004 Shumagin Islands 81 507 542 1,131 1,827 4,088South Unimak 0 5,845 0 14,485 2,724 23,054Total South Peninsula 81 6,352 542 15,616 4,551 27,142North Peninsula 0 3,874 35 108 87 4,104Alaska Peninsula Total 81 10,226 577 15,724 4,638 31,246
2005 Shumagin Islands 67 1,197 2,137 7,117 2,140 12,658South Unimak 0 0 0 0 0 0Total South Peninsula 67 1,197 2,137 7,117 2,140 12,658North Peninsula 0 2,291 2 11 36 2,340Alaska Peninsula Total 67 3,488 2,139 7,128 2,176 14,998
Number of Adult Salmon
60

Appendix B4.–Page 3 of 3.
Year Chinook Sockeye Coho Pink Chum Total2006 Shumagin Islands 21 1,211 440 2,254 7,855 11,781
South Unimak 0 0 0 0 0 0Total South Peninsula 21 1,211 440 2,254 7,855 11,781North Peninsula 20 2,232 2 0 89 2,343Alaska Peninsula Total 41 3,443 442 2,254 7,944 14,124
2007 Shumagin Islands 12 11,389 781 7,036 1,300 20,518South Unimak 0 0 0 0 0 0Total South Peninsula 12 11,389 781 7,036 1,300 20,518North Peninsula 6 4,027 7 29 54 4,123Alaska Peninsula Total 18 15,416 788 7,065 1,354 24,641
2008 Shumagin Islands 12 9,934 1,891 13,933 11,719 37,489South Unimak 0 0 0 0 0 0Total South Peninsula 12 9,934 1,891 13,933 11,719 37,489North Peninsula 0 2,249 54 1 105 2,409Alaska Peninsula Total 12 12,183 1,945 13,934 11,824 39,898
2009 Shumagin Islands 28 1,587 389 21,101 3,825 26,930South Unimak 0 0 0 0 0 0Total South Peninsula 28 1,587 389 21,101 3,825 26,930North Peninsula 6 4,027 7 29 54 4,123Alaska Peninsula Total 34 5,614 396 21,130 3,879 31,053
2010 Shumagin Islands 13 6,418 179 4,180 1,608 12,398South Unimak 0 0 0 0 0 0Total South Peninsula 13 6,418 179 4,180 1,608 12,398North Peninsula 0 2,294 2 19 58 2,373Alaska Peninsula Total 13 8,712 181 4,199 1,666 14,771
2011 Shumagin Islands 7 1,151 49 11,980 1,315 14,502South Unimak 0 0 0 0 0 0Total South Peninsula 7 1,151 49 11,980 1,315 14,502North Peninsula 1 2,434 21 33 66 2,555Alaska Peninsula Total 8 3,585 70 12,013 1,381 17,057
2012 Shumagin Islands 4 2,668 16 947 1,192 4,827South Unimak 0 0 0 0 0 0Total South Peninsula 4 2,668 16 947 1,192 4,827North Peninsula 0 0 0 0 0 0Alaska Peninsula Total 4 2,668 16 947 1,192 4,827
2013 Shumagin Islands 4 2,366 1,002 7,043 1,632 12,047South Unimak 0 0 0 0 0 0Total South Peninsula 4 2,366 1,002 7,043 1,632 12,047North Peninsula 0 2,035 28 34 116 2,213Alaska Peninsula Total 4 4,401 1,030 7,077 1,748 14,260
Number of Adult Salmon
61

62

APPENDIX C. ESCAPEMENT DATA
63
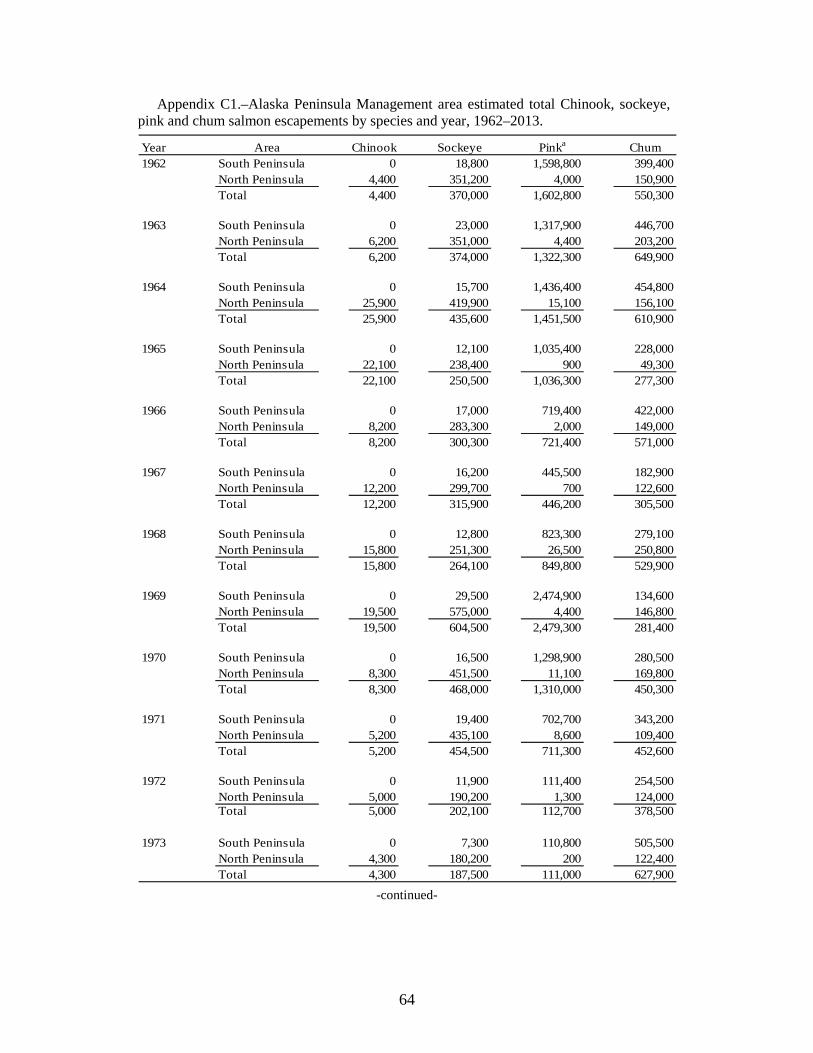
Appendix C1.–Alaska Peninsula Management area estimated total Chinook, sockeye, pink and chum salmon escapements by species and year, 1962–2013.
-continued-
Year Area Chinook Sockeye Pinka Chum1962 South Peninsula 0 18,800 1,598,800 399,400
North Peninsula 4,400 351,200 4,000 150,900Total 4,400 370,000 1,602,800 550,300
1963 South Peninsula 0 23,000 1,317,900 446,700North Peninsula 6,200 351,000 4,400 203,200Total 6,200 374,000 1,322,300 649,900
1964 South Peninsula 0 15,700 1,436,400 454,800North Peninsula 25,900 419,900 15,100 156,100Total 25,900 435,600 1,451,500 610,900
1965 South Peninsula 0 12,100 1,035,400 228,000North Peninsula 22,100 238,400 900 49,300Total 22,100 250,500 1,036,300 277,300
1966 South Peninsula 0 17,000 719,400 422,000North Peninsula 8,200 283,300 2,000 149,000Total 8,200 300,300 721,400 571,000
1967 South Peninsula 0 16,200 445,500 182,900North Peninsula 12,200 299,700 700 122,600Total 12,200 315,900 446,200 305,500
1968 South Peninsula 0 12,800 823,300 279,100North Peninsula 15,800 251,300 26,500 250,800Total 15,800 264,100 849,800 529,900
1969 South Peninsula 0 29,500 2,474,900 134,600North Peninsula 19,500 575,000 4,400 146,800Total 19,500 604,500 2,479,300 281,400
1970 South Peninsula 0 16,500 1,298,900 280,500North Peninsula 8,300 451,500 11,100 169,800Total 8,300 468,000 1,310,000 450,300
1971 South Peninsula 0 19,400 702,700 343,200North Peninsula 5,200 435,100 8,600 109,400Total 5,200 454,500 711,300 452,600
1972 South Peninsula 0 11,900 111,400 254,500North Peninsula 5,000 190,200 1,300 124,000Total 5,000 202,100 112,700 378,500
1973 South Peninsula 0 7,300 110,800 505,500North Peninsula 4,300 180,200 200 122,400Total 4,300 187,500 111,000 627,900
64

Appendix C1.–Page 2 of 5.
-continued-
Year Area Chinook Sockeye Pinka Chum1974 South Peninsula 0 95,600 284,400 257,300
North Peninsula 3,000 332,800 23,000 105,100Total 3,000 428,400 307,400 362,400
1975 South Peninsula 0 51,700 552,100 193,300North Peninsula 4,600 516,800 600 109,200Total 4,600 568,500 552,700 302,500
1976 South Peninsula 0 69,700 1,456,400 327,200North Peninsula 6,000 532,600 37,300 293,400Total 6,000 602,300 1,493,700 620,600
1977 South Peninsula 0 64,900 2,677,800 774,900North Peninsula 7,100 541,100 8,500 681,200Total 7,100 606,000 2,686,300 1,456,100
1978 South Peninsula 0 64,800 2,858,700 600,500North Peninsula 13,700 1,213,500 96,800 310,500Total 13,700 1,278,300 2,955,500 911,000
1979 South Peninsula 0 53,300 2,629,500 411,100North Peninsula 15,800 1,574,000 9,300 305,300Total 15,800 1,627,300 2,638,800 716,400
1980 South Peninsula 0 45,900 2,641,600 362,400North Peninsula 11,000 1,387,600 103,600 769,500Total 11,000 1,433,500 2,745,200 1,131,900
1981 South Peninsula 0 45,700 2,307,500 381,300North Peninsula 12,400 1,347,900 6,100 535,200Total 12,400 1,393,600 2,313,600 916,500
1982 South Peninsula 0 39,200 2,293,000 386,900North Peninsula 20,000 718,400 51,700 457,600Total 20,000 757,600 2,344,700 844,500
1983 South Peninsula 0 59,200 851,200 446,500North Peninsula 25,700 580,300 4,000 392,600Total 25,700 639,500 855,200 839,100
1984 South Peninsula 0 54,800 3,811,600 699,700North Peninsula 17,700 826,000 56,600 870,200Total 17,700 880,800 3,868,200 1,569,900
1985 South Peninsula 0 49,900 1,614,100 503,400North Peninsula 12,900 898,100 1,400 344,200Total 12,900 948,000 1,615,500 847,600
65

Appendix C1.–Page 3 of 5.
-continued-
Year Area Chinook Sockeye Pinka Chum1986 South Peninsula 0 48,000 1,716,700 544,600
North Peninsula 8,700 580,300 13,300 243,600Total 8,700 628,300 1,730,000 788,200
1987 South Peninsula 0 44,600 1,540,500 620,700North Peninsula 10,700 556,000 100 510,900Total 10,700 600,600 1,540,600 1,131,600
1988 South Peninsula 0 74,100 2,839,600 496,400North Peninsula 11,700 614,900 43,500 500,300Total 11,700 689,000 2,883,100 996,700
1989 South Peninsula 0 78,100 1,870,900 310,500North Peninsula 5,600 814,400 1,900 212,300Total 5,600 892,500 1,872,800 522,800
1990 South Peninsula 0 95,300 1,598,400 354,700North Peninsula 7,100 1,032,200 132,200 226,400Total 7,100 1,127,500 1,730,600 581,100
1991 South Peninsula 0 124,900 2,946,800 587,600North Peninsula 9,600 1,317,300 6,300 303,300Total 9,600 1,442,200 2,953,100 890,900
1992 South Peninsula 0 97,600 2,834,400 335,500North Peninsula 6,600 861,300 207,600 351,700Total 6,600 958,900 3,042,000 687,200
1993 South Peninsula 0 100,341 2,990,140 397,030North Peninsula 13,745 1,003,848 72,830 402,380Total 13,745 1,104,189 3,062,970 799,410
1994 South Peninsula 0 120,255 3,071,725 579,100North Peninsula 38,400 1,211,400 133,200 480,200Total 38,400 1,331,655 3,204,925 1,059,300
1995 South Peninsula 0 129,110 6,406,300 726,400North Peninsula 24,400 1,077,030 8,200 756,000Total 24,400 1,206,140 6,414,500 1,482,400
1996 South Peninsula 0 72,950 3,647,550 610,300North Peninsula 25,670 967,890 382,600 823,130Total 25,670 1,040,840 4,030,150 1,433,430
1997 South Peninsula 0 104,440 5,243,275 809,050North Peninsula 19,250 820,243 24,750 388,185Total 19,250 924,683 5,268,025 1,197,235
66
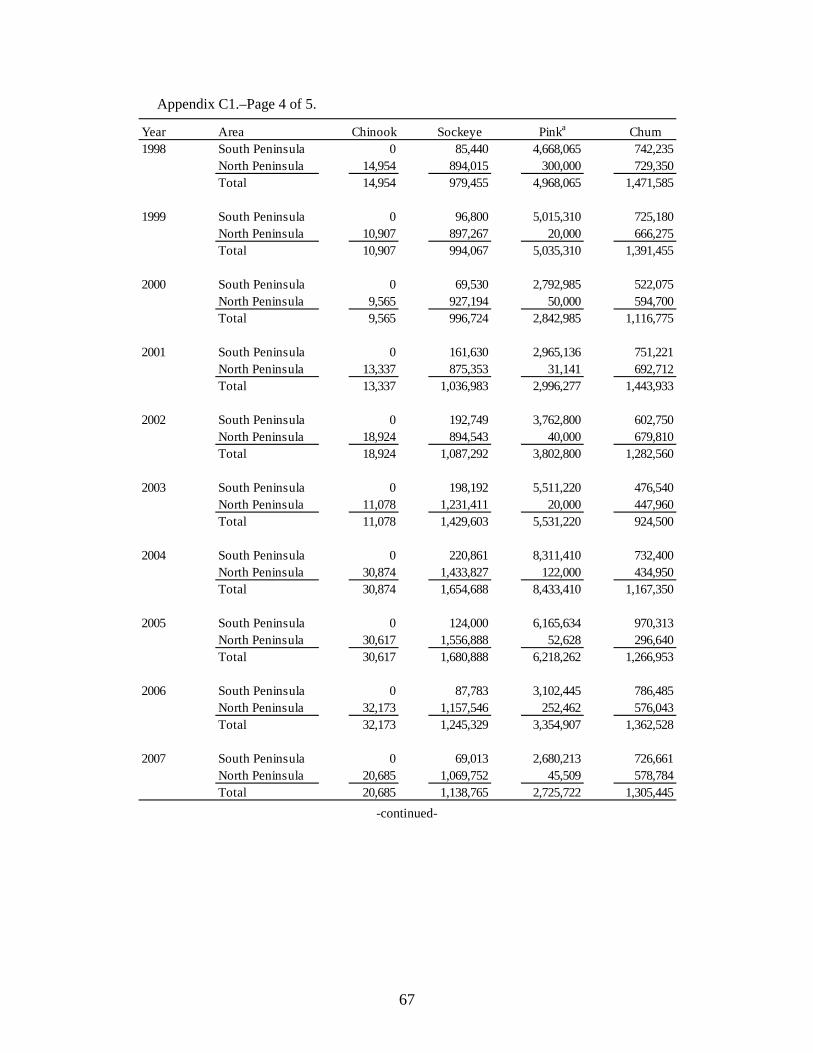
Appendix C1.–Page 4 of 5.
-continued-
Year Area Chinook Sockeye Pinka Chum1998 South Peninsula 0 85,440 4,668,065 742,235
North Peninsula 14,954 894,015 300,000 729,350Total 14,954 979,455 4,968,065 1,471,585
1999 South Peninsula 0 96,800 5,015,310 725,180North Peninsula 10,907 897,267 20,000 666,275Total 10,907 994,067 5,035,310 1,391,455
2000 South Peninsula 0 69,530 2,792,985 522,075North Peninsula 9,565 927,194 50,000 594,700Total 9,565 996,724 2,842,985 1,116,775
2001 South Peninsula 0 161,630 2,965,136 751,221North Peninsula 13,337 875,353 31,141 692,712Total 13,337 1,036,983 2,996,277 1,443,933
2002 South Peninsula 0 192,749 3,762,800 602,750North Peninsula 18,924 894,543 40,000 679,810Total 18,924 1,087,292 3,802,800 1,282,560
2003 South Peninsula 0 198,192 5,511,220 476,540North Peninsula 11,078 1,231,411 20,000 447,960Total 11,078 1,429,603 5,531,220 924,500
2004 South Peninsula 0 220,861 8,311,410 732,400North Peninsula 30,874 1,433,827 122,000 434,950Total 30,874 1,654,688 8,433,410 1,167,350
2005 South Peninsula 0 124,000 6,165,634 970,313North Peninsula 30,617 1,556,888 52,628 296,640Total 30,617 1,680,888 6,218,262 1,266,953
2006 South Peninsula 0 87,783 3,102,445 786,485North Peninsula 32,173 1,157,546 252,462 576,043Total 32,173 1,245,329 3,354,907 1,362,528
2007 South Peninsula 0 69,013 2,680,213 726,661North Peninsula 20,685 1,069,752 45,509 578,784Total 20,685 1,138,765 2,725,722 1,305,445
67

Appendix C1.–Page 5 of 5.
Note: Coho salmon escapement estimates are not available due to incomplete data. a North Peninsula pink salmon escapement estimates are based on incomplete data.
Year Area Chinook Sockeye Pinka Chum2008 South Peninsula 0 95,859 3,338,370 591,950
North Peninsula 36,072 1,012,320 49,400 470,287Total 36,072 1,108,179 3,387,770 1,062,237
2009 South Peninsula 0 128,117 3,067,000 586,830North Peninsula 12,807 934,400 91,441 232,591Total 12,807 1,062,517 3,158,441 819,421
2010 South Peninsula 0 38,039 742,912 291,912North Peninsula 9,387 875,100 32,412 289,410Total 9,387 913,139 775,324 581,322
2011 South Peninsula 0 59,794 2,494,950 497,725North Peninsula 15,254 795,105 16,778 248,352Total 15,254 854,899 2,511,728 746,077
2012 South Peninsula 0 55,900 478,910 205,242North Peninsula 3,542 747,090 28,968 280,418Total 3,542 802,990 507,878 485,660
2013 South Peninsula 0 37,386 2,320,790 502,600North Peninsula 4,346 1,010,400 8,183 230,051Total 4,346 1,047,786 2,328,973 732,651
2003–2012 South Peninsula 0 107,756 3,589,306 586,606Average North Peninsula 20,249 1,081,344 71,160 385,544
Total 20,249 1,189,100 3,660,466 972,149
68
APPENDIX D. METHOD FOR CALCULATING INDEXED
TOTAL ESCAPEMENT
69

Appendix D1.–Method for calculating indexed total escapement. Aerial surveys have inherently high variability and are influenced by many factors including survey conditions, timing of peak surveys and variability between surveyors. With the high variability of peak survey date, between three to five surveys are conducted per stream, per year. For pink and chum salmon, an approximate 21-day stream life is used to calculate total pink and chum escapements. For sockeye and coho salmon, with their longer stream life, the indexed total escapement is usually the peak escapement count. Due to the high variability, the methods of calculating estimated indexed total escapements without the use of a weir or tower are as follows: Chinook, Sockeye, and Coho Salmon: These species tend to have a much longer stream life than pink and chum salmon. Therefore, the indexed total escapement is usually the peak escapement count and carcasses. However, it is recognized that there are problems in large systems such as Ilnik and Caribou-David’s rivers. The basic problem on large systems is the length of time, expense, and fuel needed to do a thorough survey yet meet more pressing obligations. The Caribou and David’s River complex (including Coastal and other nearby lakes) is so massive a system for the size of its runs that complete surveys are not done. At Thin Point Lagoon and Lake, estimates of sockeye salmon in the lagoon are added together based on estimated time in lagoon and observations of when sockeye salmon start to move from the lagoon to the lake. In Morzhovoi (Middle Lagoon), Bluebill, Outer Marker, and Mortensen’s Lagoon systems the escapement is calculated by adding estimates of spawning sockeye salmon approximately two weeks apart. Pink and Chum Salmon: Again, due to the high variability of survey conditions, between three and five surveys are conducted per stream per year. From those surveys, the peak number of fish in the stream is added to the total count. If there are any stream counts 21 days prior to the peak count, the number of fish in the stream and the carcasses are added to the total count. Likewise, if there are any counts 21 days after the peak count, those live fish found at both the mouth and in the stream are added to the total count.
EXAMPLE
The indexed total escapement is calculated by adding the figures in bold.
The estimate of 21 days stream life was used because significant numbers of carcasses begin to appear about three weeks after adult pinks and chums first appear in Alaska Peninsula streams. It is recognized that stream life can vary, however this method is easily duplicated and is comparable from year to year. Variation in stream life is likely a much smaller factor than variation between observers. With the exception of several small streams, there are no problems with streams being obscured by brush or trees in the Alaska Peninsula and Aleutian Islands Areas. With some exceptions, visibility of spawning grounds is outstanding during periods of normal water flow and clear weather.
Survey Date Pinks at Mouth Pinks in Stream Pink Carcasses Chums at Mouth Chums in Stream Chum Carcasses
10-Jul 5,000 1,000 5,000 0 0 017-Jul 15,000 25,000 5,000 0 0 01-Aug 10,000 150,000 10,000 0 0 0
15-Aug 3,000 100,000 25,000 500 1,000 01-Sep 12,000 50,000 55,000 2,000 5,000 500
Sub total 12,000 201,000 5,000 2,000 5,000 500Total 218,000 Pink 7,500 Chum
Fictional Stream 281-##
70
APPENDIX E. FIELD PERSONNEL
71
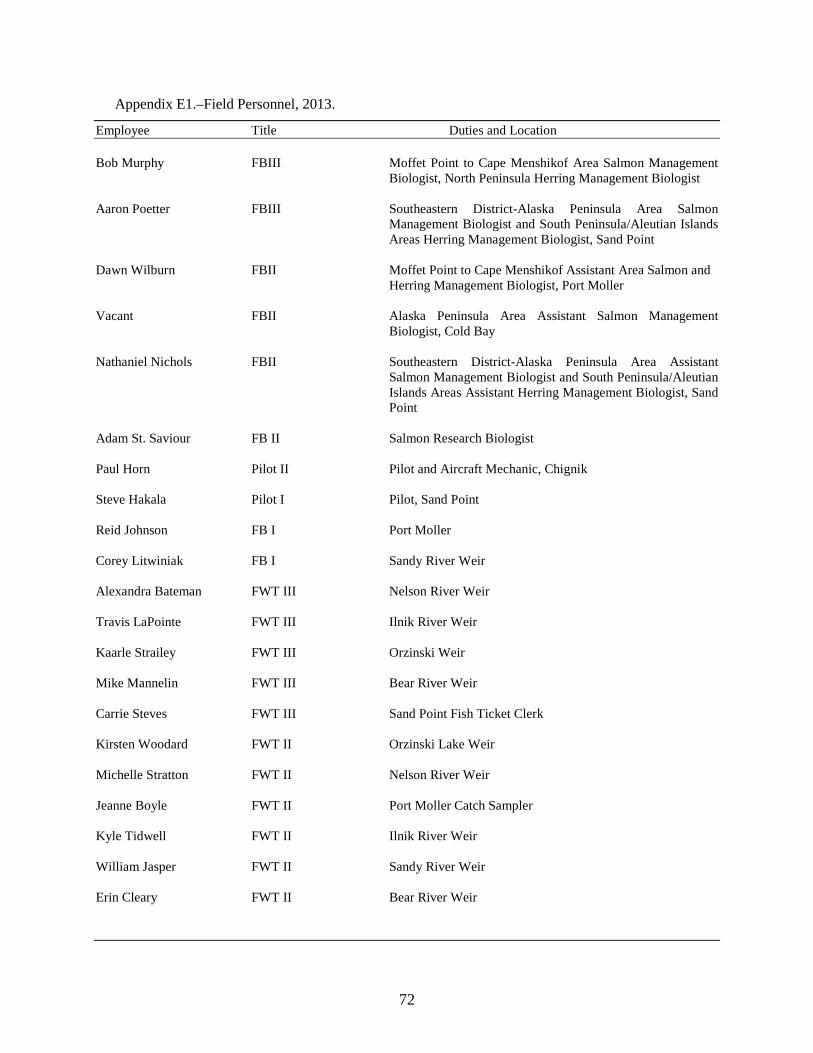
Appendix E1.–Field Personnel, 2013.
Employee Title Duties and Location Bob Murphy FBIII Moffet Point to Cape Menshikof Area Salmon Management
Biologist, North Peninsula Herring Management Biologist Aaron Poetter FBIII Southeastern District-Alaska Peninsula Area Salmon
Management Biologist and South Peninsula/Aleutian Islands Areas Herring Management Biologist, Sand Point
Dawn Wilburn FBII Moffet Point to Cape Menshikof Assistant Area Salmon and Herring Management Biologist, Port Moller Vacant FBII Alaska Peninsula Area Assistant Salmon Management
Biologist, Cold Bay Nathaniel Nichols FBII Southeastern District-Alaska Peninsula Area Assistant
Salmon Management Biologist and South Peninsula/Aleutian Islands Areas Assistant Herring Management Biologist, Sand Point
Adam St. Saviour FB II Salmon Research Biologist Paul Horn Pilot II Pilot and Aircraft Mechanic, Chignik Steve Hakala Pilot I Pilot, Sand Point Reid Johnson FB I Port Moller Corey Litwiniak FB I Sandy River Weir Alexandra Bateman FWT III Nelson River Weir Travis LaPointe FWT III Ilnik River Weir Kaarle Strailey FWT III Orzinski Weir Mike Mannelin FWT III Bear River Weir Carrie Steves FWT III Sand Point Fish Ticket Clerk Kirsten Woodard FWT II Orzinski Lake Weir Michelle Stratton FWT II Nelson River Weir Jeanne Boyle FWT II Port Moller Catch Sampler Kyle Tidwell FWT II Ilnik River Weir William Jasper FWT II Sandy River Weir Erin Cleary FWT II Bear River Weir
72
Related Documents