Annual Review of CAMHD Clinical Performance Indicators: FY 2013 February 19, 2014 CAMHD Research and Evaluation Office David Jackson, Ph.D. Scott Keir, Ph.D. Max Sender, B.S. Chuck Mueller, Ph.D. Dan Wilkie, B.A. 1

Welcome message from author
This document is posted to help you gain knowledge. Please leave a comment to let me know what you think about it! Share it to your friends and learn new things together.
Transcript

Annual Review of CAMHD Clinical
Performance Indicators: FY 2013
February 19, 2014
CAMHD Research and Evaluation Office
David Jackson, Ph.D.
Scott Keir, Ph.D.
Max Sender, B.S.
Chuck Mueller, Ph.D.
Dan Wilkie, B.A.
1

Agenda for the Day
Clinical Model Indicators:
◦ Current Indicators of Progress Toward the Clinical Model
◦ Current Data on Clinical Model Indicators
2
Short Break
• Panel Discussion:
o Measuring CAMHD’s Progress with ‘Clinical
Model’ Performance Indicators

G
o
a
l
s
O
u
t
p
u
t
s
&
O
u
t
c
o
m
e
s
6. Expand
populations
served
a. Increase # of
youth served
annually
b. Decrease
mean age of
youth
c. Increase # of
youth served
w/ trauma
history
d. Increase
public
awareness
1. Improve
the
coordination
of services
offered
a. Increase
documentation
and use of
‘Direct
Services’
b. Improve
documentation
of medications
prescribed and
used
c. Increase
data-sharing
across DoH
divisions and
state agencies
4. Increase
non-state
funding for
services
a. Increase # of
federal grant
dollars
allocated to
CAMHD
b. Increase
amount of
Medicaid
dollars
allocated to
CAMHD
2. Improve
clinical
operations
and processes
a. Bring length
of service
closer to
CAMHD policy
guidelines
b. Increase time
CAMHD
clinical team
spend on
clinical tasks
c. Reduce
turnover of
clinician
positions
d. Improve
consistency of
monthly entry
of DAP notes
3. Improve
the quality of
services
provided
a. Increase use
of Evidence-
Based Txs
b. Increase
accessibility and
use of data in
case planning
c. Increase
parent
engagement in
case planning
d. Improve
agreement
between CSP,
Tx plan, &
MTPS
5. Improve
outcomes for
youth and
families
a. Increase rate
of improvement
for youth
b. Improve
consumer
satisfaction
c. Improve
attendance in
school for
CAMHD youth
d. Decrease
arrests of youth
served
3
Clinical Model Strategy
* - Not all Performance Indicators listed for each of the ‘Goals’ are included in this presentation.

4
1a. CAMHD Direct Services
1. Improve the
coordination of
services offered
a. Increase
documentation
and use of
‘Direct
Services’
b. Improve
documentation of
medications
prescribed and
used
c. Increase data-
sharing across
DoH divisions and
state agencies
0
200
400
600
800
1000
1200
1400
2010-0
7
2010-0
8
2010-0
9
2010-1
0
2010-1
1
2010-1
2
2011-0
1
2011-0
2
2011-0
3
2011-0
4
2011-0
5
2011-0
6
2011-0
7
2011-0
8
2011-0
9
2011-1
0
2011-1
1
2011-1
2
2012-0
1
2012-0
2
2012-0
3
2012-0
4
2012-0
5
2012-0
6
2012-0
7
2012-0
8
2012-0
9
2012-1
0
2012-1
1
2012-1
2
2013-0
1
2013-0
2
2013-0
3
2013-0
4
2013-0
5
2013-0
6
2013-0
7
2013-0
8
2013-0
9
2013-1
0
Nu
mb
er
of
Yo
uth
# of Youth Served w Documented CAMHD
Direct Services Each Month, FY11-FY13
Examples of Direct Services include: Case Management, Family Therapy

5
1b. Documentation of Medications
Prescribed
1. Improve the
coordination of
services offered
a. Increase
documentation
and use of ‘Direct
Services’
b. Improve
documentation
of medications
prescribed and
used
c. Increase data-
sharing across
DoH divisions and
state agencies
• Patient ‘Prescriptions/Medications’ is a tab included in the
Electronic Health Record (EHR) (activation pending)

6
1c. Data Sharing
1. Improve the
coordination of
services offered
a. Increase
documentation
and use of ‘Direct
Services’
b. Improve
documentation of
medications
prescribed and
used
c. Increase
data-sharing
across DoH
divisions and
state agencies
Projects Underway:
• CAMHD – Redesigned Hawaii
Youth Interagency Performance
Report (HYIPR)
• Project Kealahou – Data-sharing
agreement with DOE for cost
services study
• Project Laulima – Agreement with
DDD to collect/share data on youth
served by program Worksheet slide

7
196 195
246 225
239 224
208 207
259 236
183
240
209 214 186 196
0
100
200
300
400
Mean
Len
gth
of
Servic
e
Fiscal Year/Quarter
Mean Length of Service:
IIH, FY09Q4 - FY13Q3
2a. Length of Services
2. Improve clinical
operations and
processes
a. Bring length of
service closer to
CAMHD policy
guidelines
b. Increase time
CAMHD clinical
team spend on
clinical tasks
c. Reduce turnover
of clinician positions
d. Improve
consistency of
monthly entry of
DAP notes
Orange Book Re-Authorization
Guideline = 150 days

8
160
94
117 124
175
135
114 111 122
138
150
124
177
143
122
96
0
50
100
150
200
250
Mean
Len
gth
of
Servic
e
Fiscal Year/Quarter
Mean Length of Service:
CBR III, FY09Q4 - FY13Q3 2. Improve clinical
operations and
processes
a. Bring length of
service closer to
CAMHD policy
guidelines
b. Increase time
CAMHD clinical
team spend on
clinical tasks
c. Reduce turnover
of clinician positions
d. Improve
consistency of
monthly entry of
DAP notes
Orange Book Re-Authorization
Guideline = 150 days
2a. Length of Services

9
216
315
259 259
311
367 350
201 214
244 236
322
259
303
238
177
0
100
200
300
400
500M
ean
Len
gth
of
Servic
e
Fiscal Year/Quarter
Mean Length of Service:
TFH, FY09Q4 - FY13Q3 2. Improve clinical
operations and
processes
a. Bring length of
service closer to
CAMHD policy
guidelines
b. Increase time
CAMHD clinical
team spend on
clinical tasks
c. Reduce turnover
of clinician positions
d. Improve
consistency of
monthly entry of
DAP notes
Orange Book Re-Authorization
Guideline = 240 days
2a. Length of Services

10
52
29 35
48
62 68
33
103 106
41 33
52
70 65
49
34
0
30
60
90
120
150M
ean
Len
gth
of
Servic
e
Fiscal Year/Quarter
Mean Length of Service:
HBR, FY09Q4 - FY13Q3 2. Improve clinical
operations and
processes
a. Bring length of
service closer to
CAMHD policy
guidelines
b. Increase time
CAMHD clinical
team spend on
clinical tasks
c. Reduce turnover
of clinician positions
d. Improve
consistency of
monthly entry of
DAP notes
Orange Book Re-Authorization
Guideline = 15 days
2a. Length of Services
11
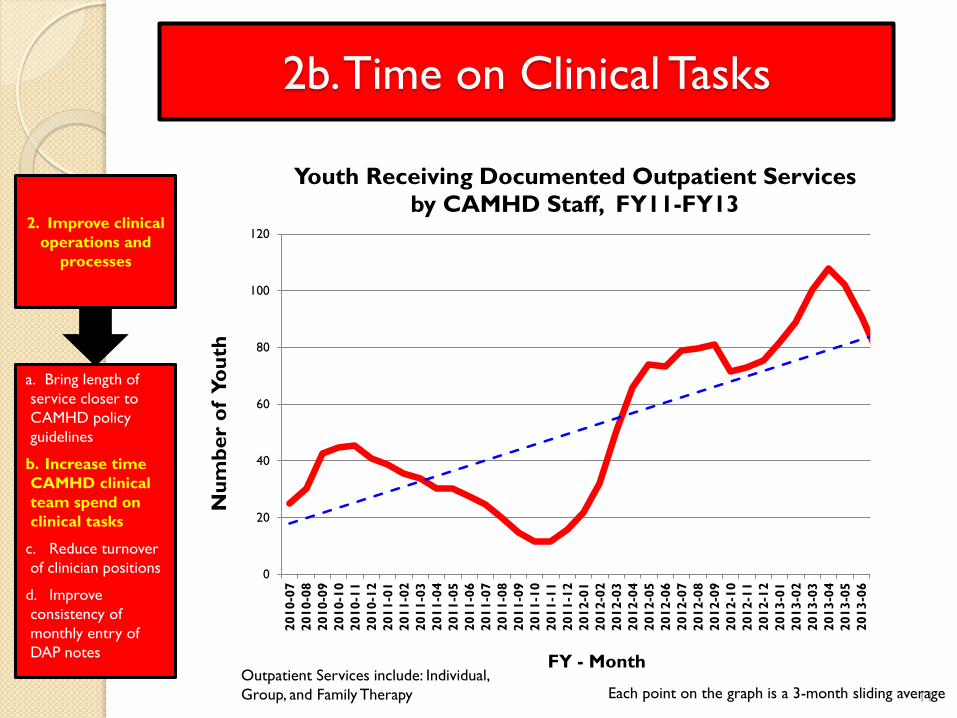
2b. Time on Clinical Tasks
2. Improve clinical
operations and
processes
a. Bring length of
service closer to
CAMHD policy
guidelines
b. Increase time
CAMHD clinical
team spend on
clinical tasks
c. Reduce turnover
of clinician positions
d. Improve
consistency of
monthly entry of
DAP notes
Each point on the graph is a 3-month sliding average
0
20
40
60
80
100
120
2010-0
7
2010-0
8
2010-0
9
2010-1
0
2010-1
1
2010-1
2
2011-0
1
2011-0
2
2011-0
3
2011-0
4
2011-0
5
2011-0
6
2011-0
7
2011-0
8
2011-0
9
2011-1
0
2011-1
1
2011-1
2
2012-0
1
2012-0
2
2012-0
3
2012-0
4
2012-0
5
2012-0
6
2012-0
7
2012-0
8
2012-0
9
2012-1
0
2012-1
1
2012-1
2
2013-0
1
2013-0
2
2013-0
3
2013-0
4
2013-0
5
2013-0
6
2013-0
7
2013-0
8
2013-0
9
2013-1
0
Nu
mb
er
of
Yo
uth
FY - Month
Youth Receiving Documented Outpatient Services
by CAMHD Staff, FY11-FY13
Outpatient Services include: Individual,
Group, and Family Therapy

12
2b. Time on Clinical Tasks
2. Improve clinical
operations and
processes
a. Bring length of
service closer to
CAMHD policy
guidelines
b. Increase time
CAMHD clinical
team spend on
clinical tasks
c. Reduce turnover
of clinician positions
d. Improve
consistency of
monthly entry of
DAP notes
Each point on the graph is a 3-month sliding average
0
100
200
300
400
500
600
700
800
900
2010-0
7
2010-0
8
2010-0
9
2010-1
0
2010-1
1
2010-1
2
2011-0
1
2011-0
2
2011-0
3
2011-0
4
2011-0
5
2011-0
6
2011-0
7
2011-0
8
2011-0
9
2011-1
0
2011-1
1
2011-1
2
2012-0
1
2012-0
2
2012-0
3
2012-0
4
2012-0
5
2012-0
6
2012-0
7
2012-0
8
2012-0
9
2012-1
0
2012-1
1
2012-1
2
2013-0
1
2013-0
2
2013-0
3
2013-0
4
2013-0
5
2013-0
6
2013-0
7
2013-0
8
2013-0
9
2013-1
0
Nu
mb
er
of
Yo
uth
FY - Month
Youth Receiving Documented Case Management
by CAMHD Staff, FY11-FY13
Case Mgmt. includes: Targeted and Intensive Case Mgmt.
13
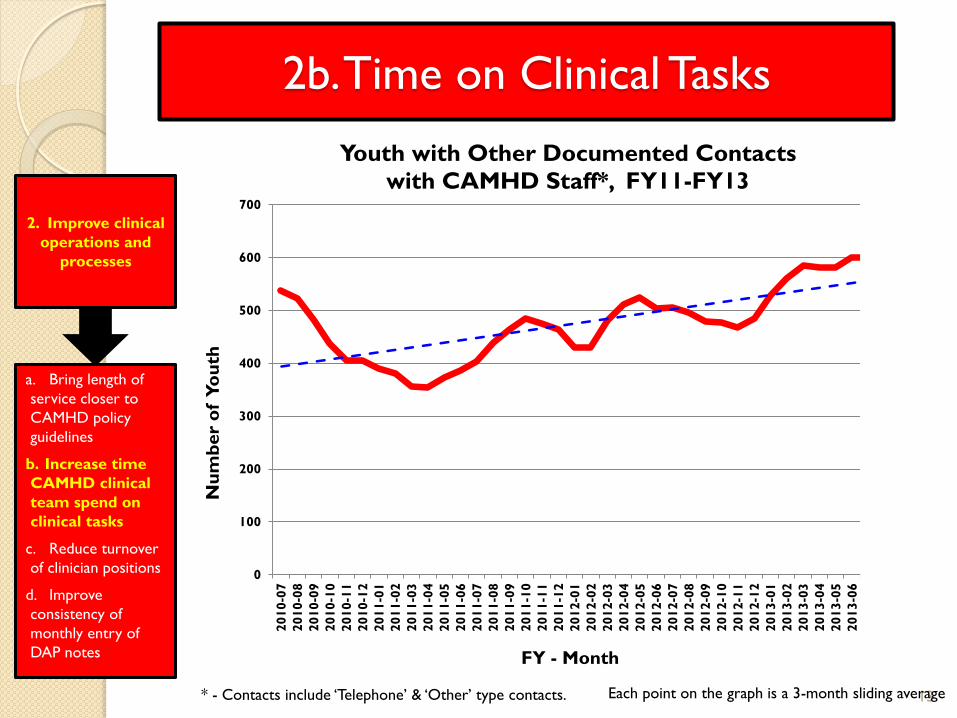
2b. Time on Clinical Tasks
2. Improve clinical
operations and
processes
a. Bring length of
service closer to
CAMHD policy
guidelines
b. Increase time
CAMHD clinical
team spend on
clinical tasks
c. Reduce turnover
of clinician positions
d. Improve
consistency of
monthly entry of
DAP notes
* - Contacts include ‘Telephone’ & ‘Other’ type contacts. Each point on the graph is a 3-month sliding average
0
100
200
300
400
500
600
700
2010-0
7
2010-0
8
2010-0
9
2010-1
0
2010-1
1
2010-1
2
2011-0
1
2011-0
2
2011-0
3
2011-0
4
2011-0
5
2011-0
6
2011-0
7
2011-0
8
2011-0
9
2011-1
0
2011-1
1
2011-1
2
2012-0
1
2012-0
2
2012-0
3
2012-0
4
2012-0
5
2012-0
6
2012-0
7
2012-0
8
2012-0
9
2012-1
0
2012-1
1
2012-1
2
2013-0
1
2013-0
2
2013-0
3
2013-0
4
2013-0
5
2013-0
6
2013-0
7
2013-0
8
2013-0
9
2013-1
0
Nu
mb
er
of
Yo
uth
FY - Month
Youth with Other Documented Contacts
with CAMHD Staff*, FY11-FY13

14
2c. Turnover of Clinical Positions
2. Improve clinical
operations and
processes
a. Bring length of
service closer to
CAMHD policy
guidelines
b. Increase time
CAMHD clinical team
spend on clinical tasks
c. Reduce turnover
of clinician positions
d. Improve consistency
of monthly entry of
DAP notes
0
5
10
15
20
2007 2008 2009 2010 2011 2012 2013
Nu
mb
er
of
Sta
ff
Fiscal Year
CAMHD Clinical Position Turnover
Rate, FY07-FY13

15
Statistically Significant Change in Use of Evidence-Based
Practice Elements: Past 5 Years
Disruptive Behavior Increasing Use:
◦ Family Engagement
◦ Psychoeducation-Parent
◦ Educational Support
Decreasing Use: ◦ Response Cost
◦ Interpretation
◦ Therapist Praise or Rewards
◦ Tangible Rewards
Anxiety Increasing Use:
◦ Exposure
◦ Guided Imagery
◦ Individual Therapy for Caregiver
Decreasing Use: ◦ None
Mood Increasing Use:
◦ Motivational Interviewing
◦ Guided Imagery
◦ Psychoeducation-Child
◦ Insight Building
Decreasing Use: ◦ Therapist Praise or Rewards
◦ Social Skills Training
Attention Increasing Use:
◦ Psychoeducation-Parent
◦ Communication Skills
◦ Insight Building
◦ Goal Setting
◦ Guided Imagery
Decreasing Use: ◦ None
3. Improve the
quality of
services provided
a. Increase use
of Evidence-
Based Txs
b. Increase
accessibility and
use of data in case
planning
c. Increase parent
engagement in case
planning
d. Improve
agreement
between CSP, Tx
plan, & MTPS
3a. Use of Evidence-Based Services

‘Three-Legged Stool’ of Feedback
16
3. Improve the
quality of
services provided
a. Increase use of
Evidence-Based Txs
b. Increase
accessibility and
use of data in
case planning
c. Increase parent
engagement in case
planning
d. Improve
agreement
between CSP, Tx
plan, & MTPS
3b. Use of Treatment Progress Data
MTPS
Ohio Scales
CAFAS
Treatment Provider
Care Coordinator
Parent & Youth CC, Therapist, Parent
& Youth Input
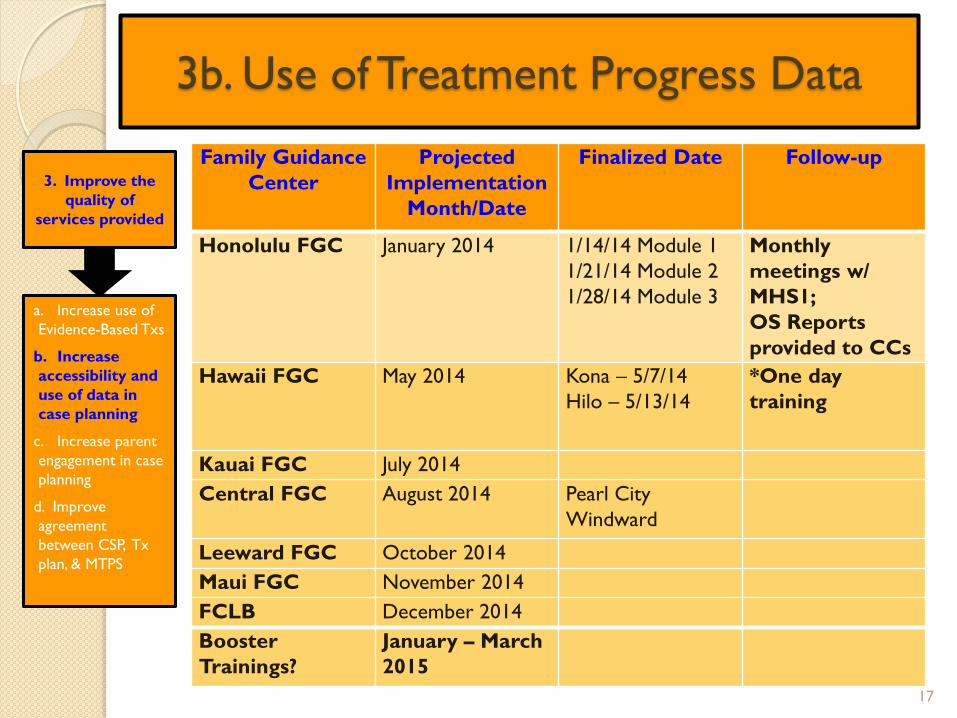
3b. Use of Treatment Progress Data
17
3. Improve the
quality of
services provided
a. Increase use of
Evidence-Based Txs
b. Increase
accessibility and
use of data in
case planning
c. Increase parent
engagement in case
planning
d. Improve
agreement
between CSP, Tx
plan, & MTPS
Family Guidance
Center
Projected
Implementation
Month/Date
Finalized Date Follow-up
Honolulu FGC January 2014 1/14/14 Module 1
1/21/14 Module 2
1/28/14 Module 3
Monthly
meetings w/
MHS1;
OS Reports
provided to CCs
Hawaii FGC May 2014 Kona – 5/7/14
Hilo – 5/13/14
*One day
training
Kauai FGC July 2014
Central FGC August 2014 Pearl City
Windward
Leeward FGC October 2014
Maui FGC November 2014
FCLB December 2014
Booster
Trainings?
January – March
2015

* - ‘Composite Score’ includes items related to parents’ participation in: choosing child’s services,
child’s Tx goals and participation in Tx. 18
3c. Family Engagement
3. Improve the
quality of
services provided
a. Increase use of
Evidence-Based
Txs
b. Increase
accessibility and
use of data in case
planning
c. Increase
parent
engagement in
case planning
d. Improve
agreement
between CSP, Tx
plan, & MTPS
79 81 82 88
81
0
20
40
60
80
100
2009 2010 2011 2012 2013
Perc
en
t o
f R
esp
on
ses
‘Str
on
gly
Agre
e’/’A
gre
e'
Survey Year (SY)
Consumer Survey: "Treatment Participation"
Composite Score* Percentage, SY09-SY13

19
3d. Agreement Between Planning and
Services Provided
3. Improve the
quality of
services provided
a. Increase use of
Evidence-Based Txs
b. Increase
accessibility and
use of data in case
planning
c. Increase parent
engagement in case
planning
d. Improve
agreement
between CSP,
Tx plan, & MTPS
References:
Young, J., Schiffman, J., Daleiden, E., Chorpita, B. & Mueller, C. (2007). Assessing stability between
treatment planning documents in a system of care. Administration and Policy in Mental Health and
Mental Health Services Research, 34, 530-539.
Lynch, R. (2012). Assessing stability between treatment plans and reported practices in a system of care.
Dissertation Abstracts International: Section B: The Sciences and Engineering, 73, 1852.
• Two UH-CAMHD studies provide
baseline data (see references below)
• Current efforts to implement this
are in process

20
4a. Federal Grants
4. Increase non-
state funding for
services
a. Increase # of
federal grant
dollars allocated
to CAMHD
b. Increase amount
of Medicaid dollars
allocated to
CAMHD
$1,937,900 $1,866,200 $1,809,290 $1,978,150
$2,400,289
$2,979,917
$3,762,129
$-
$1,000,000
$2,000,000
$3,000,000
$4,000,000
$5,000,000
2007 2008 2009 2010 2011 2012 2013
Do
llars
Fiscal Year
Federal Grant Funding, FY07-FY13
4b. Medicaid Reimbursement
21
0
5,000,000
10,000,000
15,000,000
20,000,000
2007 2008 2009 2010 2011 2012 2013
Do
llars
Fiscal Year
Medicaid Dollars Reimbursed,
FY07-FY13
4. Increase non-
state funding for
services
a. Increase # of
federal grant dollars
allocated to
CAMHD
b. Increase
amount of
Medicaid dollars
allocated to
CAMHD

5a. Rate of Youth Improvement
22
75.8% 74.8%
75.7% 75.8%
73.7% 73.2%
75.8% 77.7%
76.4%
78.5% 79.0% 80.7%
79.3% 79.7% 78.8% 78.6%
73.6%
75.6% 77.1%
68.8% 69.3%
70.9%
68.4% 69.0%
68.4% 69.1%
67.8% 66.5% 66.5%
68.2% 67.3%
68.8% 66.9%
65.0% 65.1% 66.3%
64.3% 64.7% 64.2%
65.9% 65.9%
63.5% 63.3% 64.7% 64.1%
62.8%
60.1% 61.0%
59.7%
61.9% 62.9%
61.5%
59.2% 59.5% 60.4%
62.4% 61.7% 61.7% 63.0%
50%
60%
70%
80%
90%
100%P
erc
en
t Im
pro
ved
Fiscal Year
Percent of Youth w/ Improving Trend*:
MTPS, CAFAS, CALOCUS, FY09-FY13
MTPS CAFAS CALOCUS
5. Improve
outcomes for
youth and
families
a. Increase
rate of
improvement
for youth
b. Improve
consumer
satisfaction
c. Improve
attendance in
school for
CAMHD youth
d. Decrease
arrests of youth
served
* - Up to most current assessment

5b. Consumer Satisfaction
23
5. Improve
outcomes for
youth and
families
a. Increase rate
of improvement
for youth
b. Improve
consumer
satisfaction
c. Improve
attendance in
school for
CAMHD youth
d. Decrease
arrests of youth
served
73.0 73.0 73.0
87.0
81.0
0
20
40
60
80
100
2009 2010 2011 2012 2013
Perc
en
t o
f S
urvey R
esp
on
den
ts
Survey Year (SY)
Percent "Satisfied" With CAMHD Services
Overall, SY09-FY13*
* - Percent whose average rating was 3.5 or higher on a 1-5 scale.

5c. School Attendance
24
5. Improve
outcomes for
youth and
families
a. Increase rate
of improvement
for youth
b. Improve
consumer
satisfaction
c. Improve
attendance in
school for
CAMHD
youth
d. Decrease
arrests of youth
served
Indicators of ‘School Attendance’
being collected through Ohio Scales:
• “Youth attended school in the past
30 days.”
• “If yes, what grade?”
• “Youth was suspended/expelled in
the past 30 days.”

5d. Youth Arrests
25
5. Improve
outcomes for
youth and
families
a. Increase rate
of improvement
for youth
b. Improve
consumer
satisfaction
c. Improve
attendance in
school for
CAMHD youth
d. Decrease
arrests of
youth served
Indicators of ‘Youth Arrests’ being
collected through Ohio Scales:
• “Youth arrested in the past 30
days.”
• “If yes, # of arrests.”

26
6a. Youth with Procured Services
2143 2265 2248
2110
1878 1954
2119
1431 1555 1518
1389
1197 1230 1313
0
500
1000
1500
2000
2500
3000
2007 2008 2009 2010 2011 2012 2013
Nu
mb
er
of
Yo
uth
Number of Youth Registered and Receiving
Procured Services, FY07 – FY13
# of Youth Registered # of Youth Served
6. Expand
populations
served
a. Increase #
of youth
served
annually
b. Decrease
mean age of
youth
c. Increase # of
youth served
w/ trauma
history
d. Increase
public
awareness
12.5% gain from FY11-FY13
9.7% gain from FY11-FY13

27
14.6 14.5 14.4 14.5 14.4 14.2
14.0
12
13
14
15
16
2007 2008 2009 2010 2011 2012 2013
Mean
Age
Fiscal Year
CAMHD Registered Youth (w/out Kauai)
Average Age, FY07-FY13
6b. Mean Age of Youth
6. Expand
populations
served
a. Increase # of
youth served
annually
b. Decrease
mean age of
youth
c. Increase # of
youth served
w/ trauma
history
d. Increase
public
awareness
.4 year decrease from FY11-FY13

28
6. Expand
populations
served
a. Increase # of
youth served
annually
b. Decrease
mean age of
youth
c. Increase #
of youth
served w/
trauma
history
d. Increase
public
awareness
6c. Youth Served w/ Trauma
0
50
100
150
200
250
300
Nu
mb
er
of
Yo
uth
Month
Number of Registered Youth
with Trauma* as a Diagnosis, FY10-FY13
* - Refers specifically to any current diagnosis listed as ‘PTSD’.

29
6. Expand
populations
served
a. Increase # of
youth served
annually
b. Decrease
mean age of
youth
c. Increase #
of youth
served w/
trauma
history
d. Increase
public
awareness
6c. Youth Served w/ Trauma
0
2
4
6
8
10
12
14
16
18
20
Perc
en
t o
f R
egis
tere
d Y
ou
th
Month
Percent of Registered Youth
with a Diagnosis of Trauma*, FY10-FY13
* - Refers specifically to any current diagnosis listed as ‘PTSD’.
30
6d. Public Awareness
• CAMHD: CAMHD website; Children’s
Mental Health Awareness Day; Help Your
Keiki website; FaceBook site postings
• Project Kealahou: PSAs; Web-based video
series; Magazine & Newspaper articles;
Charity benefit event; UH-Manoa orientation;
TV segments/interviews; Participation in
conferences
• Project Laulima: Resource table at ARC
Fair; IVAT (Institute on Violence and Trauma)
conference; Project Laulima website
1. Expand
populations
served
a. Increase # of
youth served
annually
b. Decrease
mean age of
youth
c. Increase # of
youth served
w/ trauma
history
d. Increase
public
awareness

31
6d. Public Awareness
1. Expand
populations
served
a. Increase # of
youth served
annually
b. Decrease
mean age of
youth
c. Increase # of
youth served
w/ trauma
history
d. Increase
public
awareness
Go to: http://helpyourkeiki.com/

32
ARE WE MOVING IN THE
RIGHT DIRECTION?

PANEL DISCUSSION
Dan Ulrich – Medical Director
Janet Ledoux – Public Health Admin Officer
Rachael Guay – Family Engagement Liaison
Tim Ryan – Branch Chief, Leeward FGC
Charles Mueller – Professor, UH-Manoa
Stan Michels – Chief Administrator
33
Related Documents