KONE 2020 ANNUAL REVIEW

Welcome message from author
This document is posted to help you gain knowledge. Please leave a comment to let me know what you think about it! Share it to your friends and learn new things together.
Transcript

KONE 2020
ANNUAL REVIEW

Contents
KONE in brief 1
KONE’s strategy 4
Board of Directors’ report 6
Shares and shareholders 27Key figures and financial development 30Calculation of key figures 31
Consolidated financial statements 32
Consolidated statement of income 32Consolidated statement of financial position 33Consolidated statement of changes in equity 34Consolidated statement of cash flows 35
Notes to the consolidated financial statements 36
1. Basis of preparation 36
2. Financial performance 382.1 Sales 392.2 Costs and expenses 402.3 Depreciation and amortization 402.4 Foreign exchange sensitivity 412.5 Financing income and expenses 422.6 Income taxes 432.7 Earnings per share 432.8 Other comprehensive income 44
3. Net working capital 453.1 Inventories 463.2 Accounts receivable and
contract assets and liabilities 463.3 Deferred assets 483.4 Accruals 483.5 Provisions 493.6 Deferred tax assets and liabilities 50
4. Acquisitions and capital expenditure 51
4.1 Acquisitions 524.2 Goodwill 534.3 Intangible assets 544.4 Tangible assets 55
5. Capital structure 575.1 Capital management 585.2 Shareholders’ equity 595.3 Financial risks and instruments 615.4 Shareholdings and other
non-current financial assets 645.5 Deposits and loans receivable 655.6 Commitments 655.7 Employee benefits 66
6. Others 686.1 Management remuneration 696.2 Share-based payments 706.3 Related party transactions 71
Parent company financial statements 72
Subsidiaries 82
Board of Directors’ dividend proposal and signatures 85
Auditor s report 86
Corporate governance statement 91
Corporate governance principles 91Board of Directors 96Executive Board 97

Coal Valley
Allen
Torreón
Hyvinkää
Motala Helsinki
Ùsti nad labemCadrezzate
Chennai
Kunshan
Nanxun (GiantKONE)
Pero
KONE ANNUAL REVIEW 2020
KONE in brief
At KONE, our mission is to improve the flow of urban life. As a global leader in the elevator and escalator industry, KONE provides elevators, escalators and automatic building doors, as well as solutions for maintenance and modernization, which add value to the life cycle of any building. Through more effective People Flow®, we make people’s journeys safe, convenient and reliable, in taller, smarter buildings. Together with our partners and customers around the world, we help cities to become better places to live in.
~550,000 customers
>60,000 employees
>1,400,000 equipment in KONE’s maintenance base
Sales MEUR 9,939 in 2020
We move over
1 billion people every day
Operations in over
60 countries
Authorized distributors and agents in close
to 100 countries
Head office
Global R&D site
Production site
KONE is present
KONE ANNUAL REVIEW 2020
1

KONE ANNUAL REVIEW 2020
KEY FIGURES
Key figures
Adjusted EBIT, MEUR and adjusted EBIT margin, %
1,500 24.0
1,250 20.0
1,000 16.0
750 12.0
500 8.0
250 4.0
0 0
Adjusted EBIT Adjusted EBIT margin
Sales, MEUROrders received*, MEUR
10,000
8,000
6,000
4,000
2,000
0
12,000
10,000
8,000
6,000
4,000
2,000
0
*) Orders received do not include maintenance contracts
1,1121,237 1,251
7,7978,400 8,185
9,0719,982 9,939
12.3% 12.4% 12.6%
1–12/2020 1–12/2019 Change
Change at comparable
exchange rates
Orders received MEUR 8,185.1 8,399.8 -2.6% -0.6%
Order book MEUR 7,728.8 8,051.5 -4.0% 0.7%
Sales MEUR 9,938.5 9,981.8 -0.4% 1.4%
Operating income MEUR 1,212.9 1,192.5 1.7%
Operating income margin % 12.2 11.9
Adjusted EBIT* MEUR 1,250.5 1,237.4 1.1%
Adjusted EBIT margin* % 12.6 12.4
Income before tax MEUR 1,224.2 1,217.5 0.6%
Net income MEUR 947.3 938.6 0.9%
Basic earnings per share EUR 1.81 1.80 0.6%
Cash flow from operations (before financing items and taxes) MEUR 1,907.5 1,549.6
Interest-bearing net debt MEUR -1,953.8 -1,552.9
Equity ratio % 45.5 46.5
Return on equity % 29.7 30.1
Net working capital (including financing items and taxes) MEUR -1,160.1 -856.0
Gearing % -61.1 -48.6
* In September 2017, KONE introduced a new alternative performance measure, adjusted EBIT, to enhance comparability of the business perfor-mance between reporting periods during the Accelerate program. Restructuring costs related to the Accelerate program are excluded from the calculation of the adjusted EBIT.
2
KEY FIGURES
20202020 20192019 20182018 202020192018

KONE ANNUAL REVIEW 2020
KEY FIGURES
*) Cash flow from operations before financing items and taxes
Cash flow*, MEUR Earnings per share, EUR Dividend per class B share, EUR
2,000
1,750
1,500
1,250
1,000
750
500
250
0
2.10
1.80
1.50
1.20
0.90
0.60
0.30
0
2.40
2.10
1.80
1.50
1.20
0.90
0.60
0.30
0
Sales by businessSales by region
EMEA 39% (41%) Americas 20% (21%) Asia-Pacific 41% (39%)
1–12/2020 (1–12/2019)
New equipment 54% (53%) Maintenance 32% (32%) Modernization 14% (15%)
1–12/2020 (1–12/2019)
1.65
1,150
1,550
1,908
1.631.80 1.81
1.70
2.25
*) Board’s proposal. Includes proposed extraordinary dividend of EUR 0.50 per class B share.
3
KEY FIGURES
2020 2020 2020*2019 2019 20192018 2018 2018

KONE ANNUAL REVIEW 2020
Core products and services
New solutions for customer value
Smart and sustainable cities
Service business in China
MEGATRENDS
WHERE TO WINWe will lead the way in:
OUR MISSION IS TO IMPROVE THE FLOW OF URBAN LIFE
MISS
ION
SUSTAINABILITYURBANIZATION
WE CREATE THE BEST PEOPLE FLOWTM EXPERIENCE
VISI
ONWAYS TO WINWe will ensure our success through:
Empowered people
Digital+ physical enterprise
Marketing and sales
renewal
Lean KONE
CULTURE
SAFETYQUALITYSUSTAINABILITY
STRATEGIC TARGETS
Great place to workMost loyal customersFaster than market growthBest financial developmentLeader in sustainability
KONEWAY
CARE
COLLABORATION
CUSTOMER
COURAGE
KONE’s strategy
STRATEGY
At KONE, our mission is to improve the flow of urban life. We understand urbanization and help our customers make the best of the world’s cities, buildings and public spaces. Our vision is to create the best People Flow experience. We believe our vision can be best achieved by working together with our customers and partners in every step of the process.
KONE’s strategic phase 2021–2024 is called ‘Sustain-able success with customers’. During the four-year strategy period, KONE will focus on increasing the value it creates for customers with new intelligent solutions and will embed sustainability even deeper across all of its operations.
Urbanization, sustainability and technology are three megatrends which continue to be key drivers in the development of the elevator and escalator industry. Against this backdrop, ‘Sustainable success with customers’ will address the needs of a digitally enabled world, where the ways people live, work and commute continue to change. KONE will focus on developing smart and sustainable solutions that adapt to future needs, together with its customers and partners. By doing this, KONE will enable cus-tomers’ facilities to function more effectively and to deliver an improved user experience.
KONE mission and vision KONE’s mission is to improve the flow of urban life. This means understanding urbanization and helping customers make cities better and more sustainable places to live.
KONE’s vision is to create the best People Flow experience. The best experience can be created by working together with customers and partners in every step of the process, from early engagement to upgrading equipment.
Clear focus areas for successIn order to bring clear direction to our strategy, KONE has defined four Where to Win areas, representing the biggest opportunities for profitable growth and differentiation:
• Core products and services, matching customer specific needs for a seamless experience through connectivity and adaptability. All products and services will be optimized for cost efficiency and sustainability.
• New solutions for customer value, which are developed and integrated with core products and services to create value for customers in new ways.
• Smart and sustainable cities: becoming the preferred part-ner for smart and sustainable city development.
• Service business in China: becoming a clear market leader in this very fast-growing and fragmented market.
4
STRATEGY
KONE ANNUAL REVIEW 2020
Core products and services
New solutions for customer value
Smart and sustainable cities
Service business in China
MEGATRENDS
WHERE TO WINWe will lead the way in:
OUR MISSION IS TO IMPROVE THE FLOW OF URBAN LIFE
MISS
ION
SUSTAINABILITYURBANIZATION
WE CREATE THE BEST PEOPLE FLOWTM EXPERIENCE
VISI
ON
WAYS TO WINWe will ensure our success through:
Empowered people
Digital+ physical enterprise
Marketing and sales
renewal
Lean KONE
CULTURE
SAFETYQUALITYSUSTAINABILITY
STRATEGIC TARGETS
Great place to workMost loyal customersFaster than market growthBest financial developmentLeader in sustainability
KONEWAY
CARE
COLLABORATION
CUSTOMER
COURAGE
STRATEGY
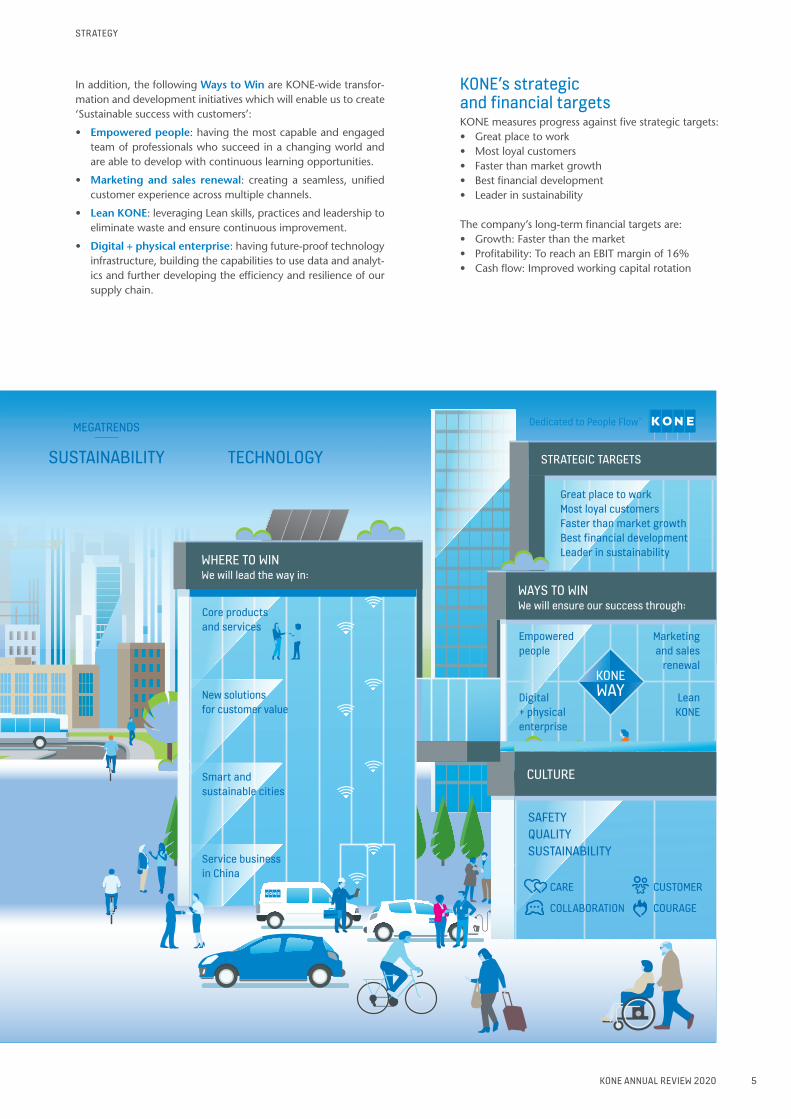
In addition, the following Ways to Win are KONE-wide transfor-mation and development initiatives which will enable us to create ‘Sustainable success with customers’:
• Empowered people: having the most capable and engaged team of professionals who succeed in a changing world and are able to develop with continuous learning opportunities.
• Marketing and sales renewal: creating a seamless, unified customer experience across multiple channels.
• Lean KONE: leveraging Lean skills, practices and leadership to eliminate waste and ensure continuous improvement.
• Digital + physical enterprise: having future-proof technology infrastructure, building the capabilities to use data and analyt-ics and further developing the efficiency and resilience of our supply chain.
KONE’s strategic and financial targets KONE measures progress against five strategic targets:• Great place to work• Most loyal customers• Faster than market growth• Best financial development • Leader in sustainability
The company’s long-term financial targets are:• Growth: Faster than the market• Profitability: To reach an EBIT margin of 16%• Cash flow: Improved working capital rotation
5
STRATEGY
KONE ANNUAL REVIEW 2020
Board of Directors’ report
CREATING VALUE BY IMPROVING THE FLOW OF URBAN LIFE
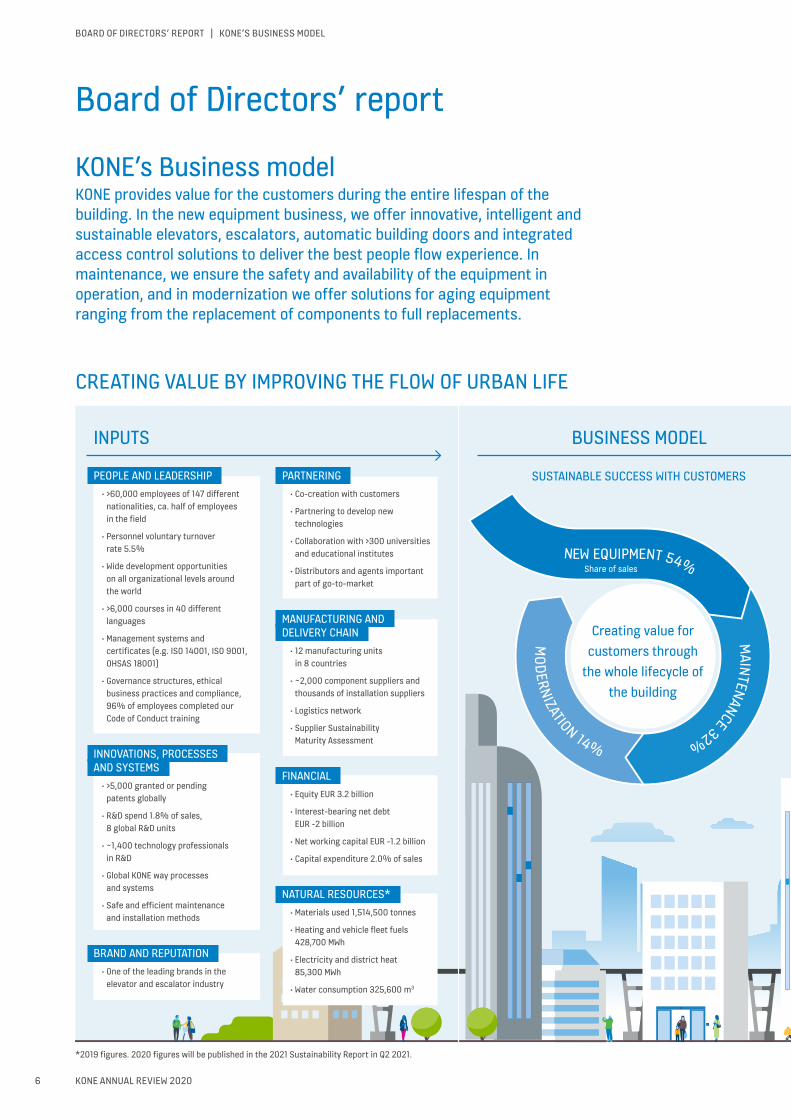
KONE’s Business modelKONE provides value for the customers during the entire lifespan of the building. In the new equipment business, we offer innovative, intelligent and sustainable elevators, escalators, automatic building doors and integrated access control solutions to deliver the best people flow experience. In maintenance, we ensure the safety and availability of the equipment in operation, and in modernization we offer solutions for aging equipment ranging from the replacement of components to full replacements.
*2019 figures. 2020 figures will be published in the 2021 Sustainability Report in Q2 2021.
MAINTENANCE 32%
PARTNERING• Co-creation with customers
• Partnering to develop new technologies
• Collaboration with >300 universities and educational institutes
• Distributors and agents important part of go-to-market
MANUFACTURING ANDDELIVERY CHAIN
• 12 manufacturing units in 8 countries
• ~2,000 component suppliers and thousands of installation suppliers
• Logistics network
• Supplier Sustainability Maturity Assessment
FINANCIAL• Equity EUR 3.2 billion
• Interest-bearing net debt EUR -2 billion
• Net working capital EUR -1.2 billion
• Capital expenditure 2.0% of sales
NATURAL RESOURCES*• Materials used 1,514,500 tonnes
• Heating and vehicle fleet fuels 428,700 MWh
• Electricity and district heat 85,300 MWh
• Water consumption 325,600 m3
BUSINESS MODELINPUTS
PEOPLE AND LEADERSHIP• >60,000 employees of 147 different
nationalities, ca. half of employees in the field
• Personnel voluntary turnover rate 5.5%
• Wide development opportunities on all organizational levels around the world
• >6,000 courses in 40 different languages
• Management systems and certificates (e.g. ISO 14001, ISO 9001, OHSAS 18001)
• Governance structures, ethical business practices and compliance, 96% of employees completed our Code of Conduct training
INNOVATIONS, PROCESSESAND SYSTEMS
• >5,000 granted or pending patents globally
• R&D spend 1.8% of sales, 8 global R&D units
• ~1,400 technology professionals in R&D
• Global KONE way processes and systems
• Safe and efficient maintenance and installation methods
BRAND AND REPUTATION• One of the leading brands in the
elevator and escalator industry
SUSTAINABLE SUCCESS WITH CUSTOMERS
NEW EQUIPMENT 54%
Creating value for customers through
the whole lifecycle of the building
MODERNIZATION 14%
Share of sales
BOARD OF DIRECTORS’ REPORT | KONE’S BUSINESS MODEL
6
BOARD OF DIRECTORS’ REPORT | KONE’S BUSINESS MODEL

KONE ANNUAL REVIEW 2020
Growth driversThe key growth drivers of the new equip-ment business are urbanization and changing demographics. New equipment deliveries are the main growth driver of the maintenance business as majority of units delivered will end up in KONE’s mainte-nance base. However, KONE maintains also other OEM’s equipment. The main growth drivers for modernization are the aging installed base and higher requirements for efficient people flow, safety and sustain-ability. Having a strong maintenance base is crucial for the growth in modernization. KONE sees significant growth opportuni-ties also in creating value for customers in new ways with the help of new technolo-gies and connectivity.
Business characteristicsKONE’s business model is capital light as the working capital is negative in all businesses and we work extensively with component suppliers to complement our own manufacturing capacity. The mainte-nance business is very stable due to high requirements for safety and reliability. The customer relationships are also typically long and stable (>90% annual retention rate). New equipment and modernization are more cyclical in nature and follow the construction cycles.
Key value driversKONE has identified five strategic inputs crucial in creating value for customers, shareholders and the society. These are:1) competent and engaged people and strong leadership, 2) innovative offering and global processes and systems, 3) best partners, 4) efficient manufacturing and delivery chain as well as 5) strong brand and solid reputation.
These are described in more detail in the picture below. In addition to these, KONE sees that the lifecycle business model and the existing maintenance base of over 1.4 million units have a crucial role in value creation. The different businesses support the growth of each other and together provide stability for the business.
MAINTENANCE 32%
BUSINESS MODEL
SUSTAINABLE SUCCESS WITH CUSTOMERS
MOVING OVER 1 BILLION PEOPLE
EVERY DAY
SHAREHOLDERS• Operating income EUR 1,213 million
• Dividend proposal EUR 2.25 per class B share (incl. extraordinary dividend), total amount of proposed dividends MEUR 1,166
• Return on equity 29.7%
SOCIETY• Recognized for our contribution to better societies and urban
environment by several external parties, e.g. CDP, Forbes and The Financial Times’ Diversity leaders report
• Wages, salaries, other employment expenses and pensions EUR 3.0 billion
• Industrial Injury Frequency Rate (IIFR) 1.2
• 83% of external hires into leadership positions from local communities
• 19% of director level positions held by women
• Increased amount of skilled workforce
• Direct purchases EUR 4.0 billion
• Income taxes EUR 276.9 million with effective tax rate 22.6%
ENVIRONMENT*• 3.1% y/y reduction in operational carbon footprint relative to sales
• 5.4% y/y reduction of Scope 1&2 carbon footprint relative to sales
• 37% of green electricity
• 93.9% of waste recycled or incinerated
• 100% of corporate units, major manufacturing units and R&D units are ISO 14001 and ISO 9001 certified
• 90% of strategic suppliers with ISO 14001 certification at the end of 2020
THE MOST SUSTAINABLEOFFERING
• ~180,000 new elevators and escalators ordered in 2020
• Maintenance and modernization services, >1.4 million units in maintenance base
• Best in class energy efficiency, ISO 25745 A-class energy rating as the first elevator company
• Up to 70% energy savings through modernization of elevators
• Focus on safety and accessibility
EMISSIONS AND WASTE*• Carbon footprint from own operations
327,100 tCO2e
• Waste 42,900 tonnes
• Wastewater effluents 8 tonnes
OUTPUTS IMPACT
BOARD OF DIRECTORS’ REPORT | KONE’S BUSINESS MODEL
7
BOARD OF DIRECTORS’ REPORT | KONE’S BUSINESS MODEL

KONE ANNUAL REVIEW 2020
KONE’s operating environment in 2020
Operating environment by region
New equipment market in units
Maintenance market in units Modernization market
Total market Stable + Stable
EMEA – + ––Central and North Europe Stable + ––South Europe –– Stable ––Middle East –– + –
North America ––– + +
Asia-Pacific + ++ +China ++ ++ ++Rest of Asia-Pacific ––– + Stable
In 2020, the global elevator and escala-tor market was impacted by the COVID-19 pandemic. Governments across the world were taking significant measures to contain the outbreak by restricting the movement of people. In many places, this resulted in actions such as closing down construction sites and limiting manufac-turing operations especially in the first half of the year. In most countries, main-tenance was deemed an essential service which was allowed with some limitations even during lockdowns. In the beginning of the year, COVID-19 had the biggest
impacts on the market in China, whereas from the second quarter onwards China was driving the growth and other markets were more impacted.
In the new equipment market, demand decreased in most parts of the world. In Asia-Pacific, the new equip-ment volumes grew slightly as a result of high level of activity in China after the challenging first quarter. In the rest of Asia-Pacific, the new equipment mar-kets declined significantly. In the EMEA region, the new equipment market declined slightly. The new equipment
market in Central and North Europe was stable, whereas in South Europe and in the Middle East, the market declined clearly. In North America, the new equipment market declined significantly.
Global maintenance market was resilient during 2020. The increased uncertainty had a bigger impact on the modernization markets due to delayed decision-making.
Intensifying competition affected pricing environment adversely in Janu-ary–December.
– – – Significant decline (>10%), – – Clear decline (5–10%), – Slight decline (<5%), Stable, + Slight growth (<5%), ++ Clear growth (5–10%), +++ Significant growth (>10%)
BOARD OF DIRECTORS’ REPORT
8
BOARD OF DIRECTORS’ REPORT

KONE ANNUAL REVIEW 2020
Orders received and order book
Orders received and order book
MEUR 2020 2019 Change
Change at comparable
exchange ratesOrders received 8,185.1 8,399.8 -2.6% -0.6%
Order book 7,728.8 8,051.5 -4.0% 0.7%
Orders received development by region*
New equipment orders Modernization orders Total orders
EMEA –– –– ––
Americas ––– +++ ––
Asia-Pacific ++ ++ ++China +++ +++ +++
*) in monetary value at comparable exchange rates
Orders received consist predominantly of new equipment and modernization orders. Maintenance contracts are not included in orders received, but the figure includes orders related to the maintenance business, such as repairs.
Orders received declined by 2.6% as compared to January–December 2019 and totaled EUR 8,185.1 million. At com-parable exchange rates, KONE’s orders received declined by 0.6%.
At comparable rates, new equipment orders received declined slightly with slight growth in the volume business and significant decline in major projects. In modernization, orders received grew slightly with slight decline in the volume business and significant growth in major projects.
The relative margin of orders received improved slightly compared to the com-parison period. This was a result of solid pricing supported by new product and service launches and easing cost pressures.
KONE’s new equipment orders received in elevator and escalator units amounted to approximately 180,000 units (2019: 173,000).
Orders received in the EMEA region declined clearly at comparable exchange rates as compared to January–December 2019. New equipment orders declined clearly and modernization orders declined clearly.
In the Americas region, orders received declined clearly at comparable rates as compared to January–December 2019. New equipment orders declined significantly and modernization orders grew significantly.
Orders received in the Asia-Pacific region grew clearly at comparable rates
as compared to January–December 2019. In China, new equipment orders grew significantly in units and grew significantly in monetary value. Like-for-like prices were slightly higher than in the comparison period and mix contributed also positively. In the rest of Asia-Pacific, new equipment orders received declined significantly. Modernization orders received grew sig-nificantly in China and declined clearly in the rest of Asia-Pacific.
The order book declined slightly compared to the end of December 2019 but stood at a strong level of EUR 7,728.8 million at the end of the reporting period.
The order book margin remained at a healthy level. Customer cancellations remained at a low level.
BOARD OF DIRECTORS’ REPORT
– – – Significant decline (>10%), – – Clear decline (5–10%), – Slight decline (<5%), Stable, + Slight growth (<5%), ++ Clear growth (5–10%), +++ Significant growth (>10%)
Terminology: Slight <5%, clear 5–10%, significant >10%
9
BOARD OF DIRECTORS’ REPORT

KONE ANNUAL REVIEW 2020
Sales
Sales by region
MEUR 2020 2019 Change
Change at comparable
exchange ratesEMEA 3,916.2 4,045.4 -3.2% -2.2%
Americas 1,939.5 2,046.7 -5.2% -2.7%
Asia-Pacific 4,082.8 3,889.7 5.0% 7.5%
Total sales 9,938.5 9,981.8 -0.4% 1.4%
Sales by business
MEUR 2020 2019 Change
Change at comparable
exchange ratesNew equipment sales 5,340.2 5,318.8 0.4% 2.7%
Service sales 4,598.4 4,663.0 -1.4% 0.1%
Maintenance 3,215.6 3,192.0 0.7% 2.2%
Modernization 1,382.8 1,471.0 -6.0% -4.5%
Total sales 9,938.5 9,981.8 -0.4% 1.4%
Sales development by region and by business*
2020 New equipment Maintenance Modernization
EMEA –– + ––Americas – – ––Asia-Pacific ++ ++ ++
*) in monetary value at comparable exchange rates
KONE’s sales declined by 0.4% as com-pared to January–December 2019, and totaled EUR 9,938.5 million. At compa-rable exchange rates, KONE’s sales grew by 1.4%. The sales consolidated from the companies acquired in 2020 had only a minor impact on KONE’s sales for the financial period.
Sales were impacted by the COVID-19 related restrictions in many markets.
New equipment sales accounted for EUR 5,340.2 million and grew by 0.4% over the comparison period. At compara-ble exchange rates, new equipment sales grew by 2.7%. The growth in China offset the decline in activity in many other areas.
Service (maintenance and modern-ization) sales declined by 1.4%, and totaled EUR 4,598.4 million. At compa-rable exchange rates, service sales grew by 0.1%. Maintenance sales grew by 0.7% (2.2% at comparable exchange rates) and
totaled EUR 3,215.6 million with resilient contract sales but lower discretionary spend by customers. Modernization sales were more impacted by the restrictions and declined by 6.0% (declined by 4.5% at comparable exchange rates) totaling EUR 1,382.8 million.
KONE’s elevator and escalator main-tenance base continued to grow and was over 1.4 million units at the end of 2020 (over 1.3 million units at the end of 2019).
The growth of the maintenance base was driven, in particular, by a continued good level of conversions of new equip-ment deliveries to the maintenance base. Acquisitions had only a minor positive contribution to the growth. In 2020, the balance of maintenance contracts that were won from or lost to competition was slightly negative.
The largest individual countries in terms of sales were China (~30%), The
United States (>15%), Germany (6%) and France (5%).
Sales in the EMEA region declined by 3.2% and totaled 3,916.2 million. At comparable exchange rates, sales declined by 2.2%. New equipment sales declined clearly, maintenance sales grew slightly and modernization sales declined clearly in the region.
In the Americas, sales declined by 5.2% and totaled EUR 1,939.5 million. At comparable exchange rates, sales declined by 2.7%. New equipment sales declined slightly, maintenance sales declined slightly and modernization sales declined clearly in the region.
In Asia-Pacific, sales grew by 5.0% and totaled EUR 4,082.8 million. At com-parable exchange rates, sales grew by 7.5%. New equipment sales grew clearly, maintenance sales grew clearly and mod-ernization sales grew clearly in the region.
– – – Significant decline (>10%), – – Clear decline (5–10%), – Slight decline (<5%), Stable, + Slight growth (<5%), ++ Clear growth (5–10%), +++ Significant growth (>10%)
BOARD OF DIRECTORS’ REPORT
Terminology: Slight <5%, clear 5–10%, significant >10%
10
BOARD OF DIRECTORS’ REPORT

KONE ANNUAL REVIEW 2020
Financial result
Financial result
Jan 1–Dec 31, 2020 Jan 1–Dec 31, 2019
Operating income, MEUR 1,212.9 1,192.5Operating income margin, % 12.2 11.9Adjusted EBIT, MEUR 1,250.5 1,237.4Adjusted EBIT margin, % 12.6 12.4Income before taxes, MEUR 1,224.2 1,217.5Net income, MEUR 947.3 938.6
Basic earnings per share, EUR 1.81 1.80
KONE’s operating income (EBIT) was EUR 1,212.9 million or 12.2% of sales. The adjusted EBIT, which excludes restructur-ing costs related to the Accelerate pro-gram, was EUR 1,250.5 million or 12.6% of sales.
Going into this year we had an overall positive outlook for our margins. Despite the uncertain environment, profitability
improved. This was a result of earlier improved margin of orders and lower dis-cretionary spend offsetting the negative impacts of the COVID-19 pandemic.
Translation exchange rates had a nega-tive impact of 18.4 million on the operat-ing income. Restructuring costs related to the Accelerate program were EUR 37.7
million and savings from the program were over EUR 50 million.
KONE’s income before taxes was EUR 1,224.2 million. Taxes totaled EUR 276.9 (278.9) million. This represents an effec-tive tax rate of 22.6% for the full financial year. Net income for the period was EUR 947.3 million.
Basic earnings per share was EUR 1.81.
Cash flow and financial position
Cash flow and financial position
Jan 1–Dec 31, 2020 Jan 1–Dec 31, 2019
Cash flow from operations (before financing items and taxes), MEUR 1,907.5 1,549.6Net working capital (including financing items and taxes), MEUR -1,160.1 -856.0Interest-bearing net debt, MEUR -1,953.8 -1,552.9Gearing, % -61.1 -48.6Equity ratio, % 45.5 46.5Equity per share, EUR 6.12 6.13
KONE’s financial position was very strong at the end of December 2020.
Cash flow from operations (before financing items and taxes) during Janu-ary–December 2020 was exceptionally strong at EUR 1,907.5 million.
Net working capital (including financ-ing items and taxes) was EUR -1,160.1 million at the end of December 2020. The improvement was driven by a posi-
tive development in several net working capital items.
Interest-bearing net debt was EUR -1,953.8 million at the end of December 2020. KONE’s cash and cash equivalents together with current deposits and loan receivables were EUR 2,629.4 (Dec 31, 2019: 2,252.0) million at the end of the reporting period. Interest-bearing liabilities were EUR 695.8 (Dec 31, 2019:
721.6) million, including a pension liability of EUR 187.2 (Dec 31, 2019: 172.9) mil-lion and leasing liability of EUR 342.9 (Dec 31, 2019: 371.0) million. Additionally, KONE had an asset on employee benefits, EUR 19.2 (Dec 31, 2019: 21.7) million. Gearing was -61.1% and equity ratio was 45.5% at the end of December 2020. Equity per share was EUR 6.12.
BOARD OF DIRECTORS’ REPORT
11
BOARD OF DIRECTORS’ REPORT

KONE ANNUAL REVIEW 2020
Capital expenditure and acquisitions
Capital expenditure
MEUR Jan 1–Dec 31, 2020 Jan 1–Dec 31, 2019
On fixed assets 87.5 98.0On leasing agreements 113.4 102.5On acquisitions 29.0 36.0Total 230.0 236.5
KONE’s capital expenditure and acquisi-tions totaled EUR 230.0 million in January–December 2020. Capital expenditure was mainly related to equipment and facilities in R&D, IT, operations and production. Capital expenditure on leases consists mainly of maintenance vehicles and office facilities.
Acquisitions totaled EUR 29.0 million in January–December 2020. KONE com-pleted small acquisitions of maintenance businesses in the EMEA region.
In the Financial Statement Bulletin 2019, KONE mentioned it had been evalu-ating acquisition opportunities related to the thyssenkrupp Elevator Technology
business. On February 17, 2020 KONE published a stock exchange release stating it has withdrawn from these discussions with thyssenkrupp.
Research and development
R&D expenditure
MEUR Jan 1–Dec 31, 2020 Jan 1–Dec 31, 2019
R&D expenditure 179.6 170.9As percentage of sales, % 1.8 1.7
KONE’s vision is to create the Best People Flow® experience. The objective of KONE’s solution and service development is to drive differentiation further by putting the needs of customers and users at the center of all development. By closer col-laboration with customers and partners, KONE will increase the speed of bringing new services and solutions to the market.
Research and development expendi-ture totaled EUR 179.6 million, represent-ing 1.8% of sales in January–December 2020. R&D expenditures include the development of new product and service concepts as well as further development of existing solutions and services. At KONE, we find it especially important to continue to invest in research and development in challenging market conditions and have thus accelerated some development pro-grams during 2020.
During January–December 2020, KONE launched new solutions as well as updates to its offering.
In the beginning of 2020, KONE started the launch of a new elevator series,
KONE DX Class elevators, from Europe and the roll-out continued to Middle East, Russia, Turkey and countries in the Asia-Pacific region during the year. This new elevator series featuring built-in connectiv-ity and an enhanced user experience was introduced in the end of 2019 and will replace the current KONE elevator range across areas. In the second quarter, KONE DX Class elevators won four awards in the renowned Red Dot Award: Product Design 2020 competition. The KONE DX Class elevator interior collection and the KONE DX Class digital experience elevator con-cept were awarded for their outstanding design features, innovativeness and smart elements. During the year, the KONE DX Class elevators were made available also for modernization in many markets. This enables customers to access the digital services and applications offered by KONE and KONE’s ecosystem partners by mod-ernizing their equipment to DX Class.
In the second quarter, KONE intro-duced a range of people flow solutions to help make buildings and cities safer
and healthier places to live, work and commute. These solutions address the challenges of adapting to a new way of life in the face of the current pandemic. The KONE People Flow Planning and Consult-ing service has been tailored to better sup-port planning a safe return to offices and other buildings. By using data, simulation tools, and expertise from KONE’s interior architects and data scientists, customers can quickly see how to reduce crowd-ing and bottlenecks and enable people to move around safely in buildings. In addition, other new solutions introduced improve air quality in elevators, help dis-infect escalator handrails and reduce the need to touch surfaces.
In the third quarter, KONE launched KONE MonoSpace® 300 elevator in the Americas. KONE MonoSpace 300 is a cost-efficient machine room-less elevator offering better ride comfort and improved energy-efficiency for a market segment previously dominated by hydraulic eleva-tors.
BOARD OF DIRECTORS’ REPORT
12
BOARD OF DIRECTORS’ REPORT

KONE ANNUAL REVIEW 2020
In the fourth quarter, KONE introduced KONE Office Flow™ for offices in high-rise buildings in selected key markets in North America, Europe, Middle East and Asia Pacific. KONE Office Flow™ is a modular,
connected people flow solution deliver-ing personalized access and enhanced user experiences in smart, adaptive workplaces. With touchless access and predictive elevator calling it integrates
with mobile devices, removing the need for key cards and tags. It features a newly designed destination control system, visi-tor management and guidance to reduce waiting and journey times.
Non-financial information
Sustainability is a source of innovation and a competitive advantage for KONE. We want to be the most trusted partner to our customers throughout the build-ing life cycle and help them achieve their sustainability objectives, creating better urban environments. At KONE, sustain-ability covers our offering, operations and culture and encompasses the environmen-tal aspect, diversity and inclusion, safety, quality and ethics and compliance. Our strategy and values reflect our commit-ment to sustainable practices.
KONE is proud to conduct its business in a responsible and sustainable way, and we expect the same commitment from all our partners. We are committed to the laws and regulations of the countries where we operate. KONE is a member of the UN Global Compact and dedicated to upholding its ten principles, which are aimed at promoting sustainability and fairness in the business environment. The principles are embedded in our strategy, policies and procedures, such as KONE’s Code of Conduct, Competition Com-pliance Policy, and our Environmental Excellence Program, as well as related processes. In addition, KONE supports the UN Sustainable Development agenda and its goals. KONE has also signed the Paris Pledge for Action climate initiative and in 2020, set Science Based Targets for its operations, offering and the value chain, showing climate leadership and commitment to limiting global warm-ing to 1.5 degrees Celsius in accordance with the Paris Climate Agreement. KONE has started applying the Task Force on Climate-related Financial Disclosure (TCFD) reporting principles in order to report about climate-related financial risks and opportunities. KONE’s initial TCFD reporting will take place within this Non-Financial information section and in other parts of this report. The table on in this text maps the pages of the report where content according to TCFD requirements can be found.
KONE’s strategy and business model are described on pages 4–7 of KONE’s Annual Review 2020. Risks and risk management related to matters below are described in the risk section under
Risks and risk management related to the reporting of non-financial information.
More information on KONE’s approach to sustainability can be found in the Sus-tainability Report. KONE published its Sus-tainability Report for 2019 in April 2020. KONE’s Sustainability Report for 2020 will be published during Q2 2021 according to GRI Standards.
Management and Board of Direc-tors’ oversight of sustainabilityKONE has integrated the management of non-financial matters and sustain-ability into operations throughout the organization. KONE’s management and supervisors work to ensure that employees are familiar with and comply with the legislation, regulations, and internal oper-ating guidelines of their respective areas of responsibility, and that KONE’s products and services are in full compliance with all codes and standards applicable to them.
Ultimately, sustainability and its man-agement are the responsibilities of KONE’s Executive Board and our President and CEO. KONE’s Executive Board discusses sustainability topics, including e.g. envi-ronmental, social and compliance topics, in its meetings regularly. In 2020, climate related topics alone were discussed 3–4 times. Furthermore, KONE has established forums where sustainability and climate-related topics are regularly discussed: The Quality and Environmental Board and the Solution Board, both chaired by KONE President and CEO and with Executive Board level members. In 2020, KONE also established a Sustainability Board, a steer-ing committee dedicated to sustainability topics, climate and environment among the priority areas. Several members of
KONE’s Executive Board are members of the Sustainability Board, chaired by KONE’s EVP of Operations Development.
KONE’s Board of Directors is respon-sible for overseeing and supervising the implementation of KONE’s strategy, including sustainability topics and climate change issues. The Board also reviews risks and risk management of which environ-mental, social and anti-corruption matters are a part of.
During 2020, sustainability was on the agenda of Executive Board and Board of Directors meetings as part of the prepa-ration of KONE’s new strategy. In addi-tion, one focus area during the year was Science-Based Targets, which KONE set in September 2020 (see more information in Environmental matters).
External recognitionsKONE has received external recogni-tion for efforts to conduct business in a sustainable way. For example, in early 2020, KONE was ranked as the 32nd most sustainable company in the world by Corporate Knights Inc. KONE was second among peer companies in the machinery manufacturing industry category and the only elevator and escalator industry company to make the Global 100 Most Sustainable Corporations in the World ranking. Furthermore, KONE was again included in the FTSE4Good index and made CDP’s Climate Change A List among the top climate change performers. CDP is an international non-profit organization that drives engagement for climate action. This is the eighth consecutive year that KONE has achieved a leadership score of A or A- in the Climate Change rating, which describes long-term commitment to envi-ronmental work and sustainability. KONE was also awarded the best A grade in CDP’s 2019 Supplier Engagement Rating, demonstrating leadership and best prac-tice in engaging our suppliers on climate change issues. In addition, KONE has been awarded the EcoVadis platinum medal for our sustainability performance, placing us among the top 1% of all assessed compa-nies.
KONE Sustainability Report 2020 • Will be published during
Q2 2021
• In the report, you can find more detailed information about sustainability
BOARD OF DIRECTORS’ REPORT
13
BOARD OF DIRECTORS’ REPORT

KONE ANNUAL REVIEW 2020
Non-financial key performance indicators
Key performance indicator Target 2020 results 2019 resultsEnvironmental matters
Annual reduction of KONE’s carbon footprint relative to sales, % 1)
3% annual reduc-tion relative to sales
Will be published in the Sustainability Report during Q2 2021.
3.1% reduction relative to sales
Share of key suppliers ISO 14001 certified, %
100% 90% 91%
Share of green electricity used in our facilities, %
50% by 2021 Will be published in the Sustainability Report during Q2 2021
37%
Share of landfill waste at our manufacturing units, %
0% by 2030 Will be published in the Sustainability Report during Q2 2021
0.9%
Personnel and social matters
Industrial Injury Frequency Rate (IIFR) 2)
Zero injuries IIFR 1.2 IIFR 1.7
Employee engagement Maintain employee engagement on a strong level
The response rate in the Pulse employee engagement survey was record high at 92%. The global survey results took a great leap up and engage-ment was at a very strong level. All survey dimensions improved and the vast major-ity of KONE’s global scores were above external high performance benchmarks.
Focused on completing the actions agreed based on 2018 employee engage-ment survey and organized dedicated discussions, Pulse Talks, across the organization. Almost 80% of employees participated in the Pulse Talks.
Personnel voluntary turn-over rate, % 3)
Maintain voluntary turnover below market level
5.5% 7.6%
Gender distribution, % More balanced gender split
11% women, 89% men 11% women, 89% men
Gender distribution in direc-tor level positions, %
20% of director level positions occupied by women by 2020
19% 18%
Human rights, anti-corruption & bribery
Share of employees with completed Code of Conduct training, %
100% 96% of nearly 60,000 employ-ees in 64 countries
90% of nearly 58,000 employees in 64 countries
Share of key suppliers who have signed the Supplier Code of Conduct, %
100% 84% (scope expanded from previous year)
95%
Share of distributors who have signed the Distributor Code of Conduct, %
100% 100% of our distributors in China and 88% in the rest of the world.
100% of distributors in China, and 87% in the rest of the world
* Some targets will be updated for 2021 in line with KONE’s new sustainability ambitions.
1) The environmental performance has been reported in accordance with ISO 14064 and the Greenhouse Gas Protocol Corporate Accounting and Reporting Standard and Corporate Value Chain (Scope 3) Accounting and Reporting Standard. The Scope 2 emissions have been calculated according to the dual reporting principles of the GHG Protocol Scope 2 Guidance (market- and location-based method). RES-GO guarantees of origin subject to EECS (European Energy Certificate System) have been acquired for the purchased green electricity, as well as some supplier specific instruments. KONE’s greenhouse gas emissions and water consumption at KONE’s manufacturing units have been externally assured by Mitopro Oy. The emission factors are based on the data sources of DEFRA (UK Department for Environment, Food & Rural Affairs), World Resource Institute GHG Emission Factors Compilation, AIB (Association of Issuing Bodies) European Residual Mix Report, and supplier specific factors for Finland.
2) The number of lost time injuries of one day or more, per million hours worked3) Sum of voluntarily left employees (with permanent contract) over 12 months divided by average closing headcount over 12 months
BOARD OF DIRECTORS’ REPORT
14
BOARD OF DIRECTORS’ REPORT

KONE ANNUAL REVIEW 2020
ENVIRONMENTAL MATTERSIn line with KONE’s strategic target of being a leader in sustainability, our environmental approach supports the ongoing green and digital transformation of the built environment into smart eco-cities, low-carbon communities, and net zero energy buildings.
We set out the environmental ambi-tion and principles that guide our work in KONE’s Environmental Policy. We develop smart and sustainable technolo-gies for People Flow® and want to be the preferred partner for environmentally sustainable urban environments. We drive transformation towards sustainable, circular and carbon neutral operations, as well as engage our employees, customers, suppliers and partners on climate and environmental action. The KONE Code of Conduct, the Supplier Code of Conduct, the Distributor Code of Conduct and KONE Global Vehicle Fleet, Facility and Travel Policies also set out environmental requirements relevant to the operations of KONE or its partners.
In September 2020, we stepped up our environmental ambition by announc-ing KONE’s climate pledge with science-based targets for significant greenhouse gas emissions reductions and an aim to have carbon neutral operations by 2030. KONE commits to a 50% cut in the emis-sions from its own operations (scope 1 and 2 emissions) by 2030, compared to a 2018 baseline. This target is in line with limiting global warming to 1.5°C, which is currently the most ambitious criteria for setting science-based targets. On top of the ambitious emissions reduction targets, KONE will achieve carbon neutral opera-tions by 2030, through offsetting the remaining emissions. In addition, KONE targets a 40% reduction in the emissions related to its products’ materials and life-time energy use (scope 3 emissions) over the same target period, relative to orders received. KONE’s targets are the most ambitious in the industry to date, and we were among the first 500 companies glob-ally to have our targets officially validated
by the Science Based Targets initiative. With the climate pledge, we are taking even stronger action and leading the way in our industry to create more sustainable urban environments.
We are taking strong actions across the supply chain and work together with our suppliers to cut emissions, increase the use of sustainable materials and limit the use of hazardous substances. Sustainability was also the theme of this year’s KONE Supplier Day, during which we launched our Supplier Sustainability Assessment, a dedicated internal tool for screening our suppliers’ performance in terms of their environmental and social responsibility. The assessment includes basic criteria that must be met in order to continue doing business with KONE, as well as other, more advanced criteria.
KONE’s climate related disclosures according to TCFD
TCFD recommended disclosures Content in KONE’s reportGovernance Board’s oversight of climate-related risks and
opportunitiesNon-financial information / Management and Board of oversight of sustainability, p. 13
Management’s role in assessing and managing climate-related risks and opportunities
Non-financial information / Management and Board of oversight of sustainability, p. 13
Strategy Climate-related risks and opportunities over the short, medium and long term
Non-financial information / Environmental matters, p. 15
Impact of climate-related risks and opportunities on the organization’s businesses, strategy and financial planning
Strategy, p. 4Risks and risk management related to the reporting of non-financial information, p. 22
Resilience of strategy, taking into consideration different climate-related scenarios
KONE has not conducted scenario work yet.
Risk management
Processes for identifying and assessing climate-related risks
Risks and risk management related to the reporting of non-financial information, p. 22
Processes for managing climate-related risks Risks and risk management related to the reporting of non-financial information, p. 22
How processes for identifying, assessing and managing climate-related risks are integrated into the organizations overall risk management
Risks and risk management related to the reporting of non-financial information, p. 22
Metrics and targets
Metrics used to assess climate-related risks and opportunities
Non-financial information / Key performance indicators, p. 14Non-financial information / Environmental matters, p. 15
Scope 1, Scope 2 and Scope 3 emissions and the related risks
Non-financial information / Key performance indicators, p. 14Non-financial information / Environmental matters, p. 15
Targets used to manage climate-related risks and opportunities and performance against targets
Non-financial information / Key performance indicators, p. 14Non-financial information / Environmental matters, p. 15
BOARD OF DIRECTORS’ REPORT
15
BOARD OF DIRECTORS’ REPORT

KONE ANNUAL REVIEW 2020
KONE’s offering The majority of the environmental impacts associated with KONE’s activities are related to our products over their full life cycle. Our innovations can thus have a significant role in advancing climate action. Requirements for smart and energy-efficient solutions, healthy and sustainable materials and overall, green and sustainable buildings are increasing. We see these shifts in customer demand as a clear opportunity and want to be the preferred partner for sustainable urban environments. To further understand the emerging needs and technologies in sustainable, resilient urban environments and people’s behavior in them, we actively participate in large-scale research projects and consortiums.
KONE supports sustainable and green building through our energy-efficient and innovative offering, functional and sustainable materials, as well as transpar-ent documentation about our products’ environmental impacts. We can help our customers meet various green building requirements even better with the KONE DX Class elevator range which continues to be launched to new markets. Lifetime energy consumption is one of the main considerations in green buildings and it is also the single most significant envi-ronmental impact of KONE’s products overall. This underlines the importance of eco-efficient innovations. We currently have 19 best-in-class energy efficiency references for our products according to the international ISO 25745 standard for the energy performance of lifts, escalators and moving walks.
Several KONE solutions have received external recognition for their sustainabil-ity. During the reporting period, KONE renewed the Singapore Green Building Product (SGBP) certifications for several of its solutions. KONE currently has seven SGBP-certified solutions and is the first and only elevator and escalator company to have all certifications with the highest pos-sible ratings. The SGBP-certified solutions are recommended for Green Mark -certi-fied buildings. KONE has also received
several approved Byggvarubedömningen (BVB) assessments for its products, the latest ones being KONE TranSys™ elevator and the TransitMaster™ 120 and Transit-Master™ 140 escalators in 2020. BVB is a nonprofit organization that evaluates solutions for buildings and drives the use of sustainable building materials.
During 2020, KONE also had impor-tant achievements in transparent com-munication about the environmental and health impacts of our products. We pub-lished Environmental Product Declarations (EPD) for six elevators. We currently have third-party verified EPDs for altogether eight elevator models and 11 automatic building door models, thus making KONE the people flow company with the most EPDs published to date. Furthermore, dur-ing the reporting year, we published two Health Product Declarations (HPD) for our products. KONE now has altogether six HPDs for its elevators and escalators.
Own operations KONE’s target for 2020 was to reduce our operational carbon footprint rela-tive to sales by 3%. This target includes our Scope 1 & 2 emissions, extended by selected Scope 3 categories that are closely monitored by KONE: logistics, business air travel and waste. The 2020 carbon footprint results will be published in the second quarter of 2021. In 2019, we exceeded our annual target as our overall operational carbon footprint (Scope 1, 2 and selected Scope 3 catego-ries) relative to sales decreased by 3.1% compared to 2018, with sales growth calculated at comparable exchange rates. Our scope 1 and 2 greenhouse gas emis-sions relative to sales decreased by 5.4%. This positive development was enabled by a 0.5% decrease in our absolute Scope 1 and 2 emissions (with compa-rable reporting scope) while our business grew strongly. KONE’s 2019 absolute operational carbon footprint amounted to 327,100 tons of carbon dioxide equivalent (2018: 319,200; figure restated). KONE’s carbon footprint data has been externally assured. Additionally, we have set a long-
term target of 0% landfill waste from our manufacturing units by 2030. In 2019, the share of landfill waste in our manufactur-ing units was 0.9% (2018: 0.6%).
During the reporting year, we took steps to achieve our target of having 50% of our electricity consumption from renewable sources by the end of 2021. Along with our ambitious climate targets announced in September, we also raised our target for renewable electricity to 100% by 2030. Our manufacturing unit in Sweden now purchases 100% renewable electricity, and solar panels were installed in our new manufacturing unit in Chennai, India. Additionally, one of our subsidiaries, KONE Austria, is already carbon neutral for 2020 after offsetting their emissions by supporting renewable energy production in Uganda and Guatemala.
KONE uses the ISO 14001 environ-mental management system to enhance its environmental performance. It covers our corporate units, including all R&D and major manufacturing units, and 26 major subsidiaries. In addition, our manufactur-ing unit in Kunshan, China, received the ISO 50001 energy management system certification during the reporting year. Altogether, three KONE manufacturing units are now ISO 50001- certified. At the end of 2020, 90% (2019: 91%) of our key suppliers were ISO 14001 certified, our target being 100%.
KONE’s manufacturing unit in Finland achieved the FSC® (Forest Stewardship Council) Chain of Custody certification, providing credible assurance that eleva-tors manufactured in this unit come with wooden components from environmen-tally and socially responsible sources. KONE’s subsidiaries in Great Britain and Ireland also achieved the FSC® Chain of Custody certification, meaning that customers can now be provided this assurance for the full delivery chain for elevators installed in those countries. To our knowledge, KONE is the only elevator company to have achieved FSC® certifica-tions.
BOARD OF DIRECTORS’ REPORT
16
BOARD OF DIRECTORS’ REPORT

KONE ANNUAL REVIEW 2020
PERSONNEL AND SOCIAL MATTERS
Number of employees
Jan 1–Dec 31, 2020 Jan 1–Dec 31, 2019
Number of employees at the end of period 61,380 59,825Average number of employees 60,376 58,369
Geographical distribution of KONE employees
Dec 31, 2020 Dec 31, 2019
EMEA 23,798 23,306Americas 7,336 7,632Asia-Pacific 30,246 28,887Total 61,380 59,825
KONE had 61,380 (December 31, 2019: 59,825) employees at the end of December 2020. The average number of employees was 60,376 (1–12/2019: 58,369). Personnel voluntary turnover rate was 5.5% (7.6%) Employee costs for the reporting period totaled EUR 3,043 (3,048) million. The geographical distribution of KONE employees was 39% (December 31, 2019: 39%) in EMEA, 12% (13%) in the Americas and 49% (48%) in Asia-Pacific.
The main goals of KONE’s personnel strategy are to secure the availability, engagement, motivation and continuous development of the company’s person-nel. All KONE’s activities are guided by ethical principles. Employee rights and responsibilities include the right to a safe and healthy working environment, per-sonal well-being, freedom of association, collective bargaining, non-discrimination and the right to a working environment in which harassment of any kind is not tolerated.
Year 2020 was exceptional due to the COVID-19 outbreak. Especially during the first half of the year, KONE leaders and HR teams around the world focused on ensur-ing that our vital business operations are functioning with good level of workforce available and safe working conditions. Field personnel was instructed of safe ways of working on sites and majority of office workers across the world started to work remotely. In some KONE units, the ability to work on construction and maintenance sites was limited due to national restrictions. In these cases, KONE approach was to first and foremost agree on flexible working arrangements and the use of accrued holidays and negative time banks to ensure that our employees stay also financially safe. Only in a few limited cases where it was not possible to use these measures, and where there were support mechanisms in place for employ-ees locally, furloughs or temporary layoffs were used.
The wellbeing and safety of our employees was KONE’s top priority in 2020. As many employees worked from home and field employees faced changed circumstances particularly the mental well-being of our workforce was in focus. Both global and local well-being resources were introduced to help managers and employ-ees deal with remote work, anxiety and stress. In general, remote work worked well even for more challenging positions such call center employees and salespeo-ple. During the year, new safety protocols for office environments were introduced to ensure safe return to the workplace.
Diversity and inclusionWe actively encourage diversity at KONE, and our values guide us in upholding an inclusive culture. To strengthen our global approach and deepen our insights on cus-tomers and markets, we have set goals for diversity in our teams. During the report-ing year, KONE’s workforce included 147 (145) nationalities. The majority of our employees are male representing 89% (89%) of our people globally. We continue our efforts towards having a more bal-anced gender split. The share of women at director level positions increased to 19% (18%) leaving us slightly behind our global target of 20% (by 2020). To strengthen diversity and inclusion (D&I) at KONE, we assessed D&I maturity in 53 KONE countries and created a global D&I strategy based on the findings. The strategy was turned into a global D&I roadmap with targeted initiatives to fur-
ther increase diversity, and to build a more inclusive talent practices and culture.
Employee engagement & KONE cultureOne of KONE’s strategic targets is to be a great place to work, which is measured by employee engagement and a related Pulse employee survey. The Pulse survey offers employees an opportunity to give feed-back and covers topics such as employee engagement and enablement, leadership, learning and growth, corporate responsi-bility, customer centricity, innovation and drive, and diversity and inclusion.
KONE’s 13th global Pulse employee survey was carried out in spring 2020 and action plans were made in teams based on the results. A total of 52,745 employees provided feedback in the employee sur-vey and we reached a record high global response rate of 92%. Overall, the global survey results took a great leap up and engagement is now at a very strong level. All survey dimensions improved and the vast majority of KONE’s global scores were above external high performance bench-marks. In 2021, we will conduct a global light survey as well as organize Pulse Talks across all teams at KONE to ensure sustainable follow-up on the Pulse 2020 action plans and continuous dialogue on engagement.
During 2020, we also started a process for developing KONE’s culture to ensure that it supports and aligns with our strate-gic priorities. First step in this process was a global culture survey in which more than
BOARD OF DIRECTORS’ REPORT
17
BOARD OF DIRECTORS’ REPORT

KONE ANNUAL REVIEW 2020
8,000 employees participated. The find-ings of the survey indicated that KONE’s work environment is healthy and that employees find the direction of the com-pany clear. As a second step, employees were encouraged to share their thoughts about the development of KONE’s culture, values and ways of working as part of the global Pulse survey. A total of 25,370 employees provided feedback and these discoveries contributed to the review and refresh of KONE’s values. The new values are “We care for each other”, “We are committed to our customers’ success”, “We collaborate as one team” and “We perform with courage”.
KONE hosts a European Employee Forum annually to bring together employee representatives and top man-agement to discuss issues ranging from safety to business development. A smaller working group meets two to four times a year to ensure continuous consultation and discussion on important develop-ments affecting KONE employees. In 2020, the Employee Forum was post-poned due to the COVID-19 pandemic, but the smaller working group and top management had two virtual meetings focusing on safety as a topic.
Training and developmentWe strive to have the best profession-als with the right competencies in each position. We facilitate this effort as well as increase the motivation, engagement and continuous development of the personnel through regular performance discussions, which take place at least twice a year. In addition, we actively encourage all employees to prepare individual develop-ment plans and to complete their talent profiles.
KONE supports continuous learning and provides a rich training offering for its employees. There are over 6,000 in-house developed training programs available varying from several days trainer-led courses into 2-minutes online learning modules. These in-house programs are complemented by external learning librar-ies to enhance the training offering. In March 2020, we launched a new external online learning library with a lot of bite size courses. By the end of 2020, we reached 160,000 learning course comple-tions in this new learning library alone.
In 2020, we had a strong focus on bringing new online learning opportuni-ties for our employees and also digitizing current trainer-led programs by using mobile learning, AR games, VR, social learning and Microsoft Teams. Hence, by the end of 2020, the total amount of online learning course completions had increased by 92% compared to the previ-
ous year. Furthermore, total learning hours increased 26% compared to 2019. As an example, a new global COVID-19 safe working practices e-learning was launched in May with 32 language versions and with a special focus on our employees serving our customers in the field. Approx-imately 27,000 employees had completed the course by the end of 2020.
Amidst COVID-19, we encouraged everyone to use time to learn. As we encouraged salespeople to have virtual customer meetings, they were trained and supported on utilizing various virtual meeting tools and techniques. Also our trainers studied and took various virtual training tools in use and experimented camera technologies in virtual train-ing sessions. This helped to re-purpose KONE’s 41 training centers as broadcast and engagement hubs making them more efficient and increasing their reach and impact.
We continued our digital HR journey by implementing Workday Learning to support the learning activities of all KONE employees during 2020. By doing this, KONE has now all people data in one sys-tem, which allows for better end-to end employee experience, and the possibility for more advanced people analytics to support people development. For exam-ple, the new system offers AI powered recommendations on learners’ role and interest.
Talent attractionA key focus area within the KONE people strategy is attracting the best talent.
Even though recruitment volumes were reduced during 2020 due to COVID-19, targeting new competencies and increas-ing diversity through recruitment contin-ued to be one of the key focus areas for KONE. Efforts to increase diversity through recruitment realized during the year with a large number of applicants outside of elevator and escalator industry. During the year 78% of all new hires to KONE posi-tions were attracted from other industries. We were also able to recruit an increasing number of people with new competencies related to, for example, digitalization and solution selling to KONE. Due to Covid-19 related travel restrictions, the annual KONE International Trainee Program (ITP) could not be organized. Instead, we offered local trainee positions for university students. KONE also continued to further strengthen its employer brand through active school collaboration.
Accelerate program Year 2020 was the final year of the Accel-erate program, which was introduced in 2017 to create a more efficient and
customer-focused way of working on a country, area and global level, across the entire KONE organization. During the Accelerate program, major changes were implemented in the KONE Way operat-ing model. We harmonized job roles and defined our global reference organization model that provide a common set-up for all units. Three new functions, Customer Solutions Engineering, Customer Service & Admin and Logistics, were established and other already existing functions, e.g. HR, Sourcing, Finance, KONE Technology & Innovation and Quality, implemented major organizational and operating model changes. Alongside with the transforma-tions, we introduced new learning and development opportunities both for func-tion specific topics as well as on common topics such as change management. In 2020, the new global set-up has enabled us to react fast during the exceptional market environment caused by COVID-19.
Safety Over the year, improving safety at work remained a top priority. KONE continued the implementation of a companywide safety management system which guides us in achieving continual improvement.
By the end of 2020, 56,000 KONE employees had completed general safety training related to our safety management framework, and KONE’s Health and Safety Policy. KONE employees receive health and safety training relevant to their work enabling it to be performed in a profes-sional and safe manner. The focus during the year was on strengthening safety competences using interactive learnings and mobile tools. Managers perform regular audits to measure compliance with KONE’s policies, processes and defined working methods. Corrective actions are taken if deviations are identified. KONE also conducts process audits to identify possible obstacles to work safety. If any are found, the work in question is stopped until a safe method is approved.
In 2020, the IIFR (Industrial Injury Fre-quency Rate) improved to 1.2 (1.7). We continue to target zero injuries. In order to move towards our ultimate target of zero injuries, our target is IIFR below 1.0 by the end on 2024. The average lost days per incident was 27.3 (33.7). Furthermore, the number of safety observations, recorded in our global safety reporting tool, KONE Safety Solution, increased by 3.6%. All employees are encouraged to actively report safety near misses and incidents as it provides valuable information for improving safety. Focus during the year was on improving the quality, analysis and investigation of near misses and incidents.
18
BOARD OF DIRECTORS’ REPORT

KONE ANNUAL REVIEW 2020
KONE Safety Week was organized in all KONE units in June 2020 with a focus on safe behavior. In order to strengthen KONE’s safety culture, agenda was com-plemented with elements of psychological safety. Various safety related activities were held during the week for both internal and external stakeholders. For the first time,
majority of the activities we organized virtually.
The safety of the people using eleva-tors, escalators and automatic building doors involves everyone from technology and maintenance service providers to building owners and equipment users. We work closely with our customers to help
them recognize and deal with situations that could lead to safety risks. We com-municate actively about safety, organize activities and provide training along with educational materials to our customers and the general public to help equipment users stay safe.
HUMAN RIGHTS, ANTI-CORRUPTION AND BRIBERYThe KONE Code of Conduct sets out our commitment to integrity, honesty, and fair play. The topics covered include: compli-ance with the laws and rules of society, the work environment and human rights, measures to combat fraud, bribery and corruption including guidance on gifts and corporate hospitality, health and safety, discrimination, fair competition, conflicts of interest, the marketing of products and services, and the environ-ment and sustainability.
Dedicated compliance officers help employees comply with KONE’s Code of Conduct, and our global and regional compliance committees advise and take decisions on compliance matters, includ-ing investigations into allegations of employee misconduct as well as human rights and corruption violations. All KONE employees are expected to understand and abide by the Code and to report any violations using the channels available for this purpose. Our internal reporting chan-nels include reporting to management, HR, Legal or Compliance. We also have a confidential externally hosted report-ing channel, the Compliance Line, to which all employees and suppliers have phone and/or web access. Reports can be made in the employee’s native language and can be anonymous where permitted under data protection laws. Reports can be submitted on a range of topics includ-ing fraud and theft, fraudulent reporting, corruption, competition law, harassment and discrimination, data protection and confidentiality, environment and safety, trade compliance, and conflicts of inter-est. All reports are handled by a dedicated impartial KONE Compliance team. In 2020, we received a total of 136 compli-ance reports, of which 24% were received through the Compliance Line. In total
35% of 141 cases closed in 2020 were either substantiated or partially substanti-ated, and disciplinary actions in those cases ranged from coaching discussions to termination of employment.
Our Code of Conduct E-learning course for all KONE employees covers topics such as conflicts of interest, fair competition, anti-bribery, privacy, work safety, harassment & discrimination and gifts & hospitality, and has a strong focus on scenarios that reflect day to day situa-tions employees might face. The course is available in 37 languages. Nearly 60,000 employees in 64 countries have been assigned the training since 2018 with a completion rate of 96%. Regular face-to-face compliance training is also provided to managers and other target groups. In 2020 approximately 3,000 employ-ees received compliance training either face-to-face or via Teams, in light of the COVID-19 pandemic.
KONE’s general Code of Conduct is complemented by our Supplier and Dis-tributor Codes of Conduct. Our Supplier Code of Conduct was renewed in July 2020 and is available in 30 languages. It sets out the ethical business practice requirements that we expect from our suppliers. It covers areas such as legal compliance, ethical conduct, our zero tol-erance for bribery and corruption, and the standards we require from our suppliers in terms of labor and human rights, health and safety, and environmental issues. KONE may terminate its contracts with suppliers for failure to adhere to the Code.
KONE expects its suppliers to comply with the requirements of the Supplier Code of Conduct in all their dealings with KONE, as well as with their own employ-ees and suppliers, and third parties includ-ing government officials. All our suppliers
are expected to sign KONE’s Supplier Code of Conduct. By the end of 2020, 84% of KONE’s current key non-product related and direct materials suppliers had signed the Code. The scope of this group was further expanded in 2020. We carry out periodic checks on suppliers’ compli-ance with the Supplier Code of Conduct.
KONE’s Distributor Code of Conduct covers the same topics as the Supplier Code of Conduct and is available in 5 lan-guages. As business partners, our distribu-tors are likewise expected to comply with the requirements of the Code in all their dealings with KONE, as well as in respect of their own employees, customers and suppliers, and third parties including government officials. Our target is to have the Code signed by all our distributors. By the end of 2020, 100% (100%) of our distributors in China, and 88% (87%) of our distributors in the rest of the world, had signed the Code.
All the above Codes of Conduct are available on kone.com.
During 2020, we continued focusing on human rights in the supply chain by developing a supplier human rights assess-ment process within KONE. Although this work was delayed by the COVID pandemic, an on-site pilot assessment was nevertheless conducted in Finland which included interviews with management and randomly selected workers. Train-ing and risk management improvement recommendations were provided to the supplier. We also developed a supplier human rights on-line questionnaire which will be rolled-out to selected suppliers during 2021. Human rights training was also provided to our internal human rights network throughout the year.
19
BOARD OF DIRECTORS’ REPORT

KONE ANNUAL REVIEW 2020
Changes in the Executive BoardIn January–December 2020, KONE announced changes in the Executive Board.
Ken Schmid (Master of Business Administration), was appointed Executive Vice President, KONE Americas as of April 1, 2020. In this role, Ken Schmid succeeds Larry Wash who served as Executive Vice President, KONE Americas and member of the Executive Board since July 2012.
Max Alfthan decided to step down from his role as Executive Vice President responsible for Marketing and Communi-cations as of 31 March 2020. Max Alfthan served in this role and as a member of KONE’s Executive Board since November 2014. Susanne Skippari, Executive Vice President, Human Resources, was named interim leader for Marketing and Commu-
nications in addition to her current role as of April 2020.
Tricia Weener, (BA, Hons) was appointed Chief Marketing Officer and Executive Vice President, Marketing and Communications, as of January 18, 2021. Current interim EVP of Marketing and Communications, Susanne Skippari con-centrates on her duties as Executive Vice President of Human Resources from Janu-ary 18, 2021 onwards.
Also after the reporting period, on Jan-uary 20, 2021, KONE announced changes in the Executive Board. Johannes Frände was appointed Executive Vice President, General Counsel and a member of the Executive Board at KONE as of February 1, 2021. He succeeds Klaus Cawén, who has served in different roles at KONE for 38
years. Thomas Hinnerskov was appointed Executive Vice President, responsible for South Europe, Middle-East and Africa region as of April 1, 2021. He succeeds Pierre Liautaud, who has served 10 years at KONE as Executive Vice President, South Europe, Middle-East and Africa region. Prior to this, Thomas Hinnerskov has served as KONE’s EVP, Central and North Europe. Axel Berkling was appointed new EVP, Central and North Europe. Prior to this, Axel Berkling has served as KONE’s EVP, Asia-Pacific region, excluding China.
On January 27, 2021, KONE announced that Samer Halabi was appointed Executive Vice President, responsible for the Asia-Pacific region and a member of the Executive Board as of May 1, 2021.
Other events In 2007, a decision was issued by the European Commission concerning alleged local anticompetitive practices before early 2004 in Germany, Luxembourg, Belgium and the Netherlands by leading eleva-tor and escalator companies, including KONE’s local subsidiaries. Also, the Aus-trian Cartel Court issued in 2007 a deci-sion concerning anticompetitive practices that had taken place before mid-2004 in
local Austrian markets by leading eleva-tor and escalator companies, including KONE’s local subsidiary. As announced by KONE earlier, a number of civil damage claims by certain companies and public entities relating to the two 2007 decisions, are pending in related countries. The claims have been made against various companies concerned by the decisions, including certain KONE companies. All
claims are independent and are pro-gressing procedurally at different stages. The total capital amount claimed jointly and severally from all of the defendants together was EUR 144 million at the end of December 2020 (December 31, 2019: EUR 166 million). KONE’s position is that the claims are without merit. No provision has been made.
Most significant risks KONE is exposed to risks that may arise from its operations or changes in the oper-ating environment. The most significant risk factors described below can potentially have an adverse effect on KONE’s business operations and financial position and, as a result, on the value of the company. Other risks, which are currently either unknown or considered immaterial to KONE may, however, become material in the future.
STRATEGIC RISKSDemand for KONE’s products and ser-vices and the competitive environment are impacted by the general economic cycles and especially the level of activity within the construction industry. As China accounts for ~30% of KONE’s sales, a sus-tained market decline in the Chinese con-struction industry, in particular, could have an adverse effect on KONE’s growth and profitability. In 2020, many governments across the world took significant measures to contain the COVID-19 outbreak by restricting the movement of people and limiting business activities. The current level of uncertainty continues to be high
despite of the ongoing vaccinations and further deterioration of the situation or prolonged restrictions to contain the pan-demic could have an adverse impact on the overall economic environment, level of construction activity and the level of demand for KONE’s services and solutions in the coming quarters.
Geopolitical tensions and protection-ism continue to expose KONE to various business risks. In addition to the potential adverse impacts on the general economic activity, geopolitical tensions and protec-tionism could impact the competitive-ness of KONE’s supply chain, and lead to increased costs from trade and customs tariffs. A significant portion of KONE’s component suppliers and global supply capacity is located in China.
In addition to the level of market demand, competitiveness of KONE’s offer-ing is a key driver of the company’s growth and profitability. A failure to anticipate or address changes in customer requirements and in competitors’ offerings, ecosystems and business models or in the regulatory environment could result in a deterioration
of the competitiveness of KONE’s offering. Furthermore, structural changes in the competitive landscape of the elevator and escalator industry, increased competition and customer consolidation in China, for example, could affect market dynamics and KONE’s market share.
OPERATIONAL RISKSEngaged employees with relevant compe-tencies and skills are key to the successful execution of our strategy. With the busi-ness models and ways of working chang-ing in the elevator and escalator industry, KONE needs new organizational capa-bilities and new competencies on the indi-vidual employee level in the field of, for example, digitalization. At the same time, competition over skilled field workforce is increasing and securing the needed field resources and their competence manage-ment is critical. A failure to develop and retain the needed capabilities or obtain them through recruitment could have an adverse impact on KONE’s growth and profitability.
BOARD OF DIRECTORS’ REPORT
20
BOARD OF DIRECTORS’ REPORT

KONE ANNUAL REVIEW 2020
Risk management
Risk Mitigation actions
Weakening of the economic environ-ment, particularly in China
KONE strives to continuously develop its competitiveness in all regions and businesses. KONE has a wide geographic presence and a balanced business portfolio with a high share of maintenance business.
Geopolitical tensions impacting the competitiveness of KONE’s supply chain, leading to increased costs or causing potential disruptions
KONE actively monitors the development of the applicable and relevant regulations, policies and trade rules, and evaluates the competitiveness and viability of KONE’s supply chain and sourcing channels. KONE is taking actions to mitigate the impact of tariffs, for example by applying for tariff exemptions when applicable. KONE also applies increased scrutiny over business operations that may be affected by interna-tional trade restrictions.
Changes in the competitive or customer landscape, customer requirements or competitors’ offerings impacting KONE’s competitiveness
KONE aims to be the industry leader by investing in research and development and by taking an open innovation approach. KONE also closely follows emerging industry and market trends and actively monitors opportunities for industry consolidation.
A failure to secure and develop the needed organizational capabilities and competencies
KONE continuously evaluates the skills and competences required for the execution of the selected strategy and develops and/or acquires these from internal talent pools or externally. KONE also has extensive training programs in place to develop and retain critical talents.
Risks related to component and subcontracted labor availability
KONE’s sourcing processes aim to identify critical suppliers and supply categories and implement dual sourcing, multi-year agreements, last-buy options and other measures to ensure the availability of the supply. KONE has also developed multinational subcon-tractor pools to ensure subcontractor capacity on a regional level. Subcontractors competences and capabilities are monitored and developed continuously, similarly as with own employees.
Product integrity, safety or quality issues as well as issues with reputation
To mitigate product risks, KONE has processes in place for product design, supply, manufacturing, installation and maintenance, involving strict quality control. In addi-tion, KONE aims for transparent and reliable communication, to prevent reputational risks and to manage potential incidents. KONE also has stringent corporate gover-nance principles in place.
Interruptions to KONE’s or its suppliers’ operations
KONE actively develops business continuity management capabilities to reduce the impact and likelihood of disruptions within its supply chain. Furthermore, KONE moni-tors the operations, business continuity management capabilities, financial strength and cybersecurity of its key suppliers. In addition, KONE aims to secure the availability of alternative sourcing channels for critical components and services. KONE also has a global property damage and business interruption insurance program in place.
In the operating environment impacted by COVID-19, KONE’s global supply chain helps mitigate the risk of interruptions. KONE has 12 manufacturing facilities in 8 countries, multiple distribution centers and a large supplier network across the globe, which helps to mitigate the challenges and restrictions in individual countries. During the COVID-19 crisis, KONE has also put extra focus on business continuity management.
Quality and reliability of IT systems and cybersecurity risks
KONE’s security policies define controls to safeguard information and information sys-tems which are both in development and in operation, in order to detect cybersecurity incidents and to respond and recover in a timely manner. KONE works with third-party security service providers and trusted, well-known technology partners to manage the risks through the control framework. KONE conducts tests, reviews and exercises to identify areas of risk and to ensure the appropriate preparedness. The company continues to invest in its cybersecurity capabilities based on these findings. KONE also has a global cyber insurance program in place.
Financial risks Centralized risk management in accordance with the KONE Treasury Policy. More information in notes 2.4 and 5.3 of KONE’s Financial Statements 2020
BOARD OF DIRECTORS’ REPORT
21
BOARD OF DIRECTORS’ REPORT
KONE ANNUAL REVIEW 2020
The majority of components used in KONE’s supply chain are sourced from external suppliers. In addition to this, KONE uses a significant amount of sub-contracted installation resources, has out-sourced some business support processes and works with other partners in e.g. digital services and logistics. These expose KONE to component and subcontracted labor availability and cost risk and continu-ity risk in partnerships. A failure to secure the needed components or resources or quality issues within these could cause business disruptions and cost increases. In 2020, COVID-19 related government restrictions caused some disruptions to KONE’s operations especially in China and in India, and the risk of such disrup-tions globally remains still high, however depending on how the pandemic devel-ops.
As one of the leading companies in the industry, KONE has a strong brand and reputation. Issues that impact the company’s reputation or brand could have an effect on KONE’s business and financial performance. Such reputational risks could materialize; for example, in the case of an incident, a major delivery issue or a product or service quality issue. Mat-ters concerning product integrity, safety or quality could also have an impact on KONE’s financial performance and affect customer operations.
HAZARD, SECURITY AND INCIDENTAL RISKSKONE’s business activities are dependent on the uninterrupted operation, quality and reliability of its manufacturing facili-ties, sourcing channels, operational service solutions and logistics processes. KONE’s, its suppliers’ and customers’ operation also utilize information technology exten-sively and KONE’s business is dependent on the quality, integrity and availability of information. Thus, KONE is exposed to IT disruptions and cybersecurity risks, as operational information systems and products may be vulnerable to interrup-tion, loss or manipulation of data, or mal-functions which can result in disruptions in processes and equipment availability. Any breach of sensitive employee or cus-tomer data may also result in significant penalties as well as reputational damage. Such cyber incidents could be caused by, including but not limited to, cybercrime, cyber-attacks, computer malware, infor-mation theft, fraud, misappropriation, or inadvertent actions from our employees and vendors. Also physical damage caused by fire, extreme weather conditions, natu-ral catastrophes or terrorism, among other things, to these operations, could cause
business interruption for KONE or its sup-pliers.
FINANCIAL RISKSThe majority of KONE’s sales and result are denominated in currencies other than the Euro, which exposes KONE to risks arising from foreign exchange-rate fluctuations. KONE is also exposed to counterparty risks related to financial institutions, through the significant amounts of liquid funds deposited with financial institutions, in the form of financial investments and in derivatives. Additionally, KONE is exposed to risks related to the liquidity and pay-ment schedules of its customers, which may impact cash flow or lead to credit losses. Significant changes in local finan-cial or taxation regulation could also have an impact on KONE’s financial perfor-mance, liquidity and cash flow. For further information on financial risks, please refer to notes 2.4 and 5.3 in the Financial State-ments for 2020.
RISKS AND RISK MANAGEMENT RELATED TO THE REPORTING OF NON-FINANCIAL INFORMATIONThe assessment and analysis of KONE’s most significant risks also covers non-financial risks. In line with the require-ments of the Finnish Accounting Act, KONE has identified the most significant non-financial risks regardless of their mate-riality for KONE as a whole. In addition, KONE is applying TCFD guidelines on the reporting of climate-related risks.
The typical impact of the non-financial risks materializing would be reputational damage. In addition to the risk mitigation actions described below, KONE aims for transparent and reliable communication in order to prevent reputational risks and to enable proactive management and learn-ing from incidents, should they occur.
Climate and environmental risks We recognize climate and environmental risks as having a potential negative impact on our business in the short to medium term, albeit they are not considered being very significant in comparison to other business risks which are reported under “Most significant risks”. However, we see that climate risks will only keep increasing in relevance and potential impact. Overall, we identify, assess and manage climate and environmental risks as integral part of our company-wide business risk manage-ment process and ISO 14001 environmen-tal management system. Certain KONE functions and locations conduct detailed climate and environmental risk assess-ments, according to relevant business requirements, e.g. in the Supply Chain function or at selected operational sites.
Climate and environmental risks are classified as transition risks and physical risks as well as risks of negative impacts on the climate. Some of the most relevant climate and environmental risks for KONE are physical risks to our supply chain and own operations, for example, as a result of extreme weather events. These risks can materialize, for example, in the form of delivery disruptions or interruptions in our own manufacturing, installation or main-tenance activities. KONE’s products are also subject to physical risks and possible damages due to changing environmental conditions or extreme weather events.
To mitigate the physical risks, we engage in several risk mitigation activi-ties related to component availability and interruptions to our own or suppli-ers’ operations, as described in the risk management table in this text. We use, for example, dedicated location-based software tools to regularly monitor our supply chain locations for risks related to extreme weather events such as fires, floods and hurricanes. In terms of our product development, we apply design specifications and specific procedures that aim to ensure product resilience even in harsh and changing environmental condi-tions. For example, rigorous environmen-tal testing is a part of KONE’s product development to ensure that our products sustain exceptional and changing weather conditions, such as temperature variations and moisture.
We have equally identified transition risks in the form of changing market demands and emerging regulation for both KONE’s solutions and operations. Not being able to meet the climate-related demands and offer the solutions and ser-vices our customers require, could have a detrimental impact on KONE’s business. In addition to potential product-related requirements, emerging climate-related regulation may also impact our opera-tions. For example, the need to transition towards more sustainable mobility solu-tions is evident for KONE’s current fleet of over 19,000 service and benefit vehicles.
To mitigate the transition risks, KONE constantly evaluates emerging regulation and market demands in our high-level business plans. KONE is an active member in relevant industry forums and research consortiums and proactively monitors the regulatory landscape. As part of KONE’s climate pledge, we have set ambitious greenhouse gas reduction targets for our offering and operations and aim to have carbon neutral operations by 2030. The pledge will guide our work for more cli-mate-friendly products, services and ways of working, and we actively collaborate
BOARD OF DIRECTORS’ REPORT
22
BOARD OF DIRECTORS’ REPORT

KONE ANNUAL REVIEW 2020
with our suppliers and partners to achieve our targets.
Social and employee related risks Safety is a top priority at KONE and poten-tial safety incidents are among the most significant social and employee related risks. Incidents are mitigated through, for example, extensive training and commu-nication, consistent safety management practices, standardized maintenance and installation methods and regular process audits. KONE also identifies and assesses risks related to any type of harassment, equal employment practices, working conditions and any form of discrimina-tions. KONE prevents such situations by having adequate policies and processes in place and training its managers. KONE also offers its employees channels for reporting misconduct as there is no toler-ance for such behavior. In 2020, safety and wellbeing of KONE employees were highlighted as a risk mitigation focus area due to the changing conditions caused by COVID-19 pandemic.
Major repairs or retrofits in public infrastructure locations may also affect the daily life of many people and therefore, may have a reputational impact.
Both safety and quality have a key role in product design, supply, manufacturing, installation and maintenance and they involve strict quality controls. KONE also follows globally implemented principles in how to manage potential incidents and implement improvements.
Human rights related risks The most significant human rights related risks are in the supply and delivery chain and are related to terms and conditions of work. All our suppliers are expected to sign KONE’s Supplier Code of Conduct which sets out our ethical business prac-tice requirements, including the standards we require in terms of labor and human rights. These standards were further clarified in our 2020 Supplier Code of Conduct. On the basis of the 2019 human rights risk assessment we conducted, we have prioritized our work on human rights in the supply chain, set up a human rights network and prepared supplier on-site and online assessment processes and docu-mentation for roll-out in 2021.
Anti-corruption and bribery related risks KONE requires its employees and partners to adhere to high ethical standards and to
comply with its Code of Conduct, Distrib-utor Code of Conduct and Supplier Code of Conduct. These codes cover numerous compliance topics, including competition law, trade sanctions compliance, and labor and human rights issues, as well as pro-hibiting corruption and bribery. Unethical business practices among KONE’s employ-ees or various stakeholders could cause reputational damage for KONE as well as a possible financial impact. The risks of such behaviors and practices materializing are included in the scope of KONE’s regular audit programs. In addition, processes introduced under our Global Delegation of Authority policy help to mitigate the risk of unauthorized payments, donations and sponsorships. We have introduced more stringent disclosure requirements in China for conflicts of interest and this work has continued worldwide in 2020. The most important action for internal mitigation continues to be the develop-ment of KONE’s corporate culture through training and awareness building. In addi-tion, in 2020 we began an anti-bribery and corruption risk assessment, which will be completed in early 2021
Decisions of the Annual General Meeting KONE Corporation’s Annual General Meeting was held in Helsinki on Febru-ary 25, 2020. The meeting approved the financial statements, considered the Remuneration Policy for governing bod-ies and discharged the responsible parties from liability for the financial period Janu-ary 1–December 31, 2019.
The General Meeting approved divi-dends in line with the Board of Director’s proposal of EUR 1.6975 for each of the 76,208,712 class A shares and EUR 1.70 for each of the outstanding 441,851,042 class B shares. The date of record for dividend distribution was February 27, 2020 and dividends were paid on March 5, 2020.
The number of Members of the Board of Directors was confirmed as nine. Re-elected as Members of the Board were Matti Alahuhta, Anne Brunila, Antti Herlin, Iiris Herlin, Jussi Herlin, Ravi Kant, Juhani Kaskeala and Sirpa Pietikäinen. Susan Duinhoven was elected as a new member to the Board of Directors.
At its meeting held after the General Meeting, the Board of Directors elected from among its members Antti Herlin as its Chairman and Jussi Herlin as Vice Chair-man.
Ravi Kant was elected as Chairman and Anne Brunila, Antti Herlin and Jussi Herlin as members of the Audit Com-mittee. Anne Brunila and Ravi Kant are independent of both the company and of significant shareholders.
Antti Herlin was elected as Chairman and Matti Alahuhta, Jussi Herlin and Juhani Kaskeala as members of the Nomination and Compensation Committee. Matti Alahuhta and Juhani Kaskeala are indepen-dent of both the company and of signifi-cant shareholders.
The General Meeting confirmed an annual compensation of EUR 60,000 for the Chairman of the Board, EUR 50,000 for the Vice Chairman and EUR 45,000 for Board Members. In addition, a compensa-tion of EUR 500 was approved for atten-dance at Board and Committee meetings but anyhow a fee of EUR 3,000 is paid per Committee meeting for a Chairman of the Committee residing outside of Fin-land and a fee of EUR 2,000 is paid per Committee meeting for those members residing outside of Finland. Of the annual remuneration, 40 percent will be paid in class B shares of KONE Corporation and the rest in cash.
The General Meeting approved the authorization for the Board of Directors to repurchase KONE’s own shares. Alto-gether no more than 52,930,000 shares may be repurchased, of which no more than 7,620,000 may be class A shares and 45,310,000 class B shares. The authoriza-tion will be valid until the conclusion of the following annual general meeting, however, at the latest until 30 June 2021.
Furthermore, the General Meeting authorized the Board of Directors to decide on the issuance of shares as well as the issuance of options and other special rights entitling to shares referred to in chapter 10 section 1 of the Finnish Companies Act. The number of shares to be issued based on this authorization shall not exceed 7,620,000 class A shares and 45,310,000 class B shares. The Board of Directors decides on all the conditions of the issuance of shares and of special rights entitling to shares. The authorization concerns both the issuance of new shares as well as the transfer of treasury shares. The issuance of shares and of special rights entitling to shares may be carried out in deviation from the shareholders’ pre-emptive rights (directed issue). The autho-rization will be valid until the conclusion
BOARD OF DIRECTORS’ REPORT
23
BOARD OF DIRECTORS’ REPORT

KONE ANNUAL REVIEW 2020
of the following annual general meeting, however, at the latest until 30 June 2021.
The General Meeting decided to amend the Articles of Association by updating the article concerning the line of
business of the company (2 §) and chang-ing the articles concerning the auditing (7§ and 10§).
Authorized public accountants Price-waterhouse-Coopers Oy and APA Jouko
Malinen were nominated as auditors for the term 2020. Audit firm Ernst & Young Oy was nominated as the auditor for the term 2021.
Share-based long-term incentivesKONE has three separate share-based incentive plans, two performance share plans and one restricted share plan. The first performance share plan is targeted for the senior management of KONE including the President & CEO, members of the Executive Board and other top management, consisting of approximately 60 individuals. The second performance share plan is targeted for other key per-sonnel of KONE, totaling approximately 500 individuals. The restricted share plan is targeted for senior management and other key personnel of KONE, excluding President & CEO. The potential reward for the performance share plans is based on
KPIs as decided by the Board on an annual basis in line with the strategic targets. In 2020, the reward was based on sales growth and profitability as well as growth of KONE’s digital services in both plans. The restricted share plan does not have a performance condition. The potential reward is to be paid as a combination of KONE class B shares and a cash pay-ment equivalent to the taxes and similar charges that are incurred from the receipt of shares.
The performance share plans have a vesting period of three years, including the performance period. The restricted share plan has a vesting period from one
to three years. If the participant’s employ-ment or service contract is terminated during the vesting period, they are either obliged to return the shares already received or lose the entitlement to the shares they have not yet received. As part of the plan for the senior management, a long-term target for their ownership has been set. For the Executive Board mem-bers, the long-term ownership target is that the members have an ownership of KONE shares corresponding to at least five years’ annual base salary. For other selected top management positions, the ownership target is at least two years’ base salary.
Share capital and market capitalization
Share capital and market capitalization*
Dec 31, 2020 Dec 31, 2019
Number of class B shares 453,187,148 453,187,148Number of class A shares 76,208,712 76,208,712Total shares 529,395,860 529,395,860
Share capital, EUR 66,174,483 66,174,483
Market capitalization, MEUR* 34,452 30,180
* Market capitalization is calculated on the basis of both the listed B shares and the unlisted A shares excluding treasury shares. Class A shares are valued at the closing price of the class B shares at the end of the reporting period.
Shares in KONE’s possession
Shares in KONE’s possession
1–12/2020
Shares in KONE's possession at the beginning of the period 11,553,605Changes in own shares during the period -547,599Shares in KONE's possession at the end of the period 11,006,006
At the end of December 2020, the Group had 11,006,006 class B shares in its possession. The shares in the Group’s possession represent 2.4% of the total number of class B shares. This corresponds to 0.9% of the total voting rights.
BOARD OF DIRECTORS’ REPORT
24
BOARD OF DIRECTORS’ REPORT

KONE ANNUAL REVIEW 2020
BOARD OF DIRECTORS’ REPORT
Shares traded on the Nasdaq Helsinki Ltd.
Trading on the KONE share
1–12/2020 1–12/2019
Shares traded on the Nasdaq Helsinki Ltd., million 222.9 157.0Average daily trading volume 884,675 628,085Volume-weighted average share price EUR 62.1 49.8Highest share notation EUR 76.2 59.3Lowest share notation EUR 42.4 41.0Share notation at the end of the period EUR 66.5 58.3
In addition to the Nasdaq Helsinki Ltd., KONE’s class B share is traded also on various alternative trading platforms. The volume of KONE’s B shares traded on the Nasdaq Helsinki Stock Exchange repre-sented approximately 31.3% of the total volume of KONE’s class B shares traded in
October–December 2020 (source: Fidessa Fragmentation Index, www.fragmenta-tion.fidessa.com).
The number of registered shareholders was 62,100 at the beginning of the review period and 72,661 at its end. The num-ber of private households holding shares
totaled 68,746 at the end of the period, which corresponds to approximately 12.1% of the listed B shares. At the end of December 2020, a total of 54.6% of the B shares were owned by nominee-registered and non-Finnish investors.
Flagging notificationsDuring January–December 2020, Black-Rock, Inc. announced two notices in accor-dance with the Finnish Securities Market Act Chapter 9, Section 5. The notices were announced on January 17 and January
27. The notices have been released as stock exchange releases and are available on KONE Corporation’s internet pages at www.kone.com. According to the latest notification, the total number of KONE
Corporation shares owned by BlackRock, Inc. and its funds decreased to below five (5) per cent of the share capital of KONE Corporation on January 24, 2020.
25
BOARD OF DIRECTORS’ REPORT

KONE ANNUAL REVIEW 2020
Outlook
North America
New equipment Services
Decline in the first quarter, recovery
after that
MaintenanceResilient excl. impact
from lock-downs
ModernizationUncertainty could
delay decisions
EMEA
New equipment Services
Decline in the first quarter, recovery
after that
MaintenanceResilient excl. impact
from lock-downs
ModernizationUncertainty could
delay decisions
Asia-Pacific
New equipment Services
ChinaStable or growth
Outside ChinaDecline in the
first quarter, recovery after that
MaintenanceResilient excl. impact
from lock-downs
ModernizationUncertainty could
delay decisions
Market outlook 2021The new equipment market is expected to be stable or to grow in China. In the rest of the world, the market is expected to decline year-on-year in the first quarter due to a high comparison point and then to start recovering.
The maintenance markets are expected to be resilient, excluding the direct impacts of the lockdown measures.
In the modernization markets, the fundamental growth drivers are intact, but
uncertainty could delay decision-making in modernization projects.
Business outlook 2021In 2021, KONE’s sales growth is estimated to be in the range of 0% to 6% at com-parable exchange rates as compared to 2020. The adjusted EBIT margin is expected to be in the range of 12.4% to 13.4%. Assuming that foreign exchange rates would remain at the January 2021 level, foreign exchange rates are estimated
to impact the adjusted EBIT negatively by around EUR 20 million.
KONE has a solid order book and main-tenance base for 2021. The improvement seen in the margin of orders received is expected to support profitability together with continual improvements in quality and productivity.
The key headwinds for 2021 results are the potential impacts from COVID-19 as well as the rising raw material and logis-tics costs. KONE also continues to invest actively in building the capability to sell and deliver digital services and solutions.
The Board’s proposal for the distribution of profitThe parent company’s non-restricted equity on December 31, 2020 is EUR 2,046,658,825.95 of which the net income for the financial year is EUR 389,581,522.35.
The Board of Directors proposes to the Annual General Meeting that a dividend of EUR 1.7475 be paid on the outstanding 76,208,712 class A shares and EUR 1.75
on the outstanding 442,181,142 class B shares. Further, the Board proposes an extra dividend of EUR 0.4975 to be paid on the outstanding 76,208,712 class A shares and EUR 0.50 on the outstanding 442,181,142 class B shares, resulting in a total amount of proposed dividend of EUR 1,165,996,127.94. The Board of Directors further proposes that the remaining non-
restricted equity, EUR 880,662,698.01 be retained and carried forward.
The Board proposes that the dividends be payable from March 11, 2021. All the shares existing on the dividend record date are entitled to dividend for the year 2020 except for the own shares held by the parent company.
Annual General Meeting 2021KONE Corporation’s Annual General Meeting will be held on Tuesday 2 March 2021 at 11.00 a.m. In order to prevent the spread of the COVID-19 pandemic, the company’s shareholders may partici-pate in the General Meeting and exercise
their shareholder rights only by voting in advance and by submitting counterpro-posals and asking questions in advance.
Helsinki, January 28, 2021KONE Corporation’s Board of Directors.
BOARD OF DIRECTORS’ REPORT
26
BOARD OF DIRECTORS’ REPORT

80
70
60
50
40
30
20
10
020162013 2014 201520122011 2017 2018 2019 2020
KONE ANNUAL REVIEW 2020
Shares and shareholders
KONE class B share price development Jan 1, 2011–Dec 31, 2020, EUR
KONE class B Share OMX Helsinki Cap -indeksi
*) Board’s proposal for the 2020 dividend Dividend Extraordinary dividend
2.50
2.00
1.50
1.00
0.50
0
KONE corporation’s share capital consists of the following:
Number of shares Par value, EUR
Class A 76,208,712 9,526,089
Class B 453,187,148 56,648,394
Total 529,395,860 66,174,483
KONE class B shareTrading code, Nasdaq Helsinki Ltd. in Finland KNEBV
ISIN code FI0009013403
Accounting par value EUR 0.125
KONE SHARE
KONE has two classes of shares: A and B. Only B-class shares are listed on the Nasdaq Helsinki Ltd. Trading of the KONE class B shares started on January 2, 1967.
Voting rightsEach KONE class A share is assigned one vote, as is each block of 10 class B shares, with the provision that each shareholder is entitled to at least one vote.
Dividend policyKONE has not adopted a specific dividend policy. In the case of a dividend distribu-tion, the dividend paid on the class B share is higher than that on the class A share.
The difference between the dividends is at minimum one (1) percent and at maximum two-and-a-half (2.5) percent, calculated from the accounting par value of the share. The accounting par value of the share is EUR 0.125.
Closing price (EUR)December 31, 2020 66.46
December 31, 2019 58.28
Change +14.0%
Dividend proposal Dividend
EUR 1.75
Extraordinary dividend
EUR 0.50per class B share
Share notations (EUR)High 76.20
Low 42.39
Volume-weighted average price 62.07
Market capitalization on December 31, 2020
EUR 34,452 million
KONE class B dividend per share, 2005–2020, EUR
BOARD OF DIRECTORS’ REPORT | SHARES AND SHAREHOLDERS
27
BOARD OF DIRECTORS’ REPORT | SHARES AND SHAREHOLDERS
20132010 2011 201220092008200720062005 2014 2015 2020*2016 2017 20192018
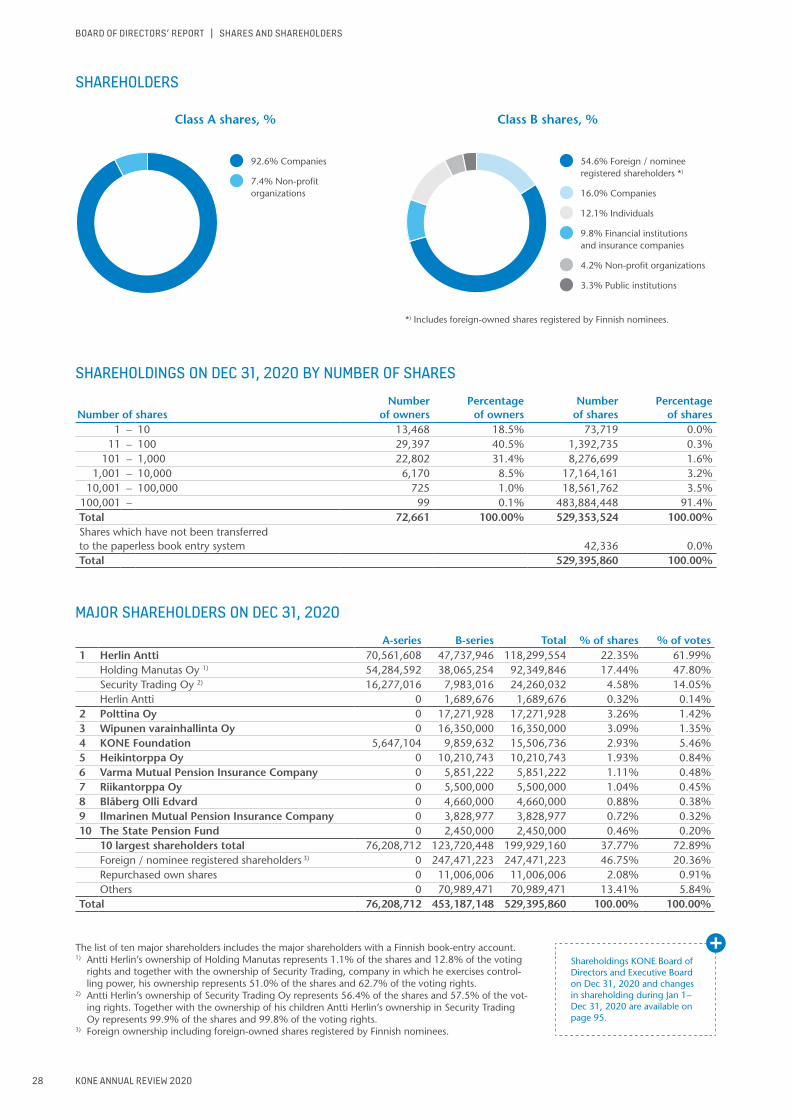
KONE ANNUAL REVIEW 2020
SHAREHOLDERS
Class A shares, % Class B shares, %
*) Includes foreign-owned shares registered by Finnish nominees.
SHAREHOLDINGS ON DEC 31, 2020 BY NUMBER OF SHARES
Number of sharesNumber
of ownersPercentage
of ownersNumber
of sharesPercentage
of shares1 – 10 13,468 18.5% 73,719 0.0%
11 – 100 29,397 40.5% 1,392,735 0.3%101 – 1,000 22,802 31.4% 8,276,699 1.6%
1,001 – 10,000 6,170 8.5% 17,164,161 3.2%10,001 – 100,000 725 1.0% 18,561,762 3.5%
100,001 – 99 0.1% 483,884,448 91.4%Total 72,661 100.00% 529,353,524 100.00%Shares which have not been transferred to the paperless book entry system 42,336 0.0%Total 529,395,860 100.00%
MAJOR SHAREHOLDERS ON DEC 31, 2020 A-series B-series Total % of shares % of votes 1 Herlin Antti 70,561,608 47,737,946 118,299,554 22.35% 61.99% Holding Manutas Oy 1) 54,284,592 38,065,254 92,349,846 17.44% 47.80% Security Trading Oy 2) 16,277,016 7,983,016 24,260,032 4.58% 14.05% Herlin Antti 0 1,689,676 1,689,676 0.32% 0.14%2 Polttina Oy 0 17,271,928 17,271,928 3.26% 1.42%3 Wipunen varainhallinta Oy 0 16,350,000 16,350,000 3.09% 1.35%4 KONE Foundation 5,647,104 9,859,632 15,506,736 2.93% 5.46%5 Heikintorppa Oy 0 10,210,743 10,210,743 1.93% 0.84%6 Varma Mutual Pension Insurance Company 0 5,851,222 5,851,222 1.11% 0.48%7 Riikantorppa Oy 0 5,500,000 5,500,000 1.04% 0.45%8 Blåberg Olli Edvard 0 4,660,000 4,660,000 0.88% 0.38%9 Ilmarinen Mutual Pension Insurance Company 0 3,828,977 3,828,977 0.72% 0.32%10 The State Pension Fund 0 2,450,000 2,450,000 0.46% 0.20% 10 largest shareholders total 76,208,712 123,720,448 199,929,160 37.77% 72.89% Foreign / nominee registered shareholders 3) 0 247,471,223 247,471,223 46.75% 20.36%
Repurchased own shares 0 11,006,006 11,006,006 2.08% 0.91% Others 0 70,989,471 70,989,471 13.41% 5.84%Total 76,208,712 453,187,148 529,395,860 100.00% 100.00%
Shareholdings KONE Board of Directors and Executive Board on Dec 31, 2020 and changes in shareholding during Jan 1−Dec 31, 2020 are available on page 95.
The list of ten major shareholders includes the major shareholders with a Finnish book-entry account.1) Antti Herlin’s ownership of Holding Manutas represents 1.1% of the shares and 12.8% of the voting
rights and together with the ownership of Security Trading, company in which he exercises control-ling power, his ownership represents 51.0% of the shares and 62.7% of the voting rights.
2) Antti Herlin’s ownership of Security Trading Oy represents 56.4% of the shares and 57.5% of the vot-ing rights. Together with the ownership of his children Antti Herlin’s ownership in Security Trading Oy represents 99.9% of the shares and 99.8% of the voting rights.
3) Foreign ownership including foreign-owned shares registered by Finnish nominees.
BOARD OF DIRECTORS’ REPORT | SHARES AND SHAREHOLDERS
54.6% Foreign / nominee registered shareholders *)
16.0% Companies
12.1% Individuals
9.8% Financial institutions and insurance companies
4.2% Non-profit organizations
3.3% Public institutions
92.6% Companies
7.4% Non-profit organizations
28
BOARD OF DIRECTORS’ REPORT | SHARES AND SHAREHOLDERS
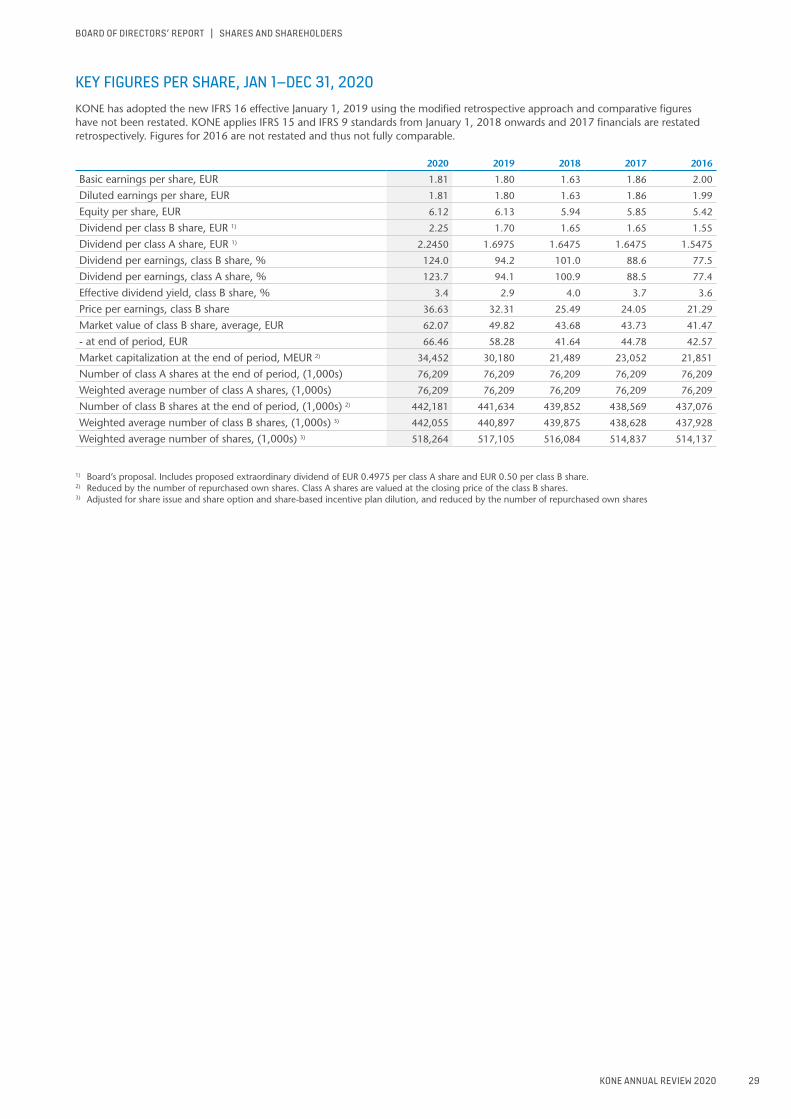
KONE ANNUAL REVIEW 2020
KEY FIGURES PER SHARE, JAN 1–DEC 31, 2020KONE has adopted the new IFRS 16 effective January 1, 2019 using the modified retrospective approach and comparative figures have not been restated. KONE applies IFRS 15 and IFRS 9 standards from January 1, 2018 onwards and 2017 financials are restated retrospectively. Figures for 2016 are not restated and thus not fully comparable.
2020 2019 2018 2017 2016
Basic earnings per share, EUR 1.81 1.80 1.63 1.86 2.00
Diluted earnings per share, EUR 1.81 1.80 1.63 1.86 1.99
Equity per share, EUR 6.12 6.13 5.94 5.85 5.42
Dividend per class B share, EUR 1) 2.25 1.70 1.65 1.65 1.55
Dividend per class A share, EUR 1) 2.2450 1.6975 1.6475 1.6475 1.5475
Dividend per earnings, class B share, % 124.0 94.2 101.0 88.6 77.5
Dividend per earnings, class A share, % 123.7 94.1 100.9 88.5 77.4
Effective dividend yield, class B share, % 3.4 2.9 4.0 3.7 3.6
Price per earnings, class B share 36.63 32.31 25.49 24.05 21.29
Market value of class B share, average, EUR 62.07 49.82 43.68 43.73 41.47
- at end of period, EUR 66.46 58.28 41.64 44.78 42.57
Market capitalization at the end of period, MEUR 2) 34,452 30,180 21,489 23,052 21,851
Number of class A shares at the end of period, (1,000s) 76,209 76,209 76,209 76,209 76,209
Weighted average number of class A shares, (1,000s) 76,209 76,209 76,209 76,209 76,209
Number of class B shares at the end of period, (1,000s) 2) 442,181 441,634 439,852 438,569 437,076
Weighted average number of class B shares, (1,000s) 3) 442,055 440,897 439,875 438,628 437,928
Weighted average number of shares, (1,000s) 3) 518,264 517,105 516,084 514,837 514,137
1) Board’s proposal. Includes proposed extraordinary dividend of EUR 0.4975 per class A share and EUR 0.50 per class B share.2) Reduced by the number of repurchased own shares. Class A shares are valued at the closing price of the class B shares. 3) Adjusted for share issue and share option and share-based incentive plan dilution, and reduced by the number of repurchased own shares
BOARD OF DIRECTORS’ REPORT | SHARES AND SHAREHOLDERS
29
BOARD OF DIRECTORS’ REPORT | SHARES AND SHAREHOLDERS
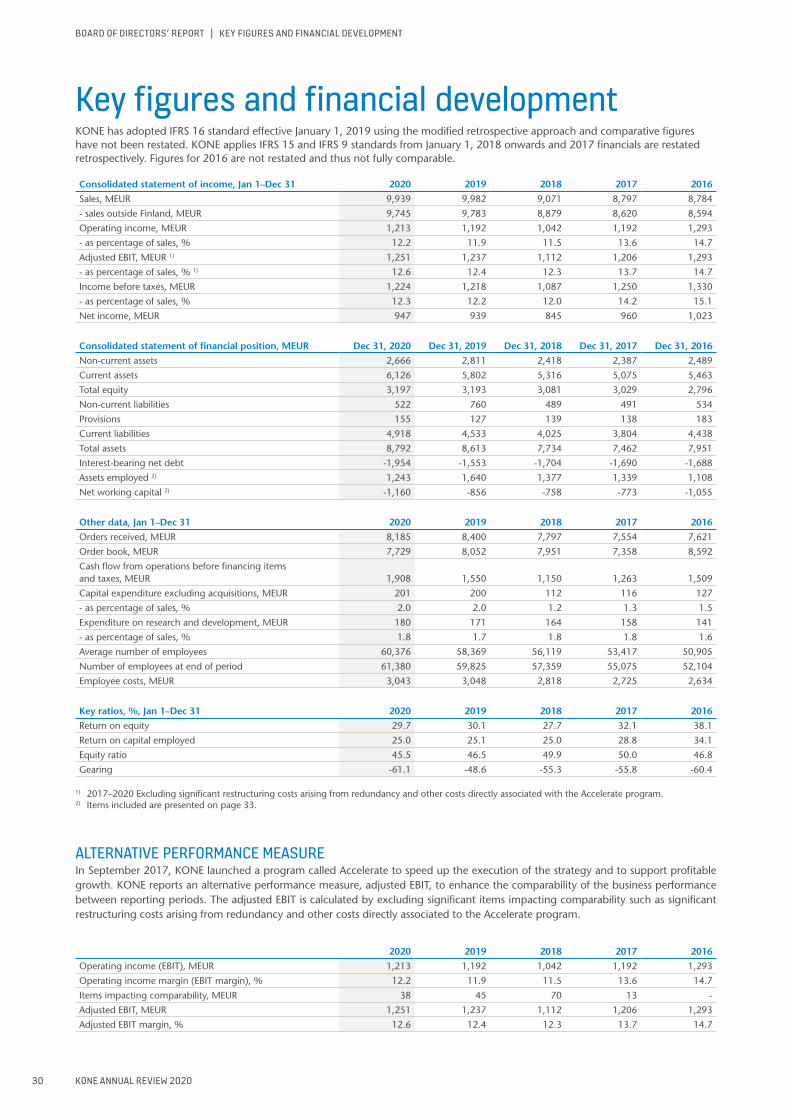
KONE ANNUAL REVIEW 2020
Key figures and financial developmentKONE has adopted IFRS 16 standard effective January 1, 2019 using the modified retrospective approach and comparative figures have not been restated. KONE applies IFRS 15 and IFRS 9 standards from January 1, 2018 onwards and 2017 financials are restated retrospectively. Figures for 2016 are not restated and thus not fully comparable.
Consolidated statement of income, Jan 1–Dec 31 2020 2019 2018 2017 2016
Sales, MEUR 9,939 9,982 9,071 8,797 8,784
- sales outside Finland, MEUR 9,745 9,783 8,879 8,620 8,594
Operating income, MEUR 1,213 1,192 1,042 1,192 1,293
- as percentage of sales, % 12.2 11.9 11.5 13.6 14.7
Adjusted EBIT, MEUR 1) 1,251 1,237 1,112 1,206 1,293
- as percentage of sales, % 1) 12.6 12.4 12.3 13.7 14.7
Income before taxes, MEUR 1,224 1,218 1,087 1,250 1,330
- as percentage of sales, % 12.3 12.2 12.0 14.2 15.1
Net income, MEUR 947 939 845 960 1,023
Consolidated statement of financial position, MEUR Dec 31, 2020 Dec 31, 2019 Dec 31, 2018 Dec 31, 2017 Dec 31, 2016
Non-current assets 2,666 2,811 2,418 2,387 2,489
Current assets 6,126 5,802 5,316 5,075 5,463
Total equity 3,197 3,193 3,081 3,029 2,796
Non-current liabilities 522 760 489 491 534
Provisions 155 127 139 138 183
Current liabilities 4,918 4,533 4,025 3,804 4,438
Total assets 8,792 8,613 7,734 7,462 7,951
Interest-bearing net debt -1,954 -1,553 -1,704 -1,690 -1,688
Assets employed 2) 1,243 1,640 1,377 1,339 1,108
Net working capital 2) -1,160 -856 -758 -773 -1,055
Other data, Jan 1–Dec 31 2020 2019 2018 2017 2016
Orders received, MEUR 8,185 8,400 7,797 7,554 7,621
Order book, MEUR 7,729 8,052 7,951 7,358 8,592
Cash flow from operations before financing items and taxes, MEUR 1,908 1,550 1,150 1,263 1,509
Capital expenditure excluding acquisitions, MEUR 201 200 112 116 127
- as percentage of sales, % 2.0 2.0 1.2 1.3 1.5
Expenditure on research and development, MEUR 180 171 164 158 141
- as percentage of sales, % 1.8 1.7 1.8 1.8 1.6
Average number of employees 60,376 58,369 56,119 53,417 50,905
Number of employees at end of period 61,380 59,825 57,359 55,075 52,104
Employee costs, MEUR 3,043 3,048 2,818 2,725 2,634
Key ratios, %, Jan 1–Dec 31 2020 2019 2018 2017 2016
Return on equity 29.7 30.1 27.7 32.1 38.1
Return on capital employed 25.0 25.1 25.0 28.8 34.1
Equity ratio 45.5 46.5 49.9 50.0 46.8
Gearing -61.1 -48.6 -55.3 -55.8 -60.4
1) 2017–2020 Excluding significant restructuring costs arising from redundancy and other costs directly associated with the Accelerate program. 2) Items included are presented on page 33.
ALTERNATIVE PERFORMANCE MEASUREIn September 2017, KONE launched a program called Accelerate to speed up the execution of the strategy and to support profitable growth. KONE reports an alternative performance measure, adjusted EBIT, to enhance the comparability of the business performance between reporting periods. The adjusted EBIT is calculated by excluding significant items impacting comparability such as significant restructuring costs arising from redundancy and other costs directly associated to the Accelerate program.
2020 2019 2018 2017 2016
Operating income (EBIT), MEUR 1,213 1,192 1,042 1,192 1,293
Operating income margin (EBIT margin), % 12.2 11.9 11.5 13.6 14.7
Items impacting comparability, MEUR 38 45 70 13 -
Adjusted EBIT, MEUR 1,251 1,237 1,112 1,206 1,293
Adjusted EBIT margin, % 12.6 12.4 12.3 13.7 14.7
BOARD OF DIRECTORS’ REPORT | KEY FIGURES AND FINANCIAL DEVELOPMENT
30
BOARD OF DIRECTORS’ REPORT | KEY FIGURES AND FINANCIAL DEVELOPMENT
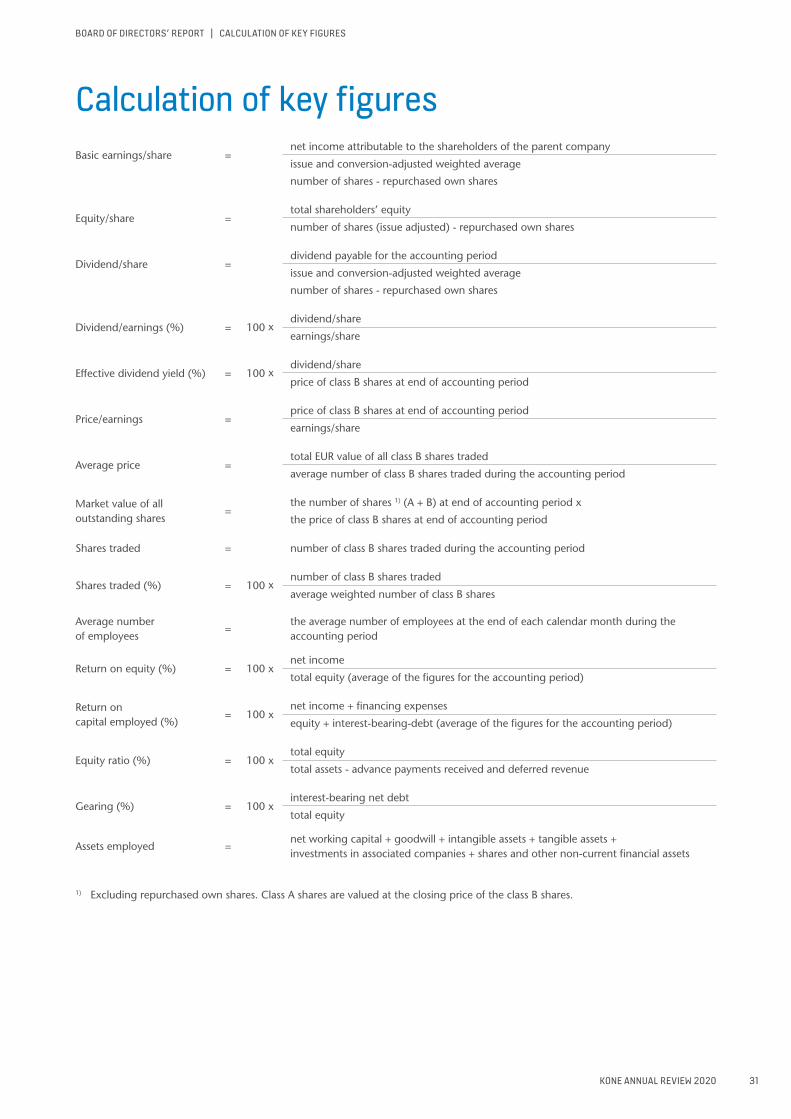
KONE ANNUAL REVIEW 2020
Calculation of key figuresBasic earnings/share =
net income attributable to the shareholders of the parent company
issue and conversion-adjusted weighted average
number of shares - repurchased own shares
Equity/share = total shareholders’ equity
number of shares (issue adjusted) - repurchased own shares
Dividend/share = dividend payable for the accounting period
issue and conversion-adjusted weighted average
number of shares - repurchased own shares
Dividend/earnings (%) = 100 x dividend/share
earnings/share
Effective dividend yield (%) = 100 x dividend/share
price of class B shares at end of accounting period
Price/earnings = price of class B shares at end of accounting period
earnings/share
Average price = total EUR value of all class B shares traded
average number of class B shares traded during the accounting period Market value of all outstanding shares
=the number of shares 1) (A + B) at end of accounting period x
the price of class B shares at end of accounting period Shares traded = number of class B shares traded during the accounting period
Shares traded (%) = 100 x number of class B shares traded
average weighted number of class B shares
Average number of employees
= the average number of employees at the end of each calendar month during the accounting period
Return on equity (%) = 100 x net income
total equity (average of the figures for the accounting period) Return on capital employed (%)
= 100 x net income + financing expenses
equity + interest-bearing-debt (average of the figures for the accounting period)
Equity ratio (%) = 100 xtotal equity
total assets - advance payments received and deferred revenue
Gearing (%) = 100 xinterest-bearing net debt
total equity
Assets employed = net working capital + goodwill + intangible assets + tangible assets + investments in associated companies + shares and other non-current financial assets
1) Excluding repurchased own shares. Class A shares are valued at the closing price of the class B shares.
BOARD OF DIRECTORS’ REPORT | CALCULATION OF KEY FIGURES
31
BOARD OF DIRECTORS’ REPORT | CALCULATION OF KEY FIGURES

KONE ANNUAL REVIEW 2020
Consolidated statement of income
Consolidated financial statements
MEUR Note Jan 1–Dec 31, 2020 % Jan 1–Dec 31, 2019 %
Sales 2.1 9,938.5 9,981.8Costs, expenses and depreciation 2.2, 2.3 -8,725.7 -8,789.4
Operating income 1,212.9 12.2 1,192.5 11.9Financing income 2.5 41.8 51.6Financing expenses 2.5 -30.4 -26.5
Income before taxes 1,224.2 12.3 1,217.5 12.2Taxes 2.6 -276.9 -278.9
Net income 947.3 9.5 938.6 9.4
Net income attributable to:Shareholders of the parent company 939.2 931.3Non-controlling interests 8.1 7.3
Total 947.3 938.6
Earnings per share for profit attributable to the shareholders of the parent company, EUR 2.7
Basic earnings per share, EUR 1.81 1.80Diluted earnings per share, EUR 1.81 1.80
Consolidated statement of comprehensive income
MEUR Note Jan 1–Dec 31, 2020 Jan 1–Dec 31, 2019
Net income 947.3 938.6
Other comprehensive income, net of tax: 2.8Translation differences -173.2 54.0Hedging of foreign subsidiaries 52.0 -8.5Cash flow hedges 27.1 -14.5
Items that may be subsequently reclassified to statement of income -94.1 31.0
Changes in fair value 4.8 -2.7
Remeasurements of employee benefits 8.8 -34.3Items that will not be reclassified to statement of income 13.6 -37.0Total other comprehensive income, net of tax -80.5 -6.0
Total comprehensive income 866.8 932.6
Total comprehensive income attributable to:Shareholders of the parent company 858.7 925.3Non-controlling interests 8.1 7.3
Total 866.8 932.6
CONSOLIDATED FINANCIAL STATEMENTS | CONSOLIDATED STATEMENT OF INCOME
32
CONSOLIDATED FINANCIAL STATEMENTS | CONSOLIDATED STATEMENT OF INCOME

KONE ANNUAL REVIEW 2020
Assets, MEUR Note Dec 31, 2020 Dec 31, 2019
Non-current assets Goodwill 4.2 1,327.0 1,366.5Other intangible assets 4.3 223.2 248.2Tangible assets 4.4 710.0 742.2Shares and other non-current financial assets 5.3, 5.4 143.2 139.2Non-current loans receivable I 5.3, 5.5 1.0 0.8Employee benefits I 5.3, 5.7 19.2 21.7Deferred tax assets II 3.6 242.4 292.3
Total non-current assets 2,666.1 2,810.9
Current assetsInventories II 3.1 597.0 648.6Accounts receivable II 3.2, 5.3 2,178.6 2,232.3Deferred assets II 3.3, 5.3 638.7 596.0Income tax receivables II 82.2 73.6Current deposits and loan receivables I 5.3, 5.5 2,171.4 1,589.5Cash and cash equivalents I 5.3 457.9 662.4
Total current assets 6,125.9 5,802.4
Total assets 8,792.0 8,613.3
Equity and liabilities, MEUR Note Dec 31, 2020 Dec 31, 2019
Equity attributable to the shareholders of the parent company Share capital 5.2 66.2 66.2Share premium account 100.3 100.3Paid-up unrestricted equity reserve 345.7 322.1Fair value and hedge reserves 41.7 9.8Translation differences -10.9 110.3Remeasurements of employee benefits -115.0 -123.8Retained earnings 2,746.6 2,687.9
Total Shareholders' Equity 3,174.6 3,172.9
Non-controlling interests 22.6 20.0
Total Equity 3,197.3 3,192.9
Non-current liabilitiesLoans I 5.3 244.0 427.1Employee benefits I 5.3, 5.7 187.2 172.9Deferred tax liabilities II 3.6 90.4 160.2
Total non-current liabilities 521.6 760.2
Provisions II 3.5 154.7 127.1
Current liabilitiesCurrent portion of long-term loans I 5.3 258.9 103.7Short-term loans and other liabilities I 5.3 5.6 17.9Advance payments received and deferred revenue II 3.2 1,766.8 1,753.8Accounts payable II 5.3 890.9 809.8Accruals II 3.4, 5.3 1,882.6 1,725.0Income tax payables II 113.6 123.0
Total current liabilities 4,918.4 4,533.2
Total equity and liabilities 8,792.0 8,613.3
Items designated ” I ” comprise interest-bearing net debt.Items designated ” II ” comprise net working capital.
Consolidated statement of financial position
CONSOLIDATED FINANCIAL STATEMENTS | CONSOLIDATED STATEMENT OF FINANCIAL POSITION
33
CONSOLIDATED FINANCIAL STATEMENTS | CONSOLIDATED STATEMENT OF FINANCIAL POSITION

KONE ANNUAL REVIEW 2020
Consolidated statement of changes in equity
MEUR Not
e
Shar
e ca
pit
al
Shar
e p
rem
ium
ac
coun
t
Paid
-up
un
rest
rict
ed
equi
ty r
eser
ve
Fair
val
ue a
nd
ot
her
res
erve
s
Tran
slat
ion
d
iffe
ren
ces
Rem
easu
rem
ents
of
em
plo
yee
ben
efits
Ow
n
shar
es
Ret
ain
ed
earn
ing
s
Net
inco
me
fo
r th
e p
erio
d
Non
-con
trol
ling
in
tere
sts
Tota
l eq
uity
Jan 1, 2020 66.2 100.3 322.1 9.8 110.3 -123.8 -185.1 2,873.0 20.0 3,192.9
Net income for the period 939.2 8.1 947.3
Other comprehensive income: 2.8Translation differences -173.2 -173.2Hedging of foreign subsidiaries 52.0 52.0Cash flow hedges 27.1 27.1Changes in fair value 4.8 4.8Remeasurements of employee benefits 8.8 8.8
Transactions with shareholders and non-controlling interests: 5.2
Profit distribution -880.5 -880.5Increase in equity (option rights) -Purchase of own shares -Change in non-controlling interests -5.5 -5.5Option and share-based compensation 23.6 20.4 -20.4 23.6
Dec 31, 2020 66.2 100.3 345.7 41.7 -10.9 -115.0 -164.7 1,972.0 939.2 22.6 3,197.3
MEUR No
te
Shar
e ca
pit
al
Shar
e p
rem
ium
ac
coun
t
Paid
-up
un
rest
rict
ed
equi
ty r
eser
ve
Fair
val
ue a
nd
o
ther
res
erve
s
Tran
slat
ion
d
iffe
ren
ces
Rem
easu
rem
ents
o
f em
plo
yee
ben
efits
Ow
n
shar
es
Ret
ain
ed
earn
ing
s
Net
inco
me
fo
r th
e p
erio
d
No
n-c
ontr
ollin
g
inte
rest
s
Tota
l eq
uity
Jan 1, 2019 66.0 100.3 259.1 27.0 64.8 -89.5 -203.3 2,840.0 16.0 3,080.6Restatement impact -28.5 -28.5Jan 1, 2019, restated 66.0 100.3 259.1 27.0 64.8 -89.5 -203.3 2,811.5 16.0 3,052.1
Net income for the period 931.3 7.3 938.6
Other comprehensive income: 2.8Translation differences 54.0 54.0Hedging of foreign subsidiaries -8.5 -8.5Cash flow hedges -14.5 -14.5Changes in fair value -2.7 -2.7Remeasurements of employee benefits -34.3 -34.3
Transactions with shareholders and non-controlling interests: 5.2
Profit distribution -851.7 -851.7Increase in equity (option rights) 0.2 37.3 37.5Purchase of own shares -Change in non-controlling interests -3.3 -3.3Option and share-based compensation 25.7 18.2 -18.2 25.7
Dec 31, 2019 66.2 100.3 322.1 9.8 110.3 -123.8 -185.1 1,941.7 931.3 20.0 3,192.9
CONSOLIDATED FINANCIAL STATEMENTS | CONSOLIDATED STATEMENT OF CHANGES IN EQUITY
34
CONSOLIDATED FINANCIAL STATEMENTS | CONSOLIDATED STATEMENT OF CHANGES IN EQUITY
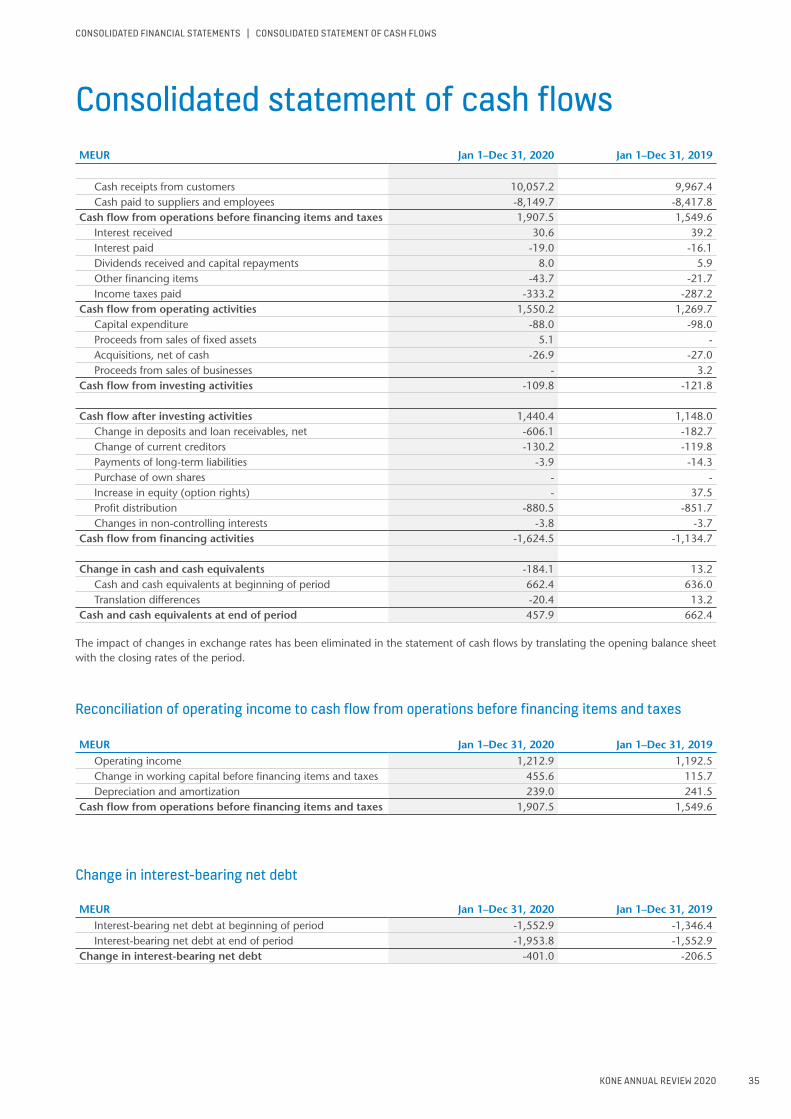
KONE ANNUAL REVIEW 2020
MEUR Jan 1–Dec 31, 2020 Jan 1–Dec 31, 2019
Cash receipts from customers 10,057.2 9,967.4Cash paid to suppliers and employees -8,149.7 -8,417.8
Cash flow from operations before financing items and taxes 1,907.5 1,549.6Interest received 30.6 39.2Interest paid -19.0 -16.1Dividends received and capital repayments 8.0 5.9Other financing items -43.7 -21.7Income taxes paid -333.2 -287.2
Cash flow from operating activities 1,550.2 1,269.7Capital expenditure -88.0 -98.0Proceeds from sales of fixed assets 5.1 -Acquisitions, net of cash -26.9 -27.0Proceeds from sales of businesses - 3.2
Cash flow from investing activities -109.8 -121.8
Cash flow after investing activities 1,440.4 1,148.0Change in deposits and loan receivables, net -606.1 -182.7Change of current creditors -130.2 -119.8Payments of long-term liabilities -3.9 -14.3Purchase of own shares - -Increase in equity (option rights) - 37.5Profit distribution -880.5 -851.7Changes in non-controlling interests -3.8 -3.7
Cash flow from financing activities -1,624.5 -1,134.7
Change in cash and cash equivalents -184.1 13.2Cash and cash equivalents at beginning of period 662.4 636.0Translation differences -20.4 13.2
Cash and cash equivalents at end of period 457.9 662.4
The impact of changes in exchange rates has been eliminated in the statement of cash flows by translating the opening balance sheet with the closing rates of the period.
Reconciliation of operating income to cash flow from operations before financing items and taxes
MEUR Jan 1–Dec 31, 2020 Jan 1–Dec 31, 2019Operating income 1,212.9 1,192.5Change in working capital before financing items and taxes 455.6 115.7Depreciation and amortization 239.0 241.5
Cash flow from operations before financing items and taxes 1,907.5 1,549.6
Change in interest-bearing net debt
MEUR Jan 1–Dec 31, 2020 Jan 1–Dec 31, 2019Interest-bearing net debt at beginning of period -1,552.9 -1,346.4Interest-bearing net debt at end of period -1,953.8 -1,552.9
Change in interest-bearing net debt -401.0 -206.5
Consolidated statement of cash flows
CONSOLIDATED FINANCIAL STATEMENTS | CONSOLIDATED STATEMENT OF CASH FLOWS
35
CONSOLIDATED FINANCIAL STATEMENTS | CONSOLIDATED STATEMENT OF CASH FLOWS

KONE ANNUAL REVIEW 2020
Notes to the consolidated financial statements
BASIS OF PREPARATION
IN THIS SECTION • Basis of preparation • Consolidation principles• Segment information• Accounting estimates and
management judgements
Accounting principles are presented in connection with notes in sections 2–6
CONSOLIDATED FINANCIAL STATEMENTS | NOTES TO THE CONSOLIDATED FINANCIAL STATEMENTS | BASIS OF PREPARATION
Basis of preparationKONE Corporation is a Finnish, public limited company domiciled in Helsinki, Finland. KONE Corporation and its subsidiaries together form the KONE Group (“KONE” or “the Group”). KONE’s vision is to deliver the best People Flow® experience, by providing Ease, Effectiveness and Experiences to users and customers over the full life-cycle of the buildings. KONE is developing and delivering ser-vices and solutions that enable people to move smoothly, safely, comfortably and without waiting in buildings in an increasingly urbanizing environment. KONE provides its customers with industry-leading elevators, escalators, automatic doors and integrated solutions to improve the customer experience in and between buildings. In addition, KONE offers maintenance and modernization services for existing equipment.
The consolidated financial statements of KONE Corpo-ration have been prepared in accordance with the Inter-national Financial Reporting Standards (IFRS) as adopted by the European Union, observing the standards and interpretations effective on December 31, 2020.
KONE has adopted the new standards and interpreta-tions that took effect during the accounting period and are relevant to its operations. The IFRS standards and amendments thereto that took effect in 2020 did not
CONSOLIDATED FINANCIAL STATEMENTS | NOTES TO THE CONSOLIDATED FINANCIAL STATEMENTS | BASIS OF PREPARATION
36
1

KONE ANNUAL REVIEW 2020
CONSOLIDATED FINANCIAL STATEMENTS | NOTES TO THE CONSOLIDATED FINANCIAL STATEMENTS | BASIS OF PREPARATION
have a material impact on the result or the financial position of the Group or on the presentation of the financial statements. IFRS 16 and IFRIC 23 were adopted effec-tive January 1, 2019 using the modified retrospective approach with transition impact of EUR 28.5 million recognized in the opening balance of retained earnings.
The consolidated financial statements have been prepared for the accounting period of 12 months from January 1 to December 31, 2020. The financial state-
ments have been authorized for issue by the Board of Directors of KONE Corpora-tion on January 28, 2021. According to the Finnish Companies’ Act the Annual General Meeting has the right to approve, reject or make changes to the financial statements after the publication.
The consolidated financial statements are presented in millions of euros and prepared under the historical cost conven-tion except as disclosed in the accounting principles. Further, trade date accounting
has been applied to all financial assets and liabilities. Amounts presented in these financial statements have been rounded from exact values and therefore the sum of amounts presented individually can deviate from the presented sum amount calculated based on the exact values. Key figures have been calculated using exact values.
Consolidation principlesThe consolidated accounts include the parent company and those companies in which the parent company held, directly or indirectly, more than 50 percent of the voting power or had control through management agreements with share-holders holding the majority of the vot-ing power at the end of the accounting period. In addition to these holdings, the consolidated accounts include possible holdings that are of a controlling-right nature (units/companies established for a specific reason). Subsidiaries acquired during the period were included in the consolidated financial statements from the date of acquiring the control, and divested subsidiaries up to the date of loss of control. Inter-corporate shareholdings have been eliminated using the acquisi-tion method. The acquisition consider-
ation, including deferred and contingent consideration, as well as the identifiable assets acquired and liabilities assumed, are measured at the acquisition date fair values. The acquisition-related costs are accounted as expenses for the period in which they are incurred.
At the acquisition date, the non-controlling interests are valued either at the acquisition date fair values or at non-controlling interests’ proportionate share in the recognized amounts of the identifi-able net assets. Net income for the period is disclosed in the statement of income as an allocation to the shareholders of the parent company and non-controlling interests. The allocation of the compre-hensive income to the shareholders of the parent company and non-controlling interests is presented in the statement of
comprehensive income. Non-controlling interests’ share of total equity is disclosed separately under consolidated total equity.
All inter-corporate transactions, receiv-ables, liabilities and unrealized profits, as well as the distribution of profits within the Group have been eliminated in the consolidated financial statements.
The results and financial position of foreign operations that have a functional currency different from the presentation currency of the Group, have been trans-lated into the presentation currency as follows: assets and liabilities at the state-ment of financial position date closing rate, and income and expenses at average exchange rates of the accounting period. The resulting exchange rate differences have been recognized in other compre-hensive income.
Segment informationThe profitability of KONE is presented as a single entity. The KONE business idea is to serve its customers by providing solu-tions throughout the entire lifecycle of the equipment, beginning from the instal-lation of new equipment to the mainte-nance and modernization during their lifecycle and the full replacement of the
equipment. Most of the equipment that are delivered are converted into long-term KONE maintenance contracts. KONE’s operating business structure is globally harmonized based on defined business processes. Material operative decisions are made by the Board of Directors of KONE. Such decisions are prepared and pre-
sented by the full-time Chairman of the Board and the President and Chief Execu-tive Officer. Due to the business model of KONE, the nature of its operations and its governance structure, the Group as a whole is the relevant operating segment to be reported.
Accounting estimates and management judgementsThe preparation of the financial statements in accordance with the IFRS requires man-agement to make judgements, estimates and assumptions that affect the measure-ment of the reported assets and liabilities and other information, such as contingent assets and liabilities and the recognition of income and expenses in the consolidated statement of income. Although these esti-
mates and assumptions are based on the management’s best knowledge of current events and actions, actual results may dif-fer from the estimates.
For KONE the most significant judge-ments, estimates and assumptions made by the management relate to revenue rec-ognition, especially to defining and deter-mining principles for revenue recognition
in project business, to project estimates for long-term major projects, assumptions used in impairment testing, valuation of accounts receivables and inventories, determining the lease term applied in the lease accounting and recognition of provi-sions and uncertain tax positions.
37
CONSOLIDATED FINANCIAL STATEMENTS | NOTES TO THE CONSOLIDATED FINANCIAL STATEMENTS | BASIS OF PREPARATION

2
KONE ANNUAL REVIEW 2020
IN THIS SECTIONThis section comprises the following notes describing KONE’s financial performance in 2020: 2.1 Sales2.2 Costs and expenses2.3 Depreciation and amortization2.4 Foreign exchange sensitivity2.5 Financing income and expenses2.6 Income taxes2.7 Earnings per share2.8 Other comprehensive income
MEUR 9,939SALES
MEUR 1,213EBIT
FINANCIAL PERFORMANCE
GROWTH: Faster than market growth
PROFITABILITY: EBIT 16%
CASH FLOW: Improved working capital
rotation
FINANCIAL TARGETS
KONE has defined long-term financial targets for its financial performance:
• KONE has not defined a time frame for the achievement of these financial targets.
• Given the capital and asset structure of KONE, the aim is not to maximize the EBIT margin in the short term, but rather to grow the absolute EBIT in an optimal way over the long term and as a result maintain a strong return on capital employed.
• The relative EBIT margin target is relevant in ensuring that growth and productivity improve continuously.
CONSOLIDATED FINANCIAL STATEMENTS | NOTES TO THE CONSOLIDATED FINANCIAL STATEMENTS | FINANCIAL PERFORMANCE
CONSOLIDATED FINANCIAL STATEMENTS | NOTES TO THE CONSOLIDATED FINANCIAL STATEMENTS | FINANCIAL PERFORMANCE
38

~30
>15
65
3 3 3 32 2
KONE ANNUAL REVIEW 2020
Accounting principles
Revenue recognitionRevenue from contracts with KONE’s cus-tomers is recognized at an amount that reflects the consideration to which KONE expects to be entitled in exchange for promised goods or services to a customer.
KONE recognizes revenue when or as it satisfies a performance obligation by transferring control on the promised goods or services (performance obligation) to a customer.
A performance obligation is a distinct good or service within a contract that a customer can benefit from on a stand-alone basis. For KONE’s new equipment and modernization contracts, a performance obligation typically means delivery and installation of a single unit, i.e. an elevator, an escalator or other People Flow™ solu-tion. For KONE’s maintenance contracts, maintenance of a single unit is considered as a distinct performance obligation and for repairs business, typically a service order is a performance obligation for KONE.
In new equipment and modernization contracts, KONE transfers the control of a single unit to the customer over time and, therefore, satisfies the performance obliga-tion and recognizes revenue over time.
The transfer of control occurs when KONE completes full delivery of the unit to
a customer site as then the customer has the ability to direct the use of, and obtain substantially all of the remaining benefits from, a unit constructed by KONE. Upon this milestone and onwards up to the proj-ect handover, revenue is recognized under the percentage of completion method using a cost-to-cost input method as based on KONE’s assessment it best depicts the transfer of control to the customer. Per-centage of completion is defined as the proportion of an individual performance obligation’s cost incurred to date from the total estimated costs for that particular per-formance obligation
The percentage of completion method requires accurate estimates of future rev-enues and costs over the full term of the contracts. These significant estimates form the basis for the amount of revenue to be recognized and include the latest updated estimate of total revenue and costs, adjusted with risks based on historical expe-rience on typical estimation revisions for similar types of contracts. These estimates may materially change due to the stage of completion of the contract, changes in the contract scope, cost estimates and cus-tomer’s plans and other factors.
Revenues from the rendering of mainte-nance services and repairs are recognized
when the services have been rendered or over the contract term when the work is being carried out. For maintenance services the performance obligation is satisfied over time because the customer simultaneously receives and consumes the benefits pro-vided as KONE performs the services.
Most of KONE’s revenue is derived from fixed-price contracts and, therefore, the amount of revenue to be earned from each contract is determined by reference to those fixed prices. KONE’s customer contracts do not contain any significant financing components. In new equipment and modernization contracts payment terms are typically based on either specific contractual milestones or progress of work performed. In maintenance services con-tracts customers generally pay based on fixed payment schedules.
When customer contracts contain mul-tiple performance obligations the transac-tion price is allocated to each performance obligation based on the standalone sell-ing prices. Where these are not directly observable, they are estimated based on estimated costs plus margin approach.
Due to KONE’s business model, the nature of its operations and its governance structure, KONE has one operating segment.
Sales by business
MEUR Jan 1–Dec 31, 2020 % Jan 1–Dec 31, 2019 %
New equipment 5,340.2 54 5,318.8 53
Services 4,598.4 46 4,663.0 47
Maintenance 3,215.6 32 3,192.0 32
Modernization 1,382.8 14 1,471.0 15
Total 9,938.5 9,981.8
Sales by geographical area
MEUR Jan 1–Dec 31, 2020 % Jan 1–Dec 31, 2019 %
EMEA 1) 3,916.2 39 4,045.4 41
Americas 1,939.5 20 2,046.7 21
Asia-Pacific 4,082.8 41 3,889.7 39
Total 9,938.5 9,981.8
1) EMEA = Europe, Middle East, Africa
2.1 SALES
CONSOLIDATED FINANCIAL STATEMENTS | NOTES TO THE CONSOLIDATED FINANCIAL STATEMENTS | FINANCIAL PERFORMANCE
Top 10 countries by sales, %
1 C
hina
2 U
SA
3 G
erm
any
4 Fr
ance
5 G
reat
Brit
ain
6 A
ustr
alia
7 It
aly
8 Fi
nlan
d
9 C
anad
a
10 S
wed
en
Sales by customerKONE’s customer base consists of a large number of customers in several markets areas and no individual customer represents a material share of its sales.
39
CONSOLIDATED FINANCIAL STATEMENTS | NOTES TO THE CONSOLIDATED FINANCIAL STATEMENTS | FINANCIAL PERFORMANCE

KONE ANNUAL REVIEW 2020
2.2 COSTS AND EXPENSES
Costs and expenses, MEURJan 1–Dec 31,
2020Jan 1–Dec 31,
2019
Direct materials, supplies and subcontracting 3,957.6 4,022.3
Wages, salaries, and other employment expenses including pensions (note 5.7) 3,042.9 3,048.4
Other production costs 1) 712.9 745.1
Selling, administrative and other expenses 2) 762.2 706.2
Items impacting comparability 3) 37.7 45.0
Depreciation and amortization (note 2.3) 239.0 241.5
Costs, expenses, depreciation and amortization 8,752.2 8,808.4
Other income 4) 26.5 19.0
Total costs, expenses, depreciation and amortization 8,725.7 8,789.4
Expense arising from leases of low-value assets and short-term leases amounted to EUR 11.2 (11.0) million in 2020.
1) Includes costs of logistics, tools and consumables, operative car fleet and traveling as well as other miscellaneous operative costs.
2) Includes costs related to premises, consulting and external services, IT and traveling as well as other miscellaneous administrative costs.
3) Restructuring costs related to the Accelerate-program.4) Includes rental income, received grants, interest on late payments, gains on sale of fixed
assets and scrap as well as other miscellaneous income.
Research and development costs, MEURJan 1–Dec 31,
2020Jan 1–Dec 31,
2019
R&D costs included in total costs 179.6 170.9
As percentage of sales, % 1.8 1.7
Auditors’ fees, MEURJan 1–Dec 31,
2020Jan 1–Dec 31,
2019
To member firms of PricewaterhouseCoopers network
Audit 3.7 3.8
Auditors´ statements 0.0 0.0
Tax services 0.5 0.4
Other services 2.3 2.2
Total 6.5 6.4
PricewaterhouseCoopers Oy has provided non-audit services to the entities of KONE Group in total of 213 thousand euros during the financial year 2020. These services included tax advisory services 27 thousand euros and other services 187 thousand euros.
2.3 DEPRECIATION AND AMORTIZATION
Depreciation and amortization, MEURJan 1–Dec 31,
2020Jan 1–Dec 31,
2019
Other intangible assets
Maintenance contracts 36.8 36.2
Other 11.6 13.7
Buildings 73.2 80.4
Machinery and equipment 117.5 111.2
Total 239.0 241.5
Cost breakdown 1–12/2020
Accounting principles
Research and development costsResearch and development costs are expensed as they incur, because the future economic benefits of new prod-ucts and development of existing prod-ucts and services can only be proven after their successful introduction to the market.
Accounting principles
Depreciation and amortization Depreciation and amortization are recorded on a straight-line basis over the economic useful lives of the assets, or over the lease contract periods, if shorter.
Economic useful lives:
Maintenance contracts 10–15 yearsOther intangible assets 3–10 yearsBuildings 5–40 yearsMachinery and equipment
4–10 years
Land is not depreciated.
45%
0.4%
3%
8%
9%
35%
CONSOLIDATED FINANCIAL STATEMENTS | NOTES TO THE CONSOLIDATED FINANCIAL STATEMENTS | FINANCIAL PERFORMANCE
40
CONSOLIDATED FINANCIAL STATEMENTS | NOTES TO THE CONSOLIDATED FINANCIAL STATEMENTS | FINANCIAL PERFORMANCE

KONE ANNUAL REVIEW 2020
Transaction risksA substantial part of KONE’s operations are denominated in local functional currencies of the subsidiaries and do not therefore give rise to transaction risk. The sales of new equipment and modernizations, including installation, typically take place in the local currency of the customer. Component and material expenses may occur in other currencies than the sales currency, which exposes KONE to transac-tion risks. KONE policy is to hedge the for-eign exchange exposure of the order book and other highly probable future sales and purchases with foreign exchange forward contracts. The business units are respon-sible for evaluating and hedging the trans-action risks in their operations according to the foreign exchange policy. The most significant transaction risk exposures aris-ing from business operations are in the Chinese yuan, British pound, Canadian dollar, US dollar and Singapore dollar. The majority of the currency forward contracts expire within one year.
Hedge accounting is applied in busi-ness units, where there are significant revenues or expenses in foreign currency. When hedge accounting is applied the gains and losses from the hedges are recognized in the statement of income at the same time as the exchange rate gains and losses for the hedged items are recognized.
KONE’s internal loans and deposits are primarily initiated in the local currencies of the subsidiaries in which case the possible foreign exchange risks are hedged, by the parent company, using foreign exchange swap contracts.
Translation risks Changes in consolidation exchange rates affect KONE’s statement of income, statement of cash flows and statement of financial position, which are presented in euros. As approximately 75% of KONE’s revenues occur in functional currencies other than euro, the translation risk is significant for KONE. A change of 10% in the annual average foreign exchange rates would have caused a 7.6% (7.6%) change in 2020 consolidated sales in euros. Such a change would have had a higher impact on KONE’s operating income and there-fore also some impact on KONE’s relative operating income. The translation of the subsidiaries’ balance sheets into euros caused translation differences of EUR -173.2 (54.0) million in 2020. The transla-tion risk is not hedged as a rule as KONE’s business consists of continuous operations in various currency areas. However, in individual cases, KONE can also hedge translation risk related to net assets of subsidiaries. The most significant transla-tion risk exposures arising from operations of foreign subsidiaries are in the Chinese yuan, Hong Kong dollar and US dollar.
Foreign exchange risksKONE operates internationally and is thus exposed to risks arising from foreign exchange rate fluctuations related to currency flows of revenues and expenses (transaction risk) and from the translation of statement of income and statement of financial position of the foreign subsidiar-ies from respective functional currencies into euros (translation risk).
2.4 FOREIGN EXCHANGE SENSITIVITY
Sales by currency 1–12/2020
EUR CNY USD Other
A change of 10% in the annual average foreign exchange rates
Impact on sales
7.6% change in consolidated sales
in euros
Impact on operating income (EBIT)
Higher impact on operating income as compared to sales and some impact on
relative operating income
Accounting principles
Foreign currency trans actions and translationsThe items included in the financial state-ments are initially recognized in the functional currencies, which are defined for each group entity based on their primary economic environment.
The presentation currency of the financial statements is the euro, which is also the functional currency of the par-ent company.
The initial recognition of transactions denominated in foreign currencies in the functional currency takes place at the rate of exchange prevailing at the date of the individual transaction. For-eign currency denominated receivables and liabilities are translated using period end exchange rates.
Foreign exchange gains and losses related to business transactions are treated as adjustments within operating income. Foreign exchange gains and losses associated with financing transac-tions are included in financing income and expenses.
The statements of income of foreign subsidiaries, whose functional currency is not the euro, are translated into euros based on the average exchange rate of the accounting period. Items in the statement of financial position, with the exception of net income for the accounting period, are translated into euros at the closing date exchange rate. Exchange rate differences arising from net investments and associated compa-nies in non-euro currency subsidiaries, as well as the exchange rate differences resulting from translating income and expenses at the average rates and assets and liabilities at the closing rate, are recorded in translation differences under equity. Respective changes dur-ing the period are presented in other comprehensive income. Exchange rate gains and losses resulting from financial instruments designated as hedges of net assets in foreign subsidiaries have been entered as translation differences in other comprehensive income. The cumulative translation differences related to foreign operations are reclas-sified from equity to statement of income upon the disposal of the foreign operation.
CONSOLIDATED FINANCIAL STATEMENTS | NOTES TO THE CONSOLIDATED FINANCIAL STATEMENTS | FINANCIAL PERFORMANCE
41
CONSOLIDATED FINANCIAL STATEMENTS | NOTES TO THE CONSOLIDATED FINANCIAL STATEMENTS | FINANCIAL PERFORMANCE
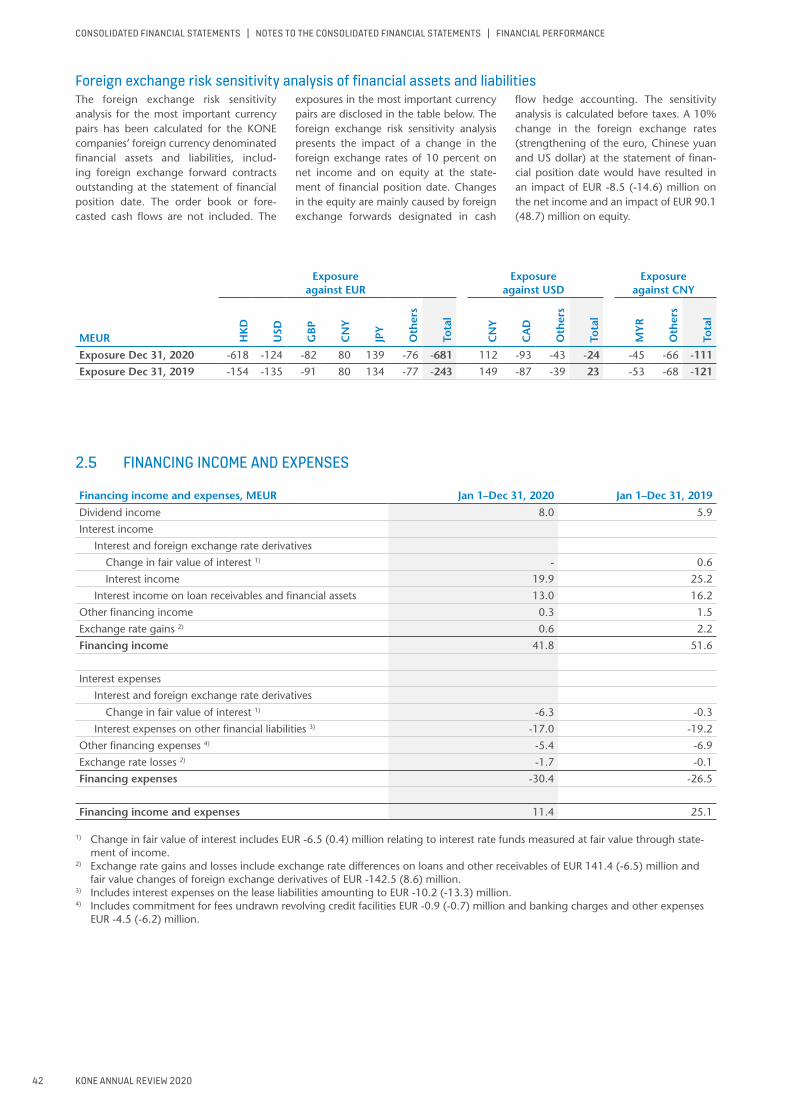
KONE ANNUAL REVIEW 2020
2.5 FINANCING INCOME AND EXPENSES
Financing income and expenses, MEUR Jan 1–Dec 31, 2020 Jan 1–Dec 31, 2019
Dividend income 8.0 5.9
Interest income
Interest and foreign exchange rate derivatives
Change in fair value of interest 1) - 0.6
Interest income 19.9 25.2
Interest income on loan receivables and financial assets 13.0 16.2
Other financing income 0.3 1.5
Exchange rate gains 2) 0.6 2.2
Financing income 41.8 51.6
Interest expenses
Interest and foreign exchange rate derivatives
Change in fair value of interest 1) -6.3 -0.3
Interest expenses on other financial liabilities 3) -17.0 -19.2
Other financing expenses 4) -5.4 -6.9
Exchange rate losses 2) -1.7 -0.1
Financing expenses -30.4 -26.5
Financing income and expenses 11.4 25.1
1) Change in fair value of interest includes EUR -6.5 (0.4) million relating to interest rate funds measured at fair value through state-ment of income.
2) Exchange rate gains and losses include exchange rate differences on loans and other receivables of EUR 141.4 (-6.5) million and fair value changes of foreign exchange derivatives of EUR -142.5 (8.6) million.
3) Includes interest expenses on the lease liabilities amounting to EUR -10.2 (-13.3) million. 4) Includes commitment for fees undrawn revolving credit facilities EUR -0.9 (-0.7) million and banking charges and other expenses
EUR -4.5 (-6.2) million.
Foreign exchange risk sensitivity analysis of financial assets and liabilitiesThe foreign exchange risk sensitivity analysis for the most important currency pairs has been calculated for the KONE companies’ foreign currency denominated financial assets and liabilities, includ-ing foreign exchange forward contracts outstanding at the statement of financial position date. The order book or fore-casted cash flows are not included. The
exposures in the most important currency pairs are disclosed in the table below. The foreign exchange risk sensitivity analysis presents the impact of a change in the foreign exchange rates of 10 percent on net income and on equity at the state-ment of financial position date. Changes in the equity are mainly caused by foreign exchange forwards designated in cash
flow hedge accounting. The sensitivity analysis is calculated before taxes. A 10% change in the foreign exchange rates (strengthening of the euro, Chinese yuan and US dollar) at the statement of finan-cial position date would have resulted in an impact of EUR -8.5 (-14.6) million on the net income and an impact of EUR 90.1 (48.7) million on equity.
Exposure against EUR
Exposure against USD
Exposure against CNY
MEUR HK
D
USD
GB
P
CN
Y
JPY
Oth
ers
Tota
l
CN
Y
CA
D
Oth
ers
Tota
l
MY
R
Oth
ers
Tota
l
Exposure Dec 31, 2020 -618 -124 -82 80 139 -76 -681 112 -93 -43 -24 -45 -66 -111
Exposure Dec 31, 2019 -154 -135 -91 80 134 -77 -243 149 -87 -39 23 -53 -68 -121
CONSOLIDATED FINANCIAL STATEMENTS | NOTES TO THE CONSOLIDATED FINANCIAL STATEMENTS | FINANCIAL PERFORMANCE
42
CONSOLIDATED FINANCIAL STATEMENTS | NOTES TO THE CONSOLIDATED FINANCIAL STATEMENTS | FINANCIAL PERFORMANCE
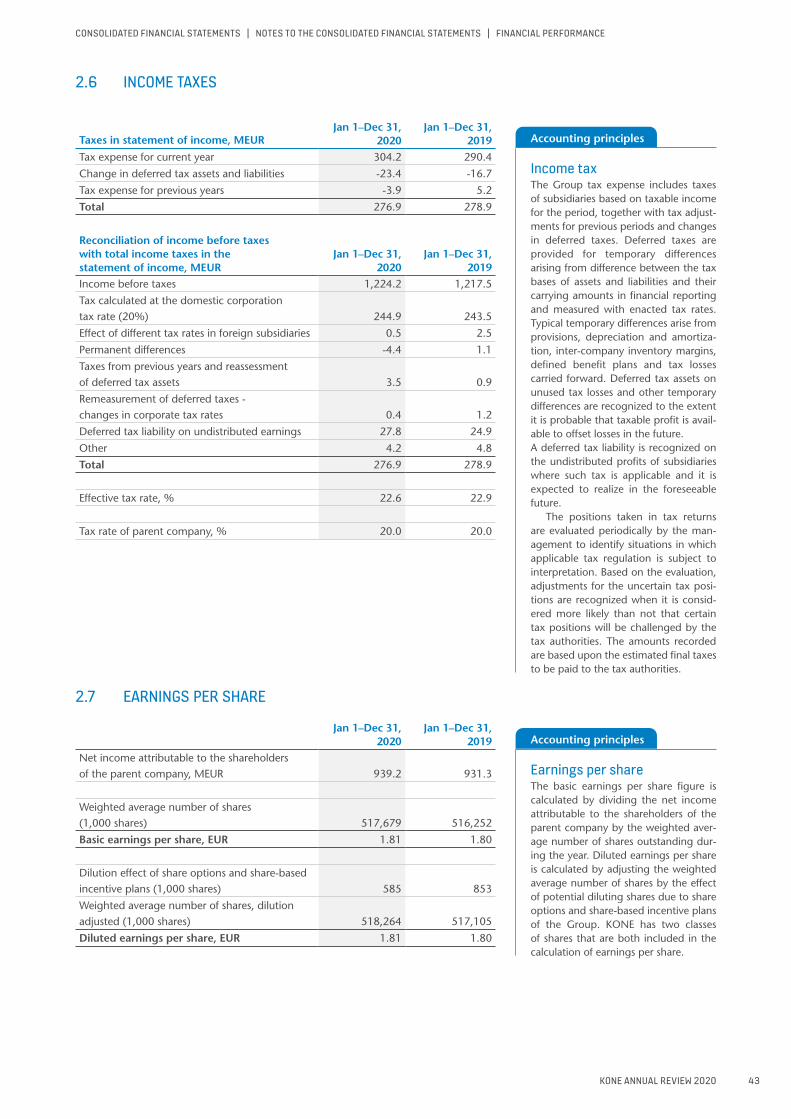
KONE ANNUAL REVIEW 2020
2.6 INCOME TAXES
Taxes in statement of income, MEURJan 1–Dec 31,
2020
Jan 1–Dec 31,
2019Tax expense for current year 304.2 290.4
Change in deferred tax assets and liabilities -23.4 -16.7
Tax expense for previous years -3.9 5.2
Total 276.9 278.9
Reconciliation of income before taxes with total income taxes in the statement of income, MEUR
Jan 1–Dec 31, 2020
Jan 1–Dec 31,
2019Income before taxes 1,224.2 1,217.5
Tax calculated at the domestic corporation tax rate (20%) 244.9 243.5
Effect of different tax rates in foreign subsidiaries 0.5 2.5
Permanent differences -4.4 1.1
Taxes from previous years and reassessment of deferred tax assets 3.5 0.9
Remeasurement of deferred taxes - changes in corporate tax rates 0.4 1.2
Deferred tax liability on undistributed earnings 27.8 24.9
Other 4.2 4.8
Total 276.9 278.9
Effective tax rate, % 22.6 22.9
Tax rate of parent company, % 20.0 20.0
Accounting principles
Earnings per shareThe basic earnings per share figure is calculated by dividing the net income attributable to the shareholders of the parent company by the weighted aver-age number of shares outstanding dur-ing the year. Diluted earnings per share is calculated by adjusting the weighted average number of shares by the effect of potential diluting shares due to share options and share-based incentive plans of the Group. KONE has two classes of shares that are both included in the calculation of earnings per share.
Accounting principles
Income tax The Group tax expense includes taxes of subsidiaries based on taxable income for the period, together with tax adjust-ments for previous periods and changes in deferred taxes. Deferred taxes are provided for temporary differences arising from difference between the tax bases of assets and liabilities and their carrying amounts in financial reporting and measured with enacted tax rates. Typical temporary differences arise from provisions, depreciation and amortiza-tion, inter-company inventory margins, defined benefit plans and tax losses carried forward. Deferred tax assets on unused tax losses and other temporary differences are recognized to the extent it is probable that taxable profit is avail-able to offset losses in the future. A deferred tax liability is recognized on the undistributed profits of subsidiaries where such tax is applicable and it is expected to realize in the foreseeable future.
The positions taken in tax returns are evaluated periodically by the man-agement to identify situations in which applicable tax regulation is subject to interpretation. Based on the evaluation, adjustments for the uncertain tax posi-tions are recognized when it is consid-ered more likely than not that certain tax positions will be challenged by the tax authorities. The amounts recorded are based upon the estimated final taxes to be paid to the tax authorities.
2.7 EARNINGS PER SHARE
Jan 1–Dec 31,
2020Jan 1–Dec 31,
2019Net income attributable to the shareholders of the parent company, MEUR 939.2 931.3
Weighted average number of shares (1,000 shares) 517,679 516,252
Basic earnings per share, EUR 1.81 1.80
Dilution effect of share options and share-based incentive plans (1,000 shares) 585 853
Weighted average number of shares, dilution adjusted (1,000 shares) 518,264 517,105
Diluted earnings per share, EUR 1.81 1.80
CONSOLIDATED FINANCIAL STATEMENTS | NOTES TO THE CONSOLIDATED FINANCIAL STATEMENTS | FINANCIAL PERFORMANCE
43
CONSOLIDATED FINANCIAL STATEMENTS | NOTES TO THE CONSOLIDATED FINANCIAL STATEMENTS | FINANCIAL PERFORMANCE

KONE ANNUAL REVIEW 2020
2.8 OTHER COMPREHENSIVE INCOME
Components of other comprehensive income
MEUR Jan 1–Dec 31, 2020 Jan 1–Dec 31, 2019Translation differences -173.2 54.0
Hedging of foreign subsidiaries 65.0 -10.7
Changes in fair value 4.8 -2.7
Remeasurements of employee benefits -2.9 -36.7
Cash flow hedges:
Gains/losses arising during the year 36.4 -0.9
Reclassifications included in profit or loss -1.4 -17.9
Cash flow hedges, net 35.0 -18.8
Income tax relating to components of other comprehensive income -9.2 8.8
Other comprehensive income -80.5 -6.0
Tax effects relating to components of other comprehensive income
MEUR
Jan 1–Dec 31, 2020 Jan 1–Dec 31, 2019
Before-tax amount
Tax expense/ benefit
Net-of-tax amount
Before-tax amount
Tax expense/ benefit
Net-of-tax amount
Translation differences -173.2 - -173.2 54.0 - 54.0
Hedging of foreign subsidiaries 65.0 -13.0 52.0 -10.7 2.1 -8.5
Cash flow hedges 35.0 -7.9 27.1 -18.8 4.3 -14.5
Items that may be subsequently reclassified to statement of income -73.2 -20.9 -94.1 24.5 6.4 31.0
Changes in fair value 4.8 - 4.8 -2.7 - -2.7
Remeasurements of employee benefits -2.9 11.7 8.8 -36.7 2.4 -34.3
Items that will not be reclassified to statement of income 1.9 11.7 13.6 -39.4 2.4 -37.0
Total other comprehensive income -71.3 -9.2 -80.5 -14.9 8.8 -6.0
CONSOLIDATED FINANCIAL STATEMENTS | NOTES TO THE CONSOLIDATED FINANCIAL STATEMENTS | FINANCIAL PERFORMANCE
44
CONSOLIDATED FINANCIAL STATEMENTS | NOTES TO THE CONSOLIDATED FINANCIAL STATEMENTS | FINANCIAL PERFORMANCE

3
KONE ANNUAL REVIEW 2020
IN THIS SECTION
This section comprises the follow-ing notes, describing components of KONE’s net working capital for 2020:
3.1 Inventories3.2 Accounts receivable and
contract assets and liabilities 3.3 Deferred assets3.4 Accruals3.5 Provisions3.6 Deferred tax assets
and liabilities
KONE’S NET WORKING CAPITAL
• Our business model enables us to operate with negative net working capital.
• KONE operates with advance payments across businesses and geographies.
MEUR -1,160NET WORKING CAPITAL
MEUR 1,908CASH FLOW*
NET WORKING CAPITAL
CONSOLIDATED FINANCIAL STATEMENTS | NOTES TO THE CONSOLIDATED FINANCIAL STATEMENTS | NET WORKING CAPITAL
*) Cash flow from operations before financing items and taxes
45
CONSOLIDATED FINANCIAL STATEMENTS | NOTES TO THE CONSOLIDATED FINANCIAL STATEMENTS | NET WORKING CAPITAL
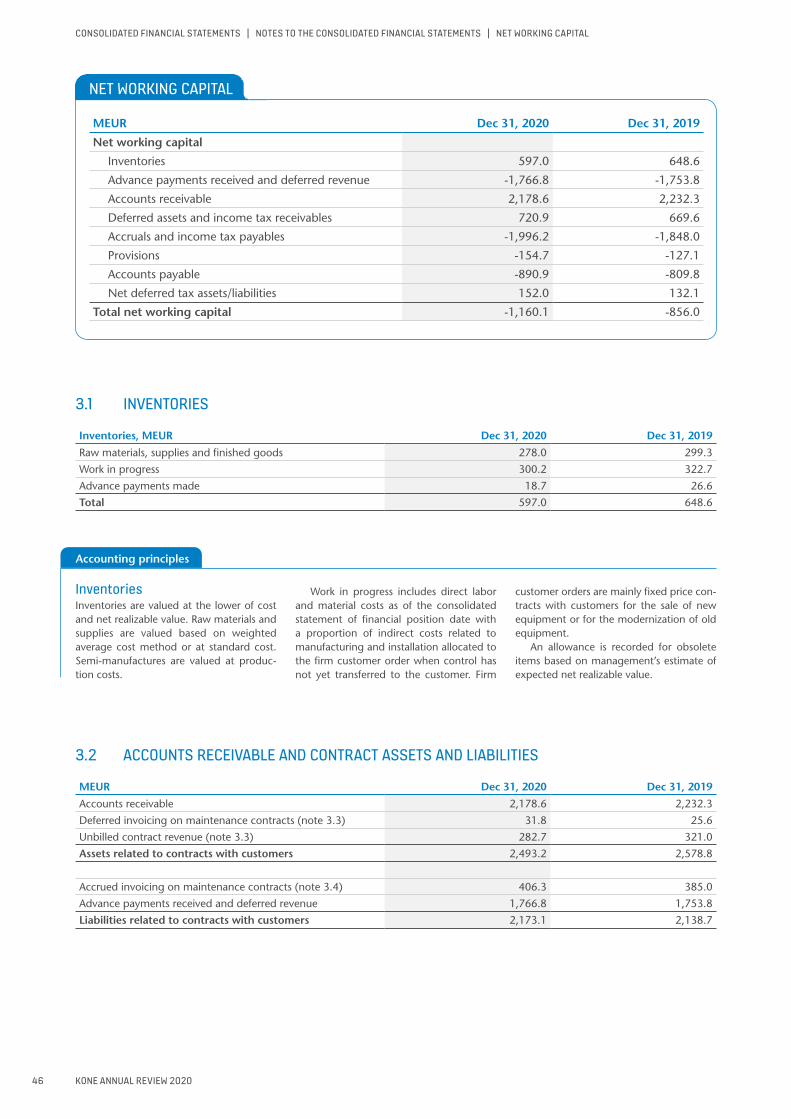
KONE ANNUAL REVIEW 2020
Accounting principles
NET WORKING CAPITAL
MEUR Dec 31, 2020 Dec 31, 2019
Net working capital
Inventories 597.0 648.6
Advance payments received and deferred revenue -1,766.8 -1,753.8
Accounts receivable 2,178.6 2,232.3
Deferred assets and income tax receivables 720.9 669.6
Accruals and income tax payables -1,996.2 -1,848.0
Provisions -154.7 -127.1
Accounts payable -890.9 -809.8
Net deferred tax assets/liabilities 152.0 132.1
Total net working capital -1,160.1 -856.0
3.1 INVENTORIES
Inventories, MEUR Dec 31, 2020 Dec 31, 2019
Raw materials, supplies and finished goods 278.0 299.3
Work in progress 300.2 322.7
Advance payments made 18.7 26.6
Total 597.0 648.6
3.2 ACCOUNTS RECEIVABLE AND CONTRACT ASSETS AND LIABILITIES
MEUR Dec 31, 2020 Dec 31, 2019
Accounts receivable 2,178.6 2,232.3
Deferred invoicing on maintenance contracts (note 3.3) 31.8 25.6
Unbilled contract revenue (note 3.3) 282.7 321.0
Assets related to contracts with customers 2,493.2 2,578.8
Accrued invoicing on maintenance contracts (note 3.4) 406.3 385.0
Advance payments received and deferred revenue 1,766.8 1,753.8
Liabilities related to contracts with customers 2,173.1 2,138.7
InventoriesInventories are valued at the lower of cost and net realizable value. Raw materials and supplies are valued based on weighted average cost method or at standard cost. Semi-manufactures are valued at produc-tion costs.
Work in progress includes direct labor and material costs as of the consolidated statement of financial position date with a proportion of indirect costs related to manufacturing and installation allocated to the firm customer order when control has not yet transferred to the customer. Firm
customer orders are mainly fixed price con-tracts with customers for the sale of new equipment or for the modernization of old equipment.
An allowance is recorded for obsolete items based on management’s estimate of expected net realizable value.
CONSOLIDATED FINANCIAL STATEMENTS | NOTES TO THE CONSOLIDATED FINANCIAL STATEMENTS | NET WORKING CAPITAL
46
CONSOLIDATED FINANCIAL STATEMENTS | NOTES TO THE CONSOLIDATED FINANCIAL STATEMENTS | NET WORKING CAPITAL
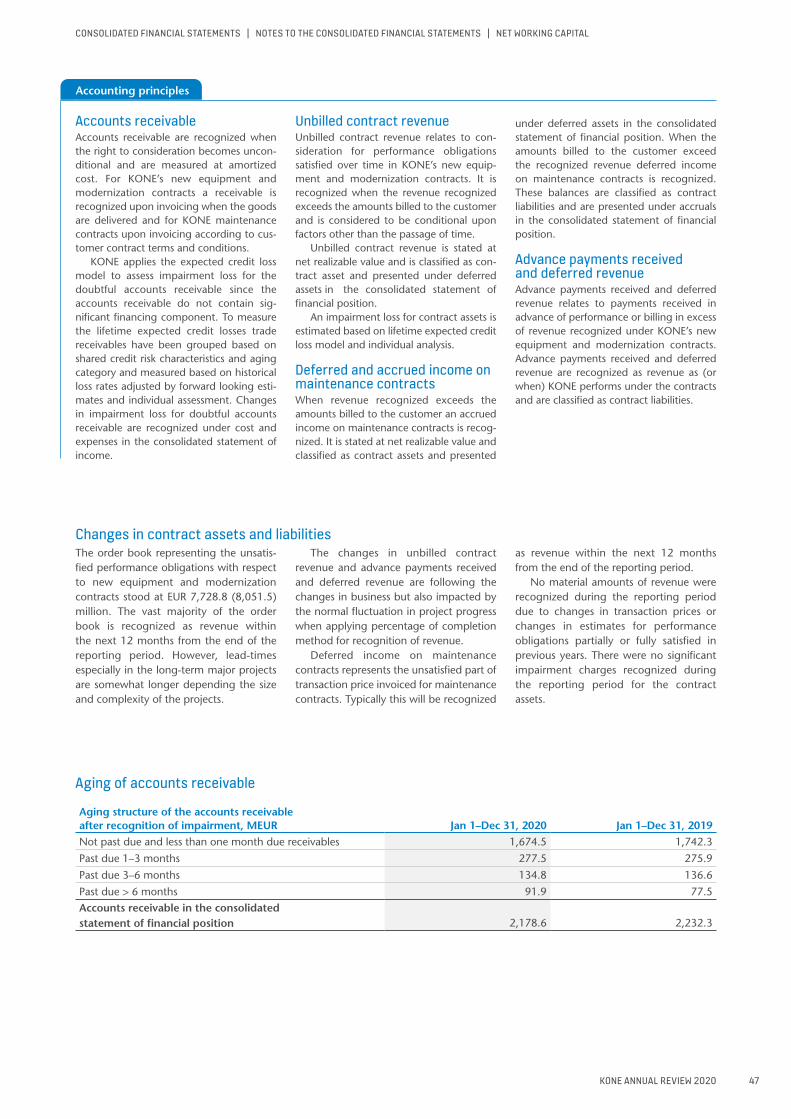
KONE ANNUAL REVIEW 2020
Accounting principles
Aging of accounts receivable
Aging structure of the accounts receivable after recognition of impairment, MEUR Jan 1–Dec 31, 2020 Jan 1–Dec 31, 2019Not past due and less than one month due receivables 1,674.5 1,742.3
Past due 1–3 months 277.5 275.9
Past due 3–6 months 134.8 136.6
Past due > 6 months 91.9 77.5Accounts receivable in the consolidated statement of financial position 2,178.6 2,232.3
Changes in contract assets and liabilitiesThe order book representing the unsatis-fied performance obligations with respect to new equipment and modernization contracts stood at EUR 7,728.8 (8,051.5) million. The vast majority of the order book is recognized as revenue within the next 12 months from the end of the reporting period. However, lead-times especially in the long-term major projects are somewhat longer depending the size and complexity of the projects.
The changes in unbilled contract revenue and advance payments received and deferred revenue are following the changes in business but also impacted by the normal fluctuation in project progress when applying percentage of completion method for recognition of revenue.
Deferred income on maintenance contracts represents the unsatisfied part of transaction price invoiced for maintenance contracts. Typically this will be recognized
as revenue within the next 12 months from the end of the reporting period.
No material amounts of revenue were recognized during the reporting period due to changes in transaction prices or changes in estimates for performance obligations partially or fully satisfied in previous years. There were no significant impairment charges recognized during the reporting period for the contract assets.
Accounts receivableAccounts receivable are recognized when the right to consideration becomes uncon-ditional and are measured at amortized cost. For KONE’s new equipment and modernization contracts a receivable is recognized upon invoicing when the goods are delivered and for KONE maintenance contracts upon invoicing according to cus-tomer contract terms and conditions.
KONE applies the expected credit loss model to assess impairment loss for the doubtful accounts receivable since the accounts receivable do not contain sig-nificant financing component. To measure the lifetime expected credit losses trade receivables have been grouped based on shared credit risk characteristics and aging category and measured based on historical loss rates adjusted by forward looking esti-mates and individual assessment. Changes in impairment loss for doubtful accounts receivable are recognized under cost and expenses in the consolidated statement of income.
Unbilled contract revenue Unbilled contract revenue relates to con-sideration for performance obligations satisfied over time in KONE’s new equip-ment and modernization contracts. It is recognized when the revenue recognized exceeds the amounts billed to the customer and is considered to be conditional upon factors other than the passage of time.
Unbilled contract revenue is stated at net realizable value and is classified as con-tract asset and presented under deferred assets in the consolidated statement of financial position.
An impairment loss for contract assets is estimated based on lifetime expected credit loss model and individual analysis.
Deferred and accrued income on maintenance contracts When revenue recognized exceeds the amounts billed to the customer an accrued income on maintenance contracts is recog-nized. It is stated at net realizable value and classified as contract assets and presented
under deferred assets in the consolidated statement of financial position. When the amounts billed to the customer exceed the recognized revenue deferred income on maintenance contracts is recognized. These balances are classified as contract liabilities and are presented under accruals in the consolidated statement of financial position.
Advance payments received and deferred revenue Advance payments received and deferred revenue relates to payments received in advance of performance or billing in excess of revenue recognized under KONE’s new equipment and modernization contracts. Advance payments received and deferred revenue are recognized as revenue as (or when) KONE performs under the contracts and are classified as contract liabilities.
CONSOLIDATED FINANCIAL STATEMENTS | NOTES TO THE CONSOLIDATED FINANCIAL STATEMENTS | NET WORKING CAPITAL
47
CONSOLIDATED FINANCIAL STATEMENTS | NOTES TO THE CONSOLIDATED FINANCIAL STATEMENTS | NET WORKING CAPITAL

KONE ANNUAL REVIEW 2020
3.3 DEFERRED ASSETS
Deferred assets, MEUR Dec 31, 2020 Dec 31, 2019
Deferred interests 0.7 3.1
Accrued income on maintenance contracts (note 3.2) 31.8 25.6
Unbilled contract revenue (note 3.2) 282.7 321.0
Derivative assets (note 5.3) 76.8 9.1
Value added tax assets 92.4 101.3
Prepaid expenses and other receivables 154.3 135.9
Total 638.7 596.0
3.4 ACCRUALS
Accruals, MEUR Dec 31, 2020 Dec 31, 2019
Accrued interests 0.9 0.9
Deferred income on maintenance contracts (note 3.2) 406.3 385.0
Late cost accruals 1) 305.7 281.8
Accrued salaries, wages and employment costs 479.5 477.5
Share-based payments 26.6 29.5
Derivative liabilities (note 5.3) 77.0 25.7
Value added tax liabilities 98.3 108.3
Accruals on acquisitions 13.4 13.4
Other accruals 474.9 402.8
Total 1,882.6 1,725.0
1) Includes expected costs still to be incurred on completed new equipment and modernization contracts.
Customer credit risk managementCustomer credit risks relate to advance payments receivable from customers or to accounts receivable related to equipment deliveries or to services rendered. This risk is managed by defining the rules for tendering, payment terms, authorizations and credit control as well as project man-agement controls. Advance payments, documentary credits and guarantees are used in payment terms to minimize customer credit risks. KONE proactively manages its accounts receivable in order to minimize the risk of customer defaults. KONE’s customer base consists of a large number of customers in several market areas. The management considers that there are no significant concentrations of credit risk with any individual customer or geographical region.
The credit quality of advance pay-ments receivable and accounts receivable is evaluated according to KONE’s credit policy. According to this policy, the rules for credit quality evaluation are set sepa-rately for the new equipment business and the service business. The credit qual-ity is evaluated both on the basis of the aging of the receivables as well as on the basis of individual case by case customer analysis in order to identify customers with a potential higher credit risk due to indi-vidual customer specific reasons. The bad debt provision for the accounts receivable is recognized on the basis of this credit quality evaluation using the expected credit loss model.
During the current financial year, KONE has modified calculation parameters for
the receivables aging based allowance as well as recorded impairment charges on certain individual cases to reflect the effect of increased risk for credit losses pertaining to COVID19. Overall the disruption to the business arising from COVID19 has been limited with significant part of KONE’s operations being considered essential and as such, allowed even during lockdowns. Increased uncertainty of receivables col-lection is not expected to continue long-term.
The amount of bad debt provision recorded to cover doubtful accounts was EUR 262.5 (252.9) million at the end of the financial period.
CONSOLIDATED FINANCIAL STATEMENTS | NOTES TO THE CONSOLIDATED FINANCIAL STATEMENTS | NET WORKING CAPITAL
48
CONSOLIDATED FINANCIAL STATEMENTS | NOTES TO THE CONSOLIDATED FINANCIAL STATEMENTS | NET WORKING CAPITAL

KONE ANNUAL REVIEW 2020
Accounting principles
3.5 PROVISIONS
Jan 1–Dec 31, 2020, MEURProvision
for warrantyProvision for claims
Provision for business
restructuring
Provision for loss
contractsOther
provisions TotalTotal provisions at beginning of period 57.8 3.7 15.2 26.4 24.0 127.1
Translation differences -1.0 0.0 -0.2 -1.9 -0.4 -3.6
Increase 31.4 3.2 20.9 18.5 19.9 94.0
Provisions used -16.2 -0.1 -16.1 -9.5 -4.6 -46.5
Reversal of provisions -4.6 -0.5 -1.6 -5.1 -4.6 -16.4
Companies acquired - - - - 0.2 0.2
Total provisions at end of period 67.4 6.3 18.1 28.3 34.5 154.7
Non-current
liabilitiesCurrent
liabilities TotalDistribution of provisions as of Dec 31, 2020 39.9 114.7 154.7
Jan 1–Dec 31, 2019, MEURProvision
for warrantyProvision for claims
Provision for business
restructuring
Provision for loss
contractsOther
provisions TotalTotal provisions at beginning of period 56.6 2.9 24.1 28.4 27.3 139.4
Translation differences 0.1 -0.1 -0.7 0.8 0.1 0.2
Increase 22.9 3.2 4.3 12.5 4.0 46.9
Provisions used -16.9 -0.1 -11.6 -9.6 -3.3 -41.5
Reversal of provisions -4.8 -2.2 -1.0 -5.8 -4.3 -18.2
Companies acquired - - - - 0.2 0.2
Total provisions at end of period 57.8 3.7 15.2 26.4 24.0 127.1
Non-current
liabilitiesCurrent
liabilities TotalDistribution of provisions as of Dec 31, 2019 32.0 95.1 127.1
Provisions Provisions are recognized when KONE has a current legal or constructive obligation as a result of past event, and it is probable that an outflow of resources will be required to settle the obligation and a reliable estimate of the amount of the obligation can be made. Recognition and measurement of a provision generally employs manage-rial estimates of the probability and the amount of the liability.
Provisions for warranties cover the esti-mated liability to repair or replace products
still under warranty at the statement of financial position date. This provision is calculated based on historical experience of levels of repair and replacements.
Provision for claims is recognized when the claim has been received and it is prob-able that it will be settled and the settle-ment amount can be estimated reliably.
A provision for business restructuring is recognized only when a detailed and formal plan has been established, there is a valid expectation that such a plan will be
carried out and the plan has been commu-nicated.
Provisions for loss contracts are recog-nized when it is probable that the costs will exceed the estimated total revenue or other income arising from the contract. The probable loss is recognized as an expense immediately.
Other provisions include for example provisions for contractual and other obliga-tions arising from disputes, labour relations or other regulatory matters.
CONSOLIDATED FINANCIAL STATEMENTS | NOTES TO THE CONSOLIDATED FINANCIAL STATEMENTS | NET WORKING CAPITAL
49
CONSOLIDATED FINANCIAL STATEMENTS | NOTES TO THE CONSOLIDATED FINANCIAL STATEMENTS | NET WORKING CAPITAL
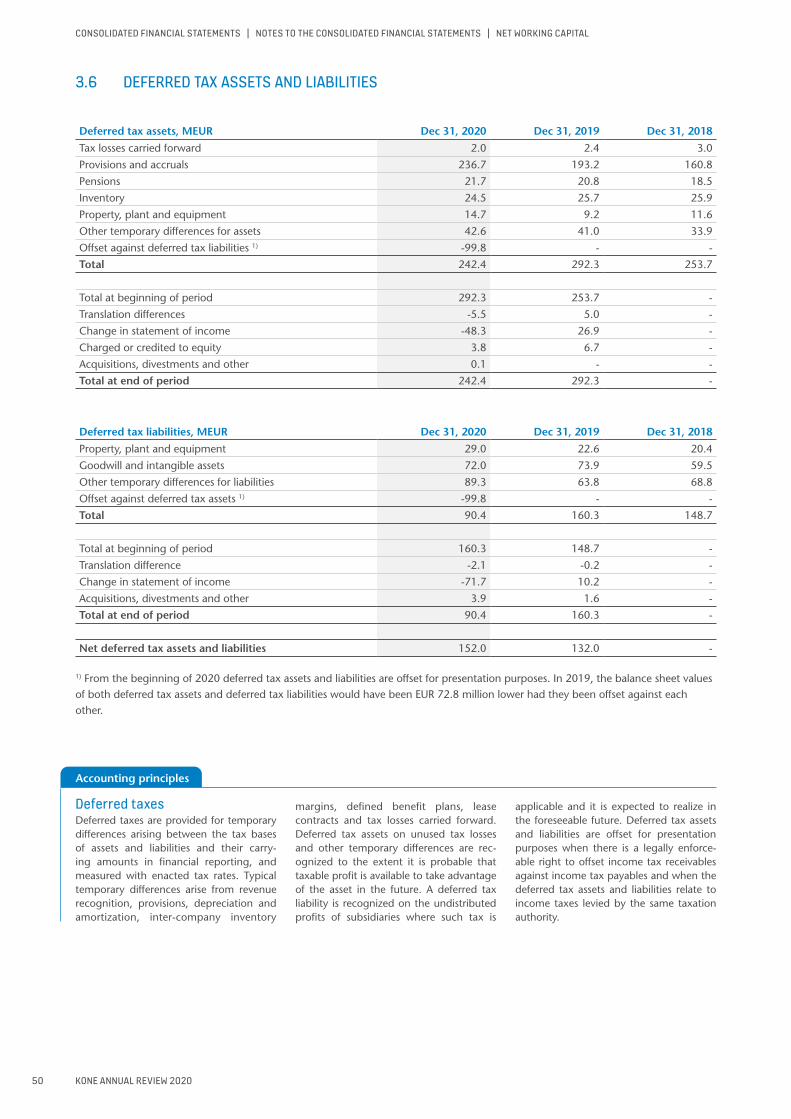
KONE ANNUAL REVIEW 2020
Accounting principles
Deferred taxes Deferred taxes are provided for temporary differences arising between the tax bases of assets and liabilities and their carry-ing amounts in financial reporting, and measured with enacted tax rates. Typical temporary differences arise from revenue recognition, provisions, depreciation and amortization, inter-company inventory
margins, defined benefit plans, lease contracts and tax losses carried forward. Deferred tax assets on unused tax losses and other temporary differences are rec-ognized to the extent it is probable that taxable profit is available to take advantage of the asset in the future. A deferred tax liability is recognized on the undistributed profits of subsidiaries where such tax is
applicable and it is expected to realize in the foreseeable future. Deferred tax assets and liabilities are offset for presentation purposes when there is a legally enforce-able right to offset income tax receivables against income tax payables and when the deferred tax assets and liabilities relate to income taxes levied by the same taxation authority.
3.6 DEFERRED TAX ASSETS AND LIABILITIES
Deferred tax assets, MEUR Dec 31, 2020
Dec 31, 2019
Dec 31, 2018
Tax losses carried forward 2.0 2.4 3.0
Provisions and accruals 236.7 193.2 160.8
Pensions 21.7 20.8 18.5
Inventory 24.5 25.7 25.9
Property, plant and equipment 14.7 9.2 11.6
Other temporary differences for assets 42.6 41.0 33.9
Offset against deferred tax liabilities 1) -99.8 - -
Total 242.4 292.3 253.7
Total at beginning of period 292.3 253.7 -
Translation differences -5.5 5.0 -
Change in statement of income -48.3 26.9 -
Charged or credited to equity 3.8 6.7 -
Acquisitions, divestments and other 0.1 - -
Total at end of period 242.4 292.3 -
Deferred tax liabilities, MEUR Dec 31, 2020
Dec 31, 2019
Dec 31, 2018
Property, plant and equipment 29.0 22.6 20.4
Goodwill and intangible assets 72.0 73.9 59.5
Other temporary differences for liabilities 89.3 63.8 68.8
Offset against deferred tax assets 1) -99.8 - -
Total 90.4 160.3 148.7
Total at beginning of period 160.3 148.7 -
Translation difference -2.1 -0.2 -
Change in statement of income -71.7 10.2 -
Acquisitions, divestments and other 3.9 1.6 -
Total at end of period 90.4 160.3 -
Net deferred tax assets and liabilities 152.0 132.0 -
1) From the beginning of 2020 deferred tax assets and liabilities are offset for presentation purposes. In 2019, the balance sheet values of both deferred tax assets and deferred tax liabilities would have been EUR 72.8 million lower had they been offset against each other.
CONSOLIDATED FINANCIAL STATEMENTS | NOTES TO THE CONSOLIDATED FINANCIAL STATEMENTS | NET WORKING CAPITAL
50
CONSOLIDATED FINANCIAL STATEMENTS | NOTES TO THE CONSOLIDATED FINANCIAL STATEMENTS | NET WORKING CAPITAL
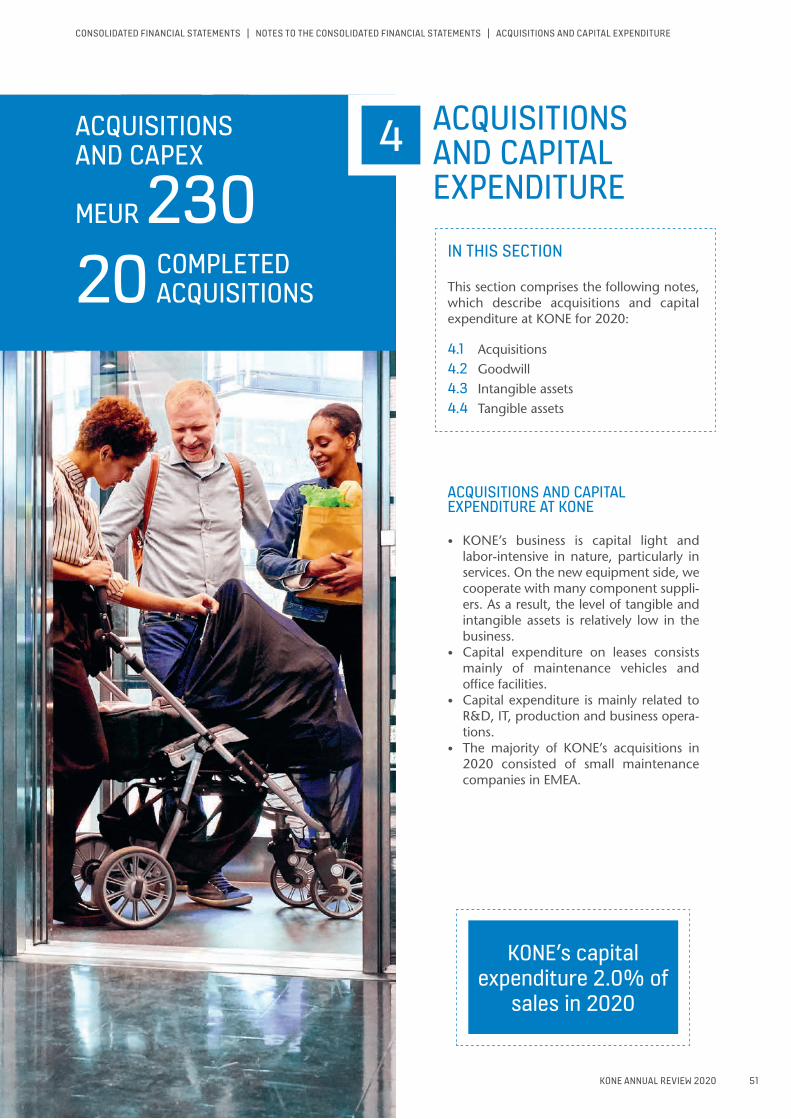
4
KONE ANNUAL REVIEW 2020
MEUR 230ACQUISITIONSAND CAPEX
20 COMPLETED ACQUISITIONS
IN THIS SECTION
This section comprises the following notes, which describe acquisitions and capital expenditure at KONE for 2020:
4.1 Acquisitions4.2 Goodwill4.3 Intangible assets4.4 Tangible assets
ACQUISITIONS AND CAPITAL EXPENDITURE AT KONE
• KONE’s business is capital light and labor-intensive in nature, particularly in services. On the new equipment side, we cooperate with many component suppli-ers. As a result, the level of tangible and intangible assets is relatively low in the business.
• Capital expenditure on leases consists mainly of maintenance vehicles and office facilities.
• Capital expenditure is mainly related to R&D, IT, production and business opera-tions.
• The majority of KONE’s acquisitions in 2020 consisted of small maintenance companies in EMEA.
ACQUISITIONS AND CAPITAL EXPENDITURE
KONE’s capital expenditure 2.0% of
sales in 2020
CONSOLIDATED FINANCIAL STATEMENTS | NOTES TO THE CONSOLIDATED FINANCIAL STATEMENTS | ACQUISITIONS AND CAPITAL EXPENDITURE
51
CONSOLIDATED FINANCIAL STATEMENTS | NOTES TO THE CONSOLIDATED FINANCIAL STATEMENTS | ACQUISITIONS AND CAPITAL EXPENDITURE
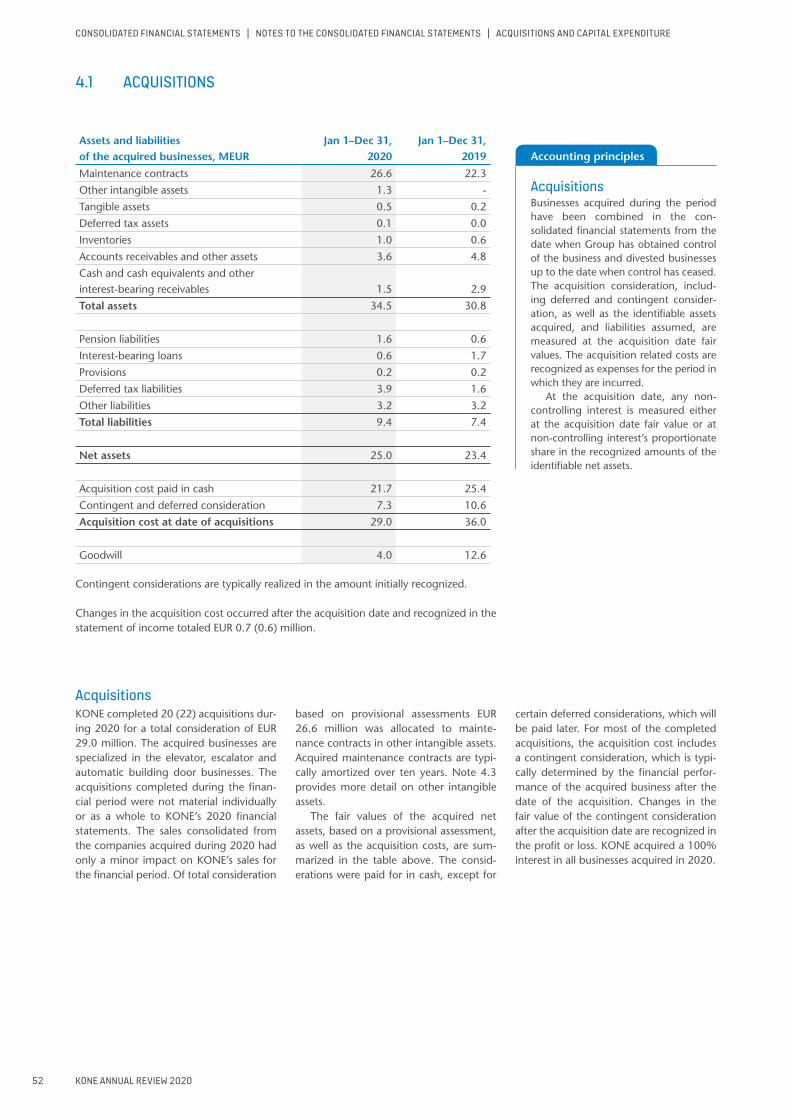
KONE ANNUAL REVIEW 2020
Acquisitions KONE completed 20 (22) acquisitions dur-ing 2020 for a total consideration of EUR 29.0 million. The acquired businesses are specialized in the elevator, escalator and automatic building door businesses. The acquisitions completed during the finan-cial period were not material individually or as a whole to KONE’s 2020 financial statements. The sales consolidated from the companies acquired during 2020 had only a minor impact on KONE’s sales for the financial period. Of total consideration
based on provisional assessments EUR 26.6 million was allocated to mainte-nance contracts in other intangible assets. Acquired maintenance contracts are typi-cally amortized over ten years. Note 4.3 provides more detail on other intangible assets.
The fair values of the acquired net assets, based on a provisional assessment, as well as the acquisition costs, are sum-marized in the table above. The consid-erations were paid for in cash, except for
certain deferred considerations, which will be paid later. For most of the completed acquisitions, the acquisition cost includes a contingent consideration, which is typi-cally determined by the financial perfor-mance of the acquired business after the date of the acquisition. Changes in the fair value of the contingent consideration after the acquisition date are recognized in the profit or loss. KONE acquired a 100% interest in all businesses acquired in 2020.
Accounting principles
Acquisitions Businesses acquired during the period have been combined in the con-solidated financial statements from the date when Group has obtained control of the business and divested businesses up to the date when control has ceased. The acquisition consideration, includ-ing deferred and contingent consider-ation, as well as the identifiable assets acquired, and liabilities assumed, are measured at the acquisition date fair values. The acquisition related costs are recognized as expenses for the period in which they are incurred.
At the acquisition date, any non-controlling interest is measured either at the acquisition date fair value or at non-controlling interest’s proportionate share in the recognized amounts of the identifiable net assets.
Assets and liabilities of the acquired businesses, MEUR
Jan 1–Dec 31, 2020
Jan 1–Dec 31, 2019
Maintenance contracts 26.6 22.3
Other intangible assets 1.3 -
Tangible assets 0.5 0.2
Deferred tax assets 0.1 0.0
Inventories 1.0 0.6
Accounts receivables and other assets 3.6 4.8
Cash and cash equivalents and other interest-bearing receivables 1.5 2.9
Total assets 34.5 30.8
Pension liabilities 1.6 0.6
Interest-bearing loans 0.6 1.7
Provisions 0.2 0.2
Deferred tax liabilities 3.9 1.6
Other liabilities 3.2 3.2
Total liabilities 9.4 7.4
Net assets 25.0 23.4
Acquisition cost paid in cash 21.7 25.4
Contingent and deferred consideration 7.3 10.6
Acquisition cost at date of acquisitions 29.0 36.0
Goodwill 4.0 12.6
Contingent considerations are typically realized in the amount initially recognized.
Changes in the acquisition cost occurred after the acquisition date and recognized in the statement of income totaled EUR 0.7 (0.6) million.
4.1 ACQUISITIONS
CONSOLIDATED FINANCIAL STATEMENTS | NOTES TO THE CONSOLIDATED FINANCIAL STATEMENTS | ACQUISITIONS AND CAPITAL EXPENDITURE
52
CONSOLIDATED FINANCIAL STATEMENTS | NOTES TO THE CONSOLIDATED FINANCIAL STATEMENTS | ACQUISITIONS AND CAPITAL EXPENDITURE
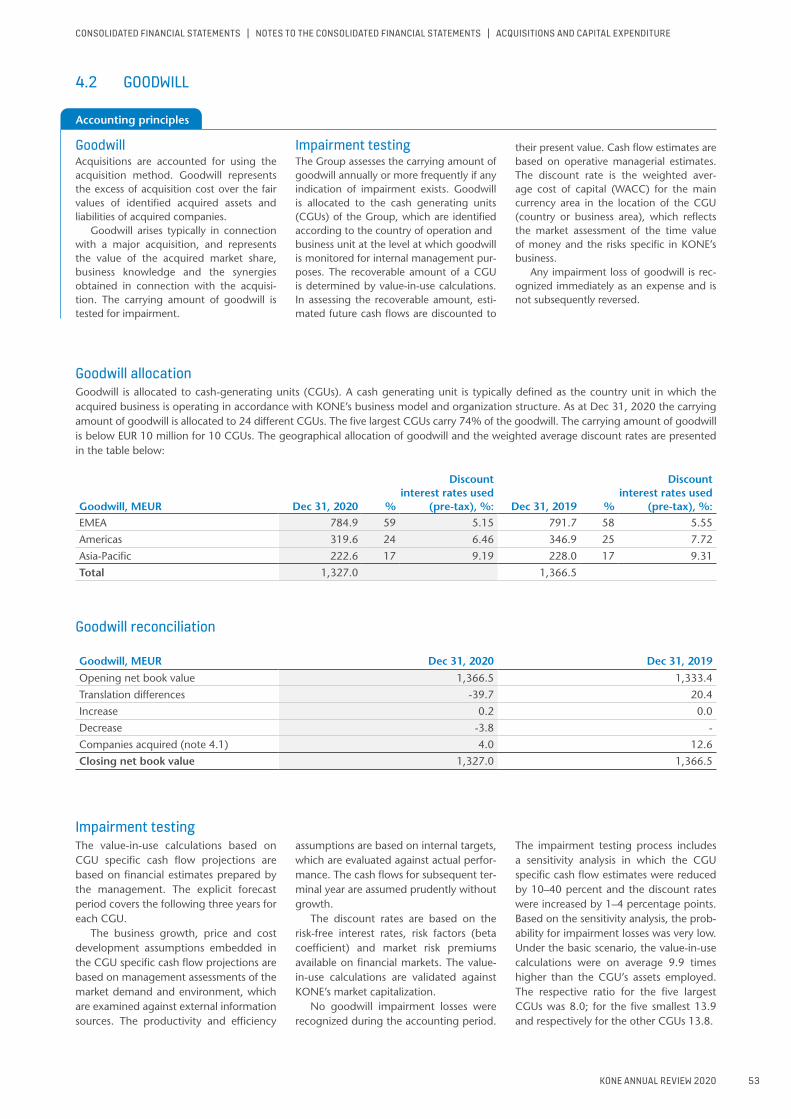
KONE ANNUAL REVIEW 2020
Accounting principles
4.2 GOODWILL
Goodwill allocationGoodwill is allocated to cash-generating units (CGUs). A cash generating unit is typically defined as the country unit in which the acquired business is operating in accordance with KONE’s business model and organization structure. As at Dec 31, 2020 the carrying amount of goodwill is allocated to 24 different CGUs. The five largest CGUs carry 74% of the goodwill. The carrying amount of goodwill is below EUR 10 million for 10 CGUs. The geographical allocation of goodwill and the weighted average discount rates are presented in the table below:
Goodwill, MEUR Dec 31, 2020 %
Discount interest rates used
(pre-tax), %: Dec 31, 2019 %
Discount interest rates used
(pre-tax), %:EMEA 784.9 59 5.15 791.7 58 5.55
Americas 319.6 24 6.46 346.9 25 7.72
Asia-Pacific 222.6 17 9.19 228.0 17 9.31
Total 1,327.0 1,366.5
Goodwill reconciliation
Goodwill, MEUR Dec 31, 2020 Dec 31, 2019
Opening net book value 1,366.5 1,333.4
Translation differences -39.7 20.4
Increase 0.2 0.0
Decrease -3.8 -
Companies acquired (note 4.1) 4.0 12.6
Closing net book value 1,327.0 1,366.5
Impairment testingThe value-in-use calculations based on CGU specific cash flow projections are based on financial estimates prepared by the management. The explicit forecast period covers the following three years for each CGU.
The business growth, price and cost development assumptions embedded in the CGU specific cash flow projections are based on management assessments of the market demand and environment, which are examined against external information sources. The productivity and efficiency
assumptions are based on internal targets, which are evaluated against actual perfor-mance. The cash flows for subsequent ter-minal year are assumed prudently without growth.
The discount rates are based on the risk-free interest rates, risk factors (beta coefficient) and market risk premiums available on financial markets. The value-in-use calculations are validated against KONE’s market capitalization.
No goodwill impairment losses were recognized during the accounting period.
The impairment testing process includes a sensitivity analysis in which the CGU specific cash flow estimates were reduced by 10–40 percent and the discount rates were increased by 1–4 percentage points. Based on the sensitivity analysis, the prob-ability for impairment losses was very low. Under the basic scenario, the value-in-use calculations were on average 9.9 times higher than the CGU’s assets employed. The respective ratio for the five largest CGUs was 8.0; for the five smallest 13.9 and respectively for the other CGUs 13.8.
Goodwill Acquisitions are accounted for using the acquisition method. Goodwill represents the excess of acquisition cost over the fair values of identified acquired assets and liabilities of acquired companies.
Goodwill arises typically in connection with a major acquisition, and represents the value of the acquired market share, business knowledge and the synergies obtained in connection with the acquisi-tion. The carrying amount of goodwill is tested for impairment.
Impairment testingThe Group assesses the carrying amount of goodwill annually or more frequently if any indication of impairment exists. Goodwill is allocated to the cash generating units (CGUs) of the Group, which are identified according to the country of operation and business unit at the level at which goodwill is monitored for internal management pur-poses. The recoverable amount of a CGU is determined by value-in-use calculations. In assessing the recoverable amount, esti-mated future cash flows are discounted to
their present value. Cash flow estimates are based on operative managerial estimates. The discount rate is the weighted aver-age cost of capital (WACC) for the main currency area in the location of the CGU (country or business area), which reflects the market assessment of the time value of money and the risks specific in KONE’s business.
Any impairment loss of goodwill is rec-ognized immediately as an expense and is not subsequently reversed.
CONSOLIDATED FINANCIAL STATEMENTS | NOTES TO THE CONSOLIDATED FINANCIAL STATEMENTS | ACQUISITIONS AND CAPITAL EXPENDITURE
53
CONSOLIDATED FINANCIAL STATEMENTS | NOTES TO THE CONSOLIDATED FINANCIAL STATEMENTS | ACQUISITIONS AND CAPITAL EXPENDITURE

KONE ANNUAL REVIEW 2020
Accounting principles
Intangible assetsIntangible assets identified in connec-tion with acquisitions are amortized on a straight-line basis over their expected useful lifetime. KONE often acquires small eleva-tor and door service companies, where the excess of consideration transferred over the net assets of the acquiree as at clos-
ing, are typically allocated to the acquired maintenance contracts. The acquired main-tenance contracts are typically amortized over ten years.
Intangible assets also include expen-diture on acquired patents, trademarks and licenses, including acquired software licenses. These assets are amortized on a
straight-line basis over their expected use-ful lifetime, which does not usually exceed five years. The carrying amount of any intangible asset is impairment tested (see impairment of assets accounting principles) when an indication of impairment exists.
4.3 INTANGIBLE ASSETS
Jan 1–Dec 31, 2020, MEURMaintenance
contracts Other Total
Jan 1, 2020:
Acquisition cost 416.3 273.0 689.2
Accumulated amortization and impairment -212.7 -228.3 -441.0
Opening net book value 203.5 44.7 248.2
Opening net book value 203.5 44.7 248.2
Translation differences -3.5 -2.0 -5.5
Increase 0.1 9.3 9.4
Decrease - -0.1 -0.1
Reclassifications - -8.3 -8.3
Companies acquired (note 4.1) 26.6 1.3 27.9
Amortization -36.8 -11.6 -48.4
Closing net book value 190.0 33.2 223.2
Dec 31, 2020
Acquisition cost 439.5 261.8 701.3
Accumulated amortization and impairment -249.5 -228.6 -478.1
Closing net book value 190.0 33.2 223.2
Jan 1–Dec 31, 2019, MEURMaintenance
contracts Other Total
Jan 1, 2019:
Acquisition cost 388.3 264.4 652.8
Accumulated amortization and impairment -176.6 -216.0 -392.6
Opening net book value 211.8 48.4 260.2
Opening net book value 211.8 48.4 260.2
Translation differences 5.1 0.2 5.3
Increase 0.8 9.6 10.4
Decrease -0.2 -0.2 -0.4
Reclassifications - 0.2 0.2
Companies acquired (note 4.1) 22.3 0.1 22.4
Amortization -36.2 -13.7 -49.9
Closing net book value 203.5 44.7 248.2
Dec 31, 2019
Acquisition cost 416.3 273.0 689.2
Accumulated amortization and impairment -212.7 -228.3 -441.0
Closing net book value 203.5 44.7 248.2
CONSOLIDATED FINANCIAL STATEMENTS | NOTES TO THE CONSOLIDATED FINANCIAL STATEMENTS | ACQUISITIONS AND CAPITAL EXPENDITURE
54
CONSOLIDATED FINANCIAL STATEMENTS | NOTES TO THE CONSOLIDATED FINANCIAL STATEMENTS | ACQUISITIONS AND CAPITAL EXPENDITURE

KONE ANNUAL REVIEW 2020
Accounting principles
4.4 TANGIBLE ASSETS
Jan 1–Dec 31, 2020, MEUR Land Buildings
Buildings,leased for
own use
Machinery & equip-
ment
Machinery & equipment,
leased for own use
Fixed assets under
construction Advance
payments Total
Jan 1, 2020:
Acquisition cost 6.8 302.1 301.4 610.4 200.2 5.3 4.4 1,430.6
Accumulated depreciation 0.0 -120.9 -69.1 -432.2 -66.1 0.0 0.0 -688.4
Net book value 6.8 181.2 232.3 178.1 134.1 5.3 4.4 742.2
Opening net book value 6.8 181.2 232.3 178.1 134.1 5.3 4.4 742.2
Translation differences -0.1 -6.4 -8.8 -7.4 -4.9 -0.4 -0.1 -28.2
Increase 0.1 7.7 58.2 57.7 55.1 10.1 2.7 191.6
Decrease -0.1 -0.3 -6.0 -1.8 -3.3 -0.9 -1.2 -13.6
Reclassifications - 10.7 0.0 3.7 0.2 -3.6 -2.6 8.3
Companies acquired (note 4.1) - 0.2 - 0.2 - - - 0.5
Depreciation 0.0 -13.6 -59.6 -55.8 -61.7 - - -190.7
Closing net book value 6.7 179.6 216.1 174.7 119.3 10.6 3.2 710.0
Dec 31, 2020:
Acquisition cost 6.7 317.3 321.6 602.2 208.6 10.6 3.2 1,470.3
Accumulated depreciation 0.0 -137.7 -105.5 -427.6 -89.4 0.0 0.0 -760.2
Net book value 6.7 179.6 216.1 174.7 119.2 10.6 3.2 710.0
During the period of Jan 1–Dec 31, 2020, capital expenditure on production facilities, customer service of sales and maintenance opera-tions as well as on information systems, including new assets recognized for lease agreements, totaled to EUR 201.0 (200.5) million. Capital expenditure on leases consists mainly of maintenance vehicles and office facilities.
Lease payments in cash flow in 2020 totaled to EUR -117.9 (-108.4) million.
Property, plant and equipmentProperty, plant and equipment are mea-sured at cost less accumulated depreciation and any impairment losses, when appli-cable. Depreciation is recognized on a straight-line basis over the economic useful lives of the assets or over the lease contract period, if shorter. Economic useful lives are as follows:
Buildings 5–40 yearsMachinery and equipment 4–10 years
Land is not depreciated.
Expenditure on repairs and maintenance of property, plant and equipment is recog-nized as expense when incurred.
LeasesAs a lessee, KONE recognizes a right-of-use asset representing its right to use
the underlying asset and a lease liability representing its obligation to make lease payments, amounting to the present value of the future lease payments. The value of right-of-use asset corresponds the value of future lease payments at the inception of the lease, discounted with the incremental borrowing rate.
Right-of-use assets are depreciated over the contract period or over the useful life of the asset, which is the shorter. An option to extend or terminate the lease contract is included to the lease period when exercising such option is considered highly probable. The cost arising from short-term leases and leases of low value assets are recognized as an expense on a straight-line basis over the contract period.
Impairment of assetsThe carrying amounts of non-current tangible assets and intangible assets are
reviewed for impairment at each reporting date or whenever there is indication of that the carrying value of the asset may not be recoverable. Impairment test involves estimating the recoverable amount of the asset, subject to testing. The recoverable amount is the higher of the asset’s fair value less cost of disposal and the value in use. An impairment loss is recognized in the statement of income whenever the carrying amount exceeds the recoverable amount.
A previously recognized impairment loss is reversed only if there has been a significant change in the estimates used to determine the recoverable amount, but not, however, to an amount higher than the carrying amount that would have been determined without the impairment loss recognized in prior years, deducted by accumulated depreciation.
CONSOLIDATED FINANCIAL STATEMENTS | NOTES TO THE CONSOLIDATED FINANCIAL STATEMENTS | ACQUISITIONS AND CAPITAL EXPENDITURE
55
CONSOLIDATED FINANCIAL STATEMENTS | NOTES TO THE CONSOLIDATED FINANCIAL STATEMENTS | ACQUISITIONS AND CAPITAL EXPENDITURE
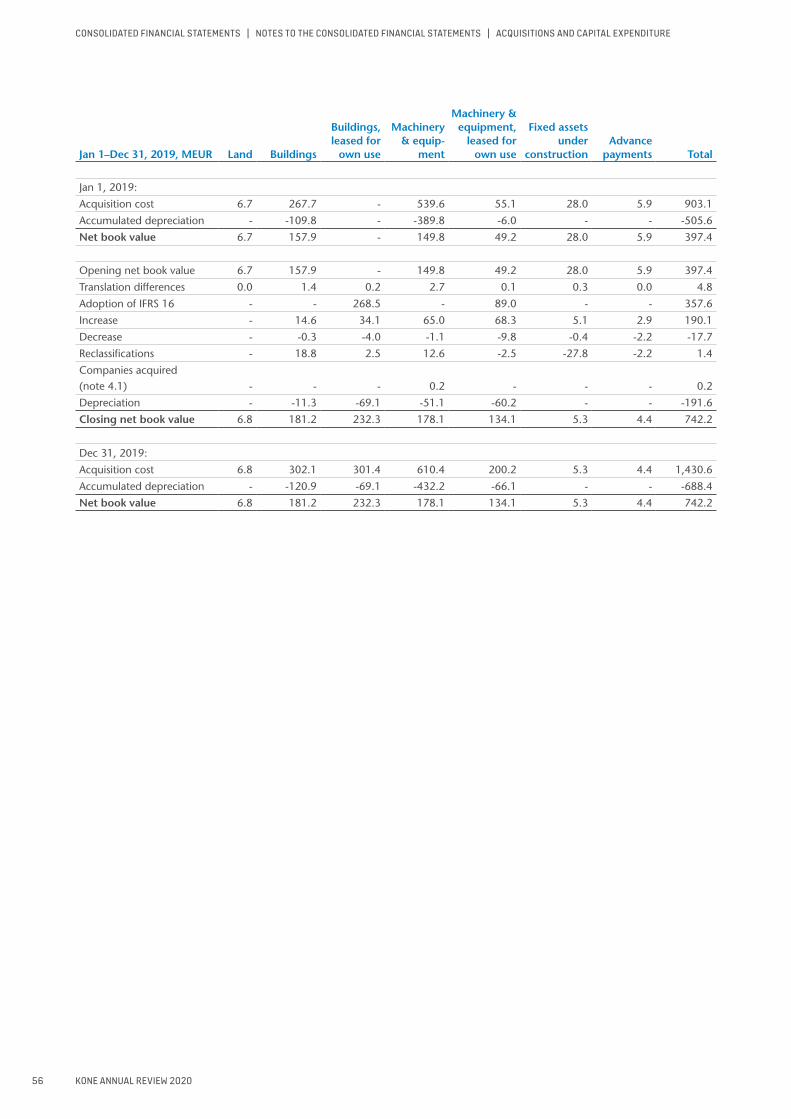
KONE ANNUAL REVIEW 2020
Jan 1–Dec 31, 2019, MEUR Land Buildings
Buildings,leased for
own use
Machinery & equip-
ment
Machinery & equipment,
leased for own use
Fixed assets under
construction Advance
payments Total
Jan 1, 2019:
Acquisition cost 6.7 267.7 - 539.6 55.1 28.0 5.9 903.1
Accumulated depreciation - -109.8 - -389.8 -6.0 - - -505.6
Net book value 6.7 157.9 - 149.8 49.2 28.0 5.9 397.4
Opening net book value 6.7 157.9 - 149.8 49.2 28.0 5.9 397.4
Translation differences 0.0 1.4 0.2 2.7 0.1 0.3 0.0 4.8
Adoption of IFRS 16 - - 268.5 - 89.0 - - 357.6
Increase - 14.6 34.1 65.0 68.3 5.1 2.9 190.1
Decrease - -0.3 -4.0 -1.1 -9.8 -0.4 -2.2 -17.7
Reclassifications - 18.8 2.5 12.6 -2.5 -27.8 -2.2 1.4
Companies acquired (note 4.1) - - - 0.2 - - - 0.2
Depreciation - -11.3 -69.1 -51.1 -60.2 - - -191.6
Closing net book value 6.8 181.2 232.3 178.1 134.1 5.3 4.4 742.2
Dec 31, 2019:
Acquisition cost 6.8 302.1 301.4 610.4 200.2 5.3 4.4 1,430.6
Accumulated depreciation - -120.9 -69.1 -432.2 -66.1 - - -688.4
Net book value 6.8 181.2 232.3 178.1 134.1 5.3 4.4 742.2
CONSOLIDATED FINANCIAL STATEMENTS | NOTES TO THE CONSOLIDATED FINANCIAL STATEMENTS | ACQUISITIONS AND CAPITAL EXPENDITURE
56
CONSOLIDATED FINANCIAL STATEMENTS | NOTES TO THE CONSOLIDATED FINANCIAL STATEMENTS | ACQUISITIONS AND CAPITAL EXPENDITURE

5
KONE ANNUAL REVIEW 2020
MEUR -1,954KONE’S INTEREST-BEARING NET DEBT
EUR 6.12EQUITY PER SHARE
IN THIS SECTION
This section comprises the following notes, which describe capital structure of KONE for 2020:
5.1 Capital management5.2 Shareholders’ equity5.3 Financial risks and instruments5.4 Shares and other non-current
financial assets5.5 Deposits and loans receivable5.6 Commitments5.7 Employee benefits
KONE’S CAPITAL STRUCTURE
• KONE’s cash position is strong due to the cash-generative business model including advance payments-driven operating model.
• KONE has not defined a specific target for its capital structure, but the aim is to ensure strong credit quality to provide for example access to external fund-ing sources and to support the growth ambitions of the business.
CAPITAL STRUCTURE
CONSOLIDATED FINANCIAL STATEMENTS | NOTES TO THE CONSOLIDATED FINANCIAL STATEMENTS | CAPITAL STRUCTURE
57
CONSOLIDATED FINANCIAL STATEMENTS | NOTES TO THE CONSOLIDATED FINANCIAL STATEMENTS | CAPITAL STRUCTURE
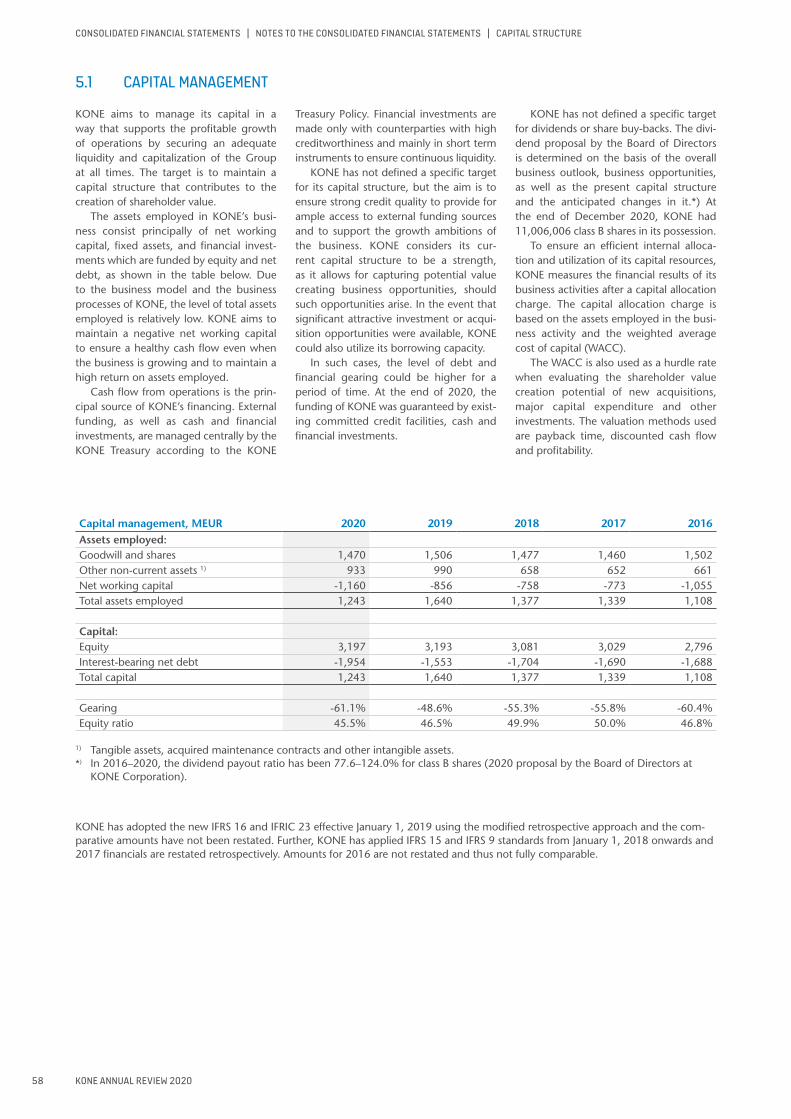
KONE ANNUAL REVIEW 2020
5.1 CAPITAL MANAGEMENT
KONE aims to manage its capital in a way that supports the profitable growth of operations by securing an adequate liquidity and capitalization of the Group at all times. The target is to maintain a capital structure that contributes to the creation of shareholder value.
The assets employed in KONE’s busi-ness consist principally of net working capital, fixed assets, and financial invest-ments which are funded by equity and net debt, as shown in the table below. Due to the business model and the business processes of KONE, the level of total assets employed is relatively low. KONE aims to maintain a negative net working capital to ensure a healthy cash flow even when the business is growing and to maintain a high return on assets employed.
Cash flow from operations is the prin-cipal source of KONE’s financing. External funding, as well as cash and financial investments, are managed centrally by the KONE Treasury according to the KONE
Treasury Policy. Financial investments are made only with counterparties with high creditworthiness and mainly in short term instruments to ensure continuous liquidity.
KONE has not defined a specific target for its capital structure, but the aim is to ensure strong credit quality to provide for ample access to external funding sources and to support the growth ambitions of the business. KONE considers its cur-rent capital structure to be a strength, as it allows for capturing potential value creating business opportunities, should such opportunities arise. In the event that significant attractive investment or acqui-sition opportunities were available, KONE could also utilize its borrowing capacity.
In such cases, the level of debt and financial gearing could be higher for a period of time. At the end of 2020, the funding of KONE was guaranteed by exist-ing committed credit facilities, cash and financial investments.
KONE has not defined a specific target for dividends or share buy-backs. The divi-dend proposal by the Board of Directors is determined on the basis of the overall business outlook, business opportunities, as well as the present capital structure and the anticipated changes in it.*) At the end of December 2020, KONE had 11,006,006 class B shares in its possession.
To ensure an efficient internal alloca-tion and utilization of its capital resources, KONE measures the financial results of its business activities after a capital allocation charge. The capital allocation charge is based on the assets employed in the busi-ness activity and the weighted average cost of capital (WACC).
The WACC is also used as a hurdle rate when evaluating the shareholder value creation potential of new acquisitions, major capital expenditure and other investments. The valuation methods used are payback time, discounted cash flow and profitability.
Capital management, MEUR 2020 2019 2018 2017 2016Assets employed:Goodwill and shares 1,470 1,506 1,477 1,460 1,502Other non-current assets 1) 933 990 658 652 661Net working capital -1,160 -856 -758 -773 -1,055Total assets employed 1,243 1,640 1,377 1,339 1,108
Capital:Equity 3,197 3,193 3,081 3,029 2,796Interest-bearing net debt -1,954 -1,553 -1,704 -1,690 -1,688Total capital 1,243 1,640 1,377 1,339 1,108
Gearing -61.1% -48.6% -55.3% -55.8% -60.4%Equity ratio 45.5% 46.5% 49.9% 50.0% 46.8%
1) Tangible assets, acquired maintenance contracts and other intangible assets. *) In 2016–2020, the dividend payout ratio has been 77.6–124.0% for class B shares (2020 proposal by the Board of Directors at
KONE Corporation).
KONE has adopted the new IFRS 16 and IFRIC 23 effective January 1, 2019 using the modified retrospective approach and the com-parative amounts have not been restated. Further, KONE has applied IFRS 15 and IFRS 9 standards from January 1, 2018 onwards and 2017 financials are restated retrospectively. Amounts for 2016 are not restated and thus not fully comparable.
CONSOLIDATED FINANCIAL STATEMENTS | NOTES TO THE CONSOLIDATED FINANCIAL STATEMENTS | CAPITAL STRUCTURE
58
CONSOLIDATED FINANCIAL STATEMENTS | NOTES TO THE CONSOLIDATED FINANCIAL STATEMENTS | CAPITAL STRUCTURE
KONE ANNUAL REVIEW 2020
Accounting principles
Shares and share capitalAt the end of the 2020 financial year, the number of shares outstanding was 529,395,860. The share capital was EUR 66 million and the total number of votes was 121,527,427. Each class A share is assigned one vote, as is each block of 10 class B shares, with the provision that each shareholder is entitled to at least one vote. At the end of the financial year, the Board of Directors of KONE Corpora-tion had a valid authorization granted by the Annual General Meeting in February 2020 to increase the share capital and
to issue stock options. The authorization shall remain in effect until the conclusion of the following annual general meeting, however at the latest until 30 June 2021.
In accordance with the Articles of Asso-ciation, class B shares are preferred for a dividend which is at least 1% and no more than 2.5% higher than the dividend paid to the holders of class A shares, calculated based on the amount obtained by divid-ing the share capital entered into the Trade Register by the number of shares entered into the Trade Register.
During 2020 there were no changes in the share capital of KONE Corpora-tion. In 2019, share capital increased by 1,303,193 or EUR 0.2 million through subscription of Class B shares with 2015 options.
Equity and profit distribution The total shareholders’ equity consists of the share capital, the share premium account, the fair value and other reserves, translation differences, the paid-up unre-stricted equity reserve, remeasurements of employee benefits and retained earn-ings. When options are exercised and if new shares are issued, the impacts of changes in the share capital, which exceed the accounting par value of the shares, are included in the paid-up unrestricted equity reserve. If treasury shares are used in subscriptions with option rights, the subscription price is included in the paid-up unrestricted equity reserve. The fair value and other reserves include changes in the
fair value of cash flow hedges. Differences arising from the application of the acquisi-tion method on the translation of the net investment in foreign subsidiaries and asso-ciated companies are recognized as transla-tion differences. Exchange rate differences resulting from financial instruments intended as hedges of the net assets in foreign subsidiaries are also recognized as translation differences. Actuarial gains and losses arising from revaluation of employee benefits are recognized as remeasurements of employee benefits. The purchase price of own shares purchased by KONE Corpora-tion is deducted from retained earnings. The net income for the accounting period is recognized directly in retained earnings.
When KONE purchases its own shares, the consideration paid and costs directly attributable to the purchase transaction are recognized as a deduction in equity. When such shares are sold, the consideration received, net of directly attributable trans-action costs, is included in equity.
Profit distribution includes dividends and donations decided by the Sharehold-ers’ Meeting. The dividend and distribution of profits proposed by the Board of Direc-tors of KONE Corporation for the financial year ended, is not deducted from the equity prior to acceptance by a Sharehold-ers’ Meeting.
5.2 SHAREHOLDERS’ EQUITY
More information
Please, refer to section 6.2 for more information on share-based incentive plans and options.
CONSOLIDATED FINANCIAL STATEMENTS | NOTES TO THE CONSOLIDATED FINANCIAL STATEMENTS | CAPITAL STRUCTURE
59
CONSOLIDATED FINANCIAL STATEMENTS | NOTES TO THE CONSOLIDATED FINANCIAL STATEMENTS | CAPITAL STRUCTURE

KONE ANNUAL REVIEW 2020
Authority to purchase own sharesKONE Corporation’s Annual General Meeting held on February 25, 2020 authorized the Board of Directors to repurchase the company’s own shares. The shares may be repurchased among others in order to develop the capital structure of the Company, finance or carry out possible acquisitions, implement the Company’s share-based incentive plans,
or to be transferred for other purposes or to be cancelled. Altogether no more than 52,930,000 shares may be repurchased, of which no more than 7,620,000 are to be class A shares and 45,310,000 class B shares, taking into consideration the provi-sions of the Companies Act regarding the maximum amount of own shares that the Company is allowed to possess.
The minimum and maximum consid-eration for the shares to be purchased is determined for both class A and class B shares on the basis of the trading price for class B shares determined on the Nasdaq Helsinki Ltd. on the time of purchase.
During the financial year 2020, KONE did not repurchase own shares.
Own sharesNumber of shares Cost, MEUR
Jan 1, 2020 11,553,605 185.1
Distributed to the share-based incentive plan, January -217,499 -8.2
Distributed to the annual compensation of the Board, April -3,315 -0.1
Distributed to the share-based incentive plan, April -294,497 -11.0
Distributed to the share-based incentive plan, May -38,013 -1.4
Returned from the share-based incentive plan, April 3,487 0.1
Returned from the share-based incentive plan, December 2,238 0.1
Dec 31, 2020 11,006,006 164.7
Jan 1, 2019 12,031,814 203.3
Distributed to the share-based incentive plan, January -217,899 -8.5
Distributed to the annual compensation of the Board, April -2,866 -0.1
Distributed to the share-based incentive plan, April -262,676 -9.8
Returned from the share-based incentive plan, August 1,744 0.1
Returned from the share-based incentive plan, December 3,488 0.1
Dec 31, 2019 11,553,605 185.1
Reconciliation of own shares, Dec 31, 2020
KONE Corporation and Group total pcs Acquisition cost Average price
Dec 31, 2019 11,553,605 185,110,965.32 16.02
January 29, 2020 -217,499 -8,159,470.77 37.51
April 28, 2020 -3,315 -122,156.59 36.85
April 28, 2020 -294,497 -10,978,976.56 37.28
April 28, 2020 3,487 -1,400,765.81 37.09
May 19, 2020 -38,013 129,325.23 36.85
December 17, 2020 2,238 83,002.54 37.09
Dec 31, 2020 11,006,006 164,661,923.36 14.96
CONSOLIDATED FINANCIAL STATEMENTS | NOTES TO THE CONSOLIDATED FINANCIAL STATEMENTS | CAPITAL STRUCTURE
60
CONSOLIDATED FINANCIAL STATEMENTS | NOTES TO THE CONSOLIDATED FINANCIAL STATEMENTS | CAPITAL STRUCTURE

KONE ANNUAL REVIEW 2020
Accounting principles
5.3 FINANCIAL RISKS AND INSTRUMENTS
Derivative financial instruments and hedge accountingDerivative financial instruments are initially and subsequently recognized at fair value in the statement of financial position. The fair values of foreign exchange forward contracts are calculated by discounting the future cash flows of the contracts with the relevant market interest rate yield curves on the valuation date and by calculating the difference between the discounted values as at the forward contract date and balance sheet date in euros.
At the contract date the derivatives are classified according to the foreign exchange policy as hedging instruments of a business transaction arising from a firm or highly probable purchase or sales contract. These are partly included in cash flow hedge accounting, hedges against fair value changes of assets or liabilities or hedges of net investments in foreign enti-ties.
In cash flow hedge accounting KONE uses foreign currency forward contracts to hedge its exposure in foreign currency dominated cash flows which ensures economic relationship between the hedged item and the hedging instrument and full effectiveness as the value of the hedging instrument and the value of the hedged item move in the opposite direc-tion because of the common underlying denominator. The full fair value of deriva-tives including transaction related forward points, is designated in the hedging rela-tionship.
The effective portion of changes in the fair values of the foreign exchange deriva-tives initiated for hedging firm or highly probable future purchase or sales transac-tions is recognized through the statement of comprehensive income to the hedge reserve within equity. The cumulative changes of fair values are transferred into the statement of income as adjustment items to sales or purchases simultaneously when the hedged sale or purchase realizes.
When cash flow hedge accounting is applied, at the inception of the hedging transaction the economic relationship between hedging instruments and hedged items is documented including whether the hedging instrument is expected to offset changes in cash flows of hedged items. Also, the risk management objective and strategy for undertaking various hedge transactions is documented at the incep-tion of each hedge relationship. Hedge
effectiveness is assessed before hedge accounting is applied and at least on a quarterly basis thereafter.
The gain or loss relating to the inef-fective portion is recognized immediately as an adjustment to cost and expenses. In hedges of foreign currency transaction, ineffectiveness may arise if the timing of the forecast transaction changes from what was originally estimated. If a foreign exchange derivative included in the cash flow hedge accounting expires or is sold or when a hedge no longer meets the criteria for hedge accounting, the cumula-tive change in the fair value of the hedging instrument will remain in the hedge reserve and is recognized in the income statement at the same time with the hedged sale or purchase. The cumulative fair values of the hedging instruments are transferred from the hedge reserve to adjust cost and expenses immediately if the hedged cash flow is no longer expected to occur.
The changes in the fair values of deriva-tives that are designated as hedging instru-ments but are not accounted for accord-ing to the principles of cash flow hedge accounting are recognized based on their nature either in the operative income or costs, or as financial income or expenses: if the hedged risk arises from an operative transaction, the fair values of the hedging instruments are recognized in costs and expenses, and if the hedged item is a mon-etary item, the fair values are recognized in financing items.
Changes in the fair values of foreign exchange derivatives are recognized in financing income and expenses if the hedged item is a loan receivable, deposit or a financial asset or liability denominated in a foreign currency.
The effective portion of the change in the fair values of currency forward contracts hedging translation differences arising from net investments in foreign subsidiaries, are recognized through the statement of comprehensive income to the translation differences within equity and would be transferred to the income statement in case the net investment were disposed of partially or in its entirety. The hedged risk is designated as movements in the spot rate (excluding changes due to interest rates i.e. forward points). Changes in fair value of the hedging instrument due to the forward points (cost of hedging) are immediately recognized in the consolidated statement of income.
Fair values of derivative instruments are recognized under current assets and liabili-ties in the balance sheet.
LoansLoans payable are classified in the valuation category other financial liabilities. They are measured initially at fair value net of directly attributable transaction costs incurred and are subsequently carried at amortized cost using the effective interest rate method. Lease liabilities are measured to the present value of future lease payments discounted with the incremental borrowing rate.
Financial assetsFinancial assets are classified into three categories: measured at amortized cost, at fair value through other comprehensive income (FVOCI) and at fair value through profit or loss.
The classification is made at the time of the original acquisition based on the objective of the business model and the characteristics of contractual cash flows of the investment.
KONE assesses on a forward looking basis the expected credit losses associated with its assets carried at amortized cost. The impairment methodology applied depends on whether there has been a sig-nificant increase in credit risk. All of these financial assets are considered to have low credit risk, and thus the impairment provi-sion assessment is based on 12 months expected losses.
Current deposits and loans receivableCurrent deposits and loans receivable are initially recognized at fair value and there-after at amortized cost using the effective interest rate method except for interest rate funds which are classified and measured as investments at fair value through profit or loss. Only substantial transaction costs are considered for when measuring the acquisi-tion cost.
Investments in commercial papers, short-term bank deposits, interest rate funds and other money market instruments are included in deposits and loans receiv-able.
Cash and cash equivalentsCash and cash equivalents include cash-in-hand and bank account balances. Bank overdrafts are included in other current liabilities.
KONE’s business activities are exposed to financial risks such as foreign exchange risks, interest rate risks, liquidity risks and credit risks. These financial risks are man-
aged as part of the total KONE risk port-folio. KONE Treasury is responsible for the centralized management of financial risks in accordance with the KONE Treasury
Policy approved by the Board of Direc-tors. KONE business units manage their financial risks locally in accordance with the KONE Treasury Policy.
CONSOLIDATED FINANCIAL STATEMENTS | NOTES TO THE CONSOLIDATED FINANCIAL STATEMENTS | CAPITAL STRUCTURE
61
CONSOLIDATED FINANCIAL STATEMENTS | NOTES TO THE CONSOLIDATED FINANCIAL STATEMENTS | CAPITAL STRUCTURE
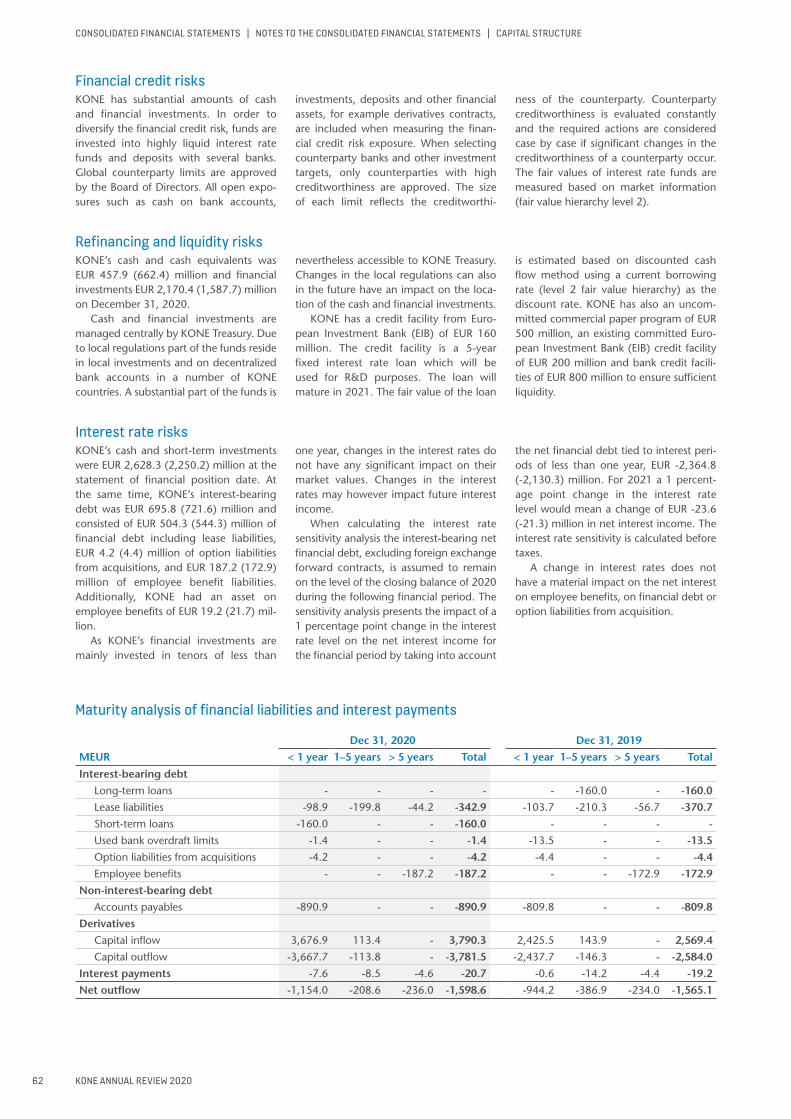
KONE ANNUAL REVIEW 2020
Maturity analysis of financial liabilities and interest payments
Dec 31, 2020 Dec 31, 2019
MEUR < 1 year 1–5 years > 5 years Total < 1 year 1–5 years > 5 years Total
Interest-bearing debt
Long-term loans - - - - - -160.0 - -160.0
Lease liabilities -98.9 -199.8 -44.2 -342.9 -103.7 -210.3 -56.7 -370.7
Short-term loans -160.0 - - -160.0 - - - -
Used bank overdraft limits -1.4 - - -1.4 -13.5 - - -13.5
Option liabilities from acquisitions -4.2 - - -4.2 -4.4 - - -4.4
Employee benefits - - -187.2 -187.2 - - -172.9 -172.9
Non-interest-bearing debt
Accounts payables -890.9 - - -890.9 -809.8 - - -809.8
Derivatives
Capital inflow 3,676.9 113.4 - 3,790.3 2,425.5 143.9 - 2,569.4
Capital outflow -3,667.7 -113.8 - -3,781.5 -2,437.7 -146.3 - -2,584.0
Interest payments -7.6 -8.5 -4.6 -20.7 -0.6 -14.2 -4.4 -19.2
Net outflow -1,154.0 -208.6 -236.0 -1,598.6 -944.2 -386.9 -234.0 -1,565.1
Financial credit risksKONE has substantial amounts of cash and financial investments. In order to diversify the financial credit risk, funds are invested into highly liquid interest rate funds and deposits with several banks. Global counterparty limits are approved by the Board of Directors. All open expo-sures such as cash on bank accounts,
investments, deposits and other financial assets, for example derivatives contracts, are included when measuring the finan-cial credit risk exposure. When selecting counterparty banks and other investment targets, only counterparties with high creditworthiness are approved. The size of each limit reflects the creditworthi-
ness of the counterparty. Counterparty creditworthiness is evaluated constantly and the required actions are considered case by case if significant changes in the creditworthiness of a counterparty occur. The fair values of interest rate funds are measured based on market information (fair value hierarchy level 2).
Refinancing and liquidity risksKONE’s cash and cash equivalents was EUR 457.9 (662.4) million and financial investments EUR 2,170.4 (1,587.7) million on December 31, 2020.
Cash and financial investments are managed centrally by KONE Treasury. Due to local regulations part of the funds reside in local investments and on decentralized bank accounts in a number of KONE countries. A substantial part of the funds is
nevertheless accessible to KONE Treasury. Changes in the local regulations can also in the future have an impact on the loca-tion of the cash and financial investments.
KONE has a credit facility from Euro-pean Investment Bank (EIB) of EUR 160 million. The credit facility is a 5-year fixed interest rate loan which will be used for R&D purposes. The loan will mature in 2021. The fair value of the loan
is estimated based on discounted cash flow method using a current borrowing rate (level 2 fair value hierarchy) as the discount rate. KONE has also an uncom-mitted commercial paper program of EUR 500 million, an existing committed Euro-pean Investment Bank (EIB) credit facility of EUR 200 million and bank credit facili-ties of EUR 800 million to ensure sufficient liquidity.
Interest rate risksKONE’s cash and short-term investments were EUR 2,628.3 (2,250.2) million at the statement of financial position date. At the same time, KONE’s interest-bearing debt was EUR 695.8 (721.6) million and consisted of EUR 504.3 (544.3) million of financial debt including lease liabilities, EUR 4.2 (4.4) million of option liabilities from acquisitions, and EUR 187.2 (172.9) million of employee benefit liabilities. Additionally, KONE had an asset on employee benefits of EUR 19.2 (21.7) mil-lion.
As KONE’s financial investments are mainly invested in tenors of less than
one year, changes in the interest rates do not have any significant impact on their market values. Changes in the interest rates may however impact future interest income.
When calculating the interest rate sensitivity analysis the interest-bearing net financial debt, excluding foreign exchange forward contracts, is assumed to remain on the level of the closing balance of 2020 during the following financial period. The sensitivity analysis presents the impact of a 1 percentage point change in the interest rate level on the net interest income for the financial period by taking into account
the net financial debt tied to interest peri-ods of less than one year, EUR -2,364.8 (-2,130.3) million. For 2021 a 1 percent-age point change in the interest rate level would mean a change of EUR -23.6 (-21.3) million in net interest income. The interest rate sensitivity is calculated before taxes.
A change in interest rates does not have a material impact on the net interest on employee benefits, on financial debt or option liabilities from acquisition.
CONSOLIDATED FINANCIAL STATEMENTS | NOTES TO THE CONSOLIDATED FINANCIAL STATEMENTS | CAPITAL STRUCTURE
62
CONSOLIDATED FINANCIAL STATEMENTS | NOTES TO THE CONSOLIDATED FINANCIAL STATEMENTS | CAPITAL STRUCTURE

KONE ANNUAL REVIEW 2020
Values of financial assets and liabilities by categories
Dec 31, 2020, MEUR Not
es
Mea
sure
d
at f
air
valu
e th
roug
h p
rofi
t or
loss
Mea
sure
d a
t am
orti
zed
co
st
Mea
sure
d a
t fa
ir
valu
e th
roug
h
oth
er c
omp
re-
hen
sive
inco
me
Oth
er
Tota
l b
ook
valu
e
Non-current assetsShares and other non-current financial assets I 5.4 143.2 143.2Non-current loans receivable 5.5 1.0 1.0Employee benefits 5.7 19.2 19.2
Current assetsAccounts receivable 2,178.6 2,178.6Derivative assets 7.7 69.1 76.8Current deposits and loans receivable I 5.5 1,790.1 381.3 2,171.4Cash and cash equivalents I 457.9 457.9
Total financial assets 1,797.9 3,018.9 212.2 19.2 5,048.2
Non-current liabilitiesLoans 1) I 244.0 244.0Employee benefits I 5.7 187.2 187.2
Current liabilitiesLoans 2) I 160.0 98.9 258.9Short-term loans and other liabilities I 1.4 1.4Option liabilities from acquisitions I 4.2 4.2Accounts payable 890.9 890.9Derivative liabilities 62.1 15.0 77.0Unpaid acquisition consideration 13.4 13.4
Total financial liabilities 66.3 1,050.9 15.0 545.0 1,677.1
1) Includes lease liabilities of EUR 244.0 million.2) Includes lease liabilities of EUR 98.9 million.
The fair values of the financial assets and liabilities are not materially different from their book values.Interest-bearing net debt comprises items marked with “ I “.
Dec 31, 2019, MEUR Not
es
Mea
sure
d
at f
air
valu
e th
roug
h p
rofi
t or
loss
Mea
sure
d a
t am
orti
zed
co
st
Mea
sure
d a
t fa
ir
valu
e th
roug
h
oth
er c
omp
re-
hen
sive
inco
me
Oth
er
Tota
l b
ook
valu
eNon-current assets
Shares and other non-current financial assets I 5.4 139.2 139.2Non-current loans receivable 5.5 0.8 0.8Employee benefits 5.7 21.7 21.7
Current assetsAccounts receivable 2,232.3 2,232.3Derivative assets 2.5 6.6 9.1Current deposits and loans receivable I 5.5 973.2 616.3 1,589.5Cash and cash equivalents I 662.4 662.4
Total financial assets 975.7 3,511.8 145.8 21.7 4,655.1
Non-current liabilitiesLoans 1) I 160.0 267.1 427.1Employee benefits I 5.7 172.9 172.9
Current liabilitiesLoans 2) I 103.7 103.7Short-term loans and other liabilities I 13.5 13.5Option liabilities from acquisitions I 4.4 4.4Accounts payable 809.8 809.8Derivative liabilities 3.1 22.6 25.7Unpaid acquisition consideration 13.4 13.4
Total financial liabilities 7.5 969.8 22.6 570.7 1,570.5
1) Includes lease liabilities of EUR 267.0 million.2) Includes lease liabilities of EUR 103.9 million.
The fair values of the financial assets and liabilities are not materially different from their book values.Interest-bearing net debt comprises items marked with “ I “.
CONSOLIDATED FINANCIAL STATEMENTS | NOTES TO THE CONSOLIDATED FINANCIAL STATEMENTS | CAPITAL STRUCTURE
63
CONSOLIDATED FINANCIAL STATEMENTS | NOTES TO THE CONSOLIDATED FINANCIAL STATEMENTS | CAPITAL STRUCTURE
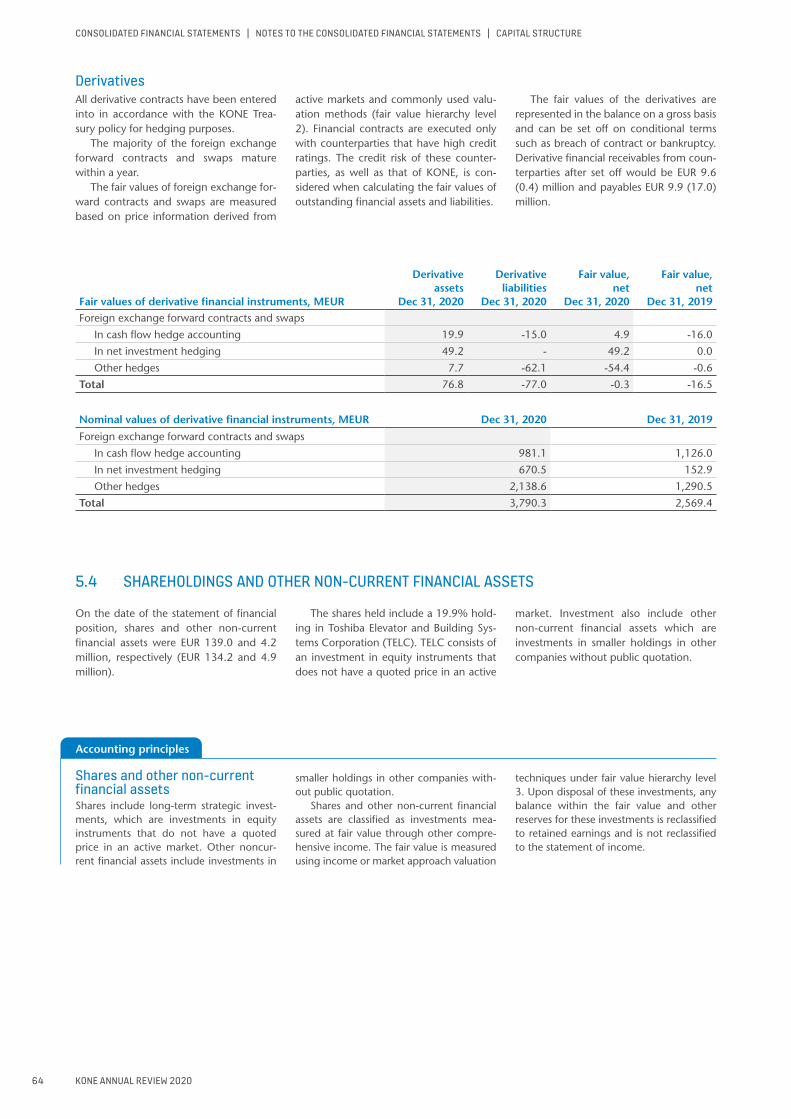
KONE ANNUAL REVIEW 2020
Accounting principles
DerivativesAll derivative contracts have been entered into in accordance with the KONE Trea-sury policy for hedging purposes.
The majority of the foreign exchange forward contracts and swaps mature within a year.
The fair values of foreign exchange for-ward contracts and swaps are measured based on price information derived from
active markets and commonly used valu-ation methods (fair value hierarchy level 2). Financial contracts are executed only with counterparties that have high credit ratings. The credit risk of these counter-parties, as well as that of KONE, is con-sidered when calculating the fair values of outstanding financial assets and liabilities.
The fair values of the derivatives are represented in the balance on a gross basis and can be set off on conditional terms such as breach of contract or bankruptcy. Derivative financial receivables from coun-terparties after set off would be EUR 9.6 (0.4) million and payables EUR 9.9 (17.0) million.
Fair values of derivative financial instruments, MEUR
Derivative assets
Dec 31, 2020
Derivative liabilities
Dec 31, 2020
Fair value,net
Dec 31, 2020
Fair value,net
Dec 31, 2019Foreign exchange forward contracts and swaps
In cash flow hedge accounting 19.9 -15.0 4.9 -16.0
In net investment hedging 49.2 - 49.2 0.0
Other hedges 7.7 -62.1 -54.4 -0.6
Total 76.8 -77.0 -0.3 -16.5
Nominal values of derivative financial instruments, MEUR Dec 31, 2020 Dec 31, 2019
Foreign exchange forward contracts and swaps
In cash flow hedge accounting 981.1 1,126.0
In net investment hedging 670.5 152.9
Other hedges 2,138.6 1,290.5
Total 3,790.3 2,569.4
5.4 SHAREHOLDINGS AND OTHER NON-CURRENT FINANCIAL ASSETS
On the date of the statement of financial position, shares and other non-current financial assets were EUR 139.0 and 4.2 million, respectively (EUR 134.2 and 4.9 million).
The shares held include a 19.9% hold-ing in Toshiba Elevator and Building Sys-tems Corporation (TELC). TELC consists of an investment in equity instruments that does not have a quoted price in an active
market. Investment also include other non-current financial assets which are investments in smaller holdings in other companies without public quotation.
Shares and other non-current financial assetsShares include long-term strategic invest-ments, which are investments in equity instruments that do not have a quoted price in an active market. Other noncur-rent financial assets include investments in
smaller holdings in other companies with-out public quotation.
Shares and other non-current financial assets are classified as investments mea-sured at fair value through other compre-hensive income. The fair value is measured using income or market approach valuation
techniques under fair value hierarchy level 3. Upon disposal of these investments, any balance within the fair value and other reserves for these investments is reclassified to retained earnings and is not reclassified to the statement of income.
CONSOLIDATED FINANCIAL STATEMENTS | NOTES TO THE CONSOLIDATED FINANCIAL STATEMENTS | CAPITAL STRUCTURE
64
CONSOLIDATED FINANCIAL STATEMENTS | NOTES TO THE CONSOLIDATED FINANCIAL STATEMENTS | CAPITAL STRUCTURE
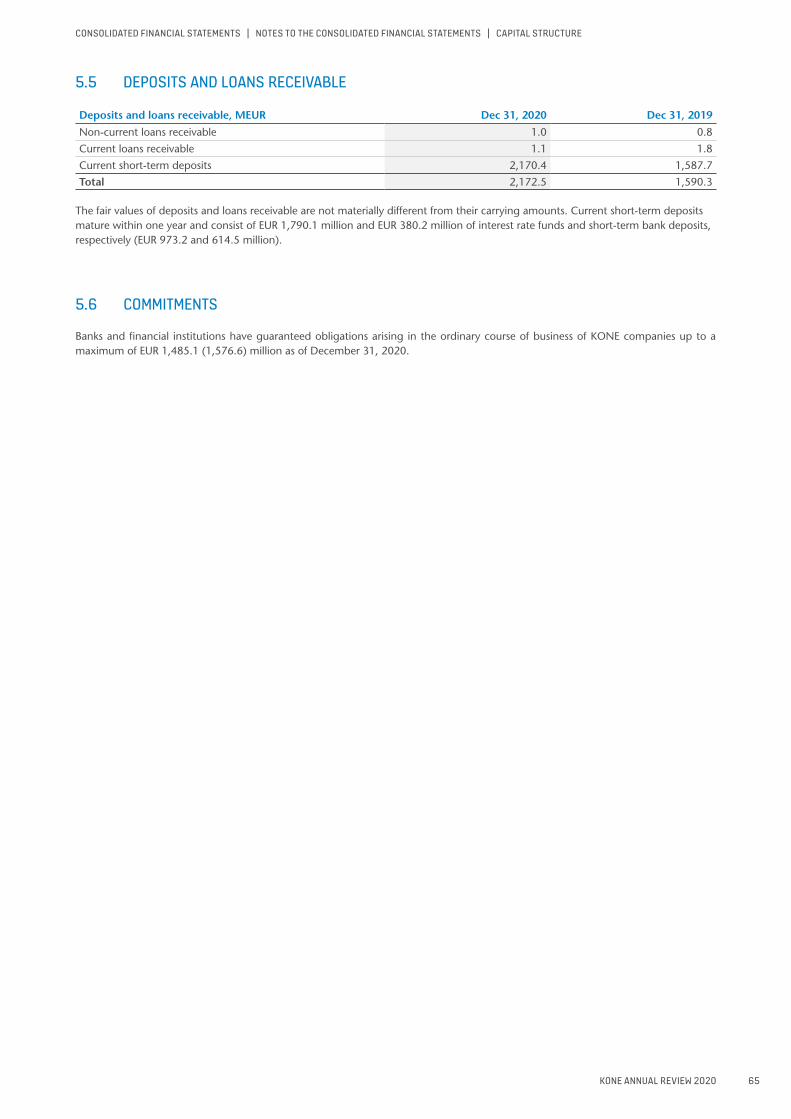
KONE ANNUAL REVIEW 2020
5.5 DEPOSITS AND LOANS RECEIVABLE
Deposits and loans receivable, MEUR Dec 31, 2020 Dec 31, 2019
Non-current loans receivable 1.0 0.8
Current loans receivable 1.1 1.8
Current short-term deposits 2,170.4 1,587.7
Total 2,172.5 1,590.3
The fair values of deposits and loans receivable are not materially different from their carrying amounts. Current short-term deposits mature within one year and consist of EUR 1,790.1 million and EUR 380.2 million of interest rate funds and short-term bank deposits, respectively (EUR 973.2 and 614.5 million).
5.6 COMMITMENTS
Banks and financial institutions have guaranteed obligations arising in the ordinary course of business of KONE companies up to a maximum of EUR 1,485.1 (1,576.6) million as of December 31, 2020.
CONSOLIDATED FINANCIAL STATEMENTS | NOTES TO THE CONSOLIDATED FINANCIAL STATEMENTS | CAPITAL STRUCTURE
65
CONSOLIDATED FINANCIAL STATEMENTS | NOTES TO THE CONSOLIDATED FINANCIAL STATEMENTS | CAPITAL STRUCTURE

KONE ANNUAL REVIEW 2020
Accounting principles
5.7 EMPLOYEE BENEFITS
Employee benefits The Group operates various employee benefit plans in accordance with local con-ditions and practices. The plans are classi-fied as either defined contribution plans or defined benefit plans. The pension plans are generally funded by payments from employees and by the relevant KONE com-panies. The assets of these plans are gener-ally held in separate insurance companies or trustee-administered funds. Pension costs and liabilities are based on calcula-tions by the local authorities or indepen-dent qualified actuaries. Contributions to the defined contribution plans are charged
directly to the statement of income in the year to which these contributions relate. For defined benefit plans, pension cost is determined based on the advice of quali-fied actuaries who carry out a full valuation of the plan on a regular basis using the projected unit credit method. Under this method, the costs of providing pensions are charged to the statement of income so as to spread the regular costs over the working lives of employees. KONE presents the service cost relating to defined benefit obligations in employment expenses while the net interest is presented in financing expenses.
The liability arising from the defined benefit post-employment plans is the present value of the defined benefit obliga-tion less the fair value of plan assets. The discount rates used in the actuarial calcu-lations of employee benefits liabilities are adjusted to market rates. Obligations to pay long-term disability benefit, the level of which is dependent on the length of service of the employee, are measured to reflect the probability that payments will be required and the length of service for which it is expected to be made.
KONE operates various employee benefit plans throughout the world. These plans include both defined contribution and defined benefit schemes. The pension benefits provided by KONE to its employ-ees are primarily organized through defined contribution plans.
KONE’s most significant funded defined benefit plans are in the United Kingdom and in the United States. Defined benefit pension plans are funded by KONE to satisfy local statutory funding requirements. The assets are managed by external fund managers. The funds are allocated between equities and fixed income instruments in order to provide return at target level and limited risk profile. The valuations of the obligations are carried out by independent qualified actuaries. The discount rates used in actu-arial calculations of the employee benefit liabilities are adjusted to market rates.
In the United Kingdom, the pension scheme is designed according to the Definitive Trust Deed and Rules and com-plies with the guidelines of the UK Pension Regulator. The pension scheme has been closed for new members as of March 2002 and is managed through KONE Pension Trustees Ltd.
In the United States, a part of KONE’s employees are members in the Employees’ Retirement Plan, which is a funded defined benefit plan. The plan is managed by
KONE Inc.’s Pension Committee. In addi-tion to this pension plan, KONE also pro-vides post-employment medical and life insurance benefits. These predominantly unfunded other post-employment ben-efit plans qualify as defined benefit plans under IFRS. KONE is also a participant in a multi-employer employee benefit plan in the United States. In this defined contribu-tion plan KONE pays a contribution based on the hours worked by participating employees, KONE’s obligation is limited to this payment.
KONE’s main unfunded defined benefit plans are in Germany, Italy (TFR Trattamento di Fine Rapporto, termina-tion indemnity plan) and in Sweden. The pension schemes in Germany and the TFR plan in Italy are closed for new entrants. In Sweden, the pension cover is organized through defined contribution as well as unfunded defined benefit plans (ITP sys-tem, Industrins och handelns tilläggspen-sion).
KONE has defined contribution plans for pensions and other post-employment benefits in most countries. Under defined contribution plans KONE’s contribu-tions are recorded as an expense in the accounting period to which they relate. Recognition of a liability is not required because KONE’s obligation is limited to the payment of the contributions into these plans or funds.
The defined contribution pension plan in Finland is the statutory Finn-ish employee pension scheme (Finnish Statutory Employment Pension Scheme “TyEL“), according to which the ben-efits are directly linked to the beneficiary’s earnings. TyEL is arranged through pen-sion insurance companies.
Defined benefit obligations expose KONE to various risks: Corporate bond yields are used as a reference in determin-ing the discount rates used for calculation of defined benefit plan related obligations. A decrease in corporate bond yields hence will increase the present value of the defined benefit obligation. A plan deficit can occur if the performance of the plan assets is below the above mentioned yield. These potential deficits may require further contributions to the plan assets by the Group.
Some of the Group’s defined benefit obligations are linked to general inflation and salary level development. Higher level of inflation and salary level will result in a higher present value of the benefit obliga-tion.
Some of the defined benefit plans obligate KONE to provide benefits to plan members for a lifetime. Therefore, any increase in life expectancy will increase defined benefit liability of these plans.
Employee benefit liabilities recognized in the consolidated statement of financial position, MEUR Dec 31, 2020 Dec 31, 2019Employee benefits
Defined benefit plans 158.1 142.0Other post-employment benefits 10.1 9.0
Total 168.1 151.0
CONSOLIDATED FINANCIAL STATEMENTS | NOTES TO THE CONSOLIDATED FINANCIAL STATEMENTS | CAPITAL STRUCTURE
66
CONSOLIDATED FINANCIAL STATEMENTS | NOTES TO THE CONSOLIDATED FINANCIAL STATEMENTS | CAPITAL STRUCTURE

KONE ANNUAL REVIEW 2020
Dec 31, 2020 Dec 31, 2019
Employee benefit liabilities recognized in the consolidated statement of financial position, MEUR
Defined benefit plans
Other post- employment
benefitsDefined
benefit plans
Other post- employment
benefitsPresent value of unfunded obligations 112.5 0.4 99.3 -Present value of funded obligations 526.3 9.7 530.4 10.2Fair value of benefit plans’ assets -480.8 - -487.7 -1.2Total 158.1 10.1 142.0 9.0
Jan 1–Dec 31, 2020 Jan 1–Dec 31, 2019
Net liability reconciliation, MEURDefined
benefit plans
Other post- employment
benefitsDefined
benefit plans
Other post- employment
benefitsEmployee benefit liability at beginning of period 163.2 9.0 133.5 13.5Employee benefit assets at beginning of period -21.3 - -29.0 -Net liability at beginning of period 142.0 9.0 104.5 13.5
Translation differences -2.6 -1.2 -0.6 0.3Acquisitions of new companies 1.6 - - -Costs recognized in statement of income 19.0 0.4 19.0 -3.4Remeasurements 1.8 1.1 37.5 -0.8Paid contributions and benefits -18.3 -0.4 -18.6 -0.5Reclassifications 6.4 1.2 0.1 -Transfer 8.4 - - -Net liability at end of period 158.1 10.1 142.0 9.0
Employee benefit liability at end of period 177.2 10.1 163.2 9.0Employee benefit assets at end of period -19.2 - -21.3 -Net liability at end of period 158.1 10.1 142.0 9.0
Amounts recognized in the statement of income, MEUR Jan 1–Dec 31, 2020 Jan 1–Dec 31, 2019Defined contribution pension plans 238.5 215.2Defined benefit pension plans 19.0 19.0Other post-employment benefits 0.4 -3.4Total 257.8 230.8
Jan 1–Dec 31, 2020 Jan 1–Dec 31, 2019
Amounts recognized in the statement of income, MEUR
Defined benefit plans
Other post- employment
benefitsDefined
benefit plans
Other post- employment
benefitsCurrent service costs 19.4 0.1 16.4 0.1Net interest 2.1 0.2 2.4 0.3Past-service costs -1.9 - 0.2 -3.9Settlements -0.7 - - -Total 19.0 0.4 19.0 -3.4
The actual return on defined benefit plans’ assets was EUR 49.8 (59.8) million.
Defined benefit plans: assumptions used in calculating benefit obligations
Jan 1–Dec 31, 2020 Jan 1–Dec 31, 2019
Europe USA Europe USA
Discount rate, % 1.27 2.52 1.61 3.19Future salary increase, % 2.4 4.0 2.5 4.0Future pension increase, % 1.7 - 1.6 -
Sensitivity of the defined benefit obligation to changes in actuarial assumptions
Impact on defined benefit obligation Dec 31, 2020 Dec 31, 2019
Discount rate, +0.25 percentage points -3.8% -3.6%Discount rate, -0.25 percentage points 4.1% 3.9%Future pension increase, +0.25 percentage points 2.4% 2.2%Future pension increase, -0.25 percentage points -2.3% -2.0%
Sensitivities are calculated by changing one assumption at a time while keeping other variables constant.
CONSOLIDATED FINANCIAL STATEMENTS | NOTES TO THE CONSOLIDATED FINANCIAL STATEMENTS | CAPITAL STRUCTURE
67
CONSOLIDATED FINANCIAL STATEMENTS | NOTES TO THE CONSOLIDATED FINANCIAL STATEMENTS | CAPITAL STRUCTURE
6
KONE ANNUAL REVIEW 2020
CONSOLIDATED FINANCIAL STATEMENTS | NOTES TO THE CONSOLIDATED FINANCIAL STATEMENTS | OTHERS
IN THIS SECTION
This section comprises the following notes concerning rewards and related parties:
6.1 Management remuneration6.2 Share-based payments6.3 Related party transactions
OTHERS
CONSOLIDATED FINANCIAL STATEMENTS | NOTES TO THE CONSOLIDATED FINANCIAL STATEMENTS | OTHERS
68

KONE ANNUAL REVIEW 2020
Compensation recognized as an expense for members of the Board of Directors and the President & CEO, (EUR, thousand) 2) Jan 1–Dec 31, 2020 Jan 1–Dec 31, 2019
Herlin Antti, Chairman of the Board 1) 535.0 529.5
Herlin Jussi, Vice Chairman of the Board 119.0 114.1
Ehrnrooth Henrik, President & CEO 1) 750.0 750.0
Alahuhta Matti 50.5 45.0
Brunila Anne 49.0 44.5
Duinhoven Susan 48.0 -
Herlin Iiris 48.5 43.5
Kant Ravi 56.5 49.5
Kaskeala Juhani 50.5 45.0
Pietikäinen Sirpa 48.5 43.0
Total 1,755.5 1,664.1
1) For the financial year 2020 in addition Antti Herlin’s accrued bonus is EUR 290,462 and Henrik Ehrnrooth’s accrued bonus is EUR 493,500. These will be paid during 2021. In April 2020, the share-based payments for the financial year 2019 received by Henrik Ehrnrooth was EUR 3,736,669.
2) Includes also the annual compensation of the Board which was performed by using shares of KONE Corporation decided by the Annual General Meeting February 25, 2020.
6.1 MANAGEMENT REMUNERATIONThe key management of KONE consists of the Board of Directors of KONE Corporation and the Executive Board.
Compensation paid to the key management, MEUR Jan 1–Dec 31, 2020 Jan 1–Dec 31, 2019Salaries and other remunerations 10.1 7.8
Share-based payments 20.1 14.8
Total 30.2 22.6
The compensation for Antti Herlin, full-time Chairman of the Board, consists of a basic salary and a yearly bonus decided by the Board on the basis of the Group’s financial result. The yearly bonus may not exceed 100 percent of his annual salary. In 2020, Antti Herlin’s basic salary was EUR 468,488. In addition, his accrued bonus for 2020 totaled EUR 290,462. He was also paid EUR 66,500 as compensation for serving as Chairman of the Board. Antti Herlin’s holdings of shares are presented in the table on page 95. The full-time Chair-man’s retirement age and pension are determined in accordance with Finland’s Pensions Act. Statutory pension cost for the year 2020 was EUR 149,870. No sepa-rate agreement regarding early retirement has been made.
The compensation for the President and CEO Henrik Ehrnrooth consists of a basic salary and a yearly bonus decided annually by the Board on the basis of the Corporation’s key targets. The yearly bonus may not exceed 100 percent of his annual salary. In 2020, Henrik Ehrnrooth’s basic salary was EUR 750,000. In addition, his accrued bonus for 2020 totaled to EUR 493,500. Henrik Ehrnrooth’s hold-ings of shares are presented in the table on page 95. Henrik Ehrnrooth is included in the share-based incentive plan for the
Group’s senior management. In April 2020, on the basis of the incentive plan for year 2019, Henrik Ehrnrooth received a reward of EUR 3,736,669, which consisted of 32,531 KONE class B shares together with a cash payment to cover taxes and similar charges arising from the receipt of shares. The corresponding reward accrued from 2020 and due for payment in April 2021 is 17,625 KONE class B shares together with a cash payment to cover taxes and similar charges arising from the receipt of shares. Henrik Ehrnrooth’s retire-ment age and pension are determined in accordance with Finland’s Pensions Act. Statutory pension cost for the year 2020 was EUR 255,530. No separate agree-ment regarding early retirement has been made. Should his employment contract be terminated before retirement, he has the right to the equivalent of 18 months’ salary, which includes the salary for a six month term of notice.
The compensation for the members of the Executive Board comprises a base salary and a yearly bonus, based on the Group’s annual result and the achieve-ment of personal targets. The bonus amount is determined by the Nomination and Compensation Committee and may not exceed 50 percent of the annual sal-ary. The Executive Board members’ hold-
ings of shares are presented in the table on page 95. The members of the Execu-tive Board are included in the share-based incentive plan for senior management. In April 2020, on the basis of the incentive plan, the members of the Executive Board received a reward of 172,619 KONE class B shares together with a cash payment equal to the amount required to cover taxes and similar charges arising from the receipt of shares. The corresponding reward accrued from 2020 and due for payment in April 2021 is 83,897 KONE class B shares together with a cash pay-ment equal to the amount of taxes and similar charges. No separate agreement regarding early retirement has been made for the members of the Executive Board. The compensation for the termination of the employment contract prior to retire-ment is a maximum of 15 months’ salary, which includes the salary for a six-month term of notice.
The amount of the pension liability for Board Member Matti Alahuhta (served as President & CEO until March 31, 2014) included in the balance sheet is EUR 5.9 million at the end of the year 2020 and the monthly pension paid by KONE to him is EUR 22,434 (December 2020).
CONSOLIDATED FINANCIAL STATEMENTS | NOTES TO THE CONSOLIDATED FINANCIAL STATEMENTS | OTHERS
69
CONSOLIDATED FINANCIAL STATEMENTS | NOTES TO THE CONSOLIDATED FINANCIAL STATEMENTS | OTHERS
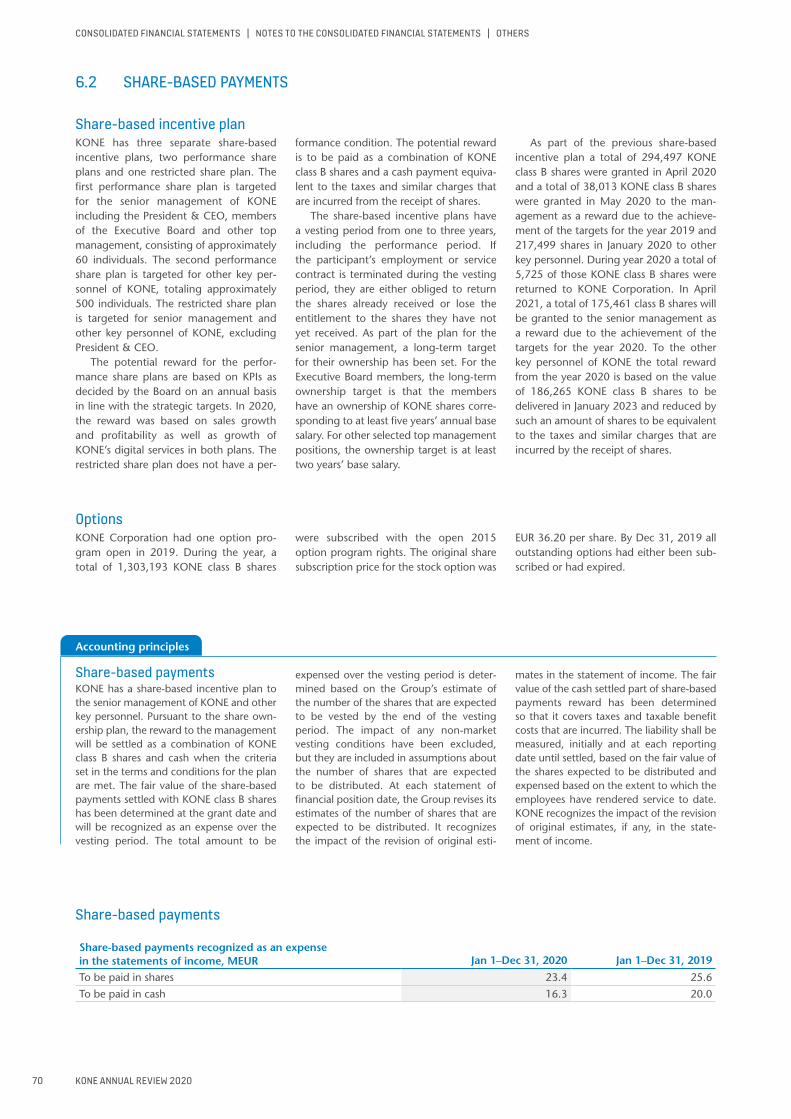
KONE ANNUAL REVIEW 2020
Accounting principles
Share-based paymentsKONE has a share-based incentive plan to the senior management of KONE and other key personnel. Pursuant to the share own-ership plan, the reward to the management will be settled as a combination of KONE class B shares and cash when the criteria set in the terms and conditions for the plan are met. The fair value of the share-based payments settled with KONE class B shares has been determined at the grant date and will be recognized as an expense over the vesting period. The total amount to be
expensed over the vesting period is deter-mined based on the Group’s estimate of the number of the shares that are expected to be vested by the end of the vesting period. The impact of any non-market vesting conditions have been excluded, but they are included in assumptions about the number of shares that are expected to be distributed. At each statement of financial position date, the Group revises its estimates of the number of shares that are expected to be distributed. It recognizes the impact of the revision of original esti-
mates in the statement of income. The fair value of the cash settled part of share-based payments reward has been determined so that it covers taxes and taxable benefit costs that are incurred. The liability shall be measured, initially and at each reporting date until settled, based on the fair value of the shares expected to be distributed and expensed based on the extent to which the employees have rendered service to date. KONE recognizes the impact of the revision of original estimates, if any, in the state-ment of income.
CONSOLIDATED FINANCIAL STATEMENTS | NOTES TO THE CONSOLIDATED FINANCIAL STATEMENTS | OTHERS
Share-based payments
Share-based payments recognized as an expense in the statements of income, MEUR Jan 1–Dec 31, 2020 Jan 1–Dec 31, 2019
To be paid in shares 23.4 25.6
To be paid in cash 16.3 20.0
Share-based incentive planKONE has three separate share-based incentive plans, two performance share plans and one restricted share plan. The first performance share plan is targeted for the senior management of KONE including the President & CEO, members of the Executive Board and other top management, consisting of approximately 60 individuals. The second performance share plan is targeted for other key per-sonnel of KONE, totaling approximately 500 individuals. The restricted share plan is targeted for senior management and other key personnel of KONE, excluding President & CEO.
The potential reward for the perfor-mance share plans are based on KPIs as decided by the Board on an annual basis in line with the strategic targets. In 2020, the reward was based on sales growth and profitability as well as growth of KONE’s digital services in both plans. The restricted share plan does not have a per-
formance condition. The potential reward is to be paid as a combination of KONE class B shares and a cash payment equiva-lent to the taxes and similar charges that are incurred from the receipt of shares.
The share-based incentive plans have a vesting period from one to three years, including the performance period. If the participant’s employment or service contract is terminated during the vesting period, they are either obliged to return the shares already received or lose the entitlement to the shares they have not yet received. As part of the plan for the senior management, a long-term target for their ownership has been set. For the Executive Board members, the long-term ownership target is that the members have an ownership of KONE shares corre-sponding to at least five years’ annual base salary. For other selected top management positions, the ownership target is at least two years’ base salary.
As part of the previous share-based incentive plan a total of 294,497 KONE class B shares were granted in April 2020 and a total of 38,013 KONE class B shares were granted in May 2020 to the man-agement as a reward due to the achieve-ment of the targets for the year 2019 and 217,499 shares in January 2020 to other key personnel. During year 2020 a total of 5,725 of those KONE class B shares were returned to KONE Corporation. In April 2021, a total of 175,461 class B shares will be granted to the senior management as a reward due to the achievement of the targets for the year 2020. To the other key personnel of KONE the total reward from the year 2020 is based on the value of 186,265 KONE class B shares to be delivered in January 2023 and reduced by such an amount of shares to be equivalent to the taxes and similar charges that are incurred by the receipt of shares.
OptionsKONE Corporation had one option pro-gram open in 2019. During the year, a total of 1,303,193 KONE class B shares
were subscribed with the open 2015 option program rights. The original share subscription price for the stock option was
EUR 36.20 per share. By Dec 31, 2019 all outstanding options had either been sub-scribed or had expired.
6.2 SHARE-BASED PAYMENTS
70
CONSOLIDATED FINANCIAL STATEMENTS | NOTES TO THE CONSOLIDATED FINANCIAL STATEMENTS | OTHERS

KONE ANNUAL REVIEW 2020
CONSOLIDATED FINANCIAL STATEMENTS | NOTES TO THE CONSOLIDATED FINANCIAL STATEMENTS | OTHERS
6.3 RELATED PARTY TRANSACTIONS KONE’s related parties comprise its sub-sidiaries as well as the Board of Directors, the President & CEO, the Executive Board including any companies controlled or significantly influenced by them. The Cor-porate Controlling function evaluates and monitors transactions between the Group and its related parties to ensure that any
conflicts of interest are taken into account appropriately in KONE’s decision making process.
Except for management remuneration there have not been any material transac-tions between KONE and its members of the Board of Directors, the President & CEO, the Executive Board including any
companies controlled or significantly influ-enced by them. Information concerning management remuneration is disclosed in note 6.1 and shares held by the members of the Board of Directors, the President & CEO, the Executive Board is disclosed in page 95. KONE’s subsidiaries are disclosed in pages 82–84.
71
CONSOLIDATED FINANCIAL STATEMENTS | NOTES TO THE CONSOLIDATED FINANCIAL STATEMENTS | OTHERS
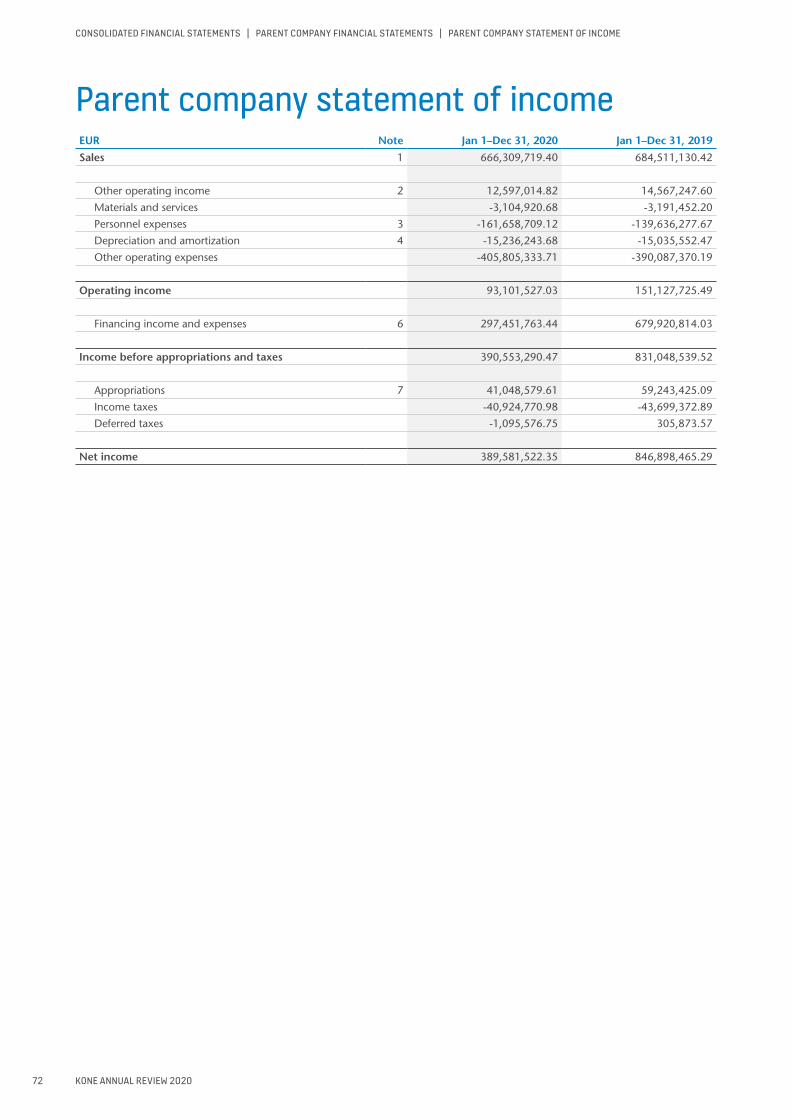
KONE ANNUAL REVIEW 2020
Parent company statement of incomeEUR Note Jan 1–Dec 31, 2020 Jan 1–Dec 31, 2019
Sales 1 666,309,719.40 684,511,130.42
Other operating income 2 12,597,014.82 14,567,247.60
Materials and services -3,104,920.68 -3,191,452.20
Personnel expenses 3 -161,658,709.12 -139,636,277.67
Depreciation and amortization 4 -15,236,243.68 -15,035,552.47
Other operating expenses -405,805,333.71 -390,087,370.19
Operating income 93,101,527.03 151,127,725.49
Financing income and expenses 6 297,451,763.44 679,920,814.03
Income before appropriations and taxes 390,553,290.47 831,048,539.52
Appropriations 7 41,048,579.61 59,243,425.09
Income taxes -40,924,770.98 -43,699,372.89
Deferred taxes -1,095,576.75 305,873.57
Net income 389,581,522.35 846,898,465.29
CONSOLIDATED FINANCIAL STATEMENTS | PARENT COMPANY FINANCIAL STATEMENTS | PARENT COMPANY STATEMENT OF INCOME
72
CONSOLIDATED FINANCIAL STATEMENTS | PARENT COMPANY FINANCIAL STATEMENTS | PARENT COMPANY STATEMENT OF INCOME

KONE ANNUAL REVIEW 2020
Parent company statement of financial positionAssets, EUR Note Dec 31, 2020 Dec 31, 2019Non-current assetsIntangible assets 8 18,278,548.21 20,134,338.21Property, plant and equipment 9 37,746,453.05 34,825,427.20Investments
Subsidiary shares 10 2,627,011,289.86 2,631,178,172.87Other shares 11 2,460,845.44 2,462,629.44
2,629,472,135.30 2,633,640,802.31
Total non-current assets 2,685,497,136.56 2,688,600,567.72
Current assetsLong-term receivables 12
Loans receivable 372,009,023.74 346,879,043.00372,009,023.74 346,879,043.00
Short-term receivables 13Accounts receivable 108,111,218.15 147,276,682.67Loans receivable 722,058,681.04 879,343,158.82Deferred tax assets 3,456,027.40 5,355,604.15Other receivables 15,786,952.75 16,127,584.07Deferred assets 248,784,957.83 238,401,080.76
1,098,197,837.17 1,286,504,110.47
Financial investments 1,509,966,813.95 687,464,343.38Cash and cash equivalents 158,423,651.17 269,462,126.90
Total current assets 3,138,597,326.03 2,590,309,623.75
Total assets 5,824,094,462.59 5,278,910,191.47
Equity and liabilities, EUR Note Dec 31, 2020 Dec 31, 2019Equity
Share capital 66,174,482.53 66,174,482.53Share premium account 100,328,064.58 100,328,064.58Other reserves
Paid-up unrestricted equity reserve 326,971,986.85 298,115,709.83Retained earnings 1,330,105,316.75 1,363,717,911.48Net income 389,581,522.35 846,898,465.29
Total equity 14 2,213,161,373.06 2,675,234,633.71
Cumulative accelerated depreciation 8,932,913.97 9,216,627.63Appropriations 8,932,913.97 9,216,627.63
Provisions 15 4,964,668.60 3,684,116.72
LiabilitiesNon-current liabilities 16
Loans 272,550,427.14 253,180,335.72272,550,427.14 253,180,335.72
Current liabilities 17Accounts payable 82,095,305.56 91,370,151.60Loans 3,024,448,429.10 2,107,909,509.79Deferred tax liabilities 804,000.00Other liabilities 34,045,510.30 26,491,719.75Accruals 183,895,834.86 111,019,096.55
3,324,485,079.82 2,337,594,477.69
Total liabilities 3,597,035,506.96 2,590,774,813.41
Total equity and liabilities 5,824,094,462.59 5,278,910,191.47
CONSOLIDATED FINANCIAL STATEMENTS | PARENT COMPANY FINANCIAL STATEMENTS | PARENT COMPANY STATEMENT OF FINANCIAL POSITION
73
CONSOLIDATED FINANCIAL STATEMENTS | PARENT COMPANY FINANCIAL STATEMENTS | PARENT COMPANY STATEMENT OF FINANCIAL POSITION
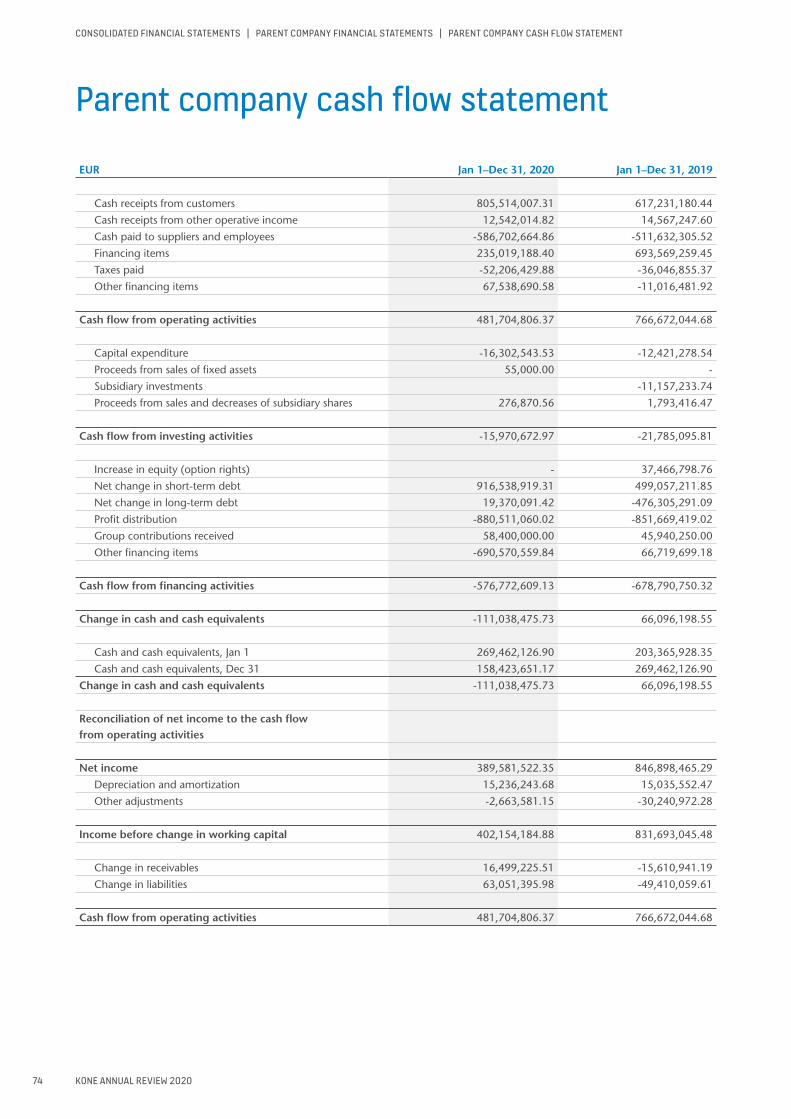
KONE ANNUAL REVIEW 2020
Parent company cash flow statement
EUR Jan 1–Dec 31, 2020 Jan 1–Dec 31, 2019
Cash receipts from customers 805,514,007.31 617,231,180.44
Cash receipts from other operative income 12,542,014.82 14,567,247.60
Cash paid to suppliers and employees -586,702,664.86 -511,632,305.52
Financing items 235,019,188.40 693,569,259.45
Taxes paid -52,206,429.88 -36,046,855.37
Other financing items 67,538,690.58 -11,016,481.92
Cash flow from operating activities 481,704,806.37 766,672,044.68
Capital expenditure -16,302,543.53 -12,421,278.54
Proceeds from sales of fixed assets 55,000.00 -
Subsidiary investments -11,157,233.74
Proceeds from sales and decreases of subsidiary shares 276,870.56 1,793,416.47
Cash flow from investing activities -15,970,672.97 -21,785,095.81
Increase in equity (option rights) - 37,466,798.76
Net change in short-term debt 916,538,919.31 499,057,211.85
Net change in long-term debt 19,370,091.42 -476,305,291.09
Profit distribution -880,511,060.02 -851,669,419.02
Group contributions received 58,400,000.00 45,940,250.00
Other financing items -690,570,559.84 66,719,699.18
Cash flow from financing activities -576,772,609.13 -678,790,750.32
Change in cash and cash equivalents -111,038,475.73 66,096,198.55
Cash and cash equivalents, Jan 1 269,462,126.90 203,365,928.35
Cash and cash equivalents, Dec 31 158,423,651.17 269,462,126.90
Change in cash and cash equivalents -111,038,475.73 66,096,198.55
Reconciliation of net income to the cash flow from operating activities
Net income 389,581,522.35 846,898,465.29
Depreciation and amortization 15,236,243.68 15,035,552.47
Other adjustments -2,663,581.15 -30,240,972.28
Income before change in working capital 402,154,184.88 831,693,045.48
Change in receivables 16,499,225.51 -15,610,941.19
Change in liabilities 63,051,395.98 -49,410,059.61
Cash flow from operating activities 481,704,806.37 766,672,044.68
CONSOLIDATED FINANCIAL STATEMENTS | PARENT COMPANY FINANCIAL STATEMENTS | PARENT COMPANY CASH FLOW STATEMENT
74
CONSOLIDATED FINANCIAL STATEMENTS | PARENT COMPANY FINANCIAL STATEMENTS | PARENT COMPANY CASH FLOW STATEMENT
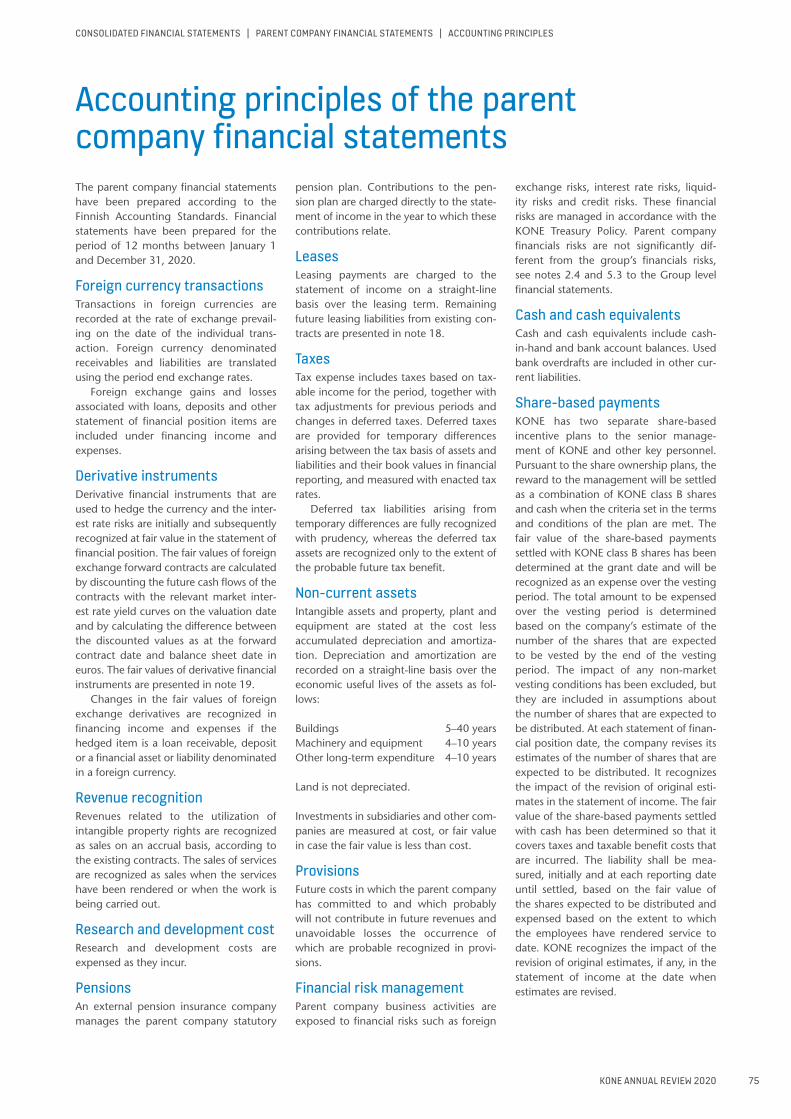
KONE ANNUAL REVIEW 2020
Accounting principles of the parent company financial statementsThe parent company financial statements have been prepared according to the Finnish Accounting Standards. Financial statements have been prepared for the period of 12 months between January 1 and December 31, 2020.
Foreign currency transactionsTransactions in foreign currencies are recorded at the rate of exchange prevail-ing on the date of the individual trans-action. Foreign currency denominated receivables and liabilities are translated using the period end exchange rates.
Foreign exchange gains and losses associated with loans, deposits and other statement of financial position items are included under financing income and expenses.
Derivative instrumentsDerivative financial instruments that are used to hedge the currency and the inter-est rate risks are initially and subsequently recognized at fair value in the statement of financial position. The fair values of foreign exchange forward contracts are calculated by discounting the future cash flows of the contracts with the relevant market inter-est rate yield curves on the valuation date and by calculating the difference between the discounted values as at the forward contract date and balance sheet date in euros. The fair values of derivative financial instruments are presented in note 19.
Changes in the fair values of foreign exchange derivatives are recognized in financing income and expenses if the hedged item is a loan receivable, deposit or a financial asset or liability denominated in a foreign currency.
Revenue recognitionRevenues related to the utilization of intangible property rights are recognized as sales on an accrual basis, according to the existing contracts. The sales of services are recognized as sales when the services have been rendered or when the work is being carried out.
Research and development costResearch and development costs are expensed as they incur.
Pensions An external pension insurance company manages the parent company statutory
pension plan. Contributions to the pen-sion plan are charged directly to the state-ment of income in the year to which these contributions relate.
Leases Leasing payments are charged to the statement of income on a straight-line basis over the leasing term. Remaining future leasing liabilities from existing con-tracts are presented in note 18.
Taxes Tax expense includes taxes based on tax-able income for the period, together with tax adjustments for previous periods and changes in deferred taxes. Deferred taxes are provided for temporary differences arising between the tax basis of assets and liabilities and their book values in financial reporting, and measured with enacted tax rates.
Deferred tax liabilities arising from temporary differences are fully recognized with prudency, whereas the deferred tax assets are recognized only to the extent of the probable future tax benefit.
Non-current assetsIntangible assets and property, plant and equipment are stated at the cost less accumulated depreciation and amortiza-tion. Depreciation and amortization are recorded on a straight-line basis over the economic useful lives of the assets as fol-lows:
Buildings 5–40 yearsMachinery and equipment 4–10 yearsOther long-term expenditure 4–10 years
Land is not depreciated.
Investments in subsidiaries and other com-panies are measured at cost, or fair value in case the fair value is less than cost.
Provisions Future costs in which the parent company has committed to and which probably will not contribute in future revenues and unavoidable losses the occurrence of which are probable recognized in provi-sions.
Financial risk managementParent company business activities are exposed to financial risks such as foreign
exchange risks, interest rate risks, liquid-ity risks and credit risks. These financial risks are managed in accordance with the KONE Treasury Policy. Parent company financials risks are not significantly dif-ferent from the group’s financials risks, see notes 2.4 and 5.3 to the Group level financial statements.
Cash and cash equivalents Cash and cash equivalents include cash-in-hand and bank account balances. Used bank overdrafts are included in other cur-rent liabilities.
Share-based payments KONE has two separate share-based incentive plans to the senior manage-ment of KONE and other key personnel. Pursuant to the share ownership plans, the reward to the management will be settled as a combination of KONE class B shares and cash when the criteria set in the terms and conditions of the plan are met. The fair value of the share-based payments settled with KONE class B shares has been determined at the grant date and will be recognized as an expense over the vesting period. The total amount to be expensed over the vesting period is determined based on the company’s estimate of the number of the shares that are expected to be vested by the end of the vesting period. The impact of any non-market vesting conditions has been excluded, but they are included in assumptions about the number of shares that are expected to be distributed. At each statement of finan-cial position date, the company revises its estimates of the number of shares that are expected to be distributed. It recognizes the impact of the revision of original esti-mates in the statement of income. The fair value of the share-based payments settled with cash has been determined so that it covers taxes and taxable benefit costs that are incurred. The liability shall be mea-sured, initially and at each reporting date until settled, based on the fair value of the shares expected to be distributed and expensed based on the extent to which the employees have rendered service to date. KONE recognizes the impact of the revision of original estimates, if any, in the statement of income at the date when estimates are revised.
CONSOLIDATED FINANCIAL STATEMENTS | PARENT COMPANY FINANCIAL STATEMENTS | ACCOUNTING PRINCIPLES
75
CONSOLIDATED FINANCIAL STATEMENTS | PARENT COMPANY FINANCIAL STATEMENTS | ACCOUNTING PRINCIPLES
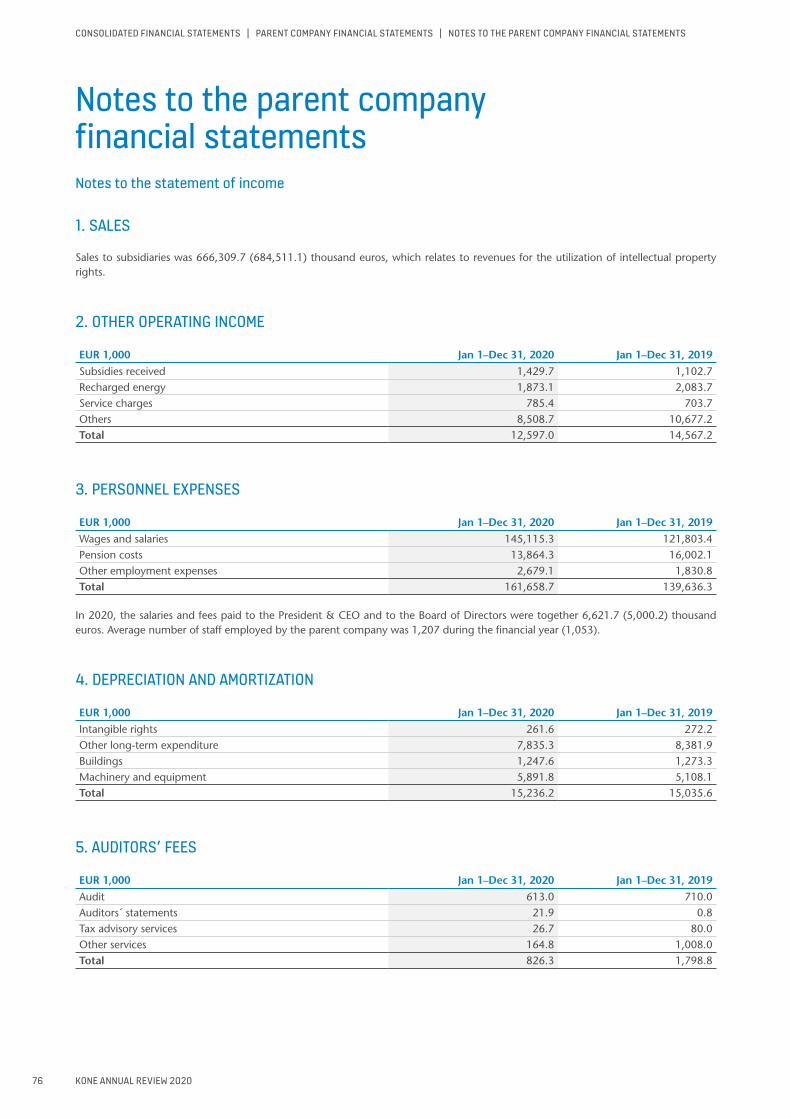
KONE ANNUAL REVIEW 2020
CONSOLIDATED FINANCIAL STATEMENTS | PARENT COMPANY FINANCIAL STATEMENTS | NOTES TO THE PARENT COMPANY FINANCIAL STATEMENTS
Notes to the parent company financial statementsNotes to the statement of income
1. SALES
Sales to subsidiaries was 666,309.7 (684,511.1) thousand euros, which relates to revenues for the utilization of intellectual property rights.
2. OTHER OPERATING INCOME
EUR 1,000 Jan 1–Dec 31, 2020 Jan 1–Dec 31, 2019
Subsidies received 1,429.7 1,102.7Recharged energy 1,873.1 2,083.7Service charges 785.4 703.7Others 8,508.7 10,677.2Total 12,597.0 14,567.2
3. PERSONNEL EXPENSES
EUR 1,000 Jan 1–Dec 31, 2020 Jan 1–Dec 31, 2019
Wages and salaries 145,115.3 121,803.4Pension costs 13,864.3 16,002.1Other employment expenses 2,679.1 1,830.8Total 161,658.7 139,636.3
In 2020, the salaries and fees paid to the President & CEO and to the Board of Directors were together 6,621.7 (5,000.2) thousand euros. Average number of staff employed by the parent company was 1,207 during the financial year (1,053).
4. DEPRECIATION AND AMORTIZATION
EUR 1,000 Jan 1–Dec 31, 2020 Jan 1–Dec 31, 2019
Intangible rights 261.6 272.2Other long-term expenditure 7,835.3 8,381.9Buildings 1,247.6 1,273.3Machinery and equipment 5,891.8 5,108.1Total 15,236.2 15,035.6
5. AUDITORS’ FEES
EUR 1,000 Jan 1–Dec 31, 2020 Jan 1–Dec 31, 2019
Audit 613.0 710.0Auditors´ statements 21.9 0.8Tax advisory services 26.7 80.0Other services 164.8 1,008.0Total 826.3 1,798.8
76
CONSOLIDATED FINANCIAL STATEMENTS | PARENT COMPANY FINANCIAL STATEMENTS | NOTES TO THE PARENT COMPANY FINANCIAL STATEMENTS

KONE ANNUAL REVIEW 2020
CONSOLIDATED FINANCIAL STATEMENTS | PARENT COMPANY FINANCIAL STATEMENTS | NOTES TO THE PARENT COMPANY FINANCIAL STATEMENTS
6. FINANCING INCOME AND EXPENSES
EUR 1,000 Jan 1–Dec 31, 2020 Jan 1–Dec 31, 2019
Dividend income from subsidiaries 249,410.1 698,468.0Other dividends received 3.3 3.0Interest income from subsidiaries 7,119.8 8,213.1Interest income from others 13,805.0 26,368.6Interest expenses to subsidiaries -35,226.7 -37,601.0Interest expenses to others -690.3 -2,423.0Other financing income and expenses 63,030.5 -13,107.8Total 297,451.8 679,920.8
7. APPROPRIATIONS
EUR 1,000 Jan 1–Dec 31, 2020 Jan 1–Dec 31, 2019
Cumulative accelerated depreciation charge 283.7 843.4Group contributions received 40,764.9 58,400.0Total 41,048.6 59,243.4
Notes to the statement of financial position
8. INTANGIBLE ASSETS
Jan 1–Dec 31, 2020, EUR 1,000 Intangible
rights
Other long-term
expenditureAdvance
payments TotalJan 1, 2020Acquisition cost 4,712.8 124,549.3 1,866.4 131,128.6Accumulated amortization and impairment -3,866.9 -107,127.3 - -110,994.2Opening net book value 845.9 17,422.0 1,866.4 20,134.3
Opening net book value 845.9 17,422.0 1,866.4 20,134.3Increase 173.9 6,067.1 6,241.1Reclassifications 1,866.4 -1,866.4Amortization -261.6 -7,835.3 -8,096.9Closing net book value 758.3 17,520.3 - 18,278.5
Dec 31, 2020Acquisition cost 4,886.8 132,482.8 - 137,369.6Accumulated amortization and impairment -4,128.5 -114,962.6 -119,091.1Closing net book value 758.3 17,520.3 - 18,278.5
Jan 1–Dec 31, 2019, EUR 1,000 Intangible
rights
Other long-term
expenditureAdvance
payments TotalJan 1, 2019Acquisition cost 4,503.1 119,294.3 1,866.4 125,663.8Accumulated amortization and impairment -3,594.7 -100,014.2 - -103,608.9Opening net book value 908.4 19,280.0 1,866.4 22,054.8
Opening net book value 908.4 19,280.0 1,866.4 22,054.8Increase 209.7 6,526.4 - 6,736.1Decrease - -2.5 - -2.5Amortization -272.2 -8,381.9 - -8,654.1Closing net book value 845.9 17,422.0 1,866.4 20,134.3
Dec 31, 2019Acquisition cost 4,712.8 124,549.3 1,866.4 131,128.6Accumulated amortization and impairment -3,866.9 -107,127.3 - -110,994.2Closing net book value 845.9 17,422.0 1,866.4 20,134.3
77
CONSOLIDATED FINANCIAL STATEMENTS | PARENT COMPANY FINANCIAL STATEMENTS | NOTES TO THE PARENT COMPANY FINANCIAL STATEMENTS

KONE ANNUAL REVIEW 2020
9. PROPERTY, PLANT AND EQUIPMENT
Jan 1–Dec 31, 2020, EUR 1,000 Land Buildings
Machinery &
equipment
Fixed assets under
construction TotalJan 1, 2020Acquisition cost 182.3 30,472.6 40,835.7 216.0 71,706.6Accumulated depreciation - -9,781.5 -27,099.7 - -36,881.2Opening net book value 182.3 20,691.1 13,736.0 216.0 34,825.4
Opening net book value 182.3 20,691.1 13,736.0 216.0 34,825.4Increase 943.9 9,064.0 52.6 10,060.4Decrease -170.7 -170.7Reclassifications 52.2 -52.2Depreciation -1,247.6 -5,721.0 -6,968.6Closing net book value 182.3 20,439.6 16,908.2 216.3 37,746.5
Dec 31, 2020Acquisition cost 182.3 31,468.7 49,729.0 216.3 81,596.3Accumulated depreciation - -11,029.1 -32,820.8 - -43,849.8Closing net book value 182.3 20,439.6 16,908.2 216.3 37,746.5
Jan 1–Dec 31, 2019, EUR 1,000 Land Buildings
Machinery &
equipment
Fixed assets under
construction TotalJan 1, 2019Acquisition cost 182.3 30,314.7 38,054.1 4.5 68,555.7Accumulated depreciation - -8,515.6 -24,432.3 -32,947.9Opening net book value 182.3 21,799.2 13,621.8 4.5 35,607.8
Opening net book value 182.3 21,799.2 13,621.8 4.5 35,607.8Increase - 165.6 5,303.6 216.0 5,685.1Decrease - -4.8 -81.3 - -86.1Reclassifications - 4.5 - -4.5 -Depreciation - -1,273.3 -5,108.1 - -6,381.4Closing net book value 182.3 20,691.1 13,736.0 216.0 34,825.4
Dec 31, 2019Acquisition cost 182.3 30,472.6 40,835.7 216.0 71,706.6Accumulated depreciation - -9,781.5 -27,099.7 - -36,881.2Closing net book value 182.3 20,691.1 13,736.0 216.0 34,825.4
10. SUBSIDIARY SHARES
EUR 1,000 Dec 31, 2020 Dec 31, 2019
Acquisition cost, Jan 1 2,631,178.2 2,622,075.4Increase - 11,703.1Decrease -4,166.9 -2,600.3Net book value, Dec 31 2,627,011.3 2,631,178.2
11. OTHER SHARES
EUR 1,000 Dec 31, 2020 Dec 31, 2019
Acquisition cost, Jan 1 2,462.6 2,463.3Increase - 167.2Decrease -1.8 -0.7Reclassifications - -167.2Net book value, Dec 31 2,460.8 2,462.6
CONSOLIDATED FINANCIAL STATEMENTS | PARENT COMPANY FINANCIAL STATEMENTS | NOTES TO THE PARENT COMPANY FINANCIAL STATEMENTS
78
CONSOLIDATED FINANCIAL STATEMENTS | PARENT COMPANY FINANCIAL STATEMENTS | NOTES TO THE PARENT COMPANY FINANCIAL STATEMENTS

KONE ANNUAL REVIEW 2020
12. LONG-TERM RECEIVABLES
EUR 1,000 Dec 31, 2020 Dec 31, 2019
Loans receivable from subsidiaries 371,684.9 346,879.0Loans receivable from externals 324.1 -Long-term receivables 372,009.0 346,879.0
13. SHORT-TERM RECEIVABLES
Receivables from subsidiaries, EUR 1,000 Dec 31, 2020 Dec 31, 2019
Accounts receivables 107,410.7 146,659.7Loans receivable 722,058.7 879,343.2Deferred assets 144,761.3 199,820.4Total 974,230.6 1,225,823.2
Receivables from externals, EUR 1,000 Dec 31, 2020 Dec 31, 2019
Accounts receivables 700.5 617.0Others 15,787.0 16,127.6Deferred assets 104,023.7 38,580.7Total 120,511.2 55,325.3
Deferred tax assets* 3,456.0 5,355.6
Total short-term receivables 1,098,197.8 1,286,504.1
Deferred assets, EUR 1,000 Dec 31, 2020 Dec 31, 2019
Derivative assets 79,362.2 22,897.2Deferred income taxes 17,059.7 11,811.9Unbilled revenue 90,231.8 124,436.7Group contributions 40,764.9 58,400.0Others 21,366.3 20,855.3Total 248,785.0 238,401.1
*As from 1.1.2020 deferred tax assets and liabilities are offset for presentation purposes. In 2019, the balance sheet value of deferred tax assets would have been 804.0 thousand euros lower if the offset would have been done.
CONSOLIDATED FINANCIAL STATEMENTS | PARENT COMPANY FINANCIAL STATEMENTS | NOTES TO THE PARENT COMPANY FINANCIAL STATEMENTS
79
CONSOLIDATED FINANCIAL STATEMENTS | PARENT COMPANY FINANCIAL STATEMENTS | NOTES TO THE PARENT COMPANY FINANCIAL STATEMENTS

KONE ANNUAL REVIEW 2020
14. EQUITY AND CHANGES IN EQUITY
EUR 1,000Share
capital
Sharepremium account
Paid-up unrestricted
equity reserveOwn
sharesRetainedearnings
Net income for the period Total
Book value Jan 1, 2020 66,174.5 100,328.1 298,115.7 -185,111.0 2,395,727.4 2,675,234.6
Profit distribution -880,511.1 -880,511.1Option and share-based compensation 28,856.3 20,449.0 -20,449.0 28,856.3
Net income for the period 389,581.5 389,581.5
Net book value Dec 31, 2020 66,174.5 100,328.1 326,972.0 -164,662.0 1,494,767.3 389,581.5 2,213,161.4
Non-restricted equity includes the paid-up unrestricted equity reserve, retained earnings deducted by own shares and the profit for the financial year. The non-restricted equity was EUR 2,046,658,825.95 (2,508,732,086.60) at the end of the period.
EUR 1,000Share
capital
Sharepremium account
Paid-up unrestricted
equity reserveOwn
sharesRetainedearnings
Net income for the period Total
Book value Jan 1, 2019 66,011.6 100,328.1 237,735.4 -203,325.9 2,418,713.2 2,619,462.4
Profit distribution -851,669.4 -851,669.4Option and share-based compensation 162.9 60,380.3 18,214.9 -18,214.9 60,543.2
Net income for the period 846,898.5 846,898.5
Net book value Dec 31, 2019 66,174.5 100,328.1 298,115.7 -185,111.0 1,548,828.9 846,898.5 2,675,234.6
15. PROVISIONS
EUR 1,000 Dec 31, 2020 Dec 31, 2019
Warranty provisions 4,964.7 3,684.1Total 4,964.7 3,684.1
16. NON-CURRENT LIABILITIES
Liabilities to subsidiaries, EUR 1,000 Dec 31, 2020 Dec 31, 2019
Liabilities falling due in 1–5 years 272,550.4 93,180.3Total 272,550.4 93,180.3
Liabilities to externals, EUR 1,000 Dec 31, 2020 Dec 31, 2019
Liabilities falling due in 1–5 years - 160,000.0Total - 160,000.0
Total non-current liabilities 272,550.4 253,180.3
CONSOLIDATED FINANCIAL STATEMENTS | PARENT COMPANY FINANCIAL STATEMENTS | NOTES TO THE PARENT COMPANY FINANCIAL STATEMENTS
80
CONSOLIDATED FINANCIAL STATEMENTS | PARENT COMPANY FINANCIAL STATEMENTS | NOTES TO THE PARENT COMPANY FINANCIAL STATEMENTS
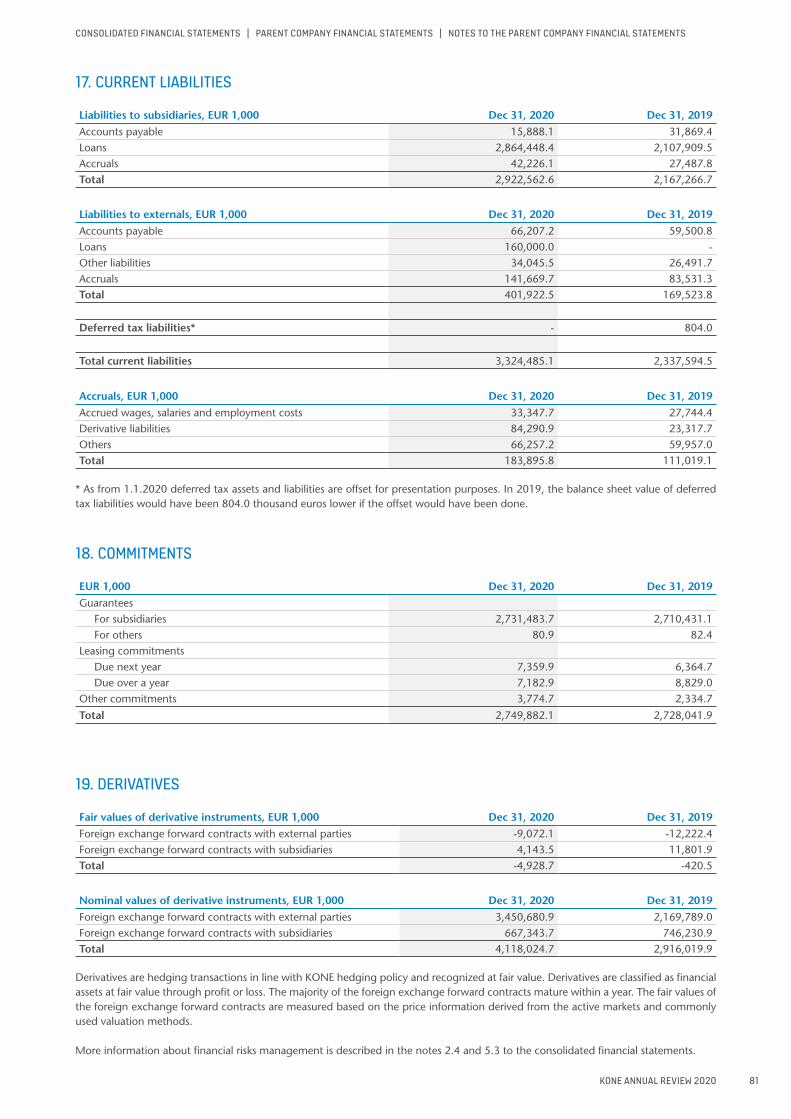
KONE ANNUAL REVIEW 2020
17. CURRENT LIABILITIES
Liabilities to subsidiaries, EUR 1,000 Dec 31, 2020 Dec 31, 2019
Accounts payable 15,888.1 31,869.4Loans 2,864,448.4 2,107,909.5Accruals 42,226.1 27,487.8Total 2,922,562.6 2,167,266.7
Liabilities to externals, EUR 1,000 Dec 31, 2020 Dec 31, 2019
Accounts payable 66,207.2 59,500.8Loans 160,000.0 -Other liabilities 34,045.5 26,491.7Accruals 141,669.7 83,531.3Total 401,922.5 169,523.8
Deferred tax liabilities* - 804.0
Total current liabilities 3,324,485.1 2,337,594.5
Accruals, EUR 1,000 Dec 31, 2020 Dec 31, 2019
Accrued wages, salaries and employment costs 33,347.7 27,744.4Derivative liabilities 84,290.9 23,317.7Others 66,257.2 59,957.0Total 183,895.8 111,019.1
* As from 1.1.2020 deferred tax assets and liabilities are offset for presentation purposes. In 2019, the balance sheet value of deferred tax liabilities would have been 804.0 thousand euros lower if the offset would have been done.
18. COMMITMENTS
EUR 1,000 Dec 31, 2020 Dec 31, 2019
GuaranteesFor subsidiaries 2,731,483.7 2,710,431.1For others 80.9 82.4
Leasing commitmentsDue next year 7,359.9 6,364.7Due over a year 7,182.9 8,829.0
Other commitments 3,774.7 2,334.7
Total 2,749,882.1 2,728,041.9
19. DERIVATIVES
Fair values of derivative instruments, EUR 1,000 Dec 31, 2020 Dec 31, 2019
Foreign exchange forward contracts with external parties -9,072.1 -12,222.4Foreign exchange forward contracts with subsidiaries 4,143.5 11,801.9Total -4,928.7 -420.5
Nominal values of derivative instruments, EUR 1,000 Dec 31, 2020 Dec 31, 2019
Foreign exchange forward contracts with external parties 3,450,680.9 2,169,789.0Foreign exchange forward contracts with subsidiaries 667,343.7 746,230.9Total 4,118,024.7 2,916,019.9
Derivatives are hedging transactions in line with KONE hedging policy and recognized at fair value. Derivatives are classified as financial assets at fair value through profit or loss. The majority of the foreign exchange forward contracts mature within a year. The fair values of the foreign exchange forward contracts are measured based on the price information derived from the active markets and commonly used valuation methods.
More information about financial risks management is described in the notes 2.4 and 5.3 to the consolidated financial statements.
CONSOLIDATED FINANCIAL STATEMENTS | PARENT COMPANY FINANCIAL STATEMENTS | NOTES TO THE PARENT COMPANY FINANCIAL STATEMENTS
81
CONSOLIDATED FINANCIAL STATEMENTS | PARENT COMPANY FINANCIAL STATEMENTS | NOTES TO THE PARENT COMPANY FINANCIAL STATEMENTS

KONE ANNUAL REVIEW 2020
SubsidiariesSUBSIDIARIES, DEC 31, 2020
Share holding %Country/Region Company Group Parent company
Andorra KONE Ascensors i Escales, S.A. 100
Australia KONE Elevators Pty Limited 100
KONE Elevators Employee Benefits Pty Limited 100
KONE Holdings (Australia) Limited 100
Austria KONE AG 100 100
Bahrain KONE Bahrain S.P.C. 0
KONE Elevators S.P.C. 0
Belgium KONE Belgium S.A. 100 99.99
Bosnia and Herzegovina KONE d.o.o. Sarajevo 100
Bulgaria KONE EOOD 100 100
Canada KONE Inc. 100
China mainland Giant Kone Elevator Co., Ltd. 100 40
KONE Elevators Co., Ltd. 100
KONE Elevator (Shanghai) Co., Ltd. 100
Kunshan KONE Industrial Machinery Co., Ltd. 100 100
Croatia KONE d.o.o. 100 100
Cyprus Gelco Lifts Ltd 100
KONE Elevators Cyprus Limited 100 100
Czech Republic KONE, a.s. 100 100
KONE Industrial – koncern s.r.o. 100 100
Denmark KONE A/S 100 100
Egypt KONE LLC 100
Estonia AS KONE 100 100
Finland Finescal Oy 100 100
KONE Digital Services Oy 100 100
KONE Export Oy 100
KONE Hissit Oy 100 100
KONE Industrial Oy 100 100
France Ascenseurs Portes Automatiques Arnaud S.A.S. 100
Ascenseurs Soulier S.N.C. 100
ATS-ATPE S.A.S. 100
Delta Ascenseurs S.A.S. 100
KONE Développement S.N.C. 100
KONE Holding France S.A.S. 100 100
KONE S.A. 99.99
Liftman S.A.S. 100
Prokodis S.A.S. 100
R.M.D. Automatismes S.A.S. 100
R.M.D. S.A.S. 100
Société en Participation KONE ATS 100
2STP S.A.S. 100
Technique & Mecanique des Elevateurs S.A.S. 100
Germany Alois Kasper GmbH 100
Aufzugstechnik Rhein Ruhr GmbH 100
KONE Automatiktüren GmbH 100
KONE Escalator Supply Service Center Europe GmbH 100
KONE Garant Aufzug GmbH 100
KONE GmbH 100
KONE Montage GmbH 100
KONE Servicezentrale GmbH 100
CONSOLIDATED FINANCIAL STATEMENTS | PARENT COMPANY FINANCIAL STATEMENTS | SUBSIDIARIES
82
CONSOLIDATED FINANCIAL STATEMENTS | PARENT COMPANY FINANCIAL STATEMENTS | SUBSIDIARIES
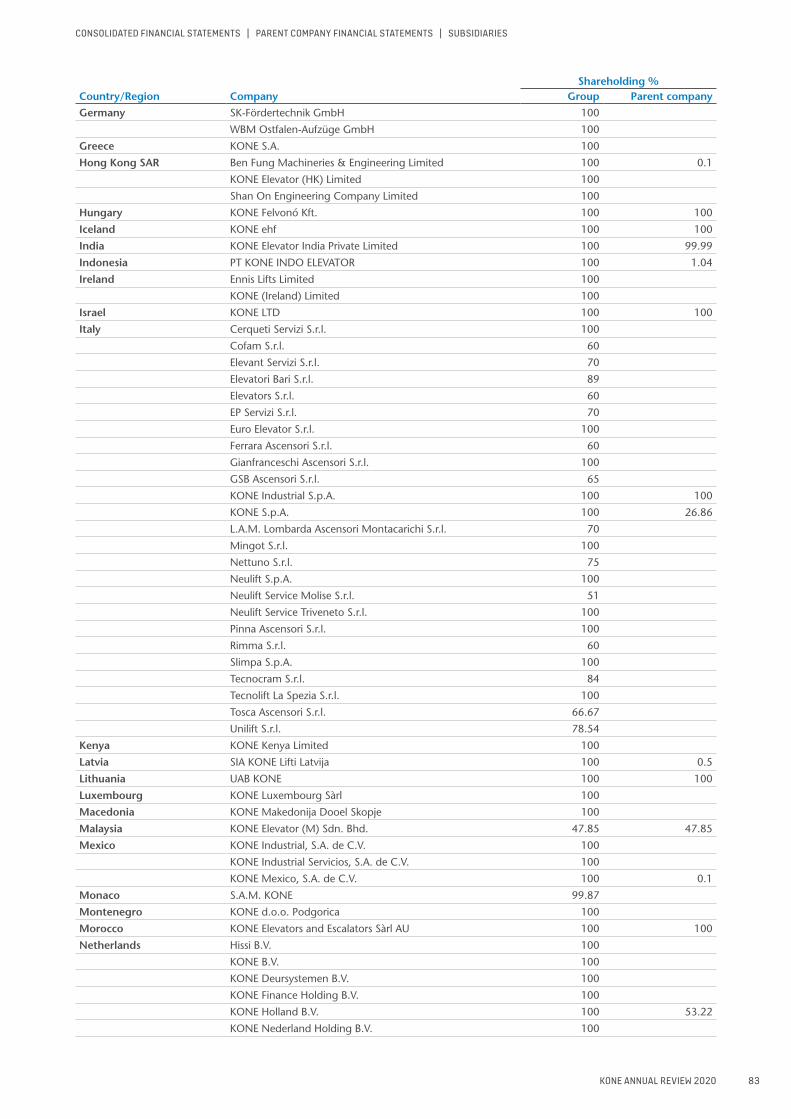
KONE ANNUAL REVIEW 2020
Share holding %Country/Region Company Group Parent company
Germany SK-Fördertechnik GmbH 100
WBM Ostfalen-Aufzüge GmbH 100
Greece KONE S.A. 100
Hong Kong SAR Ben Fung Machineries & Engineering Limited 100 0.1
KONE Elevator (HK) Limited 100
Shan On Engineering Company Limited 100
Hungary KONE Felvonó Kft. 100 100
Iceland KONE ehf 100 100
India KONE Elevator India Private Limited 100 99.99
Indonesia PT KONE INDO ELEVATOR 100 1.04
Ireland Ennis Lifts Limited 100
KONE (Ireland) Limited 100
Israel KONE LTD 100 100
Italy Cerqueti Servizi S.r.l. 100
Cofam S.r.l. 60
Elevant Servizi S.r.l. 70
Elevatori Bari S.r.l. 89
Elevators S.r.l. 60
EP Servizi S.r.l. 70
Euro Elevator S.r.l. 100
Ferrara Ascensori S.r.l. 60
Gianfranceschi Ascensori S.r.l. 100
GSB Ascensori S.r.l. 65
KONE Industrial S.p.A. 100 100
KONE S.p.A. 100 26.86
L.A.M. Lombarda Ascensori Montacarichi S.r.l. 70
Mingot S.r.l. 100
Nettuno S.r.l. 75
Neulift S.p.A. 100
Neulift Service Molise S.r.l. 51
Neulift Service Triveneto S.r.l. 100
Pinna Ascensori S.r.l. 100
Rimma S.r.l. 60
Slimpa S.p.A. 100
Tecnocram S.r.l. 84
Tecnolift La Spezia S.r.l. 100
Tosca Ascensori S.r.l. 66.67
Unilift S.r.l. 78.54
Kenya KONE Kenya Limited 100
Latvia SIA KONE Lifti Latvija 100 0.5
Lithuania UAB KONE 100 100
Luxembourg KONE Luxembourg Sàrl 100
Macedonia KONE Makedonija Dooel Skopje 100
Malaysia KONE Elevator (M) Sdn. Bhd. 47.85 47.85
Mexico KONE Industrial, S.A. de C.V. 100
KONE Industrial Servicios, S.A. de C.V. 100
KONE Mexico, S.A. de C.V. 100 0.1
Monaco S.A.M. KONE 99.87
Montenegro KONE d.o.o. Podgorica 100
Morocco KONE Elevators and Escalators Sàrl AU 100 100
Netherlands Hissi B.V. 100
KONE B.V. 100
KONE Deursystemen B.V. 100
KONE Finance Holding B.V. 100
KONE Holland B.V. 100 53.22
KONE Nederland Holding B.V. 100
CONSOLIDATED FINANCIAL STATEMENTS | PARENT COMPANY FINANCIAL STATEMENTS | SUBSIDIARIES
83
CONSOLIDATED FINANCIAL STATEMENTS | PARENT COMPANY FINANCIAL STATEMENTS | SUBSIDIARIES

KONE ANNUAL REVIEW 2020
Share holding %Country/Region Company Group Parent company
Norway KONE Aksjeselskap 100 100
KONE Rulletrapper AS 100 100
Oman KONE Assarain LLC 70
Philippines Elevators Philippines Construction, Inc. 40
KPI Elevators, Inc. 99.99
Poland KONE Sp.z o.o. 100 100
Portugal KONE Portugal - Elevadores, Lda. 100 1
JCC Companhia de Elevadores LDA 100
Qatar KONE Elevators W.L.L. 49 49
Romania KONE Ascensorul S.A. 100 99.99
Russia JSC KONE Lifts 100 100
Saudi Arabia KONE Areeco Limited 50 10
Serbia KONE d.o.o. Beograd-Novi Beograd 100
Singapore KONE Pte Ltd 100
Slovak Republic KONE s.r.o. 100 99.91
KONE SSC s.r.o. 100 100
Slovenia KONE d.o.o. 100 100
South Africa KONE Elevators South Africa (Pty) Ltd 100
United Elevators (Pty) Ltd 100
Addo Private Equity Fund 2 (Pty) Ltd 100
Spain Ascensores Carrillo Alcalá S.L. 100
Ascensores Muralla, S.L. 100
Ascensores R Casado, S.A. 100
Citylift S.A. 100
Instalación y Mantenimiento Ascensores MP Baleares, S.L 100
KONE Elevadores, S.A. 100 99.99
MARVI ASCENSORES, S.L. 100
Sweden KONE AB 100
KONE Door AB 100
KONE Metro AB 100
Motala Hissar AB 100
Switzerland KONE (Schweiz) AG 100 100
Taiwan, China KONE Elevators Taiwan Co., Ltd 100
Kang-En Taiwan Elevator Technology Service Co., Ltd 100
Thailand KONE Public Company Limited 84.08
Thai Elevators and Escalators Company Limited 74
Thai Elevators Holding Company Limited 49
Tunisia KONE Elevators & Escalators Assembly 100
Turkey KONE Asansör Sanayi ve Ticaret A.S. 100
Uganda KONE Uganda Limited 100
Ukraine KONE Lifts LLC 100
United Arab Emirates KONE (Middle East) LLC 49 49
United Kingdom 21st Century Lifts Limited 100
Acre Lifts Limited 100
CrownAcre Lifts Limited 100
Express Elevators Limited 100
KONE (NI) Limited 100
United Kingdom KONE Pension Trustees Ltd. 100
KONE Plc 100 100
Lift Maintenance Limited 100
(Jersey) Rob Willder Lifts Limited 100
USA ENOK Electrical Company, LLC 100
KONE Holdings, Inc. 100
KONE Inc. 100
Marine Elevators LLC 100
Vietnam KONE Vietnam Limited Liability Company 100
CONSOLIDATED FINANCIAL STATEMENTS | PARENT COMPANY FINANCIAL STATEMENTS | SUBSIDIARIES
84
CONSOLIDATED FINANCIAL STATEMENTS | PARENT COMPANY FINANCIAL STATEMENTS | SUBSIDIARIES
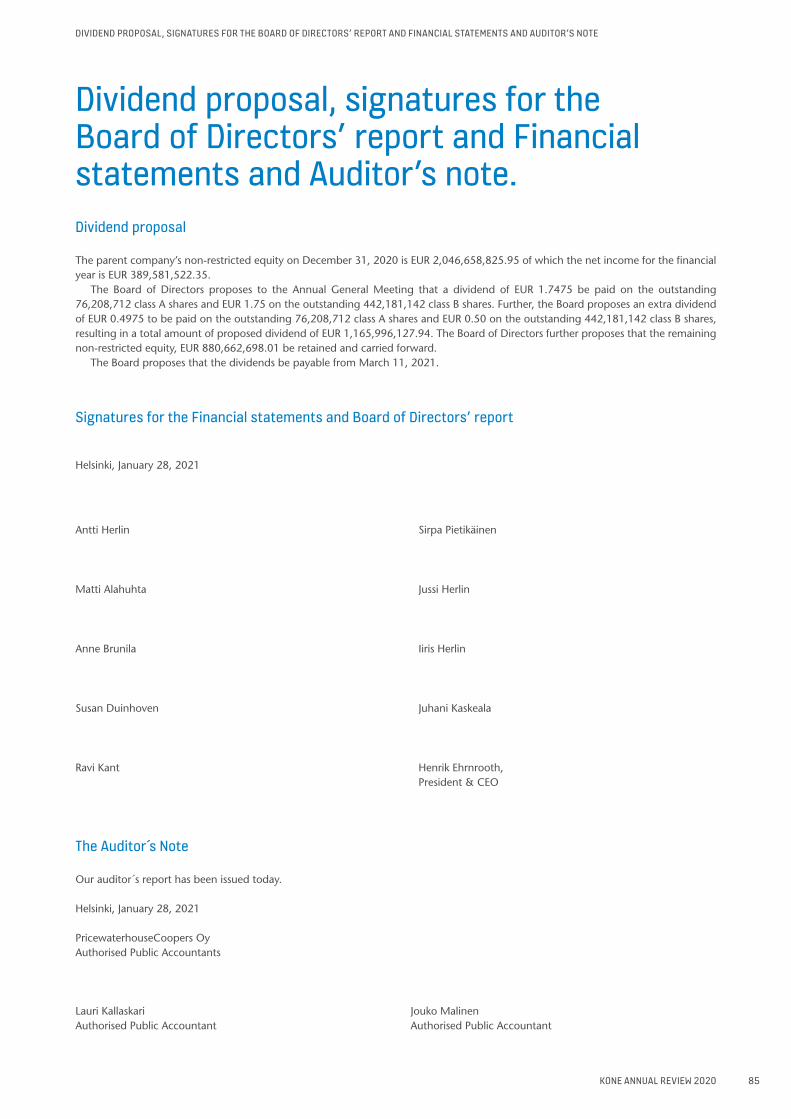
KONE ANNUAL REVIEW 2020
Dividend proposal, signatures for the Board of Directors’ report and Financial statements and Auditor’s note.Dividend proposal
The parent company’s non-restricted equity on December 31, 2020 is EUR 2,046,658,825.95 of which the net income for the financial year is EUR 389,581,522.35.
The Board of Directors proposes to the Annual General Meeting that a dividend of EUR 1.7475 be paid on the outstanding 76,208,712 class A shares and EUR 1.75 on the outstanding 442,181,142 class B shares. Further, the Board proposes an extra dividend of EUR 0.4975 to be paid on the outstanding 76,208,712 class A shares and EUR 0.50 on the outstanding 442,181,142 class B shares, resulting in a total amount of proposed dividend of EUR 1,165,996,127.94. The Board of Directors further proposes that the remaining non-restricted equity, EUR 880,662,698.01 be retained and carried forward.
The Board proposes that the dividends be payable from March 11, 2021.
Signatures for the Financial statements and Board of Directors’ report
Helsinki, January 28, 2021
Antti Herlin Sirpa Pietikäinen
Matti Alahuhta Jussi Herlin
Anne Brunila Iiris Herlin
Susan Duinhoven Juhani Kaskeala
Ravi Kant Henrik Ehrnrooth,President & CEO
The Auditor s Note
Our auditor´s report has been issued today.
Helsinki, January 28, 2021
PricewaterhouseCoopers OyAuthorised Public Accountants
Lauri Kallaskari Jouko MalinenAuthorised Public Accountant Authorised Public Accountant
DIVIDEND PROPOSAL, SIGNATURES FOR THE BOARD OF DIRECTORS’ REPORT AND FINANCIAL STATEMENTS AND AUDITOR’S NOTE
85
DIVIDEND PROPOSAL, SIGNATURES FOR THE BOARD OF DIRECTORS’ REPORT AND FINANCIAL STATEMENTS AND AUDITOR’S NOTE
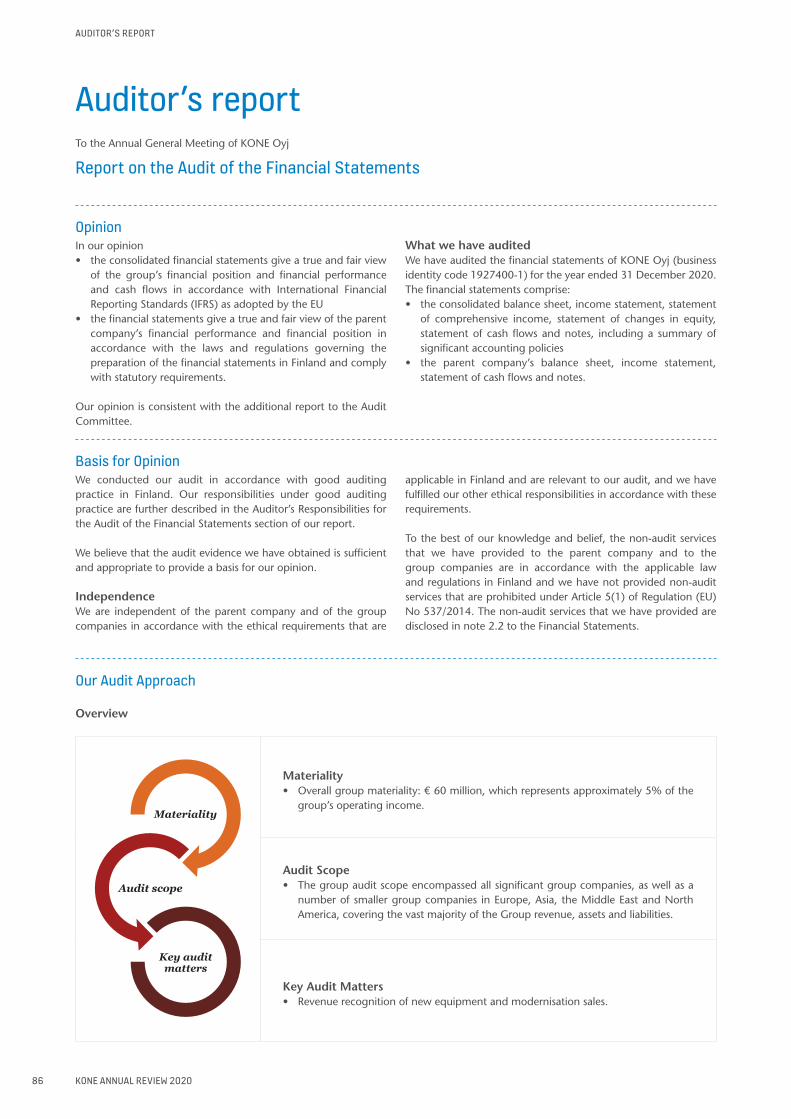
KONE ANNUAL REVIEW 2020
Auditor’s reportTo the Annual General Meeting of KONE Oyj
Report on the Audit of the Financial Statements
OpinionIn our opinion • the consolidated financial statements give a true and fair view
of the group’s financial position and financial performance and cash flows in accordance with International Financial Reporting Standards (IFRS) as adopted by the EU
• the financial statements give a true and fair view of the parent company’s financial performance and financial position in accordance with the laws and regulations governing the preparation of the financial statements in Finland and comply with statutory requirements.
Our opinion is consistent with the additional report to the Audit Committee.
What we have auditedWe have audited the financial statements of KONE Oyj (business identity code 1927400-1) for the year ended 31 December 2020. The financial statements comprise:• the consolidated balance sheet, income statement, statement
of comprehensive income, statement of changes in equity, statement of cash flows and notes, including a summary of significant accounting policies
• the parent company’s balance sheet, income statement, statement of cash flows and notes.
Basis for Opinion We conducted our audit in accordance with good auditing practice in Finland. Our responsibilities under good auditing practice are further described in the Auditor’s Responsibilities for the Audit of the Financial Statements section of our report.
We believe that the audit evidence we have obtained is sufficient and appropriate to provide a basis for our opinion.
IndependenceWe are independent of the parent company and of the group companies in accordance with the ethical requirements that are
applicable in Finland and are relevant to our audit, and we have fulfilled our other ethical responsibilities in accordance with these requirements.
To the best of our knowledge and belief, the non-audit services that we have provided to the parent company and to the group companies are in accordance with the applicable law and regulations in Finland and we have not provided non-audit services that are prohibited under Article 5(1) of Regulation (EU) No 537/2014. The non-audit services that we have provided are disclosed in note 2.2 to the Financial Statements.
Our Audit Approach
Overview
Materiality• Overall group materiality: € 60 million, which represents approximately 5% of the
group’s operating income.
Audit Scope• The group audit scope encompassed all significant group companies, as well as a
number of smaller group companies in Europe, Asia, the Middle East and North America, covering the vast majority of the Group revenue, assets and liabilities.
Key Audit Matters• Revenue recognition of new equipment and modernisation sales.
AUDITOR’S REPORT
86
AUDITOR’S REPORT
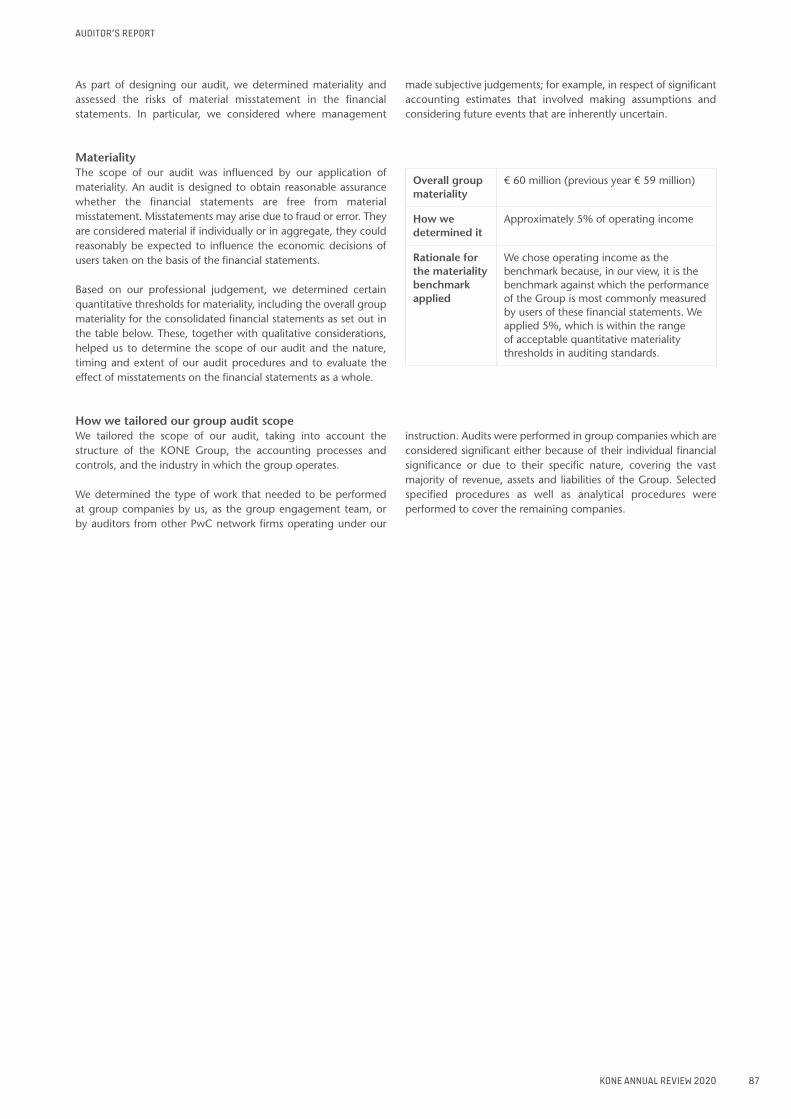
KONE ANNUAL REVIEW 2020
As part of designing our audit, we determined materiality and assessed the risks of material misstatement in the financial statements. In particular, we considered where management
made subjective judgements; for example, in respect of significant accounting estimates that involved making assumptions and considering future events that are inherently uncertain.
MaterialityThe scope of our audit was influenced by our application of materiality. An audit is designed to obtain reasonable assurance whether the financial statements are free from material misstatement. Misstatements may arise due to fraud or error. They are considered material if individually or in aggregate, they could reasonably be expected to influence the economic decisions of users taken on the basis of the financial statements.
Based on our professional judgement, we determined certain quantitative thresholds for materiality, including the overall group materiality for the consolidated financial statements as set out in the table below. These, together with qualitative considerations, helped us to determine the scope of our audit and the nature, timing and extent of our audit procedures and to evaluate the effect of misstatements on the financial statements as a whole.
Overall group materiality
€ 60 million (previous year € 59 million)
How we determined it
Approximately 5% of operating income
Rationale for the materiality benchmark applied
We chose operating income as the benchmark because, in our view, it is the benchmark against which the performance of the Group is most commonly measured by users of these financial statements. We applied 5%, which is within the range of acceptable quantitative materiality thresholds in auditing standards.
How we tailored our group audit scopeWe tailored the scope of our audit, taking into account the structure of the KONE Group, the accounting processes and controls, and the industry in which the group operates.
We determined the type of work that needed to be performed at group companies by us, as the group engagement team, or by auditors from other PwC network firms operating under our
instruction. Audits were performed in group companies which are considered significant either because of their individual financial significance or due to their specific nature, covering the vast majority of revenue, assets and liabilities of the Group. Selected specified procedures as well as analytical procedures were performed to cover the remaining companies.
AUDITOR’S REPORT
87
AUDITOR’S REPORT
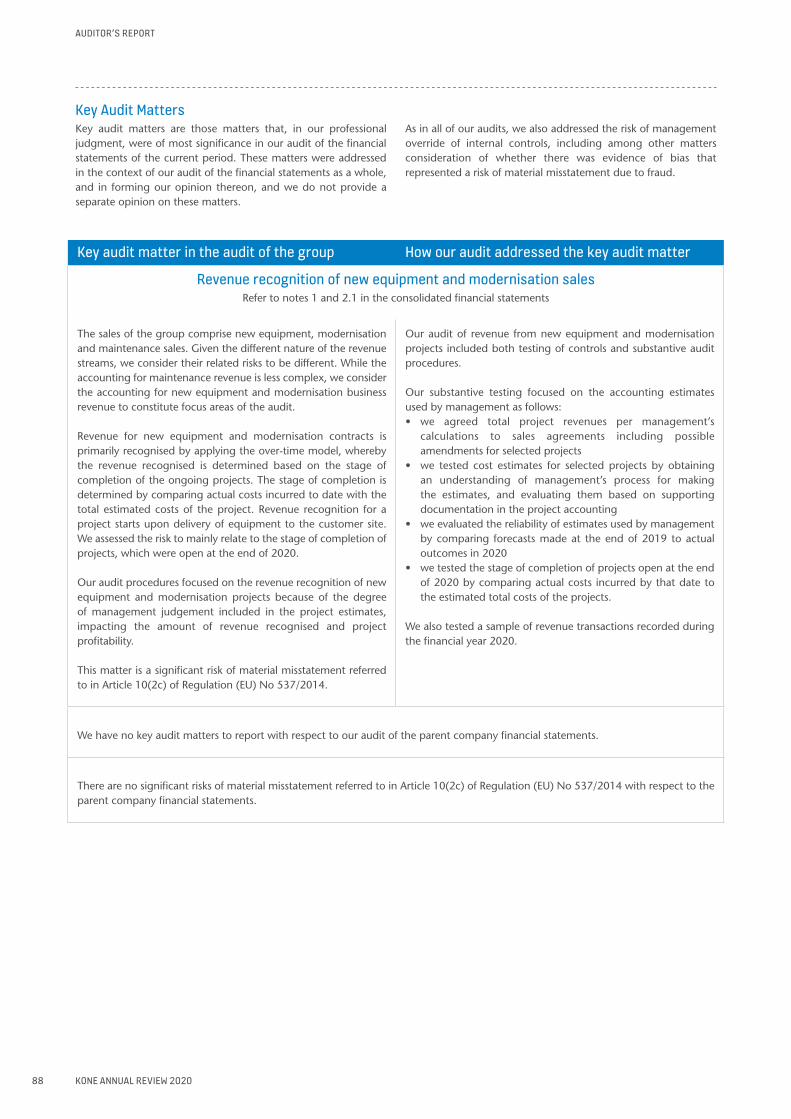
KONE ANNUAL REVIEW 2020
Key Audit Matters Key audit matters are those matters that, in our professional judgment, were of most significance in our audit of the financial statements of the current period. These matters were addressed in the context of our audit of the financial statements as a whole, and in forming our opinion thereon, and we do not provide a separate opinion on these matters.
As in all of our audits, we also addressed the risk of management override of internal controls, including among other matters consideration of whether there was evidence of bias that represented a risk of material misstatement due to fraud.
Key audit matter in the audit of the group How our audit addressed the key audit matter
Revenue recognition of new equipment and modernisation salesRefer to notes 1 and 2.1 in the consolidated financial statements
The sales of the group comprise new equipment, modernisation and maintenance sales. Given the different nature of the revenue streams, we consider their related risks to be different. While the accounting for maintenance revenue is less complex, we consider the accounting for new equipment and modernisation business revenue to constitute focus areas of the audit.
Revenue for new equipment and modernisation contracts is primarily recognised by applying the over-time model, whereby the revenue recognised is determined based on the stage of completion of the ongoing projects. The stage of completion is determined by comparing actual costs incurred to date with the total estimated costs of the project. Revenue recognition for a project starts upon delivery of equipment to the customer site. We assessed the risk to mainly relate to the stage of completion of projects, which were open at the end of 2020.
Our audit procedures focused on the revenue recognition of new equipment and modernisation projects because of the degree of management judgement included in the project estimates, impacting the amount of revenue recognised and project profitability.
This matter is a significant risk of material misstatement referred to in Article 10(2c) of Regulation (EU) No 537/2014.
Our audit of revenue from new equipment and modernisation projects included both testing of controls and substantive audit procedures.
Our substantive testing focused on the accounting estimates used by management as follows:• we agreed total project revenues per management’s
calculations to sales agreements including possible amendments for selected projects
• we tested cost estimates for selected projects by obtaining an understanding of management’s process for making the estimates, and evaluating them based on supporting documentation in the project accounting
• we evaluated the reliability of estimates used by management by comparing forecasts made at the end of 2019 to actual outcomes in 2020
• we tested the stage of completion of projects open at the end of 2020 by comparing actual costs incurred by that date to the estimated total costs of the projects.
We also tested a sample of revenue transactions recorded during the financial year 2020.
We have no key audit matters to report with respect to our audit of the parent company financial statements.
There are no significant risks of material misstatement referred to in Article 10(2c) of Regulation (EU) No 537/2014 with respect to the parent company financial statements.
AUDITOR’S REPORT
88
AUDITOR’S REPORT

KONE ANNUAL REVIEW 2020
Responsibilities of the Board of Directors and the Managing Director for the Financial StatementsThe Board of Directors and the Managing Director are responsible for the preparation of consolidated financial statements that give a true and fair view in accordance with International Financial Reporting Standards (IFRS) as adopted by the EU, and of financial statements that give a true and fair view in accordance with the laws and regulations governing the preparation of financial statements in Finland and comply with statutory requirements. The Board of Directors and the Managing Director are also responsible for such internal control as they determine is necessary to enable the preparation of financial statements that are free from material misstatement, whether due to fraud or error.
In preparing the financial statements, the Board of Directors and the Managing Director are responsible for assessing the parent company’s and the group’s ability to continue as a going concern, disclosing, as applicable, matters relating to going concern and using the going concern basis of accounting. The financial statements are prepared using the going concern basis of accounting unless there is an intention to liquidate the parent company or the group or to cease operations, or there is no realistic alternative but to do so.
Auditor’s Responsibilities for the Audit of the Financial StatementsOur objectives are to obtain reasonable assurance about whether the financial statements as a whole are free from material misstatement, whether due to fraud or error, and to issue an auditor’s report that includes our opinion. Reasonable assurance is a high level of assurance, but is not a guarantee that an audit conducted in accordance with good auditing practice will always detect a material misstatement when it exists. Misstatements can arise from fraud or error and are considered material if, individually or in the aggregate, they could reasonably be expected to influence the economic decisions of users taken on the basis of these financial statements.
As part of an audit in accordance with good auditing practice, we exercise professional judgment and maintain professional skepticism throughout the audit. We also:• Identify and assess the risks of material misstatement of the
financial statements, whether due to fraud or error, design and perform audit procedures responsive to those risks, and obtain audit evidence that is sufficient and appropriate to provide a basis for our opinion. The risk of not detecting a material misstatement resulting from fraud is higher than for one resulting from error, as fraud may involve collusion, forgery, intentional omissions, misrepresentations, or the override of internal control.
• Obtain an understanding of internal control relevant to the audit in order to design audit procedures that are appropriate in the circumstances, but not for the purpose of expressing an opinion on the effectiveness of the parent company’s or the group’s internal control.
• Evaluate the appropriateness of accounting policies used and the reasonableness of accounting estimates and related disclosures made by management.
• Conclude on the appropriateness of the Board of Directors’ and the Managing Director’s use of the going concern basis of accounting and based on the audit evidence obtained, whether a material uncertainty exists related to events or conditions that may cast significant doubt on the parent company’s or the group’s ability to continue as a going concern. If we conclude that a material uncertainty exists, we are required to draw attention in our auditor’s report to the related disclosures in
the financial statements or, if such disclosures are inadequate, to modify our opinion. Our conclusions are based on the audit evidence obtained up to the date of our auditor’s report. However, future events or conditions may cause the parent company or the group to cease to continue as a going concern.
• Evaluate the overall presentation, structure and content of the financial statements, including the disclosures, and whether the financial statements represent the underlying transactions and events so that the financial statements give a true and fair view.
• Obtain sufficient appropriate audit evidence regarding the financial information of the entities or business activities within the group to express an opinion on the consolidated financial statements. We are responsible for the direction, supervision and performance of the group audit. We remain solely responsible for our audit opinion.
We communicate with those charged with governance regarding, among other matters, the planned scope and timing of the audit and significant audit findings, including any significant deficiencies in internal control that we identify during our audit.
We also provide those charged with governance with a statement that we have complied with relevant ethical requirements regarding independence, and to communicate with them all relationships and other matters that may reasonably be thought to bear on our independence, and where applicable, related safeguards.
From the matters communicated with those charged with governance, we determine those matters that were of most significance in the audit of the financial statements of the current period and are therefore the key audit matters. We describe these matters in our auditor’s report unless law or regulation precludes public disclosure about the matter or when, in extremely rare circumstances, we determine that a matter should not be communicated in our report because the adverse consequences of doing so would reasonably be expected to outweigh the public interest benefits of such communication.
AUDITOR’S REPORT
89
AUDITOR’S REPORT

KONE ANNUAL REVIEW 2020
Other Reporting Requirements
AppointmentThe auditors who have signed the audit report have been acting as the auditors appointed by the annual general meeting of KONE Oyj as follows: PricewaterhouseCoopers Oy has, without interruption, been acting as the auditor for 64 years since first being appointed on 2 March 1957, when one Authorised Public Accountant (KHT) working for our firm was appointed as the auditor. The other auditor of KONE Oyj has been an
auditor working for our firm since 1.1.1988. Authorised Public Accountant (KHT) Jouko Malinen has, without interruption, been acting as the auditor since 26 February 2019 for two years. Our firm and Authorised Public Accountants (KHT) working for our firm have been acting as the auditors of KONE Oyj for the entirety of the duration that it has been a public interest entity.
Other Information The Board of Directors and the Managing Director are responsible for the other information. The other information comprises the report of the Board of Directors and the information included in the Annual Review, but does not include the financial statements and our auditor’s report thereon.
Our opinion on the financial statements does not cover the other information.
In connection with our audit of the financial statements, our responsibility is to read the other information and, in doing so, consider whether the other information is materially inconsistent with the financial statements or our knowledge obtained in the audit, or otherwise appears to be materially misstated. With respect to the report of the Board of Directors, our responsibility
also includes considering whether the report of the Board of Directors has been prepared in accordance with the applicable laws and regulations.
In our opinion• the information in the report of the Board of Directors is
consistent with the information in the financial statements• the report of the Board of Directors has been prepared in
accordance with the applicable laws and regulations.
If, based on the work we have performed, we conclude that there is a material misstatement of the other information, we are required to report that fact. We have nothing to report in this regard.
Helsinki 28 January 2021
PricewaterhouseCoopers OyAuthorised Public Accountants
Lauri Kallaskari Jouko MalinenAuthorised Public Accountant (KHT) Authorised Public Accountant (KHT)
AUDITOR’S REPORT
90
AUDITOR’S REPORT
KONE ANNUAL REVIEW 2020
Corporate governance statement
KONE’s general governance principlesThe duties and responsibilities of KONE Corporation’s various governing bodies are determined by Finnish law and KONE’s corporate governance principles. KONE complies with the Finnish Corporate Governance Code 2020 published by the Securities Market Association, with the exception of recommendations 16 (Independence of the company of the members of the audit committee), 17 (Independence of the company of the members of the remuneration committee) and 18 (Independence of the company of the members of the nomination com-mittee). The entire Code is available on the Internet at www.cgfinland.fi. These exceptions are due to the company’s ownership structure. The company’s larg-est shareholder, Antti Herlin, controls 62 percent of the company’s voting rights and 22 percent of its shares. The signifi-cant entrepreneurial risk associated with ownership is considered to justify the main shareholder serving as either Chairman or Member of the Board of Directors and of its Committees and, in this capacity, over-seeing the shareholders’ interests.
KONE’s administrative bodies and officers with the greatest decision-making power are the General Meeting of Share-holders, the Board of Directors of KONE Corporation, the full time Chairman of the Board and the President and CEO. At the Annual General Meeting of Shareholders, the shareholders approve the consolidated financial statements, decide on the distri-bution of profits, select the members of the Board of Directors and the auditors and determine their compensation.
KONE Corporation’s Annual General Meeting is convened by the Board of Directors. According to the Articles of Association, the Annual General Meeting of Shareholders shall be held within three months of the closing of the financial year on a date decided by the Board of Direc-tors.
Board of Directors
Duties and responsibilitiesThe Board of Directors’ duties and respon-sibilities are defined primarily by the Articles of Association and the Finnish Lim-ited Liability Companies’ Act. The Board’s duties include:
• compiling of the Board of Directors’ report, interim reports and financial statements
• ensuring the proper organization and surveillance of the accounting and asset management
• preparation of proposals for the Gen-eral Meeting and the convocation of the General Meetings
• approval and confirmation of strategic guidelines and the principles of risk management
• ratification of annual budget and plans• appointment of a full-time Chairman
of the Board and a President and CEO, and decisions on the terms and condi-tions of their employment
• decisions on the company’s corporate structure
• decisions on major acquisitions and investments
• decisions on other matters falling under the Board’s responsibility by law
The Board has created rules of procedure stipulating the duties of the Board, its Chairman and its Committees. The Board of Directors holds six regular meetings a year and additional meetings as required. The Board of Directors reviews its own performance and procedures once a year.
Members of the BoardThe Annual General Meeting elects five to ten members and no more than three deputy members to the Board of Direc-tors for one year at a time in accordance with KONE Corporation’s Articles of Association. The Board of Directors elects a Chairman and Vice Chairman among its members. The proposals for Board members are prepared at the Nomina-tion and Compensation Committee and under the steering of the Chairman of the Board. During the preparation and in the proposal to the General Meeting of Shareholders attention is paid to the board candidates’ broad and mutually complementary background, experience, expertise, age, gender and views of both KONE’s business and other businesses so that the diversity of the board supports KONE’s business and its future in the best available way. The independence of the members of the Board is assessed in line with the independence criteria of the Finnish Corporate Governance Code.
CommitteesThe Board of Directors has appointed two committees consisting of its members: the Audit Committee and the Nomination and Compensation Committee. The Board has confirmed rules of procedure for both Committees. The Secretary to the Board acts as the Secretary of both Committees.
The Audit Committee monitors the Group’s financial situation and supervises reporting related to the financial state-ments and interim reports. The Audit Committee monitors and assesses the adequacy and appropriateness of KONE’s internal control and risk management, as well as the adherence to rules and regulations. It also monitors and evaluates how agreements and other transactions between the company and its related parties meet the requirements relating to ordinary business operations and general market terms and monitors and oversees the financial statement and financial reporting process. In addition, the Audit Committee processes the description of the main features of the internal control and risk management systems pertaining to the financial reporting process included in the company’s corporate governance statement. In addition, it deals with the Corporation’s internal audit plans and reports. The Director of Internal Audit reports the internal audit results to the Committee.
The Audit Committee evaluates the auditing of the Group’s companies and the appropriateness of the related arrange-ments and auditing services and considers the auditors’ reports. Furthermore, the Committee formulates a proposal to the Annual General Meeting regarding the auditors to be selected for the Corpora-tion.
The Nomination and Compensation Committee prepares proposals to be made to the Annual General Meeting regarding the nomination of Board members and their compensation and makes decisions regarding senior management appoint-ments and compensation. The Committee also decides on the compensation systems to be used and prepares the remuneration policy and remuneration report for the company´s governing bodies.
CORPORATE GOVERNANCE STATEMENT | CORPORATE GOVERNANCE PRINCIPLES
91
CORPORATE GOVERNANCE STATEMENT | CORPORATE GOVERNANCE PRINCIPLES

KONE ANNUAL REVIEW 2020
More information
Most significant risks and uncertainties related to KONE’s business are described in the Board of Directors’ Report. Financial risk management is described in note 2.4 and 5.3.
Management
Full-time Chairman of the Board and the President and CEOKONE Corporation’s Board of Directors appoints the full-time Chairman of the Board and the President and CEO. The Board determines the terms and condi-tions of employment of the full-time Chairman of the Board and the President and CEO, and these are defined in their respective written contracts. The Chair-man of the Board prepares matters to be considered by the Board together with the President and CEO and the corporate staff. The Chairman of the Board and the President and CEO are responsible for the execution of the targets, plans, strategies and goals set by the Board of Directors within the KONE Group. The President and CEO is responsible for operational leadership within the scope of the stra-tegic plans, budgets, operational plans, guidelines and orders approved by KONE Corporation’s Board of Directors. The President and CEO presents operational issues to the Board, and is responsible for implementing the decisions of the Board.
Executive BoardThe Executive Board supports the Presi-dent and CEO in executing the corporate strategy. The Executive Board follows busi-ness developments, initiates actions and defines operating principles and methods in accordance with guidelines handed down by the Board of Directors and the President and CEO. The Executive Board holds regular monthly meetings and addi-tional meetings as required.
Risk management, internal control and internal and external audit at KONEKONE Corporation’s Board of Directors has ratified the principles of risk manage-ment, internal control and internal audit-ing to be followed within the Group.
Risk managementKONE’s Risk Management function coor-dinates and develops a systematic assess-ment of risks and opportunities within core business planning and decision-mak-ing processes together with the Strategy Development function.
KONE Risk Management function oversees and facilitates the assessment of risks and opportunities related to KONE’s business environment, operations, assets and financial performance in order to limit unnecessary or excessive risks. KONE’s business units are responsible for identify-ing, assessing and managing risks that can threaten the achievement of their business objectives as part of the strategic planning and budgeting processes. Key risks are reported to the Risk Management func-tion, which consolidates the risk informa-tion to the Executive Board. The Board of Directors reviews the KONE risk portfolio regularly based on the Executive Board’s assessment. The ownership of identi-fied risk exposures is assigned to specific business units, and the Risk Management function facilitates and follows-up the execution of the identified actions.
Internal controlThe goal of KONE’s internal control sys-tem is to ensure that the Group’s opera-tions are efficient and profitable, risks are managed, eliminated or mitigated to an acceptable level and that the financial and operational reporting is reliable and in compliance with the applicable regula-tions, policies and practices.
The Board’s Audit Committee moni-tors the efficiency and functioning of the internal control process. The management is responsible for establishing and main-taining adequate internal controls and for monitoring the effectiveness as part of operative management. This is supported by dedicated Internal Controls function, which is responsible for facilitating and coordinating the internal control design, implementation and monitoring across the organization.
The KONE internal control framework is built and based on corporate values, Code of Conduct, a culture of honesty and high ethical standards. Such framework is promoted by dedicated leadership, train-ing programs, positive and disciplined cor-porate culture and working environment
as well as by attracting and promoting dedicated and competent employees.
KONE internal controls are designed to manage, eliminate and mitigate the relevant operational, financial, and compliance risks, and they are linked to KONE’s processes and employee job roles. Controls are supported by global and local policies and principles, and control design is continuously maintained by incorporat-ing the changes and development from the business operations and information systems.
KONE business units are responsible for implementing the control framework and for monitoring adherence of globally and locally agreed policies and principles. Global Finance and Control has the over-sight responsibility of the overall frame-work.
Internal control procedures over financial reportingCorrect financial reporting in KONE’s internal control framework means that its financial statements give a true and fair view of the financial performance of the operations and the financial position of the group and that such statements do not include intentional or unintentional mis-statements or omissions both in respect of the figures and level of disclosure.
Corporate-wide financial management and control of operations is coordinated by the Global Finance and Control func-tion and implemented by a network of subsidiary and business entity Controllers within KONE.
KONE’s monthly business planning and financial reporting process represents a key control procedure within KONE in ensuring the effectiveness and efficiency of operations. This process includes in-depth analyses of deviations between actual performance, budgets, prior year perfor-mance and latest forecasts for the business on multiple levels of the organization. The process covers financial information as well as key performance indicators that measure the operational performance on a business unit and corporate level. The process is designed to ensure that any deviations from plans, in terms of financial or operating performance and financial management policies are identified, com-municated and reacted upon efficiently, in a harmonized and timely manner. KONE’s financial statements are based on this management reporting process.
Financial control tasks are built into the business processes of KONE as well as into the ongoing business supervision and monitoring of the management. KONE has established Financial Control Models for new equipment and service businesses
CORPORATE GOVERNANCE STATEMENT | CORPORATE GOVERNANCE PRINCIPLES
92
CORPORATE GOVERNANCE STATEMENT | CORPORATE GOVERNANCE PRINCIPLES

KONE ANNUAL REVIEW 2020
More information
This statement is available on the company’s web pages at www.kone.com and it has been given separately of the Board of Directors’ report.
as well as for treasury and tax matters. The models have been defined to ensure that the financial control covers the relevant tasks in an efficient and timely manner.
The interpretation, application and monitoring of the compliance of account-ing standards is centralized in the Global Finance and Control function, which maintains, under the supervision of the Audit Committee, the KONE Accounting Standards. Reporting and forecasting con-tents are defined in the KONE Accounting and Reporting Instructions. These stan-dards and instructions are maintained and updated centrally by the Global Finance and Control function and applied uni-formly throughout KONE.
KONE has a global enterprise resource planning (ERP) system which is built to reflect the KONE Accounting Standards and KONE Accounting and Reporting Instructions. KONE applies a controlled change management process ensuring that no changes to the financial report-ing logic of the ERP system can be made without approval from the Global Finance and Control function. Automatic inter-faces between different systems are prin-cipally applied in the period-end financial reporting process of KONE. Transactional processing is increasingly automated and centralized in dedicated shared service centers.
Effective internal control over record to report processes, from business processes and systems to the financial statements, is important in ensuring the correctness of financial reporting. This is driven by the identification of key data elements of the business and the quality of the data to ensure correct financial reporting and forecasting ability.
Internal auditThe Corporation has an Internal Audit Department, which is separate from the management. The Head of Internal Audit
reports to the Chairman of the Board. The Internal Audit Department is respon-sible for auditing both the internal control system and the management of business risks. It reports its findings to the Audit Committee.
Related party transactionsKONE evaluates and monitors related party transactions between the company and its related parties. KONE maintains a list of related parties. KONE’s related par-ties comprise its subsidiaries as well as the Board of Directors, the President and CEO, the Executive Board including any compa-nies controlled or significantly influenced by them. KONE’s Board of Directors has approved guidelines how to recognize, handle, approve, monitor and report related party transactions. According to the guidelines, the Corporate Controlling function follows and monitors related party transactions as part KONE’s normal reporting and control procedures and reports related party transactions to the Audit Committee annually.
KONE’s Board of Directors decides on any related party transactions which are not considered normal business activities or differ from market terms. KONE reports relevant and material related party trans-actions annually in the notes of consoli-dated financial statements.
External auditThe objective of a statutory audit is to express an opinion whether the consoli-dated financial statements give a true and fair view of the financial position, financial performance and cash flows of the group, as well as whether the parent company’s financial statements give a true and fair view of the parent company’s financial performance and financial position. Statu-tory audit encompasses also the audit of the accounting and governance in the company. The auditor considers whether the information in the Board of Directors’ report is consistent with the information in the financial statements and the report of the Board of Directors has been prepared in accordance with the applicable legal requirements.
According to the Articles of Associa-tion, the company must have a minimum of one and a maximum of three Auditors. The Auditors must be public accountants or public accounting firms authorized by Finland’s Central Chamber of Commerce. The Auditor is elected at the Annual Gen-eral Meeting for a term which expires at the end of the following Annual General Meeting.
InsidersKONE Corporation adheres to the insider guidelines of the Nasdaq Helsinki Ltd, which have been supplemented with internal insider guidelines approved by the Board of Directors. In compliance with the Market Abuse Regulation, the person discharging managerial responsibilities in KONE Corporation (managers) include the members and deputy members of the Board of Directors, the President and CEO and members of the Executive Board. Managers are permitted to trade in KONE shares and other financial instru-ments of KONE during a six-week period after the release of interim reports and financial statements releases. KONE does not maintain a list of permanent insiders. KONE has resolved to maintain the insider list with respect to each quarter and year-end financial reporting. The company also maintains other project-specific insider lists when necessary. Project-specific insiders are prohibited from trading with financial instruments of KONE until the termination of the project.
The person in charge of KONE’s insider issues is the Secretary to the Board of Directors.
Corporate governance in 2020
Annual General MeetingThe Annual General Meeting was held in Helsinki, Finland on February 25 February, 2020.
Board of Directors and committeesThe Annual General Meeting elected nine members to KONE’s Board of Directors. The full-time Chairman of the Board of Directors of KONE Corporation is Antti Herlin. Jussi Herlin is the Vice Chairman of the Board. The other members of the Board are Matti Alahuhta, Anne Brunila, Susan Duinhoven, Iiris Herlin, Ravi Kant, Juhani Kaskeala and Sirpa Pietikäinen. Out of the nine Board Members, five are male and four females.
Of the Board members, Matti Ala-huhta, Anne Brunila, Susan Duinhoven, Iiris Herlin, Ravi Kant, Juhani Kaskeala and Sirpa Pietikäinen are independent of the Corporation. With the exception of Antti Herlin, Iiris Herlin and Jussi Herlin, the other Board members are independent of the Corporation’s significant shareholders.
In 2020, the Board of Directors con-vened 8 times, with an average atten-dance rate of 99%. Jukka Ala-Mello serves as Secretary to the Board and to its Com-mittees.
CORPORATE GOVERNANCE STATEMENT | CORPORATE GOVERNANCE PRINCIPLES
93
CORPORATE GOVERNANCE STATEMENT | CORPORATE GOVERNANCE PRINCIPLES

KONE ANNUAL REVIEW 2020
Audit committeeThe Board of Directors’ Audit Committee comprises Ravi Kant (Chairman, indepen-dent member), Anne Brunila (independent member), Antti Herlin and Jussi Herlin.
The Audit Committee held 3 meetings in 2020, with an average attendance rate of 83%
Kristian Snäll serves as the Head of Internal Audit.
Nomination and compensation committeeThe Nomination and Compensation Com-mittee comprises Antti Herlin (Chairman), Matti Alahuhta (independent member), Jussi Herlin and Juhani Kaskeala (indepen-dent member).
The Nomination and Compensation Committee held 4 meetings in 2020, with an average attendance rate of 100%.
Number of Board and Committee meetings in 2020 and participant attendance:
BoardAudit
Committee
Nomination and Compensation
CommitteeAntti Herlin 8/8 2/3 4/4Jussi Herlin 8/8 3/3 4/4Matti Alahuhta 8/8 4/4Anne Brunila 7/8 2/3Susan Duinhoven 7/7Iiris Herlin 8/8Ravi Kant 8/8 3/3Juhani Kaskeala 8/8 4/4Sirpa Pietikäinen 8/8
Compensation and other benefits of the Board of DirectorsThe Annual General Meeting of KONE Corporation in February 2020 confirmed the fees of the members of the Board as follows (annual fees in EUR):
Chairman of the Board 60,000Vice chairman 50,000Member 45,000
Of the annual remuneration, 40 percent was paid in class B shares of KONE Cor-poration and the rest in cash. In addition, a compensation of EUR 500 was approved for attendance at Board and Committee meetings but anyhow a fee of EUR 3,000 is paid per Committee meeting for a Chair-man of the Committee residing outside of Finland and a fee of EUR 2,000 is paid per Committee meeting for those members residing outside of Finland. Board mem-bers’ travel expenses and daily allowances are compensated in accordance with the company’s travel expense policy.
Compensation and other benefits of the ChairmanThe compensation for Antti Herlin, full-time Chairman of the Board, consists of a base salary and a yearly bonus decided by the Board on the basis of the Group’s financial result. The yearly bonus may
not exceed 100 percent of the recipient’s annual salary. In 2020, Antti Herlin’s basic salary was EUR 468,488. In addition, his accrued bonus for 2020 totaled EUR 290,462. He was also paid EUR 66,500 as compensation for serving as Chairman of the Board. Antti Herlin’s holdings of shares are presented in the table on page 95.
The full-time Chairman’s retirement age and pension are determined in accor-dance with Finland’s Pensions Act. No separate agreement regarding early retire-ment has been made.
President and CEOHenrik Ehrnrooth serves as KONE Corpo-ration’s President and CEO.
Compensation and other benefits of the President and CEOThe President and CEO’s compensation consists of a basic salary and a yearly bonus determined annually by the Board on the basis of the Corporation’s key targets. The yearly bonus may not exceed 100 percent of the recipient’s annual sal-ary.
Henrik Ehrnrooth’s annual base salary is EUR 750,000. In addition, his accrued bonus for 2020 totaled EUR 493,500. Henrik Ehrnrooth’s holdings of shares are presented in the table below.
Henrik Ehrnrooth is included in the share-based incentive plan for the Group’s senior management. In April 2020, on the basis of the incentive plan for year 2019, Henrik Ehrnrooth received a bonus of EUR 3,736,669 which consisted of 32,531 KONE class B shares together with a cash bonus to cover taxes and similar charges arising from the receipt of shares. The cor-responding bonus accrued from 2020 and due for payment in April 2021 is 17,625 KONE class B shares together with a cash bonus to cover taxes and similar charges arising from the receipt of shares.
Henrik Ehrnrooth’s retirement age and pension are determined in accordance with Finland’s Pensions Act. No separate agreement regarding early retirement has been made. Should his employment contract be terminated before retirement, he has the right to the equivalent of 18 months’ salary, which includes the salary for a six-month term of notice.
Executive BoardIn 2020, KONE’s Executive Board consisted of President and CEO and 12–13 Mem-bers. Henrik Ehrnrooth serves as President and CEO. The other members of Executive Board in 2020 were Max Alfthan (until 31 March, 2020), Axel Berkling, Klaus Cawén, Hugues Delval, Ilkka Hara, Thomas Hin-nerskov, William Johnson, Mikko Korte, Maciej Kranz, Pierre Liautaud, Tomio Pih-kala, Ken Schmid (from March 1, 2020), Susanne Skippari and Larry Wash (until 28 February, 2020).
Compensation and other benefits of the Executive BoardThe compensation for the members of the Executive Board comprises a base salary and a yearly bonus, based on the Group’s annual result and the achievement of personal targets, which can relate to, for example, strategy execution, safety or quality. The bonus amount is determined by the Nomination and Compensation Committee and may not exceed 50 per-cent of the annual salary. The Executive Board members’ holdings of shares are presented in the below table.
The members of the Executive Board are included in the share-based incentive plan for senior management. In April 2020, on the basis of the incentive plan, the members of the Executive Board received a bonus 172,619 KONE class B shares together with a cash bonus equal to the amount required to cover taxes and similar charges arising from the receipt of shares. The corresponding bonus accrued from 2020 and due for payment in April 2021 is 83,897 KONE class B shares together with a cash bonus equal to the
CORPORATE GOVERNANCE STATEMENT | CORPORATE GOVERNANCE PRINCIPLES
94
CORPORATE GOVERNANCE STATEMENT | CORPORATE GOVERNANCE PRINCIPLES

KONE ANNUAL REVIEW 2020
CORPORATE GOVERNANCE STATEMENT | CORPORATE GOVERNANCE PRINCIPLES
amount of taxes and similar charges. No separate agreement regarding early retire-ment has been made for the members of the Executive Board. The compensation for the termination of the employment contract prior to retirement is a maximum of 15 months’ salary, which includes the salary for a six-month term of notice.
AuditingKONE Corporation’s Auditors are Jouko Malinen, Authorized Public Accountant, and PricewaterhouseCoopers Oy, Autho-rized Public Accountants. The fees paid to companies in the PricewaterhouseCoopers chain for 2020 were EUR 3.7 million for auditing and EUR 2.8 million for other consulting services.
InsidersThe holdings of the Board of Directors and Management of KONE on December 31, 2020 and the changes occurring in them during the financial year are presented in the table below.
Related party transactionsExcept for management remuneration, there have not been any material transac-tions between KONE and its members of the Board of Directors, the President & CEO, the Executive Board including any companies controlled or significantly influ-enced by them.
More information
As of July 3, 2016, the trades of KONE Board and Management are published as stock exchange releases.
More information
Board of Directors, page 96Executive Board, page 97–98
Shareholdings and options of KONE Board and Management on Dec 31, 2020 and changes in shareholding during the period Jan 1–Dec 31, 2020
Class A shares Change
Class B shares Change
Alahuhta Matti 754,294 +351
Berkling Axel 61,924 +13,013
Brunila Anne 3,334 +351
Cawén Klaus 368,312 +13,013
Delval Hugues 47,199 -1,987
Duinhoven Susan 351 +351
Ehrnrooth Henrik 371,272 +32,531
Hara Ilkka 48,515 +13,013
Herlin Antti 70,561,608 - 47,737,946 +801,468
Herlin Iiris 135,341 +351
Herlin Jussi 109,667 +390
Hinnerskov Thomas 55,179 +13,013
Johnson William 134,122 +8,013
Kant Ravi 2,494 +351
Kaskeala Juhani 3,318 +351
Korte Mikko 67,058 +11,713
Kranz Maciej 38,013 +38,013
Liautaud Pierre 53,296 -15,987
Pietikäinen Sirpa 8,494 +351
Pihkala Tomio 106,608 +13,013
Schmid Ken 17,818 +4,476
Skippari Susanne 39,682 +13,013
Max Alfthan was a member of the Executive Board until March 31, 2020 and owned 58,875 KONE class B shares on that date. Larry Wash was a member of the Executive Board until February 28, 2020 and owned 69,033 KONE class B shares on that date. The shares owned by companies in which the Board Member or Management exercises controlling power and minor children are also included in these shareholdings.
95
CORPORATE GOVERNANCE STATEMENT | CORPORATE GOVERNANCE PRINCIPLES
KONE ANNUAL REVIEW 2020
More information
Shareholdings of KONE Corpora-tion’s public insiders are available on page 95.
More information
Corporate governance, page 91.
Board of DirectorsAntti HerlinChairman of the Boardb. 1956, D.Sc. (Econ.) h.c., D.Arts h.c., D.Sc. (Tech) h.c. Member of the Board since 1991. Has served as Chairman of the Board since 2003. Previously served as CEO of KONE 1996–2006 and as Deputy Chairman 1996–2003. Current key positions of trust are Chair-man of the Board of Security Trading Oy, Chairman of the Board of Holding Manu-tas Oy, Chairman of the Board of the Tiina and Antti Herlin Foundation and Vice Chairman of the Board of Sanoma Corpo-ration.
Jussi HerlinVice Chairman of the Boardb. 1984, M.Sc. (Econ)Member of the Board since 2012.Previously served as Senior Business Ana-lyst and Strategy Development Manager at KONE 2016–2020, as Consultant at Accenture between 2012–2014 and as Deputy Member of the Board of KONE Corporation during the years 2007–2012. Current key positions of trust are Mem-ber of the Board of Security Trading Oy, Member of the Board of Holding Manutas Oy, Member of the Board of the Tiina and Antti Herlin Foundation, Member of the Board of Kaskas Media Oy and Member of the Board of Technology Industries of Finland.
Matti Alahuhtab. 1952, D. Sc. (Tech.), D.Sc. (Tech.) h.c.Member of the Board since 2003.Previously served as President of KONE since 2005, and President & CEO since 2006 to 2014, as Executive Vice President of Nokia Corporation 2004, as President of Nokia Mobile Phones 1998–2003 and as President of Nokia Telecommunications 1993–1998. Current key positions of trust are Chair-man of the Board of DevCo Partners Cor-poration, Vice Chairman of the Board of Metso Outotec Corporation, Member of the Board of AB Volvo and Member of the Board of ABB Ltd.
Anne Brunilab. 1957, D.Sc. (Econ.), D.Sc. (Econ.) h.c.Member of the Board since 2009.Previously served as Professor of Practice, Hanken School of Economics 2014–2018, as Executive Vice President, Corporate Relations and Strategy and Member of the Management Team of Fortum 2009–2012, as President and CEO of the Finnish Forest Industries Federation 2006–2009, in the Finnish Ministry of Finance as Direc-tor General 2003–2006 and in several advisory and executive positions in the Bank of Finland 1992–2000 and in the European Commission 2000–2002. Cur-rent key position of trust is Chair of the Board of the Finnish Film Foundation.
Susan Duinhovenb. 1965, Ph.D. (Physical Chemistry), B. Sc. (Physical Chemistry)Member of the Board since 2020.Serves as President and CEO of Sanoma Corporation since 2015. Previously served as CEO of Koninklijke Wegener N.V. 2013–2015, as CEO of Western Europe/CEO Netherlands at Thomas Cook Group Plc 2010–2013, as Managing Director of Ben-elux & New Acquisitions Europe at Read-er’s Digest 2008–2010, and as CEO at De Gule Sider A/S 2005–2007 and started her career at Unilever in 1988.
Iiris Herlinb. 1989, M.Soc.Sc.Member of the Board since 2015. Deputy Member of the Board during the years 2013–2014.Current key positions of trust are Member of the Board of Security Trading Oy and Member of the Board of the Tiina and Antti Herlin Foundation.
Ravi Kantb. 1944, B.Tech. (Hons.), M.Sc., D.Sc. (Hon) Member of the Board since 2014.Previously served in different positions in Tata Motors since 1999, and as Manag-ing Director and CEO from 2005 to 2009 and after that as the Vice Chairman of the Board of Directors until 2014. Prior to that, he was Director, Consumer Elec-tronics, Philips India; Director (Marketing), LML Ltd. and Vice President (Marketing), Titan Watches Ltd. Current key positions of trust are Mem-ber of the Board of Hawkins Cookers Ltd, Member of the Advisory Board of Accen-ture India and Chairman of the Advisory Board of both MedTherapy India and Akhandjyoti Eye Hospital.
Juhani Kaskealab. 1946, Admiral.Member of the Board since 2009.Managing Director of Admiral Consulting Oy since 2011. Previously served in the Finnish Defence Forces in several positions 1965–2009, last as Commander of the Finnish Defence Forces 2001–2009. Current key positions of trust are Senior Advisor of Blic Oy and Member of the European Leadership Network.
Sirpa Pietikäinenb. 1959, M.Sc. (Econ.)Member of the Board since 2006.Served as Member of the European Par-liament since 2008 and as a negotiation theory lecturer and consultant since 1999. Previously served as a Member of Finland’s Parliament 1983–2003 and as Finland’s Minister of the Environment 1991–1995. Current key positions of trust are Chair of GLOBE EU, Chair of the Board of the Mar-tha Organisation, Vice Chair of the Board of Lammi Savings Bank, Chair of the Board of Federation Mieli Mental Health Finland and Member of the Board of Alzheimer Europe.
CORPORATE GOVERNANCE STATEMENT | BOARD OF DIRECTORS
96
CORPORATE GOVERNANCE STATEMENT | BOARD OF DIRECTORS
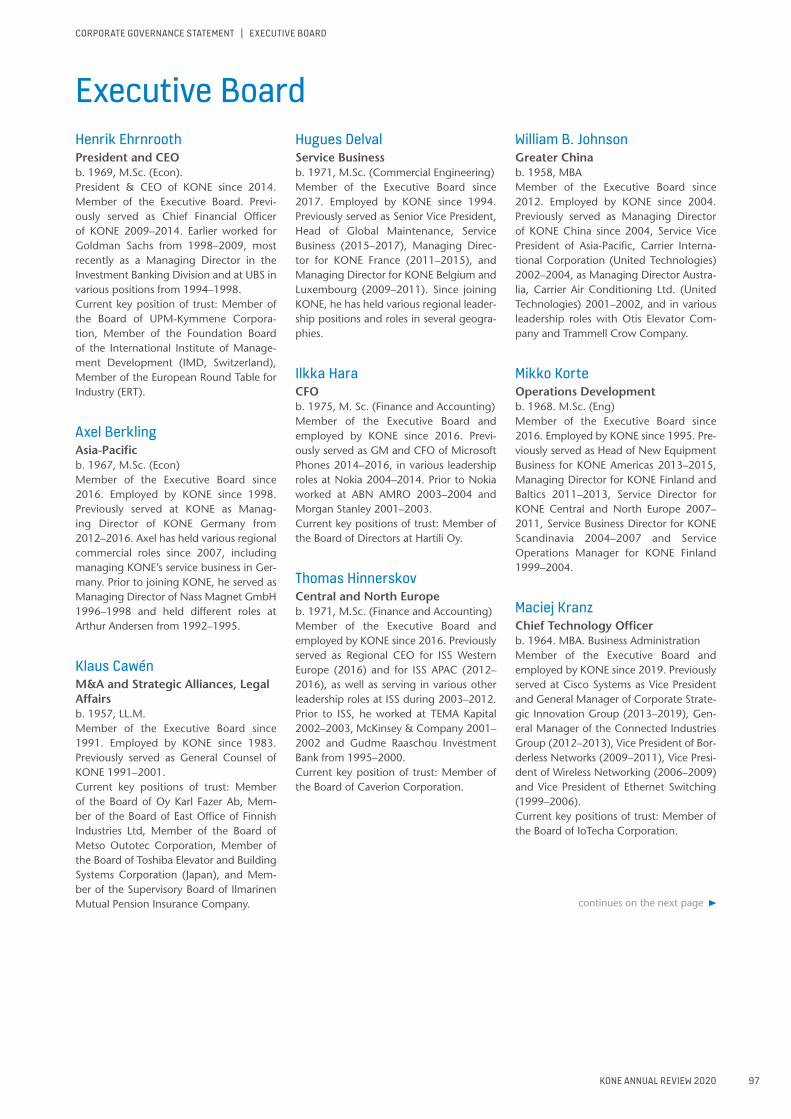
KONE ANNUAL REVIEW 2020
Executive BoardHenrik EhrnroothPresident and CEOb. 1969, M.Sc. (Econ).President & CEO of KONE since 2014. Member of the Executive Board. Previ-ously served as Chief Financial Officer of KONE 2009–2014. Earlier worked for Goldman Sachs from 1998–2009, most recently as a Managing Director in the Investment Banking Division and at UBS in various positions from 1994–1998. Current key position of trust: Member of the Board of UPM-Kymmene Corpora-tion, Member of the Foundation Board of the International Institute of Manage-ment Development (IMD, Switzerland), Member of the European Round Table for Industry (ERT).
Axel BerklingAsia-Pacificb. 1967, M.Sc. (Econ)Member of the Executive Board since 2016. Employed by KONE since 1998. Previously served at KONE as Manag-ing Director of KONE Germany from 2012–2016. Axel has held various regional commercial roles since 2007, including managing KONE’s service business in Ger-many. Prior to joining KONE, he served as Managing Director of Nass Magnet GmbH 1996–1998 and held different roles at Arthur Andersen from 1992–1995.
Klaus CawénM&A and Strategic Alliances, Legal Affairsb. 1957, LL.M.Member of the Executive Board since 1991. Employed by KONE since 1983. Previously served as General Counsel of KONE 1991–2001.Current key positions of trust: Member of the Board of Oy Karl Fazer Ab, Mem-ber of the Board of East Office of Finnish Industries Ltd, Member of the Board of Metso Outotec Corporation, Member of the Board of Toshiba Elevator and Building Systems Corporation (Japan), and Mem-ber of the Supervisory Board of Ilmarinen Mutual Pension Insurance Company.
Hugues DelvalService Businessb. 1971, M.Sc. (Commercial Engineering)Member of the Executive Board since 2017. Employed by KONE since 1994. Previously served as Senior Vice President, Head of Global Maintenance, Service Business (2015–2017), Managing Direc-tor for KONE France (2011–2015), and Managing Director for KONE Belgium and Luxembourg (2009–2011). Since joining KONE, he has held various regional leader-ship positions and roles in several geogra-phies.
Ilkka HaraCFOb. 1975, M. Sc. (Finance and Accounting)Member of the Executive Board and employed by KONE since 2016. Previ-ously served as GM and CFO of Microsoft Phones 2014–2016, in various leadership roles at Nokia 2004–2014. Prior to Nokia worked at ABN AMRO 2003–2004 and Morgan Stanley 2001–2003. Current key positions of trust: Member of the Board of Directors at Hartili Oy.
Thomas HinnerskovCentral and North Europeb. 1971, M.Sc. (Finance and Accounting)Member of the Executive Board and employed by KONE since 2016. Previously served as Regional CEO for ISS Western Europe (2016) and for ISS APAC (2012–2016), as well as serving in various other leadership roles at ISS during 2003–2012. Prior to ISS, he worked at TEMA Kapital 2002–2003, McKinsey & Company 2001–2002 and Gudme Raaschou Investment Bank from 1995–2000. Current key position of trust: Member of the Board of Caverion Corporation.
William B. JohnsonGreater Chinab. 1958, MBAMember of the Executive Board since 2012. Employed by KONE since 2004. Previously served as Managing Director of KONE China since 2004, Service Vice President of Asia-Pacific, Carrier Interna-tional Corporation (United Technologies) 2002–2004, as Managing Director Austra-lia, Carrier Air Conditioning Ltd. (United Technologies) 2001–2002, and in various leadership roles with Otis Elevator Com-pany and Trammell Crow Company.
Mikko KorteOperations Developmentb. 1968. M.Sc. (Eng)Member of the Executive Board since 2016. Employed by KONE since 1995. Pre-viously served as Head of New Equipment Business for KONE Americas 2013–2015, Managing Director for KONE Finland and Baltics 2011–2013, Service Director for KONE Central and North Europe 2007–2011, Service Business Director for KONE Scandinavia 2004–2007 and Service Operations Manager for KONE Finland 1999–2004.
Maciej KranzChief Technology Officerb. 1964. MBA. Business AdministrationMember of the Executive Board and employed by KONE since 2019. Previously served at Cisco Systems as Vice President and General Manager of Corporate Strate-gic Innovation Group (2013–2019), Gen-eral Manager of the Connected Industries Group (2012–2013), Vice President of Bor-derless Networks (2009–2011), Vice Presi-dent of Wireless Networking (2006–2009) and Vice President of Ethernet Switching (1999–2006). Current key positions of trust: Member of the Board of IoTecha Corporation.
CORPORATE GOVERNANCE STATEMENT | EXECUTIVE BOARD
continues on the next page
97
CORPORATE GOVERNANCE STATEMENT | EXECUTIVE BOARD
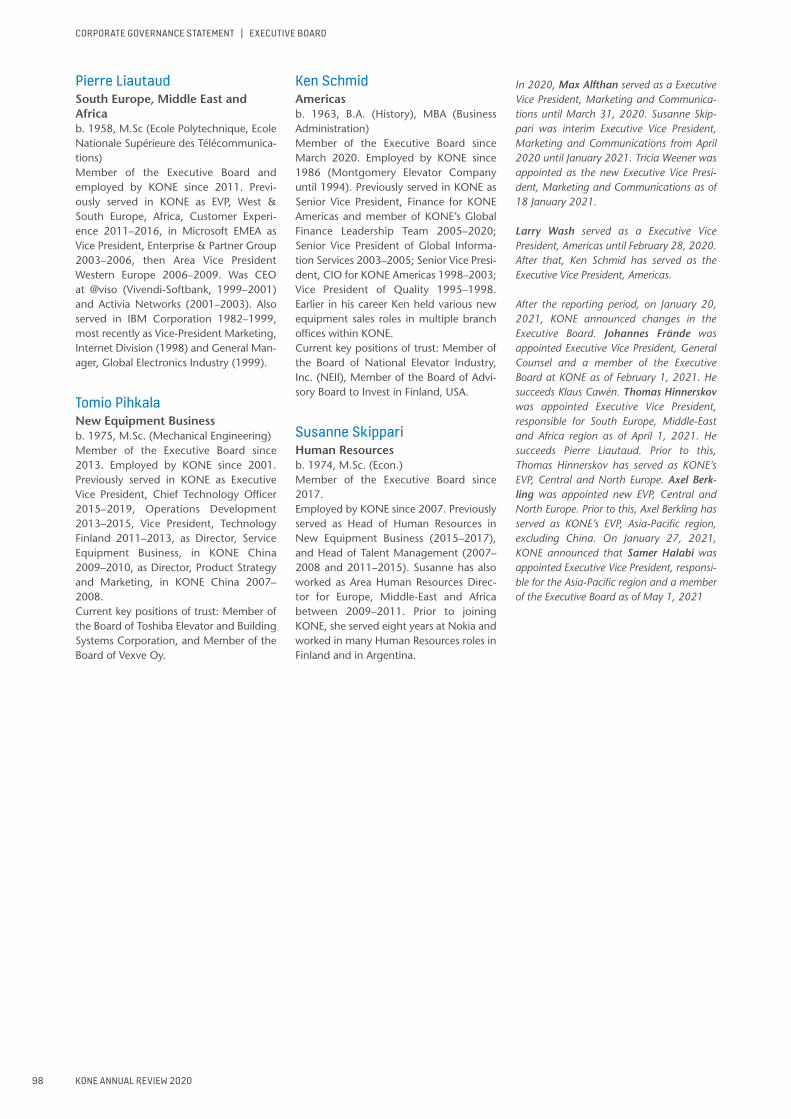
KONE ANNUAL REVIEW 2020
Pierre LiautaudSouth Europe, Middle East and Africab. 1958, M.Sc (Ecole Polytechnique, Ecole Nationale Supérieure des Télécommunica-tions)Member of the Executive Board and employed by KONE since 2011. Previ-ously served in KONE as EVP, West & South Europe, Africa, Customer Experi-ence 2011–2016, in Microsoft EMEA as Vice President, Enterprise & Partner Group 2003–2006, then Area Vice President Western Europe 2006–2009. Was CEO at @viso (Vivendi-Softbank, 1999–2001) and Activia Networks (2001–2003). Also served in IBM Corporation 1982–1999, most recently as Vice-President Marketing, Internet Division (1998) and General Man-ager, Global Electronics Industry (1999).
Tomio PihkalaNew Equipment Businessb. 1975, M.Sc. (Mechanical Engineering)Member of the Executive Board since 2013. Employed by KONE since 2001. Previously served in KONE as Executive Vice President, Chief Technology Officer 2015–2019, Operations Development 2013–2015, Vice President, Technology Finland 2011–2013, as Director, Service Equipment Business, in KONE China 2009–2010, as Director, Product Strategy and Marketing, in KONE China 2007–2008. Current key positions of trust: Member of the Board of Toshiba Elevator and Building Systems Corporation, and Member of the Board of Vexve Oy.
Ken SchmidAmericasb. 1963, B.A. (History), MBA (Business Administration)Member of the Executive Board since March 2020. Employed by KONE since 1986 (Montgomery Elevator Company until 1994). Previously served in KONE as Senior Vice President, Finance for KONE Americas and member of KONE’s Global Finance Leadership Team 2005–2020; Senior Vice President of Global Informa-tion Services 2003–2005; Senior Vice Presi-dent, CIO for KONE Americas 1998–2003; Vice President of Quality 1995–1998. Earlier in his career Ken held various new equipment sales roles in multiple branch offices within KONE. Current key positions of trust: Member of the Board of National Elevator Industry, Inc. (NEII), Member of the Board of Advi-sory Board to Invest in Finland, USA.
Susanne SkippariHuman Resourcesb. 1974, M.Sc. (Econ.)Member of the Executive Board since 2017.Employed by KONE since 2007. Previously served as Head of Human Resources in New Equipment Business (2015–2017), and Head of Talent Management (2007–2008 and 2011–2015). Susanne has also worked as Area Human Resources Direc-tor for Europe, Middle-East and Africa between 2009–2011. Prior to joining KONE, she served eight years at Nokia and worked in many Human Resources roles in Finland and in Argentina.
In 2020, Max Alfthan served as a Executive Vice President, Marketing and Communica-tions until March 31, 2020. Susanne Skip-pari was interim Executive Vice President, Marketing and Communications from April 2020 until January 2021. Tricia Weener was appointed as the new Executive Vice Presi-dent, Marketing and Communications as of 18 January 2021.
Larry Wash served as a Executive Vice President, Americas until February 28, 2020. After that, Ken Schmid has served as the Executive Vice President, Americas.
After the reporting period, on January 20, 2021, KONE announced changes in the Executive Board. Johannes Frände was appointed Executive Vice President, General Counsel and a member of the Executive Board at KONE as of February 1, 2021. He succeeds Klaus Cawén. Thomas Hinnerskov was appointed Executive Vice President, responsible for South Europe, Middle-East and Africa region as of April 1, 2021. He succeeds Pierre Liautaud. Prior to this, Thomas Hinnerskov has served as KONE’s EVP, Central and North Europe. Axel Berk-ling was appointed new EVP, Central and North Europe. Prior to this, Axel Berkling has served as KONE’s EVP, Asia-Pacific region, excluding China. On January 27, 2021, KONE announced that Samer Halabi was appointed Executive Vice President, responsi-ble for the Asia-Pacific region and a member of the Executive Board as of May 1, 2021
CORPORATE GOVERNANCE STATEMENT | EXECUTIVE BOARD
98
CORPORATE GOVERNANCE STATEMENT | EXECUTIVE BOARD

KONE ANNUAL REVIEW 2020
More information
The Board of Directors’ proposal for the distribution of profit, page 85 Shares and shareholders, page 27
Information for shareholdersAnnual General MeetingKONE Corporation’s Annual General Meeting will be held on Tuesday 2 March 2021 at 11.00 a.m. In order to prevent the spread of the COVID-19 pandemic, the company’s shareholders may partici-pate in the General Meeting and exercise their shareholder rights only by voting in advance and by submitting counterpro-posals and asking questions in advance.
Further instructions and schedules for shareholders can be found on KONE’s website at kone.com and in the Notice to the General meeting.
At general meetings, each KONE class A share is assigned one vote, as is each block of 10 class B shares, with the provi-sion that each shareholder is entitled to at least one vote.
Payment of dividendsThe Board of Directors proposes to the Annual General Meeting that for the finan-cial year 2020 dividend of EUR 1.7475 be paid for each class A share and a dividend of EUR 1.75 be paid for each class B share. Further, the Board proposes an extraordi-nary dividend of EUR 0.4975 to be paid on the outstanding class A shares and EUR 0.50 on the outstanding class B shares, resulting total dividend of 2.2450 per class A share and 2.25 per class B share. All shares existing on the dividend record date, March 4, 2020 are entitled to the dividend. The dividend is proposed to be paid on March 11, 2020.
Listing of KONE securities KONE Corporation has two classes of shares: the listed class B shares and the non-listed class A shares. The KONE class B shares are listed on the Nasdaq Helsinki Ltd. and are registered at Euroclear Fin-land Ltd.
INFORMATION FOR SHAREHOLDERS
99
INFORMATION FOR SHAREHOLDERS

KONE ANNUAL REVIEW 2020
Investor Relations policyKONE strives to offer liquid shares that present an attractive investment alterna-tive to domestic and foreign investors. The primary task of KONE’s Investor Relations is to ensure that the market has correct and sufficient information at its disposal in order to determine the value of the KONE share at all times. This task is being performed in KONE’s written communica-tions, such as the financial statements and interim reports, the corporate responsi-bility report, stock exchange and press releases, the internet pages as well as in all other communication with investors and analysts.
In all of its communications, KONE com-plies with the requirements for listed com-panies as defined by the Securities Markets Act, the rules of the Nasdaq Helsinki Ltd. and any other applicable regulation con-cerning prompt and simultaneous disclo-sure of information.
Silent periodKONE observes a period of silence prior to releasing financial results. This means that there will be no discussions regarding financial issues with the capital markets or the financial media during the three-week period preceding the publication of interim results and the four-week period preceding the publication of the annual financial statements. This applies to meet-ings, telephone conversations or other means of communication.
Contact informationSanna KajeVice President, Investor RelationsTel. +358 (0)204 75 [email protected]
KONE’s financial reporting schedule in 2021
Financial Statement Bulletin and Financial Statements for 2020 Thursday, January 28, 2021
Printed Financial Statements for 2020 Week 8–9 February, 2021
Interim report for January 1–March 31, 2021 Wednesday, April 28, 2021
Half-year Financial Report for January 1–June 30, 2021 Tuesday, July 20, 2021
Interim report for January 1–September 30, 2021 Thursday, October 28, 2021
In the second quarter of 2021, KONE will publish a separate Sustainability Report for the year 2020.
INVESTOR RELATIONS
Investor Relations
This bulletin contains forward-looking statements that are based on the current expectations, known factors, decisions and plans of the managementof KONE. Although the management believes that the expectations reflected in such forward-looking statements are reasonable, no assurance can begiven that such expectations will prove to be correct. Accordingly, results could differ materially from those implied in the forward-looking statementsas a result of, among other factors, changes in economic, market and competitive conditions, changes in the regulatory environment and other govern-ment actions as well as fluctuations in exchange rates.
This report has been laid out from the official KONE 2020 Annual Review for printing purposes. Due to different page layouts the page numbers in this report can differ from the official KONE 2020 Annual Review.
100
INVESTOR RELATIONS

Des
ign
Avid
ly, p
rintin
g Pa
inot
alo
Plus
Dig
ital,
Laht
i
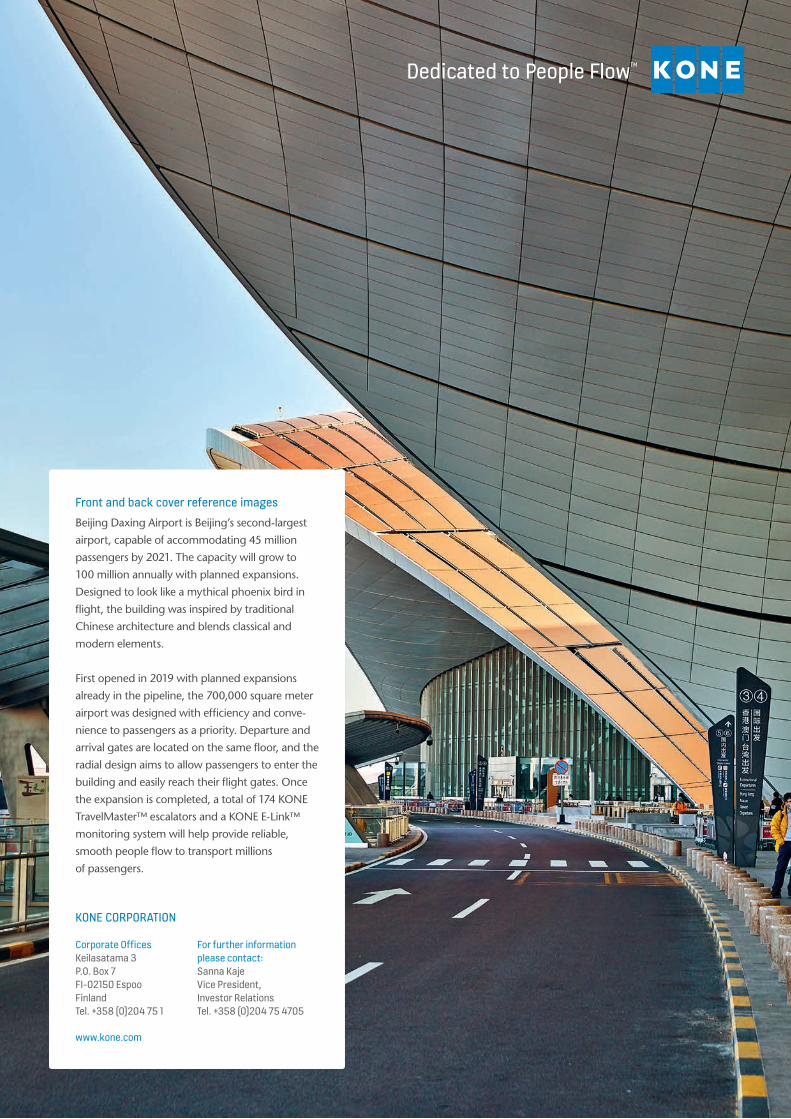
KONE 2020 ANNUAL REVIEW
www.kone.com
KONE CORPORATION
Corporate OfficesKeilasatama 3 P.O. Box 7 FI-02150 Espoo Finland Tel. +358 (0)204 75 1
For further information please contact:Sanna Kaje Vice President, Investor Relations Tel. +358 (0)204 75 4705
Front and back cover reference imagesBeijing Daxing Airport is Beijing’s second-largest
airport, capable of accommodating 45 million
passengers by 2021. The capacity will grow to
100 million annually with planned expansions.
Designed to look like a mythical phoenix bird in
flight, the building was inspired by traditional
Chinese architecture and blends classical and
modern elements.
First opened in 2019 with planned expansions
already in the pipeline, the 700,000 square meter
airport was designed with efficiency and conve-
nience to passengers as a priority. Departure and
arrival gates are located on the same floor, and the
radial design aims to allow passengers to enter the
building and easily reach their flight gates. Once
the expansion is completed, a total of 174 KONE
TravelMaster™ escalators and a KONE E-Link™
monitoring system will help provide reliable,
smooth people flow to transport millions
of passengers.
Related Documents