Annual Reports and Financial Statements 2010

Welcome message from author
This document is posted to help you gain knowledge. Please leave a comment to let me know what you think about it! Share it to your friends and learn new things together.
Transcript
Annual Reports and Financial Statements 2010
www.reedelsevier.com
Annual Reports and Financial Statem
ents 2010
47213_Covers.indd 1 1/3/11 11:52:12

Designed and produced byCONRAN DESIGN GROUP
Board photography by Julian CalderPrinted by Pureprint Group, ISO14001, FSC® certified and CarbonNeutral®
Printed on Revive 50:50 Silk a recycled paper, Forest Stewardship Council (FSC) certified, containing 50% recycled waste and 50% virgin fibre and manufactured at a mill certified with ISO 14001 environmental management standard. The pulp used in this product is bleached using an Elemental Chlorine Free process (ECF). The inks used in the printing of this report are all vegetable based.
CreditsReed Elsevier is a world leading provider of professional information solutions in the Science, Medical, Risk, Legal and Business sectors.
Our customers use our products every day to advance science, improve medical outcomes, evaluate risk, enable better legal decisions, forge business relationships and gain business insight.
Full report online The Reed Elsevier Annual Reports and Financial Statements 2010 are available to view online.www.reedelsevier.com/ar10
47213_Covers.indd 2 3/3/11 13:51:10
Annual Reports and Financial Statements 2010 Reed Elsevier 01
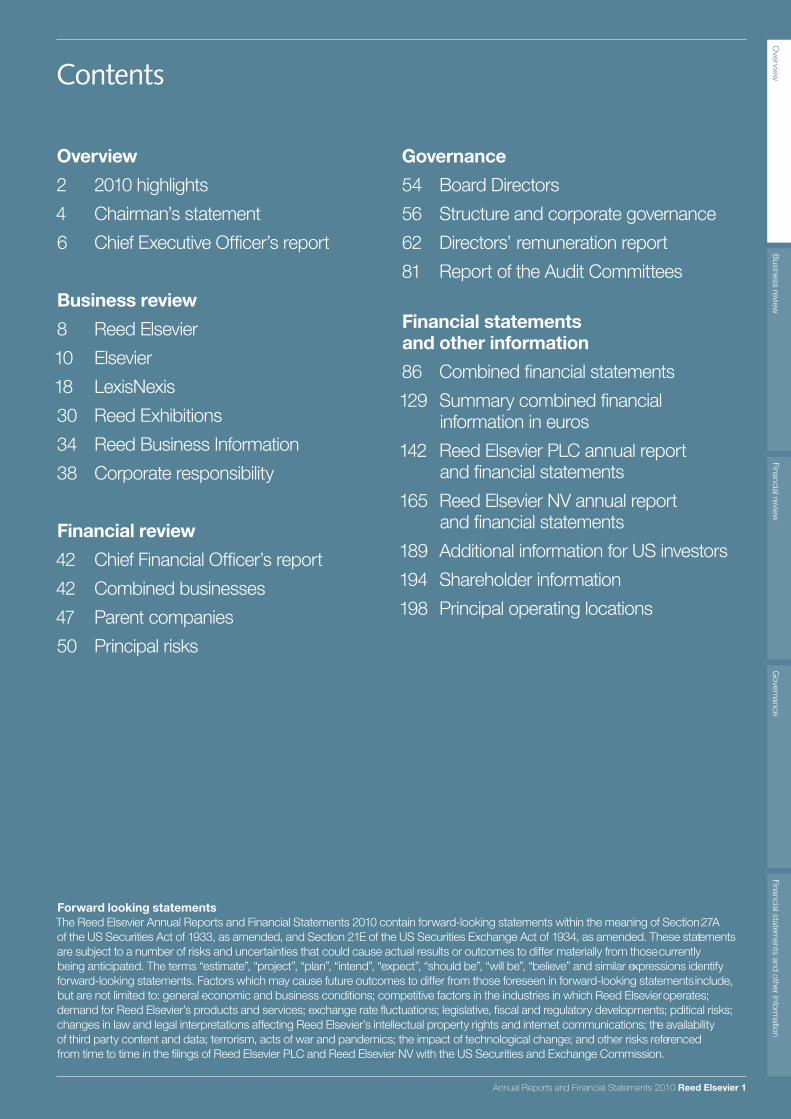
Contents
Overview2 2010 highlights4 Chairman’s statement6 Chief Executive Officer’s report
Business review8 Reed Elsevier10 Elsevier18 LexisNexis30 Reed Exhibitions34 Reed Business Information38 Corporate responsibility
Financial review42 Chief Financial Officer’s report42 Combined businesses47 Parent companies50 Principal risks
Governance54 Board Directors56 Structure and corporate governance62 Directors’ remuneration report81 Report of the Audit Committees
Financial statements and other information86 Combined financial statements129 Summary combined financial
information in euros142 Reed Elsevier PLC annual report
and financial statements165 Reed Elsevier NV annual report
and financial statements189 Additional information for US investors194 Shareholder information198 Principal operating locations
Annual Reports and Financial Statements 2010 Reed Elsevier 1
Overview
Business review
Financial reviewG
overnanceFinancial statem
ents and other information
Forward looking statementsThe Reed Elsevier Annual Reports and Financial Statements 2010 contain forward-looking statements within the meaning of Section 27A of the US Securities Act of 1933, as amended, and Section 21E of the US Securities Exchange Act of 1934, as amended. These statements are subject to a number of risks and uncertainties that could cause actual results or outcomes to differ materially from those currently being anticipated. The terms “estimate”, “project”, “plan”, “intend”, “expect”, “should be”, “will be”, “believe” and similar expressions identify forward-looking statements. Factors which may cause future outcomes to differ from those foreseen in forward-looking statements include, but are not limited to: general economic and business conditions; competitive factors in the industries in which Reed Elsevier operates; demand for Reed Elsevier’s products and services; exchange rate fluctuations; legislative, fiscal and regulatory developments; political risks; changes in law and legal interpretations affecting Reed Elsevier’s intellectual property rights and internet communications; the availability of third party content and data; terrorism, acts of war and pandemics; the impact of technological change; and other risks referenced from time to time in the filings of Reed Elsevier PLC and Reed Elsevier NV with the US Securities and Exchange Commission.
47213_Text_p001-055.indd 1 1/3/11 11:17:32

2 Reed Elsevier Annual Reports and Financial Statements 2010
2010 highlights
Improved trading performance and good business progress > Revenue growth of 2% underlying against 6% decline in 2009 > Adjusted operating margin 0.2% pts lower at 25.7% > Good progress on business unit specific priorities
– New content and information solutions launched– Increased product development and sales & marketing– Focus on cost efficiency and process innovation– Portfolio actions taken
> Strong cash generation
Prospects encouraging; recovery will be gradual
Reed Elsevier combined businesses
Adjusted profit before tax
£m !m
1,279 1,279
2009
1,432 1,496
20092010 2010
!m
6,800 7,084
2009 2010
Revenue
£m
6,071 6,055
2009 2010
Adjusted operating profit
£m !m
1,570 1,555
2009
1,758 1,819
20092010 2010
Reed Elsevier PLC:Adjusted EPSpence
45.9 43.4
2009 2010
Reed Elsevier NV:Dividenda
0.400 0.412
2009 2010
Parent companies
Reed Elsevier PLC:Dividendpence
20.4 20.4
2009 2010
Reed Elsevier NV:Adjusted EPSa
0.79 0.78
2009 2010
47213_Text_p001-055.indd 2 1/3/11 11:17:35

Reed Elsevier combined businesses
£ ! Change at
2010 2009 2010 2009 constant Change For the year ended 31 December £m £m Change !m !m Change currencies underlying
Reported figuresRevenue 6,055 6,071 0% 7,084 6,800 +4% -1% +2%Operating profit 1,090 787 +39% 1,275 881 +45% +37%Profit before tax 768 435 +77% 898 487 +84% +74%Net profit 642 391 +64% 751 438 +71% +61%Net borrowings 3,455 3,931 4,043 4,402
£ ! Change at
2010 2009 2010 2009 constant Change For the year ended 31 December £m £m Change !m !m Change currencies underlying
Adjusted figuresOperating profit 1,555 1,570 -1% 1,819 1,758 +3% -2% -1%Operating margin 25.7% 25.9% 25.7% 25.9%Profit before tax 1,279 1,279 0% 1,496 1,432 +4% -1%Net profit 983 982 0% 1,150 1,099 +5% -1%Operating cash flow 1,519 1,558 -3% 1,777 1,745 +2% -3%Operating cash flow conversion 98% 99% 98% 99%
Parent companies
Reed Elsevier PLC Reed Elsevier NV Change atconstant
2010 2009 Change 2010 2009 Change currencies
Adjusted earnings per share 43.4p 45.9p -5% !0.78 !0.79 -1% -6%Reported earnings per share 27.3p 17.2p +58% !0.51 !0.32 +62%Ordinary dividend per share 20.4p 20.4p 0% !0.412 !0.400 +3%
The Reed Elsevier combined businesses encompass the businesses of Reed Elsevier Group plc and Elsevier Reed Finance BV, together with their two parent companies, Reed Elsevier PLC and Reed Elsevier NV (the “Reed Elsevier combined businesses”). The results of Reed Elsevier PLC reflect its shareholders’ 52.9% economic interest in the Reed Elsevier combined businesses. The results of Reed Elsevier NV reflect its shareholders’ 50% economic interest in the Reed Elsevier combined businesses. The respective economic interests of the Reed Elsevier PLC and Reed Elsevier NV shareholders take account of Reed Elsevier PLC’s 5.8% indirect interest in Reed Elsevier NV.
Adjusted figures are additional performance measures used by management and are reconciled to the reported figures in note 10 to the combined financial statements and note 9 to the respective parent company financial statements.
The percentage change at constant currencies refers to the movements at constant exchange rates, using 2009 full year average and hedge rates. Underlying change excludes the results of acquisitions and disposals made both in the year and in the prior year.
Annual Reports and Financial Statements 2010 Reed Elsevier 3
Overview
Business review
Financial reviewG
overnanceFinancial statem
ents and other information
47213_Text_p001-055.indd 3 1/3/11 11:17:35

4 Reed Elsevier Annual Reports and Financial Statements 2010
I am pleased to report that Reed Elsevier has made significant progress in 2010 as our markets strengthened and we saw the benefit of the actions which management has taken in the business. Underlying revenues were 2% higher in constant currencies with the return to growth reflecting improved performance in our more cyclical markets, together with a sustained commitment to new product development and a focus on sales & marketing initiatives. Our reported revenues were flat at £6,055m expressed in sterling and increased by 4% to !7,084m expressed in euros. During the year, action was taken to divest low return assets, such that total revenues were 1% lower in constant currencies.
Firm action on costs and further innovations in our operational processes has meant that total costs at constant exchange rates declined 1% and adjusted operating margins at 25.7% were just 0.2 percentage points lower than in 2009, despite the increased spending on new product development and sales & marketing. Adjusted operating profits were 1% lower at £1,555m/up 3% at !1,819m. Adjusted profit before tax was flat at £1,279m/up 4% at !1,496m. Adjusted earnings per share were down 5% for Reed Elsevier PLC at 43.4p and 1% lower for Reed Elsevier NV at !0.78, taking into account 4% dilution from the July 2009 equity placing.
Reported operating profit was up 39% to £1,090m/45% to !1,275m. This reflects the absence of intangible asset and goodwill impairment in 2010 and much lower exceptional restructuring charges as we get these programmes behind us. Reported earnings per share for Reed Elsevier PLC were up 58% at 27.3p and for Reed Elsevier NV up 62% at !0.51.
Chairman’s statement
Anthony HabgoodChairman
Considerable progress has been made during the year resulting in improvements in trading performance with underlying sales returning to positive organic growth. Reported profits are strongly ahead with the bulk of our major restructuring programmes now behind us. Management has put in place business unit teams to sharpen the focus on value creation and operational execution. I am confident that the good progress which is being made on individual business priorities will deliver further improvements.
47213_Text_p001-055.indd 4 2/3/11 21:41:52
Annual Reports and Financial Statements 2010 Reed Elsevier 5
DividendsThe Boards are recommending equalised final dividends of 15.0p for Reed Elsevier PLC and !0.303 for Reed Elsevier NV, flat and up 3% respectively against the prior year. This brings the total for the year to 20.4p for Reed Elsevier PLC and !0.412 for Reed Elsevier NV, respectively unchanged and an increase of 3%. The differing growth rates reflect movements in the sterling-euro exchange rate between dividend announcement dates.
Balance SheetDuring the year our net debt, which is principally denominated in US dollars, reduced from $6.3 billion to $5.4 billion reflecting the excellent cash generation in the year and capital discipline. Our financial position is strong and our balance sheet is well placed to support our business strategies.
Management and BoardsOver the past twelve months, our Chief Executive Officer, Erik Engstrom, has been reshaping the management organisation. LexisNexis, with effect from January 2011, has been divided into the Risk Solutions and Legal & Professional businesses, with distinct management teams reporting directly to him. Reed Business Information has undergone a major restructuring of its portfolio and operations during the year and is now organised by key asset groups, each with its own specific strategic priorities and management team. These changes will further improve the focus of each business in their respective markets and accelerate our progress.
In December 2010, Andrew Prozes retired from our Boards and as Chief Executive Officer of LexisNexis after 10 years of service. During that time, Andy built a leading Risk Solutions business, led the transition of the legal businesses from publishers of content to providers of online solutions, and developed a leadership position in online legal solutions outside the US. I would like to thank Andy for his contribution to the development of LexisNexis and Reed Elsevier over many years.
In April 2010, Dien de Boer-Kruyt retired from the Reed Elsevier NV Supervisory Board. At the Annual General Meetings in April 2011, Lord Sharman will also be stepping down as a non-executive director of our Boards. Both completed more than nine years of valuable Board service. Colin Sharman also served for all this period as an important member of the Audit Committees, eight years as their chairman, and was a key member of the Nominations Committee. I would like to thank both Dien and Colin for their substantial contributions to the Boards through a period of significant change for Reed Elsevier.
Marike van Lier Lels joined the Reed Elsevier NV Supervisory Board in January 2010 in anticipation of Dien’s retirement and I am pleased to say that Mr Adrian Hennah will join our Boards as a non-executive director, to succeed Lord Sharman, subject to shareholder approval at the respective Annual General Meetings in April. Adrian is a serving Chief Financial Officer of a FTSE 100 company with over 25 years’ experience in finance and operations in the medical devices, technology and pharmaceuticals industries and he will bring highly relevant experience to our board discussions. On appointment, he will become a member of our Audit Committees and of the Corporate Governance Committee.
Going forwardOur markets have stabilised or are showing improvement. Each of our businesses is focused on value creation and operational execution. I am confident that the good progress which is being made on individual business priorities will deliver further improvements.
Anthony HabgoodChairman
Overview
Business review
Financial reviewG
overnanceFinancial statem
ents and other information
47213_Text_p001-055.indd 5 1/3/11 11:17:37

6 Reed Elsevier Annual Reports and Financial Statements 2010
on product development and sales & marketing, particularly in the legal & professional business, was funded largely by cost actions across the businesses with continuing focus on process innovation. Adjusted pre-tax profits were flat at £1,279m/up 4% at !1,496m, and 1% lower at constant currencies.
Adjusted operating cash flow continued to be strong at £1,519m/!1,777m with an excellent 98% conversion of adjusted operating profits into cash. The post tax return on capital employed improved to 10.6%, 0.2 percentage points higher reflecting the strong cash generation and increased capital efficiency.
Adjusted earnings per share were down 5% to 43.4p for Reed Elsevier PLC, 1% lower at !0.78 for Reed Elsevier NV, and 6% lower at constant currencies. This included a 4% dilutive effect from the July 2009 equity placing.
We use adjusted figures as key performance measures, and these are stated principally before amortisation on acquired intangible assets, exceptional restructuring charges and acquisition related costs, and disposal gains and losses. Including these items, reported operating profit and pre-tax profit were 39% and 77% higher in sterling and 45% and 84% higher in euros, reflecting no intangible asset and goodwill impairment and much lower exceptional charges as our major restructuring programmes completed, with charges in 2010 relating to Reed Business Information only. Reported earnings per share were 58% higher at 27.3p for Reed Elsevier PLC and 62% higher at !0.51 for Reed Elsevier NV.
The Elsevier science and medical business (46% of adjusted operating profit) saw modest growth reflecting a constrained customer budget environment. Elsevier has continued to develop innovative new content and tools, with the initial launch in 2010 of SciVerse, an integrated platform for accessing ScienceDirect,Scopus and scientific web content. Also launched in beta version is the SciVerse Application Marketplace which facilitates collaboration across the scientific community in the development of customised search and discovery applications. Further institutional planning and performance tools are also being developed to help academic and government institutions evaluate their research performance and determine research strategies. In Health Sciences, the focus of development is in clinical decision support point-of-care solutions, clinical practice guidelines and predictive analytics to address the demand to make healthcare more efficient and to improve medical outcomes.
LexisNexis (38% of adjusted operating profit) returned to overall revenue growth, with strong growth in the risk business. Subscription revenues in the legal business continued to reflect the lower levels of law firm activity and employment. Adjusted operating margin was lower due to the weaker revenues and increased spending in the legal business on new product development, related infrastructure and sales & marketing.
In the risk solutions business, strong growth in the insurance business is supported by high transactional activity in the US auto and property markets. A continuous pipeline of new data and analytics products also drives growth, ranging from helping insurers better assess underwriting risk to reducing cost and improving the effectiveness of the insurers’ workflow, from initial potential customer contact to policy renewal. Recently introduced products includeData Pre-Fill, which provides accurate information directly into the
Chief Executive Officer’s report
The year has seen improved trading performance, with 2% organic revenue growth against a 6% decline last year. Increased spend on product development and sales & marketing was largely offset by cost efficiency gains.
During 2010, we also made good progress against the key priorities we outlined for each of the businesses at the start of the year. In Elsevier, subscription renewals for 2010 were completed in line with our expectations and the renewals process for 2011 is well progressed. We continued to develop new content and innovative tools, including the launch of SciVerse, an integrated platform for researchers. LexisNexis Risk Solutions captured the benefit of increased market activity and growing demand for data and analytics. LexisNexis Legal & Professional added new features and content sets, including the initial launch of Lexis Advance for Solos,the first of a series of tools for specific legal segments. Effective from January 2011, we reorganised LexisNexis Risk Solutions and Legal & Professional to operate as separate businesses, reporting directly to me, to sharpen the management focus on their respective markets. Reed Exhibitions significantly stepped up its launch programme with 35 new shows, particularly targeting high growth sectors and emerging markets and continued to invest in technology and innovation. Within Reed Business Information, we reshaped the portfolio, significantly reduced costs, and invested behind the successful data services business, including in early January this year the acquisition of a majority share in the leading petrochemical and energy information service CBI China.
Financial resultsTotal revenues were flat at £6,055m/up 4% to !7,084m and down 1% at constant currencies, as the portfolio was reshaped through disposal and closure, most notably in Reed Business Information. Importantly on an underlying basis, excluding acquisitions and divestments, revenues returned to growth, up 2%, reflecting both the progress against our business priorities made during the year and our more cyclical markets stabilising.
Adjusted operating profit was lower by 1% at £1,555m/up 3% at !1,819m and down 2% at constant currencies; on an underlying basis adjusted operating profit was down 1%. Increased spend
Erik EngstromChief Executive Officer
47213_Text_p001-055.indd 6 2/3/11 21:43:42

Annual Reports and Financial Statements 2010 Reed Elsevier 7
insurance workflow on customers, potential customers and theirauto ownership, and Insurance Exchange, which is directed atimproving the efficiency and transparency of communicationsbetween insurance agents, brokers and carriers through the sharingof customer application data.
In the legal & professional business, continued good progressis being made in the development of the next generation of legalproducts and advanced operational infrastructure, which will beprogressively introduced over the next few years. 2010 saw the initialmarket introduction, on version 1.0 of the new LexisNexis researchplatform, of Lexis Advance for Solos, a legal research tool specificallyfor US solo attorneys. This is the first of a series of tools for specificsegments of the legal market. Features and content are also beingprogressively added to existing services such as Lexis for MicrosoftOffice, which enables lawyers to conduct their Lexis searches withinMicrosoft applications, and LexisNexis Verdict & Settlement Analyzer,which provides data and analytics on previous settlements. In theUK, LexisNexis continued to build out its practical guidance serviceLexisPSL, with the introduction of further practice areas, includingcompany commercial. The increased spend on supporting theseimportant developments has in part been mitigated by continuingcost efficiencies, including further outsourcing of production andengineering activities, supply chain management and operationalstreamlining.
Reed Exhibitions (10% of adjusted operating profit) saw goodrevenue growth with the net cycling in of biennial exhibitions anda significantly moderated decline in annual show revenues. The 2010shows have seen overall success, with growing attendances at themajority of annual events and exhibitor numbers up 4% in the top 50annual shows. While recovery in the larger markets has taken longerto materialise, by contrast, the shows in China, Russia, the MiddleEast and Brazil grew strongly. Reed Exhibitions significantly steppedup its launch programme in 2010 with 35 new events of which14 were in Asia, including the successful Cloud Computing show inJapan, and the PAX East games event in Boston. Reed Exhibitionsnow operates nearly 100 shows in emerging markets with approximately
40 shows in each of Brazil and China. Reed Exhibitions alsocontinued to develop websites, analytics and other innovativeonline tools to increase the effectiveness and efficiency of eventsfor both exhibitors and attendees.
Reed Business Information (6% of adjusted operating profit) sawgood growth in data services and online marketing solutions andsignificantly moderated declines in advertising markets. The portfoliowas significantly reshaped and refocused. The sale and closureof the US controlled circulation magazines and certain other titleswere completed, together with the sale of clusters of titles in Europeand Asia. The business was redefined by asset group and clear,distinct value creation plans were developed for each group.We invested in data services and in January 2011, we increased ourinvestment to a majority position in the leading petrochemical andenergy information service in CBI China. There was also a significantrestructuring of the business with the consolidation of operations,procurement savings and tight cost control.
The business and financial reviews set out in pages 8 to 37 describein more detail our markets, businesses and the performance andoutlook by business.
OutlookGoing forward we will continue to focus on creating value for ourcustomers, in each business unit and across Reed Elsevier. As wego into 2011, most of our markets are stable or improving and weare building on the actions taken in 2010 to strengthen the businessfurther. Overall, we expect a gradual recovery and a continuedimprovement in performance.
We are focused on creating value for our professional customersthrough helping them to deliver better outcomes more efficiently.The business units have well defined priorities designed to capturegrowth and deliver good returns targeting high growth marketssupported by a commitment to new product development andincreased sales & marketing. Across Reed Elsevier, we enhancethese initiatives through the building and leveraging of institutionalskills, including professional customer analysis and productdevelopment, knowledge, methods and people as well as sharingresources in software, technology and infrastructure.
We have a strong management team in place, with a sharpenedfocus on value creation and operational execution. Our employeesare knowledgeable and passionate about the customers they serveand are critical to achieving our goals over the coming years. I wouldlike to thank them for their continuing enthusiasm and commitmentto our customers and to creating value for Reed Elsevier.
Erik EngstromChief Executive Officer
Overview
Business review
Financial reviewG
overnanceFinancial statem
ents and other information
Completion of Reed Elsevier Code of Ethicsand Business Conduct training
We prioritise employee ethics trainingas part of our ongoing commitmentto implementing the highest standardsof corporate and individual behaviouracross Reed Elsevier
93%93%01
22%
61%14%
14%64%
25%
10
Electronic Face to face Print
00 02 03 04 05 06 07 08 09
Revenue by format
Reed Elsevier has seen a significant migration from printproducts to electronic content and tools over the lastten years, so that print revenues now account for only25% of revenues.
47213_Text_p001-055.indd 7 1/3/11 11:17:40

8 Reed Elsevier Annual Reports and Financial Statements 2010
Reed Elsevier
Elsevier is the world’s leading provider of scientific and medical information and serves scientists, health professionals and students worldwide.
Its objective is to help its customers advance science and improve healthcare by providing world class information and innovative solutions that enable customers to make critical decisions, enhance productivity and improve outcomes. Elsevier publishes over 1,800 scientific and medical journals, through ScienceDirect, the world’s largest database of scientific and medical research, used by over 11 million researchers each year. In 2010, Elsevier published over 2,400 new book titles and clinical reference works both in print and online, as well as offering an extensive portfolio of online information databases and analytics.
LexisNexis’ content and tools enable legal, risk and other professional customers to make more effective and efficient decisions.
LexisNexis Risk Solutions provides data and analytics that enable its customers to evaluate and manage risks associated with transactions and improve performance.
LexisNexis Legal & Professional provides legal, tax, regulatory and news & business information and analysis to legal, corporate, government, accounting and academic markets.
Reed Business Information is a provider of business information, data and marketing solutions in multiple formats. It produces industry critical data services and lead generation tools, and over 100 online community and job sites. It publishes over 100 business magazines with market leading positions in many sectors.
Reed Exhibitions is the world’s leading events business, with over 450 events in 35 countries. Reed Exhibitions organises market-leading events that are relevant to industry needs, where participants from around the world come together to do business, network and learn. Through its portfolio of exhibitions and conferences it serves 44 industry sectors across the Americas, Europe, the Middle East and Asia Pacific.
47213_Text_p001-055.indd 8 1/3/11 11:17:41

Annual Reports and Financial Statements 2010 Reed Elsevier 9
Change at 2010 2009 constant Change
£m £m Change currencies underlying
RevenueElsevier 2,026 1,985 +2% +2% +2%LexisNexis 2,618 2,557 +2% +1% +1%Reed Exhibitions 693 638 +9% +9% +8%Reed Business Information 718 891 -19% -20% -2%
6,055 6,071 0% -1% +2%
Adjusted operating profitElsevier 724 693 +4% +4% +4%LexisNexis 592 665 -11% -12% -12%Reed Exhibitions 158 152 +4% +4% +4%Reed Business Information 89 89 0% 0% +4%Unallocated items (8) (29)
1,555 1,570 -1% -2% -1%
Adjusted operating profit is presented as an additional performance measure used by management and is stated before amortisation and impairment of acquired intangible assets and goodwill, exceptional restructuring and acquisition related costs, and is grossed up to exclude the equity share of taxes in joint ventures. Reconciliations between the reported and adjusted figures are provided in note 10 to the combined financial statements. The percentage change at constant currencies refers to the movements at constant exchange rates, using 2009 full year average and hedge rates. Underlying change excludes the results of acquisitions and disposals made both in the year and the prior year.
In 2010, Reed Elsevier announced that LexisNexis would be reorganised into two separate risk solutions and legal & professional businesses, with the separation effective from 1 January 2011. The charts below reflect the Reed Elsevier business split of revenue and adjusted operating profit including this separation. The adjusted operating profit split is a pro forma division of the 2010 LexisNexis adjusted operating profit for the two businesses.
Revenue by format£6,055m
Revenue by geographic market£6,055m
Overview
Business review
Financial reviewG
overnanceFinancial statem
ents and other information
Electronic 61%Face to face 14% Print 25%
Adjusted operating profit£1,555m
Elsevier 46%LexisNexis Risk Solutions 23% LexisNexis Legal & Professional 15%Reed Exhibitions 10%Reed Business Information 6%
North America 55%UK 8%Netherlands 3% Rest of Europe 19%Rest of World 15%
Revenue£6,055m
Elsevier 34%LexisNexis Risk Solutions 15% LexisNexis Legal & Professional 28%Reed Exhibitions 11%Reed Business Information 12%
47213_Text_p001-055.indd 9 1/3/11 11:17:43

ADVANCING
SCIENCE
10 Reed Elsevier Annual Reports and Financial Statements 2010
47213_Text_p001-055.indd 10 1/3/11 11:17:49

Annual Reports and Financial Statements 2010 Reed Elsevier 11
ELSEVIER IS THE WORLD’S LEADINGSCIENTIFIC INFORMATION PROVIDER,SERVING OVER 11 MILLIONRESEARCHERSElsevier delivers a wide array of information and work!ow toolsthat help researchers generate valuable insights in the advancementof scienti"c discovery and improve the productivity of research.
47213_Text_p001-055.indd 11 1/3/11 11:17:55

12 Reed Elsevier Annual Reports and Financial Statements 2010
IMPROVINGMEDICAL OUTCOMES
47213_Text_p001-055.indd 12 1/3/11 11:18:02

Annual Reports and Financial Statements 2010 Reed Elsevier 13
ELSEVIER IS A WORLD LEADINGMEDICAL INFORMATION PROVIDER,USED BY HEALTH PROFESSIONALSWORLDWIDEThrough its medical journals, books, major reference works, databasesand online information tools, Elsevier provides critical information andanalysis on which its customers rely to base their decisions, to improvemedical outcomes and enhance the ef"ciency of healthcare.
47213_Text_p001-055.indd 13 1/3/11 11:18:09

14 Reed Elsevier Annual Reports and Financial Statements 2010
Elsevier is the world’s leading provider of scientificand medical information and serves scientists, healthprofessionals and students worldwide. Its objectiveis to help its customers advance science and improvehealthcare by providing world class information andinnovative solutions that enable customers to make criticaldecisions, enhance productivity and improve outcomes.
Total revenues for the year ended 31 December 2010 were £2,026m.Elsevier is a global business with principal operations in Amsterdam,Beijing, Boston, Chennai, Delhi, London, Madrid, Milan, Munich,New York, Oxford, Paris, Philadelphia, Rio de Janeiro, St. Louis,San Diego, Singapore and Tokyo. Elsevier has 6,700 employees.
Elsevier is organised around two market-facing businesses:Science & Technology, which serves the scientific and technologycommunities, and Health Sciences, which serves the healthcommunity. Both of these businesses are supported by a globalshared services organisation which provides integrated editorialsystems and production services, product platforms, distribution,and other support functions.
Science & Technology is the world’s leading scientific informationprovider. It delivers a wide array of information and workflow toolsthat help researchers generate valuable insights in the advancementof scientific discovery and improve the productivity of research.Its customers are scientists, academic institutions, research leadersand administrators, corporations and governments which rely onElsevier to: provide high quality content; review, publish, disseminateand preserve research findings; and create innovative tools to helpfocus research strategies and improve their effectiveness.
Elsevier publishes over 200,000 new science & technology researcharticles each year through some 1,150 journals, many of whichare the foremost publications in their field and a primary point ofreference for new research. The vast majority of customers receivethese journals through ScienceDirect, the world’s largest databaseof scientific and medical research, providing access to over10 million scientific and medical journal articles, used by over11 million researchers each year.
Elsevier also publishes over 700 new science & technology booktitles annually, supporting bibliographic data, indexes and abstracts,and review and reference works. 14,000 online books are availableon ScienceDirect, with over 600 online books added each year.
Other major products include Scopus and Reaxys. Scopus is thelargest abstract and citation database of research literature in theworld, with abstracts and bibliographic information on more than40 million scientific research articles from 18,000 peer reviewedjournals and over 5,000 publishers. Scopus also has data on morethan 23 million patents. Reaxys is a leading solution for syntheticchemists that integrates chemical reaction and compound datasearching with synthesis planning.
A major challenge facing researchers and institutions is the evergrowing amount of research and related information but the limitedtime to identify and analyse what is most relevant. To address thischallenge, Elsevier has been developing a suite of new productsthat significantly improve the speed at which researchers are ableto find the most relevant information and analyse this informationusing the most innovative applications. In 2010, SciVerse Hub betawas launched providing a single search interface for accessingScienceDirect, Scopus and scientific web content. In November2010, SciVerse Application Marketplace & Developer Network waslaunched in beta enabling researchers and third party developersto build customised applications on top of Elsevier’s information andcombine this with other data and analytics held by the customer.
Elsevier is continuing to develop the SciVal suite of productsthat help academic and government institutions evaluate theirresearch performance, determine research strategies and increaseinstitutional efficiencies. Leveraging bibliometric data, such ascitations from Scopus, SciVal Spotlight helps institutions andgovernments to identify their distinctive research strengths,evaluate performance and increase the focus of their R&Dinvestments. SciVal Funding assists researchers and institutionsin identifying grants that are most relevant in their research areas.In support of this strategy, Collexis was acquired in 2010, a leadingdeveloper of semantic technology, which increases the efficiencyand effectiveness of the evaluation of grant applications byfunding agencies.
Elsevier’s scientific and medical information and tools helpits customers improve outcomes in science and health
Journal Citation Reports® categories whereElsevier journals ranked #1 by Impact Factor*
Elsevier continues to improve journalquality and relevance to thecommunities they serve throughits world class editorial processand by attracting the highestquality research
*Impact Factor is the average citation rate of a journal’s articles over a defined period. The JournalCitation Reports relate to the 2009 and 2008 edition but were published in 2010 and 2009 respectively
57
51
2009
2008
Copyright© Thomson Reuters
Growth in Scopus searches
+30%Increased customer base,growth in available content andhigher customer usage drivesgrowth in Scopus searches
47213_Text_p001-055.indd 14 1/3/11 11:18:10

Annual Reports and Financial Statements 2010 Reed Elsevier 15
Health Sciences is a world leading medical information provider.Through its medical journals, books, major reference works,databases and online information tools, Elsevier provides criticalinformation and analysis on which its customers rely to base theirdecisions, to improve medical outcomes and enhance the efficiencyof healthcare. Health Sciences serves medical researchers, doctors,nurses, allied health professionals and students, as well as hospitals,research institutions, health insurers, managed healthcareorganisations and pharmaceutical companies.
Elsevier publishes over 700 health sciences journals, includingon behalf of learned societies, and, in 2010, over 1,700 new healthsciences book titles and clinical reference works were publishedboth in print and through ScienceDirect and other electronicplatforms such as MD Consult. MD Consult is a leading onlineclinical information service with more than 2,200 institutionalcustomers. Flagship titles include market leading medical journalssuch as The Lancet, and major medical reference works such asGray’s Anatomy, Nelson’s Pediatrics and Netter’s Atlas of HumanAnatomy. In addition to its local language publishing in manycountries across the world, Health Sciences leverages its contentand solutions into new markets through local language versioning.
Elsevier is a leader in medical education and training resources,particularly to the nursing and allied health professions. From coretextbooks to virtual clinical patient care, Health Sciences supportsstudents, teaching faculties and healthcare organisations ineducation and practice. A strong focus is on the further developmentof innovative electronic services: the Evolve portal provides a richresource to support faculty and students and now has 2.4 millionregistered users; Evolve Reach (Health Education Systems Inc.)provides online review and testing tools for students of nursingand the allied health professionals; Evolve Teach provides onlineresources and solutions to support faculty.
A growing area of focus is clinical decision support, providing onlineinformation and analytics to deliver patient-specific solutions at thepoint of care to improve patient outcomes. Gold Standard providescritical information on drug interactions to assist effective treatment;CPM Resource Center provides a data driven framework to supportnurses in undertaking procedures; Nursing Consult provides nursingcare guidelines in trauma and disease management; MEDai usespatient data and analytics to help identify areas for improvementin clinical practice within hospitals and lower costs for the payersof healthcare through preventative interventions.
Elsevier also provides marketing services to the pharmaceuticalindustry through advertising and sponsored communications tothe specialist community it serves. In 2010, the standalone medicalagency communications business Excerpta Medica was divestedas part of a restructuring of this business focusing more on theservices which leverage Health Sciences’ core information anddistribution platforms.
Market OpportunitiesThe science and medical information markets have good long termdemand growth characteristics. The importance of research anddevelopment to economic performance and competitive positioningis well understood by governments, academic institutions andcorporations. This is reflected in the long term growth in R&D spendand in the number of researchers worldwide, leading to greaterresearch output and publishing. Additionally there is growingdemand for tools that allow research to better target and improvethe spend and efficiency of the research process.
In health, market growth is also supported by demographictrends, with ageing populations that require more healthcare, risingprosperity in developing economies with increasing expectations ofbetter healthcare provision, and the increasing focus on improvingmedical outcomes and efficiency.
Given that a majority of global R&D and healthcare is funded directlyor indirectly by governments, spending is influenced by governmentalbudgetary considerations. The commitment to R&D and healthprovision does however generally remain high, even in more difficultbudgetary environments.
Strategic PrioritiesElsevier’s strategic goal is to make valued contributions to thecommunities it serves in advancing science, improving medicaloutcomes and enhancing productivity. To achieve this, Elsevier isfocused on: building world-class content; deepening its customerengagement to identify how better to help them achieve their desiredoutcomes more efficiently and effectively; delivering tools which link,analyse and illuminate content and data to help customers makecritical decisions and improve their productivity; increasing itsinvestment in high-growth markets and disciplines; and continuouslyimproving organisational efficiency.
In Science & Technology, priorities are to continually enhance thequality and relevance of research and reference content and expanddata sets, while adding greater functionality and utility to the newlylaunced SciVerse, ScienceDirect, Scopus and new tools to assistresearcher productivity. The SciVal suite of performance andplanning tools will continue to be expanded to help academic andgovernment institutions target their research spend and improveresearch efficiency and economic outcomes.
In Health Sciences, priorities are similar, particularly with regard tomedical research, focusing on the quality and relevance of contentand the functionality of electronic platforms and services. Additionally,Health Sciences continues to build out clinical decision supportservices to meet customer demand for tools that deliver bettermedical outcomes and lowers costs for payers, physicians andhospitals. Elsevier is also focused on increasing growth in emergingmarkets through expansion of local publishing and versioning ofcontent and electronic services.
Overview
Business review
Financial reviewG
overnanceFinancial statem
ents and other information
Evolve unique site visits
+36%Evolve site visits grow as moreusers register and nursing facultiesand students increasingly useelectronic resources
Growth in international MD Consult sessions
Increasing expansion in internationalmarkets (outside the US) as customerslook to use the online clinicalinformation service to access content +18%
47213_Text_p001-055.indd 15 1/3/11 11:18:11
16 Reed Elsevier Annual Reports and Financial Statements 2010
Business Model, Distribution Channels and CompetitionScience and medical research is principally disseminated on a paid subscription basis to the research facilities of academic institutions, government and corporations, and, in the case of medical and healthcare journals, also to individual practitioners and medical society members. Advertising and promotional revenues are derived from pharmaceutical and other companies.
Electronic products, such as ScienceDirect, Scopus and MDConsult,are generally sold direct to customers through a dedicated sales force that has offices around the world. Subscription agents facilitate the sales and administrative process for print journals. Books are sold through traditional and online book stores, wholesalers and, particularly in medical and healthcare markets, directly to end users.
Competition within science and medical publishing is generally on a title by title and product by product basis. Competing journals, books and databases are typically published by learned societies and other professional publishers. Workflow tools face similar competition as well as from software companies and internal solutions developed by customers.
2010 financial performance
Elsevier saw modest growth reflecting a constrained customer budget environment.
Revenues and adjusted operating profits increased by 2% and 4% respectively at constant currencies, with the improvement in adjusted operating margin reflecting increased cost efficiency.
Science & Technology saw 3% revenue growth at constant currencies. ScienceDirect and other journal subscription revenues developed much as expected in a difficult academic budget environment. Content quantity, quality and usage continued to grow, reflecting the growth in research activity worldwide. The Scopusabstract and indexing database performed particularly well with a significant increase in subscriptions. New content sets and product features were added and Scopus saw much higher usage with a 30% increase in customer searches. Other specialist databases also grew well as the development of new features and content continued. In reference and education, in a smaller frontlist publishing year, electronic sales grew well and print revenue decline stabilised.
In Health Sciences, revenues were flat at constant currencies, or up 1% underlying before taking account of small acquisitions and disposals. Modest growth was seen in medical research journal subscriptions revenues, reflecting the same academic budget pressures seen in Science & Technology. Subscriptions to integrated online solutions and other electronic product sales grew well in nursing and health professional education, clinical reference and in the majority of clinical decision support. Growth was tempered, however, by constrained budgets, pending US healthcare reform and moderating enrolment, as career schools adjust to expected legislation affecting student funding. Pharma promotion and other advertising revenues were lower, with continuing weakness in Europe. Emerging markets grew well due to the continued expansion of local publishing to meet the increasing demand for medical education and clinical reference products.
Underlying cost growth was 1%, with increased spend on new product development, sales and marketing offset by additional cost savings in offshore production, procurement and the streamlining of operations and support services. The reported operating margin, after amortisation of acquired intangible assets, was 31.9%, up 3.5 percentage points reflecting in particular that there were no exceptional restructuring costs in 2010.
Going into 2011, the budget environment remains constrained in many markets but with large variations by geography and customer. The customer by customer renewal process for 2011 is well progressed. Good demand growth for electronic tools is continuing. Another year of modest revenue growth for Elsevier is expected.
47213_Text_p001-055.indd 16 1/3/11 11:18:11

Annual Reports and Financial Statements 2010 Reed Elsevier 17
Overview
Business review
Financial reviewG
overnanceFinancial statem
ents and other information
Change at2010 2009 constant Change
£m £m Change currencies underlying
RevenueScience & Technology 1,015 985 +3% +3% +3%Health Sciences 1,011 1,000 +1% 0% +1%
2,026 1,985 +2% +2% +2%
Adjusted operating profit 724 693 +4% +4% +4%
Elsevier 34%
Revenue% of Reed Elsevier
Elsevier 46%
Adjusted operating profit% of Reed Elsevier
Revenue£m
1,521
2006
1,507
2007
1,700
2008
1,985
2009
2,026
2010
Adjusted operating profit£m
465
2006
477
2007
568
2008
693
2009
724
2010
One of the world’s leading medical journalssince 1823
Access to history of drug developmentthrough unique online platform
Online evidence-based content to informnursing clinical decisions at the point of care
Integrated, online resources that complementElsevier’s nursing textbook content
Clinical decision support tool to identify areasfor improvement in medical practice
Leading web-based chemical reactionworkflow solutions for industrial chemists
Premier life sciences journal with the highestimpact factor in cell biology
The SciVerse platform combines contentfrom Elsevier products with a new discoveryhub and community developed applications
Science Direct is the world’s largest databaseof scientific and medical research articles
Scopus is the world’s largest scientificabstract and citation database
SciVal provides funding intelligence and researchperformance tools for academic institutions
Online clinical information service, includingreference works, journals and drug information
47213_Text_p001-055.indd 17 1/3/11 11:18:18

EVALUATING
RISK
18 Reed Elsevier Annual Reports and Financial Statements 2010
47213_Text_p001-055.indd 18 1/3/11 11:18:25

Annual Reports and Financial Statements 2010 Reed Elsevier 19
LEXISNEXIS RISK SOLUTIONSPROVIDES DATA AND ANALYTICSTO EVALUATE AND MANAGE RISKSASSOCIATED WITH TRANSACTIONSAND IMPROVE PERFORMANCEThe identity veri"cation and risk evaluation data and analytics providedby LexisNexis Risk Solutions utilise a comprehensive database of publicrecords and proprietary information, which is the largest database of itskind in the US market today.
47213_Text_p001-055.indd 19 1/3/11 11:18:31

ENABLING BETTER LEGAL
DECISI
20 Reed Elsevier Annual Reports and Financial Statements 2010
47213_Text_p001-055.indd 20 1/3/11 11:19:03

ONS
Annual Reports and Financial Statements 2010 Reed Elsevier 21
LEXISNEXIS LEGAL & PROFESSIONALIS A WORLD LEADING PROVIDEROF CONTENT AND INFORMATIONSOLUTIONSServing customers in more than 100 countries, LexisNexis providesresources and services that inform decisions and increase productivity.
47213_Text_p001-055.indd 21 1/3/11 11:19:15

22 Reed Elsevier Annual Reports and Financial Statements 2010
In 2010, LexisNexis comprised the two market facing businesses:Risk Solutions and Legal & Professional supported by shared servicefunctions. These businesses are described on the following pages.
Total LexisNexis revenues for the year ended 31 December 2010 were£2,618m. During 2010, LexisNexis was headquartered in New Yorkand at 31 December 2010 had 14,700 employees worldwide.
The adjusted operating margin declined 3.4 percentage points due tothe revenue decline in the legal businesses combined with significantincreases in spend on new legal product development, relatedinfrastructure, sales & marketing, and restructuring costs. Thiswas in part mitigated by continuing cost actions, including furtheroutsourcing of production and engineering activities, supply chainmanagement and operational streamlining in the legal businessesand the further integration within risk solutions. Underlying cost growthwas 6%. The reported operating margin, after amortisation of acquiredintangible assets and acquisition integration costs, was 12.4%, down0.8 percentage points from the prior year which included exceptionalrestructuring costs. There were no exceptional restructuring costs in2010 other than in respect of acquisition integration.
LexisNexis’ content and tools enable legal, risk and other professionalcustomers to make more effective and efficient decisions
2010 financial performance
LexisNexis returned to overall revenue growth, with stronggrowth in the risk business. Subscription revenues in thelegal business continued to reflect the lower levels of lawfirm activity and employment. Adjusted operating marginwas lower due to the weaker revenues and increasedspending in the legal business on new product development,related infrastructure and sales & marketing.
LexisNexis revenues increased by 1% and adjusted operating profitsdeclined 12% at constant currencies, both before and after smallacquisitions and disposals.
Change at2010 2009 constant Change
£m £m Change currencies underlying
Revenue 2,618 2,557 +2% +1% +1%
Adjusted operating profit 592 665 -11% -12% -12%
Adjusted operating profit£m
380
2006
406
2007
513
2008
665
2009
592
2010
Revenue£m
1,570
2006
1,594
2007
1,940
2008
2,557
2009
2,618
2010
47213_Text_p001-055.indd 22 1/3/11 11:19:16
Annual Reports and Financial Statements 2010 Reed Elsevier 23
Overview
Business review
Financial reviewG
overnanceFinancial statem
ents and other information
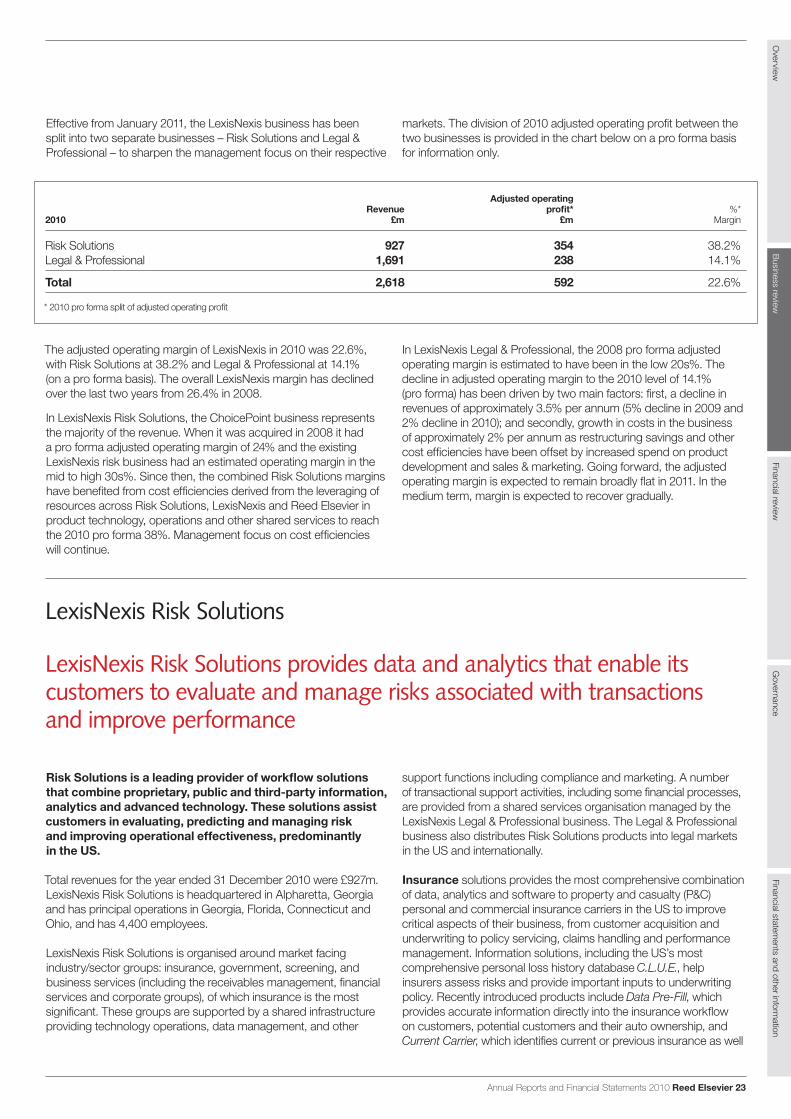
Adjusted operating Revenue profit* %*2010 £m £m Margin
Risk Solutions 927 354 38.2% Legal & Professional 1,691 238 14.1%
Total 2,618 592 22.6%
* 2010 pro forma split of adjusted operating profit
Risk Solutions is a leading provider of workflow solutions that combine proprietary, public and third-party information, analytics and advanced technology. These solutions assist customers in evaluating, predicting and managing risk and improving operational effectiveness, predominantly in the US.
Total revenues for the year ended 31 December 2010 were £927m. LexisNexis Risk Solutions is headquartered in Alpharetta, Georgia and has principal operations in Georgia, Florida, Connecticut and Ohio, and has 4,400 employees.
LexisNexis Risk Solutions is organised around market facing industry/sector groups: insurance, government, screening, and business services (including the receivables management, financial services and corporate groups), of which insurance is the most significant. These groups are supported by a shared infrastructure providing technology operations, data management, and other
support functions including compliance and marketing. A number of transactional support activities, including some financial processes, are provided from a shared services organisation managed by the LexisNexis Legal & Professional business. The Legal & Professional business also distributes Risk Solutions products into legal markets in the US and internationally.
Insurance solutions provides the most comprehensive combination of data, analytics and software to property and casualty (P&C) personal and commercial insurance carriers in the US to improve critical aspects of their business, from customer acquisition and underwriting to policy servicing, claims handling and performance management. Information solutions, including the US’s most comprehensive personal loss history database C.L.U.E., help insurers assess risks and provide important inputs to underwriting policy. Recently introduced products include Data Pre-Fill, which provides accurate information directly into the insurance workflow on customers, potential customers and their auto ownership, and Current Carrier, which identifies current or previous insurance as well
LexisNexis Risk Solutions provides data and analytics that enable its customers to evaluate and manage risks associated with transactions and improve performance
LexisNexis Risk Solutions
In LexisNexis Legal & Professional, the 2008 pro forma adjusted operating margin is estimated to have been in the low 20s%. The decline in adjusted operating margin to the 2010 level of 14.1% (pro forma) has been driven by two main factors: first, a decline in revenues of approximately 3.5% per annum (5% decline in 2009 and 2% decline in 2010); and secondly, growth in costs in the business of approximately 2% per annum as restructuring savings and other cost efficiencies have been offset by increased spend on product development and sales & marketing. Going forward, the adjusted operating margin is expected to remain broadly flat in 2011. In the medium term, margin is expected to recover gradually.
The adjusted operating margin of LexisNexis in 2010 was 22.6%, with Risk Solutions at 38.2% and Legal & Professional at 14.1% (on a pro forma basis). The overall LexisNexis margin has declined over the last two years from 26.4% in 2008.
In LexisNexis Risk Solutions, the ChoicePoint business represents the majority of the revenue. When it was acquired in 2008 it had a pro forma adjusted operating margin of 24% and the existing LexisNexis risk business had an estimated operating margin in the mid to high 30s%. Since then, the combined Risk Solutions margins have benefited from cost efficiencies derived from the leveraging of resources across Risk Solutions, LexisNexis and Reed Elsevier in product technology, operations and other shared services to reach the 2010 pro forma 38%. Management focus on cost efficiencies will continue.
Effective from January 2011, the LexisNexis business has been split into two separate businesses – Risk Solutions and Legal & Professional – to sharpen the management focus on their respective
markets. The division of 2010 adjusted operating profit between the two businesses is provided in the chart below on a pro forma basis for information only.
47213_Text_p001-055.indd 23 1/3/11 11:19:16
24 Reed Elsevier Annual Reports and Financial Statements 2010
as any lapses in coverage. In 2010, the Insurance Exchange waslaunched enabling the sharing of customer application data amongparticipating insurance agents, brokers and carriers. The exchangeis directed at improving the efficiency and transparency of theindependent agent-based distribution system for insurance products.
Government solutions provides investigative solutions to USfederal, state and local law enforcement and government agenciesto help solve cases and identify and locate individuals. Additionally,Government solutions helps mitigate risks of fraud, waste and abusein government programmes.
Screening solutions focuses on employment-related, resident andvolunteer screening, with the largest segment being pre-employmentscreening services offered across a number of industries includingretail, recruitment, banking, and professional services. ReceivablesManagement solutions helps debt recovery professionals inthe segmentation, management and collection of consumer andbusiness debt. Financial Services provides financial institutionswith risk management, identity verification, fraud detection, credit riskmanagement, and compliance solutions. These include “know yourcustomer” and anti-money laundering products. The Corporategroup provides risk and identity management solutions for customersin retail, telecommunications and utilities. The Risk Solutions businessalso provides identity verification and risk related information to thelegal industry.
During 2010, a particular focus has been on developing a pipeline ofnew solutions for select adjacent markets, sectors and geographies.
The identity verification and risk evaluation solutions provided byRisk Solutions utilise a comprehensive database of public recordsand proprietary information, which is the largest database of its kindin the US market today. LexisNexis Accurint is the flagship identityverification product, powered by the powerful High PerformanceCluster Computing (HPCC) technology. This technology enables RiskSolutions to provide its customers with highly relevant search resultsswiftly and to create new, low-cost solutions quickly and efficiently.
Market OpportunitiesRisk Solutions operates in markets with strong long term underlyinggrowth drivers: insurance underwriting transactions; insurance,healthcare and entitlement fraud; credit defaults and financial fraud;regulatory compliance and due diligence requirements surroundingcustomer enrolment and employment; and security considerations.
In the insurance segment, growth is supported by increasingtransactional activity in the auto and property insurance markets andthe increasing adoption by insurance carriers of more sophisticateddata and analytics in the prospecting, underwriting and claimsevaluation processes, to determine appropriate risk pricing, increasecompetitiveness and improve operating cost efficiency. Transactionalactivity is driven by the levels of insurance quoting as consumersseek better policy terms, stimulated by increasing competition
between insurance companies and rising levels of internet quotingand policy binding.
In screening, demand is driven mainly by employer hiring activityand, in receivables management, by levels of consumer debtdefaults and the prospects of recovering those debts; both of thesemarkets are linked to employment levels in the US. A number offactors support demand for risk solutions in the financial servicesmarket, including new credit originations, fraud losses and regulatorycompliance requirements. Growth in government markets is drivenby the increasing use of data and analytics to combat criminalactivity and fraud, and to address security issues. The level andtiming of demand in this market is influenced by governmentfunding considerations.
Strategic PrioritiesRisk Solutions’ strategic goal is to make businesses and governmentmore effective, through a better understanding of the risksassociated with individuals, other businesses and transactions andby providing the tools to help manage those risks. To achieve this,Risk Solutions is focused on: expanding the range of productsacross the insurance carrier workflow; leveraging our advancedtechnology capabilities; delivering innovative new products andexpanding the range of risk management solutions across adjacentmarkets; and completing the multi-year process of integratingthe ChoicePoint businesses acquired in September 2008.
Business Model, Distribution Channels and CompetitionRisk Solutions’ products are predominantly sold on a transactionalbasis directly to insurance carriers, other corporations andgovernment entities.
Risk Solutions and Verisk sell data and analytics to insurance carriersbut largely address different activities. Risk Solutions’ principalcompetitors include Thomson Reuters and First Data Corporation ina number of segments that utilise public records. Major competitorsin pre-employment screening are Altegrity and SymphonyTechnology Group.
LexisNexis Risk Solutions
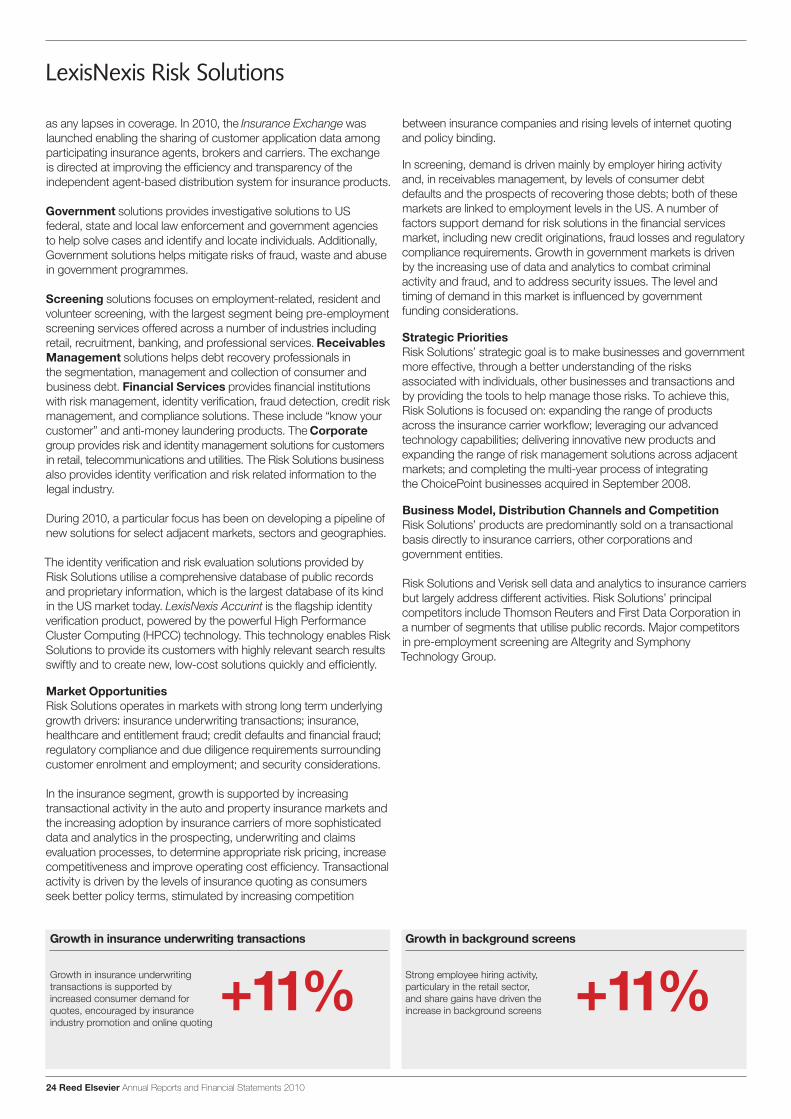
Growth in background screens
+11%Strong employee hiring activity,particulary in the retail sector,and share gains have driven theincrease in background screens
Growth in insurance underwriting transactions
+11%Growth in insurance underwritingtransactions is supported byincreased consumer demand forquotes, encouraged by insuranceindustry promotion and online quoting
47213_Text_p001-055.indd 24 1/3/11 11:19:17
Annual Reports and Financial Statements 2010 Reed Elsevier 25
Overview
Business review
Financial reviewG
overnanceFinancial statem
ents and other information
Change at2010 2009 constant Change
£m £m Change currencies underlying
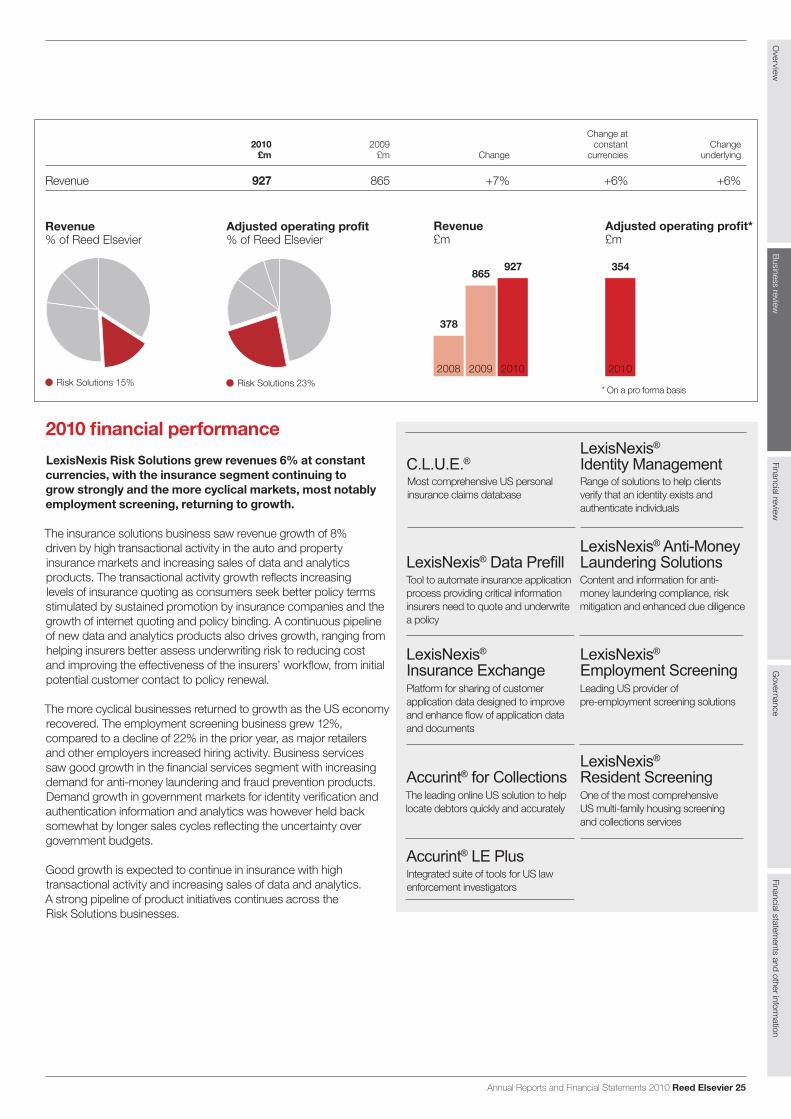
Revenue 927 865 +7% +6% +6%
Revenue£m
378
2008
865
2009
927
2010
Adjusted operating profit*£m
354
2010Risk Solutions 23%
Adjusted operating profit% of Reed Elsevier
Risk Solutions 15%
Revenue% of Reed Elsevier
* On a pro forma basis
2010 financial performance
LexisNexis Risk Solutions grew revenues 6% at constantcurrencies, with the insurance segment continuing togrow strongly and the more cyclical markets, most notablyemployment screening, returning to growth.
The insurance solutions business saw revenue growth of 8%driven by high transactional activity in the auto and propertyinsurance markets and increasing sales of data and analyticsproducts. The transactional activity growth reflects increasinglevels of insurance quoting as consumers seek better policy termsstimulated by sustained promotion by insurance companies and thegrowth of internet quoting and policy binding. A continuous pipelineof new data and analytics products also drives growth, ranging fromhelping insurers better assess underwriting risk to reducing costand improving the effectiveness of the insurers’ workflow, from initialpotential customer contact to policy renewal.
The more cyclical businesses returned to growth as the US economyrecovered. The employment screening business grew 12%,compared to a decline of 22% in the prior year, as major retailersand other employers increased hiring activity. Business servicessaw good growth in the financial services segment with increasingdemand for anti-money laundering and fraud prevention products.Demand growth in government markets for identity verification andauthentication information and analytics was however held backsomewhat by longer sales cycles reflecting the uncertainty overgovernment budgets.
Good growth is expected to continue in insurance with hightransactional activity and increasing sales of data and analytics.A strong pipeline of product initiatives continues across theRisk Solutions businesses.
Tool to automate insurance applicationprocess providing critical informationinsurers need to quote and underwritea policy
Platform for sharing of customerapplication data designed to improveand enhance flow of application dataand documents
The leading online US solution to helplocate debtors quickly and accurately
Integrated suite of tools for US lawenforcement investigators
Range of solutions to help clientsverify that an identity exists andauthenticate individuals
Content and information for anti-money laundering compliance, riskmitigation and enhanced due diligence
Leading US provider ofpre-employment screening solutions
One of the most comprehensiveUS multi-family housing screeningand collections services
Most comprehensive US personalinsurance claims database
C.L.U.E.®
Accurint® for Collections
LexisNexis® Anti-MoneyLaundering Solutions
LexisNexis®
Employment Screening
Accurint® LE Plus
LexisNexis®
LexisNexis®
Resident Screening
LexisNexis®
Identity Management
LexisNexis®
Insurance Exchange
47213_Text_p001-055.indd 25 1/3/11 11:19:18
26 Reed Elsevier Annual Reports and Financial Statements 2010
LexisNexis Legal & Professional is a world leadingprovider of content and information solutions for legaland other corporate markets. Serving customers in morethan 100 countries, LexisNexis Legal & Professionalprovides resources and services that inform decisionsand increase productivity.
Total revenues for the year ended 31 December 2010 were £1,691m.LexisNexis Legal & Professional is headquartered in New York andhas principal operations in Ohio and New Jersey in the United States,in London and Paris in Europe, Canada, and in several other countriesin Africa and Asia Pacific. It has 10,300 employees worldwide.
LexisNexis Legal & Professional is organised through market facingbusinesses, the most significant of which are Research & LitigationSolutions and Marketing & Business Solutions in the US andLexisNexis Europe, Middle East, Africa & Australasia and LexisNexisAsia (together reported as International) outside the US. Theseare supported by global shared services organisations providingplatform and product development, operational and distributionservices, and other support functions.
LexisNexis is a leading provider of legal and business informationand analysis to law firms, corporations and government throughoutthe US. Electronic information solutions and innovative workflowtools, developed through close collaboration with customers,help law firms and other legal and business professionals makebetter informed decisions in the practice of law and in managingtheir businesses.
In Research & Litigation solutions, the flagship product for legalresearch is Lexis.com, which provides federal and state statutesand case law, together with analysis and expert commentariesfrom sources such as Matthew Bender and Michie and the leadingcitation service Shepard’s, which advises on the continuingrelevance of case law precedents. Through its suite of litigationservices, LexisNexis additionally provides lawyers with tools forelectronic discovery, evidence management, case analysis, courtdocket tracking, e-filing, expert witness identification and legaldocument preparation. LexisNexis also partners with law schools toprovide services to students as part of their training. In October 2010,LexisNexis launched Lexis Advance for Solos, which is a legalresearch tool built specifically for the US solo attorney market andis the first product to be launched on the new LexisNexis researchplatform. Both the product and the platform are version 1.0 and
LexisNexis Legal & Professional provides legal, tax, regulatoryand news & business information and analysis to legal, corporate,government, accounting and academic markets
over the next few years LexisNexis will be introducing products ofincreasing sophistication and depth for specific customer segmentsand to perform specific functions across the legal markets. Earlierin the year, LexisNexis introduced Lexis for Microsoft Office, whichenables lawyers to conduct their Lexis searches within Microsoftapplications such as Word and Outlook. Other product introductionsincluded LexisNexis Verdict & Settlement Analyzer, which providesdata and analytics on previous settlements.
In the business of law, Marketing & Business solutions provideslaw firms with practice management solutions, including time andbilling systems, case management, cost recovery and documentmanagement services. LexisNexis assists law firms in their clientdevelopment through Lawyers.com, showcasing the qualificationsand credentials of more than one million lawyers and law firmsin the US and internationally, and providing law firms withwebsite development, search engine optimisation and otherweb marketing services.
LexisNexis also provides its legal and information services toUS government, corporate and academic customers, including newsand business information and public records. In addition to researchand litigation services, capabilities for these customers includespecialist products for corporate counsel focused on regulatorycompliance, intellectual property management, and managementof external counsel.
In International markets outside the United States, LexisNexisserves legal, corporate, government and academic markets inEurope, Canada, Africa and Asia Pacific with local and internationallegal, tax, regulatory and business information. The most significantbusinesses are in the UK, France, Australia and Canada.
LexisNexis is focused across all its geographies on leveraging bestin class content and its market leading international online productplatform to deliver innovative electronic information services andworkflow tools to help legal and business professionals make betterinformed decisions more efficiently. Penetration of online informationservices is growing and electronic revenues now account for over50% of LexisNexis total revenues outside the US.
Growth in Lawyers.com traffic
+12%Increase in consumers searchingfor lawyers online and growth in lawfirm online marketing drives growthin traffic to Lawyers.com
Growth in international online legal solutions
Growth in international (outside US)online solutions and workflow toolsto help lawyers make better informeddecisions more efficiently +6%
LexisNexis Legal & Professional
47213_Text_p001-055.indd 26 1/3/11 11:19:19
Annual Reports and Financial Statements 2010 Reed Elsevier 27
Overview
Business review
Financial reviewG
overnanceFinancial statem
ents and other information
In the UK, LexisNexis is a leading legal information provider in its market. It delivers a wide array of content and services, comprising an unrivalled collection of primary and secondary legislation, case law, expert commentary, and forms and precedents. Its extensive portfolio includes Halsbury’s Laws of England, Simon’s Taxes and Butterworths Company Law Service delivered through the UK’s flagship online product LexisLibrary and in print. Other electronic products include Lexis Legal Intelligence, a resource on legal practice for lawyers, and media monitoring and reputation management tools for the corporate market such as the NexisDirectresearch tool. Additionally, LexisNexis provides law firms with practice management solutions.
In 2010, LexisNexis continued to build its UK legal practical guidance service LexisPSL, and now has ten practice areas including company commercial, dispute resolution and employment. LexisPSL provides practical guidance on the application of law to complement and integrate with LexisNexis authoritative legal content and commentaries and legal forms and precedents.
In France, LexisNexis is a provider of information to lawyers, notaries and courts with JurisClasseur and La Semaine Juridique being the principal publications, delivered through lexisnexis.fr and in print. These content sources are, as in the UK, being combined with new content and innovative workflow tools to develop practical guidance and practice management solutions. During 2010, LexisNexis divested its legal publishing business in Germany as the investment required to build profitable scale was not considered to have adequate prospective returns. The news and business activities in Germany were retained.
Market OpportunitiesLonger term growth in legal and regulatory markets worldwide is driven by increasing levels of legislation, regulation, regulatory complexity and litigation, and an increasing number of lawyers. Additional market opportunities are presented by the increasing demand for online information solutions and practice management tools that improve the quality and productivity of research, deliver better legal outcomes, and improve business performance. Notwithstanding this, legal activity and legal information markets are also influenced by economic conditions and corporate activity, as has been seen most recently with the dampening impact on demand of the recent global recession and the somewhat subdued environment that has followed in North America and in Europe.
Strategic PrioritiesLexisNexis Legal & Professional’s strategic goal is to enable better legal outcomes and be the leading provider of productivity enhancing information and information-based workflow solutions in its markets. To achieve this LexisNexis is focused on: building world class content; developing next generation product platforms, tools and infrastructure to deliver best-in-class outcomes for legal and business professionals with greater speed and efficiency; building client development and practice management tools enabling customers to be more successful in their markets; international expansion and growth of online products and solutions; increasing LexisNexis’ presence in emerging markets; and improving operational efficiency.
In the US, the focus is on the continuing development of the next generation of legal research and practice solutions and a major upgrade in operations infrastructure and customer service and support platforms to provide an integrated and superior customer experience across US legal research, litigation services, practice management and client development. Progressive product introductions over the next few years will combine advanced technology with enriched content and sophisticated analytics and applications to enable LexisNexis’ customers to make better legal decisions and drive better outcomes for their organisations and clients. A further priority is to complete the transformation of the client development business from a legal directory business into a web marketing services company.
Outside the US, LexisNexis is focused on growing online services and developing further high quality actionable content and workflow tools, including the development of practical guidance and practice management applications. Additionally, LexisNexis is focusing on the expansion of its activities in emerging markets.
Business Model, Distribution Channels and CompetitionLexisNexis Legal & Professional products and services are generally sold directly to law firms and to corporate, government and academic customers on a paid subscription basis, with subscriptions with law firms often under multi year contracts.
Principal competitors for LexisNexis in US legal markets are West (Thomson Reuters), CCH (Wolters Kluwer) and BNA, and Bloomberg and Factiva (News Corporation) in news and business information. Competitors in litigation solutions also include software companies. Major international competitors include Thomson Reuters, Wolters Kluwer and Factiva.
47213_Text_p001-055.indd 27 1/3/11 11:19:19

28 Reed Elsevier Annual Reports and Financial Statements 2010
2010 financial performance
The LexisNexis Legal & Professional business saw a small revenue decline of 2% at constant currencies reflecting the impact on renewals and print product of the low levels of law firm activity and employment. Corporate, government and academic markets were lower.
US revenues declined 2% at constant currencies, or 1% underlying before the net effect of small disposals and acquisitions. This compares to a decline of 6% in the prior year. The decline was largely driven by the continued contraction in corporate, government and academic markets which saw revenues 5% lower in a challenging budgetary environment for customers, impacting in particular sales of the news & business information databases to corporate customers, which were down 13%. US law firm revenues were up 2%; these would however have been down 2% ignoring the effect of last year’s revenue recognition change in Martindale Hubbell. Law firm subscription, print and transactional revenues remained under pressure as contract renewals reflected the lower levels of law firm activity and lawyer employment than was the case when they were last agreed, typically two to three years ago.
Aside from this late cycle impact on renewals, which by the end of 2011 will be fully reflected in the base, legal markets in the US stabilised and good growth was seen in new sales. Good growth continued in litigation solutions, practice management and other services for law firms. In December 2010, LexisNexis acquired StateNet, the leading publisher of information on the progress of prospective legislation through the US legislative process.
Outside the US, International revenues declined 2% at constant currencies. Online legal solutions saw revenues up 6% with strong demand for technology enabled content and new workflow tools. Market penetration of these services continues to increase across all geographies. Print sales declined, particularly in the UK as law firms cut back on spending and place increasing reliance on online services. Electronic revenues now account for more than 50% of the International business.
Continued good progress is being made in the development of the next generation of legal products and advanced operational infrastructure, which will be progressively introduced over the next few years.
While law firms, corporations and governments remain cautious in their spending, new sales continue to be higher and the environment is more stable. Revenue recovery is expected to be gradual, with the adjusted operating margin broadly flat in 2011.
LexisNexis Legal & Professional
47213_Text_p001-055.indd 28 1/3/11 11:19:19
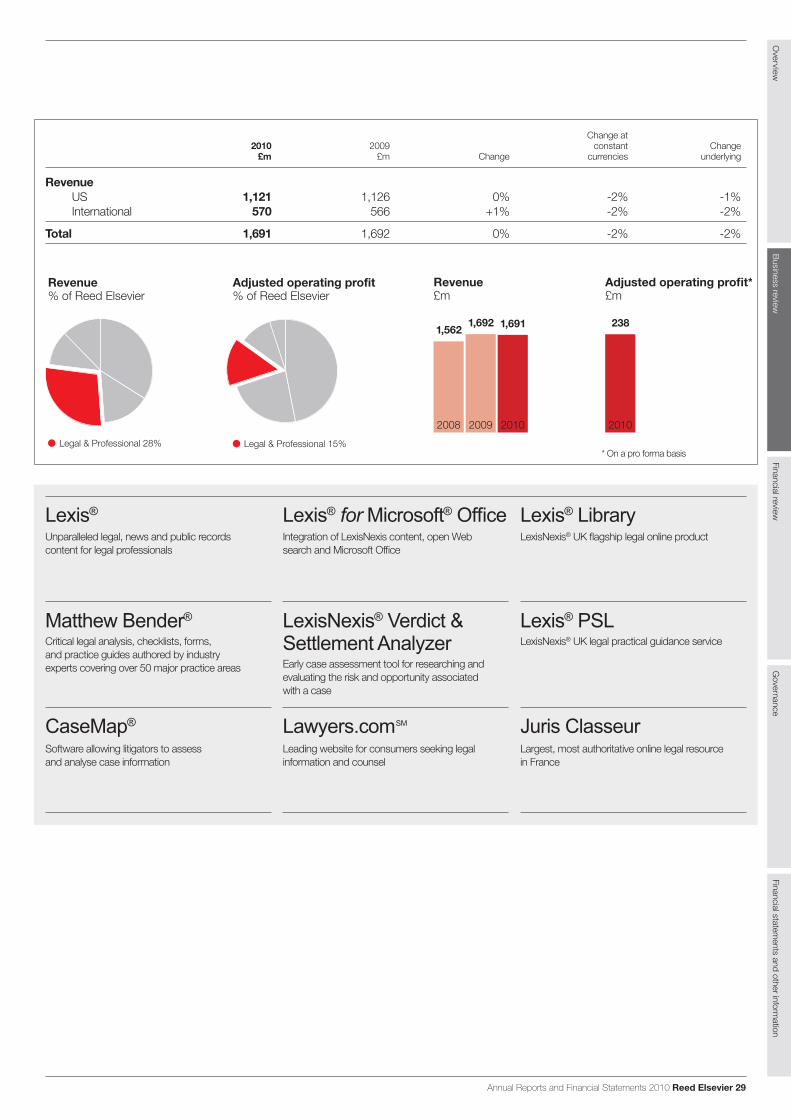
Annual Reports and Financial Statements 2010 Reed Elsevier 29
Change at2010 2009 constant Change
£m £m Change currencies underlying
RevenueUS 1,121 1,126 0% -2% -1%International 570 566 +1% -2% -2%
Total 1,691 1,692 0% -2% -2%
Revenue£m
1,562
2008
1,692
2009
1,691
2010
Legal & Professional 28%
Revenue% of Reed Elsevier
Legal & Professional 15%
Adjusted operating profit% of Reed Elsevier
Unparalleled legal, news and public recordscontent for legal professionals
Lexis®
Integration of LexisNexis content, open Websearch and Microsoft Office
Lexis® for Microsoft®LexisNexis® UK flagship legal online product
Lexis® Library
LexisNexis® UK legal practical guidance service
Lexis® PSL
Early case assessment tool for researching andevaluating the risk and opportunity associatedwith a case
LexisNexis® Verdict &Settlement AnalyzerCritical legal analysis, checklists, forms,
and practice guides authored by industryexperts covering over 50 major practice areas
Matthew Bender®
Largest, most authoritative online legal resourcein France
Juris ClasseurLeading website for consumers seeking legalinformation and counsel
Lawyers.comSM
Software allowing litigators to assessand analyse case information
CaseMap®
Overview
Business review
Financial reviewG
overnanceFinancial statem
ents and other information
Adjusted operating profit*£m
238
2010
* On a pro forma basis
47213_Text_p001-055.indd 29 1/3/11 11:19:21

30 Reed Elsevier Annual Reports and Financial Statements 2010
FORGINGBUSINESS RELATIO
47213_Text_p001-055.indd 30 1/3/11 11:19:33

Annual Reports and Financial Statements 2010 Reed Elsevier 31
REED EXHIBITIONS IS THE WORLD’SLEADING EVENTS BUSINESS, WITHOVER 450 EVENTS IN 35 COUNTRIESIn 2010 Reed Exhibitions brought together over six million eventparticipants from around the world, generating billions of dollarsin business for its customers.
NSHIPS
47213_Text_p001-055.indd 31 1/3/11 11:19:42
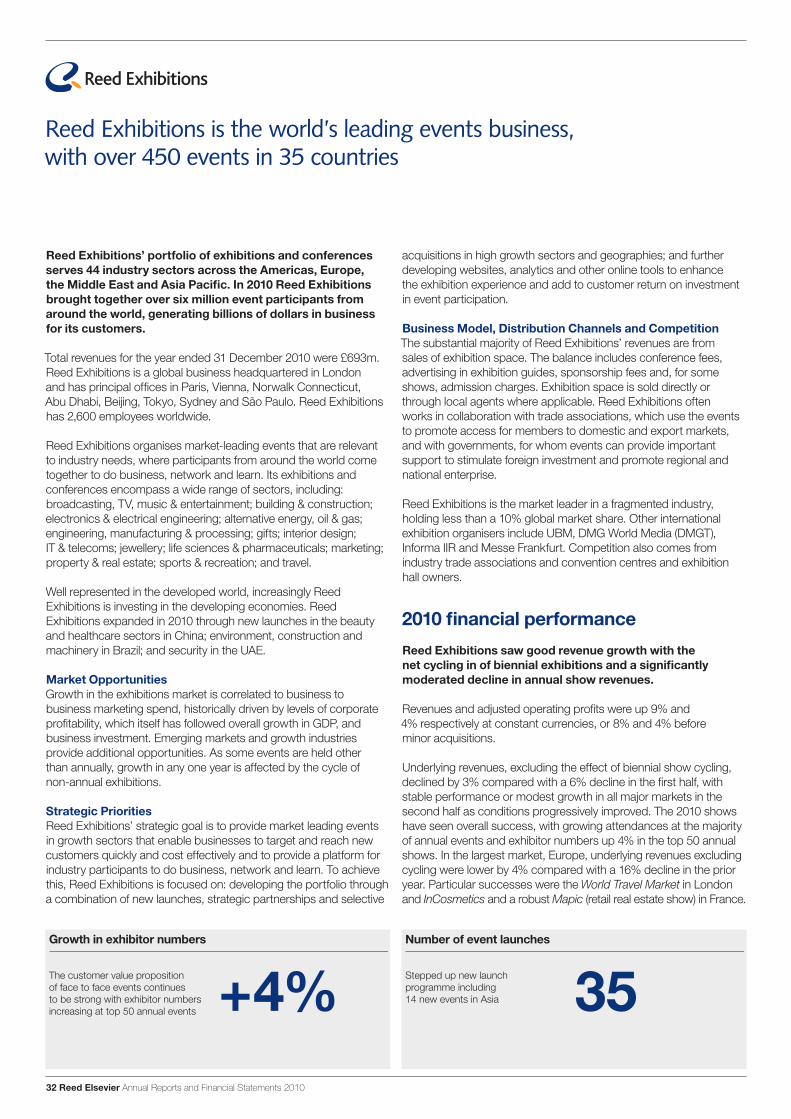
32 Reed Elsevier Annual Reports and Financial Statements 2010
Reed Exhibitions is the world’s leading events business,with over 450 events in 35 countries
Reed Exhibitions’ portfolio of exhibitions and conferencesserves 44 industry sectors across the Americas, Europe,the Middle East and Asia Pacific. In 2010 Reed Exhibitionsbrought together over six million event participants fromaround the world, generating billions of dollars in businessfor its customers.
Total revenues for the year ended 31 December 2010 were £693m.Reed Exhibitions is a global business headquartered in Londonand has principal offices in Paris, Vienna, Norwalk Connecticut,Abu Dhabi, Beijing, Tokyo, Sydney and São Paulo. Reed Exhibitionshas 2,600 employees worldwide.
Reed Exhibitions organises market-leading events that are relevantto industry needs, where participants from around the world cometogether to do business, network and learn. Its exhibitions andconferences encompass a wide range of sectors, including:broadcasting, TV, music & entertainment; building & construction;electronics & electrical engineering; alternative energy, oil & gas;engineering, manufacturing & processing; gifts; interior design;IT & telecoms; jewellery; life sciences & pharmaceuticals; marketing;property & real estate; sports & recreation; and travel.
Well represented in the developed world, increasingly ReedExhibitions is investing in the developing economies. ReedExhibitions expanded in 2010 through new launches in the beautyand healthcare sectors in China; environment, construction andmachinery in Brazil; and security in the UAE.
Market OpportunitiesGrowth in the exhibitions market is correlated to business tobusiness marketing spend, historically driven by levels of corporateprofitability, which itself has followed overall growth in GDP, andbusiness investment. Emerging markets and growth industriesprovide additional opportunities. As some events are held otherthan annually, growth in any one year is affected by the cycle ofnon-annual exhibitions.
Strategic PrioritiesReed Exhibitions’ strategic goal is to provide market leading eventsin growth sectors that enable businesses to target and reach newcustomers quickly and cost effectively and to provide a platform forindustry participants to do business, network and learn. To achievethis, Reed Exhibitions is focused on: developing the portfolio througha combination of new launches, strategic partnerships and selective
acquisitions in high growth sectors and geographies; and furtherdeveloping websites, analytics and other online tools to enhancethe exhibition experience and add to customer return on investmentin event participation.
Business Model, Distribution Channels and CompetitionThe substantial majority of Reed Exhibitions’ revenues are fromsales of exhibition space. The balance includes conference fees,advertising in exhibition guides, sponsorship fees and, for someshows, admission charges. Exhibition space is sold directly orthrough local agents where applicable. Reed Exhibitions oftenworks in collaboration with trade associations, which use the eventsto promote access for members to domestic and export markets,and with governments, for whom events can provide importantsupport to stimulate foreign investment and promote regional andnational enterprise.
Reed Exhibitions is the market leader in a fragmented industry,holding less than a 10% global market share. Other internationalexhibition organisers include UBM, DMG World Media (DMGT),Informa IIR and Messe Frankfurt. Competition also comes fromindustry trade associations and convention centres and exhibitionhall owners.
2010 financial performance
Reed Exhibitions saw good revenue growth with thenet cycling in of biennial exhibitions and a significantlymoderated decline in annual show revenues.
Revenues and adjusted operating profits were up 9% and4% respectively at constant currencies, or 8% and 4% beforeminor acquisitions.
Underlying revenues, excluding the effect of biennial show cycling,declined by 3% compared with a 6% decline in the first half, withstable performance or modest growth in all major markets in thesecond half as conditions progressively improved. The 2010 showshave seen overall success, with growing attendances at the majorityof annual events and exhibitor numbers up 4% in the top 50 annualshows. In the largest market, Europe, underlying revenues excludingcycling were lower by 4% compared with a 16% decline in the prioryear. Particular successes were the World Travel Market in Londonand InCosmetics and a robust Mapic (retail real estate show) in France.
Growth in exhibitor numbers
+4%The customer value propositionof face to face events continuesto be strong with exhibitor numbersincreasing at top 50 annual events
Number of event launches
35Stepped up new launchprogramme including14 new events in Asia
47213_Text_p001-055.indd 32 1/3/11 11:19:43

Annual Reports and Financial Statements 2010 Reed Elsevier 33
The US also saw significantly moderated declines with revenuesdown by 5% compared to 15% in 2009. By contrast, the showsin China, Russia, the Middle East and Brazil grew strongly althoughsome of these are joint ventures and are therefore not included inthe reported revenues. Successful shows in emerging marketsincluded Salão do Automóvel motor show in Brazil, pharmaceuticaland aluminium shows in China, and the Intercharm beauty showin Russia. Reed Exhibitions now operates nearly 100 shows inemerging markets with approximately 40 shows in each of Braziland China.
Reed Exhibitions significantly stepped up its launch programmein 2010 with 35 new events of which 14 were in Asia, includingthe successful Cloud Computing show in Japan, and thePAX East games event in Boston.
The decline in adjusted operating margin primarily reflects therevenue decline in annual shows and increased spend, includingon the development of websites, analytics and other innovativeonline tools to increase the effectiveness and efficiency of eventsfor both exhibitors and attendees, partly mitigated through costsavings. The reported operating margin, after amortisation ofacquired intangible assets, was 18.3%, up from 12.4% in the prioryear which included impairment charges on certain minor showsand exceptional restructuring costs. There were no exceptionalrestructuring costs in 2010.
The outlook is encouraging, with momentum building in annualshows and significant launch activity continuing. 2011 will seethe net cycling out of biennial shows, particularly in the first half.
Overview
Business review
Financial reviewG
overnanceFinancial statem
ents and other information
Reed Exhibitions 11%
Revenue% of Reed Elsevier
Revenue£m
522
2006
577
2007
707
2008
638
2009
693
2010
Adjusted operating profit£m
129
2006
139
2007
183
2008
152
2009
158
2010Reed Exhibitions 10%
Adjusted operating profit% of Reed Elsevier
Premier global event for thetravel market
International offshore oil & gastrade show
A world leading constructionexhibition
The North American jewelleryindustry’s premier trade event
World’s platform for sustainablefuture energy solutions
One of the largest and longest standingelectronics manufacturing trade eventsin China
Leading international exhibitionfor personal care ingredients
One of the largest business gifts& home fairs in China
The world’s entertainment market
International exhibition ofenvironmental equipment,technology and services
Change at2010 2009 constant Change
£m £m Change currencies underlying
Revenue 693 638 +9% +9% +8%
Adjusted operating profit 158 152 +4% +4% +4%
47213_Text_p001-055.indd 33 1/3/11 11:19:47

34 Reed Elsevier Annual Reports and Financial Statements 2010
GAINING BUSINESS
INSIGHTS
47213_Text_p001-055.indd 34 1/3/11 11:20:14

Annual Reports and Financial Statements 2010 Reed Elsevier 35
REED BUSINESS INFORMATIONIS A PROVIDER OF BUSINESSINFORMATION, DATA AND MARKETINGSOLUTIONS IN MULTIPLE FORMATS
47213_Text_p001-055.indd 35 1/3/11 11:20:30

36 Reed Elsevier Annual Reports and Financial Statements 2010
Reed Business Information is a provider of business information,data and marketing solutions in multiple formats
Reed Business Information (RBI) provides data services,information and marketing solutions to businessprofessionals in the UK, the US, Continental Europe, Asiaand Australia. It produces industry critical data servicesand lead generation tools, and over 100 online communityand job sites. It publishes over 100 business magazineswith market leading positions in many sectors.
Total revenues for the year ended 31 December 2010 were £718m.RBI is a global business headquartered in London and has principaloperations in Sutton in the UK, Amsterdam and Doetinchem in theNetherlands, Boston, Los Angeles and Norcross, Georgia in theUS as well as Paris, Milan, Madrid, Bilbao, Sydney and Shanghai.RBI has 5,300 employees worldwide.
RBI’s data services enable businesses and professionals to enhanceproductivity through quicker and easier access to insightful andcomprehensive industry information. Online marketing solutions,business to business magazines, online lead generation servicesand community websites provide effective marketing channels foradvertisers to reach target audiences and for industry professionalsto access valued information.
In 2010, RBI was significantly restructured and refocused, to reflectthe reduction in revenues caused by recession, the acceleratedmigration of customer marketing spend to web media, and thecontinued growth and opportunity in data services. During the year,the sale and closure of the US controlled circulation magazines andcertain other titles were completed, together with the sale of RBIGermany and clusters of titles in the Netherlands, UK, Italy, Spain,France, Ireland and Asia.
The business was redefined and is now managed by key assetgroup – data services, online marketing solutions, leading brands,and other magazine brands/websites – and specific strategiesand action plans have been developed for each group.
RBI’s market-leading data services include ICIS, a global informationand pricing service for the petrochemicals and energy sector;Bankers Almanac, a leading provider of reference data on thebanking industry; XpertHR, an online service providing HR data,regulatory guidance, best practices and tools for HR professionals;and Reed Construction Data, a provider of online construction datato the North American construction industry. In 2010, RBI enteredinto an agreement to increase its interest in CBI China, the marketleading petrochemical and energy information service in China,
and now has majority ownership. This transaction was completedin January 2011 and has brought ICIS unrivalled coverage of theimportant and growing Chinese and Asian chemicals and energymarkets, considerably strengthening its global position.
The major online marketing solutions include: totaljobs.com, a majorUK online recruitment site; and Hotfrog, a global online businessdirectory. Premier publishing brands include Variety in the US,New Scientist in the UK and the Elsevier magazine in the Netherlands.
Market OpportunitiesThe growing need for authoritative industry data and information isdriving demand for online subscription data services and providingnew opportunities. Business to business marketing spend hashistorically been driven by levels of corporate profitability, whichitself has followed GDP growth, and business investment.
Strategic PrioritiesRBI’s strategic goal is to help business professionals achieve betteroutcomes with information and decision support in its individualmarkets. Its areas of strategic focus are: further growing the dataservices businesses; capturing the economic recovery in the majoronline marketing solutions businesses; restructuring the businessmagazines and advertising driven portfolio, to develop onlineservices in key markets and support print franchises through brandextensions and redesign; and to realign the cost base with revenueexpectations and drive further organisational effectiveness.
Business Model, Distribution Channels and CompetitionAcross the RBI portfolio, user and subscription revenues nowaccount for 59% of the total business with the remaining 41% derivedfrom print and online advertising and lead generation. RBI electronicrevenue streams now account for 46% of total revenue.
Data services are typically sold directly on a subscription ortransactional basis. Business magazines are distributed on a paid orcontrolled circulation basis. Advertising and lead generation revenuesare sold directly or through agents.
RBI’s data services and titles compete with a number of publisherson a service and title by title basis including: UBM, McGraw Hill,Wolters Kluwer and Incisive as well as many niche and privately-owned competitors. RBI competes for online advertising with otherbusiness to business websites as well as Monster, Google and othersearch engines.
Advertising revenue %
41%
54%
2010
2008
Significant transformation of RBIfocusing on subscription dataservices is reducing its exposureto advertising revenues
Online revenue %
46%
34%
2010
2008
Demand for online data servicesand marketing solutions drivesincreasing proportion ofonline revenue
47213_Text_p001-055.indd 36 1/3/11 11:20:30
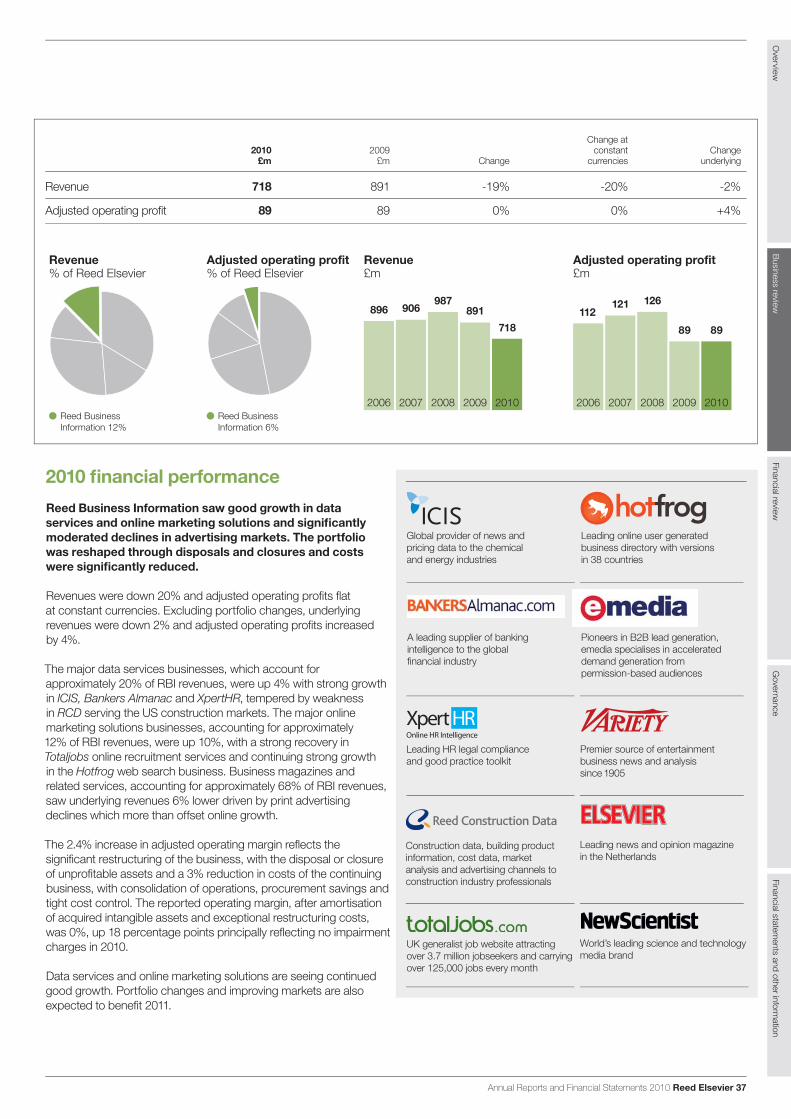
Annual Reports and Financial Statements 2010 Reed Elsevier 37
2010 financial performance
Reed Business Information saw good growth in dataservices and online marketing solutions and significantlymoderated declines in advertising markets. The portfoliowas reshaped through disposals and closures and costswere significantly reduced.
Revenues were down 20% and adjusted operating profits flatat constant currencies. Excluding portfolio changes, underlyingrevenues were down 2% and adjusted operating profits increasedby 4%.
The major data services businesses, which account forapproximately 20% of RBI revenues, were up 4% with strong growthin ICIS, Bankers Almanac and XpertHR, tempered by weaknessin RCD serving the US construction markets. The major onlinemarketing solutions businesses, accounting for approximately12% of RBI revenues, were up 10%, with a strong recovery inTotaljobs online recruitment services and continuing strong growthin the Hotfrog web search business. Business magazines andrelated services, accounting for approximately 68% of RBI revenues,saw underlying revenues 6% lower driven by print advertisingdeclines which more than offset online growth.
The 2.4% increase in adjusted operating margin reflects thesignificant restructuring of the business, with the disposal or closureof unprofitable assets and a 3% reduction in costs of the continuingbusiness, with consolidation of operations, procurement savings andtight cost control. The reported operating margin, after amortisationof acquired intangible assets and exceptional restructuring costs,was 0%, up 18 percentage points principally reflecting no impairmentcharges in 2010.
Data services and online marketing solutions are seeing continuedgood growth. Portfolio changes and improving markets are alsoexpected to benefit 2011.
Overview
Business review
Financial reviewG
overnanceFinancial statem
ents and other information
Reed BusinessInformation 12%
Revenue% of Reed Elsevier
Reed BusinessInformation 6%
Adjusted operating profit% of Reed Elsevier
Revenue£m
896
2006
906
2007
987
2008
891
2009
718
2010
Adjusted operating profit£m
112
2006
121
2007
126
2008
89
2009
89
2010
A leading supplier of bankingintelligence to the globalfinancial industry
Leading HR legal complianceand good practice toolkit
Construction data, building productinformation, cost data, marketanalysis and advertising channels toconstruction industry professionals
UK generalist job website attractingover 3.7 million jobseekers and carryingover 125,000 jobs every month
Premier source of entertainmentbusiness news and analysissince 1905
Leading news and opinion magazinein the Netherlands
World’s leading science and technologymedia brand
Leading online user generatedbusiness directory with versionsin 38 countries
Global provider of news andpricing data to the chemicaland energy industries
Pioneers in B2B lead generation,emedia specialises in accelerateddemand generation frompermission-based audiences
Change at2010 2009 constant Change
£m £m Change currencies underlying
Revenue 718 891 -19% -20% -2%
Adjusted operating profit 89 89 0% 0% +4%
47213_Text_p001-055.indd 37 1/3/11 11:20:36

38 Reed Elsevier Annual Reports and Financial Statements 2010
Corporate responsibility
Corporate responsibility ensures goodmanagement of risk and opportunities,helps us attract and retain the best people,and strengthens our corporate reputation.It means performing to the highestcommercial and ethical standards andchannelling our knowledge and strengths,as global leaders in our industries, to makea difference to society.
Constant engagement with stakeholders, including shareholders,employees, communities, governments, and members of civilsociety, helps us determine material corporate responsibility issues.The Reed Elsevier Board, senior management and the CorporateResponsibility Forum oversee corresponding objectives and monitorperformance against them – encompassing our unique contributionsas a business, as well as governance, people and community,customers, health and safety, supply chain, and environment.
Our unique contributions
We focus on areas where we can make a positive impact on societythrough our knowledge, resources and skills. These include universalsustainable access to information, advance of science and health,promotion of the rule of law and justice, and protection of society.
Elsevier, the world’s largest scientific publisher, has an importantrole to play in advancing human welfare and economic progressin places where information resources are often scarce. Among keyprogrammes is Research4Life, in partnership with United Nationsagencies and other publishers, which provides core and cutting-edgescientific information to researchers in more than 100 developingcountries. In 2010, there were 3.1 million Research4Life articledownloads from ScienceDirect – a 20% increase over 2009. Inthe year, the Elsevier Foundation, through its Innovative Librariesin Developing Countries programme, committed over $300,000to support libraries with grants to improve infrastructure-buildingaccess to primary source material. Recipients included HIV/AIDSAudio-Visual Archive, University of Cape Town, South Africa;Library Infrastructure Boost, University of Hargeisa, Somaliland;and the Egyptian National Cancer Database.
LexisNexis concentrates on promoting justice. Its Rule of LawResource Center is a free online community covering topics likehuman rights, protecting minority communities, and anti-humantrafficking. In 2010, LexisNexis signed an agreement to providecontent and support for the World Justice Project’s Ruleof Law Index, a new quantitative assessment tool ranking over75 countries. As a founder of the UK’s International Law Book
-29%Reduction in health and safety severity rate(lost days per 200,000 hours worked) 2008-2010
Valuing our people meansgoing beyond legal obligationsto ensure staff wellbeing -29%60%
Percentage of key suppliers as signatoriesto Reed Elsevier Supplier Code of Conduct
We uphold Reed Elsevier valuesby requiring our suppliers to meetthe same standards we setfor ourselves 60%
Facility, since 2005, LexisNexis has provided 5,000 legal texts toassist professional bodies, advice centres, pro bono groups, lawschools, and other institutions involved in access to justice acrosscommon law jurisdictions in Africa, Asia, and the Caribbean.
LexisNexis Risk Solutions works to protect society by supportingnon-profit organisations such as the National Center for Missing &Exploited Children (NCMEC) and the Cal Ripken Sr. Foundation.Since 2005, LexisNexis has completed nearly 6 million volunteerbackground checks for such organisations, identifying over 870,000individuals with criminal convictions, including more than 58,000registered sex offenders. Employees helped create the ADAMprogramme which assists in the safe recovery of missing children.In partnership with NCMEC, ADAM distributes missing child postersto police, news media, schools, businesses, medical centres, andother recipients within a specific geographic search area. Sincelaunching in 2000, 117 children have been located.
Reed Exhibitions provides platforms at its trade shows toorganisations that support our corporate responsibility focus areas.At the 2010 World Travel Market, its global event for the travel industry,Reed Exhibitions marked World Responsible Tourism Day with theResponsible Tourism Awards, recognising sector initiatives in areaslike poverty reduction, low carbon transport and technology, andconservation. Over the last seven years, Reed Exhibitions has givenfree space at the London Book Fair to Book Aid International, whichannually provides 500,000 books – including those donated fromacross Reed Elsevier – to readers in the developing world, enablingthe charity to engage with a wide range of potential book andfinancial donors.
Reed Business Information (RBI) uses the power of its brands toaid communities. Variety, the leading entertainment industry newssource published by RBI, has established initiatives like the Powerof Youth to spur young entertainers to support philanthropic andhumanitarian causes, and to encourage their fans to do so as well.Since its inception in 2007, Power of Youth has raised more than$850,000 to aid children; in 2010 beneficiaries included LA’s BEST,Education through Music, Girl Up, and Pencils of Promise. Varietyhas built on the Power of Youth model to launch Power of Womenand the Power of Comedy to highlight those using their celebrityto beneficial effect.
Drawing on expertise across Reed Elsevier, in 2010 we launchedthe Reed Elsevier Environmental Challenge to identify projects thatimprove sustainable access to water where it is presently at risk.We have provided access to products from our businesses toover 100 registrants from more than 50 countries and winnerswill be announced in June 2011.
2011 ObjectivesComplete RE Environmental Challenge; launch plans for 2012Undertake UNICEF project on the impact of climate changeon childrenFurther expansion of Research4Life
47213_Text_p001-055.indd 38 1/3/11 11:20:36

Annual Reports and Financial Statements 2010 Reed Elsevier 39
Corporate responsibility continued
Governance
2010 ObjectivesCode of Ethics and Business Conduct course completionby 90% of all employeesData Privacy and Security course completion by 60% of allemployeesAnti-bribery training for 80% of relevant employees in higherrisk roles and geographies
The Reed Elsevier Code of Ethics and Business Conduct (Code)is disseminated to every employee as a guide to our corporate andindividual conduct. Encompassing topics such as fair competition,anti-bribery and human rights, it encourages open and principledbehaviour. 93% of current employees completed online Code trainingby year end 2010, and 80% of all employees completed a dataprivacy and security course. In 2010, we provided anti-briberytraining for approximately 78% of relevant employees in higherrisk roles and geographies. Further by the close of 2010, 2,700managers had completed online training on anti-harassment and5,500 employees on fair competition.
In 2010, we actively promoted the United Nations Global Compact(UNGC) to which we are a signatory – businesses must align theirgovernance and operations with ten principles related to humanrights, labour, environment and anti-corruption. We served on thesteering group for the United Kingdom; contributed to the UNGCSupply Chain Advisory Group; produced a video on the UNGC forthe legal community; and helped launch a report on UK signatoriesand the Millennium Development Goals.
2011 ObjectivesCode of Ethics and Business Conduct course completionby 95% of all employeesFull alignment with Adequate Procedures Guidance underthe UK Bribery Act; 95% completion of anti-bribery trainingby relevant employees in higher risk jobs and geographiesImplementation of updated records management policy
People and community
2010 ObjectivesAdvance divisional Employee Opinion Survey (EOS) action plansDevelop a diversity and inclusion strategy for key locationsCloser alignment of RE Cares donations with corporateresponsibility focus areasIncrease in-kind contributions
Our 30,200 people are our strength. In 2010, we implementedactivities across the business to address the results of our 2009global Employee Opinion Survey. For example, LexisNexis developednew initiatives to help employees build their management capabilities,with a percentage of executive bonuses tied to higher 2010 interim,‘pulse’ survey scores in this and other areas. At Reed Exhibitions,focus groups were held to address career development andsatisfaction with feedback translated into management activities.
The Reed Elsevier Diversity and Inclusion (D&I) Statement articulatesour commitment to a diverse workforce and environment thatrespects individuals and their contributions, regardless of theirgender, race, or other characteristics. In 2010, we developed a D&Istrategy endorsed by the Reed Elsevier Management Committee,with key objectives such as ensuring each key location has aD&I value proposition and broad implementation plan. Our cross-business D&I Working Group, drawing on internal and externalexpertise, promoted best practice in areas ranging from trainingto communication. Affinity groups, like women’s forums, providesupport and mentoring and encourage community involvement.
Reed Elsevier Cares, our global community programme, promoteseducation for disadvantaged young people, and allows staff up totwo days off per year for their own community work. We donated£2.3 million in cash (including through matching gifts) and theequivalent of £6.6 million in products, services, and staff time in 2010.We worked to increase in-kind contributions throughout the year,examples of which include LexisNexis Corporate Responsibility Daywhich involved nearly 2,000 staff in local community projects, andElsevier Beijing which worked with an underprivileged school inHe Bei Province over two days providing educational supportand supplies.
Champions engage colleagues throughout the year in activitiessuch as the Reed Elsevier Cares Challenge, which rewards businesssponsored community engagement, and Reed Elsevier CaresMonth, with hundreds of events around the globe. During the Month,we launched a global fundraising effort to raise $50,000 for PlanInternational’s Because I’m a Girl campaign to help girls in India,for example, in gaining educational opportunities and awarenessof their legal and employment rights. Our annual global book driveinvolved over 5,000 employees and yielded some 18,240 books forlocal and developing world readers.
2011 ObjectivesBegin implementation of diversity and inclusion strategyin key locationsNew and improved People sections of internal and externalwebsitesLaunch RE Cares recognition awards
Overview
Business review
Financial reviewG
overnanceFinancial statem
ents and other information
To date, Elsevier has helped the International Council of Nurses (ICN)Mobile Library set up more than 250 mobile libraries to delivercurrent health information to nursing professionals working in remoteareas of 17 developing countries.
Each library is housed in a sturdy, transportable trunk with approximately 80 titles. In 2010,through Elsevier and the Reed Elsevier Cares programme, resources, products, andassistance supported the ICN Supporting Nurses and Nursing in Haiti Fund in aidingpost-earthquake recovery and reconstruction with tailored French-language NursingMobile Libraries containing books on post-disaster response, infectious diseases, andreinitiating interrupted treatment of life-threatening conditions like HIV and tuberculosis.
47213_Text_p001-055.indd 39 1/3/11 11:20:38

40 Reed Elsevier Annual Reports and Financial Statements 201040 Reed Elsevier Annual Reports and Financial Statements 2010
Corporate responsibility continued
Customers
2010 ObjectivesImprove customer loyalty as measured by Net Promoter Scores;advance dashboard programmesContinue to improve website accessibility
We surveyed more than 150,000 customers through Net PromoterScore (measuring customer loyalty) and business dashboardprogrammes. This allows us to deepen understanding of theirneeds and drives forward a customer centric culture acrossReed Elsevier. Results, reviewed by the CEO and senior managers,and communicated to staff, illuminate where we are doing well andwhere we must do better.
We are committed to improving access to our products and servicesfor all users, regardless of physical ability. Upgrades to core LexisNexisproducts in 2010 have incorporated WCAG 2.0, the most recentweb accessibility guidelines. The Accessibility Working Group heldeducational webinars with disabled customers and accessibilityexperts, and helped process 3,250 requests for accessible versionsof our publications, many from AccessText.org, a service we helpedestablish – 95% of requests were addressed in one day or less.In 2010, Elsevier won the first JISC Publisher Lookup Award forAccessibility, and also enabled the text-to-speech option on alle-books titles to aid users with sight, motor or other challenges.
2011 ObjectivesLaunch CR webinars on non-financial performance to supportcustomer-facing staffConsult on Reed Elsevier Editorial PolicyAssess accessibility of key product websites
Health and safety
2010 Objectives10% reduction in severity rate by 2010 (from 2008 baseline)Advance collection of absenteeism data
Our employees have the right to a healthy and safe workplaceas outlined in the Reed Elsevier Health and Safety Policy.
To reduce our severity rate (lost days per 200,000 hours worked),we conduct risk assessments and work with a third party resourcein the US to assign a nurse case manager to each complex orsevere claim. We achieved a 29% reduction in the severity ratebetween 2008 and 2010.
We concentrated on wellness in the workplace providing stressawareness training, weight loss and smoking cessation programmes.In 2010, we advanced collection of absenteeism data by incorporatingit into a new global human resources information system launched inNorth America during the year.
We held the second RE:Fit2Win global competition in 2010 to recogniseemployees for walking, cycling, and running, with winners receiving$1,000 for the charity of their choice. 1,083 employees took part.
2011 ObjectivesBenchmark health and safety performanceExtend preventive care programmes
Supply Chain
2010 Objectives60% of key suppliers as Supplier Code of Conduct signatories40 external audits of high risk suppliersAsk key suppliers to become UN Global Compact signatories
We require our suppliers to meet the high standards we set forourselves. Our Supplier Code of Conduct stipulates adherence toall laws and best practice in areas such as human rights, labour andthe environment. Through our Socially Responsible Supplier (SRS)database, we tracked 606 critical, preferred, and strategic suppliers,and those we deem high risk according to criteria from the CorporateExecutive Board’s Global Country Analysis Support Tool, humantrafficking data from the US State Department, and rankings in theEnvironmental Performance Index (EPI) produced by Yale Universityand Columbia University. We achieved our target of 60% of SRSsuppliers as signatories to the Supplier Code by year end, andspecialists ITS undertook 43 external audits of high risk suppliers.Any incidence of Supplier Code non-compliance identified inthe audit process triggers a corrective action plan with supplierremediation required on all issues. We have embedded signing theSupplier Code into our e-sourcing tool as one of the criteria for doingbusiness with us.
We provided training to increase reporting on the Reed Elsevierportion of suppliers’ CO2 emissions and undertook six supplierwebinars on the benefits of joining the UN Global Compact.
2011 Objectives75% of key suppliers as Supplier Code of Conduct signatories45 external audits of high risk suppliersIntroduce Socially Responsible Supplier Academy
Through its trade shows, Reed Exhibitions advancesour CR focus areas by bringing people together toshare information.
In 2010 Reed Exhibitions ran Pollutec Lyon, a leading internationalenvironment exhibition bringing together innovative techniquesfor the prevention and treatment of pollution of all kinds as well asfor the preservation of the environment as a whole. Close to 2,000exhibitors and over 50,000 visitors attended to discuss innovationsin key sectors such as water, waste (which includes recycling andcleaning), air quality, and energy.
47213_Text_p001-055.indd 40 1/3/11 11:20:43
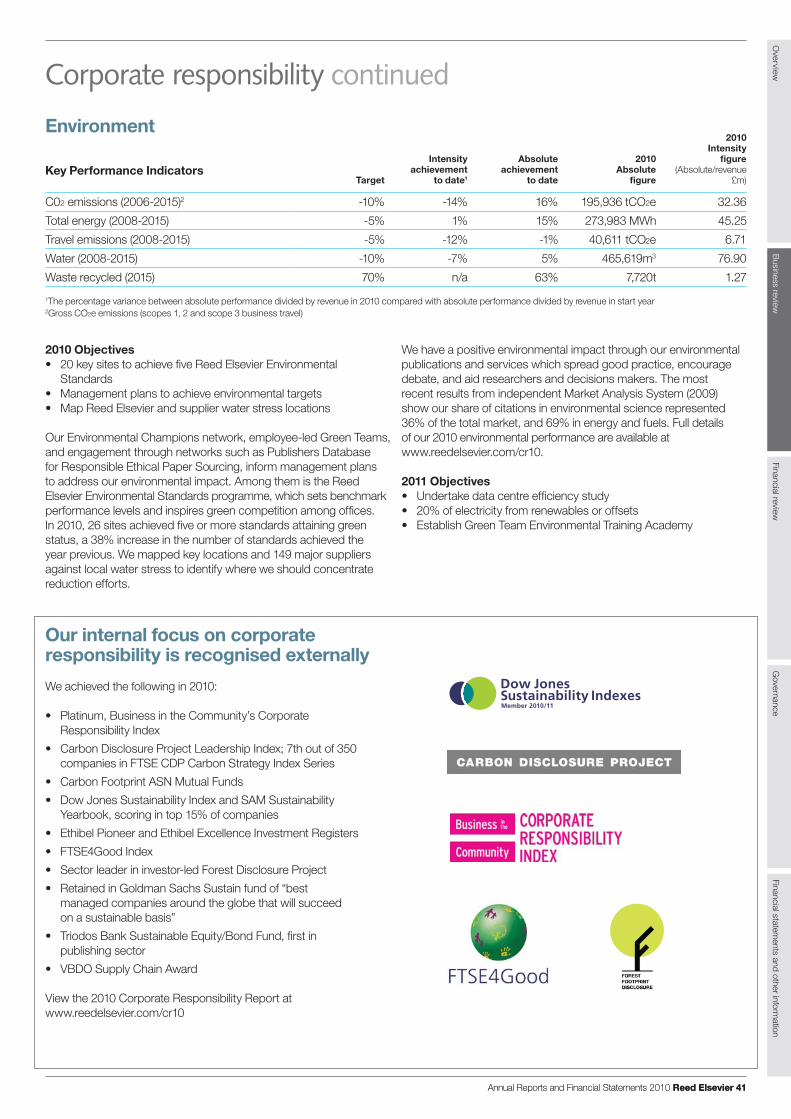
Annual Reports and Financial Statements 2010 Reed Elsevier 41Annual Reports and Financial Statements 2010 Reed Elsevier 41
2010 Objectives20 key sites to achieve five Reed Elsevier EnvironmentalStandardsManagement plans to achieve environmental targetsMap Reed Elsevier and supplier water stress locations
Our Environmental Champions network, employee-led Green Teams,and engagement through networks such as Publishers Databasefor Responsible Ethical Paper Sourcing, inform management plansto address our environmental impact. Among them is the ReedElsevier Environmental Standards programme, which sets benchmarkperformance levels and inspires green competition among offices.In 2010, 26 sites achieved five or more standards attaining greenstatus, a 38% increase in the number of standards achieved theyear previous. We mapped key locations and 149 major suppliersagainst local water stress to identify where we should concentratereduction efforts.
Corporate responsibility continued
Key Performance IndicatorsTarget
Intensityachievement
to date1
Absoluteachievement
to date
2010Absolute
figure
2010Intensity
figure(Absolute/revenue
£m)
C02 emissions (2006-2015)2 -10% -14% 16% 195,936 tCO2e 32.36
Total energy (2008-2015) -5% 1% 15% 273,983 MWh 45.25
Travel emissions (2008-2015) -5% -12% -1% 40,611 tCO2e 6.71
Water (2008-2015) -10% -7% 5% 465,619m3 76.90
Waste recycled (2015) 70% n/a 63% 7,720t 1.27
1The percentage variance between absolute performance divided by revenue in 2010 compared with absolute performance divided by revenue in start year2Gross CO2e emissions (scopes 1, 2 and scope 3 business travel)
Overview
Business review
Financial reviewG
overnanceFinancial statem
ents and other information
We have a positive environmental impact through our environmentalpublications and services which spread good practice, encouragedebate, and aid researchers and decisions makers. The mostrecent results from independent Market Analysis System (2009)show our share of citations in environmental science represented36% of the total market, and 69% in energy and fuels. Full detailsof our 2010 environmental performance are available atwww.reedelsevier.com/cr10.
2011 ObjectivesUndertake data centre efficiency study20% of electricity from renewables or offsetsEstablish Green Team Environmental Training Academy
Our internal focus on corporateresponsibility is recognised externally
We achieved the following in 2010:
Platinum, Business in the Community’s CorporateResponsibility IndexCarbon Disclosure Project Leadership Index; 7th out of 350companies in FTSE CDP Carbon Strategy Index SeriesCarbon Footprint ASN Mutual FundsDow Jones Sustainability Index and SAM SustainabilityYearbook, scoring in top 15% of companiesEthibel Pioneer and Ethibel Excellence Investment RegistersFTSE4Good IndexSector leader in investor-led Forest Disclosure ProjectRetained in Goldman Sachs Sustain fund of “bestmanaged companies around the globe that will succeedon a sustainable basis”Triodos Bank Sustainable Equity/Bond Fund, first inpublishing sectorVBDO Supply Chain Award
View the 2010 Corporate Responsibility Report atwww.reedelsevier.com/cr10
Environment
47213_Text_p001-055.indd 41 1/3/11 11:20:57

42 Reed Elsevier Annual Reports and Financial Statements 2010
Chief Financial Officer’s report
Reported figures
Revenues at £6,055m (2009: £6,071m) were flat compared with 2009. At constant exchange rates, revenues were down 1% compared with the prior year. Underlying revenues, i.e. before acquisitions and disposals, were 2% higher. Revenue performance across the business is described in the Business Review.
Reconciliation of reported revenues year-on-year
Year to 31 December £m Change
2009 revenue 6,071
Underlying growth 100 +2%
Acquisitions 5 0%
Disposals (173) -3%
Currency effects 52 +1%
2010 revenue 6,055 0%
Reported operating profit, after amortisation and impairment of acquired intangible assets and goodwill and exceptional restructuring and acquisition related costs, was up 39% at £1,090m (2009: £787m). The significant increase principally reflects no intangible asset and goodwill impairment and lower exceptional restructuring charges.
2010 2009 Change at Change Reported figures £m £m Change constant currencies underlying
Revenue 6,055 6,071 0% -1% +2%Operating profit 1,090 787 +39% +37%Profit before tax 768 435 +77% +74%Net profit 642 391 +64% +61%Net borrowings 3,455 3,931
Adjusted figures
Operating profit 1,555 1,570 -1% -2% -1%Operating margin 25.7% 25.9%Profit before tax 1,279 1,279 0% -1%Net profit 983 982 0% -1%Operating cash flow 1,519 1,558 -3% -3%Operating cash flow conversion 98% 99%Return on invested capital 10.6% 10.4%
Change at Reed Elsevier PLC Reed Elsevier NV constantParent Companies 2010 2009 Change 2010 2009 Change currencies
Reported earnings per share 27.3p 17.2p +58% !0.51 !0.32 +62%Adjusted earnings per share 43.4p 45.9p -5% !0.78 !0.79 -1% -6%Ordinary dividend per share 20.4p 20.4p 0% !0.412 !0.400 +3%
Adjusted figures are used by Reed Elsevier as additional performance measures and are stated before the amortisation and impairment of acquired intangible assets and goodwill, exceptional restructuring and acquisition related costs, and, in respect of earnings, reflect a tax rate that excludes the effect of movements in deferred taxation assets and liabilities that are not expected to crystallise in the near term and includes the benefit of tax amortisation where available on acquired goodwill and intangible assets. Exceptional restructuring costs in 2009 relate to the major restructuring programmes announced in February 2008 and 2009 and in 2010 relate only to the restructuring of RBI. Acquisition related costs relate to acquisition integration and, from 2010, professional and other transaction related fees and adjustments to deferred and contingent consideration now required to be expensed under international financial reporting standards. Profit and loss on disposals and other non operating items are also excluded from the adjusted figures. Reconciliations between the reported and adjusted figures are set out in note 10 to the combined financial statements. Comparison at constant exchange rates uses 2009 full year average and hedge exchange rates. Underlying growth rates are the year on year change at constant currencies, excluding the results of all acquisitions and disposals made both in the year and prior year.
Mark ArmourChief Financial Officer
47213_Text_p001-055.indd 42 1/3/11 11:20:58
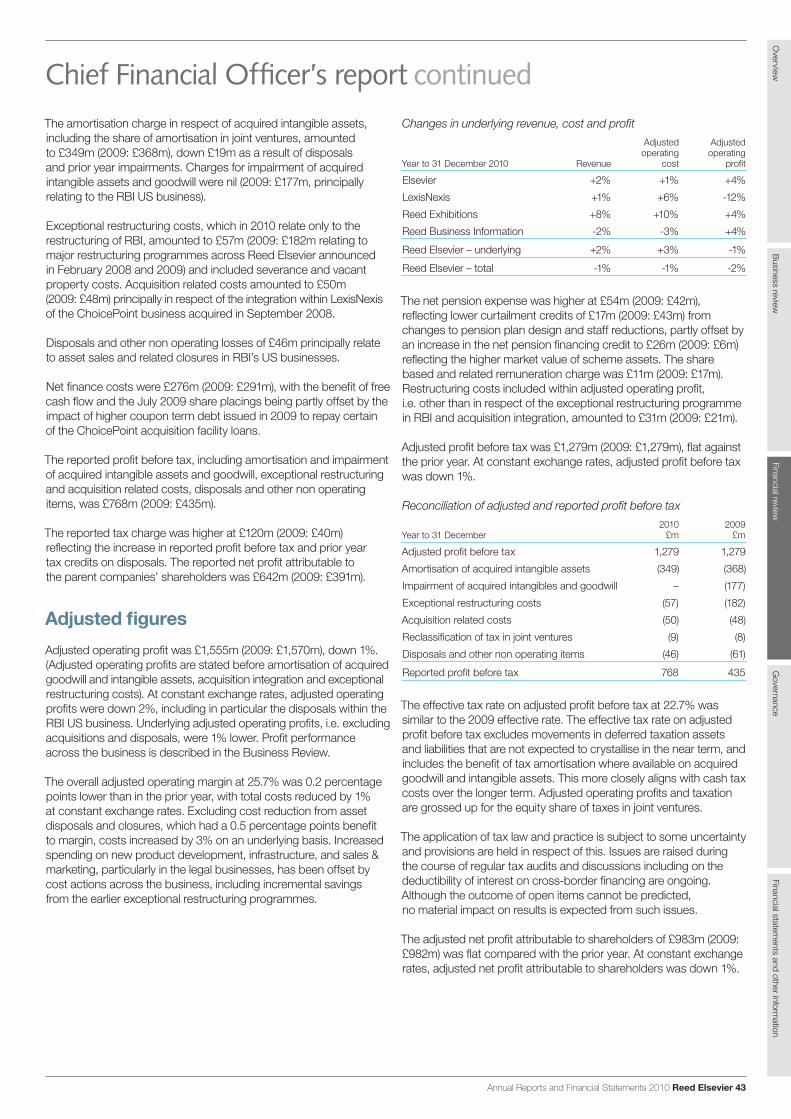
Annual Reports and Financial Statements 2010 Reed Elsevier 43
Overview
Business review
Financial reviewG
overnanceFinancial statem
ents and other information
The amortisation charge in respect of acquired intangible assets, including the share of amortisation in joint ventures, amounted to £349m (2009: £368m), down £19m as a result of disposals and prior year impairments. Charges for impairment of acquired intangible assets and goodwill were nil (2009: £177m, principally relating to the RBI US business).
Exceptional restructuring costs, which in 2010 relate only to the restructuring of RBI, amounted to £57m (2009: £182m relating to major restructuring programmes across Reed Elsevier announced in February 2008 and 2009) and included severance and vacant property costs. Acquisition related costs amounted to £50m (2009: £48m) principally in respect of the integration within LexisNexis of the ChoicePoint business acquired in September 2008.
Disposals and other non operating losses of £46m principally relate to asset sales and related closures in RBI’s US businesses.
Net finance costs were £276m (2009: £291m), with the benefit of free cash flow and the July 2009 share placings being partly offset by the impact of higher coupon term debt issued in 2009 to repay certain of the ChoicePoint acquisition facility loans.
The reported profit before tax, including amortisation and impairment of acquired intangible assets and goodwill, exceptional restructuring and acquisition related costs, disposals and other non operating items, was £768m (2009: £435m).
The reported tax charge was higher at £120m (2009: £40m) reflecting the increase in reported profit before tax and prior year tax credits on disposals. The reported net profit attributable to the parent companies’ shareholders was £642m (2009: £391m).
Adjusted figures
Adjusted operating profit was £1,555m (2009: £1,570m), down 1%. (Adjusted operating profits are stated before amortisation of acquired goodwill and intangible assets, acquisition integration and exceptional restructuring costs). At constant exchange rates, adjusted operating profits were down 2%, including in particular the disposals within the RBI US business. Underlying adjusted operating profits, i.e. excluding acquisitions and disposals, were 1% lower. Profit performance across the business is described in the Business Review.
The overall adjusted operating margin at 25.7% was 0.2 percentage points lower than in the prior year, with total costs reduced by 1% at constant exchange rates. Excluding cost reduction from asset disposals and closures, which had a 0.5 percentage points benefit to margin, costs increased by 3% on an underlying basis. Increased spending on new product development, infrastructure, and sales & marketing, particularly in the legal businesses, has been offset by cost actions across the business, including incremental savings from the earlier exceptional restructuring programmes.
Chief Financial Officer’s report continuedChanges in underlying revenue, cost and profit
Adjusted Adjustedoperating operating
Year to 31 December 2010 Revenue cost profit
Elsevier +2% +1% +4%
LexisNexis +1% +6% -12%
Reed Exhibitions +8% +10% +4%
Reed Business Information -2% -3% +4%
Reed Elsevier – underlying +2% +3% -1%
Reed Elsevier – total -1% -1% -2%
The net pension expense was higher at £54m (2009: £42m), reflecting lower curtailment credits of £17m (2009: £43m) from changes to pension plan design and staff reductions, partly offset by an increase in the net pension financing credit to £26m (2009: £6m) reflecting the higher market value of scheme assets. The share based and related remuneration charge was £11m (2009: £17m). Restructuring costs included within adjusted operating profit, i.e. other than in respect of the exceptional restructuring programme in RBI and acquisition integration, amounted to £31m (2009: £21m).
Adjusted profit before tax was £1,279m (2009: £1,279m), flat against the prior year. At constant exchange rates, adjusted profit before tax was down 1%.
Reconciliation of adjusted and reported profit before tax2010 2009
Year to 31 December £m £m
Adjusted profit before tax 1,279 1,279
Amortisation of acquired intangible assets (349) (368)
Impairment of acquired intangibles and goodwill – (177)
Exceptional restructuring costs (57) (182)
Acquisition related costs (50) (48)
Reclassification of tax in joint ventures (9) (8)
Disposals and other non operating items (46) (61)
Reported profit before tax 768 435
The effective tax rate on adjusted profit before tax at 22.7% was similar to the 2009 effective rate. The effective tax rate on adjusted profit before tax excludes movements in deferred taxation assets and liabilities that are not expected to crystallise in the near term, and includes the benefit of tax amortisation where available on acquired goodwill and intangible assets. This more closely aligns with cash tax costs over the longer term. Adjusted operating profits and taxation are grossed up for the equity share of taxes in joint ventures.
The application of tax law and practice is subject to some uncertainty and provisions are held in respect of this. Issues are raised during the course of regular tax audits and discussions including on the deductibility of interest on cross-border financing are ongoing. Although the outcome of open items cannot be predicted, no material impact on results is expected from such issues.
The adjusted net profit attributable to shareholders of £983m (2009: £982m) was flat compared with the prior year. At constant exchange rates, adjusted net profit attributable to shareholders was down 1%.
47213_Text_p001-055.indd 43 1/3/11 11:20:59

44 Reed Elsevier Annual Reports and Financial Statements 2010
Chief Financial Officer’s report continued
Cash flows
Adjusted operating cash flow was £1,519m (2009: £1,558m),down 3% at both reported exchange rates and constant currencies.
The small decrease in adjusted operating cash flow at constantcurrencies reflects the 2% decrease in adjusted operating profitsat constant currencies. The impact of higher capital expenditurewas largely offset by working capital improvements with the rateof conversion of adjusted operating profits into cash flow very highat 98% (2009: 99%).
Conversion of adjusted operating profit into cash2010 2009
Year to 31 December £m £m
Adjusted operating profit 1,555 1,570
Capital expenditure (311) (242)
Depreciation and amortisation ofinternally developed intangible assets 237 223
Working capital and other items 38 7
Adjusted operating cash flow 1,519 1,558
Cash flow conversion rate 98% 99%
Capital expenditure included within adjusted operating cash flowwas £311m (2009: £242m), including £228m (2009: £164m) inrespect of capitalised development costs included within internallygenerated intangible assets. The increase from the prior year reflectsincreased investment in new products and related infrastructure,particularly in the LexisNexis legal business.
Free cash flow, after interest and taxation, was £1,131m (2009:£1,051m) before exceptional restructuring and acquisition relatedspend. The increase principally reflects the lower than usual taxespaid because of tax repayments from prior years.
Exceptional restructuring spend was £99m (2009: £124m) principallyrelating to severance and vacant property costs. Payments made inrespect of acquisition related costs amounted to £51m (2009: £45m)principally in respect of the ChoicePoint integration. Net tax paidin the year was reduced by £42m (2009: £36m) in respect ofexceptional restructuring and acquisition related spend.
Free cash flow before dividends was £1,023m (2009: £918m).Ordinary dividends paid to shareholders in the year, being the 2009final and 2010 interim dividends, amounted to £483m (2009: £457m).Free cash flow after dividends was £540m (2009: £461m).
Free cash flow2010 2009
Year to 31 December £m £m
Adjusted operating cash flow 1,519 1,558
Interest paid (287) (293)
Tax paid (101) (214)
Free cash flow before exceptional spend 1,131 1,051
Restructuring expense/acquisition integration* (108) (133)
Free cash flow before dividends 1,023 918
Ordinary dividends (483) (457)
Free cash flow post dividends 540 461
*Including cash tax relief/repayments
Funding
DebtNet borrowings at 31 December 2010 were £3,455m, a decreaseof £476m since 31 December 2009 after currency translation effectswhich increased net borrowings by £77m on the largely US dollardenominated net debt. The significance of Reed Elsevier Group plc’sUS operations means that the majority of debt is denominated inUS dollars. Excluding currency translation effects, net debt reducedby £553m reflecting the strong free cash flow and limited acquisitionactivity. Expressed in US dollars, net borrowings at 31 December 2010were $5,387m, a decrease of $962m since 31 December 2009.
Gross borrowings after fair value adjustments at 31 December 2010amounted to £4,302m (2009: £4,706m). The fair value of relatedderivative assets was £105m (2009: £41m). Cash balances totalled£742m (2009: £734m).
As at 31 December 2010, after taking into account interest rateand currency derivatives, a total of 73% of Reed Elsevier’s grossborrowings were at fixed rates with a weighted average remaininglife of 5.3 years and interest rate of 6.0%.
Underlying revenue growth
-6%
+2%
2009 2010
Underlying adjustedoperating profit growth
-9%
-1%
2009 2010
Adjusted operating margin
25.9% 25.7%
2009 2010
47213_Text_p001-055.indd 44 1/3/11 11:21:00
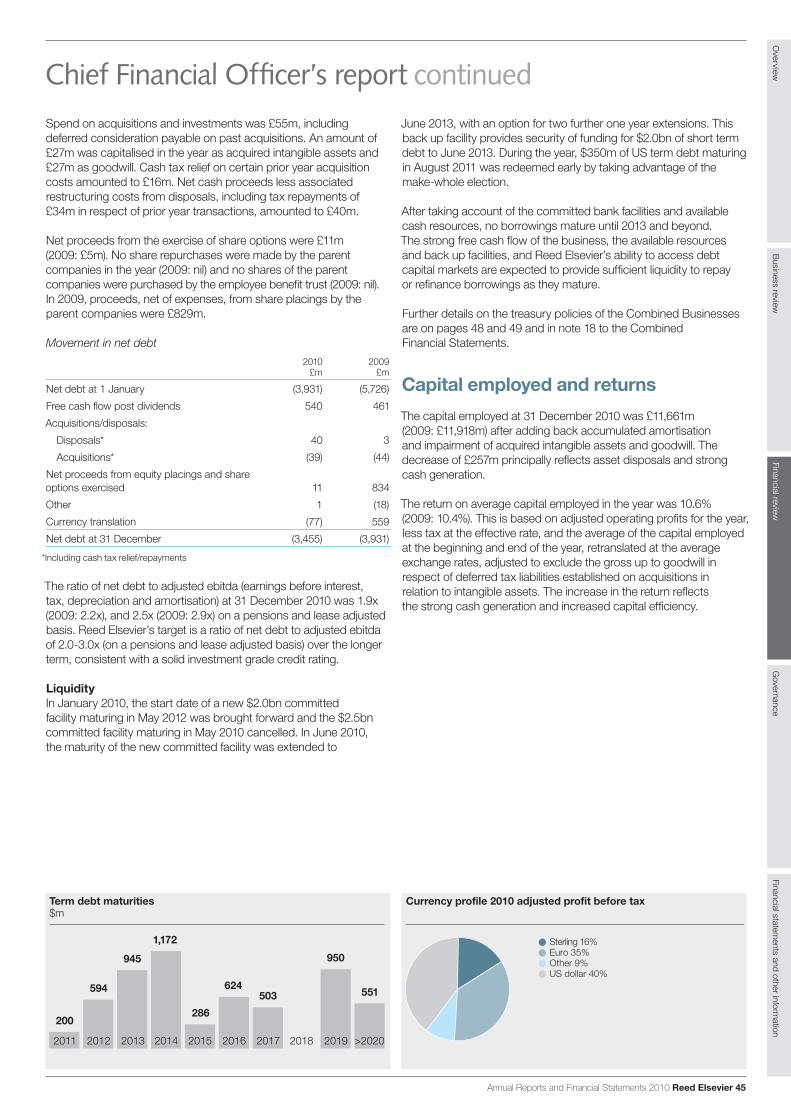
Annual Reports and Financial Statements 2010 Reed Elsevier 45
Overview
Business review
Financial reviewG
overnanceFinancial statem
ents and other information
June 2013, with an option for two further one year extensions. Thisback up facility provides security of funding for $2.0bn of short termdebt to June 2013. During the year, $350m of US term debt maturingin August 2011 was redeemed early by taking advantage of themake-whole election.
After taking account of the committed bank facilities and availablecash resources, no borrowings mature until 2013 and beyond.The strong free cash flow of the business, the available resourcesand back up facilities, and Reed Elsevier’s ability to access debtcapital markets are expected to provide sufficient liquidity to repayor refinance borrowings as they mature.
Further details on the treasury policies of the Combined Businessesare on pages 48 and 49 and in note 18 to the CombinedFinancial Statements.
Capital employed and returns
The capital employed at 31 December 2010 was £11,661m(2009: £11,918m) after adding back accumulated amortisationand impairment of acquired intangible assets and goodwill. Thedecrease of £257m principally reflects asset disposals and strongcash generation.
The return on average capital employed in the year was 10.6%(2009: 10.4%). This is based on adjusted operating profits for the year,less tax at the effective rate, and the average of the capital employedat the beginning and end of the year, retranslated at the averageexchange rates, adjusted to exclude the gross up to goodwill inrespect of deferred tax liabilities established on acquisitions inrelation to intangible assets. The increase in the return reflectsthe strong cash generation and increased capital efficiency.
Chief Financial Officer’s report continuedSpend on acquisitions and investments was £55m, includingdeferred consideration payable on past acquisitions. An amount of£27m was capitalised in the year as acquired intangible assets and£27m as goodwill. Cash tax relief on certain prior year acquisitioncosts amounted to £16m. Net cash proceeds less associatedrestructuring costs from disposals, including tax repayments of£34m in respect of prior year transactions, amounted to £40m.
Net proceeds from the exercise of share options were £11m(2009: £5m). No share repurchases were made by the parentcompanies in the year (2009: nil) and no shares of the parentcompanies were purchased by the employee benefit trust (2009: nil).In 2009, proceeds, net of expenses, from share placings by theparent companies were £829m.
Movement in net debt2010 2009
£m £m
Net debt at 1 January (3,931) (5,726)
Free cash flow post dividends 540 461
Acquisitions/disposals:
Disposals* 40 3
Acquisitions* (39) (44)
Net proceeds from equity placings and shareoptions exercised 11 834
Other 1 (18)
Currency translation (77) 559
Net debt at 31 December (3,455) (3,931)
*Including cash tax relief/repayments
The ratio of net debt to adjusted ebitda (earnings before interest,tax, depreciation and amortisation) at 31 December 2010 was 1.9x(2009: 2.2x), and 2.5x (2009: 2.9x) on a pensions and lease adjustedbasis. Reed Elsevier’s target is a ratio of net debt to adjusted ebitdaof 2.0-3.0x (on a pensions and lease adjusted basis) over the longerterm, consistent with a solid investment grade credit rating.
LiquidityIn January 2010, the start date of a new $2.0bn committedfacility maturing in May 2012 was brought forward and the $2.5bncommitted facility maturing in May 2010 cancelled. In June 2010,the maturity of the new committed facility was extended to
Term debt maturities$m
200
594
945
1,172
286
2011 2012 2013 2014 2015
624
2016
503
2017 2018
950
551
>20202019
Currency profile 2010 adjusted profit before tax
Sterling 16%Euro 35%Other 9%US dollar 40%
47213_Text_p001-055.indd 45 1/3/11 11:21:01
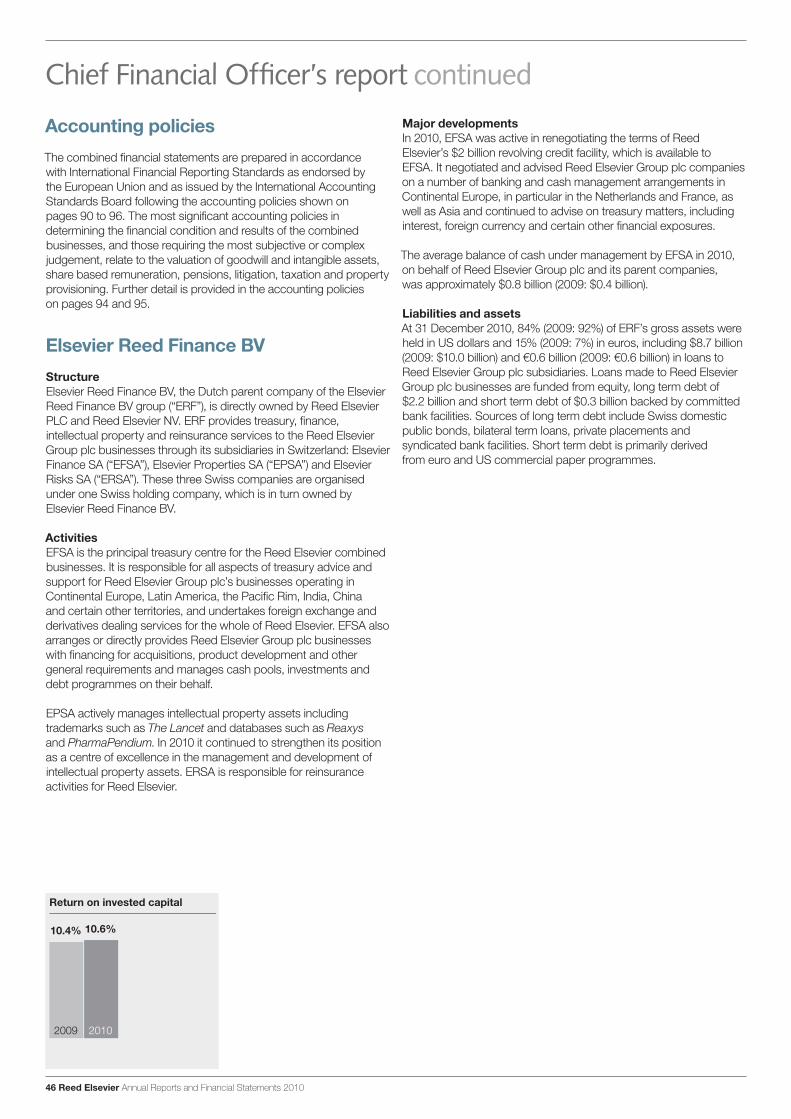
46 Reed Elsevier Annual Reports and Financial Statements 2010
Return on invested capital
10.4% 10.6%
2009 2010
Accounting policies
The combined financial statements are prepared in accordancewith International Financial Reporting Standards as endorsed bythe European Union and as issued by the International AccountingStandards Board following the accounting policies shown onpages 90 to 96. The most significant accounting policies indetermining the financial condition and results of the combinedbusinesses, and those requiring the most subjective or complexjudgement, relate to the valuation of goodwill and intangible assets,share based remuneration, pensions, litigation, taxation and propertyprovisioning. Further detail is provided in the accounting policieson pages 94 and 95.
Elsevier Reed Finance BV
StructureElsevier Reed Finance BV, the Dutch parent company of the ElsevierReed Finance BV group (“ERF”), is directly owned by Reed ElsevierPLC and Reed Elsevier NV. ERF provides treasury, finance,intellectual property and reinsurance services to the Reed ElsevierGroup plc businesses through its subsidiaries in Switzerland: ElsevierFinance SA (“EFSA”), Elsevier Properties SA (“EPSA”) and ElsevierRisks SA (“ERSA”). These three Swiss companies are organisedunder one Swiss holding company, which is in turn owned byElsevier Reed Finance BV.
ActivitiesEFSA is the principal treasury centre for the Reed Elsevier combinedbusinesses. It is responsible for all aspects of treasury advice andsupport for Reed Elsevier Group plc’s businesses operating inContinental Europe, Latin America, the Pacific Rim, India, Chinaand certain other territories, and undertakes foreign exchange andderivatives dealing services for the whole of Reed Elsevier. EFSA alsoarranges or directly provides Reed Elsevier Group plc businesseswith financing for acquisitions, product development and othergeneral requirements and manages cash pools, investments anddebt programmes on their behalf.
EPSA actively manages intellectual property assets includingtrademarks such as The Lancet and databases such as Reaxysand PharmaPendium. In 2010 it continued to strengthen its positionas a centre of excellence in the management and development ofintellectual property assets. ERSA is responsible for reinsuranceactivities for Reed Elsevier.
Chief Financial Officer’s report continuedMajor developmentsIn 2010, EFSA was active in renegotiating the terms of ReedElsevier’s $2 billion revolving credit facility, which is available toEFSA. It negotiated and advised Reed Elsevier Group plc companieson a number of banking and cash management arrangements inContinental Europe, in particular in the Netherlands and France, aswell as Asia and continued to advise on treasury matters, includinginterest, foreign currency and certain other financial exposures.
The average balance of cash under management by EFSA in 2010,on behalf of Reed Elsevier Group plc and its parent companies,was approximately $0.8 billion (2009: $0.4 billion).
Liabilities and assetsAt 31 December 2010, 84% (2009: 92%) of ERF’s gross assets wereheld in US dollars and 15% (2009: 7%) in euros, including $8.7 billion(2009: $10.0 billion) and !0.6 billion (2009: !0.6 billion) in loans toReed Elsevier Group plc subsidiaries. Loans made to Reed ElsevierGroup plc businesses are funded from equity, long term debt of$2.2 billion and short term debt of $0.3 billion backed by committedbank facilities. Sources of long term debt include Swiss domesticpublic bonds, bilateral term loans, private placements andsyndicated bank facilities. Short term debt is primarily derivedfrom euro and US commercial paper programmes.
47213_Text_p001-055.indd 46 1/3/11 11:21:01

Annual Reports and Financial Statements 2010 Reed Elsevier 47
Overview
Business review
Financial reviewG
overnanceFinancial statem
ents and other information
Chief Financial Officer’s report continued
The equalised final dividends proposed by the respective boardsare 15.0p per share for Reed Elsevier PLC and !0.303 per share forReed Elsevier NV, unchanged and 3% higher respectively comparedwith the prior year final dividends. This gives total dividends for theyear of 20.4p (2009: 20.4p) and !0.412 (2009: !0.400), unchangedand up 3% respectively. The difference in growth rates in theequalised dividends reflects changes in the euro: sterling exchangerate since the prior year dividend announcement dates.
Dividend cover, based on adjusted earnings per share and the totalinterim and proposed final dividends for the year, is 2.1 times forReed Elsevier PLC and 1.9 times for Reed Elsevier NV. The dividendpolicy of the parent companies is, subject to currency considerations,to grow dividends broadly in line with adjusted earnings per sharewhilst maintaining dividend cover (being the number of times theannual dividend is covered by the adjusted earnings per share) ofat least two times over the longer term.
Parent companiesChange at
2010 2009 constantReed Elsevier PLC £m £m Change currencies
Reported net profit 327 195 +68%Adjusted net profit 520 519 0% -1%
Reported earnings per share 27.3p 17.2p +58%Adjusted earnings per share 43.4p 45.9p -5% -6%Ordinary dividend per share 20.4p 20.4p 0%
Reed Elsevier NV !m !m
Reported net profit 376 219 +72%Adjusted net profit 575 550 +5% -1%
Reported earnings per share !0.51 !0.32 +62%Adjusted earnings per share !0.78 !0.79 -1% -6%Ordinary dividend per share !0.412 !0.400 +3%
For the parent companies, Reed Elsevier PLC and Reed Elsevier NV,adjusted earnings per share were respectively down 5% at 43.4p(2009: 45.9p) and 1% at !0.78 (2009: !0.79). At constant rates ofexchange, the adjusted earnings per share of both companiesdecreased by 6%.
The July 2009 equity placings had a dilutive effect on adjustedearnings per share of approximately 4% in 2010, taking into accountthe interest expense saved on the borrowings repaid from theproceeds of the equity placings and the increase in the averagenumber of parent company shares in issue. (In July 2009, ReedElsevier PLC placed 109.2m ordinary shares at 405p per share forproceeds, net of issue costs, of £435m (!487m) and Reed Elsevier NVplaced 63.0m ordinary shares at !7.08 per share for net proceeds of!441m (£394m). The numbers of ordinary shares issued represented9.9% of the issued ordinary share capital of the respective parentcompanies prior to the placings.)
The reported earnings per share for Reed Elsevier PLC shareholderswas 27.3p (2009: 17.2p) and for Reed Elsevier NV shareholderswas !0.51 (2009: !0.32). The increase principally reflects lowerexceptional restructuring charges and no intangible asset andgoodwill impairment in 2010.
Reed Elsevier PLCAdjusted EPSpence
45.9 43.4
2009 2010
Reed Elsevier NVOrdinary dividenda
0.400 0.412
2009 2010
Reed Elsevier PLCOrdinary dividendpence
20.4 20.4
2009 2010
Reed Elsevier NVAdjusted EPSa
0.79 0.78
2009 2010
47213_Text_p001-055.indd 47 1/3/11 11:21:03

48 Reed Elsevier Annual Reports and Financial Statements 2010
Treasury policies
The boards of Reed Elsevier PLC and Reed Elsevier NV have requested that Reed Elsevier Group plc and Elsevier Reed Finance BV have due regard to the best interests of Reed Elsevier PLC and Reed Elsevier NV shareholders in the formulation of treasury policies. Financial instruments are used to finance the Reed Elsevier businesses and to hedge transactions. Reed Elsevier’s businesses do not enter into speculative transactions. The main treasury risks faced by Reed Elsevier are liquidity risk, interest rate risk, foreign currency risk and credit risk. The boards of the parent companies agree overall policy guidelines for managing each of these risks and the boards of Reed Elsevier Group plc and Elsevier Finance SA agree policies (in line with parent company guidelines) for their respective business and treasury centres. A summary of these policies is given below.
Capital and liquidity managementThe capital structure is managed to support Reed Elsevier’s objective of maximising long-term shareholder value through appropriate security of funding, ready access to debt and capital markets, cost effective borrowing and flexibility to fund business and acquisition opportunities whilst maintaining appropriate leverage to optimise the cost of capital.
Over the long term Reed Elsevier targets cash flow conversion (the proportion of adjusted operating profits converted into cash) and credit metrics to reflect this aim and that are consistent with a solid investment grade credit rating. Levels of net debt should not exceed those consistent with such a rating other than for relatively short periods of time, for instance following an acquisition. The principal metrics utilised are free cash flow (after interest, tax and dividends) to net debt, net debt to ebitda (earnings before interest, taxation, depreciation and amortisation) and ebitda to net interest and these metrics are monitored and reported to senior management and the board representatives on a quarterly basis. Cash flow conversion of 90% or higher and a net debt to adjusted ebitda target, over the long term, in the range of 2x to 3x on a pensions and lease adjusted basis are consistent with the rating target. The cash flow conversion in 2010 was 98% and as at 31 December 2010 net debt to adjusted ebitda was 2.5x (2009: 2.9x) on a pensions and lease adjusted basis.
Reed Elsevier’s use of cash over the longer term reflects these objectives through a progressive dividend policy, selective acquisitions and, from time to time when conditions suggest, share repurchases whilst retaining the balance sheet strength to maintain access to the most cost effective sources of borrowing and to support Reed Elsevier’s strategic ambition in evolving publishing and information markets. Reed Elsevier’s balance sheet was strengthened in 2010 by the repayment of debt out of free cash flow and this focus on debt reduction will continue over the next 12 months.
The balance of long term debt, short term debt and committed bank facilities is managed to provide security of funding, taking into account the cash generation of the business and the uncertain size and timing of acquisition spend. Reed Elsevier maintains a range of borrowing faciltites and debt programmes from a variety of sources to fund its requirements at short notice and at competitive rates. The significance of Reed Elsevier Group plc’s US operations means that the majority of debt is denominated in US dollars. Policy requires that no more than $1.5 billion of term debt issues should mature in any 12-month period. In addition, minimum levels of borrowings with maturities over three and five years are specified, depending on the level of net debt. From time to time, Reed Elsevier may redeem term debt early or repurchase outstanding debt in the open market depending on market conditions.
There were no changes to Reed Elsevier’s long term approach to capital and liquidity management during the year.
Interest rate exposure managementReed Elsevier’s interest rate exposure management policy is aimed at reducing the exposure of the combined businesses to changes in interest rates. The proportion of interest expense that is fixed on net debt is determined by reference to the level of net interest cover. Reed Elsevier uses fixed rate term debt, interest rate swaps, forward rate agreements and interest rate options to manage the exposure. Interest rate derivatives are used only to hedge an underlying risk and no net market positions are held.
After taking into account interest rate and currency derivatives, at 31 December 2010 interest expense was fixed on an average of £3.0 billion of forecast debt for the next 12 months. This fixed rate debt reduces to £2.0 billion by the end of 2013 and reduces further thereafter with all but £0.4 billion of fixed rate term debt (not swapped to floating rate) having matured by the end of 2019.
At 31 December 2010, fixed rate term debt (not swapped to floating rate) amounted to £2.5 billion (2009: £2.7 billion) and had a weighted average life remaining of 6.4 years (2009: 6.9 years) and a weighted average interest rate of 6.4% (2009: 6.4%). Interest rate derivatives in place at 31 December 2010, which fix the interest cost on an additional £0.6 billion (2009: £0.8 billion) of variable rate debt, have a weighted average maturity of 1.1 years (2009: 1.7 years) and a weighted average interest rate of 4.2% (2009: 4.2%).
Chief Financial Officer’s report continued
47213_Text_p001-055.indd 48 1/3/11 11:21:03
Annual Reports and Financial Statements 2010 Reed Elsevier 49
Overview
Business review
Financial reviewG
overnanceFinancial statem
ents and other information
Foreign currency exposure managementTranslation exposures arise on the earnings and net assets of business operations in countries other than those of each parent company. These exposures are hedged, to a significant extent, by a policy of denominating borrowings in currencies where significant translation exposures exist, most notably US dollars.Currency exposures on transactions denominated in a foreign currency are required to be hedged using forward contracts. In addition, recurring transactions and future investment exposures may be hedged, in advance of becoming contractual. The precise policy differs according to the specific circumstances of the individual businesses. Highly predictable future cash flows may be covered for transactions expected to occur during the next 12 months (50 months for Elsevier science and medical subscription businesses) within limits defined according to the period before the transaction is expected to become contractual. Cover takes the form of foreign exchange forward contracts.
As at 31 December 2010, the amount of outstanding foreign exchange cover against future transactions was £1.1 billion (2009: £1.0 billion).
Credit riskReed Elsevier has a credit exposure for the full principal amount of cash and cash equivalents held with individual counterparties. In addition, it has a credit risk from the potential non performance by counterparties to financial instruments; this credit risk normally being restricted to the amounts of any hedge gain and not the full principal amount being hedged. Credit risks are controlled by monitoring the credit quality of counterparties, principally licensed commercial banks and investment banks with strong long term credit ratings, and the amounts outstanding with each of them.
Reed Elsevier has treasury policies in place which do not allow concentrations of risk with individual counterparties and do not allow significant treasury exposures with counterparties which are rated lower than A/A2 by Standard and Poor’s, Moody’s or Fitch. At 31 December 2010, cash and cash equivalents totalled £742 million, of which 97% was held with banks rated A+/A1 or better.
Mark ArmourChief Financial Officer
Chief Financial Officer’s report continued
Key performance measuresReed Elsevier uses a range of performance indicators to help measure its development against strategy and financial objectives. These indicators are integrated into the annual reports and are shown within the following sections:
Chief Executive Officer’s report (pages 6 to 7)
Business Review (pages 8 to 37)
Corporate responsibility (pages 38 to 41)
Chief Financial Officer’s report (pages 42 to 49)
47213_Text_p001-055.indd 49 1/3/11 11:21:03
50 Reed Elsevier Annual Reports and Financial Statements 2010
Principal risksReed Elsevier has established risk management practices that are embedded into the operations of the businesses, based on the framework in internal control issued by the Committee of Sponsoring Organisations of the Treadway Commission (COSO). The principal risks facing Reed Elsevier, which have been considered by the Audit Committees and Boards, are described below. It is not possible to identify every risk that could affect our businesses, and the actions taken to mitigate the risks described below cannot provide absolute assurance that a risk will not materialise and/or adversely affect our business or financial performance. Our risk management and internal control processes are described in the Structure and Corporate Governance section. A description of the business and a discussion of factors affecting performance is set out in the Business and Financial Review and our financial risks are discussed in the Chief Financial Officer’s report and in note 18 to the combined financial statements of Reed Elsevier. Important specific risks that have been identified include:
Risk Mitigation
Economy and market conditionsDemand for our products and services may be impacted by factors beyond our control such as the economic environment in the US and other major economies, and government funding.
Our businesses are focused on professional markets which have generally been more resilient in periods of economic downturn. We deliver information solutions, many on a subscription basis, which are important to our customers’ effectiveness and efficiency.
Customer acceptance of products Reed Elsevier’s businesses are dependent on the continued acceptance by our customers of our products and services and the value placed on them.
We are focused on the needs and economics of our customers and seek to provide content and innovative solutions that help them achieve better outcomes and enhance productivity.
CompetitionOur businesses operate in highly competitive markets. These markets continue to change in response to technological innovations, changing legislation, regulatory changes, the entrance of new competitors and other factors.
To remain competitive we continuously invest significant resources in our products and services, and the infrastructure to support them. We gain insights into our markets, evolving customers’ needs and opportunities, the potential application of new technologies and business models, and the actions of competitors, and these insights inform our market strategies and operational priorities.
Technology failureReed Elsevier’s businesses are increasingly dependent on electronic platforms and networks, primarily the internet, for delivery of products and services. Our businesses could be adversely affected if their electronic delivery platforms and networks experience a significant failure, interruption, or security breach.
We have established procedures for the protection of our technology assets. These include the development of business continuity plans, including IT disaster recovery plans and back-up delivery systems, to reduce business disruption in the event of a major technology failure.
Data securityOur businesses maintain databases and information online, including personal information, and could be adversely affected if these experience a breach in security or if we fail to comply with applicable legislation or regulatory or contractual requirements governing such databases and information.
We have established data privacy and security programmes. We test and re-evaluate our procedures and controls with the aim of ensuring that personal data is protected and that we comply with relevant legislation, regulatory and contractual requirements.
Intellectual property rightsOur products and services are largely comprised of intellectual property content delivered through a variety of media. We rely on trademark, copyright, patent and other intellectual property laws to establish and protect our proprietary rights in these products and services. There is a risk that our proprietary rights could be challenged, limited, invalidated or circumvented.
We actively engage in developing and promoting the legal protection of intellectual property rights. In our businesses, subscription contracts with customers contain provisions as to the use of proprietary content. We are also vigilant as to the use of our content and, as appropriate, take legal action to challenge illegal distribution sources.
47213_Text_p001-055.indd 50 1/3/11 11:21:03
Annual Reports and Financial Statements 2010 Reed Elsevier 51
Risk Mitigation
Data sourcesA number of our businesses rely extensively upon content and data from external sources. Data is obtained from public records, governmental authorities, customers and other information companies, including competitors. The disruption or loss of data sources in the future, because of changes in the law or because data suppliers decide not to supply them, could adversely affect our business if we were unable to arrange for substitute sources in a timely manner or at all.
We seek as far as possible to have proprietary content. Where content is supplied to us by third parties, we seek to have contracts which provide mutual commercial benefit. We also maintain an active dialogue with regulatory authorities on privacy and other data related issues, and we promote, with others, the responsible use of data.
Paid subscriptionsOur scientific, technical and medical (STM) primary publications, like those of most of our competitors, are published on a paid subscription basis. There has been continuous debate in the government, academic and library communities, which are the principal customers for our STM publications, regarding whether such publications should be funded instead through fees charged to authors and from governmental and other subsidies or made freely available after a period following publication. If these methods of STM publishing are widely adopted or mandated, it could adversely affect our revenue from paid subscription publications.
We engage extensively with stakeholders in the STM community to better understand their needs and deliver value to them. While we adopt a number of publishing models and continue to experiment, through the principal paid subscription model we encourage the submission of research output by scientists without the penalty of publishing cost. We focus on the integrity and quality of research through the editorial and peer review process; we invest in efficient editorial and distribution platforms and in innovation in platforms and tools to make content and data more accessible and actionable; and we ensure vigilance on plagiarism and the long term preservation of research findings.
Supply chain dependenciesOur organisational and operational structures have increased dependency on outsourced and offshored functions. The failure of third parties to whom we have outsourced activities could adversely affect our business performance, reputation and financial condition.
We select our vendors with care and establish service level agreements that we closely monitor, including through key performance indicators. We also have developed business continuity plans to reduce disruption in the event of a major failure by a vendor.
Pensions We operate a number of pension schemes around the world, the largest schemes being of the defined benefit type in the UK, the US and the Netherlands. The assets and obligations associated with defined benefit pension schemes are particularly sensitive to changes in the market values of assets and the market related assumptions used to value scheme liabilities.
Further information on risks associated with defined benefit pensions schemes is set out in note 5 to the Reed Elsevier combined financial statements.
We have well established professional management of our pension schemes and we focus on maintaining appropriate asset allocation and plan designs. We review our funding requirements on a regular basis with the assistance of independent actuaries and ensure that the funding plans are sufficient to meet future liabilities.
Overview
Business review
Financial reviewG
overnanceFinancial statem
ents and other information
Principal risks continued
47213_Text_p001-055.indd 51 1/3/11 11:21:03
52 Reed Elsevier Annual Reports and Financial Statements 2010
Principal risks continued
Risk Mitigation
TaxOur businesses operate worldwide and our earnings are subject to taxation in many differing jurisdictions and at differing rates. We seek to organise our affairs in a tax efficient manner, taking account of the jurisdictions in which we operate. However, tax laws that apply to Reed Elsevier businesses may be amended by the relevant authorities or interpreted differently which could adversely affect our reported results.
We have clear and consistent tax policies and tax matters are dealt with by a professional tax function, supported by external tax advisors. We maintain an open dialogue with the relevant tax authorities and are vigilant in ensuring that we comply with tax legislation.
AcquisitionsWe often acquire businesses to reshape and strengthen our portfolio. If we are unable to generate the anticipated benefits such as revenue growth, synergies and/or cost savings associated with these acquisitions this could adversely affect our reputation and financial condition.
Our acquisitions are made within the framework of our overall strategy. We have a well formulated process for reviewing and executing acquisitions and for managing the post acquisition integration. This process is underpinned with clear strategic and financial acquisition criteria. We closely monitor the performance of acquisitions.
Treasury The Reed Elsevier combined financial statements are expressed in pounds sterling and are subject to movements in exchange rates on the translation of the financial information of businesses whose operational currencies are other than sterling. The US is our most important market and, accordingly, significant fluctuations in the US dollar exchange rate could significantly affect our reported results.
Macroeconomic, political and market conditions may also adversely affect the availability of short and long term funding, volatility of interest rates, currency exchange rates and inflation.
The main treasury risks faced by Reed Elsevier are liquidity risk, interest rate risk, foreign currency risk and credit risk.
Reed Elsevier’s approach to funding and management of interest rate and foreign currency exposures is described on pages 48 and 49. The approach to the management of financial risks is described in note 18 to the combined financial statements.
Ethics Our businesses operate around the world and we have over 30,000 employees. A breach of generally accepted ethical business standards could adversely affect our business performance, reputation and financial condition.
Our Reed Elsevier Code of Ethics and Business Conduct is provided to every employee and is supported by training on specific topics. It encompasses such topics as fair competition, anti-bribery and human rights and it encourages open and principled behaviour. We also have well established processes for reporting and investigating unethical conduct.
Our approach to managing ethical risks is set out in our Corporate Responsibility Report available at www.reedelsevier.com/cr10
EnvironmentalReed Elsevier and its businesses have an impact on the environment, principally through the use of energy and water, waste generation and, in our supply chain, through our paper use and print and production technologies.
We are committed to reducing these impacts by limiting resource use whenever possible and by efficiently employing sustainable materials and technologies. We require our suppliers and contractors to meet the same objectives. We seek to ensure that Reed Elsevier’s businesses are compliant with all relevant environmental regulation.
Our approach to managing environmental risks is set out in our Corporate Responsibility Report available at www.reedelsevier.com/cr10
47213_Text_p001-055.indd 52 1/3/11 11:21:03

Annual Reports and Financial Statements 2010 Reed Elsevier 53
Governance
54 Board Directors56 Structure and corporate governance62 Directors’ remuneration report81 Report of the Audit Committees
Overview
Business review
Financial reviewG
overnanceFinancial statem
ents and other information
47213_Text_p001-055.indd 53 1/3/11 11:21:03

54 Reed Elsevier Annual Reports and Financial Statements 2010
Board Directors
1 2 3
4 5 6
7 8 9
10
47213_Text_p001-055.indd 54 1/3/11 11:21:29

Annual Reports and Financial Statements 2010 Reed Elsevier 55
1 Erik Engstrom (47) (Swedish) Chief Executive Officer since 2009. Joined Reed Elsevier as Chief Executive Officer of Elsevier in 2004. Prior to joining Reed Elsevier was a partner at General Atlantic Partners. Before that was president and chief operating officer of Random House Inc and, before its merger with Random House, president and chief executive officer of Bantam Doubleday Dell, North America. Began his career as a consultant with McKinsey. Served as a non-executive director of Eniro AB and Svenska Cellulosa Aktiebolaget SCA. Holds a BSc from Stockholm School of Economics, an MSc from the Royal Institute of Technology in Stockholm, and gained an MBA from Harvard Business School as a Fulbright Scholar.
2 Mark Armour (56)(British) Chief Financial Officer since 1996. Non-executive director of SABMiller plc. Prior to joining Reed Elsevier as Deputy Chief Financial Officer in 1995, was a partner in Price Waterhouse. Holds an MA in Engineering from Cambridge University and qualified as a Chartered Accountant.
Non-Executive Directors3 Anthony Habgood (64)(British) Appointed Chairman 2009. Chairman of Whitbread plc. Was chairman of Bunzl plc and of Mölnlycke Healthcare Limited and served as chief executive of Bunzl plc, chief executive of Tootal Group plc and a director of The Boston Consulting Group lnc. He has also been a non-executive director of Geest plc; Marks and Spencer plc; National Westminster Bank plc; Powergen plc; and SVG Capital plc. Holds an MA in Economics from Cambridge University and an MS in Industrial Administration from Carnegie Mellon University. He is a visiting Fellow at Oxford University.
4 Mark Elliott (61)(American) Appointed 2003. Chairman of the Remuneration Committee. Chairman of QinetiQ Group plc and a non-executive director of G4S plc. Until his retirement in 2008, was general manager IBM Global Solutions, having held a number of positions with IBM, including managing director of IBM Europe, Middle East and Africa.
5 Lisa Hook (52)(American) Appointed 2006. President and chief executive officer of Neustar Inc. A director of The Ocean Foundation. Was president and chief executive officer at Sun Rocket Inc. Before that was president of AOL Broadband, Premium and Developer Services. Prior to joining AOL, was a founding partner at Brera Capital Partners LLC. Previously was chief operating officer of Time Warner Telecommunications. Has served as senior advisor to the Federal Communications Commission Chairman and a senior counsel to Viacom Cable.
6 Marike van Lier Lels (51)(Dutch) Appointed January 2010. Member of the supervisory boards of KPN NV, USG People NV, TKH Group NV and Maersk BV. A member of the audit committee of the Algemene Rekenkamer and of various Dutch governmental advisory boards. Was executive vice president and chief operating officer of the Schiphol Group. Prior to joining Schiphol Group, was a member of the executive board of Deutsche Post Euro Express and held various senior positions with Nedlloyd.
7 Robert Polet (55)(Dutch) Appointed 2007. President and chief executive officer of Gucci Group. Non-executive director of Wilderness Holdings Limited. Spent 26 years at Unilever working in a variety of marketing and senior executive positions throughout the world including president of Unilever’s Worldwide Ice Cream and Frozen Foods division.
8 David Reid (64)(British) Appointed 2003. Senior independent director. Non-executive chairman of Tesco PLC, having previously been executive deputy chairman until December 2003, and finance director from 1985 to 1997. Chairman of Kwik-Fit and previously a non-executive director of De Vere PLC, Legal & General Group plc and Westbury PLC.
9 Lord Sharman of Redlynch OBE (67)(British) Appointed 2002. Served as Chairman of the Audit Committee until August 2010. Non-executive chairman of Aviva PLC and a non-executive director of BG Group plc. Member of the House of Lords since 1999. Was chairman of KPMG Worldwide until 1999, having joined KPMG in 1966. Previous non-executive directorships include: chairman of Aegis Group plc; deputy chairman of G4S plc; Young & Co’s Brewery plc; AEA Technology plc; and member of the supervisory board of ABN AMRO Holding NV.
10 Ben van der Veer (59)(Dutch) Appointed 2009. Chairman of the Audit Committee from August 2010. Member of the supervisory boards of AEGON NV, TomTom NV, Siemens Nederland NV and Koninklijke FrieslandCampina NV. Was chairman of the executive board of KPMG in the Netherlands and a member of the management committee of the KPMG International board until his retirement in 2008, having joined KPMG in 1976.
Board Committee MembershipAudit Committees: Reed Elsevier Group plc, Reed Elsevier PLC and Reed Elsevier NVRemuneration Committee: Reed Elsevier Group plcNominations Committee: joint Reed Elsevier PLC and Reed Elsevier NVCorporate Governance Committee: joint Reed Elsevier PLC and Reed Elsevier NV
Both of the executive directors are directors of Reed Elsevier Group plc and Reed Elsevier PLC and members of the Executive Board of Reed Elsevier NV.
Mrs van Lier Lels is a member of the Supervisory Board of Reed Elsevier NV. All of the other non-executive directors are directors of Reed Elsevier Group plc and Reed Elsevier PLC and members of the Supervisory Board of Reed Elsevier NV.
Executive Directors
Overview
Business review
Financial reviewG
overnanceFinancial statem
ents and other information
47213_Text_p001-055.indd 55 1/3/11 11:21:29

56 Reed Elsevier Annual Reports and Financial Statements 2010
Structure and corporate governance
Corporate structure
Reed Elsevier was created in January 1993, when Reed Elsevier PLCand Reed Elsevier NV contributed their business to two jointly ownedcompanies, Reed Elsevier Group plc, a UK registered companywhich owns the publishing and information businesses, and ElsevierReed Finance BV, a Dutch registered company which owns thefinancing activities. Reed Elsevier PLC and Reed Elsevier NV haveretained their separate legal and national identities and are publiclyheld companies. Reed Elsevier PLC’s securities are listed in Londonand New York, and Reed Elsevier NV’s securities are listed inAmsterdam and New York. Following the merger of their respectivebusinesses, Reed Elsevier PLC and Reed Elsevier NV entered intoa Governing Agreement to regulate their relationship, including theeconomic interests of the parties and the composition of their boardsand those of Reed Elsevier Group plc and of Elsevier Reed FinanceBV, as further referred to below.
Equalisation arrangementsReed Elsevier PLC and Reed Elsevier NV each hold a 50% interestin Reed Elsevier Group plc. Reed Elsevier PLC holds a 39% interestin Elsevier Reed Finance BV, with Reed Elsevier NV holding a 61%interest. Reed Elsevier PLC additionally holds a 5.8% indirect equityinterest in Reed Elsevier NV, reflecting the arrangements enteredinto between the two companies at the time of the merger, whichdetermined the equalisation ratio whereby one Reed Elsevier NVordinary share is, in broad terms, intended to confer equivalenteconomic interests to 1.538 Reed Elsevier PLC ordinary shares.The equalisation ratio is subject to change to reflect share splitsand similar events that affect the number of outstanding ordinaryshares of either Reed Elsevier PLC or Reed Elsevier NV.
Under the equalisation arrangements, Reed Elsevier PLCshareholders have a 52.9% economic interest in the Reed Elseviercombined businesses, and Reed Elsevier NV shareholders(other than Reed Elsevier PLC) have a 47.1% economic interestin the Reed Elsevier combined businesses. Holders of ordinaryshares in Reed Elsevier PLC and Reed Elsevier NV enjoysubstantially equivalent dividend and capital rights with respectto their ordinary shares.
The boards of both Reed Elsevier PLC and Reed Elsevier NVhave agreed, other than in special circumstances, to recommendequivalent gross dividends (including, with respect to the dividendon Reed Elsevier PLC ordinary shares, the associated UK tax credit)based on the equalisation ratio. A Reed Elsevier PLC ordinary sharepays dividends in sterling and is subject to UK tax law with respectto dividend and capital rights. A Reed Elsevier NV ordinary sharepays dividends in euros and is subject to Dutch tax law with respectto dividend and capital rights. The exchange rate used for each dividendcalculation is the spot euro/sterling exchange rate, averaged over aperiod of five consecutive business days commencing on the tenthbusiness day before the announcement of the proposed dividend.
Compliance
Compliance with codes of best practiceThe boards of Reed Elsevier PLC and Reed Elsevier NV haveimplemented standards of corporate governance and disclosurepolicies applicable to companies listed on the stock exchangesof the United Kingdom, the Netherlands and the United States.The effect of this is that a standard applying to one will, where notin conflict, also be observed by the other.
The boards of Reed Elsevier PLC and Reed Elsevier NV (whichcomprises an Executive Board and a Supervisory Board, togetherthe Combined Board) support the principles and provisionsof corporate governance contained in the Combined Code onCorporate Governance issued by the Financial Reporting Councilin June 2008 (the UK Code) and those contained in the DutchCorporate Governance Code issued in December 2008 (the DutchCode). The principles and provisions set out in the UK Code andthe Dutch Code have applied throughout the financial year ended31 December 2010. Reed Elsevier PLC, which has its primary listingon the London Stock Exchange, has complied throughout the yearwith the UK Code. Reed Elsevier NV, which has its primary listing onthe Euronext Amsterdam Stock Exchange, has complied throughoutthe year with the UK Code, and subject to limited exceptions asexplained in the Reed Elsevier NV Report of the Supervisory Boardand the Executive Board on pages 166 to 169, has applied thebest practice provisions of the Dutch Code. The ways in whichReed Elsevier PLC and Reed Elsevier NV have applied the mainprinciples of the UK Code are described below. For furtherinformation on the application of the Dutch Code by Reed ElsevierNV, see the Corporate Governance Statement of Reed Elsevier NVpublished on the Reed Elsevier website, www.reedelsevier.com.
New UK Corporate Governance CodeIn May 2010 the Financial Reporting Council issued The UKCorporate Governance Code (the New UK Code), which replacesthe UK Code for financial years beginning on or after 29 June 2010.The New UK Code will, therefore, apply to Reed Elsevier in respectof the financial year beginning 1 January 2011. It is the intention ofthe boards to comply with the New UK Code and in accordance withits recommendation, all directors will seek annual re-election at therespective Annual General Meetings of Reed Elsevier PLC and ReedElsevier NV commencing from the meetings to be held in April 2011.
Relations with shareholdersReed Elsevier PLC and Reed Elsevier NV participate in regulardialogue with institutional shareholders. Presentations are made bythe Chairman, Chief Executive Officer and Chief Financial Officerfollowing the announcement of the interim and full year results and
Elsevier LexisNexisRiskSolutions
LexisNexisLegal &Professional
ReedExhibitions
ReedBusinessInformation
Elsevier Reed Finance BVFinance Activities
Reed Elsevier Group plcPublishing and Information Businesses
Reed ElsevierPLC
Reed ElsevierNV
47213_Text_p056-084.indd 56 1/3/11 10:43:21

Annual Reports and Financial Statements 2010 Reed Elsevier 57
Overview
Business review
Financial reviewG
overnanceFinancial statem
ents and other information
these are simultaneously webcast. Two investor seminars on specific areas of the business are currently planned for 2011 and these will also be webcast. The Chief Executive Officer, the Chief Financial Officer and the investor relations team meet institutional shareholders on a regular basis and the Chairman also makes himself available to major institutions as appropriate. A trading update is provided ahead of the Annual General Meetings of the two companies and towards the end of the financial year through Interim Management Statements. The interim and annual results announcements and presentations, together with the Interim Management Statements, investor seminar presentations and other important announcements and corporate governance documents concerning Reed Elsevier, are published on the Reed Elsevier website, www.reedelsevier.com. In accordance with the provisions of the Dutch Code, Reed Elsevier NV has adopted a bilateral shareholder contact policy, which is also published on the Reed Elsevier website. The boards of Reed Elsevier PLC and Reed Elsevier NV commission periodic reports on the attitudes and views of the companies’ institutional shareholders and the results are the subject of formal presentations to the respective boards.
Both Reed Elsevier PLC and Reed Elsevier NV offer e-voting facilities in relation to proxy voting at shareholder meetings. The Annual General Meetings provide an opportunity for the boards to communicate with individual shareholders. The Chairman, the Chief Executive Officer, the Chief Financial Officer, the chairmen of the board committees, other directors and a representative of the external auditors are available to answer questions from shareholders.
Board induction and informationOn appointment and as required, directors receive training appropriate to their level of previous experience. This includes the provision of a tailored induction programme so as to provide newly appointed directors with information about the Reed Elsevier businesses and other relevant information to assist them in performing their duties. Non-executive directors are encouraged to visit the Reed Elsevier businesses to meet management and senior staff.
All directors have full and timely access to the information required to discharge their responsibilities fully and efficiently. They have access to the services of the respective company secretaries, other members of Reed Elsevier’s management and staff, and external advisors. Directors may take independent professional advice in the furtherance of their duties, at the relevant company’s expense.
In addition to scheduled board and board committee meetings held during the year, directors attend many other meetings and site visits. Where a director is unable to attend a board or board committee meeting he or she is provided with all relevant papers and information relating to that meeting and is able to discuss issues arising with the respective Chairman and other board members.
Board evaluationDuring the year the Corporate Governance Committee assessed the performance of individual directors and, led by the senior independent director, also assessed the performance of the Chairman. Using questionnaires completed by all directors, the Committee reviewed the functioning and constitution of the boards and their committees. Based on these assessments and on the board effectiveness review, the Committee believes that the performance of each director continues to be effective and that they demonstrate commitment to their respective roles in Reed Elsevier. The Committee currently envisages initiating an independent evaluation of the boards and their committees in 2011.
The boards
The board of Reed Elsevier PLC, the Combined Board of Reed Elsevier NV and the board of Reed Elsevier Group plc are harmonised. All of the directors of Reed Elsevier Group plc are also directors of Reed Elsevier PLC and are a member of either the Executive Board or the Supervisory Board of Reed Elsevier NV. Reed Elsevier NV may nominate for appointment to the Supervisory Board two directors who are not appointed to the boards of either Reed Elsevier PLC or Reed Elsevier Group plc. Marike van Lier Lels was appointed to the Reed Elsevier NV Supervisory Board in January 2010, in succession to Dien de Boer-Kruyt who retired at the conclusion of the Reed Elsevier NV Annual General Meeting in April 2010. The names, nationality and biographical details of each director at the date of this report appear on pages 54 and 55.
The boards of Reed Elsevier PLC, Reed Elsevier NV, Reed Elsevier Group plc and Elsevier Reed Finance BV each comprise a balance of executive and non-executive directors who bring a wide range of skills and experience to the deliberations of the boards. The boards review the independence of the non-executive directors every year, based on the criteria for independence set out in the UK Code. The UK Code does not consider the Chairman to be independent due to the unique role the Chairman has in corporate governance. Notwithstanding this, Anthony Habgood met the independence criteria contained in the UK Code when he was appointed Chairman in 2009. The boards consider all non-executive directors (other than the Chairman) to be independent of management and free from any business or other relationship which could materially interfere with their ability to exercise independent judgement. Lord Sharman, who was appointed as a non-executive director of Reed Elsevier PLC in January 2002, and a member of the Reed Elsevier NV Supervisory Board in April 2002, will retire from the respective boards at the conclusion of the Reed Elsevier NV and Reed Elsevier PLC Annual General Meetings in April 2011. The boards have determined that Lord Sharman remains independent in character and judgement despite having served on the board of Reed Elsevier PLC for more than nine years; there are also no relationships or circumstances which are likely to affect his independent judgement.
The boards of Reed Elsevier PLC and of Reed Elsevier NV have appointed David Reid to act as senior independent director, who is available to meet with institutional shareholders and assist in resolving concerns in cases where alternative channels are deemed inappropriate. The senior independent director also leads the annual assessment of the functioning and performance of the Chairman of Reed Elsevier PLC/Chairman of the Supervisory Board of Reed Elsevier NV. A profile, which identifies the skills and experience of the non-executive directors of Reed Elsevier PLC and the members of the Supervisory Board of Reed Elsevier NV, is available on the Reed Elsevier website, www.reedelsevier.com.
Reed Elsevier PLC and Reed Elsevier NV shareholders maintain their rights to appoint individuals to the respective boards in accordance with the provisions of the Articles of Association of these companies. Subject to this, no individual may be appointed to the boards of Reed Elsevier PLC, Reed Elsevier NV (either of the Executive Board or the Supervisory Board) or Reed Elsevier Group plc unless recommended by the joint Nominations Committee. Members of the Committee abstain when their own re-appointment is being considered.
Structure and corporate governance continued
47213_Text_p056-084.indd 57 1/3/11 10:43:21

58 Reed Elsevier Annual Reports and Financial Statements 2010
Structure and corporate governance continued
As a general rule, letters of appointment in respect of non-executive directors of Reed Elsevier PLC and members of the Supervisory Board of Reed Elsevier NV provide that individuals will serve for an initial term of three years, and are typically expected to serve two three-year terms, although the boards may invite an individual to serve for an additional period of three years.
The respective Articles of Association of Reed Elsevier PLC and Reed Elsevier NV provide that all directors should be subject to retirement at least every three years and are then able to make themselves available for re-election by shareholders at subsequent Annual General Meetings. Notwithstanding the provisions of the said Articles of Association, the boards intend to comply with the recommendations contained in the New UK Code, and all directors will seek re-election by shareholders annually, commencing with the Annual General Meetings to be held in April 2011.
Board changesChanges during the year in the composition of the boards of Reed Elsevier PLC, Reed Elsevier NV and Reed Elsevier Group plc are noted in the table above.
Based on recommendations from the Nominations Committee, Marike van Lier Lels was appointed a member of the Reed Elsevier NV Supervisory Board in January 2010. Mrs Van Lier Lels has extensive business and international experience, along with specific knowledge of employee related matters in the Netherlands. Mrs de Boer-Kruyt retired from the Reed Elsevier NV Supervisory Board in April 2010. Mr Prozes retired as an executive director of the boards on 31 December 2010.
Lord Sharman will retire from the boards at the conclusion of the Reed Elsevier NV and Reed Elsevier PLC Annual General Meetings in April 2011, and will not seek re-election. In accordance with the recommendation in the New UK Code, all other directors will retire from the boards at the respective Annual General Meetings and, being eligible, they will offer themselves for re-election. Taking into account the assessment by the Corporate Governance Committee of the qualifications, performance and effectiveness of each individual director seeking re-election, the boards have accepted a recommendation from the Nominations Committee that each director be proposed for re-election at the Annual General Meeting of the respective company.
The boards, in conjunction with external recruitment consultants, have been conducting a search for a suitable candidate as a non-executive director and, on the recommendation of the Nominations Committee, Adrian Hennah will be proposed for appointment as a non-executive director of Reed Elsevier PLC and as a member of the Supervisory Board of Reed Elsevier NV at the Reed Elsevier PLC and Reed Elsevier NV Annual General Meetings in April 2011. Mr Hennah was appointed chief financial officer of Smith & Nephew plc in 2006. He has over 25 years’ experience in finance and operations in the medical devices, technology and pharmaceuticals industries, and will bring highly relevant experience to the board discussions. Subject to his appointment at the Annual General Meetings, he will also be appointed a non-executive director of Reed Elsevier Group plc and a member of the Audit Committees and of the Corporate Governance Committee.
Elsevier Reed Finance BV has a two-tier board structure comprising a Supervisory Board and a Management Board. The Supervisory Board consists of Rudolf van den Brink (Chairman), Mark Armour, Ben van der Veer and Marike van Lier Lels, with theManagement Board consisting of Jacques Billy, Gerben de Jong and Jans van der Woude. Appointments to the Supervisory Board and the Management Board are made by Elsevier Reed Finance BV’s shareholders, in accordance with the company’s Articles of Association.
Date of Number of appointment meetings Number of
(cessation) held whilst meetings Members during the year a director attended
Mark Armour 3 3 Jacques Billy 3 3 Dien de Boer-Kruyt (April 2010) 1 1 Rudolf van den Brink 3 3 Gerben de Jong 3 3Marike van Lier Lels February 2010 2 2Ben van der Veer February 2010 2 2Jans van der Woude 3 3
Board committees
In accordance with the principles of good corporate governance, the following committees have been established by the respective boards. All of the committees have written terms of reference, which are published on the Reed Elsevier website, www.reedelsevier.com. Membership of each committee during the year is set out on page 59.
Board attendanceReed Elsevier PLC Reed Elsevier NV Reed Elsevier Group plc
Date of Number of Number of Number ofappointment meetings Number meetings Number meetings Number of
(cessation) held whilst of meetings held whilst of meetings held whilst meetings Members during the year a director attended a director attended a director attended
Mark Armour 6 5 6 5 7 6 Dien de Boer-Kruyt (April 2010) n/a n/a 2 1 n/a n/a Mark Elliott 6 5 6 5 7 6 Erik Engstrom 6 6 6 6 7 7 Anthony Habgood 6 6 6 6 7 7 Lisa Hook 6 5 6 5 7 6 Marike van Lier Lels January 2010 n/a n/a 6 5 n/a n/a Robert Polet 6 5 6 5 7 6 Andrew Prozes (December 2010) 6 4 6 4 7 5 David Reid 6 4 6 4 7 5 Lord Sharman 6 4 6 4 7 4 Ben van der Veer 6 6 6 6 7 7
47213_Text_p056-084.indd 58 1/3/11 10:43:21

Annual Reports and Financial Statements 2010 Reed Elsevier 59
Overview
Business review
Financial reviewG
overnanceFinancial statem
ents and other information
Audit Committees: Reed Elsevier PLC, Reed Elsevier NV and Reed Elsevier Group plc have established Audit Committees. The Committees comprise only non-executive directors. The Committees have been chaired by Ben van der Veer since August 2010, having previously been chaired by Lord Sharman. A report of the Audit Committees, setting out their role and main activities during the year, appears on pages 81 to 84.
Number of meetings
held whilst a Number of Committee meetings
Members member attended
Lisa Hook 5 5 David Reid 5 5 Lord Sharman 5 4 Ben van der Veer 5 5
The functions of an audit committee in respect of the financing activities are carried out by the Supervisory Board of Elsevier Reed Finance BV.
Remuneration Committee: Reed Elsevier Group plc has established a Remuneration Committee, which is responsible for determining the remuneration for the executive directors of Reed Elsevier Group plc, Reed Elsevier PLC and Reed Elsevier NV. The Committee comprises only non-executive directors, and is chaired by Mark Elliott. A Directors’ Remuneration Report, which has been approved by the boards of Reed Elsevier Group plc, Reed Elsevier PLC and Reed Elsevier NV, appears on pages 62 to 80. This report also serves as disclosure of the directors’ remuneration policy, and the remuneration and interests of the directors in the shares of the two parent companies, Reed Elsevier PLC and Reed Elsevier NV.
Number of meetings
Date of held whilst a Number of appointment Committee meetings
Members during the year member attended
Mark Elliott 6 6 Anthony Habgood January 2010 6 6 Robert Polet 6 6 David Reid 6 5
Nominations Committee: Reed Elsevier PLC and Reed Elsevier NV have established a joint Nominations Committee, which provides a formal and transparent procedure for the selection and appointment of new directors to the boards. The Committee comprises only non-executive directors, and is chaired by Anthony Habgood. The Committee’s terms of reference include assuring board succession and making recommendations to the boards of Reed Elsevier PLC, Reed Elsevier NV and Reed Elsevier Group plc concerning the appointment or re-appointment of directors to, and the retirement of directors from, those boards. In conjunction with the Reed Elsevier Group plc Remuneration Committee and external consultants, the Committee is also responsible for developing proposals for the remuneration and fees for new directors. In recommending appointments to the Reed Elsevier PLC and Reed Elsevier NV Boards, the Committee considers the knowledge, experience and background of individual directors and has regard to diversity. In respect of the Supervisory Board as a whole, it also has regard to the profile adopted for the constitution of the Supervisory Board (see www.reedelsevier.com).
Structure and corporate governance continued
Number of meetings
held whilst a Number of Committee meetings
Members member attended
Mark Elliott 5 5 Anthony Habgood 5 5 David Reid 5 5 Lord Sharman 5 3
Ben van der Veer was appointed a member of the Committee in January 2011.
Corporate Governance Committee: Reed Elsevier PLC and Reed Elsevier NV have established a joint Corporate Governance Committee, which is responsible for reviewing ongoing developments and best practice in corporate governance. The Committee is also responsible for assessing the performance of the directors and recommending the structure and operation of the various committees of the boards and the qualifications and criteria for membership of each committee, including the independence of members of the boards. The Committee comprises only non-executive directors, and is chaired by Anthony Habgood.
Date of Number ofappointment meetings
(cessation) held whilst a Number of during the Committee meetings
Members year member attended
Dien de Boer-Kruyt (April 2010) 2 1 Mark Elliott 3 3 Anthony Habgood 3 3 Lisa Hook 3 2 Marike van Lier Lels January 2010 3 2 Robert Polet 3 3 David Reid 3 3 Lord Sharman 3 3 Ben van der Veer 3 3
Internal control
Parent companiesThe boards of Reed Elsevier PLC and Reed Elsevier NV exercise independent supervisory roles over the activities and systems of internal control of Reed Elsevier Group plc and Elsevier Reed Finance BV. The boards of Reed Elsevier PLC and Reed Elsevier NV have each adopted a schedule of matters which are required to be brought to them for decision. In relation to Reed Elsevier Group plc and Elsevier Reed Finance BV, the boards of Reed Elsevier PLC and Reed Elsevier NV approve the strategy and the annual budgets, and receive regular reports on the operations, including the treasury and risk management activities of the two companies. Major transactions proposed by the boards of Reed Elsevier Group plc or Elsevier Reed Finance BV require the approval of the boards of both Reed Elsevier PLC and Reed Elsevier NV.
The Reed Elsevier PLC and Reed Elsevier NV Audit Committees meet on a regular basis to review the systems of internal control and risk management of Reed Elsevier Group plc and Elsevier Reed Finance BV.
47213_Text_p056-084.indd 59 1/3/11 10:43:21
60 Reed Elsevier Annual Reports and Financial Statements 2010
Structure and corporate governance continued
Operating companiesThe board of Reed Elsevier Group plc is responsible for the system of internal control of the Reed Elsevier publishing and information businesses, while the boards of Elsevier Reed Finance BV are responsible for the system of internal control in respect of the finance group activities. The boards of Reed Elsevier Group plc and Elsevier Reed Finance BV are also responsible for reviewing the effectiveness of their systems of internal control.
The boards of Reed Elsevier Group plc and Elsevier Reed Finance BV have each implemented an ongoing process for identifying, evaluating, monitoring and managing the more significant risks faced by their respective businesses. These processes have been in place throughout the year ended 31 December 2010 and up to the date of the approvals of the Annual Reports and Financial Statements 2010.
Reed Elsevier Group plcReed Elsevier Group plc has an established framework of procedures and internal controls, with which the management of each business is required to comply. Group businesses are required to maintain systems of internal control which are appropriate to the nature and scale of their activities and address all significant operational and financial risks that they face. The board of Reed Elsevier Group plc has adopted a schedule of matters that are required to be brought to it for decision.
Reed Elsevier Group plc has a Code of Ethics and Business Conduct that provides a guide for achieving its business goals and requires officers and employees to behave in an open, honest, ethical and principled manner. The Code also outlines confidential procedures enabling employees to report any concerns about compliance, or about Reed Elsevier’s financial reporting practice. The Code is published on the Reed Elsevier website, www.reedelsevier.com.
Each division has identified and evaluated its major risks, the controls in place to manage those risks and the levels of residual risk accepted. Risk management and control procedures are embedded into the operations of the business and include the monitoring of progress in areas for improvement that come to management and board attention. The major risks identified include business continuity, protection of IT systems and data, challenges to intellectual property rights, management of strategic and operational change, evaluation and integration of acquisitions, and recruitment and retention of personnel. Further detail on the principal risks facing Reed Elsevier is set out on pages 50 to 52.
The major strategic risks facing the Reed Elsevier Group plc businesses are considered by the Board. Reed Elsevier’s Chief Risk Officer is responsible for providing regular reports to the Board and Audit Committee. Working closely with business management and with the central functions, the role of the Chief Risk Officer is to ensure that Reed Elsevier is managing its business risks effectively and in a coordinated manner across the business with clarity on the respective responsibilities and interdependencies. Litigation and other legal regulatory matters are managed by legal directors in Europe and the United States.
The Reed Elsevier Group plc Audit Committee receives regular reports on the identification and management of material risks and reviews these reports. The Audit Committee also receives regular reports from both internal and external auditors on internal control and risk management matters. In addition, each division is required, at the end of the financial year, to review the effectiveness of internal controls and risk management and report its findings on a detailed basis to the management of Reed Elsevier Group plc. These reports are summarised and, as part of the annual review of effectiveness, submitted to the Audit Committee of Reed Elsevier Group plc. The Chairman of the Audit Committee reports to the board on any significant internal control matters arising.
Elsevier Reed Finance BVElsevier Reed Finance BV has established policy guidelines, which are applied to all Elsevier Reed Finance BV companies. The respective boards of Elsevier Reed Finance BV have adopted schedules of matters that are required to be brought to them for decision. Procedures are in place for monitoring the activities of the finance group, including a comprehensive treasury reporting system. The major risks affecting the finance group have been identified and evaluated and are subject to regular review. The controls in place to manage these risks and the level of residual risk accepted are monitored by the boards.
Annual reviewAs part of the year end procedures, the Audit Committees and boards of Reed Elsevier PLC, Reed Elsevier NV, Reed Elsevier Group plc and Elsevier Reed Finance BV review the effectiveness of the systems of internal control and risk management during the last financial year. The objective of these systems is to manage, rather than eliminate, the risk of failure to achieve business objectives. Accordingly, they can only provide reasonable, but not absolute, assurance against material misstatement or loss. The boards have confirmed, subject to the above, that as regards financial reporting risks, the respective risk management and control systems provide reasonable assurance against material inaccuracies or loss and have functioned properly during the year.
47213_Text_p056-084.indd 60 1/3/11 10:43:21
Annual Reports and Financial Statements 2010 Reed Elsevier 61
Overview
Business review
Financial reviewG
overnanceFinancial statem
ents and other information
Responsibilities in respect of the financial statements
The directors of Reed Elsevier PLC, Reed Elsevier NV, Reed Elsevier Group plc and Elsevier Reed Finance BV are required to prepare financial statements as at the end of each financial period, in accordance with applicable law and regulations, which give a true and fair view of the state of affairs, and of the profit or loss, of the respective companies and their subsidiaries, joint ventures and associates. They are responsible for maintaining proper accounting records, for safeguarding assets, and for taking reasonable steps to prevent and detect fraud and other irregularities. The directors are also responsible for selecting suitable accounting policies and applying them on a consistent basis, making judgements and estimates that are prudent and reasonable.
Applicable accounting standards have been followed and the Reed Elsevier combined financial statements, which are the responsibility of the directors of Reed Elsevier PLC and Reed Elsevier NV, are prepared using accounting policies which comply with International Financial Reporting Standards.
Going concern
The directors of Reed Elsevier PLC and Reed Elsevier NV, having made appropriate enquiries, consider that adequate resources exist for the combined businesses to continue in operational existence for the foreseeable future and that, therefore, it is appropriate to adopt the going concern basis in preparing the 2010 financial statements. In reaching this conclusion, the directors of Reed Elsevier PLC and Reed Elsevier NV have had due regard to the combined businesses’ financial position as at 31 December 2010, the strong free cash flow of the combined businesses, Reed Elsevier’s ability to access capital markets and the principal risks facing Reed Elsevier.
A commentary on the Reed Elsevier combined businesses’ cash flows, financial position and liquidity for the year ended 31 December 2010 is set out in the Chief Financial Officer’s Report on pages 44 and 45. This shows that after taking account of available cash resources and committed bank facilities that back up short term borrowings, none of Reed Elsevier’s borrowings fall due within the next two years. Reed Elsevier’s policies on liquidity, capital management and management of risks relating to interest rate, foreign exchange and credit exposures are set out on pages 48 and 49. Further information on liquidity of the combined businesses can be found in note 18 of the combined financial statements. The principal risks facing Reed Elsevier are set out on pages 50 to 52.
US certificates
As required by Section 302 of the US Sarbanes-Oxley Act 2002 and by related rules issued by the US Securities and Exchange Commission, the Chief Executive Officer and Chief Financial Officer of Reed Elsevier PLC and of Reed Elsevier NV certify in the respective Annual Reports 2010 on Form 20-F to be filed with the Commission that they are responsible for establishing and maintaining disclosure controls and procedures and that they have:
that material information relating to Reed Elsevier is made known to them;
and procedures;
and the external auditors all significant deficiencies in the design or operation of disclosure controls and procedures and any frauds, whether or not material, that involve management or other employees who have a significant role in Reed Elsevier’s internal controls; and
20-F their conclusions about the effectiveness of the disclosure controls and procedures.
A Disclosure Committee, comprising the company secretaries of Reed Elsevier PLC and Reed Elsevier NV and other senior Reed Elsevier managers, provides assurance to the Chief Executive Officer and Chief Financial Officer regarding their Section 302 certifications.
Section 404 of the US Sarbanes-Oxley Act 2002 requires the Chief Executive Officer and Chief Financial Officer of Reed Elsevier PLC and of Reed Elsevier NV to certify in the respective Annual Reports 2010 on Form 20-F that they are responsible for maintaining adequate internal control structures and procedures for financial reporting and to conduct an assessment of their effectiveness. The conclusions of the assessment of internal control structures and financial reporting procedures, which are unqualified, are presented in the Reed Elsevier Annual Report 2010 on Form 20-F.
Structure and corporate governance continued
47213_Text_p056-084.indd 61 1/3/11 10:43:22
62 Reed Elsevier Annual Reports and Financial Statements 2010
Remuneration Committee63 Constitution and terms of reference
Executive directors63 Remuneration philosophy and policy65 The total remuneration package73 Service contracts
Non-executive directors74 Policy on non-executive directors’ fees
Total Shareholder Return graphs75 Total Shareholder Return graphs
Remuneration and share tables75 Directors’ emoluments and fees76 Directors’ shareholdings in Reed Elsevier76 Share-based awards in Reed Elsevier
This report (the Directors’ Remuneration Report) describes how Reed Elsevier applies the principles of good governance relating to directors’ remuneration. In respect to the disclosures contained in this report, we have sought to comply with the substance and spirit of prevailing legislation and corporate governance guidelines in the UK and the Netherlands. The Remuneration Committee (the Committee) has sought to balance in a thoughtful and responsible manner the UK legislative requirements with best practice guidelines on disclosure in the Netherlands. This report has been prepared by the Remuneration Committee of Reed Elsevier Group plc in accordance with regulations made under the Companies Act 2006 and the Dutch Corporate Governance Code (the Dutch Code).
The Directors’ Remuneration Report was approved by the boards of Reed Elsevier Group plc, Reed Elsevier PLC and Reed Elsevier NV and will be submitted to shareholders for an advisory vote at the Annual General Meeting of Reed Elsevier PLC. In addition, resolutions will be submitted to the Annual General Meeting of Reed Elsevier NV requesting approval for the introduction of a separate annual fee for the senior independent director and for setting the maximum amount of annual remuneration of the Supervisory Board of Reed Elsevier NV at !600,000.
The audited parts of the Directors’ Remuneration ReportIn compliance with the Large and Medium-sized Companies and Groups (Accounts and Reports) Regulations 2008, and under Title 9, Book 2 of the Civil Code in the Netherlands, the following elements of this report have been audited: the table entitled ‘Transfer values of accrued pension benefits’ on page 73; the tables showing ‘Aggregate emoluments’ and ‘Individual fees of non-executive directors’ on page 75; the tables on ‘Individual emoluments of executive directors’ and ‘Directors’ shareholdings in Reed Elsevier PLC and Reed Elsevier NV’ on page 76; and the section ‘Share-based awards in Reed Elsevier PLC and Reed Elsevier NV’ on pages 76-79.
Introduction from Remuneration Committee Chairman
2010 saw the implementation of two new multi-year incentives, the Reed Elsevier Growth Plan (REGP) and the new Bonus Investment Plan (BIP), both of which received overwhelming shareholder approval at the 2010 Annual General Meetings of Reed Elsevier PLC and Reed Elsevier NV. Awards were made in May 2010 under both plans while no awards were made under the Long-Term Incentive Plan (LTIP) approved by shareholders in 2003 (and amended in 2006). As previously communicated to shareholders, no new Long-Term Incentive Plan for executive directors in 2011 or thereafter will be introduced without shareholder approval. No awards were made during the year under the Executive Share Option Scheme (ESOS), also approved by shareholders in 2003, to executive directors.
During the year, awards granted under the 2007-09 cycle of ESOS, BIP and LTIP lapsed for executive directors as a result of performance conditions not being met. ESOS and LTIP awards granted under the 2008-10 cycle lapsed for executive directors prior to the date of this report for the same reasons. In addition, unvested matching awards granted under the BIP prior to 2010 lapsed during the year.
Since the REGP is a one-off arrangement, the executive directors are not eligible for any further grants under that plan and no grants will be made to them in 2011 under the LTIP. For 2011 the executive directors are eligible to participate in the 2011-13 cycle of the new BIP and the Committee intends to make grants of market value options under the ESOS to the executive directors. The grants will be made within the limits and be subject to pre- and post grant performance conditions as previously approved by shareholders. The grants to all participants under the multi-year incentives will be made in May.
Having given no annual salary increases to executive directors since January 2008, the Committee decided to award the executive directors a salary increase of 2.5% each effective 1 January 2011.
Annual bonuses payable for 2010 to the executive directors were below target as the Committee had decided that an on or above target bonus could only be achieved if profits in 2010 exceeded 2009.
Standard terms and conditions were applied to the retirement of Andrew Prozes who retired on 31 December 2010. Furthermore, the Committee revised its terms of reference during the year in the context of best practice guidance.
Our approach to preparing this report has been to meet the highest standards of disclosure. In balancing relevant requirements in the UK and the Netherlands, the Committee had regard to the approach adopted by other large global businesses subject to disclosure requirements in more than one jurisdiction. As in prior years, our aim has been to produce a clear, informative and understandable report.
Mark ElliottChairman, Remuneration Committee
Directors’ remuneration report
47213_Text_p056-084.indd 62 2/3/11 21:45:11

Annual Reports and Financial Statements 2010 Reed Elsevier 63
Remuneration Committee
ConstitutionThroughout 2010, the Committee consisted of independent non-executive directors, as defined by the UK Corporate Governance Code and the Dutch Code, and the Chairman of Reed Elsevier Group plc. Details of Committee members and meeting attendance are contained in the section on ‘Structure and corporate governance’ in the Annual Reports. The Company Secretary of Reed Elsevier Group plc, Stephen Cowden, also attends the meetings in his capacity as secretary to the Committee. At the invitation of the Committee Chairman, the CEO of Reed Elsevier Group plc attends appropriate parts of the meetings.
Ian Fraser, Global Human Resources Director, provided material advice to the Committee during the year.
AdvisorsTowers Watson acted as external advisers to the Committee throughout 2010 and also provided market data and data analysis. Towers Watson also provided actuarial and other human resources consultancy services directly to some Reed Elsevier companies.
The individual consultants involved in advising the Committee do not provide advice to the executive directors or act on their behalf.
Terms of reference During 2010, the Committee reviewed its terms of reference in the context of latest best practice guidance. As a result, the Committee’s remit was revised and its duties are in relation to:
Executive Directors
and determine the remuneration in all its forms (including pensions and share plan participation), the terms of the service contracts and all other terms and conditions of employment of the executive directors of Reed Elsevier Group plc; and
executive directors.
Senior Management
remuneration policy of other senior leaders and of the Company Secretary; and
of executives.
Reed Elsevier Chairman
the remuneration of the Reed Elsevier Chairman.
General
remuneration policy, in particular the performance-related elements and their compatibility with risk policies and systems;
plans including the formulation of suitable performance conditions for share based awards and options, and where necessary, to submit them for approval by shareholders;
investors on major remuneration policy issues; and
corporate governance guidelines, codes or recommendations regarding the remuneration of directors of listed companies and formation and operation of share schemes which the Committee considers relevant or appropriate including, but not limited to, the UK and Dutch Corporate Governance Codes.
A copy of the terms of reference of the Committee can be found on the Reed Elsevier website, www.reedelsevier.com.
Executive directors
Remuneration philosophy and policyThe context for Reed Elsevier’s remuneration policy and practices is set by the needs of a group of global businesses, each of which operates internationally by line of business. Furthermore, Reed Elsevier PLC and Reed Elsevier NV’s respective stock market listings in London and Amsterdam combined with the majority of its employees being based in the US provides a particular set of challenges in the design and operation of remuneration policy.
Our remuneration philosophyReed Elsevier’s guiding remuneration philosophy for senior executives is based on the following precepts:
performance standards.
the best executive talent from anywhere in the world.
elements, and annual and longer term performance.
and other stakeholders.
Directors’ remuneration report continued
Overview
Business review
Financial reviewG
overnanceFinancial statem
ents and other information
47213_Text_p056-084.indd 63 2/3/11 21:46:00
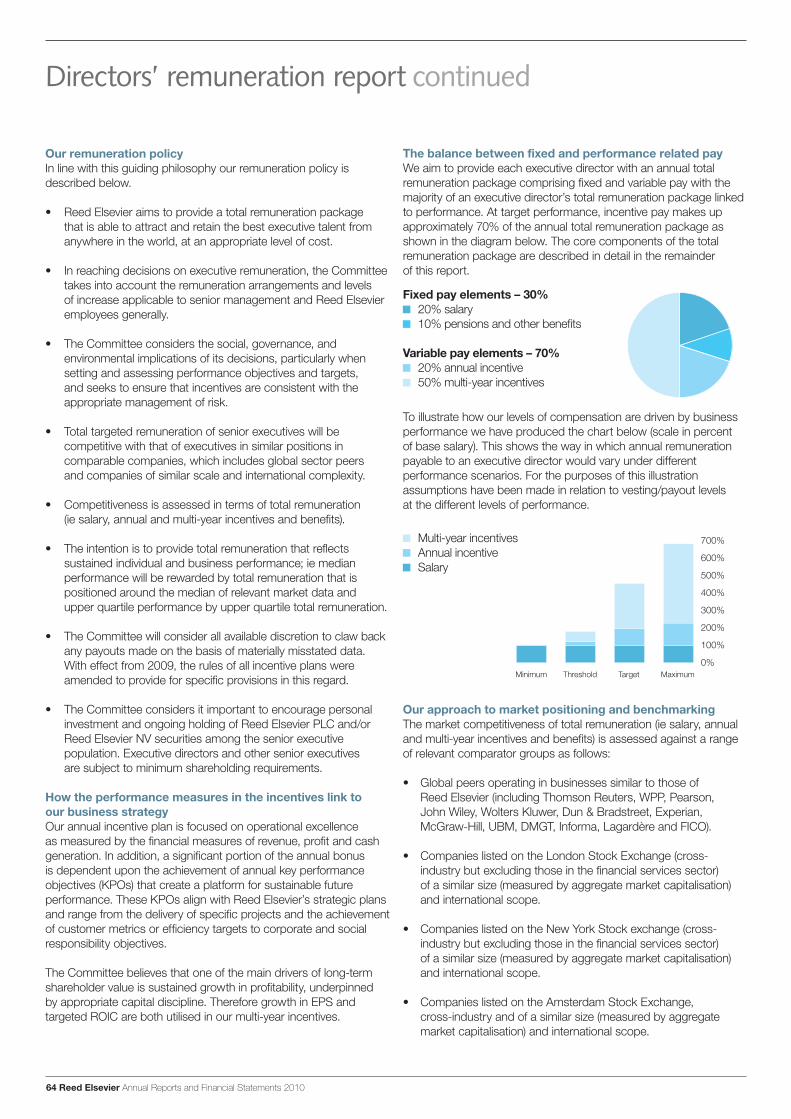
64 Reed Elsevier Annual Reports and Financial Statements 2010
Directors’ remuneration report continued
Our remuneration policyIn line with this guiding philosophy our remuneration policy is described below.
that is able to attract and retain the best executive talent from anywhere in the world, at an appropriate level of cost.
takes into account the remuneration arrangements and levels of increase applicable to senior management and Reed Elsevier employees generally.
environmental implications of its decisions, particularly when setting and assessing performance objectives and targets, and seeks to ensure that incentives are consistent with the appropriate management of risk.
competitive with that of executives in similar positions in comparable companies, which includes global sector peers and companies of similar scale and international complexity.
(ie salary, annual and multi-year incentives and benefits).
sustained individual and business performance; ie median performance will be rewarded by total remuneration that is positioned around the median of relevant market data and upper quartile performance by upper quartile total remuneration.
any payouts made on the basis of materially misstated data. With effect from 2009, the rules of all incentive plans were amended to provide for specific provisions in this regard.
investment and ongoing holding of Reed Elsevier PLC and/or Reed Elsevier NV securities among the senior executive population. Executive directors and other senior executives are subject to minimum shareholding requirements.
How the performance measures in the incentives link to our business strategy Our annual incentive plan is focused on operational excellence as measured by the financial measures of revenue, profit and cash generation. In addition, a significant portion of the annual bonus is dependent upon the achievement of annual key performance objectives (KPOs) that create a platform for sustainable future performance. These KPOs align with Reed Elsevier’s strategic plans and range from the delivery of specific projects and the achievement of customer metrics or efficiency targets to corporate and social responsibility objectives.
The Committee believes that one of the main drivers of long-term shareholder value is sustained growth in profitability, underpinned by appropriate capital discipline. Therefore growth in EPS and targeted ROIC are both utilised in our multi-year incentives.
The balance between fixed and performance related payWe aim to provide each executive director with an annual total remuneration package comprising fixed and variable pay with the majority of an executive director’s total remuneration package linked to performance. At target performance, incentive pay makes up approximately 70% of the annual total remuneration package as shown in the diagram below. The core components of the total remuneration package are described in detail in the remainder of this report.
Fixed pay elements – 30%20% salary10% pensions and other benefits
Variable pay elements – 70%20% annual incentive50% multi-year incentives
To illustrate how our levels of compensation are driven by business performance we have produced the chart below (scale in percent of base salary). This shows the way in which annual remuneration payable to an executive director would vary under different performance scenarios. For the purposes of this illustration assumptions have been made in relation to vesting/payout levels at the different levels of performance.
Multi-year incentivesAnnual incentiveSalary
Minimum Threshold Target Maximum
400%
700%
600%
500%
300%
200%
100%
0%
Our approach to market positioning and benchmarkingThe market competitiveness of total remuneration (ie salary, annual and multi-year incentives and benefits) is assessed against a range of relevant comparator groups as follows:
Reed Elsevier (including Thomson Reuters, WPP, Pearson, John Wiley, Wolters Kluwer, Dun & Bradstreet, Experian, McGraw-Hill, UBM, DMGT, Informa, Lagardère and FICO).
industry but excluding those in the financial services sector) of a similar size (measured by aggregate market capitalisation) and international scope.
industry but excluding those in the financial services sector) of a similar size (measured by aggregate market capitalisation) and international scope.
cross-industry and of a similar size (measured by aggregate market capitalisation) and international scope.
47213_Text_p056-084.indd 64 1/3/11 10:43:23

Annual Reports and Financial Statements 2010 Reed Elsevier 65
Directors’ remuneration report continued
The composition of the respective comparator groups is subjectto minor changes year on year reflecting changes in the size,international scope and listing status of specific companies duringthe year.
The competitiveness of our remuneration packages is assessed bythe Committee as part of the annual review cycle for pay andperformance, in line with the process set out below.
packages is assessed. The appropriate positioning of anindividual’s total remuneration against the market is determinedbased on the Committee’s judgement of individual performanceand potential.
for the different elements of the package including salary, totalannual cash and total remuneration. While relevant benchmarkinformation are a meaningful input to the process, they informrather than drive the outcome of the review.
exists, the Committee believes that this should be addressedvia a review of performance-linked compensation elementsin the first instance.
are positioned to reflect local country practice.
The total remuneration packageEach element of the remuneration package for executive directors is designed to achieve specific objectives, as described in this section.
is only maximised through the integrated delivery of annual and longer term performance. Reward for the delivery of business results isconnected with reward for value flowing to shareholders. The incentive arrangements are structured in such a way that reward cannotbe maximised through inappropriate short term risk-taking.
The table below summarises the component parts of the remuneration package provided to the executive directors during 2010. Thisincludes the bonuses earned for performance during 2010, payouts received from and awards granted under the multi-year incentivesduring the year.
Overview
Governance
Component Erik Engstrom Mark Armour Andrew Prozes
Base salary (page 66) £1,000,000 £613,440 $1,215,180
Retirement benefi ts (page 72) UK defined benefit plan UK defined benefit plan Retired 31 December 2010
Other benefi ts Company car or cashallowance and privatemedical benefit
Company car or cashallowance and privatemedical benefit
Company car andprivate medical benefit
Annual incentive (page 66)(earned for 2010 andpayable in March 2011)
£999,000 £612,827 $1,146,332
Multi-year incentivesgranted (page 67)
REGP 643,086 PLC and 422,310NV ordinary shares
394,495 PLC and 259,062 NVordinary shares
–
LTIP – – –
ESOS – – –
BIP 70,189 NV ADRs 65,054 PLC and 42,512 NVordinary shares
88,687 PLC and 58,545 NVordinary shares
Multi-year incentivesvested (2007-09 cycle)
LTIP – – –
ESOS – – –
BIP – – –
Shareholdingrequirement (page 72)
300% of salary 200% of salary 200% of salary
Policy in relation to the individual remuneration elements is described in greater detail in the remainder of this section.
47213_Text_p056-084.indd 65 2/3/11 21:48:45
66 Reed Elsevier Annual Reports and Financial Statements 2010
Directors’ remuneration report continued
Base salary
Salary reflects the role and the sustained value of the executive in terms of skills, experience and contribution in the context of the relevant market.
Salaries for executive directors are reviewed annually in the context of the competitiveness of total remuneration and Reed Elsevier’s guidelines for wages and salaries agreed for the whole of Reed Elsevier for the forthcoming financial year. Any increases typically take effect on 1 January.
No increases in the base salary of executive directors have been given since 1 January 2008, except for Erik Engstrom who received a promotional increase in November 2009 following his appointment as CEO of Reed Elsevier Group plc. The Committee decided to award a salary increase of 2.5% to each executive director which increased base salaries with effect from 1 January 2011 to £1,025,000 for Erik Engstrom and £628,776 for Mark Armour. This level of increase is within the guidelines agreed for all employees in respect of 2011 increases.
In respect of salaries for the broader employee population, Reed Elsevier uses the same factors to determine the levels of increase across all employee populations globally: ie relevant pay market, skills, experience and contribution. Reed Elsevier operates across many diverse countries in terms of their remuneration structures and practices. Any increases awarded to different employee groups in different geographies reflect this diversity and range of practices. An increase of approximately 2.5% on average will be awarded across the senior management population globally for 2011. This level of increase is in line with increases provided to the wider employee population.
Annual incentive
The annual incentive plan (AIP) provides focus on the delivery of stretching annual financial targets and the achievement of annual objectives and milestones that create a platform for sustainable future performance.
For 2011, executive directors have a target bonus opportunity of 100% of salary that is weighted as follows across four elements (unchanged from 2010):
Measure Weighting
Revenue 30% Profit* 30% Cash Flow Conversion Rate 10% Key Performance Objectives (KPOs) 30%
* The Profit measure for the CEO and CFO of Reed Elsevier Group plc is Adjusted Profit After Tax (PAT) for the Reed Elsevier combined businesses.
The target bonus opportunity for the financial measures is payable for the achievement of highly stretching financial targets. The four elements are measured separately, such that there could be a payout on one element and not on others.
For 2011, the Committee decided to retain the incentive slope and payout range used in 2010 under which a small bonus starts to accrue for achieving 94% of target against each individual financial performance measure. The level of out-performance required to achieve the maximum bonus (150% of target and unchanged) will also be retained.
The KPOs are individual to each executive director. Each executive director is set up to six KPOs to reflect critical business priorities for which they are accountable. The KPO component for the executive directors and other senior executives will contain at least one KPO relating to the achievement of specific sustainability objectives and targets contained within Reed Elsevier’s corporate responsibility agenda.
Against each objective, measurable milestone targets are set for the year. All financial targets and KPOs are approved by the Committee and are subject to formal assessment at the end of each year. The Chairman of Reed Elsevier Group plc presents his assessment of performance against KPOs for the CEO of Reed Elsevier Group plc to the Committee while the CEO of Reed Elsevier Group plc presents his assessment of KPO performance for the CFO of Reed Elsevier Group plc. The Committee then discusses and agrees the final KPO score for each executive director.
AIP payments for 2010In assessing the level of bonus payments for 2010, the Committee noted the following performances:
% change over 2009 at constant exchange rates
Underlying Total Adjusted revenue growth PAT/OP
Reed Elsevier +2% -1% LexisNexis +1% -12%
Reed Elsevier has made significant progress in 2010 as our markets strengthened and we saw the benefit of the actions which management has taken in the business. Underlying revenues were 2% higher in constant currencies with the return to growth reflecting improved performance in our more cyclical markets, together with a sustained commitment to new product development and a focus on sales & marketing initiatives. Firm action on costs and further innovations in our operational processes has meant that total costs at constant exchange rates declined 1% and adjusted operating margins at 25.7% were just 0.2 percentage points lower than in 2009, despite the increased spending on new product development and sales & marketing. Adjusted operating profits were 1% lower at £1,555m/up 3% at !1,819m. Adjusted operating cash flow continued to be strong at £1,519m/!1,777m with an excellent 98% conversion of adjusted operating profits into cash. The post tax return on capital employed improved to 10.6%, 0.2 percentage points higher reflecting the strong cash generation and increased capital efficiency.
LexisNexis returned to overall revenue growth, with strong growth in the risk business. Subscription revenues in the legal business continued to reflect lower levels of law firm activity and employment. Adjusted operating margin was lower due to the weaker revenues and increased spending in the legal business on new product development, related infrastructure and sales & marketing. The increased spend on supporting these important developments has in part been mitigated by continuing cost efficiencies including further outsourcing of production and engineering activities, supply chain management and operational streamlining.
For Erik Engstrom and Mark Armour the sum of the individual scores achieved against the four AIP components exceeded target AIP. However, as Reed Elsevier’s PAT did not exceed 2009 adjusted PAT, the overall bonus was capped at just below target.
47213_Text_p056-084.indd 66 3/3/11 16:13:14

Annual Reports and Financial Statements 2010 Reed Elsevier 67
Directors’ remuneration report continued
Reed Elsevier Growth Plan (REGP)The key features of the REGP are summarised below.
Feature Detail
Frequency of award
Performance conditions(see section entitled ‘Performance measures and targets’ below)
share award
Financial statements and other inform
ation
2010 annual bonus % of 2010 base (to be paid in March 2011) salary earnings
£999,000 99.9£612,827 99.9
$1,146,332 93.9
Multi-year incentives
based on internal financial metrics and total shareholder return.
47213_Text_p056-084.indd 67 2/3/11 21:54:21

68 Reed Elsevier Annual Reports and Financial Statements 2010
Directors’ remuneration report continued
Performance measures and targets
Total Shareholder Return (TSR)The vesting of one third of the REGP award is subject toReed Elsevier’s TSR performance compared against threecomparator groups (the TSR tranche).
As Reed Elsevier accesses equity capital markets through threeexchanges – London, Amsterdam and New York – in threeseparate currency zones, three distinct comparator groups areused – a Sterling Comparator Group, a Euro Comparator Groupand a US Dollar Comparator Group. The TSR performance ofReed Elsevier PLC ordinary shares (based on the London listing)is measured against the Sterling Comparator Group, the TSRperformance of Reed Elsevier NV ordinary shares (based onthe Amsterdam listing) is measured against the Euro ComparatorGroup; and the TSR performance of Reed Elsevier PLC ADRs andReed Elsevier NV ADRs (based on the New York listing) is measuredagainst the US Dollar Comparator Group. The averaging periodapplied for TSR measurement purposes is six months prior to thestart of the financial year in which the award was made and thefinal six months of the last financial year of the performance period.
TSR performance is measured separately against each comparatorgroup and the proportion of the TSR tranche that vests is the sumof the payouts achieved against the three comparator groups.
TSR ranking within3-year period: 5-year period:the relevant TSR
2010-2012 2010-14comparator groupVesting percentage Vesting percentageof each third of the of each third of the
TSR tranche TSR tranche
Below Median 0% 0%
Median 30% 30%
Upper quartile 100% 100%
Vesting is on a straight line basis for ranking between the medianand the upper quartile.
3 years: 2010-2012 Q1 2013 2 years: 2013-2014 Q1 2015
Performanceshare awardof 600%of salary
On the date of grant the CEO committed 300%of salary and the CFO 200% of salary in sharesto the plan which must be retained throughoutthe life of the plan
Overall payout from the plan to each executive director is capped at 150% of the shares comprised in the performance share award
Performanceshare award
Performancetested
50% ofperformanceshares arereleased
emaining 50% of the performance shares is deferred until Q1 of 2015 subject to continued employment
ee metrics, up to a 1 for 1 match can be earned over years 4 and 5 on the deferred performance shares
ee metrics,up to a 1 for 1 match can be earned over years4 and 5 on the personal shareholding committedunder the plan
committedholding – theregular shareholdingguidelines continueto apply to theexecutive directors
edperformance shares
1/3rd 1/3rd
1/3rd
1/3rd 1/3rd
1/3rd
matching sharesearned
MechanicsThe chart below illustrates how the REGP operates.
47213_Text_p056-084.indd 68 1/3/11 10:43:24
Annual Reports and Financial Statements 2010 Reed Elsevier 69
Directors’ remuneration report continued
Overview
Business review
Financial reviewG
overnanceFinancial statem
ents and other information
TSR comparators groupsThe constituents of each comparator group were selected on the following basis:
31 December 2009 and nearest in size to Reed Elsevier in terms of market capitalisation.
Comparator Group; (2) Euronext100 and the DAX30 for the Euro Comparator Group; and (3) the S&P500 for the US Dollar Comparator Group.
– companies with mainly domestic revenues (as they do not reflect the global nature of Reed Elsevier’s customer base);
– those engaged in extractive industries (as they are exposed to commodity cycles); and
– financial services companies (as they have a different risk/reward profile).
to those of Reed Elsevier not otherwise included were added to the relevant comparator group.
Set out below are the comparators included in each currency group applicable to awards made in 2010 under the REGP.
Sterling Euro US Dollar Comparator Comparator Comparator Group* Group* Group*Aggreko Accor 3MAstraZeneca Adidas Adobe SystemsAutonomy Corp. Ahold Agilent Techs.BAE Systems Air Liquide Air Prds. & Chems.British Airways Akzo Nobel Amazon.comBritish American Tobacco Alstom Analog DevicesBunzl ASML Holding Applied Mats.Burberry Group BASF Avon ProductsCobham BMW Baxter Intl.Compass Group Carrefour Becton DickinsonDMGT Christian Dior CaterpillarDiageo Daimler Colgate-PalmoliveExperian Deutsche Post CorningGlaxoSmithkline EADS CumminsIntercontinental Hotels Essilor Intl. DeereImperial Tobacco Group Heineken Dow ChemicalInforma Hermes Intl. Dun & BradstreetInmarsat K+S E. I. Du pont de NemoursInternational Power Lafarge EbayIntertek Group Lagardère Groupe Emerson ElectricInvensys Linde FICOJohnson Matthey LVMH Ford MotorKingfisher MAN GenzymeNational Grid Metro H.J. HeinzPearson Michelin Illinois Tool WorksReckitt Benckiser Group Pernod-Ricard John Wiley Rexam Philips Eltn. Koninklijke Johnson ControlsRolls-Royce Group Portugal Telecom SGPS Juniper NetworksSABMiller PPR Life TechnologiesSage Group Renault McDonaldsShire Saint-Gobain McGraw-HillSmith & Nephew SAP Micron TechnologySmiths Group Schneider Electric MotorolaThomas Cook Group Suez Environnement News Corp TUI Travel Thales Nike Unilever (LSE) ThyssenKrupp NvidiaUnited Business Media TNT PaccarVodafone Unilever (AEX) PPG IndustriesWolseley Vallourec Spectra EnergyWPP Veolia Environnement Texas Insts. Volkswagen Thomson Reuters (NYSE) Wolters Kluwer United Technologies Yum! Brands
*Reflects the composition of the comparator group as at the date of grant.
Return on invested capital (ROIC)The vesting of one third of the REGP award is subject to the percentage return on invested capital of Reed Elsevier PLC and Reed Elsevier NV (the ROIC tranche) as follows:
3 years: 2 years: Vesting percentage 2010-2012 2013-14 of ROIC tranche
ROIC in 2012, subject ROIC in 2014 to actual exceeding
2009 ROIC calculated on the same basis
Below 10.2% Below 10.7% 0%
10.2% 10.7% 60%
11.2% or above 12.7% or above 100%
Vesting is on a straight-line basis for performance between the minimum and maximum levels.
For the purposes of the plan, the following definitions apply:
closing capital employed for the Reed Elsevier combined businesses for the financial year with all cumulative amortisation and impairment charges for acquired intangible assets and goodwill added back. In addition, any exceptional restructuring and acquisition integration charges (net of tax) are capitalised for these purposes and changes in exchange rates and movements in pension deficits are excluded.
combined businesses before amortisation and impairment of acquired intangible assets and goodwill, exceptional restructuring and acquisition integration charges. In addition, it is grossed up to exclude the equity share of taxes in joint ventures and further adjusted to exclude net pension financing credit movement, after applying the effective rate of tax used for adjusted earnings calculations and using exchange rates to match those used in the calculation of invested capital.
In order to ensure that the performance score achieved is a fair reflection of underlying business performance, the Committee retains discretion to determine the treatment of major disposals and acquisitions that require board approval. Any significant adjustments made to the final performance score will be disclosed to shareholders.
47213_Text_p056-084.indd 69 1/3/11 10:43:25

70 Reed Elsevier Annual Reports and Financial Statements 2010
Directors’ remuneration report continued
Executive Share Option Scheme (ESOS)The key features of the ESOS are summarised below.
Feature Detail
Frequency of award
Eligibility
Performance conditions
Adjusted earnings per share (EPS)
as follows:
3 years: 2 years: Vesting percentage 2010-2012 2013-14 of EPS tranche
Average Adjusted EPS growth p.a. % of the 2003 grant poolover the three-years prior to grant available for distribution
of ESOS during which restructuring benefits were realised. Prior to
47213_Text_p056-084.indd 70 2/3/11 22:20:40

Annual Reports and Financial Statements 2010 Reed Elsevier 71
Directors’ remuneration report continued
Feature Detail
Frequency of award
Bonus Investment Plan (BIP)
47213_Text_p056-084.indd 71 2/3/11 21:55:54
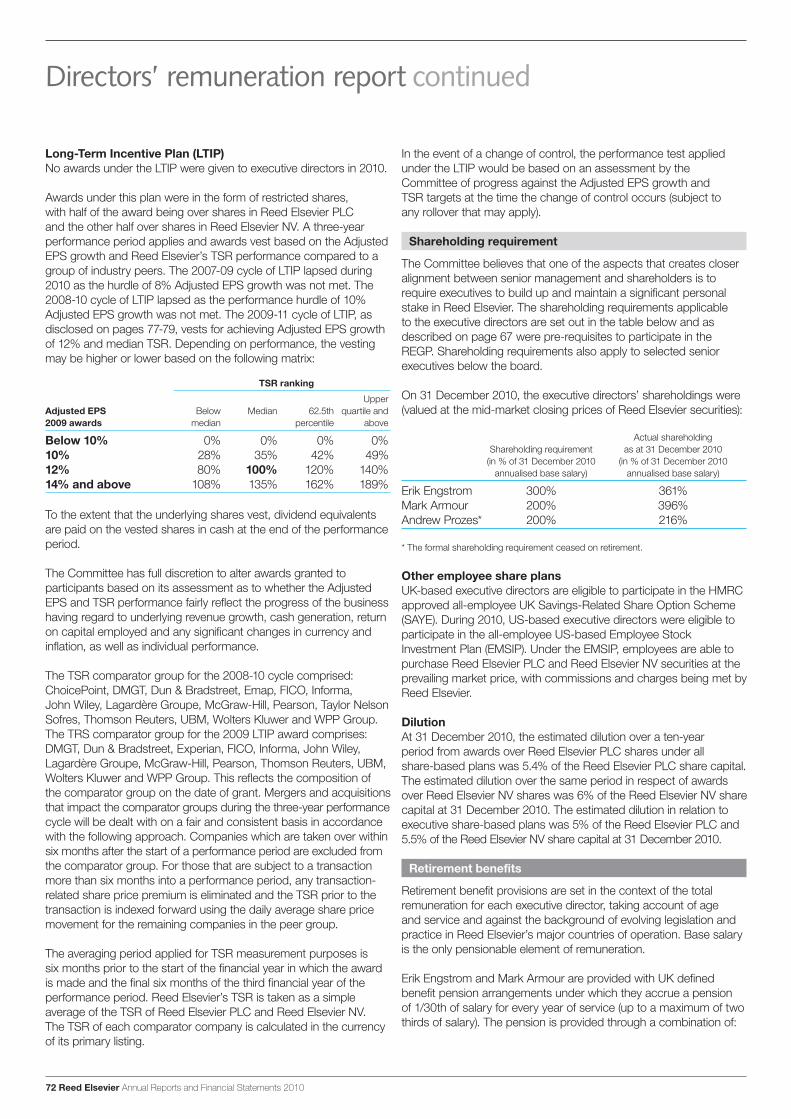
72 Reed Elsevier Annual Reports and Financial Statements 2010
Directors’ remuneration report continued
Long-Term Incentive Plan (LTIP)No awards under the LTIP were given to executive directors in 2010.
Awards under this plan were in the form of restricted shares, with half of the award being over shares in Reed Elsevier PLC and the other half over shares in Reed Elsevier NV. A three-year performance period applies and awards vest based on the Adjusted EPS growth and Reed Elsevier’s TSR performance compared to a group of industry peers. The 2007-09 cycle of LTIP lapsed during 2010 as the hurdle of 8% Adjusted EPS growth was not met. The 2008-10 cycle of LTIP lapsed as the performance hurdle of 10% Adjusted EPS growth was not met. The 2009-11 cycle of LTIP, as disclosed on pages 77-79, vests for achieving Adjusted EPS growth of 12% and median TSR. Depending on performance, the vesting may be higher or lower based on the following matrix:
TSR ranking
Upper Adjusted EPS Below Median 62.5th quartile and 2009 awards median percentile above
Below 10% 0% 0% 0% 0% 10% 28% 35% 42% 49%12% 80% 100% 120% 140% 14% and above 108% 135% 162% 189%
To the extent that the underlying shares vest, dividend equivalents are paid on the vested shares in cash at the end of the performance period.
The Committee has full discretion to alter awards granted to participants based on its assessment as to whether the Adjusted EPS and TSR performance fairly reflect the progress of the business having regard to underlying revenue growth, cash generation, return on capital employed and any significant changes in currency and inflation, as well as individual performance.
The TSR comparator group for the 2008-10 cycle comprised: ChoicePoint, DMGT, Dun & Bradstreet, Emap, FICO, Informa, John Wiley, Lagardère Groupe, McGraw-Hill, Pearson, Taylor Nelson Sofres, Thomson Reuters, UBM, Wolters Kluwer and WPP Group. The TRS comparator group for the 2009 LTIP award comprises: DMGT, Dun & Bradstreet, Experian, FICO, Informa, John Wiley, Lagardère Groupe, McGraw-Hill, Pearson, Thomson Reuters, UBM, Wolters Kluwer and WPP Group. This reflects the composition of the comparator group on the date of grant. Mergers and acquisitions that impact the comparator groups during the three-year performance cycle will be dealt with on a fair and consistent basis in accordance with the following approach. Companies which are taken over within six months after the start of a performance period are excluded from the comparator group. For those that are subject to a transaction more than six months into a performance period, any transaction-related share price premium is eliminated and the TSR prior to the transaction is indexed forward using the daily average share price movement for the remaining companies in the peer group.
The averaging period applied for TSR measurement purposes is six months prior to the start of the financial year in which the award is made and the final six months of the third financial year of the performance period. Reed Elsevier’s TSR is taken as a simple average of the TSR of Reed Elsevier PLC and Reed Elsevier NV. The TSR of each comparator company is calculated in the currency of its primary listing.
In the event of a change of control, the performance test applied under the LTIP would be based on an assessment by the Committee of progress against the Adjusted EPS growth and TSR targets at the time the change of control occurs (subject to any rollover that may apply).
Shareholding requirement
The Committee believes that one of the aspects that creates closer alignment between senior management and shareholders is to require executives to build up and maintain a significant personal stake in Reed Elsevier. The shareholding requirements applicable to the executive directors are set out in the table below and as described on page 67 were pre-requisites to participate in the REGP. Shareholding requirements also apply to selected senior executives below the board.
On 31 December 2010, the executive directors’ shareholdings were (valued at the mid-market closing prices of Reed Elsevier securities):
Actual shareholding Shareholding requirement as at 31 December 2010
(in % of 31 December 2010 (in % of 31 December 2010 annualised base salary) annualised base salary)
Erik Engstrom 300% 361% Mark Armour 200% 396% Andrew Prozes* 200% 216%
* The formal shareholding requirement ceased on retirement.
Other employee share plansUK-based executive directors are eligible to participate in the HMRC approved all-employee UK Savings-Related Share Option Scheme (SAYE). During 2010, US-based executive directors were eligible to participate in the all-employee US-based Employee Stock Investment Plan (EMSIP). Under the EMSIP, employees are able to purchase Reed Elsevier PLC and Reed Elsevier NV securities at the prevailing market price, with commissions and charges being met by Reed Elsevier.
DilutionAt 31 December 2010, the estimated dilution over a ten-year period from awards over Reed Elsevier PLC shares under all share-based plans was 5.4% of the Reed Elsevier PLC share capital. The estimated dilution over the same period in respect of awards over Reed Elsevier NV shares was 6% of the Reed Elsevier NV share capital at 31 December 2010. The estimated dilution in relation to executive share-based plans was 5% of the Reed Elsevier PLC and 5.5% of the Reed Elsevier NV share capital at 31 December 2010.
Retirement benefits
Retirement benefit provisions are set in the context of the total remuneration for each executive director, taking account of age and service and against the background of evolving legislation and practice in Reed Elsevier’s major countries of operation. Base salary is the only pensionable element of remuneration.
Erik Engstrom and Mark Armour are provided with UK defined benefit pension arrangements under which they accrue a pension of 1/30th of salary for every year of service (up to a maximum of two thirds of salary). The pension is provided through a combination of:
47213_Text_p056-084.indd 72 2/3/11 21:57:05
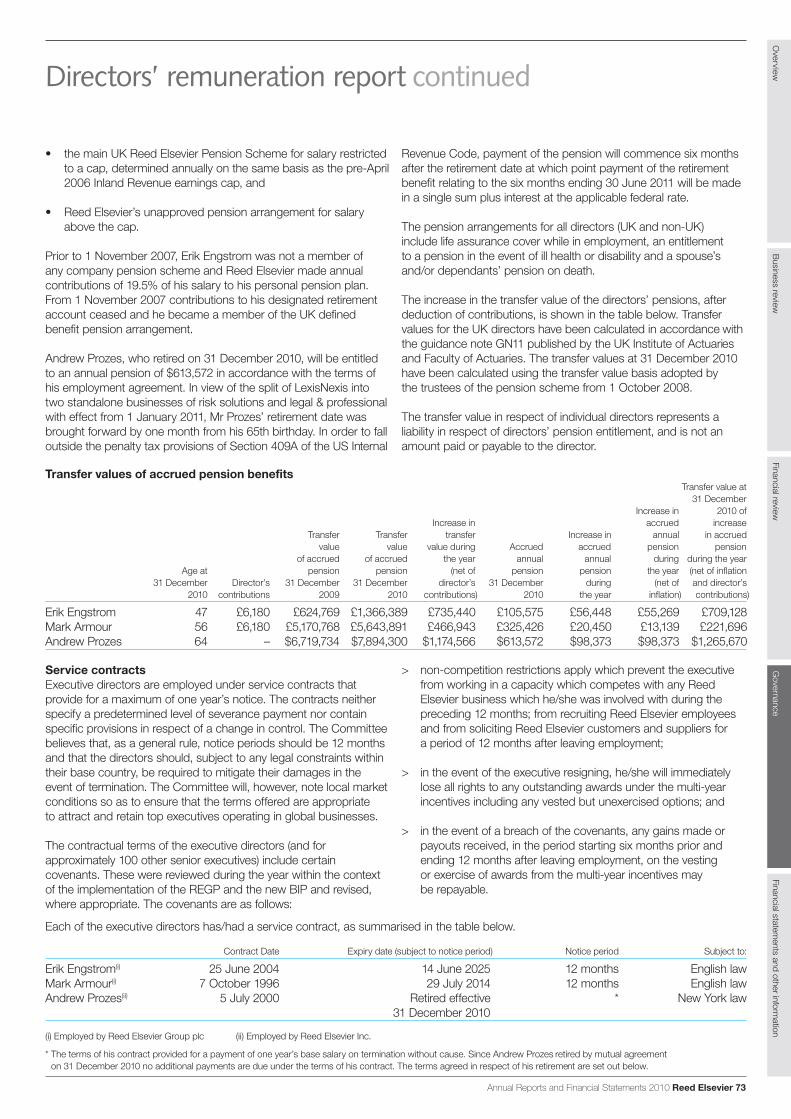
Annual Reports and Financial Statements 2010 Reed Elsevier 73
Directors’ remuneration report continued
Transfer values of accrued pension benefits Transfer value at 31 December Increase in 2010 of Increase in accrued increase Transfer Transfer transfer Increase in annual in accrued value value value during Accrued accrued pension pension of accrued of accrued the year annual annual during during the year Age at pension pension (net of pension pension the year (net of inflation 31 December Director’s 31 December 31 December director’s 31 December during (net of and director’s 2010 contributions 2009 2010 contributions) 2010 the year inflation) contributions)
Erik Engstrom 47 £6,180 £624,769 £1,366,389 £735,440 £105,575 £56,448 £55,269 £709,128Mark Armour 56 £6,180 £5,170,768 £5,643,891 £466,943 £325,426 £20,450 £13,139 £221,696Andrew Prozes 64 – $6,719,734 $7,894,300 $1,174,566 $613,572 $98,373 $98,373 $1,265,670
Each of the executive directors has/had a service contract, as summarised in the table below.
Contract Date Expiry date (subject to notice period) Notice period Subject to:
Erik Engstrom(i) 25 June 2004 14 June 2025 12 months English lawMark Armour(i) 7 October 1996 29 July 2014 12 months English lawAndrew Prozes(ii) 5 July 2000 Retired effective * New York law 31 December 2010
(i) Employed by Reed Elsevier Group plc (ii) Employed by Reed Elsevier Inc.
* The terms of his contract provided for a payment of one year’s base salary on termination without cause. Since Andrew Prozes retired by mutual agreement on 31 December 2010 no additional payments are due under the terms of his contract. The terms agreed in respect of his retirement are set out below.
Overview
Business review
Financial reviewG
overnanceFinancial statem
ents and other information
to a cap, determined annually on the same basis as the pre-April 2006 Inland Revenue earnings cap, and
above the cap.
Prior to 1 November 2007, Erik Engstrom was not a member of any company pension scheme and Reed Elsevier made annual contributions of 19.5% of his salary to his personal pension plan. From 1 November 2007 contributions to his designated retirement
benefit pension arrangement.
Andrew Prozes, who retired on 31 December 2010, will be entitled to an annual pension of $613,572 in accordance with the terms of his employment agreement. In view of the split of LexisNexis into two standalone businesses of risk solutions and legal & professional with effect from 1 January 2011, Mr Prozes’ retirement date was brought forward by one month from his 65th birthday. In order to fall
Revenue Code, payment of the pension will commence six months after the retirement date at which point payment of the retirement benefit relating to the six months ending 30 June 2011 will be made in a single sum plus interest at the applicable federal rate.
include life assurance cover while in employment, an entitlement to a pension in the event of ill health or disability and a spouse’s and/or dependants’ pension on death.
The increase in the transfer value of the directors’ pensions, after deduction of contributions, is shown in the table below. Transfer
and Faculty of Actuaries. The transfer values at 31 December 2010 have been calculated using the transfer value basis adopted by the trustees of the pension scheme from 1 October 2008.
The transfer value in respect of individual directors represents a liability in respect of directors’ pension entitlement, and is not an amount paid or payable to the director.
Service contractsExecutive directors are employed under service contracts that provide for a maximum of one year’s notice. The contracts neither specify a predetermined level of severance payment nor contain specific provisions in respect of a change in control. The Committee believes that, as a general rule, notice periods should be 12 months and that the directors should, subject to any legal constraints within their base country, be required to mitigate their damages in the event of termination. The Committee will, however, note local market conditions so as to ensure that the terms offered are appropriate to attract and retain top executives operating in global businesses.
The contractual terms of the executive directors (and for approximately 100 other senior executives) include certain covenants. These were reviewed during the year within the context of the implementation of the REGP and the new BIP and revised, where appropriate. The covenants are as follows:
> non-competition restrictions apply which prevent the executive from working in a capacity which competes with any Reed Elsevier business which he/she was involved with during the preceding 12 months; from recruiting Reed Elsevier employees and from soliciting Reed Elsevier customers and suppliers for a period of 12 months after leaving employment;
> in the event of the executive resigning, he/she will immediately lose all rights to any outstanding awards under the multi-year incentives including any vested but unexercised options; and
> in the event of a breach of the covenants, any gains made or payouts received, in the period starting six months prior and ending 12 months after leaving employment, on the vesting or exercise of awards from the multi-year incentives may be repayable.
47213_Text_p056-084.indd 73 2/3/11 21:57:43
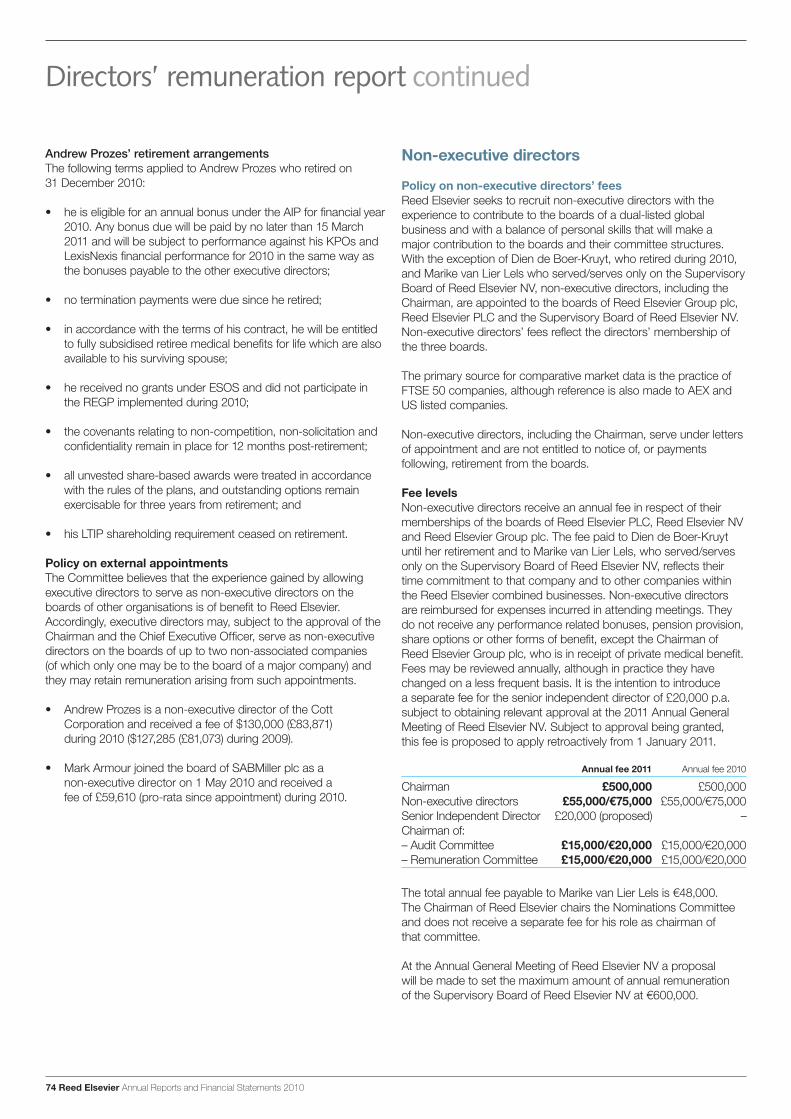
74 Reed Elsevier Annual Reports and Financial Statements 2010
Directors’ remuneration report continued
Andrew Prozes’ retirement arrangementsThe following terms applied to Andrew Prozes who retired on 31 December 2010:
2010. Any bonus due will be paid by no later than 15 March 2011 and will be subject to performance against his KPOs and LexisNexis financial performance for 2010 in the same way as the bonuses payable to the other executive directors;
to fully subsidised retiree medical benefits for life which are also available to his surviving spouse;
the REGP implemented during 2010;
confidentiality remain in place for 12 months post-retirement;
with the rules of the plans, and outstanding options remain exercisable for three years from retirement; and
Policy on external appointmentsThe Committee believes that the experience gained by allowing executive directors to serve as non-executive directors on the boards of other organisations is of benefit to Reed Elsevier. Accordingly, executive directors may, subject to the approval of the Chairman and the Chief Executive Officer, serve as non-executive directors on the boards of up to two non-associated companies (of which only one may be to the board of a major company) and they may retain remuneration arising from such appointments.
Corporation and received a fee of $130,000 (£83,871) during 2010 ($127,285 (£81,073) during 2009).
non-executive director on 1 May 2010 and received a fee of £59,610 (pro-rata since appointment) during 2010.
Non-executive directors
Policy on non-executive directors’ feesReed Elsevier seeks to recruit non-executive directors with the experience to contribute to the boards of a dual-listed global business and with a balance of personal skills that will make a major contribution to the boards and their committee structures. With the exception of Dien de Boer-Kruyt, who retired during 2010, and Marike van Lier Lels who served/serves only on the Supervisory Board of Reed Elsevier NV, non-executive directors, including the Chairman, are appointed to the boards of Reed Elsevier Group plc, Reed Elsevier PLC and the Supervisory Board of Reed Elsevier NV. Non-executive directors’ fees reflect the directors’ membership of the three boards.
The primary source for comparative market data is the practice of FTSE 50 companies, although reference is also made to AEX and US listed companies.
Non-executive directors, including the Chairman, serve under letters of appointment and are not entitled to notice of, or payments following, retirement from the boards.
Fee levelsNon-executive directors receive an annual fee in respect of their memberships of the boards of Reed Elsevier PLC, Reed Elsevier NV and Reed Elsevier Group plc. The fee paid to Dien de Boer-Kruyt until her retirement and to Marike van Lier Lels, who served/serves only on the Supervisory Board of Reed Elsevier NV, reflects their time commitment to that company and to other companies within the Reed Elsevier combined businesses. Non-executive directors are reimbursed for expenses incurred in attending meetings. They do not receive any performance related bonuses, pension provision, share options or other forms of benefit, except the Chairman of Reed Elsevier Group plc, who is in receipt of private medical benefit. Fees may be reviewed annually, although in practice they have changed on a less frequent basis. It is the intention to introduce a separate fee for the senior independent director of £20,000 p.a. subject to obtaining relevant approval at the 2011 Annual General Meeting of Reed Elsevier NV. Subject to approval being granted, this fee is proposed to apply retroactively from 1 January 2011.
Annual fee 2011 Annual fee 2010
Chairman £500,000 £500,000 Non-executive directors £55,000/!75,000 £55,000/!75,000 Senior Independent Director £20,000 (proposed) – Chairman of: – Audit Committee £15,000/!20,000 £15,000/!20,000 – Remuneration Committee £15,000/!20,000 £15,000/!20,000
The total annual fee payable to Marike van Lier Lels is !48,000. The Chairman of Reed Elsevier chairs the Nominations Committee and does not receive a separate fee for his role as chairman of that committee.
At the Annual General Meeting of Reed Elsevier NV a proposal will be made to set the maximum amount of annual remuneration of the Supervisory Board of Reed Elsevier NV at !600,000.
47213_Text_p056-084.indd 74 1/3/11 10:43:26
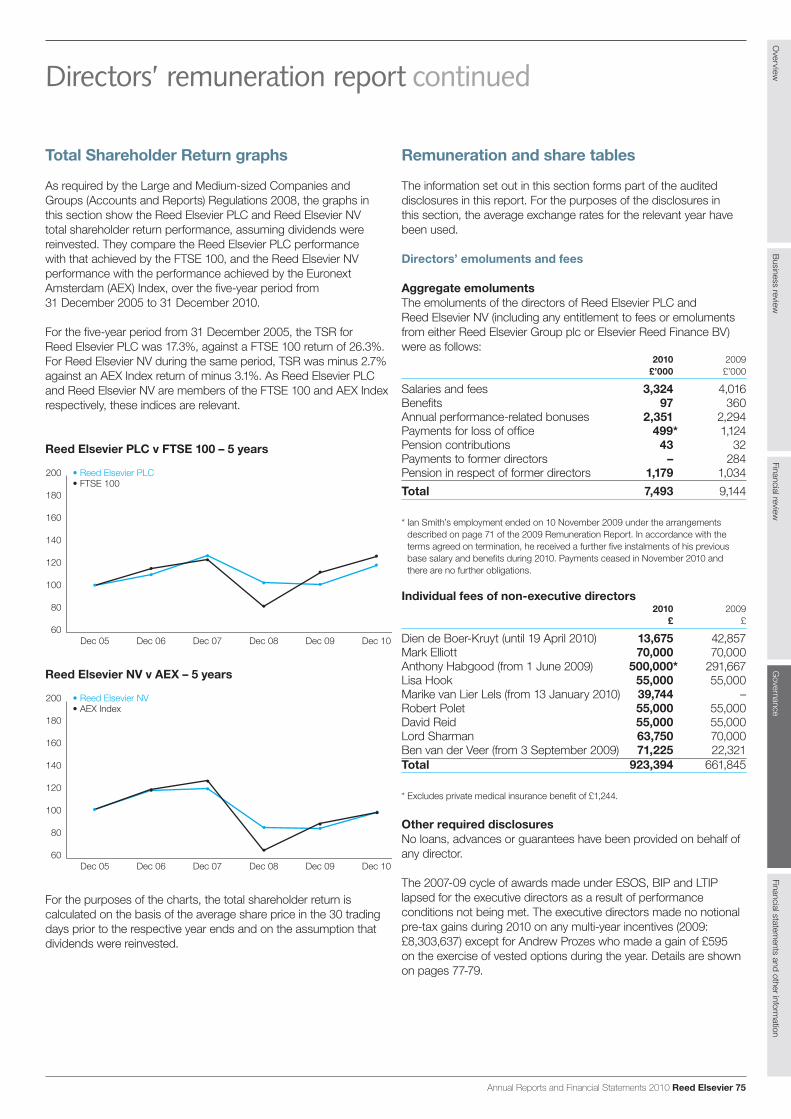
Annual Reports and Financial Statements 2010 Reed Elsevier 75
Directors’ remuneration report continued
Overview
Business review
Financial reviewG
overnanceFinancial statem
ents and other information
Total Shareholder Return graphs
As required by the Large and Medium-sized Companies andGroups (Accounts and Reports) Regulations 2008, the graphs inthis section show the Reed Elsevier PLC and Reed Elsevier NVtotal shareholder return performance, assuming dividends werereinvested. They compare the Reed Elsevier PLC performancewith that achieved by the FTSE 100, and the Reed Elsevier NVperformance with the performance achieved by the EuronextAmsterdam (AEX) Index, over the five-year period from31 December 2005 to 31 December 2010.
For the five-year period from 31 December 2005, the TSR forReed Elsevier PLC was 17.3%, against a FTSE 100 return of 26.3%.For Reed Elsevier NV during the same period, TSR was minus 2.7%against an AEX Index return of minus 3.1%. As Reed Elsevier PLCand Reed Elsevier NV are members of the FTSE 100 and AEX Indexrespectively, these indices are relevant.
Reed Elsevier PLC v FTSE 100 – 5 years
60
80
100
120
140
160
180
200
Dec 05 Dec 06 Dec 07 Dec 08 Dec 09 Dec 10
Reed Elsevier NV v AEX – 5 years
60
80
100
120
140
160
180
200
Dec 05 Dec 06 Dec 07 Dec 08 Dec 09 Dec 10
For the purposes of the charts, the total shareholder return iscalculated on the basis of the average share price in the 30 tradingdays prior to the respective year ends and on the assumption thatdividends were reinvested.
Remuneration and share tables
The information set out in this section forms part of the auditeddisclosures in this report. For the purposes of the disclosures inthis section, the average exchange rates for the relevant year havebeen used.
Directors’ emoluments and fees
Aggregate emolumentsThe emoluments of the directors of Reed Elsevier PLC andReed Elsevier NV (including any entitlement to fees or emolumentsfrom either Reed Elsevier Group plc or Elsevier Reed Finance BV)were as follows:
2010 2009£’000 £’000
Salaries and fees 3,324 4,016Benefits 97 360Annual performance-related bonuses 2,351 2,294Payments for loss of office 499* 1,124Pension contributions 43 32Payments to former directors – 284Pension in respect of former directors 1,179 1,034Total 7,493 9,144
* Ian Smith’s employment ended on 10 November 2009 under the arrangementsdescribed on page 71 of the 2009 Remuneration Report. In accordance with theterms agreed on termination, he received a further five instalments of his previousbase salary and benefits during 2010. Payments ceased in November 2010 andthere are no further obligations.
Individual fees of non-executive directors2010 2009
£ £
Dien de Boer-Kruyt (until 19 April 2010) 13,675 42,857Mark Elliott 70,000 70,000Anthony Habgood (from 1 June 2009) 500,000* 291,667Lisa Hook 55,000 55,000Marike van Lier Lels (from 13 January 2010) 39,744 –Robert Polet 55,000 55,000David Reid 55,000 55,000Lord Sharman 63,750 70,000Ben van der Veer (from 3 September 2009) 71,225 22,321Total 923,394 661,845
* Excludes private medical insurance benefit of £1,244.
Other required disclosuresNo loans, advances or guarantees have been provided on behalf ofany director.
The 2007-09 cycle of awards made under ESOS, BIP and LTIPlapsed for the executive directors as a result of performanceconditions not being met. The executive directors made no notionalpre-tax gains during 2010 on any multi-year incentives (2009:£8,303,637) except for Andrew Prozes who made a gain of £595on the exercise of vested options during the year. Details are shownon pages 77-79.
47213_Text_p056-084.indd 75 1/3/11 10:43:27
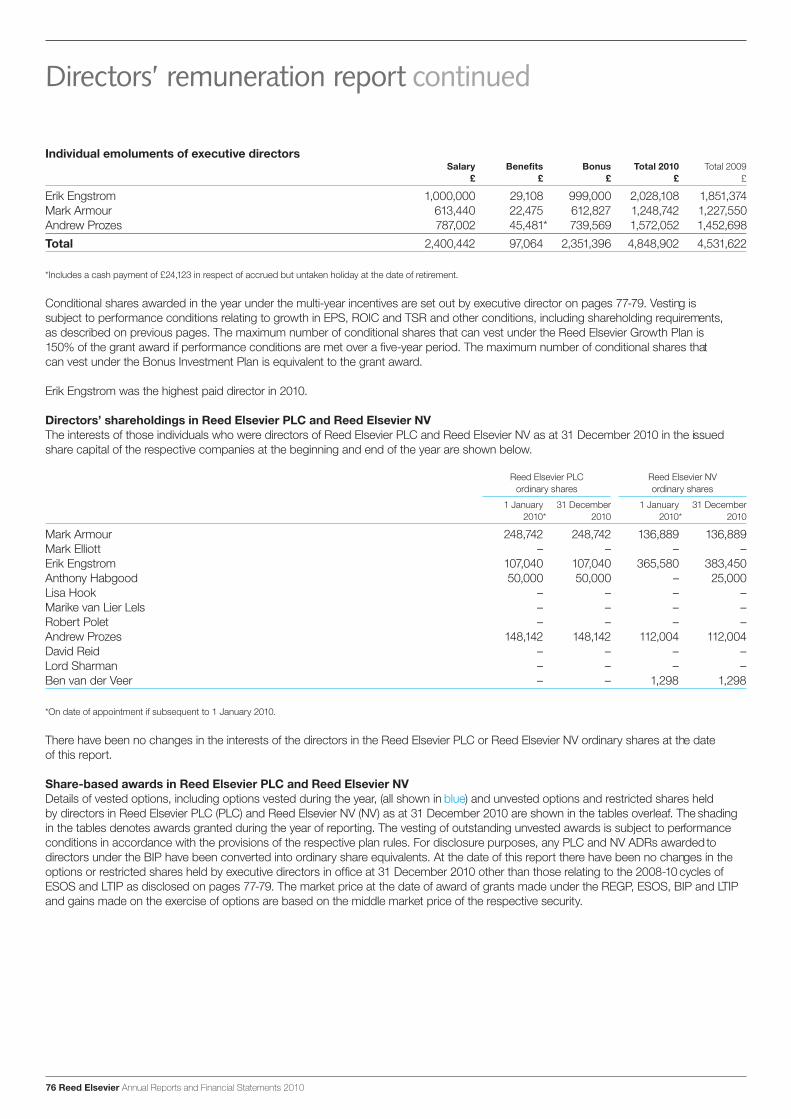
76 Reed Elsevier Annual Reports and Financial Statements 2010
Directors’ remuneration report continued
Individual emoluments of executive directorsSalary Benefits Bonus Total 2010 Total 2009
£ £ £ £ £
Erik Engstrom 1,000,000 29,108 999,000 2,028,108 1,851,374Mark Armour 613,440 22,475 612,827 1,248,742 1,227,550Andrew Prozes 787,002 45,481* 739,569 1,572,052 1,452,698Total 2,400,442 97,064 2,351,396 4,848,902 4,531,622
*Includes a cash payment of £24,123 in respect of accrued but untaken holiday at the date of retirement.
Conditional shares awarded in the year under the multi-year incentives are set out by executive director on pages 77-79. Vesting is subject to performance conditions relating to growth in EPS, ROIC and TSR and other conditions, including shareholding requirements, as described on previous pages. The maximum number of conditional shares that can vest under the Reed Elsevier Growth Plan is 150% of the grant award if performance conditions are met over a five-year period. The maximum number of conditional shares that can vest under the Bonus Investment Plan is equivalent to the grant award.
Erik Engstrom was the highest paid director in 2010.
Directors’ shareholdings in Reed Elsevier PLC and Reed Elsevier NVThe interests of those individuals who were directors of Reed Elsevier PLC and Reed Elsevier NV as at 31 December 2010 in the issued share capital of the respective companies at the beginning and end of the year are shown below.
Reed Elsevier PLC Reed Elsevier NV ordinary shares ordinary shares
1 January 31 December 1 January 31 December 2010* 2010 2010* 2010
Mark Armour 248,742 248,742 136,889 136,889Mark Elliott – – – –Erik Engstrom 107,040 107,040 365,580 383,450Anthony Habgood 50,000 50,000 – 25,000Lisa Hook – – – –Marike van Lier Lels – – – –Robert Polet – – – –Andrew Prozes 148,142 148,142 112,004 112,004David Reid – – – –Lord Sharman – – – –Ben van der Veer – – 1,298 1,298
*On date of appointment if subsequent to 1 January 2010.
There have been no changes in the interests of the directors in the Reed Elsevier PLC or Reed Elsevier NV ordinary shares at the date of this report.
Share-based awards in Reed Elsevier PLC and Reed Elsevier NVDetails of vested options, including options vested during the year, (all shown in blue) and unvested options and restricted shares held by directors in Reed Elsevier PLC (PLC) and Reed Elsevier NV (NV) as at 31 December 2010 are shown in the tables overleaf. The shading in the tables denotes awards granted during the year of reporting. The vesting of outstanding unvested awards is subject to performance conditions in accordance with the provisions of the respective plan rules. For disclosure purposes, any PLC and NV ADRs awarded to directors under the BIP have been converted into ordinary share equivalents. At the date of this report there have been no changes in the options or restricted shares held by executive directors in office at 31 December 2010 other than those relating to the 2008-10 cycles of ESOS and LTIP as disclosed on pages 77-79. The market price at the date of award of grants made under the REGP, ESOS, BIP and LTIP and gains made on the exercise of options are based on the middle market price of the respective security.
47213_Text_p056-084.indd 76 2/3/11 22:37:24
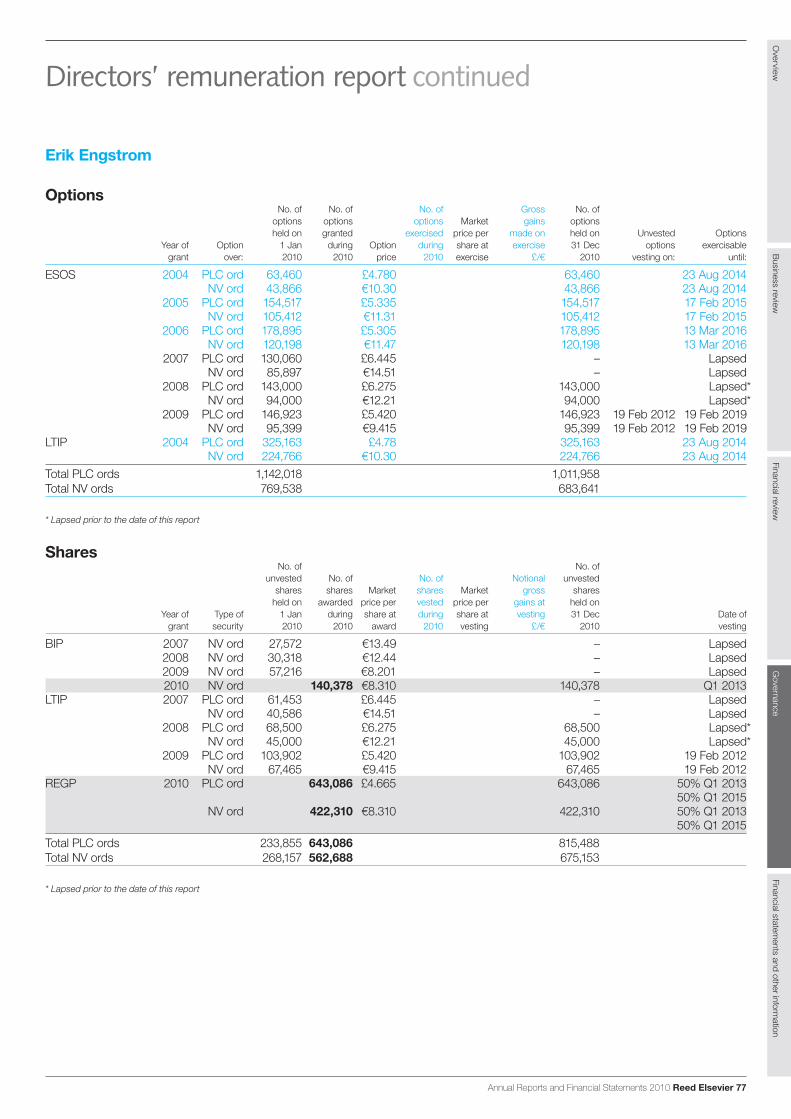
Annual Reports and Financial Statements 2010 Reed Elsevier 77
Directors’ remuneration report continued
Erik Engstrom
OptionsNo. of No. of No. of Gross No. of
options options options Market gains optionsheld on granted exercised price per made on held on Unvested Options
Year of Option 1 Jan during Option during share at exercise 31 Dec options exercisablegrant over: 2010 2010 price 2010 exercise £/! 2010 vesting on: until:
ESOS 2004 PLC ord 63,460 £4.780 63,460 23 Aug 2014NV ord 43,866 !10.30 43,866 23 Aug 2014
2005 PLC ord 154,517 £5.335 154,517 17 Feb 2015NV ord 105,412 !11.31 105,412 17 Feb 2015
2006 PLC ord 178,895 £5.305 178,895 13 Mar 2016NV ord 120,198 !11.47 120,198 13 Mar 2016
2007 PLC ord 130,060 £6.445 – LapsedNV ord 85,897 !14.51 – Lapsed
2008 PLC ord 143,000 £6.275 143,000 Lapsed*NV ord 94,000 !12.21 94,000 Lapsed*
2009 PLC ord 146,923 £5.420 146,923 19 Feb 2012 19 Feb 2019NV ord 95,399 !9.415 95,399 19 Feb 2012 19 Feb 2019
LTIP 2004 PLC ord 325,163 £4.78 325,163 23 Aug 2014NV ord 224,766 !10.30 224,766 23 Aug 2014
Total PLC ords 1,142,018 1,011,958Total NV ords 769,538 683,641
* Lapsed prior to the date of this report
SharesNo. of No. of
unvested No. of No. of Notional unvestedshares shares Market shares Market gross shares
held on awarded price per vested price per gains at held onYear of Type of 1 Jan during share at during share at vesting 31 Dec Date of
grant security 2010 2010 award 2010 vesting £/! 2010 vesting
BIP 2007 NV ord 27,572 !13.49 – Lapsed2008 NV ord 30,318 !12.44 – Lapsed2009 NV ord 57,216 !8.201 – Lapsed2010 NV ord 140,378 !8.310 140,378 Q1 2013
LTIP 2007 PLC ord 61,453 £6.445 – LapsedNV ord 40,586 !14.51 – Lapsed
2008 PLC ord 68,500 £6.275 68,500 Lapsed*NV ord 45,000 !12.21 45,000 Lapsed*
2009 PLC ord 103,902 £5.420 103,902 19 Feb 2012NV ord 67,465 !9.415 67,465 19 Feb 2012
REGP 2010 PLC ord 643,086 £4.665 643,086 50% Q1 201350% Q1 2015
NV ord 422,310 !8.310 422,310 50% Q1 201350% Q1 2015
Total PLC ords 233,855 643,086 815,488Total NV ords 268,157 562,688 675,153
* Lapsed prior to the date of this report
Overview
Business review
Financial reviewG
overnanceFinancial statem
ents and other information
47213_Text_p056-084.indd 77 1/3/11 10:43:28
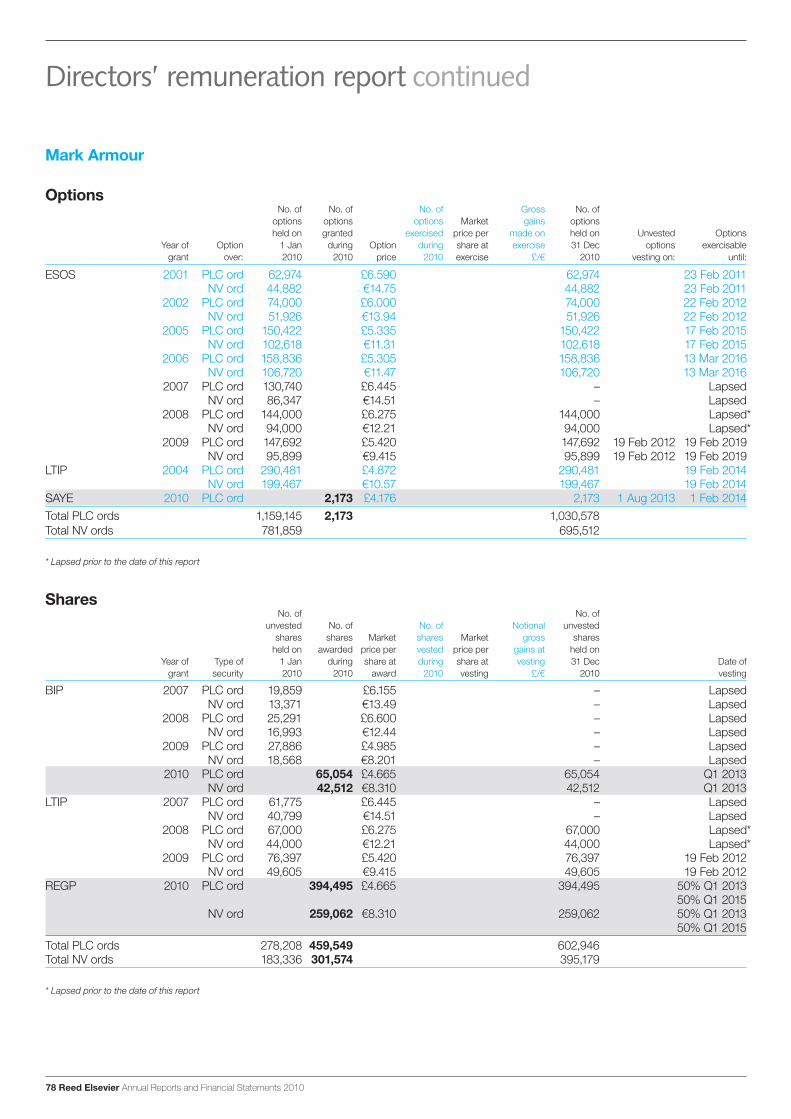
78 Reed Elsevier Annual Reports and Financial Statements 2010
Directors’ remuneration report continued
Mark Armour
OptionsNo. of No. of No. of Gross No. of
options options options Market gains optionsheld on granted exercised price per made on held on Unvested Options
Year of Option 1 Jan during Option during share at exercise 31 Dec options exercisablegrant over: 2010 2010 price 2010 exercise £/! 2010 vesting on: until:
ESOS 2001 PLC ord 62,974 £6.590 62,974 23 Feb 2011NV ord 44,882 !14.75 44,882 23 Feb 2011
2002 PLC ord 74,000 £6.000 74,000 22 Feb 2012NV ord 51,926 !13.94 51,926 22 Feb 2012
2005 PLC ord 150,422 £5.335 150,422 17 Feb 2015NV ord 102,618 !11.31 102,618 17 Feb 2015
2006 PLC ord 158,836 £5.305 158,836 13 Mar 2016NV ord 106,720 !11.47 106,720 13 Mar 2016
2007 PLC ord 130,740 £6.445 – LapsedNV ord 86,347 !14.51 – Lapsed
2008 PLC ord 144,000 £6.275 144,000 Lapsed*NV ord 94,000 !12.21 94,000 Lapsed*
2009 PLC ord 147,692 £5.420 147,692 19 Feb 2012 19 Feb 2019NV ord 95,899 !9.415 95,899 19 Feb 2012 19 Feb 2019
LTIP 2004 PLC ord 290,481 £4.872 290,481 19 Feb 2014NV ord 199,467 !10.57 199,467 19 Feb 2014
SAYE 2010 PLC ord 2,173 £4.176 2,173 1 Aug 2013 1 Feb 2014Total PLC ords 1,159,145 2,173 1,030,578Total NV ords 781,859 695,512
* Lapsed prior to the date of this report
SharesNo. of No. of
unvested No. of No. of Notional unvestedshares shares Market shares Market gross shares
held on awarded price per vested price per gains at held onYear of Type of 1 Jan during share at during share at vesting 31 Dec Date of
grant security 2010 2010 award 2010 vesting £/! 2010 vesting
BIP 2007 PLC ord 19,859 £6.155 – LapsedNV ord 13,371 !13.49 – Lapsed
2008 PLC ord 25,291 £6.600 – LapsedNV ord 16,993 !12.44 – Lapsed
2009 PLC ord 27,886 £4.985 – LapsedNV ord 18,568 !8.201 – Lapsed
2010 PLC ord 65,054 £4.665 65,054 Q1 2013NV ord 42,512 !8.310 42,512 Q1 2013
LTIP 2007 PLC ord 61,775 £6.445 – LapsedNV ord 40,799 !14.51 – Lapsed
2008 PLC ord 67,000 £6.275 67,000 Lapsed*NV ord 44,000 !12.21 44,000 Lapsed*
2009 PLC ord 76,397 £5.420 76,397 19 Feb 2012NV ord 49,605 !9.415 49,605 19 Feb 2012
REGP 2010 PLC ord 394,495 £4.665 394,495 50% Q1 201350% Q1 2015
NV ord 259,062 !8.310 259,062 50% Q1 201350% Q1 2015
Total PLC ords 278,208 459,549 602,946Total NV ords 183,336 301,574 395,179
* Lapsed prior to the date of this report
47213_Text_p056-084.indd 78 1/3/11 10:43:28
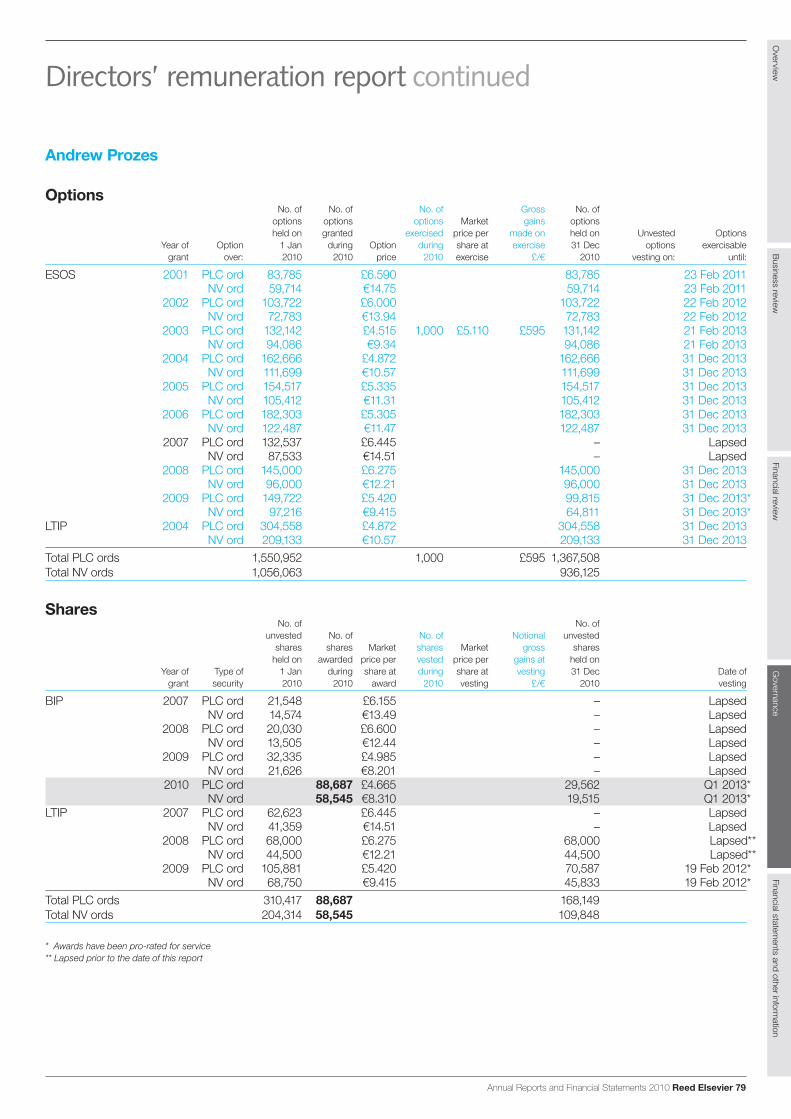
Annual Reports and Financial Statements 2010 Reed Elsevier 79
Directors’ remuneration report continued
Andrew Prozes
Options No. of No. of No. of Gross No. of options options options Market gains options held on granted exercised price per made on held on Unvested Options Year of Option 1 Jan during Option during share at exercise 31 Dec options exercisable grant over: 2010 2010 price 2010 exercise £/! 2010 vesting on: until:
ESOS 2001 PLC ord 83,785 £6.590 83,785 23 Feb 2011 NV ord 59,714 !14.75 59,714 23 Feb 2011 2002 PLC ord 103,722 £6.000 103,722 22 Feb 2012 NV ord 72,783 !13.94 72,783 22 Feb 2012 2003 PLC ord 132,142 £4.515 1,000 £5.110 £595 131,142 21 Feb 2013 NV ord 94,086 !9.34 94,086 21 Feb 2013 2004 PLC ord 162,666 £4.872 162,666 31 Dec 2013 NV ord 111,699 !10.57 111,699 31 Dec 2013 2005 PLC ord 154,517 £5.335 154,517 31 Dec 2013 NV ord 105,412 !11.31 105,412 31 Dec 2013 2006 PLC ord 182,303 £5.305 182,303 31 Dec 2013 NV ord 122,487 !11.47 122,487 31 Dec 2013 2007 PLC ord 132,537 £6.445 – Lapsed NV ord 87,533 !14.51 – Lapsed 2008 PLC ord 145,000 £6.275 145,000 31 Dec 2013 NV ord 96,000 !12.21 96,000 31 Dec 2013 2009 PLC ord 149,722 £5.420 99,815 31 Dec 2013* NV ord 97,216 !9.415 64,811 31 Dec 2013*LTIP 2004 PLC ord 304,558 £4.872 304,558 31 Dec 2013 NV ord 209,133 !10.57 209,133 31 Dec 2013Total PLC ords 1,550,952 1,000 £595 1,367,508Total NV ords 1,056,063 936,125
Shares No. of No. of unvested No. of No. of Notional unvested shares shares Market shares Market gross shares held on awarded price per vested price per gains at held on Year of Type of 1 Jan during share at during share at vesting 31 Dec Date of grant security 2010 2010 award 2010 vesting £/! 2010 vesting
BIP 2007 PLC ord 21,548 £6.155 – Lapsed NV ord 14,574 !13.49 – Lapsed 2008 PLC ord 20,030 £6.600 – Lapsed NV ord 13,505 !12.44 – Lapsed 2009 PLC ord 32,335 £4.985 – Lapsed NV ord 21,626 !8.201 – Lapsed 2010 PLC ord 88,687 £4.665 29,562 Q1 2013* NV ord 58,545 !8.310 19,515 Q1 2013*LTIP 2007 PLC ord 62,623 £6.445 – Lapsed NV ord 41,359 !14.51 – Lapsed 2008 PLC ord 68,000 £6.275 68,000 Lapsed** NV ord 44,500 !12.21 44,500 Lapsed** 2009 PLC ord 105,881 £5.420 70,587 19 Feb 2012* NV ord 68,750 !9.415 45,833 19 Feb 2012*Total PLC ords 310,417 88,687 168,149Total NV ords 204,314 58,545 109,848
* Awards have been pro-rated for service** Lapsed prior to the date of this report
Overview
Business review
Financial reviewG
overnanceFinancial statem
ents and other information
47213_Text_p056-084.indd 79 2/3/11 22:21:21

Directors’ remuneration report continued
Other required disclosures in respect of share-based awardsThe number of shares and options that vest in respect of all outstanding (unvested) awards under the multi-year incentives depend on the extent to which performance conditions are met.
In respect of the REGP, the maximum number of shares that can vest is 150% of the number of shares shown in the tables above. In respect of ESOS and BIP, the number of awards shown in the table is the maximum capable of vesting. ESOS awards vest on the third anniversary and expire on the tenth anniversary of the date of grant. For LTIP, the number of shares shown in the share tables reflects the target award. The target award under the 2009-11 cycle of LTIP vests for achieving Adjusted EPS growth of 12% and median TSR relative to an industry comparator group. Depending on actual Adjusted EPS growth and TSR, the proportion of the target award that may vest could be lower or higher. The maximum that can potentially vest in respect of these awards is 189% of the number of shares comprised in the target awards shown in the tables above.
Options under the SAYE scheme, in which all eligible UK employees are invited to participate, are granted at a maximum discount of 20% to the market price at time of grant. They are normally exercisable after the expiry of three or five years from the date of grant. No performance targets are attached to these option grants as the SAYE is an all-employee scheme.
The middle market price of a Reed Elsevier PLC ordinary share at the date of award of grants under the REGP and BIP was £4.665. The middle market price of a Reed Elsevier NV ordinary share at the date of award of grants under the REGP and BIP was !8.31.
The middle market price of a Reed Elsevier PLC ordinary share during the year was in the range of £4.606 to £5.63 and at 31 December 2010 was £5.415. The middle market price of a Reed Elsevier NV ordinary share during the year was in the range of !8.174 to !10.115 and at 31 December 2010 was !9.257.
Employee Benefit TrustAny securities required to satisfy entitlements under the REGP, LTIP and BIP are provided by the Employee Benefit Trust (EBT) from market purchases. As a potential beneficiary under the EBT in the same way as other employees of Reed Elsevier, each executive director is deemed to be interested in all the shares held by the EBT which, at 31 December 2010, amounted to 14,654,161 Reed Elsevier PLC ordinary shares (1.17% of issued share capital) and 7,781,790 Reed Elsevier NV ordinary shares (1.01% of issued share capital). These numbers include ordinary share equivalents held in the form of Reed Elsevier PLC ADRs and Reed Elsevier NV ADRs.
Approved by the Board of Reed Elsevier Group plc on 16 February 2011.
Mark ElliottChairman of the Remuneration Committee
Approved by the Board of Reed Elsevier PLC on 16 February 2011
Mark ElliottNon-Executive Director
Approved by the Combined Board of Reed Elsevier NV on 16 February 2011
Mark ElliottMember of the Supervisory Board
80 Reed Elsevier Annual Reports and Financial Statements 2010
47213_Text_p056-084.indd 80 1/3/11 10:43:28
This report has been prepared by the Audit Committees of Reed Elsevier PLC and Reed Elsevier NV in conjunction with the Audit Committee of Reed Elsevier Group plc (the Committees) and has been approved by the respective boards.
The report meets the requirements of the UK Corporate Governance Code, issued by the UK Financial Reporting Council, and the Dutch Corporate Governance Code, issued by Dutch Corporate Governance Code Monitoring Committee.
Audit CommitteesThe main role and responsibilities of the Committees in relation to the respective companies are set out in written terms of reference and include:
(i) to monitor the integrity of the financial statements of the company, and any formal announcements relating to the company’s financial performance, reviewing significant financial reporting judgements contained in them;
(ii) to review the company’s internal financial controls and the company’s internal control and risk management systems;
(iii) to monitor and review the effectiveness of the company’s internal audit function;
(iv) to make recommendations to the board, for it to put to the shareholders for their approval in general meeting, in relation to the appointment, reappointment and removal of the external auditor and to approve the remuneration and terms of engagement of the external auditor;
(v) to review and monitor the external auditors’ independence and objectivity and the effectiveness of the audit process, taking into consideration relevant professional and regulatory requirements; and
(vi) to develop and recommend policy on the engagement of the external auditor to supply non audit services, taking into account relevant ethical guidance regarding the provision of non audit services by the external audit firm, and to monitor compliance.
The Committees report to the respective boards on their activities identifying any matters in respect of which they consider that action or improvement is needed and making recommendations as to the steps to be taken.
The Reed Elsevier Group plc Audit Committee fulfils this role in respect of the publishing and information operating business. The functions of an audit committee in respect of the financing activities are carried out by the Supervisory Board of Elsevier Reed Finance BV. The Reed Elsevier PLC and Reed Elsevier NV Audit Committees fulfil their roles from the perspective of the parent companies and both Committees have access to the reports to and the work of the Reed Elsevier Group plc Audit Committee and the Elsevier Reed Finance BV Supervisory Board in this respect.
The Committees have explicit authority to investigate any matters within their terms of reference and have access to all resources and information that they may require for this purpose. The Committees are entitled to obtain legal and other independent professional advice and have the authority to approve all fees payable to such advisers.
The terms of reference of each Audit Committee are reviewed annually and a copy of each is published on the Reed Elsevier website, www.reedelsevier.com.
Committee membershipThe Committees each comprise at least three independent non-executive directors. The members of each of the Committees that served during the year are: Ben van der Veer (Chairman of the Committees from August 2010), Lord Sharman (Chairman of the Committees until August 2010), Lisa Hook and David Reid. Lord Sharman and David Reid, both UK chartered accountants, and Ben van der Veer, a registered accountant in the Netherlands, are considered to have significant, recent and relevant financial experience. Lord Sharman will retire as a member of the Committees in April 2011. Biographies of the members of each of the Committees are set out on page 55.
Appointments to the Committees are made on the recommendation of the Nominations Committee and are for periods of up to three years, extendable by no more than two additional three-year periods, so long as the member continues to be independent. Details of the remuneration policy in respect of members of the Committees and the remuneration paid to members for the year ended 31 December 2010 are set out in the Directors’ Remuneration Report on pages 62 to 80.
Annual Reports and Financial Statements 2010 Reed Elsevier 81
Report of the Audit Committees
Overview
Business review
Financial reviewG
overnanceFinancial statem
ents and other information
47213_Text_p056-084.indd 81 1/3/11 10:43:29
Committee activitiesThe Committees hold meetings five times a year: in January, February, June, July and December, and reports on these meetings are made to the respective boards at the next board meetings. The principal business of these meetings typically includes:
– January: review of critical accounting policies and practices, and significant financial reporting issues and judgements arising in connection with the annual financial statements, including appropriateness of the going concern assumption; review of risk management activities, compliance and internal control effectiveness; reviewing and approving the internal audit plan; review of internal audit findings; review of the Reed Elsevier policy on auditor independence and the fees paid to the external auditor for audit and non audit services;
– February: review and recommending for approval to the Boards of annual financial statements, results announcement, annual report on Form 20-F and related formal statements; review of external audit findings;
– June: monitoring and assessing the qualification, performance, expertise, resources, objectivity and independence of the external auditors and the effectiveness of the external audit process; agreeing the external audit plan; reviewing significant financial reporting issues and judgements arising in connection with the interim financial statements; review of significant external financial reporting and regulatory developments; review of tax policies: review of compliance activities; review of report from external auditors on control matters; review of internal audit findings;
– July: review of critical accounting policies and practices, and significant financial reporting issues and judgements arising in connection with the interim financial statements, including appropriateness of the going concern assumption; review and recommending for approval to the Boards of the interim financial statements, results announcement and related formal statements; review of external audit findings; review of risk management activities and internal audit findings; review and approval of the external audit engagement letters; review of estimated external audit fees;
– December: review of year end financial reporting and accounting issues; review of significant external financial reporting and regulatory developments; review of external audit findings to date; review of internal audit findings; review of the terms of reference and effectiveness of internal audit; review of the terms of reference of the Audit Committees.
The Audit Committee meetings are typically attended by the Chief Financial Officer, the Reed Elsevier Group plc group financial controller, chief risk officer and director of internal audit, and audit partners of the external auditors. From time to time the Chairman and Chief Executive Officer may attend the Audit Committee meetings. Additionally, the managing director and senior representatives of the external auditors of Elsevier Reed Finance BV attend the July and February meetings of the parent company Audit Committees. At least one meeting each year, the Committees meet separately with the external auditors without management present. The Chairman of the Audit Committees has at least one separate meeting each year with the director of internal audit.
In discharging their principal responsibilities in respect of the 2010 financial year, the Committees have:
(i) received and discussed reports from the Reed Elsevier Group plc group financial controller that set out areas of significance in the preparation of the financial statements, including: review of the carrying values of goodwill and intangible assets for possible impairment, review of estimated useful lives of intangible assets, accounting for pensions and related assumptions, accounting for share based remuneration and related assumptions, review of the carrying value of investments, accounting treatment for acquisitions and disposals and business restructuring, application of revenue recognition and cost capitalisation policies, accounting for derivatives, review of tax reserves and provisions for lease obligations, and the use of the going concern basis in the preparation of the financial statements. Areas of focus in 2010 were the accounting and judgements in respect of: the carrying value of goodwill and intangible assets, taking into account the effects of the recent global recession and subsequent economic environment on business performance; revenue recognition and cost capitalisation as business models evolve from print publications to online services; accounting for the sale and/or closure of a number of Reed Business Information titles and businesses; tax provisioning; and the recognition of liabilities arising from the restructuring programmes and lease obligations.
(ii) reviewed the critical accounting policies and compliance with applicable accounting standards and other disclosure requirements and received regular update reports on accounting and regulatory developments.
Report of the Audit Committees continued
82 Reed Elsevier Annual Reports and Financial Statements 2010
47213_Text_p056-084.indd 82 1/3/11 10:43:29
(iii) received and discussed regular reports on the management of material risks and reviewed the effectiveness of the systems of internal control. As part of this review, detailed internal control evaluation and certification is obtained from management across the operating businesses, reviewed by internal audit and discussed with the Committees.
(iv) received and discussed regular reports from the Reed Elsevier Group plc chief risk officer and director of internal audit summarising the status of the Reed Elsevier risk management activities and the findings from internal audit reviews and the actions agreed with management. Areas of focus in 2010 included: project management of development spend, particularly in relation to the significant product and infrastructure investment in the US legal business; restructuring and acquisition integration activities, notably in the restructuring of Reed Business Information and the integration of the ChoicePoint acquisition within LexisNexis Risk Solutions; regulatory compliance and review of information security; business continuity planning; and continued compliance with the requirements of Section 404 of the US Sarbanes-Oxley Act relating to the documentation and testing of internal controls over financial reporting.
(v) reviewed and approved the internal audit plan for 2010 and monitored execution, including progress in respect of recommendations made. Reviewed the resources, budget and effectiveness of the internal audit function.
(vi) received presentations from the Reed Elsevier vice president compliance on the compliance programme, including the operation of Reed Elsevier’s codes of conduct, training programmes and whistleblowing arrangements; and from the LexisNexis senior vice president, privacy, security and compliance on management of data privacy, security and compliance.
(vii) received regular updates from the Chief Financial Officer on developments within the finance function.
Ben van der Veer, Lisa Hook and David Reid attended all five meetings of the Committees in 2010. Lord Sharman attended four meetings.
The external auditors have attended all meetings of the Committees. They have provided written reports at the February, June, July and December meetings summarising the most significant findings from their audit work. These reports have been discussed by the Committees and actions agreed where necessary.
External auditor independence and audit effectivenessThe Audit Committees have the delegated responsibility for reviewing the effectiveness of the external audit and overseeing the independence and objectivity of the auditors. Reed Elsevier has a well established policy on audit effectiveness and independence of auditors that sets out inter alia: the responsibilities of the Audit Committee in the selection of auditors to be proposed for appointment or reappointment at the annual general meeting and for agreement on the terms of their engagement and the scope of the annual audit; the auditor independence requirements and the policy on the provision of non audit services; the rotation of audit partners and staff; and the conduct of meetings between the auditors and the Audit Committee. The policy is available on the Reed Elsevier website, www.reedelsevier.com.
Under the policy, the auditors are precluded from engaging in non audit services that would compromise their independence or violate any professional requirements or regulations affecting their appointment as auditors. In general, the auditors may not provide a service which creates a mutuality of interest; places the auditor in a position to audit their own work; results in the auditor acting in a capacity akin to that of a company manager or employee; or puts the auditor in the role of advocate for the company. The policy sets out specific services that may not be provided by the auditors. The auditors may provide non audit services which do not conflict with their independence where their skills and experience make them a logical supplier of the services, and subject to pre-approval by the Audit Committee. The Committees have reviewed and agreed the non audit services provided in 2010 by the external auditors, together with the associated fees which are set out in note 3 to the combined financial statements. The non audit services provided were in the areas of taxation, other audit related services, due diligence and other transaction related services where their knowledge of the Reed Elsevier businesses and experience made them most suitable to carry out the work required.
The external auditors are required to rotate the audit partners responsible for the audit engagement every five years. The lead engagement partner has now completed his second year of auditing Reed Elsevier’s financial statements. Any decision to open the audit to tender is taken only on the recommendation of the Committees. The external auditors have confirmed their independence and compliance with the Reed Elsevier policy on auditor independence.
Report of the Audit Committees continued
Annual Reports and Financial Statements 2010 Reed Elsevier 83
Overview
Business review
Financial reviewG
overnanceFinancial statem
ents and other information
47213_Text_p056-084.indd 83 1/3/11 10:43:29
84 Reed Elsevier Annual Reports and Financial Statements 2010
The Committees conducted a formal review during 2010 of the performance of the external auditors and the effectiveness of the external audit process for the year ended 31 December 2009. As part of this process, the Committees reviewed the report on the external auditors by the Audit Inspection Unit of the UK Financial Reporting Council issued in September 2010 and the report of the Autoriteit Financiële Markten in the Netherlands issued on 1 September 2010 on the general findings of the quality and effectiveness of audits performed by external audit firms (Rapport algemene bevindingen kwaliteit accountantscontrole en kwaliteitsbewaking). Based on these reviews, and on their subsequent observations on the planning and execution of the external audit for the year ended 31 December 2010, the Committees have recommended to the respective boards that resolutions for the reappointment of the external auditors be proposed at the forthcoming Annual General Meetings. Deloitte LLP and Deloitte Accountants BV or their predecessor Deloitte firms were first appointed respectively auditors of Reed Elsevier PLC and Reed Elsevier NV for the financial year ended 31 December 1994. In addition to the annual review of the performance of the external auditors and the effectiveness of the audit process, at least every four years the Committees will consider whether the objectives of the audit would be better served through a formal tender process for the auditor appointment.
The effectiveness of the operation of the Audit Committees was reviewed as part of the effectiveness review of the Boards in December 2010.
Ben van der VeerChairman of the Audit Committees
16 February 2011
Report of the Audit Committees continued
47213_Text_p056-084.indd 84 1/3/11 10:43:29
Annual Reports and Financial Statements 2010 Reed Elsevier 85
86 Combined financial statements90 Accounting policies97 Notes to the combined financial statements128 Independent auditors’ report129 Summary combined financial information in euros142 Reed Elsevier PLC annual report and financial statements165 Reed Elsevier NV annual report and financial statements189 Additional information for US investors
Overview
Business review
Financial reviewG
overnanceFinancial statem
ents and other information
Financial Statements
47213_Text_p085-128.indd 85 1/3/11 10:38:36

86 Reed Elsevier Annual Reports and Financial Statements 2010
2010 2009 For the year ended 31 December Note £m £m
Revenue 1 6,055 6,071Cost of sales (2,209) (2,252)Gross profit 3,846 3,819Selling and distribution costs (1,091) (1,112)Administration and other expenses (1,687) (1,935)Operating profit before joint ventures 1,068 772Share of results of joint ventures 22 15Operating profit 2 1,090 787Finance income 7 8 7Finance costs 7 (284) (298)Net finance costs (276) (291)Disposals and other non operating items 8 (46) (61)Profit before tax 768 435Taxation 9 (120) (40)Net profit for the year 648 395
Attributable to:Parent companies’ shareholders 642 391Non-controlling interests 6 4Net profit for the year 648 395
Combined statement of comprehensive income2010 2009
For the year ended 31 December Note £m £m
Net profit for the year 648 395
Exchange differences on translation of foreign operations 94 (122) Actuarial (losses)/gains on defined benefit pension schemes 5 (63) 6Cumulative fair value movements on disposal of available for sale investments – 1Fair value movements on cash flow hedges (58) 53Transfer to net profit from hedge reserve (net of tax) 18 46 84Tax recognised directly in equity 9 29 (25)Other comprehensive income/(expense) for the year 48 (3)Total comprehensive income for the year 696 392
Attributable to:Parent companies’ shareholders 690 388Non-controlling interests 6 4Total comprehensive income for the year 696 392
Combined income statement
47213_Text_p085-128.indd 86 1/3/11 10:38:36
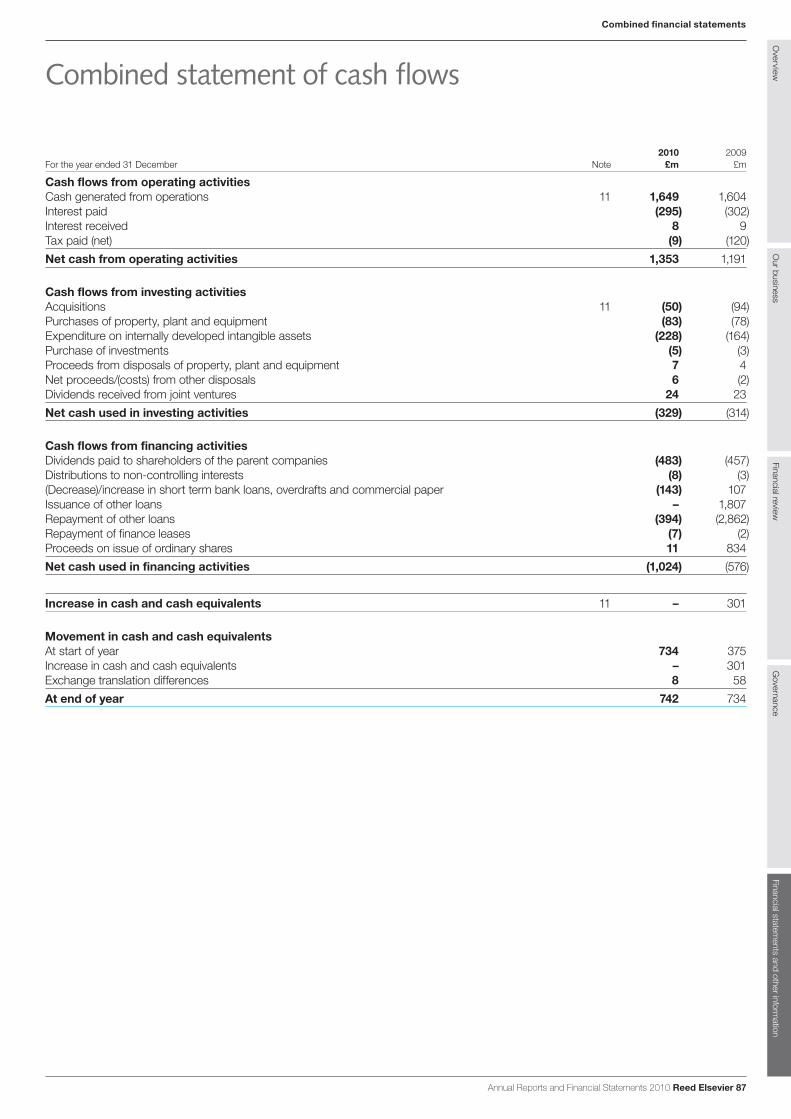
Overview
Our business
Financial reviewG
overnanceFinancial statem
ents and other information
Annual Reports and Financial Statements 2010 Reed Elsevier 87
Combined financial statements
2010 2009 For the year ended 31 December Note £m £m
Cash flows from operating activitiesCash generated from operations 11 1,649 1,604Interest paid (295) (302)Interest received 8 9Tax paid (net) (9) (120)Net cash from operating activities 1,353 1,191
Cash flows from investing activitiesAcquisitions 11 (50) (94)Purchases of property, plant and equipment (83) (78)Expenditure on internally developed intangible assets (228) (164)Purchase of investments (5) (3)Proceeds from disposals of property, plant and equipment 7 4Net proceeds/(costs) from other disposals 6 (2) Dividends received from joint ventures 24 23Net cash used in investing activities (329) (314)
Cash flows from financing activitiesDividends paid to shareholders of the parent companies (483) (457)Distributions to non-controlling interests (8) (3)(Decrease)/increase in short term bank loans, overdrafts and commercial paper (143) 107Issuance of other loans – 1,807Repayment of other loans (394) (2,862)Repayment of finance leases (7) (2)Proceeds on issue of ordinary shares 11 834Net cash used in financing activities (1,024) (576)
Increase in cash and cash equivalents 11 – 301
Movement in cash and cash equivalentsAt start of year 734 375Increase in cash and cash equivalents – 301Exchange translation differences 8 58At end of year 742 734
Combined statement of cash flows
47213_Text_p085-128.indd 87 1/3/11 10:38:36

88 Reed Elsevier Annual Reports and Financial Statements 2010
2010 2009 As at 31 December Note £m £m
Non-current assetsGoodwill 14 4,441 4,339Intangible assets 15 3,457 3,632Investments in joint ventures 16 136 135Other investments 16 48 41Property, plant and equipment 17 291 292Net pension assets 5 55 110Deferred tax assets 19 151 208 8,579 8,757Current assetsInventories and pre-publication costs 20 228 275Trade and other receivables 21 1,475 1,492Derivative financial instruments 134 71Cash and cash equivalents 11 742 734 2,579 2,572Assets held for sale 22 – 5Total assets 11,158 11,334
Current liabilitiesTrade and other payables 23 2,584 2,471Derivative financial instruments 80 102Borrowings 24 516 678Taxation 646 479Provisions 26 71 134 3,897 3,864Non-current liabilitiesBorrowings 24 3,786 4,028Deferred tax liabilities 19 1,192 1,272Net pension obligations 5 225 345Provisions 26 88 61
5,291 5,706Liabilities associated with assets held for sale 22 – 5Total liabilities 9,188 9,575Net assets 1,970 1,759
Capital and reservesCombined share capitals 28 224 225Combined share premiums 29 2,754 2,807Combined shares held in treasury 30 (677) (698)Translation reserve 31 29 (100)Other combined reserves 32 (387) (502)Combined shareholders’ equity 1,943 1,732Non-controlling interests 27 27Total equity 1,970 1,759
Combined statement of financial position
47213_Text_p085-128.indd 88 1/3/11 10:38:36
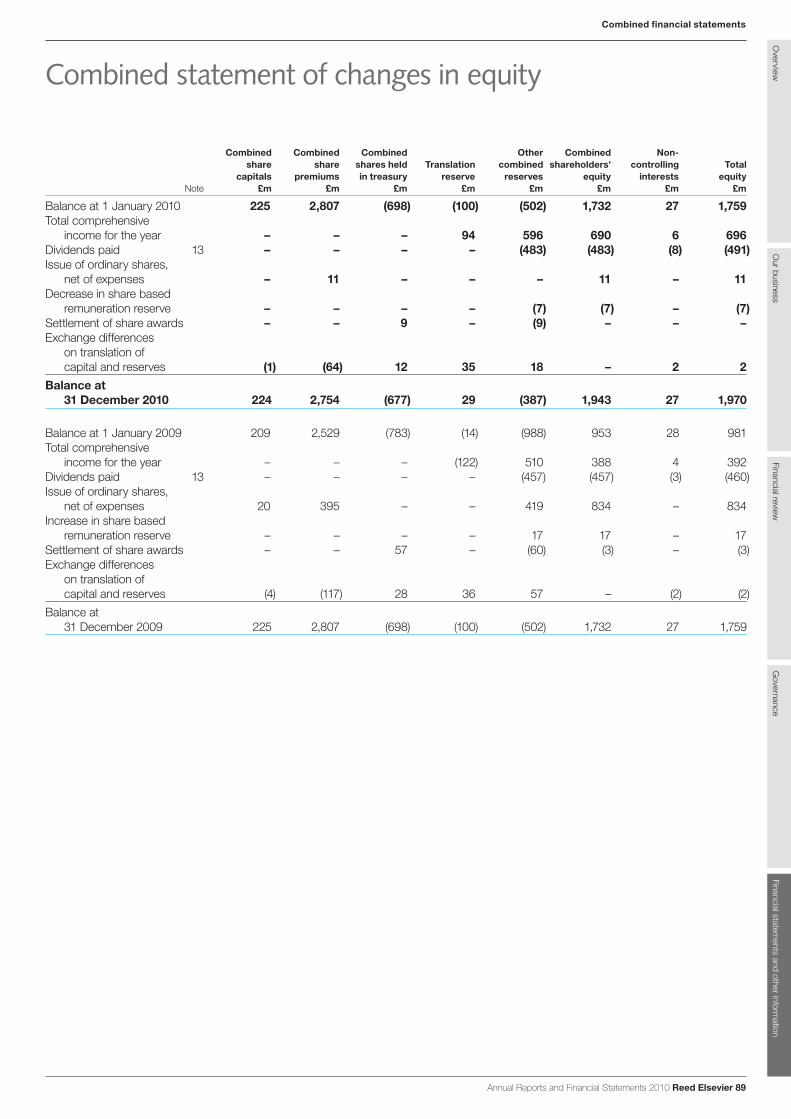
Annual Reports and Financial Statements 2010 Reed Elsevier 89
Overview
Our business
Financial reviewG
overnanceFinancial statem
ents and other information
Combined financial statements
Combined Combined Combined Other Combined Non-share share shares held Translation combined shareholders’ controlling Total
capitals premiums in treasury reserve reserves equity interests equity Note £m £m £m £m £m £m £m £m
Balance at 1 January 2010 225 2,807 (698) (100) (502) 1,732 27 1,759Total comprehensive
income for the year – – – 94 596 690 6 696Dividends paid 13 – – – – (483) (483) (8) (491)Issue of ordinary shares,
net of expenses – 11 – – – 11 – 11Decrease in share based
remuneration reserve – – – – (7) (7) – (7)Settlement of share awards – – 9 – (9) – – –Exchange differences
on translation of capital and reserves (1) (64) 12 35 18 – 2 2
Balance at 31 December 2010 224 2,754 (677) 29 (387) 1,943 27 1,970
Balance at 1 January 2009 209 2,529 (783) (14) (988) 953 28 981Total comprehensive
income for the year – – – (122) 510 388 4 392Dividends paid 13 – – – – (457) (457) (3) (460)Issue of ordinary shares,
net of expenses 20 395 – – 419 834 – 834Increase in share based
remuneration reserve – – – – 17 17 – 17Settlement of share awards – – 57 – (60) (3) – (3)Exchange differences
on translation of capital and reserves (4) (117) 28 36 57 – (2) (2)
Balance at 31 December 2009 225 2,807 (698) (100) (502) 1,732 27 1,759
Combined statement of changes in equity
47213_Text_p085-128.indd 89 1/3/11 10:38:36
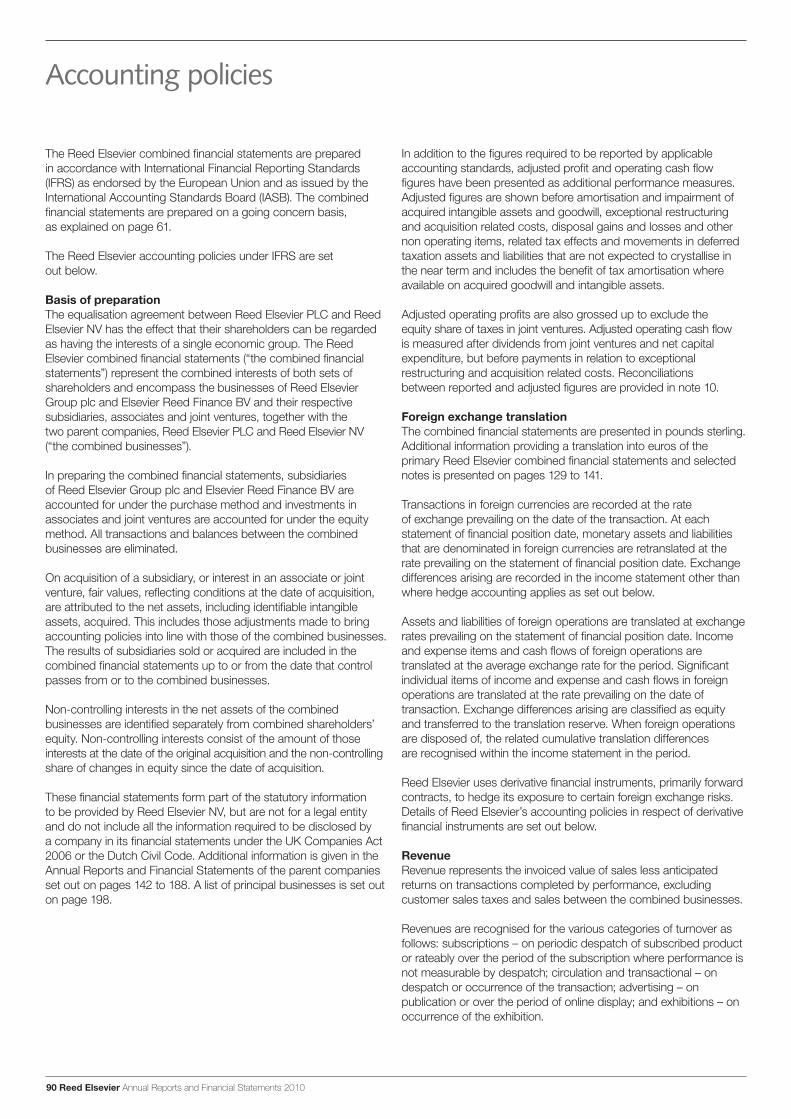
90 Reed Elsevier Annual Reports and Financial Statements 2010
The Reed Elsevier combined financial statements are prepared in accordance with International Financial Reporting Standards (IFRS) as endorsed by the European Union and as issued by the International Accounting Standards Board (IASB). The combined financial statements are prepared on a going concern basis, as explained on page 61.
The Reed Elsevier accounting policies under IFRS are set out below.
Basis of preparationThe equalisation agreement between Reed Elsevier PLC and Reed Elsevier NV has the effect that their shareholders can be regarded as having the interests of a single economic group. The Reed Elsevier combined financial statements (“the combined financial statements”) represent the combined interests of both sets of shareholders and encompass the businesses of Reed Elsevier Group plc and Elsevier Reed Finance BV and their respective subsidiaries, associates and joint ventures, together with the two parent companies, Reed Elsevier PLC and Reed Elsevier NV (“the combined businesses”).
In preparing the combined financial statements, subsidiaries of Reed Elsevier Group plc and Elsevier Reed Finance BV are accounted for under the purchase method and investments in associates and joint ventures are accounted for under the equity method. All transactions and balances between the combined businesses are eliminated.
On acquisition of a subsidiary, or interest in an associate or joint venture, fair values, reflecting conditions at the date of acquisition, are attributed to the net assets, including identifiable intangible assets, acquired. This includes those adjustments made to bring accounting policies into line with those of the combined businesses. The results of subsidiaries sold or acquired are included in the combined financial statements up to or from the date that control passes from or to the combined businesses.
Non-controlling interests in the net assets of the combined businesses are identified separately from combined shareholders’ equity. Non-controlling interests consist of the amount of those interests at the date of the original acquisition and the non-controlling share of changes in equity since the date of acquisition.
These financial statements form part of the statutory information to be provided by Reed Elsevier NV, but are not for a legal entity and do not include all the information required to be disclosed by a company in its financial statements under the UK Companies Act 2006 or the Dutch Civil Code. Additional information is given in the Annual Reports and Financial Statements of the parent companies set out on pages 142 to 188. A list of principal businesses is set out on page 198.
In addition to the figures required to be reported by applicable accounting standards, adjusted profit and operating cash flow figures have been presented as additional performance measures. Adjusted figures are shown before amortisation and impairment of acquired intangible assets and goodwill, exceptional restructuring and acquisition related costs, disposal gains and losses and other non operating items, related tax effects and movements in deferred taxation assets and liabilities that are not expected to crystallise in the near term and includes the benefit of tax amortisation where available on acquired goodwill and intangible assets.
Adjusted operating profits are also grossed up to exclude the equity share of taxes in joint ventures. Adjusted operating cash flow is measured after dividends from joint ventures and net capital expenditure, but before payments in relation to exceptional restructuring and acquisition related costs. Reconciliations between reported and adjusted figures are provided in note 10.
Foreign exchange translationThe combined financial statements are presented in pounds sterling. Additional information providing a translation into euros of the primary Reed Elsevier combined financial statements and selected notes is presented on pages 129 to 141.
Transactions in foreign currencies are recorded at the rate of exchange prevailing on the date of the transaction. At each statement of financial position date, monetary assets and liabilities that are denominated in foreign currencies are retranslated at the rate prevailing on the statement of financial position date. Exchange differences arising are recorded in the income statement other than where hedge accounting applies as set out below.
Assets and liabilities of foreign operations are translated at exchange rates prevailing on the statement of financial position date. Income and expense items and cash flows of foreign operations are translated at the average exchange rate for the period. Significant individual items of income and expense and cash flows in foreign operations are translated at the rate prevailing on the date of transaction. Exchange differences arising are classified as equity and transferred to the translation reserve. When foreign operations are disposed of, the related cumulative translation differences are recognised within the income statement in the period.
Reed Elsevier uses derivative financial instruments, primarily forward contracts, to hedge its exposure to certain foreign exchange risks. Details of Reed Elsevier’s accounting policies in respect of derivative financial instruments are set out below.
RevenueRevenue represents the invoiced value of sales less anticipated returns on transactions completed by performance, excluding customer sales taxes and sales between the combined businesses.
Revenues are recognised for the various categories of turnover as follows: subscriptions – on periodic despatch of subscribed product or rateably over the period of the subscription where performance is not measurable by despatch; circulation and transactional – on despatch or occurrence of the transaction; advertising – on publication or over the period of online display; and exhibitions – on occurrence of the exhibition.
Accounting policies
47213_Text_p085-128.indd 90 3/3/11 13:32:34
Annual Reports and Financial Statements 2010 Reed Elsevier 91
Overview
Our business
Financial reviewG
overnanceFinancial statem
ents and other information
Combined financial statements
Where sales consist of two or more independent components whose value can be reliably measured, revenue is recognised on each component as it is completed by performance, based on attribution of relative value.
Employee benefitsThe expense of defined benefit pension schemes and other post-retirement employee benefits is determined using the projected unit credit method and charged in the income statement as an operating expense, based on actuarial assumptions reflecting market conditions at the beginning of the financial year. Actuarial gains and losses are recognised in full in the statement of comprehensive income in the period in which they occur.
Past service costs are recognised immediately to the extent that benefits have vested, or, if not vested, on a straight line basis over the period until the benefits vest.
Net pension obligations in respect of defined benefit schemes are included in the statement of financial position at the present value of scheme liabilities, less the fair value of scheme assets. Where schemes are in surplus, i.e. assets exceed liabilities, the net pension assets are separately included in the statement of financial position. Any net pension asset is limited to the extent that the asset is recoverable through reductions in future contributions.
The expense of defined contribution pension schemes and other employee benefits is charged in the income statement as incurred.
Share based remunerationThe fair value of share based remuneration is determined at the date of grant and recognised as an expense in the income statement on a straight line basis over the vesting period, taking account of the estimated number of shares that are expected to vest. Market based performance criteria are taken into account when determining the fair value at the date of grant. Non-market based performance criteria are taken into account when estimating the number of shares expected to vest. The fair value of share based remuneration is determined by use of a binomial or Monte Carlo simulation model as appropriate. All Reed Elsevier’s share based remuneration is equity settled.
Borrowing costsBorrowing costs that are directly attributable to the acquisition, construction or production of an asset that takes a substantial period of time to bring to use are capitalised. All other interest on borrowings is expensed as incurred. The cost of issuing borrowings is generally expensed over the period of borrowing so as to produce a constant periodic rate of charge.
TaxationThe tax expense represents the sum of the tax payable on the current year taxable profits, adjustments in respect of prior year taxable profits, and the movements on deferred tax that are recognised in the income statement.
The tax payable on current year taxable profits is calculated using the applicable tax rates that have been enacted, or substantively enacted, by the statement of financial position date.
Deferred tax is the tax arising on differences between the carrying amounts of assets and liabilities in the financial statements and their corresponding tax bases used in the computation of taxable profit, and is accounted for using the balance sheet liability method. Deferred tax liabilities are generally recognised for all taxable temporary differences and deferred tax assets are recognised to the extent that, based on current forecasts, it is probable that taxable profits will be available against which deductible temporary differences can be utilised. Deferred tax is not recognised on temporary differences arising in respect of goodwill that is not deductible for tax purposes.
Deferred tax is calculated using tax rates that are expected to apply in the period when the liability is expected to be settled or the asset realised. Full provision is made for deferred tax which would become payable on the distribution of retained profits from foreign subsidiaries, associates or joint ventures.
Movements in deferred tax are charged or credited in the income statement, except when they relate to items charged or credited directly to equity, in which case the deferred tax is also recognised in equity. Deferred tax credits in respect of share based remuneration are recognised in equity to the extent that expected tax deductions exceed the related expense.
GoodwillOn the acquisition of a subsidiary or business, the purchase consideration is allocated between the net tangible and intangible assets on a fair value basis, with any excess purchase consideration representing goodwill. Goodwill arising on acquisitions also includes amounts corresponding to deferred tax liabilities recognised in respect of acquired intangible assets.
Goodwill is recognised as an asset and reviewed for impairment at least annually. Any impairment is recognised immediately in the income statement and not subsequently reversed.
On disposal of a subsidiary or business, the attributable amount of goodwill is included in the determination of the profit or loss on disposal.
Accounting policies continued
47213_Text_p085-128.indd 91 1/3/11 10:38:37

92 Reed Elsevier Annual Reports and Financial Statements 2010
Intangible assetsIntangible assets acquired as part of a business combination are stated in the statement of financial position at their fair value as at the date of acquisition, less accumulated amortisation. Internally generated intangible assets are stated in the statement of financial position at the directly attributable cost of creation of the asset, less accumulated amortisation.
Intangible assets acquired as part of business combinations comprise: market related assets (e.g. trade marks, imprints, brands); customer related assets (e.g. subscription bases, customer lists, customer relationships); editorial content; software and systems (e.g. application infrastructure, product delivery platforms, in-process research and development); contract based assets (e.g. publishing rights, exhibition rights, supply contracts); and other intangible assets. Internally generated intangible assets typically comprise software and systems development where an identifiable asset is created that is probable to generate future economic benefits.
Intangible assets, other than brands and imprints determined to have indefinite lives, are amortised systematically over their estimated useful lives. The estimated useful lives of intangible assets with finite lives are as follows: market and customer related assets – 3 to 40 years; content, software and other acquired intangible assets – 3 to 20 years; and internally developed intangible assets – 3 to 10 years. Brands and imprints determined to have indefinite lives are not amortised and are subject to impairment review at least annually.
Property, plant and equipmentProperty, plant and equipment are stated in the statement of financial position at cost less accumulated depreciation. No depreciation is provided on freehold land. Freehold buildings and long leases are depreciated over their estimated useful lives up to a maximum of 50 years. Short leases are written off over the duration of the lease. Depreciation is provided on other assets on a straight line basis over their estimated useful lives as follows: leasehold improvements – shorter of life of lease and 10 years; plant – 3 to 20 years; office furniture, fixtures and fittings – 5 to 10 years; computer systems, communication networks and equipment – 3 to 7 years.
InvestmentsInvestments, other than investments in joint ventures and associates, are stated in the statement of financial position at fair value. Investments held as part of the venture capital portfolio are classified as held for trading, with changes in fair value reported through the income statement. All other investments are classified as available for sale with changes in fair value recognised directly in equity until the investment is disposed of or is determined to be impaired, at which time the cumulative gain or loss previously recognised in equity is brought into the net profit or loss for the period. All items recognised in the income statement relating to investments, other than investments in joint ventures and associates, are reported as non operating items.
Accounting policies continued
Available for sale investments and venture capital investments held for trading represent investments in listed and unlisted securities. The fair value of listed securities is determined based on quoted market prices, and of unlisted securities on management’s estimate of fair value based on standard valuation techniques, including market comparisons and discounts of future cash flows, having regard to maximising the use of observable inputs and adjusting for risk. Independent valuation experts are used as appropriate.
Investments in joint ventures and associates are accounted for under the equity method and stated in the statement of financial position at cost as adjusted for post-acquisition changes in Reed Elsevier’s share of net assets, less any impairment in value.
ImpairmentAt each statement of financial position date, reviews are carried out of the carrying amounts of tangible and intangible assets and goodwill to determine whether there is any indication that those assets have suffered an impairment loss. If any such indication exists, the recoverable amount, which is the higher of value in use and fair value less costs to sell, of the asset is estimated in order to determine the extent, if any, of the impairment loss. Where the asset does not generate cash flows that are independent from other assets, value in use estimates are made based on the cash flows of the cash generating unit to which the asset belongs. Intangible assets with an indefinite useful life are tested for impairment at least annually and whenever there is any indication that the asset may be impaired.
If the recoverable amount of an asset or cash generating unit is estimated to be less than its net carrying amount, the net carrying amount of the asset or cash generating unit is reduced to its recoverable amount. Impairment losses are recognised immediately in the income statement in administration and other expenses.
Inventories and pre-publication costsInventories and pre-publication costs are stated at the lower of cost, including appropriate attributable overhead, and estimated net realisable value. Pre-publication costs, representing costs incurred in the origination of content prior to publication, are expensed systematically reflecting the expected sales profile over the estimated economic lives of the related products, generally up to five years.
LeasesAssets held under leases which confer rights and obligations similar to those attaching to owned assets are classified as assets held under finance leases and capitalised within property, plant and equipment or software and the corresponding liability to pay rentals is shown net of interest in the statement of financial position as obligations under finance leases. The capitalised value of the assets is depreciated on a straight line basis over the shorter of the periods of the leases or the useful lives of the assets concerned. The interest element of the lease payments is allocated so as to produce a constant periodic rate of charge.
47213_Text_p085-128.indd 92 1/3/11 10:38:37
Annual Reports and Financial Statements 2010 Reed Elsevier 93
Overview
Our business
Financial reviewG
overnanceFinancial statem
ents and other information
Combined financial statements
Operating lease rentals are charged to the income statement on a straight line basis over the period of the leases. Rental income from operating leases is recognised on a straight line basis over the term of the relevant lease.
Cash and cash equivalentsCash and cash equivalents comprise cash balances, call deposits and other short term highly liquid investments and are held in the statement of financial position at fair value.
Assets held for saleAssets of businesses that are available for immediate sale in their current condition and for which a sales process has been initiated are classified as assets held for sale, and are carried at the lower of amortised cost and fair value less costs to sell. Non-current assets are not amortised or depreciated following their classification as held for sale. Liabilities of businesses held for sale are also separately classified on the statement of financial position.
Discontinued operationsA discontinued operation is a component of the combined businesses that represents a separate major line of business or geographical area of operations that has been disposed of or is held for sale. When an operation is classified as discontinued, the comparative income statement and statement of cash flows are re-presented as if the operation had been discontinued from the start of the comparative period.
Financial instrumentsFinancial instruments comprise investments (other than investments in joint ventures or associates), trade receivables, cash and cash equivalents, payables and accruals, provisions, borrowings and derivative financial instruments.
Investments (other than investments in joint ventures and associates) are classified as either held for trading or available for sale, as described above. (These investments are classified as either Level 1 or 2 in the IFRS 7 fair value hierarchy.)
Trade receivables are carried in the statement of financial position at invoiced value less allowance for estimated irrecoverable amounts. Irrecoverable amounts are estimated based on the ageing of trade receivables, experience and circumstance.
Borrowings (other than fixed rate borrowings in designated hedging relationships and for which the carrying value is adjusted to reflect changes in the fair value of the hedged risk), payables, accruals and provisions are recorded initially at fair value and subsequently at amortised cost.
Derivative financial instruments are used to hedge interest rate and foreign exchange risks. Changes in the fair value of derivative financial instruments that are designated and effective as hedges of future cash flows are recognised (net of tax) directly in equity in the hedge reserve. If a hedged firm commitment or forecasted transaction results in the recognition of a non financial asset or liability, then, at the time that the asset or liability is recognised, the associated gains or losses on the derivative that had previously been recognised in equity are included in the initial measurement of the asset or liability. For hedges that do not result in the recognition of an asset or a liability, amounts deferred in equity are recognised in the income statement in the same period in which the hedged item affects net profit or loss. Any ineffective portion of hedges is recognised immediately in the income statement.
Derivative financial instruments that are not designated as hedging instruments are classified as held for trading and recorded in the statement of financial position at fair value, with changes in fair value recognised in the income statement.
Where an effective hedge is in place against changes in the fair value of fixed rate borrowings, the hedged borrowings are adjusted for changes in fair value attributable to the risk being hedged with a corresponding income or expense included in the income statement within finance costs. The offsetting gains or losses from remeasuring the fair value of the related derivatives are also recognised in the income statement within finance costs. When the related derivative expires, is sold or terminated, or no longer qualifies for hedge accounting, the cumulative change in fair value of the hedged borrowing is amortised in the income statement over the period to maturity of the borrowing using the effective interest method.
The fair values of interest rate swaps, interest rate options, forward rate agreements and forward foreign exchange contracts represent the replacement costs calculated using observable market rates of interest and exchange. The fair value of long term borrowings is calculated by discounting expected future cash flows at observable market rates. (These instruments are accordingly classified as Level 2 in the IFRS 7 fair value hierarchy.)
Cash flow hedge accounting is discontinued when a hedging instrument expires or is sold, terminated or exercised, or no longer qualifies for hedge accounting. At that time, any cumulative gain or loss on the hedging instrument recognised in equity is either retained in equity until the firm commitment or forecasted transaction occurs, or, where a hedged transaction is no longer expected to occur, is immediately credited or expensed in the income statement.
ProvisionsProvisions are recognised when a present obligation exists as a result of a past event, and it is probable that settlement of the obligation will be required. Provisions are measured at the best estimate of the expenditure required to settle the obligation at the statement of financial position date.
Accounting policies continued
47213_Text_p085-128.indd 93 1/3/11 10:38:37
94 Reed Elsevier Annual Reports and Financial Statements 2010
Shares held in treasuryShares of Reed Elsevier PLC and Reed Elsevier NV that are repurchased by the respective parent companies and not cancelled are classified as shares held in treasury. The consideration paid, including directly attributable costs, is recognised as a deduction from equity. Shares of the parent companies that are purchased by the Reed Elsevier Group plc Employee Benefit Trust are also classified as shares held in treasury, with the cost recognised as a deduction from equity.
Critical judgements and key sources of estimation uncertaintyThe most significant accounting policies in determining the financial condition and results of the Reed Elsevier combined businesses, and those requiring the most subjective or complex judgement, relate to the valuation of goodwill and intangible assets, share based remuneration, pensions, litigation, taxation, and property provisioning.
Goodwill and intangiblesOn acquisition of a subsidiary or business, the purchase consideration is allocated between the net tangible and intangible assets other than goodwill on a fair value basis, with any excess purchase consideration representing goodwill. The valuation of acquired intangible assets represents the estimated economic value in use, using standard valuation methodologies, including as appropriate, discounted cash flow, relief from royalty and comparable market transactions. Acquired intangible assets are capitalised and amortised systematically over their estimated useful lives, subject to impairment review. Appropriate amortisation periods are selected based on assessments of the longevity of the brands and imprints, the strength and stability of customer relationships, the market positions of the acquired assets and the technological and competitive risks that they face. Certain intangible assets in relation to acquired science and medical publishing businesses have been determined to have indefinite lives.
The longevity of these assets is evidenced by their long established and well regarded brands and imprints, and their characteristically stable market positions.
The carrying amounts of goodwill and indefinite lived intangible assets in each business are reviewed for impairment at least annually. The carrying amounts of all other intangible assets are reviewed where there are indications of possible impairment. An impairment review involves a comparison of the carrying value of the asset with estimated values in use based on latest management cash flow projections. Key areas of judgement in estimating the values in use of businesses are the growth in cash flows over a five year forecast period, the long term growth rate assumed thereafter and the discount rate applied to the forecast cash flows.
The discount rates used are based on the Reed Elsevier weighted average cost of capital, adjusted to reflect a risk premium specific to each business. The pre-tax discount rates applied are 9.5% for Elsevier, 10.0-10.5% for LexisNexis, 10.5-11.0% for Reed Exhibitions and 10.5-12.0% for Reed Business Information. The nominal long term growth rates, which are based on historic growth rates and the growth prospects for businesses, do not exceed 3%. There were no charges for impairment of acquired intangible assets and goodwill in 2010 (2009: £177m principally relating to the RBI controlled circulation titles).
A sensitivity analysis has been performed based on changes in key assumptions considered to be reasonably possible by management: an increase in the discount rate of 0.5%; a decrease in the compound annual growth rate for adjusted operating cash flow in the five year forecast period of 2.0%; and a decrease in perpetuity growth rates of 0.5%. The sensitivity analysis shows that impairment charges resulting from these scenarios would be less than £10m. Further information is provided in note 14 to the combined financial statements.
Share based remunerationShare based remuneration is determined based on the fair value of an award at the date of grant, and is spread over the vesting period on a straight line basis, taking into account the number of shares that are expected to vest. The fair value of awards is determined at the date of grant by use of a binomial or Monte Carlo simulation model as appropriate, which requires judgements to be made regarding share price volatility, dividend yield, risk free rates of return and expected option lives. The number of awards that are expected to vest requires judgements to be made regarding forfeiture rates and the extent to which performance conditions will be met. The assumptions are determined in conjunction with independent actuaries based on historical data and trends.
The assumptions of share price volatility of 26%, of expected share option life of 4 years, and of expected lapse rate of 3-5% are based on relevant historical data. Other judgements made on grant are based on market data. Assumptions as to future performance against non market related vesting conditions are based on management estimates. The charge for share based and related remuneration was £11m in 2010 (2009: £17m) as a result of reduced vesting assumptions. Further information is provided in note 6 to the combined financial statements.
PensionsAccounting for defined benefit pension schemes involves judgement about uncertain events, including the life expectancy of the members, salary and pension increases, inflation, the return on scheme assets and the rate at which the future pension payments are discounted. Estimates for these factors are used in determining the pension cost and liabilities reported in the financial statements. These best estimates of future developments are made in conjunction with independent actuaries. Each scheme is subject to a periodic review by independent actuaries.
Accounting policies continued
47213_Text_p085-128.indd 94 1/3/11 10:38:37

Annual Reports and Financial Statements 2010 Reed Elsevier 95
Overview
Our business
Financial reviewG
overnanceFinancial statem
ents and other information
Combined financial statements
Accounting policies continued
The principal assumptions as at 31 December 2010, expressed as a weighted average of the various defined benefit pension schemes, were a discount rate of 5.6% (2009: 5.8%; 2008: 6.2%), an expected return on scheme assets of 6.8% (2009: 7.0%; 2008: 7.1%), an expected rate of salary increases of 4.1% (2009: 4.0%; 2008: 3.7%) and inflation of 3.2% (2009: 3.1%; 2008: 2.7%). Future pension increases are assumed at 3.2% (2009: 3.1%; 2008: 2.8%) and average life expectancy of 87-89 years (2009: 87-88 years) for scheme members currently aged 45 and 60 years. The net defined benefit pension expense was £22m (2009: £18m). Excluding the net pension financing credit, the expense was £48m (2009: £24m) reflecting the lower discount rates and higher inflation assumptions at the beginning of the year compared with the prior year, and pension curtailment credits of £17m (2009: £43m) from changes to pension plan design and staff reductions. The net pension financing credit is based on market data at the beginning of the year and was £26m (2009: £6m) reflecting the higher market value of scheme assets. Further information and sensitivity analysis is provided in note 5 to the combined financial statements.
LitigationReed Elsevier is involved in various legal proceedings, which arise in the normal course of its business, relating to commercial disputes, employment, data security and product liability. Provisions for liabilities are recognised when it is likely that a settlement is required. Although the outcome of legal proceedings is uncertain, the ultimate resolution of such matters is not expected to have a material impact on results.
TaxationReed Elsevier is subject to tax in numerous jurisdictions, giving rise to complex tax issues that require management to exercise judgment in making tax determinations. While Reed Elsevier is confident that tax returns are appropriately prepared and filed, the application of tax law and practice is subject to some uncertainty and provisions are held in respect of this. Issues are raised during the course of regular tax audits and discussions including on the deductibility of interest in the US on certain cross-border financing are ongoing. Although the outcome of open items cannot be predicted, no material impact on results is expected from such issues.
Reed Elsevier’s policy in respect of deferred taxation is to provide in full for all taxable temporary differences using the balance sheet liability method. Deferred tax assets are only recognised to the extent that they are considered recoverable based on forecasts of available taxable profits against which they can be utilised over the near term.
Property provisionsReed Elsevier has exposures to sub-lease shortfalls in respect of certain property leases for periods up to 2024. Provisions are recognised for net liabilities expected to arise on these exposures. Estimation of the provisions requires judgement in respect of future head lease costs, sub lease income and the length of vacancy periods. The charge for property provisions was £36m (2009: £70m) relating to surplus property arising on the restructuring, sale and closure of RBI businesses and includes expected losses on sub leases entered into during 2010 and an estimate of vacancy periods and future market conditions. Further information is provided in note 26 to the combined financial statements.
Other significant accounting policiesThe accounting policies in respect of revenue recognition, pre-publication costs and development spend are also significant in determining the financial condition and results of the Reed Elsevier combined businesses, although the application of these policies is more straightforward.
Revenue recognition policies, while an area of management focus, are generally straightforward in application as the timing of product or service delivery and customer acceptance for the various revenue types can be readily determined. Allowances for product returns are deducted from revenues based on historical return rates. Where sales consist of two or more components that operate independently, revenue is recognised as each component is completed by performance, based on attribution of relative value.
Pre-publication costs incurred in the creation of content prior to production and publication are typically deferred and expensed over their estimated useful lives based on sales profiles. Such costs typically comprise direct internal labour costs and externally commissioned editorial and other fees. Estimated useful lives generally do not exceed five years. Annual reviews are carried out to assess the recoverability of carrying amounts.
Development spend embraces investment in new product and other initiatives, ranging from the building of new online delivery platforms, to launch costs of new services, to building new infrastructure applications. Launch costs and other operating expenses of new products and services are expensed as incurred. The costs of building product applications and infrastructure are capitalised as intangible assets and amortised over their estimated useful lives. Impairment reviews are carried out at least annually.
47213_Text_p085-128.indd 95 1/3/11 10:38:37
96 Reed Elsevier Annual Reports and Financial Statements 2010
Accounting policies continued
Standards and amendments effective for the yearThose amendments to IFRS which are relevant to Reed Elsevier and are effective for the current year are set out below.
Amendments to IFRS3 – Business Combinations requires transaction related costs (including professional fees) to be expensed and adjustments to contingent and deferred consideration to be recognised in income and allows non-controlling interests to be measured either at fair value or the proportionate share of net identifiable assets. Adoption of this standard has not required a restatement of prior year business combinations and has not had a significant impact in the year ended 31 December 2010.
Amendments to IAS27 – Consolidated and Separate Financial Statements amendments has introduced changes to the accounting for partial disposals of subsidiaries, associates and joint ventures. Adoption of this standard has not had a significant impact in the year ended 31 December 2010.
Amendment to IAS39 – Financial Instruments: Recognition and Measurement clarifies the eligibility of hedge accounting for inflation and hedging with options and has not had a significant impact for the year ended 31 December 2010.
Amendments to IAS32 – Financial Instruments: Presentation amendment provides relief to companies making rights issues in a currency other than their functional currency. This amendment has not affected Reed Elsevier as shares are not issued in currencies other than its functional currencies.
Standards, amendments and interpretations not yet effectiveNew accounting standards and amendments and their expected impact on the future accounting policies and reporting of Reed Elsevier are set out below.
IFRS9 – Financial Instruments (effective for the 2013 financial year, with earlier adoption permitted). The standard replaces the existing classification and measurement requirements in IAS39 for financial assets by requiring entities to classify them as being measured either at amortised cost or fair value depending on the business model and contractual cash flow characteristics of the asset. For financial liabilities, IFRS9 requires an entity choosing to measure a liability at fair value to present the portion of the change in its fair value due to changes in the entity’s own credit risk in the other comprehensive income rather than the income statement. Adoption of this standard is not expected to have a significant impact on the measurement, presentation or disclosure of financial assets and liabilities in the combined financial statements.
Additionally, a number of interpretations have been issued which are not expected to have any significant impact on Reed Elsevier’s accounting policies and reporting.
47213_Text_p085-128.indd 96 1/3/11 10:38:37
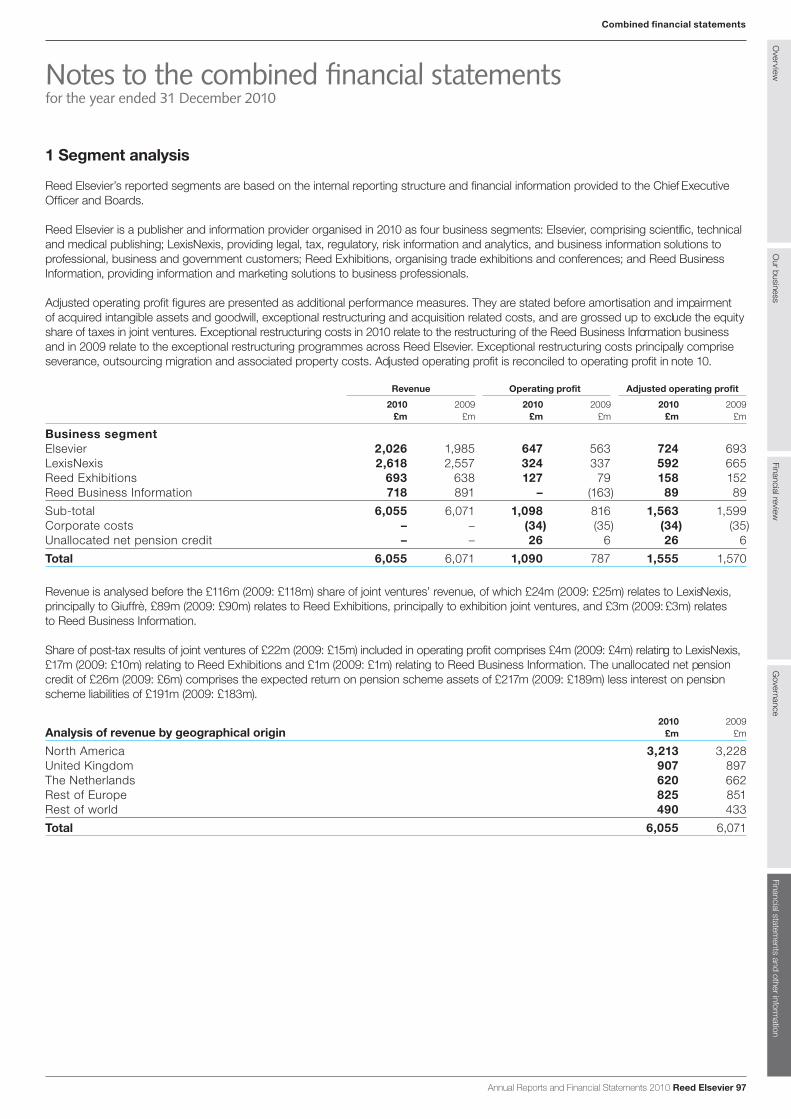
Overview
Our business
Financial reviewG
overnanceFinancial statem
ents and other information
Annual Reports and Financial Statements 2010 Reed Elsevier 97
Combined financial statements
Notes to the combined financial statementsfor the year ended 31 December 2010
1 Segment analysis
Reed Elsevier’s reported segments are based on the internal reporting structure and financial information provided to the Chief Executive Officer and Boards.
Reed Elsevier is a publisher and information provider organised in 2010 as four business segments: Elsevier, comprising scientific, technical and medical publishing; LexisNexis, providing legal, tax, regulatory, risk information and analytics, and business information solutions to professional, business and government customers; Reed Exhibitions, organising trade exhibitions and conferences; and Reed Business Information, providing information and marketing solutions to business professionals.
Adjusted operating profit figures are presented as additional performance measures. They are stated before amortisation and impairment of acquired intangible assets and goodwill, exceptional restructuring and acquisition related costs, and are grossed up to exclude the equity share of taxes in joint ventures. Exceptional restructuring costs in 2010 relate to the restructuring of the Reed Business Information business and in 2009 relate to the exceptional restructuring programmes across Reed Elsevier. Exceptional restructuring costs principally comprise severance, outsourcing migration and associated property costs. Adjusted operating profit is reconciled to operating profit in note 10.
Revenue Operating profit Adjusted operating profit
2010 2009 2010 2009 2010 2009 £m £m £m £m £m £m
Business segmentElsevier 2,026 1,985 647 563 724 693LexisNexis 2,618 2,557 324 337 592 665Reed Exhibitions 693 638 127 79 158 152Reed Business Information 718 891 – (163) 89 89Sub-total 6,055 6,071 1,098 816 1,563 1,599Corporate costs – – (34) (35) (34) (35)Unallocated net pension credit – – 26 6 26 6Total 6,055 6,071 1,090 787 1,555 1,570
Revenue is analysed before the £116m (2009: £118m) share of joint ventures’ revenue, of which £24m (2009: £25m) relates to LexisNexis, principally to Giuffrè, £89m (2009: £90m) relates to Reed Exhibitions, principally to exhibition joint ventures, and £3m (2009: £3m) relates to Reed Business Information.
Share of post-tax results of joint ventures of £22m (2009: £15m) included in operating profit comprises £4m (2009: £4m) relating to LexisNexis, £17m (2009: £10m) relating to Reed Exhibitions and £1m (2009: £1m) relating to Reed Business Information. The unallocated net pension credit of £26m (2009: £6m) comprises the expected return on pension scheme assets of £217m (2009: £189m) less interest on pension scheme liabilities of £191m (2009: £183m).
2010 2009 Analysis of revenue by geographical origin £m £m
North America 3,213 3,228United Kingdom 907 897The Netherlands 620 662Rest of Europe 825 851Rest of world 490 433Total 6,055 6,071
47213_Text_p085-128.indd 97 1/3/11 10:38:37
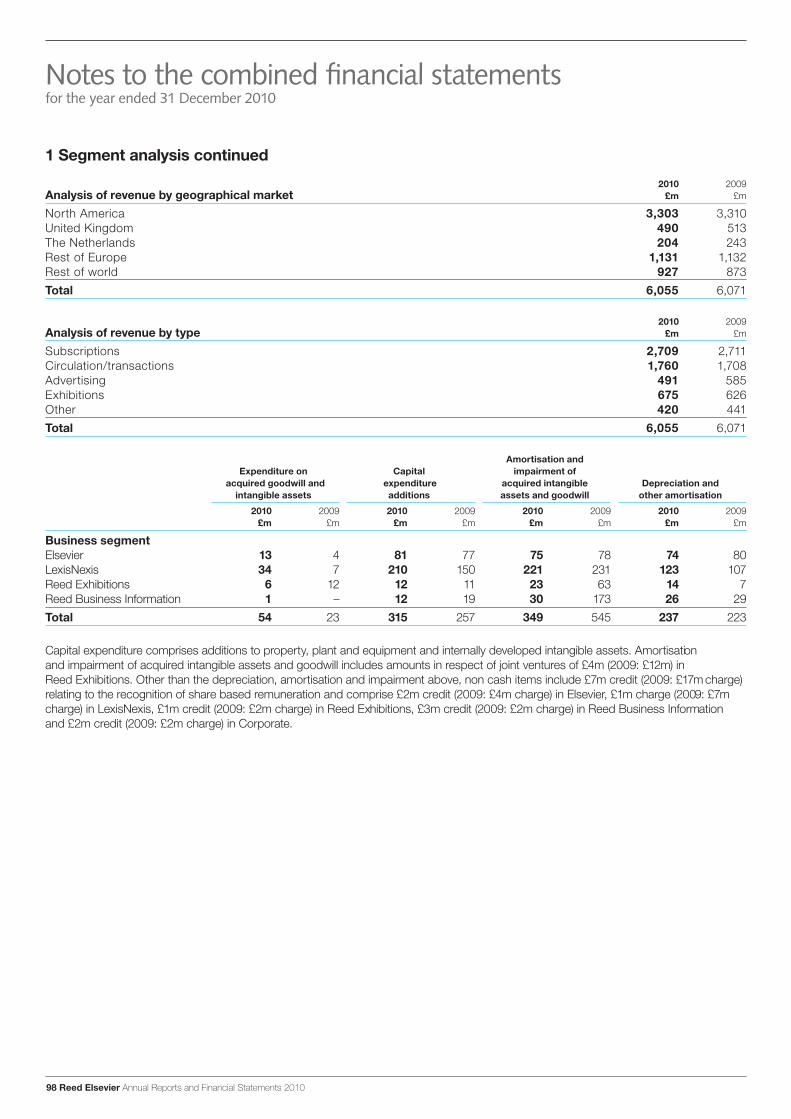
98 Reed Elsevier Annual Reports and Financial Statements 2010
1 Segment analysis continued
2010 2009 Analysis of revenue by geographical market £m £m
North America 3,303 3,310United Kingdom 490 513The Netherlands 204 243Rest of Europe 1,131 1,132Rest of world 927 873Total 6,055 6,071
2010 2009 Analysis of revenue by type £m £m
Subscriptions 2,709 2,711Circulation/transactions 1,760 1,708Advertising 491 585Exhibitions 675 626Other 420 441Total 6,055 6,071
Amortisation andExpenditure on Capital impairment of
acquired goodwill and expenditure acquired intangible Depreciation andintangible assets additions assets and goodwill other amortisation
2010 2009 2010 2009 2010 2009 2010 2009 £m £m £m £m £m £m £m £m
Business segmentElsevier 13 4 81 77 75 78 74 80LexisNexis 34 7 210 150 221 231 123 107Reed Exhibitions 6 12 12 11 23 63 14 7Reed Business Information 1 – 12 19 30 173 26 29Total 54 23 315 257 349 545 237 223
Capital expenditure comprises additions to property, plant and equipment and internally developed intangible assets. Amortisation and impairment of acquired intangible assets and goodwill includes amounts in respect of joint ventures of £4m (2009: £12m) in Reed Exhibitions. Other than the depreciation, amortisation and impairment above, non cash items include £7m credit (2009: £17m charge) relating to the recognition of share based remuneration and comprise £2m credit (2009: £4m charge) in Elsevier, £1m charge (2009: £7m charge) in LexisNexis, £1m credit (2009: £2m charge) in Reed Exhibitions, £3m credit (2009: £2m charge) in Reed Business Information and £2m credit (2009: £2m charge) in Corporate.
Notes to the combined financial statementsfor the year ended 31 December 2010
47213_Text_p085-128.indd 98 1/3/11 10:38:37

Annual Reports and Financial Statements 2010 Reed Elsevier 99
Overview
Our business
Financial reviewG
overnanceFinancial statem
ents and other information
Combined financial statements
1 Segment analysis continued
Total assets
2010 2009 £m £m
Business segmentElsevier 2,871 2,915LexisNexis 5,921 5,872Reed Exhibitions 681 728Reed Business Information 456 547Sub-total 9,929 10,062Taxation 151 208Cash and cash equivalents 742 734Net pension assets 55 110Assets held for sale – 5Other assets 281 215Total 11,158 11,334Geographical locationNorth America 7,556 7,570United Kingdom 933 1,164The Netherlands 854 687Rest of Europe 1,356 1,504Rest of world 459 409Total 11,158 11,334
Investments in joint ventures of £136m (2009: £135m) included in segment assets above comprise £38m (2009: £38m) relating to LexisNexis, £92m (2009: £92m) relating to Reed Exhibitions and £6m (2009: £5m) relating to Reed Business Information.
Notes to the combined financial statementsfor the year ended 31 December 2010
47213_Text_p085-128.indd 99 1/3/11 10:38:37
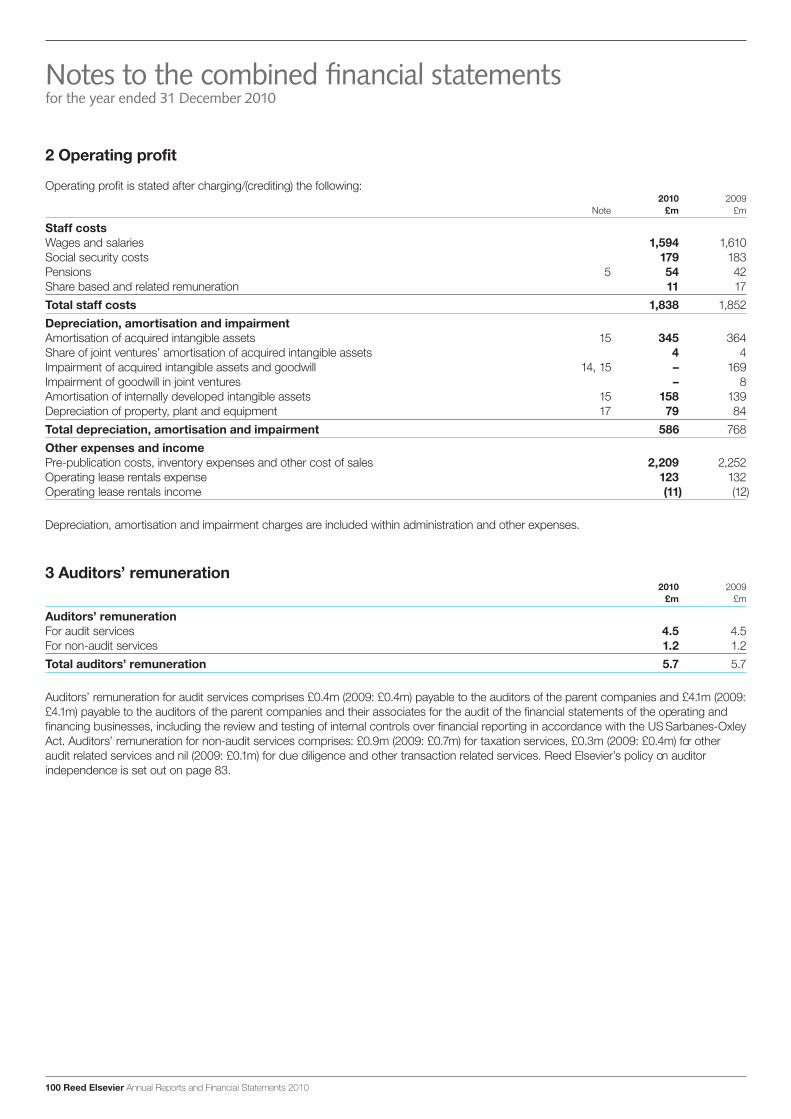
100 Reed Elsevier Annual Reports and Financial Statements 2010
2 Operating profit
Operating profit is stated after charging/(crediting) the following:2010 2009
Note £m £m
Staff costsWages and salaries 1,594 1,610Social security costs 179 183Pensions 5 54 42Share based and related remuneration 11 17Total staff costs 1,838 1,852Depreciation, amortisation and impairmentAmortisation of acquired intangible assets 15 345 364Share of joint ventures’ amortisation of acquired intangible assets 4 4Impairment of acquired intangible assets and goodwill 14, 15 – 169Impairment of goodwill in joint ventures – 8Amortisation of internally developed intangible assets 15 158 139 Depreciation of property, plant and equipment 17 79 84Total depreciation, amortisation and impairment 586 768Other expenses and incomePre-publication costs, inventory expenses and other cost of sales 2,209 2,252Operating lease rentals expense 123 132Operating lease rentals income (11) (12)
Depreciation, amortisation and impairment charges are included within administration and other expenses.
3 Auditors’ remuneration2010 2009
£m £m
Auditors’ remunerationFor audit services 4.5 4.5For non-audit services 1.2 1.2Total auditors’ remuneration 5.7 5.7
Auditors’ remuneration for audit services comprises £0.4m (2009: £0.4m) payable to the auditors of the parent companies and £4.1m (2009: £4.1m) payable to the auditors of the parent companies and their associates for the audit of the financial statements of the operating and financing businesses, including the review and testing of internal controls over financial reporting in accordance with the US Sarbanes-Oxley Act. Auditors’ remuneration for non-audit services comprises: £0.9m (2009: £0.7m) for taxation services, £0.3m (2009: £0.4m) for other audit related services and nil (2009: £0.1m) for due diligence and other transaction related services. Reed Elsevier’s policy on auditor independence is set out on page 83.
Notes to the combined financial statementsfor the year ended 31 December 2010
47213_Text_p085-128.indd 100 1/3/11 10:38:38

Annual Reports and Financial Statements 2010 Reed Elsevier 101
Overview
Our business
Financial reviewG
overnanceFinancial statem
ents and other information
Combined financial statements
4 Personnel
At 31 December Average during the year
Number of people employed 2010 2009 2010 2009
Business segmentElsevier 6,700 6,800 6,800 6,900LexisNexis 14,700 15,200 14,900 15,400Reed Exhibitions 2,600 2,500 2,600 2,600Reed Business Information 5,300 6,900 5,800 7,500Sub-total 29,300 31,400 30,100 32,400Corporate/shared functions 900 900 900 900Total 30,200 32,300 31,000 33,300Geographical locationNorth America 16,500 17,600 16,900 18,000 United Kingdom 4,600 4,900 4,700 5,000 The Netherlands 1,700 2,000 1,800 2,100 Rest of Europe 3,800 4,200 4,000 4,500 Rest of world 3,600 3,600 3,600 3,700 Total 30,200 32,300 31,000 33,300
5 Pension schemes
A number of pension schemes are operated around the world. The major schemes are of the defined benefit type with assets held in separate trustee administered funds. The largest schemes, which cover the majority of employees, are in the UK, the US and the Netherlands. Under these plans, employees are entitled to retirement benefits dependent on the number of years service provided.
The principal assumptions for the purpose of valuation under IAS19 – Employee Benefits are determined for each scheme in conjunction with the respective schemes’ independent actuaries and are presented below as the weighted average of the various defined benefit pension schemes. The defined benefit pension expense for each year is based on the assumptions and scheme valuations set at 31 December of the prior year.
As at 31 December
2010 2009 2008
Discount rate 5.6% 5.8% 6.2%Expected rate of return on scheme assets 6.8% 7.0% 7.1%Expected rate of salary increases 4.1% 4.0% 3.7%Inflation 3.2% 3.1% 2.7%Future pension increases 3.2% 3.1% 2.8%
The expected rates of return on individual categories of scheme assets are determined by reference to relevant market indices and market expectations of real rates of return. The overall expected rate of return on scheme assets is based on the weighted average of each asset category.
Mortality assumptions used in assessing defined benefit obligations make allowance for future improvements in longevity and have been determined by reference to applicable mortality statistics and the actuaries’ expectations for each scheme. The average life expectancies assumed in the valuation of the defined benefit obligations are set out below.
2010 2009
Male Female Male Female Average life expectancy (at 31 December) (years) (years) (years) (years)
Member currently aged 60 88 87 88 87Member currently aged 45 89 88 88 87
Notes to the combined financial statementsfor the year ended 31 December 2010
47213_Text_p085-128.indd 101 1/3/11 10:38:38
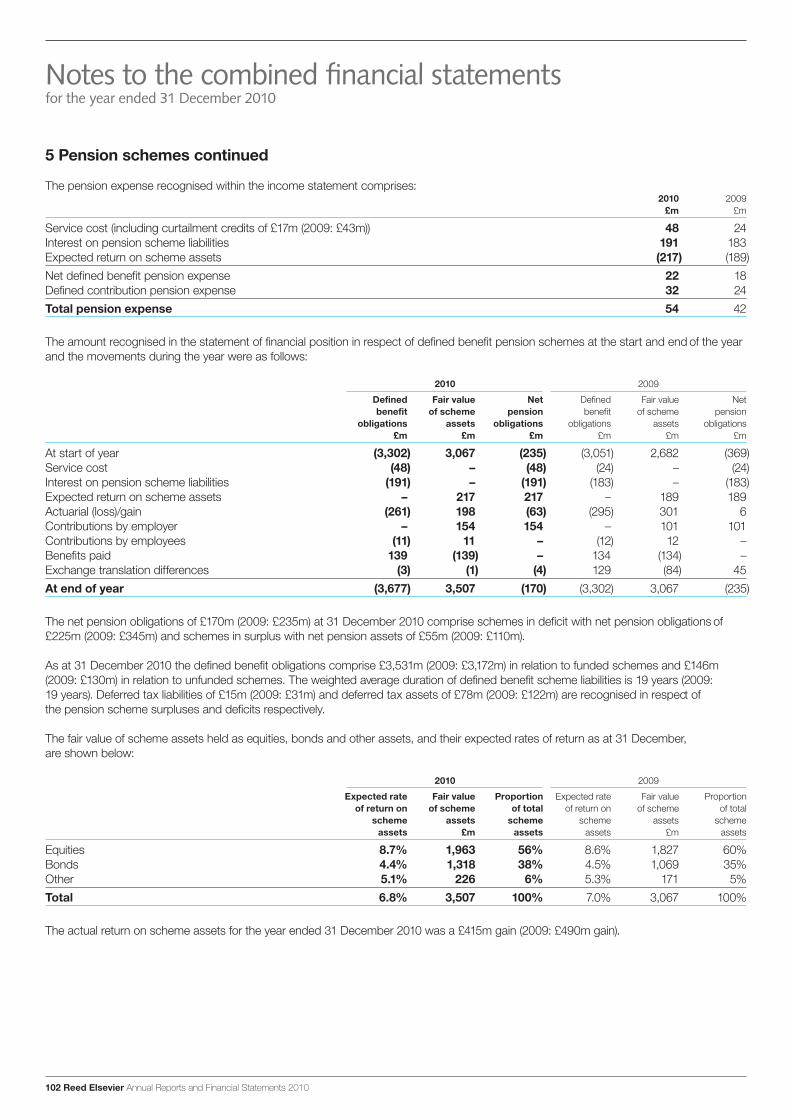
102 Reed Elsevier Annual Reports and Financial Statements 2010
5 Pension schemes continued
The pension expense recognised within the income statement comprises:2010 2009
£m £m
Service cost (including curtailment credits of £17m (2009: £43m)) 48 24Interest on pension scheme liabilities 191 183Expected return on scheme assets (217) (189)Net defined benefit pension expense 22 18Defined contribution pension expense 32 24Total pension expense 54 42
The amount recognised in the statement of financial position in respect of defined benefit pension schemes at the start and end of the year and the movements during the year were as follows:
2010 2009
Defined Fair value Net Defined Fair value Net benefit of scheme pension benefit of scheme pension
obligations assets obligations obligations assets obligations £m £m £m £m £m £m
At start of year (3,302) 3,067 (235) (3,051) 2,682 (369)Service cost (48) – (48) (24) – (24)Interest on pension scheme liabilities (191) – (191) (183) – (183)Expected return on scheme assets – 217 217 – 189 189Actuarial (loss)/gain (261) 198 (63) (295) 301 6Contributions by employer – 154 154 – 101 101Contributions by employees (11) 11 – (12) 12 –Benefits paid 139 (139) – 134 (134) –Exchange translation differences (3) (1) (4) 129 (84) 45At end of year (3,677) 3,507 (170) (3,302) 3,067 (235)
The net pension obligations of £170m (2009: £235m) at 31 December 2010 comprise schemes in deficit with net pension obligations of £225m (2009: £345m) and schemes in surplus with net pension assets of £55m (2009: £110m).
As at 31 December 2010 the defined benefit obligations comprise £3,531m (2009: £3,172m) in relation to funded schemes and £146m (2009: £130m) in relation to unfunded schemes. The weighted average duration of defined benefit scheme liabilities is 19 years (2009: 19 years). Deferred tax liabilities of £15m (2009: £31m) and deferred tax assets of £78m (2009: £122m) are recognised in respect of the pension scheme surpluses and deficits respectively.
The fair value of scheme assets held as equities, bonds and other assets, and their expected rates of return as at 31 December, are shown below:
2010 2009
Expected rate Fair value Proportion Expected rate Fair value Proportion of return on of scheme of total of return on of scheme of total
scheme assets scheme scheme assets scheme assets £m assets assets £m assets
Equities 8.7% 1,963 56% 8.6% 1,827 60%Bonds 4.4% 1,318 38% 4.5% 1,069 35%Other 5.1% 226 6% 5.3% 171 5%Total 6.8% 3,507 100% 7.0% 3,067 100%
The actual return on scheme assets for the year ended 31 December 2010 was a £415m gain (2009: £490m gain).
Notes to the combined financial statementsfor the year ended 31 December 2010
47213_Text_p085-128.indd 102 1/3/11 10:38:38
Annual Reports and Financial Statements 2010 Reed Elsevier 103
Overview
Our business
Financial reviewG
overnanceFinancial statem
ents and other information
Combined financial statements
5 Pension schemes continued
A summary of pension balances in respect of funded and unfunded schemes for the five years ended 31 December 2010 is set out below.
2010 2009 2008 2007 2006 £m £m £m £m £m
Fair value of scheme assets 3,507 3,067 2,682 3,018 2,772Defined benefit obligations (3,677) (3,302) (3,051) (2,968) (3,008)Net pension (obligations)/surplus (170) (235) (369) 50 (236)
Gains and losses arising on the revaluation of pension scheme assets and liabilities that have been recognised in the statement of comprehensive income are set out below:
2010 2009 2008 2007 2006 £m £m £m £m £m
Gains and losses arising during the year:Experience (losses)/gains on scheme liabilities (43) 18 (9) (28) (30)Experience gains/(losses) on scheme assets 198 301 (765) 34 99
Actuarial (losses)/gains arising on the present value of scheme liabilities due to changes in:– discount rates (162) (249) 202 367 198– inflation (50) (124) 198 (152) (77)– life expectancy and other actuarial assumptions (6) 60 27 3 (51)
(63) 6 (347) 224 139Net cumulative (losses)/gains at start of year (89) (95) 252 28 (111)Net cumulative (losses)/gains at end of year (152) (89) (95) 252 28
Regular contributions to defined benefit pension schemes in respect of 2011 are expected to be approximately £70m.
Sensitivity analysisValuation of Reed Elsevier’s pension scheme liabilities involves judgements about uncertain events, including the life expectancy of the members, salary and pension increases, inflation and the rate at which the future pension payments are discounted. Estimates are used for each of these factors, determined in conjunction with independent actuaries. Differences arising from actual experience or future changes in assumptions may materially affect future pension charges. In particular, changes in assumptions for discount rates, inflation and life expectancies would have the following approximate effects on the annual net pension expense and the defined benefit pension obligations:
£m
Increase/decrease of 0.25% in discount rate:Decrease/increase in annual net pension expense 5Decrease/increase in defined benefit pension obligations 162
Increase/decrease of one year in assumed life expectancy:Increase/decrease in annual net pension expense 5Increase/decrease in defined benefit pension obligations 87
Increase/decrease of 0.25% in the expected inflation rate:Increase/decrease in annual net pension expense 5Increase/decrease in defined benefit pension obligations 137
Additionally, the annual net pension expense includes an expected return on scheme assets. A 5% increase/decrease in the market value of equity investments held by the defined benefit pension schemes would, absent any change in their expected long term rate of return, increase/decrease the amount of the expected return on scheme assets by £9m and would decrease/increase the amount of the net pension obligations by £98m.
Notes to the combined financial statementsfor the year ended 31 December 2010
47213_Text_p085-128.indd 103 2/3/11 22:31:11

104 Reed Elsevier Annual Reports and Financial Statements 2010
6 Share based remuneration
Reed Elsevier provides a number of share based remuneration schemes to directors and employees. The principal share based remuneration schemes are the Executive Share Option Schemes (ESOS), the Long Term Incentive Plan (LTIP), the Reed Elsevier Growth Plan (REGP), the Retention Share Plan (RSP) and the Bonus Investment Plan (BIP). Share options granted under ESOS and LTIP are exercisable after three years and up to ten years from the date of grant at a price equivalent to the market value of the respective shares at the date of grant. Conditional shares granted under ESOS, LTIP, RSP and BIP are exercisable after three years for nil consideration if conditions are met. Conditional shares granted under REGP are exercisable for nil consideration if conditions are met after three and five years. Other awards principally relate to all employee share based saving schemes in the UK and the Netherlands.
Share based remuneration awards are, other than in exceptional circumstances, subject to the condition that the employee remains in employment at the time of exercise. Share options and conditional shares granted under LTIP, RSP and BIP in 2009 and prior years are subject to the achievement of growth targets of Reed Elsevier PLC and Reed Elsevier NV adjusted earnings per share measured at constant exchange rates. LTIP grants made in 2006, 2007, 2008 and 2009 are also variable subject to the achievement of an additional total shareholder return performance target.
Conditional shares granted under LTIP, REGP, RSP and BIP in 2010 are subject to the achievement of growth targets of Reed Elsevier PLC and Reed Elsevier NV adjusted earnings per share measured at constant exchange rates as well as the achievement of a percentage return on invested capital of Reed Elsevier PLC and Reed Elsevier NV.
The weighted average fair value per award is based on full vesting on achievement of non market related performance conditions and stochastic models for market related components. The conditional shares and option awards are recognised in the income statement over the vesting period, being between three and five years, on the basis of expected performance against the non market related conditions, with the fair value related to market related components unchanging. Further details of performance conditions are given in the Directors’ Remuneration Report on pages 62 to 80.
In respect of In respect of Reed Elsevier PLC ordinary shares Reed Elsevier NV ordinary shares
Weighted Weighted average fair average fair Number of value Number of value shares per award shares per award 2010 grants ’000 £ ’000 £
Share options– ESOS 2,204 0.77 1,448 1.08– Other 846 0.99 381 0.82
Total share options 3,050 0.83 1,829 1.02Conditional shares
– ESOS 751 4.23 493 6.37– LTIP 1,677 4.01 1,101 6.11– REGP 1,038 6.99 681 10.66– RSP 236 4.23 155 6.37– BIP 1,714 4.64 820 6.93
Total conditional shares 5,416 4.82 3,250 7.32
In respect of In respect of Reed Elsevier PLC ordinary shares Reed Elsevier NV ordinary shares
Weighted Weighted average fair average fair Number of value Number of value shares per award shares per award 2009 grants ’000 £ ’000 £
Share options– ESOS 4,303 0.93 2,799 1.44– Other 1,284 1.25 588 0.87
Total share options 5,587 1.00 3,387 1.34Conditional shares
– ESOS 770 4.91 500 7.52– LTIP 1,845 6.26 1,198 9.73– RSP 204 4.95 133 7.58– BIP 661 4.48 352 6.48
Total conditional shares 3,480 5.55 2,183 8.57
Notes to the combined financial statementsfor the year ended 31 December 2010
47213_Text_p085-128.indd 104 1/3/11 10:38:38

Annual Reports and Financial Statements 2010 Reed Elsevier 105
Overview
Our business
Financial reviewG
overnanceFinancial statem
ents and other information
Combined financial statements
6 Share based remuneration continued
The main assumptions used to determine the fair values, which have been established with advice from and data provided by independent actuaries, are set out below.
In respect of In respect of Reed Elsevier PLC Reed Elsevier NV
ordinary shares ordinary shares
Assumptions for grants made during the year 2010 2009 2010 2009
Weighted average share price at date of grant– ESOS £4.69 £5.39 8.36 9.35– LTIP £4.67 £5.44 8.31 9.50– REGP £4.67 – 8.31 –– RSP £4.67 £5.42 8.33 9.42– BIP £4.64 £4.91 8.11 8.05– Other £5.22 £5.02 8.86 8.31
Expected share price volatility 26% 26% 26% 26% Expected option life 4 years 4 years 4 years 4 years Expected dividend yield 3.5% 3.1% 3.9% 3.4% Risk free interest rate 1.8% 2.0% 1.2% 2.4% Expected lapse rate 3-5% 3-5% 3-4% 3-4%
Expected share price volatility has been estimated based on relevant historic data in respect of the Reed Elsevier PLC and Reed Elsevier NV ordinary share prices. Expected share option life has been estimated based on historical exercise patterns in respect of Reed Elsevier PLC and Reed Elsevier NV share options.
The share based remuneration awards outstanding as at 31 December 2010, in respect of both Reed Elsevier PLC and Reed Elsevier NV ordinary shares, are set out below.
ESOS LTIP Other Total
Weighted Weighted Weighted Weighted average average average average
Number of exercise Number of exercise Number of exercise Number of exercise Share options: shares price shares price shares price shares price Reed Elsevier PLC ’000 (pence) ’000 (pence) ’000 (pence) ’000 (pence)
Outstanding at 1 January 2009 30,172 562 2,325 489 2,631 454 35,128 549Granted 4,303 539 – – 1,284 402 5,587 508Exercised (781) 436 – – (436) 404 (1,217) 424Forfeited (1,638) 602 – – (578) 469 (2,216) 549 Expired (1,490) 522 (66) 487 (41) 408 (1,597) 518 Outstanding at 1 January 2010 30,566 562 2,259 489 2,860 436 35,685 547Granted 2,204 469 – – 846 418 3,050 455Exercised (1,039) 481 (269) 487 (700) 447 (2,008) 470Forfeited (988) 560 – – (367) 432 (1,355) 496Expired (1,494) 578 – – (167) 425 (1,661) 554Outstanding at 31 December 2010 29,249 557 1,990 489 2,472 428 33,711 544
Exercisable at 31 December 2009 20,763 547 2,259 489 349 422 23,371 540Exercisable at 31 December 2010 19,929 559 1,990 489 129 468 22,048 552
Notes to the combined financial statementsfor the year ended 31 December 2010
47213_Text_p085-128.indd 105 1/3/11 10:38:38

106 Reed Elsevier Annual Reports and Financial Statements 2010
6 Share based remuneration continued
ESOS LTIP Other Total
Weighted Weighted Weighted Weighted average average average average
Number of exercise Number of exercise Number of exercise Number of exercise Share options: shares price shares price shares price shares price Reed Elsevier NV ’000 ( ) ’000 ( ) ’000 ( ) ’000 ( )
Outstanding at 1 January 2009 21,811 12.23 1,809 10.60 2,357 12.19 25,977 12.11Granted 2,799 9.35 – – 588 8.31 3,387 9.17 Exercised – – – – (32) 7.93 (32) 7.93 Forfeited (1,203) 11.73 – – (376) 12.00 (1,579) 11.84 Expired (1,790) 11.98 (46) 10.57 – – (1,836) 11.94 Outstanding at 1 January 2010 21,617 11.88 1,763 10.60 2,537 11.32 25,917 11.74Granted 1,448 8.36 – – 381 8.86 1,829 8.45 Exercised (50) 9.31 – – (134) 8.38 (184) 8.63Forfeited (556) 10.16 – – (452) 14.01 (1,008) 8.75Expired (1,499) 13.00 (222) 10.57 – – (1,721) 6.71Outstanding at 31 December 2010 20,960 11.61 1,541 10.60 2,332 10.57 24,833 11.45
Exercisable at 31 December 2009 15,217 12.01 1,763 10.60 2,537 11.32 19,517 11.79Exercisable at 31 December 2010 14,862 12.22 1,541 10.60 2,332 10.57 18,735 11.88
Number of shares ’000
Conditional shares: Reed Elsevier PLC ESOS LTIP REGP RSP BIP Total
Outstanding at 1 January 2009 2,051 4,516 – 35 1,901 8,503Granted 770 1,845 – 204 661 3,480Exercised (867) (1,767) – (24) (622) (3,280)Forfeited (87) (442) – – (26) (555)Outstanding at 1 January 2010 1,867 4,152 – 215 1,914 8,148Granted 751 1,677 1,038 236 1,714 5,416Exercised (594) (15) – (4) (65) (678)Forfeited (81) (595) – – (173) (849)Outstanding at 31 December 2010 1,943 5,219 1,038 447 3,390 12,037
Number of shares ’000
Conditional shares: Reed Elsevier NV ESOS LTIP REGP RSP BIP Total
Outstanding at 1 January 2009 1,358 2,978 – 24 838 5,198Granted 500 1,198 – 133 352 2,183Exercised (580) (1,162) – (17) (315) (2,074)Forfeited (65) (311) – – (10) (386)Outstanding at 1 January 2010 1,213 2,703 – 140 865 4,921Granted 493 1,101 681 155 820 3,250Exercised (389) (10) – (3) (23) (425)Forfeited (47) (324) – – (82) (453)Outstanding at 31 December 2010 1,270 3,470 681 292 1,580 7,293
The weighted average share price at the date of exercise of share options and conditional shares during 2010 was 522p (2009: 506p) for Reed Elsevier PLC ordinary shares and 8.82 (2009: 8.45) for Reed Elsevier NV ordinary shares.
Notes to the combined financial statementsfor the year ended 31 December 2010
47213_Text_p085-128.indd 106 1/3/11 10:38:38
Annual Reports and Financial Statements 2010 Reed Elsevier 107
Overview
Our business
Financial reviewG
overnanceFinancial statem
ents and other information
Combined financial statements
6 Share based remuneration continued
2010 2009
Weighted Weighted Number average Number average
of shares remaining of shares remaining under period until under period until option expiry option expiry
Range of exercise prices for outstanding share options ’000 (years) ’000 (years)
Reed Elsevier PLC ordinary shares (pence)351-400 – – 16 0.3 401-450 2,017 3.3 2,157 2.6451-500 8,919 4.5 8,219 2.9501-550 11,299 5.6 12,638 6.0551-600 3,153 1.6 3,593 2.3 601-650 6,053 6.6 6,600 7.6651-700 2,270 0.2 2,462 1.2Total 33,711 4.6 35,685 4.3Reed Elsevier NV ordinary shares (euro)7.01-8.00 137 8.2 175 9.28.01-9.00 2,062 9.0 511 9.09.01-10.00 3,915 6.0 4,011 6.8 10.01-11.00 4,385 3.3 4,912 4.4 11.01-12.00 5,670 4.4 6,297 5.112.01-13.00 2,653 6.8 2,854 7.413.01-14.00 2,502 1.4 2,990 2.514.01-15.00 3,414 3.2 3,971 4.0 15.01-16.00 95 0.8 196 1.3Total 24,833 3.9 25,917 5.2
Share options are expected, upon exercise, to be met principally by the issue of new ordinary shares but may also be met from shares held by the Reed Elsevier Group plc Employee Benefit Trust (EBT) (see note 30). Conditional shares will be met from shares held by the EBT.
Notes to the combined financial statementsfor the year ended 31 December 2010
47213_Text_p085-128.indd 107 1/3/11 10:38:38
108 Reed Elsevier Annual Reports and Financial Statements 2010
7 Net finance costs
2010 2009 £m £m
Interest on short term bank loans, overdrafts and commercial paper (33) (63)Interest on other loans (236) (226)Interest on obligations under finance leases (1) (1)Total borrowing costs (270) (290)Losses on derivatives not designated as hedges (14) (8)Finance costs (284) (298)Interest on bank deposits 7 5Gains on loans and derivatives not designated as hedges 1 2Finance income 8 7Net finance costs (276) (291)
Finance costs include £26m (2009: £46m) transferred from the hedge reserve. A net loss of £15m (2009: £11m) on interest rate derivatives designated as cash flow hedges was recognised directly in equity in the hedge reserve to be recognised in future periods.
8 Disposals and other non operating items
2010 2009 £m £m
Revaluation of held for trading investments 8 8Loss on disposal and write down of businesses and other assets (54) (69)Net loss on disposals and other non operating items (46) (61)
The loss on disposal and write down of businesses and other assets in 2009 and 2010 principally relate to asset sales and closures in RBI US’s businesses.
9 Taxation
2010 2009 £m £m
Current taxUnited Kingdom 44 44The Netherlands 58 37Rest of world 64 (1)
Total current tax charge 166 80Deferred tax
Origination and reversal of temporary differences (46) (40)Total taxation charge 120 40
The current tax charge includes a tax credit of £7m (2009: £34m) in respect of prior year disposals.
Notes to the combined financial statementsfor the year ended 31 December 2010
47213_Text_p085-128.indd 108 1/3/11 10:38:38

Annual Reports and Financial Statements 2010 Reed Elsevier 109
Overview
Our business
Financial reviewG
overnanceFinancial statem
ents and other information
Combined financial statements
9 Taxation continued
A reconciliation of the notional tax charge based on average applicable rates of tax (weighted in proportion to accounting profits) to the actual total tax expense is set out below.
2010 2009 £m £m
Profit before tax 768 435Tax at average applicable rates 118 41Tax on share of results of joint ventures (7) (6)Prior year credits on disposals (7) (34)Non deductible goodwill impairment – 19Non deductible loss on disposals 10 –Net tax on share based remuneration 2 10Non deductible amounts and other items 4 10Tax expense 120 40Tax expense as a percentage of profit before tax 16% 9%
The following tax has been recognised directly in equity during the year.2010 2009
£m £m
Tax on actuarial movements on defined benefit pension schemes 16 (10)Tax on fair value movements on cash flow hedges 12 (15)Deferred tax charge on share based remuneration 1 –Net tax credit/(charge) recognised directly in equity 29 (25)
10 Adjusted figures
Reed Elsevier uses adjusted figures as additional performance measures. Adjusted figures are stated before amortisation and impairment of acquired intangible assets and goodwill, exceptional restructuring and acquisition related costs, disposal gains and losses and other non operating items, related tax effects and movements in deferred taxation assets and liabilities that are not expected to crystallise in the near term and includes the benefit of tax amortisation where available on acquired goodwill and intangible assets. Adjusted operating profit is also grossed up to exclude the equity share of taxes in joint ventures. Exceptional restructuring costs in 2010 relate to the restructuring of the Reed Business Information business and in 2009 relate to the exceptional restructuring programmes across Reed Elsevier. Acquisition related costs relate to acquisition integration and, from 2010, professional and other transaction related fees and adjustments to deferred and contingent consideration.
Adjusted operating cash flow is measured after net capital expenditure and dividends from joint ventures but before payments in relation to exceptional restructuring and acquisition related costs. Adjusted figures are derived as follows:
2010 2009 £m £m
Operating profit 1,090 787Adjustments:
Amortisation of acquired intangible assets 349 368Impairment of acquired intangible assets and goodwill – 177Exceptional restructuring costs 57 182Acquisition related costs 50 48Reclassification of tax in joint ventures 9 8
Adjusted operating profit 1,555 1,570
Profit before tax 768 435Adjustments:
Amortisation of acquired intangible assets 349 368Impairment of acquired intangible assets and goodwill – 177Exceptional restructuring costs 57 182Acquisition related costs 50 48Reclassification of tax in joint ventures 9 8Disposals and other non operating items 46 61
Adjusted profit before tax 1,279 1,279
Notes to the combined financial statementsfor the year ended 31 December 2010
47213_Text_p085-128.indd 109 1/3/11 10:38:38

110 Reed Elsevier Annual Reports and Financial Statements 2010
10 Adjusted figures continued
2010 2009 £m £m
Profit attributable to parent companies’ shareholders 642 391Adjustments (post tax):
Amortisation of acquired intangible assets 337 411Impairment of acquired intangible assets and goodwill – 136Exceptional restructuring costs 37 133Acquisition related costs 30 33Disposals and other non operating items 37 (22)Deferred tax credits on acquired intangible assets not expected to crystallise in the near term (100) (100)
Adjusted profit attributable to parent companies’ shareholders 983 982
Cash generated from operations 1,649 1,604Dividends received from joint ventures 24 23Purchases of property, plant and equipment (83) (78)Proceeds from disposals of property, plant and equipment 7 4Expenditure on internally developed intangible assets (228) (164)Payments in relation to exceptional restructuring costs 99 124Payments in relation to acquisition related costs 51 45Adjusted operating cash flow 1,519 1,558
11 Statement of cash flows
2010 2009
Reconciliation of operating profit before joint ventures to cash generated from operations £m £m
Operating profit before joint ventures 1,068 772
Amortisation and impairment of acquired intangible assets and goodwill 345 533Amortisation of internally developed intangible assets 158 139Depreciation of property, plant and equipment 79 84Share based remuneration (7) 17Total non cash items 575 773Decrease in inventories and pre-publication costs 35 47Decrease in receivables 24 112Decrease in payables (53) (100)Decrease in working capital 6 59Cash generated from operations 1,649 1,604
2010 2009 Cash flow on acquisitions Note £m £m
Purchase of businesses 12 (38) (9)Payment of ChoicePoint change of control and other non operating payables assumed (7) (56)Deferred payments relating to prior year acquisitions (5) (29)Total (50) (94)
Notes to the combined financial statementsfor the year ended 31 December 2010
47213_Text_p085-128.indd 110 1/3/11 10:38:39
Annual Reports and Financial Statements 2010 Reed Elsevier 111
Overview
Our business
Financial reviewG
overnanceFinancial statem
ents and other information
Combined financial statements
11 Statement of cash flows continued
Related derivative
Cash & cash financial equivalents Borrowings instruments 2010 2009
Reconciliation of net borrowings £m £m £m £m £m
At start of year 734 (4,706) 41 (3,931) (5,726)
Increase in cash and cash equivalents – – – – 301Net movement in short term bank loans, overdrafts and
commercial paper – 143 – 143 (107)Issuance of other loans – – – – (1,807)Repayment of other loans – 394 – 394 2,862Repayment of finance leases – 7 – 7 2Change in net borrowings resulting from cash flows – 544 – 544 1,251Inception of finance leases – (2) – (2) (26)Fair value adjustments to borrowings and related derivatives – (52) 63 11 11Exchange translation differences 8 (86) 1 (77) 559At end of year 742 (4,302) 105 (3,455) (3,931)
Net borrowings comprise cash and cash equivalents, loan capital, finance leases, promissory notes, bank and other loans, and those derivative financial instruments that are used to hedge the fair value of fixed rate borrowings.
Cash and cash equivalents include £4m (2009: £5m) held in trust to satisfy liabilities in respect of change of control obligations related to the acquisition of ChoicePoint.
12 Acquisitions
During the year a number of small acquisitions were made for a total consideration of £43m (2009: £11m), after taking account of net cash acquired of nil. The net assets of the businesses acquired are incorporated at their fair value to the combined businesses. Provisional fair values of the consideration given and of the assets and liabilities acquired are summarised below.
Fair Fair value value 2010 2009
£m £m
Goodwill 27 6Intangible assets 27 17Current liabilities (2) (11)Deferred tax (9) (1)Net assets acquired 43 11Consideration (after taking account of nil net cash acquired) 43 11Less: consideration deferred to future years (5) (2)Net cash flow 38 9
Goodwill, being the excess of the consideration over the net tangible and intangible assets acquired, represents benefits which do not qualify for recognition as intangible assets, including the ability of a business to generate higher returns than individual assets, skilled workforces, acquisition synergies that are specific to Reed Elsevier, and high barriers to market entry. In addition, goodwill arises on the recognition of deferred tax liabilities in respect of intangible assets for which amortisation does not qualify for tax deductions.
Notes to the combined financial statementsfor the year ended 31 December 2010
47213_Text_p085-128.indd 111 1/3/11 10:38:39

112 Reed Elsevier Annual Reports and Financial Statements 2010
12 Acquisitions continued
The fair values of the assets and liabilities acquired are provisional pending the completion of the valuation exercises. Final fair values will be incorporated in the 2011 combined financial statements. There were no significant adjustments to the provisional fair values of prior year acquisitions established in 2009.
The businesses acquired in 2010 contributed £2m to revenue, decreased adjusted operating profit by £1m, decreased adjusted profit attributable by £1m, decreased profit attributable by £3m, and contributed nil net cash inflow from operating activities for the part year under Reed Elsevier ownership and before taking account of acquisition financing costs. Had the businesses been acquired at the beginning of the year, on a pro forma basis the Reed Elsevier revenues, adjusted operating profit, adjusted profit attributable and profit attributable for the year would have been £6,065m, £1,556m, £984m and £643m respectively before taking account of acquisition financing costs.
13 Equity dividends
2010 2009 Ordinary dividends declared in the year £m £m
Reed Elsevier PLC 245 228Reed Elsevier NV 240 232Total 485 460
Ordinary dividends declared in the year, in amounts per ordinary share, comprise: a 2009 final dividend of 15.0p and a 2010 interim dividend of 5.4p giving a total of 20.4p (2009: 20.4p) for Reed Elsevier PLC; and a 2009 final dividend of 0.293 and a 2010 interim dividend of 0.109 giving a total of 0.402 (2009: 0.397) for Reed Elsevier NV.
The directors of Reed Elsevier PLC have proposed a final dividend of 15.0p (2009: 15.0p). The directors of Reed Elsevier NV have proposed a final dividend of 0.303 (2009: 0.293). The total cost of funding the proposed final dividends is expected to be £361m, for which no liability has been recognised at the statement of financial position date.
2010 2009 Ordinary dividends paid and proposed relating to the financial year £m £m
Reed Elsevier PLC 245 245Reed Elsevier NV 246 250Total 491 495
Dividends paid to Reed Elsevier PLC and Reed Elsevier NV shareholders are, other than in special circumstances, equalised at the gross level inclusive of the UK tax credit of 10% received by certain Reed Elsevier PLC shareholders. The cost of funding the Reed Elsevier PLC dividends is therefore similar to that of Reed Elsevier NV.
14 Goodwill
2010 2009 £m £m
At start of year 4,339 4,901Acquisitions 27 6Disposals (38) (7)Impairment – (110)Reclassified from held for sale – 22Exchange translation differences 113 (473)At end of year 4,441 4,339
Notes to the combined financial statementsfor the year ended 31 December 2010
47213_Text_p085-128.indd 112 1/3/11 10:38:39
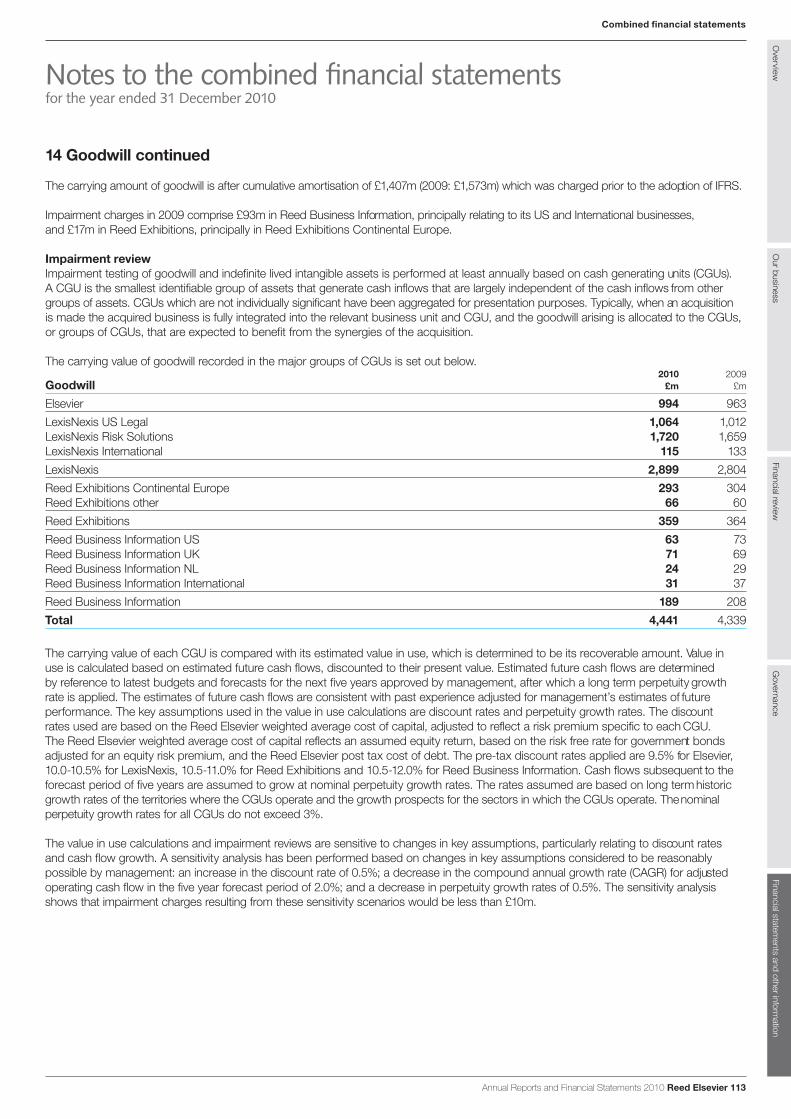
Annual Reports and Financial Statements 2010 Reed Elsevier 113
Overview
Our business
Financial reviewG
overnanceFinancial statem
ents and other information
Combined financial statements
14 Goodwill continued
The carrying amount of goodwill is after cumulative amortisation of £1,407m (2009: £1,573m) which was charged prior to the adoption of IFRS.
Impairment charges in 2009 comprise £93m in Reed Business Information, principally relating to its US and International businesses, and £17m in Reed Exhibitions, principally in Reed Exhibitions Continental Europe.
Impairment reviewImpairment testing of goodwill and indefinite lived intangible assets is performed at least annually based on cash generating units (CGUs). A CGU is the smallest identifiable group of assets that generate cash inflows that are largely independent of the cash inflows from other groups of assets. CGUs which are not individually significant have been aggregated for presentation purposes. Typically, when an acquisition is made the acquired business is fully integrated into the relevant business unit and CGU, and the goodwill arising is allocated to the CGUs, or groups of CGUs, that are expected to benefit from the synergies of the acquisition.
The carrying value of goodwill recorded in the major groups of CGUs is set out below.2010 2009
Goodwill £m £m
Elsevier 994 963LexisNexis US Legal 1,064 1,012LexisNexis Risk Solutions 1,720 1,659LexisNexis International 115 133LexisNexis 2,899 2,804Reed Exhibitions Continental Europe 293 304Reed Exhibitions other 66 60Reed Exhibitions 359 364Reed Business Information US 63 73Reed Business Information UK 71 69Reed Business Information NL 24 29Reed Business Information International 31 37Reed Business Information 189 208Total 4,441 4,339
The carrying value of each CGU is compared with its estimated value in use, which is determined to be its recoverable amount. Value in use is calculated based on estimated future cash flows, discounted to their present value. Estimated future cash flows are determined by reference to latest budgets and forecasts for the next five years approved by management, after which a long term perpetuity growth rate is applied. The estimates of future cash flows are consistent with past experience adjusted for management’s estimates of future performance. The key assumptions used in the value in use calculations are discount rates and perpetuity growth rates. The discount rates used are based on the Reed Elsevier weighted average cost of capital, adjusted to reflect a risk premium specific to each CGU. The Reed Elsevier weighted average cost of capital reflects an assumed equity return, based on the risk free rate for government bonds adjusted for an equity risk premium, and the Reed Elsevier post tax cost of debt. The pre-tax discount rates applied are 9.5% for Elsevier, 10.0-10.5% for LexisNexis, 10.5-11.0% for Reed Exhibitions and 10.5-12.0% for Reed Business Information. Cash flows subsequent to the forecast period of five years are assumed to grow at nominal perpetuity growth rates. The rates assumed are based on long term historic growth rates of the territories where the CGUs operate and the growth prospects for the sectors in which the CGUs operate. The nominal perpetuity growth rates for all CGUs do not exceed 3%.
The value in use calculations and impairment reviews are sensitive to changes in key assumptions, particularly relating to discount rates and cash flow growth. A sensitivity analysis has been performed based on changes in key assumptions considered to be reasonably possible by management: an increase in the discount rate of 0.5%; a decrease in the compound annual growth rate (CAGR) for adjusted operating cash flow in the five year forecast period of 2.0%; and a decrease in perpetuity growth rates of 0.5%. The sensitivity analysis shows that impairment charges resulting from these sensitivity scenarios would be less than £10m.
Notes to the combined financial statementsfor the year ended 31 December 2010
47213_Text_p085-128.indd 113 2/3/11 22:32:02
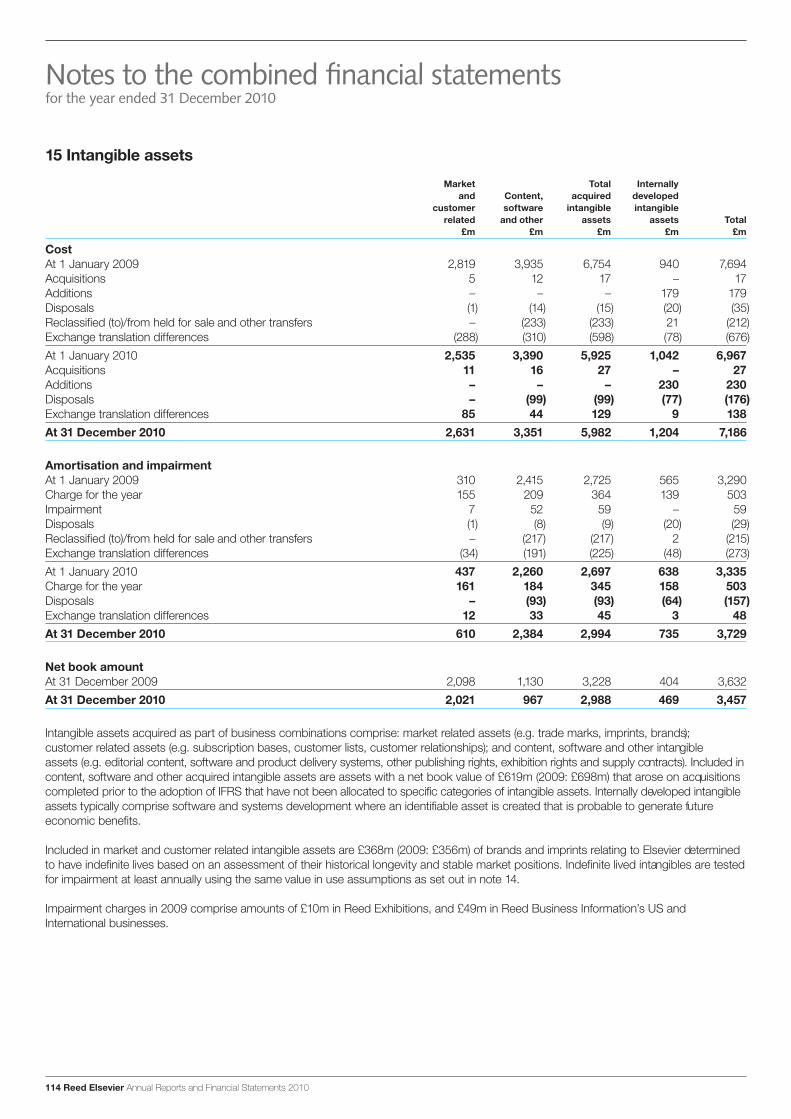
114 Reed Elsevier Annual Reports and Financial Statements 2010
15 Intangible assets
Market Total Internally and Content, acquired developed
customer software intangible intangible related and other assets assets Total
£m £m £m £m £m
CostAt 1 January 2009 2,819 3,935 6,754 940 7,694Acquisitions 5 12 17 – 17Additions – – – 179 179Disposals (1) (14) (15) (20) (35)Reclassified (to)/from held for sale and other transfers – (233) (233) 21 (212)Exchange translation differences (288) (310) (598) (78) (676)At 1 January 2010 2,535 3,390 5,925 1,042 6,967Acquisitions 11 16 27 – 27Additions – – – 230 230Disposals – (99) (99) (77) (176)Exchange translation differences 85 44 129 9 138At 31 December 2010 2,631 3,351 5,982 1,204 7,186
Amortisation and impairmentAt 1 January 2009 310 2,415 2,725 565 3,290Charge for the year 155 209 364 139 503Impairment 7 52 59 – 59Disposals (1) (8) (9) (20) (29)Reclassified (to)/from held for sale and other transfers – (217) (217) 2 (215)Exchange translation differences (34) (191) (225) (48) (273)At 1 January 2010 437 2,260 2,697 638 3,335Charge for the year 161 184 345 158 503Disposals – (93) (93) (64) (157)Exchange translation differences 12 33 45 3 48At 31 December 2010 610 2,384 2,994 735 3,729
Net book amountAt 31 December 2009 2,098 1,130 3,228 404 3,632At 31 December 2010 2,021 967 2,988 469 3,457
Intangible assets acquired as part of business combinations comprise: market related assets (e.g. trade marks, imprints, brands); customer related assets (e.g. subscription bases, customer lists, customer relationships); and content, software and other intangible assets (e.g. editorial content, software and product delivery systems, other publishing rights, exhibition rights and supply contracts). Included in content, software and other acquired intangible assets are assets with a net book value of £619m (2009: £698m) that arose on acquisitions completed prior to the adoption of IFRS that have not been allocated to specific categories of intangible assets. Internally developed intangible assets typically comprise software and systems development where an identifiable asset is created that is probable to generate future economic benefits.
Included in market and customer related intangible assets are £368m (2009: £356m) of brands and imprints relating to Elsevier determined to have indefinite lives based on an assessment of their historical longevity and stable market positions. Indefinite lived intangibles are tested for impairment at least annually using the same value in use assumptions as set out in note 14.
Impairment charges in 2009 comprise amounts of £10m in Reed Exhibitions, and £49m in Reed Business Information’s US and International businesses.
Notes to the combined financial statementsfor the year ended 31 December 2010
47213_Text_p085-128.indd 114 1/3/11 10:38:39
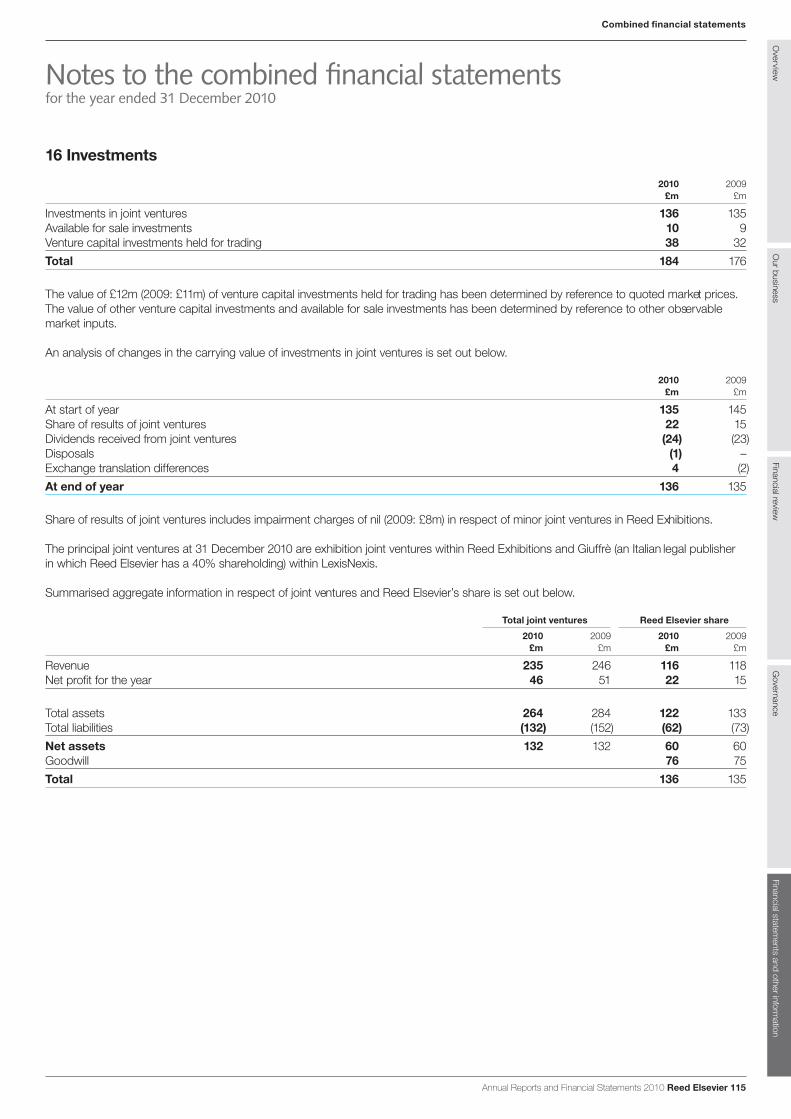
Annual Reports and Financial Statements 2010 Reed Elsevier 115
Overview
Our business
Financial reviewG
overnanceFinancial statem
ents and other information
Combined financial statements
16 Investments
2010 2009 £m £m
Investments in joint ventures 136 135Available for sale investments 10 9Venture capital investments held for trading 38 32Total 184 176
The value of £12m (2009: £11m) of venture capital investments held for trading has been determined by reference to quoted market prices. The value of other venture capital investments and available for sale investments has been determined by reference to other observable market inputs.
An analysis of changes in the carrying value of investments in joint ventures is set out below.
2010 2009 £m £m
At start of year 135 145Share of results of joint ventures 22 15Dividends received from joint ventures (24) (23)Disposals (1) –Exchange translation differences 4 (2)At end of year 136 135
Share of results of joint ventures includes impairment charges of nil (2009: £8m) in respect of minor joint ventures in Reed Exhibitions.
The principal joint ventures at 31 December 2010 are exhibition joint ventures within Reed Exhibitions and Giuffrè (an Italian legal publisher in which Reed Elsevier has a 40% shareholding) within LexisNexis.
Summarised aggregate information in respect of joint ventures and Reed Elsevier’s share is set out below.
Total joint ventures Reed Elsevier share
2010 2009 2010 2009 £m £m £m £m
Revenue 235 246 116 118Net profit for the year 46 51 22 15
Total assets 264 284 122 133Total liabilities (132) (152) (62) (73)Net assets 132 132 60 60Goodwill 76 75Total 136 135
Notes to the combined financial statementsfor the year ended 31 December 2010
47213_Text_p085-128.indd 115 3/3/11 13:33:42
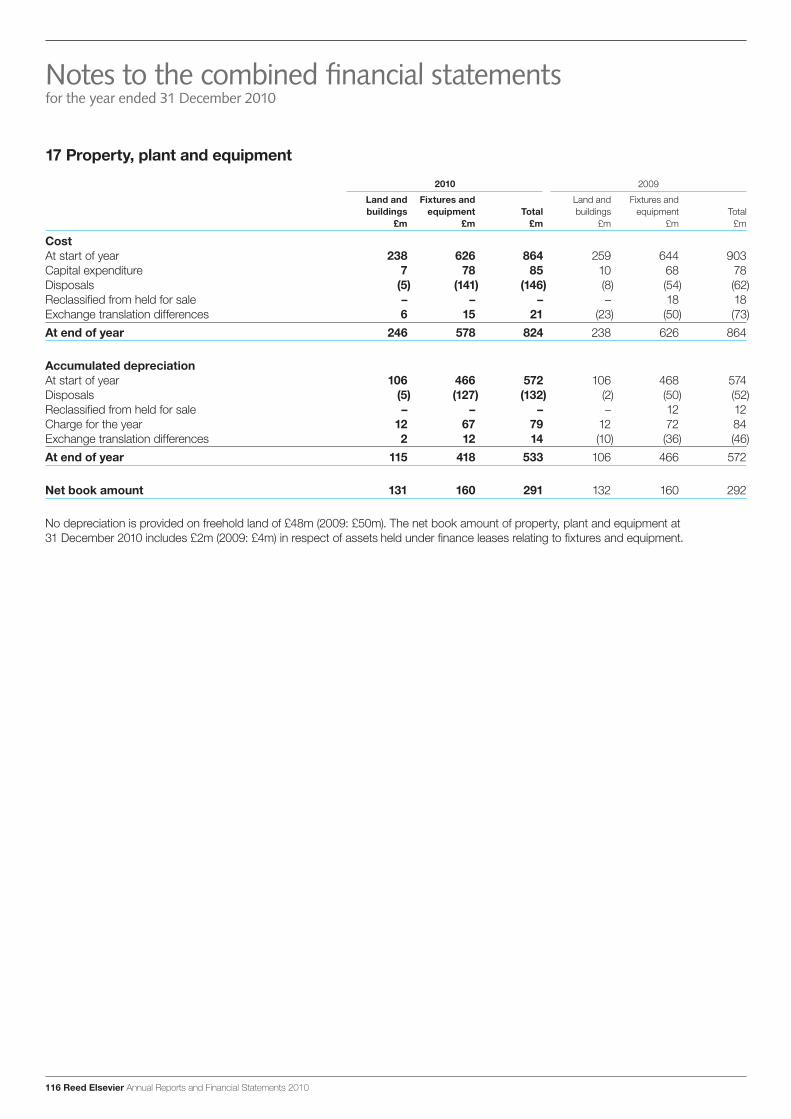
116 Reed Elsevier Annual Reports and Financial Statements 2010
17 Property, plant and equipment
2010 2009
Land and Fixtures and Land and Fixtures and buildings equipment Total buildings equipment Total
£m £m £m £m £m £m
CostAt start of year 238 626 864 259 644 903Capital expenditure 7 78 85 10 68 78Disposals (5) (141) (146) (8) (54) (62)Reclassified from held for sale – – – – 18 18Exchange translation differences 6 15 21 (23) (50) (73)At end of year 246 578 824 238 626 864
Accumulated depreciationAt start of year 106 466 572 106 468 574Disposals (5) (127) (132) (2) (50) (52)Reclassified from held for sale – – – – 12 12Charge for the year 12 67 79 12 72 84Exchange translation differences 2 12 14 (10) (36) (46)At end of year 115 418 533 106 466 572
Net book amount 131 160 291 132 160 292
No depreciation is provided on freehold land of £48m (2009: £50m). The net book amount of property, plant and equipment at 31 December 2010 includes £2m (2009: £4m) in respect of assets held under finance leases relating to fixtures and equipment.
Notes to the combined financial statementsfor the year ended 31 December 2010
47213_Text_p085-128.indd 116 1/3/11 10:38:39
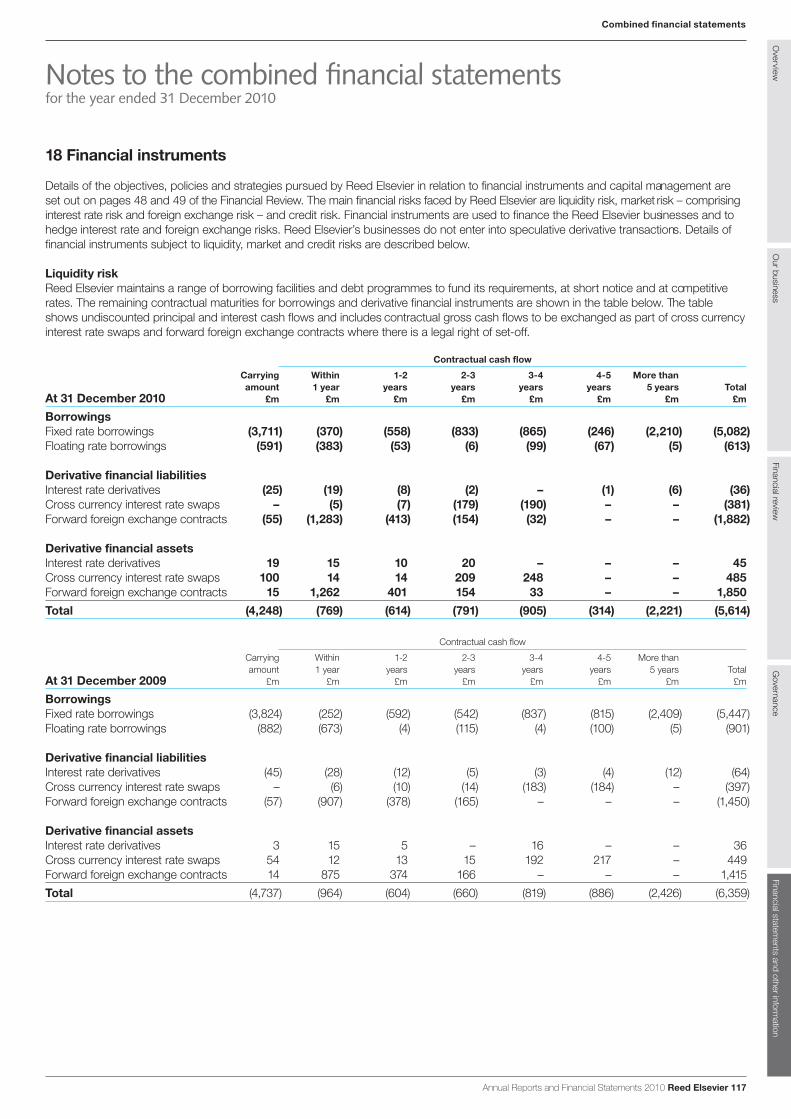
Annual Reports and Financial Statements 2010 Reed Elsevier 117
Overview
Our business
Financial reviewG
overnanceFinancial statem
ents and other information
Combined financial statements
18 Financial instruments
Details of the objectives, policies and strategies pursued by Reed Elsevier in relation to financial instruments and capital management are set out on pages 48 and 49 of the Financial Review. The main financial risks faced by Reed Elsevier are liquidity risk, market risk – comprising interest rate risk and foreign exchange risk – and credit risk. Financial instruments are used to finance the Reed Elsevier businesses and to hedge interest rate and foreign exchange risks. Reed Elsevier’s businesses do not enter into speculative derivative transactions. Details of financial instruments subject to liquidity, market and credit risks are described below.
Liquidity riskReed Elsevier maintains a range of borrowing facilities and debt programmes to fund its requirements, at short notice and at competitive rates. The remaining contractual maturities for borrowings and derivative financial instruments are shown in the table below. The table shows undiscounted principal and interest cash flows and includes contractual gross cash flows to be exchanged as part of cross currency interest rate swaps and forward foreign exchange contracts where there is a legal right of set-off.
Contractual cash flow
Carrying Within 1-2 2-3 3-4 4-5 More than amount 1 year years years years years 5 years Total At 31 December 2010 £m £m £m £m £m £m £m £m
BorrowingsFixed rate borrowings (3,711) (370) (558) (833) (865) (246) (2,210) (5,082)Floating rate borrowings (591) (383) (53) (6) (99) (67) (5) (613)
Derivative financial liabilitiesInterest rate derivatives (25) (19) (8) (2) – (1) (6) (36)Cross currency interest rate swaps – (5) (7) (179) (190) – – (381)Forward foreign exchange contracts (55) (1,283) (413) (154) (32) – – (1,882)
Derivative financial assetsInterest rate derivatives 19 15 10 20 – – – 45Cross currency interest rate swaps 100 14 14 209 248 – – 485Forward foreign exchange contracts 15 1,262 401 154 33 – – 1,850Total (4,248) (769) (614) (791) (905) (314) (2,221) (5,614)
Contractual cash flow
Carrying Within 1-2 2-3 3-4 4-5 More than amount 1 year years years years years 5 years Total At 31 December 2009 £m £m £m £m £m £m £m £m
BorrowingsFixed rate borrowings (3,824) (252) (592) (542) (837) (815) (2,409) (5,447) Floating rate borrowings (882) (673) (4) (115) (4) (100) (5) (901)
Derivative financial liabilitiesInterest rate derivatives (45) (28) (12) (5) (3) (4) (12) (64) Cross currency interest rate swaps – (6) (10) (14) (183) (184) – (397) Forward foreign exchange contracts (57) (907) (378) (165) – – – (1,450)
Derivative financial assetsInterest rate derivatives 3 15 5 – 16 – – 36 Cross currency interest rate swaps 54 12 13 15 192 217 – 449Forward foreign exchange contracts 14 875 374 166 – – – 1,415 Total (4,737) (964) (604) (660) (819) (886) (2,426) (6,359)
Notes to the combined financial statementsfor the year ended 31 December 2010
47213_Text_p085-128.indd 117 1/3/11 10:38:39
118 Reed Elsevier Annual Reports and Financial Statements 2010
18 Financial instruments continued
The carrying amount of derivative financial liabilities comprises nil (2009: £9m) in relation to fair value hedges, £68m (2009: £67m) in relation to cash flow hedges and £12m (2009: £26m) held for trading. The carrying amount of derivative financial assets comprises £105m (2009: £50m) in relation to fair value hedges, £12m (2009: £12m) in relation to cash flow hedges and £17m (2009: £9m) held for trading. Derivative financial assets and liabilities held for trading comprise interest rate derivatives and forward foreign exchange contracts that were not designated as hedging instruments.
At 31 December 2010, Reed Elsevier had access to a $2,000m committed bank facility maturing in June 2013, which was undrawn.
After taking account of the maturity of committed bank facilities that back short term borrowings at 31 December 2010, and after utilising available cash resources, no borrowings mature within two years (2009: nil), 23% of borrowings mature in the third year (2009: 19%), 27% in the fourth and fifth years (2009: 35%), 39% in the sixth to tenth years (2009: 36%), and 11% beyond the tenth year (2009: 10%).
Market riskReed Elsevier’s primary market risks are to interest rate fluctuations and exchange rate movements. Derivatives are used to hedge or reduce the risks of interest rate and exchange rate movements and are not entered into unless such risks exist. Derivatives used by Reed Elsevier for hedging a particular risk are not specialised and are generally available from numerous sources. The impact of market risks on net post employment benefit obligations and taxation is excluded from the following market risk sensitivity analysis.
Interest rate riskReed Elsevier’s interest rate exposure management policy is aimed at reducing the exposure of the combined businesses to changes in interest rates.
At 31 December 2010, 73% of gross borrowings were either fixed rate or had been fixed through the use of interest rate swaps, forward rate agreements and options. A 100 basis point reduction in interest rates would result in an estimated decrease in net finance costs of £3m (2009: £4m), based on the composition of financial instruments including cash, cash equivalents, bank loans and commercial paper borrowings at 31 December 2010. A 100 basis point rise in interest rates would result in an estimated increase in net finance costs of £3m (2009: £4m).
The impact on net equity of a theoretical change in interest rates as at 31 December 2010 is restricted to the change in carrying value of floating rate to fixed rate interest rate derivatives in a designated cash flow hedge relationship and undesignated interest rate derivatives. A 100 basis point reduction in interest rates would result in an estimated reduction in net equity of £8m (2009: £14m) and a 100 basis point increase in interest rates would increase net equity by an estimated £9m (2009: £15m). The impact of a change in interest rates on the carrying value of fixed rate borrowings in a designated fair value hedge relationship would be offset by the change in carrying value of the related interest rate derivative. Fixed rate borrowings not in a designated hedging relationship are carried at amortised cost.
Foreign exchange rate riskTranslation exposures arise on the earnings and net assets of business operations in countries with currencies other than sterling, most particularly in respect of the US businesses. These exposures are hedged, to a significant extent, by a policy of denominating borrowings in currencies where significant translation exposures exist, most notably US dollars (see note 24).
A theoretical weakening of all currencies by 10% against sterling at 31 December 2010 would decrease the carrying value of net assets, excluding net borrowings, by £457m (2009: £466m). This would be offset to a large degree by a decrease in net borrowings of £270m (2009: £321m). A strengthening of all currencies by 10% against sterling at 31 December 2010 would increase the carrying value of net assets, excluding net borrowings, by £570m (2009: £581m) and increase net borrowings by £329m (2009: £392m).
A retranslation of the combined businesses’ net profit for the year assuming a 10% weakening of all foreign currencies against sterling but excluding transactional exposures would reduce net profit by £51m (2009: £17m). A 10% strengthening of all foreign currencies against sterling on this basis would increase net profit for the year by £62m (2009: £20m).
Notes to the combined financial statementsfor the year ended 31 December 2010
47213_Text_p085-128.indd 118 1/3/11 10:38:39
Annual Reports and Financial Statements 2010 Reed Elsevier 119
Overview
Our business
Financial reviewG
overnanceFinancial statem
ents and other information
Combined financial statements
18 Financial instruments continued
Credit riskReed Elsevier seeks to limit interest rate and foreign exchange risks described above by the use of financial instruments and as a result has a credit risk from the potential non performance by the counterparties to these financial instruments, which are unsecured. The amount of this credit risk is normally restricted to the amounts of any hedge gain and not the principal amount being hedged. Reed Elsevier also has a credit exposure to counterparties for the full principal amount of cash and cash equivalents. Credit risks are controlled by monitoring the credit quality of these counterparties, principally licensed commercial banks and investment banks with strong long term credit ratings, and the amounts outstanding with each of them.
Reed Elsevier has treasury policies in place which do not allow concentrations of risk with individual counterparties and do not allow significant treasury exposures with counterparties which are rated lower than A/A2 by Standard and Poor’s, Moody’s or Fitch.
Reed Elsevier also has credit risk with respect to trade receivables due from its customers that include national and state governments, academic institutions and large and small enterprises including law firms, book stores and wholesalers. The concentration of credit risk from trade receivables is limited due to the large and broad customer base. Trade receivable exposures are managed locally in the business units where they arise. Where appropriate, business units seek to minimise this exposure by taking payment in advance and through management of credit terms. Allowance is made for bad and doubtful debts based on management’s assessment of the risk taking into account the ageing profile, experience and circumstance. The maximum exposure to credit risk is represented by the carrying amount of each financial asset, including derivative financial instruments, recorded in the statement of financial position.
Included within trade receivables are the following amounts which are past due but for which no allowance has been made. Past due up to one month £241m (2009: £248m); past due two to three months £58m (2009: £66m); past due four to six months £16m (2009: £25m); and past due greater than six months £5m (2009: nil). Examples of trade receivables which are past due but for which no allowance has been made include those receivables where there is no concern over the creditworthiness of the customer and where the history of dealings with the customer indicate the amount will be settled.
Hedge accountingThe hedging relationships that are designated under IAS39 – Financial Instruments are described below:
Fair value hedgesReed Elsevier has entered into interest rate swaps and cross currency interest rate swaps to hedge the exposure to changes in the fair value of fixed rate borrowings due to interest rate and foreign currency movements which could affect the income statement.
Interest rate derivatives (including cross currency interest rate swaps) with a principal amount of £1,093m (2009: £1,104m) were in place at 31 December 2010 swapping fixed rate term debt issues denominated in sterling, euros and Swiss francs (CHF) to floating rate sterling, euro and US dollar (USD) debt respectively for the whole of their term.
Notes to the combined financial statementsfor the year ended 31 December 2010
47213_Text_p085-128.indd 119 1/3/11 10:38:39

120 Reed Elsevier Annual Reports and Financial Statements 2010
18 Financial instruments continued
The gains and losses on the borrowings and related derivatives designated as fair value hedges, which are included in the income statement, for the two years ended 31 December 2010 were as follows:
Fair value Fair value 1 January movement Exchange 1 January movement Exchange 31 December Gains/(losses) on borrowings 2009 gain/(loss) gain/(loss) 2010 gain/(loss) gain/(loss) 2010 and related derivatives £m £m £m £m £m £m £m
GBP debt – 9 – 9 (16) – (7)Related interest rate swaps – (9) – (9) 16 – 7 – – – – – – –EUR debt – (2) – (2) (10) – (12)Related interest rate swaps – 2 – 2 10 – 12 – – – – – – –CHF debt (41) (11) 4 (48) (37) (1) (86)Related CHF to USD cross currency
interest rate swaps 41 11 (4) 48 37 1 86 – – – – – – –Total GBP, EUR and CHF debt (41) (4) 4 (41) (63) (1) (105)Total related interest rate derivatives 41 4 (4) 41 63 1 105Net gain – – – – – – –
All fair value hedges were highly effective throughout the two years ended 31 December 2010.
Gross borrowings as at 31 December 2010 included £51m (2009: £59m) in relation to fair value adjustments to borrowings previously designated in a fair value hedge relationship which were de-designated in 2008. The related derivatives were closed out on de-designation with a cash inflow of £62m. £10m (2009: £11m) of these fair value adjustments were amortised in the year as a reduction to finance costs.
Cash flow hedgesReed Elsevier enters into two types of cash flow hedge:(1) Interest rate derivatives which fix the interest expense on a portion of forecast floating rate debt (including commercial paper, short term
bank loans and floating rate term debt).
(2) Foreign exchange derivatives which fix the exchange rate on a portion of future foreign currency subscription revenues forecast by the Elsevier science and medical businesses for up to 50 months.
Movements in the hedge reserve (pre-tax) in 2009 and 2010, including gains and losses on cash flow hedging instruments, were as follows:
Foreign Total hedge Interest rate exchange reserve
hedges hedges pre-tax £m £m £m
Hedge reserve at 1 January 2009: losses deferred (80) (176) (256)(Losses)/gains arising in 2009 (11) 64 53Amounts recognised in income statement 46 58 104Exchange translation differences 7 3 10Hedge reserve at 1 January 2010: losses deferred (38) (51) (89)Losses arising in 2010 (15) (43) (58)Amounts recognised in income statement 26 35 61Exchange translation differences (2) – (2)Hedge reserve at 31 December 2010: losses deferred (29) (59) (88)
All cash flow hedges were highly effective throughout the two years ended 31 December 2010.
A tax credit of £21m (2009: £24m) in respect of the above gains and losses at 31 December 2010 was also deferred in the hedge reserve.
Notes to the combined financial statementsfor the year ended 31 December 2010
47213_Text_p085-128.indd 120 1/3/11 10:38:39
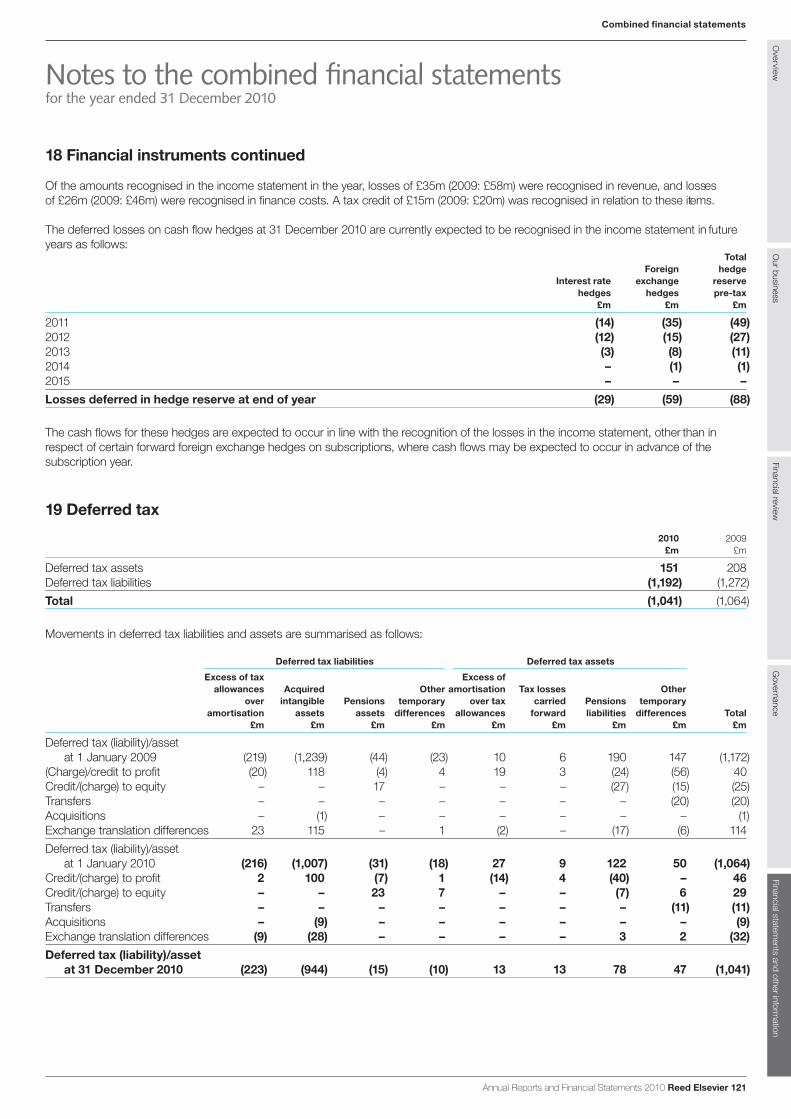
Annual Reports and Financial Statements 2010 Reed Elsevier 121
Overview
Our business
Financial reviewG
overnanceFinancial statem
ents and other information
Combined financial statements
18 Financial instruments continued
Of the amounts recognised in the income statement in the year, losses of £35m (2009: £58m) were recognised in revenue, and losses of £26m (2009: £46m) were recognised in finance costs. A tax credit of £15m (2009: £20m) was recognised in relation to these items.
The deferred losses on cash flow hedges at 31 December 2010 are currently expected to be recognised in the income statement in future years as follows:
Total Foreign hedge
Interest rate exchange reserve hedges hedges pre-tax
£m £m £m
2011 (14) (35) (49)2012 (12) (15) (27)2013 (3) (8) (11)2014 – (1) (1)2015 – – –Losses deferred in hedge reserve at end of year (29) (59) (88)
The cash flows for these hedges are expected to occur in line with the recognition of the losses in the income statement, other than in respect of certain forward foreign exchange hedges on subscriptions, where cash flows may be expected to occur in advance of the subscription year.
19 Deferred tax
2010 2009 £m £m
Deferred tax assets 151 208Deferred tax liabilities (1,192) (1,272)Total (1,041) (1,064)
Movements in deferred tax liabilities and assets are summarised as follows:
Deferred tax liabilities Deferred tax assets
Excess of tax Excess of allowances Acquired Other amortisation Tax losses Other
over intangible Pensions temporary over tax carried Pensions temporary amortisation assets assets differences allowances forward liabilities differences Total
£m £m £m £m £m £m £m £m £m
Deferred tax (liability)/asset at 1 January 2009 (219) (1,239) (44) (23) 10 6 190 147 (1,172)
(Charge)/credit to profit (20) 118 (4) 4 19 3 (24) (56) 40Credit/(charge) to equity – – 17 – – – (27) (15) (25)Transfers – – – – – – – (20) (20)Acquisitions – (1) – – – – – – (1)Exchange translation differences 23 115 – 1 (2) – (17) (6) 114Deferred tax (liability)/asset
at 1 January 2010 (216) (1,007) (31) (18) 27 9 122 50 (1,064)Credit/(charge) to profit 2 100 (7) 1 (14) 4 (40) – 46Credit/(charge) to equity – – 23 7 – – (7) 6 29Transfers – – – – – – – (11) (11)Acquisitions – (9) – – – – – – (9)Exchange translation differences (9) (28) – – – – 3 2 (32)Deferred tax (liability)/asset
at 31 December 2010 (223) (944) (15) (10) 13 13 78 47 (1,041)
Notes to the combined financial statementsfor the year ended 31 December 2010
47213_Text_p085-128.indd 121 1/3/11 10:38:40
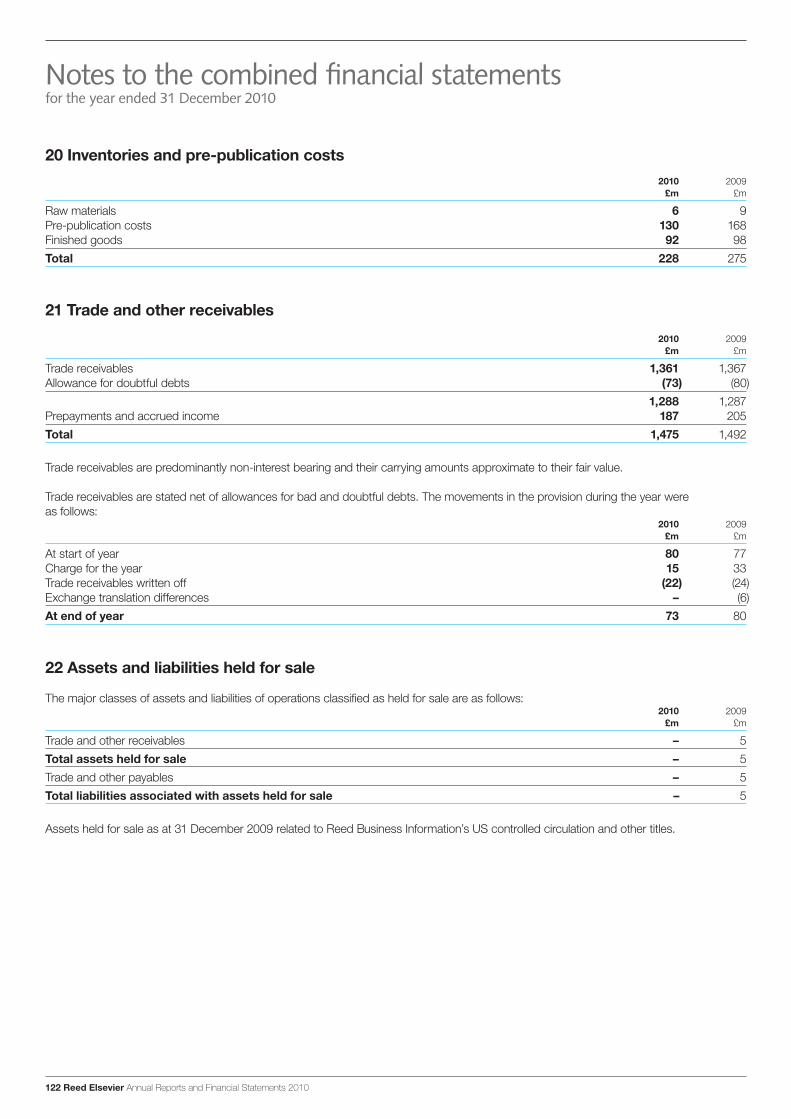
122 Reed Elsevier Annual Reports and Financial Statements 2010
20 Inventories and pre-publication costs2010 2009
£m £m
Raw materials 6 9Pre-publication costs 130 168Finished goods 92 98Total 228 275
21 Trade and other receivables
2010 2009 £m £m
Trade receivables 1,361 1,367Allowance for doubtful debts (73) (80) 1,288 1,287Prepayments and accrued income 187 205Total 1,475 1,492
Trade receivables are predominantly non-interest bearing and their carrying amounts approximate to their fair value.
Trade receivables are stated net of allowances for bad and doubtful debts. The movements in the provision during the year were as follows:
2010 2009 £m £m
At start of year 80 77Charge for the year 15 33Trade receivables written off (22) (24)Exchange translation differences – (6)At end of year 73 80
22 Assets and liabilities held for sale
The major classes of assets and liabilities of operations classified as held for sale are as follows:2010 2009
£m £m
Trade and other receivables – 5Total assets held for sale – 5Trade and other payables – 5Total liabilities associated with assets held for sale – 5
Assets held for sale as at 31 December 2009 related to Reed Business Information’s US controlled circulation and other titles.
Notes to the combined financial statementsfor the year ended 31 December 2010
47213_Text_p085-128.indd 122 1/3/11 10:38:40
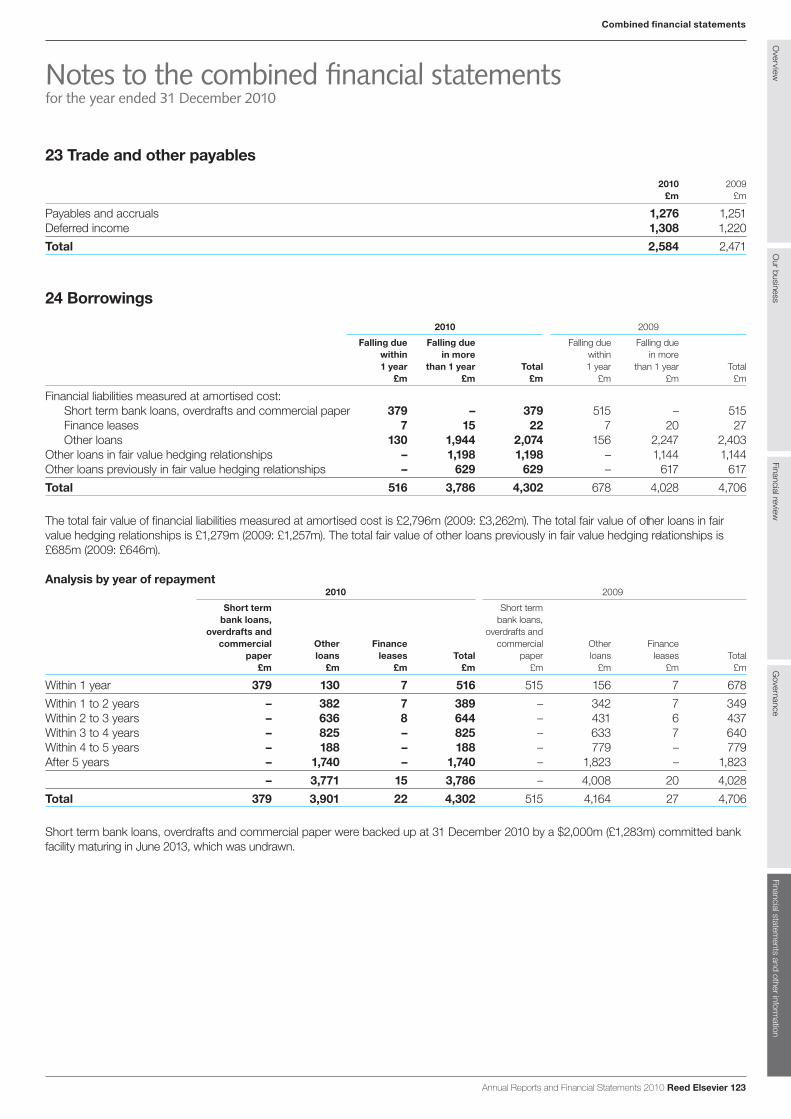
Annual Reports and Financial Statements 2010 Reed Elsevier 123
Overview
Our business
Financial reviewG
overnanceFinancial statem
ents and other information
Combined financial statements
23 Trade and other payables
2010 2009 £m £m
Payables and accruals 1,276 1,251Deferred income 1,308 1,220Total 2,584 2,471
24 Borrowings
2010 2009
Falling due Falling due Falling due Falling due within in more within in more 1 year than 1 year Total 1 year than 1 year Total
£m £m £m £m £m £m
Financial liabilities measured at amortised cost:Short term bank loans, overdrafts and commercial paper 379 – 379 515 – 515Finance leases 7 15 22 7 20 27Other loans 130 1,944 2,074 156 2,247 2,403
Other loans in fair value hedging relationships – 1,198 1,198 – 1,144 1,144Other loans previously in fair value hedging relationships – 629 629 – 617 617Total 516 3,786 4,302 678 4,028 4,706
The total fair value of financial liabilities measured at amortised cost is £2,796m (2009: £3,262m). The total fair value of other loans in fair value hedging relationships is £1,279m (2009: £1,257m). The total fair value of other loans previously in fair value hedging relationships is £685m (2009: £646m).
Analysis by year of repayment2010 2009
Short term Short term bank loans, bank loans,
overdrafts and overdrafts and commercial Other Finance commercial Other Finance
paper loans leases Total paper loans leases Total £m £m £m £m £m £m £m £m
Within 1 year 379 130 7 516 515 156 7 678 Within 1 to 2 years – 382 7 389 – 342 7 349Within 2 to 3 years – 636 8 644 – 431 6 437Within 3 to 4 years – 825 – 825 – 633 7 640Within 4 to 5 years – 188 – 188 – 779 – 779After 5 years – 1,740 – 1,740 – 1,823 – 1,823 – 3,771 15 3,786 – 4,008 20 4,028Total 379 3,901 22 4,302 515 4,164 27 4,706
Short term bank loans, overdrafts and commercial paper were backed up at 31 December 2010 by a $2,000m (£1,283m) committed bank facility maturing in June 2013, which was undrawn.
Notes to the combined financial statementsfor the year ended 31 December 2010
47213_Text_p085-128.indd 123 1/3/11 10:38:40
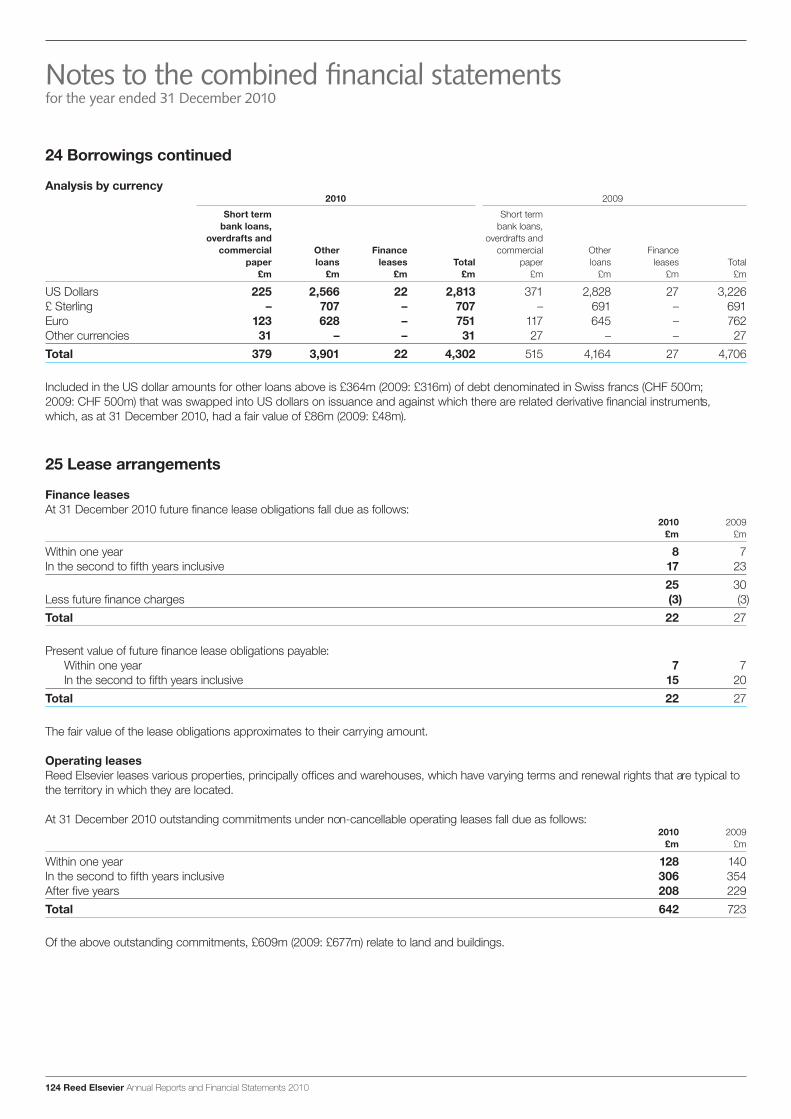
124 Reed Elsevier Annual Reports and Financial Statements 2010
24 Borrowings continued
Analysis by currency2010 2009
Short term Short term bank loans, bank loans,
overdrafts and overdrafts and commercial Other Finance commercial Other Finance
paper loans leases Total paper loans leases Total £m £m £m £m £m £m £m £m
US Dollars 225 2,566 22 2,813 371 2,828 27 3,226£ Sterling – 707 – 707 – 691 – 691Euro 123 628 – 751 117 645 – 762Other currencies 31 – – 31 27 – – 27Total 379 3,901 22 4,302 515 4,164 27 4,706
Included in the US dollar amounts for other loans above is £364m (2009: £316m) of debt denominated in Swiss francs (CHF 500m; 2009: CHF 500m) that was swapped into US dollars on issuance and against which there are related derivative financial instruments, which, as at 31 December 2010, had a fair value of £86m (2009: £48m).
25 Lease arrangements
Finance leasesAt 31 December 2010 future finance lease obligations fall due as follows:
2010 2009 £m £m
Within one year 8 7In the second to fifth years inclusive 17 23 25 30Less future finance charges (3) (3)Total 22 27
Present value of future finance lease obligations payable:Within one year 7 7In the second to fifth years inclusive 15 20
Total 22 27
The fair value of the lease obligations approximates to their carrying amount.
Operating leasesReed Elsevier leases various properties, principally offices and warehouses, which have varying terms and renewal rights that are typical to the territory in which they are located.
At 31 December 2010 outstanding commitments under non-cancellable operating leases fall due as follows:2010 2009
£m £m
Within one year 128 140In the second to fifth years inclusive 306 354After five years 208 229Total 642 723
Of the above outstanding commitments, £609m (2009: £677m) relate to land and buildings.
Notes to the combined financial statementsfor the year ended 31 December 2010
47213_Text_p085-128.indd 124 1/3/11 10:38:40

Annual Reports and Financial Statements 2010 Reed Elsevier 125
Overview
Our business
Financial reviewG
overnanceFinancial statem
ents and other information
Combined financial statements
25 Lease arrangements continued
Reed Elsevier has a number of properties that are sub-leased. The future lease receivables contracted with sub-tenants fall as follows:
2010 2009 £m £m
Within one year 17 17In the second to fifth years inclusive 25 36After five years 5 7Total 47 60
26 Provisions2010 2009
Property Restructuring Total Property Restructuring Total £m £m £m £m £m £m
At start of year 89 106 195 45 69 114Charged 36 31 67 70 157 227Utilised (22) (82) (104) (20) (114) (134)Exchange translation differences 2 (1) 1 (6) (6) (12)At end of year 105 54 159 89 106 195
Property provisions relate to estimated sub-lease shortfalls and guarantees given in respect of certain property leases for various periods up to 2024. Restructuring provisions at 31 December 2010 principally relate to Reed Business Information.
At 31 December 2010 provisions are included within current and non-current liabilities as follows:2010 2009
£m £m
Current liabilities 71 134Non-current liabilities 88 61Total 159 195
27 Contingent liabilities and capital commitments
There are contingent liabilities amounting to £10m (2009: £22m) in respect of property lease guarantees.
28 Combined share capitals2010 2009
£m £m
At start of year 225 209Issue of ordinary shares – 20Exchange translation differences (1) (4)At end of year 224 225
In July 2009, Reed Elsevier PLC placed 109,198,190 new ordinary shares at 405p per share for proceeds, net of issue costs, of £435m and Reed Elsevier NV placed 63,030,989 new ordinary shares at 7.08 per share for net proceeds of 441m. The number of shares issued represented 9.9% of the issued ordinary share capital of the respective parent companies prior to the placings. No share premium was recognised in Reed Elsevier PLC as the company took advantage of section 612 of the Companies Act 2006 regarding merger relief.
Combined share capitals exclude the shares of Reed Elsevier NV held by a subsidiary of Reed Elsevier PLC.
Disclosures in respect of share capital are given in note 12 to the Reed Elsevier PLC consolidated financial statements and note 13 to the Reed Elsevier NV consolidated financial statements.
Notes to the combined financial statementsfor the year ended 31 December 2010
47213_Text_p085-128.indd 125 1/3/11 10:38:40

126 Reed Elsevier Annual Reports and Financial Statements 2010
29 Combined share premiums
2010 2009 £m £m
At start of year 2,807 2,529Issue of ordinary shares, net of expenses 11 395Exchange translation differences (64) (117)At end of year 2,754 2,807
Combined share premiums exclude the share premium in respect of shares of Reed Elsevier NV held by a subsidiary of Reed ElsevierPLC.
30 Combined shares held in treasury
Shares Shares held held by parent
by EBT companies Total £m £m £m
At 1 January 2009 232 551 783Settlement of share awards (57) – (57)Exchange translation differences – (28) (28)At 1 January 2010 175 523 698Settlement of share awards (9) – (9)Exchange translation differences – (12) (12)At 31 December 2010 166 511 677
At 31 December 2010, shares held in treasury related to 14,654,161 (2009: 15,350,605) Reed Elsevier PLC ordinary shares and 7,781,790 (2009: 8,219,196) Reed Elsevier NV ordinary shares held by the Reed Elsevier Group plc Employee Benefit Trust (EBT); and 34,196,298 (2009: 34,196,298) Reed Elsevier PLC ordinary shares and 23,952,791 (2009: 23,952,791) Reed Elsevier NV ordinary shares held by the respective parent companies.
The EBT purchases Reed Elsevier PLC and Reed Elsevier NV shares which, at the trustees’ discretion, can be used in respect of the exercise of share options and to meet commitments under conditional share awards.
31 Translation reserve
2010 2009 £m £m
At start of year (100) (14)Exchange differences on translation of foreign operations 94 (122)Exchange translation differences on capital and reserves 35 36At end of year 29 (100)
Notes to the combined financial statementsfor the year ended 31 December 2010
47213_Text_p085-128.indd 126 1/3/11 10:38:40

Annual Reports and Financial Statements 2010 Reed Elsevier 127
Overview
Our business
Financial reviewG
overnanceFinancial statem
ents and other information
Combined financial statements
32 Other combined reserves
Hedge Other reserve reserves Total Total
2010 2010 2010 2009 £m £m £m £m
At start of year (65) (437) (502) (988)Profit attributable to parent companies’ shareholders – 642 642 391Dividends paid – (483) (483) (457)Issue of ordinary shares, net of expenses – – – 419Actuarial (losses)/gains on defined benefit pension schemes – (63) (63) 6Cumulative fair value movements on disposals of available for sale investments – – – 1Fair value movements on cash flow hedges (58) – (58) 53Tax recognised directly in equity 12 17 29 (25)(Decrease)/increase in share based remuneration reserve – (7) (7) 17Settlement of share awards – (9) (9) (60)Transfer from hedge reserve to net profit (net of tax) 46 – 46 84Exchange translation differences (2) 20 18 57At end of year (67) (320) (387) (502)
Other reserves principally comprise retained earnings, the share based remuneration reserve and available for sale investment reserve.
33 Related party transactions
Transactions between the Reed Elsevier combined businesses have been eliminated within the combined financial statements. Transactions with joint ventures were made on normal market terms of trading and comprise sales of goods and services of £1m (2009: £2m). As at 31 December 2010, amounts owed by joint ventures were £2m (2009: £4m). Key management personnel are also related parties and comprise the executive directors of Reed Elsevier PLC and Reed Elsevier NV. Transactions with key management personnel are set out below.
2010 2009 £m £m
Salaries and other short term employee benefits 5 6Post employment benefits 1 1Termination benefits – 1Share based remuneration (1) 1Total 5 9
34 Exchange rates
The following exchange rates have been applied in preparing the combined financial statements:
Statement of Income statement financial position
2010 2009 2010 2009
Euro to sterling 1.17 1.12 1.17 1.12US dollars to sterling 1.55 1.57 1.56 1.62
35 Approval of financial statements
The combined financial statements were approved and authorised for issue by the Boards of directors of Reed Elsevier PLC and Reed Elsevier NV on 16 February 2011.
Notes to the combined financial statementsfor the year ended 31 December 2010
47213_Text_p085-128.indd 127 1/3/11 10:38:40

128 Reed Elsevier Annual Reports and Financial Statements 2010
Independent auditors’ reportto the members of Reed Elsevier PLC and shareholders of Reed Elsevier NV
Report on the combined financial statementsWe have audited the combined financial statements of Reed Elsevier PLC (registered in England and Wales), Reed Elsevier NV (registered in Amsterdam), Reed Elsevier Group plc (registered in England and Wales), Elsevier Reed Finance BV (registered in Amsterdam) and their respective subsidiaries, associates and joint ventures (together “the combined businesses”), for the year ended 31 December 2010 (“the combined financial statements”), which comprise the combined income statement, the combined statement of comprehensive income, the combined statement of cash flows, the combined statement of financial position, the combined statement of changes in equity, the accounting policies and the related notes 1 to 35.
Our audit work has been undertaken so that we might state to the members of Reed Elsevier PLC and shareholders of Reed Elsevier NV those matters we are required to state to them in an auditor’s report and for no other purpose. To the fullest extent permitted by law, we do not accept or assume responsibility to anyone other than Reed Elsevier PLC and Reed Elsevier NV, and the members of Reed Elsevier PLC as a body and the shareholders of Reed Elsevier NV as a body, for our audit work, for this report, or for the opinions we have formed.
Responsibilities of directorsAs explained more fully in the Directors’ Responsibilities Statement, the directors are responsible for the preparation of the combined financial statements in accordance with International Financial Reporting Standards as adopted by the European Union (“IFRS”) and for being satisfied that they give a true and fair view and for such internal control as they determine is necessary to enable the preparation of financial statements that are free from material misstatement, whether due to fraud or error.
Auditors’ responsibilitiesOur responsibility is to audit and express an opinion on the combined financial statements in accordance with International Standards on Auditing (UK and Ireland) as issued by the United Kingdom Auditing Practices Board, and Dutch law, including the Dutch Standards on Auditing. Those standards require us to comply with our respective professions’ ethical requirements, including the Auditing Practices Board’s Ethical Standards for Auditors.
Scope of the audit of the combined financial statementsAn audit involves obtaining evidence about the amounts and disclosures in the combined financial statements sufficient to give reasonable assurance that the combined financial statements are free from material misstatement, whether caused by fraud or error. This includes an assessment of: whether the accounting policies are appropriate to the combined businesses’ circumstances and have been consistently applied and adequately disclosed; the reasonableness of significant accounting estimates made by the directors; and the overall presentation of the combined financial statements.
The procedures selected depend on the auditor’s judgment, including the assessment of the risks of material misstatement of the combined financial statements, whether due to fraud or error. In making those risk assessments, the auditor considers internal control relevant to the entity’s preparation of the combined financial statements in order to design audit procedures that are appropriate in the circumstances, but not for the purpose of expressing an opinion on the effectiveness of the entity’s internal control.
We believe that the audit evidence we have obtained is sufficient and appropriate to provide a basis for our audit opinion.
Opinion on the combined financial statementsIn our opinion the combined financial statements:
> give a true and fair view of the state of the combined businesses’ affairs as at 31 December 2010 and of its profit for the year then ended; and
> have been properly prepared in accordance with IFRSs as adopted by the European Union
Other matterWe have also audited the information in the parts of the Directors’ Remuneration Report presented in the Reed Elsevier Annual Reports and Financial Statements (“the Remuneration Report”) that are described as having been audited. The separate audit reports on the consolidated financial statements of Reed Elsevier PLC and Reed Elsevier NV, which have been audited under locally adopted standards and which include the other opinions required by local laws and regulations, appear on pages 160 and 182.
Douglas King (Senior statutory auditor) A SandlerFor and on behalf ofDeloitte LLP Deloitte Accountants B.V.Chartered Accountants Amsterdam and Statutory Auditor The NetherlandsLondon, United Kingdom 16 February 2011 16 February 2011
47213_Text_p085-128.indd 128 1/3/11 10:38:40
Annual Reports and Financial Statements 2010 Reed Elsevier 129
130 Combined income statement130 Combined statement of comprehensive income131 Combined statement of cash flows132 Combined statement of financial position133 Combined statement of changes in equity134 Notes to the summary combined financial information in euros
Overview
Business review
Financial reviewG
overnanceFinancial statem
ents and other information
Summary combined financial information in euros
47213_Text_p129-141.indd 129 1/3/11 10:37:16
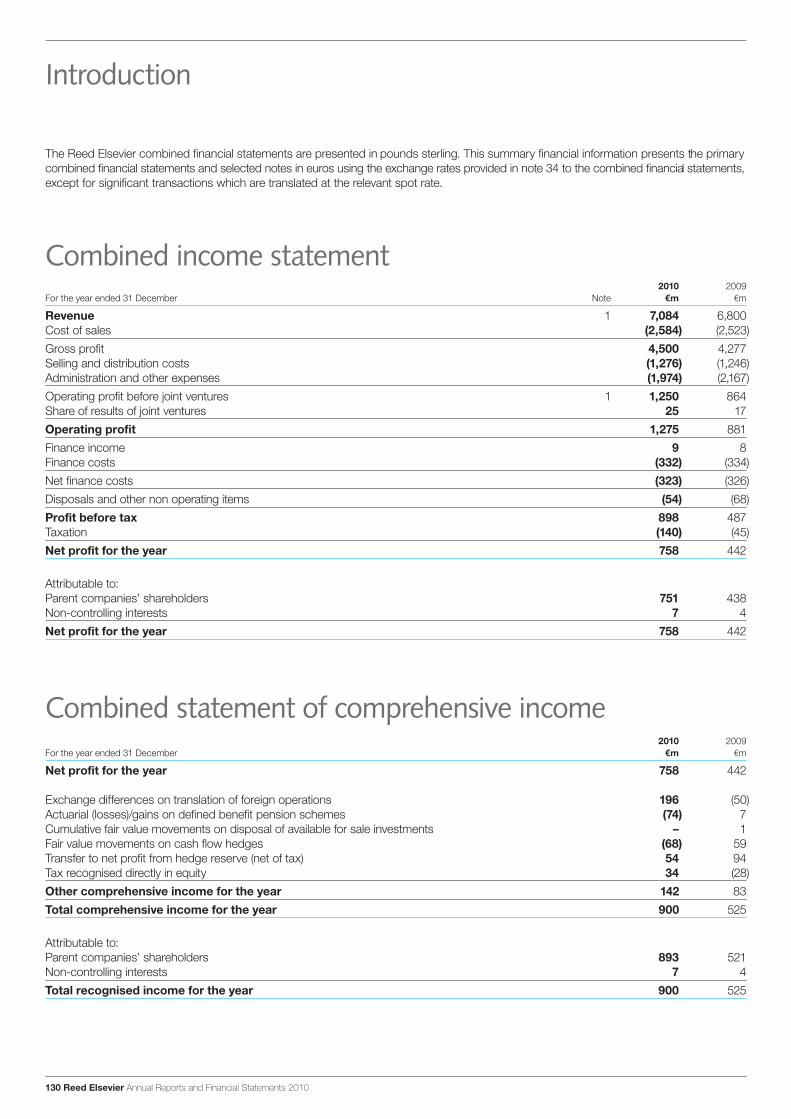
130 Reed Elsevier Annual Reports and Financial Statements 2010
Introduction
The Reed Elsevier combined financial statements are presented in pounds sterling. This summary financial information presents the primary combined financial statements and selected notes in euros using the exchange rates provided in note 34 to the combined financial statements, except for significant transactions which are translated at the relevant spot rate.
Combined income statement2010 2009
For the year ended 31 December Note m m
Revenue 1 7,084 6,800Cost of sales (2,584) (2,523)Gross profit 4,500 4,277Selling and distribution costs (1,276) (1,246)Administration and other expenses (1,974) (2,167)Operating profit before joint ventures 1 1,250 864Share of results of joint ventures 25 17Operating profit 1,275 881Finance income 9 8Finance costs (332) (334)Net finance costs (323) (326)Disposals and other non operating items (54) (68)Profit before tax 898 487Taxation (140) (45)Net profit for the year 758 442
Attributable to:Parent companies’ shareholders 751 438Non-controlling interests 7 4Net profit for the year 758 442
Combined statement of comprehensive income2010 2009
For the year ended 31 December m m
Net profit for the year 758 442
Exchange differences on translation of foreign operations 196 (50)Actuarial (losses)/gains on defined benefit pension schemes (74) 7Cumulative fair value movements on disposal of available for sale investments – 1Fair value movements on cash flow hedges (68) 59Transfer to net profit from hedge reserve (net of tax) 54 94Tax recognised directly in equity 34 (28)Other comprehensive income for the year 142 83Total comprehensive income for the year 900 525
Attributable to:Parent companies’ shareholders 893 521Non-controlling interests 7 4Total recognised income for the year 900 525
47213_Text_p129-141.indd 130 1/3/11 10:37:16
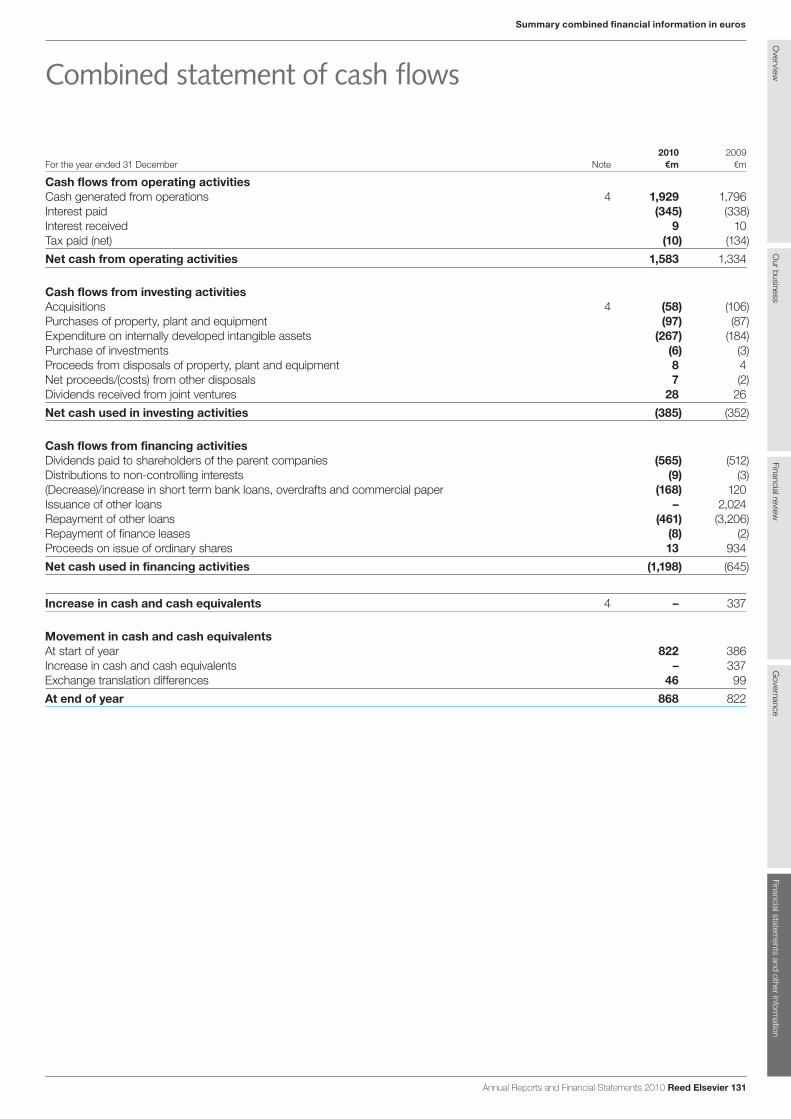
Summary combined financial information in euros
Annual Reports and Financial Statements 2010 Reed Elsevier 131
Overview
Our business
Financial reviewG
overnanceFinancial statem
ents and other information
Combined statement of cash flows
2010 2009For the year ended 31 December Note m m
Cash flows from operating activitiesCash generated from operations 4 1,929 1,796Interest paid (345) (338)Interest received 9 10Tax paid (net) (10) (134)Net cash from operating activities 1,583 1,334
Cash flows from investing activitiesAcquisitions 4 (58) (106)Purchases of property, plant and equipment (97) (87)Expenditure on internally developed intangible assets (267) (184)Purchase of investments (6) (3)Proceeds from disposals of property, plant and equipment 8 4Net proceeds/(costs) from other disposals 7 (2)Dividends received from joint ventures 28 26Net cash used in investing activities (385) (352)
Cash flows from financing activitiesDividends paid to shareholders of the parent companies (565) (512)Distributions to non-controlling interests (9) (3)(Decrease)/increase in short term bank loans, overdrafts and commercial paper (168) 120Issuance of other loans – 2,024Repayment of other loans (461) (3,206)Repayment of finance leases (8) (2)Proceeds on issue of ordinary shares 13 934Net cash used in financing activities (1,198) (645)
Increase in cash and cash equivalents 4 – 337
Movement in cash and cash equivalentsAt start of year 822 386Increase in cash and cash equivalents – 337Exchange translation differences 46 99At end of year 868 822
47213_Text_p129-141.indd 131 1/3/11 10:37:16
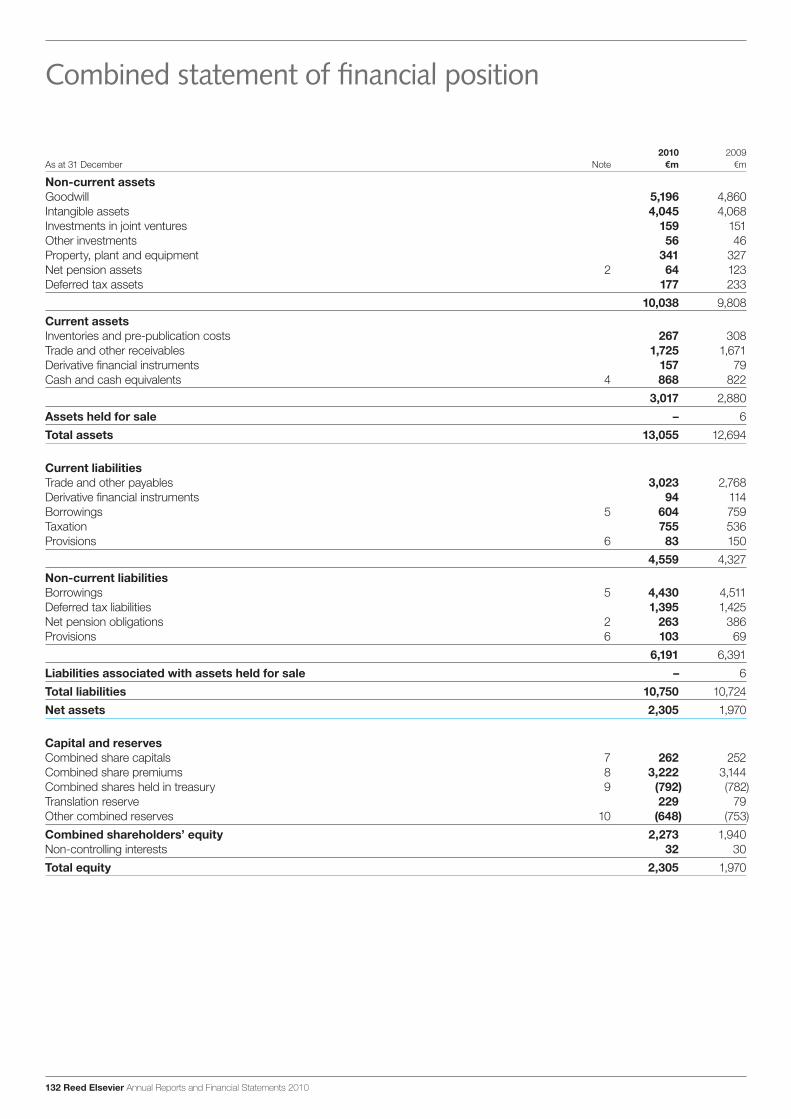
132 Reed Elsevier Annual Reports and Financial Statements 2010
Combined statement of financial position
2010 2009As at 31 December Note m m
Non-current assetsGoodwill 5,196 4,860Intangible assets 4,045 4,068Investments in joint ventures 159 151Other investments 56 46Property, plant and equipment 341 327Net pension assets 2 64 123Deferred tax assets 177 233 10,038 9,808Current assetsInventories and pre-publication costs 267 308Trade and other receivables 1,725 1,671Derivative financial instruments 157 79Cash and cash equivalents 4 868 822 3,017 2,880Assets held for sale – 6Total assets 13,055 12,694
Current liabilitiesTrade and other payables 3,023 2,768Derivative financial instruments 94 114Borrowings 5 604 759Taxation 755 536Provisions 6 83 150 4,559 4,327Non-current liabilitiesBorrowings 5 4,430 4,511Deferred tax liabilities 1,395 1,425Net pension obligations 2 263 386Provisions 6 103 69 6,191 6,391Liabilities associated with assets held for sale – 6Total liabilities 10,750 10,724Net assets 2,305 1,970
Capital and reservesCombined share capitals 7 262 252Combined share premiums 8 3,222 3,144Combined shares held in treasury 9 (792) (782)Translation reserve 229 79Other combined reserves 10 (648) (753)Combined shareholders’ equity 2,273 1,940Non-controlling interests 32 30Total equity 2,305 1,970
47213_Text_p129-141.indd 132 1/3/11 10:37:16
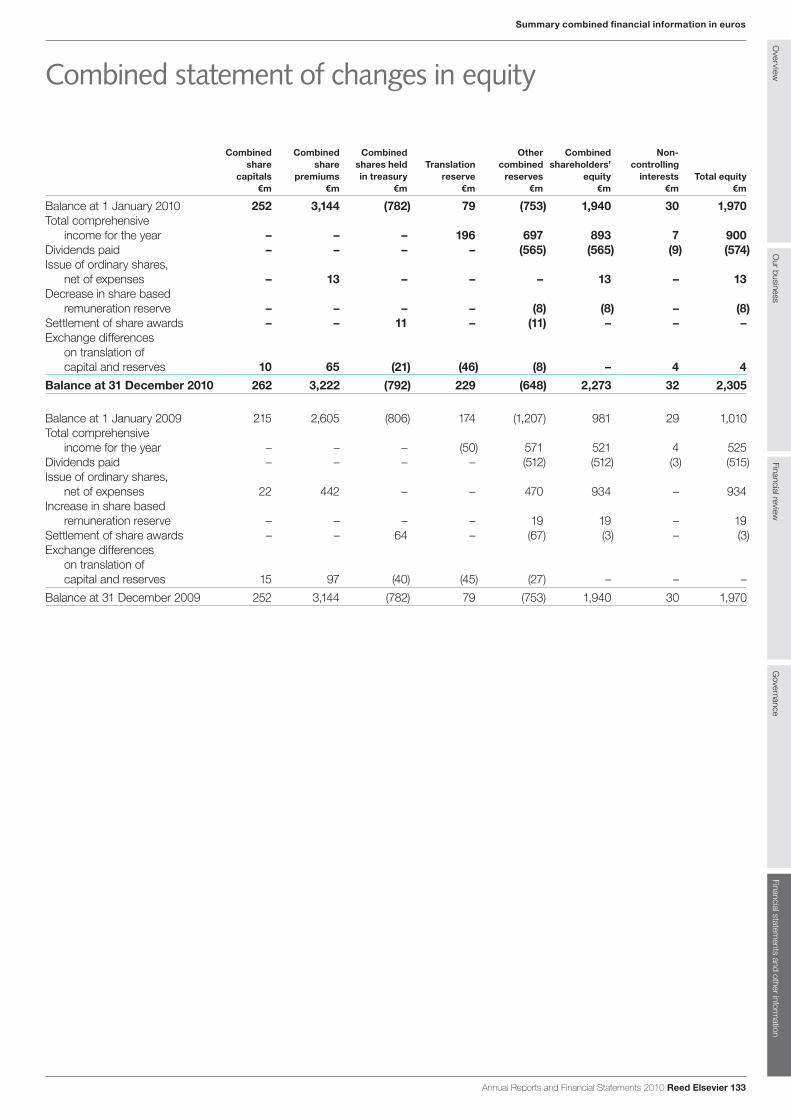
Summary combined financial information in euros
Annual Reports and Financial Statements 2010 Reed Elsevier 133
Overview
Our business
Financial reviewG
overnanceFinancial statem
ents and other information
Combined statement of changes in equity
Combined Combined Combined Other Combined Non- share share shares held Translation combined shareholders’ controlling
capitals premiums in treasury reserve reserves equity interests Total equity m m m m m m m m
Balance at 1 January 2010 252 3,144 (782) 79 (753) 1,940 30 1,970Total comprehensive
income for the year – – – 196 697 893 7 900Dividends paid – – – – (565) (565) (9) (574)Issue of ordinary shares,
net of expenses – 13 – – – 13 – 13Decrease in share based
remuneration reserve – – – – (8) (8) – (8)Settlement of share awards – – 11 – (11) – – –Exchange differences
on translation of capital and reserves 10 65 (21) (46) (8) – 4 4
Balance at 31 December 2010 262 3,222 (792) 229 (648) 2,273 32 2,305
Balance at 1 January 2009 215 2,605 (806) 174 (1,207) 981 29 1,010Total comprehensive
income for the year – – – (50) 571 521 4 525Dividends paid – – – – (512) (512) (3) (515)Issue of ordinary shares,
net of expenses 22 442 – – 470 934 – 934Increase in share based
remuneration reserve – – – – 19 19 – 19Settlement of share awards – – 64 – (67) (3) – (3)Exchange differences
on translation of capital and reserves 15 97 (40) (45) (27) – – –
Balance at 31 December 2009 252 3,144 (782) 79 (753) 1,940 30 1,970
47213_Text_p129-141.indd 133 1/3/11 10:37:16
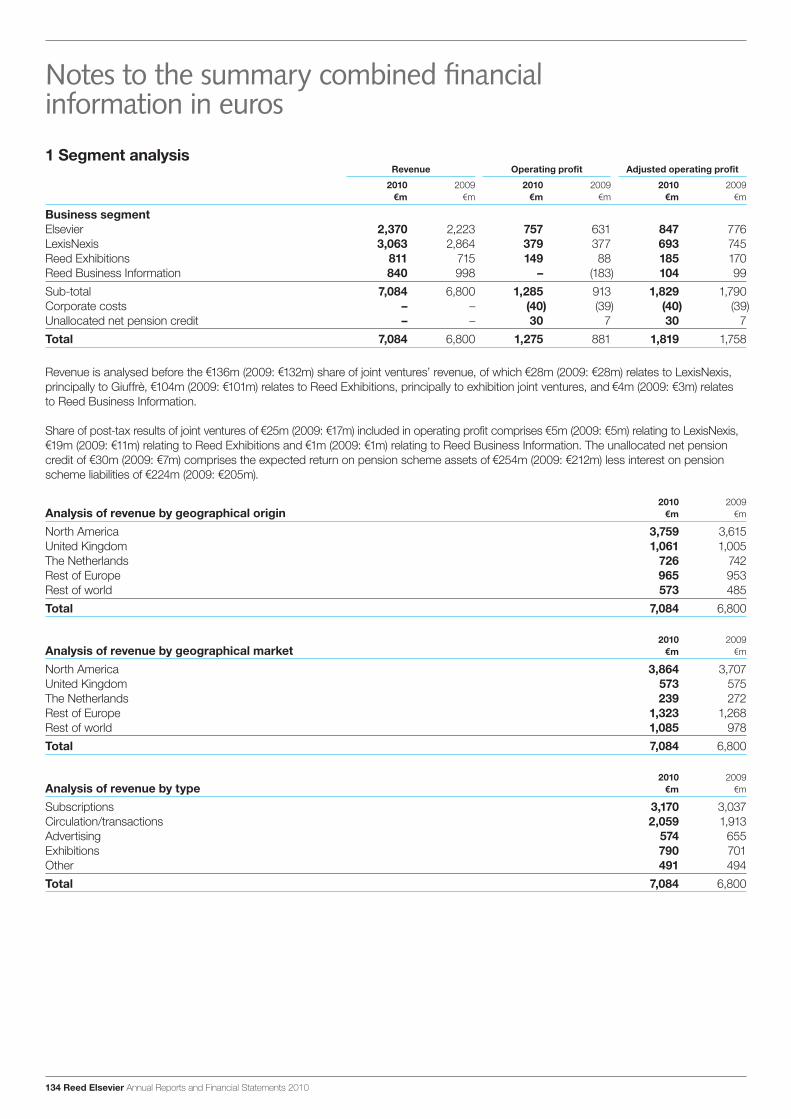
134 Reed Elsevier Annual Reports and Financial Statements 2010
1 Segment analysisRevenue Operating profit Adjusted operating profit
2010 2009 2010 2009 2010 2009 m m m m m m
Business segmentElsevier 2,370 2,223 757 631 847 776LexisNexis 3,063 2,864 379 377 693 745Reed Exhibitions 811 715 149 88 185 170 Reed Business Information 840 998 – (183) 104 99 Sub-total 7,084 6,800 1,285 913 1,829 1,790 Corporate costs – – (40) (39) (40) (39)Unallocated net pension credit – – 30 7 30 7Total 7,084 6,800 1,275 881 1,819 1,758
Revenue is analysed before the 136m (2009: 132m) share of joint ventures’ revenue, of which 28m (2009: 28m) relates to LexisNexis, principally to Giuffrè, 104m (2009: 101m) relates to Reed Exhibitions, principally to exhibition joint ventures, and 4m (2009: 3m) relates to Reed Business Information.
Share of post-tax results of joint ventures of 25m (2009: 17m) included in operating profit comprises 5m (2009: 5m) relating to LexisNexis, 19m (2009: 11m) relating to Reed Exhibitions and 1m (2009: 1m) relating to Reed Business Information. The unallocated net pension
credit of 30m (2009: 7m) comprises the expected return on pension scheme assets of 254m (2009: 212m) less interest on pension scheme liabilities of 224m (2009: 205m).
2010 2009 Analysis of revenue by geographical origin m m
North America 3,759 3,615United Kingdom 1,061 1,005 The Netherlands 726 742Rest of Europe 965 953 Rest of world 573 485 Total 7,084 6,800
2010 2009 Analysis of revenue by geographical market m m
North America 3,864 3,707United Kingdom 573 575 The Netherlands 239 272Rest of Europe 1,323 1,268 Rest of world 1,085 978 Total 7,084 6,800
2010 2009 Analysis of revenue by type m m
Subscriptions 3,170 3,037Circulation/transactions 2,059 1,913Advertising 574 655Exhibitions 790 701Other 491 494Total 7,084 6,800
Notes to the summary combined financial information in euros
47213_Text_p129-141.indd 134 1/3/11 10:37:16

Summary combined financial information in euros
Annual Reports and Financial Statements 2010 Reed Elsevier 135
Overview
Our business
Financial reviewG
overnanceFinancial statem
ents and other information
Notes to the summary combined financial information in euros
1 Segment analysis continuedExpenditure on Capital Amortisation and impairment
acquired goodwill and expenditure of acquired intangible Depreciation and intangible assets additions assets and goodwill other amortisation
2010 2009 2010 2009 2010 2009 2010 2009 m m m m m m m m
Business segmentElsevier 15 5 95 86 88 87 87 90LexisNexis 41 8 246 168 258 259 144 120Reed Exhibitions 7 13 14 13 27 70 16 8Reed Business Information 1 – 14 21 35 194 30 32Total 64 26 369 288 408 610 277 250
Capital expenditure comprises additions to property, plant and equipment and internally developed intangible assets. Amortisation and impairment of acquired intangible assets and goodwill includes amounts in respect of joint ventures of 4m (2009: 13m) in Reed Exhibitions. Other than the depreciation, amortisation and impairment above, non cash items include 8m credit (2009: 19m charge) relating to the recognition of share based remuneration and comprise 2m credit (2009: 5m charge) in Elsevier, 1m charge (2009: 8m charge) in LexisNexis, 1m credit (2009: 2m charge) in Reed Exhibitions, 4m credit (2009: 2m charge) in Reed Business Information and 2m credit (2009: 2m charge) in Corporate.
Total assets
2010 2009 m m
Business segmentElsevier 3,359 3,265LexisNexis 6,928 6,576Reed Exhibitions 797 815Reed Business Information 533 613 Sub-total 11,617 11,269Taxation 177 233Cash and cash equivalents 868 822Net pension assets 64 123Assets held for sale – 6Other assets 329 241Total 13,055 12,694Geographical locationNorth America 8,840 8,478United Kingdom 1,092 1,304The Netherlands 999 769Rest of Europe 1,587 1,685Rest of world 537 458Total 13,055 12,694
Investments in joint ventures of 159m (2009: 151m) included in segment assets above comprise 44m (2009: 42m) relating to LexisNexis, 108m (2009: 103m) relating to Reed Exhibitions and 7m (2009: 6m) relating to Reed Business Information.
47213_Text_p129-141.indd 135 1/3/11 10:37:16

136 Reed Elsevier Annual Reports and Financial Statements 2010
Notes to the summary combined financial information in euros
2 Pension schemes
The pension expense recognised within the income statement comprises:2010 2009
m m
Service cost (including curtailment credits of 20m (2009: 48m)) 56 27Interest on pension scheme liabilities 224 205Expected return on scheme assets (254) (212)Net defined benefit pension expense 26 20Defined contribution pension expense 37 27Total pension expense 63 47
The amount recognised in the statement of financial position in respect of defined benefit pension schemes at the start and end of the year and the movements during the year were as follows:
2010 2009
Defined Fair value Net Defined Fair value Net benefit of scheme pension benefit of scheme pension
obligations assets obligations obligations assets obligations m m m m m m
At start of year (3,698) 3,435 (263) (3,143) 2,763 (380)Service cost (56) – (56) (27) – (27)Interest on pension scheme liabilities (224) – (224) (205) – (205)Expected return on scheme assets – 254 254 – 212 212Actuarial (loss)/gain (306) 232 (74) (330) 337 7Contributions by employer – 180 180 – 113 113Contributions by employees (13) 13 – (13) 13 –Benefits paid 163 (163) – 150 (150) –Exchange translation differences (168) 152 (16) (130) 147 (17)At end of year (4,302) 4,103 (199) (3,698) 3,435 (263)
The net pension obligations of 199m (2009: 263m) at 31 December 2010 comprise schemes in deficit with net pension obligations of 263m (2009: 386m) and schemes in surplus with net pension assets of 64m (2009: 123m).
As at 31 December 2010 the defined benefit obligations comprise 4,131m (2009: 3,553m) in relation to funded schemes and 171m (2009: 145m) in relation to unfunded schemes.
47213_Text_p129-141.indd 136 1/3/11 10:37:16

Summary combined financial information in euros
Annual Reports and Financial Statements 2010 Reed Elsevier 137
Overview
Our business
Financial reviewG
overnanceFinancial statem
ents and other information
Notes to the summary combined financial information in euros
3 Adjusted figures
Reed Elsevier uses adjusted figures as additional performance measures. Adjusted figures are stated before amortisation and impairment of acquired intangible assets and goodwill, exceptional restructuring and acquisition related costs, disposal gains and loses and other non operating items, related tax effects and movements in deferred taxation assets and liabilities that are not expected to crystallise in the near term and includes the benefit of tax amortisation where available on acquired goodwill and intangible assets. Adjusted operating profit is also grossed up to exclude the equity share of taxes in joint ventures. Exceptional restructuring costs in 2010 relate to the restructuring of the Reed Business Information business and in 2009 relate to the exceptional restructuring programmes across Reed Elsevier. Acquisition related costs relate to acquisition integration and, from 2010, professional and other transaction related fees and adjustments to deferred and contingent consideration.
Adjusted operating cash flow is measured after net capital expenditure and dividends from joint ventures but before payments in relation to exceptional restructuring and acquisition related costs.
2010 2009 m m
Operating profit 1,275 881Adjustments:
Amortisation of acquired intangible assets 408 412Impairment of acquired intangible assets and goodwill – 198Exceptional restructuring costs 67 204Acquisition related costs 58 54Reclassification of tax in joint ventures 11 9
Adjusted operating profit 1,819 1,758
Profit before tax 898 487Adjustments:
Amortisation of acquired intangible assets 408 412Impairment of acquired intangible assets and goodwill – 198Exceptional restructuring costs 67 204Acquisition related costs 58 54Reclassification of tax in joint ventures 11 9Disposals and other non operating items 54 68
Adjusted profit before tax 1,496 1,432
Profit attributable to parent companies’ shareholders 751 438Adjustments (post tax):
Amortisation of acquired intangible assets 394 460Impairment of acquired intangible assets and goodwill – 152Exceptional restructuring costs 44 149Acquisition related costs 35 37Disposals and other non operating items 43 (25)Deferred tax credits on acquired intangible assets not expected to crystallise in the near term (117) (112)
Adjusted profit attributable to parent companies’ shareholders 1,150 1,099
Cash generated from operations 1,929 1,796Dividends received from joint ventures 28 26Purchases of property, plant and equipment (97) (87)Proceeds from disposals of property, plant and equipment 8 4Expenditure on internally developed intangible assets (267) (184)Payments in relation to exceptional restructuring costs 116 139Payments in relation to acquisition related costs 60 51Adjusted operating cash flow 1,777 1,745
47213_Text_p129-141.indd 137 1/3/11 10:37:16

138 Reed Elsevier Annual Reports and Financial Statements 2010
Notes to the summary combined financial information in euros
4 Statement of cash flows
2010 2009Reconciliation of operating profit before joint ventures to cash generated from operations m m
Operating profit before joint ventures 1,250 864
Amortisation and impairment of acquired intangible assets and goodwill 404 597 Amortisation of internally developed intangible assets 185 156Depreciation of property, plant and equipment 92 94Share based remuneration (8) 19Total non cash items 673 866Decrease in inventories and pre-publication costs 40 53Decrease in receivables 28 125Decrease in payables (62) (112)Decrease in working capital 6 66Cash generated from operations 1,929 1,796
2010 2009 Cash flow on acquisitions m m
Purchase of businesses (44) (10)Payment of ChoicePoint change of control and other non operating payables assumed (8) (63)Deferred payments relating to prior year acquisitions (6) (33)Total (58) (106)
Related derivative
Cash & cash financial equivalents Borrowings instruments 2010 2009
Reconciliation of net borrowings m m m m m
At start of year 822 (5,270) 46 (4,402) (5,898)
Increase in cash and cash equivalents – – – – 337Net movement in short term bank loans, overdrafts
and commercial paper – 168 – 168 (120)Issuance of other loans – – – – (2,024)Repayment of other loans – 461 – 461 3,206Repayment of finance leases – 8 – 8 2Change in net borrowings resulting from cash flows – 637 – 637 1,401Inception of finance leases – (2) – (2) (29)Fair value adjustments to borrowings and related derivatives – (61) 74 13 12Exchange translation differences 46 (338) 3 (289) 112At end of year 868 (5,034) 123 (4,043) (4,402)
Net borrowings comprise cash and cash equivalents, loan capital, finance leases, promissory notes, bank and other loans, and those derivative financial instruments that are used to hedge the fair value of fixed rate borrowings.
Cash and cash equivalents include 5m (2009: 6m) held in trust to satisfy liabilities in respect of change of control obligations related to the acquisition of ChoicePoint.
47213_Text_p129-141.indd 138 1/3/11 10:37:16
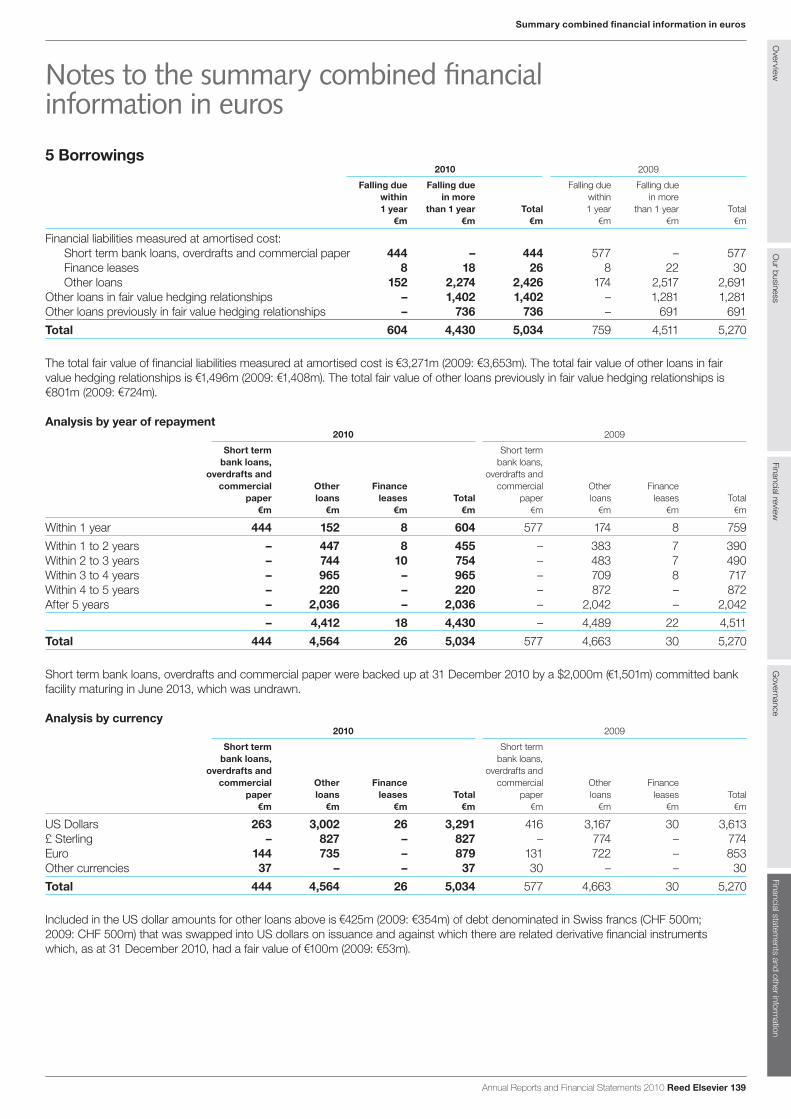
Summary combined financial information in euros
Annual Reports and Financial Statements 2010 Reed Elsevier 139
Overview
Our business
Financial reviewG
overnanceFinancial statem
ents and other information
Notes to the summary combined financial information in euros
5 Borrowings2010 2009
Falling due Falling due Falling due Falling duewithin in more within in more 1 year than 1 year Total 1 year than 1 year Total
m m m m m m
Financial liabilities measured at amortised cost:Short term bank loans, overdrafts and commercial paper 444 – 444 577 – 577Finance leases 8 18 26 8 22 30Other loans 152 2,274 2,426 174 2,517 2,691
Other loans in fair value hedging relationships – 1,402 1,402 – 1,281 1,281Other loans previously in fair value hedging relationships – 736 736 – 691 691Total 604 4,430 5,034 759 4,511 5,270
The total fair value of financial liabilities measured at amortised cost is 3,271m (2009: 3,653m). The total fair value of other loans in fair value hedging relationships is 1,496m (2009: 1,408m). The total fair value of other loans previously in fair value hedging relationships is 801m (2009: 724m).
Analysis by year of repayment2010 2009
Short term Short termbank loans, bank loans,
overdrafts and overdrafts andcommercial Other Finance commercial Other Finance
paper loans leases Total paper loans leases Total m m m m m m m m
Within 1 year 444 152 8 604 577 174 8 759Within 1 to 2 years – 447 8 455 – 383 7 390Within 2 to 3 years – 744 10 754 – 483 7 490Within 3 to 4 years – 965 – 965 – 709 8 717Within 4 to 5 years – 220 – 220 – 872 – 872After 5 years – 2,036 – 2,036 – 2,042 – 2,042
– 4,412 18 4,430 – 4,489 22 4,511Total 444 4,564 26 5,034 577 4,663 30 5,270
Short term bank loans, overdrafts and commercial paper were backed up at 31 December 2010 by a $2,000m ( 1,501m) committed bank facility maturing in June 2013, which was undrawn.
Analysis by currency2010 2009
Short term Short termbank loans, bank loans,
overdrafts and overdrafts andcommercial Other Finance commercial Other Finance
paper loans leases Total paper loans leases Total m m m m m m m m
US Dollars 263 3,002 26 3,291 416 3,167 30 3,613£ Sterling – 827 – 827 – 774 – 774Euro 144 735 – 879 131 722 – 853Other currencies 37 – – 37 30 – – 30Total 444 4,564 26 5,034 577 4,663 30 5,270
Included in the US dollar amounts for other loans above is 425m (2009: 354m) of debt denominated in Swiss francs (CHF 500m; 2009: CHF 500m) that was swapped into US dollars on issuance and against which there are related derivative financial instruments which, as at 31 December 2010, had a fair value of 100m (2009: 53m).
47213_Text_p129-141.indd 139 1/3/11 10:37:17

140 Reed Elsevier Annual Reports and Financial Statements 2010
Notes to the summary combined financial information in euros
6 Provisions2010 2009
Property Restructuring Total Property Restructuring Total m m m m m m
At start of year 99 120 219 46 71 117Charged 42 36 78 78 176 254Utilised (26) (96) (122) (22) (128) (150)Exchange translation differences 8 3 11 (3) 1 (2)At end of year 123 63 186 99 120 219
Property provisions relate to estimated sub-lease shortfalls and guarantees given in respect of certain property leases for various periods up to 2024. Restructuring provisions at 31 December 2010 principally relate to Reed Business Information.
At 31 December 2010 provisions are included within current and non-current liabilities as follows:2010 2009
m m
Current liabilities 83 150Non-current liabilities 103 69Total 186 219
7 Combined share capitals2010 2009
m m
At start of year 252 215Issue of ordinary shares – 22Exchange translation differences 10 15At end of year 262 252
In July 2009, Reed Elsevier PLC placed 109,198,190 new ordinary shares at 405p per share for proceeds, net of issue costs, of £435m and Reed Elsevier NV issued 63,030,989 new ordinary shares at 7.08 per share for net proceeds of 441m. The number of shares issued represented 9.9% of the issued ordinary share capital of the respective parent companies prior to the placings. No share premium was recognised in Reed Elsevier PLC as the company took advantage of section 612 of the Companies Act 2006 regarding merger relief.
Combined share capitals exclude the shares of Reed Elsevier NV held by a subsidiary of Reed Elsevier PLC.
8 Combined share premiums2010 2009
m m
At start of year 3,144 2,605Issue of ordinary shares, net of expenses 13 442Exchange translation differences 65 97At end of year 3,222 3,144
Combined share premiums exclude the share premium in respect of shares of Reed Elsevier NV held by a subsidiary of Reed Elsevier PLC.
47213_Text_p129-141.indd 140 1/3/11 10:37:17
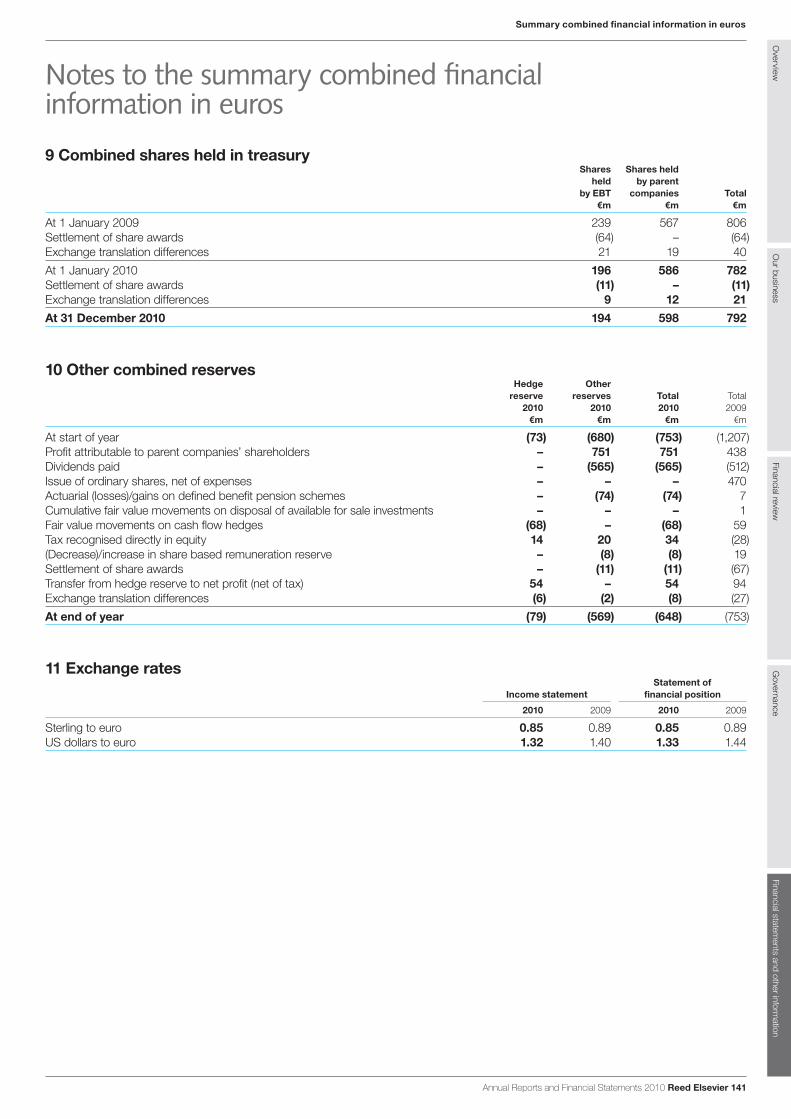
Summary combined financial information in euros
Annual Reports and Financial Statements 2010 Reed Elsevier 141
Overview
Our business
Financial reviewG
overnanceFinancial statem
ents and other information
Notes to the summary combined financial information in euros
9 Combined shares held in treasuryShares Shares held
held by parent by EBT companies Total
m m m
At 1 January 2009 239 567 806Settlement of share awards (64) – (64)Exchange translation differences 21 19 40At 1 January 2010 196 586 782Settlement of share awards (11) – (11)Exchange translation differences 9 12 21At 31 December 2010 194 598 792
10 Other combined reservesHedge Other
reserve reserves Total Total2010 2010 2010 2009
m m m m
At start of year (73) (680) (753) (1,207)Profit attributable to parent companies’ shareholders – 751 751 438Dividends paid – (565) (565) (512)Issue of ordinary shares, net of expenses – – – 470Actuarial (losses)/gains on defined benefit pension schemes – (74) (74) 7Cumulative fair value movements on disposal of available for sale investments – – – 1Fair value movements on cash flow hedges (68) – (68) 59Tax recognised directly in equity 14 20 34 (28)(Decrease)/increase in share based remuneration reserve – (8) (8) 19Settlement of share awards – (11) (11) (67)Transfer from hedge reserve to net profit (net of tax) 54 – 54 94Exchange translation differences (6) (2) (8) (27)At end of year (79) (569) (648) (753)
11 Exchange ratesStatement of
Income statement financial position
2010 2009 2010 2009
Sterling to euro 0.85 0.89 0.85 0.89US dollars to euro 1.32 1.40 1.33 1.44
47213_Text_p129-141.indd 141 1/3/11 10:37:17

142 Reed Elsevier Annual Reports and Financial Statements 2010
143 Directors’ report148 Consolidated financial statements152 Group accounting policies153 Notes to the consolidated financial statements160 Independent auditors’ report on the consolidated financial statements161 Parent company financial statements162 Parent company accounting policies162 Notes to the parent company financial statements163 Independent auditors’ report on the parent company financial statements164 5 year summary
Company number: 77536
Reed Elsevier PLC annual report and financial statements
47213_Text_p142-164.indd 142 1/3/11 10:36:15
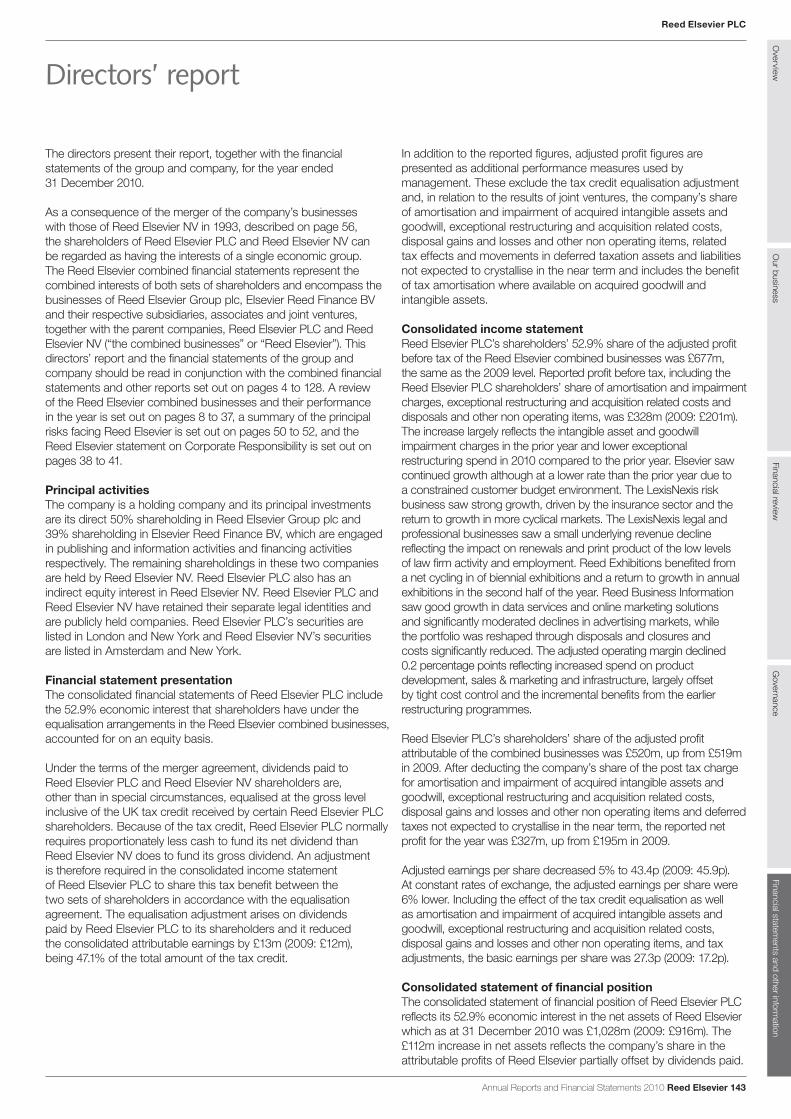
Overview
Our business
Financial reviewG
overnanceFinancial statem
ents and other information
Reed Elsevier PLC
The directors present their report, together with the financial statements of the group and company, for the year ended 31 December 2010.
As a consequence of the merger of the company’s businesses with those of Reed Elsevier NV in 1993, described on page 56, the shareholders of Reed Elsevier PLC and Reed Elsevier NV can be regarded as having the interests of a single economic group. The Reed Elsevier combined financial statements represent the combined interests of both sets of shareholders and encompass the businesses of Reed Elsevier Group plc, Elsevier Reed Finance BV and their respective subsidiaries, associates and joint ventures, together with the parent companies, Reed Elsevier PLC and Reed Elsevier NV (“the combined businesses” or “Reed Elsevier”). This directors’ report and the financial statements of the group and company should be read in conjunction with the combined financial statements and other reports set out on pages 4 to 128. A review of the Reed Elsevier combined businesses and their performance in the year is set out on pages 8 to 37, a summary of the principal risks facing Reed Elsevier is set out on pages 50 to 52, and the Reed Elsevier statement on Corporate Responsibility is set out on pages 38 to 41.
Principal activitiesThe company is a holding company and its principal investments are its direct 50% shareholding in Reed Elsevier Group plc and 39% shareholding in Elsevier Reed Finance BV, which are engaged in publishing and information activities and financing activities respectively. The remaining shareholdings in these two companies are held by Reed Elsevier NV. Reed Elsevier PLC also has an indirect equity interest in Reed Elsevier NV. Reed Elsevier PLC and Reed Elsevier NV have retained their separate legal identities and are publicly held companies. Reed Elsevier PLC’s securities are listed in London and New York and Reed Elsevier NV’s securities are listed in Amsterdam and New York.
Financial statement presentationThe consolidated financial statements of Reed Elsevier PLC include the 52.9% economic interest that shareholders have under the equalisation arrangements in the Reed Elsevier combined businesses, accounted for on an equity basis.
Under the terms of the merger agreement, dividends paid to Reed Elsevier PLC and Reed Elsevier NV shareholders are, other than in special circumstances, equalised at the gross level inclusive of the UK tax credit received by certain Reed Elsevier PLC shareholders. Because of the tax credit, Reed Elsevier PLC normally requires proportionately less cash to fund its net dividend than Reed Elsevier NV does to fund its gross dividend. An adjustment is therefore required in the consolidated income statement of Reed Elsevier PLC to share this tax benefit between the two sets of shareholders in accordance with the equalisation agreement. The equalisation adjustment arises on dividends paid by Reed Elsevier PLC to its shareholders and it reduced the consolidated attributable earnings by £13m (2009: £12m), being 47.1% of the total amount of the tax credit.
In addition to the reported figures, adjusted profit figures are presented as additional performance measures used by management. These exclude the tax credit equalisation adjustment and, in relation to the results of joint ventures, the company’s share of amortisation and impairment of acquired intangible assets and goodwill, exceptional restructuring and acquisition related costs, disposal gains and losses and other non operating items, related tax effects and movements in deferred taxation assets and liabilities not expected to crystallise in the near term and includes the benefit of tax amortisation where available on acquired goodwill and intangible assets.
Consolidated income statementReed Elsevier PLC’s shareholders’ 52.9% share of the adjusted profit before tax of the Reed Elsevier combined businesses was £677m, the same as the 2009 level. Reported profit before tax, including the Reed Elsevier PLC shareholders’ share of amortisation and impairment charges, exceptional restructuring and acquisition related costs and disposals and other non operating items, was £328m (2009: £201m). The increase largely reflects the intangible asset and goodwill impairment charges in the prior year and lower exceptional restructuring spend in 2010 compared to the prior year. Elsevier saw continued growth although at a lower rate than the prior year due to a constrained customer budget environment. The LexisNexis risk business saw strong growth, driven by the insurance sector and the return to growth in more cyclical markets. The LexisNexis legal and professional businesses saw a small underlying revenue decline reflecting the impact on renewals and print product of the low levels of law firm activity and employment. Reed Exhibitions benefited from a net cycling in of biennial exhibitions and a return to growth in annual exhibitions in the second half of the year. Reed Business Information saw good growth in data services and online marketing solutions and significantly moderated declines in advertising markets, while the portfolio was reshaped through disposals and closures and costs significantly reduced. The adjusted operating margin declined 0.2 percentage points reflecting increased spend on product development, sales & marketing and infrastructure, largely offset by tight cost control and the incremental benefits from the earlier restructuring programmes.
Reed Elsevier PLC’s shareholders’ share of the adjusted profit attributable of the combined businesses was £520m, up from £519m in 2009. After deducting the company’s share of the post tax charge for amortisation and impairment of acquired intangible assets and goodwill, exceptional restructuring and acquisition related costs, disposal gains and losses and other non operating items and deferred taxes not expected to crystallise in the near term, the reported net profit for the year was £327m, up from £195m in 2009.
Adjusted earnings per share decreased 5% to 43.4p (2009: 45.9p). At constant rates of exchange, the adjusted earnings per share were 6% lower. Including the effect of the tax credit equalisation as well as amortisation and impairment of acquired intangible assets and goodwill, exceptional restructuring and acquisition related costs, disposal gains and losses and other non operating items, and tax adjustments, the basic earnings per share was 27.3p (2009: 17.2p).
Consolidated statement of financial positionThe consolidated statement of financial position of Reed Elsevier PLC reflects its 52.9% economic interest in the net assets of Reed Elsevier which as at 31 December 2010 was £1,028m (2009: £916m). The £112m increase in net assets reflects the company’s share in the attributable profits of Reed Elsevier partially offset by dividends paid.
Directors’ report
Annual Reports and Financial Statements 2010 Reed Elsevier 143
47213_Text_p142-164.indd 143 2/3/11 22:45:01
DividendsThe board is recommending an equalised final dividend of 15.0p per ordinary share, unchanged from the prior year. This gives total ordinary dividends for the year of 20.4p (2009: 20.4p), unchanged on 2009. The final dividend will be paid on 17 May 2011 to shareholders on the Register on 26 April 2011.
Dividend cover, based on adjusted earnings per share and the total interim and proposed final dividends for the year, is 2.1 times. The boards of the company and Reed Elsevier NV have adopted dividend policies in recent years in respect of their equalised dividends that, subject to currency considerations, grow dividends broadly in line with adjusted earnings per share whilst maintaining dividend cover (being the number of times the annual dividend is covered by the adjusted earnings per share) of at least two times over the longer term.
The total dividend paid on the ordinary shares in the financial year was £245m (2009: £228m).
Parent company financial statementsThe individual parent company financial statements of Reed Elsevier PLC are presented on pages 161 to 163, and are prepared under UK Generally Accepted Accounting Practice (UK GAAP). Parent company shareholders’ funds as at 31 December 2010 were £2,791m (2009: £2,444m).
Corporate GovernanceThe company has complied throughout the year with the provisions of the Combined Code on Corporate Governance issued in June 2008 (the “UK Code”). The UK Code is publicly available at www.frc.org.uk. Details of how the principles of the UK Code have been applied and the directors’ statement on internal control are set out in the Structure and Corporate Governance report on pages 56 to 61.
In May 2010 the Financial Reporting Council issued The UK Corporate Governance Code (“the New UK Code”), which replaces the UK Code for financial years beginning on or after 29 June 2010. The New UK Code will, therefore, apply in respect of the company’s financial year beginning 1 January 2011.
Details of the role and responsibilities, membership and activities of the Reed Elsevier Audit Committees, including the company’s Audit Committee, are set out in the Report of the Audit Committees on pages 81 to 84.
DirectorsThe following served as directors of the company during the year:
A J Habgood (Chairman)E Engstrom (Chief Executive Officer)M H Armour (Chief Financial Officer)M W ElliottL HookR B PoletA Prozes (Retired 31 December 2010)D E Reid (senior independent director)Lord Sharman of Redlynch OBEB van der Veer
Biographical details of the directors at the date of this report are given on pages 54 and 55.
Directors are appointed in accordance with the Articles of Association, which provides that any director appointed during the year holds office only until the next following Annual General Meeting and is then eligible for election by the shareholders. The company’s Articles of Association provide that at every Annual General Meeting of the company, one third of the directors (or if their number is not a multiple of three the number nearest to one third) shall retire from office and, if they wish, put themselves up for re-election by the shareholders. The New UK Code, applicable in respect of the company’s financial year beginning 1 January 2011, recommends that all directors should seek re-election by shareholders annually. Accordingly, the board intends to implement this provision with effect from the Annual General Meeting to be held in April 2011.
The office of director shall be vacated if he or she: (i) resigns; (ii) becomes bankrupt or compounds with his or her creditors generally; (iii) is or may be suffering from a mental illness; (iv) is prohibited by law from being a director; or (v) is removed from office pursuant to the company’s Articles of Association. Subject to the shareholders’ rights to appoint individuals to the board in accordance with the company’s Articles of Association, no individual may be appointed to the board unless such appointment is recommended by the Nominations Committee.
Lord Sharman will retire as a director at the conclusion of the Annual General Meeting in April 2011, and will not seek re-election. In accordance with the provisions of the New UK Code, all other directors will retire from the board at the Annual General Meeting in 2011 and, being eligible, they will each offer themselves for re-election. Taking into account the assessment by the Corporate Governance Committee of the qualifications, performance and effectiveness of each individual director seeking re-election, the board has accepted a recommendation from the Nominations Committee that each director be proposed for re-election at the 2011 Annual General Meeting.
The board, in conjunction with external recruitment consultants, has been conducting a search for a suitable candidate as a non-executive director and, on the recommendation of the Nominations Committee, Adrian Hennah will be proposed for appointment as a non-executive director of Reed Elsevier PLC and as a member of the Supervisory Board of Reed Elsevier NV at the Reed Elsevier PLC and Reed Elsevier NV Annual General Meetings in April 2011. Mr Hennah was appointed chief financial officer of Smith & Nephew plc in 2006. He has over 25 years’ experience in finance and operations in the medical devices, technology and pharmaceuticals industries, and will bring highly relevant experience to the board discussions. Subject to his appointment at the Annual General Meetings, he will also be appointed a non-executive director of Reed Elsevier Group plc and a member of the Audit Committees and of the Corporate Governance Committee.
The notice period applicable to the service contracts of E Engstrom and M H Armour is 12 months. The remaining directors seeking re-appointment at the 2011 Annual General Meeting do not have service contracts.
Details of directors’ remuneration and their interests in the share capital of the company are provided in the Directors’ Remuneration Report on pages 62 to 80.
Directors’ report continued
144 Reed Elsevier Annual Reports and Financial Statements 2010
47213_Text_p142-164.indd 144 1/3/11 10:36:15

Overview
Our business
Financial reviewG
overnanceFinancial statem
ents and other information
Reed Elsevier PLC
Share capitalThe company’s issued share capital comprises a single class of ordinary shares, all of which are listed on the London Stock Exchange. All issued shares are fully paid up and carry no additional obligations or special rights. Each share carries the right to one vote at general meetings of the company. In a general meeting, subject to any rights and restrictions attached to any shares, on a show of hands every member who is present in person shall have one vote and every proxy present who has been duly appointed by one or more members entitled to vote on the resolution has one vote (although a proxy has one vote for and one vote against the resolution if: (i) the proxy has been duly appointed by more than one member entitled to vote on the resolution; and (ii) the proxy has been instructed by one or more of those members to vote for the resolution and by one or more other of those members to vote against it). Subject to any rights or restrictions attached to any shares, on a vote on a resolution on a poll every member present in person or by proxy shall have one vote for every share of which he is the holder. Proxy appointments and voting instructions must be received by the company’s registrars not less than 48 hours before a general meeting. There are no specific restrictions on the size of a holding nor on the transfer of shares, which are both governed by the general provisions of the Articles of Association and prevailing legislation. The company is not aware of any agreements between shareholders that may result in restrictions on the transfer of shares or on voting rights attached to the shares.
At the 2010 Annual General Meeting, shareholders passed a resolution authorising the directors to allot shares up to a nominal value of £9m, representing less than 5% of the company’s issued share capital. Since the 2010 Annual General Meeting no shares have been issued under this authority. The shareholder authority also permitted the directors to allot shares in order to satisfy entitlements under employee share plans, and details of such allotments are noted below. The authority to allot shares will expire at the 2011 Annual General Meeting, and a resolution to further extend the authority will be submitted to the shareholders at the 2011 Annual General Meeting.
During the year, 2,010,391 ordinary shares in the company were issued in order to satisfy entitlements under employee share plans as follows:
> 704,655 under a UK SAYE share option scheme at prices between 377.6p and 504.0p per share.
> 1,305,736 under executive share option schemes at prices between 451.5p and 534.0p per share.
The issued share capital as at 31 December 2010 is shown in note 12 to the consolidated financial statements.
Authority to purchase shares At the 2010 Annual General Meeting, shareholders passed a resolution authorising the purchase of up to 124.7 million ordinary shares in the company (representing less than 10% of the issued ordinary shares) by market purchase. No shares were purchased under this authority during the year. As at 31 December 2010 there were 34,196,298 ordinary shares held in treasury, representing 2.74% of the issued ordinary shares. The authority to make market purchases will expire at the 2011 Annual General Meeting, and a resolution to further extend the authority will be submitted to the shareholders at the 2011 Annual General Meeting.
Substantial share interestsAs at 16 February 2011, the company had been notified by the following shareholders that they held an interest of 3% or more in voting rights of the issued share capital of the company:
> Legal & General Group plc 4.30%> Silchester International Investors Limited 3.03%
The percentage interests stated above are as disclosed at the date on which the interests were notified to the company.
In addition to the interests noted above, the company is aware that as at the year end Scottish Widows Investment Partnership held, approximately, a 4.83% shareholding in the company and BlackRock Group held, approximately, a 4.22% shareholding in the company.
Employee benefit trustThe Trustee of the Reed Elsevier Group plc Employee Benefit Trust held an interest in 14,654,161 ordinary shares in the company (representing 1.17% of the issued ordinary shares) as at 31 December 2010. The Trustee may vote or abstain from voting any shares it holds in any way it sees fit.
Significant agreements – change of controlThe Governing Agreement between Reed Elsevier PLC and Reed Elsevier NV states that upon a change of control of Reed Elsevier PLC (for these purposes, the acquisition by a third party of 50% or more of the issued share capital having voting rights), should there not be a comparable offer from the offeror for Reed Elsevier NV, Reed Elsevier NV may serve notice upon Reed Elsevier PLC varying certain provisions of the Governing Agreement, including the governance and the standstill provisions.
There are a number of borrowing agreements including credit facilities that in the event of a change of control of both Reed Elsevier PLC and Reed Elsevier NV and, in some cases, a consequential credit rating downgrade to sub-investment grade may, at the option of the lenders, require repayment and/or cancellation as appropriate.
Powers of directorsSubject to the provisions of the Companies Act 2006, the company’s Articles of Association and any directions given by special resolutions, the business of the company shall be managed by the board which may exercise all the powers of the company.
Directors’ indemnityIn accordance with the company’s Articles of Association, the company has granted directors an indemnity, to the extent permitted by law, in respect of liabilities incurred as a result of their office. The company also purchased and maintained throughout the year Directors’ and Officers’ liability insurance in respect of itself and its directors.
Related party transactionsInternal controls are in place to ensure that any related party transactions involving directors or their connected persons are carried out on an arm’s length basis and are properly recorded.
Directors’ report continued
Annual Reports and Financial Statements 2010 Reed Elsevier 145
47213_Text_p142-164.indd 145 1/3/11 10:36:15
146 Reed Elsevier Annual Reports and Financial Statements 2010
Directors’ report continued
Conflict of interestThe company’s Articles of Association permit the board to approve situations where a director has an interest that conflicts, or may possibly conflict, with the interests of the company. The board has established a formal system whereby the Nominations Committee considers and decides whether to authorise any such conflict or potential conflict, and whether to impose limits or conditions when giving authorisation. In reaching its decision, the Nominations Committee is required to act in a way it considers would be most likely to promote the success of the company.
Creditor payment policyReed Elsevier companies agree terms and conditions for business transactions with suppliers, including the terms of payment. Reed Elsevier does not operate a standard code in respect of payments to suppliers. The average time taken to pay suppliers during the year was between 30 and 45 days (2009: between 30 and 45 days).
Charitable donationsThrough the Reed Elsevier Cares programme, which concentrates on education for disadvantaged young people, Reed Elsevier companies made donations during the year for charitable purposes amounting to £2.3m (2009: £2.5m) of which £0.5m (2009: £0.5m) was in the United Kingdom. Further information concerning the Reed Elsevier Cares programme is available from the Reed Elsevier Corporate Responsibility Report at www.reedelsevier.com/CorporateResponsibility.
Political donationsReed Elsevier does not make donations to EU political organisations or incur EU political expenditure. In the United States, Reed Elsevier companies donated £53,000 (2009: £46,000) to political organisations. In line with US law, these donations were not made at federal level, but only to candidates and political parties at the state and local levels.
Financial Statements and accounting recordsThe directors are responsible for preparing the directors’ report and the financial statements in accordance with applicable law and regulations.
Company law requires the directors to prepare financial statements for each financial year. Under that law the directors are required to prepare the consolidated financial statements in accordance with International Financial Reporting Standards as adopted by the European Union and Article 4 of the IAS Regulation and have elected to prepare the parent company financial statements in accordance with United Kingdom Generally Accepted Accounting Practice (United Kingdom Accounting Standards and applicable law). Under company law the directors must not approve the accounts unless they are satisfied that they give a true and fair view of the state of affairs of the company and of the profit or loss of the company for that period.
In preparing the parent company financial statements, the directors are required to: select suitable accounting policies and then apply them consistently; make judgments and accounting estimates that are reasonable and prudent; state whether applicable UK Accounting Standards have been followed, subject to any material departures being disclosed and explained in the financial statements; and prepare the financial statements on a going concern basis unless it is inappropriate to presume that the company will continue in business.
In preparing the group financial statements, IAS1 requires that directors: properly select and apply accounting policies; present information, including accounting policies, in a manner that provides relevant, reliable, comparable and understandable information; provide additional disclosures when compliance with the specific requirements in IFRSs are insufficient to enable users to understand the impact of particular transactions, other events and conditions on the entity’s financial position and financial performance; and make an assessment of the company’s ability to continue as a going concern.
The directors are responsible for keeping adequate accounting records that are sufficient to show and explain the company’s transactions and disclose with reasonable accuracy at any time the financial position of the company and enable them to ensure that the financial statements comply with the Companies Act 2006. They are also responsible for safeguarding the assets of the company and hence for taking reasonable steps for the prevention and detection of fraud and other irregularities.
Directors’ responsibility statementThe board confirms that to the best of its knowledge:
> the consolidated financial statements, prepared in accordance with International Financial Reporting Standards as issued by the International Accounting Standards Board and as adopted by the European Union, give a true and fair view of the financial position and profit or loss of the group; and
> the Directors’ Report includes a fair review of the development and performance of the business and the position of the group, together with a description of the principal risks and uncertainties that it faces.
Neither the company nor the directors accept any liability to any person in relation to the Annual Report except to the extent that such liability could arise under English law. Accordingly, any liability to a person who has demonstrated reliance on any untrue or misleading statement or omission shall be determined in accordance with Section 90A of the Financial Services and Markets Act 2000.
47213_Text_p142-164.indd 146 1/3/11 10:36:16
Reed Elsevier PLC
Annual Reports and Financial Statements 2010 Reed Elsevier 147
Overview
Our business
Financial reviewG
overnanceFinancial statem
ents and other information
Directors’ report continued
Disclosure of information to auditorsAs part of the process of approving the company’s 2010 financial statements, the directors have taken steps pursuant to section 418(2) of the Companies Act 2006 to ensure that they are aware of any relevant audit information and to establish that the company’s auditors are aware of that information. In that context, so far as the directors are aware, there is no relevant audit information of which the company’s auditors are unaware.
Going concernThe directors, having made appropriate enquiries, consider that adequate resources exist for the combined businesses to continue in operational existence for the foreseeable future and that, therefore, it is appropriate to adopt the going concern basis in preparing the 2010 financial statements. In reaching this conclusion, the directors have had due regard to the combined businesses’ financial position as at 31 December 2010, the strong free cash flow of the combined businesses, Reed Elsevier’s ability to access capital markets and the principal risks facing Reed Elsevier.
A commentary on the Reed Elsevier combined businesses’ cash flows, financial position and liquidity for the year ended 31 December 2010 is set out in the Chief Financial Officer’s Report on pages 44 and 45. This shows that, after taking account of available cash resources and committed bank facilities that back up short term borrowings, none of Reed Elsevier’s borrowings fall due within the next two years. Reed Elsevier’s policies on liquidity, capital management and management of risks relating to interest rate, foreign exchange and credit exposures are set out on pages 48 and 49. Further information on liquidity of the combined businesses can be found in note 18 of the combined financial statements. The principal risks facing Reed Elsevier are set out on pages 50 to 52.
AuditorsResolutions for the re-appointment of Deloitte LLP as auditors of the company and to authorise the directors to fix their remuneration will be submitted to shareholders at the 2011 Annual General Meeting.
By order of the board Registered Office
Stephen J Cowden 1-3 StrandSecretary London 16 February 2011 WC2N 5JR
47213_Text_p142-164.indd 147 1/3/11 10:36:16

Consolidated income statement
148 Reed Elsevier Annual Reports and Financial Statements 2010
2010 2009 For the year ended 31 December Note £m £m
Administrative expenses 1 (2) (2)Effect of tax credit equalisation on distributed earnings 2 (13) (12)Share of results of joint ventures 11 342 213Operating profit 327 199Finance income 5 1 2Profit before tax 328 201Taxation 6 (1) (6)Profit attributable to ordinary shareholders 327 195
Consolidated statement of comprehensive income2010 2009
For the year ended 31 December £m £m
Profit attributable to ordinary shareholders 327 195Share of joint ventures’ other comprehensive income/(expense) for year 25 (2)Total comprehensive income for the year 352 193
Earnings per ordinary share2010 2009
For the year ended 31 December Note pence pence
Basic earnings per share 8 27.3 17.2Diluted earnings per share 8 27.1 17.1
47213_Text_p142-164.indd 148 1/3/11 10:36:16

Overview
Our business
Financial reviewG
overnanceFinancial statem
ents and other information
Reed Elsevier PLC
Consolidated statement of cash flows
2010 2009 For the year ended 31 December Note £m £m
Cash flows from operating activitiesCash used by operations 10 (2) (2)Interest received 1 2Tax paid (3) (6)Net cash used in operating activities (4) (6)
Cash flows from investing activitiesDividends received from joint ventures 11 589 –Increase in investment in joint ventures 11 (596) (462)Net cash used in investing activities (7) (462)
Cash flows from financing activitiesEquity dividends paid 7 (245) (228)Proceeds on issue of ordinary shares 9 440Decrease in net funding balances due from joint ventures 10 247 256Net cash from financing activities 11 468
Movement in cash and cash equivalents – –
Annual Reports and Financial Statements 2010 Reed Elsevier 149
47213_Text_p142-164.indd 149 1/3/11 10:36:16
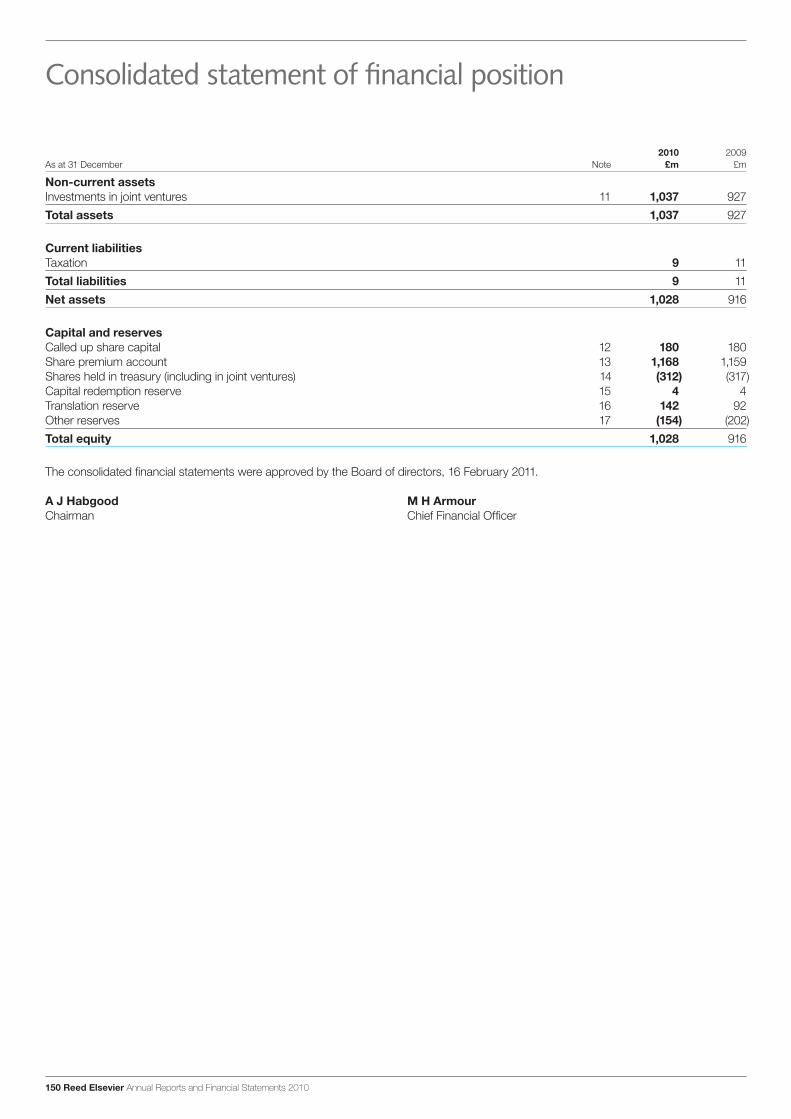
Consolidated statement of financial position
150 Reed Elsevier Annual Reports and Financial Statements 2010
2010 2009 As at 31 December Note £m £m
Non-current assetsInvestments in joint ventures 11 1,037 927Total assets 1,037 927
Current liabilitiesTaxation 9 11Total liabilities 9 11Net assets 1,028 916
Capital and reservesCalled up share capital 12 180 180Share premium account 13 1,168 1,159Shares held in treasury (including in joint ventures) 14 (312) (317)Capital redemption reserve 15 4 4Translation reserve 16 142 92Other reserves 17 (154) (202)Total equity 1,028 916
The consolidated financial statements were approved by the Board of directors, 16 February 2011.
A J Habgood M H Armour Chairman Chief Financial Officer
47213_Text_p142-164.indd 150 1/3/11 10:36:16
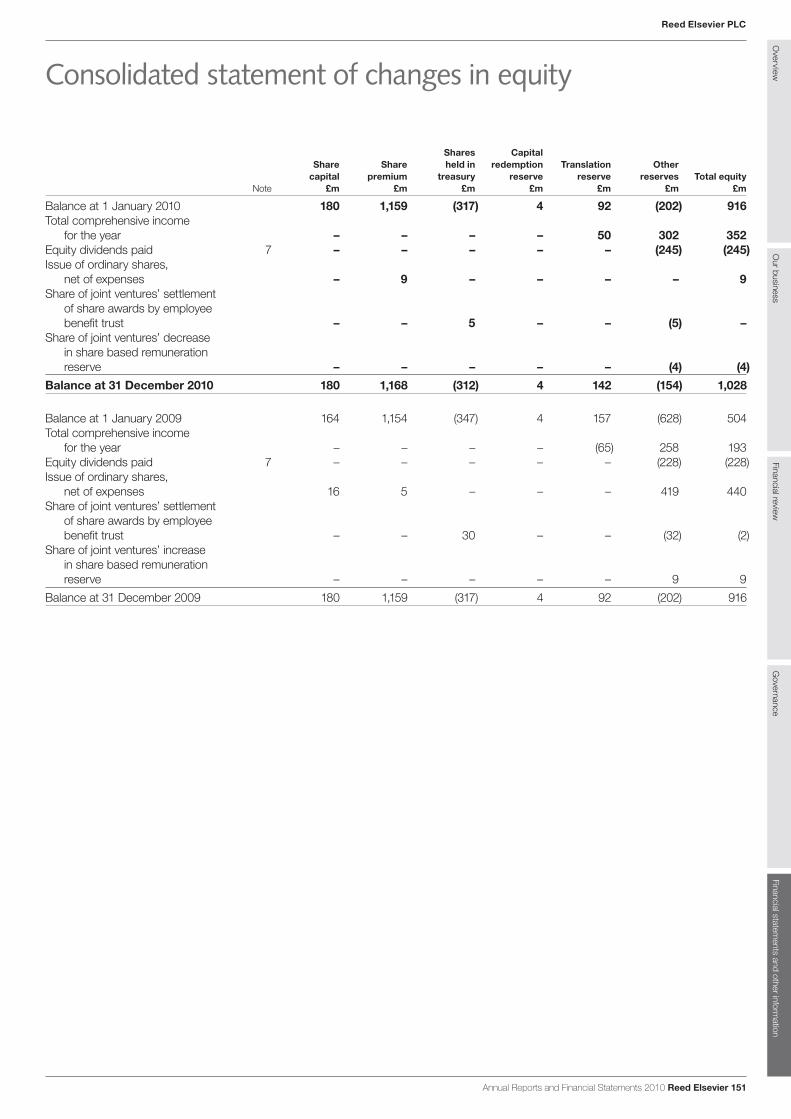
Overview
Our business
Financial reviewG
overnanceFinancial statem
ents and other information
Shares Capital Share Share held in redemption Translation Other
capital premium treasury reserve reserve reserves Total equity Note £m £m £m £m £m £m £m
Balance at 1 January 2010 180 1,159 (317) 4 92 (202) 916Total comprehensive income
for the year – – – – 50 302 352Equity dividends paid 7 – – – – – (245) (245)Issue of ordinary shares,
net of expenses – 9 – – – – 9Share of joint ventures’ settlement
of share awards by employee benefit trust – – 5 – – (5) –
Share of joint ventures’ decrease in share based remuneration reserve – – – – – (4) (4)
Balance at 31 December 2010 180 1,168 (312) 4 142 (154) 1,028
Balance at 1 January 2009 164 1,154 (347) 4 157 (628) 504Total comprehensive income
for the year – – – – (65) 258 193Equity dividends paid 7 – – – – – (228) (228)Issue of ordinary shares,
net of expenses 16 5 – – – 419 440Share of joint ventures’ settlement
of share awards by employee benefit trust – – 30 – – (32) (2)
Share of joint ventures’ increase in share based remuneration reserve – – – – – 9 9
Balance at 31 December 2009 180 1,159 (317) 4 92 (202) 916
Reed Elsevier PLC
Consolidated statement of changes in equity
Annual Reports and Financial Statements 2010 Reed Elsevier 151
47213_Text_p142-164.indd 151 1/3/11 10:36:16
Group accounting policies
152 Reed Elsevier Annual Reports and Financial Statements 2010
Basis of preparationThese consolidated financial statements have been prepared under the historical cost convention in accordance with applicable accounting standards. They report the consolidated statements of income, cash flow and financial position of Reed Elsevier PLC, and have been prepared in accordance with International Financial Reporting Standards (IFRS) as endorsed by the European Union and as issued by the International Accounting Standards Board (IASB).
The consolidated financial statements are prepared on a going concern basis, as explained on page 147.
Unless otherwise indicated, all amounts shown in the financial statements are in millions of pounds.
The basis of the merger of the businesses of Reed Elsevier PLC and Reed Elsevier NV is set out on page 56.
Determination of profitThe Reed Elsevier PLC share of the Reed Elsevier combined results has been calculated on the basis of the 52.9% economic interest of the Reed Elsevier PLC shareholders in the Reed Elsevier combined businesses, after taking account of results arising in Reed Elsevier PLC and its subsidiaries. Dividends paid to Reed Elsevier PLC and Reed Elsevier NV shareholders are, other than in special circumstances, equalised at the gross level inclusive of the UK tax credit received by certain Reed Elsevier PLC shareholders. In Reed Elsevier PLC’s consolidated financial statements, an adjustment is required to equalise the benefit of the tax credit between the two sets of shareholders in accordance with the equalisation agreement. This equalisation adjustment arises on dividends paid by Reed Elsevier PLC to its shareholders and reduces the consolidated attributable earnings by 47.1% of the total amount of the tax credit.
The accounting policies adopted in the preparation of the combined financial statements are set out on pages 90 to 96.
InvestmentsReed Elsevier PLC’s 52.9% economic interest in the net assets of the combined businesses has been shown on the statement of financial position as investments in joint ventures, net of the assets and liabilities reported as part of Reed Elsevier PLC and its subsidiaries. Investments in joint ventures are accounted for using the equity method.
Foreign exchange translationTransactions in foreign currencies are recorded at the rate of exchange prevailing on the date of the transaction. At each statement of financial position date, monetary assets and liabilities that are denominated in foreign currencies are retranslated at the rate prevailing on the statement of financial position date. Exchange differences arising are recorded in the income statement. The exchange gains or losses relating to the retranslation of Reed Elsevier PLC’s 52.9% economic interest in the net assets of the combined businesses are classified as equity and transferred to the translation reserve.
When foreign operations are disposed of, the related cumulative translation differences are recognised within the income statement in the period.
TaxationThe tax expense represents the sum of the tax payable on the current year taxable profits, adjustments in respect of prior year taxable profits and the movements on deferred tax that are recognised in the income statement. Tax arising in joint ventures is included in the share of results of joint ventures.
The tax payable on current year taxable profits is calculated using the applicable tax rate that has been enacted, or substantively enacted, by the statement of financial position date.
Deferred tax is the tax arising on differences between the carrying amounts of assets and liabilities in the financial statements and their corresponding tax bases used in the computation of taxable profit, and is accounted for using the balance sheet liability method. Deferred tax liabilities are generally recognised for all taxable temporary differences and deferred tax assets are recognised to the extent that, based on current forecasts, it is probable that taxable profits will be available against which deductible temporary differences can be utilised.
Deferred tax is calculated using tax rates that are expected toapply in the period when the liability is settled or the asset is realised. Full provision is made for deferred tax which would become payable on the distribution of retained profits from foreign subsidiaries, associates or joint ventures.
Movements in deferred tax are charged and credited in the income statement, except when they relate to items charged or credited directly to equity, in which case the deferred tax is also recognised in equity.
Critical judgements and key sources of estimation uncertaintyCritical judgements in the preparation of the combined financial statements are set out on pages 94 and 95.
Standards, amendments and interpretations not yet effectiveRecently issued standards, amendments and interpretations and their impact on future accounting policies and reporting have been considered on page 96 of the combined financial statements and are not expected to have a significant impact on the consolidated financial statements.
47213_Text_p142-164.indd 152 1/3/11 10:36:16

Overview
Our business
Financial reviewG
overnanceFinancial statem
ents and other information
1 Administrative expenses
Administrative expenses include £742,000 (2009: £712,000) paid in the year to Reed Elsevier Group plc under a contract for the services of directors and administrative support. Reed Elsevier PLC has no employees (2009: nil).
2 Effect of tax credit equalisation on distributed earnings
The tax credit equalisation adjustment arises on ordinary dividends paid by Reed Elsevier PLC to its shareholders and reduces the consolidated profit attributable to ordinary shareholders by 47.1% of the total amount of the tax credit, as set out in the accounting policies on page 152.
3 Auditors’ remuneration
Audit fees payable by Reed Elsevier PLC were £27,000 (2009: £26,000). Further information on the audit and non-audit fees paid by the Reed Elsevier combined businesses to Deloitte LLP and its associates is set out in note 3 to the combined financial statements.
4 Related party transactions
All transactions with joint ventures, which are related parties of Reed Elsevier PLC, are reflected in these financial statements. Key management personnel are also related parties and comprise the executive directors of Reed Elsevier PLC. Transactions with key management personnel are set out in note 33 to the combined financial statements.
5 Finance income2010 2009
£m £m
Finance income from joint ventures 1 2
6 Taxation2010 2009
£m £m
UK corporation tax 1 6
A reconciliation of the notional tax charge based on the applicable rate of tax to the actual total tax expense is set out below.
2010 2009 £m £m
Profit before tax 328 201Tax at applicable rate 28% (2009: 28%) 92 56Tax at applicable rate on share of results of joint ventures (96) (60)Other 5 10Tax expense 1 6
Reed Elsevier PLC
Notes to the consolidated financial statementsfor the year ended 31 December 2010
Annual Reports and Financial Statements 2010 Reed Elsevier 153
47213_Text_p142-164.indd 153 1/3/11 10:36:16

Notes to the consolidated financial statementsfor the year ended 31 December 2010
154 Reed Elsevier Annual Reports and Financial Statements 2010
7 Equity dividends
2010 2009 2010 2009 Ordinary dividends declared in the year pence pence £m £m
Ordinary shares Final for prior financial year 15.0p 15.0p 180 163Interim for financial year 5.4p 5.4p 65 65
Total 20.4p 20.4p 245 228
The directors of Reed Elsevier PLC have proposed a final dividend of 15.0p (2009: 15.0p). The cost of funding the proposed final dividend is expected to be £180m. No liability has been recognised at the statement of financial position date.
2010 2009 Ordinary dividends paid and proposed relating to the financial year pence pence
Ordinary shares Interim (paid) 5.4p 5.4pFinal (proposed) 15.0p 15.0p
Total 20.4p 20.4p
8 Earnings per ordinary share (“EPS”)2010 2009
Weighted Weighted average average
number of number of shares Earnings EPS shares Earnings EPS
(millions) £m pence (millions) £m pence
Basic earnings per share 1,199.1 327 27.3 1,131.4 195 17.2Based on 52.9% interest in total operations
of the combined businesses 1,199.1 340 28.4 1,131.4 207 18.3Diluted earnings per share 1,205.1 327 27.1 1,139.5 195 17.1
The diluted EPS figures are calculated after taking account of the effect of potential additional ordinary shares arising from share options and conditional shares.
47213_Text_p142-164.indd 154 1/3/11 10:36:16
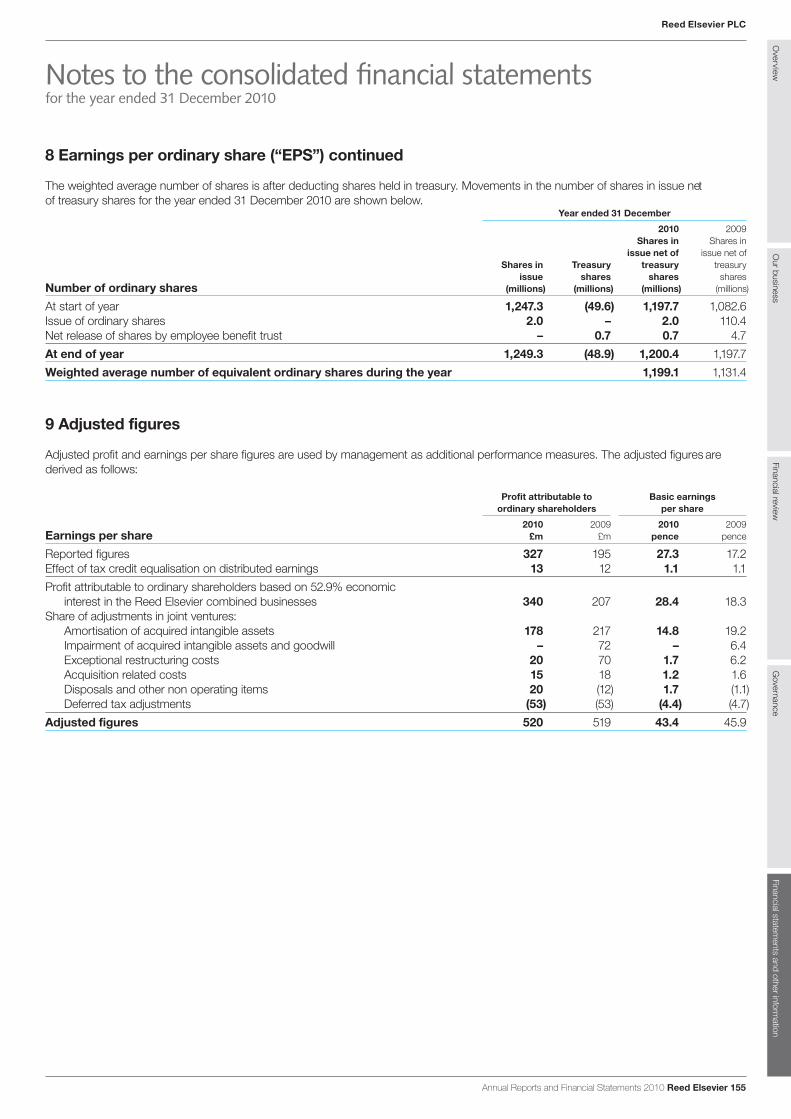
Overview
Our business
Financial reviewG
overnanceFinancial statem
ents and other information
8 Earnings per ordinary share (“EPS”) continued
The weighted average number of shares is after deducting shares held in treasury. Movements in the number of shares in issue net of treasury shares for the year ended 31 December 2010 are shown below.
Year ended 31 December
2010 2009 Shares in Shares in
issue net of issue net of Shares in Treasury treasury treasury
issue shares shares shares Number of ordinary shares (millions) (millions) (millions) (millions)
At start of year 1,247.3 (49.6) 1,197.7 1,082.6Issue of ordinary shares 2.0 – 2.0 110.4Net release of shares by employee benefit trust – 0.7 0.7 4.7At end of year 1,249.3 (48.9) 1,200.4 1,197.7Weighted average number of equivalent ordinary shares during the year 1,199.1 1,131.4
9 Adjusted figures
Adjusted profit and earnings per share figures are used by management as additional performance measures. The adjusted figures are derived as follows:
Profit attributable to Basic earnings ordinary shareholders per share
2010 2009 2010 2009 Earnings per share £m £m pence pence
Reported figures 327 195 27.3 17.2Effect of tax credit equalisation on distributed earnings 13 12 1.1 1.1Profit attributable to ordinary shareholders based on 52.9% economic
interest in the Reed Elsevier combined businesses 340 207 28.4 18.3Share of adjustments in joint ventures:
Amortisation of acquired intangible assets 178 217 14.8 19.2Impairment of acquired intangible assets and goodwill – 72 – 6.4Exceptional restructuring costs 20 70 1.7 6.2Acquisition related costs 15 18 1.2 1.6Disposals and other non operating items 20 (12) 1.7 (1.1)Deferred tax adjustments (53) (53) (4.4) (4.7)
Adjusted figures 520 519 43.4 45.9
Reed Elsevier PLC
Notes to the consolidated financial statementsfor the year ended 31 December 2010
Annual Reports and Financial Statements 2010 Reed Elsevier 155
47213_Text_p142-164.indd 155 1/3/11 10:36:16
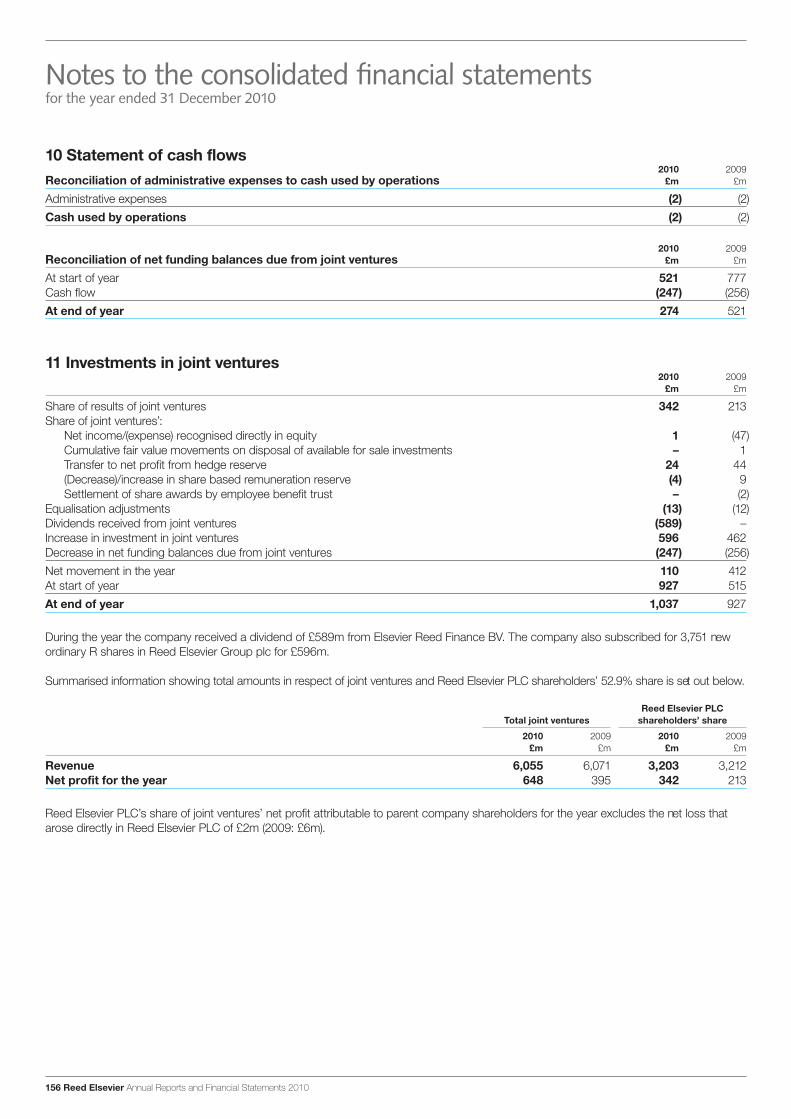
Notes to the consolidated financial statementsfor the year ended 31 December 2010
156 Reed Elsevier Annual Reports and Financial Statements 2010
10 Statement of cash flows2010 2009
Reconciliation of administrative expenses to cash used by operations £m £m
Administrative expenses (2) (2)Cash used by operations (2) (2)
2010 2009 Reconciliation of net funding balances due from joint ventures £m £m
At start of year 521 777Cash flow (247) (256)At end of year 274 521
11 Investments in joint ventures2010 2009
£m £m
Share of results of joint ventures 342 213Share of joint ventures’:
Net income/(expense) recognised directly in equity 1 (47)Cumulative fair value movements on disposal of available for sale investments – 1Transfer to net profit from hedge reserve 24 44(Decrease)/increase in share based remuneration reserve (4) 9Settlement of share awards by employee benefit trust – (2)
Equalisation adjustments (13) (12)Dividends received from joint ventures (589) –Increase in investment in joint ventures 596 462Decrease in net funding balances due from joint ventures (247) (256)Net movement in the year 110 412At start of year 927 515At end of year 1,037 927
During the year the company received a dividend of £589m from Elsevier Reed Finance BV. The company also subscribed for 3,751 new ordinary R shares in Reed Elsevier Group plc for £596m.
Summarised information showing total amounts in respect of joint ventures and Reed Elsevier PLC shareholders’ 52.9% share is set out below.
Reed Elsevier PLC Total joint ventures shareholders’ share
2010 2009 2010 2009 £m £m £m £m
Revenue 6,055 6,071 3,203 3,212 Net profit for the year 648 395 342 213
Reed Elsevier PLC’s share of joint ventures’ net profit attributable to parent company shareholders for the year excludes the net loss that arose directly in Reed Elsevier PLC of £2m (2009: £6m).
47213_Text_p142-164.indd 156 1/3/11 10:36:16
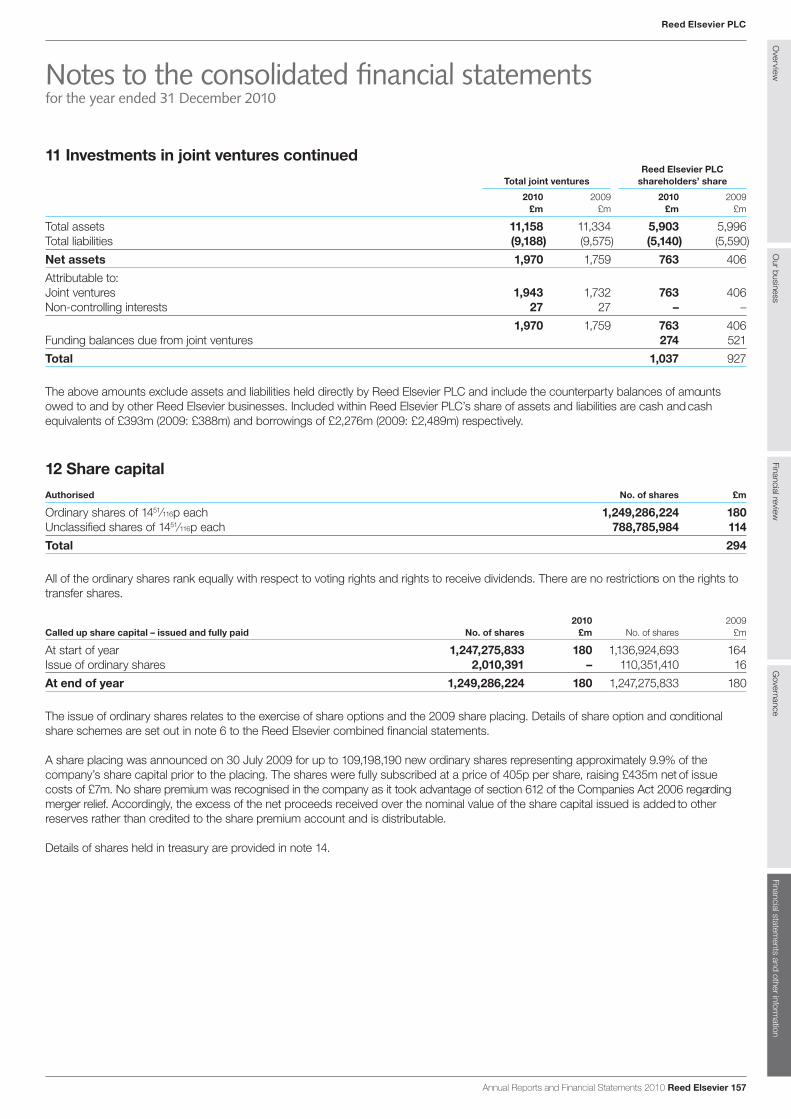
Overview
Our business
Financial reviewG
overnanceFinancial statem
ents and other information
11 Investments in joint ventures continuedReed Elsevier PLC
Total joint ventures shareholders’ share
2010 2009 2010 2009 £m £m £m £m
Total assets 11,158 11,334 5,903 5,996Total liabilities (9,188) (9,575) (5,140) (5,590)Net assets 1,970 1,759 763 406Attributable to:Joint ventures 1,943 1,732 763 406Non-controlling interests 27 27 – –
1,970 1,759 763 406Funding balances due from joint ventures 274 521Total 1,037 927
The above amounts exclude assets and liabilities held directly by Reed Elsevier PLC and include the counterparty balances of amounts owed to and by other Reed Elsevier businesses. Included within Reed Elsevier PLC’s share of assets and liabilities are cash and cash equivalents of £393m (2009: £388m) and borrowings of £2,276m (2009: £2,489m) respectively.
12 Share capitalAuthorised No. of shares £m
Ordinary shares of 1451⁄116p each 1,249,286,224 180Unclassified shares of 1451⁄116p each 788,785,984 114Total 294
All of the ordinary shares rank equally with respect to voting rights and rights to receive dividends. There are no restrictions on the rights to transfer shares.
2010 2009 Called up share capital – issued and fully paid No. of shares £m No. of shares £m
At start of year 1,247,275,833 180 1,136,924,693 164Issue of ordinary shares 2,010,391 – 110,351,410 16At end of year 1,249,286,224 180 1,247,275,833 180
The issue of ordinary shares relates to the exercise of share options and the 2009 share placing. Details of share option and conditional share schemes are set out in note 6 to the Reed Elsevier combined financial statements.
A share placing was announced on 30 July 2009 for up to 109,198,190 new ordinary shares representing approximately 9.9% of the company’s share capital prior to the placing. The shares were fully subscribed at a price of 405p per share, raising £435m net of issue costs of £7m. No share premium was recognised in the company as it took advantage of section 612 of the Companies Act 2006 regarding merger relief. Accordingly, the excess of the net proceeds received over the nominal value of the share capital issued is added to other reserves rather than credited to the share premium account and is distributable.
Details of shares held in treasury are provided in note 14.
Reed Elsevier PLC
Notes to the consolidated financial statementsfor the year ended 31 December 2010
Annual Reports and Financial Statements 2010 Reed Elsevier 157
47213_Text_p142-164.indd 157 1/3/11 10:36:16
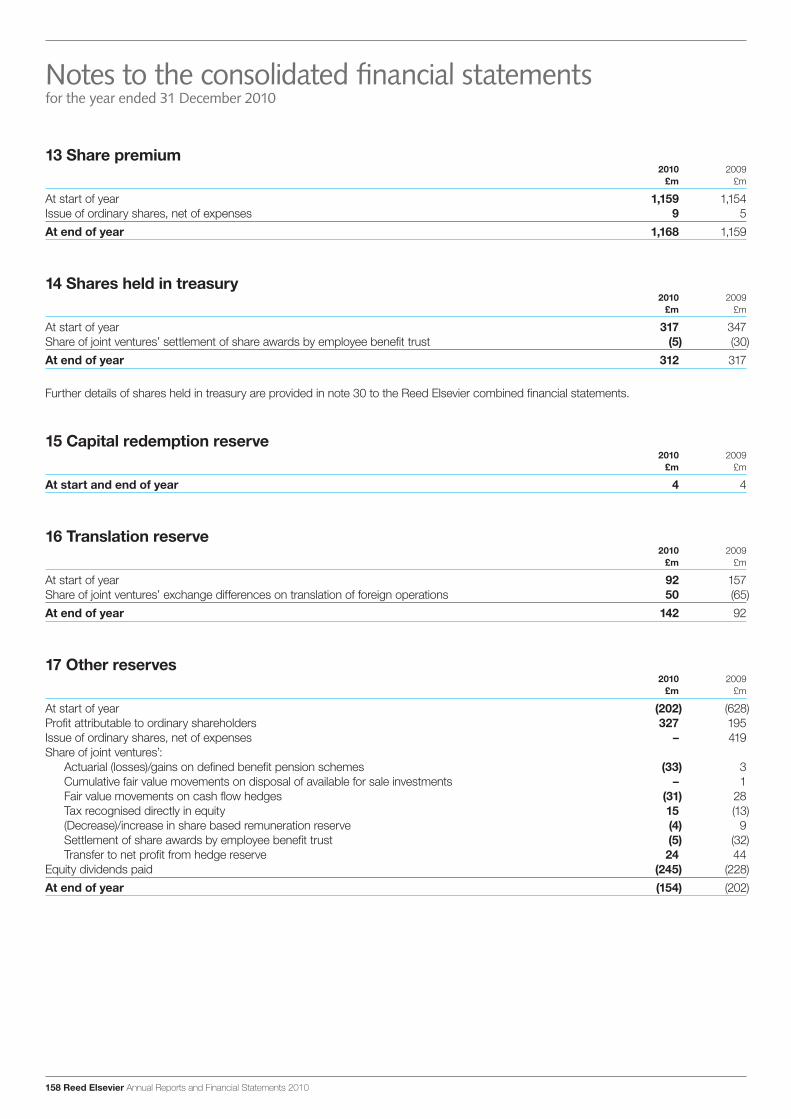
Notes to the consolidated financial statementsfor the year ended 31 December 2010
158 Reed Elsevier Annual Reports and Financial Statements 2010
13 Share premium2010 2009
£m £m
At start of year 1,159 1,154Issue of ordinary shares, net of expenses 9 5At end of year 1,168 1,159
14 Shares held in treasury2010 2009
£m £m
At start of year 317 347Share of joint ventures’ settlement of share awards by employee benefit trust (5) (30)At end of year 312 317
Further details of shares held in treasury are provided in note 30 to the Reed Elsevier combined financial statements.
15 Capital redemption reserve2010 2009
£m £m
At start and end of year 4 4
16 Translation reserve2010 2009
£m £m
At start of year 92 157Share of joint ventures’ exchange differences on translation of foreign operations 50 (65)At end of year 142 92
17 Other reserves2010 2009
£m £m
At start of year (202) (628)Profit attributable to ordinary shareholders 327 195Issue of ordinary shares, net of expenses – 419Share of joint ventures’:
Actuarial (losses)/gains on defined benefit pension schemes (33) 3Cumulative fair value movements on disposal of available for sale investments – 1Fair value movements on cash flow hedges (31) 28Tax recognised directly in equity 15 (13)(Decrease)/increase in share based remuneration reserve (4) 9Settlement of share awards by employee benefit trust (5) (32)Transfer to net profit from hedge reserve 24 44
Equity dividends paid (245) (228)At end of year (154) (202)
47213_Text_p142-164.indd 158 1/3/11 10:36:16
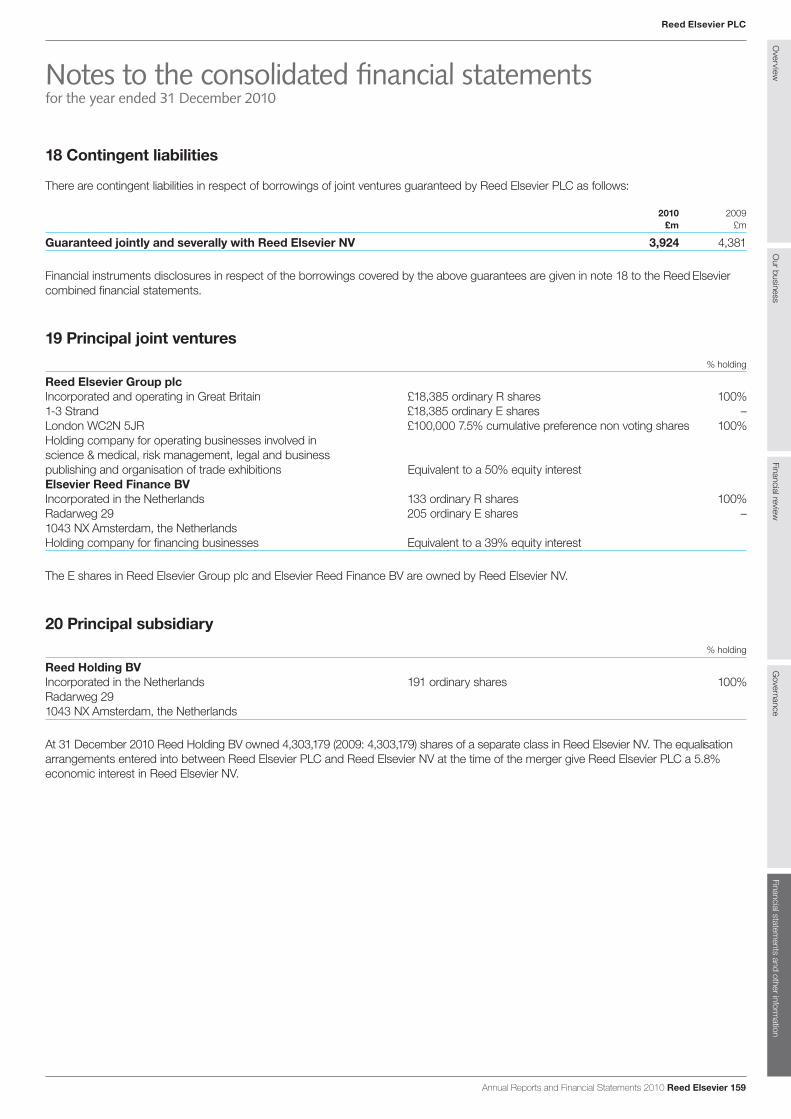
Overview
Our business
Financial reviewG
overnanceFinancial statem
ents and other information
18 Contingent liabilities
There are contingent liabilities in respect of borrowings of joint ventures guaranteed by Reed Elsevier PLC as follows:
2010 2009 £m £m
Guaranteed jointly and severally with Reed Elsevier NV 3,924 4,381
Financial instruments disclosures in respect of the borrowings covered by the above guarantees are given in note 18 to the Reed Elsevier combined financial statements.
19 Principal joint ventures% holding
Reed Elsevier Group plcIncorporated and operating in Great Britain £18,385 ordinary R shares 100%1-3 Strand £18,385 ordinary E shares –London WC2N 5JR £100,000 7.5% cumulative preference non voting shares 100%Holding company for operating businesses involved in science & medical, risk management, legal and business publishing and organisation of trade exhibitions Equivalent to a 50% equity interestElsevier Reed Finance BVIncorporated in the Netherlands 133 ordinary R shares 100%Radarweg 29 205 ordinary E shares –1043 NX Amsterdam, the Netherlands Holding company for financing businesses Equivalent to a 39% equity interest
The E shares in Reed Elsevier Group plc and Elsevier Reed Finance BV are owned by Reed Elsevier NV.
20 Principal subsidiary% holding
Reed Holding BV Incorporated in the Netherlands 191 ordinary shares 100%Radarweg 291043 NX Amsterdam, the Netherlands
At 31 December 2010 Reed Holding BV owned 4,303,179 (2009: 4,303,179) shares of a separate class in Reed Elsevier NV. The equalisation arrangements entered into between Reed Elsevier PLC and Reed Elsevier NV at the time of the merger give Reed Elsevier PLC a 5.8% economic interest in Reed Elsevier NV.
Reed Elsevier PLC
Notes to the consolidated financial statementsfor the year ended 31 December 2010
Annual Reports and Financial Statements 2010 Reed Elsevier 159
47213_Text_p142-164.indd 159 1/3/11 10:36:17
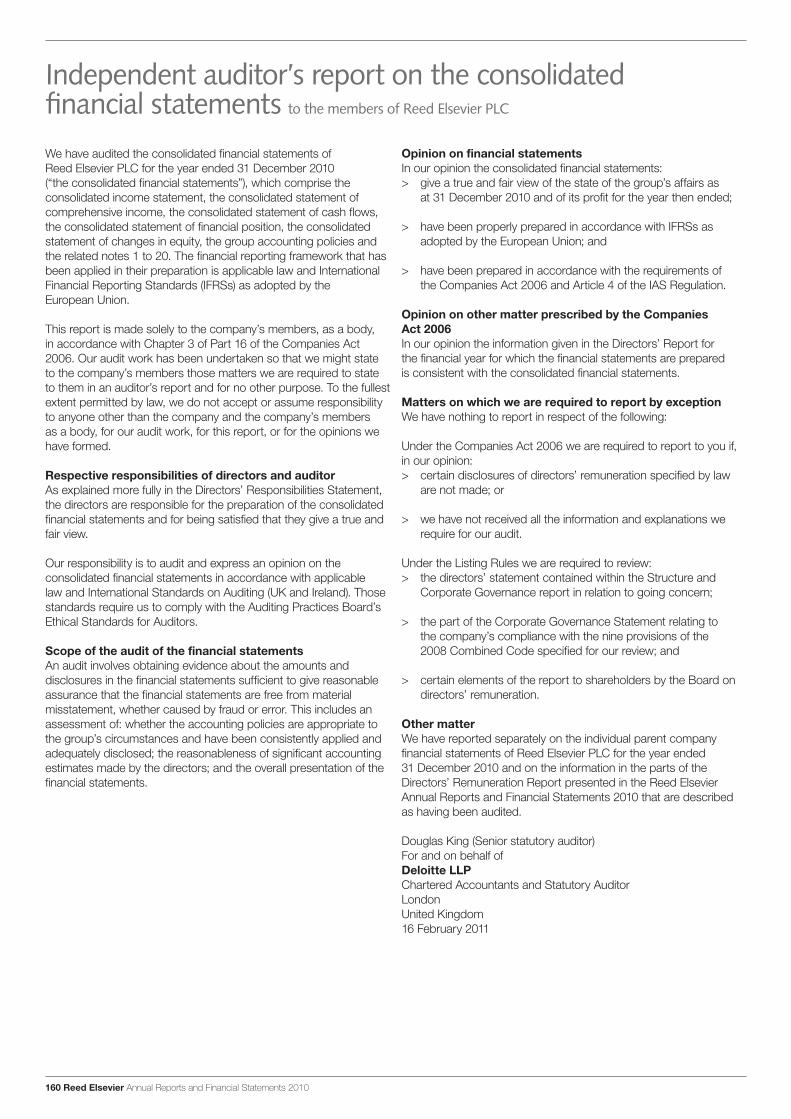
Independent auditor’s report on the consolidated financial statements to the members of Reed Elsevier PLC
160 Reed Elsevier Annual Reports and Financial Statements 2010
We have audited the consolidated financial statements of Reed Elsevier PLC for the year ended 31 December 2010 (“the consolidated financial statements”), which comprise the consolidated income statement, the consolidated statement of comprehensive income, the consolidated statement of cash flows, the consolidated statement of financial position, the consolidated statement of changes in equity, the group accounting policies and the related notes 1 to 20. The financial reporting framework that has been applied in their preparation is applicable law and International Financial Reporting Standards (IFRSs) as adopted by the European Union.
This report is made solely to the company’s members, as a body, in accordance with Chapter 3 of Part 16 of the Companies Act 2006. Our audit work has been undertaken so that we might state to the company’s members those matters we are required to state to them in an auditor’s report and for no other purpose. To the fullest extent permitted by law, we do not accept or assume responsibility to anyone other than the company and the company’s members as a body, for our audit work, for this report, or for the opinions we have formed.
Respective responsibilities of directors and auditorAs explained more fully in the Directors’ Responsibilities Statement, the directors are responsible for the preparation of the consolidated financial statements and for being satisfied that they give a true and fair view.
Our responsibility is to audit and express an opinion on the consolidated financial statements in accordance with applicable law and International Standards on Auditing (UK and Ireland). Those standards require us to comply with the Auditing Practices Board’s Ethical Standards for Auditors.
Scope of the audit of the financial statementsAn audit involves obtaining evidence about the amounts and disclosures in the financial statements sufficient to give reasonable assurance that the financial statements are free from material misstatement, whether caused by fraud or error. This includes an assessment of: whether the accounting policies are appropriate to the group’s circumstances and have been consistently applied and adequately disclosed; the reasonableness of significant accounting estimates made by the directors; and the overall presentation of the financial statements.
Opinion on financial statementsIn our opinion the consolidated financial statements:> give a true and fair view of the state of the group’s affairs as
at 31 December 2010 and of its profit for the year then ended;
> have been properly prepared in accordance with IFRSs as adopted by the European Union; and
> have been prepared in accordance with the requirements of the Companies Act 2006 and Article 4 of the IAS Regulation.
Opinion on other matter prescribed by the Companies Act 2006In our opinion the information given in the Directors’ Report for the financial year for which the financial statements are prepared is consistent with the consolidated financial statements.
Matters on which we are required to report by exceptionWe have nothing to report in respect of the following:
Under the Companies Act 2006 we are required to report to you if, in our opinion:> certain disclosures of directors’ remuneration specified by law
are not made; or
> we have not received all the information and explanations we require for our audit.
Under the Listing Rules we are required to review:> the directors’ statement contained within the Structure and
Corporate Governance report in relation to going concern;
> the part of the Corporate Governance Statement relating to the company’s compliance with the nine provisions of the 2008 Combined Code specified for our review; and
> certain elements of the report to shareholders by the Board on directors’ remuneration.
Other matterWe have reported separately on the individual parent company financial statements of Reed Elsevier PLC for the year ended 31 December 2010 and on the information in the parts of the Directors’ Remuneration Report presented in the Reed Elsevier Annual Reports and Financial Statements 2010 that are described as having been audited.
Douglas King (Senior statutory auditor)For and on behalf of Deloitte LLPChartered Accountants and Statutory AuditorLondon United Kingdom16 February 2011
47213_Text_p142-164.indd 160 1/3/11 10:36:17
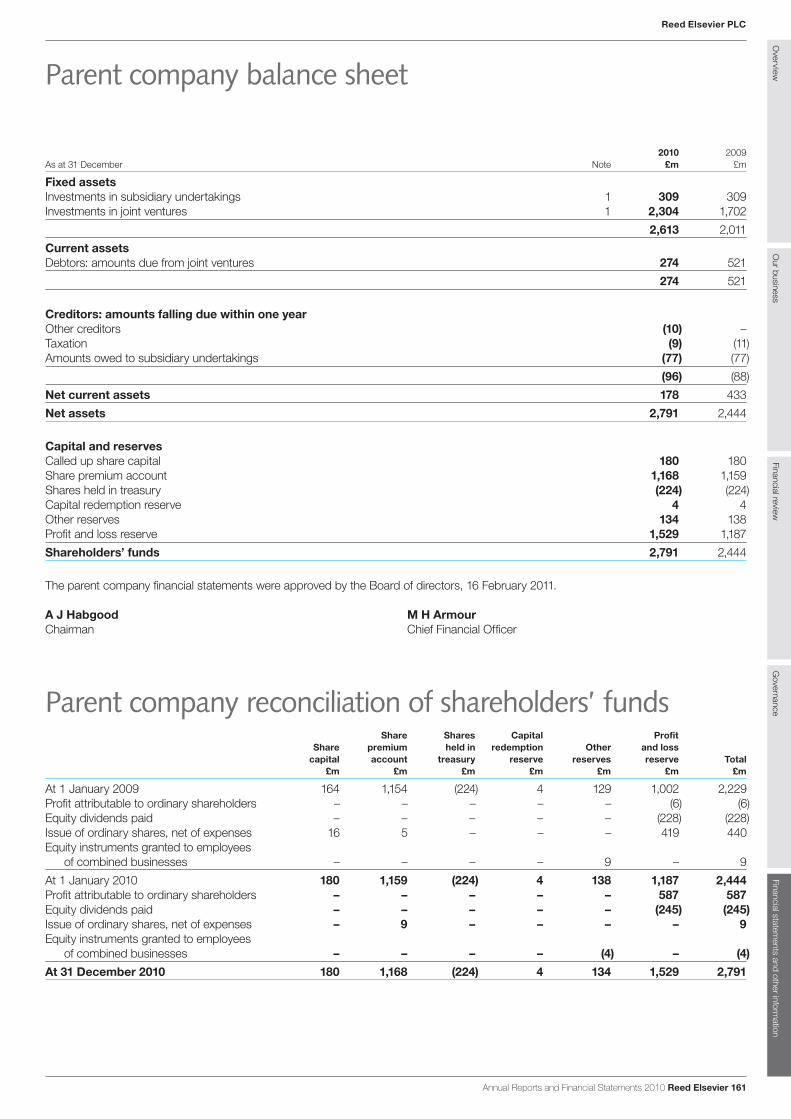
Overview
Our business
Financial reviewG
overnanceFinancial statem
ents and other information
Reed Elsevier PLC
2010 2009 As at 31 December Note £m £m
Fixed assetsInvestments in subsidiary undertakings 1 309 309Investments in joint ventures 1 2,304 1,702 2,613 2,011Current assetsDebtors: amounts due from joint ventures 274 521 274 521
Creditors: amounts falling due within one yearOther creditors (10) –Taxation (9) (11)Amounts owed to subsidiary undertakings (77) (77) (96) (88)Net current assets 178 433Net assets 2,791 2,444
Capital and reservesCalled up share capital 180 180Share premium account 1,168 1,159Shares held in treasury (224) (224)Capital redemption reserve 4 4Other reserves 134 138 Profit and loss reserve 1,529 1,187 Shareholders’ funds 2,791 2,444
The parent company financial statements were approved by the Board of directors, 16 February 2011.
A J Habgood M H Armour Chairman Chief Financial Officer
Parent company reconciliation of shareholders’ funds Share Shares Capital Profit Share premium held in redemption Other and loss capital account treasury reserve reserves reserve Total £m £m £m £m £m £m £m
At 1 January 2009 164 1,154 (224) 4 129 1,002 2,229Profit attributable to ordinary shareholders – – – – – (6) (6)Equity dividends paid – – – – – (228) (228)Issue of ordinary shares, net of expenses 16 5 – – – 419 440Equity instruments granted to employees
of combined businesses – – – – 9 – 9At 1 January 2010 180 1,159 (224) 4 138 1,187 2,444Profit attributable to ordinary shareholders – – – – – 587 587Equity dividends paid – – – – – (245) (245)Issue of ordinary shares, net of expenses – 9 – – – – 9Equity instruments granted to employees
of combined businesses – – – – (4) – (4)At 31 December 2010 180 1,168 (224) 4 134 1,529 2,791
Parent company balance sheet
Annual Reports and Financial Statements 2010 Reed Elsevier 161
47213_Text_p142-164.indd 161 1/3/11 10:36:17
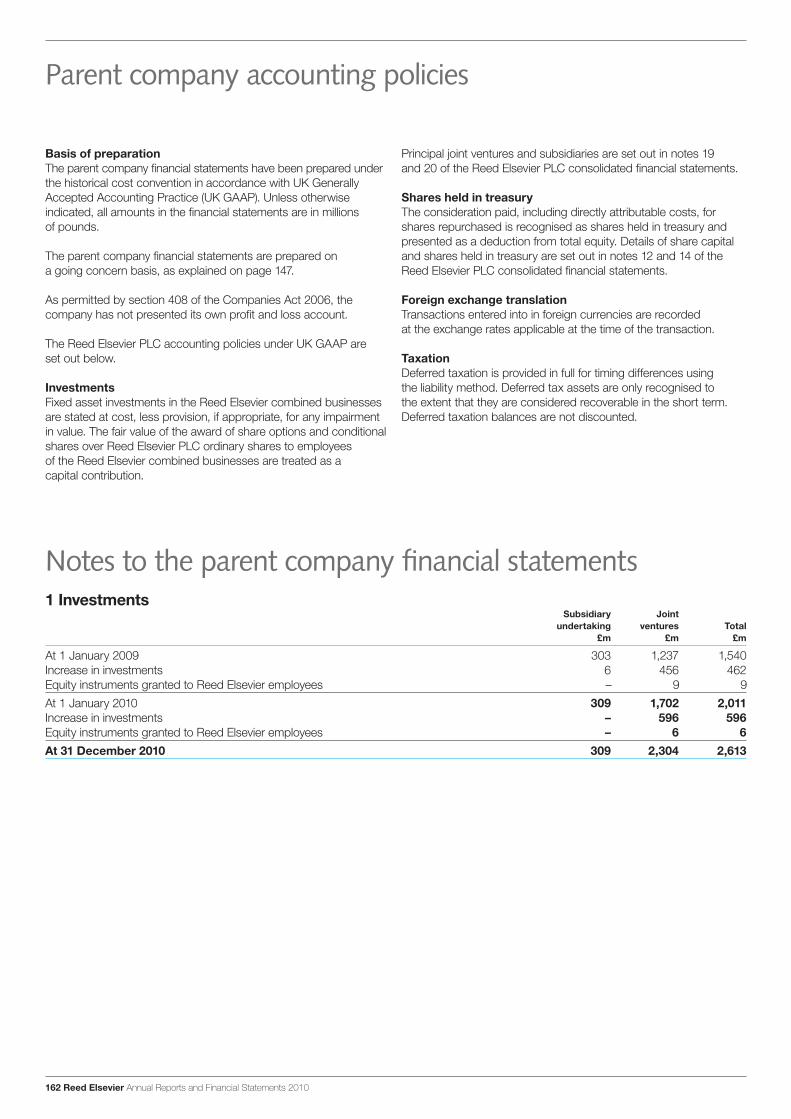
Parent company accounting policies
162 Reed Elsevier Annual Reports and Financial Statements 2010
Basis of preparationThe parent company financial statements have been prepared under the historical cost convention in accordance with UK Generally Accepted Accounting Practice (UK GAAP). Unless otherwise indicated, all amounts in the financial statements are in millions of pounds.
The parent company financial statements are prepared on a going concern basis, as explained on page 147.
As permitted by section 408 of the Companies Act 2006, the company has not presented its own profit and loss account.
The Reed Elsevier PLC accounting policies under UK GAAP areset out below.
InvestmentsFixed asset investments in the Reed Elsevier combined businesses are stated at cost, less provision, if appropriate, for any impairment in value. The fair value of the award of share options and conditional shares over Reed Elsevier PLC ordinary shares to employees of the Reed Elsevier combined businesses are treated as a capital contribution.
Notes to the parent company financial statements1 Investments
Subsidiary Joint undertaking ventures Total
£m £m £m
At 1 January 2009 303 1,237 1,540Increase in investments 6 456 462Equity instruments granted to Reed Elsevier employees – 9 9At 1 January 2010 309 1,702 2,011Increase in investments – 596 596Equity instruments granted to Reed Elsevier employees – 6 6At 31 December 2010 309 2,304 2,613
Principal joint ventures and subsidiaries are set out in notes 19 and 20 of the Reed Elsevier PLC consolidated financial statements.
Shares held in treasuryThe consideration paid, including directly attributable costs, for shares repurchased is recognised as shares held in treasury and presented as a deduction from total equity. Details of share capital and shares held in treasury are set out in notes 12 and 14 of the Reed Elsevier PLC consolidated financial statements.
Foreign exchange translationTransactions entered into in foreign currencies are recorded at the exchange rates applicable at the time of the transaction.
TaxationDeferred taxation is provided in full for timing differences using the liability method. Deferred tax assets are only recognised tothe extent that they are considered recoverable in the short term. Deferred taxation balances are not discounted.
47213_Text_p142-164.indd 162 1/3/11 10:36:17
Overview
Our business
Financial reviewG
overnanceFinancial statem
ents and other information
We have audited the parent company financial statements of Reed Elsevier PLC for the year ended 31 December 2010 (“the company financial statements”) which comprise the parent company balance sheet, the parent company reconciliation of shareholders’ funds, the parent company accounting policies and the related note on page 162. The financial reporting framework that has been applied in their preparation is applicable law and United Kingdom Accounting Standards (United Kingdom Generally Accepted Accounting Practice, or “UK GAAP”).
This report is made solely to the company’s members, as a body, in accordance with Chapter 3 of Part 16 of the Companies Act 2006. Our audit work has been undertaken so that we might state to the company’s members those matters we are required to state to them in an auditor’s report and for no other purpose. To the fullest extent permitted by law, we do not accept or assume responsibility to anyone other than the company and the company’s members as a body, for our audit work, for this report, or for the opinions we have formed.
Respective responsibilities of directors and auditorAs explained more fully in the Directors’ Responsibilities Statement the directors are responsible for the preparation of the parent company financial statements and for being satisfied that they give a true and fair view. Our responsibility is to audit and express an opinion on the parent company financial statements in accordance with applicable law and International Standards on Auditing (UK and Ireland). Those standards require us to comply with the Auditing Practices Board’s Ethical Standards for Auditors.
Scope of the audit of the financial statementsAn audit involves obtaining evidence about the amounts and disclosures in the financial statements sufficient to give reasonable assurance that the financial statements are free from material misstatement, whether caused by fraud or error. This includes an assessment of: whether the accounting policies are appropriate to the parent company’s circumstances and have been consistently applied and adequately disclosed; the reasonableness of significant accounting estimates made by the directors; and the overall presentation of the financial statements.
Opinion on financial statementsIn our opinion the parent company financial statements:> give a true and fair view of the state of the parent company’s
affairs as at 31 December 2010 and of its profit for the year then ended;
> have been properly prepared in accordance with UK GAAP; and
> have been prepared in accordance with the requirements of the Companies Act 2006.
Reed Elsevier PLC
Independent auditor’s report on the parent company financial statements to the members of Reed Elsevier PLC
Opinion on other matters prescribed by the Companies Act 2006In our opinion:> the part of the Directors’ Remuneration Report to be audited has
been properly prepared in accordance with the Companies Act 2006; and
> the information given in the Directors’ Report for the financial year for which the financial statements are prepared is consistent with the parent company financial statements.
Matters on which we are required to report by exceptionWe have nothing to report in respect of the following matters where the Companies Act 2006 requires us to report to you if, in our opinion:> adequate accounting records have not been kept by the parent
company, or returns adequate for our audit have not been received from branches not visited by us; or
> the parent company financial statements and the part of the Directors’ Remuneration Report to be audited are not in agreement with the accounting records and returns; or
> certain disclosures of directors’ remuneration specified by law are not made; or
> we have not received all the information and explanations we require for our audit.
Other matterWe have reported separately on the consolidated financial statements of Reed Elsevier PLC for the year ended 31 December 2010.
Douglas King (Senior statutory auditor)For and on behalf of Deloitte LLPChartered Accountants and Statutory AuditorLondon United Kingdom16 February 2011
Annual Reports and Financial Statements 2010 Reed Elsevier 163
47213_Text_p142-164.indd 163 1/3/11 10:36:17

164 Reed Elsevier Annual Reports and Financial Statements 2010
5 year summary
2010 2009 2008 2007 2006 Note £m £m £m £m £m
Combined financial informationRevenue – continuing operations 2 6,055 6,071 5,334 4,584 4,509Reported operating profit – continuing operations 2 1,090 787 901 888 837Adjusted operating profit – continuing operations 2 1,555 1,570 1,379 1,137 1,081Reported profit attributable to shareholders – total operations 642 391 476 1,200 623Adjusted profit attributable to shareholders – total operations 983 982 919 852 796Reed Elsevier PLC consolidated financial informationReported profit attributable to shareholders 3 327 195 241 624 320Adjusted profit attributable to shareholders 4 520 519 486 451 421Reported earnings per ordinary share (pence) 3 27.3p 17.2p 22.1p 49.7p 25.6pAdjusted earnings per ordinary share (pence) 4 43.4p 45.9p 44.6p 35.9p 33.6pDividend per ordinary share (pence) 5 20.4p 20.4p 20.3p 18.1p 15.9p
(1) Adjusted figures are presented as additional performance measures used by management and are stated before amortisation and impairment of acquired intangible assets and goodwill, exceptional restructuring and acquisition related costs, and in respect of attributable profit, reflect a tax rate that excludes the effect of movements in deferred taxation assets and liabilities that are not expected to crystallise in the near term and includes the benefit of tax amortisation where available on acquired goodwilll and intangible assets. Acquisition related finance costs and profit and loss from disposal gains and losses and other non operating items are also excluded from the adjusted figures.
(2) Revenue, reported operating profit and adjusted operating profit are presented for continuing operations. Net profit from discontinued operations is included in profit attributable to shareholders.
(3) Reported profit attributable to shareholders and reported earnings per share are based on the 52.9% share of the Reed Elsevier combined profit attributable to shareholders, adjusted to equalise the benefit of the UK dividend tax credit with Reed Elsevier NV shareholders as a reduction in reported profits.
(4) Adjusted profit attributable to shareholders and adjusted earnings per share are based on the 52.9% share of the Reed Elsevier combined profit attributable to Reed Elsevier PLC shareholders.
(5) Dividend per ordinary share is based on the interim dividend and proposed final dividend for the relevant year, and does not include the 82.0p per share special distribution in 2008.
47213_Text_p142-164.indd 164 1/3/11 10:36:17
Annual Reports and Financial Statements 2010 Reed Elsevier 165
Overview
Business review
Financial reviewG
overnanceFinancial statem
ents and other information
166 Report of the Supervisory Board and the Executive Board170 Consolidated financial statements172 Group accounting policies174 Notes to the consolidated financial statements182 Independent auditors’ report on the consolidated financial statements183 Parent company financial statements184 Parent company accounting policies185 Notes to the parent company financial statements186 Additional information187 Independent auditors’ report on the parent company financial statements188 5 year summary
Reed Elsevier NV annual report and financial statements
47213_Text_p165-188.indd 165 1/3/11 10:35:30
166 Reed Elsevier Annual Reports and Financial Statements 2010
The Supervisory Board and the Executive Board (which jointly make up “the Combined Board”) present their joint report, together with the financial statements of the group and of the company, for the year ended 31 December 2010.
As a consequence of the merger of the company’s businesses with those of Reed Elsevier PLC in 1993, described on page 56, the shareholders of Reed Elsevier NV and Reed Elsevier PLC can be regarded as having the interests of a single economic group. The Reed Elsevier combined financial statements represent the combined interests of both sets of shareholders and encompass the businesses of Reed Elsevier Group plc, Elsevier Reed Finance BV and their respective subsidiaries, associates and joint ventures, together with the parent companies, Reed Elsevier NV and Reed Elsevier PLC (“the combined businesses” or “Reed Elsevier”).
This report of the Supervisory Board and the Executive Board and the consolidated and parent company financial statements should be read in conjunction with the Reed Elsevier combined financial statements and other reports set out on pages 4 to 141, which are incorporated by reference herein. Summary combined financial information in euros is set out on pages 129 to 141. The combined financial statements on pages 86 to 128 are to be considered as part of the notes to the statutory financial statements. The annual report of Reed Elsevier NV within the meaning of article 2:391 of the Dutch Civil Code consists of pages 166 to 169 and, incorporated by reference, pages 4 to 141. The Corporate Governance Statement of Reed Elsevier NV dated 16 February 2011 is published on the Reed Elsevier website (www.reedelsevier.com) and is incorporated by reference herein as per the Vaststellingsbesluit nadere voorschriften inhoud jaarverslag January 2010 article 2a under 1 sub b.
Principal activitiesThe company is a holding company and its principal investments are its direct 50% shareholding in Reed Elsevier Group plc and its direct 61% shareholding in Elsevier Reed Finance BV, which are engaged in publishing and information activities and financing activities respectively. The remaining shareholdings in these two companies are held by Reed Elsevier PLC.
Reed Elsevier NV and Reed Elsevier PLC have retained their separate legal identities and are publicly held companies. Reed Elsevier NV’s securities are listed in Amsterdam and New York and Reed Elsevier PLC’s securities are listed in London and New York.
Financial statement presentationThe consolidated financial statements of Reed Elsevier NV include the 50% economic interest that its shareholders (including Reed Elsevier PLC, which has an indirect 5.8% interest in the company) have under the equalisation arrangements in the Reed Elsevier combined businesses, accounted for on an equity basis.
Under the terms of the merger agreement, dividends paid to Reed Elsevier NV and Reed Elsevier PLC shareholders are, other than in special circumstances, equalised at the gross level inclusive of the UK tax credit received by certain Reed Elsevier PLC shareholders. In addition to the reported figures, adjusted profit figures are presented as additional performance measures used by management. These exclude, in relation to the results of joint ventures, the company’s share of amortisation and impairment of acquired intangible assets and goodwill, exceptional restructuring and acquisition related costs, disposal gains and losses and other non operating items, related tax effects and movements in deferred taxation assets and liabilities not expected to crystallise in the near term and includes the benefit of tax amortisation where available on acquired goodwill and intangible assets.
Consolidated income statementReed Elsevier NV’s shareholders’ 50% share of the adjusted profit before tax of the Reed Elsevier combined businesses was 748m, up from 716m in 2009 reflecting the 3% increase in adjusted operating profits and the lower net interest expense. Reported profit before tax, including the Reed Elsevier NV shareholders’ share of amortisation and impairment charges, exceptional restructuring and acquisition related costs and disposals and non operating items, was 379m (2009: 217m). The increase largely reflects intangible asset and
goodwill impairment charges in the prior year and lower exceptional restructuring spend in 2010 compared to the prior year. Elsevier saw continued growth although at a lower rate than the prior year due to a constrained customer budget environment. The LexisNexis risk business saw strong growth, driven by the insurance sector and the return to growth in more cyclical markets. The LexisNexis legal and professional businesses saw a small underlying revenue decline reflecting the impact on renewals and print product of the low levels of law firm activity and employment. Reed Exhibitions benefited from a net cycling in of biennial exhibitions and a return to growth in annual exhibitions in the second half of the year. Reed Business Information saw good growth in data services and online marketing solutions and significantly moderated declines in advertising markets, while the portfolio was reshaped through disposals and closures and costs significantly reduced. The adjusted operating margin declined 0.2 percentage points reflecting increased spend on product development, sales & marketing and infrastructure, partially offset by tight cost control and the incremental benefits of the earlier restructuring programmes.
Reed Elsevier NV’s shareholders’ share of the adjusted profit attributable of the combined businesses was 575m, up from 550m in 2009. After deducting the company’s share of the post tax charge for amortisation and impairment of acquired intangible assets and goodwill, exceptional restructuring and acquisition related costs, disposal gains and losses and other non operating items and deferred taxes not expected to crystallise in the near term, the reported net profit for the year was 376m, up from 219m in 2009.
Adjusted earnings per share decreased 1% to 0.78 (2009: 0.79). At constant rates of exchange, the adjusted earnings per share were 6% lower. Including amortisation and impairment of acquired intangible assets and goodwill, exceptional restructuring and acquisition related costs, disposal gains and losses and other non operating items, and tax adjustments, the basic earnings per share was 0.51 (2009: 0.32).
Report of the Supervisory Board and the Executive Board
47213_Text_p165-188.indd 166 2/3/11 22:46:35
Reed Elsevier NV
Annual Reports and Financial Statements 2010 Reed Elsevier 167
Overview
Our business
Financial reviewG
overnanceFinancial statem
ents and other information
Report of the Supervisory Board and the Executive Board continued
Corporate GovernanceReed Elsevier NV and Reed Elsevier PLC are subject to various corporate governance principles and best practice codes, in particular the Dutch Corporate Governance Code (the Dutch Code) and the UK Combined Code (the UK Code). In May 2010 the Financial Reporting Council issued the UK Corporate Governance Code (“the New UK Code”), which replaces the UK code for financial years beginning on or after 29 June 2010. The New UK Code will, therefore, apply in respect of the company’s financial year beginning 1 January 2011. Reed Elsevier NV may not apply fully the verbatim language of these codes, but does fully apply the principles and best practice provisions other than, in respect of the Dutch Code, the following for reasons explained below:
> Best practice provision II.2.5: Executive directors are required to build up a minimum shareholding and Reed Elsevier uses long term incentive arrangements in the form of awards of shares which may vest after three years. The intent of this shareholding policy is to align the interests of senior executives and shareholders. This intent is in compliance with the Dutch Code. Shares received on joining Reed Elsevier in compensation for benefits forfeited under incentive schemes from a previous employer are not to be considered as part of the minimum shareholding in this context.
> Best practice provision II.2.8: Reed Elsevier has arrangements that are commensurate with local and legal requirements to ensure a competitive employment offer to its board members. Executive directors have employment agreements under English or New York law that provide for notice periods not exceeding one year. There are currently no executive directors with employment agreements under Dutch law. In the event of dismissal, notice is given in accordance with the agreed notice period. The payment during the notice period may be mitigated if the director finds other employment within this period. The application of this arrangement may fall within the best practice provision that remuneration in the event of dismissal may not exceed the fixed component of one year’s salary. There are no other severance arrangements in place for the executive directors and none of the employment agreements contain severance pay arrangements. Although the principle that severance pay should not exceed the fixed component of one year’s salary is supported, there may be exceptional circumstances where this maximum would be manifestly unreasonable that could justify additional compensation on termination for loss of variable remuneration components. Full disclosure on remuneration in event of dismissal is provided in the Director’s Remuneration Report in the Reed Elsevier Annual Reports and Financial Statements 2010.
> Best practice provisions II.2.13 and II.2.14: In view of their detailed specificity and complexity and because of the confidential or potentially commercially sensitive nature of the information concerned, individual performance targets and achievements relevant for variable executive remuneration will only be disclosed in general terms.
> Best practice provision II.3.4 and III.6.3: The disclosure of transactions where directors have a conflict of interest, as required by these provisions, shall be qualified to the extent required under applicable rules and laws pertaining to the disclosure of price sensitive information, confidentiality and justified aspects of competition.
Consolidated statement of financial positionThe consolidated statement of financial position of Reed Elsevier NV reflects its 50% economic interest in the net assets of Reed Elsevier which as at 31 December 2010 was 1,137m (2009: 970m). The 167m increase in net assets reflects the company’s share in the
attributable profits of Reed Elsevier partially offset by dividends paid.
Parent company financial statementsIn accordance with article 2:362(1) of the Dutch Civil Code, the individual parent company financial statements of Reed Elsevier NV (presented on pages 183 to 187) are prepared under UK generally accepted accounting practice (UK GAAP) The profit attributable to the shareholders of Reed Elsevier NV was 9m (2009: 22m) and net assets as at 31 December 2010, principally representing the investments in Reed Elsevier Group plc and Elsevier Reed Finance BV under the historical cost method and loans to their subsidiaries, were 4,884m (2009: 4,065m). Free reserves as at 31 December 2010
were 4,655m (2009: 3,833m), comprising reserves and paid-in surplus less shares held in treasury.
DividendsThe Combined Board is recommending an equalised final dividend of 0.303 per ordinary share, up 3% compared with the prior year. This gives total ordinary dividends for the year of 0.412 (2009: 0.400), up 3% on 2009. The final dividend will be paid on 17 May 2011.
Dividend cover, based on adjusted earnings per share and the total interim and proposed final dividends for the year, is 1.9 times. The boards of the company and Reed Elsevier PLC have adopted dividend policies in recent years in respect of their equalised dividends that, subject to currency considerations, grow dividends broadly in line with adjusted earnings per share whilst maintaining dividend cover (being the number of times the annual dividend is covered by the adjusted earnings per share) of at least two times over the longer term.
The total dividend paid on the ordinary shares in the financial year was 281m (2009: 260m).
Share capitalDuring 2010, 184,116 ordinary shares in the company were issued as follows:
> 134,350 under convertible debentures at prices between 7.35 and 9.45
> 49,766 under executive share option schemes at prices between 8.31 and 9.34
Information regarding shares outstanding at 31 December 2010 is shown in note 13 to the consolidated financial statements.
As at 31 December 2010 31,734,581 of the ordinary shares were held in treasury including 7,781,790 held by the Reed Elsevier Group plc Employee Benefit Trust. No R shares were held in treasury.
As at 16 February 2011, based on the public database of and on notification received from the Netherlands Authority for the Financial Markets, the company is aware of interests in the capital and voting rights of the issued share capital of the company of at least 5% by Reed Elsevier PLC and Mondrian Investment Partners Limited.
47213_Text_p165-188.indd 167 1/3/11 10:35:30

168 Reed Elsevier Annual Reports and Financial Statements 2010
The Supervisory Board The Executive BoardA Habgood (Chairman) E Engstrom (Chairman andG de Boer-Kruyt Chief Executive Officer)
(retired 20 April 2010) M ArmourM Elliott (Chief Financial Officer)L Hook A Prozes M van Lier Lels (retired 31 December 2010)
(appointed 13 January 2010) R Polet D ReidLord Sharman of Redlynch OBEB van der Veer
Lord Sharman will retire as a member of the Supervisory Board at the conclusion of the Annual General Meeting in April 2011.
In view of the retirement of Lord Sharman, a search has been conducted in conjunction with external recruitment consultants for a suitable candidate to join the Supervisory Board. This has resulted in the Nominations Committee recommending to the Combined Board the appointment of Adrian Hennah as a member of the Supervisory Board of Reed Elsevier NV and as a non-executive director of Reed Elsevier PLC. This will be proposed at the Annual General Meetings in April 2011. Subject to shareholder approval of his appointment, he will become a member of the Audit Committees and of the Corporate Governance Committee.
Biographical details of the directors at the date of this report are given on pages 54 and 55. Details of the remuneration of the members of the Executive Board and of the Supervisory Board and their interests in the share capital of the company are provided in the Directors’ Remuneration Report on pages 62 to 80.
Financial statements and accounting recordsThe financial statements provide a true and fair view of the state of affairs of the company and the group as of 31 December 2010 and of the profit or loss in 2010. In preparing the financial statements, the Supervisory Board and the Executive Board ensure that suitable accounting policies, consistently applied and supported by reasonable judgements and estimates, have been used and applicable accounting standards have been followed. The Boards are responsible for keeping proper accounting records, which disclose with reasonable accuracy at any time the financial position of the company and enable them to ensure that the financial statements comply with the law. The Boards have general responsibility for taking reasonable steps to safeguard the assets of the company and to prevent and detect fraud and other irregularities.
> Principle III.7: The remuneration of Supervisory Board members is determined by the Combined Board in the context of the board harmonisation with Reed Elsevier PLC and Reed Elsevier Group plc, having regard for the maximum approved by the general meeting of shareholders.
> Best practice provision IV.1.1: Appointments, suspensions and removal procedures for members of the Executive Board and the Supervisory Board are set out in the Corporate Governance Statement 2010. In order to safeguard the agreed board harmonisation with the Board of Reed Elsevier PLC, the Articles of Association of Reed Elsevier NV provide that a resolution of the General Shareholders’ Meeting to appoint a member of the Executive or Supervisory Board other than in accordance with the proposal of the Combined Board shall require a majority of at least two-thirds of the votes cast if less than one-half of the company’s issued capital is represented at the meeting. Given the still generally low attendance rate at shareholders’ meetings in the Netherlands, the Boards believe that this qualified majority requirement is appropriate for this purpose.
> Best practice provision IV.3.1: It is considered impractical and unnecessary to provide access for shareholders to all meetings with analysts and all presentations to investors in real time. Price sensitive and other information relevant to shareholders is disclosed as required or as appropriate and made available on the website.
For further information on the application of the Dutch Code, see the Corporate Governance Statement of Reed Elsevier NV published on the Reed Elsevier website, www.reedelsevier.com.
Significant agreements – change of controlThe governing agreement between Reed Elsevier NV and Reed Elsevier PLC states that upon a change of control of Reed Elsevier NV (for these purposes, the acquisition by a third party of 50% or more of the issued share capital having voting rights), should there not be a comparable offer from the offeror for Reed Elsevier PLC, Reed Elsevier PLC may serve notice upon Reed Elsevier NV varying certain provisions of the governing agreement, including the governance and the standstill provisions.
There are a number of borrowing agreements including credit facilities that in the event of a change of control of both Reed Elsevier NV and Reed Elsevier PLC and, in some cases, a consequential credit rating downgrade to sub-investment grade may, at the option of the lenders, require repayment and/or cancellation as appropriate.
DirectorsThe following individuals served as members of the Supervisory and Executive Boards during the year:
Report of the Supervisory Board and the Executive Board continued
47213_Text_p165-188.indd 168 1/3/11 10:35:30
Reed Elsevier NV
Annual Reports and Financial Statements 2010 Reed Elsevier 169
Overview
Our business
Financial reviewG
overnanceFinancial statem
ents and other information
Report of the Supervisory Board and the Executive Board continued
A commentary on the Reed Elsevier combined businesses’ cash flows, financial position and liquidity for the year ended 31 December 2010 is set out in the Chief Financial Officer’s Report on pages 44 and 45. This shows that, after taking account of available cash resources and committed bank facilities that back up short term borrowings, none of Reed Elsevier’s borrowings fall due within the next two years. Reed Elsevier’s policies on liquidity, capital management and management of risks relating to interest rate, foreign exchange and credit exposures are set out on pages 48 and 49. Further information on liquidity of the combined businesses can be found in note 18 of the combined financial statements. The principal risks facing Reed Elsevier are set out on pages 50 to 52.
AuditorsResolutions for the re-appointment of Deloitte Accountants BV as auditors of the company and authorising the Supervisory Board to determine their remuneration will be submitted to the forthcoming Annual General Meeting on 19 April 2011.
Signed by:The Supervisory Board The Executive BoardA Habgood (Chairman) E Engstrom (Chairman M Elliott and Chief Executive Officer)L Hook M Armour M van Lier Lels (Chief Financial Officer)R PoletD ReidLord Sharman of Redlynch OBEB van der Veer
Registered officeRadarweg 291043 NX The Netherlands
Chamber of Commerce AmsterdamRegister file No: 3315503716 February 2011
Internal controlAs required under sections II.1.4. and II.1.5. of the Dutch Code, the Audit Committee and the Combined Board have reviewed the effectiveness of the systems of internal control and risk management during the last financial year. The objective of these systems is to manage, rather than eliminate, the risk of failure to achieve business objectives. Accordingly, they can only provide reasonable, but not absolute, assurance against material misstatement or loss. The outcome of this review has been discussed with the external auditors. The Combined Board confirmed that as regards financial reporting, the risk management and control systems provide reasonable assurance against material inaccuracies or loss and have functioned properly during the financial year.
Directors’ responsibility statementThe Combined Board confirms, to the best of its knowledge, that:> the consolidated financial statements, prepared in accordance
with International Financial Reporting Standards as issued by the International Accounting Standards Board and as adopted by the European Union, give a true and fair view of the financial position and profit or loss of the group; and
> the Report of the Supervisory Board and the Executive Board includes a fair review of the development and performance of the business during the financial year and the position of the group as at 31 December 2010 together with a description of the principal risks and uncertainties that it faces.
Neither the company nor the directors accept any liability to any person in relation to the Annual Report except to the extent that such liability arises under Dutch law.
Disclosure of information to auditorsAs part of the process of approving the company’s 2010 financial statements, the Supervisory and the Executive Boards and their members have taken steps to ensure that all relevant information was provided to the company’s auditors and, so far as the boards are aware, there is no relevant audit information of which the company’s auditors are unaware.
Going concernThe Combined Board, having made appropriate enquiries, considers that adequate resources exist for the combined businesses to continue in operational existence for the foreseeable future and that, therefore, it is appropriate to adopt the going concern basis in preparing the 2010 financial statements. In reaching this conclusion, the Combined Board has had due regard to the combined businesses’ financial position as at 31 December 2010, the strong free cash flow of the combined businesses, Reed Elsevier’s ability to access capital markets and the principal risks facing Reed Elsevier.
47213_Text_p165-188.indd 169 2/3/11 22:47:37
170 Reed Elsevier Annual Reports and Financial Statements 2010
2010 2009 For the year ended 31 December Note m m
Administrative expenses 2 (2) (2)Share of results of joint ventures 11 367 197Operating profit 365 195Finance income 5 14 22Profit before tax 379 217Taxation 6 (3) 2Profit attributable to ordinary shareholders 376 219
Consolidated statement of comprehensive income2010 2009
For the year ended 31 December m m
Profit attributable to ordinary shareholders 376 219Share of joint ventures’ other comprehensive income for the year 71 42Total comprehensive income for the year 447 261
Earnings per ordinary share2010 2009
For the year ended 31 December Note
Basic earnings per share 8 0.51 0.32Diluted earnings per share 8 0.51 0.31
Consolidated statement of cash flows2010 2009
For the year ended 31 December Note m m
Cash flows from operating activitiesCash used by operations 10 (1) (2)Interest received 14 24Tax paid (4) (8)Net cash from operating activities 9 14
Cash flows from investing activitiesDividends received from joint ventures 11 1,093 –Increase in investment in joint ventures 11 (719) (531)Net cash from/(used in) investing activities 374 (531)
Cash flows from financing activitiesEquity dividends paid 7 (281) (260)Proceeds on issue of ordinary shares 2 470(Increase)/decrease in net funding balances due from joint ventures 10 (104) 298Net cash (used in)/from financing activities (383) 508
Movement in cash and cash equivalents – (9)
Consolidated income statement
47213_Text_p165-188.indd 170 1/3/11 10:35:30

Reed Elsevier NV
Annual Reports and Financial Statements 2010 Reed Elsevier 171
Overview
Our business
Financial reviewG
overnanceFinancial statem
ents and other information
Consolidated statement of financial position
2010 2009 As at 31 December Note m m
Non-current assetsInvestments in joint ventures 11 1,198 1,031Current assetsAmounts due from joint ventures 2 2Cash and cash equivalents 3 3 5 5Total assets 1,203 1,036
Current liabilitiesPayables 12 11 10Taxation 55 56Total liabilities 66 66Net assets 1,137 970
Capital and reservesShare capital issued 13 54 53Paid-in surplus 14 2,169 2,168Shares held in treasury (including in joint ventures) 15 (433) (434)Translation reserve 16 (51) (153)Other reserves 17 (602) (664)Total equity 1,137 970
Consolidated statement of changes in equityShare Paid-in Shares held Translation Other Total
capital surplus in treasury reserve reserves equity Note m m m m m m
Balance at 1 January 2010 53 2,168 (434) (153) (664) 970Total comprehensive income for the year – – – 98 349 447Equity dividends paid 7 – – – – (281) (281)Issue of ordinary shares, net of expenses 1 1 – – – 2Share of joint ventures’ settlement of
share awards by employee benefit trust – – 5 – (5) –Share of joint ventures’ decrease in
share based remuneration reserve – – – – (4) (4)Equalisation adjustments – – – – 3 3Exchange translation differences – – (4) 4 – –Balance at 31 December 2010 54 2,169 (433) (51) (602) 1,137
Balance at 1 January 2009 49 1,712 (477) (138) (655) 491Total comprehensive income for the year – – – (25) 286 261Equity dividends paid 7 – – – – (260) (260)Issue of ordinary shares, net of expenses 4 456 21 – (11) 470Share of joint ventures’ settlement of
share awards by employee benefit trust – – 32 – (34) (2)Share of joint ventures’ increase in
share based remuneration reserve – – – – 10 10Exchange translation differences – – (10) 10 – –Balance at 31 December 2009 53 2,168 (434) (153) (664) 970
47213_Text_p165-188.indd 171 1/3/11 10:35:30
172 Reed Elsevier Annual Reports and Financial Statements 2010
Group accounting policies
These consolidated financial statements, which have been prepared under the historic cost convention, report the consolidated statements of income, cash flow and financial position of Reed Elsevier NV. Unless otherwise indicated, all amounts shown in the financial statements are in millions of euros.
As required by a regulation adopted by the European Parliament, the consolidated financial statements have been prepared in accordance with International Financial Reporting Standards (IFRS) as endorsed by the European Union and as issued by the International Accounting Standards Board (IASB).
The consolidated financial statements are prepared on a going concern basis, as explained on page 169.
The Reed Elsevier combined financial statements presented in pounds sterling on pages 86 to 128 form an integral part of the notes to Reed Elsevier NV’s statutory financial statements. The primary combined financial statements and selected notes are presented in euros on pages 129 to 141.
As a consequence of the merger of the company’s businesses with those of Reed Elsevier PLC, described on page 56, the shareholders of Reed Elsevier NV and Reed Elsevier PLC can be regarded as having the interests of a single economic group, enjoying substantially equivalent ordinary dividend and capital rights in the earnings and net assets of the Reed Elsevier combined businesses.
The Reed Elsevier NV consolidated financial statements are presented incorporating Reed Elsevier NV’s investments in the Reed Elsevier combined businesses accounted for using the equity method, as adjusted for the effects of the equalisation arrangement between Reed Elsevier NV and Reed Elsevier PLC. The arrangement lays down the distribution of dividends and net assets in such a way that Reed Elsevier NV’s share in the profit and net assets of the Reed Elsevier combined businesses equals 50%, with all settlements accruing to shareholders from the equalisation arrangements taken directly to reserves. Further detail is provided in note 1.
Because the dividend paid to shareholders by Reed Elsevier NV is equivalent to the Reed Elsevier PLC dividend plus, other than in special circumstances, the UK tax credit received by certain Reed Elsevier PLC shareholders, Reed Elsevier NV normally distributes a higher proportion of the combined profit attributable than Reed Elsevier PLC. Reed Elsevier PLC’s share in this difference in dividend distributions is settled with Reed Elsevier NV and is credited directly to consolidated reserves under equalisation. Reed Elsevier NV can pay a nominal dividend on its R shares held by a subsidiary of Reed Elsevier PLC that is lower than the dividend on the ordinary shares. Equally, Reed Elsevier NV has the possibility to receive dividends directly from Dutch affiliates. Reed Elsevier PLC is compensated by direct dividend payments by Reed Elsevier Group plc. The settlements flowing from these arrangements are also taken directly to consolidated reserves under equalisation.
Parent company financial statementsIn accordance with 2:402 of the Dutch Civil Code, the parent company financial statements only contain an abridged profit and loss account.
Combined financial statementsThe accounting policies adopted in the preparation of the combined financial statements are set out on pages 90 to 96.
These include policies in relation to intangible assets. Such assets are amortised over their estimated useful economic lives which, due to their longevity, may be for periods in excess of five years.
Basis of valuation of assets and liabilitiesReed Elsevier NV’s 50% economic interest in the net assets of the combined businesses has been shown on the consolidated statement of financial position as investments in joint ventures, net of the assets and liabilities reported as part of Reed Elsevier NV. Joint ventures are accounted for using the equity method.
Cash and cash equivalents are stated at fair value. Other assets and liabilities are stated at historical cost, less provision, if appropriate, for any impairment in value.
Foreign exchange translationTransactions in foreign currencies are recorded at the rate of exchange prevailing on the date of the transaction. At each statement of financial position date, monetary assets and liabilities that are denominated in foreign currencies are retranslated at the rate prevailing on the statement of financial position date. Exchange differences arising are recorded in the income statement. The gains or losses relating to the retranslation of Reed Elsevier NV’s 50% interest in the net assets of the combined businesses are classified as equity and transferred to the translation reserve.
When foreign operations are disposed of, the related cumulative translation differences are recognised within the income statement in the period.
TaxationThe tax expense represents the sum of the tax payable on the current year taxable profits, adjustments in respect of prior year taxable profits and the movements on deferred tax that are recognised in the income statement. Tax arising in joint ventures is included in the share of results of joint ventures.
The tax payable on current year taxable profits is calculated using the applicable tax rate that has been enacted, or substantively enacted, by the statement of financial position date.
47213_Text_p165-188.indd 172 1/3/11 10:35:30
Reed Elsevier NV
Annual Reports and Financial Statements 2010 Reed Elsevier 173
Overview
Our business
Financial reviewG
overnanceFinancial statem
ents and other information
Group accounting policies continued
Deferred tax is the tax arising on differences between the carrying amounts of assets and liabilities in the financial statements and their corresponding tax bases used in the computation of taxable profit, and is accounted for using the balance sheet liability method. Deferred tax liabilities are generally recognised for all taxable temporary differences and deferred tax assets are recognised to the extent that, based on current forecasts, it is probable that taxable profits will be available against which deductible temporary differences can be utilised.
Deferred tax is calculated using tax rates that are expected to apply in the period when the liability is settled or the asset is realised. Full provision is made for deferred tax which would become payable on the distribution of retained profits from foreign subsidiaries, associates or joint ventures.
Movements in deferred tax are charged and credited in the income statement, except when they relate to items charged or credited directly to equity, in which case the deferred tax is also recognised in equity.
Critical judgements and key sources of estimation uncertainty Critical judgements in the preparation of the combined financial statements are set out on pages 94 and 95.
Standards, amendments and interpretations not yet effectiveRecently issued standards, amendments and interpretations and their impact on future accounting policies and reporting have been considered on page 96 of the combined financial statements and are not expected to have a significant impact on the consolidated financial statements.
47213_Text_p165-188.indd 173 1/3/11 10:35:30

174 Reed Elsevier Annual Reports and Financial Statements 2010
Notes to the consolidated financial statementsfor the year ended 31 December 2010
1 Basis of preparation
The consolidated financial statements of Reed Elsevier NV reflect the 50% economic interest that its shareholders have under the equalisation arrangements in the Reed Elsevier combined businesses, accounted for on an equity basis.
The Reed Elsevier combined financial statements are presented in pounds sterling, which is the functional currency of Reed Elsevier Group plc, a UK registered company which owns the publishing and information businesses of Reed Elsevier. The following analysis presents how the consolidated financial statements of Reed Elsevier NV, presented in euros, are derived from the Reed Elsevier combined financial statements.
Reed Elsevier NV consolidated profit attributable to ordinary shareholders 2010 2009
Reed Elsevier combined businesses net profit attributable to parent company shareholdersin pounds sterling £642m £391m
Reed Elsevier combined businesses net profit attributable to parent company shareholdersin pounds sterling translated into euros at average exchange rates 751m 438m
Reed Elsevier combined businesses net profit attributable to parent company shareholders in euros 751m 438mReed Elsevier NV’s 50% share of combined net profit attributable to ordinary shareholders 376m 219m
Reed Elsevier NV consolidated total equity 2010 2009
Reed Elsevier combined shareholders’ equity in pounds sterling £1,943m £1,732mReed Elsevier combined shareholders’ equity in pounds sterling translated into euros
at year end exchange rates 2,273m 1,940mReed Elsevier NV’s 50% share of combined equity 1,137m 970m
2 Administrative expenses
Administrative expenses are stated after the gross remuneration for present and former directors of Reed Elsevier NV in respect of services rendered to Reed Elsevier NV and the combined businesses. Fees for members of the Supervisory Board of Reed Elsevier NV of 0.3m (2009: 0.2m) are included in gross remuneration. Insofar as gross remuneration is related to services rendered to Reed Elsevier Group plc group and Elsevier Reed Finance BV group, it is borne by these groups. Reed Elsevier NV has no employees (2009: nil).
3 Auditors’ remuneration
Audit fees payable by Reed Elsevier NV were 48,000 (2009: 48,000). Further information on the audit and non-audit fees paid by the Reed Elsevier combined businesses to Deloitte Accountants B.V. and its associates is set out in note 3 to the combined financial statements.
47213_Text_p165-188.indd 174 1/3/11 10:35:30
Reed Elsevier NV
Annual Reports and Financial Statements 2010 Reed Elsevier 175
Overview
Our business
Financial reviewG
overnanceFinancial statem
ents and other information
Notes to the consolidated financial statementsfor the year ended 31 December 2010
4 Related party transactions
All transactions with joint ventures, which are related parties of Reed Elsevier NV, are reflected in these financial statements. Key management personnel are also related parties and comprise the members of the Executive Board of Reed Elsevier NV. Transactions with key management personnel are set out in note 33 to the combined financial statements.
5 Finance income2010 2009
m m
Finance income from joint ventures 14 22
6 Taxation
A reconciliation of the notional tax charge based on the applicable rate of tax to the actual total tax expense is set out below.
2010 2009 m m
Profit before tax 379 217Tax at applicable rate: 25.5% (2009: 25.5%) 97 55Tax at applicable rate on share of results of joint ventures (94) (50)Other – (7)Tax expense/(credit) 3 (2)
7 Equity dividends2010 2009 2010 2009
Ordinary dividends declared in the year m m
Ordinary sharesFinal for prior financial year 0.293 0.290 205 185Interim for financial year 0.109 0.107 76 75
Total 0.402 0.397 281 260R shares – – – –
The directors of Reed Elsevier NV have proposed a final dividend of 0.303 (2009: 0.293). The cost of funding the proposed final dividend is expected to be 212m. No liability has been recognised at the statement of financial position date.
2010 2009 Ordinary dividends paid and proposed relating to the financial yearOrdinary shares
Interim (paid) 0.109 0.107Final (proposed) 0.303 0.293
Total 0.412 0.400R shares – –
47213_Text_p165-188.indd 175 1/3/11 10:35:31
176 Reed Elsevier Annual Reports and Financial Statements 2010
Notes to the consolidated financial statementsfor the year ended 31 December 2010
8 Earnings per ordinary share (“EPS”)2010 2009
Weighted Weighted average average
number of number of shares Earnings EPS shares Earnings EPS
(millions) m (millions) m
Basic earnings per share 734.5 376 0.51 693.9 219 0.32Diluted earnings per share 737.8 376 0.51 698.7 219 0.31
The diluted EPS figures are calculated after taking account of the effect of potential additional ordinary shares arising from share options and conditional shares.
The weighted average number of shares reflects the equivalent ordinary shares amount taking into account the R shares and is after deducting shares held in treasury. Movements in the number of shares in issue net of treasury shares for the year ended 31 December 2010 are shown below.
Year ended 31 December
2010 2009 Shares in Shares in
issue net of issue net of Shares in Treasury treasury treasury
issue shares shares shares Number of ordinary shares (millions) (millions) (millions) (millions)
At start of year 723.7 (32.2) 691.5 625.4Issue of ordinary shares 0.2 – 0.2 63.1Net release of shares by employee benefit trust – 0.5 0.5 3.0At end of year 723.9 (31.7) 692.2 691.5Weighted average number of equivalent ordinary shares during the year 734.5 693.9
The average number of equivalent ordinary shares takes into account the R shares in the company held by a subsidiary of Reed Elsevier PLC, which represents a 5.8% interest in the company’s share capital.
47213_Text_p165-188.indd 176 1/3/11 10:35:31

Reed Elsevier NV
Annual Reports and Financial Statements 2010 Reed Elsevier 177
Overview
Our business
Financial reviewG
overnanceFinancial statem
ents and other information
Notes to the consolidated financial statementsfor the year ended 31 December 2010
9 Adjusted figures
Adjusted profit and earnings per share figures are used by management as additional performance measures. The adjusted figures are derived as follows:
Profit attributable to Basic earnings ordinary shares ordinary shares
2010 2009 2010 2009 Earnings per share m m
Reported figures 376 219 0.51 0.32Share of adjustments in joint ventures:
Amortisation of acquired intangible assets 197 230 0.27 0.33Impairment of acquired intangible assets and goodwill – 76 – 0.11Exceptional restructuring costs 22 75 0.03 0.10Acquisition related costs 18 19 0.02 0.03Disposals and other non operating items 21 (13) 0.03 (0.02)Deferred tax adjustments (59) (56) (0.08) (0.08)
Adjusted figures 575 550 0.78 0.79
10 Statement of cash flows2010 2009
Reconciliation of administrative expenses to cash used by operations m m
Administrative expenses (2) (2)Net movement in payables 1 –Cash used by operations (1) (2)
2010 2009 Reconciliation of net funding balances due from joint ventures m m
At start of year 1,255 1,553Cash flow 104 (298)At end of year 1,359 1,255
47213_Text_p165-188.indd 177 1/3/11 10:35:31
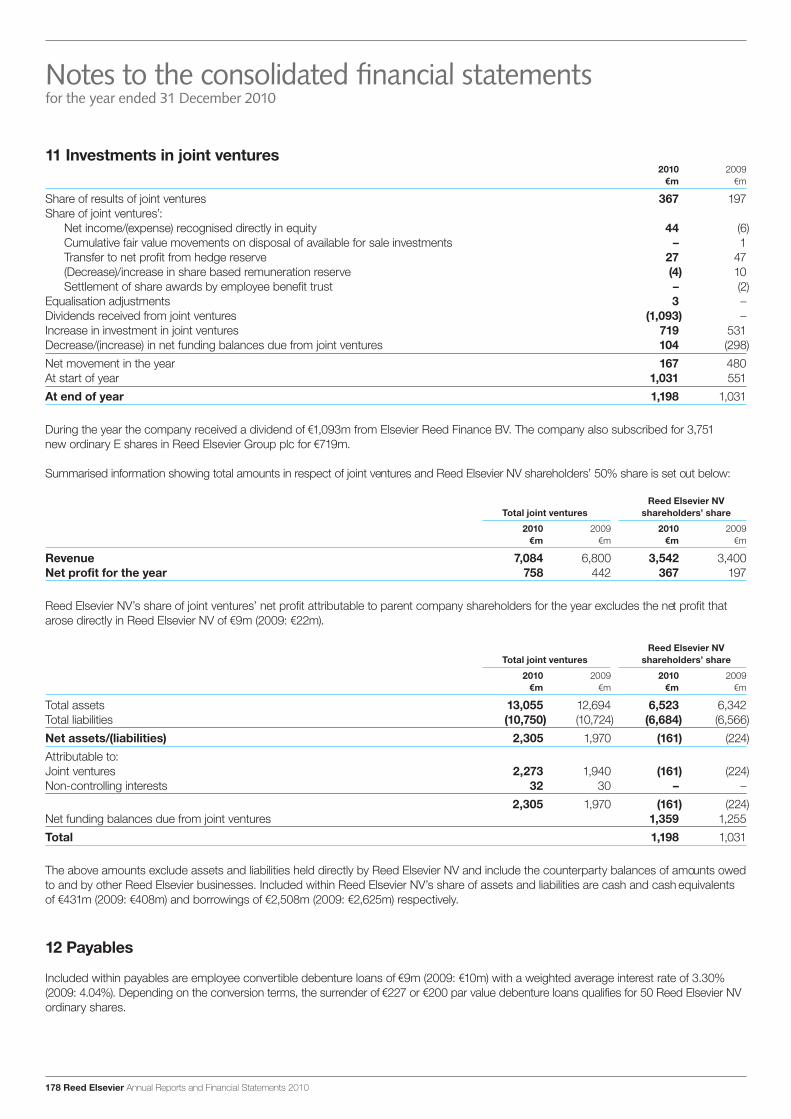
178 Reed Elsevier Annual Reports and Financial Statements 2010
Notes to the consolidated financial statementsfor the year ended 31 December 2010
11 Investments in joint ventures2010 2009
m m
Share of results of joint ventures 367 197Share of joint ventures’:
Net income/(expense) recognised directly in equity 44 (6)Cumulative fair value movements on disposal of available for sale investments – 1Transfer to net profit from hedge reserve 27 47(Decrease)/increase in share based remuneration reserve (4) 10Settlement of share awards by employee benefit trust – (2)
Equalisation adjustments 3 –Dividends received from joint ventures (1,093) –Increase in investment in joint ventures 719 531Decrease/(increase) in net funding balances due from joint ventures 104 (298)Net movement in the year 167 480At start of year 1,031 551At end of year 1,198 1,031
During the year the company received a dividend of 1,093m from Elsevier Reed Finance BV. The company also subscribed for 3,751 new ordinary E shares in Reed Elsevier Group plc for 719m.
Summarised information showing total amounts in respect of joint ventures and Reed Elsevier NV shareholders’ 50% share is set out below:
Reed Elsevier NV Total joint ventures shareholders’ share
2010 2009 2010 2009 m m m m
Revenue 7,084 6,800 3,542 3,400Net profit for the year 758 442 367 197
Reed Elsevier NV’s share of joint ventures’ net profit attributable to parent company shareholders for the year excludes the net profit that arose directly in Reed Elsevier NV of 9m (2009: 22m).
Reed Elsevier NV Total joint ventures shareholders’ share
2010 2009 2010 2009 m m m m
Total assets 13,055 12,694 6,523 6,342Total liabilities (10,750) (10,724) (6,684) (6,566)Net assets/(liabilities) 2,305 1,970 (161) (224)Attributable to:Joint ventures 2,273 1,940 (161) (224)Non-controlling interests 32 30 – –
2,305 1,970 (161) (224)Net funding balances due from joint ventures 1,359 1,255Total 1,198 1,031
The above amounts exclude assets and liabilities held directly by Reed Elsevier NV and include the counterparty balances of amounts owed to and by other Reed Elsevier businesses. Included within Reed Elsevier NV’s share of assets and liabilities are cash and cash equivalents of 431m (2009: 408m) and borrowings of 2,508m (2009: 2,625m) respectively.
12 Payables
Included within payables are employee convertible debenture loans of 9m (2009: 10m) with a weighted average interest rate of 3.30% (2009: 4.04%). Depending on the conversion terms, the surrender of 227 or 200 par value debenture loans qualifies for 50 Reed Elsevier NV ordinary shares.
47213_Text_p165-188.indd 178 1/3/11 10:35:31
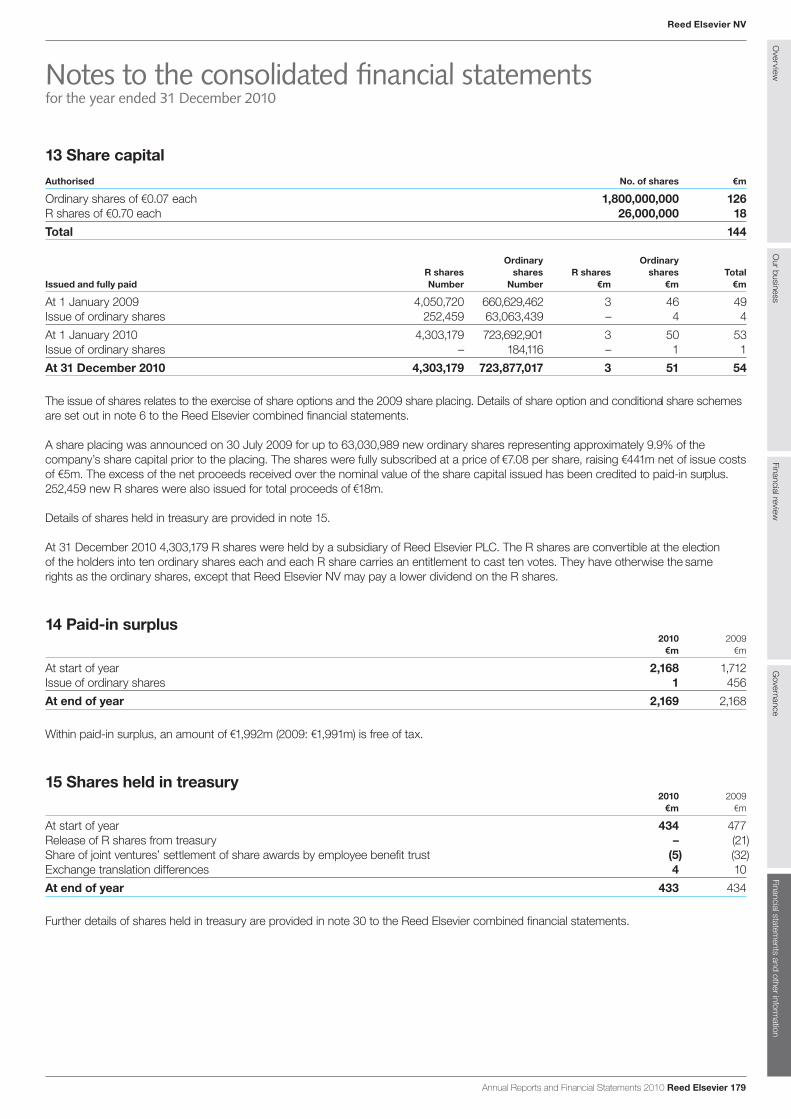
Reed Elsevier NV
Annual Reports and Financial Statements 2010 Reed Elsevier 179
Overview
Our business
Financial reviewG
overnanceFinancial statem
ents and other information
Notes to the consolidated financial statementsfor the year ended 31 December 2010
13 Share capitalAuthorised No. of shares m
Ordinary shares of 0.07 each 1,800,000,000 126R shares of 0.70 each 26,000,000 18Total 144
Ordinary OrdinaryR shares shares R shares shares Total
Issued and fully paid Number Number m m m
At 1 January 2009 4,050,720 660,629,462 3 46 49Issue of ordinary shares 252,459 63,063,439 – 4 4At 1 January 2010 4,303,179 723,692,901 3 50 53Issue of ordinary shares – 184,116 – 1 1At 31 December 2010 4,303,179 723,877,017 3 51 54
The issue of shares relates to the exercise of share options and the 2009 share placing. Details of share option and conditional share schemes are set out in note 6 to the Reed Elsevier combined financial statements.
A share placing was announced on 30 July 2009 for up to 63,030,989 new ordinary shares representing approximately 9.9% of the company’s share capital prior to the placing. The shares were fully subscribed at a price of 7.08 per share, raising 441m net of issue costs of 5m. The excess of the net proceeds received over the nominal value of the share capital issued has been credited to paid-in surplus. 252,459 new R shares were also issued for total proceeds of 18m.
Details of shares held in treasury are provided in note 15.
At 31 December 2010 4,303,179 R shares were held by a subsidiary of Reed Elsevier PLC. The R shares are convertible at the election of the holders into ten ordinary shares each and each R share carries an entitlement to cast ten votes. They have otherwise the same rights as the ordinary shares, except that Reed Elsevier NV may pay a lower dividend on the R shares.
14 Paid-in surplus2010 2009
m m
At start of year 2,168 1,712Issue of ordinary shares 1 456At end of year 2,169 2,168
Within paid-in surplus, an amount of 1,992m (2009: 1,991m) is free of tax.
15 Shares held in treasury2010 2009
m m
At start of year 434 477Release of R shares from treasury – (21)Share of joint ventures’ settlement of share awards by employee benefit trust (5) (32)Exchange translation differences 4 10At end of year 433 434
Further details of shares held in treasury are provided in note 30 to the Reed Elsevier combined financial statements.
47213_Text_p165-188.indd 179 1/3/11 10:35:31
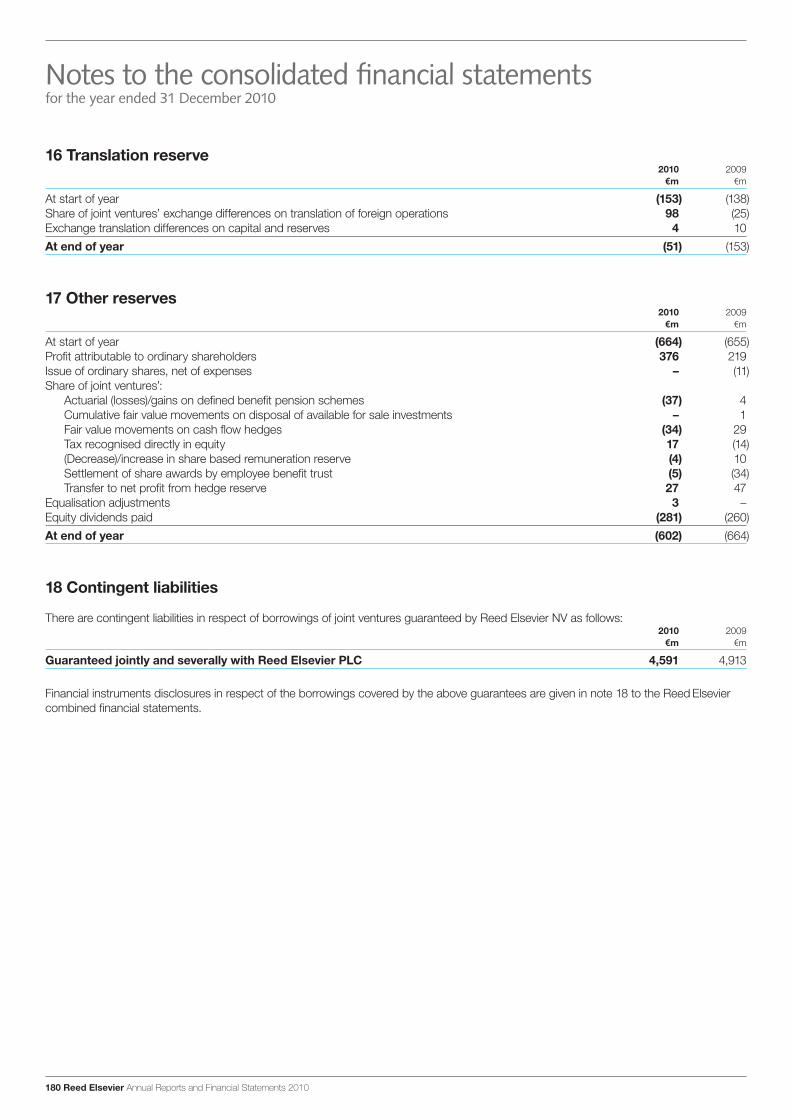
180 Reed Elsevier Annual Reports and Financial Statements 2010
16 Translation reserve2010 2009
m m
At start of year (153) (138) Share of joint ventures’ exchange differences on translation of foreign operations 98 (25)Exchange translation differences on capital and reserves 4 10At end of year (51) (153)
17 Other reserves2010 2009
m m
At start of year (664) (655)Profit attributable to ordinary shareholders 376 219Issue of ordinary shares, net of expenses – (11)Share of joint ventures’:
Actuarial (losses)/gains on defined benefit pension schemes (37) 4Cumulative fair value movements on disposal of available for sale investments – 1Fair value movements on cash flow hedges (34) 29Tax recognised directly in equity 17 (14)(Decrease)/increase in share based remuneration reserve (4) 10Settlement of share awards by employee benefit trust (5) (34)Transfer to net profit from hedge reserve 27 47
Equalisation adjustments 3 –Equity dividends paid (281) (260)At end of year (602) (664)
18 Contingent liabilities
There are contingent liabilities in respect of borrowings of joint ventures guaranteed by Reed Elsevier NV as follows:2010 2009
m m
Guaranteed jointly and severally with Reed Elsevier PLC 4,591 4,913
Financial instruments disclosures in respect of the borrowings covered by the above guarantees are given in note 18 to the Reed Elsevier combined financial statements.
Notes to the consolidated financial statementsfor the year ended 31 December 2010
47213_Text_p165-188.indd 180 1/3/11 10:35:31
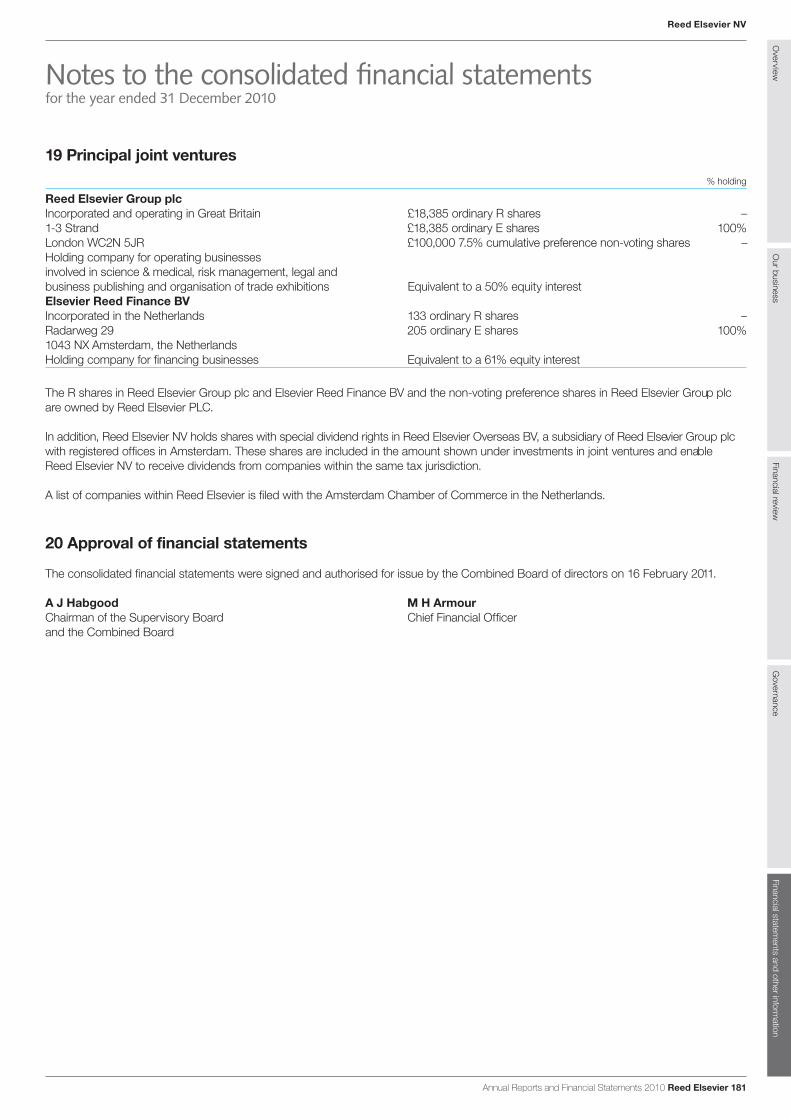
Reed Elsevier NV
Annual Reports and Financial Statements 2010 Reed Elsevier 181
Overview
Our business
Financial reviewG
overnanceFinancial statem
ents and other information
19 Principal joint ventures% holding
Reed Elsevier Group plcIncorporated and operating in Great Britain £18,385 ordinary R shares –1-3 Strand £18,385 ordinary E shares 100%London WC2N 5JR £100,000 7.5% cumulative preference non-voting shares –Holding company for operating businesses involved in science & medical, risk management, legal and business publishing and organisation of trade exhibitions Equivalent to a 50% equity interestElsevier Reed Finance BVIncorporated in the Netherlands 133 ordinary R shares –Radarweg 29 205 ordinary E shares 100%1043 NX Amsterdam, the Netherlands Holding company for financing businesses Equivalent to a 61% equity interest
The R shares in Reed Elsevier Group plc and Elsevier Reed Finance BV and the non-voting preference shares in Reed Elsevier Group plc are owned by Reed Elsevier PLC.
In addition, Reed Elsevier NV holds shares with special dividend rights in Reed Elsevier Overseas BV, a subsidiary of Reed Elsevier Group plc with registered offices in Amsterdam. These shares are included in the amount shown under investments in joint ventures and enable Reed Elsevier NV to receive dividends from companies within the same tax jurisdiction.
A list of companies within Reed Elsevier is filed with the Amsterdam Chamber of Commerce in the Netherlands.
20 Approval of financial statements
The consolidated financial statements were signed and authorised for issue by the Combined Board of directors on 16 February 2011.
A J Habgood M H ArmourChairman of the Supervisory Board Chief Financial Officerand the Combined Board
Notes to the consolidated financial statementsfor the year ended 31 December 2010
47213_Text_p165-188.indd 181 1/3/11 10:35:31
182 Reed Elsevier Annual Reports and Financial Statements 2010
Independent auditors’ report on the consolidated financial statements to the shareholders of Reed Elsevier NV
Report on the consolidated financial statementsWe have audited the accompanying consolidated financial statements 2010 which are part of the financial statements of Reed Elsevier NV, Amsterdam, which comprise the consolidated statement of financial position as at 31 December 2010, the consolidated income statement, the consolidated statement of comprehensive income, the consolidated statement of cash flows, and the consolidated statement of changes in equity for the year then ended and the notes, comprising a summary of the accounting policies and other explanatory information, as set out in pages 170 to 181.
Management’s responsibilityManagement is responsible for the preparation and fair presentation of the consolidated financial statements in accordance with International Financial Reporting Standards as adopted by the European Union and with Part 9 of Book 2 of the Dutch Civil Code, and for the preparation of the report of the Supervisory Board and the Executive Board in accordance with Part 9 of Book 2 of the Dutch Civil Code. Furthermore, management is responsible for such internal control as it determines necessary to enable the preparation of financial statements that are free from material misstatement, whether due to fraud or error.
Auditors’ responsibilityOur responsibility is to express an opinion on the consolidated financial statements based on our audit. We conducted our audit in accordance with Dutch law, including the Dutch Standards on Auditing. This requires that we comply with ethical requirements and plan and perform the audit to obtain reasonable assurance about whether the consolidated financial statements are free from material misstatement.
An audit involves performing procedures to obtain audit evidence about the amounts and disclosures in the consolidated financial statements. The procedures selected depend on the auditor’s judgment, including the assessment of the risks of material misstatement of the consolidated financial statements, whether due to fraud or error.
In making those risk assessments, the auditor considers internal control relevant to the entity’s preparation and fair presentation of the consolidated financial statements in order to design audit procedures that are appropriate in the circumstances, but not for the purpose of expressing an opinion on the effectiveness of the entity’s internal control. An audit also includes evaluating the appropriateness of accounting policies used and the reasonableness of accounting estimates made by management, as well as evaluating the overall presentation of the consolidated financial statements.
We believe that the audit evidence we have obtained is sufficient and appropriate to provide a basis for our audit opinion.
Opinion with respect to the consolidated financial statementsIn our opinion, the consolidated financial statements give a true and fair view of the financial position of Reed Elsevier NV as at 31 December 2010, and of its results and its cash flows for the year then ended in accordance with International Financial Reporting Standards as adopted by the European Union and with Part 9 of Book 2 of the Dutch Civil Code.
Report on other legal and regulatory requirementsPursuant to the legal requirement under 2:393 sub 5 at e and f of the Dutch Civil Code, we have no deficiencies to report as a result of our examination whether the report of the Supervisory Board and the Executive Board, to the extent we can assess, has been prepared in accordance with Part 9 of Book 2 of this Code, and if the information as required under section 2:392 sub 1 at b-h has been annexed. Further we report, to the extent we can assess, that the report of the Supervisory Board and the Executive Board is consistent with the consolidated financial statements as required by 2:391 sub 4 of the Dutch Civil Code.
Deloitte Accountants B.V.A Sandler Amsterdam The Netherlands 16 February 2011
47213_Text_p165-188.indd 182 1/3/11 10:35:31

Reed Elsevier NV
Annual Reports and Financial Statements 2010 Reed Elsevier 183
Overview
Our business
Financial reviewG
overnanceFinancial statem
ents and other information
Parent company profit and loss account
2010 2009 For the year ended 31 December m m
Administrative expenses (2) (2)Dividends received from joint ventures 1,093 –Finance income from joint ventures 14 22Taxation (3) 2Profit attributable to ordinary shareholders 1,102 22
Parent company balance sheet2010 2009
As at 31 December Note m m
Fixed assetsInvestments in joint ventures 3,597 2,871Current assetsAmounts due from joint ventures – funding 1,359 1,255Amounts due from joint ventures – other 2 2 1,361 1,257Cash 3 3 1,364 1,260Creditors: amounts falling due within one yearTaxation (55) (56)Other creditors 1 (22) (10) (77) (66)Net current assets 1,287 1,194Net assets 4,884 4,065
Capital and reservesShare capital issued 54 53Paid-in surplus 2,169 2,168Shares held in treasury (336) (336)Other reserves 175 179Reserves 2,822 2,001Shareholders’ funds 4,884 4,065
The parent company financial statements were signed and authorised for issue by the Combined Board of directors on 16 February 2011.
A J Habgood M H Armour Chairman of the Supervisory Board Chief Financial Officer
47213_Text_p165-188.indd 183 1/3/11 10:35:31
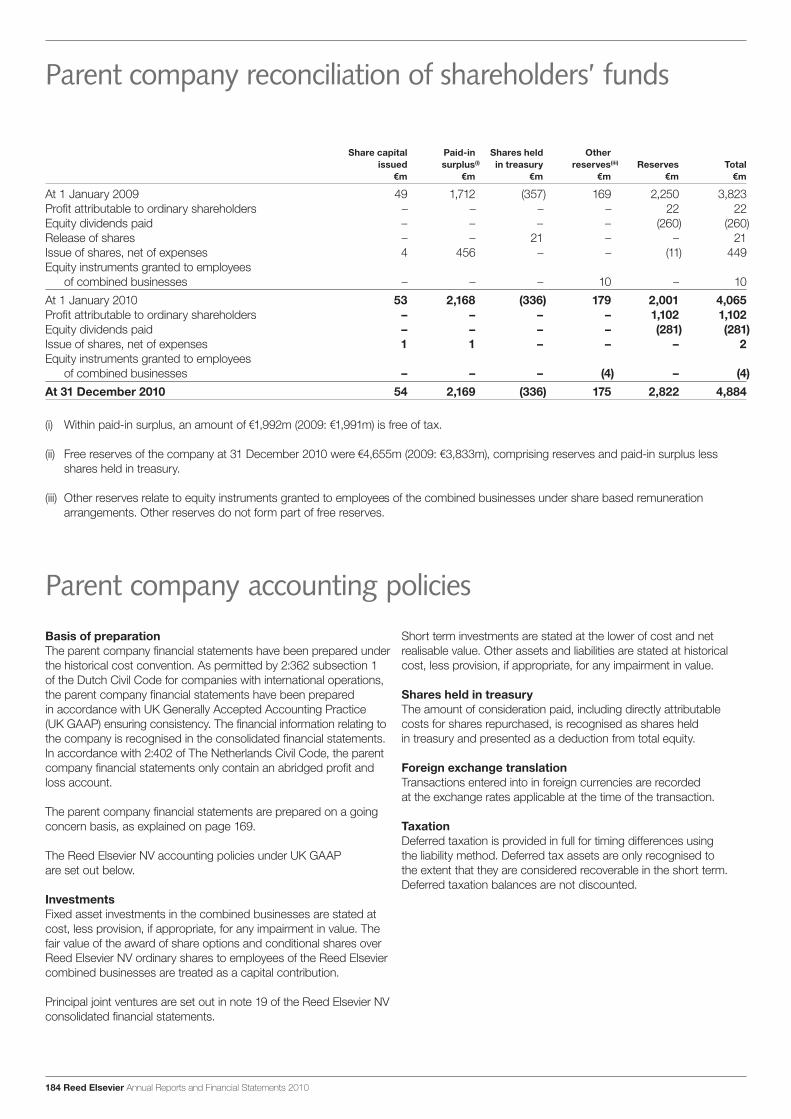
184 Reed Elsevier Annual Reports and Financial Statements 2010
Share capital Paid-in Shares held Other issued surplus(i) in treasury reserves(iii) Reserves Total
m m m m m m
At 1 January 2009 49 1,712 (357) 169 2,250 3,823Profit attributable to ordinary shareholders – – – – 22 22Equity dividends paid – – – – (260) (260)Release of shares – – 21 – – 21Issue of shares, net of expenses 4 456 – – (11) 449Equity instruments granted to employees
of combined businesses – – – 10 – 10At 1 January 2010 53 2,168 (336) 179 2,001 4,065Profit attributable to ordinary shareholders – – – – 1,102 1,102Equity dividends paid – – – – (281) (281)Issue of shares, net of expenses 1 1 – – – 2Equity instruments granted to employees
of combined businesses – – – (4) – (4)At 31 December 2010 54 2,169 (336) 175 2,822 4,884
(i) Within paid-in surplus, an amount of 1,992m (2009: 1,991m) is free of tax.
(ii) Free reserves of the company at 31 December 2010 were 4,655m (2009: 3,833m), comprising reserves and paid-in surplus less shares held in treasury.
(iii) Other reserves relate to equity instruments granted to employees of the combined businesses under share based remuneration arrangements. Other reserves do not form part of free reserves.
Parent company accounting policies
Parent company reconciliation of shareholders’ funds
Basis of preparationThe parent company financial statements have been prepared under the historical cost convention. As permitted by 2:362 subsection 1 of the Dutch Civil Code for companies with international operations, the parent company financial statements have been prepared in accordance with UK Generally Accepted Accounting Practice (UK GAAP) ensuring consistency. The financial information relating to the company is recognised in the consolidated financial statements. In accordance with 2:402 of The Netherlands Civil Code, the parent company financial statements only contain an abridged profit and loss account.
The parent company financial statements are prepared on a going concern basis, as explained on page 169.
The Reed Elsevier NV accounting policies under UK GAAP are set out below.
InvestmentsFixed asset investments in the combined businesses are stated at cost, less provision, if appropriate, for any impairment in value. The fair value of the award of share options and conditional shares over Reed Elsevier NV ordinary shares to employees of the Reed Elsevier combined businesses are treated as a capital contribution.
Principal joint ventures are set out in note 19 of the Reed Elsevier NV consolidated financial statements.
Short term investments are stated at the lower of cost and net realisable value. Other assets and liabilities are stated at historical cost, less provision, if appropriate, for any impairment in value.
Shares held in treasuryThe amount of consideration paid, including directly attributable costs for shares repurchased, is recognised as shares held in treasury and presented as a deduction from total equity.
Foreign exchange translationTransactions entered into in foreign currencies are recorded at the exchange rates applicable at the time of the transaction.
TaxationDeferred taxation is provided in full for timing differences using the liability method. Deferred tax assets are only recognised to the extent that they are considered recoverable in the short term. Deferred taxation balances are not discounted.
47213_Text_p165-188.indd 184 1/3/11 10:35:31

Reed Elsevier NV
Annual Reports and Financial Statements 2010 Reed Elsevier 185
Overview
Our business
Financial reviewG
overnanceFinancial statem
ents and other information
Notes to the parent company financial statements
1 Other creditors
Other creditors include 9m (2009: 10m) of employee convertible debenture loans with a weighted average interest rate of 3.30% (2009: 4.04%). Depending on the conversion terms, the surrender of 227 or 200 par value debenture loans qualifiesfor 50 Reed Elsevier NV ordinary shares.
2 Reconciliations to consolidated financial statements
A reconciliation of the parent company profit attributable to ordinary shareholders prepared under UK GAAP and the consolidated profit attributable to ordinary shareholders prepared under IFRS and presented under the equity method is provided below:
2010 2009 Year ended 31 December m m
Parent company profit attributable to ordinary shareholders 1,102 22Share of results of joint ventures 367 197Dividends received from joint ventures (1,093) –Consolidated profit attributable to ordinary shareholders using the equity method 376 219
A reconciliation between the parent company shareholders’ funds prepared under UK GAAP and the consolidated shareholders’ funds prepared under IFRS and presented under the equity method is provided below:
2010 2009 As at 31 December m m
Parent company shareholders’ funds 4,884 4,065Cumulative share of results of joint ventures less cumulative dividends received from joint ventures (2,747) (2,021)Cumulative currency translation adjustments (271) (373)Cumulative equalisation and other adjustments 145 178Share of treasury shares held by joint ventures’ employee benefit trust (97) (98)Share of IFRS adjustments in joint ventures (602) (602)Equity instruments granted to employees of combined businesses (175) (179)Consolidated shareholders’ funds using the equity method 1,137 970
47213_Text_p165-188.indd 185 1/3/11 10:35:31
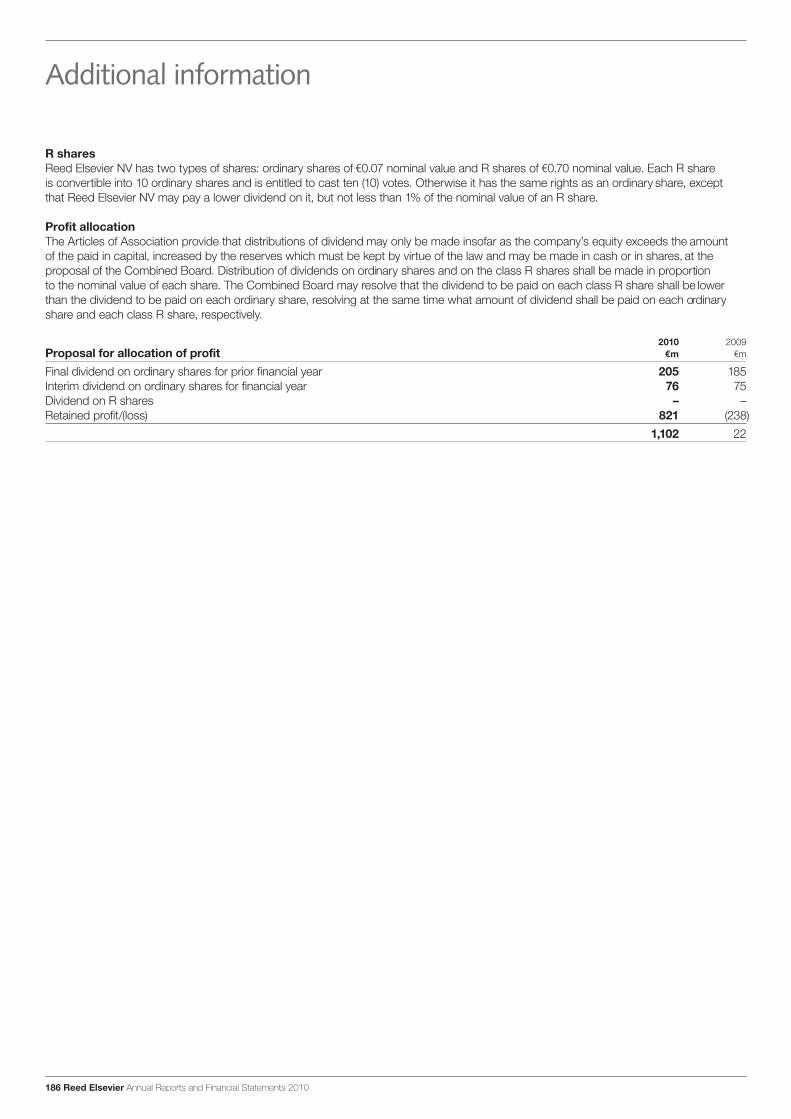
186 Reed Elsevier Annual Reports and Financial Statements 2010
R sharesReed Elsevier NV has two types of shares: ordinary shares of 0.07 nominal value and R shares of 0.70 nominal value. Each R share is convertible into 10 ordinary shares and is entitled to cast ten (10) votes. Otherwise it has the same rights as an ordinary share, except that Reed Elsevier NV may pay a lower dividend on it, but not less than 1% of the nominal value of an R share.
Profit allocationThe Articles of Association provide that distributions of dividend may only be made insofar as the company’s equity exceeds the amount of the paid in capital, increased by the reserves which must be kept by virtue of the law and may be made in cash or in shares, at the proposal of the Combined Board. Distribution of dividends on ordinary shares and on the class R shares shall be made in proportion to the nominal value of each share. The Combined Board may resolve that the dividend to be paid on each class R share shall be lower than the dividend to be paid on each ordinary share, resolving at the same time what amount of dividend shall be paid on each ordinary share and each class R share, respectively.
2010 2009 Proposal for allocation of profit m m
Final dividend on ordinary shares for prior financial year 205 185Interim dividend on ordinary shares for financial year 76 75Dividend on R shares – –Retained profit/(loss) 821 (238) 1,102 22
Additional information
47213_Text_p165-188.indd 186 1/3/11 10:35:31
Reed Elsevier NV
Annual Reports and Financial Statements 2010 Reed Elsevier 187
Overview
Our business
Financial reviewG
overnanceFinancial statem
ents and other information
Independent auditors’ report on the parent company financial statements to the shareholders of Reed Elsevier NV
Report on the company financial statementsWe have audited the accompanying parent company financial statements 2010 which are part of the financial statements of Reed Elsevier NV, Amsterdam, which comprise the parent company balance sheet as at 31 December 2010, the parent company profit and loss account for the year then ended, the parent company reconciliation of shareholders’ funds and the notes, comprising a summary of the accounting policies and the additional information, as set out in pages 183 to 186.
Management’s responsibilityManagement is responsible for the preparation and fair presentation of the parent company financial statements both in accordance with accounting principles generally accepted in the United Kingdom and with Part 9 of Book 2 of the Dutch Civil Code, and for the preparation of the report of the Supervisory Board and the Executive Board in accordance with Part 9 of Book 2 of the Dutch Civil Code. Furthermore, management is also responsible for such internal control as it determines necessary to enable the preparation of the parent company financial statements that are free from material misstatement, whether due to fraud or error.
Auditors’ responsibilityOur responsibility is to express an opinion on the parent company financial statements based on our audit. We conducted our audit in accordance with Dutch law, including the Dutch Standards on Auditing. This requires that we comply with ethical requirements and plan and perform the audit to obtain reasonable assurance about whether the parent company financial statements are free from material misstatement.
An audit involves performing procedures to obtain audit evidence about the amounts and disclosures in the parent company financial statements. The procedures selected depend on the auditor’s judgment, including the assessment of the risks of material misstatement of the parent company financial statements, whether due to fraud or error.
In making those risk assessments, the auditor considers internal control relevant to the entity’s preparation and fair presentation of the parent company financial statements in order to design audit procedures that are appropriate in the circumstances, but not for the purpose of expressing an opinion on the effectiveness of the entity’s internal control. An audit also includes evaluating the appropriateness of accounting policies used and the reasonableness of accounting estimates made by management, as well as evaluating the overall presentation of the parent company financial statements.
We believe that the audit evidence we have obtained is sufficient and appropriate to provide a basis for our audit opinion.
Opinion with respect to the parent company financial statementsIn our opinion, the parent company financial statements give a true and fair view of the financial position of Reed Elsevier NV as at 31 December 2010 and of its result for the year then ended in accordance with accounting principles generally accepted in the United Kingdom and with Part 9 of Book 2 of the Dutch Civil Code.
Report on other legal and regulatory requirementsPursuant to the legal requirement under 2:393 sub 5 at e and f of the Dutch Civil Code, we have no deficiencies to report as a result of our examination whether the report of the Supervisory Board and the Executive Board, to the extent we can assess, has been prepared in accordance with Part 9 of Book 2 of this Code, and if the information as required under section 2:392 sub 1 at b-h has been annexed. Further we report that the report of the Supervisory Board and the Executive Board, to the extent we can assess, is consistent with the consolidated financial statements as required by 2:391 sub 4 of the Dutch Civil Code.
Deloitte Accountants B.V.A SandlerAmsterdam The Netherlands 16 February 2011
47213_Text_p165-188.indd 187 1/3/11 10:35:32
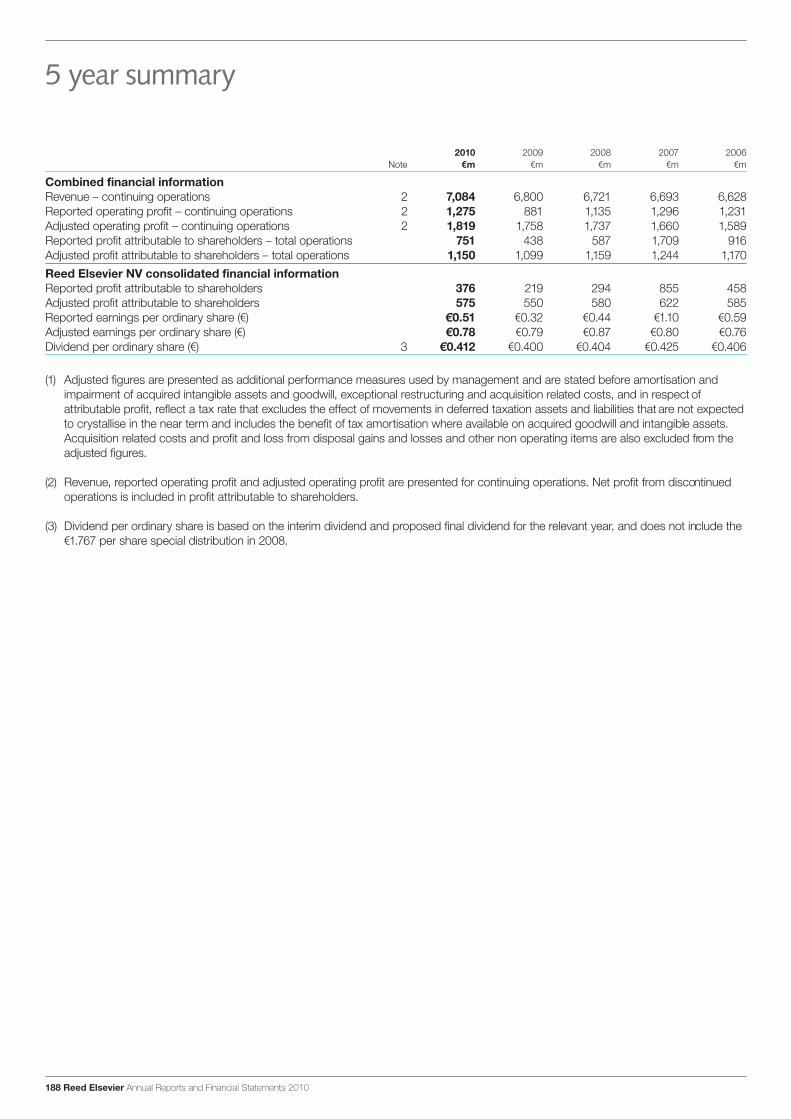
188 Reed Elsevier Annual Reports and Financial Statements 2010
5 year summary
2010 2009 2008 2007 2006 Note m m m m m
Combined financial informationRevenue – continuing operations 2 7,084 6,800 6,721 6,693 6,628Reported operating profit – continuing operations 2 1,275 881 1,135 1,296 1,231Adjusted operating profit – continuing operations 2 1,819 1,758 1,737 1,660 1,589Reported profit attributable to shareholders – total operations 751 438 587 1,709 916Adjusted profit attributable to shareholders – total operations 1,150 1,099 1,159 1,244 1,170Reed Elsevier NV consolidated financial informationReported profit attributable to shareholders 376 219 294 855 458Adjusted profit attributable to shareholders 575 550 580 622 585Reported earnings per ordinary share ( ) 0.51 0.32 0.44 1.10 0.59Adjusted earnings per ordinary share ( ) 0.78 0.79 0.87 0.80 0.76Dividend per ordinary share ( ) 3 0.412 0.400 0.404 0.425 0.406
(1) Adjusted figures are presented as additional performance measures used by management and are stated before amortisation and impairment of acquired intangible assets and goodwill, exceptional restructuring and acquisition related costs, and in respect of attributable profit, reflect a tax rate that excludes the effect of movements in deferred taxation assets and liabilities that are not expected to crystallise in the near term and includes the benefit of tax amortisation where available on acquired goodwill and intangible assets. Acquisition related costs and profit and loss from disposal gains and losses and other non operating items are also excluded from the adjusted figures.
(2) Revenue, reported operating profit and adjusted operating profit are presented for continuing operations. Net profit from discontinued operations is included in profit attributable to shareholders.
(3) Dividend per ordinary share is based on the interim dividend and proposed final dividend for the relevant year, and does not include the 1.767 per share special distribution in 2008.
47213_Text_p165-188.indd 188 1/3/11 10:35:32

Overview
Our business
Financial reviewG
overnanceFinancial statem
ents and other information
Annual Reports and Financial Statements 2010 Reed Elsevier 189
Overview
Business review
Financial reviewG
overnanceFinancial statem
ents and other information
Additional information for US Investors
190 Reed Elsevier combined businesses192 Reed Elsevier PLC193 Reed Elsevier NV
Shareholder information
194 Shareholder information196 Contacts197 Financial calendar
Principal operating locations
198 Principal operating locations
Other information
47213_Text_p189-200.indd 189 1/3/11 10:34:06
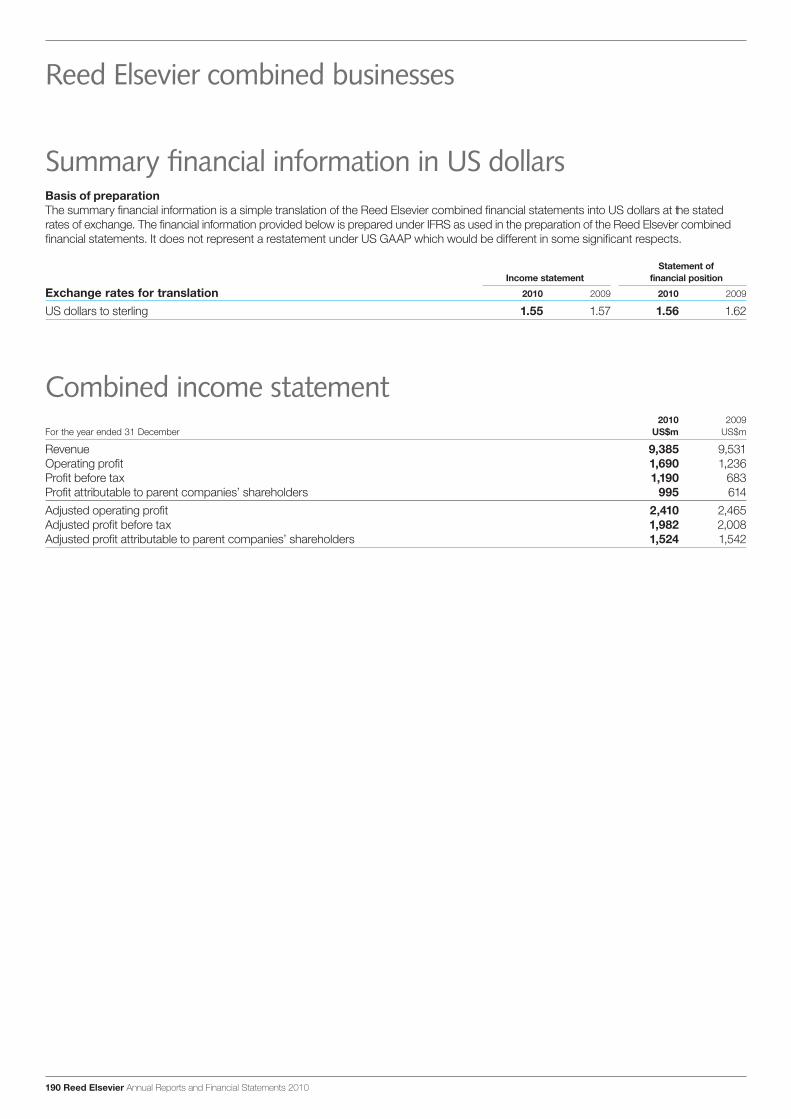
190 Reed Elsevier Annual Reports and Financial Statements 2010
Summary financial information in US dollarsBasis of preparationThe summary financial information is a simple translation of the Reed Elsevier combined financial statements into US dollars at the stated rates of exchange. The financial information provided below is prepared under IFRS as used in the preparation of the Reed Elsevier combined financial statements. It does not represent a restatement under US GAAP which would be different in some significant respects.
Statement of Income statement financial position
Exchange rates for translation 2010 2009 2010 2009
US dollars to sterling 1.55 1.57 1.56 1.62
Combined income statement2010 2009
For the year ended 31 December US$m US$m
Revenue 9,385 9,531Operating profit 1,690 1,236Profit before tax 1,190 683Profit attributable to parent companies’ shareholders 995 614Adjusted operating profit 2,410 2,465Adjusted profit before tax 1,982 2,008Adjusted profit attributable to parent companies’ shareholders 1,524 1,542
Reed Elsevier combined businesses
47213_Text_p189-200.indd 190 1/3/11 10:34:06

Additional information for US Investors
Annual Reports and Financial Statements 2010 Reed Elsevier 191
Overview
Our business
Financial reviewG
overnanceFinancial statem
ents and other information
Combined statement of cash flows2010 2009
For the year ended 31 December US$m US$m
Net cash from operating activities 2,097 1,870Net cash used in investing activities (510) (493)Net cash used in financing activities (1,587) (904)Increase in cash and cash equivalents – 473Movement in cash and cash equivalentsAt start of year 1,189 544Increase in cash and cash equivalents – 473Exchange translation differences (31) 172At end of year 1,158 1,189Adjusted operating cash flow 2,354 2,446
Combined statement of financial position2010 2009
As at 31 December US$m US$m
Non-current assets 13,383 14,186Current assets 4,023 4,167Assets held for sale – 8Total assets 17,406 18,361Current liabilities 6,079 6,259Non-current liabilities 8,254 9,244Liabilities associated with assets held for sale – 8Total liabilities 14,333 15,511Net assets 3,073 2,850
Reed Elsevier combined businesses
47213_Text_p189-200.indd 191 1/3/11 10:34:06

192 Reed Elsevier Annual Reports and Financial Statements 2010
Summary financial information in US dollarsBasis of preparationThe summary financial information is a simple translation of Reed Elsevier PLC’s consolidated financial statements into US dollars at the stated rates of exchange. The financial information provided below is prepared under IFRS as used in the preparation of the Reed Elsevier PLC consolidated financial statements. It does not represent a restatement under US GAAP which would be different in some significant respects.
2010 2009Exchange rates for translation of sterling ($:£1) US$:£ US$:£
Income statement 1.55 1.57Statement of financial position 1.56 1.62
Consolidated income statement2010 2009
For the year ended 31 December US$m US$m
Profit attributable to ordinary shareholders 507 306Adjusted profit attributable to 52.9% interest in Reed Elsevier combined businesses 806 815Share of joint ventures’:
Amortisation of acquired intangible assets (276) (341)Impairment of acquired intangible assets and goodwill – (113)Exceptional restructuring costs (31) (110)Acquisition related costs (23) (28)Disposals and other non operating items (31) 19Deferred tax adjustments 82 83
Profit attributable to 52.9% interest in Reed Elsevier combined businesses 527 325
2010 2009Data per American Depositary Share (ADS) US$ US$
Earnings per ADS based on 52.9% interest in Reed Elsevier combined businessesAdjusted $2.69 $2.88Basic $1.69 $1.08
Net dividend per ADS declared in the year $1.26 $1.28Net dividend per ADS paid and proposed in relation to the financial year $1.26 $1.28
Consolidated statement of financial position2010 2009
As at 31 December US$m US$m
Shareholders’ equity 1,604 1,484
Adjusted earnings per American Depositary Share is based on Reed Elsevier PLC shareholders’ 52.9% share of the adjusted profit attributable of the Reed Elsevier combined businesses, which excludes amortisation and impairment of acquired intangible assets and goodwill, exceptional restructuring and acquisition related costs, disposal gains and losses and other non operating items, related tax effects and movements in deferred tax assets and liabilities that are not expected to crystallise in the near term and includes the benefit of tax amortisation where available on acquired goodwill and intangible assets. Adjusted figures are additional performance measures used by management and are described in note 9 to the Reed Elsevier PLC consolidated financial statements.
Reed Elsevier PLC shares are quoted on the New York Stock Exchange and trading is in the form of American Depositary Shares (ADSs), evidenced by American Depositary Receipts (ADRs), representing four Reed Elsevier PLC ordinary shares. (CUSIP No. 758205207; trading symbol, RUK; Bank of New York is the ADR Depositary.)
Reed Elsevier PLC
47213_Text_p189-200.indd 192 1/3/11 10:34:06

Additional information for US Investors
Annual Reports and Financial Statements 2010 Reed Elsevier 193
Overview
Our business
Financial reviewG
overnanceFinancial statem
ents and other information
Summary financial information in US dollarsBasis of preparationThe summary financial information is a simple translation of the Reed Elsevier NV consolidated financial statements into US dollars at the stated rates of exchange. The financial information provided below is prepared under IFRS as used in the preparation of the Reed Elsevier NV consolidated financial statements. It does not represent a restatement under US GAAP which would be different in some significant respects.
2010 2009Exchange rates for translation of euros ($: 1) US$: US$:
Income statement 1.32 1.40Statement of financial position 1.33 1.44
Consolidated income statement2010 2009
For the year ended 31 December US$m US$m
Adjusted profit attributable to ordinary shareholders 762 770Share of joint ventures’:
Amortisation of acquired intangible assets (261) (322)Impairment of acquired intangible assets and goodwill – (106)Exceptional restructuring costs (29) (105)Acquisition related costs (24) (27)Disposals and other non operating items (28) 18Deferred tax adjustments 78 79
Profit attributable to ordinary shareholders 498 307
2010 2009Data per American Depositary Share (ADS) US$ US$
Earnings per ADS based on 50% interest in Reed Elsevier combined businessesAdjusted $2.07 $2.21Basic $1.35 $0.90
Net dividend per ADS declared in the year $1.07 $1.11Net dividend per ADS paid and proposed in relation to the financial year $1.09 $1.12
Consolidated statement of financial position2010 2009
As at 31 December US$m US$m
Shareholders’ equity 1,516 1,403
Adjusted earnings per American Depositary Share is based on Reed Elsevier NV shareholders’ 50% share of the adjusted profit attributable of the Reed Elsevier combined businesses, which excludes amortisation and impairment of acquired intangible assets and goodwill, exceptional restructuring and acquisition related costs, disposal gains and losses and other non operating items, related tax effects and movements in deferred tax assets and liabilities that are not expected to crystallise in the near term and includes the benefit of tax amortisation where available on acquired goodwill and intangible assets. Adjusted figures are additional performance measures used by management and are described in note 9 to the Reed Elsevier NV consolidated financial statements.
Reed Elsevier NV shares are quoted on the New York Stock Exchange and trading is in the form of American Depositary Shares (ADSs), evidenced by American Depositary Receipts (ADRs), representing two Reed Elsevier NV ordinary shares. (CUSIP No. 758204200; trading symbol, ENL; Bank of New York is the ADR Depositary.)
Reed Elsevier NV
47213_Text_p189-200.indd 193 1/3/11 10:34:06
194 Reed Elsevier Annual Reports and Financial Statements 2010
Annual Reports and Financial Statements 2010The Annual Reports and Financial Statements for the Reed Elsevier combined businesses, Reed Elsevier PLC and Reed Elsevier NV for the year ended 31 December 2010, and the Corporate Governance Statement of Reed Elsevier NV are available on the Reed Elsevier website, and from the registered offices of the respective parent companies shown on page 196. Additional financial information, including the Interim and Full Year Results announcements, Interim Management Statements and presentations is also available on the Reed Elsevier website www.reedelsevier.com.
The Reed Elsevier combined financial statements set out in the Annual Reports and Financial Statements are expressed in sterling, with summary combined financial information expressed in euros. The financial statements of Reed Elsevier PLC and Reed Elsevier NV are expressed in sterling and euros respectively. Reed Elsevier NV no longer publishes on the website a full convenience translation in euros of the Reed Elsevier Annual Reports and Financial Statements.
Interim resultsReed Elsevier PLC and Reed Elsevier NV no longer publish interim results in hard copy. The interim results are available on the Reed Elsevier website.
Share price informationReed Elsevier PLC’s ordinary shares are quoted on the London Stock Exchange.
Reed Elsevier NV’s ordinary shares are quoted on the Euronext Amsterdam Stock Exchange.
The Reed Elsevier PLC and Reed Elsevier NV ordinary shares are quoted on the New York Stock Exchange in the form of American Depositary Shares (ADSs), evidenced by American Depositary Receipts (ADRs). Each Reed Elsevier PLC ADR represents four Reed Elsevier PLC ordinary shares. Each Reed Elsevier NV ADR represents two Reed Elsevier NV ordinary shares.
The Reed Elsevier PLC and Reed Elsevier NV ordinary share prices and the ADR prices may be obtained from the Reed Elsevier website, other online sources and the financial pages of some newspapers.
For further information visit www.reedelsevier.com
Information for Reed Elsevier PLC ordinary shareholders
Shareholder servicesThe Reed Elsevier PLC ordinary share register is administered by Equiniti Limited. Equiniti provides a free online portal for shareholders at www.shareview.co.uk. Shareview provides shareholders with instant access to details of their shareholding and dividend payments, with the ability to update personal details and to register a bank mandate. Equiniti’s contact details appear on page 196.
Electronic communicationsWhile hard copy shareholder communications continue to be available to those shareholders actively requesting them, in accordance with the Companies Act 2006 and its Articles of Association, Reed Elsevier PLC uses the Reed Elsevier website as the main method of communicating with shareholders. By registering their details online at Shareview, shareholders can be notified by email when shareholder communications are published on the website. Shareholders can also use the Shareview website to appoint a proxy to vote on their behalf at shareholder meetings.
Shareholders who hold their Reed Elsevier PLC shares through CREST may appoint proxies for shareholder meetings through the CREST electronic proxy appointment service by using the procedures described in the CREST manual.
Dividend mandatesShareholders are encouraged to have their dividends paid directly into a UK bank or building society account. This method of payment reduces the risk of delay or loss of dividend cheques in the post and ensures the account is credited on the dividend payment date. A dividend mandate form can be obtained online at www.shareview.co.uk, or by contacting Equiniti at the address shown on page 196.
Equiniti has established a service for overseas shareholders in over 30 countries, which enables shareholders to have their dividends automatically converted from sterling and paid directly into their nominated bank account. Further details of this service, and the fees applicable, are available at www.shareview.co.uk or by contacting Equiniti at the address shown on page 196.
Dividend Reinvestment PlanShareholders can choose to reinvest their Reed Elsevier PLC dividends by purchasing further shares through the Dividend Reinvestment Plan (“DRIP”) provided by Equiniti. Further information concerning the DRIP facility, together with the terms and conditions and an application form can be obtained online at www.shareview.co.uk/dividends or by contacting Equiniti at the address shown on page 196.
Share dealing serviceA telephone and internet dealing service is available through Reed Elsevier PLC’s Registrar, which provides a simple way for UK-resident shareholders to buy or sell Reed Elsevier PLC shares. For telephone dealing call 08456 037 037 between 8.00am and 4.30pm, Monday to Friday, and for internet dealing log on to www.shareview.co.uk/dealing. You will need your shareholder account number shown on your dividend tax voucher.
Shareholder information
47213_Text_p189-200.indd 194 2/3/11 22:48:56
Overview
Our business
Financial reviewG
overnanceFinancial statem
ents and other information
Annual Reports and Financial Statements 2010 Reed Elsevier 195
Shareholder information
Individual savings accounts (ISA)A single company ISA for Reed Elsevier PLC shares is available through Equiniti. Details may be obtained from www.shareview.co.uk/ISA, by writing to Equiniti at the address shown on page 196, or by calling their ISA helpline on 0845 300 0430.
ShareGiftThe Orr Mackintosh Foundation operates a charity share donation scheme for shareholders with small parcels of shares whose value makes it uneconomic to sell them. Details of the scheme can be obtained from the ShareGift website at www.sharegift.org, or by telephoning ShareGift on 020 7930 3737.
Sub-division of ordinary shares and share consolidationOn 28 July 1986 each Reed Elsevier PLC ordinary share of £1 nominal value was sub-divided into four ordinary shares of 25p each. On 2 May 1997 each 25p ordinary share was sub-divided into two ordinary shares of 12.5p each. On 7 January 2008 the ordinary shares of 12.5p each were consolidated on the basis of 58 new ordinary shares of 1451⁄116p nominal value for every 67 ordinary shares of 12.5p each held.
Capital gains taxThe mid-market price of Reed Elsevier PLC’s £1 ordinary shares on 31 March 1982 was 282p. Adjusting for the sub-divisions and share consolidation referred to above, results in an equivalent mid-market price of 40.72p for each existing ordinary share of 1451⁄116p nominal value.
Information for Reed Elsevier NV ordinary shareholders
Shareholder enquiriesEnquiries from holders of Reed Elsevier NV registered ordinary shares in relation to share transfers, dividends, change of address and bank accounts should be directed to the Company Secretary of Reed Elsevier NV, at the registered office address shown on page 196.
DividendsDividends on Reed Elsevier NV ordinary shares are declared and paid in euros. Registered shareholders in Reed Elsevier NV will receive dividends from the company by transmission to the bank account which they have notified to the company. Dividends on shares in bearer form are paid through the intermediary of a bank or broker.
Dividend Reinvestment PlanBy instructing their bank or intermediary, shareholders can choose to reinvest their Reed Elsevier NV dividends by purchasing further shares through the Dividend Reinvestment Plan (“DRIP”) provided by Royal Bank of Scotland N.V. Further information concerning the DRIP facility can be obtained online at www.securitiesinfo.nl.
Consolidation of ordinary sharesOn 7 January 2008 each Reed Elsevier NV ordinary share of 0.06 each were consolidated on the basis of 58 new ordinary
shares of 0.07 each for every 67 ordinary shares of 0.06 held.
Shareholder Communications Channel for Reed Elsevier NV shareholdersReed Elsevier NV has entered into arrangements with Stichting Communicatiekanaal Aandeelhouders (Shareholder Communication Channel Trustee) in the Netherlands, facilitating the communication with and between shareholders, particularly in connection with general shareholders’ meetings. Under these arrangements, holders of Reed Elsevier NV bearer shares whose shares are held in the custody of a Dutch bank, and who have notified the intermediary authority appointed for these purposes of their interest, will receive written information from the company with a proxy form for their representation at general shareholder meetings. Reed Elsevier NV also uses the e-voting system of RBS, that allows its shareholders to vote electronically at general meetings of shareholders and provides the shareholder that uses the system confirmation that the vote was cast.
Information for Reed Elsevier PLC and Reed Elsevier NV ADR holders
The Reed Elsevier PLC and Reed Elsevier NV ADR Depositary is BNY Mellon. Reed Elsevier PLC’s CUSIP number is 758205207 and its trading symbol is RUK. Each Reed Elsevier PLC ADR represents four Reed Elsevier PLC ordinary shares. Reed Elsevier NV’s CUSIP number is 758204200 and its trading symbol is ENL. Each Reed Elsevier NV ADR represents two Reed Elsevier NV ordinary shares.
ADR shareholder servicesEnquiries concerning Reed Elsevier PLC or Reed Elsevier NV ADRs should be addressed to the ADR Depositary at the address shown on page 196.
DividendsDividend payments on Reed Elsevier PLC and Reed Elsevier NV ADRs are converted into US dollars by the ADR Depositary.
Annual Report on Form 20-FThe Annual Report on Form 20-F for the Reed Elsevier combined businesses, Reed Elsevier PLC and Reed Elsevier NV will be filed electronically with the United States Securities and Exchange Commission. A copy of Form 20-F for the year ended 31 December 2010 will be available on the Reed Elsevier website, or from the ADR Depositary at the address shown on page 196.
Shareholder information continued
47213_Text_p189-200.indd 195 1/3/11 10:34:07

196 Reed Elsevier Annual Reports and Financial Statements 2010
Contacts
Reed Elsevier PLC1-3 Strand London WC2N 5JR United Kingdom
Tel: +44 (0) 20 7930 7077 Fax: +44 (0) 20 7166 5799
AuditorsDeloitte LLP 2 New Street SquareLondon EC4A 3BZUnited Kingdom
RegistrarEquiniti LimitedAspect HouseSpencer RoadLancingWest SussexBN99 6DAUnited Kingdom
www.shareview.co.uk
Tel: 0871 384 2960 (calls charged at 8p per minute from a BT landline, other telephony providers’ costs may vary)
Tel: +44 121 415 7047 (non-UK callers)
Reed Elsevier PLC and Reed Elsevier NV ADR DepositaryBNY Mellon Shareowner Services480 Washington Blvd 27th FloorJersey City NJ 07310USA
email: https://vault.bnymellon.com
www.adrbny.com
Tel: +1 888 269 2377 +1 201 680 6825 (outside the US)
Reed Elsevier NVRadarweg 29 1043 NX Amsterdam The Netherlands
Tel: +31 (0) 20 485 2222Fax: +31 (0) 20 485 2032
Deloitte Accountants B.V. Orlyplein 50 1043 DP Amsterdam The Netherlands
Listing/paying agentRoyal Bank of Scotland N.V.Gustav Mahlerlaan 10 1082 PP Amsterdam The Netherlands
47213_Text_p189-200.indd 196 1/3/11 10:34:07
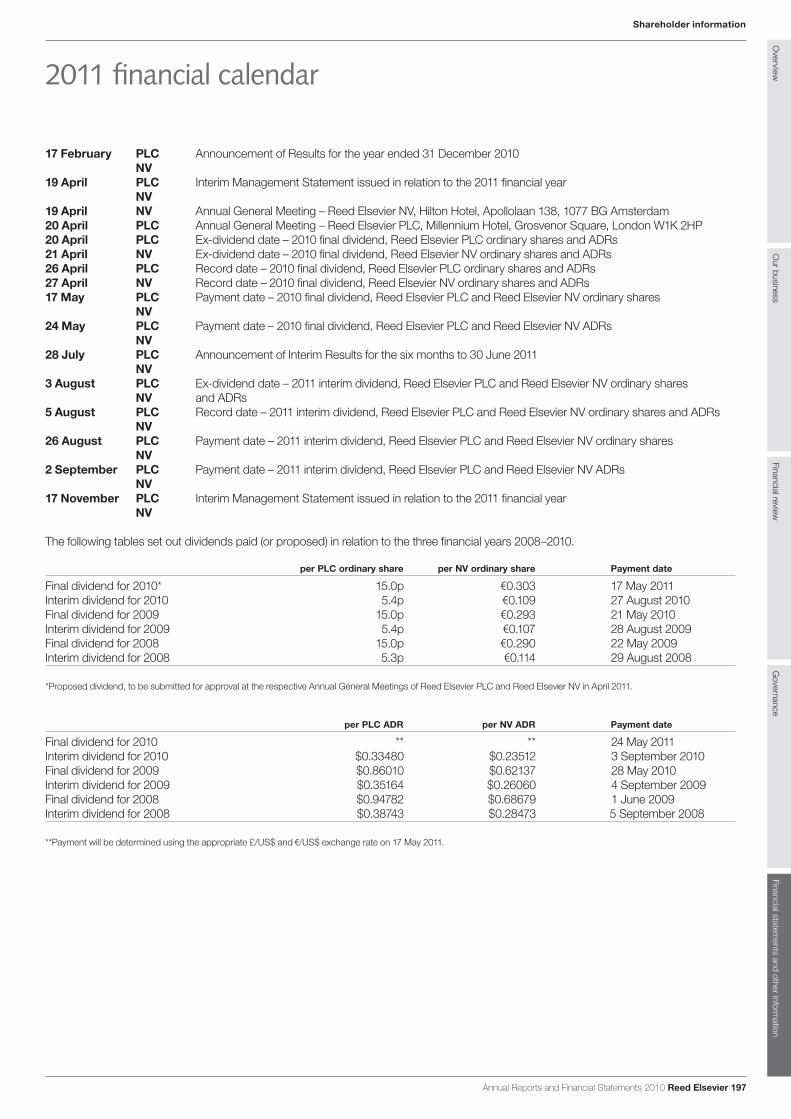
Overview
Our business
Financial reviewG
overnanceFinancial statem
ents and other information
Annual Reports and Financial Statements 2010 Reed Elsevier 197
Shareholder information
2011 financial calendar
17 February PLC Announcement of Results for the year ended 31 December 2010 NV19 April PLC Interim Management Statement issued in relation to the 2011 financial year NV19 April NV Annual General Meeting – Reed Elsevier NV, Hilton Hotel, Apollolaan 138, 1077 BG Amsterdam 20 April PLC Annual General Meeting – Reed Elsevier PLC, Millennium Hotel, Grosvenor Square, London W1K 2HP20 April PLC Ex-dividend date – 2010 final dividend, Reed Elsevier PLC ordinary shares and ADRs21 April NV Ex-dividend date – 2010 final dividend, Reed Elsevier NV ordinary shares and ADRs26 April PLC Record date – 2010 final dividend, Reed Elsevier PLC ordinary shares and ADRs27 April NV Record date – 2010 final dividend, Reed Elsevier NV ordinary shares and ADRs17 May PLC Payment date – 2010 final dividend, Reed Elsevier PLC and Reed Elsevier NV ordinary shares NV24 May PLC Payment date – 2010 final dividend, Reed Elsevier PLC and Reed Elsevier NV ADRs NV28 July PLC Announcement of Interim Results for the six months to 30 June 2011 NV3 August PLC Ex-dividend date – 2011 interim dividend, Reed Elsevier PLC and Reed Elsevier NV ordinary shares NV and ADRs5 August PLC Record date – 2011 interim dividend, Reed Elsevier PLC and Reed Elsevier NV ordinary shares and ADRs NV26 August PLC Payment date – 2011 interim dividend, Reed Elsevier PLC and Reed Elsevier NV ordinary shares NV2 September PLC Payment date – 2011 interim dividend, Reed Elsevier PLC and Reed Elsevier NV ADRs NV17 November PLC Interim Management Statement issued in relation to the 2011 financial year NV
The following tables set out dividends paid (or proposed) in relation to the three financial years 2008–2010.
per PLC ordinary share per NV ordinary share Payment date
Final dividend for 2010* 15.0p 0.303 17 May 2011Interim dividend for 2010 5.4p 0.109 27 August 2010Final dividend for 2009 15.0p 0.293 21 May 2010Interim dividend for 2009 5.4p 0.107 28 August 2009Final dividend for 2008 15.0p 0.290 22 May 2009Interim dividend for 2008 5.3p 0.114 29 August 2008
*Proposed dividend, to be submitted for approval at the respective Annual General Meetings of Reed Elsevier PLC and Reed Elsevier NV in April 2011.
per PLC ADR per NV ADR Payment date
Final dividend for 2010 ** ** 24 May 2011Interim dividend for 2010 $0.33480 $0.23512 3 September 2010Final dividend for 2009 $0.86010 $0.62137 28 May 2010Interim dividend for 2009 $0.35164 $0.26060 4 September 2009Final dividend for 2008 $0.94782 $0.68679 1 June 2009Interim dividend for 2008 $0.38743 $0.28473 5 September 2008
**Payment will be determined using the appropriate £/US$ and /US$ exchange rate on 17 May 2011.
47213_Text_p189-200.indd 197 2/3/11 22:49:38
Principal operating locations
Reed Elsevier1-3 Strand London WC2N 5JR, UKTel: +44 (0)20 7930 7077Fax: +44 (0)20 7166 5799
Radarweg 291043 NX AmsterdamThe NetherlandsTel: +31 (0)20 485 2222Fax: +31 (0)20 485 2032
125 Park Avenue, 23rd FloorNew York, NY 10017, USATel: +1 212 309 8100Fax: +1 212 309 8187
For further information or contact details, please consult our website: www.reedelsevier.com
ElsevierRadarweg 291043 NX AmsterdamThe Netherlandswww.elsevier.com
The Boulevard, Langford LaneKidlington, Oxford OX5 1GB, UK
1600 John F. Kennedy BlvdSuite 1800, PhiladelphiaPA 19103, USAwww.us.elsevierhealth.com
3251 Riverport LaneMaryland Heights, MO 63043, USA
LexisNexis Legal & Professional125 Park Avenue, 23rd FloorNew York, NY 10017, USAwww.lexisnexis.com
9443 Springboro PikeMiamisburg, OH 45342, USA
Halsbury House, 35 Chancery LaneLondon WC2A 1EL, UKwww.lexisnexis.co.uk
LexisNexis Risk Solutions1000 Alderman DriveAlpharetta, GA 30005, USA
Reed ExhibitionsGateway House, 28 The QuadrantRichmond, Surrey TW9 1DN, UKwww.reedexpo.com
Reed Business InformationQuadrant House, The QuadrantSutton, Surrey SM2 5AS, UKwww.reedbusiness.co.uk
Elsevier Reed Finance BVRadarweg 291043 NX AmsterdamThe NetherlandsTel: +31 (0)20 485 2222Fax: +31 (0)20 485 2032
198 Reed Elsevier Annual Reports and Financial Statements 2010
47213_Text_p189-200.indd 198 1/3/11 10:34:07

Overview
Our business
Financial reviewG
overnanceFinancial statem
ents and other information
Notes
Annual Reports and Financial Statements 2010 Reed Elsevier 199
47213_Text_p189-200.indd 199 1/3/11 10:34:07

200 Reed Elsevier Annual Reports and Financial Statements 2010
Notes
47213_Text_p189-200.indd 200 1/3/11 10:34:07

Designed and produced byCONRAN DESIGN GROUP
Board photography by Julian CalderPrinted by Pureprint Group, ISO14001, FSC® certified and CarbonNeutral®
Printed on Revive 50:50 Silk a recycled paper, Forest Stewardship Council (FSC) certified, containing 50% recycled waste and 50% virgin fibre and manufactured at a mill certified with ISO 14001 environmental management standard. The pulp used in this product is bleached using an Elemental Chlorine Free process (ECF). The inks used in the printing of this report are all vegetable based.
CreditsReed Elsevier is a world leading provider of professional information solutions in the Science, Medical, Risk, Legal and Business sectors.
Our customers use our products every day to advance science, improve medical outcomes, evaluate risk, enable better legal decisions, forge business relationships and gain business insight.
Full report online The Reed Elsevier Annual Reports and Financial Statements 2010 are available to view online.www.reedelsevier.com/ar10
47213_Covers.indd 2 3/3/11 13:51:10

Annual Reports and Financial Statements 2010
www.reedelsevier.com
Annual Reports and Financial Statem
ents 2010
47213_Covers.indd 1 1/3/11 11:52:12
Related Documents