DISCLAIMER Notes to the Annual Report and Accounts This PDF version of the Unilever Annual Report and Accounts 2011 is an exact copy of the document provided to Unilever’s shareholders. Certain sections of the Unilever Annual Report and Accounts 2011 have been audited. These are on pages 64 to 122, and those parts noted as audited within the Directors’ Remuneration Report on pages 56 to 59. The maintenance and integrity of the Unilever website is the responsibility of the Directors; the work carried out by the auditors does not involve consideration of these matters. Accordingly, the auditors accept no responsibility for any changes that may have occurred to the financial statements since they were initially placed on the website. Legislation in the United Kingdom and the Netherlands governing the preparation and dissemination of financial statements may differ from legislation in other jurisdictions. Disclaimer Except where you are a shareholder, this material is provided for information purposes only and is not, in particular, intended to confer any legal rights on you. This Annual Report and Accounts does not constitute an invitation to invest in Unilever shares. Any decisions you make in reliance on this information are solely your responsibility. The information is given as of the dates specified, is not updated, and any forward-looking statements are made subject to the reservations specified on the final page of the Report. Unilever accepts no responsibility for any information on other websites that may be accessed from this site by hyperlinks.

Welcome message from author
This document is posted to help you gain knowledge. Please leave a comment to let me know what you think about it! Share it to your friends and learn new things together.
Transcript
DISCLAIMER
Notes to the Annual Report and Accounts This PDF version of the Unilever Annual Report and Accounts 2011 is an exact copy of the document provided to Unilever’s shareholders.
Certain sections of the Unilever Annual Report and Accounts 2011 have been audited. These are on pages 64 to 122, and those parts noted as audited within the Directors’ Remuneration Report on pages 56 to 59.
The maintenance and integrity of the Unilever website is the responsibility of the Directors; the work carried out by the auditors does not involve consideration of these matters. Accordingly, the auditors accept no responsibility for any changes that may have occurred to the financial statements since they were initially placed on the website.
Legislation in the United Kingdom and the Netherlands governing the preparation and dissemination of financial statements may differ from legislation in other jurisdictions.
Disclaimer Except where you are a shareholder, this material is provided for information purposes only and is not, in particular, intended to confer any legal rights on you.
This Annual Report and Accounts does not constitute an invitation to invest in Unilever shares. Any decisions you make in reliance on this information are solely your responsibility.
The information is given as of the dates specified, is not updated, and any forward-looking statements are made subject to the reservations specified on the final page of the Report.
Unilever accepts no responsibility for any information on other websites that may be accessed from this site by hyperlinks.

ANNUAL REPORT AND ACCOUNTS 2011
Creating a better future every day

OUR MISSIONWE WORK TO CREATE A BETTER FUTURE EVERY DAYWe help people feel good, look good and get more out of life with brands and services that are good for them and good for others. We will inspire people to take small, everyday actions that can add up to a big difference for the world. We will develop new ways of doing business with the aim of doubling the size of our company while reducing our environmental impact.Our business model is designed to deliver sustainable growth. We are living in a world where temperatures are rising, water is scarce, energy is expensive, sanitation is poor, and food supplies are volatile and uncertain. We have to develop products that enable people to live well in a resource-stressed world, and encourage behaviour and habits that help them to live sustainably.
For us, sustainability is integral to our way of doing business. Executed well, it will be a powerful driver of business growth and is a core competence for any successful company.
EXAMPLES OF OUR BRANDS DELIVERING SUSTAINABLE GROWTHPUREIT Provides people with safe and affordable drinking water where supplies are of poor quality, and without the need for gas, electricity or a pressurised supply.
KNORRGoes to extraordinary lengths to provide great-tasting products which help people to prepare delicious and nutritious meals for their families every day.
LIPTONIs committed to sourcing all its tea sustainably to help conserve the environment and improve the livelihoods of tea workers, their families and communities.
DOVEHelps women to realise their personal potential for beauty and encourages men to take better care of themselves by engaging them with products that deliver superior care.
COMFORT ONE RINSESaves up to 30 litres of water per wash for the millions of people who do their laundry by hand in water-scarce countries.
CONTENTS
REPORT OF THE DIRECTORSAbout Unilever
2 Chairman’s statement4 Chief Executive Officer’s review6 Operational highlights8 Our business model for sustainable growth
10 Winning with brands and innovation14 Winning in the market place16 Winning through continuous improvement18 Winning with people20 Financial review 201128 Risks
Governance34 Biographies36 Corporate governance46 Report of the Audit Committee48 Report of the Corporate Responsibility
and Reputation Committee49 Report of the Nomination Committee50 Directors’ Remuneration Report
FINANCIAL STATEMENTS61 Statement of Directors’ responsibilities62 Auditors’ reports64 Consolidated income statement65 Consolidated statement of
comprehensive income65 Consolidated statement of changes in equity66 Consolidated balance sheet67 Consolidated cash flow statement68 Notes to the consolidated financial
statements109 Principal group companies and
non-current investments111 Company accounts

1Unilever Annual Report and Accounts 2011
SHAREHOLDER INFORMATION123 Share capital124 Analysis of shareholding125 Financial calendar125 Contact details126 Website126 Share registration126 Publications128 Index
Other informationThe brand names shown in this report are trademarks owned by or licensed to companies within the Unilever Group. This document contains certain statements that are neither reported financial results nor other historical information. These statements are forward-looking statements, including within the meaning of the United States Private Securities Litigation Reform Act of 1995. Actual results may differ materially from those disclosed in our forward-looking statements. For a description of factors that could affect future results, reference should be made to the full ‘Cautionary statement’ on the inside back cover and to the section entitled ‘Risks’ on pages 28 to 33. For information about our non-GAAP measures, see pages 26 and 27. In our report we make reference to Unilever’s website. Information on our website is not incorporated herein and does not form part of this document. This Annual Report comprises regulated information within the meaning of sections 1:1 and 5:25c of the Act on Financial Supervision (“Wet op het financieel toezicht (Wft)”) in the Netherlands.

2
Report of the Directors About Unilever
CHAIRMAN'S STATEMENTAgainst the backdrop of a continuing tough economic environment, Unilever delivered a good performance in 2011. We have a stronger business, with a compelling vision, a sharper organisation and an increasingly effective performance culture.
In a year marked by natural disasters and political turmoil, Unilever’s performance stands out all the more. Beyond delivering solid results, the Group has been taking the right actions for the long term, building a sustainable growth model for our business.
This model reflects the values that are central to Unilever’s approach to doing business – knowing it can only prosper if the societies and communities in which it operates similarly benefit from its presence.
We also see good governance as an essential foundation for the long-term success of the Group, and your Directors firmly believe that acting with integrity and upholding the highest standards of corporate governance form an essential component of the delivery of the Group’s strategy. You will find a description of Unilever’s corporate governance structures and procedures, along with an explanation of the work of the Boards, beginning on page 36. Together these should give you a sense of how Unilever seeks to achieve these aspirations.
2011 was another busy year for the Boards, with a number of key initiatives undertaken.
Board evaluationFollowing our internal evaluation of the Boards’ activities and effectiveness in 2010, we appointed an external consultancy in 2011 to carry out the evaluation. Their report was presented
to the Boards in December and concluded that overall the Boards were operating effectively. The report made a number of valuable recommendations and, as a result, Board meetings will now build knowledge-sharing sessions into the agenda where Directors can discuss experiences on specific topics of relevance to Unilever.
Understanding the businessDuring 2011 the Directors went out into the business and visited operations in Jakarta, Indonesia, and Rome, Italy. In both locations the Directors visited local markets and consumers in their homes. Rome is particularly important as the global centre for Unilever’s ice cream business. Visits such as these give Non-Executive Directors the opportunity to meet senior managers across Unilever and help them to gain a deeper understanding of the Group.
DiversityAt Unilever we have long understood the importance of diversity within our workforce because of the wide range of consumers we connect with globally. This goes right through our organisation, starting with the Boards.
The subject of gender diversity at Board level is receiving considerable attention within the EU. In nominating directors, Unilever considers diversity in terms of nationality, race, gender and relevant expertise and directs that, wherever possible, the Boards should reflect Unilever’s consumer base.
I am pleased that already 25% of Directors on our Boards are women, and we will continue in our aim to increase that percentage. However, Unilever feels that gender is only one part of diversity, and Unilever Directors will continue to be selected on the basis of their wide-ranging experience, backgrounds, skills, knowledge and insight.
Changes to the BoardsJeroen van der Veer retired as a Non-Executive Director at the end of the 2011 AGMs in May and, on behalf of the Boards, I would like to thank him for his valued contributions as Vice-Chairman and Senior Independent Director, and as Chairman of the Nomination and Remuneration Committees.
At the same AGMs Sunil B Mittal was elected as a Non-Executive Director bringing experience in developing markets that will further strengthen the expertise and independence of the Boards as well as broadening their diversity.
It remains for me to thank our 171,000 employees across the world for their hard work in delivering good results in such a challenging environment.
Unilever Annual Report and Accounts 2011
1
Michael TreschowChairman
3
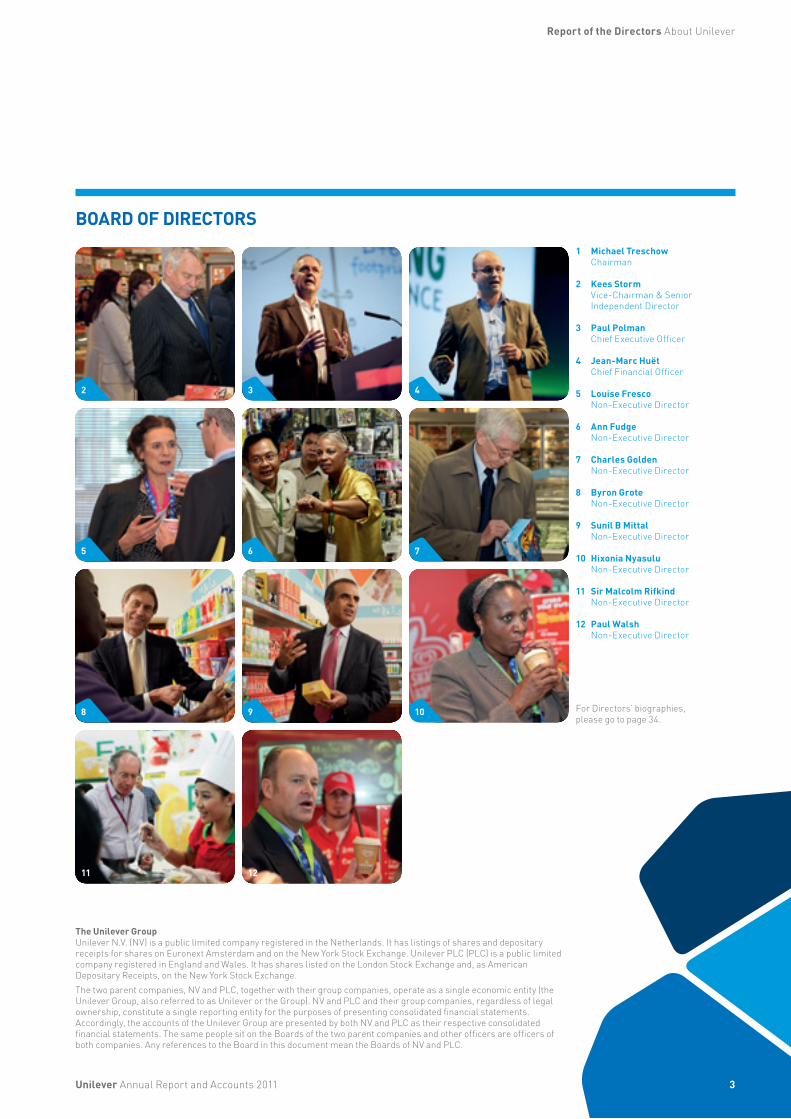
BOARD OF DIRECTORS
The Unilever Group Unilever N.V. (NV) is a public limited company registered in the Netherlands. It has listings of shares and depositary receipts for shares on Euronext Amsterdam and on the New York Stock Exchange. Unilever PLC (PLC) is a public limited company registered in England and Wales. It has shares listed on the London Stock Exchange and, as American Depositary Receipts, on the New York Stock Exchange.The two parent companies, NV and PLC, together with their group companies, operate as a single economic entity (the Unilever Group, also referred to as Unilever or the Group). NV and PLC and their group companies, regardless of legal ownership, constitute a single reporting entity for the purposes of presenting consolidated financial statements. Accordingly, the accounts of the Unilever Group are presented by both NV and PLC as their respective consolidated financial statements. The same people sit on the Boards of the two parent companies and other officers are officers of both companies. Any references to the Board in this document mean the Boards of NV and PLC.
1 Michael Treschow Chairman
2 Kees Storm Vice-Chairman & Senior Independent Director
3 Paul Polman Chief Executive Officer
4 Jean-Marc Huët Chief Financial Officer
5 Louise Fresco Non-Executive Director
6 Ann Fudge Non-Executive Director
7 Charles Golden Non-Executive Director
8 Byron Grote Non-Executive Director
9 Sunil B Mittal Non-Executive Director
10 Hixonia Nyasulu Non-Executive Director
11 Sir Malcolm Rifkind Non-Executive Director
12 Paul Walsh Non-Executive Director
Unilever Annual Report and Accounts 2011
Report of the Directors About Unilever
5 7
9
11
2 3 4
6
8 10
12
For Directors’ biographies, please go to page 34.
4
CHIEF EXECUTIVE OFFICER’S REVIEW2011 has been another year of real progress in delivering our Compass strategy. We made significant progress in the transformation of Unilever to a sustainable growth company despite difficult markets.
2010. This is a good performance, not least given that we also continued to invest for long-term success – adding, for example, an extra €150 million in advertising and promotional spend.
We maintained our record for efficiency gains, reducing overheads and delivering €1.5 billion in savings. We also re-affirmed our reputation for financial discipline, with strong free cash flow of €3.1 billion.
Last year’s performance should also be seen in the context of geopolitical disturbances and natural disasters. The uprisings in North Africa and the Middle East, together with earthquakes in New Zealand and Japan and floods in Thailand, were among events that had a major impact on our operations. Our first concern during these incidents is for the welfare of our people and for their families, and thankfully we suffered no loss of life or serious injury.
How a company responds to these events says a lot about its values and we are proud that Unilever employees – working alongside partners such as the World Food Programme – were among the first to offer assistance to those caught up in these tragedies. In Thailand, for example, Unilever teams worked tirelessly to help get our customers – many of whose stores and warehouses were flooded – back in business.
One of the most pleasing aspects of the performance in 2011 was that we delivered strong results while continuing to make necessary long-term changes. Our vision is to double the size of the business while reducing our environmental impact. This requires us to operate very differently. At the heart of our new business model is the Unilever Sustainable Living Plan (USLP), which touches all aspects of our business: from the way we source our materials, develop our brands and make our products, to the way they are used and disposed of by our consumers. Its basic premise is that in a
2011 was another turbulent year for the world economy, reflected in the instability of the Eurozone and sluggish consumer demand in North America. Growth in the emerging countries remained robust, although even here we saw some softening. It was also in these markets that we experienced our most intense competitor activity.
The uncertainty underpinning global markets gave rise to strong inflationary pressures and a sharp increase in commodity costs, stifling growth and significantly impacting costs. With unemployment rising and real incomes falling, there is no doubt that consumers are suffering.
Despite these conditions, 2011 was a strong year for Unilever. Underlying sales growth of 6.5% was ahead of our markets and continued the trend of improving top line performance. Growth was price and volume driven, reflecting the strength of our brands and their ability to compete in the most difficult conditions. Recent acquisition and disposal activity added a further 1.2% to turnover.
Growth was broad-based, although fuelled by an outstanding performance in the emerging markets – a strategic focus for the business. Driven by markets like India, China, Turkey and South Africa – all of which grew by double digits – our emerging markets business grew by 11.5% and now accounts for 54% of Unilever’s turnover.
In the developed world, growth was more subdued, at 0.8%, although even here we saw some strong performances. Our biggest developed markets – the United States, Germany, the UK and France – which represent 61% of our developed world business, grew between 1% and 4%.
The sharp rise in commodity prices meant we had to absorb an additional €2.4 billion of costs. Despite this, our operating profit was broadly in line with
resource constrained world, it is possible and necessary to decouple growth from environmental impact.
The USLP represents a long-term goal but progress during the first year was encouraging, not least our commitment to source agricultural raw materials from sustainable supplies. By the end of 2011, for example, almost two thirds of the palm oil used in our products was being purchased from certified sources.
Our leadership in this area has caught the imagination of employees and customers alike. It has won Unilever widespread external recognition. Last year, the company was named winner of the 6th International Green Awards – just one of a number of high profile sustainability awards received in 2011.
Our business model is designed to provide long-term sustainable growth. This relies on delivering our corporate strategy, and in particular building our brands and providing bigger and better innovations. Again, we are making progress. The proportion of turnover coming from products launched in the past two years continues to be above 30%. Sales of Dove exceeded €3 billion in 2011 driven by innovations like Men+Care. And the use of advanced technology enabled our Knorr jelly platform to grow by 60% last year.
Our strategy relies equally on rolling out innovations faster and to more markets. The launch of Axe Excite to 100 markets in just over a year is typical of the speed and breadth we are able to achieve.
We are also introducing brands into many more markets. Magnum, for example, has enjoyed remarkable success since being launched in North America and Indonesia. We have also introduced Dove in China and Clear shampoo in South Africa. Our Comfort and Surf fabric conditioner brands have performed strongly since being introduced in Australasia, South Africa and the Philippines.
Unilever Annual Report and Accounts 2011
Report of the Directors About Unilever
1∆

55
At the same time we are strengthening our portfolio. Following the integration of the Sara Lee personal care business and Alberto Culver, we are now acquiring the Russian personal care company, Concern Kalina, increasing our ability to compete in the personal care market. Alberto Culver was Unilever’s biggest acquisition in ten years and we have moved quickly to capitalise on these new assets. Within nine months, we had introduced TRESemmé into Brazil, Simpleinto the United States and Motions into South Africa – great brands and fantastic examples of speed in action.
We are also changing the organisation. Today we are more agile, more consumerresponsive and better able to leverage
global scale. We see the emergence of a culture rooted in strong values but with a sharper performance edge – vital if we are to succeed in today’s markets.
To support the transformation, we also continue to invest heavily in our people and their development. Last year, for example, we were proud to break ground on a new state-of-the-art training facility in Singapore. This 5.6 hectare site will act
as a leading development centre for our emerging markets business.
So we look back on a year of progress, measured both by strong results and changes to the business. Unilever is
moving from a company fit to compete to one that is fit to win. Shareholders are
benefiting from the changes: last year, Unilever’s share price rose 14% on the AEX, making it the market’s best performing stock in 2011.
2012 will be a tough year. But we are well prepared, and – thanks to the dedication of our 171,000 wonderful employees – we are confident that we can continue to outperform our markets and deliver sustainable growth and long-term value to all stakeholders.
Paul PolmanChief Executive Officer
UNILEVER LEADERSHIP EXECUTIVE (ULE)
4
8
2 5∆
9
3
6
10 12
7
11 13
1 Paul Polman∆
Chief Executive Officer
2 Doug Baillie Chief Human Resources Officer
6 Alan Jope North Asia
10 Antoine de Saint-Affrique Foods
3 Professor Geneviève Berger Chief Research & Development Officer
7 Kees Kruythoff North America
11 Pier Luigi Sigismondi Chief Supply Chain Officer
4 Kevin Havelock Refreshment
8 Dave Lewis Personal Care
12 Keith Weed Chief Marketing and Communication Officer
5 Jean-Marc Huët∆
Chief Financial Officer
9 Harish Manwani Chief Operating Officer
13 Jan Zijderveld Europe
Unilever Annual Report and Accounts 2011
Report of the Directors About Unilever
∆ Board member For ULE biographies, please go to page 35.
6
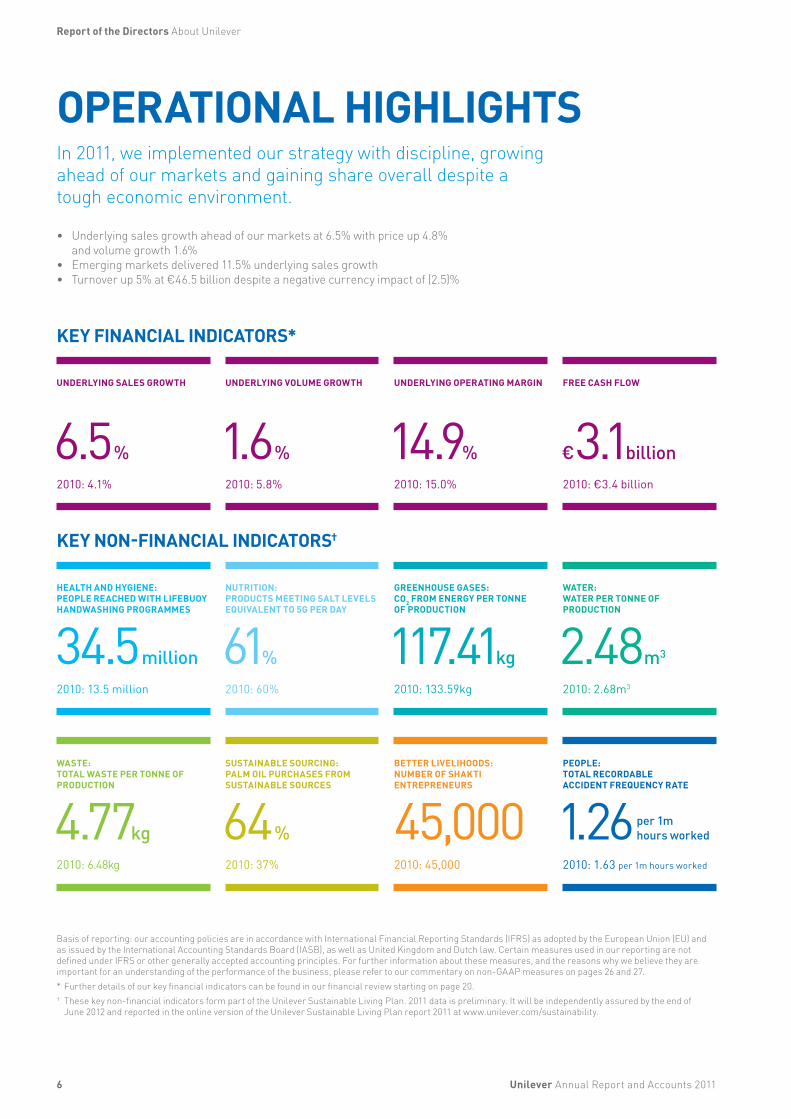
OPERATIONAL HIGHLIGHTSIn 2011, we implemented our strategy with discipline, growing ahead of our markets and gaining share overall despite a tough economic environment.
• Underlying sales growth ahead of our markets at 6.5% with price up 4.8% and volume growth 1.6%
• Emerging markets delivered 11.5% underlying sales growth• Turnover up 5% at €46.5 billion despite a negative currency impact of (2.5)%
KEY FINANCIAL INDICATORS*
UNDERLYING SALES GROWTH
6.5%2010: 4.1%
UNDERLYING VOLUME GROWTH
1.6%2010: 5.8%
UNDERLYING OPERATING MARGIN
14.9%2010: 15.0%
FREE CASH FLOW
€3.1 billion2010: €3.4 billion
KEY NON-FINANCIAL INDICATORS†
HEALTH AND HYGIENE: PEOPLE REACHED WITH LIFEBUOY HANDWASHING PROGRAMMES
34.5 million2010: 13.5 million
NUTRITION: PRODUCTS MEETING SALT LEVELS EQUIVALENT TO 5G PER DAY
61%2010: 60%
GREENHOUSE GASES: CO2 FROM ENERGY PER TONNE OF PRODUCTION
117.41kg2010: 133.59kg
WATER: WATER PER TONNE OF PRODUCTION
2.48m3
2010: 2.68m3
WASTE: TOTAL WASTE PER TONNE OF PRODUCTION
4.77kg2010: 6.48kg
SUSTAINABLE SOURCING: PALM OIL PURCHASES FROM SUSTAINABLE SOURCES
64%2010: 37%
BETTER LIVELIHOODS: NUMBER OF SHAKTI ENTREPRENEURS
45,0002010: 45,000
PEOPLE: TOTAL RECORDABLE ACCIDENT FREQUENCY RATE
1.26per 1m hours worked
2010: 1.63 per 1m hours worked
Unilever Annual Report and Accounts 2011
Report of the Directors About Unilever
Basis of reporting: our accounting policies are in accordance with International Financial Reporting Standards (IFRS) as adopted by the European Union (EU) and as issued by the International Accounting Standards Board (IASB), as well as United Kingdom and Dutch law. Certain measures used in our reporting are not defined under IFRS or other generally accepted accounting principles. For further information about these measures, and the reasons why we believe they are important for an understanding of the performance of the business, please refer to our commentary on non-GAAP measures on pages 26 and 27.* Further details of our key financial indicators can be found in our financial review starting on page 20.† These key non-financial indicators form part of the Unilever Sustainable Living Plan. 2011 data is preliminary. It will be independently assured by the end of
June 2012 and reported in the online version of the Unilever Sustainable Living Plan report 2011 at www.unilever.com/sustainability.
Unilever Annual Report and Accounts 2011
Report of the Directors About Unilever
7
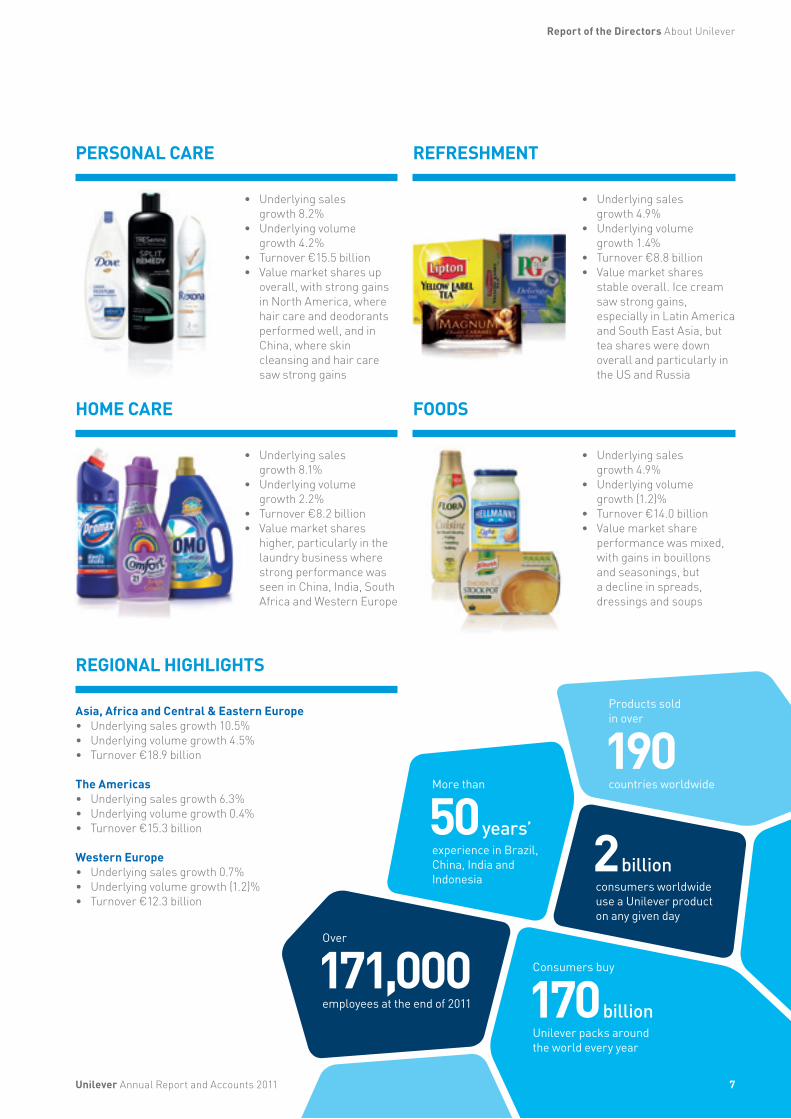
PERSONAL CARE
• Underlying sales growth 8.2%
• Underlying volume growth 4.2%
• Turnover €15.5 billion • Value market shares up
overall, with strong gains in North America, where hair care and deodorants performed well, and in China, where skin cleansing and hair care saw strong gains
REFRESHMENT
• Underlying sales growth 4.9%
• Underlying volume growth 1.4%
• Turnover €8.8 billion • Value market shares
stable overall. Ice cream saw strong gains, especially in Latin America and South East Asia, but tea shares were down overall and particularly in the US and Russia
HOME CARE
• Underlying sales growth 8.1%
• Underlying volume growth 2.2%
• Turnover €8.2 billion • Value market shares
higher, particularly in the laundry business where strong performance was seen in China, India, South Africa and Western Europe
FOODS
• Underlying sales growth 4.9%
• Underlying volume growth (1.2)%
• Turnover €14.0 billion • Value market share
performance was mixed, with gains in bouillons and seasonings, but a decline in spreads, dressings and soups
REGIONAL HIGHLIGHTS
Asia, Africa and Central & Eastern Europe• Underlying sales growth 10.5%• Underlying volume growth 4.5%• Turnover €18.9 billion
The Americas• Underlying sales growth 6.3%• Underlying volume growth 0.4%• Turnover €15.3 billion
Western Europe• Underlying sales growth 0.7%• Underlying volume growth (1.2)%• Turnover €12.3 billion
Products sold in over
190countries worldwide
50 years’
More than
experience in Brazil, China, India and Indonesia
2 billionconsumers worldwide use a Unilever product on any given day
171,000Over
employees at the end of 2011
Consumers buy
170 billionUnilever packs around the world every year

8
OUR BUSINESS MODEL FOR SUSTAINABLE GROWTH
VISIONOur vision is to double the size of Unilever while reducing our environmental footprint. The two elements of this are interlinked. Our growth ambition is dependent on operating sustainably. These two aspects of the vision shape and form our business model.
EXTERNAL CONTEXTWhen we wrote in our previous report that 2011 would be challenging, we could not have known how right that prediction would be. The world has been through a year of almost unprecedented turmoil and uncertainty, and is facing some serious challenges. This in turn frames the way we must manage our business and the issues we face.
Short-term economic pressures have dominated 2011, with major instability in the Eurozone and a weak recovery by the US economy. Stubbornly high unemployment in many developed markets has created a continued squeeze on consumer spending. Commodity prices have been volatile and many have risen sharply. And the operating environment in emerging markets has seen increasing focus from competitors who all know that business success depends on driving growth in these markets.
2011 also saw a tragic series of natural disasters, from the earthquake and tsunami in Japan to the famine in the Horn of Africa. Each one required a response from us at a humanitarian, employer and operational level.
Furthermore, the interdependent challenges of food security, poverty reduction, sustainability of resources, climate change and social and economic development have never been greater.
We believe that many of these factors will continue for the medium term, and that this level of volatility and uncertainty is the ‘new normal’. Our business model has been evolved as a response to this operating environment, as we address the prospect of another 2 billion people on the planet by 2050.
THE UNILEVER SUSTAINABLE LIVING PLANIn order to live within the natural limits of the planet there is no option but to decouple growth from social and environmental impact. The Unilever Sustainable Living Plan (USLP) sets out our path to achieving this. It includes around 60 targets and embraces all aspects of our own operations, going beyond them to the entire lifecycle of our products. Innovation and technology will be key to achieving our goals. Equally important will be our ability to change consumer behaviour.
The USLP will result in three big outcomes:
1We will help
billionpeople impro
ve their health and well-being
hWe w
aill
tlve
he environmental footprint of our products
1We
0 will
0source
%of agricultural r
aw materials sustainably
Report of the Directors About Unilever
Unilever Annual Report and Accounts 2011

BUSINESS MODELOur aim is to deliver growth. But not growth at any cost – rather a new sustainable and equitable form of growth. Strong business performance is driven by our brands, people, and sustainability – which is increasingly giving us a true competitive advantage. We will invest in strengthening our brands so that they drive profitable growth as part of a sustainable business model: the more we sell, the more efficiently we can operate and, at the same time, by reducing the cost of running our business we can invest more in our brands, innovations, and advertising and promotions. This, in turn, enables us to sell more.
As a FMCG (fast-moving consumer goods) company, our business model centres on building GREAT BRANDS
which consumers know, trust, like, and buy in conscious preference to competitors’ products. Our
brands command loyalty and affinity and deliver superior performance. They help consumers to
perform simple but essential everyday tasks. Innovation is nourishment for our brands. It
helps to deliver superiority, increases our competitiveness and allows us to appeal
to the widest range of consumers. Increasingly, our innovations are
designed to enable sustainable living.
As a major employer, our business model is rooted in our people. We have a distinctive set of values and they attract people who bring a sense of purpose to their work. We reward in line with performance and create a climate where people are incentivised to excel. We develop leadership capabilities early and place priority on building tomorrow’s leaders today. All this combines to build a business of GREAT PEOPLE.
A further element of our business model is SUSTAINABLE LIVING. External factors will move it from being the choice of a concerned few to a new norm for billions in this decade. Companies who move quickly to enable it can seize major competitive advantage by doing so. Our aim is to help people move to a more sustainable way of using our products and reduce the current rate of consumption of scarce resources.
Our business model is designed to deliver SUSTAINABLE GROWTH, where sustainable means four things: • it is consistent;• it is competitive;• it is profitable; and • it meets major social and environmental needs.
Report of the Directors About Unilever
Unilever Annual Report and Accounts 2011
BUSINESS STRATEGYOur vision and other elements of our business strategy are articulated in ‘the Compass’, which was developed in 2009 and has remained a constant guide and touchstone for all our employees. Key elements of it are elaborated on in the following pages.
OUR VISION IN ACTION MEANS THAT, IN FUTURE, EVERY TIME CONSUMERS
CHOOSE A UNILEVER PRODUCT, IT IMPROVES
THEIR LIFE, THEIR COMMUNITY AND THE
WORLD WE ALL SHARE.
9
10
WINNING WITH BRANDS AND INNOVATIONUnilever owns some of the world’s best known and best loved brands. But ensuring they maintain their place in people’s lives requires us to innovate, improve and expand our brands every day.
Superior products, design, branding and marketing
At heart, our strategy with brands and marketing is simple: discover what consumers want and give it to them. But consumer needs are complex, and people are increasingly concerned about sustainability as well as functionality. The improvements we make to our products and the developments in our portfolio must be led by these needs if we are to beat our competitors at the point of sale.
For us, the product is the hero, and we focus on what’s important: striving towards sustainable products that consumers prefer.
We operate a rigorous system of testing our products against their main rivals in every key market to ensure we deliver the attributes that consumers want. Whether it’s toothpaste in India, tea bags in Russia, laundry liquids in Turkey or bouillon in South Africa, we want to find out what consumers desire from our products, whether they prefer them and why. Is it the taste, the fragrance, the cleaning properties or the packaging?
We conduct a careful analysis of what it is about a product that consumers are searching for.
Bigger, better, faster innovation
Science is one of the key drivers of Unilever’s continuing success. We invest in research and development (R&D) to make sure we are first with the innovations that will make our brands bigger, better and more profitable. Central to innovation is our Genesis programme, an R&D process set up in 2009 which fuels our longer-term pipeline, applying breakthrough technology across categories. The programme is delivering results and we are already seeing some of these innovations in the market.
For example, we’ve discovered how to extract and preserve the essence of freshly picked tea leaves, a complicated piece of science which is already being used in our PG Tips and Lipton Yellow Label ranges to give a unique fresh taste. In PG Tips that innovation is coupled with our unique pyramid-shaped bags to make an even better cup of tea.
Another example is Rexona for Women with Motionsense technology. Rexona has long been one of the world’s biggest deodorant brands. We know from our consumer understanding that people love its performance and, most importantly, its fragrance.
However, as with all deodorants, the fragrance slowly faded over the course of the day. The conventional wisdom was that there was nothing that could be done about that, but we developed a new technology to combat the problem. We introduced Motionsense technology in 2011 with Rexona deodorant products. It’s a new way of wrapping the fragrance up in tiny bundles that open slowly throughout the day when the body moves, releasing it when it’s most needed. Subsequent testing showed that this gives Rexona a clear win over its key competitors.
No matter how confident we are that our products deliver on what we claim, we need to give consumers and regulators strong proof to underscore this. This is just as important when trying to get a government to back a handwashing programme as it is when advertising a face cream. We have a clinicals organisation in place with leading-edge
No1.hair care supplier in South Africa
Commitment to source
2all ag
0ricu
materials
2ltura
0l raw
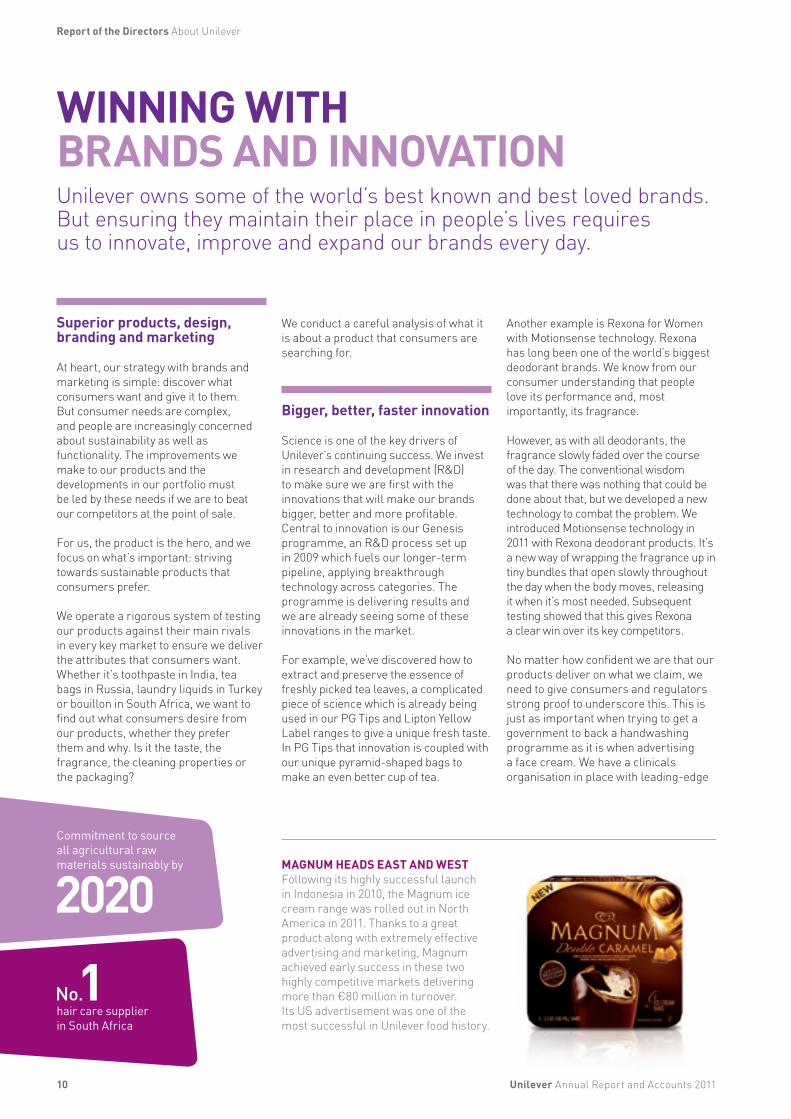
sustainably by MAGNUM HEADS EAST AND WEST Following its highly successful launch in Indonesia in 2010, the Magnum ice cream range was rolled out in North America in 2011. Thanks to a great product along with extremely effective advertising and marketing, Magnum achieved early success in these two highly competitive markets delivering more than €80 million in turnover. Its US advertisement was one of the most successful in Unilever food history.
Unilever Annual Report and Accounts 2011
Report of the Directors About Unilever
Unilever Annual Report and Accounts 2011
Report of the Directors About Unilever
11
expertise in clinical protocols, trials, analysis and data management that allows us to substantiate the claims we make for our products.
Getting the best ideas – wherever they areOur world-class R&D facilities are constantly making breakthroughs that keep Unilever at the forefront of product development. Integral to the way we work are partnerships with universities, scientists, large and small companies and entrepreneurs. This ‘open innovation’ approach allows us to source the best ideas from across the world and contributes towards more than half the value of our innovation pipeline, allowing us to grow together with our partners. In 2011, around 500 partners had one or more of our projects under development.
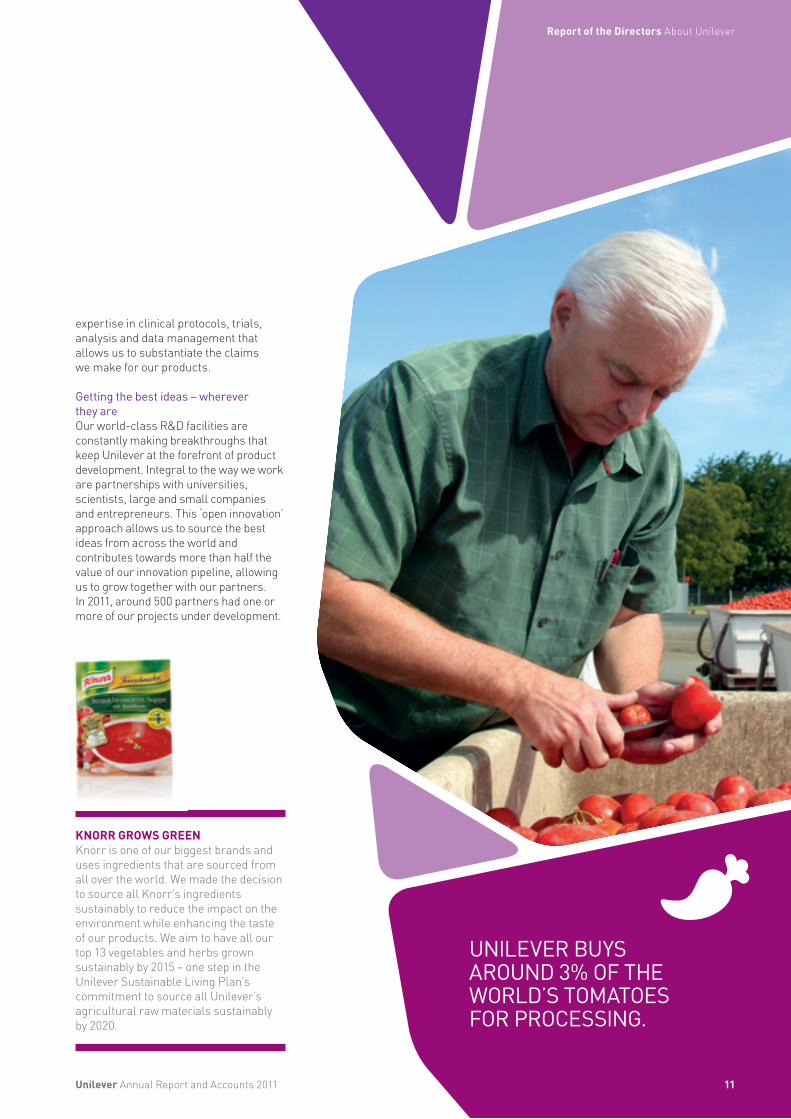
KNORR GROWS GREENKnorr is one of our biggest brands and uses ingredients that are sourced from all over the world. We made the decision to source all Knorr’s ingredients sustainably to reduce the impact on the environment while enhancing the taste of our products. We aim to have all our top 13 vegetables and herbs grown sustainably by 2015 – one step in the Unilever Sustainable Living Plan’s commitment to source all Unilever’s agricultural raw materials sustainably by 2020.
UNILEVER BUYS AROUND 3% OF THE WORLD’S TOMATOES FOR PROCESSING.

Unilever Annual Report and Accounts 201112
PNEUMONIA AND DIARRHOEA ARE TWO OF THE BIGGEST CAUSES OF DEATHS AMONG CHILDREN UNDER FIVE YEARS OLD, ACCOUNTING FOR ONE THIRD OF CHILD DEATHS.◊
HANDWASHING WITH SOAP IS ONE OF THE MOST EFFECTIVE AND INEXPENSIVE WAYS TO PREVENT THIS.◊ Source: UN
LIFEBUOY HELPS SAVE LIVES To help achieve a core commitment of the Unilever Sustainable Living Plan, the Lifebuoy brand has launched a programme to bring hygiene education to a billion people. It’s called the School of Five and it’s already been launched in seven countries where we’re working with governments and NGOs to get across our vital message of developing a habit of washing hands on five occasions a day. In Vietnam it’s even become part of the school curriculum. The results are healthier children and 4.1% volume growth for Lifebuoy in Vietnam.
Unilever Annual Report and Accounts 2011
Report of the Directors About Unilever
13
WINNING WITH BRANDS AND INNOVATION continued
In addition, we have been working with our strategic suppliers to develop co-innovation programmes and to ensure that they bring great ideas to Unilever first.
Applying knowledge across the businessOne of our key strengths is how we quickly leverage ideas across our geographies, categories and brands, which allows us to focus investment and resources more wisely and efficiently – for example, taking the fragrance technology expertise we used to improve Rexona and applying it to Skip detergent.
Reaching more consumers
To grow, we need to reach more consumers with our products and we are well placed to do so. For example, we can take brands into markets that many companies do not have the resources and experience to develop. In 2011, consistent with our strategy of making bolt-on acquisitions to strengthen our portfolio in key countries and categories, Unilever acquired Alberto Culver, helping accelerate our transition to becoming one of the world’s leading personal care businesses.
New markets, new opportunitiesThe Alberto Culver acquisition gave us brands such as TRESemmé, VO5 and
Simple. TRESemmé already had a strong presence as a premium shampoo in North America and Western Europe, but it was unknown in the world’s second biggest hair care market: Brazil.
Within days of completion, Unilever began work on an ambitious plan to take the TRESemmé brand to Brazil. As a business we have wide experience of rolling out brands into new markets across the world and, coupled with our new agile structure, this ensured a swift, successful launch. TRESemmé was launched in Brazil less than six months after the acquisition completed. We’re already seeing considerable success in that market.
And the same is happening all over the world. With brands including TRESemmé, Dove and Suave, in 2011 we reinforced our position as a leading hair care supplier in the US, and achieved similar success on the other side of the Atlantic by taking the number one position in South Africa.
We’re continuing with our acquisition strategy and bought a controlling stake in Concern Kalina, one of the leading local personal care companies in Russia. Success here would establish Unilever as a key player in a big emerging market, as well as giving us invaluable knowledge of local supply and distribution.
Growing in developed markets Our aim is to grow in developed markets too. For example, we re-launched Domestos in Western Europe in 2011 on the back of new technology that allows the product to cling to the toilet, for longer lasting germ kill. In Personal Care, we accelerated the launch of Mentadent Total oral care range in Italy to take on the fierce local market, ahead of the global re-launch.
Looking ahead
Our Dove brand is a great example of Unilever’s ability to get it right with brands and innovation. In 2011 Dove became our first €3 billion Personal Care brand. This success has been made possible by focusing on three key objectives: better marketing – making Dove a premium brand; better innovation – for example, applying our leading-edge expertise to Dove hair care; and expansion into new markets, as with the Dove Men+Care range.
Already Unilever has new innovations, new patents, new brands and new markets in the pipeline for 2012. And every day we’re working on ways to make our brands the best, most innovative and most agile in the world.
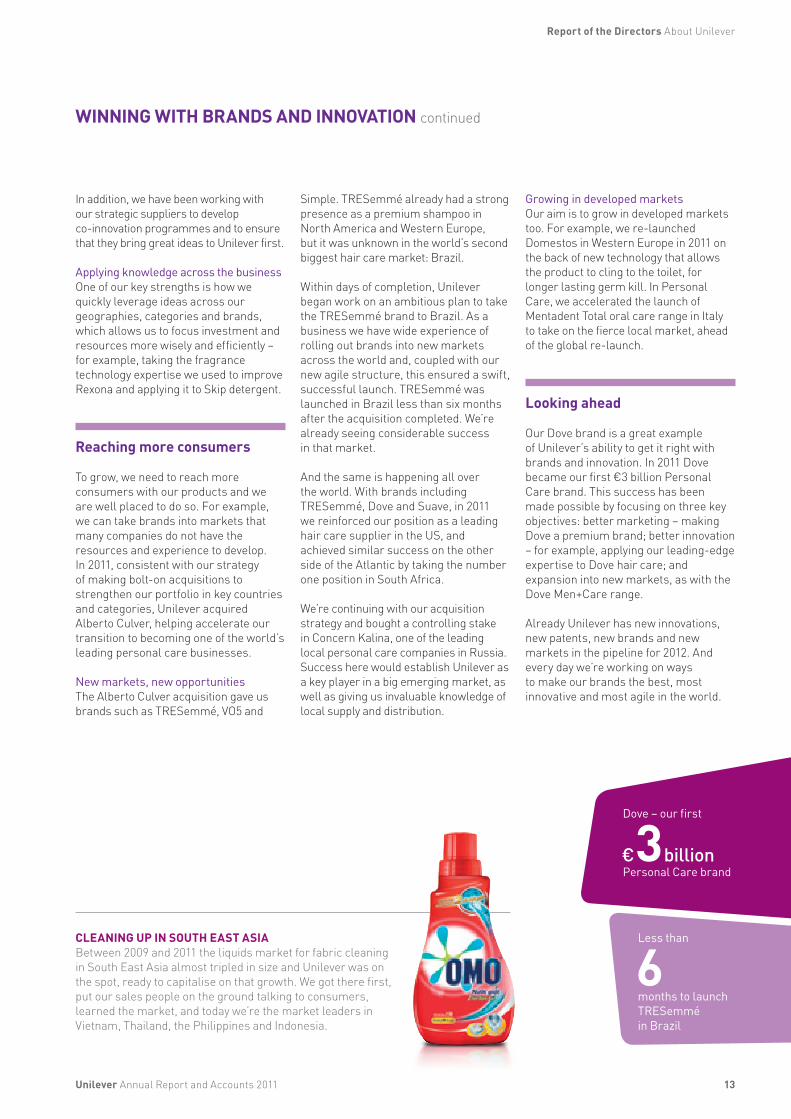
CLEANING UP IN SOUTH EAST ASIABetween 2009 and 2011 the liquids market for fabric cleaning in South East Asia almost tripled in size and Unilever was on the spot, ready to capitalise on that growth. We got there first, put our sales people on the ground talking to consumers, learned the market, and today we’re the market leaders in Vietnam, Thailand, the Philippines and Indonesia.
Dove – our first
€3 billionPersonal Care brand
Less than
6months to launch TRESemmé in Brazil
Unilever Annual Report and Accounts 2011
Report of the Directors About Unilever
14
WINNING IN THE MARKET PLACEBy 2020, the world’s population is expected to reach 7.6 billion, and we aim to reach a significant number of these consumers with our brands. Our biggest opportunity lies in addressing all consumer needs across all markets – and we’re already finding new ways to do so.
Driving growth through market development
Growth through market development means reaching more users, creating more usage and delivering more benefits to consumers everywhere.
Already, 2 billion consumers worldwide use our products on any given day. We want to increase this substantially by 2020 and we will do this by:• reaching up (offering premium
brands to more affluent consumers);• reaching down (making our products
more affordable and accessible for consumers on lower incomes); and
• reaching wide (taking our brands to new geographies like Central Africa, to new consumer segments like male grooming and to new channels like e-commerce).
This approach is reaping rewards. In 2011 we continued rolling out our market development model to ensure a consistent approach across our markets. We proved this approach first in Asia and then in Latin America; now we are using it elsewhere to grow our markets by changing people’s habits
and helping them find new ways to use our products.
For example, in 2011 we grew the Magnum Mini range by 8.8% in the UK by offering consumers an ice cream in a smaller version of a standard Magnum, more suitable for eating at home. And in South East Asia, laundry liquids grew by 9.3% as consumers traded up from powder.
In 2012, we will continue to target new consumers in new ways. Reaching up, we will compete for share in the fast-growing beauty segment by rolling out premium offerings such as Toni & Guy, Axe Hair, Dove Men+Care and Pond’s Anti Aging premium range to more markets.
We will reach down in developed markets to financially pressured shoppers. In 2011, our highly successful launch of new pack sizes across many brands in the UK allowed retailers to sell our products at £1. In emerging markets, we will continue to offer small, affordable product sizes of our brands.
We will reach wide through our expansion in Africa, leading the market
development of savoury, laundry and skin cleansing with great brands such as Knorr, Sunlight detergent and Lifebuoy.
Growing sustainably with customers
All over the world we are helping our retail partners to grow sustainably, combining scale with local knowledge. In Mexico for example, in 2011 we worked alongside Walmart to improve the supply chain for their Superama retail chain.
We also worked closely with drug store customers, resulting in our highest recorded underlying sales growth of 9.2% in 2011 in this channel.
Working with global retailers is essential for growth, but some markets require a different approach – India, for example, where reaching consumers is still about the local small shop. Through the Shakti programme, we have expanded a direct distribution network of micro-entrepreneurs who sell our products, doubling their household income in the process (see picture story on page 15).
3 millionshops signed up to our ‘Perfect Store’ programme
9.3%growth in laundry liquids in South East Asia
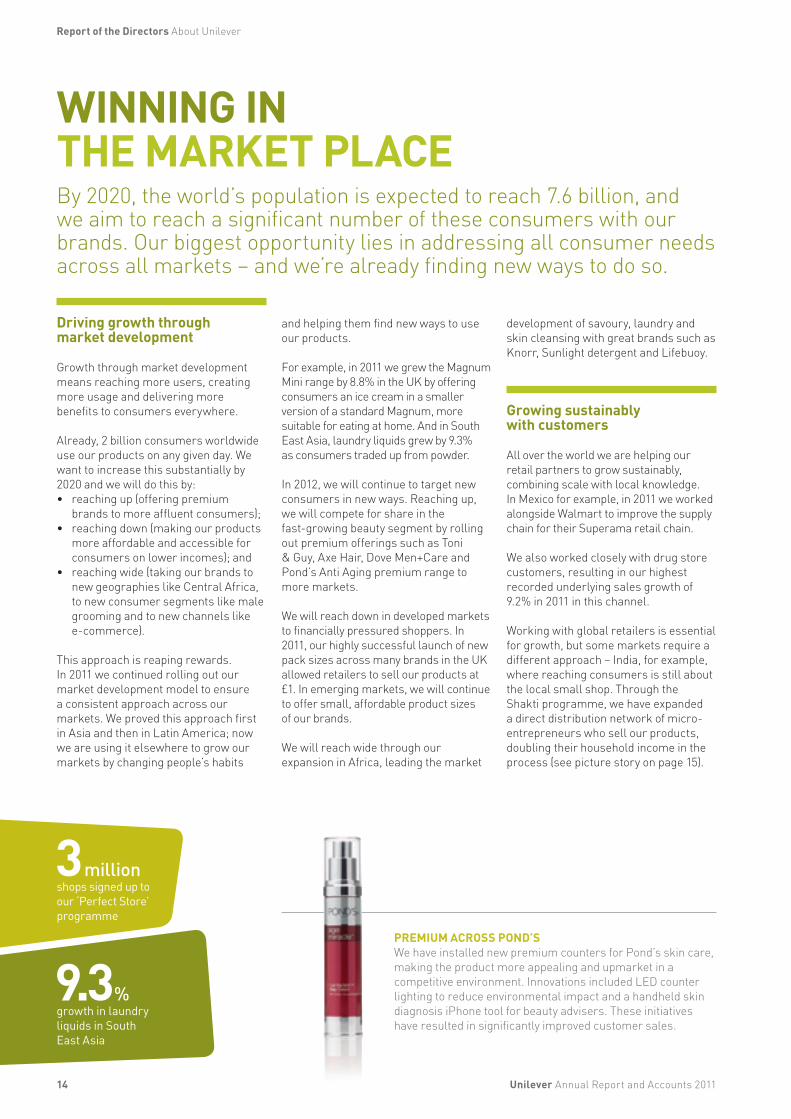
PREMIUM ACROSS POND’S We have installed new premium counters for Pond’s skin care, making the product more appealing and upmarket in a competitive environment. Innovations included LED counter lighting to reduce environmental impact and a handheld skin diagnosis iPhone tool for beauty advisers. These initiatives have resulted in significantly improved customer sales.

15Unilever Annual Report and Accounts 2011
Report of the Directors About Unilever
15
Focusing on shoppers
We are now focusing much more closely on marketing to shoppers in the store. We continue to concentrate on ‘sales fundamentals’ – standards which measure our in-store performance in an increasing number of markets.
Meanwhile, our ‘Perfect Store’ programme is creating optimal merchandising layouts for retailers, regardless of geography or space. By the end of 2011 more than 3 million shops had already signed up to our ‘Perfect Store’ programme. We know the strategy is working – in the Philippines, for example, our audit of 3,800 stores showed that the ‘Perfect Store’ format is growing faster than those outside the programme. And in Germany, the ‘Perfect Store’ programme boosted the entire savoury category, with sales of Knorr products significantly outpacing category and competitor growth.
GROWING BUSINESS, GROWING LIVELIHOODS Project Shakti – meaning ‘strength’ in Sanskrit – is our distribution programme in India, creating opportunities for micro-entrepreneurs to sell our products in rural areas, enabling them to bring in extra money to support their families and earn respect within society. We employ around 45,000 female entrepreneurs, helping our brands reach over 100,000 villages. In addition, more than 30,000 male members of Shakti families are now involved, cycling to surrounding villages to sell Unilever products. As well as supporting the Unilever Sustainable Living Plan’s goal to enhance livelihoods, local distribution programmes such as this have added around €80 million in incremental turnover.
OUR DOOR-TO-DOOR SELLING OPERATION IN INDIA PROVIDES OPPORTUNITIES FOR BETTER LIVELIHOODS, HELPING COMMUNITIES AND OUR BUSINESS.
16 Unilever Annual Report and Accounts 2011
Report of the Directors About Unilever
WINNING THROUGH CONTINUOUS IMPROVEMENTSmall actions can make a big difference. Our focus on operational excellence – doing everything better, every day – is bringing consumers better quality and service, while substantial savings and better environmental performance are ensuring that growth is truly sustainable.
Lean, responsive, consumer-led
Consumer needs are changing and developing rapidly. To continue to meet them, we must take things we already do well – like high quality products and excellent service – and do them even better, faster and more efficiently.
Better qualityAlmost a century ago, Lever Brothers offered consumers a £1,000 reward if they could show that their soap was anything less than ‘perfectly pure, genuine and unadulterated’. Consumer-perceived quality driving sustainable growth remains at the heart of Unilever today. We are systematically improving the quality of our products. In 2011, consumer complaints per million units fell by 19% and product quality incidents more than halved.
For example, we listened to feedback from consumers about Lifebuoy soap, and improved its fragrance and bar structure, resulting in a 0.8% market share growth in the global skin cleansing market in 2011.
Better choiceThrough our on-shelf availability (OSA) programme, we work with retailers to improve our service to them, and their service to the shopper – making our products available more of the time.
In 2011, stores in our OSA programme reduced empty shelves by 27%. We are expanding this programme to other customer channels and geographies.
Better serviceOur supply chain combines the advantages of global scale with local agility. Our reach, particularly in emerging markets, is a significant competitive advantage, and we are constantly seeking ways to differentiate our supply chain. In 2011, for example, in Indonesia we created a dedicated supply chain for a selection of beauty products that more than doubled our sales for these products.
And when floods hit Thailand, our teams moved quickly to protect our people, factories and stocks – carrying our products directly to customers’ shops. Unilever Thailand was ranked number one in the Advantage 2011 Customer Satisfaction Survey.
Agile and cost-competitive
We are making our operations more responsive to changes in demand, enabling us to optimise our capital investment, launch products more quickly and win market share. In 2011, for example, we delivered on our
objective to increase the speed of factory building, saving up to 25% of build time on large factories (see picture story on page 17). Meanwhile, we never lose sight of the importance of reducing costs and conserving cash. Better margins We look for improvements at every link in the value chain. Wherever we find savings, we aim to replicate them. This philosophy helped us to deliver record savings of €1.3 billion in 2011.
Managing cash We continued to have negative working capital in 2011 and aim to bring stocks down further in the future through continuous improvement of our business planning processes.
Partnerships with suppliersWe spent well over €30 billion on goods and services in 2011, and our suppliers are vital partners in our sustainable growth ambitions. We work with them to create better, faster innovations – and our suppliers are investing up to €1.3 billion to guarantee capacity for our future growth.
In line with our commitments in the Unilever Sustainable Living Plan, we increased the amount of agricultural raw materials obtained from sustainable sources.
€6.1 billionspent on advertising and promotion in 2011
No.1in customer satisfaction survey in Thailand
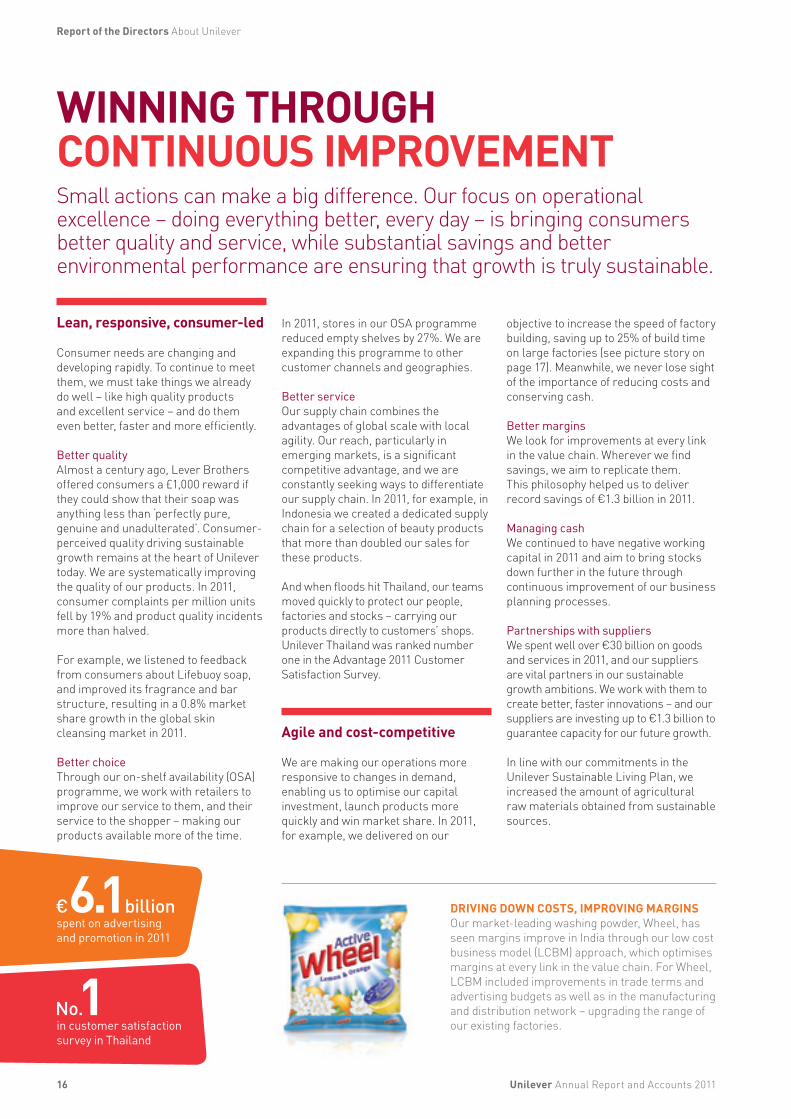
DRIVING DOWN COSTS, IMPROVING MARGINS Our market-leading washing powder, Wheel, has seen margins improve in India through our low cost business model (LCBM) approach, which optimises margins at every link in the value chain. For Wheel, LCBM included improvements in trade terms and advertising budgets as well as in the manufacturing and distribution network – upgrading the range of our existing factories.
17Unilever Annual Report and Accounts 2011
Report of the Directors About Unilever
17
Driving return on brand support
We spent €6.1 billion on advertising and promotion in 2011 with every brand, in every category, in every market focusing on the best possible returns.
Global scale, local agilityBy evaluating the effectiveness of our marketing better, and rapidly adopting new cost-effective models that make us more competitive, we have been able to drive down advertising production and fees globally, reducing our overall spending in this area by more than €128 million. And we see equal potential for savings in local markets.
In Russia, Ukraine and Belarus alone, we released €19 million for investment through an operational excellence drive that included improving customer management, using handheld computers to track in-store performance and order sizes, and improving the tracking of our point-of-sale materials.
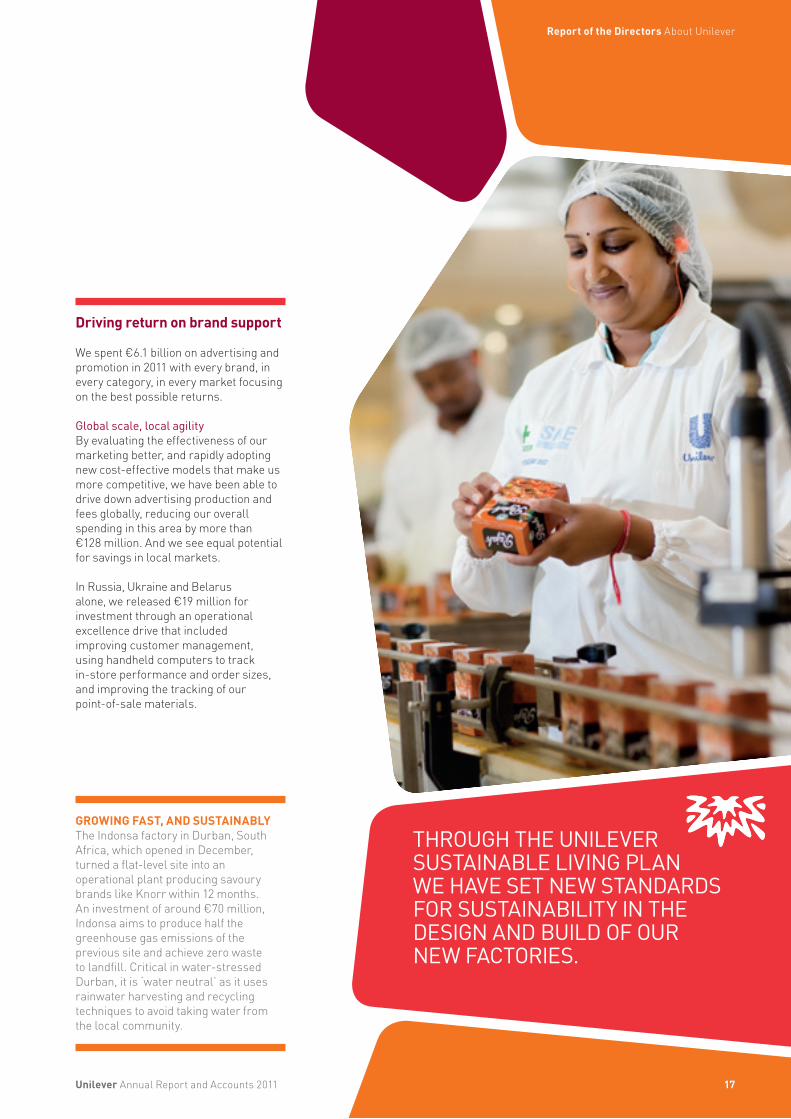
GROWING FAST, AND SUSTAINABLY The Indonsa factory in Durban, South Africa, which opened in December, turned a flat-level site into an operational plant producing savoury brands like Knorr within 12 months. An investment of around €70 million, Indonsa aims to produce half the greenhouse gas emissions of the previous site and achieve zero waste to landfill. Critical in water-stressed Durban, it is ‘water neutral’ as it uses rainwater harvesting and recycling techniques to avoid taking water from the local community.
THROUGH THE UNILEVER SUSTAINABLE LIVING PLAN WE HAVE SET NEW STANDARDS FOR SUSTAINABILITY IN THE DESIGN AND BUILD OF OUR NEW FACTORIES.
18
WINNING WITH PEOPLEOur growth ambitions demand that our organisation has a structure and culture that make us fit to win in a fast-changing environment. Above all, they require us to find and develop the world’s best talent and leaders – a challenge we are striving to meet.
Leverage our operating framework for competitive advantage
Success in the future will depend on being lean, agile and competitive in a resource-challenged world. In three years, we have transformed our structure to enable us to move faster, innovate better and take full advantage of our global scale.
More focused categoriesDuring 2011 we started to move from 11 product categories to four: Foods, Refreshment, Home Care, and Personal Care. This streamlining makes our decision-making faster, lets us share best practice more effectively, and creates greater scale for innovation and sustainability initiatives.
Getting closer to the consumerWe are also moving from 22 geographical clusters to eight. The clusters – six of them primarily in emerging markets – allow us to focus more closely on the consumer, help us spot wider opportunities, and create regional economies of scale.
Our global function network, including IT, Finance, R&D, Supply Chain and HR, further drives the benefits of scale and shared best practice.
Organisation and diverse talent pipeline ready to match our growth ambitions
Attracting, developing and retaining talent is essential if we are to meet our ambitions. We constantly audit the skills and leadership that will be needed across every cluster and in our key global functions to achieve our ambition of doubling the size of the business while reducing our environmental impact.
Seeking talent globallyThe talent we need will come from all over the world. We’ve introduced global standards for graduate recruitment, so that people have the same experience wherever they start. We have targeted universities, particularly in emerging markets, with our campus recruitment programme. In 2011, we were recognised as the most preferred graduate FMCG (fast-moving consumer goods) employer in 14 countries.
Developing leadersWe are expanding our Unilever Leadership Development Programme to deliver high quality training to more managers. All our senior leaders have been through the programme and are now mentoring our next generation of leaders. In 2011, we began building our
Four Acres leadership facility in Singapore (see picture story below) – reinforcing our presence in emerging markets.
Furthering diversity Our consumers come from every background, nationality and social group, and we want our people to reflect that diversity. Over the past few years, we have focused on improving the representation of women in the workplace. Today, 30% of our Non-Executive Directors are women, and the proportion of women in senior positions rose from 23% in 2007 to 28% in 2011. In our annual Global People Pulse Survey, gauging managers’ views of the company, approval of our diversity and inclusion measures rose by four percentage points in 2011 to reach 83%, well above the external benchmark of 74%.
Performance culture which respects our values
We are building a winning culture, in which every employee is encouraged to grow to his or her full potential. We have developed a new performance-based reward structure that recognises
86%of managers proud to work for Unilever
Most preferred
1gra
4duate FMCG
employer in
countries
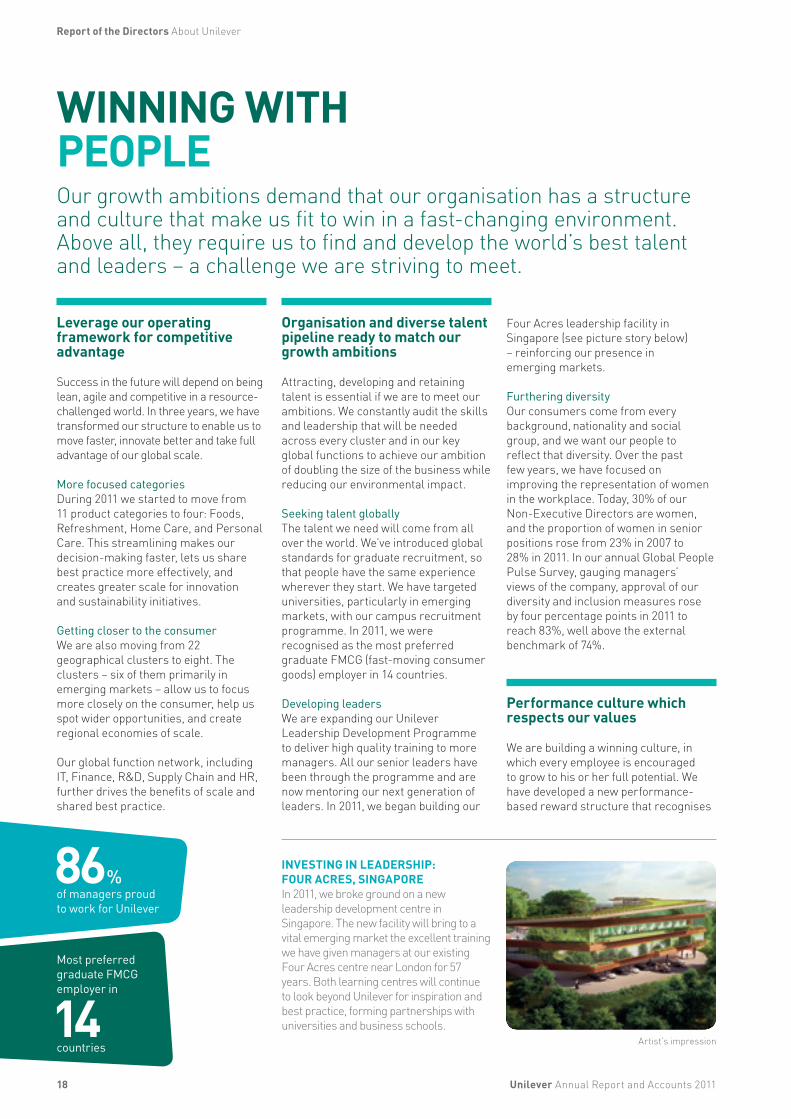
INVESTING IN LEADERSHIP: FOUR ACRES, SINGAPORE In 2011, we broke ground on a new leadership development centre in Singapore. The new facility will bring to a vital emerging market the excellent training we have given managers at our existing Four Acres centre near London for 57 years. Both learning centres will continue to look beyond Unilever for inspiration and best practice, forming partnerships with universities and business schools.
Unilever Annual Report and Accounts 2011
Report of the Directors About Unilever
Artist’s impression

Unilever Annual Report and Accounts 2011 19
Report of the Directors About Unilever
SAFETY IS ESSENTIAL The health, safety and well-being of everyone working for or on behalf of Unilever are of the utmost importance to us. A key measure of progress, set out in the Unilever Sustainable Living Plan, is our total recordable accident frequency rate, which counts all employee workplace accidents except those requiring only simple first aid treatment. There was a 22.7%† reduction in our total recordable accident frequency rate in 2011.
† 2011 data is preliminary. It will be independently assured by the end of June 2012 and reported in the online version of the Unilever Sustainable Living Plan report 2011 at www.unilever.com/sustainability.
people who not only have delivered results, but also have the right values for our business.
Clear goal-settingWe have changed the way we set goals for our employees to ensure clear direction on priorities and responsibilities. Closer measurement of performance has allowed us to introduce more differentiation into the way we reward people – further encouraging excellence.
Encouraging learningIn 2011 the Unilever Learning Academy, established in December 2010, had more than 128,000 employees registered for its e-learning and classroom courses, giving access to over 7,600 training modules.
Listening to our peopleOur 2011 Global People Pulse Survey also confirmed that we are making progress in developing a performance culture. 86% of our managers are ‘proud to say they worked for Unilever’ and our overall performance culture index rose by 4%.
CHANGE IN OUR HANDS: TANZANIAUnilever uses trucks to sell shop-to-shop to retailers in Tanzania’s capital, Dar es Salaam. When company driver Issa John Mgumba saw that the sales vehicles didn’t look the part, he identified the opportunity to smarten them up, transforming them into a fleet that he and his colleagues would be proud to drive. Improvements included enlivening the vehicles with vinyl stickers – costing just €300 in total – that grab people’s attention and promote Unilever’s brands. Small actions like Issa’s all add up to making a big difference, helping to grow our business wherever we are. “He feels that he really owns the business with a real stake in the long-term success of the company,” said country Customer Development Manager Martin Kariuki.
CONSTANTLY LOOKING FOR EFFECTIVE WAYS TO HELP GROW SALES AND INCREASE PRIDE IN THE BUSINESS IS KEY TO SUCCESS.

20 Unilever Annual Report and Accounts 2011
Report of the Directors About Unilever
FINANCIAL REVIEW 2011The virtuous circle of growth is starting to work for us. We have successfully accelerated our growth and at the same time have continued the steady and sustainable expansion of operating profit.
Delivering against our priorities
Underlying sales growth ahead of our markets, with volumes broadly in lineMarkets continued to grow in value in 2011, with double digit growth in emerging markets and mid single digit growth overall. Market volume growth has slowed however, reflecting the impact of rising prices and weak consumer confidence especially in Western Europe and North America.
Against this background, underlying sales growth of 6.5% was a strong performance. It was growth ahead of our markets, and was driven by outstanding performance in emerging markets and in the Home Care and Personal Care categories. In Foods and Refreshment, whilst price increases have impacted volumes, growth was in line with relevant markets and several key businesses gained share. Volume growth overall was 1.6%, a step down from 2010 but broadly in line with our markets. Price growth of 4.8% was ahead of our markets as we increased prices more than others in a number of categories.
Performance was particularly strong in emerging markets, which delivered underlying sales growth of 11.5%, a significant proportion of this from volume. Double digit growth was achieved in a wide range of countries including China, India, Turkey, South Africa and Mexico.
Growth continued to be driven by innovation, with good progress in the year in rolling out bigger innovations more quickly across more markets. The launch of new brands into new markets was also accelerated and acquisitions played an important role, with Alberto Culver performing particularly strongly.
Underlying operating margins protected in a difficult environmentUnderlying operating margin for the year was 14.9%, down slightly on the 15.0% achieved in 2010. In the context of substantial cost inflation and depressed consumer demand in the developed world we have built market shares and held margins to within 0.1% of the prior year, reflecting the strength of our business.
Gross margin was down by 1.8% at constant currency, reflecting unusually high levels of cost inflation. Strong pricing and excellent savings delivery were achieved in the year, but these were insufficient to fully compensate for the level of cost inflation suffered.
The lower gross margin was largely mitigated by overheads, where outstanding progress in savings programmes reduced the impact on margin by 1.0% for the year at constant currency. Although part of this reduction was one-off, the various continuous improvement initiatives across the business have been a major success, resulting in accelerated savings in a wide range of areas.
Advertising and promotions expenditure increased by €150 million, but was 0.7% lower as a percentage of turnover, at constant currency.
Healthy cash delivery Cash generation was healthy, with free cash flow of €3.1 billion. This was below the 2010 figure of €3.4 billion, the difference largely reflecting a significant step up in net capital expenditure to €2.0 billion, due to capacity expansion in the fast-growing emerging markets.
The net working capital movement was a small cash outflow in 2011. This related to a series of financial items, with no significant movement in trade working capital, which has now been negative overall for nine consecutive quarters.
Key positive drivers of cash flow in 2011 were improved operating profit, which contributed around €0.1 billion, and income tax payments, €0.1 billion lower.
21Unilever Annual Report and Accounts 2011
Report of the Directors About Unilever
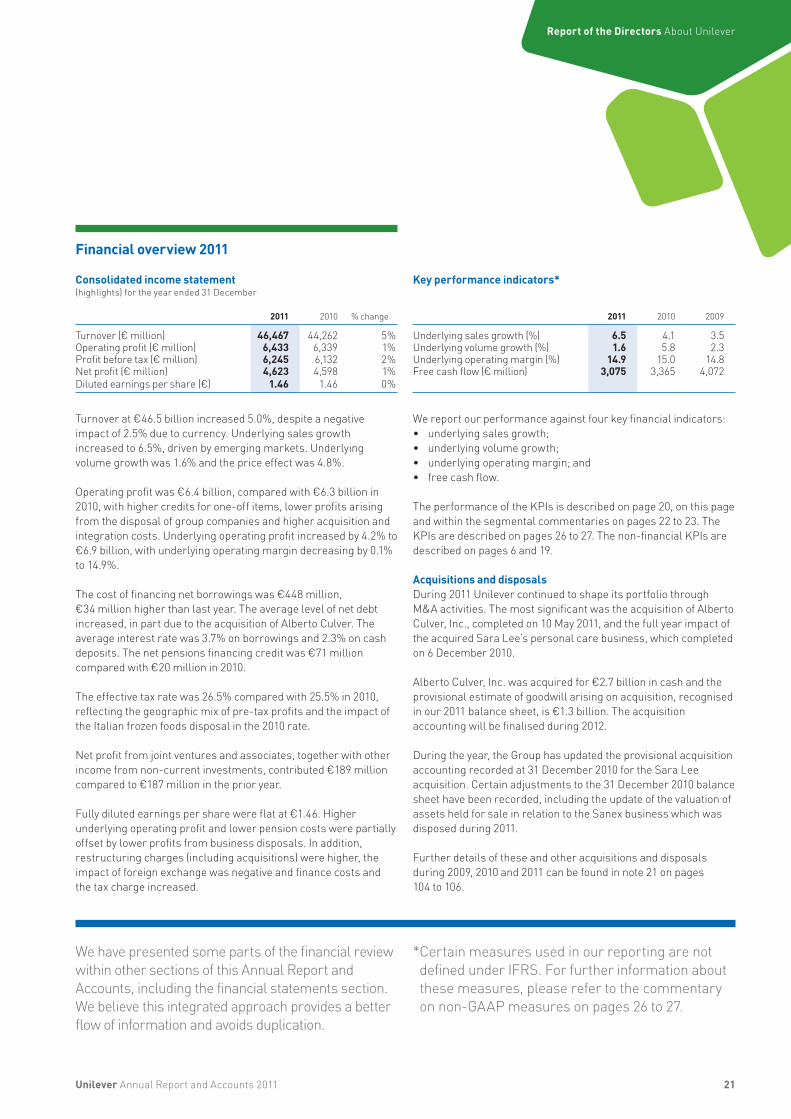
Financial overview 2011
Consolidated income statement(highlights) for the year ended 31 December
2011 2010 % change
Turnover (€ million) 46,467 44,262 5%Operating profit (€ million) 6,433 6,339 1%Profit before tax (€ million) 6,245 6,132 2%Net profit (€ million) 4,623 4,598 1%Diluted earnings per share (€) 1.46 1.46 0%
Turnover at €46.5 billion increased 5.0%, despite a negative impact of 2.5% due to currency. Underlying sales growth increased to 6.5%, driven by emerging markets. Underlying volume growth was 1.6% and the price effect was 4.8%.
Operating profit was €6.4 billion, compared with €6.3 billion in 2010, with higher credits for one-off items, lower profits arising from the disposal of group companies and higher acquisition and integration costs. Underlying operating profit increased by 4.2% to €6.9 billion, with underlying operating margin decreasing by 0.1% to 14.9%.
The cost of financing net borrowings was €448 million, €34 million higher than last year. The average level of net debt increased, in part due to the acquisition of Alberto Culver. The average interest rate was 3.7% on borrowings and 2.3% on cash deposits. The net pensions financing credit was €71 million compared with €20 million in 2010.
The effective tax rate was 26.5% compared with 25.5% in 2010, reflecting the geographic mix of pre-tax profits and the impact of the Italian frozen foods disposal in the 2010 rate.
Net profit from joint ventures and associates, together with other income from non-current investments, contributed €189 million compared to €187 million in the prior year.
Fully diluted earnings per share were flat at €1.46. Higher underlying operating profit and lower pension costs were partially offset by lower profits from business disposals. In addition, restructuring charges (including acquisitions) were higher, the impact of foreign exchange was negative and finance costs and the tax charge increased.
Key performance indicators*
2011 2010 2009
Underlying sales growth (%) 6.5 4.1 3.5Underlying volume growth (%) 1.6 5.8 2.3Underlying operating margin (%) 14.9 15.0 14.8Free cash flow (€ million) 3,075 3,365 4,072
We report our performance against four key financial indicators:• underlying sales growth;• underlying volume growth;• underlying operating margin; and• free cash flow.
The performance of the KPIs is described on page 20, on this page and within the segmental commentaries on pages 22 to 23. The KPIs are described on pages 26 to 27. The non-financial KPIs are described on pages 6 and 19.
Acquisitions and disposalsDuring 2011 Unilever continued to shape its portfolio through M&A activities. The most significant was the acquisition of Alberto Culver, Inc., completed on 10 May 2011, and the full year impact of the acquired Sara Lee’s personal care business, which completed on 6 December 2010.
Alberto Culver, Inc. was acquired for €2.7 billion in cash and the provisional estimate of goodwill arising on acquisition, recognised in our 2011 balance sheet, is €1.3 billion. The acquisition accounting will be finalised during 2012.
During the year, the Group has updated the provisional acquisition accounting recorded at 31 December 2010 for the Sara Lee acquisition. Certain adjustments to the 31 December 2010 balance sheet have been recorded, including the update of the valuation of assets held for sale in relation to the Sanex business which was disposed during 2011.
Further details of these and other acquisitions and disposals during 2009, 2010 and 2011 can be found in note 21 on pages 104 to 106.
We have presented some parts of the financial review within other sections of this Annual Report and Accounts, including the financial statements section. We believe this integrated approach provides a better flow of information and avoids duplication.
* Certain measures used in our reporting are not defined under IFRS. For further information about these measures, please refer to the commentary on non-GAAP measures on pages 26 to 27.
22
FINANCIAL REVIEW 2011 continued
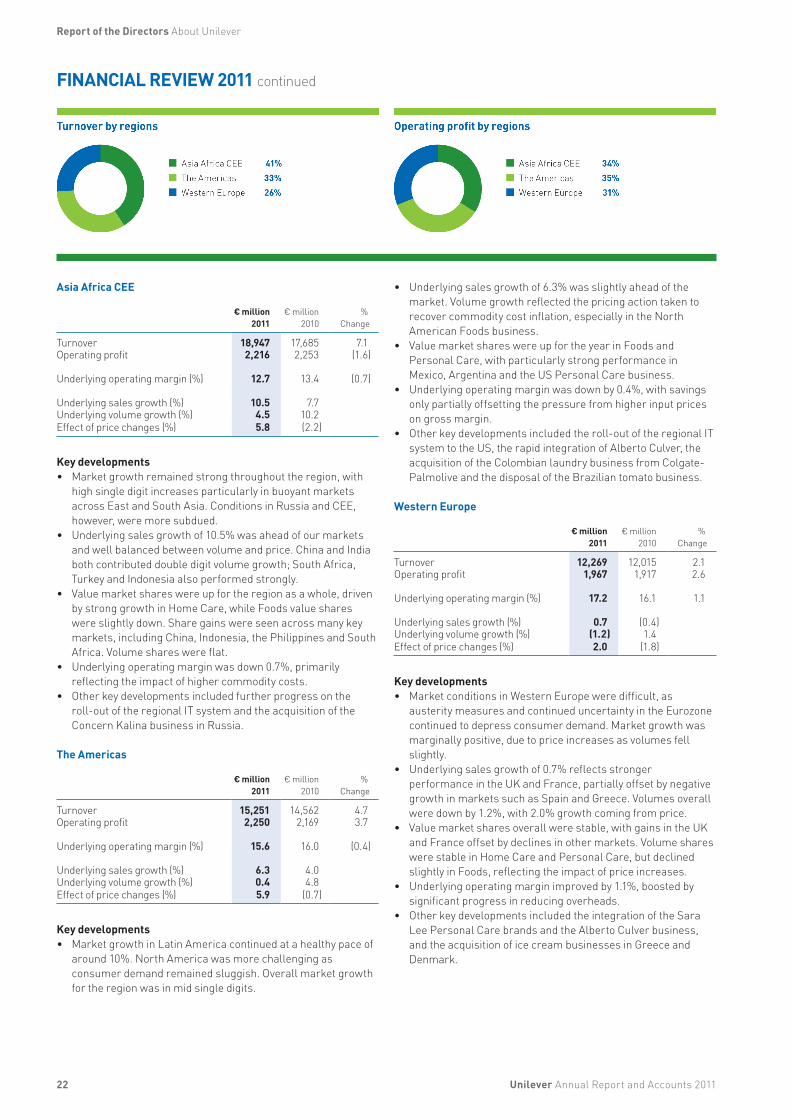
Asia Africa CEE
€ million2011
€ million2010
%Change
Turnover 18,947 17,685 7.1Operating profit 2,216 2,253 (1.6)
Underlying operating margin (%) 12.7 13.4 (0.7)
Underlying sales growth (%) 10.5 7.7Underlying volume growth (%) 4.5 10.2Effect of price changes (%) 5.8 (2.2)
Key developments• Market growth remained strong throughout the region, with
high single digit increases particularly in buoyant markets across East and South Asia. Conditions in Russia and CEE, however, were more subdued.
• Underlying sales growth of 10.5% was ahead of our markets and well balanced between volume and price. China and India both contributed double digit volume growth; South Africa, Turkey and Indonesia also performed strongly.
• Value market shares were up for the region as a whole, driven by strong growth in Home Care, while Foods value shares were slightly down. Share gains were seen across many key markets, including China, Indonesia, the Philippines and South Africa. Volume shares were flat.
• Underlying operating margin was down 0.7%, primarily reflecting the impact of higher commodity costs.
• Other key developments included further progress on the roll-out of the regional IT system and the acquisition of the Concern Kalina business in Russia.
The Americas
€ million2011
€ million2010
%Change
Turnover 15,251 14,562 4.7Operating profit 2,250 2,169 3.7
Underlying operating margin (%) 15.6 16.0 (0.4)
Underlying sales growth (%) 6.3 4.0Underlying volume growth (%) 0.4 4.8Effect of price changes (%) 5.9 (0.7)
Key developments• Market growth in Latin America continued at a healthy pace of
around 10%. North America was more challenging as consumer demand remained sluggish. Overall market growth for the region was in mid single digits.
• Underlying sales growth of 6.3% was slightly ahead of the market. Volume growth reflected the pricing action taken to recover commodity cost inflation, especially in the North American Foods business.
• Value market shares were up for the year in Foods and Personal Care, with particularly strong performance in Mexico, Argentina and the US Personal Care business.
• Underlying operating margin was down by 0.4%, with savings only partially offsetting the pressure from higher input prices on gross margin.
• Other key developments included the roll-out of the regional IT system to the US, the rapid integration of Alberto Culver, the acquisition of the Colombian laundry business from Colgate-Palmolive and the disposal of the Brazilian tomato business.
Western Europe
€ million2011
€ million2010
%Change
Turnover 12,269 12,015 2.1Operating profit 1,967 1,917 2.6
Underlying operating margin (%) 17.2 16.1 1.1
Underlying sales growth (%) 0.7 (0.4)Underlying volume growth (%) (1.2) 1.4Effect of price changes (%) 2.0 (1.8)
Key developments• Market conditions in Western Europe were difficult, as
austerity measures and continued uncertainty in the Eurozone continued to depress consumer demand. Market growth was marginally positive, due to price increases as volumes fell slightly.
• Underlying sales growth of 0.7% reflects stronger performance in the UK and France, partially offset by negative growth in markets such as Spain and Greece. Volumes overall were down by 1.2%, with 2.0% growth coming from price.
• Value market shares overall were stable, with gains in the UK and France offset by declines in other markets. Volume shares were stable in Home Care and Personal Care, but declined slightly in Foods, reflecting the impact of price increases.
• Underlying operating margin improved by 1.1%, boosted by significant progress in reducing overheads.
• Other key developments included the integration of the Sara Lee Personal Care brands and the Alberto Culver business, and the acquisition of ice cream businesses in Greece and Denmark.
Unilever Annual Report and Accounts 2011
Report of the Directors About Unilever
23
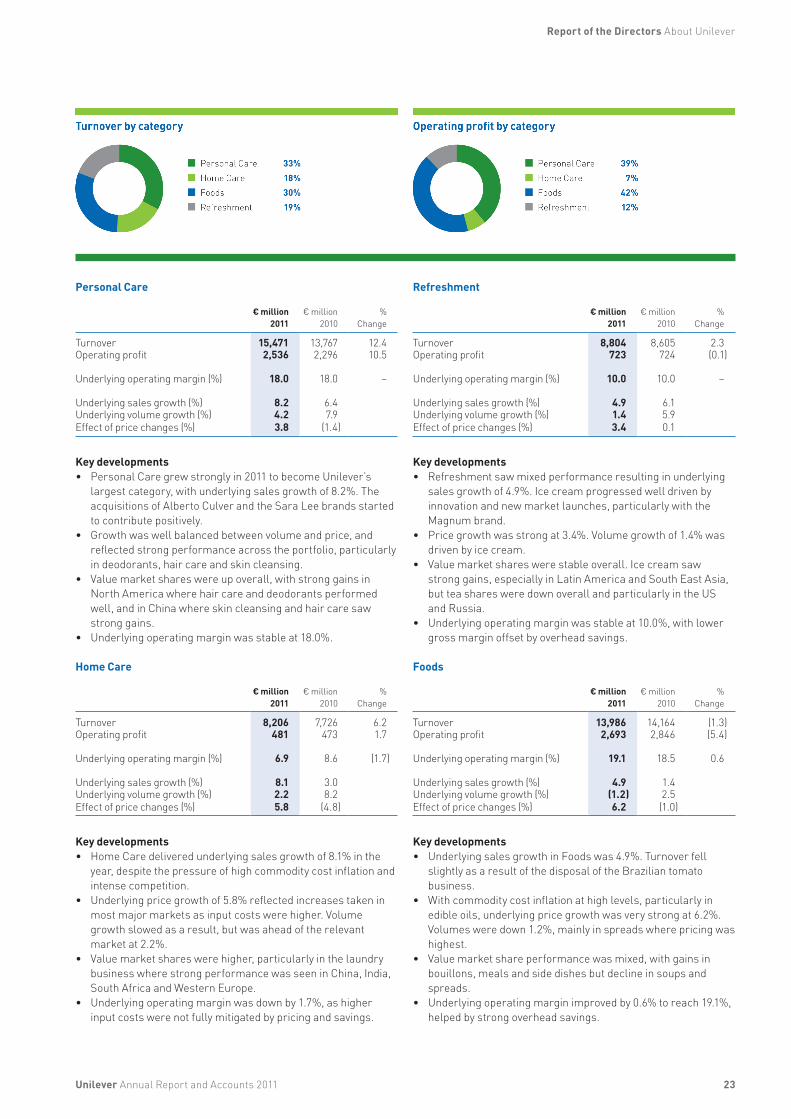
Personal Care
€ million
2011€ million
2010%
Change
Turnover 15,471 13,767 12.4Operating profit 2,536 2,296 10.5
Underlying operating margin (%) 18.0 18.0 –
Underlying sales growth (%) 8.2 6.4Underlying volume growth (%) 4.2 7.9Effect of price changes (%) 3.8 (1.4)
Key developments• Personal Care grew strongly in 2011 to become Unilever’s
largest category, with underlying sales growth of 8.2%. The acquisitions of Alberto Culver and the Sara Lee brands started to contribute positively.
• Growth was well balanced between volume and price, and reflected strong performance across the portfolio, particularly in deodorants, hair care and skin cleansing.
• Value market shares were up overall, with strong gains in North America where hair care and deodorants performed well, and in China where skin cleansing and hair care saw strong gains.
• Underlying operating margin was stable at 18.0%.
Home Care
€ million
2011€ million
2010%
Change
Turnover 8,206 7,726 6.2Operating profit 481 473 1.7
Underlying operating margin (%) 6.9 8.6 (1.7)
Underlying sales growth (%) 8.1 3.0Underlying volume growth (%) 2.2 8.2Effect of price changes (%) 5.8 (4.8)
Key developments• Home Care delivered underlying sales growth of 8.1% in the
year, despite the pressure of high commodity cost inflation and intense competition.
• Underlying price growth of 5.8% reflected increases taken in most major markets as input costs were higher. Volume growth slowed as a result, but was ahead of the relevant market at 2.2%.
• Value market shares were higher, particularly in the laundry business where strong performance was seen in China, India, South Africa and Western Europe.
• Underlying operating margin was down by 1.7%, as higher input costs were not fully mitigated by pricing and savings.
Refreshment
€ million
2011€ million
2010%
Change
Turnover 8,804 8,605 2.3Operating profit 723 724 (0.1)
Underlying operating margin (%) 10.0 10.0 –
Underlying sales growth (%) 4.9 6.1Underlying volume growth (%) 1.4 5.9Effect of price changes (%) 3.4 0.1
Key developments• Refreshment saw mixed performance resulting in underlying
sales growth of 4.9%. Ice cream progressed well driven by innovation and new market launches, particularly with the Magnum brand.
• Price growth was strong at 3.4%. Volume growth of 1.4% was driven by ice cream.
• Value market shares were stable overall. Ice cream saw strong gains, especially in Latin America and South East Asia, but tea shares were down overall and particularly in the US and Russia.
• Underlying operating margin was stable at 10.0%, with lower gross margin offset by overhead savings.
Foods
€ million
2011€ million
2010%
Change
Turnover 13,986 14,164 (1.3)Operating profit 2,693 2,846 (5.4)
Underlying operating margin (%) 19.1 18.5 0.6
Underlying sales growth (%) 4.9 1.4Underlying volume growth (%) (1.2) 2.5Effect of price changes (%) 6.2 (1.0)
Key developments• Underlying sales growth in Foods was 4.9%. Turnover fell
slightly as a result of the disposal of the Brazilian tomato business.
• With commodity cost inflation at high levels, particularly in edible oils, underlying price growth was very strong at 6.2%. Volumes were down 1.2%, mainly in spreads where pricing was highest.
• Value market share performance was mixed, with gains in bouillons, meals and side dishes but decline in soups and spreads.
• Underlying operating margin improved by 0.6% to reach 19.1%, helped by strong overhead savings.
Unilever Annual Report and Accounts 2011
Report of the Directors About Unilever

24
FINANCIAL REVIEW 2011 continued
Balance sheet
€ million
2011€ million
2010
Goodwill and intangible assets 21,913 18,233Other non-current assets 11,308 10,405Current assets 14,291 12,534
Total assets 47,512 41,172
Current liabilities 17,929 13,608Non-current liabilities 14,662 12,486
Total liabilities 32,591 26,094
Shareholders’ equity 14,293 14,485Non-controlling interest 628 593
Total equity 14,921 15,078
Total liabilities and equity 47,512 41,172
Goodwill and intangibles at 31 December 2011 were €3.7 billion higher than in 2010, mainly as a result of acquisitions, including Alberto Culver and Concern Kalina, after disposals. The increase in other non-current assets is mainly due to an increase in property, plant and equipment to €8.8 billion compared to €7.9 billion in 2010.
Inventories were higher by €0.3 billion and trade and other receivables were higher by €0.4 billion. Cash and cash equivalents were €1.1 billion higher at €3.5 billion.
Current liabilities were €4.3 billion higher at €17.9 billion mainly due to an increase in short term and maturing financial liabilities and currency movements. Provisions remained at €0.4 billion.
The overall net liability for all pension arrangements was €3.2 billion at the end of 2011, up from €2.1 billion at the end of 2010. Funded schemes showed an aggregate deficit of €1.3 billion and unfunded arrangements a liability of €1.9 billion. The increase in the overall balance sheet liability was mainly due to the decrease in discount rates over the year. Cash expenditure on pensions was €553 million.
Shareholders’ equity fell by €0.2 billion in the year. Net profit added €4.3 billion, with currency and other movements negatively impacting by €2.0 billion. Dividends paid in the year totalled €2.5 billion.
Contractual obligations at 31 December 2011
€ million
Total
€ millionDue
within1 year
€ million
Due in1-3 years
€ million
Due in3-5 years
€ millionDue in
over 5 years
Long-term debt 9,193 1,526 2,452 2,446 2,769Interest on financial liabilities 3,007 387 602 594 1,424
Operating lease obligations 1,628 381 499 337 411
Purchase obligations(a) 515 459 32 8 16
Finance leases 346 28 52 46 220Other long-term commitments 1,749 628 781 257 83
Total 16,438 3,409 4,418 3,688 4,923(a) For raw and packaging material and finished goods.
Unilever Annual Report and Accounts 2011
Report of the Directors About Unilever
Contractual obligationsUnilever’s contractual obligations at the end of 2011 included capital expenditure commitments, borrowings, lease commitments and other commitments. A summary of certain contractual obligations at 31 December 2011 is provided in the preceding table. Further details are set out in the following notes to the consolidated financial statements: note 10 on pages 86 to 87, note 15 on pages 90 to 92, and note 20 on pages 102 to 103.
Off-balance sheet arrangementsSIC interpretation 12 ‘Consolidation – Special Purpose Entities’ (SIC 12) requires that entities which we do not control are considered for consolidation in the financial statements based on risks and rewards. We have reviewed our contractual arrangements and concluded that there are no significant relationships not already appropriately reflected in the consolidated financial statements. Information concerning guarantees given by the Group is stated in note 16B on page 96.
Finance and liquidityThe Group’s financial strategy provides the financial flexibility to meet strategic and day-to-day needs. Our current long-term credit rating is A+/A1 and our current short-term credit rating is A1/P1. We aim to maintain a competitive balance sheet which we consider to be the equivalent of a credit rating of A+/A1 in the long term. This provides us with:• appropriate access to equity and debt markets;• sufficient flexibility for acquisitions;• sufficient resilience against economic and financial uncertainty
ensuring ample liquidity; and• optimal weighted average cost of capital, given the
constraints above.
Unilever aims to concentrate cash in the parent and central finance companies in order to ensure maximum flexibility in meeting changing business needs. Operating subsidiaries are financed through the mixture of retained earnings, third-party borrowings and loans from parent and central finance companies. Unilever maintains access to global debt markets through an infrastructure of short-term debt programmes (principally US domestic and euro commercial paper programmes) and long-term debt programmes (principally a US Shelf Registration programme and a European markets Debt Issuance Programme). Debt in the international markets is, in general, issued in the name of NV, PLC, Unilever Finance International BV or Unilever Capital Corporation. NV, PLC and Unilever United States Inc. will normally guarantee such debt where they are not the issuer.
In this uncertain environment, we have continued to closely monitor all our exposures and counterparty limits. We were comfortable with a higher cash balance in 2011.
Unilever has committed credit facilities in place for general corporate purposes. The undrawn committed credit facilities in place on 31 December 2011 were US $6,150 million. Bilateral committed credit facilities totalled US $5,950 million. Bilateral money market commitments totalled US $200 million. Further details are given in note 16B on page 95.
Unilever Annual Report and Accounts 2011
Report of the Directors About Unilever
25
On 10 February 2011 we issued two series of senior notes: (a) US $500 million at 2.75% maturing in 2016; and (b) US $1.0 billion at 4.25% maturing in 2021. On 31 March 2011 we issued CNY 300 million notes at 1.15% maturing in 2014. On 2 December 2011 we redeemed our Swiss francs 400 million notes.
The main source of liquidity continues to be cash generated from operations. Unilever is satisfied that its financing arrangements are adequate to meet its working capital needs for the foreseeable future.
TreasuryUnilever Treasury’s role is to ensure that appropriate financing is available for all value-creating investments. Additionally, Treasury delivers financial services to allow operating companies to manage their financial transactions and exposures in an efficient, timely and low-cost manner.
Unilever Treasury operates as a service centre and is governed by plans approved by the Boards. In addition to guidelines and exposure limits, a system of authorities and extensive independent reporting covers all major areas of activity. Performance is monitored closely. Reviews are undertaken periodically by the corporate internal audit function.
The key financial instruments used by Unilever are short-term and long-term borrowings, cash and cash equivalents, and certain straightforward derivative instruments, principally comprising interest rate swaps and foreign exchange contracts. The accounting for derivative instruments is discussed in note 16 on page 93 and on page 98. The use of leveraged instruments is not permitted.
Unilever Treasury manages a variety of market risks, including the effects of changes in foreign exchange rates, interest rates and liquidity. Further details of the management of these risks are given in note 16 on pages 94 to 97, which are incorporated and repeated here by reference.
Cash flow
€ million
2011€ million
2010€ million
2009
Net cash flow from operating activities 5,452 5,490 5,774
Net cash flow from/(used in) investing activities (4,467) (1,164) (1,263)
Net cash flow from/(used in) financing activities 411 (4,609) (4,301)
Net increase/(decrease) in cash and cash equivalents 1,396 (283) 210
Cash and cash equivalents at 1 January 1,966 2,397 2,360
Effect of foreign exchange rate changes (384) (148) (173)
Cash and cash equivalents at 31 December 2,978 1,966 2,397
Cash and cash equivalents increased by €1.4 billion when translated at average 2011 exchange rates. After recognising the changes in exchange rates, cash and cash equivalents in the balance sheet at 31 December 2011 were €1.0 billion higher at €3.0 billion.
Net cash flow from operating activities of €5.5 billion was in line with 2010. Net capital expenditure was €0.3 billion higher than 2010. There was a net cash outflow of €1.7 billion for acquisition and disposal activities, primarily the acquisition of Alberto Culver and the disposal of the Sanex business. The movement in financing activities is explained by an inflow from third-party borrowings.
At 31 December 2011, the net debt position was €8.8 billion, an increase of €2.1 billion compared to 2010. The outflow from dividends, acquisitions, tax, net capital expenditure and interest plus the negative impact of foreign exchange rates together exceeded the cash inflow from operating activities and business disposals.
Market capitalisation and dividendsUnilever’s combined market capitalisation rose from €64.8 billion at the end of 2010 to €73.9 billion at 31 December 2011.
Information on dividends is set out in note 8 on page 83.
Basis of reporting and critical accounting policiesThe accounting policies that are most significant in connection with our financial reporting are set out in note 1 on pages 68 to 69.

26 Unilever Annual Report and Accounts 2011
Report of the Directors About Unilever
FINANCIAL REVIEW 2011 continued
Non-GAAP measures
Certain discussions and analyses set out in this Annual Report and Accounts include measures which are not defined by generally accepted accounting principles (GAAP) such as IFRS. We believe this information, along with comparable GAAP measurements, is useful to investors because it provides a basis for measuring our operating performance, ability to retire debt and invest in new business opportunities. Our management uses these financial measures, along with the most directly comparable GAAP financial measures, in evaluating our operating performance and value creation. Non-GAAP financial measures should not be considered in isolation from, or as a substitute for, financial information presented in compliance with GAAP. Non-GAAP financial measures as reported by us may not be comparable with similarly titled amounts reported by other companies.
In the following sections we set out our definitions of the following non-GAAP measures and provide reconciliations to relevant GAAP measures:• underlying sales growth;• underlying volume growth;• underlying operating margin (including explanation
of restructuring, business disposals and other one-off items (RDIs);
• free cash flow; and• net debt.
Underlying sales growth (USG)USG reflects the change in revenue from continuing operations at constant rates of exchange, excluding the effects of acquisitions and disposals. It is a measure that provides valuable additional information on the underlying performance of the business. In particular, it presents the organic growth of our business year on year and is used internally as a core measure of sales performance.
The reconciliation of USG to changes in the GAAP measure turnover is as follows:
Total Group
2011vs 2010
2010vs 2009
Underlying sales growth (%) 6.5 4.1Effect of acquisitions (%) 2.7 0.3Effect of disposals (%) (1.5) (0.8)Effect of exchange rates (%) (2.5) 7.3Turnover growth (%) 5.0 11.1
Asia, Africa CEE
2011vs 2010
2010vs 2009
Underlying sales growth (%) 10.5 7.7Effect of acquisitions (%) 0.7 0.2Effect of disposals (%) 0.0 (0.1)Effect of exchange rates (%) (3.7) 10.1Turnover growth (%) 7.1 18.7
The Americas
2011vs 2010
2010vs 2009
Underlying sales growth (%) 6.3 4.0Effect of acquisitions (%) 3.6 0.3Effect of disposals (%) (1.5) (0.4)Effect of exchange rates (%) (3.4) 9.0Turnover growth (%) 4.7 13.3
Western Europe
2011vs 2010
2010vs 2009
Underlying sales growth (%) 0.7 (0.4)Effect of acquisitions (%) 4.8 0.5Effect of disposals (%) (3.6) (2.0)Effect of exchange rates (%) 0.4 1.4Turnover growth (%) 2.1 (0.5)
Underlying volume growth (UVG)Underlying volume growth is underlying sales growth after eliminating the impact of price changes. The relationship between the two measures is set out below:
2011vs 2010
2010vs 2009
Underlying volume growth (%) 1.6 5.8Effect of price changes (%) 4.8 (1.6)Underlying sales growth (%) 6.5 4.1
The UVG and price effect for each region and category are shown within the tables on pages 22 to 23.
Underlying operating margin In our commentary on results of operations for the Group and each region, we discuss trends in underlying operating margins. This means operating margin before the impact of restructuring costs, business disposals, impairments and other one-off items, which we refer to collectively as RDIs. We believe that giving this information allows readers of our financial statements to have a better understanding of underlying trends. There is no recognised GAAP measure that corresponds to this measure.
The reconciliation of underlying operating profit to operating profit is as follows:
€ million2011
€ million2010
Operating profit 6,433 6,339Restructuring costs 612 589Business disposals (221) (468)Acquisition and integration costs and other one-off items 77 160
Underlying operating profit 6,901 6,620
Turnover 46,467 44,262Operating margin 13.8% 14.3%Underlying operating margin 14.9% 15.0%
Further details of RDIs can be found in note 3 on page 72.
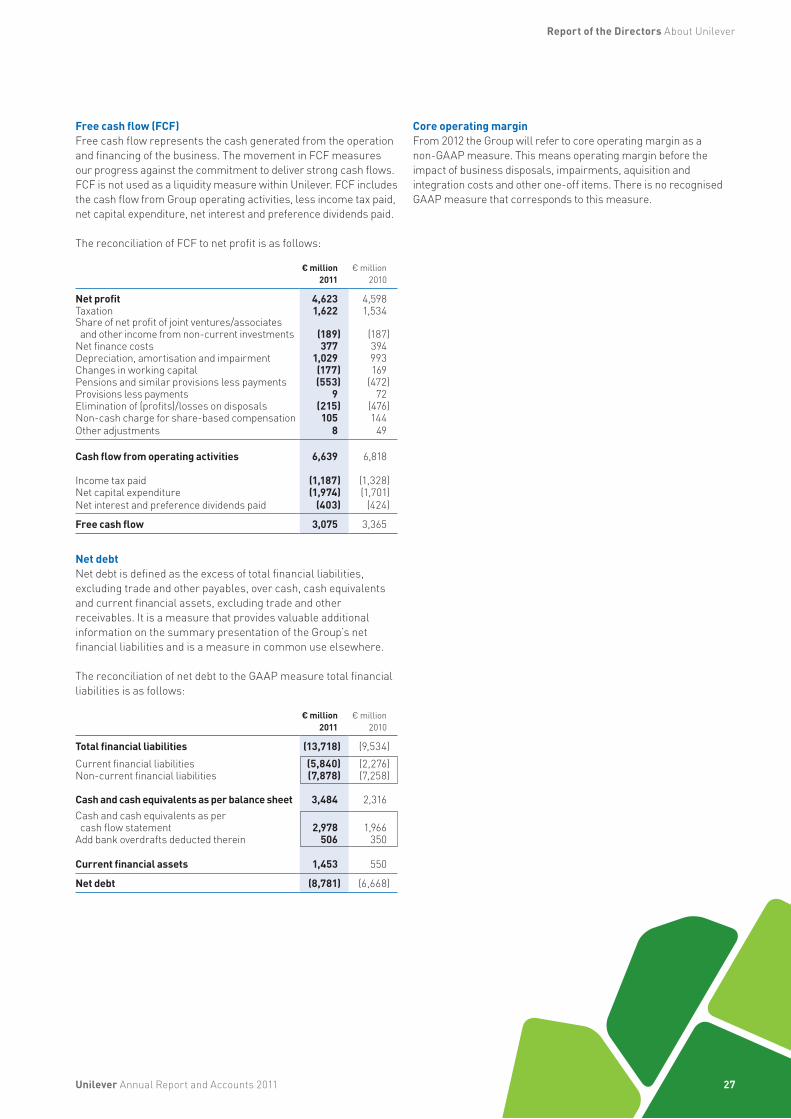
27
Free cash flow (FCF)Free cash flow represents the cash generated from the operation and financing of the business. The movement in FCF measures our progress against the commitment to deliver strong cash flows. FCF is not used as a liquidity measure within Unilever. FCF includes the cash flow from Group operating activities, less income tax paid, net capital expenditure, net interest and preference dividends paid.
The reconciliation of FCF to net profit is as follows:
€ million
2011€ million
2010
Net profit 4,623 4,598Taxation 1,622 1,534Share of net profit of joint ventures/associates and other income from non-current investments (189) (187)
Net finance costs 377 394Depreciation, amortisation and impairment 1,029 993Changes in working capital (177) 169Pensions and similar provisions less payments (553) (472)Provisions less payments 9 72Elimination of (profits)/losses on disposals (215) (476)Non-cash charge for share-based compensation 105 144Other adjustments 8 49
Cash flow from operating activities 6,639 6,818
Income tax paid (1,187) (1,328)Net capital expenditure (1,974) (1,701)Net interest and preference dividends paid (403) (424)
Free cash flow 3,075 3,365
Net debtNet debt is defined as the excess of total financial liabilities, excluding trade and other payables, over cash, cash equivalents and current financial assets, excluding trade and other receivables. It is a measure that provides valuable additional information on the summary presentation of the Group’s net financial liabilities and is a measure in common use elsewhere.
The reconciliation of net debt to the GAAP measure total financial liabilities is as follows:
€ million2011
€ million2010
Total financial liabilities (13,718) (9,534)Current financial liabilities (5,840) (2,276)Non-current financial liabilities (7,878) (7,258)
Cash and cash equivalents as per balance sheet 3,484 2,316Cash and cash equivalents as per cash flow statement 2,978 1,966
Add bank overdrafts deducted therein 506 350
Current financial assets 1,453 550
Net debt (8,781) (6,668)
Core operating marginFrom 2012 the Group will refer to core operating margin as a non-GAAP measure. This means operating margin before the impact of business disposals, impairments, aquisition and integration costs and other one-off items. There is no recognised GAAP measure that corresponds to this measure.
Unilever Annual Report and Accounts 2011
Report of the Directors About Unilever
28
RISKSOutlook and risks 2012
The following discussion of the risk outlook and our principal risk management activities includes ‘forward-looking’ statements that reflect Unilever’s view of the operating risk environment. The actual results could differ materially from those projected. See the ‘Cautionary statement’ on the inside back cover.
OutlookMarket conditions for our business were challenging in 2011 and we do not anticipate this changing significantly in 2012.
Economic pressures are expected to continue. We expect consumer markets to remain flat to slightly down in developed markets. In emerging markets consumer demand remains robust but there is nonetheless the risk of modest slowdown in key markets such as China, India and Brazil. Currency markets remain volatile and uncertain. Although we have seen rather more stable conditions in key commodity markets in recent months we remain watchful for further periods of volatility in 2012. A worsening economic scenario could be triggered by a major Eurozone crisis prompted by countries leaving the euro or by a break-up of the euro leading to significant contraction in financial markets, followed by a severe recession in Europe and knock-on effects globally. Terrorist activity and political unrest may also result in business interruptions and a decreased demand for our products.
The competitive environment for our business is likely to remain intense in 2012. Our competitors, both global and local, will continue to shift resources into emerging markets. We expect continued high levels of competitive challenge to our many category leadership positions. Some of this may be price based, but we also expect strong innovation based competition. With the improvements we have been making to our business we are well prepared for these challenges.
In a period of significant uncertainty and downside risk, we believe Unilever’s operational and financial flexibility, and speed of response to a fast changing environment are vital assets. We will continue to focus on our long term strategic priority of driving volume growth ahead of our markets whilst providing a steady improvement in core operating margin and strong cash flow. We are well placed in emerging markets and we expect these markets to continue to drive growth. Our recent strategy review sharpened the portfolio role of our categories and our 2012 outlook fully reflects the choices made. This gives us confidence that Unilever is fit to compete, whatever the circumstances.
Principal risk factorsOur business is subject to risks and uncertainties. The risks that we regard as the most relevant to our business are identified below. We have also commented on certain mitigating actions that we believe help us to manage these risks. However, we may not be successful in deploying some or all of these mitigating actions. If the circumstances in these risks occur or are not successfully mitigated, our cashflow, operating results, financial position, business and reputation could be materially adversely affected. In addition risks and uncertainties could cause actual results to vary from those described herein in the descriptions below, which may include forward-looking statements, or could impact on our ability to meet our targets or be detrimental to our profitability or reputation.
Description of risk What we are doing to manage the risk
Consumer PreferenceAs a branded goods business, Unilever’s success depends on the value and relevance of our brands and products to consumers across the world and on our ability to innovate.
Consumer tastes, preferences and behaviours are constantly changing and Unilever’s ability to respond to these changes and to continue to differentiate our brands and products is vital to our business.
We are dependent on creating innovative products that continue to meet the needs of our consumers.
We continuously monitor external market trends and collate consumer, customer and shopper insight in order to develop category and brand strategies.
Our Research and Development function actively searches for ways in which to translate the trends in consumer preference and taste into new technologies for incorporation into future products.
Our innovation management process deploys the necessary tools, technologies and resources to convert category strategies into projects and category plans, develop products and relevant brand communication and successfully roll out new products to our consumers.
Unilever Annual Report and Accounts 2011
Report of the Directors About Unilever
29
Description of risk What we are doing to manage the risk
CompetitionThe activities of our competitors may adversely impact our business.
Unilever operates globally in competitive markets where other local, regional and global companies are targeting the same consumer base.
Our retail customers frequently compete with us through private label offerings.
Industry consolidation amongst our direct competitors and in the retail trade can bring about significant shifts in the competitive landscape.
Our strategy focuses on investing in markets and segments which we identify as attractive because we have already built, or are confident that we can build, competitive advantage.
We continue to monitor developments in our markets across the world and to direct our resources accordingly to respond to competitive threats and opportunities.
Portfolio Management Unilever’s strategic investment choices will determine the long-term growth and profits of our business.
Unilever’s growth and profitability are determined by our portfolio of categories, geographies and channels and how these evolve over time.
Our Compass strategy and our business plans are designed to ensure that resources are prioritised towards those categories and markets having the greatest long term potential for Unilever.
Our acquisition activity is driven by our portfolio strategy with a clear, defined evaluation process.
SustainabilityThe success of our business depends on finding sustainable solutions to support long-term growth.
Unilever’s vision to double the size of our business while reducing our environmental impact will require more sustainable ways of doing business. This means increasing the positive social benefits of Unilever’s activities while reducing our environmental impact.
The Unilever Sustainable Living Plan sets clear long-term commitments for health and well-being, environmental impact and enhancing livelihoods. These are underpinned by specific targets in areas such as sustainable sourcing, water availability and usage, waste and greenhouse gases.
The Unilever Sustainable Development Group, comprising five external specialists in corporate responsibility and sustainability, monitors the execution of this strategy.
Progress towards the Unilever Sustainable Living Plan is monitored by the Unilever Leadership Executive and the Boards.
Customer RelationshipsSuccessful customer relationships are vital to our business and continued growth.
Maintaining strong relationships with our customers is necessary for our brands to be well presented to our consumers and available for purchase at all times.
The strength of our customer relationships also affects our ability to obtain pricing and secure favourable trade terms.
We build and maintain trading relationships across a broad spectrum of channels ranging from centrally managed multinational customers through to small traders accessed via distributors in many developing countries.
We develop joint business plans with all our key customers that include detailed investment plans and customer service objectives and we regularly monitor progress.
We have developed capabilities for customer sales and outlet design which enable us to find new ways to improve customer performance and enhance our customer relationships.
PeopleA skilled workforce is essential for the continued success of our business.
Our ability to attract, develop and retain the right number of appropriately qualified people is critical if we are to effectively compete and grow.
This is especially true in our key emerging markets where there can be a high level of competition for a limited talent pool.
Resource committees have been established and implemented throughout our business. These committees have responsibility for identifying future skills and capability needs, developing career paths and identifying the key talent and leaders of the future.
We have an integrated management development process which includes regular performance reviews underpinned by a common set of leadership behaviours, skills and competencies.
We have targeted programmes to attract and retain top talent and we actively monitor our performance in retaining talent within Unilever.
Unilever Annual Report and Accounts 2011
Report of the Directors About Unilever
30
RISKS continued
Description of risk What we are doing to manage the risk
Supply Chain Our business depends on securing high quality materials, efficient We have contingency plans designed to enable us to secure manufacturing and the timely distribution of products to our alternative key material supplies at short notice, to transfer or share customers. production between manufacturing sites and to use substitute
materials in our product formulations and recipes.Our supply chain network is exposed to potentially adverse events such as physical disruptions, environmental and industrial accidents These contingency plans also extend to an ability to intervene directly or bankruptcy of a key supplier which could impact our ability to to support a key supplier should it for any reason find itself in difficulty deliver orders to our customers. or be at risk of negatively affecting a Unilever product.
The quality and safety of our products are of paramount importance We have policies and procedures designed to ensure the health and for our brands and our reputation. safety of our employees and the products in our facilities and to deal
with major incidents or crises including business continuity and The cost of our products can be significantly affected by the cost of disaster recovery.the underlying commodities and materials from which they are made. Fluctuations in these costs cannot always be passed on to the Our product quality controls are extensive and are regularly tested to consumer through pricing. ensure that they are effective. All of our key suppliers are periodically
reviewed to ensure they meet the rigorous quality standards that our products demand.
Commodity price risk is actively managed through forward-buying of traded commodities and other hedging mechanisms. Trends are monitored and modelled regularly and integrated into our forecasting process.
Systems and InformationUnilever’s operations are increasingly dependent on IT systems and Hardware that runs and manages core operating data is fully backed the management of information. up with separate contingency systems to provide real time backup
operations should they ever be required. We interact electronically with customers, suppliers and consumers in ways which place ever greater emphasis on the need for secure We maintain a system of control at all times for access to our and reliable IT systems and infrastructure and careful management important information.of the information that is in our possession.
Our policies on data access, privacy and protection of information are This also increases the threat from unauthorised access and regularly reviewed and our employees are trained to understand the misuse of sensitive information. requirements.
Business TransformationSuccessful execution of business transformation projects is key to All acquisitions, disposals and global restructuring projects are delivering their intended business benefits and avoiding disruption sponsored by a Unilever Leadership Executive member. Regular to other business activities. progress updates are provided to the Unilever Leadership Executive.
Unilever is continually engaged in major change projects, including Sound project disciplines are used in all merger, acquisitions and acquisitions and disposals, to drive continuous improvement in our restructuring projects and these projects are resourced by dedicated business and to strengthen our portfolio and capabilities. and appropriately qualified personnel.
In 2011, this included several significant acquisitions (Alberto Culver, Unilever also monitors the volume of change programmes underway Concern Kalina), IT system implementations, the roll-out of in an effort to stagger the impact on current operations and to ensure Enterprise Support and changes to our management organisation. minimal disruption.
Unilever Annual Report and Accounts 2011
Report of the Directors About Unilever
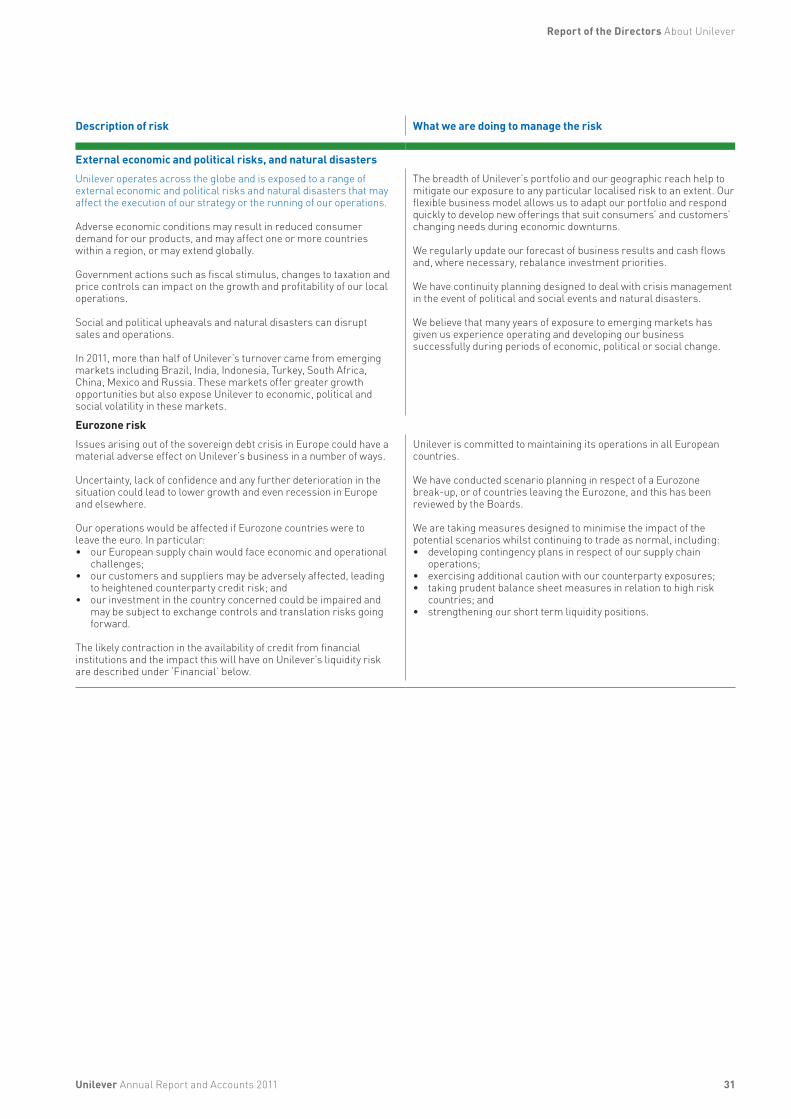
31
Description of risk What we are doing to manage the risk
External economic and political risks, and natural disastersUnilever operates across the globe and is exposed to a range of The breadth of Unilever’s portfolio and our geographic reach help to external economic and political risks and natural disasters that may mitigate our exposure to any particular localised risk to an extent. Ouraffect the execution of our strategy or the running of our operations. flexible business model allows us to adapt our portfolio and respond
quickly to develop new offerings that suit consumers’ and customers’ Adverse economic conditions may result in reduced consumer changing needs during economic downturns. demand for our products, and may affect one or more countries within a region, or may extend globally. We regularly update our forecast of business results and cash flows
and, where necessary, rebalance investment priorities. Government actions such as fiscal stimulus, changes to taxation and price controls can impact on the growth and profitability of our local We have continuity planning designed to deal with crisis management operations. in the event of political and social events and natural disasters.
Social and political upheavals and natural disasters can disrupt We believe that many years of exposure to emerging markets has sales and operations. given us experience operating and developing our business
successfully during periods of economic, political or social change.In 2011, more than half of Unilever’s turnover came from emerging markets including Brazil, India, Indonesia, Turkey, South Africa, China, Mexico and Russia. These markets offer greater growth opportunities but also expose Unilever to economic, political and social volatility in these markets.
Eurozone riskIssues arising out of the sovereign debt crisis in Europe could have a Unilever is committed to maintaining its operations in all European material adverse effect on Unilever’s business in a number of ways. countries.
Uncertainty, lack of confidence and any further deterioration in the We have conducted scenario planning in respect of a Eurozone situation could lead to lower growth and even recession in Europe break-up, or of countries leaving the Eurozone, and this has been and elsewhere. reviewed by the Boards.
Our operations would be affected if Eurozone countries were to We are taking measures designed to minimise the impact of the leave the euro. In particular: potential scenarios whilst continuing to trade as normal, including:• our European supply chain would face economic and operational • developing contingency plans in respect of our supply chain
challenges; operations;• our customers and suppliers may be adversely affected, leading • exercising additional caution with our counterparty exposures;
to heightened counterparty credit risk; and • taking prudent balance sheet measures in relation to high risk • our investment in the country concerned could be impaired and countries; and
may be subject to exchange controls and translation risks going • strengthening our short term liquidity positions.forward.
The likely contraction in the availability of credit from financial institutions and the impact this will have on Unilever’s liquidity risk are described under ‘Financial’ below.
Unilever Annual Report and Accounts 2011
Report of the Directors About Unilever
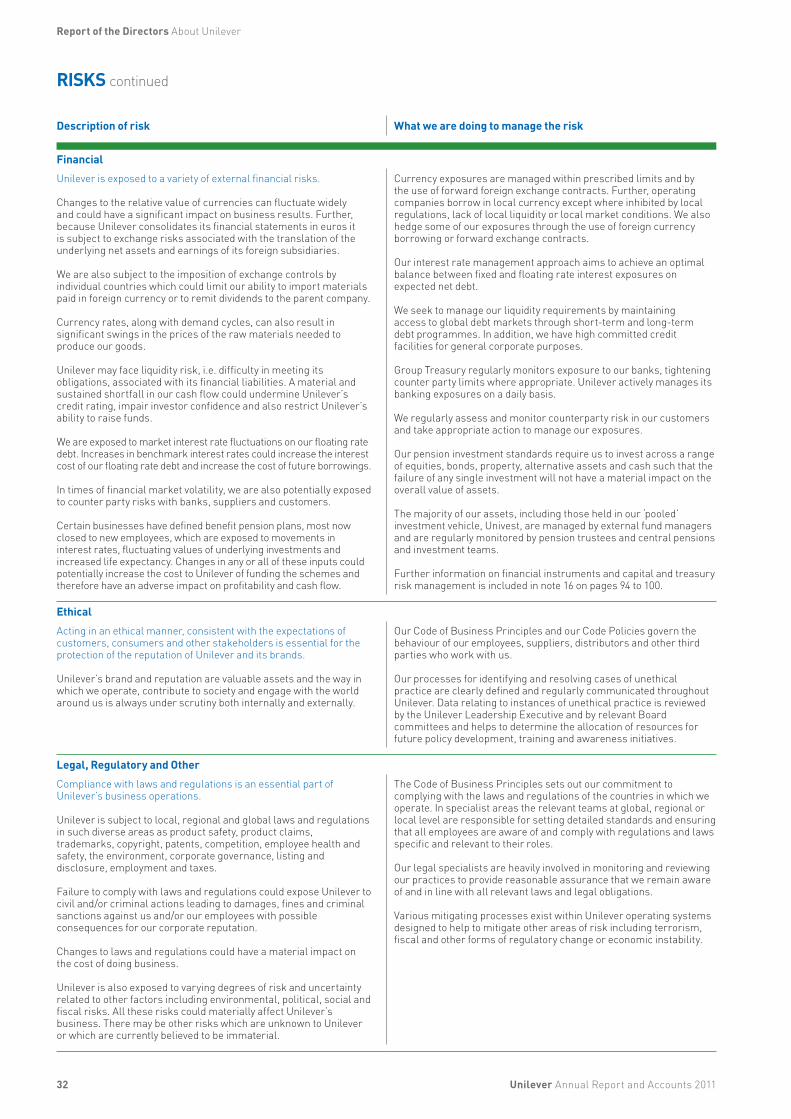
32
RISKS continued
Description of risk What we are doing to manage the risk
FinancialUnilever is exposed to a variety of external financial risks.
Changes to the relative value of currencies can fluctuate widely and could have a significant impact on business results. Further, because Unilever consolidates its financial statements in euros it is subject to exchange risks associated with the translation of the underlying net assets and earnings of its foreign subsidiaries.
We are also subject to the imposition of exchange controls by individual countries which could limit our ability to import materials paid in foreign currency or to remit dividends to the parent company.
Currency rates, along with demand cycles, can also result in significant swings in the prices of the raw materials needed to produce our goods.
Unilever may face liquidity risk, i.e. difficulty in meeting its obligations, associated with its financial liabilities. A material and sustained shortfall in our cash flow could undermine Unilever’s credit rating, impair investor confidence and also restrict Unilever’s ability to raise funds.
We are exposed to market interest rate fluctuations on our floating rate debt. Increases in benchmark interest rates could increase the interest cost of our floating rate debt and increase the cost of future borrowings.
In times of financial market volatility, we are also potentially exposed to counter party risks with banks, suppliers and customers.
Certain businesses have defined benefit pension plans, most now closed to new employees, which are exposed to movements in interest rates, fluctuating values of underlying investments and increased life expectancy. Changes in any or all of these inputs could potentially increase the cost to Unilever of funding the schemes and therefore have an adverse impact on profitability and cash flow.
Currency exposures are managed within prescribed limits and by the use of forward foreign exchange contracts. Further, operating companies borrow in local currency except where inhibited by local regulations, lack of local liquidity or local market conditions. We also hedge some of our exposures through the use of foreign currency borrowing or forward exchange contracts.
Our interest rate management approach aims to achieve an optimal balance between fixed and floating rate interest exposures on expected net debt.
We seek to manage our liquidity requirements by maintaining access to global debt markets through short-term and long-term debt programmes. In addition, we have high committed credit facilities for general corporate purposes.
Group Treasury regularly monitors exposure to our banks, tightening counter party limits where appropriate. Unilever actively manages its banking exposures on a daily basis.
We regularly assess and monitor counterparty risk in our customers and take appropriate action to manage our exposures.
Our pension investment standards require us to invest across a range of equities, bonds, property, alternative assets and cash such that the failure of any single investment will not have a material impact on the overall value of assets.
The majority of our assets, including those held in our ‘pooled’ investment vehicle, Univest, are managed by external fund managers and are regularly monitored by pension trustees and central pensions and investment teams.
Further information on financial instruments and capital and treasury risk management is included in note 16 on pages 94 to 100.
EthicalActing in an ethical manner, consistent with the expectations of customers, consumers and other stakeholders is essential for the protection of the reputation of Unilever and its brands.
Unilever’s brand and reputation are valuable assets and the way in which we operate, contribute to society and engage with the world around us is always under scrutiny both internally and externally.
Our Code of Business Principles and our Code Policies govern the behaviour of our employees, suppliers, distributors and other third parties who work with us.
Our processes for identifying and resolving cases of unethical practice are clearly defined and regularly communicated throughout Unilever. Data relating to instances of unethical practice is reviewed by the Unilever Leadership Executive and by relevant Board committees and helps to determine the allocation of resources for future policy development, training and awareness initiatives.
Legal, Regulatory and OtherCompliance with laws and regulations is an essential part of Unilever’s business operations.
Unilever is subject to local, regional and global laws and regulations in such diverse areas as product safety, product claims, trademarks, copyright, patents, competition, employee health and safety, the environment, corporate governance, listing and disclosure, employment and taxes.
Failure to comply with laws and regulations could expose Unilever to civil and/or criminal actions leading to damages, fines and criminal sanctions against us and/or our employees with possible consequences for our corporate reputation.
Changes to laws and regulations could have a material impact on the cost of doing business.
Unilever is also exposed to varying degrees of risk and uncertainty related to other factors including environmental, political, social and fiscal risks. All these risks could materially affect Unilever’s business. There may be other risks which are unknown to Unilever or which are currently believed to be immaterial.
The Code of Business Principles sets out our commitment to complying with the laws and regulations of the countries in which we operate. In specialist areas the relevant teams at global, regional or local level are responsible for setting detailed standards and ensuring that all employees are aware of and comply with regulations and laws specific and relevant to their roles.
Our legal specialists are heavily involved in monitoring and reviewing our practices to provide reasonable assurance that we remain aware of and in line with all relevant laws and legal obligations.
Various mitigating processes exist within Unilever operating systems designed to help to mitigate other areas of risk including terrorism, fiscal and other forms of regulatory change or economic instability.
Unilever Annual Report and Accounts 2011
Report of the Directors About Unilever
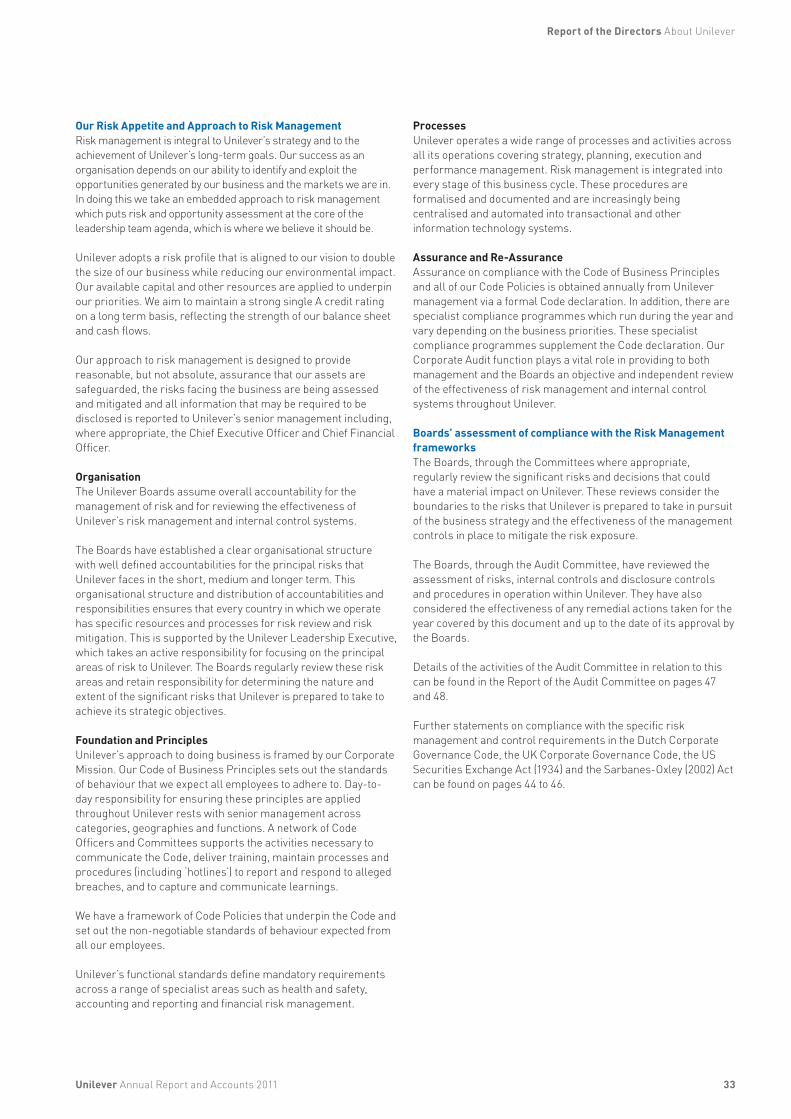
33
Our Risk Appetite and Approach to Risk Management Risk management is integral to Unilever’s strategy and to the achievement of Unilever’s long-term goals. Our success as an organisation depends on our ability to identify and exploit the opportunities generated by our business and the markets we are in. In doing this we take an embedded approach to risk management which puts risk and opportunity assessment at the core of the leadership team agenda, which is where we believe it should be.
Unilever adopts a risk profile that is aligned to our vision to double the size of our business while reducing our environmental impact. Our available capital and other resources are applied to underpin our priorities. We aim to maintain a strong single A credit rating on a long term basis, reflecting the strength of our balance sheet and cash flows.
Our approach to risk management is designed to provide reasonable, but not absolute, assurance that our assets are safeguarded, the risks facing the business are being assessed and mitigated and all information that may be required to be disclosed is reported to Unilever’s senior management including, where appropriate, the Chief Executive Officer and Chief Financial Officer.
OrganisationThe Unilever Boards assume overall accountability for the management of risk and for reviewing the effectiveness of Unilever’s risk management and internal control systems.
The Boards have established a clear organisational structure with well defined accountabilities for the principal risks that Unilever faces in the short, medium and longer term. This organisational structure and distribution of accountabilities and responsibilities ensures that every country in which we operate has specific resources and processes for risk review and risk mitigation. This is supported by the Unilever Leadership Executive, which takes an active responsibility for focusing on the principal areas of risk to Unilever. The Boards regularly review these risk areas and retain responsibility for determining the nature and extent of the significant risks that Unilever is prepared to take to achieve its strategic objectives.
Foundation and PrinciplesUnilever’s approach to doing business is framed by our Corporate Mission. Our Code of Business Principles sets out the standards of behaviour that we expect all employees to adhere to. Day-to-day responsibility for ensuring these principles are applied throughout Unilever rests with senior management across categories, geographies and functions. A network of Code Officers and Committees supports the activities necessary to communicate the Code, deliver training, maintain processes and procedures (including ‘hotlines’) to report and respond to alleged breaches, and to capture and communicate learnings.
We have a framework of Code Policies that underpin the Code and set out the non-negotiable standards of behaviour expected from all our employees.
Unilever’s functional standards define mandatory requirements across a range of specialist areas such as health and safety, accounting and reporting and financial risk management.
Processes Unilever operates a wide range of processes and activities across all its operations covering strategy, planning, execution and performance management. Risk management is integrated into every stage of this business cycle. These procedures are formalised and documented and are increasingly being centralised and automated into transactional and other information technology systems.
Assurance and Re-AssuranceAssurance on compliance with the Code of Business Principles and all of our Code Policies is obtained annually from Unilever management via a formal Code declaration. In addition, there are specialist compliance programmes which run during the year and vary depending on the business priorities. These specialist compliance programmes supplement the Code declaration. Our Corporate Audit function plays a vital role in providing to both management and the Boards an objective and independent review of the effectiveness of risk management and internal control systems throughout Unilever.
Boards’ assessment of compliance with the Risk Management frameworksThe Boards, through the Committees where appropriate, regularly review the significant risks and decisions that could have a material impact on Unilever. These reviews consider the boundaries to the risks that Unilever is prepared to take in pursuit of the business strategy and the effectiveness of the management controls in place to mitigate the risk exposure.
The Boards, through the Audit Committee, have reviewed the assessment of risks, internal controls and disclosure controls and procedures in operation within Unilever. They have also considered the effectiveness of any remedial actions taken for the year covered by this document and up to the date of its approval by the Boards.
Details of the activities of the Audit Committee in relation to this can be found in the Report of the Audit Committee on pages 47 and 48.
Further statements on compliance with the specific risk management and control requirements in the Dutch Corporate Governance Code, the UK Corporate Governance Code, the US Securities Exchange Act (1934) and the Sarbanes-Oxley (2002) Act can be found on pages 44 to 46.
Unilever Annual Report and Accounts 2011
Report of the Directors About Unilever

34
BIOGRAPHIESBoard of Directors
Chairman
Michael TreschowNationality: Swedish. Aged 68.Appointed Chairman May 2007.Non-Executive Director, ABB Group. Board member, Knut and Alice Wallenberg Foundation. Member of the European Advisory, Eli Lilly and Company. Chairman, Telefonaktiebolaget L M Ericsson 2002-2011. Chairman, AB Electrolux 2004-2007 and Confederation of Swedish Enterprise 2004-2007.
Vice-Chairman & Senior Independent Director
Kees J StormNationality: Dutch. Aged 69.Appointed May 2006.Chairman, Supervisory Board, and member of the Audit Committee, KLM Royal Dutch Airlines N.V. Member, Supervisory Board, AEGON N.V. Vice-Chairman and Chairman of Audit Committee, Anheuser-Busch InBev S.A. Board member and Audit Committee member, Baxter International, Inc.. Vice-Chairman, Supervisory Board, Pon Holdings B.V.
Executive Directors
Paul PolmanChief Executive OfficerNationality: Dutch. Aged 55.Appointed Chief Executive Officer January 2009.Appointed Director October 2008. Non-Executive Director, The Dow Chemical Company. President, Kilimanjaro Blind Trust. Procter & Gamble Co. 1979-2001, Group President Europe and Officer, Procter & Gamble Co. 2001-2006. Chief Financial Officer, Nestlé S.A. 2006-2008. Executive Vice President and Zone Director for the Americas 2008.
Jean-Marc HuëtChief Financial OfficerNationality: Dutch. Aged 42.Appointed Director May 2010.Appointed Chief Financial Officer February 2010.Executive Vice President and Chief Financial Officer, Bristol-Myers Squibb Company 2008-2009. Non-Executive Director, Mead Johnson Nutrition 2009. Chief Financial Officer, Royal Numico NV 2003-2007. Investment Banking, Goldman Sachs International 1993- 2003. Clement Trading 1991-1993.
Non-Executive Directors
Louise FrescoNationality: Dutch. Aged 60.Appointed May 2009.Professor of International Development and Sustainability at the University of Amsterdam. Supervisory Director, RABO Bank. Member, Social and Economic Council of the Netherlands (SER).
Ann FudgeNationality: American. Aged 60.Appointed May 2009.Non-Executive Director, Infosys, Novartis AG, General Electric Co., and Buzzient Inc. Chairman, US Programs Advisory Panel of Gates Foundation. Honorary director of Catalyst. Member, Foreign Affairs Policy Board, U.S. State Department. Member, Finance Committee of Harvard University.
Charles E GoldenNationality: American. Aged 65.Appointed May 2006.Non-Executive Director Indiana University Health, Hill-Rom Holdings, Eaton Corporation and the Lilly Endowment. Member of Finance Committee, Indianapolis Museum of Art. Executive Vice-President, Chief Financial Officer and Director, Eli Lilly and Company 1996-2006.
Byron E GroteNationality: American/British. Aged 63.Appointed May 2006.Executive Vice President, Corporate Business Activities, BP p.l.c. Member, UK Business – Government Forum on Tax and Globalisation 2008-2010. Vice-Chairman, UK Government’s Public Services Productivity Panel 1998-2000.
Sunil B MittalNationality: Indian. Aged 54.Appointed May 2011.Founder, Chairman and Group CEO, Bharti Enterprises. Awarded Global Economy Prize by the Kiel Institute in Germany and Global Vision Award by the US-India Business Council. President, Confederation of Indian Industry. Co-chairman, World Economic Forum at Davos and member of its International Business Council.
Hixonia NyasuluNationality: South African. Aged 57.Appointed May 2007.Chairman, Sasol Ltd. Non-Executive Director, Barloworld Ltd. Member, Advisory Board of JP Morgan S.A. Beneficiary, Sequel Property Investments.
Sir Malcolm RifkindNationality: British. Aged 65.Appointed May 2010.A Queen’s Counsel. Served in Cabinets of Margaret Thatcher and John Major, last position being that of Foreign Secretary. Non-Executive Director, Adam Smith International and Continental Farmers Group plc.
Paul WalshNationality: British. Aged 56.Appointed May 2009.Chief Executive Officer and Director, Diageo PLC. Non-Executive Director, FedEx Corporation Inc. and Avanti Communications Group PLC. Member, Business Advisory Group, Advisor to the Department of Energy and Climate Change. Member, International Business Leaders Forum.
Unilever Annual Report and Accounts 2011
Report of the Directors Governance

35
Unilever Leadership Executive (ULE) For Paul Polman and Jean-Marc Huët see page 34
Doug BaillieChief HR OfficerNationality: British. Aged 56.Appointed Chief HR Officer in February 2011. Appointed to ULE as President of Western Europe in May 2008. Joined Unilever 1978. Previous Unilever posts include: CEO Hindustan Unilever Limited; Group-Vice President South Asia 2006; Group Vice-President – Africa, Middle East & Turkey 2005; President Africa Regional Group 2004; National Manager Unilever South Africa 2000.
Professor Geneviève BergerChief Research & Development OfficerNationality: French. Aged 57.Appointed to ULE July 2008. Previous posts include: Chairman of the Health Advisory Board for the European Commission; Professor at the University of Paris and La Pitié-Salpêtrière Teaching Hospital; and Director General of the French Centre National de la Recherche Scientifique. Appointed Non-Executive Director of Smith & Nephew in March 2010.
Kevin HavelockRefreshmentNationality: British. Aged 54.Appointed to ULE November 2011.Joined Unilever 1985. Previous Unilever posts include: Chairman in Arabia and President Unilever USA. Previous external posts include: Vice President UK Advertising Association and Executive Committee of American Personal Care Council.
Alan JopeNorth AsiaNationality: British. Aged 47.Appointed to ULE November 2011.Joined Unilever 1985. Previous Unilever posts include: Chairman of Unilever Greater China; Global Category Leader for SCC and Dressings; Chief Operating Officer and subsequently President of Unilever’s combined Home and Personal Care business in North America; and Vice President, Personal Care Thailand.
Kees KruythoffNorth AmericaNationality: Dutch. Aged 43.Appointed to ULE November 2011.Joined Unilever 1993. Previous Unilever posts include: Executive Vice President Brazil 2008; Chairman of Unilever Foods South Africa 2004; and a member of the board of Unilever Bestfoods Asia 2002.
Dave LewisPersonal CareNationality: British. Aged 46.Appointed to ULE May 2010.Joined Unilever 1987. Previous posts include: President, Americas; Chairman, Unilever UK and Ireland; Managing Director, UK home and personal care business; Senior Vice President for Home and Personal Care, Central and Eastern Europe; Managing Director, Indonesia; Marketing Director, South America.
Harish ManwaniChief Operating OfficerNationality: Indian. Aged 58.Appointed Chief Operating Officer in November 2011.Appointed to ULE April 2005 as President Asia Africa. Joined Unilever 1976. Non-Executive Chairman, Hindustan Unilever. Previous Unilever posts include: President Asia, Africa, Central & Eastern Europe 2008; and Group President, Home and Personal Care, North America 2004.
Antoine de Saint-AffriqueFoodsNationality: French. Aged 47.Appointed to ULE November 2011.First joined Unilever 1989 until 1997; re-joined Unilever 2000. Previous Unilever posts include: Executive Vice President Skin category; and Executive Vice President Unilever Central & Eastern Europe. Vice President Marketing for Liebig Maille Amora, Danone Group/PAI 1997-2000. Non-Executive Director and member of the Audit Committee at Essilor International.
Pier Luigi SigismondiChief Supply Chain OfficerNationality: Italian. Aged 46.Appointed to ULE September 2009.Prior to joining Unilever, he joined Nestlé S.A. in 2002. Moved to Nestlé Mexico in 2005 as Vice President of Operations and R&D. Prior to Nestlé S.A. he was Vice President of Operations for A T Kearney.
Keith WeedChief Marketing and Communication OfficerNationality: British. Aged 50.Appointed to ULE April 2010.Joined Unilever 1983. Previous Unilever posts include: Executive Vice President for Global Home Care & Hygiene; Chairman of Lever Fabergé; SVP Hair and Oral Care. Non-Executive Director of Sun Products Corporation.
Jan ZijderveldEuropeNationality: Dutch. Aged 47.Appointed to ULE February 2011.Joined Unilever in 1988. Previous Unilever posts include: Executive Vice President South East Asia and Australasia; Chairman of Unilever Middle East North Africa; Chairman of Nordic ice cream business; Marketing Director Italy; European Olive Oil Category Director; and General Manager – Sauces and Dressings Europe.
Unilever Annual Report and Accounts 2011
Report of the Directors Governance
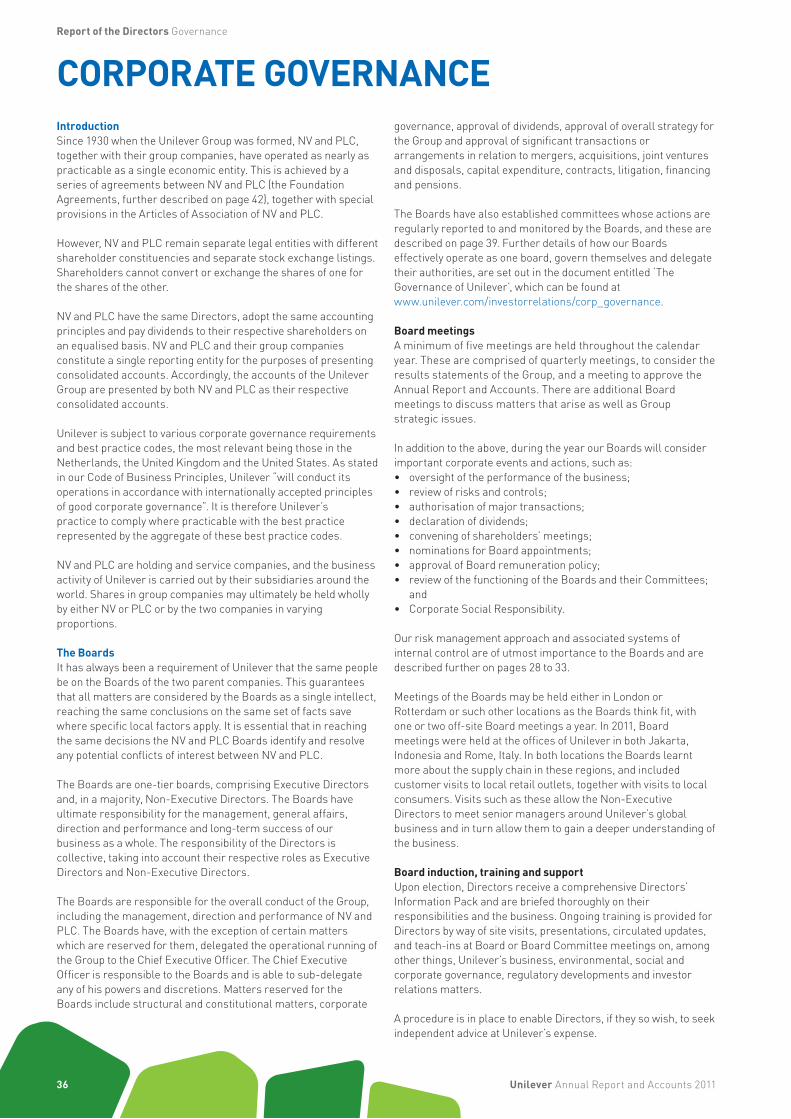
36
CORPORATE GOVERNANCEIntroductionSince 1930 when the Unilever Group was formed, NV and PLC, together with their group companies, have operated as nearly as practicable as a single economic entity. This is achieved by a series of agreements between NV and PLC (the Foundation Agreements, further described on page 42), together with special provisions in the Articles of Association of NV and PLC.
However, NV and PLC remain separate legal entities with different shareholder constituencies and separate stock exchange listings. Shareholders cannot convert or exchange the shares of one for the shares of the other.
NV and PLC have the same Directors, adopt the same accounting principles and pay dividends to their respective shareholders on an equalised basis. NV and PLC and their group companies constitute a single reporting entity for the purposes of presenting consolidated accounts. Accordingly, the accounts of the Unilever Group are presented by both NV and PLC as their respective consolidated accounts.
Unilever is subject to various corporate governance requirements and best practice codes, the most relevant being those in the Netherlands, the United Kingdom and the United States. As stated in our Code of Business Principles, Unilever “will conduct its operations in accordance with internationally accepted principles of good corporate governance”. It is therefore Unilever’s practice to comply where practicable with the best practice represented by the aggregate of these best practice codes.
NV and PLC are holding and service companies, and the business activity of Unilever is carried out by their subsidiaries around the world. Shares in group companies may ultimately be held wholly by either NV or PLC or by the two companies in varying proportions.
The BoardsIt has always been a requirement of Unilever that the same people be on the Boards of the two parent companies. This guarantees that all matters are considered by the Boards as a single intellect, reaching the same conclusions on the same set of facts save where specific local factors apply. It is essential that in reaching the same decisions the NV and PLC Boards identify and resolve any potential conflicts of interest between NV and PLC.
The Boards are one-tier boards, comprising Executive Directors and, in a majority, Non-Executive Directors. The Boards have ultimate responsibility for the management, general affairs, direction and performance and long-term success of our business as a whole. The responsibility of the Directors is collective, taking into account their respective roles as Executive Directors and Non-Executive Directors.
The Boards are responsible for the overall conduct of the Group, including the management, direction and performance of NV and PLC. The Boards have, with the exception of certain matters which are reserved for them, delegated the operational running of the Group to the Chief Executive Officer. The Chief Executive Officer is responsible to the Boards and is able to sub-delegate any of his powers and discretions. Matters reserved for the Boards include structural and constitutional matters, corporate
governance, approval of dividends, approval of overall strategy for the Group and approval of significant transactions or arrangements in relation to mergers, acquisitions, joint ventures and disposals, capital expenditure, contracts, litigation, financing and pensions.
The Boards have also established committees whose actions are regularly reported to and monitored by the Boards, and these are described on page 39. Further details of how our Boards effectively operate as one board, govern themselves and delegate their authorities, are set out in the document entitled ‘The Governance of Unilever’, which can be found atwww.unilever.com/investorrelations/corp_governance.
Board meetingsA minimum of five meetings are held throughout the calendar year. These are comprised of quarterly meetings, to consider the results statements of the Group, and a meeting to approve the Annual Report and Accounts. There are additional Board meetings to discuss matters that arise as well as Group strategic issues.
In addition to the above, during the year our Boards will consider important corporate events and actions, such as:• oversight of the performance of the business;• review of risks and controls;• authorisation of major transactions;• declaration of dividends;• convening of shareholders’ meetings;• nominations for Board appointments;• approval of Board remuneration policy;• review of the functioning of the Boards and their Committees;
and• Corporate Social Responsibility.
Our risk management approach and associated systems of internal control are of utmost importance to the Boards and are described further on pages 28 to 33.
Meetings of the Boards may be held either in London or Rotterdam or such other locations as the Boards think fit, with one or two off-site Board meetings a year. In 2011, Board meetings were held at the offices of Unilever in both Jakarta, Indonesia and Rome, Italy. In both locations the Boards learnt more about the supply chain in these regions, and included customer visits to local retail outlets, together with visits to local consumers. Visits such as these allow the Non-Executive Directors to meet senior managers around Unilever’s global business and in turn allow them to gain a deeper understanding of the business.
Board induction, training and supportUpon election, Directors receive a comprehensive Directors’ Information Pack and are briefed thoroughly on their responsibilities and the business. Ongoing training is provided for Directors by way of site visits, presentations, circulated updates, and teach-ins at Board or Board Committee meetings on, among other things, Unilever’s business, environmental, social and corporate governance, regulatory developments and investor relations matters.
A procedure is in place to enable Directors, if they so wish, to seek independent advice at Unilever’s expense.
Unilever Annual Report and Accounts 2011
Report of the Directors Governance

37
Board evaluationThe Chairman, in conjunction with the Vice-Chairman & Senior Independent Director, leads the process whereby the Boards formally assess their own performance, with the aim of helping to improve the effectiveness of the Boards and their Committees. The evaluation process consists of an internal exercise performed annually with an independent third-party evaluation carried out at least once every three years.
The internal evaluation process includes an extensive bespoke and confidential questionnaire for all Directors to complete. The detailed questionnaire invites comments on a number of areas including board responsibility, performance, operations, effectiveness, training and knowledge. In addition, each year the Chairman conducts a process of evaluating the performance and contribution of each Director, including an interview with each. The evaluation of the performance of the Chairman is led by the Vice-Chairman & Senior Independent Director and the Chairman leads the evaluation of the Chief Executive Officer, both by means of confidential, bespoke questionnaires. Committees of the Boards evaluate themselves annually under supervision of their respective chairmen taking into account the views of respective Committee members and the Boards.
As a result of the recommendations from the 2010 evaluation, Board meetings were organised to ensure there was sufficient time to allow for greater contributions from the Non-Executive Directors.
Action taken in 2011Following the commitment made in 2010, the Board conducted an external board evaluation process using an independent external third-party consultant, and further information is provided within the Chairman’s Statement on page 2.
Appointment of DirectorsDirectors are appointed by shareholders at the AGMs. All existing Directors, unless they are retiring, submit themselves for re-election every year, and shareholders vote to re-appoint them by a simple majority vote. A list of our current Directors and the periods during which they have served as such is set out on page 34.
In order to seek to ensure that NV and PLC have the same Directors, the Articles of Association of NV and PLC contain provisions which are designed to ensure that both NV and PLC shareholders are presented with the same candidates for election as Directors. This is achieved through a nomination procedure operated by the Boards of NV and PLC through Unilever’s Nomination Committee.
Based on the evaluation of the Boards, its Committees and its individual members, the Nomination Committee recommends to each Board a list of candidates for nomination at the AGMs of both NV and PLC. In addition, shareholders are able to nominate Directors. To do so they must put a resolution to both AGMs in line with local requirements. However, in order to ensure that the Boards remain identical, anyone being elected as a Director of NV must also be elected as a Director of PLC and vice versa. Therefore, if an individual fails to be elected to both companies then he or she will be unable to take their place on either Board.
The provisions in the Articles of Association for appointing Directors cannot be changed without the permission, in the case of NV, of the holders of the special ordinary shares numbered 1 to 2,400 inclusive and, in the case of PLC, of the holders of PLC’s deferred stock. The NV special ordinary shares may only be transferred to one or more other holders of such shares. The joint holders of both the NV special ordinary shares and the PLC deferred stock are N.V. Elma and United Holdings Limited, which are joint subsidiaries of NV and PLC. The Boards of N.V. Elma and United Holdings Limited comprise the members of the Nomination Committee, which comprise Non-Executive Directors of Unilever only.
Group SecretaryThe Group Secretary is available to advise all Directors on matters relating to the governance of the Group and ensures that Board procedures are complied with. The current Group Secretary is Tonia Lovell.
Board changesThe current Directors, with their biographies, are shown on page 34.
At the 2011 AGMs, Jeroen van der Veer retired as a Non-Executive Director and Sunil B Mittal was appointed as a Non-Executive Director. At the same AGMs, Paul Polman and Jean-Marc Huët were re-elected as Executive Directors, and Louise Fresco, Ann Fudge, Charles Golden, Byron Grote, Hixonia Nyasulu, Sir Malcolm Rifkind, Kees Storm, Michael Treschow and Paul Walsh were re-elected as Non-Executive Directors.
At the 2012 AGMs all current Executive and Non-Executive Directors will be nominated for re-election.
The 2012 AGM Notices are available on our website at www.unilever.com/agm from 28 March 2012.
Unilever Annual Report and Accounts 2011
Report of the Directors Governance
Our Directors
Non-Executive Directors
ChairmanUnilever has an independent Non-Executive Chairman and a Chief Executive Officer. There is a clear division of responsibilities between their roles.
The Chairman is primarily responsible for leadership of the Boards and ensuring their effectiveness. The Chairman sets the Boards’ agenda, ensures the Directors receive accurate, timely and clear information, promotes effective relationships and open communication between the Executive and Non-Executive Directors and maintains effective communication with major shareholders. With the Group Secretary, the Chairman will take the lead in providing a properly constructed induction programme for new Directors that is comprehensive, formal and tailored.
Senior Independent DirectorFollowing the retirement of Jeroen van der Veer at the 2011 AGMs, the Boards have appointed Kees Storm as Vice-Chairman & Senior Independent Director. He acts as their spokesman, and serves as an intermediary for the other Directors when necessary. He is also a point of contact for shareholders if they have concerns which cannot be resolved through the Chairman or Chief Executive Officer.
Non-Executive DirectorsThe Non-Executive Directors share responsibility, together with the Executive Directors, for the execution of the Boards’ duties. The role of Non-Executive Directors is essentially supervisory. As they make up the Committees of the Boards, it is important that they can be considered to be independent.
Role and ResponsibilitiesThe key elements of the role and responsibilities of the Non-Executive Directors are:• supervision of and advice to the Chief Executive Officer;• developing strategy with the Chief Executive Officer;• scrutiny of performance of the business and Chief Executive
Officer;• oversight of risks and controls;• reporting of performance;• remuneration of and succession planning for Executive
Directors; and• governance and compliance.
The Non-Executive Directors are chosen individually for their broad and relevant experience and international outlook, as well as for their independence and details of their various appointments can be found in their biographies on page 34. In consultation with the Nomination Committee, the Boards review both the adequacy of succession planning processes and succession planning itself at both Board and Unilever Leadership Executive (ULE) level. The profile set by the Boards for the Non-Executive Directors provides guiding principles for the composition of the Boards in line with the recommendations of applicable governance regulations and best practice, and takes into account the balance of skills, diversity, knowledge and experience on the Boards. The profile set by the Boards for the Non-Executive Directors and the schedule used for orderly succession planning can be found on our website atwww.unilever.com/investorrelations/corp_governance.
MeetingsThe Non-Executive Directors meet as a group, without the Executive Directors present, under the leadership of the Chairman to consider specific agenda items and wide-ranging business matters of relevance to the Group. In 2011 they met five times.
IndependenceFollowing the conclusion of a thorough review of all relevant relationships of the Non-Executive Directors, and their related or connected persons, our Boards consider all of our Non-Executive Directors to be independent of Unilever by reference to the criteria set out in ‘The Governance of Unilever’ and derived from the relevant best practice guidelines in the Netherlands, United Kingdom and United States.
None of our Non-Executive Directors are elected or appointed under any arrangement or understanding with any major shareholder, customer, supplier or otherwise.
RemunerationThe remuneration of the Non-Executive Directors is determined by the Boards, within the overall limit set by the shareholders at the AGMs in 2007, and is reported on page 59. We do not grant our Non-Executive Directors any personal loans or guarantees nor are they entitled to any severance payments. Details of the terms of appointment of our Non-Executive Directors can be seen on the Unilever website atwww.unilever.com/investorrelations/corp_governance.
TenureOur Non-Executive Directors submit themselves for re-election each year at the AGMs. Although the Dutch Corporate Governance Code sets the suggested length of tenure at a maximum of 12 years for Non-Executive Directors, they normally serve for a maximum of nine years in accordance with the UK Corporate Governance Code. Their nomination for re-election is subject to continued good performance which is evaluated by the Boards, based on the recommendations of the Nomination Committee.
Executive Directors
Chief Executive OfficerThe Chief Executive Officer has the authority to determine which duties regarding the operational management of the companies and their business enterprises will be carried out under his responsibility, by one or more Executive Directors or by one or more other persons. This provides a basis for the ULE that is chaired by and reports to the Chief Executive Officer. For ULE members’ biographies see page 35.
Executive DirectorsDuring 2011, Unilever had two Executive Directors, the Chief Executive Officer and Chief Financial Officer, who were also members of the ULE and are full-time employees of Unilever.
The Executive Directors submit themselves for re-election at the AGMs each year, and the Nomination Committee carefully considers each nomination for re-appointment. Executive Directors stop holding executive office on ceasing to be Directors.
We do not grant our Executive Directors any personal loans or guarantees.
38 Unilever Annual Report and Accounts 2011
Report of the Directors Governance
CORPORATE GOVERNANCE continued
39
There are no family relationships between any of our Executive Directors, members of the ULE or Non-Executive Directors, and none of our Executive Directors or other key management personnel are elected or appointed under any arrangement or understanding with any major shareholder, customer, supplier or otherwise.
Outside appointmentsUnilever recognises the benefit to the individual and to the Group of involvement by Unilever senior executives acting as directors of other companies outside the Unilever Group, broadening their experience and knowledge. For our Executive Directors, the number of outside directorships of listed companies is generally limited to one per individual, and in the case of publicly listed companies approval is required from the Chairman. Outside directorships must not involve an excessive commitment or conflict of interest. Fees paid in connection with an outside directorship may be retained by the individual, reflecting that any outside directorship is the responsibility of the individual and that Unilever takes no responsibility in this regard.
Director matters
Conflicts of interestWe attach special importance to avoiding conflicts of interest between NV and PLC and their Directors. The Boards are responsible for ensuring that there are rules in place to avoid conflicts of interest by Board members. Conflicts of interest are understood not to include transactions and other activities between companies in the Unilever Group.
Authorisation of situational conflicts is given by the Boards to the relevant Director in accordance with the Articles of Association of PLC. The authorisation includes conditions relating to keeping Unilever information confidential and to the exclusion from receiving and discussing relevant information at Board meetings. Situational conflicts are reviewed annually by the Boards as part of the determination of Director independence. In between those reviews Directors have a duty to inform the Boards of any relevant changes to the situation. A Director may not vote on, or be counted in a quorum in relation to, any resolution of the Boards in respect of any contract in which he or she has a material interest. The procedures that Unilever have put in place to deal with conflicts of interest have operated effectively.
Various formal mattersThe borrowing powers of NV Directors on behalf of NV are not limited by the Articles of Association of NV. PLC Directors have the power to borrow on behalf of PLC up to three times the PLC proportion of the adjusted capital and reserves of the Unilever Group, as defined in PLC’s Articles of Association, without the approval of shareholders (any exceptions requiring an ordinary resolution).
IndemnificationDirectors’ indemnification, including the terms thereof, is provided for in NV’s Articles of Association. The power to indemnify Directors is provided for in PLC’s Articles of Association and deeds of indemnity have been issued to all PLC Directors. Appropriate qualifying third-party Directors’ and Officers’ liability insurance was in place for all Unilever Directors throughout 2011 and is currently in force.
In addition, PLC provides indemnities (including, where applicable, a qualifying pension scheme indemnity provision) to the directors from time to time of two subsidiaries that act as trustee respectively of two of Unilever’s UK pension schemes. Appropriate trustee liability insurance is also in place.
Our Committees
Board CommitteesThe Boards have established four Board Committees: the Audit Committee; the Corporate Responsibility and Reputation Committee; the Nomination Committee; and the Remuneration Committee, all formally set up by Board resolutions with defined remits. They are made up solely of Non-Executive Directors and report regularly to the Boards.
All Committees are provided with sufficient resources to undertake their duties, and the terms of reference for each Committee are contained within ‘The Governance of Unilever’ which is available atwww.unilever.com/investorrelations/corp_governance.
The reports of each Committee can be found on pages 46 to 59.
Management Committee
Disclosure CommitteeThe Boards have set up, through the Chief Executive Officer, a Disclosure Committee which is responsible for helping the Boards ensure that financial and other information required to be disclosed publicly is disclosed in a timely manner and that the information that is disclosed is complete and accurate in all material aspects.
The Committee comprises the Group Controller (Chairman), the Group Secretary and Chief Legal Officer, the Group Treasurer and the NV and PLC Deputy Secretaries.
Unilever Annual Report and Accounts 2011
Report of the Directors Governance
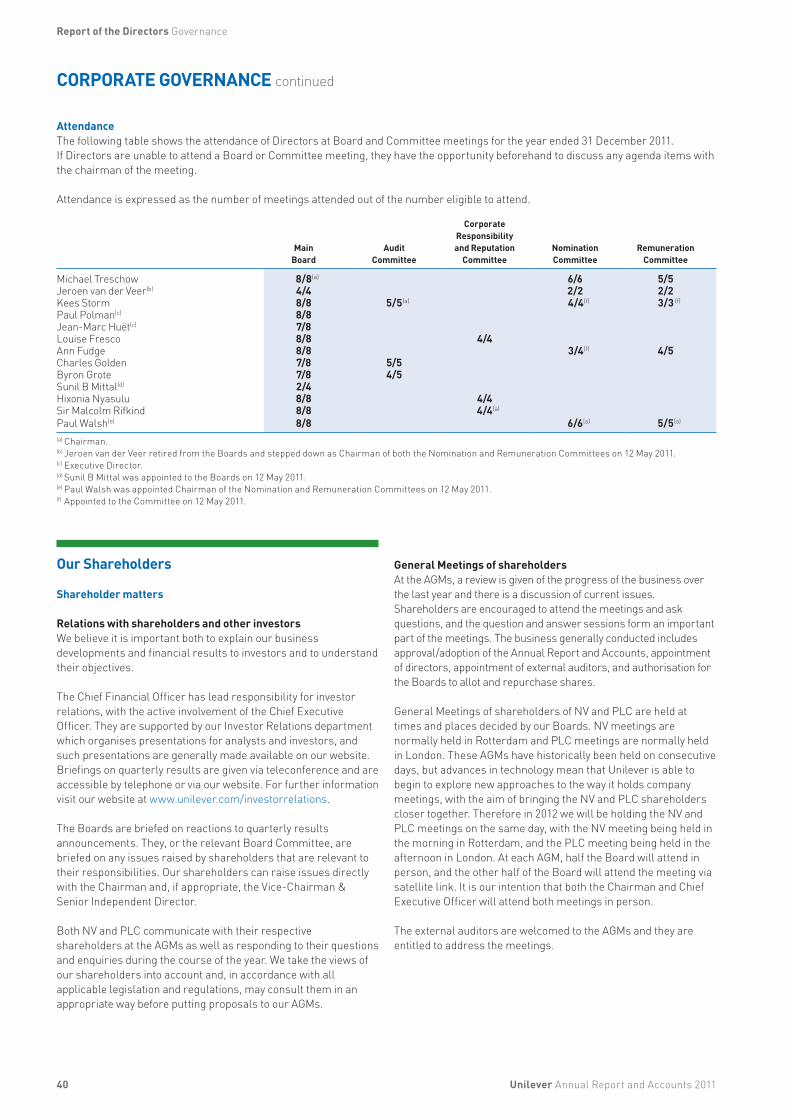
40
CORPORATE GOVERNANCE continued
AttendanceThe following table shows the attendance of Directors at Board and Committee meetings for the year ended 31 December 2011. If Directors are unable to attend a Board or Committee meeting, they have the opportunity beforehand to discuss any agenda items with the chairman of the meeting.
Attendance is expressed as the number of meetings attended out of the number eligible to attend.
Main Board
Audit Committee
Corporate Responsibility and Reputation
CommitteeNomination Committee
Remuneration Committee
Michael Treschow 8/8(a) 6/6 5/5Jeroen van der Veer(b) 4/4 2/2 2/2Kees Storm 8/8 5/5(a) 4/4(f) 3/3 (f)
Paul Polman(c) 8/8Jean-Marc Huët(c) 7/8Louise Fresco 8/8 4/4Ann Fudge 8/8 3/4(f) 4/5Charles Golden 7/8 5/5Byron Grote 7/8 4/5Sunil B Mittal(d) 2/4Hixonia Nyasulu 8/8 4/4Sir Malcolm Rifkind 8/8 4/4(a)
Paul Walsh(e) 8/8 6/6(a) 5/5(a)
(a) Chairman.(b) Jeroen van der Veer retired from the Boards and stepped down as Chairman of both the Nomination and Remuneration Committees on 12 May 2011.(c) Executive Director.(d) Sunil B Mittal was appointed to the Boards on 12 May 2011.(e) Paul Walsh was appointed Chairman of the Nomination and Remuneration Committees on 12 May 2011.(f) Appointed to the Committee on 12 May 2011.
Our Shareholders
Shareholder matters
Relations with shareholders and other investorsWe believe it is important both to explain our business developments and financial results to investors and to understand their objectives.
The Chief Financial Officer has lead responsibility for investor relations, with the active involvement of the Chief Executive Officer. They are supported by our Investor Relations department which organises presentations for analysts and investors, and such presentations are generally made available on our website. Briefings on quarterly results are given via teleconference and are accessible by telephone or via our website. For further information visit our website at www.unilever.com/investorrelations.
The Boards are briefed on reactions to quarterly results announcements. They, or the relevant Board Committee, are briefed on any issues raised by shareholders that are relevant to their responsibilities. Our shareholders can raise issues directly with the Chairman and, if appropriate, the Vice-Chairman & Senior Independent Director.
Both NV and PLC communicate with their respective shareholders at the AGMs as well as responding to their questions and enquiries during the course of the year. We take the views of our shareholders into account and, in accordance with all applicable legislation and regulations, may consult them in an appropriate way before putting proposals to our AGMs.
General Meetings of shareholdersAt the AGMs, a review is given of the progress of the business over the last year and there is a discussion of current issues. Shareholders are encouraged to attend the meetings and ask questions, and the question and answer sessions form an important part of the meetings. The business generally conducted includes approval/adoption of the Annual Report and Accounts, appointment of directors, appointment of external auditors, and authorisation for the Boards to allot and repurchase shares.
General Meetings of shareholders of NV and PLC are held at times and places decided by our Boards. NV meetings are normally held in Rotterdam and PLC meetings are normally held in London. These AGMs have historically been held on consecutive days, but advances in technology mean that Unilever is able to begin to explore new approaches to the way it holds company meetings, with the aim of bringing the NV and PLC shareholders closer together. Therefore in 2012 we will be holding the NV and PLC meetings on the same day, with the NV meeting being held in the morning in Rotterdam, and the PLC meeting being held in the afternoon in London. At each AGM, half the Board will attend in person, and the other half of the Board will attend the meeting via satellite link. It is our intention that both the Chairman and Chief Executive Officer will attend both meetings in person.
The external auditors are welcomed to the AGMs and they are entitled to address the meetings.
Unilever Annual Report and Accounts 2011
Report of the Directors Governance

41
Voting rightsShareholders that hold NV shares on the record date are entitled to attend and vote at NV General Meetings. Dutch law requires that the record date is set at a date 28 days before the meeting, and shares are not blocked between the record date and the date of the meeting. NV shareholders can cast one vote for each €0.16 nominal capital that they hold. This means that they can cast one vote for each NV ordinary share, or NV New York Registry Share. Shareholders can vote in person or by proxy. Similar arrangements apply to holders of depositary receipts issued for NV shares and the holders of NV preference shares. PLC shareholders can cast one vote for each 31⁄9p nominal capital that they hold. This means shareholders can cast one vote for each PLC ordinary share, or PLC American Depositary Receipt of shares. Proxy appointments need to be with our Registrars 48 hours before the meeting and the shareholding at this time will determine both the right to vote and the ability to attend the meeting.
More information on the exercise of voting rights can be found in NV’s and PLC’s Articles of Association and in the respective Notices of Meetings which can be found on our website atwww.unilever.com/agm.
Holders of NV New York Registry Shares or PLC American Depositary Receipts of shares will receive a proxy form enabling them to authorise and instruct a notary public or Citibank, N.A. respectively to vote on their behalf at the General Meeting of NV or PLC.
Shares held in treasury will not be voted upon.
Voting on each of the resolutions contained in the Notice of AGMs is conducted by poll. The final vote is published at the meetings and the outcome of the votes, including the proxy votes, is put on Unilever’s website.
Shareholder proposed resolutionsShareholders of NV may propose resolutions if they individually or together hold 1% of NV’s issued capital in the form of shares or depositary receipts for shares, or if they individually or together hold shares or depositary receipts worth €50 million. Shareholders who together represent at least 10% of the issued capital of NV can also requisition Extraordinary General Meetings to deal with specific resolutions.
Shareholders of PLC who together hold shares representing at least 5% of the total voting rights of PLC, or 100 shareholders who hold on average £100 each in nominal value of PLC share capital, can require PLC to propose a resolution at a General Meeting. PLC shareholders holding in aggregate 5% of the issued PLC ordinary shares are able to convene a General Meeting of PLC.
Required majoritiesResolutions are usually adopted at NV and PLC shareholder meetings by an absolute majority of votes cast, unless there are other requirements under the applicable laws or NV’s or PLC’s Articles of Association. For example, there are special requirements for resolutions relating to the alteration of the Articles of Association, the liquidation of NV or PLC and the alteration of the Equalisation Agreement.
A proposal to alter the Articles of Association of NV can only be made by the Board of NV. A proposal to alter the Articles of Association of PLC can be made either by the Board of PLC or by shareholders in the manner permitted under the UK Companies Act 2006. Unless expressly specified to the contrary in the Articles of Association of PLC, PLC’s Articles of Association may be amended by a special resolution. Proposals to alter the provisions in the Articles of Association of NV and PLC respectively relating to the unity of management require the prior approval of meetings of the holders of the NV special shares and the PLC deferred stock. The Articles of Association of both NV and PLC can be found on our website atwww.unilever.com/investorrelations/corp_governance.
Right to hold sharesUnilever’s constitutional documents place no limitations on the right to hold NV and PLC shares. There are no limitations on the right to hold or exercise voting rights on the ordinary shares of NV and PLC imposed by foreign law.
Electronic communicationShareholders of NV and PLC can electronically appoint a proxy to vote on their behalf at the respective AGM. Shareholders of PLC can also choose to receive electronic notification that the Annual Report and Accounts and Notice of AGMs have been published on our website, instead of receiving printed copies.
Share capital matters
Margarine Union (1930) Limited: Conversion RightsThe first Viscount Leverhulme was the founder of the company which became PLC. When he died in 1925, he left in his will a large number of PLC shares in various trusts.
When the will trusts were varied in 1983, the interests of the beneficiaries of his will were also preserved. Four classes of special shares were created in Margarine Union (1930) Limited, a subsidiary of PLC. One of these classes can be converted at the end of the year 2038 into 70,875,000 PLC ordinary shares of 31⁄9p each. This currently represents 5.4% of PLC’s issued ordinary capital. These convertible shares replicate the rights which the descendants of the first Viscount would have had under his will. This class of the special shares only has a right to dividends in specified circumstances, and no dividends have yet been paid.
Foundation Unilever NV Trust OfficeThe Foundation Unilever NV Trust Office (Stichting Administratiekantoor Unilever N.V.) is a trust office with a board independent of Unilever. As part of its corporate objects, the Foundation issues depositary receipts in exchange for the ordinary and 7% preference shares it holds in NV. These depositary receipts are listed on Euronext Amsterdam, as are the NV ordinary and 7% preference shares themselves.
Unilever Annual Report and Accounts 2011
Report of the Directors Governance
42
CORPORATE GOVERNANCE continued
Holders of depositary receipts can under all circumstances exchange their depositary receipts for the underlying shares (and vice versa), and are entitled to dividends and all economic benefits on the underlying shares held by the Foundation. They can attend all General Meetings of NV, either personally or by proxy, and also have the right to speak. They can under all circumstances and without limitation exercise their voting rights. The Foundation only votes shares that are not represented at a General Meeting. The Foundation votes in such a way as it deems to be in the interests of the holders of the depositary receipts. This voting policy is laid down in the Conditions of Administration that apply to the depositary receipts.
The Foundation’s shareholding fluctuates daily. Its holdings on 28 February 2012 were 1,252,279,716 NV ordinary shares (73.03%) and 9,776 NV 7% cumulative preference shares (33.71%).
The members of the board at the Foundation are Mr J H Schraven (chairman), Mr P P de Koning, Prof Emeritus Dr L Koopmans and Mr A A Olijslager. The Foundation reports periodically on its activities. Further information on the Foundation, including its Articles of Association and Conditions of Administration, can be found on its website at www.administratiekantoor-unilever.nl.
Unilever considers the arrangements of the Foundation appropriate and in the interest of NV and its shareholders given the size of the voting rights attached to the financing preference shares and the relatively low attendance of holders of ordinary shares at the General Meetings of NV.
Further information on the share capital of NV and PLC is given on pages 123 and 124.
Our Foundation Agreements
Foundation AgreementsThe Unilever Group is created and maintained by a series of agreements between the parent companies, NV and PLC, together with special provisions in their respective Articles of Association, which are together known as the Foundation Agreements. These agreements enable Unilever to achieve unity of management, operations, shareholders’ rights, purpose and mission and further information on these agreements is provided below and in the document entitled ‘The Governance of Unilever’ which is available on our website at www.unilever.com/investorrelations/corp_governance.
NV’s Articles of Association contain, among other things, the objects clause, which sets out the scope of activities that NV is authorised to undertake. They are drafted to give a wide scope and provide that the primary objectives are: to carry on business as a holding company; to manage any companies in which it has an interest; and to operate and carry into effect the Equalisation Agreement. At the 2010 PLC AGM, the shareholders agreed that the objects clause be removed from PLC’s Articles of Association so that there are no restrictions on its objects.
NV’s and PLC’s Articles of Association, together with the additional three Foundation Agreements detailed below, can be found on our website at www.unilever.com/investorrelations/corp_governance.
Equalisation AgreementThe Equalisation Agreement makes the economic position of the shareholders of NV and PLC, as far as possible, the same as if they held shares in a single company. The Equalisation Agreement regulates the mutual rights of the shareholders of NV and PLC. Under the Equalisation Agreement, NV and PLC must adopt the same financial periods and accounting policies.
Each NV ordinary share represents the same underlying economic interest in the Unilever Group as each PLC ordinary share.
The Deed of Mutual CovenantsThe Deed of Mutual Covenants provides that NV and PLC and their respective subsidiary companies shall co-operate in every way for the purpose of maintaining a common operating policy. They shall exchange all relevant information about their respective businesses – the intention being to create and maintain a common operating platform for the Unilever Group throughout the world. The Deed also contains provisions for the allocation of assets between NV and PLC.
The Agreement for Mutual Guarantees of BorrowingUnder the Agreement for Mutual Guarantees of Borrowing between NV and PLC, each company will, if asked by the other, guarantee the borrowings of the other. The two companies also jointly guarantee the borrowings of their subsidiaries. These arrangements are used, as a matter of financial policy, for certain significant public borrowings. They enable lenders to rely on our combined financial strength.
Unilever Annual Report and Accounts 2011
Report of the Directors Governance
43
Our requirements and compliance
Requirements and compliance – generalUnilever is subject to corporate governance requirements in the Netherlands, the UK and as a foreign private issuer in the US. In this section we report on our compliance with the corporate governance regulations and best practice codes applicable in the Netherlands and the UK and we also describe compliance with corporate governance standards in the US.
Under the European Takeover Directive as implemented in the Netherlands and the UK, the UK Companies Act 2006 and rules of the US Securities and Exchange Commission, Unilever is required to provide information on contracts and other arrangements essential or material to the business of the Group. We believe we do not have any such contracts or arrangements.
Our governance arrangements are designed and structured to promote and further the interests of our companies and their shareholders. The Boards however reserve the right, in cases where they decide such to be in the interests of the companies or our shareholders, to depart from that which is set out in the present and previous sections in relation to our corporate governance. Any such changes will be reported in future Annual Reports and Accounts and, when necessary, through changes to the relevant documents published on our website. As appropriate, proposals for change will be put to our shareholders for approval.
Our principal risks and our approach to risk management and systems of internal control are described on pages 28 to 33.
Further information can be found on our website and in the document entitled ‘The Governance of Unilever’ which is available on our website atwww.unilever.com/Investorrelations/corp_governance.
Requirements – European UnionFollowing implementation of the European Takeover Directive, certain information is required to be disclosed in relation to control and share structures and interests of NV and PLC. Such disclosures, which are not covered elsewhere in this Annual Report and Accounts, include the following:• there are no requirements to obtain the approval of NV or PLC,
or of other holders of securities in NV or PLC, for a transfer of such securities. The NV special ordinary shares may only be transferred to one or more holders of such shares;
• there are no arrangements by which, with NV’s or PLC’s co-operation, financial rights carried by securities are held by a person other than the holder of such securities;
• NV and PLC are not aware of any agreements between holders of securities which may result in restrictions on the transfer of such securities or on voting rights;
• neither NV nor PLC are parties to any significant agreements which include provisions that take effect, alter or terminate such agreement upon a change of control following a takeover bid;
• NV and PLC do not have any agreements with any Director or employee that would provide compensation for loss of office or employment resulting from a takeover except that most of Unilever’s share schemes contain provisions which operate in the event of a takeover of Unilever, which provisions may for instance cause options or awards granted to employees under such schemes to vest after a takeover or be exchanged into new awards for shares in another entity; and
• the Trustees of the PLC employee share trusts may vote or abstain in any way they think fit and in doing so may take into account both financial and non-financial interests of the beneficiaries of the employee share trusts or their dependants. Historically the Trustees tend not to exercise this right.
The NetherlandsNV is required to state in its Annual Report and Accounts whether it complies or will comply with the Principles and best practice provisions (‘bpp’) of the Dutch Corporate Governance Code (the Dutch Code) and, if it does not comply, to explain the reasons for this. NV complies with almost all of the principles and best practice provisions of the Dutch Code, a copy of which is available at www.commissiecorporategovernance.nl. The text that follows sets out certain statements that the Dutch Code invites us to make to our shareholders that are not included elsewhere in this Annual Report and Accounts as well as areas of non-compliance.
Unilever places a great deal of importance on corporate responsibility and sustainability as is evidenced by our vision to double the size of the company while reducing our environmental impact. With respect to our performance measures Unilever is keen to ensure focus on key financial performance measures which we believe to be the drivers of shareholder value creation and relative total shareholder return. Unilever therefore believes that the interests of the business and shareholders are best served by linking the long-term share plans to the measures as described in the Directors’ Remuneration Report and has not included a non-financial performance indicator (Principle II.2 and bpp II.2.3).
Risk management and controlAs a result of the review of the Audit Committee (as described in its report on pages 46 and 47) the Boards believe that as regards financial reporting risks, the risk management and control systems provide reasonable assurance that the financial statements do not contain any errors of material importance and the risk management and control systems have worked properly in 2011 (bpp ll.1.5).
The aforesaid statements are not statements in accordance with the requirements of Section 404 of the US Sarbanes-Oxley Act of 2002.
Retention period of sharesThe Dutch Code recommends that shares granted to Executive Directors must be retained for a period of at least five years (bpp II.2.5). Our shareholder-approved remuneration policy requires Executive Directors to build and retain a personal shareholding in Unilever. The Boards believe that this is in line with the spirit of the Dutch Code.
Severance payIt is our policy to set the level of severance payments for Directors at no more than one year’s salary, unless the Boards, at the proposal of the Remuneration Committee, find this manifestly unreasonable given circumstances or unless otherwise dictated by applicable law (bpp II.2.8).
Conflicts of interestIn the event of a potential conflict of interest, the provisions of the Dutch Code (Principles II.3 and III.6) are applied. Conflicts of interest are not understood to include transactions and other activities between companies in the Unilever Group.
Unilever Annual Report and Accounts 2011
Report of the Directors Governance
44
CORPORATE GOVERNANCE continued
Remuneration CommitteeThe Remuneration Committee may not be chaired by a Board member who is a member of the management board of another listed company (bpp III.5.11). Paul Walsh is Chairman of the Remuneration Committee and has been CEO of Diageo Plc since 2000. Paul has profound knowledge and understanding of remuneration matters at companies operating globally and understands how remuneration policies support the growth objective. His experience and insight of remuneration matters is very valuable to Unilever. The Boards believe that Mr Walsh is ideally placed for the position of Chairman of the Remuneration Committee.
Financing preference sharesNV issued 6% and 7% cumulative preference shares between 1927 and 1964. Their voting rights are based on their nominal value, as prescribed by Dutch law. The Dutch Code recommends that the voting rights on such shares should, in any event when they are newly issued, be based on their economic value rather than on their nominal value (bpp IV.1.2). NV agrees with this principle but cannot unilaterally reduce voting rights of its outstanding preference shares.
Anti-takeover constructions and control over the companyNV confirms that it has no anti-takeover constructions, in the sense of constructions that are intended solely, or primarily, to block future hostile public offers for its shares (bpp IV.3.11). Nor does NV have any constructions whose specific purpose is to prevent a bidder, after acquiring 75% of the capital, from appointing or dismissing members of the Board and subsequently altering the Articles of Association. The acquisition through a public offer of a majority of the shares in a company does not under Dutch law preclude in all circumstances the continued right of the board of the company to exercise its powers.
Meetings of analysts and presentations to investorsWe have extensive procedures for handling relations with and communicating with shareholders, investors, analysts and the media (also see page 40). The important presentations and meetings are conducted as far as practicable in accordance with the Dutch Code (bpp IV.3.1). Due to their large number and overlap in information, however, some of the less important ones are not announced in advance, made accessible to everyone or put on our website.
Corporate Governance StatementNV is required to make a statement concerning corporate governance as referred to in article 2a of the decree on additional requirements for annual reports (Vaststellingsbesluit nadere voorschriften inhoud jaarverslag) with effect from 1 January 2010 (the ‘Decree’). The information required to be included in this corporate governance statement as described in articles 3, 3a and 3b of the Decree can be found in the following sections of this Report and Accounts:• the information concerning compliance with the Dutch
Corporate Governance Code, as required by article 3 of the Decree, can be found under ‘Corporate Governance’ within the section ‘Requirements – the Netherlands’;
• the information concerning Unilever’s risk management and control frameworks relating to the financial reporting process, as required by article 3a(a) of the Decree, can be found under ‘Outlook and risks’ on pages 28 to 33 and within the relevant sections under ‘Corporate Governance’;
• the information regarding the functioning of NV’s General Meeting of shareholders, and the authority and rights of NV’s shareholders, as required by article 3a(b) of the Decree, can be found within the relevant sections under ‘Corporate Governance’;
• the information regarding the composition and functioning of NV’s Board and its Committees, as required by article 3a(c) of the Decree, can be found within the relevant sections under ‘Corporate Governance’; and
• the information concerning the inclusion of the information required by the decree Article 10 European Takeover Directive, as required by article 3b of the Decree, can be found within the relevant sections under ‘Corporate Governance’ and within the section ‘Shareholder information, Analysis of shareholding’.
The United KingdomPLC is required, as a company that is incorporated in the UK and listed on the London Stock Exchange, to state how it has applied the main principles and how far it has complied with the provisions set out in the 2010 UK Corporate Governance Code, a copy of which is available at www.frc.org.uk.
In the preceding pages we have described how we have applied the main principles and the provisions in the UK Code. In 2011, PLC complied with all UK Code provisions, with the exception of provision E.2.3 of the Code (which provides that the chairmen of the audit, remuneration and nomination committees be available to answer questions at the AGM and that all directors attend the AGM) as Kees Storm, who is Chairman of the Audit Committee, was unable to attend the AGM in May because he was required to attend a scheduled board meeting of another public company on the same day.
Risk management and controlOur approach to risk management and systems of internal control is in line with the recommendations in the report on ‘Internal Control – Revised Guidance for Directors on the UK Combined Code’ (‘The Turnbull guidance’).
It is Unilever’s practice to bring acquired companies within the Group’s governance procedures as soon as is practicable and in any event by the end of the first full year of operation.
The United StatesBoth NV and PLC are listed on the New York Stock Exchange and must therefore comply with such of the requirements of US legislation, such as the Sarbanes-Oxley Act of 2002, regulations enacted under US securities laws and the Listing Standards of the New York Stock Exchange (NYSE) as are applicable to foreign private issuers, copies of which are available at www.sec.gov and www.nyse.com. In some cases the requirements are mandatory and in other cases the obligation is to ‘comply or explain’.
We have complied in all material respects with the requirements concerning corporate governance that were in force during 2011. Attention is drawn in particular to the Report of the Audit Committee on pages 46 and 47.
Unilever Annual Report and Accounts 2011
Report of the Directors Governance

45
Actions already taken to ensure compliance in all material respects that are not specifically disclosed elsewhere or otherwise clear from reading this report include:• the Code of Business Principles and Code Policies declaration
undertaken by all senior financial officers;• the issuance of instructions restricting the employment of
former employees of the audit firm; and• the establishment of a policy on reporting requirements under
SEC rules relating to standards of professional conduct for US attorneys.
In each of these cases, existing practices were revised and/or documented in such a way as to conform to the new requirements.
All senior executives and senior financial officers have declared their understanding of and compliance with Unilever’s Code of Business Principles and the related Code Policies. No waiver from any provision of the Code of Business Principles or Code Policies was granted to any of the persons falling within the scope of the SEC requirements in 2011. The Code Policies include mandatory requirements covering (but not limited to) the following areas: accurate records, reporting & accounting; anti-bribery; avoiding conflicts of interest; gifts & entertainment; preventing insider trading; political activities & political donations; contact with government, regulators & non-governmental organisations; respect, dignity & fair treatment; external communications – the media, investors & analysts. Our Code of Business Principles is available on our website at www.unilever.com/investorrelations/corp_governance.
We are required by US securities laws and the Listing Standards of the NYSE to have an Audit Committee that satisfies Rule 10A-3 under the Exchange Act and the Listing Standards of the NYSE. We are compliant with these requirements. We are also required to disclose any significant ways in which our corporate governance practices differ from those typically followed by US companies listed on the NYSE.
In addition to the information we have given to you in this report about our corporate governance arrangements, further details are provided in the document entitled ‘The Governance of Unilever’, which is on our website at www.unilever.com/investorrelations/corp_governance.
We are compliant with the Listing Standards of the NYSE applicable to foreign private issuers. Our corporate governance practices do not significantly differ from those required of US companies listed on the NYSE.
We also confirm that our shareholders have the opportunity to vote on certain equity compensation plans.
Risk management and controlBased on an evaluation by the Boards, the Chief Executive Officer and the Chief Financial Officer concluded that the design and operation of the Group’s disclosure controls and procedures, including those defined in United States Securities Exchange Act of 1934 – Rule 13a – 15(e), as at 31 December 2011 were effective, and that subsequently until the date of the approval of the Annual Report and Accounts by the Boards, there have been no significant changes in the Group’s internal controls, or in other factors that could significantly affect those controls.
Unilever is required by Section 404 of the US Sarbanes-Oxley Act of 2002 to report on the effectiveness of internal control over financial reporting. This requirement will be reported on separately and will form part of Unilever’s Annual Report on Form 20-F.
Unilever Annual Report and Accounts 2011
Report of the Directors Governance

46
REPORT OF THE AUDIT COMMITTEE
The role and terms of reference of the Audit Committee is to assist the Boards in fulfilling their oversight responsibilities regarding the integrity of Unilever’s financial statements, risk management and internal control, compliance with legal and regulatory requirements, the external auditors’ performance, qualifications and independence, and the performance of the internal audit function.
The Audit Committee is comprised only of independent Non-Executive Directors with a minimum requirement of three such members. During 2011 the Committee comprised Kees Storm (Chairman), Charles Golden and Byron Grote. The Committee met five times in 2011. All Committee members attended all the meetings except Byron Grote who attended four out of the five meetings. The Boards have satisfied themselves that the current members of the Audit Committee are competent in financial matters and have recent and relevant experience. For the purposes of the US Sarbanes-Oxley Act of 2002, Kees Storm was the Audit Committee’s financial expert up to 28 February 2012. Byron Grote will take over the Chairmanship of the Committee on 29 February 2012 and will become the Audit Committee’s financial expert on this date.
During the year, principal activities were as follows:
Financial statementsThe Committee considered reports from the Chief Financial Officer on the quarterly and annual financial statements, including other financial statements and disclosures prior to their publication and issues reviewed by the Disclosure Committee. They also reviewed the Annual Report and Accounts and Annual Report on Form 20-F, the quarterly performance and accompanying press releases prior to publication. These reviews incorporated the accounting policies and key judgements and estimates underpinning the financial statements as disclosed within Note 1 on pages 68 and 69, including:• goodwill and intangible assets;• provisions;• business combinations; • financial instruments;• pensions;• taxation; and• going concern assessment.
The Committee was satisfied with the accounting treatments adopted.
Risk management and internal control arrangementsThe Committee reviewed Unilever’s overall approach to risk management and control, and its processes, outcomes and disclosure. It reviewed:• the Controller’s Quarterly Risk and Control Status Report
(which includes matters arising from the Global Code and Policy Committee), including Code cases relating to frauds and financial crimes and significant complaints received through the global Ethics Hotline;
• Corporate Risks, including regular reviews of the 2011 risks and the 2012 Focus Risks identified by the Unilever Leadership Executive;
• Management’s work to implement a simplified policy framework that directly underpins the Code of Business Principles;
• progress on management’s Effective Financial Control & Reporting project;
• the application of information and communication technology; • tax planning, insurance arrangements and related risk
management;• treasury policies, including debt issuance and hedging; • commodity risk management, governance and derivatives
hedging; and• litigation and regulatory investigations.
The Committee reviewed the application of the requirements under Section 404 of the US Sarbanes-Oxley Act of 2002 with respect to internal controls over financial reporting.
In addition, the Committee reviewed the annual financial plan and Unilever’s dividend policy and dividend proposals.
In fulfilling its oversight responsibilities in relation to risk management, internal control and the financial statements, the Committee met regularly with senior members of management and are fully satisfied with the key judgements taken.
Internal audit functionThe Committee reviewed Corporate Audit’s audit plan for the year and agreed its budget and resource requirements. It reviewed interim and year-end summary reports and management’s response. The Committee carried out a formal evaluation of the performance of the internal audit function and was satisfied with the effectiveness of the function. The Committee met independently with the Chief Auditor during the year and discussed the results of the audits performed during the year.
Audit of the Annual AccountsPricewaterhouseCoopers, Unilever’s external auditors and independent registered public accounting firm, reported in depth to the Committee on the scope and outcome of the annual audit, including their audit of internal controls over financial reporting as required by Section 404 of the US Sarbanes-Oxley Act of 2002. Their reports included accounting matters, governance and control, and accounting developments.
The Committee held independent meetings with the external auditors during the year and discussed and challenged their audit plan, including their assessment of the financial reporting risk profile of the Group. The Committee discussed the views and conclusions of PricewaterhouseCoopers regarding management’s treatment of significant transactions and areas of judgement during the year and PricewaterhouseCoopers confirmed they were satisfied that these had been treated appropriately in the financial statements.
External auditors The Audit Committee conducted a formal evaluation of the effectiveness of the external audit process. The Committee has considered the tenure, quality and fees of the auditors and determined that a tender for the audit work is not necessary. As a result, the Committee has approved the extension of the current external audit contract by one year, and recommended to the Boards the re-appointment of external auditors. On the recommendation of the Audit Committee, the Directors will be proposing the re-appointment of PricewaterhouseCoopers at the AGMs in May 2012 (see pages 116 and 122).
Unilever Annual Report and Accounts 2011
Report of the Directors Governance
47
Both Unilever and the auditors have for many years had safeguards in place to avoid the possibility that the auditors’ objectivity and independence could be compromised. The Committee reviewed the report from PricewaterhouseCoopers on the actions they take to comply with the professional and regulatory requirements and best practice designed to ensure their independence from Unilever.
The Committee also reviewed the statutory audit, audit related and non-audit related services provided by PricewaterhouseCoopers, and compliance with Unilever’s documented approach, which prescribes in detail the types of engagements, listed below, for which the external auditors can be used:• statutory audit services, including audit of subsidiaries;• audit related engagements – services that involve attestation,
assurance or certification of factual information that may be required by external parties;
• non-audit related services – work that our auditors are best placed to undertake, which may include:– tax services – all significant tax work is put to tender;– acquisition and disposal services, including related due
diligence, audits and accountants’ reports; and– internal control reviews.
Several types of engagements are prohibited, including:• bookkeeping or similar services;• systems design and implementation related to financial
information or risk management;• valuation services;• actuarial services;• internal audit; and• staff secondments to a management function.
All audit related engagements over €250,000 and non-audit related engagements over €100,000 require specific advance approval of the Audit Committee Chairman. The Committee further approves all engagements below these levels which have been authorised by the Group Controller. These authorities are reviewed regularly and, where necessary, updated in the light of internal developments, external developments and best practice.
Audit Committee terms of referenceThe Audit Committee’s terms of reference are reviewed annually by the Committee taking into account relevant legislation and recommended good practice. The terms of reference are contained within ‘The Governance of Unilever’ which is available on our website at www.unilever.com/investorrelations/corp_governance.
Board Assessment of the Audit CommitteeThe Board evaluated the performance of the Committee and the Committee carried out a self-assessment of its performance, and concluded it was performing effectively.
Kees Storm Chairman of the Audit CommitteeCharles GoldenByron Grote
Unilever Annual Report and Accounts 2011
Report of the Directors Governance
48
REPORT OF THE CORPORATE RESPONSIBILITY AND REPUTATION COMMITTEE
Terms of ReferenceThe Corporate Responsibility and Reputation Committee oversees Unilever’s conduct as a responsible multinational business. The Committee is also charged with ensuring that Unilever’s reputation is protected and enhanced. A key element of the role is the need to identify any external developments which are likely to have an influence upon Unilever’s standing in society and to bring these to the attention of the Boards.
The Committee comprises three independent Non-Executive Directors: Sir Malcolm Rifkind, Hixonia Nyasulu and Louise Fresco. Sir Malcolm Rifkind chairs the Committee. Keith Weed, Chief Marketing and Communication Officer and a member of the Unilever Leadership Executive, attends the Committee’s meetings.
The Committee’s discussions are informed by the perspectives of Unilever’s two sustainability leadership groups. The first is the Unilever Sustainable Development Group (USDG) – five experts from outside Unilever who advise our senior leadership on the development of its sustainability strategy. The second is the Unilever Sustainable Living Plan (USLP) Steering Team, the group of senior executives who are accountable for the delivery of the USLP. The insights from these groups help to keep the Boards informed of current and emerging trends and any potential risks arising from sustainability issues.
The Committee’s terms of reference and details of the Unilever Sustainable Development Group are available on our website at www.unilever.com/investorrelations/corp_governance.
MeetingsMeetings are held quarterly and ad hoc as required. The Committee Chairman reports the conclusions to the Boards. Four meetings were held in 2011.
The Committee’s agenda comprises a number of standing items. These include the Code of Business Principles, litigation and the USLP. In 2011, Committee members requested that product and occupational safety be added to these standing items.
In addition, the Committee reviews a number of strategic topics. For example, in 2011 these included a review of the system Unilever uses to manage issues and reputational risks and a discussion of animal testing.
Code of Business Principles and litigation reviewThe Committee is responsible for the oversight of the Unilever Code of Business Principles and associated Code Policies, which set out the standards of conduct we expect of our employees.
The Committee ensures that the Code of Business Principles and Code Policies remain fit for purpose and are appropriately applied. In this regard it complements the role of the Audit Committee which considers the Code as part of its remit to review risk management.
During the year, members of the Committee endorsed the refinement of the system for collating statistics relating to cases under the Code of Business Principles and Code Policies. The improved visibility of this data means that management is able to monitor infringements more closely and identify trends.
Pursuant to the remit of the Committee, the Chief Legal Officer reports to the Committee on litigation matters which have a reputational impact including environmental issues, labour relations and competition law compliance. These matters are then also considered by the full Boards. For further information on ‘Legal proceedings’ please see note 20 on page 103.
Unilever Sustainable Living PlanThe Committee monitors progress on the USLP. The USLP is at the heart of Unilever’s aim to double the size of its business while reducing its environmental impacts and is available on our website at www.unilever.com/sustainability.
The Committee reviews any potential risks that could damage the credibility of the USLP, and each of its meetings addresses a different element of the USLP. In 2011 the governance mechanisms of the USLP were discussed, as well as issues such as sustainable agricultural sourcing, water and safety.
The Committee visited Unilever’s research laboratory at Colworth in the UK to learn more about the role of R&D and the science of behaviour change. Both are crucial to achieving the USLP’s targets. Unilever’s work in developing alternative approaches to animal testing was also reviewed.
During the Boards’ visit to Indonesia, the Committee received a briefing from the World Resources Institute’s local expert on deforestation. Sustainable sourcing of palm oil is a major target in the USLP. The briefing gave the Committee a detailed update on deforestation issues in Indonesia as well as a broad overview of Unilever’s actions in this area and how it is working collaboratively with growers, suppliers, customers, governments and NGOs to promote sustainable palm oil.
Evaluation of the CommitteeThe Committee carried out a self-assessment of its performance, led by the Committee Chairman. The Board also evaluated the performance of the Committee and concluded it was performing effectively.
Sir Malcolm RifkindChairman of the Corporate Responsibility and Reputation CommitteeLouise FrescoHixonia Nyasulu
Unilever Annual Report and Accounts 2011
Report of the Directors Governance

49
REPORT OF THE NOMINATION COMMITTEE
Terms of ReferenceThe Nomination Committee comprises three Independent Non-Executive Directors and the Chairman. It was chaired by Jeroen van der Veer until his retirement at the 2011 AGMs. Paul Walsh has chaired the Committee since 12 May 2011. The other members are Ann Fudge, Kees Storm (both of whom were appointed following the 2011 AGMs) and Michael Treschow. The Group Secretary acts as secretary to the Committee.
The Committee is responsible for drawing up selection criteria, succession planning and appointment procedures. Under Unilever’s corporate governance arrangements Executive and Non-Executive Directors offer themselves for election each year at the Annual General Meetings. The Nomination Committee is responsible for recommending candidates for nomination as Executive Directors (including the Chief Executive Officer) and Non-Executive Directors each year based on the process of evaluations referred to below. After Directors have been appointed by shareholders the Committee recommends to the Boards candidates for election as Chairman and the Vice-Chairman & Senior Independent Director. The Committee also has responsibility for supervising the policy of the Chief Executive Officer on the selection criteria and appointment procedures for senior management and it keeps oversight of all matters relating to corporate governance, bringing any issues to the attention of the Boards. The Committee’s Terms of Reference are contained within ‘The Governance of Unilever’ and are also available on our website at www.unilever.com/investorrelations/corp_governance.
Process for the appointment of DirectorsUnilever has formal procedures for the evaluation of the Boards, the Board Committees and the individual Directors. The Chairman, in conjunction with the Vice-Chairman & Senior Independent Director, leads the process whereby the Boards assess their own performance and the results of the evaluations are provided to the Committee when it discusses the nominations for re-election of Directors.
Where a vacancy arises on the Boards, the Committee may seek the services of specialist recruitment firms and other external experts to assist in finding individuals with the appropriate skills and expertise. The Committee reviews candidates presented by the recruitment firm, or by Directors and members of the Unilever Leadership Executive, and all members of the Committee are involved in the interview process before making their recommendations to the full Boards for approval.
In nominating Directors, the Committee follows the agreed Board profile of potential Non-Executive Directors, which takes into account the roles of Non-Executive Directors set out in the Dutch Corporate Governance Code and the UK Corporate Governance Code. Under the terms of ‘The Governance of Unilever’ the Boards should comprise a majority of Non-Executive Directors. To represent Unilever’s areas of interest, the profile also indicates there should be a strong representation from Developing and Emerging markets as well as from Europe and North America. Non-Executive Directors should be independent of Unilever and free from any conflicts of interest. With respect to diversity in the composition of the Boards the objective pursued by the Boards is to have a variation of age, gender, expertise, social background and nationality and, wherever possible, the Boards should reflect Unilever’s consumer base. The Boards are pleased that we already have 25% female representation on the Boards. We will
continue to aspire to increase that level. However, Unilever feels that gender is only one part of diversity, and Unilever directors will continue to be selected on the basis of the wide-ranging experience, backgrounds, skills, knowledge and insight of its members.
It is recognised that Executive Directors may be invited to become a Non-Executive Director of another company and that such an appointment, subject to the approval of the Chairman and where relevant the Chief Executive Officer, may broaden the knowledge and experience to the benefit of the Group (see page 34 for details in the biographies).
Activities of the Committee during the yearThe Committee met six times in 2011. All Committee members attended the meetings they were eligible to attend except Ann Fudge who attended three out of four meetings she was eligible to attend. Other attendees at Committee meetings (or part thereof) were the Chief Executive Officer, the Chief HR Officer and the Group Secretary.
The Committee proposed the nomination of all Directors offering themselves for re-election at the 2011 AGMs in May 2011. During 2011, the Committee also proposed the nomination of Sunil B Mittal as a Non-Executive Director at the 2011 AGMs in May. Mr Mittal was chosen because, with his business building experience in developing markets ranging from the entrepreneurial to large-scale corporate activities, he would be a valuable addition to the Boards. In making this appointment the Nomination Committee was supported by an independent executive search firm chosen by the Committee which had been engaged to identify suitable candidates for the role required. Following his appointment at the 2011 AGMs, the Committee approved an extensive induction programme for Mr Mittal.
As part of its corporate governance responsibilities, during the year the Committee considered the new UK Corporate Governance Code, which applied to Unilever from 1 January 2011, and will continue to ensure that Unilever complies with the new provisions, where appropriate, for our future reporting years.
This year, Unilever decided to perform an external evaluation, undertaken by an independent third-party consultant. Further information on this evaluation can be found on page 2, the results of which were discussed at the December 2011 Board Meetings.
The Committee also carried out an assessment of its own performance and concluded it was performing effectively.
Paul Walsh Chairman of the Nomination CommitteeAnn FudgeKees StormMichael Treschow
Unilever Annual Report and Accounts 2011
Report of the Directors Governance
50
DIRECTORS’ REMUNERATION REPORT
Remuneration reviewAs we communicated in last year’s Report, the Committee has now taken a close look at the competitive position of our Executive Directors’ salaries. Following consultation with shareholders, the Committee intends to increase the CEO’s salary by 6% to £975,200 during the course of 2012. The CFO’s salary will also be increased by 5% to £714,000. It is the Committee’s intention that these increases will not be implemented immediately but rather will be implemented (with no backdating) at a time when the Committee determines appropriate for the business. These salary increases are in line with the salary increases that have been awarded to other high performing UK/European employees at Unilever. The Committee also made some changes to the structure of pension and benefits in order to increase transparency for the individual and for shareholders.
Further details on the proposed changes are provided in the section entitled ’Proposed changes from 2012 onwards’.
2011 reward outcomes2011 was another year of growth for Unilever despite difficult markets and the external challenges facing the business. We delivered a good set of financial results, growing sales and earnings, particularly in emerging markets. We have also made significant progress in the implementation of our strategy.
We set challenging bonus targets for 2011 reflecting our ambitious growth objectives. The Committee considered performance against these stretching targets as well as the quality of performance delivered and the Executive Directors’ contribution to the sustainability of the business. Taking these factors into account the Committee determined that the CEO should be awarded a bonus of 135% of base salary with the CFO being awarded a bonus of 90% of base salary.
Global Share Incentive Plan awards granted in 2009 are due to vest in March 2012 based on performance to 31 December 2011. The Committee assessed financial performance against the relevant metrics, TSR performance against peers and the underlying quality of performance and determined that 87% of the initial award (out of a maximum vesting of 200%) would vest. The Committee considered that this level of vesting is appropriate given the sustained delivery of performance against key strategic metrics and our performance against peers in the challenging economic climate.
Further details on performance and vesting levels are provided below.
Long-term performance conditionsDuring 2012, the Committee intends to review performance conditions to ensure they remain appropriate for the business and are aligned with our strategy and the long-term creation of shareholder value and in particular our desire to build a long-term sustainable business. To the extent that the review results in proposed changes to performance measures for long term incentive plans, the Committee will consult with shareholders in advance.
Paul Walsh Chairman of the Remuneration CommitteeAnn Fudge Kees StormMichael Treschow
Remuneration CommitteeThe role of the Remuneration Committee is to make proposals to the Boards for decisions on:• the remuneration and benefits of Directors;• the remuneration policy for the ULE and the Chief Auditor,
Group Controller, Chief Legal Officer and Group Secretary; and• the design and terms of all share-based incentive plans.
The Committee’s key responsibilities in respect of Executive Directors include making proposals to the Boards on:• the remuneration policy;• individual salary levels, bonuses, long-term incentive awards
and other benefits;• performance frameworks, targets setting and performance
review; and• determining contractual terms.
The Committee’s Terms of Reference are contained within ‘The Governance of Unilever’, which can be found at www.unilever.com/investorrelations/corp_governance. Details of Committee meeting attendance are contained in the section on Corporate Governance on page 40.
During 2011 the Committee comprised Paul Walsh, who became Committee Chairman in May 2011 on the retirement of Jeroen van der Veer, Michael Treschow, Ann Fudge and from May 2011 Kees Storm.
While it is the Committee’s responsibility to exercise independent judgement, the Committee does request advice from management and professional advisers, as appropriate, to ensure that its decisions are fully informed given the internal and external environment. The Committee appointed Deloitte LLP to provide independent advice on various matters it considered in 2011. During the year, Deloitte also provided specific tax, technology consultancy and corporate finance services to Unilever. The Committee reviewed the potential for conflicts of interest and judged that there were appropriate safeguards against such conflicts.
Unilever Annual Report and Accounts 2011
Report of the Directors Governance
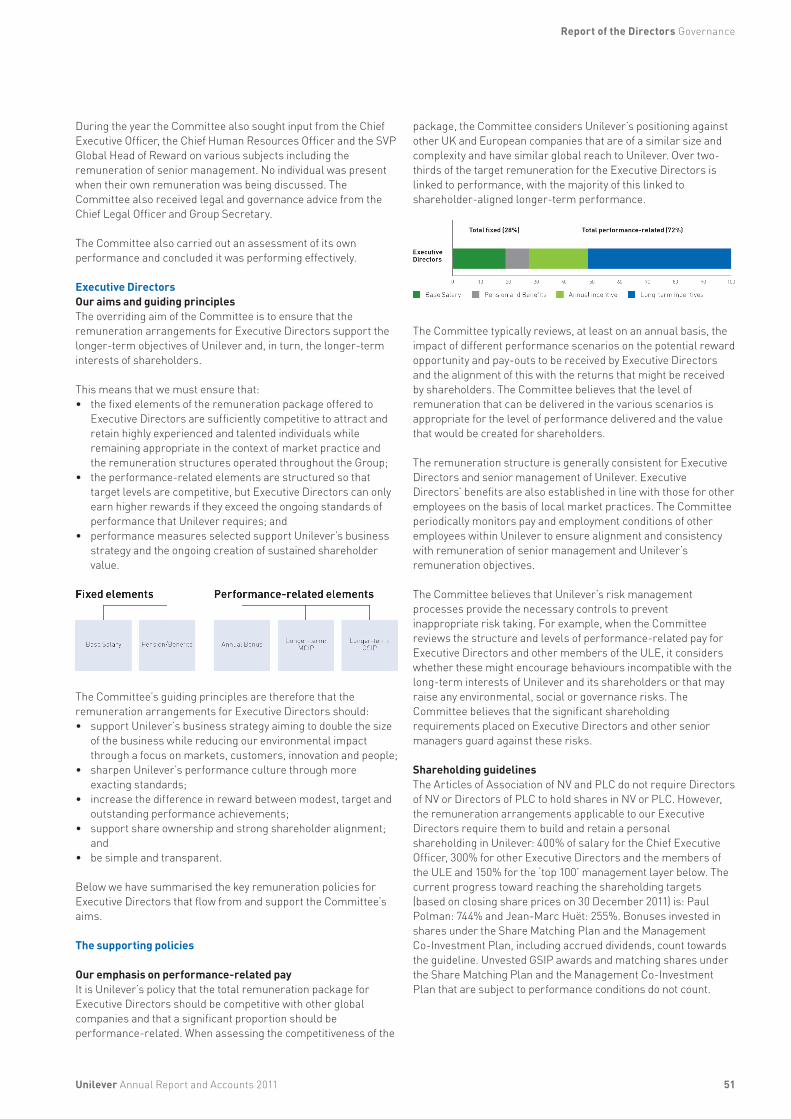
51
During the year the Committee also sought input from the Chief Executive Officer, the Chief Human Resources Officer and the SVP Global Head of Reward on various subjects including the remuneration of senior management. No individual was present when their own remuneration was being discussed. The Committee also received legal and governance advice from the Chief Legal Officer and Group Secretary.
The Committee also carried out an assessment of its own performance and concluded it was performing effectively.
Executive DirectorsOur aims and guiding principlesThe overriding aim of the Committee is to ensure that the remuneration arrangements for Executive Directors support the longer-term objectives of Unilever and, in turn, the longer-term interests of shareholders.
This means that we must ensure that:• the fixed elements of the remuneration package offered to
Executive Directors are sufficiently competitive to attract and retain highly experienced and talented individuals while remaining appropriate in the context of market practice and the remuneration structures operated throughout the Group;
• the performance-related elements are structured so that target levels are competitive, but Executive Directors can only earn higher rewards if they exceed the ongoing standards of performance that Unilever requires; and
• performance measures selected support Unilever’s business strategy and the ongoing creation of sustained shareholder value.
The Committee’s guiding principles are therefore that the remuneration arrangements for Executive Directors should:• support Unilever’s business strategy aiming to double the size
of the business while reducing our environmental impact through a focus on markets, customers, innovation and people;
• sharpen Unilever’s performance culture through more exacting standards;
• increase the difference in reward between modest, target and outstanding performance achievements;
• support share ownership and strong shareholder alignment; and
• be simple and transparent.
Below we have summarised the key remuneration policies for Executive Directors that flow from and support the Committee’s aims.
The supporting policies
Our emphasis on performance-related payIt is Unilever’s policy that the total remuneration package for Executive Directors should be competitive with other globalcompanies and that a significant proportion should be performance-related. When assessing the competitiveness of the
package, the Committee considers Unilever’s positioning against other UK and European companies that are of a similar size and complexity and have similar global reach to Unilever. Over two-thirds of the target remuneration for the Executive Directors is linked to performance, with the majority of this linked to shareholder-aligned longer-term performance.
The Committee typically reviews, at least on an annual basis, the impact of different performance scenarios on the potential reward opportunity and pay-outs to be received by Executive Directors and the alignment of this with the returns that might be received by shareholders. The Committee believes that the level of remuneration that can be delivered in the various scenarios is appropriate for the level of performance delivered and the value that would be created for shareholders.
The remuneration structure is generally consistent for Executive Directors and senior management of Unilever. Executive Directors’ benefits are also established in line with those for other employees on the basis of local market practices. The Committee periodically monitors pay and employment conditions of other employees within Unilever to ensure alignment and consistency with remuneration of senior management and Unilever’s remuneration objectives.
The Committee believes that Unilever’s risk management processes provide the necessary controls to prevent inappropriate risk taking. For example, when the Committee reviews the structure and levels of performance-related pay for Executive Directors and other members of the ULE, it considers whether these might encourage behaviours incompatible with the long-term interests of Unilever and its shareholders or that may raise any environmental, social or governance risks. The Committee believes that the significant shareholding requirements placed on Executive Directors and other senior managers guard against these risks.
Shareholding guidelinesThe Articles of Association of NV and PLC do not require Directors of NV or Directors of PLC to hold shares in NV or PLC. However, the remuneration arrangements applicable to our Executive Directors require them to build and retain a personal shareholding in Unilever: 400% of salary for the Chief Executive Officer, 300% for other Executive Directors and the members of the ULE and 150% for the ‘top 100’ management layer below. The current progress toward reaching the shareholding targets (based on closing share prices on 30 December 2011) is: Paul Polman: 744% and Jean-Marc Huët: 255%. Bonuses invested in shares under the Share Matching Plan and the Management Co-Investment Plan, including accrued dividends, count towards the guideline. Unvested GSIP awards and matching shares under the Share Matching Plan and the Management Co-Investment Plan that are subject to performance conditions do not count.
Unilever Annual Report and Accounts 2011
Report of the Directors Governance
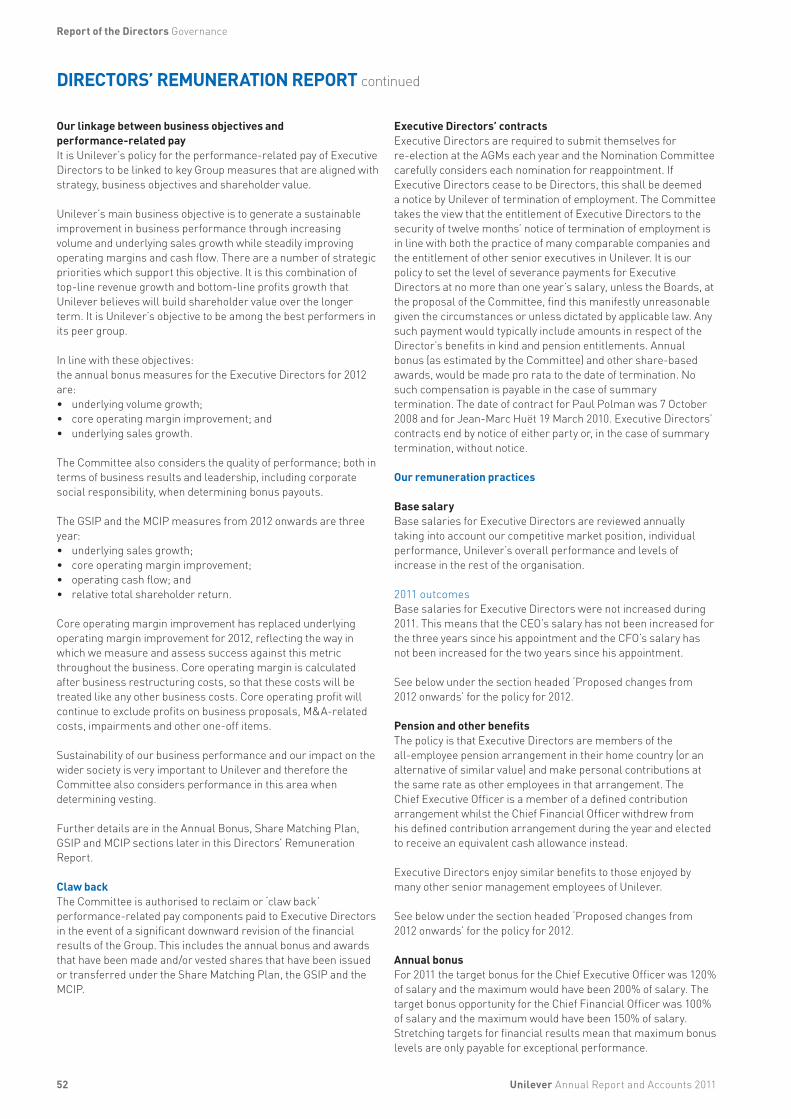
52
DIRECTORS’ REMUNERATION REPORT continued
Our linkage between business objectives and performance-related pay It is Unilever’s policy for the performance-related pay of Executive Directors to be linked to key Group measures that are aligned with strategy, business objectives and shareholder value.
Unilever’s main business objective is to generate a sustainable improvement in business performance through increasing volume and underlying sales growth while steadily improving operating margins and cash flow. There are a number of strategic priorities which support this objective. It is this combination of top-line revenue growth and bottom-line profits growth that Unilever believes will build shareholder value over the longer term. It is Unilever’s objective to be among the best performers in its peer group.
In line with these objectives:the annual bonus measures for the Executive Directors for 2012 are:• underlying volume growth;• core operating margin improvement; and• underlying sales growth.
The Committee also considers the quality of performance; both in terms of business results and leadership, including corporate social responsibility, when determining bonus payouts.
The GSIP and the MCIP measures from 2012 onwards are three year:• underlying sales growth;• core operating margin improvement;• operating cash flow; and• relative total shareholder return.
Core operating margin improvement has replaced underlying operating margin improvement for 2012, reflecting the way in which we measure and assess success against this metric throughout the business. Core operating margin is calculated after business restructuring costs, so that these costs will be treated like any other business costs. Core operating profit will continue to exclude profits on business proposals, M&A-related costs, impairments and other one-off items.
Sustainability of our business performance and our impact on the wider society is very important to Unilever and therefore the Committee also considers performance in this area when determining vesting.
Further details are in the Annual Bonus, Share Matching Plan, GSIP and MCIP sections later in this Directors’ Remuneration Report.
Claw back The Committee is authorised to reclaim or ‘claw back’ performance-related pay components paid to Executive Directors in the event of a significant downward revision of the financial results of the Group. This includes the annual bonus and awards that have been made and/or vested shares that have been issued or transferred under the Share Matching Plan, the GSIP and the MCIP.
Executive Directors’ contracts Executive Directors are required to submit themselves for re-election at the AGMs each year and the Nomination Committee carefully considers each nomination for reappointment. If Executive Directors cease to be Directors, this shall be deemed a notice by Unilever of termination of employment. The Committee takes the view that the entitlement of Executive Directors to the security of twelve months’ notice of termination of employment is in line with both the practice of many comparable companies and the entitlement of other senior executives in Unilever. It is our policy to set the level of severance payments for Executive Directors at no more than one year’s salary, unless the Boards, at the proposal of the Committee, find this manifestly unreasonable given the circumstances or unless dictated by applicable law. Any such payment would typically include amounts in respect of the Director’s benefits in kind and pension entitlements. Annual bonus (as estimated by the Committee) and other share-based awards, would be made pro rata to the date of termination. No such compensation is payable in the case of summary termination. The date of contract for Paul Polman was 7 October 2008 and for Jean-Marc Huët 19 March 2010. Executive Directors’ contracts end by notice of either party or, in the case of summary termination, without notice.
Our remuneration practices
Base salaryBase salaries for Executive Directors are reviewed annually taking into account our competitive market position, individual performance, Unilever’s overall performance and levels of increase in the rest of the organisation.
2011 outcomesBase salaries for Executive Directors were not increased during 2011. This means that the CEO’s salary has not been increased for the three years since his appointment and the CFO’s salary has not been increased for the two years since his appointment.
See below under the section headed ‘Proposed changes from 2012 onwards’ for the policy for 2012. Pension and other benefitsThe policy is that Executive Directors are members of the all-employee pension arrangement in their home country (or an alternative of similar value) and make personal contributions at the same rate as other employees in that arrangement. The Chief Executive Officer is a member of a defined contribution arrangement whilst the Chief Financial Officer withdrew from his defined contribution arrangement during the year and elected to receive an equivalent cash allowance instead.
Executive Directors enjoy similar benefits to those enjoyed by many other senior management employees of Unilever.
See below under the section headed ‘Proposed changes from 2012 onwards’ for the policy for 2012.
Annual bonusFor 2011 the target bonus for the Chief Executive Officer was 120% of salary and the maximum would have been 200% of salary. The target bonus opportunity for the Chief Financial Officer was 100% of salary and the maximum would have been 150% of salary. Stretching targets for financial results mean that maximum bonus levels are only payable for exceptional performance.
Unilever Annual Report and Accounts 2011
Report of the Directors Governance
53
The Executive Director’s annual bonus opportunity is based on Unilever’s results referenced against financial targets set at the beginning of the year. For 2011, targets were set by the Committee for underlying volume growth, underlying operating margin improvement and underlying sales growth over the previous year. With these results in view, the Committee then assessed the quality of performance; both in terms of business results and leadership, including corporate social responsibility, to determine the actual bonus award for Executive Directors.
See below under the section headed ‘Proposed changes from 2012 onwards’ for the policy for 2012.
2011 outcomes2011 was another year of growth despite difficult markets and the external challenges facing the business. We delivered a strong set of financial results and made significant progress in the implementation of our strategy.
We set challenging bonus targets for 2011 reflecting our ambitious growth objectives. Overall the level of performance achieved was as follows: underlying sales growth above the target level; underlying volume growth slightly below the target level and underlying operating margin slightly below the threshold level. The Committee considered performance against these stretching targets as well as the quality of performance delivered and the contribution of the Executive Directors to the sustainability of the business and determined that the CEO should be awarded a bonus of 135% of base salary in respect of 2011 with the CFO being awarded a bonus of 90% of base salary.
Share Matching PlanThe 2011 grant relating to the annual bonus earned for 2010 was the last grant under the Share Matching Plan. Under the Share Matching Plan, Executive Directors are required to invest 25% of their bonus into shares and hold them for a minimum period of three years. The Executive Directors receive a matching award of 25% of their annual bonus in the form of NV and PLC shares. The matching shares normally vest after three years provided that the underlying shares have been retained during this period and the Executive Director has not resigned or been dismissed.
From 2012 the Executive Directors, like all other senior managers of Unilever, will participate in the Management Co-Investment Plan in respect of the 2011 bonuses.
Management Co-Investment Plan (MCIP)This plan aims to support Unilever’s drive for profitable growth by encouraging Unilever’s managers to take a greater financial interest in the performance of the Group and the value of Unilever shares over the long term.
Under the MCIP Executive Directors, the ULE and our top 100 managers are required to invest at least 25% and may invest up to 60% of their annual bonus in Unilever’s shares. They receive a corresponding award of performance-related shares, which will vest after three years depending on: Unilever’s performance, continued employment and maintenance of the underlying investment shares. The performance conditions are identical to the performance conditions of the GSIP (see below) to ensure alignment with the drive for profitable growth. As under the GSIP, vesting levels will be between 0% and 200%. However, the Committee has decided to limit the maximum vesting level for the Executive Directors to 150%.
For managers the first operation of the MCIP was in 2011 in respect of annual bonuses relating to the 2010 financial year.
On 17 February 2012 Paul Polman and Jean-Marc Huët first participated in MCIP in respect of their annual bonus over 2011. Paul Polman invested 60% of his bonus which resulted in 17,772 NV and 17,772 PLC investment shares. Jean-Marc Huët invested 25% of his bonus which resulted in 3,649 NV and 3,649 PLC investment shares. They each received a corresponding award of performance related NV and PLC shares under the terms of the MCIP.
Further information on the methods used to calculate expected values for the Directors’ share based pay can be found in Note 4C on page 79.
Global Share Incentive Plan (GSIP)Executive Directors receive annual awards of NV and PLC shares under the GSIP. The number of shares that vest after three years depends on the satisfaction of performance conditions.
The current maximum grant levels were agreed by shareholders in 2008 and are 200% of salary for the Chief Executive Officer and 178% for other Executive Directors. The vesting range is between 0% and 200% of grant level.
Since 2010 the performance conditions have been the following:• underlying sales growth;• underlying operating margin improvement;• operating cash flow; and• relative total shareholder return.
As from 2012 core operating margin improvement will replace underlying operating margin improvement, reflecting the way in which we measure and assess success against this metric throughout the business.
For Executive Directors and the ULE the four measures are equally weighted (25% each).
For the three internal business-focused conditions there will be no vesting if performance is below the minimum of the range, 25% vesting for achieving threshold performance and 200% vesting only for performance at or above the top end of the range. In addition, the performance conditions for underlying sales growth and core operating margin improvement must reach the threshold of the performance range for both performance conditions before any shares subject to either performance condition can vest. At the end of the three-year performance period the Committee will also assess Unilever’s performance against the three internal conditions relative to the performance of peer group companies to ensure that vesting levels are appropriate.
For the relative total shareholder return (TSR) performance condition, Unilever’s TSR is measured relative to a group of 20 other companies. TSR measures the return received by a shareholder, capturing both the increase in share price and the value of dividend income (assuming dividends are reinvested). The TSR results are compared on a single reference currency basis. No shares in the portion of the award subject to TSR vest if Unilever is ranked below position 11 in the peer group at the end of the three-year period, 50% vest if Unilever is ranked 11th, 100% if Unilever is ranked 7th and 200% if Unilever is ranked 3rd or above. Straight-line vesting occurs between these points.
Unilever Annual Report and Accounts 2011
Report of the Directors Governance
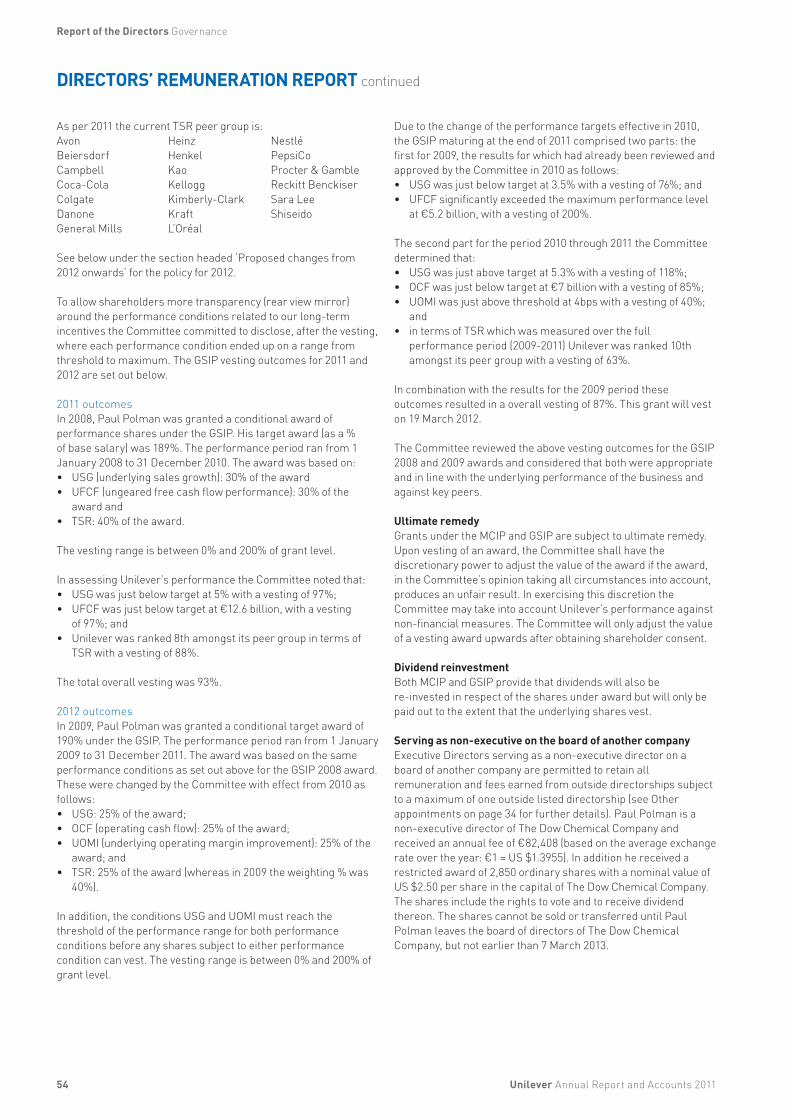
54
DIRECTORS’ REMUNERATION REPORT continued
As per 2011 the current TSR peer group is:Avon Heinz NestléBeiersdorf Henkel PepsiCoCampbell Kao Procter & GambleCoca-Cola Kellogg Reckitt BenckiserColgate Kimberly-Clark Sara LeeDanone Kraft ShiseidoGeneral Mills L’Oréal
See below under the section headed ‘Proposed changes from 2012 onwards’ for the policy for 2012.
To allow shareholders more transparency (rear view mirror) around the performance conditions related to our long-term incentives the Committee committed to disclose, after the vesting, where each performance condition ended up on a range from threshold to maximum. The GSIP vesting outcomes for 2011 and 2012 are set out below.
2011 outcomesIn 2008, Paul Polman was granted a conditional award of performance shares under the GSIP. His target award (as a % of base salary) was 189%. The performance period ran from 1 January 2008 to 31 December 2010. The award was based on:• USG (underlying sales growth): 30% of the award• UFCF (ungeared free cash flow performance): 30% of the
award and • TSR: 40% of the award.
The vesting range is between 0% and 200% of grant level.
In assessing Unilever’s performance the Committee noted that:• USG was just below target at 5% with a vesting of 97%;• UFCF was just below target at €12.6 billion, with a vesting
of 97%; and• Unilever was ranked 8th amongst its peer group in terms of
TSR with a vesting of 88%.
The total overall vesting was 93%.
2012 outcomesIn 2009, Paul Polman was granted a conditional target award of 190% under the GSIP. The performance period ran from 1 January 2009 to 31 December 2011. The award was based on the same performance conditions as set out above for the GSIP 2008 award. These were changed by the Committee with effect from 2010 as follows:• USG: 25% of the award;• OCF (operating cash flow): 25% of the award;• UOMI (underlying operating margin improvement): 25% of the
award; and• TSR: 25% of the award (whereas in 2009 the weighting % was
40%).
In addition, the conditions USG and UOMI must reach the threshold of the performance range for both performance conditions before any shares subject to either performance condition can vest. The vesting range is between 0% and 200% of grant level.
Due to the change of the performance targets effective in 2010, the GSIP maturing at the end of 2011 comprised two parts: the first for 2009, the results for which had already been reviewed and approved by the Committee in 2010 as follows:• USG was just below target at 3.5% with a vesting of 76%; and• UFCF significantly exceeded the maximum performance level
at €5.2 billion, with a vesting of 200%.
The second part for the period 2010 through 2011 the Committee determined that:• USG was just above target at 5.3% with a vesting of 118%;• OCF was just below target at €7 billion with a vesting of 85%;• UOMI was just above threshold at 4bps with a vesting of 40%;
and • in terms of TSR which was measured over the full
performance period (2009-2011) Unilever was ranked 10th amongst its peer group with a vesting of 63%.
In combination with the results for the 2009 period these outcomes resulted in a overall vesting of 87%. This grant will vest on 19 March 2012.
The Committee reviewed the above vesting outcomes for the GSIP 2008 and 2009 awards and considered that both were appropriate and in line with the underlying performance of the business and against key peers.
Ultimate remedyGrants under the MCIP and GSIP are subject to ultimate remedy. Upon vesting of an award, the Committee shall have the discretionary power to adjust the value of the award if the award, in the Committee’s opinion taking all circumstances into account, produces an unfair result. In exercising this discretion the Committee may take into account Unilever’s performance against non-financial measures. The Committee will only adjust the value of a vesting award upwards after obtaining shareholder consent.
Dividend reinvestmentBoth MCIP and GSIP provide that dividends will also be re-invested in respect of the shares under award but will only be paid out to the extent that the underlying shares vest.
Serving as non-executive on the board of another companyExecutive Directors serving as a non-executive director on a board of another company are permitted to retain all remuneration and fees earned from outside directorships subject to a maximum of one outside listed directorship (see Other appointments on page 34 for further details). Paul Polman is a non-executive director of The Dow Chemical Company and received an annual fee of €82,408 (based on the average exchange rate over the year: €1 = US $1.3955). In addition he received a restricted award of 2,850 ordinary shares with a nominal value of US $2.50 per share in the capital of The Dow Chemical Company. The shares include the rights to vote and to receive dividend thereon. The shares cannot be sold or transferred until Paul Polman leaves the board of directors of The Dow Chemical Company, but not earlier than 7 March 2013.
Unilever Annual Report and Accounts 2011
Report of the Directors Governance

55
2011 Summary Remuneration (unaudited)The table below summarises total remuneration paid to Executive Directors for 2011.
Remuneration paid in 2011
Element CEO(£ ‘000)
CFO(£ ‘000)
Base Salary 920 680Allowances and benefits1 156 269Annual Bonus2 1,242 612GSIP performance shares3 2,303 –GSIP restricted shares4 951 812Pension5 316 124
Total Remuneration paid 5,888 2,4971 For the CEO, this includes an allowance in lieu of company car, an
entertaining allowance, medical insurance, private use of chauffeur-driven car, tax return preparation and payment to protect him against the difference between the employee social security obligations in his country of residence versus the UK. For the CFO this includes an allowance in lieu of company car, an entertaining allowance, an annual housing allowance, medical insurance, tax return preparation, private use of chauffeur-driven car and an annual education allowance he is entitled to per child of school age.
2 Bonus paid in 2012 based on performance in the year ended 31 December 2011.
3 GSIP awards vesting in the year based on performance in the three-year period to 31 December 2010.
4 Restricted awards vesting in the year. These were one-off awards made to Executive Directors under the GSIP on appointment.
5 Including the cost of death in service benefits and the cost of pension administration.
Amounts have been translated into euros using the average exchange rate over the year: €1 = £0.8692.
Proposed changes from 2012 onwardsBase salaryIn last year’s Directors’ Remuneration Report we communicated that during the course of 2011 the Committee would be taking a closer look at the competitive positioning of our Executive Directors’ salaries. The Committee undertook such a review during the year and approved the following annual salary increases in respect of 2012:• 6% to £975,200 for the CEO;• 5% to £714,000 for the CFO.
However, the Committee is mindful of the difficult and uncertain economic circumstances prevailing at this time. Consequently, the implementation of these salary increases will be deferred until such later time as the Committee consider it appropriate. When and if these salary increases are implemented, they will not be backdated; salaries will be paid at the higher level only from the implementation date onwards. The Committee will use the higher approved salary levels (£975,200 for the CEO and £714,200 for the CFO) as the respective base points for calculating 2012 incentive payments.
These salary increases are in line with the salary increases that have been awarded to other high-performing UK/European employees at Unilever.
The Committee will continue to keep the positioning of base salaries under review, particularly for the CEO, whose current salary is positioned at the lower end of market practice compared to similar sized UK and European companies. The Committee will therefore look to make further increases, as appropriate, to address this over the next few years.
Fixed pension and benefit allowanceIn order to simplify the provision of benefits and increase transparency, from 2012 the current benefit and pension provision will be replaced by a fixed cash allowance of £250,000 for the CEO and £340,000 for the CFO. This consolidated allowance reflects the approach taken during 2011 for other senior executives at Unilever. The level of fixed allowance provided to the CFO will be reduced over the next four years to reflect the phasing out of his annual housing allowance to nil in 2015. His fixed allowance will therefore be reduced to £220,000 in 2015.
In addition Unilever will continue to provide death, disability and medical insurance cover for Executive Directors. Unilever will also continue to pay social security obligations in the CEO’s country of residence and maintain the CEO’s hiring in agreement of a conditional supplemental pension accrual, which will be capped from 2012 onwards at 12% of the lower of actual salary or current salary plus 3% pa. Accordingly, the cap for this accrual has been set at £947,600 for 2012.
Annual bonusThere will be no change to the annual bonus opportunity for 2012. The target opportunity for the CEO will remain at 120% of salary with the maximum opportunity being 200% of salary. This level of bonus will only be paid for exceptional performance. The target opportunity for the CFO will continue to be 100% of salary with the opportunity to earn 150% of salary for exceptional performance.
The performance conditions for 2012 will be the same as for 2011 as outlined on page 52.
GSIPFor 2012 the target level of GSIP award for the CEO will be 200% of salary (190% for 2011). This level of award is within the limits previously approved by shareholders. The target GSIP award for the CFO will be 175% of salary (178% for 2011).
Executive Directors will continue to be able to earn between 0 and 2 times the target award depending on performance. The performance conditions for 2012 are outlined on page 52.
The Committee intends to keep the annual bonus and GSIP opportunities for the CEO at the current levels at least until 2014.
Unilever Annual Report and Accounts 2011
Report of the Directors Governance

56
DIRECTORS’ REMUNERATION REPORT continued
Executive Directors’ remuneration in 2011Remuneration for individual Executive Directors (audited)
Annual Emoluments 2011
Name and base country
Basesalary€ ‘000
Allowancesand otherpayments
€ ‘000
Value ofbenefits
€ ‘000Bonus€ ‘000
Sub Total€ ‘000
Pension€ ‘000
Share awards
€ ‘000Total
€ ‘000
Paul Polman (UK)(a) 1,058 149(b) 31(c) 1,429(d) 2,667 363 3,631(g) 6,661
Jean-Marc Huët (UK)(e) 782 285(f) 24(c) 704(d) 1,795 143 2,009(g) 3,947
Total 2011 1,840 434 55 2,133 4,462 506 5,640 10,608
Total 2010 (including former Directors) 1,600 1,022 7 2,349 4,978 464 4,306 9,748(a) Chief Executive Officer. Base salary set in sterling was £920,000 per annum.(b) Includes allowance in lieu of company car, entertaining allowance of £1,000 and payment to protect against the difference between the employee social
security obligations in his country of residence versus the UK. He also received a further payment of €91,236 in 2011 in relation to his social security obligations for 2009 and 2010 following a reconciliation for those years.
(c) Includes benefits for medical insurance, tax return preparation and private use of chauffeur-driven car.(d) Bonus for the full year 2011. Includes the value of both the cash element and the element paid in shares of NV and PLC under the MCIP. It does not include
matching shares awarded on a conditional basis in addition to the element of bonus paid in shares. (e) Chief Financial Officer. Base salary set in sterling was £680,000 per annum. (f) Includes allowance in lieu of company car, entertaining allowance of £1,000, annual housing allowance and annual education allowance of £16,000 net per
child of school age.(g) Costs are non-cash and relate to the expenses following IFRS2. Based on share prices on grant dates and 98% adjustment factor for GSIP shares awarded in
2011 and 2010, and 89% adjustment factor for GSIP shares awarded in 2009 and 2008 to take account of the external performance condition TSR for GSIP.
In addition, Unilever provides support to Executive Directors in relation to spouses’ travel expenses when travelling together on company business. This amount is capped at 5% of base salary and the maximum limit for 2011 was €92,039.
Amounts have been translated into euros using the average exchange rate over the year: €1 = £0.8692 (2010: €1 = £0.858) and €1 = US $1.3955 (2010: €1 = US $1.326).
Pensions (audited)Paul Polman is a member of a defined contribution pension arrangement. The total pension cost including death in service benefits and administration costs and the company’s conditional supplemental pension provision was €363,000. This total pension cost breaks down as follows:– company contribution towards defined contribution pension plan: €160,000;– additional company contribution (made in return for his individual salary sacrifice) towards defined contribution pension plan:
€32,000*;– costs of provision for death in service benefits and administration: €43,000;– company’s supplemental pension provision, which is conditional on the CEO remaining in employment with Unilever to age 60 and
subsequently retiring from active service or his death or total disability prior to retirement: €128,000.
Jean-Marc Huët participated in a defined contribution pension arrangement from January to March 2011, but with effect from April 2011 he elected to cease pension provision and receive an equivalent payment in cash in lieu of pension. The total pension cost for Jean-Marc Huët was €143,000. This total pension cost breaks down as follows:
From January 2011 to March 2011 the total cost was €44,000 of which:– company contribution towards defined contribution pension plan: €30,000;– additional company contribution (made in return for his individual salary sacrifice) towards defined contribution pension plan:
€6,000*;– death in service benefits and administration: €8,000;
From April 2011 to December 2011, the total cost was €99,000 of which:– cash payment of €89,000;– death in service benefits: €10,000.
*This amount is paid from within (not in addition to) the salary reported in preceding sections of this Directors’ Remuneration Report.
Unilever Annual Report and Accounts 2011
Report of the Directors Governance
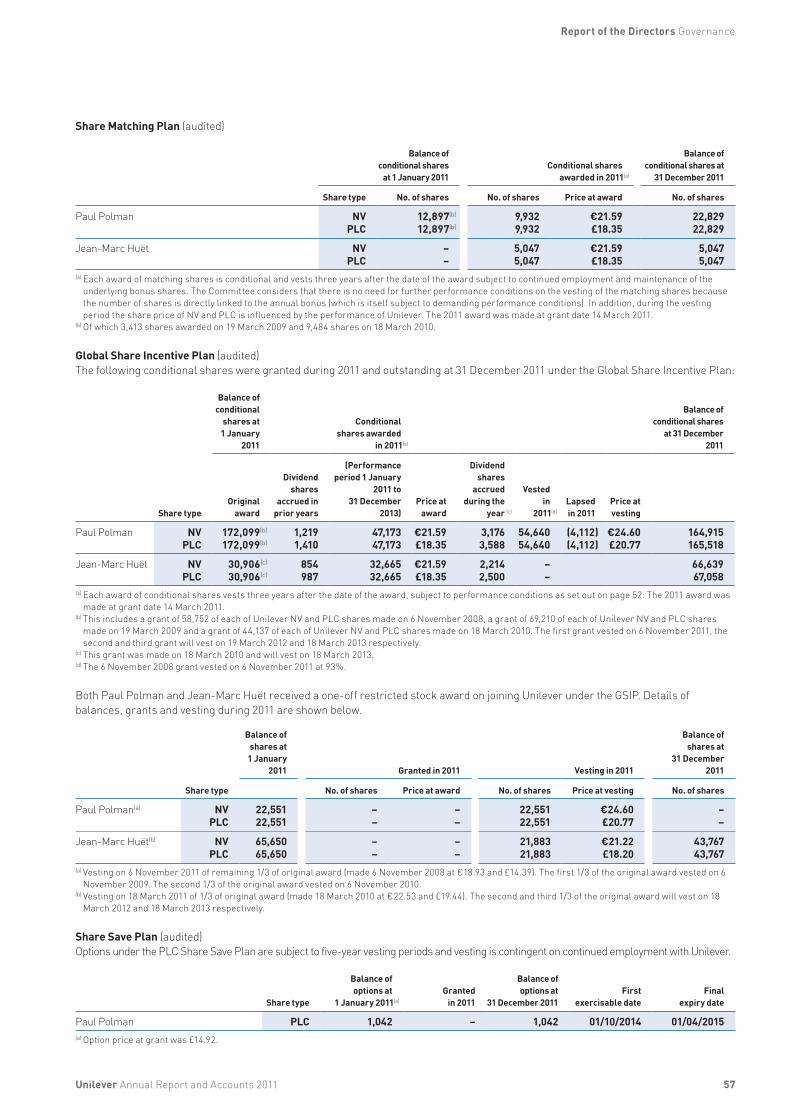
57
Share Matching Plan (audited)
Balance of conditional shares
at 1 January 2011 Conditional shares
awarded in 2011(a)
Balance of conditional shares at
31 December 2011
Share type No. of shares No. of shares Price at award No. of shares
Paul Polman NV 12,897(b) 9,932 €21.59 22,829PLC 12,897(b) 9,932 £18.35 22,829
Jean-Marc Huët NV – 5,047 €21.59 5,047PLC – 5,047 £18.35 5,047
(a) Each award of matching shares is conditional and vests three years after the date of the award subject to continued employment and maintenance of the underlying bonus shares. The Committee considers that there is no need for further performance conditions on the vesting of the matching shares because the number of shares is directly linked to the annual bonus (which is itself subject to demanding performance conditions). In addition, during the vesting period the share price of NV and PLC is influenced by the performance of Unilever. The 2011 award was made at grant date 14 March 2011.
(b) Of which 3,413 shares awarded on 19 March 2009 and 9,484 shares on 18 March 2010.
Global Share Incentive Plan (audited)The following conditional shares were granted during 2011 and outstanding at 31 December 2011 under the Global Share Incentive Plan:
Balance of conditional
shares at 1 January
2011
Conditional shares awarded
in 2011(a)
Balance of conditional shares
at 31 December 2011
Share typeOriginal
award
Dividend shares
accrued in prior years
(Performance period 1 January
2011 to 31 December
2013)Price at
award
Dividend shares
accrued during the
year (c)
Vested in
2011(d)
Lapsed in 2011
Price at vesting
Paul Polman NV 172,099(b) 1,219 47,173 €21.59 3,176 54,640 (4,112) €24.60 164,915PLC 172,099(b) 1,410 47,173 £18.35 3,588 54,640 (4,112) £20.77 165,518
Jean-Marc Huët NV 30,906(c) 854 32,665 €21.59 2,214 – 66,639 PLC 30,906(c) 987 32,665 £18.35 2,500 – 67,058(a) Each award of conditional shares vests three years after the date of the award, subject to performance conditions as set out on page 52. The 2011 award was
made at grant date 14 March 2011. (b) This includes a grant of 58,752 of each of Unilever NV and PLC shares made on 6 November 2008, a grant of 69,210 of each of Unilever NV and PLC shares
made on 19 March 2009 and a grant of 44,137 of each of Unilever NV and PLC shares made on 18 March 2010. The first grant vested on 6 November 2011, the second and third grant will vest on 19 March 2012 and 18 March 2013 respectively.
(c) This grant was made on 18 March 2010 and will vest on 18 March 2013.(d) The 6 November 2008 grant vested on 6 November 2011 at 93%.
Both Paul Polman and Jean-Marc Huët received a one-off restricted stock award on joining Unilever under the GSIP. Details of balances, grants and vesting during 2011 are shown below.
Balance ofshares at
1 January2011 Granted in 2011 Vesting in 2011
Balance ofshares at
31 December2011
Share type No. of shares Price at award No. of shares Price at vesting No. of shares
Paul Polman(a) NV 22,551 – – 22,551 €24.60 – PLC 22,551 – – 22,551 £20.77 –
Jean-Marc Huët(b) NV 65,650 – – 21,883 €21.22 43,767 PLC 65,650 – – 21,883 £18.20 43,767(a) Vesting on 6 November 2011 of remaining 1/3 of original award (made 6 November 2008 at €18.93 and £14.39). The first 1/3 of the original award vested on 6
November 2009. The second 1/3 of the original award vested on 6 November 2010.(b) Vesting on 18 March 2011 of 1/3 of original award (made 18 March 2010 at €22.53 and £19.44). The second and third 1/3 of the original award will vest on 18
March 2012 and 18 March 2013 respectively.
Share Save Plan (audited)Options under the PLC Share Save Plan are subject to five-year vesting periods and vesting is contingent on continued employment with Unilever.
Share type
Balance ofoptions at
1 January 2011(a)
Granted in 2011
Balance of options at
31 December 2011First
exercisable dateFinal
expiry date
Paul Polman PLC 1,042 – 1,042 01/10/2014 01/04/2015(a) Option price at grant was £14.92.
Unilever Annual Report and Accounts 2011
Report of the Directors Governance
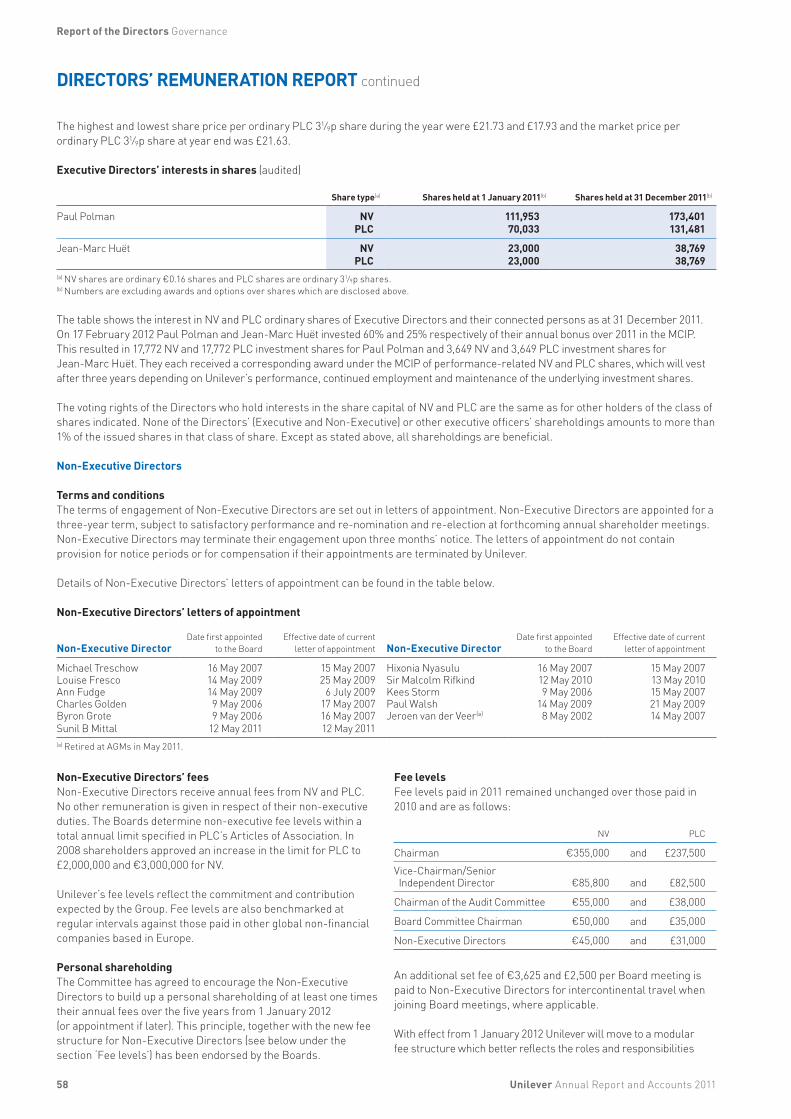
58 Unilever Annual Report and Accounts 2011
Report of the Directors Governance
DIRECTORS’ REMUNERATION REPORT continued
The highest and lowest share price per ordinary PLC 31⁄9p share during the year were £21.73 and £17.93 and the market price per ordinary PLC 31⁄9p share at year end was £21.63. Executive Directors’ interests in shares (audited)
Share type(a) Shares held at 1 January 2011(b) Shares held at 31 December 2011(b)
Paul Polman NV 111,953 173,401PLC 70,033 131,481
Jean-Marc Huët NV 23,000 38,769PLC 23,000 38,769
(a) NV shares are ordinary €0.16 shares and PLC shares are ordinary 31⁄9p shares.(b) Numbers are excluding awards and options over shares which are disclosed above.
The table shows the interest in NV and PLC ordinary shares of Executive Directors and their connected persons as at 31 December 2011. On 17 February 2012 Paul Polman and Jean-Marc Huët invested 60% and 25% respectively of their annual bonus over 2011 in the MCIP. This resulted in 17,772 NV and 17,772 PLC investment shares for Paul Polman and 3,649 NV and 3,649 PLC investment shares for Jean-Marc Huët. They each received a corresponding award under the MCIP of performance-related NV and PLC shares, which will vest after three years depending on Unilever’s performance, continued employment and maintenance of the underlying investment shares.
The voting rights of the Directors who hold interests in the share capital of NV and PLC are the same as for other holders of the class of shares indicated. None of the Directors’ (Executive and Non-Executive) or other executive officers’ shareholdings amounts to more than 1% of the issued shares in that class of share. Except as stated above, all shareholdings are beneficial. Non-Executive Directors
Terms and conditionsThe terms of engagement of Non-Executive Directors are set out in letters of appointment. Non-Executive Directors are appointed for a three-year term, subject to satisfactory performance and re-nomination and re-election at forthcoming annual shareholder meetings. Non-Executive Directors may terminate their engagement upon three months’ notice. The letters of appointment do not contain provision for notice periods or for compensation if their appointments are terminated by Unilever.
Details of Non-Executive Directors’ letters of appointment can be found in the table below.
Non-Executive Directors’ letters of appointment
Non-Executive DirectorDate first appointed
to the Board Effective date of current
letter of appointment Non-Executive DirectorDate first appointed
to the Board Effective date of current
letter of appointment
Michael Treschow 16 May 2007 15 May 2007 Hixonia Nyasulu 16 May 2007 15 May 2007Louise Fresco 14 May 2009 25 May 2009 Sir Malcolm Rifkind 12 May 2010 13 May 2010Ann Fudge 14 May 2009 6 July 2009 Kees Storm 9 May 2006 15 May 2007Charles Golden 9 May 2006 17 May 2007 Paul Walsh 14 May 2009 21 May 2009Byron Grote 9 May 2006 16 May 2007 Jeroen van der Veer(a) 8 May 2002 14 May 2007Sunil B Mittal 12 May 2011 12 May 2011(a) Retired at AGMs in May 2011.
Non-Executive Directors’ feesNon-Executive Directors receive annual fees from NV and PLC. No other remuneration is given in respect of their non-executive duties. The Boards determine non-executive fee levels within a total annual limit specified in PLC’s Articles of Association. In 2008 shareholders approved an increase in the limit for PLC to £2,000,000 and €3,000,000 for NV.
Unilever’s fee levels reflect the commitment and contribution expected by the Group. Fee levels are also benchmarked at regular intervals against those paid in other global non-financial companies based in Europe.
Personal shareholdingThe Committee has agreed to encourage the Non-Executive Directors to build up a personal shareholding of at least one times their annual fees over the five years from 1 January 2012 (or appointment if later). This principle, together with the new fee structure for Non-Executive Directors (see below under the section ‘Fee levels’) has been endorsed by the Boards.
Fee levelsFee levels paid in 2011 remained unchanged over those paid in 2010 and are as follows:
NV PLC
Chairman €355,000 and £237,500Vice-Chairman/Senior Independent Director €85,800 and £82,500
Chairman of the Audit Committee €55,000 and £38,000
Board Committee Chairman €50,000 and £35,000
Non-Executive Directors €45,000 and £31,000
An additional set fee of €3,625 and £2,500 per Board meeting is paid to Non-Executive Directors for intercontinental travel when joining Board meetings, where applicable.
With effect from 1 January 2012 Unilever will move to a modular fee structure which better reflects the roles and responsibilities
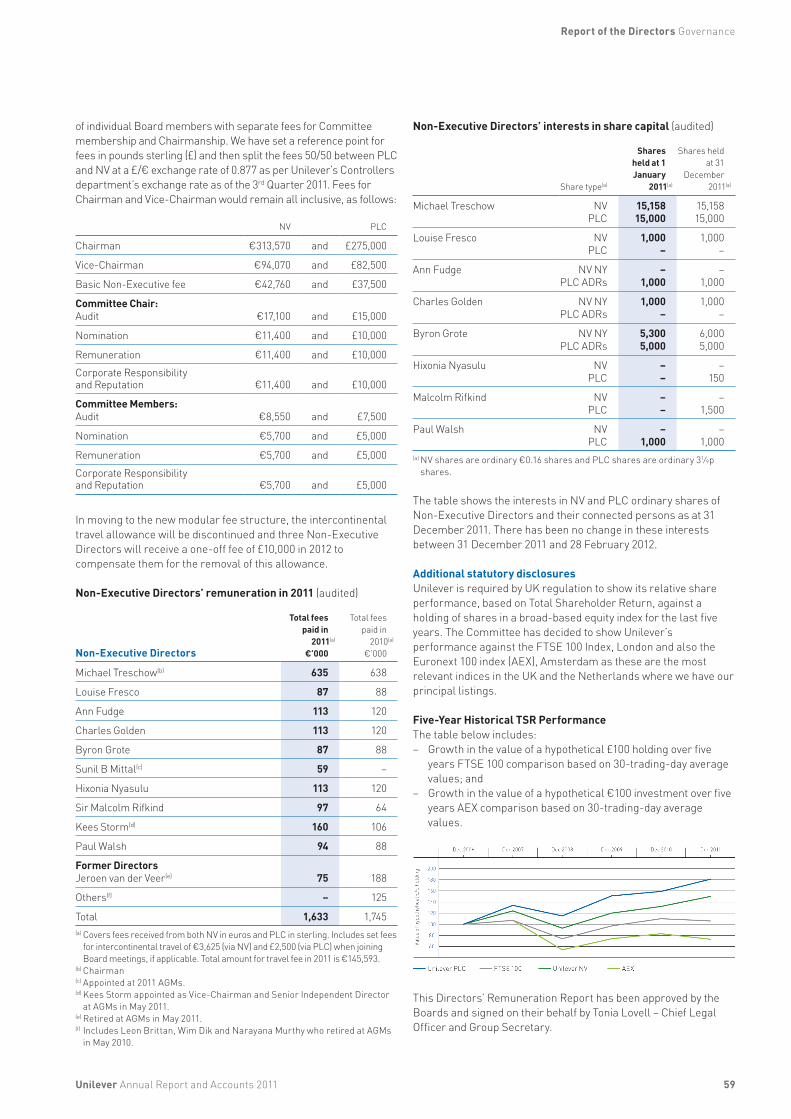
59
of individual Board members with separate fees for Committee membership and Chairmanship. We have set a reference point for fees in pounds sterling (£) and then split the fees 50/50 between PLC and NV at a £/€ exchange rate of 0.877 as per Unilever’s Controllers department’s exchange rate as of the 3rd Quarter 2011. Fees for Chairman and Vice-Chairman would remain all inclusive, as follows:
NV PLC
Chairman €313,570 and £275,000
Vice-Chairman €94,070 and £82,500
Basic Non-Executive fee €42,760 and £37,500
Committee Chair:Audit €17,100 and £15,000
Nomination €11,400 and £10,000
Remuneration €11,400 and £10,000Corporate Responsibility and Reputation €11,400 and £10,000
Committee Members:Audit €8,550 and £7,500
Nomination €5,700 and £5,000
Remuneration €5,700 and £5,000Corporate Responsibility and Reputation €5,700 and £5,000
In moving to the new modular fee structure, the intercontinental travel allowance will be discontinued and three Non-Executive Directors will receive a one-off fee of £10,000 in 2012 to compensate them for the removal of this allowance.
Non-Executive Directors’ remuneration in 2011 (audited)
Non-Executive Directors
Total fees paid in
2011(a) €’000
Total fees paid in
2010(a) €’000
Michael Treschow(b) 635 638
Louise Fresco 87 88
Ann Fudge 113 120
Charles Golden 113 120
Byron Grote 87 88
Sunil B Mittal(c) 59 –
Hixonia Nyasulu 113 120
Sir Malcolm Rifkind 97 64
Kees Storm(d) 160 106
Paul Walsh 94 88
Former DirectorsJeroen van der Veer(e) 75 188
Others(f) – 125
Total 1,633 1,745(a) Covers fees received from both NV in euros and PLC in sterling. Includes set fees
for intercontinental travel of €3,625 (via NV) and £2,500 (via PLC) when joining Board meetings, if applicable. Total amount for travel fee in 2011 is €145,593.
(b) Chairman (c) Appointed at 2011 AGMs.(d) Kees Storm appointed as Vice-Chairman and Senior Independent Director
at AGMs in May 2011. (e) Retired at AGMs in May 2011.(f) Includes Leon Brittan, Wim Dik and Narayana Murthy who retired at AGMs
in May 2010.
Non-Executive Directors’ interests in share capital (audited)
Share type(a)
Shares held at 1 January
2011(a)
Shares held at 31
December 2011(a)
Michael Treschow NV 15,158 15,158PLC 15,000 15,000
Louise Fresco NV 1,000 1,000 PLC – –
Ann Fudge NV NY – –PLC ADRs 1,000 1,000
Charles Golden NV NY 1,000 1,000PLC ADRs – –
Byron Grote NV NY 5,300 6,000PLC ADRs 5,000 5,000
Hixonia Nyasulu NV – – PLC – 150
Malcolm Rifkind NV – –PLC – 1,500
Paul Walsh NV – – PLC 1,000 1,000(a) NV shares are ordinary €0.16 shares and PLC shares are ordinary 31⁄9p
shares.
The table shows the interests in NV and PLC ordinary shares of Non-Executive Directors and their connected persons as at 31 December 2011. There has been no change in these interests between 31 December 2011 and 28 February 2012.
Additional statutory disclosuresUnilever is required by UK regulation to show its relative share performance, based on Total Shareholder Return, against a holding of shares in a broad-based equity index for the last five years. The Committee has decided to show Unilever’s performance against the FTSE 100 Index, London and also the Euronext 100 index (AEX), Amsterdam as these are the most relevant indices in the UK and the Netherlands where we have our principal listings.
Five-Year Historical TSR PerformanceThe table below includes:– Growth in the value of a hypothetical £100 holding over five
years FTSE 100 comparison based on 30-trading-day average values; and
– Growth in the value of a hypothetical €100 investment over five years AEX comparison based on 30-trading-day average values.
This Directors’ Remuneration Report has been approved by the Boards and signed on their behalf by Tonia Lovell – Chief Legal Officer and Group Secretary.
Unilever Annual Report and Accounts 2011
Report of the Directors Governance
60
FINANCIAL STATEMENTSContents
Statement of Directors’ responsibilities 61
Auditor’s reports 62
Consolidated income statement 64
Consolidated statement of comprehensive income 65
Consolidated statement of changes in equity 65
Consolidated balance sheet 66
Consolidated cash flow statement 67
Notes to the consolidated financial statements 68
1 Accountinginformationandpolicies 68
2 Segmentinformation 70
3 Grossprofitandoperatingcosts 72
4 Employees 73 4AStaffandmanagementcosts 73 4BPensionsandsimilarobligations 73 4CShare-basedcompensationplans 79
5 Netfinancecosts 80
6 Taxation 80 6AIncometax 80 6BDeferredtaxation 81 6CTaxonothercomprehensiveincome 82
7 Combinedearningspershare 83
8 Dividendsonordinarycapital 83
9 Goodwillandintangibleassets 84
10Property,plantandequipment 86
11 Othernon-currentassets 87
12 Inventories 88
13Tradeandothercurrentreceivables 88
14Tradepayablesandothercurrentliabilities 89
Notes to the consolidated financial statements (continued)
15Financialassetsandliabilities 90 15AFinancialassets 90 15BFinancialliabilities 91
16 Capitalandtreasuryriskmanagement 9316ACapitalmanagement 9316BTreasuryriskmanagement 9416CFinancialinstrumentsfairvaluerisk 9716DDerivativesandhedging 98
17 Provisions 99
18Equity 100
19Sharecapital 101
20Commitmentsandcontingentliabilities 102
21Acquisitionsanddisposals 104
22Assetsandliabilitiesheldforsale 107
23Relatedpartytransactions 107
24Remunerationofauditors 108
25Eventsafterthebalancesheetdate 108
Principal group companies and non-current investments 109
Auditor’s report – Unilever N.V. 111
Company accounts – Unilever N.V. 112
Notes to the company accounts – Unilever N.V. 113
Further statutory and other information – Unilever N.V. 116
Auditor’s report – Unilever PLC 117
Company accounts – Unilever PLC 118
Notes to the company accounts – Unilever PLC 119
Further statutory and other information – Unilever PLC 121
Shareholder information 123
UnileverAnnualReportandAccounts2011
Financial statements
61
STATEMENT OF DIRECTORS’ RESPONSIBILITIES
Annual accountsTheDirectorsarerequiredbyPart9ofBook2oftheCivil CodeintheNetherlandsandtheUnitedKingdomCompaniesAct2006toprepareaccountsforeachfinancialyearwhichgiveatrueandfairviewofthestateofaffairsof theUnileverGroup,andtheNVandPLCentities,asattheendofthefinancialyearandoftheprofitorlossandcashflowsforthatyear.
TheDirectorsconsiderthat,inpreparingtheaccounts,the GroupandtheNVandPLCentitieshaveusedthemostappropriateaccountingpolicies,consistentlyappliedandsupportedbyreasonableandprudentjudgementsandestimates,andthat allInternationalFinancialReportingStandardsasadoptedbytheEUand asissuedbytheInternationalAccountingStandardsBoard(in the caseoftheconsolidatedfinancialstatements),UnitedKingdomaccountingstandards(inthecaseoftheparentcompanyaccounts)andDutchlaw(inthecaseoftheNVparentcompanyaccounts)whichtheyconsidertobeapplicablehavebeenfollowed.
TheDirectorshaveresponsibilityforensuringthatNVandPLCkeepaccountingrecordswhichdisclosewithreasonableaccuracytheirfinancialpositionandwhichenabletheDirectorstoensurethattheaccountscomplywiththerelevantlegislation.Theyalsohaveageneralresponsibilityfortakingsuchstepsasarereasonablyopento themtosafeguardtheassetsoftheGroup,andtopreventanddetect fraudandotherirregularities.
Thisstatement,whichshouldbereadinconjunctionwiththeAuditors’reports,is madewithaviewtodistinguishingforshareholderstherespectiveresponsibilitiesoftheDirectorsand of the auditorsinrelationtotheaccounts.
AcopyofthefinancialstatementsoftheUnileverGroupisplaced on ourwebsiteatwww.unilever.com/investorrelations.ThemaintenanceandintegrityofthewebsitearetheresponsibilityoftheDirectors,andtheworkcarriedoutbytheauditorsdoesnotinvolveconsiderationofthesematters.Accordingly,theauditorsacceptnoresponsibilityforanychangesthatmayhaveoccurredtothefinancialstatementssincetheywereinitiallyplacedonthewebsite.LegislationintheUnitedKingdomandtheNetherlandsgoverningthepreparationanddisseminationoffinancialstatementsmaydifferfromlegislationinotherjurisdictions.
UKlawsetsoutadditionalresponsibilitiesfortheDirectorsofPLCregardingdisclosureofinformationtoauditors.Disclosureinrespectoftheseresponsibilitiesismadeonpage122.
Directors’ responsibility statementEachoftheDirectorsconfirmsthat,tothebestofhisorherknowledge:• Thefinancialstatementswhichhavebeenpreparedin
accordancewithInternationalFinancialReportingStandardsasadoptedbytheEUandasissuedbytheInternationalAccountingStandardsBoard(inthecaseoftheconsolidatedfinancialstatements)andUnitedKingdomaccountingstandards(inthecaseofthePLCparentcompanyaccounts)andUnitedKingdomaccountingstandardsandPart9of Book2oftheDutchCivilCode(inthecaseoftheNVparentcompanyaccounts),giveatrueandfairviewoftheassets,liabilities,financialpositionandprofitorlossoftheGroupandthe NVandPLCentitiestakenasawhole;and
• TheReportoftheDirectorsincludesafairreviewofthedevelopmentandperformanceofthebusinessandthepositionof theGroupandtheNVandthePLCentitiestakenasawhole,togetherwithadescriptionoftheprincipalrisksanduncertaintiestheyface.
TheDirectorsandtheirrolesarelistedonpages34and40.
Going concernTheactivitiesoftheGroup,togetherwiththefactorslikelytoaffectitsfuturedevelopment,performance,thefinancialpositionoftheGroup,itscashflows,liquiditypositionandborrowingfacilitiesaredescribedin AboutUnileverandtheFinancialreview2011onpages1to27.Inaddition,wedescribeinnote16onpages93to99:theGroup’sobjectives,policiesandprocessesformanagingitscapital;itsfinancialriskmanagementobjectives;detailsofitsfinancialinstrumentsandhedgingactivities;anditsexposurestocreditandliquidityrisk.
TheGrouphasconsiderablefinancialresourcestogetherwithestablishedbusinessrelationshipswithmanycustomersandsuppliersincountriesthroughouttheworld.Asaconsequence,theDirectorsbelievethattheGroupiswellplacedtomanageitsbusinessriskssuccessfullydespitethecurrentuncertainoutlook.
Aftermakingenquiries,theDirectorshaveareasonableexpectationthattheGrouphasadequateresourcestocontinueinoperationalexistencefortheforeseeablefuture.Accordingly,theycontinuetoadoptthegoingconcernbasisinpreparingtheAnnualReportand Accounts.
Internal and disclosure controls and proceduresPleaserefertopages28to32foradiscussionofUnilever’sprincipalriskfactorsandtopage33forcommentaryontheGroup’sapproachtoriskmanagementandcontrol.
UnileverAnnualReportandAccounts2011
Financial statements
62
AUDITOR’S REPORT NETHERLANDS
Independent auditor’s report
To: the General Meeting of Shareholders of Unilever N.V.
Report on the consolidated financial statementsWehaveauditedtheaccompanyingconsolidatedfinancialstatements2011assetoutonpages64to110whicharepartoftheAnnualReportandAccounts2011oftheUnileverGroupfortheyearended31December2011,whichcomprisetheconsolidatedincomestatement,consolidatedstatementofcomprehensiveincome,consolidatedstatementofchangesinequity,consolidatedbalancesheet,consolidatedcashflowstatementandthenotestotheconsolidatedfinancialstatements,comprisingasummaryofsignificantaccountingpoliciesandotherexplanatoryinformation.
Directors’ responsibilityTheDirectorsareresponsibleforthepreparationandfairpresentationoftheseconsolidatedfinancialstatementsinaccordancewithInternationalFinancialReportingStandardsasadoptedbytheEuropeanUnionandasissuedbytheInternationalAccountingStandardsBoardandwithPart9ofBook2oftheDutchCivilCode,andforthepreparationoftheReportoftheDirectorsinaccordancewithPart9ofBook2oftheDutchCivilCode.Furthermore,theDirectorsareresponsibleforsuchinternalcontrolastheydetermineisnecessarytoenablethepreparationoftheconsolidatedfinancialstatementsthatarefreefrommaterialmisstatement,whetherduetofraudorerror.
Auditor’s responsibilityOurresponsibilityistoexpressanopinionontheseconsolidatedfinancialstatementsbasedonouraudit.WeconductedourauditinaccordancewithDutchlaw,includingtheDutchStandardsonAuditing.Thisrequiresthatwecomplywithethicalrequirementsandplanandperformtheaudittoobtainreasonableassuranceaboutwhethertheconsolidatedfinancialstatementsarefreefrommaterialmisstatement.
Anauditinvolvesperformingprocedurestoobtainauditevidenceabouttheamountsanddisclosuresintheconsolidatedfinancialstatements.Theproceduresselecteddependontheauditor’sjudgement,includingtheassessmentoftherisksofmaterialmisstatementoftheconsolidatedfinancialstatements,whetherduetofraudorerror.Inmakingthoseriskassessments,theauditorconsidersinternalcontrolrelevanttothecompany’spreparationandfairpresentationoftheconsolidatedfinancialstatementsinordertodesignauditproceduresthatareappropriateinthecircumstances,butnotforthepurposeofexpressinganopinionontheeffectivenessofthecompany’sinternalcontrol.AnauditalsoincludesevaluatingtheappropriatenessofaccountingpoliciesusedandthereasonablenessofaccountingestimatesmadebytheDirectors,aswellasevaluatingtheoverallpresentationoftheconsolidatedfinancialstatements.
Webelievethattheauditevidencewehaveobtainedissufficientandappropriatetoprovideabasisforourauditopinion.
Opinion with respect to the consolidated financial statementsInouropinion,theconsolidatedfinancialstatementsgiveatrueandfairviewofthefinancialpositionofUnileverGroupasat31 December2011,andofitsresultanditscashflowsfortheyearthenendedinaccordancewithInternationalFinancialReportingStandardsasadoptedbytheEuropeanUnionandasissuedbytheInternationalAccountingStandardsBoardandwithPart9ofBook2oftheDutchCivilCode.
Separate report on company accountsWehavereportedseparatelyonthecompanyaccountsofUnileverN.V.fortheyearended31December2011.
Report on other legal and regulatory requirementsPursuanttothelegalrequirementunderSection2:393sub5ate andfoftheDutchCivilCode,wehavenodeficienciestoreportasaresultofourexaminationwhethertheReportoftheDirectors,totheextentwecanassess,hasbeenpreparedinaccordancewithPart9ofBook2ofthisCode,andwhethertheinformationasrequiredunderSection2:392sub1atb-hhasbeenannexed.FurtherwereportthattheReportoftheDirectors,totheextentwecanassess,isconsistentwiththeconsolidatedfinancialstatementsasrequiredbySection2:391sub4oftheDutchCivil Code.
Amsterdam,28February2012PricewaterhouseCoopersAccountantsN.V.
R A J Swaak RA
UnileverAnnualReportandAccounts2011
Financial statements
63
AUDITOR’S REPORT UNITEDKINGDOM
Independent auditor’s report to the members of Unilever PLC
WehaveauditedthegroupfinancialstatementsofUnileverGroupfortheyearended31December2011whichcomprisetheconsolidatedincomestatement,consolidatedstatementofcomprehensiveincome,consolidatedstatementofchangesinequity,consolidatedbalancesheet,consolidatedcashflowstatement,andtherelatednotesonpages64to110.ThefinancialreportingframeworkthathasbeenappliedintheirpreparationisapplicablelawandInternationalFinancialReportingStandards(IFRSs)asadoptedbytheEuropeanUnion.
Respective responsibilities of Directors and auditors AsexplainedmorefullyintheStatementofDirectors’responsibilitiessetoutonpage61,theDirectorsareresponsibleforthepreparationofthegroupfinancialstatementsandforbeingsatisfiedthattheygiveatrueandfairview.OurresponsibilityistoauditandexpressanopiniononthegroupfinancialstatementsinaccordancewithapplicablelawandInternationalStandardsonAuditing(UKandIreland).ThosestandardsrequireustocomplywiththeAuditingPracticesBoard’sEthicalStandardsforAuditors.
Thisreport,includingtheopinions,hasbeenpreparedforandonlyfortheparentcompany’smembersasabodyinaccordancewithChapter3ofPart16oftheCompaniesAct2006andfornootherpurpose.Wedonot,ingivingtheseopinions,acceptorassumeresponsibilityforanyotherpurposeortoanyotherpersontowhomthisreportisshownorintowhosehandsitmaycomesavewhereexpresslyagreedbyourpriorconsentinwriting.
Scope of the audit of the financial statementsAnauditinvolvesobtainingevidenceabouttheamountsanddisclosuresinthefinancialstatementssufficienttogivereasonableassurancethatthegroupfinancialstatementsarefreefrommaterialmisstatement,whethercausedbyfraudorerror.Thisincludesanassessmentof:whethertheaccountingpoliciesareappropriatetotheGroup’scircumstancesandhavebeenconsistentlyappliedandadequatelydisclosed;thereasonablenessofsignificantaccountingestimatesmadebytheDirectors;andtheoverallpresentationofthegroupfinancialstatements.Inaddition,wereadallthefinancialandnon-financialinformationintheAnnualReportandAccounts2011toidentifymaterialinconsistencieswiththeauditedfinancialstatements.Ifwebecomeawareofanyapparentmaterialmisstatementsorinconsistenciesweconsidertheimplicationsforourreport.
Opinion on financial statements Inouropinionthegroupfinancialstatements:• giveatrueandfairviewofthestateoftheGroup’saffairsasat
31December2011andofitsprofitandcashflowsfortheyearthenended;
• havebeenproperlypreparedinaccordancewithIFRSsasadoptedbytheEuropeanUnion;and
• havebeenpreparedinaccordancewiththerequirementsoftheCompaniesAct2006andArticle4ofthelASRegulation.
Separate opinion in relation to IFRSs as issued by the IASB Asexplainedinnote1tothegroupfinancialstatements,theGroupinadditiontocomplyingwithitslegalobligationtoapplyIFRSsasadoptedbytheEuropeanUnion,hasalsoappliedIFRSsasissuedbytheInternationalAccountingStandardsBoard(IASB).
InouropinionthegroupfinancialstatementscomplywithIFRSsasissuedbytheIASB.
Opinion on other matters prescribed by the Companies Act 2006 Inouropinion,theinformationgivenintheDirectors’Reportsetoutonpages121and122forthefinancialyearforwhichthegroupfinancialstatementsarepreparedisconsistentwiththegroupfinancialstatements.
Matters on which we are required to report by exception Wehavenothingtoreportinrespectofthefollowing:UndertheCompaniesAct2006wearerequiredtoreporttoyouif,inouropinion:• certaindisclosuresofDirectors’remunerationspecifiedbylaw
arenotmade;or• wehavenotreceivedalltheinformationandexplanationswe
requireforouraudit.
UndertheListingRuleswearerequiredtoreview:• theDirectors’statement,setoutonpage61,inrelationtogoing
concern;• thepartoftheCorporategovernancestatementrelatingtothe
parentcompany’scompliancewiththenineprovisionsoftheUKCorporateGovernanceCodespecifiedforourreview;and
• certainelementsofthereporttoshareholdersbytheBoardonDirectors’remuneration.
Other matters WehavereportedseparatelyontheparentcompanyfinancialstatementsofUnileverPLCfortheyearended31December2011andontheinformationintheDirectors’RemunerationReportthatisdescribedashavingbeenaudited.
John Baker (SeniorStatutoryAuditor)forandonbehalfofPricewaterhouseCoopersLLPCharteredAccountantsandStatutoryAuditorsLondon28February2012
UnileverAnnualReportandAccounts2011
Financial statements
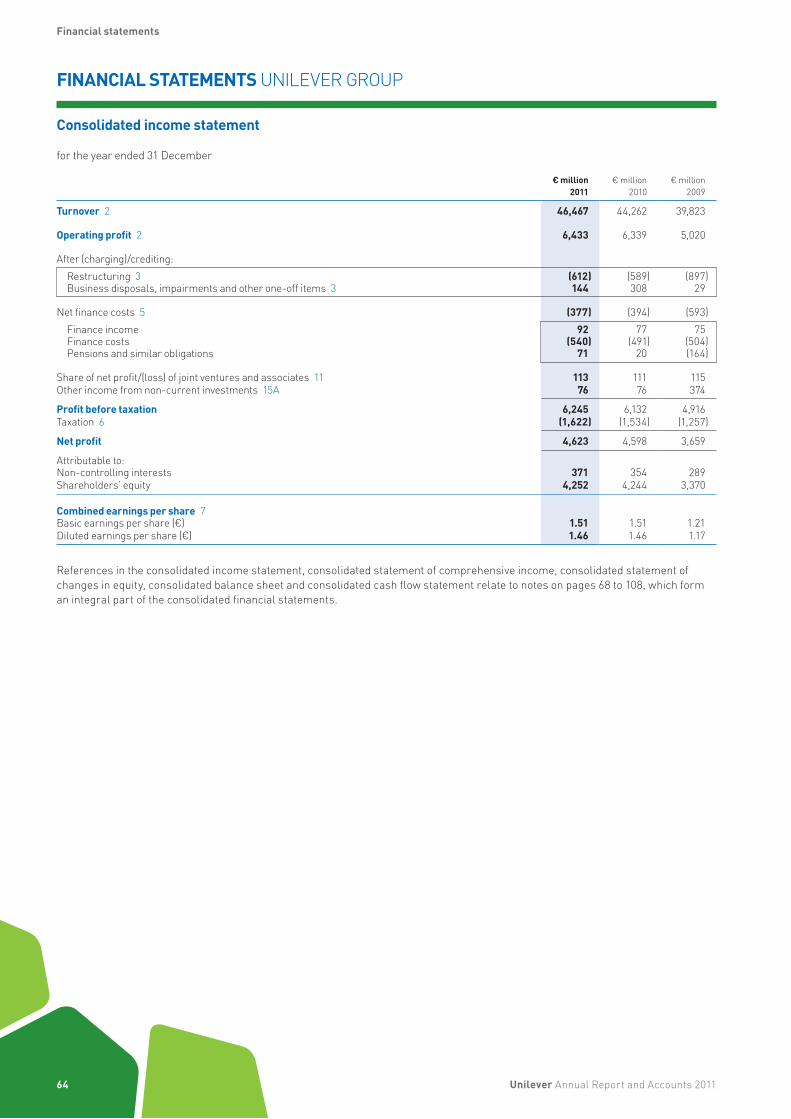
64
FINANCIAL STATEMENTS UNILEVERGROUP
Consolidated income statement
fortheyearended31December
€ million2011
€million2010
€million2009
Turnover 2 46,467 44,262 39,823
Operating profit 2 6,433 6,339 5,020
After(charging)/crediting:Restructuring 3 (612) (589) (897)Businessdisposals,impairmentsandotherone-offitems 3 144 308 29
Netfinancecosts 5 (377) (394) (593)Financeincome 92 77 75Financecosts (540) (491) (504)Pensionsandsimilarobligations 71 20 (164)
Shareofnetprofit/(loss)ofjointventuresandassociates 11 113 111 115Otherincomefromnon-currentinvestments 15A 76 76 374
Profit before taxation 6,245 6,132 4,916Taxation 6 (1,622) (1,534) (1,257)
Net profit 4,623 4,598 3,659
Attributableto:Non-controllinginterests 371 354 289Shareholders’equity 4,252 4,244 3,370
Combined earnings per share 7Basicearningspershare(€) 1.51 1.51 1.21Dilutedearningspershare(€) 1.46 1.46 1.17
Referencesintheconsolidatedincomestatement,consolidatedstatementofcomprehensiveincome,consolidatedstatementofchangesin equity,consolidatedbalancesheetandconsolidatedcashflowstatementrelatetonotesonpages68to108,whichformanintegralpartof the consolidatedfinancialstatements.
UnileverAnnualReportandAccounts2011
Financial statements
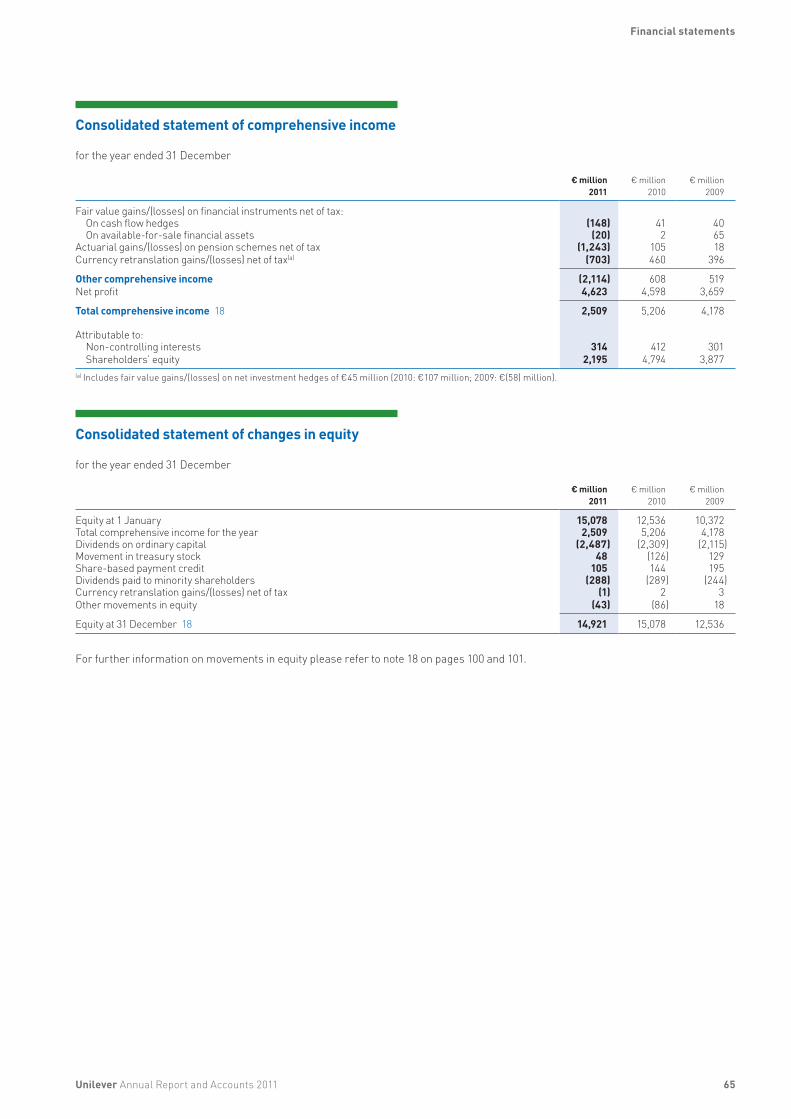
65
Consolidated statement of comprehensive income
fortheyearended31December
€ million2011
€million2010
€million2009
Fairvaluegains/(losses)onfinancialinstrumentsnetoftax:Oncashflowhedges (148) 41 40Onavailable-for-salefinancialassets (20) 2 65
Actuarialgains/(losses)onpensionschemesnetoftax (1,243) 105 18Currencyretranslationgains/(losses)netoftax(a) (703) 460 396
Other comprehensive income (2,114) 608 519Netprofit 4,623 4,598 3,659
Total comprehensive income 18 2,509 5,206 4,178
Attributableto:Non-controllinginterests 314 412 301Shareholders’equity 2,195 4,794 3,877
(a)Includesfairvaluegains/(losses)onnetinvestmenthedgesof€45million(2010:€107million;2009:€(58)million).
Consolidated statement of changes in equity
fortheyearended31December
€ million
2011€million
2010€million
2009
Equityat1January 15,078 12,536 10,372Totalcomprehensiveincomefortheyear 2,509 5,206 4,178Dividendsonordinarycapital (2,487) (2,309) (2,115)Movementintreasurystock 48 (126) 129Share-basedpaymentcredit 105 144 195Dividendspaidtominorityshareholders (288) (289) (244)Currencyretranslationgains/(losses)netoftax (1) 2 3Othermovementsinequity (43) (86) 18
Equityat31December 18 14,921 15,078 12,536
Forfurtherinformationonmovementsinequitypleaserefertonote18onpages100and101.
UnileverAnnualReportandAccounts2011
Financial statements
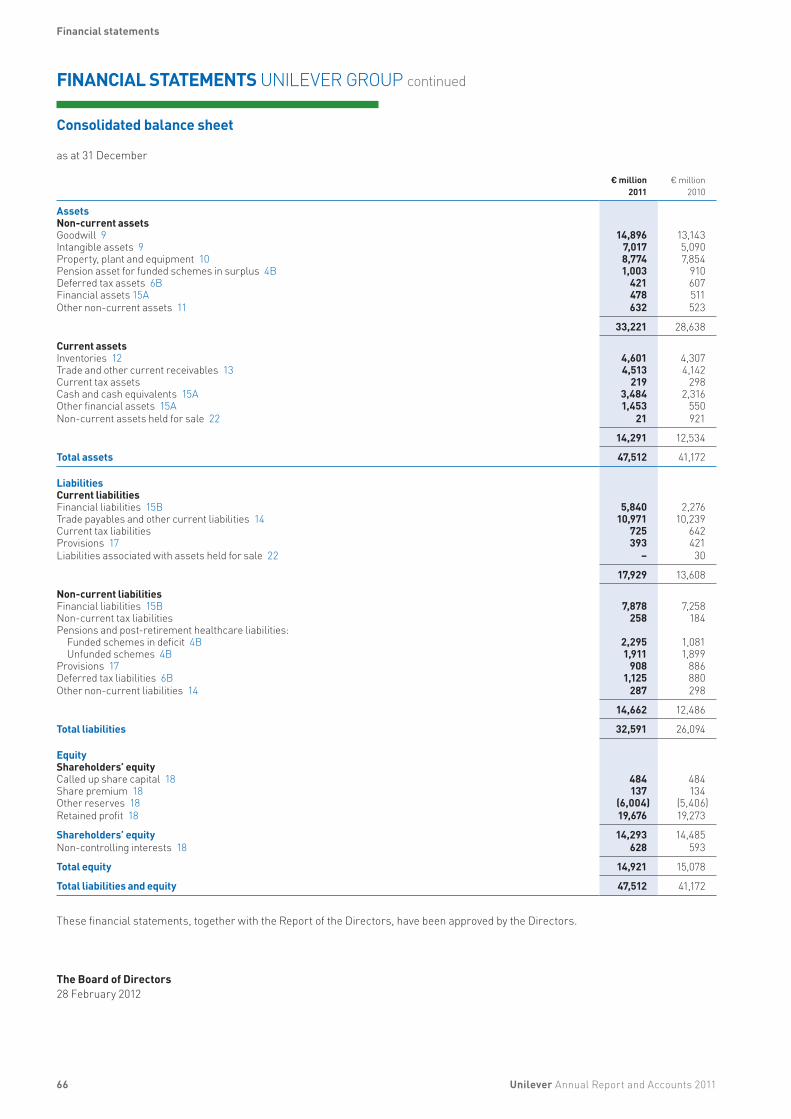
66
FINANCIAL STATEMENTS UNILEVERGROUPcontinued
Consolidated balance sheet
asat31December
€ million2011
€million2010
AssetsNon-current assetsGoodwill 9 14,896 13,143Intangibleassets 9 7,017 5,090Property,plantandequipment 10 8,774 7,854Pensionassetforfundedschemesinsurplus 4B 1,003 910Deferredtaxassets 6B 421 607Financialassets15A 478 511Othernon-currentassets 11 632 523
33,221 28,638
Current assetsInventories 12 4,601 4,307Tradeandothercurrentreceivables 13 4,513 4,142Currenttaxassets 219 298Cashandcashequivalents 15A 3,484 2,316Otherfinancialassets 15A 1,453 550Non-currentassetsheldforsale 22 21 921
14,291 12,534
Total assets 47,512 41,172
Liabilities Current liabilitiesFinancialliabilities 15B 5,840 2,276Tradepayablesandothercurrentliabilities 14 10,971 10,239Currenttaxliabilities 725 642Provisions 17 393 421Liabilitiesassociatedwithassetsheldforsale 22 – 30
17,929 13,608
Non-current liabilitiesFinancialliabilities 15B 7,878 7,258Non-currenttaxliabilities 258 184Pensionsandpost-retirementhealthcareliabilities:
Fundedschemesindeficit 4B 2,295 1,081Unfundedschemes 4B 1,911 1,899
Provisions 17 908 886Deferredtaxliabilities 6B 1,125 880Othernon-currentliabilities 14 287 298
14,662 12,486
Total liabilities 32,591 26,094
EquityShareholders’ equityCalledupsharecapital 18 484 484Sharepremium 18 137 134Otherreserves 18 (6,004) (5,406)Retainedprofit 18 19,676 19,273
Shareholders’ equity 14,293 14,485Non-controllinginterests 18 628 593
Total equity 14,921 15,078
Total liabilities and equity 47,512 41,172
Thesefinancialstatements,togetherwiththeReportoftheDirectors,havebeenapprovedbytheDirectors.
The Board of Directors28February2012
UnileverAnnualReportandAccounts2011
Financial statements

67
Consolidated cash flow statement
fortheyearended31December
€ million2011
€million2010
€million2009
Netprofit 4,623 4,598 3,659Taxation 1,622 1,534 1,257Shareofnetprofitofjointventures/associatesandotherincomefromnon-currentinvestments (189) (187) (489)Netfinancecosts: 377 394 593
Financeincome (92) (77) (75)Financecost 540 491 504Pensionsandsimilarobligations (71) (20) 164
Operatingprofit 6,433 6,339 5,020Depreciation,amortisationandimpairment 1,029 993 1,032Changesinworkingcapital: (177) 169 1,701
Inventories (219) (573) 473Tradeandothercurrentreceivables (399) (343) 640Tradepayablesandotherliabilities 441 1,085 588
Pensionsandsimilarobligationslesspayments (553) (472) (1,028)Provisionslesspayments 9 72 (258)Eliminationof(profits)/lossesondisposals (215) (476) 13Non-cashchargeforshare-basedcompensation 105 144 195Otheradjustments 8 49 58
Cashflowfromoperatingactivities 6,639 6,818 6,733Incometaxpaid (1,187) (1,328) (959)
Net cash flow from operating activities 5,452 5,490 5,774
Interestreceived 93 70 73Purchaseofintangibleassets (264) (177) (121)Purchaseofproperty,plantandequipment (1,835) (1,638) (1,248)Disposalofproperty,plantandequipment 125 114 111Acquisitionofgroupcompanies,jointventuresandassociates (3,098) (1,252) (409)Disposalofgroupcompanies,jointventuresandassociates 1,378 891 270Acquisitionofothernon-currentinvestments (88) (85) (95)Disposalofothernon-currentinvestments 178 151 224Dividendsfromjointventures,associatesandothernon-currentinvestments 116 184 201(Purchase)/saleoffinancialassets (1,072) 578 (269)
Net cash flow (used in)/from investing activities (4,467) (1,164) (1,263)
Dividendspaidonordinarysharecapital (2,485) (2,323) (2,106)Interestandpreferencedividendspaid (496) (494) (517)Netchangeinshort-termborrowings 1,261 (46) (227)Additionalfinancialliabilities 3,419 86 3,140Repaymentoffinancialliabilities (907) (1,391) (4,456)Capitalelementoffinanceleaserentalpayments (16) (22) (24)Othermovementsontreasurystock 30 (124) 103Otherfinancingactivities (395) (295) (214)
Net cash flow (used in)/from financing activities 411 (4,609) (4,301)
Net increase/(decrease) in cash and cash equivalents 1,396 (283) 210Cash and cash equivalents at the beginning of the year 1,966 2,397 2,360Effectofforeignexchangeratechanges (384) (148) (173)
Cash and cash equivalents at the end of the year 15 2,978 1,966 2,397
Thecashflowsofpensionfunds(otherthancontributionsandotherdirectpaymentsmadebytheGroupinrespectofpensionsandsimilarobligations)arenotincludedintheGroupcashflowstatement.
UnileverAnnualReportandAccounts2011
Financial statements

68
NOTES TO THE CONSOLIDATED FINANCIAL STATEMENTS UNILEVER GROUP
1. Accounting information and policies
The accounting policies adopted are the same as those which were applied for the previous financial year, except as set out below under the heading ‘Recent accounting developments’.
UnileverThe two parent companies, NV and PLC, together with their group companies, operate as a single economic entity (the Unilever Group, also referred to as Unilever or the Group). NV and PLC have the same Directors and are linked by a series of agreements, including an Equalisation Agreement, which are designed so that the positions of the shareholders of both companies are as closely as possible the same as if they held shares in a single company.
The Equalisation Agreement provides that both companies adopt the same accounting principles. It also requires that dividends and other rights and benefits attaching to each ordinary share of NV, be equal in value to those rights and benefits attaching to each ordinary share of PLC, as if each such unit of capital formed part of the ordinary capital of one and the same company.
Basis of consolidationDue to the operational and contractual arrangements referred to above, NV and PLC form a single reporting entity for the purposes of presenting consolidated financial statements. Accordingly, the financial statements of Unilever are presented by both NV and PLC as their respective consolidated financial statements. Group companies included in the consolidation are those companies controlled by NV or PLC. Control exists when the Group has the power to govern the financial and operating policies of an entity so as to obtain benefits from its activities.
The net assets and results of acquired businesses are included in the consolidated financial statements from their respective dates of acquisition, being the date on which the Group obtains control. The results of disposed businesses are included in the consolidated financial statements up to their date of disposal, being the date control ceases.
Intra-group transactions and balances are eliminated.
Companies legislation and accounting standardsThe consolidated financial statements have been prepared in accordance with International Financial Reporting Standards (IFRS) as adopted by the European Union (EU), IFRIC Interpretations and in accordance with Part 9 of Book 2 of the Civil Code in the Netherlands and the United Kingdom Companies Act 2006 applicable to companies reporting under IFRS. They are also in compliance with IFRS as issued by the International Accounting Standards Board.
These financial statements are prepared under the historical cost convention unless otherwise indicated.
Accounting policiesAccounting policies are included in the relevant notes to the consolidated financial statements and have been highlighted with blue shading and a vertical green bar on the left. The accounting policies below are applied throughout the financial statements.
Balance sheet presentationThe presentation of the balance sheet has been changed in 2011 to remove the sub-totals titled ‘Total assets less current liabilities’ and ‘Total capital employed’, instead including sub-totals titled ‘Total assets’ and ‘Total liabilities and equity’. This change provides information that is clearer and more relevant. Comparative information has been reclassified.
Foreign currenciesThe consolidated financial statements are presented in euros. The functional currencies of NV and PLC are euros and sterling respectively. Items included in the financial statements of individual group companies are recorded in their respective functional currency which is the currency of the primary economic environment in which each entity operates.
Foreign currency transactions in individual group companies are translated into functional currency using exchange rates at the date of the transaction. Foreign exchange gains and losses from settlement of these transactions, and from translation of monetary assets and liabilities at year-end exchange rates, are recognised in the income statement except when deferred in equity as qualifying hedges.
In preparing the consolidated financial statements, the balances in individual group companies are translated from their functional currency into euros. The income statement, the cash flow statement and all other movements in assets and liabilities are translated at average rates of exchange as a proxy for the transaction rate, or at the transaction rate itself if more appropriate. Assets and liabilities are translated at year-end exchange rates.
The ordinary share capital of NV and PLC is translated in accordance with the Equalisation Agreement. The difference between the value for PLC and the value by applying the year-end rate of exchange is taken to other reserves (see note 18 on page 101).
The effect of exchange rate changes during the year on net assets of foreign operations is recorded in equity. For this purpose net assets include loans between group companies and any related foreign exchange contracts where settlement is neither planned nor likely to occur in the foreseeable future. The Group applies hedge accounting to exchange differences arising between the functional currency of a foreign operation and the euro, regardless of whether the net investment is held directly or through an intermediate parent. Differences arising on retranslation of a financial liability designated as a foreign currency net investment hedge are recorded in equity to the extent that the hedge is effective. These differences are reported within profit or loss to the extent that the hedge is ineffective.
Cumulative exchange differences arising since the date of transition to IFRS of 1 January 2004 are reported as a separate component of other reserves (see note 18 on page 101). In the event of disposal or part disposal of an interest in a group company either through sale or as a result of a repayment of capital, the cumulative exchange difference is recognised in the income statement as part of the profit or loss on disposal of group companies.
Unilever Annual Report and Accounts 2011
Financial statements
69
Critical accounting estimates and judgementsThe preparation of financial statements requires management to make judgements, estimates and assumptions in the application of accounting policies that affect the reported amounts of assets, liabilities, income and expenses. Actual results may differ from these estimates. Estimates and judgements are continuously evaluated and are based on historical experience and other factors, including expectations of future events that are believed to be reasonable. Revisions to accounting estimates are recognised in the period in which the estimate is revised and in any future period affected.
Information about critical judgements in applying accounting policies, as well as estimates and assumptions that have the most significant risk of causing a material adjustment to the carrying amounts of assets and liabilities within the next financial year, are included in the following notes:• Separate presentation of items in the income statement
– note 3• Measurement of defined benefit obligations – note 4B• Key assumptions used in discounted cash flow projections
– note 9• Utilisation of tax losses and recognition of other deferred tax
assets – note 6B• Likelihood of occurrence of provisions and contingencies,
including tax investigations and audits – notes 17 and 20• Measurement of consideration and assets and liabilities
acquired as part of business combinations – note 21
Recent accounting developments
Adopted by the GroupThe following amended standards are relevant to the Group and have been adopted for the first time in these financial statements, with no material impact:• Amendments to IAS 1 ‘Presentation of financial statements’ • Amendments to IFRS 3 ‘Business combinations’• Amendments to IFRS 7 ‘Financial instruments disclosures’• IAS 24 ‘Related party disclosures (Revised)’ • Amendments to IFRIC 14 ‘Prepayments of a minimum funding
requirement’
Not adopted by the GroupThe Group is currently assessing the impact of the following new standards and amendments that are not yet effective.
The Group does not currently believe adoption of these standards would have a material impact on the consolidated results or financial position of the Group. All of the following new standards and amendments are effective from 1 January 2013 unless otherwise stated. Standards have not yet been endorsed by the EU unless otherwise stated.
Unilever Annual Report and Accounts 2011
Financial statements
• IFRS 9 ‘Financial instruments’, replaces the current classification and measurement models for financial assets with two classification categories: amortised cost and fair value. Classification is driven by the business model for managing the assets and the contractual cash flow characteristics. Financial liabilities are not affected by the changes. Effective from 1 January 2015.
• IFRS 10 ‘Consolidated financial statements’ replaces current guidance on control and consolidation. The core principle that a consolidated entity presents a parent and its subsidiaries as if they were a single entity remains unchanged, as do the mechanics of consolidation.
• IFRS 11 ‘Joint arrangements’ requires joint arrangements to be accounted for as a joint operation or as a joint venture depending on the rights and obligations of each party to the arrangement. Equity accounting for joint ventures, already used by Unilever, will become mandatory.
• IFRS 12 ‘Disclosure of interests in other entities’ requires enhanced disclosures of the nature, risks and financial effects associated with the Group’s interests in subsidiaries, associates, joint arrangements and unconsolidated structured entities.
• IFRS 13 ‘Fair value measurement’ explains how to measure fair value and enhances fair value disclosures. The standard does not significantly change the measurement of fair value but codifies it in one place.
• IAS 19 ‘Employee benefits (Revised)’ changes a number of disclosure requirements for post-employment arrangements and restricts the accounting options available for defined benefit pension plans. The return on pension plan assets and finance charge will be replaced by a net interest expense or income, calculated by applying the liability discount rate to the net defined benefit asset or liability. The Group expects this change will result in an increase in finance costs but will not impact the group’s net assets.
• Amendments to IAS 1 ‘Presentation of items of other comprehensive income’ will result in items of other comprehensive income that may be reclassified to profit or loss being presented separately from items that would never be reclassified. Effective from 1 July 2012.
• IAS 27 ‘Separate financial statements (Revised)’. The standard is revised to reflect the issue of IFRS 10.
• IAS 28 ‘Investments in associates and joint ventures (Revised)’. The standard is revised to reflect the issue of IFRS 11.
• Amendments to IAS 32 ‘Financial instruments: Presentation’ (Effective from 1 January 2014) and IFRS 7 ‘Financial instruments: Disclosures’ (Effective from 1 January 2013)provide additional guidance on when financial assets and liabilities may be offset.
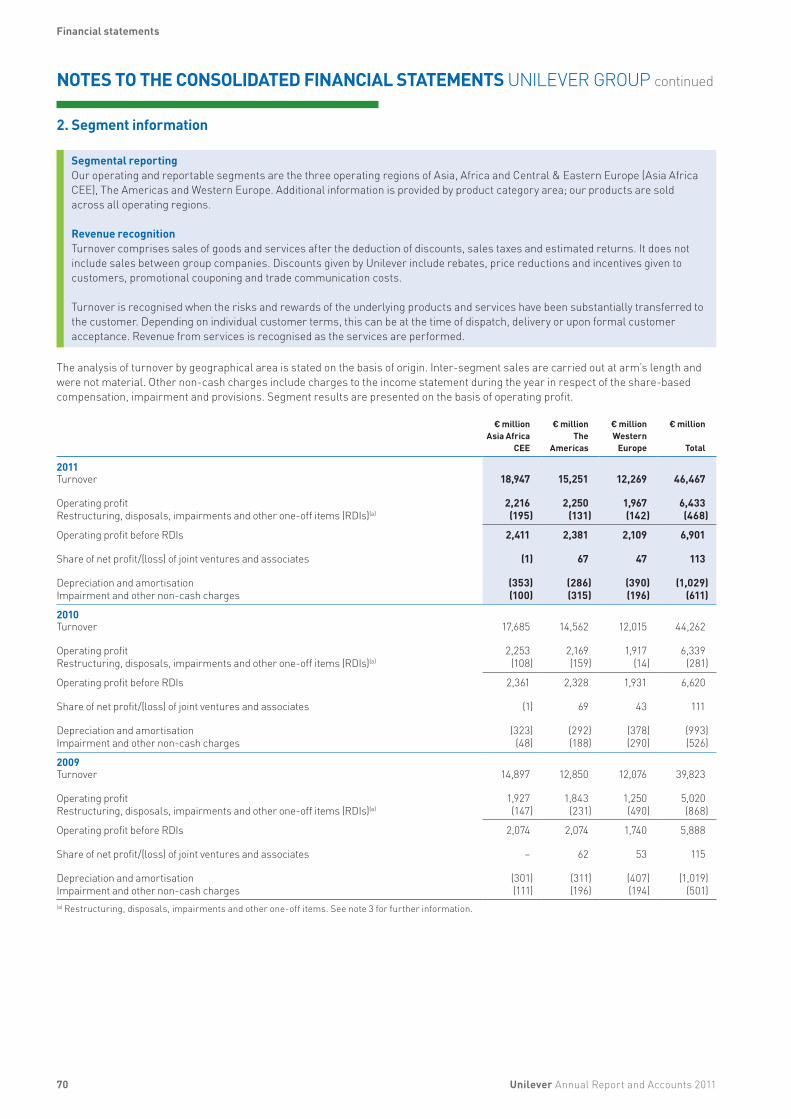
70
NOTES TO THE CONSOLIDATED FINANCIAL STATEMENTS UNILEVER GROUP continued
2. Segment information
Segmental reportingOur operating and reportable segments are the three operating regions of Asia, Africa and Central & Eastern Europe (Asia Africa CEE), The Americas and Western Europe. Additional information is provided by product category area; our products are sold across all operating regions.
Revenue recognition Turnover comprises sales of goods and services after the deduction of discounts, sales taxes and estimated returns. It does not include sales between group companies. Discounts given by Unilever include rebates, price reductions and incentives given to customers, promotional couponing and trade communication costs.
Turnover is recognised when the risks and rewards of the underlying products and services have been substantially transferred to the customer. Depending on individual customer terms, this can be at the time of dispatch, delivery or upon formal customer acceptance. Revenue from services is recognised as the services are performed.
The analysis of turnover by geographical area is stated on the basis of origin. Inter-segment sales are carried out at arm’s length and were not material. Other non-cash charges include charges to the income statement during the year in respect of the share-based compensation, impairment and provisions. Segment results are presented on the basis of operating profit.
€ millionAsia Africa
CEE
€ millionThe
Americas
€ millionWestern
Europe
€ million
Total
2011Turnover 18,947 15,251 12,269 46,467
Operating profit 2,216 2,250 1,967 6,433 Restructuring, disposals, impairments and other one-off items (RDIs)(a) (195) (131) (142) (468)
Operating profit before RDIs 2,411 2,381 2,109 6,901
Share of net profit/(loss) of joint ventures and associates (1) 67 47 113
Depreciation and amortisation (353) (286) (390) (1,029)Impairment and other non-cash charges (100) (315) (196) (611)
2010Turnover 17,685 14,562 12,015 44,262
Operating profit 2,253 2,169 1,917 6,339Restructuring, disposals, impairments and other one-off items (RDIs)(a) (108) (159) (14) (281)
Operating profit before RDIs 2,361 2,328 1,931 6,620
Share of net profit/(loss) of joint ventures and associates (1) 69 43 111
Depreciation and amortisation (323) (292) (378) (993)Impairment and other non-cash charges (48) (188) (290) (526)
2009Turnover 14,897 12,850 12,076 39,823
Operating profit 1,927 1,843 1,250 5,020Restructuring, disposals, impairments and other one-off items (RDIs)(a) (147) (231) (490) (868)
Operating profit before RDIs 2,074 2,074 1,740 5,888
Share of net profit/(loss) of joint ventures and associates – 62 53 115
Depreciation and amortisation (301) (311) (407) (1,019)Impairment and other non-cash charges (111) (196) (194) (501)(a) Restructuring, disposals, impairments and other one-off items. See note 3 for further information.
Unilever Annual Report and Accounts 2011
Financial statements

71
2. Segment information continued
The home countries of the Unilever Group are the Netherlands and the United Kingdom. Turnover and non-current assets (other than financial assets, deferred tax assets and pension assets for funded schemes in surplus) for these two countries combined, the USA and Brazil (being the two largest countries outside the home countries) and all other countries are:
2011
€ millionNetherlands/
UnitedKingdom
€ million
USA
€ million
Brazil
€ million
All othercountries
€ million
Total
Turnover 3,693 6,889 3,644 32,241 46,467 Non-current assets 2,915 9,286 2,525 16,593 31,319
2010
Turnover 3,490 6,725 3,502 30,545 44,262Non-current assets 2,602 5,960 2,681 15,367 26,610
2009
Turnover 3,384 6,332 2,796 27,311 39,823Non-current assets 2,434 5,498 2,412 13,879 24,223
No other country had turnover or non-current assets (as shown above) greater than 10% of the Group total.
Additional information by product areaAlthough the Group’s operations are managed on a geographical basis, we provide additional information based on brands grouped into four principal areas, as set out below.
Personal Care – including sales of skin care and hair care products, deodorants and oral care products.
Home Care – including sales of home care products, such as laundry tablets, powders and liquids, soap bars and a wide range of cleaning products.
Foods – including sales of soups, bouillons, sauces, snacks, mayonnaise, salad dressings, margarines and spreads, and cooking products such as liquid margarines.
Refreshment – including sales of ice cream, tea-based beverages, weight-management products, and nutritionally enhanced staples sold in developing markets.
2011
€ million
Foods
€ million
Refreshment
€ millionPersonal
Care
€ million
Home Care
€ million
Total
Turnover 13,986 8,804 15,471 8,206 46,467 Operating profit 2,693 723 2,536 481 6,433 Share of net profit/(loss) of joint ventures and associates 7 98 5 3 113
2010
Turnover 14,164 8,605 13,767 7,726 44,262Operating profit 2,846 724 2,296 473 6,339Share of net profit/(loss) of joint ventures and associates 18 92 7 (6) 111
2009
Turnover 13,256 7,753 11,846 6,968 39,823Operating profit 1,840 731 1,834 615 5,020Share of net profit/(loss) of joint ventures and associates 14 87 4 10 115
Unilever Annual Report and Accounts 2011
Financial statements
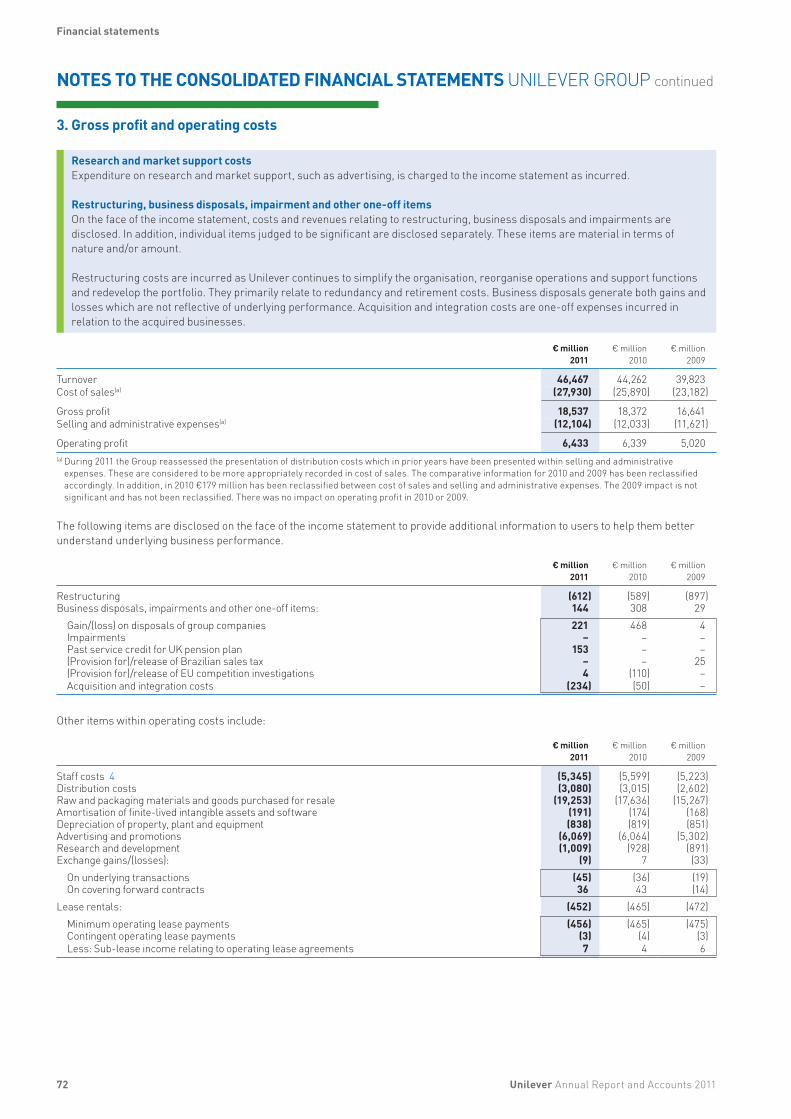
72
NOTES TO THE CONSOLIDATED FINANCIAL STATEMENTS UNILEVER GROUP continued
3. Gross profit and operating costs
Research and market support costsExpenditure on research and market support, such as advertising, is charged to the income statement as incurred.
Restructuring, business disposals, impairment and other one-off itemsOn the face of the income statement, costs and revenues relating to restructuring, business disposals and impairments are disclosed. In addition, individual items judged to be significant are disclosed separately. These items are material in terms of nature and/or amount.
Restructuring costs are incurred as Unilever continues to simplify the organisation, reorganise operations and support functions and redevelop the portfolio. They primarily relate to redundancy and retirement costs. Business disposals generate both gains and losses which are not reflective of underlying performance. Acquisition and integration costs are one-off expenses incurred in relation to the acquired businesses.
€ million € million € million2011 2010 2009
Turnover 46,467 44,262 39,823Cost of sales(a) (27,930) (25,890) (23,182)
Gross profitSelling and administrative
Operating profit
expenses(a) 18,537
(12,104)
6,433
18,372 (12,033)
16,641 (11,621)
6,339 5,020(a) During 2011 the Group reassessed the presentation of distribution costs which in prior years have been presented within selling and administrative
expenses. These are considered to be more appropriately recorded in cost of sales. The comparative information for 2010 and 2009 has been reclassified accordingly. In addition, in 2010 €179 million has been reclassified between cost of sales and selling and administrative expenses. The 2009 impact is not significant and has not been reclassified. There was no impact on operating profit in 2010 or 2009.
The following items are disclosed on the face of the income statement to provide additional information to users to help them better understand underlying business performance.
€ million2011
€ million2010
€ million2009
Restructuring (612) (589) (897)Business disposals, impairments and other one-off items: 144 308 29
Gain/(loss) on disposals of group companies 221 468 4Impairments – – –Past service credit for UK pension plan 153 – –(Provision for)/release of Brazilian sales tax – – 25(Provision for)/release of EU competition investigations 4 (110) –Acquisition and integration costs (234) (50) –
Other items within operating costs include:
€ million2011
€ million2010
€ million2009
Staff costs 4 (5,345) (5,599) (5,223)Distribution costs (3,080) (3,015) (2,602)Raw and packaging materials and goods purchased for resale (19,253) (17,636) (15,267)Amortisation of finite-lived intangible assets and software (191) (174) (168)Depreciation of property, plant and equipment (838) (819) (851)Advertising and promotions (6,069) (6,064) (5,302)Research and development (1,009) (928) (891)Exchange gains/(losses): (9) 7 (33)
On underlying transactions (45) (36) (19)On covering forward contracts 36 43 (14)
Lease rentals: (452) (465) (472)Minimum operating lease payments (456) (465) (475)Contingent operating lease payments (3) (4) (3)Less: Sub-lease income relating to operating lease agreements 7 4 6
Unilever Annual Report and Accounts 2011
Financial statements
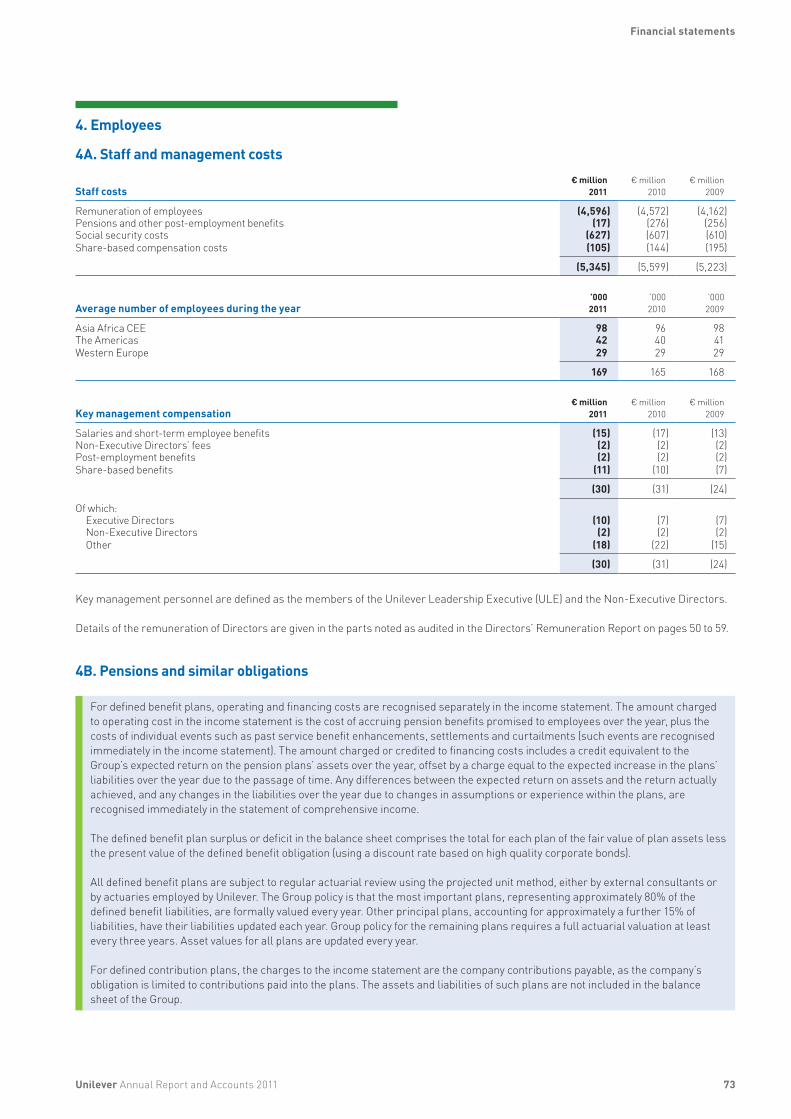
73
4. Employees
4A. Staff and management costs
Staff costs€ million
2011€ million
2010€ million
2009
Remuneration of employees (4,596) (4,572) (4,162)Pensions and other post-employment benefits (17) (276) (256)Social security costs (627) (607) (610)Share-based compensation costs (105) (144) (195)
(5,345) (5,599) (5,223)
Average number of employees during the year’0002011
’0002010
’0002009
Asia Africa CEE 98 96 98The Americas 42 40 41Western Europe 29 29 29
169 165 168
Key management compensation€ million
2011€ million
2010€ million
2009
Salaries and short-term employee benefits (15) (17) (13)Non-Executive Directors’ fees (2) (2) (2)Post-employment benefits (2) (2) (2)Share-based benefits (11) (10) (7)
(30) (31) (24)
Of which:Executive Directors (10) (7) (7)Non-Executive Directors (2) (2) (2)Other (18) (22) (15)
(30) (31) (24)
Key management personnel are defined as the members of the Unilever Leadership Executive (ULE) and the Non-Executive Directors.
Details of the remuneration of Directors are given in the parts noted as audited in the Directors’ Remuneration Report on pages 50 to 59.
4B. Pensions and similar obligations
For defined benefit plans, operating and financing costs are recognised separately in the income statement. The amount charged to operating cost in the income statement is the cost of accruing pension benefits promised to employees over the year, plus the costs of individual events such as past service benefit enhancements, settlements and curtailments (such events are recognised immediately in the income statement). The amount charged or credited to financing costs includes a credit equivalent to the Group’s expected return on the pension plans’ assets over the year, offset by a charge equal to the expected increase in the plans’ liabilities over the year due to the passage of time. Any differences between the expected return on assets and the return actually achieved, and any changes in the liabilities over the year due to changes in assumptions or experience within the plans, are recognised immediately in the statement of comprehensive income.
The defined benefit plan surplus or deficit in the balance sheet comprises the total for each plan of the fair value of plan assets less the present value of the defined benefit obligation (using a discount rate based on high quality corporate bonds).
All defined benefit plans are subject to regular actuarial review using the projected unit method, either by external consultants or by actuaries employed by Unilever. The Group policy is that the most important plans, representing approximately 80% of the defined benefit liabilities, are formally valued every year. Other principal plans, accounting for approximately a further 15% of liabilities, have their liabilities updated each year. Group policy for the remaining plans requires a full actuarial valuation at least every three years. Asset values for all plans are updated every year.
For defined contribution plans, the charges to the income statement are the company contributions payable, as the company’s obligation is limited to contributions paid into the plans. The assets and liabilities of such plans are not included in the balance sheet of the Group.
Unilever Annual Report and Accounts 2011
Financial statements
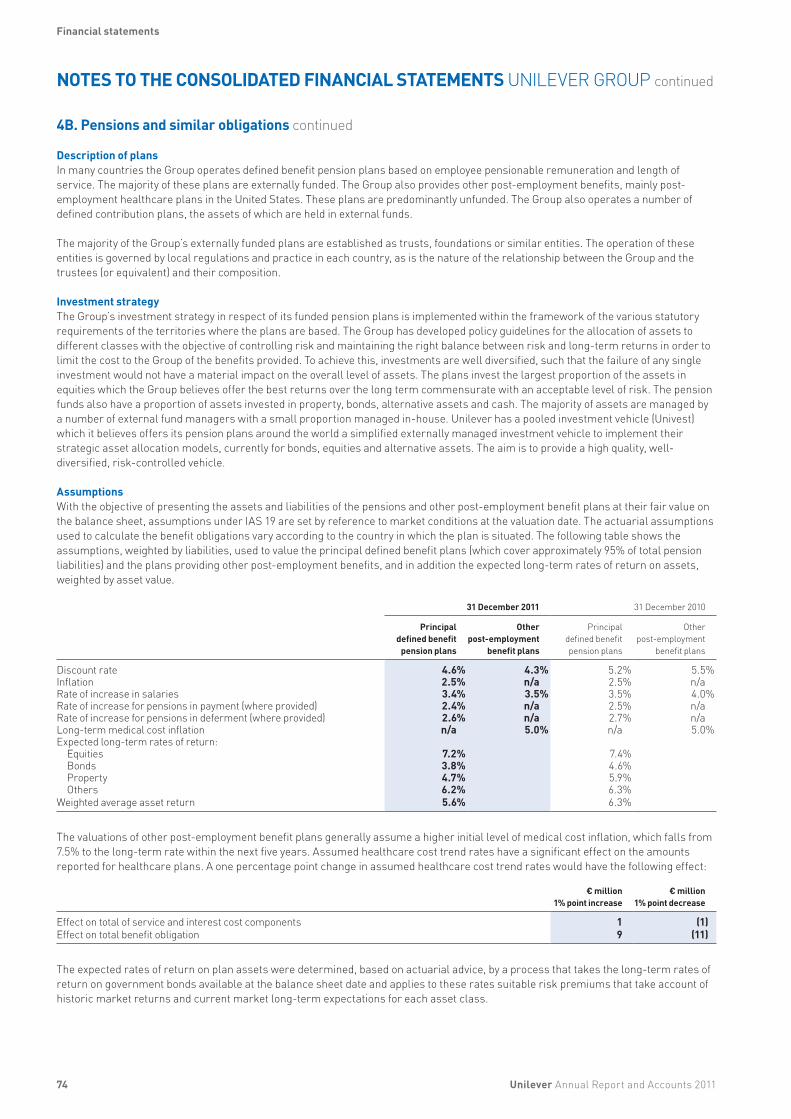
74
NOTES TO THE CONSOLIDATED FINANCIAL STATEMENTS UNILEVER GROUP continued
4B. Pensions and similar obligations continued
Description of plansIn many countries the Group operates defined benefit pension plans based on employee pensionable remuneration and length of service. The majority of these plans are externally funded. The Group also provides other post-employment benefits, mainly post-employment healthcare plans in the United States. These plans are predominantly unfunded. The Group also operates a number of defined contribution plans, the assets of which are held in external funds.
The majority of the Group’s externally funded plans are established as trusts, foundations or similar entities. The operation of these entities is governed by local regulations and practice in each country, as is the nature of the relationship between the Group and the trustees (or equivalent) and their composition.
Investment strategyThe Group’s investment strategy in respect of its funded pension plans is implemented within the framework of the various statutory requirements of the territories where the plans are based. The Group has developed policy guidelines for the allocation of assets to different classes with the objective of controlling risk and maintaining the right balance between risk and long-term returns in order to limit the cost to the Group of the benefits provided. To achieve this, investments are well diversified, such that the failure of any single investment would not have a material impact on the overall level of assets. The plans invest the largest proportion of the assets in equities which the Group believes offer the best returns over the long term commensurate with an acceptable level of risk. The pension funds also have a proportion of assets invested in property, bonds, alternative assets and cash. The majority of assets are managed by a number of external fund managers with a small proportion managed in-house. Unilever has a pooled investment vehicle (Univest) which it believes offers its pension plans around the world a simplified externally managed investment vehicle to implement their strategic asset allocation models, currently for bonds, equities and alternative assets. The aim is to provide a high quality, well-diversified, risk-controlled vehicle.
AssumptionsWith the objective of presenting the assets and liabilities of the pensions and other post-employment benefit plans at their fair value on the balance sheet, assumptions under IAS 19 are set by reference to market conditions at the valuation date. The actuarial assumptions used to calculate the benefit obligations vary according to the country in which the plan is situated. The following table shows the assumptions, weighted by liabilities, used to value the principal defined benefit plans (which cover approximately 95% of total pension liabilities) and the plans providing other post-employment benefits, and in addition the expected long-term rates of return on assets, weighted by asset value.
31 December 2011 31 December 2010
Principal defined benefit
pension plans
Otherpost-employment
benefit plans
Principal defined benefit pension plans
Other post-employment
benefit plans
Discount rate 4.6% 4.3% 5.2% 5.5%Inflation 2.5% n/a 2.5% n/aRate of increase in salaries 3.4% 3.5% 3.5% 4.0%Rate of increase for pensions in payment (where provided) 2.4% n/a 2.5% n/aRate of increase for pensions in deferment (where provided) 2.6% n/a 2.7% n/aLong-term medical cost inflation n/a 5.0% n/a 5.0%Expected long-term rates of return:
Equities 7.2% 7.4%Bonds 3.8% 4.6%Property 4.7% 5.9%Others 6.2% 6.3%
Weighted average asset return 5.6% 6.3%
The valuations of other post-employment benefit plans generally assume a higher initial level of medical cost inflation, which falls from 7.5% to the long-term rate within the next five years. Assumed healthcare cost trend rates have a significant effect on the amounts reported for healthcare plans. A one percentage point change in assumed healthcare cost trend rates would have the following effect:
€ million1% point increase
€ million1% point decrease
Effect on total of service and interest cost components 1 (1)Effect on total benefit obligation 9 (11)
The expected rates of return on plan assets were determined, based on actuarial advice, by a process that takes the long-term rates of return on government bonds available at the balance sheet date and applies to these rates suitable risk premiums that take account of historic market returns and current market long-term expectations for each asset class.
Unilever Annual Report and Accounts 2011
Financial statements
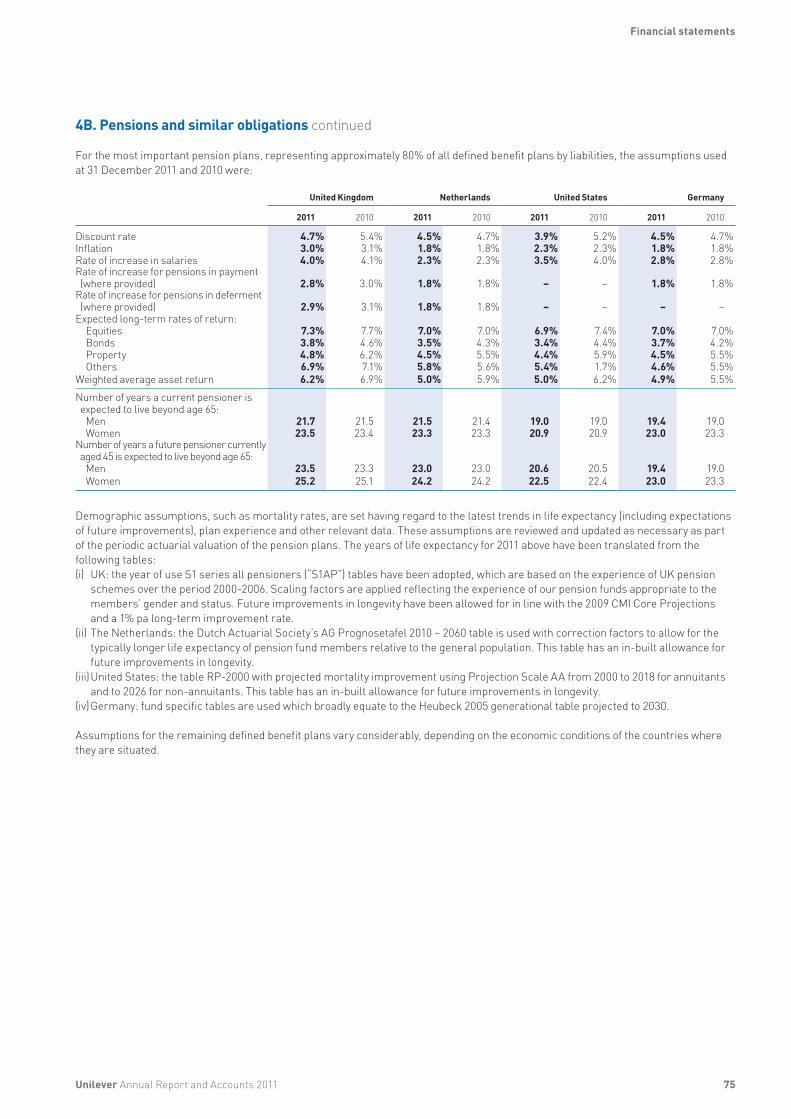
75
4B. Pensions and similar obligations continued
For the most important pension plans, representing approximately 80% of all defined benefit plans by liabilities, the assumptions used at 31 December 2011 and 2010 were:
United Kingdom Netherlands United States Germany
2011 2010 2011 2010 2011 2010 2011 2010
Discount rate 4.7% 5.4% 4.5% 4.7% 3.9% 5.2% 4.5% 4.7%Inflation 3.0% 3.1% 1.8% 1.8% 2.3% 2.3% 1.8% 1.8% Rate of increase in salaries 4.0% 4.1% 2.3% 2.3% 3.5% 4.0% 2.8% 2.8%Rate of increase for pensions in payment (where provided) 2.8% 3.0% 1.8% 1.8% – – 1.8% 1.8%
Rate of increase for pensions in deferment (where provided) 2.9% 3.1% 1.8% 1.8% – – – –
Expected long-term rates of return:Equities 7.3% 7.7% 7.0% 7.0% 6.9% 7.4% 7.0% 7.0%Bonds 3.8% 4.6% 3.5% 4.3% 3.4% 4.4% 3.7% 4.2%Property 4.8% 6.2% 4.5% 5.5% 4.4% 5.9% 4.5% 5.5%Others 6.9% 7.1% 5.8% 5.6% 5.4% 1.7% 4.6% 5.5%
Weighted average asset return 6.2% 6.9% 5.0% 5.9% 5.0% 6.2% 4.9% 5.5%Number of years a current pensioner is expected to live beyond age 65:
Men 21.7 21.5 21.5 21.4 19.0 19.0 19.4 19.0Women 23.5 23.4 23.3 23.3 20.9 20.9 23.0 23.3
Number of years a future pensioner currently aged 45 is expected to live beyond age 65:
Men 23.5 23.3 23.0 23.0 20.6 20.5 19.4 19.0Women 25.2 25.1 24.2 24.2 22.5 22.4 23.0 23.3
Demographic assumptions, such as mortality rates, are set having regard to the latest trends in life expectancy (including expectations of future improvements), plan experience and other relevant data. These assumptions are reviewed and updated as necessary as part of the periodic actuarial valuation of the pension plans. The years of life expectancy for 2011 above have been translated from the following tables:(i) UK: the year of use S1 series all pensioners (“S1AP”) tables have been adopted, which are based on the experience of UK pension
schemes over the period 2000-2006. Scaling factors are applied reflecting the experience of our pension funds appropriate to the members’ gender and status. Future improvements in longevity have been allowed for in line with the 2009 CMI Core Projections and a 1% pa long-term improvement rate.
(ii) The Netherlands: the Dutch Actuarial Society’s AG Prognosetafel 2010 – 2060 table is used with correction factors to allow for the typically longer life expectancy of pension fund members relative to the general population. This table has an in-built allowance for future improvements in longevity.
(iii) United States: the table RP-2000 with projected mortality improvement using Projection Scale AA from 2000 to 2018 for annuitants and to 2026 for non-annuitants. This table has an in-built allowance for future improvements in longevity.
(iv) Germany: fund specific tables are used which broadly equate to the Heubeck 2005 generational table projected to 2030.
Assumptions for the remaining defined benefit plans vary considerably, depending on the economic conditions of the countries where they are situated.
Unilever Annual Report and Accounts 2011
Financial statements

76
NOTES TO THE CONSOLIDATED FINANCIAL STATEMENTS UNILEVER GROUP continued
4B. Pensions and similar obligations continued
Income statementThe charge to the income statement comprises:
€ million2011
€ million2010
€ million2009
Charged to operating profit:Defined benefit pension and other benefit plans:
Current service cost (252) (261) (228)Employee contributions 15 13 12Special termination benefits (31) (22) (50)Past service cost 195 60 50Settlements/curtailments 146 6 20
Defined contribution plans (90) (72) (60)
Total operating cost 4A (17) (276) (256)
Charged to net finance costs:Interest on retirement benefits (908) (963) (940)Expected return on assets 979 983 776
Total net finance income/(cost) 5 71 20 (164)
Net impact on the income statement (before tax) 54 (256) (420)
Significant items on the face of the income statementOne-off items in 2011 include a past service credit of €153 million, as Unilever implemented amendments to certain constructive obligations in the UK that the company had the discretion to amend, and curtailment credits of €146 million relating to benefit changes mainly in the UK, the USA and Canada.
Statement of comprehensive incomeAmounts recognised in the statement of comprehensive income comprise:
€ million
2011
€ million
2010
€ million
2009
€ million
2008
€ million
2007
€ millionCumulative
1 January2004 to present
Actual return less expected return on pension and other benefit plan assets (440) 677 1,277 (4,243) (236) (471)
Experience gains/(losses) arising on pension plan and other benefit plan liabilities (74) 197 250 – 103 507
Changes in assumptions underlying the present value of the pension and other benefit plan liabilities (1,177) (716) (1,489) 1,116 946 (3,599)
Actuarial gain/(loss) (1,691) 158 38 (3,127) 813 (3,563)Change in unrecognised surplus – – – – – 103Refund of unrecognised assets – – – – – 15Net actuarial gain/(loss) recognised in statement of comprehensive income (before tax) (1,691) 158 38 (3,127) 813 (3,445)
Unilever Annual Report and Accounts 2011
Financial statements

77
4B. Pensions and similar obligations continued
Balance sheetThe assets, liabilities and surplus/(deficit) position of the pension and other post-employment benefit plans and the expected rates of return on the plan assets at the balance sheet date were:
31 December 2011 31 December 2010
€ million € million % € million € million %
Pensionplans
Other post-employment
benefitplans
Long-termrates of
returnexpected
Pensionplans
Other post-employment
benefitplans
Long-termrates ofreturn
expected
Assets of principal plans:Equities 6,860 – 7.2% 7,690 – 7.4%Bonds 6,120 – 3.8% 5,013 – 4.6%Property 1,007 – 4.7% 915 – 5.9%Other 1,633 – 6.2% 1,931 – 6.3%
Assets of other plans 417 7 7.9% 419 6 8.3%
16,037 7 – 15,968 6 –Present value of liabilities:
Principal plans (17,703) – – (16,540) – – Other plans (887) (657) – (842) (662) –
(18,590) (657) – (17,382) (662) –
Aggregate net deficit of the plans (2,553) (650) – (1,414) (656) – Irrecoverable surplus(a) – – – – –
Pension liability net of assets (2,553) (650) – (1,414) (656) –
Of which in respect of:
Funded plans in surplus:Liabilities (4,201) – – (5,519) – –Assets 5,204 – – 6,429 – –
Aggregate surplus 1,003 – – 910 – –Irrecoverable surplus(a) – – – – – –
Pension asset net of liabilities 1,003 – – 910 – –
Funded plans in deficit:Liabilities (13,101) (34) – (10,592) (34) –Assets 10,833 7 – 9,539 6 –
Pension liability net of assets (2,268) (27) – (1,053) (28) –
Unfunded plans:Pension liability (1,288) (623) – (1,271) (628) –(a) A surplus is deemed recoverable to the extent that the Group is able to benefit economically from the surplus.
In 2010, agreement was reached with local insurers to externally insure most of our existing Swedish pension obligation. Consequently, €150 million of liabilities were considered settled and removed from the table above. The remaining liability in Sweden of €6 million was included in unfunded plans at the end of 2010.
Equity securities include Unilever securities amounting to €41 million (0.3% of total plan assets) and €50 million (0.3% of total plan assets) at 31 December 2011 and 2010 respectively. Property includes property occupied by Unilever amounting to €14 million and €14 million at 31 December 2011 and 2010 respectively.
The pension assets above exclude the assets in a Special Benefits Trust amounting to €110 million (2010: €128 million) to fund pension and similar obligations in the US (see also note 15A on page 91).
The sensitivity of the overall pension liabilities to changes in the weighted key financial assumptions are:
Change in assumption Impact on overall liabilities
Discount rate Increase/decrease by 0.5% Decrease/increase by 7%Inflation rate Increase/decrease by 0.5% Increase/decrease by 6%
Unilever Annual Report and Accounts 2011
Financial statements
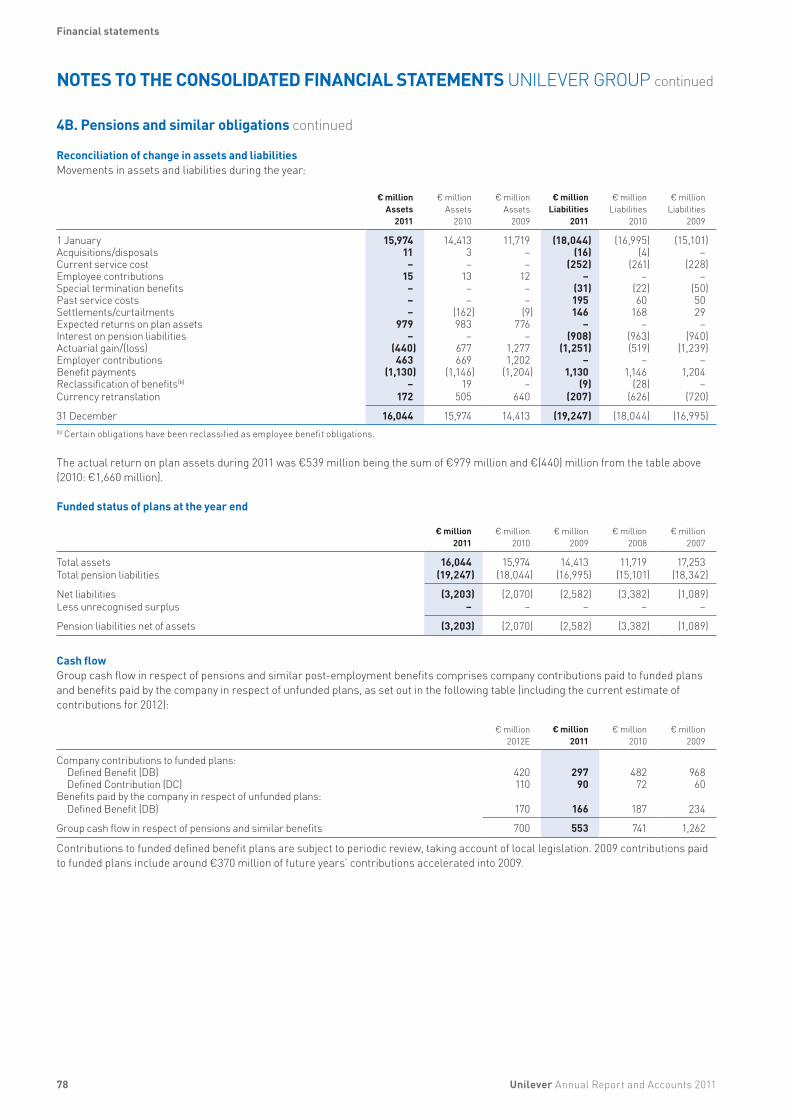
78
NOTES TO THE CONSOLIDATED FINANCIAL STATEMENTS UNILEVER GROUP continued
4B. Pensions and similar obligations continued
Reconciliation of change in assets and liabilitiesMovements in assets and liabilities during the year:
€ millionAssets
2011
€ millionAssets
2010
€ millionAssets
2009
€ millionLiabilities
2011
€ millionLiabilities
2010
€ millionLiabilities
2009
1 January 15,974 14,413 11,719 (18,044) (16,995) (15,101)Acquisitions/disposals 11 3 – (16) (4) –Current service cost – – – (252) (261) (228)Employee contributions 15 13 12 – – –Special termination benefits – – – (31) (22) (50)Past service costs – – – 195 60 50Settlements/curtailments – (162) (9) 146 168 29Expected returns on plan assets 979 983 776 – – –Interest on pension liabilities – – – (908) (963) (940)Actuarial gain/(loss) (440) 677 1,277 (1,251) (519) (1,239)Employer contributions 463 669 1,202 – – –Benefit payments (1,130) (1,146) (1,204) 1,130 1,146 1,204Reclassification of benefits(b) – 19 – (9) (28) –Currency retranslation 172 505 640 (207) (626) (720)
31 December 16,044 15,974 14,413 (19,247) (18,044) (16,995)(b) Certain obligations have been reclassified as employee benefit obligations.
The actual return on plan assets during 2011 was €539 million being the sum of €979 million and €(440) million from the table above (2010: €1,660 million).
Funded status of plans at the year end
€ million2011
€ million2010
€ million2009
€ million2008
€ million2007
Total assets 16,044 15,974 14,413 11,719 17,253Total pension liabilities (19,247) (18,044) (16,995) (15,101) (18,342)
Net liabilities (3,203) (2,070) (2,582) (3,382) (1,089)Less unrecognised surplus – – – – –
Pension liabilities net of assets (3,203) (2,070) (2,582) (3,382) (1,089)
Cash flowGroup cash flow in respect of pensions and similar post-employment benefits comprises company contributions paid to funded plans and benefits paid by the company in respect of unfunded plans, as set out in the following table (including the current estimate of contributions for 2012):
€ million
2012E€ million
2011€ million
2010€ million
2009
Company contributions to funded plans:Defined Benefit (DB) 420 297 482 968Defined Contribution (DC) 110 90 72 60
Benefits paid by the company in respect of unfunded plans:Defined Benefit (DB) 170 166 187 234
Group cash flow in respect of pensions and similar benefits 700 553 741 1,262
Contributions to funded defined benefit plans are subject to periodic review, taking account of local legislation. 2009 contributions paid to funded plans include around €370 million of future years’ contributions accelerated into 2009.
Unilever Annual Report and Accounts 2011
Financial statements
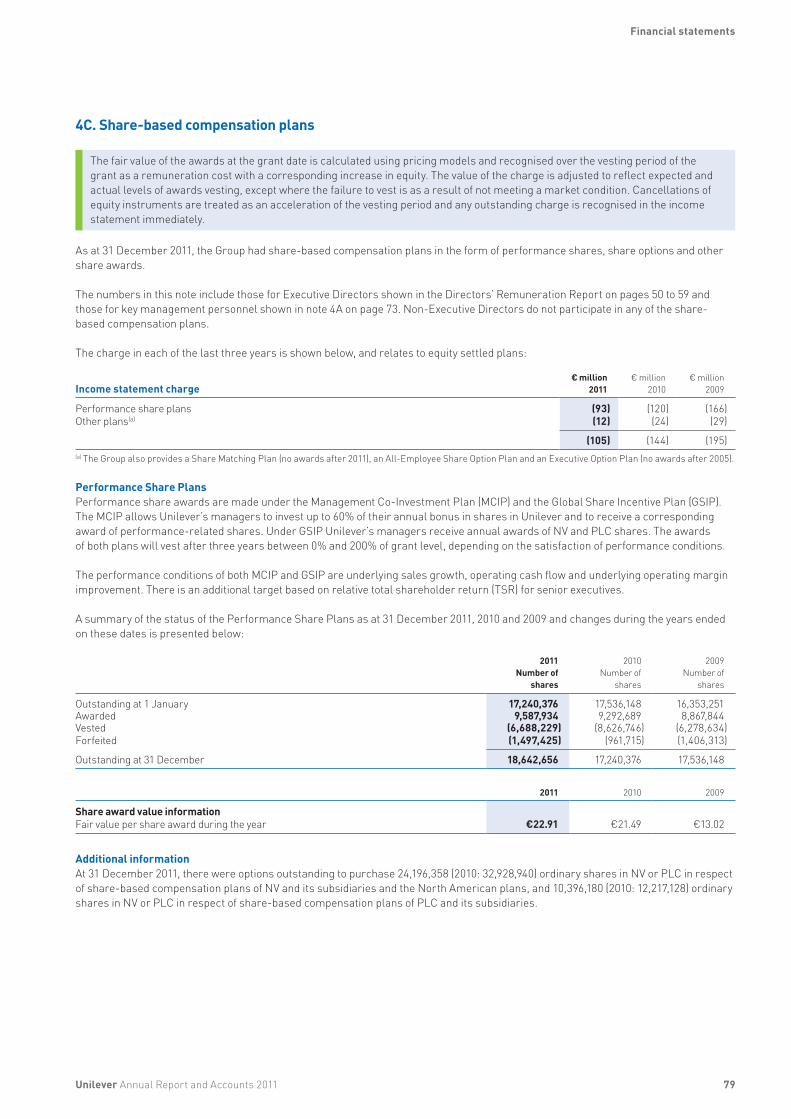
79
4C. Share-based compensation plans
The fair value of the awards at the grant date is calculated using pricing models and recognised over the vesting period of the grant as a remuneration cost with a corresponding increase in equity. The value of the charge is adjusted to reflect expected and actual levels of awards vesting, except where the failure to vest is as a result of not meeting a market condition. Cancellations of equity instruments are treated as an acceleration of the vesting period and any outstanding charge is recognised in the income statement immediately.
As at 31 December 2011, the Group had share-based compensation plans in the form of performance shares, share options and other share awards.
The numbers in this note include those for Executive Directors shown in the Directors’ Remuneration Report on pages 50 to 59 and those for key management personnel shown in note 4A on page 73. Non-Executive Directors do not participate in any of the share-based compensation plans.
The charge in each of the last three years is shown below, and relates to equity settled plans:
Income statement charge
€ million2011
€ million2010
€ million2009
Performance share plans (93) (120) (166)Other plans(a) (12) (24) (29)
(105) (144) (195)(a) The Group also provides a Share Matching Plan (no awards after 2011), an All-Employee Share Option Plan and an Executive Option Plan (no awards after 2005).
Performance Share PlansPerformance share awards are made under the Management Co-Investment Plan (MCIP) and the Global Share Incentive Plan (GSIP). The MCIP allows Unilever’s managers to invest up to 60% of their annual bonus in shares in Unilever and to receive a corresponding award of performance-related shares. Under GSIP Unilever’s managers receive annual awards of NV and PLC shares. The awards of both plans will vest after three years between 0% and 200% of grant level, depending on the satisfaction of performance conditions.
The performance conditions of both MCIP and GSIP are underlying sales growth, operating cash flow and underlying operating margin improvement. There is an additional target based on relative total shareholder return (TSR) for senior executives.
A summary of the status of the Performance Share Plans as at 31 December 2011, 2010 and 2009 and changes during the years ended on these dates is presented below:
2011Number of
shares
2010Number of
shares
2009Number of
shares
Outstanding at 1 January 17,240,376 17,536,148 16,353,251Awarded 9,587,934 9,292,689 8,867,844Vested (6,688,229) (8,626,746) (6,278,634)Forfeited (1,497,425) (961,715) (1,406,313)
Outstanding at 31 December 18,642,656 17,240,376 17,536,148
2011 2010 2009
Share award value informationFair value per share award during the year €22.91 €21.49 €13.02
Additional informationAt 31 December 2011, there were options outstanding to purchase 24,196,358 (2010: 32,928,940) ordinary shares in NV or PLC in respect of share-based compensation plans of NV and its subsidiaries and the North American plans, and 10,396,180 (2010: 12,217,128) ordinary shares in NV or PLC in respect of share-based compensation plans of PLC and its subsidiaries.
Unilever Annual Report and Accounts 2011
Financial statements

80
NOTES TO THE CONSOLIDATED FINANCIAL STATEMENTS UNILEVER GROUP continued
4C. Share-based compensation plans continued
To satisfy the options granted, certain NV group companies hold 33,219,526 (2010: 42,033,393) ordinary shares of NV or PLC, and trusts in Jersey and the United Kingdom hold 3,042,111 (2010: 4,838,277) PLC shares. The trustees of these trusts have agreed, until further notice, to waive dividends on these shares, save for the nominal sum of 0.01p per 31/9p ordinary share. Shares acquired during 2011 represent 0.27% of the Group’s called up capital. The balance of shares held in connection with share plans at 31 December 2011 represented 1.2% (2010: 1.5%) of the Group’s called up capital.
The book value of €799 million (2010: €937 million) of all shares held in respect of share-based compensation plans for both NV and PLC is eliminated on consolidation by deduction from other reserves. Their market value at 31 December 2011 was €954 million (2010: €1,083 million).
At 31 December 2011 there were no options for which the exercise price was above market price.
Shares held to satisfy options and related trusts are accounted for in accordance with IAS 32 ‘Financial Instruments: Presentation’ and SIC 12 ‘Consolidation of Special Purpose Entities’. All differences between the purchase price of the shares held to satisfy options granted and the proceeds received for the shares, whether on exercise or lapse, are charged to reserves. The basis of the charge to operating profit for the economic value of options granted is discussed on page 79.
Between 31 December 2011 and 28 February 2012, 5,789,685 shares were granted and 75,466 shares were forfeited related to the performance share plans.
5. Net finance costs
Net finance costs is the net of finance costs and finance income, including net finance costs in relation to pensions and similar obligations.
Finance income includes income on cash and cash equivalents and income on other financial assets. Finance costs include interest costs in relation to financial liabilities.
Borrowing costs which are not capitalised are recognised based on the effective interest method.
Net finance costs€ million
2011€ million
2010€ million
2009
Finance costs (540) (491) (504)
Bank loans and overdrafts (59) (38) (47)Bonds and other loans (472) (441) (429)Dividends paid on preference shares (5) (6) (7)Net gain/(loss) on derivatives for which hedge accounting is not applied(a) (4) (6) (21)
On foreign exchange derivatives (379) (601) (168)Exchange difference on underlying items 375 595 147
Finance income 92 77 75Pensions and similar obligations(b) 71 20 (164)
(377) (394) (593)(a) For further details of derivatives for which hedge accounting is not applied please refer to note 16D on page 98.(b) Net finance costs in respect of pensions and similar obligations are analysed in note 4B on page 76.
6. Taxation
6A. Income tax
Income tax on the profit for the year comprises current and deferred tax. Income tax is recognised in the income statement except to the extent that it relates to items recognised directly in equity.
Current tax is the expected tax payable on the taxable income for the year, using tax rates enacted or substantively enacted at the balance sheet date, and any adjustments to tax payable in respect of previous years.
Unilever Annual Report and Accounts 2011
Financial statements

81
6A. Income tax continued
Tax charge in income statement€ million
2011€ million
2010€ million
2009
Current taxCurrent year (1,571) (1,479) (1,263)Over/(under) provided in prior years(a) 93 88 151
(1,478) (1,391) (1,112)
Deferred taxOrigination and reversal of temporary differences (179) (237) (276)Changes in tax rates 1 (2) 3Recognition of previously unrecognised losses brought forward 34 96 128
(144) (143) (145)
(1,622) (1,534) (1,257)(a) Provisions have been released following the favourable settlement of prior year tax audits in a number of countries, none of which is individually material.
The reconciliation between the computed weighted average rate of income tax expense, which is generally applicable to Unilever companies, and the actual rate of taxation charged is as follows:
Reconciliation of effective tax rate%
2011%
2010%
2009
Computed rate of tax(b) 27 28 29Differences due to:
Incentive tax credits (5) (5) (6)Withholding tax on dividends 2 2 2Adjustments to previous years (1) (3) (3)Expenses not deductible for tax purposes 1 1 1Other 2 3 3
Effective tax rate 26 26 26(b) The computed tax rate used is the average of the standard rate of tax applicable in the countries in which Unilever operates, weighted by the amount of profit
before taxation generated in each of those countries. For this reason the rate may vary from year to year according to the mix of profit and related tax rates.
6B. Deferred tax
Deferred tax is recognised using the liability method on taxable temporary differences between the tax base and the accounting base of items included in the balance sheet of the Group. Certain temporary differences are not provided for as follows: • goodwill not deductible for tax purposes; • the initial recognition of assets or liabilities that affect neither accounting nor taxable profit; and • differences relating to investments in subsidiaries to the extent that they will probably not reverse in the foreseeable future. The amount of deferred tax provided is based on the expected manner of realisation or settlement of the carrying amount of assets and liabilities, using tax rates enacted, or substantively enacted, at the year end.
A deferred tax asset is recognised only to the extent that it is probable that future taxable profits will be available against which the asset can be utilised. Deferred tax assets are reduced to the extent that it is no longer probable that the related tax benefit will be realised.
Movements in 2011 and 2010
€ millionAs at
1 January2011
€ million
Incomestatement
€ million
Other(a)
€ millionAs at
31 December2011
€ millionAs at
1 January2010
€ million
Incomestatement
€ million
Other(a)
€ millionAs at
31 December2010
Pensions and similar obligations 440 (113) 421 748 592 (133) (19) 440Provisions 701 (45) 5 661 651 10 40 701Goodwill and intangible assets (1,122) 78 (677) (1,721) (944) (53) (125) (1,122)Accelerated tax depreciation (540) (60) (68) (668) (525) 12 (27) (540)Tax losses 117 (21) 4 100 82 27 8 117Fair value gains (25) (12) 17 (20) (24) – (1) (25)Fair value losses 13 2 16 31 2 – 11 13Share-based payments 120 (19) 17 118 146 (25) (1) 120Other 23 46 (22) 47 (6) 19 10 23
(273) (144) (287) (704) (26) (143) (104) (273)(a) Of the other movements in deferred tax of €287 million (2010: €104 million), €677 million (2010: €55 million) arose as a result of acquisitions and disposals.
Of this amount €623 million (2010: €58 million) was as a result of deferred tax arising on goodwill and intangibles assets. The remainder of other movements relates to either deferred tax on the components of other comprehensive income of (€453) million (2010: €48 million), or currency retranslation €63 million (2010: €1 million).
Unilever Annual Report and Accounts 2011
Financial statements

82
NOTES TO THE CONSOLIDATED FINANCIAL STATEMENTS UNILEVER GROUP continued
6B. Deferred tax continued
At the balance sheet date, the Group has unused tax losses of €1,568 million (2010: €1,515 million) and tax credits amounting to €39 million (2010: €78 million) available for offset against future taxable profits. Deferred tax assets have not been recognised in respect of unused tax losses of €1,191 million (2010: €1,109 million) and tax credits of €38 million (2010: €78 million), as it is not probable that there will be future taxable profits within the entities against which the losses can be utilised. The majority of these tax losses and credits arise in tax jurisdictions where they do not expire with the exception of €512 million (2010: €524 million) of state and federal tax losses in the US which expire between now and 2031.
Other deductible temporary differences of €58 million (2010: €83 million) have not been recognised as a deferred tax asset. There is no expiry date for these differences.
At the balance sheet date, the aggregate amount of temporary differences associated with undistributed earnings of subsidiaries for which deferred tax liabilities have not been recognised was €1,443 million (2010: €1,633 million). No liability has been recognised in respect of these differences because the Group is in a position to control the timing of the reversal of the temporary differences, and it is probable that such differences will not reverse in the foreseeable future.
Deferred income tax assets and liabilities are offset when there is a legally enforceable right to set off current tax assets against current tax liabilities and when the deferred income taxes relate to the same fiscal authority. The following amounts, determined after appropriate offsetting, are shown in the consolidated balance sheet:
Deferred tax assets and liabilities
€ millionAssets
2011
€ millionAssets
2010
€ millionLiabilities
2011
€ millionLiabilities
2010
€ millionTotal2011
€ millionTotal2010
Pensions and similar obligations 555 556 193 (116) 748 440Provisions 419 537 242 164 661 701Goodwill and intangible assets (612) (475) (1,109) (647) (1,721) (1,122)Accelerated tax depreciation (129) (238) (539) (302) (668) (540)Tax losses 69 71 31 46 100 117Fair value gains (1) (18) (19) (7) (20) (25)Fair value losses 27 1 4 12 31 13Share-based payments 63 120 55 – 118 120Other 30 53 17 (30) 47 23
421 607 (1,125) (880) (704) (273)Of which deferred tax to be recovered/(settled) after more than 12 months 163 296 (1,131) (957) (968) (661)
6C. Tax on other comprehensive income
Income tax is recognised in other comprehensive income for items recognised directly in equity.
Tax effects of the components of other comprehensive income were as follows:
€ million
Beforetax
2011
€ millionTax
charge/credit
2011
€ million
Aftertax
2011
€ million
Beforetax
2010
€ millionTax
charge/credit2010
€ million
Aftertax
2010
Fair value gains/(losses) on financial instruments (194) 26 (168) 41 2 43Actuarial gains/(losses) on pension schemes (1,691) 448 (1,243) 158 (53) 105Currency redistribution gains/(losses) (713) 10 (703) 460 – 460
Unilever Annual Report and Accounts 2011
Financial statements

83
7. Combined earnings per share
The calculations of combined earnings per share are based on the net profit attributable to ordinary capital divided by the average number of share units representing the combined ordinary share capital of NV and PLC in issue during the year, after deducting shares held as treasury stock.
The calculations of diluted earnings per share are based on: (i) conversion into PLC ordinary shares of those shares in a group company which are convertible in the year 2038, as described in Corporate governance on page 41; and (ii) the effect of share-based compensation plans, details of which are set out in note 4C on pages 79 to 80.
Combined earnings per share€
2011€
2010€
2009
Basic earnings per share 1.51 1.51 1.21Diluted earnings per share 1.46 1.46 1.17
Millions of share units
Calculation of average number of share units 2011 2010 2009
Average number of shares: NV 1,714.7 1,714.7 1,714.7PLC 1,310.2 1,310.2 1,310.2
Less shares held by employee share trusts and companies (209.0) (212.6) (228.6)
Combined average number of share units 2,815.9 2,812.3 2,796.3Add shares issuable in 2038 70.9 70.9 70.9Add dilutive effect of share-based compensation plans 21.3 21.9 22.8
Diluted combined average number of share units 2,908.1 2,905.1 2,890.0
Calculation of earnings€ million
2011€ million
2010€ million
2009
Net profit 4,623 4,598 3,659Non-controlling interests (371) (354) (289)
Net profit attributable to ordinary capital 4,252 4,244 3,370
8. Dividends on ordinary capital
Dividends are recognised on the date that the shareholder’s right to receive payment is established. This is generally the date when the dividend is declared.
Dividends on ordinary capital during the year€ million
2011€ million
2010€ million
2009
NV dividends (1,368) (1,270) (1,203)PLC dividends (1,119) (1,039) (912)
(2,487) (2,309) (2,115)
Four quarterly interim dividends were declared and paid during 2011. Dividends declared totalled €0.90 (2010: €0.83) per NV ordinary share and £0.78 (2010: £0.71) per PLC ordinary share. Dividends paid totalled €0.88 (2010: €0.82) per NV ordinary share and £0.77 (2010: £0.71) per PLC ordinary share.
Quarterly dividends of €0.225 per NV ordinary share and £0.1879 per PLC ordinary share were declared on 1 February 2012, to be payable in March 2012. See note 25 ‘Events after the balance sheet date’ on page 108.
Unilever Annual Report and Accounts 2011
Financial statements
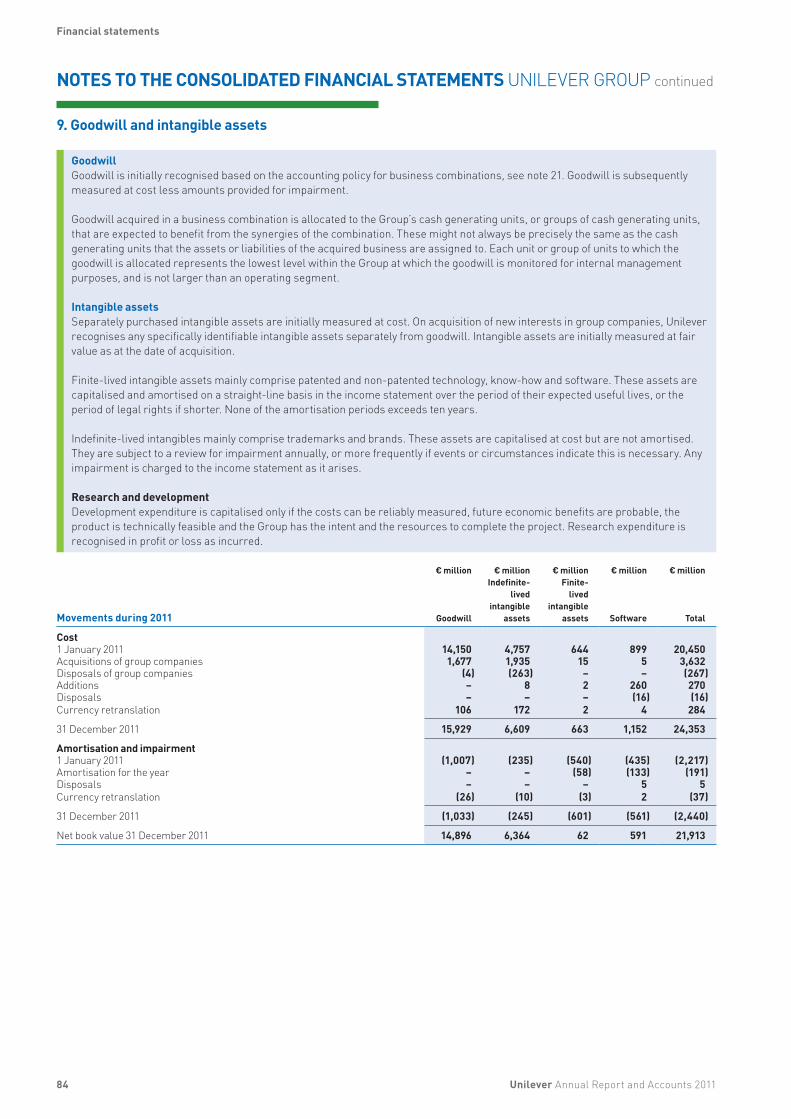
84
NOTES TO THE CONSOLIDATED FINANCIAL STATEMENTS UNILEVER GROUP continued
9. Goodwill and intangible assets
GoodwillGoodwill is initially recognised based on the accounting policy for business combinations, see note 21. Goodwill is subsequently measured at cost less amounts provided for impairment.
Goodwill acquired in a business combination is allocated to the Group’s cash generating units, or groups of cash generating units, that are expected to benefit from the synergies of the combination. These might not always be precisely the same as the cash generating units that the assets or liabilities of the acquired business are assigned to. Each unit or group of units to which the goodwill is allocated represents the lowest level within the Group at which the goodwill is monitored for internal management purposes, and is not larger than an operating segment.
Intangible assetsSeparately purchased intangible assets are initially measured at cost. On acquisition of new interests in group companies, Unilever recognises any specifically identifiable intangible assets separately from goodwill. Intangible assets are initially measured at fair value as at the date of acquisition.
Finite-lived intangible assets mainly comprise patented and non-patented technology, know-how and software. These assets are capitalised and amortised on a straight-line basis in the income statement over the period of their expected useful lives, or the period of legal rights if shorter. None of the amortisation periods exceeds ten years.
Indefinite-lived intangibles mainly comprise trademarks and brands. These assets are capitalised at cost but are not amortised. They are subject to a review for impairment annually, or more frequently if events or circumstances indicate this is necessary. Any impairment is charged to the income statement as it arises.
Research and developmentDevelopment expenditure is capitalised only if the costs can be reliably measured, future economic benefits are probable, the product is technically feasible and the Group has the intent and the resources to complete the project. Research expenditure is recognised in profit or loss as incurred.
Movements during 2011
€ million
Goodwill
€ millionIndefinite-
livedintangible
assets
€ millionFinite-
livedintangible
assets
€ million
Software
€ million
Total
Cost1 January 2011 14,150 4,757 644 899 20,450Acquisitions of group companies 1,677 1,935 15 5 3,632Disposals of group companies (4) (263) – – (267)Additions – 8 2 260 270Disposals – – – (16) (16)Currency retranslation 106 172 2 4 284
31 December 2011 15,929 6,609 663 1,152 24,353
Amortisation and impairment1 January 2011 (1,007) (235) (540) (435) (2,217)Amortisation for the year – – (58) (133) (191)Disposals – – – 5 5Currency retranslation (26) (10) (3) 2 (37)
31 December 2011 (1,033) (245) (601) (561) (2,440)
Net book value 31 December 2011 14,896 6,364 62 591 21,913
Unilever Annual Report and Accounts 2011
Financial statements

85
9. Goodwill and intangible assets continued
Movements during 2010
€ million
Goodwill
€ millionIndefinite-
livedintangible
assets
€ millionFinite-
livedintangible
assets
€ million
Software
€ million
Total
Cost1 January 2010 13,408 4,269 611 687 18,975Acquisitions of group companies 225 246 1 – 472Disposals of group companies (222) (1) – – (223)Reclassed to held for disposal (82) – – – (82)Additions – 1 1 180 182Disposals (1) (8) – (16) (25)Currency retranslation 822 250 31 48 1,151
31 December 2010 14,150 4,757 644 899 20,450
Amortisation and impairment1 January 2010 (944) (219) (458) (307) (1,928)Disposal of group companies – – – – –Amortisation for the year – – (58) (116) (174)Disposals – – – 6 6Currency retranslation (63) (16) (24) (18) (121)
31 December 2010 (1,007) (235) (540) (435) (2,217)
Net book value 31 December 2010 13,143 4,522 104 464 18,233
There are no significant carrying amounts of goodwill and intangible assets that are allocated across multiple cash generating units (CGUs).
Impairment charges in the yearThere were no material impairments in 2011, 2010 or 2009.
Significant CGUsThe goodwill and indefinite-lived intangible assets held in the regional Foods CGUs are considered significant in comparison to the total carrying amounts of goodwill and indefinite-lived intangible assets at 31 December 2011. No other CGUs are considered significant in this respect.
The goodwill and indefinite-lived intangible assets held in the regional Foods CGUs are:
€ billion2011
Goodwill
€ billion2011
Indefinite- lived
intangibles
€ billion2010
Goodwill
€ billion2010
Indefinite-lived
intangibles
Western Europe 5.2 1.4 5.2 1.4The Americas 4.1 1.5 4.2 1.5Asia Africa CEE 2.0 0.6 1.8 0.6
During 2011, the Group conducted an impairment review of the carrying value of these assets. Value in use has been calculated as the present value of projected future cash flows. A pre-tax discount rate of 7.4% was used.
For the regional Foods CGUs, the following key assumptions were used in the discounted cash flow projections:
Western Europe Americas
Asia Africa CEE
Longer-term sustainable growth rates 0.2% 1.4% 3.0%Average near-term nominal growth rates 0.8% 2.9% 7.9%Average operating margins 19-22% 18-20% 12-14%
The growth rates and margins used to estimate future performance are based on past performance and our experience of growth rates and margins achievable in our key markets.
The projections covered a period of five years, as we believe this to be the most appropriate timescale over which to review and consider annual performances before applying a fixed terminal value multiple to the final year cash flows.
The growth rates used are consistent with our annual planning and strategic planning processes.
We have performed sensitivity analyses around the base assumptions and have concluded that no reasonable possible changes in key assumptions would cause the recoverable amount of the regional Foods CGUs to be less than the carrying value.
Unilever Annual Report and Accounts 2011
Financial statements
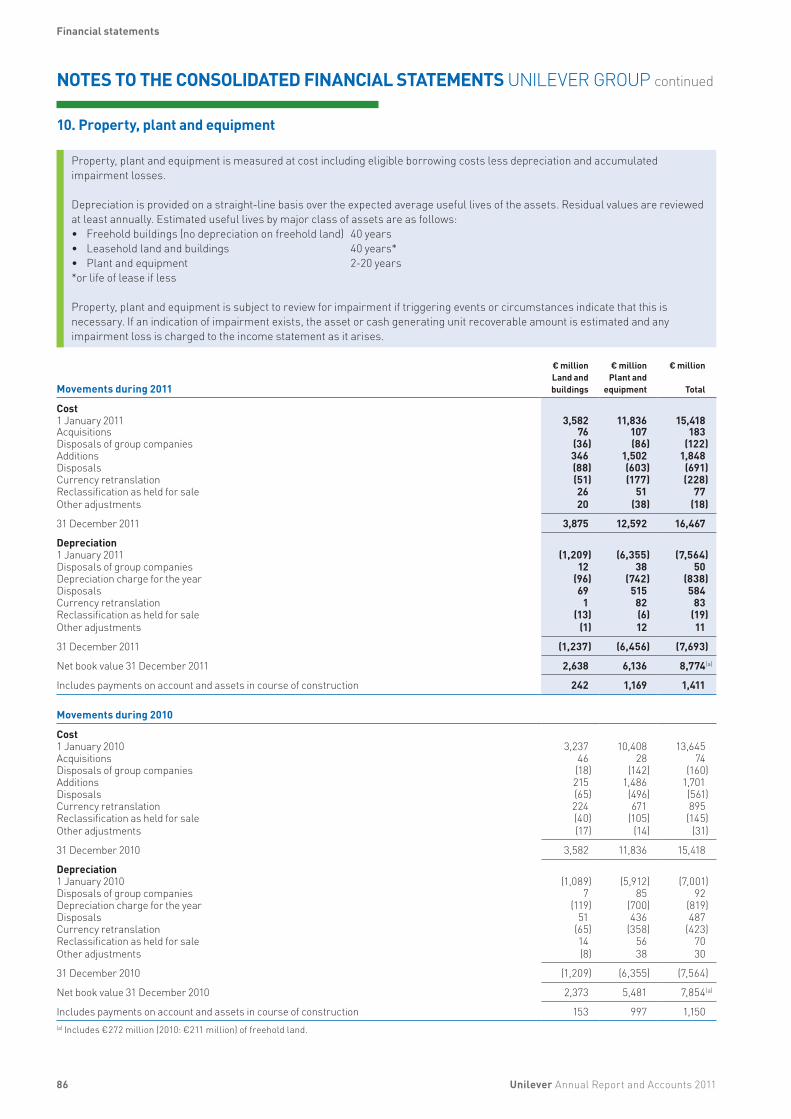
86
NOTES TO THE CONSOLIDATED FINANCIAL STATEMENTS UNILEVER GROUP continued
10. Property, plant and equipment
Property, plant and equipment is measured at cost including eligible borrowing costs less depreciation and accumulated impairment losses.
Depreciation is provided on a straight-line basis over the expected average useful lives of the assets. Residual values are reviewed at least annually. Estimated useful lives by major class of assets are as follows:• Freehold buildings (no depreciation on freehold land) 40 years
Leasehold land and buildings 40 years* Plant and equipment 2-20 yearsor life of lease if less
••*
Property, plant and equipment is subject to review for impairment if triggering events or circumstances indicate that this is necessary. If an indication of impairment exists, the asset or cash generating unit recoverable amount is estimated and any impairment loss is charged to the income statement as it arises.
Movements during 2011
€ millionLand andbuildings
€ millionPlant and
equipment
€ million
Total
Cost1 January 2011 3,582 11,836 15,418Acquisitions 76 107 183Disposals of group companies (36) (86) (122)Additions 346 1,502 1,848Disposals (88) (603) (691)Currency retranslation (51) (177) (228)Reclassification as held for sale 26 51 77Other adjustments 20 (38) (18)
31 December 2011 3,875 12,592 16,467
Depreciation1 January 2011 (1,209) (6,355) (7,564)Disposals of group companies 12 38 50Depreciation charge for the year (96) (742) (838)Disposals 69 515 584Currency retranslation 1 82 83Reclassification as held for sale (13) (6) (19)Other adjustments (1) 12 11
31 December 2011 (1,237) (6,456) (7,693)
Net book value 31 December 2011 2,638 6,136 8,774(a)
Includes payments on account and assets in course of construction 242 1,169 1,411
Movements during 2010
Cost1 January 2010 3,237 10,408 13,645Acquisitions 46 28 74Disposals of group companies (18) (142) (160)Additions 215 1,486 1,701Disposals (65) (496) (561)Currency retranslation 224 671 895Reclassification as held for sale (40) (105) (145)Other adjustments (17) (14) (31)
31 December 2010 3,582 11,836 15,418
Depreciation 1 January 2010 (1,089) (5,912) (7,001)Disposals of group companies 7 85 92Depreciation charge for the year (119) (700) (819)Disposals 51 436 487Currency retranslation (65) (358) (423)Reclassification as held for sale 14 56 70Other adjustments (8) 38 30
31 December 2010 (1,209) (6,355) (7,564)
Net book value 31 December 2010 2,373 5,481 7,854(a)
Includes payments on account and assets in course of construction 153 997 1,150(a) Includes €272 million (2010: €211 million) of freehold land.
Unilever Annual Report and Accounts 2011
Financial statements
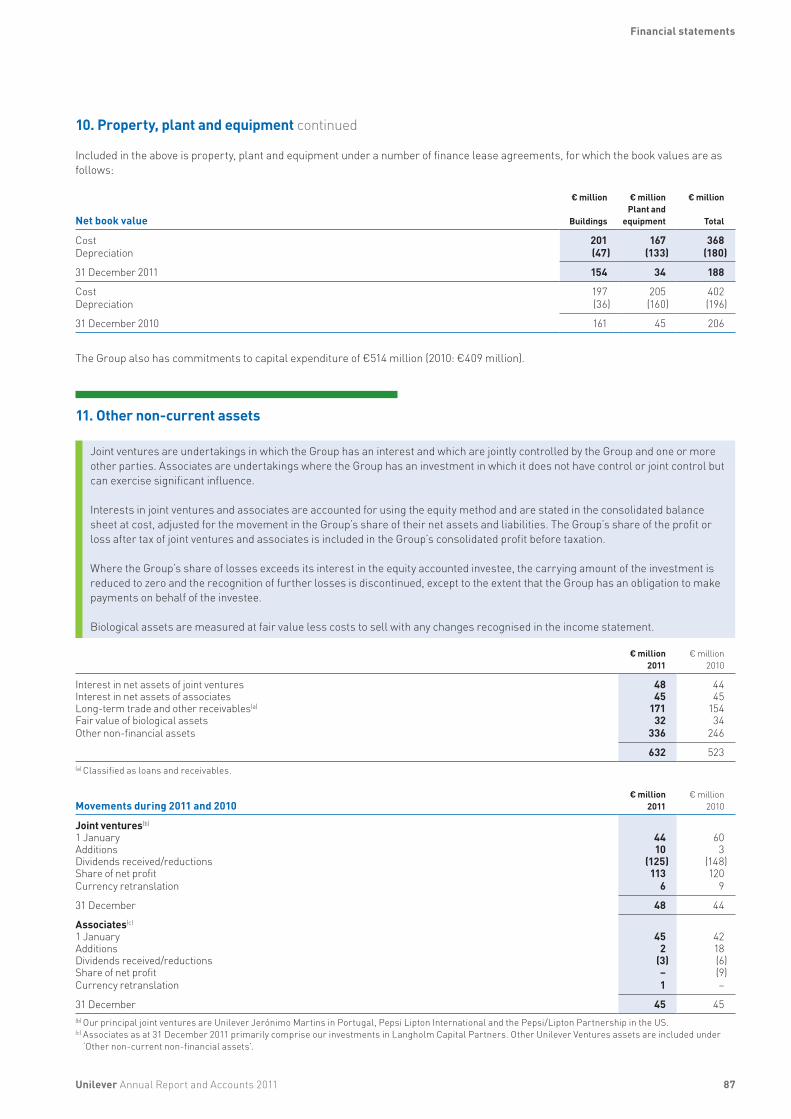
87
10. Property, plant and equipment continued
Included in the above is property, plant and equipment under a number of finance lease agreements, for which the book values are as follows:
Net book value
€ million
Buildings
€ millionPlant and
equipment
€ million
Total
Cost 201 167 368Depreciation (47) (133) (180)
31 December 2011 154 34 188
Cost 197 205 402Depreciation (36) (160) (196)
31 December 2010 161 45 206
The Group also has commitments to capital expenditure of €514 million (2010: €409 million).
11. Other non-current assets
Joint ventures are undertakings in which the Group has an interest and which are jointly controlled by the Group and one or more other parties. Associates are undertakings where the Group has an investment in which it does not have control or joint control but can exercise significant influence.
Interests in joint ventures and associates are accounted for using the equity method and are stated in the consolidated balance sheet at cost, adjusted for the movement in the Group’s share of their net assets and liabilities. The Group’s share of the profit or loss after tax of joint ventures and associates is included in the Group’s consolidated profit before taxation.
Where the Group’s share of losses exceeds its interest in the equity accounted investee, the carrying amount of the investment is reduced to zero and the recognition of further losses is discontinued, except to the extent that the Group has an obligation to make payments on behalf of the investee.
Biological assets are measured at fair value less costs to sell with any changes recognised in the income statement.
€ million2011
€ million2010
Interest in net assets of joint ventures 48 44Interest in net assets of associates 45 45Long-term trade and other receivables(a) 171 154Fair value of biological assets 32 34Other non-financial assets 336 246
632 523(a) Classified as loans and receivables.
Movements during 2011 and 2010€ million
2011€ million
2010
Joint ventures(b)
1 January 44 60Additions 10 3Dividends received/reductions (125) (148)Share of net profit 113 120Currency retranslation 6 9
31 December 48 44
Associates(c)
1 January 45 42Additions 2 18Dividends received/reductions (3) (6)Share of net profit – (9)Currency retranslation 1 –
31 December 45 45(b) Our principal joint ventures are Unilever Jerónimo Martins in Portugal, Pepsi Lipton International and the Pepsi/Lipton Partnership in the US.(c) Associates as at 31 December 2011 primarily comprise our investments in Langholm Capital Partners. Other Unilever Ventures assets are included under
‘Other non-current non-financial assets’.
Unilever Annual Report and Accounts 2011
Financial statements

88
NOTES TO THE CONSOLIDATED FINANCIAL STATEMENTS UNILEVER GROUP continued
11. Other non-current assets continued
The joint ventures and associates have no significant contingent liabilities to which the Group is exposed, and the Group has no significant contingent liabilities in relation to its interest in the joint ventures and associates.
The Group has no outstanding capital commitments to joint ventures.
Outstanding balances with joint ventures and associates are shown in note 23 on page 107.
12. Inventories
Inventories are valued at the lower of weighted average cost and net realisable value. Cost comprises direct costs and, where appropriate, a proportion of attributable production overheads. Net realisable value is the estimated selling price less the estimated costs necessary to make the sale.
Inventories€ million
2011€ million
2010
Raw materials and consumables 1,584 1,554Finished goods and goods for resale 3,017 2,753
4,601 4,307
Inventories with a value of €158 million (2010: €132 million) are carried at net realisable value, this being lower than cost. During 2011, €99 million (2010: €135 million) was charged to the income statement for damaged, obsolete and lost inventories. In 2011, €43 million (2010: €42 million) was utilised or released to the income statement from inventory provisions taken in earlier years.
In 2011, inventories with a carrying amount of €4 million (2010: €3 million) were pledged as security for certain of the Group’s borrowings.
13. Trade and other current receivables
Trade and other receivables are initially recognised at fair value plus any directly attributable transaction costs. Subsequently these assets are held at amortised cost, using the effective interest method and net of any impairment losses.
We do not consider the fair values of trade and other receivables to be significantly different from their carrying values. Credit terms for customers are determined in individual territories. Concentrations of credit risk with respect to trade receivables are limited, due to the Group’s customer base being large and diverse. Our historical experience of collecting receivables, supported by the level of default, is that credit risk is low across territories and so trade receivables are considered to be a single class of financial assets. Balances are considered for impairment on an individual basis rather than by reference to the extent that they become overdue.
Trade and other current receivables€ million
2011€ million
2010
Due within one yearTrade receivables 2,897 2,541Prepayments and accrued income 591 629Other receivables 1,025 972
4,513 4,142
Other receivables comprise loans and receivables of €327 million (2010: €286 million) and other non-financial assets of €698 million (2010: €686 million).
Unilever Annual Report and Accounts 2011
Financial statements
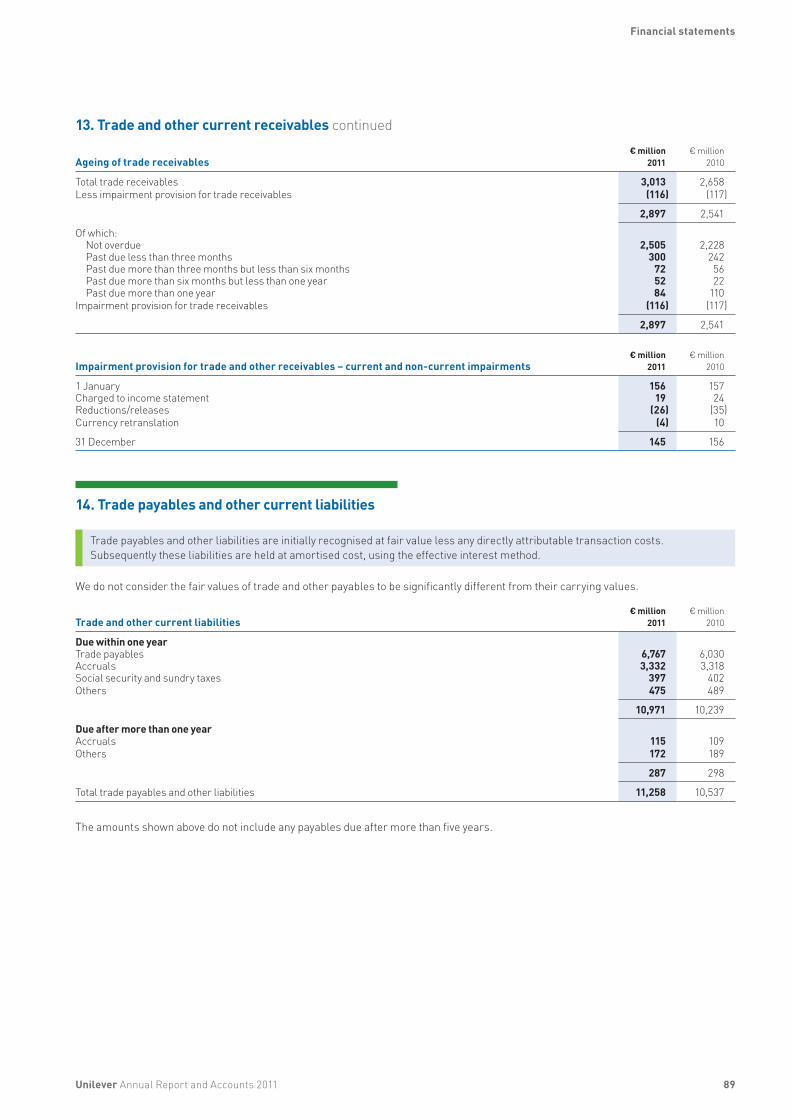
89
13. Trade and other current receivables continued
Ageing of trade receivables € million
2011€ million
2010
Total trade receivables 3,013 2,658Less impairment provision for trade receivables (116) (117)
2,897 2,541
Of which:Not overdue 2,505 2,228Past due less than three months 300 242Past due more than three months but less than six months 72 56Past due more than six months but less than one year 52 22Past due more than one year 84 110
Impairment provision for trade receivables (116) (117)
2,897 2,541
Impairment provision for trade and other receivables – current and non-current impairments€ million
2011€ million
2010
1 January 156 157Charged to income statement 19 24Reductions/releases (26) (35)Currency retranslation (4) 10
31 December 145 156
14. Trade payables and other current liabilities
Trade payables and other liabilities are initially recognised at fair value less any directly attributable transaction costs. Subsequently these liabilities are held at amortised cost, using the effective interest method.
We do not consider the fair values of trade and other payables to be significantly different from their carrying values.
Trade and other current liabilities€ million
2011€ million
2010
Due within one yearTrade payables 6,767 6,030Accruals 3,332 3,318Social security and sundry taxes 397 402Others 475 489
10,971 10,239
Due after more than one yearAccruals 115 109Others 172 189
287 298
Total trade payables and other liabilities 11,258 10,537
The amounts shown above do not include any payables due after more than five years.
Unilever Annual Report and Accounts 2011
Financial statements

90
NOTES TO THE CONSOLIDATED FINANCIAL STATEMENTS UNILEVER GROUP continued
15. Financial assets and liabilities
15A. Financial assets
Cash and cash equivalentsCash and cash equivalents in the balance sheet include deposits, investments in money market funds and highly liquid investments. To be classified as cash and cash equivalents, an asset must:• be readily convertible into cash; and • have an insignificant risk of changes in value; and• have a maturity period of three months or less at acquisition.Cash and cash equivalents in the cash flow statement also includes bank overdrafts.
Other financial assetsOther financial assets are first recognised on the trade date. At that point they are classified as: (i) Loans and receivables;(ii) Available-for-sale financial assets; or(iii) Financial assets at fair value through profit or loss.
(i) Loans and receivablesThese are assets with an established payment profile and which are not listed on a recognised stock exchange. They are initially recognised at fair value, which is usually the original invoice amount plus any directly related transaction costs. Afterwards loans and receivables are carried at amortised cost, less any impairment.
(ii) Available-for-sale financial assetsAny financial assets not classified as either loans and receivables or financial assets at fair value through profit or loss are designated as available-for-sale. They are initially recognised at fair value, usually the original invoice amount plus any directly related transaction costs. Afterwards they are measured at fair value with changes being recognised in equity. When the investment is sold or impaired, the accumulated gains and losses are moved from equity to the income statement. Interest and dividends from these assets are recognised in the income statement.
(iii) Financial assets at fair value through profit or lossThese are derivatives and assets that are held for trading. Related transaction costs are expensed as incurred. Unless they form part of a hedging relationship (see note 16C on pages 97 to 98), these assets are held at fair value, with changes being recognised in the income statement.
Impairment of financial assetsEach year the Group assesses whether there is evidence that financial assets are impaired. A significant or prolonged fall in value below the cost of an asset generally indicates that an asset may be impaired. If impaired, financial assets are written down to their estimated recoverable amount. Impairment losses on assets classified as loans and receivables are recognised in profit and loss. When a later event causes the impairment losses to decrease, the reduction in impairment loss is also recognised in profit and loss. Impairment losses on assets classified as available-for-sale are recognised by moving the loss accumulated in equity to the income statement. Any subsequent recovery in value of an available-for-sale debt security is recognised within profit and loss. However, any subsequent recovery in value of an equity security is recognised within equity.
Unilever Annual Report and Accounts 2011
Financial statements
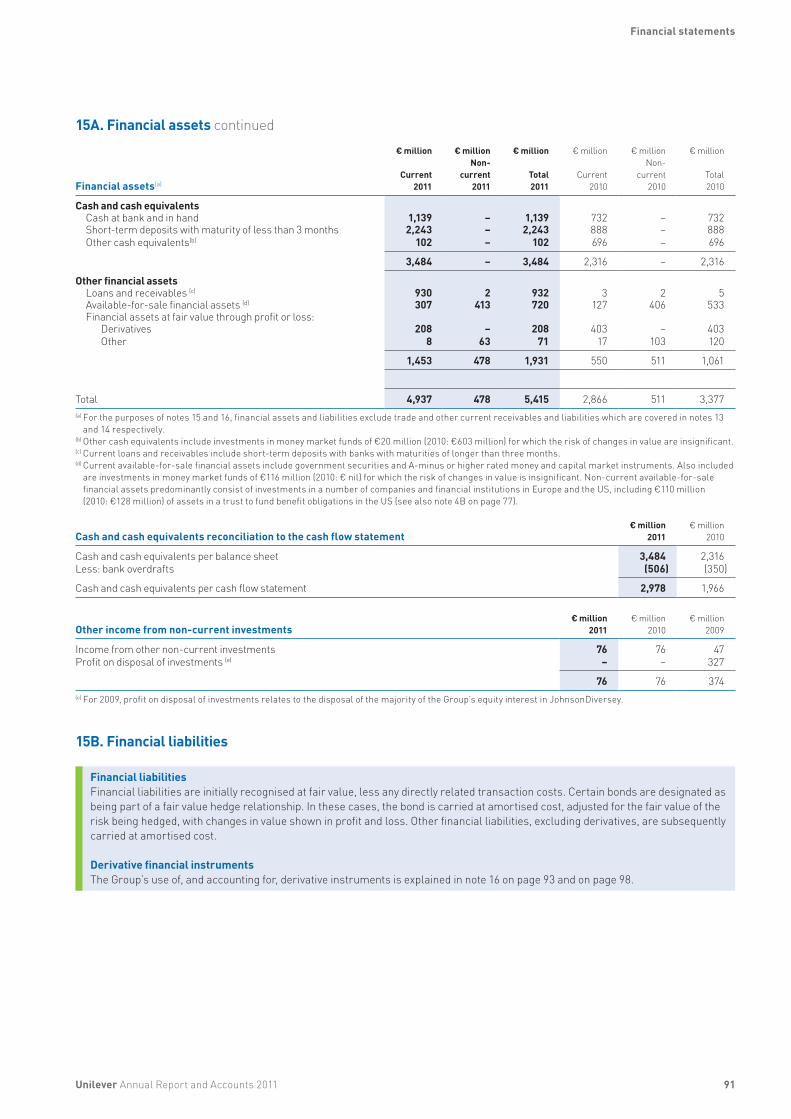
91
15A. Financial assets continued
Financial assets(a)
€ million
Current2011
€ million Non-
current2011
€ million
Total 2011
€ million
Current 2010
€ million Non-
current 2010
€ million
Total 2010
Cash and cash equivalentsCash at bank and in hand 1,139 – 1,139 732 – 732Short-term deposits with maturity of less than 3 months 2,243 – 2,243 888 – 888Other cash equivalents(b) 102 – 102 696 – 696
3,484 – 3,484 2,316 – 2,316
Other financial assetsLoans and receivables (c) 930 2 932 3 2 5Available-for-sale financial assets (d) 307 413 720 127 406 533Financial assets at fair value through profit or loss:
Derivatives 208 – 208 403 – 403Other 8 63 71 17 103 120
1,453 478 1,931 550 511 1,061
Total 4,937 478 5,415 2,866 511 3,377(a) For the purposes of notes 15 and 16, financial assets and liabilities exclude trade and other current receivables and liabilities which are covered in notes 13
and 14 respectively.(b) Other cash equivalents include investments in money market funds of €20 million (2010: €603 million) for which the risk of changes in value are insignificant.(c) Current loans and receivables include short-term deposits with banks with maturities of longer than three months.(d) Current available-for-sale financial assets include government securities and A-minus or higher rated money and capital market instruments. Also included
are investments in money market funds of €116 million (2010: € nil) for which the risk of changes in value is insignificant. Non-current available-for-sale financial assets predominantly consist of investments in a number of companies and financial institutions in Europe and the US, including €110 million (2010: €128 million) of assets in a trust to fund benefit obligations in the US (see also note 4B on page 77).
Cash and cash equivalents reconciliation to the cash flow statement€ million
2011€ million
2010
Cash and cash equivalents per balance sheet 3,484 2,316 Less: bank overdrafts (506) (350)
Cash and cash equivalents per cash flow statement 2,978 1,966
Other income from non-current investments€ million
2011€ million
2010€ million
2009
Income from other non-current investments 76 76 47Profit on disposal of investments (e) – – 327
76 76 374(e) For 2009, profit on disposal of investments relates to the disposal of the majority of the Group’s equity interest in JohnsonDiversey.
15B. Financial liabilities
Financial liabilitiesFinancial liabilities are initially recognised at fair value, less any directly related transaction costs. Certain bonds are designated as being part of a fair value hedge relationship. In these cases, the bond is carried at amortised cost, adjusted for the fair value of the risk being hedged, with changes in value shown in profit and loss. Other financial liabilities, excluding derivatives, are subsequently carried at amortised cost.
Derivative financial instrumentsThe Group’s use of, and accounting for, derivative instruments is explained in note 16 on page 93 and on page 98.
Unilever Annual Report and Accounts 2011
Financial statements
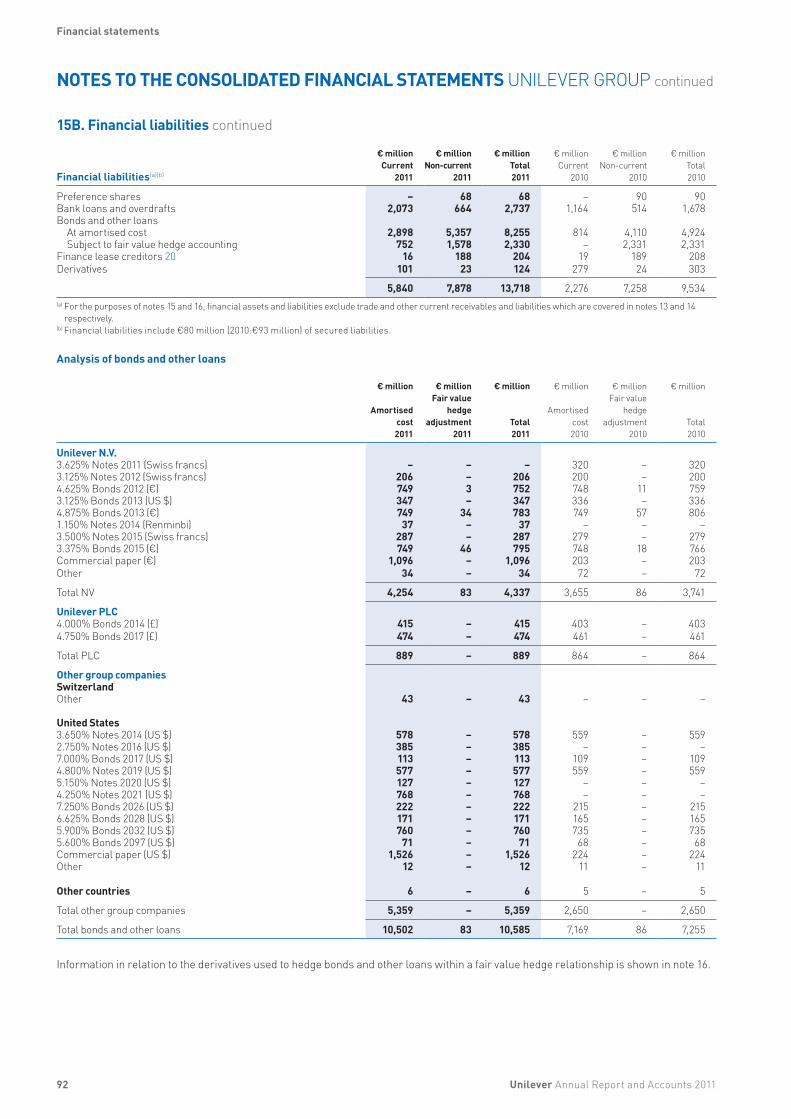
92
NOTES TO THE CONSOLIDATED FINANCIAL STATEMENTS UNILEVER GROUP continued
15B. Financial liabilities continued
Financial liabilities(a)(b)
€ million Current
2011
€ million Non-current
2011
€ million Total 2011
€ million Current
2010
€ million Non-current
2010
€ million Total 2010
Preference shares – 68 68 – 90 90Bank loans and overdrafts 2,073 664 2,737 1,164 514 1,678Bonds and other loans
At amortised cost 2,898 5,357 8,255 814 4,110 4,924Subject to fair value hedge accounting 752 1,578 2,330 – 2,331 2,331
Finance lease creditors 20 16 188 204 19 189 208Derivatives 101 23 124 279 24 303
5,840 7,878 13,718 2,276 7,258 9,534(a) For the purposes of notes 15 and 16, financial assets and liabilities exclude trade and other current receivables and liabilities which are covered in notes 13 and 14
respectively.(b) Financial liabilities include €80 million (2010:€93 million) of secured liabilities.
Analysis of bonds and other loans
€ million
Amortisedcost2011
€ millionFair value
hedge adjustment
2011
€ million
Total2011
€ million
Amortisedcost2010
€ millionFair value
hedge adjustment
2010
€ million
Total2010
Unilever N.V.3.625% Notes 2011 (Swiss francs) – – – 320 – 3203.125% Notes 2012 (Swiss francs) 206 – 206 200 – 2004.625% Bonds 2012 (€) 749 3 752 748 11 7593.125% Bonds 2013 (US $) 347 – 347 336 – 3364.875% Bonds 2013 (€) 749 34 783 749 57 8061.150% Notes 2014 (Renminbi) 37 – 37 – – –3.500% Notes 2015 (Swiss francs) 287 – 287 279 – 2793.375% Bonds 2015 (€) 749 46 795 748 18 766Commercial paper (€) 1,096 – 1,096 203 – 203Other 34 – 34 72 – 72
Total NV 4,254 83 4,337 3,655 86 3,741
Unilever PLC4.000% Bonds 2014 (£) 415 – 415 403 – 4034.750% Bonds 2017 (£) 474 – 474 461 – 461
Total PLC 889 – 889 864 – 864
Other group companiesSwitzerlandOther 43 – 43 – – –
United States3.650% Notes 2014 (US $) 578 – 578 559 – 5592.750% Notes 2016 (US $) 385 – 385 – – –7.000% Bonds 2017 (US $) 113 – 113 109 – 1094.800% Notes 2019 (US $) 577 – 577 559 – 5595.150% Notes 2020 (US $) 127 – 127 – – –4.250% Notes 2021 (US $) 768 – 768 – – –7.250% Bonds 2026 (US $) 222 – 222 215 – 2156.625% Bonds 2028 (US $) 171 – 171 165 – 1655.900% Bonds 2032 (US $) 760 – 760 735 – 7355.600% Bonds 2097 (US $) 71 – 71 68 – 68Commercial paper (US $) 1,526 – 1,526 224 – 224Other 12 – 12 11 – 11
Other countries 6 – 6 5 – 5
Total other group companies 5,359 – 5,359 2,650 – 2,650
Total bonds and other loans 10,502 83 10,585 7,169 86 7,255
Information in relation to the derivatives used to hedge bonds and other loans within a fair value hedge relationship is shown in note 16.
Unilever Annual Report and Accounts 2011
Financial statements
93
16. Capital and treasury risk management
Derivatives and hedge accountingDerivatives are measured at fair value with any related transaction costs expensed as incurred. The treatment of changes in the value of derivatives depends on their use as explained below.
(i) Fair value hedgesCertain derivatives are held to hedge the risk of changes in value of a specific bond or other loan. In these situations, the Group designates the liability and related derivative to be part of a fair value hedge relationship. The carrying value of the bond is adjusted by the fair value of the risk being hedged, with changes going to the income statement. Gains and losses on the corresponding derivative are also recognised in the income statement. The amounts recognised offset in the income statement. When the relationship no longer meets the criteria for hedge accounting, the fair value hedge adjustment made to the bond is amortised to the income statement using the effective interest method.
(ii) Cash flow hedgesDerivatives are also held to hedge the uncertainty in timing or amount of future forecast cash flows. Such derivatives are classified as being part of cash flow hedge relationships. For an effective hedge, gains and losses from changes in the fair value of derivatives are recognised in equity. Any ineffective elements of the hedge are recognised in the income statement. If the hedged cash flow relates to a non-financial asset, the amount accumulated in equity is subsequently included within the carrying value of that asset. For other cash flow hedges, amounts deferred in equity are taken to the income statement at the same time as the related cash flow.
When a derivative no longer qualifies for hedge accounting, any cumulative gain or loss remains in equity until the related cash flow occurs. When the cash flow takes place, the cumulative gain or loss is taken to the income statement. If the hedged cash flow is no longer expected to occur, the cumulative gain or loss is taken to the income statement immediately.
(iii) Net investment hedgesCertain derivatives are designated as hedges of the currency risk on the Group’s investment in foreign subsidiaries. The accounting policy for these arrangements is set out in note 1.
(iv) Derivatives for which hedge accounting is not appliedDerivatives not classified as hedges are held in order to hedge certain balance sheet items and commodity exposures. No hedge accounting is applied to these derivatives, which are carried at fair value with changes being recognised in the income statement.
16A. Capital management
Unilever considers the following components of its balance sheet to be capital: short-term debt, long-term debt (bank loans, overdrafts, bonds and other loans) and equity (mainly common and preferred stock).
Finance and liquidityThe Group’s financial strategy provides the financial flexibility to meet strategic and day-to-day needs. Our current long-term credit rating is A+/A1 and our current short-term credit rating is A1/P1. We aim to maintain a competitive balance sheet which we consider to be the equivalent of a credit rating of A+/A1 in the long term. This provides us with:• appropriate access to equity and debt markets;• sufficient flexibility for acquisitions;• sufficient resilience against economic and financial uncertainty ensuring ample liquidity; and• optimal weighted average cost of capital, given the constraints above.
Unilever monitors the qualitative and quantitative factors utilised by the rating agencies. This information is publicly available and is updated by the credit rating agencies on a regular basis.
The capital structure of Unilever is based on management’s judgement of the appropriate balancing of all key elements of its financial strategy in order to meet its strategic and day-to-day needs. We consider the amount of capital in proportion to risk and manage the capital structure and make adjustments to it in the light of changes in economic conditions and the risk characteristics of the underlying assets. Unilever will take appropriate steps in order to maintain, or if necessary adjust, the capital structure.
Unilever is not subject to covenants in any of its significant financing agreements.
Unilever Annual Report and Accounts 2011
Financial statements
94
NOTES TO THE CONSOLIDATED FINANCIAL STATEMENTS UNILEVER GROUP continued
16B. Treasury risk management
The Group has an established system of control in place covering all derivative financial instruments. This system includes guidelines, exposure limits, authority schedules and independent reporting. The controls are subject to periodic review by internal audit. The use of leveraged instruments is not permitted.
The Group is exposed to the following risks that arise from its use of financial instruments, the management of which is described in the following sections:a) market risk;b) liquidity risk; andc) credit risk.
a) Market riskMarket risk arises from fluctuations in market factors, including exchange rates, interest rates and commodity prices. Movements in these factors may affect the Group’s income and expenses, or the value of its financial instruments. The objective of the Group’s management of market risk is to maintain this risk within acceptable parameters, whilst optimising returns. Generally, the Group applies hedge accounting to manage the volatility in profit and loss arising from market risk.
(i) Currency riskCurrency risk on sales, purchases and borrowings Because of Unilever’s global reach, it is subject to the risk that changes in foreign currency values will impact the Group’s sales, purchases and borrowings. The Group manages currency exposures within prescribed limits, mainly through forward foreign currency exchange contracts. Operating companies actively manage foreign exchange exposures within prescribed limits, and regional groups monitor local compliance.
As shown in note 15B, the Group holds debt in a number of currencies. Exchange risks related to the principal amounts of the US$ and Swiss franc denominated debt either form part of hedging relationships themselves, or are hedged through forward contracts.
The aim of the Group’s approach to the management of currency risk is to leave the Group with no material residual risk. This aim has been achieved in all years presented.
At 31 December 2011, the unhedged exposure to the Group from companies holding assets and liabilities other than in their functional currency amounted to €56 million (2010: €52 million). A 10% strengthening of the euro against key currencies to which the Group is exposed would lead to approximately an additional €6 million credit in the income statement (2010: €5 million credit). A 10% weakening of the euro against these currencies would lead to an equal but opposite effect.
Currency risk on the Group’s investmentsThe Group is also subject to the exchange risk in relation to the translation of the net assets of its foreign operations into euros.
Unilever aims to minimise this foreign exchange exposure by borrowing in local currency wherever possible. In some locations however, the Group’s ability to do this is inhibited by local regulations, lack of local liquidity or by local market conditions. Where the residual risk from these countries exceeds prescribed limits, Unilever may decide on a case-by-case basis to actively hedge the exposure. This is done either through additional borrowings in the related currency, or through the use of forward foreign exchange contracts. Where local currency borrowings, or forward contracts, are used to hedge the currency risk in relation to the Group’s net investment in foreign subsidiaries, these relationships are designated as net investment hedges for accounting purposes.
At 31 December 2011 the nominal value of the Group’s designated net investment hedges amounted to €4.1 billion (2010: €4.4 billion), mainly consisting of US $/€ contracts. A 10% strengthening of the euro against all other key currencies would lead to an additional €377 million debit being recognised in equity (2010: €395 million debit). A 10% weakening of the euro against these currencies would have the equal but opposite effect. There would be no impact on the income statement under either of these scenarios.
(ii) Interest rate riskUnilever’s interest rate management approach aims for an optimal balance between fixed and floating rate interest rate exposures on expected net debt. The objective of this approach is to minimise annual interest costs after tax and to reduce volatility. This is achieved either by issuing fixed or floating rate long-term debt, or by modifying interest rate exposure through the use of interest rate swaps.
At 31 December 2011, interest rates were fixed on approximately 73% of the expected net debt for 2012 and 57% for 2013 (66% for 2011 and 63% for 2012 at 31 December 2010). The average interest rate on short-term borrowings in 2011 was 2.5% (2010: 2.4%).
Unilever Annual Report and Accounts 2011
Financial statements

95
16B. Treasury risk management continued
The following table shows the split in fixed and floating rate interest exposures, taking into account the impact of interest rate swaps and forward foreign currency contracts:
€ million2011
€ million2010
Cash and cash equivalents 3,484 2,316Current other financial assets 1,453 550Current financial liabilities (5,840) (2,276)Non-current financial liabilities (7,878) (7,258)
(8,781) (6,668)Of which:Fixed rate (amount of fixing for following year) (6,179) (4,946)Floating rate (2,602) (1,722)
(8,781) (6,668)
Assuming that all other variables remain constant, a 100bps increase in floating interest rates on a full year basis would lead to an additional €26 million debit in the income statement (2010: €17 million debit). A 100bps decrease in floating interest rates on a full-year basis would have an equal but opposite effect.
Furthermore, Unilever has interest rate swaps for which cash flow hedge accounting is applied. Assuming that all other variables remain constant, a 100bps increase in floating interest rates on a full year basis would lead to an additional €16 million credit in equity (2010: €10 million credit). A 100bps decrease in floating interest rates on a full year basis would have an equal but opposite effect.
(iii) Commodity price riskThe Group uses commodity forward contracts to hedge against the risk of changes in price of certain commodities. All commodity forward contracts hedge future purchases of raw materials and the contracts are settled either in cash or by physical delivery. Commodity derivatives are generally designated as hedges within cash flow hedge arrangements.
The amount of outstanding commodity contracts is immaterial.
b) Liquidity riskLiquidity risk is the risk that the Group will face difficulty in meeting its obligations associated with its financial liabilities. The Group’s approach to managing liquidity is to ensure that it will have sufficient funds to meet its liabilities when due without incurring unacceptable losses. In doing this management considers both normal and stressed conditions. A material and sustained shortfall in our cash flow could undermine the Group’s credit rating, impair investor confidence and also restrict the Group’s ability to raise funds.
Given recent volatility in the financial markets, the Group has maintained a cautious funding strategy, running a positive cash balance throughout 2011. This has been the result of a strong cash delivery from the business, coupled with the proceeds from bond issuances in 2011. This cash has been invested conservatively with low risk counterparties at maturities of less than six months.
Cash flow from operating activities provides the funds to service the financing of financial liabilities on a day-to-day basis. The Group seeks to manage its liquidity requirements by maintaining access to global debt markets through short-term and long-term debt programmes. In addition, Unilever has committed credit facilities for general corporate use.
Unilever had US $6,150 million of undrawn committed facilities on 31 December 2011 as follows:• revolving 364-day bilateral credit facilities of in aggregate US $5,950 million (2010: US $5,495 million) with a 364-day term-out; and• 364-day bilateral money market commitments of in aggregate US $200 million (2010: US $555 million), under which the
underwriting banks agree, subject to certain conditions, to subscribe for notes with maturities of up to three years.
As part of the regular annual process these facilities will again be renewed in 2012.
Unilever Annual Report and Accounts 2011
Financial statements
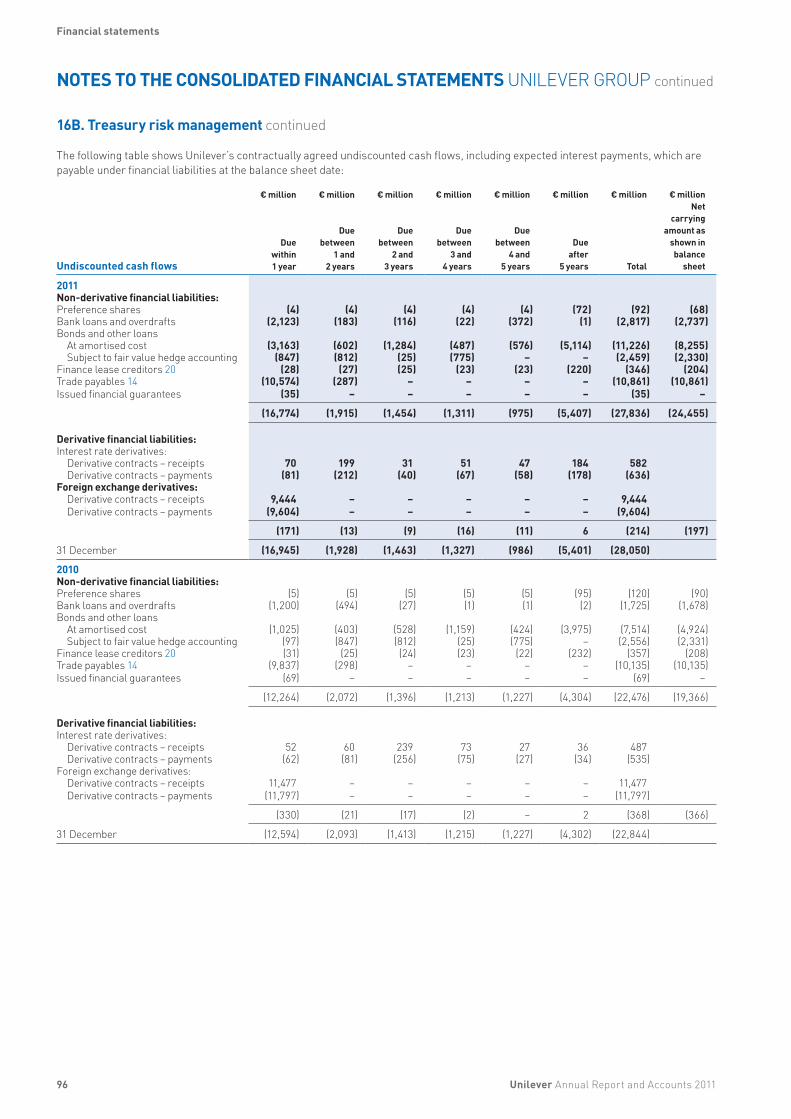
96
NOTES TO THE CONSOLIDATED FINANCIAL STATEMENTS UNILEVER GROUP continued
16B. Treasury risk management continued
The following table shows Unilever’s contractually agreed undiscounted cash flows, including expected interest payments, which are payable under financial liabilities at the balance sheet date:
Undiscounted cash flows
€ million
Duewithin1 year
€ million
Duebetween
1 and2 years
€ million
Duebetween
2 and3 years
€ million
Duebetween
3 and4 years
€ million
Duebetween
4 and5 years
€ million
Dueafter
5 years
€ million
Total
€ millionNet
carryingamount as
shown inbalance
sheet
2011Non-derivative financial liabilities:Preference shares (4) (4) (4) (4) (4) (72) (92) (68)Bank loans and overdrafts (2,123) (183) (116) (22) (372) (1) (2,817) (2,737)Bonds and other loans
At amortised cost (3,163) (602) (1,284) (487) (576) (5,114) (11,226) (8,255)Subject to fair value hedge accounting (847) (812) (25) (775) – – (2,459) (2,330)
Finance lease creditors 20 (28) (27) (25) (23) (23) (220) (346) (204)Trade payables 14 (10,574) (287) – – – – (10,861) (10,861)Issued financial guarantees (35) – – – – – (35) –
(16,774) (1,915) (1,454) (1,311) (975) (5,407) (27,836) (24,455)
Derivative financial liabilities:Interest rate derivatives:
Derivative contracts – receipts 70 199 31 51 47 184 582Derivative contracts – payments (81) (212) (40) (67) (58) (178) (636)
Foreign exchange derivatives:Derivative contracts – receipts 9,444 – – – – – 9,444Derivative contracts – payments (9,604) – – – – – (9,604)
(171) (13) (9) (16) (11) 6 (214) (197)
31 December (16,945) (1,928) (1,463) (1,327) (986) (5,401) (28,050)
2010Non-derivative financial liabilities:Preference shares (5) (5) (5) (5) (5) (95) (120) (90)Bank loans and overdrafts (1,200) (494) (27) (1) (1) (2) (1,725) (1,678)Bonds and other loans
At amortised cost (1,025) (403) (528) (1,159) (424) (3,975) (7,514) (4,924)Subject to fair value hedge accounting (97) (847) (812) (25) (775) – (2,556) (2,331)
Finance lease creditors 20 (31) (25) (24) (23) (22) (232) (357) (208)Trade payables 14 (9,837) (298) – – – – (10,135) (10,135)Issued financial guarantees (69) – – – – – (69) –
(12,264) (2,072) (1,396) (1,213) (1,227) (4,304) (22,476) (19,366)
Derivative financial liabilities:Interest rate derivatives:
Derivative contracts – receipts 52 60 239 73 27 36 487Derivative contracts – payments (62) (81) (256) (75) (27) (34) (535)
Foreign exchange derivatives:Derivative contracts – receipts 11,477 – – – – – 11,477Derivative contracts – payments (11,797) – – – – – (11,797)
(330) (21) (17) (2) – 2 (368) (366)
31 December (12,594) (2,093) (1,413) (1,215) (1,227) (4,302) (22,844)
Unilever Annual Report and Accounts 2011
Financial statements
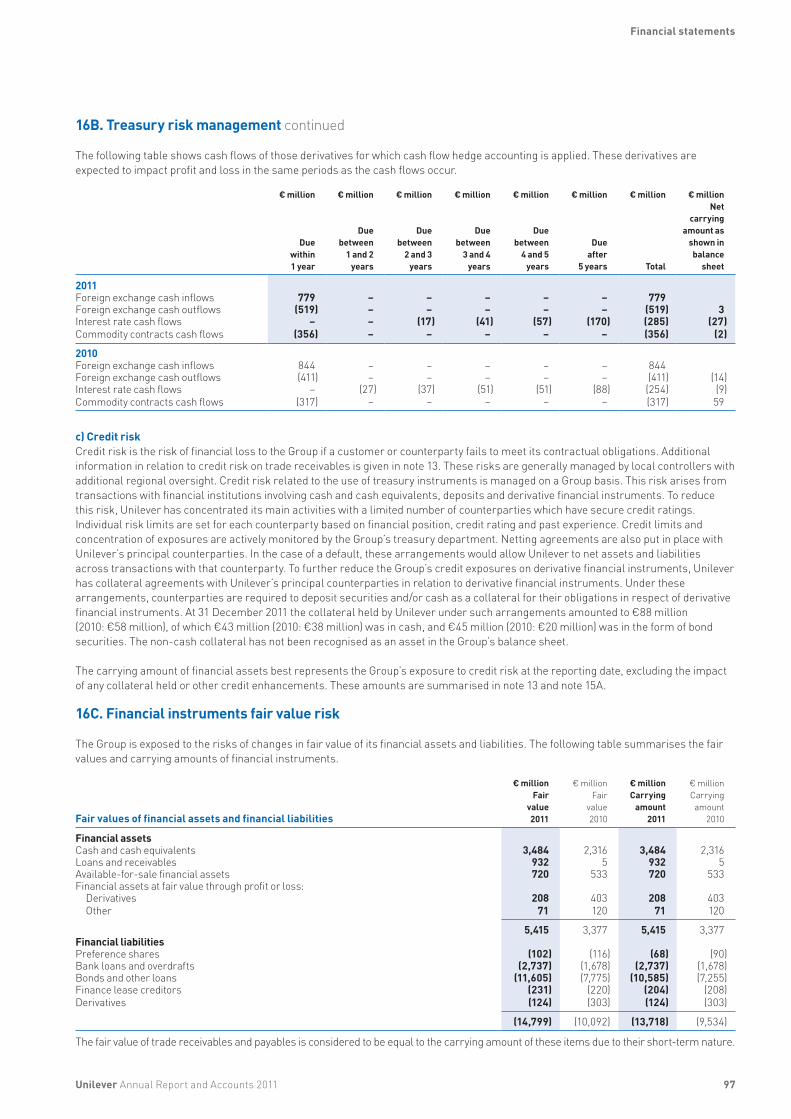
97
16B. Treasury risk management continued
The following table shows cash flows of those derivatives for which cash flow hedge accounting is applied. These derivatives are expected to impact profit and loss in the same periods as the cash flows occur.
€ million
Duewithin1 year
€ million
Duebetween
1 and 2 years
€ million
Duebetween
2 and 3 years
€ million
Duebetween
3 and 4 years
€ million
Duebetween
4 and 5 years
€ million
Dueafter
5 years
€ million
Total
€ millionNet
carryingamount as
shown inbalance
sheet
2011Foreign exchange cash inflows 779 – – – – – 779Foreign exchange cash outflows (519) – – – – – (519) 3Interest rate cash flows – – (17) (41) (57) (170) (285) (27)Commodity contracts cash flows (356) – – – – – (356) (2)
2010Foreign exchange cash inflows 844 – – – – – 844Foreign exchange cash outflows (411) – – – – – (411) (14)Interest rate cash flows – (27) (37) (51) (51) (88) (254) (9)Commodity contracts cash flows (317) – – – – – (317) 59
c) Credit riskCredit risk is the risk of financial loss to the Group if a customer or counterparty fails to meet its contractual obligations. Additional information in relation to credit risk on trade receivables is given in note 13. These risks are generally managed by local controllers with additional regional oversight. Credit risk related to the use of treasury instruments is managed on a Group basis. This risk arises from transactions with financial institutions involving cash and cash equivalents, deposits and derivative financial instruments. To reduce this risk, Unilever has concentrated its main activities with a limited number of counterparties which have secure credit ratings. Individual risk limits are set for each counterparty based on financial position, credit rating and past experience. Credit limits and concentration of exposures are actively monitored by the Group’s treasury department. Netting agreements are also put in place with Unilever’s principal counterparties. In the case of a default, these arrangements would allow Unilever to net assets and liabilities across transactions with that counterparty. To further reduce the Group’s credit exposures on derivative financial instruments, Unilever has collateral agreements with Unilever’s principal counterparties in relation to derivative financial instruments. Under these arrangements, counterparties are required to deposit securities and/or cash as a collateral for their obligations in respect of derivative financial instruments. At 31 December 2011 the collateral held by Unilever under such arrangements amounted to €88 million (2010: €58 million), of which €43 million (2010: €38 million) was in cash, and €45 million (2010: €20 million) was in the form of bond securities. The non-cash collateral has not been recognised as an asset in the Group’s balance sheet.
The carrying amount of financial assets best represents the Group’s exposure to credit risk at the reporting date, excluding the impact of any collateral held or other credit enhancements. These amounts are summarised in note 13 and note 15A.
16C. Financial instruments fair value risk
The Group is exposed to the risks of changes in fair value of its financial assets and liabilities. The following table summarises the fair values and carrying amounts of financial instruments.
Fair values of financial assets and financial liabilities
€ millionFair
value2011
€ millionFair
value2010
€ millionCarrying
amount2011
€ millionCarryingamount
2010
Financial assetsCash and cash equivalents 3,484 2,316 3,484 2,316Loans and receivables 932 5 932 5Available-for-sale financial assets 720 533 720 533Financial assets at fair value through profit or loss:
Derivatives 208 403 208 403Other 71 120 71 120
5,415 3,377 5,415 3,377Financial liabilitiesPreference shares (102) (116) (68) (90)Bank loans and overdrafts (2,737) (1,678) (2,737) (1,678)Bonds and other loans (11,605) (7,775) (10,585) (7,255)Finance lease creditors (231) (220) (204) (208)Derivatives (124) (303) (124) (303)
(14,799) (10,092) (13,718) (9,534)
The fair value of trade receivables and payables is considered to be equal to the carrying amount of these items due to their short-term nature.
Unilever Annual Report and Accounts 2011
Financial statements

98
NOTES TO THE CONSOLIDATED FINANCIAL STATEMENTS UNILEVER GROUP continued
16C. Financial instruments fair value risk continued
Fair value hierarchyThese fair values shown above have been classified into three categories depending on the inputs used in the valuation technique. The categories used are as follows:• Level 1: quoted prices for identical instruments;• Level 2: directly or indirectly observable market inputs, other than Level 1 inputs; and• Level 3: inputs which are not based on observable market data.
For assets and liabilities which are carried at fair value, the classification of fair value calculations by category is summarised below:
€ million
Level 1 2011
€ million
Level 1 2010
€ million
Level 2 2011
€ million
Level 2 2010
€ million
Level 3 2011
€ million
Level 32010
€ millionTotal fair
value 2011
€ millionTotal fair
value2010
Assets at fair valueOther cash equivalents 15A – – 102 696 – – 102 696Available-for-sale financial assets 15A 236 197 482 314 2 22 720 533Financial assets at fair value through profit or loss:
Derivatives 16D – – 266 497 – – 266 497Other 15A 71 56 – 17 – 47 71 120
Liabilities at fair valueBonds and other loans 15B – – (2,330) (2,331) – – (2,330) (2,331)Derivatives 16D – – (197) (366) – – (197) (366)
During the reporting period ending 31 December 2011, there were no transfers from Level 2 to Level 1 (2010: €nil). There were no transfers into, or out of, Level 3 (2010: €nil).
Calculation of fair valuesThe fair values of the financial assets and liabilities are defined as being the amounts at which the instruments could be exchanged or liability settled in an arm’s length transaction between knowledgeable, willing parties. The following methods and assumptions have been used to estimate the fair values:
Assets and liabilities carried at fair value• The fair values of quoted investments falling into Level 1 are based on current bid prices. • The fair values of unquoted available-for-sale financial assets, which fall into Level 2, are based on recent trades in liquid markets,
observable market rates and statistical modelling techniques such as Monte Carlo simulation.• Derivatives are valued using valuation techniques with market observable inputs. The models incorporate various inputs including
the credit quality of counterparties, foreign exchange spot and forward rates, interest rate curves and forward rate curves of the underlying commodities.
• For listed securities where the market is not liquid, and for unlisted securities, valuation techniques are used. These include the use of recent arm’s length transactions, reference to other instruments that are substantially the same and discounted cash flow calculations.
Other financial assets and liabilities (fair values for disclosure purposes only)• Cash and cash equivalents, trade and other current receivables, bank loans and overdrafts, trade payables and other current
liabilities have fair values that approximate to their carrying amounts due to their short-term nature.• The fair values of preference shares and listed bonds are based on their market value.• Non-listed bonds and other loans are based on the net present value of the anticipated future cash flows associated with these
instruments using rates currently available for debt on similar terms, credit risk and remaining maturities.• Fair values for finance lease creditors have been assessed by reference to current market rates for comparable leasing
arrangements.
16D. Derivatives and hedging
The Group uses derivative financial instruments, such as foreign exchange forward contracts, interest rate swap contracts and forward rate agreements, to hedge its exposure to interest rate and foreign currency risk. The Group also uses commodity contracts to hedge the price of some raw materials. The Group does not use derivative financial instruments for speculative purposes.
Unilever Annual Report and Accounts 2011
Financial statements
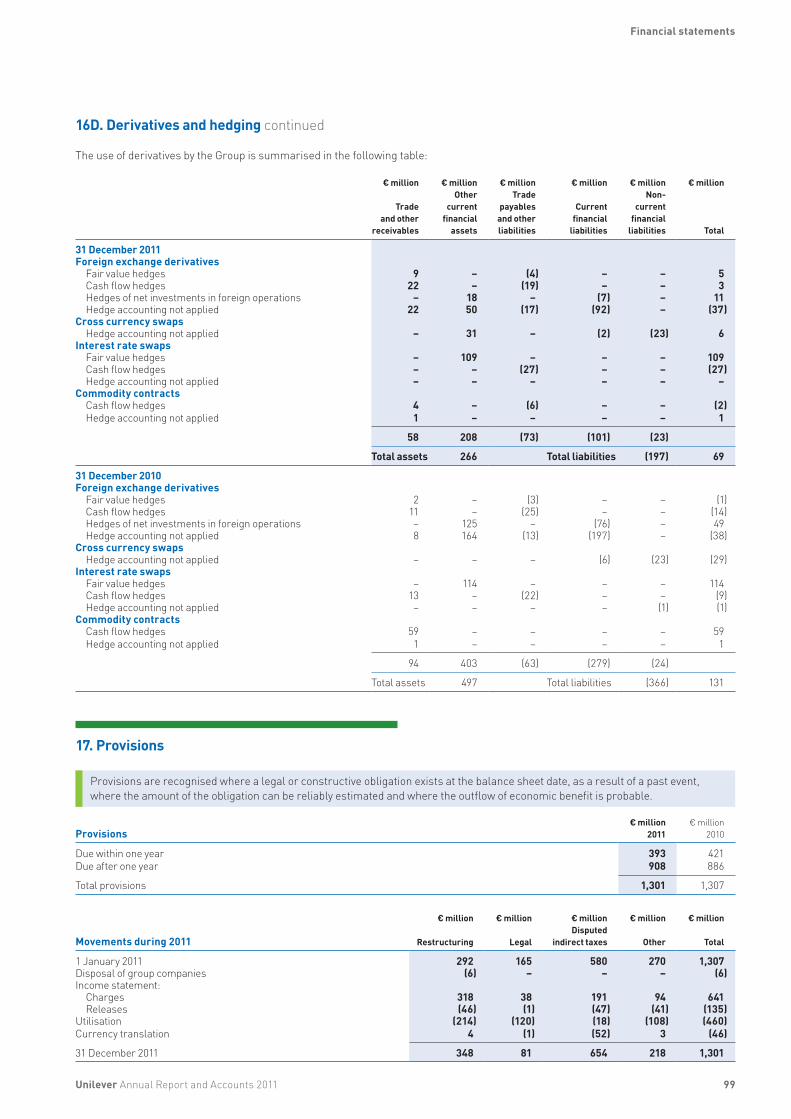
99
16D. Derivatives and hedging continued
The use of derivatives by the Group is summarised in the following table:
€ million
Trade and other
receivables
€ millionOther
current financial
assets
€ millionTrade
payables and other liabilities
€ million
Current financial
liabilities
€ millionNon-
current financial
liabilities
€ million
Total
31 December 2011Foreign exchange derivatives
Fair value hedges 9 – (4) – – 5Cash flow hedges 22 – (19) – – 3Hedges of net investments in foreign operations – 18 – (7) – 11Hedge accounting not applied 22 50 (17) (92) – (37)
Cross currency swapsHedge accounting not applied – 31 – (2) (23) 6
Interest rate swapsFair value hedges – 109 – – – 109Cash flow hedges – – (27) – – (27)Hedge accounting not applied – – – – – –
Commodity contractsCash flow hedges 4 – (6) – – (2)Hedge accounting not applied 1 – – – – 1
58 208 (73) (101) (23)
Total assets 266 Total liabilities (197) 69
31 December 2010Foreign exchange derivatives
Fair value hedges 2 – (3) – – (1)Cash flow hedges 11 – (25) – – (14)Hedges of net investments in foreign operations – 125 – (76) – 49Hedge accounting not applied 8 164 (13) (197) – (38)
Cross currency swapsHedge accounting not applied – – – (6) (23) (29)
Interest rate swapsFair value hedges – 114 – – – 114Cash flow hedges 13 – (22) – – (9)Hedge accounting not applied – – – – (1) (1)
Commodity contractsCash flow hedges 59 – – – – 59Hedge accounting not applied 1 – – – – 1
94 403 (63) (279) (24)
Total assets 497 Total liabilities (366) 131
17. Provisions
Provisions are recognised where a legal or constructive obligation exists at the balance sheet date, as a result of a past event, where the amount of the obligation can be reliably estimated and where the outflow of economic benefit is probable.
Provisions€ million
2011€ million
2010
Due within one year 393 421Due after one year 908 886
Total provisions 1,301 1,307
Movements during 2011
€ million
Restructuring
€ million
Legal
€ millionDisputed
indirect taxes
€ million
Other
€ million
Total
1 January 2011 292 165 580 270 1,307Disposal of group companies (6) – – – (6)Income statement:
Charges 318 38 191 94 641Releases (46) (1) (47) (41) (135)
Utilisation (214) (120) (18) (108) (460)Currency translation 4 (1) (52) 3 (46)
31 December 2011 348 81 654 218 1,301
Unilever Annual Report and Accounts 2011
Financial statements
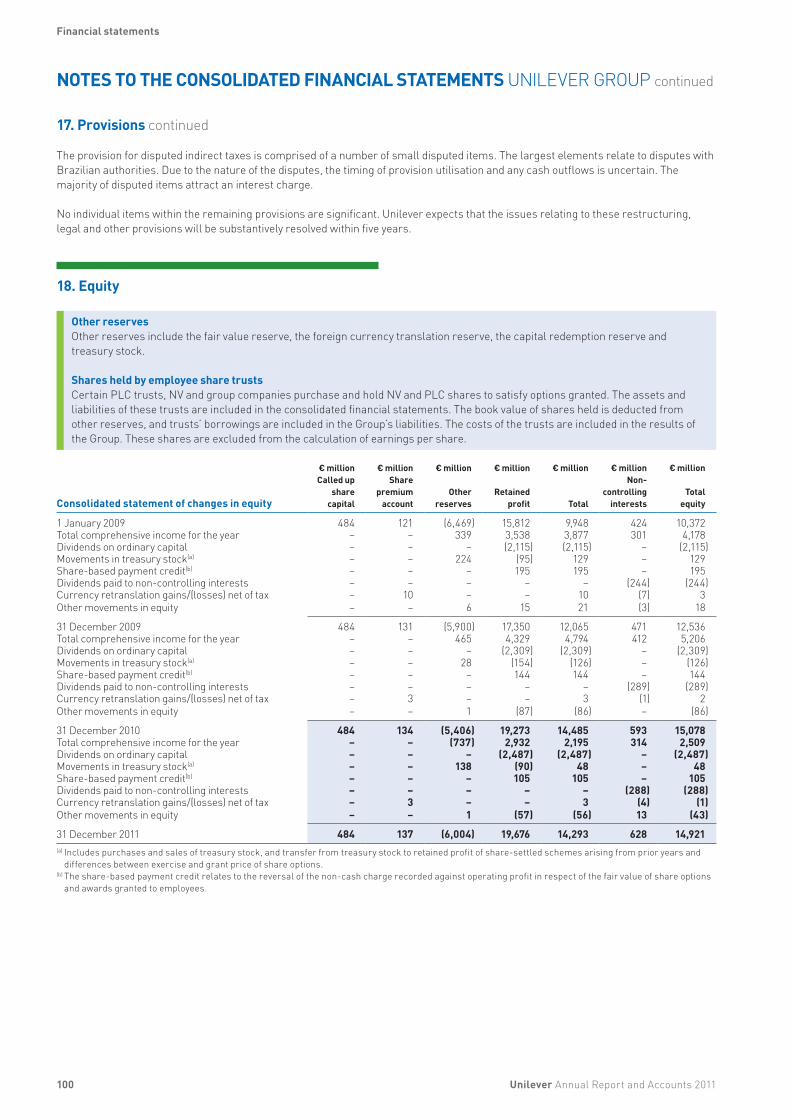
100
NOTES TO THE CONSOLIDATED FINANCIAL STATEMENTS UNILEVER GROUP continued
17. Provisions continued
The provision for disputed indirect taxes is comprised of a number of small disputed items. The largest elements relate to disputes with Brazilian authorities. Due to the nature of the disputes, the timing of provision utilisation and any cash outflows is uncertain. The majority of disputed items attract an interest charge.
No individual items within the remaining provisions are significant. Unilever expects that the issues relating to these restructuring, legal and other provisions will be substantively resolved within five years.
18. Equity
Other reservesOther reserves include the fair value reserve, the foreign currency translation reserve, the capital redemption reserve and treasury stock.
Shares held by employee share trustsCertain PLC trusts, NV and group companies purchase and hold NV and PLC shares to satisfy options granted. The assets and liabilities of these trusts are included in the consolidated financial statements. The book value of shares held is deducted from other reserves, and trusts’ borrowings are included in the Group’s liabilities. The costs of the trusts are included in the results of the Group. These shares are excluded from the calculation of earnings per share.
Consolidated statement of changes in equity
€ millionCalled up
sharecapital
€ millionShare
premiumaccount
€ million
Otherreserves
€ million
Retainedprofit
€ million
Total
€ millionNon-
controllinginterests
€ million
Totalequity
1 January 2009 484 121 (6,469) 15,812 9,948 424 10,372Total comprehensive income for the year – – 339 3,538 3,877 301 4,178Dividends on ordinary capital – – – (2,115) (2,115) – (2,115)Movements in treasury stock(a) – – 224 (95) 129 – 129Share-based payment credit(b) – – – 195 195 – 195Dividends paid to non-controlling interests – – – – – (244) (244)Currency retranslation gains/(losses) net of tax – 10 – – 10 (7) 3Other movements in equity – – 6 15 21 (3) 18
31 December 2009 484 131 (5,900) 17,350 12,065 471 12,536Total comprehensive income for the year – – 465 4,329 4,794 412 5,206Dividends on ordinary capital – – – (2,309) (2,309) – (2,309)Movements in treasury stock(a) – – 28 (154) (126) – (126)Share-based payment credit(b) – – – 144 144 – 144Dividends paid to non-controlling interests – – – – – (289) (289)Currency retranslation gains/(losses) net of tax – 3 – – 3 (1) 2Other movements in equity – – 1 (87) (86) – (86)
31 December 2010 484 134 (5,406) 19,273 14,485 593 15,078Total comprehensive income for the year – – (737) 2,932 2,195 314 2,509 Dividends on ordinary capital – – – (2,487) (2,487) – (2,487)Movements in treasury stock(a) – – 138 (90) 48 – 48 Share-based payment credit(b) – – – 105 105 – 105 Dividends paid to non-controlling interests – – – – – (288) (288)Currency retranslation gains/(losses) net of tax – 3 – – 3 (4) (1)Other movements in equity – – 1 (57) (56) 13 (43)
31 December 2011 484 137 (6,004) 19,676 14,293 628 14,921 (a) Includes purchases and sales of treasury stock, and transfer from treasury stock to retained profit of share-settled schemes arising from prior years and
differences between exercise and grant price of share options.(b) The share-based payment credit relates to the reversal of the non-cash charge recorded against operating profit in respect of the fair value of share options
and awards granted to employees.
Unilever Annual Report and Accounts 2011
Financial statements
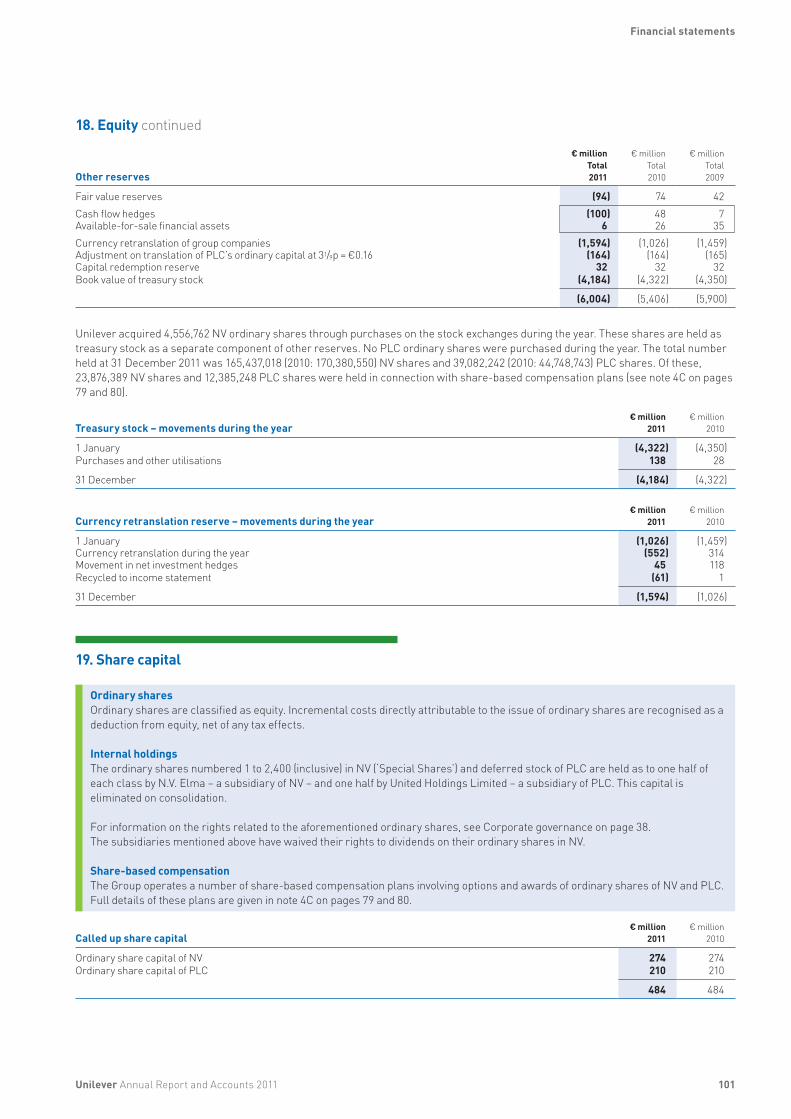
101
18. Equity continued
Other reserves
€ millionTotal2011
€ millionTotal2010
€ millionTotal2009
Fair value reserves (94) 74 42Cash flow hedges (100) 48 7Available-for-sale financial assets 6 26 35Currency retranslation of group companies (1,594) (1,026) (1,459)Adjustment on translation of PLC’s ordinary capital at 31/9p = €0.16 (164) (164) (165)Capital redemption reserve 32 32 32Book value of treasury stock (4,184) (4,322) (4,350)
(6,004) (5,406) (5,900)
Unilever acquired 4,556,762 NV ordinary shares through purchases on the stock exchanges during the year. These shares are held as treasury stock as a separate component of other reserves. No PLC ordinary shares were purchased during the year. The total number held at 31 December 2011 was 165,437,018 (2010: 170,380,550) NV shares and 39,082,242 (2010: 44,748,743) PLC shares. Of these, 23,876,389 NV shares and 12,385,248 PLC shares were held in connection with share-based compensation plans (see note 4C on pages 79 and 80).
Treasury stock – movements during the year€ million
2011€ million
2010
1 January (4,322) (4,350)Purchases and other utilisations 138 28
31 December (4,184) (4,322)
Currency retranslation reserve – movements during the year€ million
2011€ million
2010
1 January (1,026) (1,459)Currency retranslation during the year (552) 314Movement in net investment hedges 45 118Recycled to income statement (61) 1
31 December (1,594) (1,026)
19. Share capital
Ordinary sharesOrdinary shares are classified as equity. Incremental costs directly attributable to the issue of ordinary shares are recognised as a deduction from equity, net of any tax effects.
Internal holdingsThe ordinary shares numbered 1 to 2,400 (inclusive) in NV (‘Special Shares’) and deferred stock of PLC are held as to one half of each class by N.V. Elma – a subsidiary of NV – and one half by United Holdings Limited – a subsidiary of PLC. This capital is eliminated on consolidation.
For information on the rights related to the aforementioned ordinary shares, see Corporate governance on page 38. The subsidiaries mentioned above have waived their rights to dividends on their ordinary shares in NV.
Share-based compensationThe Group operates a number of share-based compensation plans involving options and awards of ordinary shares of NV and PLC. Full details of these plans are given in note 4C on pages 79 and 80.
Called up share capital
€ million2011
€ million2010
Ordinary share capital of NV 274 274Ordinary share capital of PLC 210 210
484 484
Unilever Annual Report and Accounts 2011
Financial statements
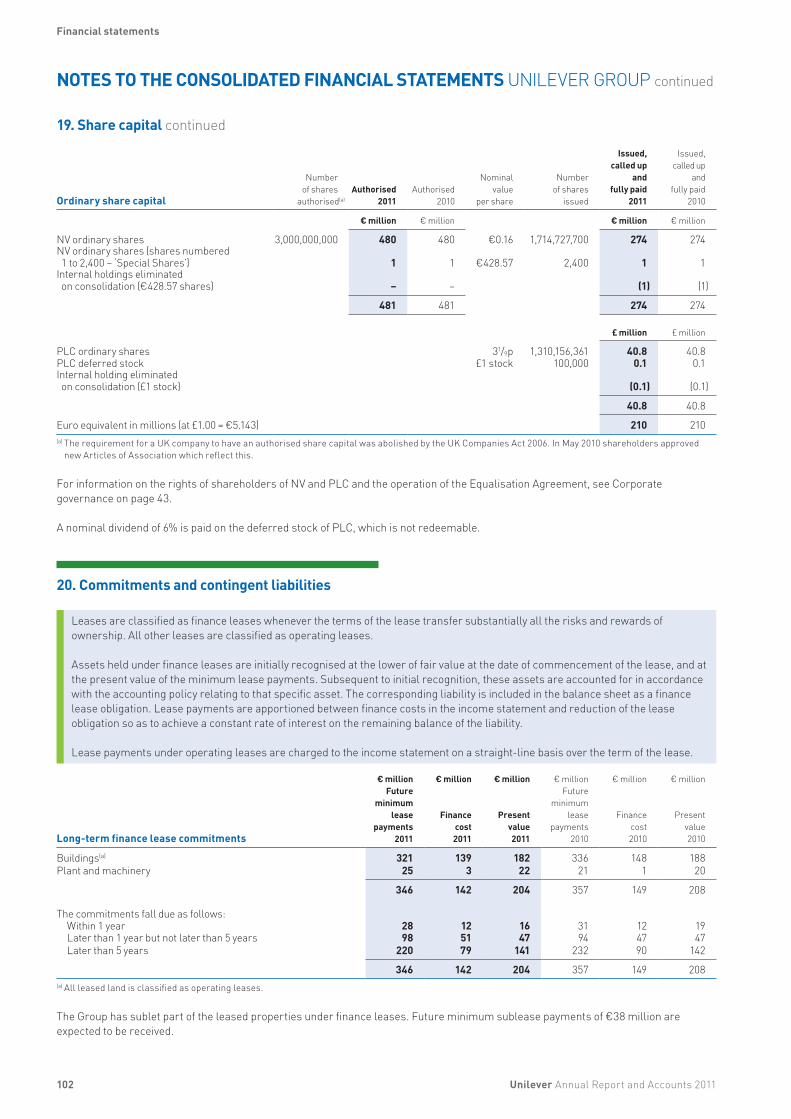
102
NOTES TO THE CONSOLIDATED FINANCIAL STATEMENTS UNILEVER GROUP continued
19. Share capital continued
Ordinary share capital
Number
of sharesauthorised(a)
Authorised2011
Authorised2010
Nominal
valueper share
Number
of sharesissued
Issued,called up
andfully paid
2011
Issued, called up
and fully paid
2010
€ million € million € million € million
NV ordinary shares 3,000,000,000 480 480 €0.16 1,714,727,700 274 274NV ordinary shares (shares numbered 1 to 2,400 – ‘Special Shares’) 1 1 €428.57 2,400 1 1
Internal holdings eliminated on consolidation (€428.57 shares) – – (1) (1)
481 481 274 274
£ million £ million
PLC ordinary shares 31/9p 1,310,156,361 40.8 40.8PLC deferred stock £1 stock 100,000 0.1 0.1Internal holding eliminated on consolidation (£1 stock) (0.1) (0.1)
40.8 40.8
Euro equivalent in millions (at £1.00 = €5.143) 210 210 (a) The requirement for a UK company to have an authorised share capital was abolished by the UK Companies Act 2006. In May 2010 shareholders approved
new Articles of Association which reflect this.
For information on the rights of shareholders of NV and PLC and the operation of the Equalisation Agreement, see Corporate governance on page 43.
A nominal dividend of 6% is paid on the deferred stock of PLC, which is not redeemable.
20. Commitments and contingent liabilities
Leases are classified as finance leases whenever the terms of the lease transfer substantially all the risks and rewards of ownership. All other leases are classified as operating leases.
Assets held under finance leases are initially recognised at the lower of fair value at the date of commencement of the lease, and at the present value of the minimum lease payments. Subsequent to initial recognition, these assets are accounted for in accordance with the accounting policy relating to that specific asset. The corresponding liability is included in the balance sheet as a finance lease obligation. Lease payments are apportioned between finance costs in the income statement and reduction of the lease obligation so as to achieve a constant rate of interest on the remaining balance of the liability.
Lease payments under operating leases are charged to the income statement on a straight-line basis over the term of the lease.
Long-term finance lease commitments
€ millionFuture
minimumlease
payments2011
€ million
Financecost2011
€ million
Presentvalue2011
€ millionFuture
minimumlease
payments2010
€ million
Financecost2010
€ million
Presentvalue2010
Buildings(a) 321 139 182 336 148 188Plant and machinery 25 3 22 21 1 20
346 142 204 357 149 208
The commitments fall due as follows:Within 1 year 28 12 16 31 12 19Later than 1 year but not later than 5 years 98 51 47 94 47 47Later than 5 years 220 79 141 232 90 142
346 142 204 357 149 208 (a) All leased land is classified as operating leases.
The Group has sublet part of the leased properties under finance leases. Future minimum sublease payments of €38 million are expected to be received.
Unilever Annual Report and Accounts 2011
Financial statements
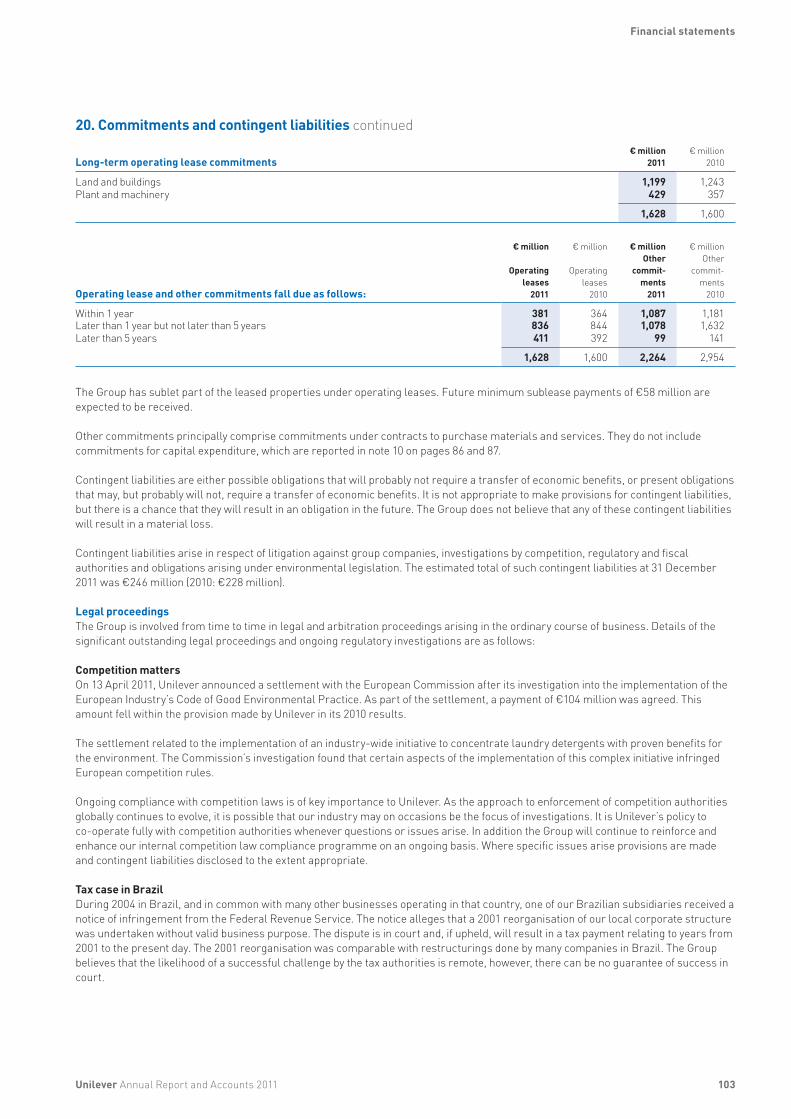
103
20. Commitments and contingent liabilities continued Long-term operating lease commitments
€ million2011
€ million2010
Land and buildings 1,199 1,243Plant and machinery 429 357
1,628 1,600
Operating lease and other commitments fall due as follows:
€ million
Operatingleases
2011
€ million
Operatingleases
2010
€ millionOther
commit-ments
2011
€ millionOther
commit-ments
2010
Within 1 year 381 364 1,087 1,181Later than 1 year but not later than 5 years 836 844 1,078 1,632Later than 5 years 411 392 99 141
1,628 1,600 2,264 2,954
The Group has sublet part of the leased properties under operating leases. Future minimum sublease payments of €58 million are expected to be received.
Other commitments principally comprise commitments under contracts to purchase materials and services. They do not include commitments for capital expenditure, which are reported in note 10 on pages 86 and 87.
Contingent liabilities are either possible obligations that will probably not require a transfer of economic benefits, or present obligations that may, but probably will not, require a transfer of economic benefits. It is not appropriate to make provisions for contingent liabilities, but there is a chance that they will result in an obligation in the future. The Group does not believe that any of these contingent liabilities will result in a material loss.
Contingent liabilities arise in respect of litigation against group companies, investigations by competition, regulatory and fiscal authorities and obligations arising under environmental legislation. The estimated total of such contingent liabilities at 31 December 2011 was €246 million (2010: €228 million).
Legal proceedingsThe Group is involved from time to time in legal and arbitration proceedings arising in the ordinary course of business. Details of the significant outstanding legal proceedings and ongoing regulatory investigations are as follows:
Competition mattersOn 13 April 2011, Unilever announced a settlement with the European Commission after its investigation into the implementation of the European Industry’s Code of Good Environmental Practice. As part of the settlement, a payment of €104 million was agreed. This amount fell within the provision made by Unilever in its 2010 results.
The settlement related to the implementation of an industry-wide initiative to concentrate laundry detergents with proven benefits for the environment. The Commission’s investigation found that certain aspects of the implementation of this complex initiative infringed European competition rules.
Ongoing compliance with competition laws is of key importance to Unilever. As the approach to enforcement of competition authorities globally continues to evolve, it is possible that our industry may on occasions be the focus of investigations. It is Unilever’s policy to co-operate fully with competition authorities whenever questions or issues arise. In addition the Group will continue to reinforce and enhance our internal competition law compliance programme on an ongoing basis. Where specific issues arise provisions are made and contingent liabilities disclosed to the extent appropriate.
Tax case in BrazilDuring 2004 in Brazil, and in common with many other businesses operating in that country, one of our Brazilian subsidiaries received a notice of infringement from the Federal Revenue Service. The notice alleges that a 2001 reorganisation of our local corporate structure was undertaken without valid business purpose. The dispute is in court and, if upheld, will result in a tax payment relating to years from 2001 to the present day. The 2001 reorganisation was comparable with restructurings done by many companies in Brazil. The Group believes that the likelihood of a successful challenge by the tax authorities is remote, however, there can be no guarantee of success in court.
Unilever Annual Report and Accounts 2011
Financial statements
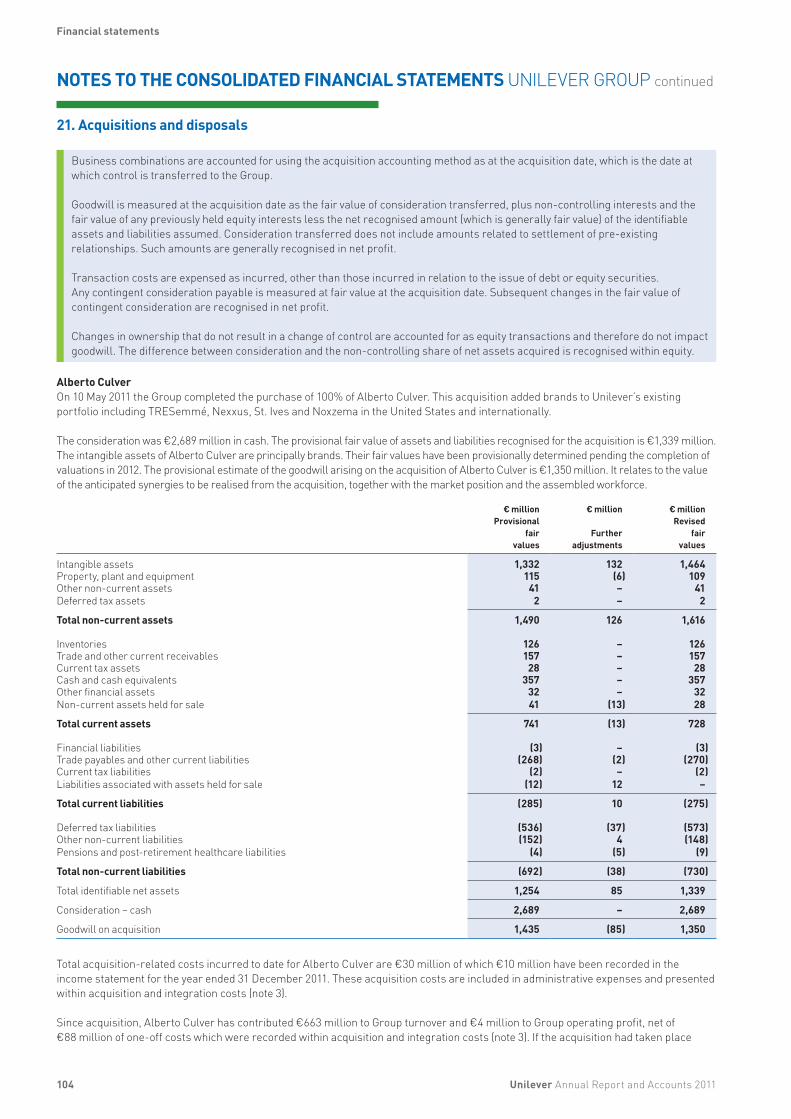
104
NOTES TO THE CONSOLIDATED FINANCIAL STATEMENTS UNILEVER GROUP continued
21. Acquisitions and disposals
Business combinations are accounted for using the acquisition accounting method as at the acquisition date, which is the date at which control is transferred to the Group.
Goodwill is measured at the acquisition date as the fair value of consideration transferred, plus non-controlling interests and the fair value of any previously held equity interests less the net recognised amount (which is generally fair value) of the identifiable assets and liabilities assumed. Consideration transferred does not include amounts related to settlement of pre-existing relationships. Such amounts are generally recognised in net profit.
Transaction costs are expensed as incurred, other than those incurred in relation to the issue of debt or equity securities. Any contingent consideration payable is measured at fair value at the acquisition date. Subsequent changes in the fair value of contingent consideration are recognised in net profit.
Changes in ownership that do not result in a change of control are accounted for as equity transactions and therefore do not impact goodwill. The difference between consideration and the non-controlling share of net assets acquired is recognised within equity.
Alberto Culver On 10 May 2011 the Group completed the purchase of 100% of Alberto Culver. This acquisition added brands to Unilever’s existing portfolio including TRESemmé, Nexxus, St. Ives and Noxzema in the United States and internationally.
The consideration was €2,689 million in cash. The provisional fair value of assets and liabilities recognised for the acquisition is €1,339 million. The intangible assets of Alberto Culver are principally brands. Their fair values have been provisionally determined pending the completion of valuations in 2012. The provisional estimate of the goodwill arising on the acquisition of Alberto Culver is €1,350 million. It relates to the value of the anticipated synergies to be realised from the acquisition, together with the market position and the assembled workforce.
€ millionProvisional
fair values
€ million
Furtheradjustments
€ millionRevised
fairvalues
Intangible assets 1,332 132 1,464Property, plant and equipment 115 (6) 109Other non-current assets 41 – 41 Deferred tax assets 2 – 2
Total non-current assets 1,490 126 1,616
Inventories 126 – 126Trade and other current receivables 157 – 157Current tax assets 28 – 28Cash and cash equivalents 357 – 357Other financial assets 32 – 32Non-current assets held for sale 41 (13) 28
Total current assets 741 (13) 728
Financial liabilities (3) – (3)Trade payables and other current liabilities (268) (2) (270)Current tax liabilities (2) – (2)Liabilities associated with assets held for sale (12) 12 –
Total current liabilities (285) 10 (275)
Deferred tax liabilities (536) (37) (573)Other non-current liabilities (152) 4 (148)Pensions and post-retirement healthcare liabilities (4) (5) (9)
Total non-current liabilities (692) (38) (730)
Total identifiable net assets 1,254 85 1,339
Consideration – cash 2,689 – 2,689
Goodwill on acquisition 1,435 (85) 1,350
Total acquisition-related costs incurred to date for Alberto Culver are €30 million of which €10 million have been recorded in the income statement for the year ended 31 December 2011. These acquisition costs are included in administrative expenses and presented within acquisition and integration costs (note 3).
Since acquisition, Alberto Culver has contributed €663 million to Group turnover and €4 million to Group operating profit, net of €88 million of one-off costs which were recorded within acquisition and integration costs (note 3). If the acquisition had taken place
Unilever Annual Report and Accounts 2011
Financial statements
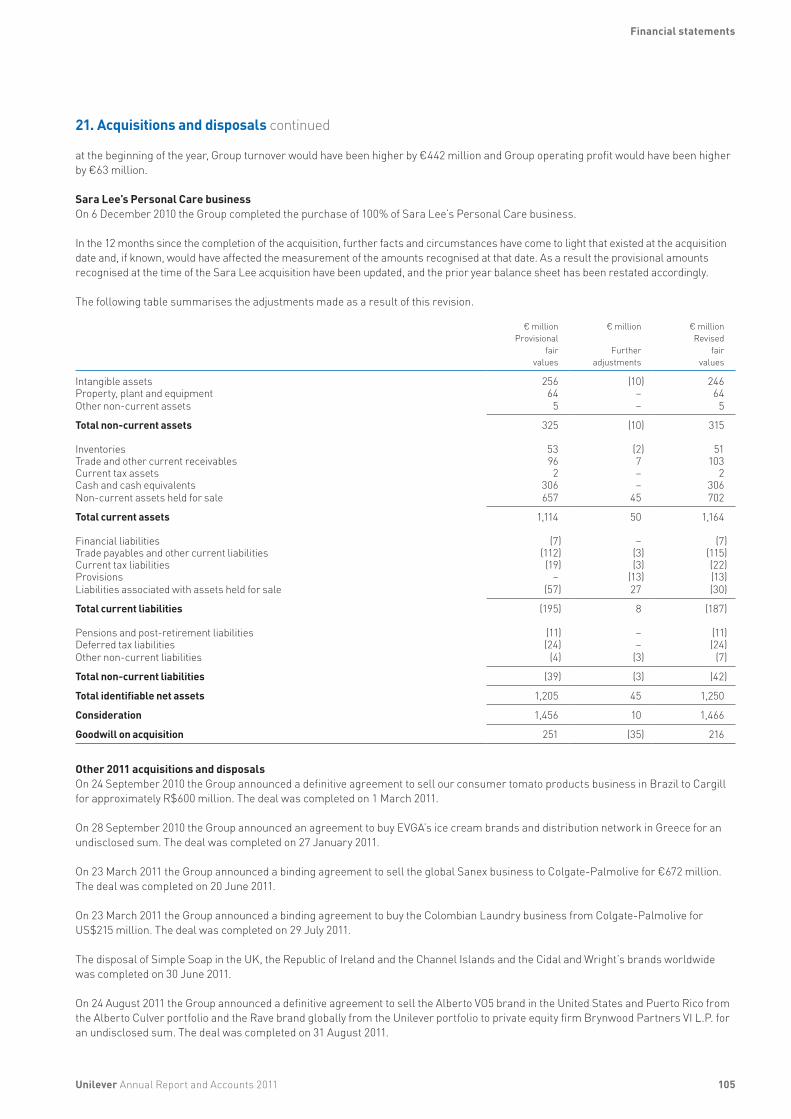
105
21. Acquisitions and disposals continued
at the beginning of the year, Group turnover would have been higher by €442 million and Group operating profit would have been higher by €63 million.
Sara Lee’s Personal Care businessOn 6 December 2010 the Group completed the purchase of 100% of Sara Lee’s Personal Care business.
In the 12 months since the completion of the acquisition, further facts and circumstances have come to light that existed at the acquisition date and, if known, would have affected the measurement of the amounts recognised at that date. As a result the provisional amounts recognised at the time of the Sara Lee acquisition have been updated, and the prior year balance sheet has been restated accordingly.
The following table summarises the adjustments made as a result of this revision.
€ millionProvisional
fairvalues
€ million
Furtheradjustments
€ millionRevised
fairvalues
Intangible assets 256 (10) 246Property, plant and equipment 64 – 64Other non-current assets 5 – 5
Total non-current assets 325 (10) 315
Inventories 53 (2) 51Trade and other current receivables 96 7 103Current tax assets 2 – 2Cash and cash equivalents 306 – 306Non-current assets held for sale 657 45 702
Total current assets 1,114 50 1,164
Financial liabilities (7) – (7)Trade payables and other current liabilities (112) (3) (115)Current tax liabilities (19) (3) (22)Provisions – (13) (13)Liabilities associated with assets held for sale (57) 27 (30)
Total current liabilities (195) 8 (187)
Pensions and post-retirement liabilities (11) – (11)Deferred tax liabilities (24) – (24)Other non-current liabilities (4) (3) (7)
Total non-current liabilities (39) (3) (42)
Total identifiable net assets 1,205 45 1,250
Consideration 1,456 10 1,466
Goodwill on acquisition 251 (35) 216
Other 2011 acquisitions and disposals On 24 September 2010 the Group announced a definitive agreement to sell our consumer tomato products business in Brazil to Cargill for approximately R$600 million. The deal was completed on 1 March 2011.
On 28 September 2010 the Group announced an agreement to buy EVGA’s ice cream brands and distribution network in Greece for an undisclosed sum. The deal was completed on 27 January 2011.
On 23 March 2011 the Group announced a binding agreement to sell the global Sanex business to Colgate-Palmolive for €672 million. The deal was completed on 20 June 2011.
On 23 March 2011 the Group announced a binding agreement to buy the Colombian Laundry business from Colgate-Palmolive for US$215 million. The deal was completed on 29 July 2011.
The disposal of Simple Soap in the UK, the Republic of Ireland and the Channel Islands and the Cidal and Wright’s brands worldwide was completed on 30 June 2011.
On 24 August 2011 the Group announced a definitive agreement to sell the Alberto VO5 brand in the United States and Puerto Rico from the Alberto Culver portfolio and the Rave brand globally from the Unilever portfolio to private equity firm Brynwood Partners VI L.P. foran undisclosed sum. The deal was completed on 31 August 2011.
Unilever Annual Report and Accounts 2011
Financial statements
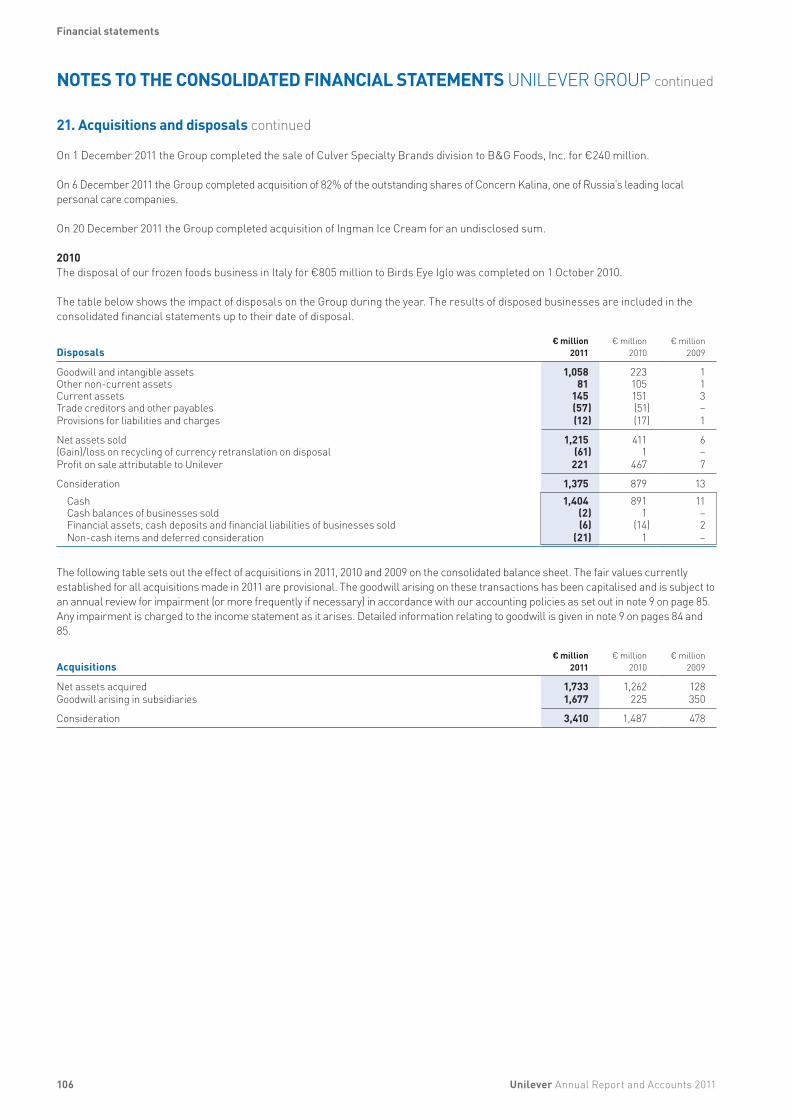
106
NOTES TO THE CONSOLIDATED FINANCIAL STATEMENTS UNILEVER GROUP continued
21. Acquisitions and disposals continued
On 1 December 2011 the Group completed the sale of Culver Specialty Brands division to B&G Foods, Inc. for €240 million.
On 6 December 2011 the Group completed acquisition of 82% of the outstanding shares of Concern Kalina, one of Russia’s leading local personal care companies.
On 20 December 2011 the Group completed acquisition of Ingman Ice Cream for an undisclosed sum.
2010The disposal of our frozen foods business in Italy for €805 million to Birds Eye Iglo was completed on 1 October 2010.
The table below shows the impact of disposals on the Group during the year. The results of disposed businesses are included in the consolidated financial statements up to their date of disposal.
Disposals€ million
2011€ million
2010€ million
2009
Goodwill and intangible assets 1,058 223 1Other non-current assets 81 105 1Current assets 145 151 3Trade creditors and other payables (57) (51) –Provisions for liabilities and charges (12) (17) 1
Net assets sold 1,215 411 6(Gain)/loss on recycling of currency retranslation on disposal (61) 1 –Profit on sale attributable to Unilever 221 467 7
Consideration 1,375 879 13Cash 1,404 891 11Cash balances of businesses sold (2) 1 –Financial assets, cash deposits and financial liabilities of businesses sold (6) (14) 2Non-cash items and deferred consideration (21) 1 –
The following table sets out the effect of acquisitions in 2011, 2010 and 2009 on the consolidated balance sheet. The fair values currently established for all acquisitions made in 2011 are provisional. The goodwill arising on these transactions has been capitalised and is subject to an annual review for impairment (or more frequently if necessary) in accordance with our accounting policies as set out in note 9 on page 85. Any impairment is charged to the income statement as it arises. Detailed information relating to goodwill is given in note 9 on pages 84 and 85.
Acquisitions
€ million2011
€ million2010
€ million2009
Net assets acquired 1,733 1,262 128Goodwill arising in subsidiaries 1,677 225 350
Consideration 3,410 1,487 478
Unilever Annual Report and Accounts 2011
Financial statements

107
22. Assets and liabilities held for sale
Non-current assets and groups of assets and liabilities which comprise disposal groups, are classified as ‘held for sale’ when all of the following criteria are met: a decision has been made to sell; the assets are available for sale immediately; the assets are being actively marketed; and a sale has been agreed or is expected to be concluded within twelve months of the balance sheet date.
Immediately prior to classification as held for sale, the assets or groups of assets are remeasured in accordance with the Group’s accounting policies. Subsequently, assets and disposal groups classified as held for sale are valued at the lower of book value or fair value less disposal costs. Assets held for sale are not depreciated.
€ million2011
€ million2010
Disposal group held for sale on acquisitionAssets – 702Liabilities – (30)
– 672
Other disposal groups held for saleGoodwill and intangibles 9 82Property, plant and equipment – 63Inventories – 53Trade and other receivables – 1
9 199
Non-current assets held for sale
Property, plant and equipment 12 20
On 6 December 2010, the Group acquired the Sanex brand as part of the acquisition of Sara Lee’s Personal Care business. The European Competition Authority’s approval of the acquisition was contingent on the divestiture of the Sanex brand in the European Economic Area. The divestiture was completed in the first half of 2011.
23. Related party transactions
A related party is a person or entity that is related to the Group. These include both people and entities that have, or are subject to the influence or control of the Group.
The following related party balances existed with associate or joint venture businesses at 31 December:
Related party balances
€ million2011
€ million2010
Trading and other balances due from joint ventures 243 233Trading and other balances due from/(to) associates – –
Joint venturesSales by Unilever group companies to Unilever Jerónimo Martins and Pepsi Lipton International were €100 million and €11 million in 2011 (2010: €83 million and €12 million) respectively. Sales from Jerónimo Martins to Unilever group companies were €45 million in 2011 (2010: €43 million). Balances owed by/(to) Unilever Jerónimo Martins and Pepsi Lipton International at 31 December 2011 were €244 million and €0.7 million (2010: €233 million and €0.3 million) respectively.
AssociatesLangholm Capital Partners invests in private European companies with above-average longer-term growth prospects. Since the Langholm I Fund was launched in 2002, Unilever has invested €83 million in Langholm I, with an outstanding commitment at the end of 2011 of €2 million. Unilever has received back a total of €130 million in cash from its investment in Langholm I.
Langholm Capital Partners II was launched in 2009 Unilever has invested €25 million in Langholm II, with an outstanding commitment at the end of 2011 of €50 million.
Physic Ventures is an early stage venture capital fund based in San Francisco, focusing on consumer-driven health, wellness and sustainable living. Unilever has invested €44 million in Physic Ventures since the launch of the fund in 2007. At 31 December 2011 the outstanding commitment with Physic Ventures was €26 million.
Unilever Annual Report and Accounts 2011
Financial statements
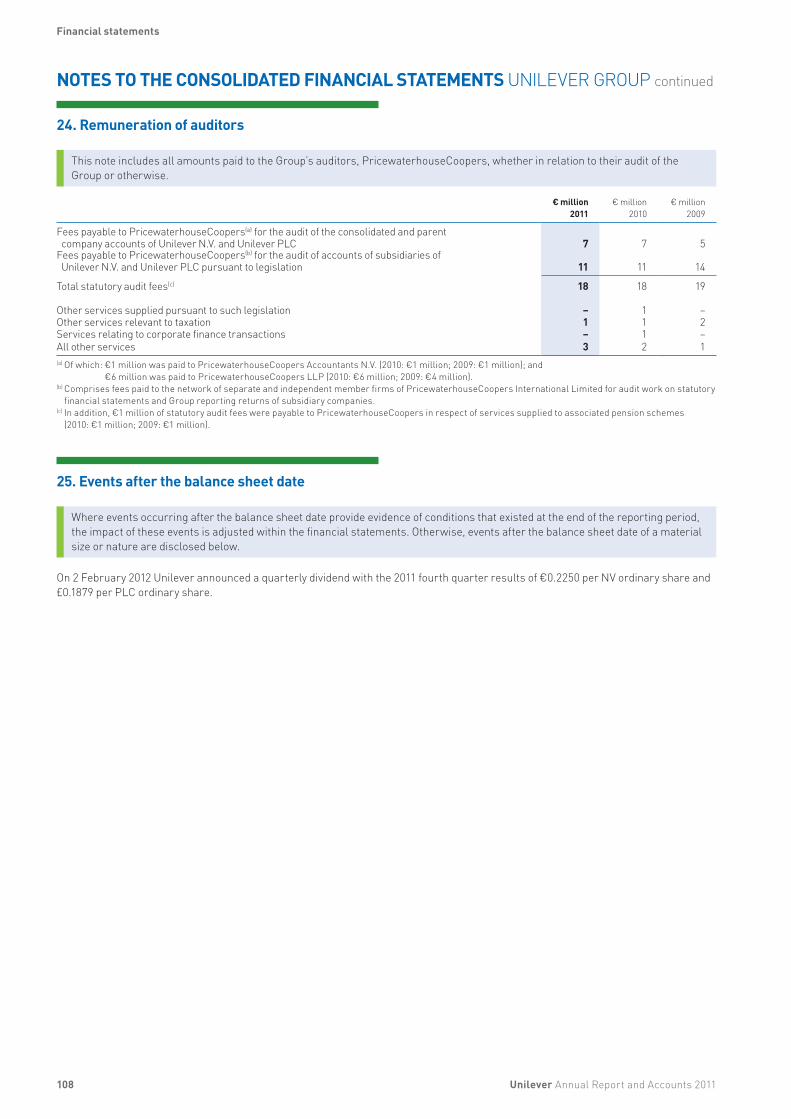
108
NOTES TO THE CONSOLIDATED FINANCIAL STATEMENTS UNILEVER GROUP continued
24. Remuneration of auditors
This note includes all amounts paid to the Group’s auditors, PricewaterhouseCoopers, whether in relation to their audit of the Group or otherwise.
€ million2011
€ million2010
€ million2009
Fees payable to PricewaterhouseCoopers(a) for the audit of the consolidated and parent company accounts of Unilever N.V. and Unilever PLC 7 7 5
Fees payable to PricewaterhouseCoopers(b) for the audit of accounts of subsidiaries of Unilever N.V. and Unilever PLC pursuant to legislation 11 11 14
Total statutory audit fees(c) 18 18 19
Other services supplied pursuant to such legislation – 1 –Other services relevant to taxation 1 1 2Services relating to corporate finance transactions – 1 –All other services 3 2 1(a) Of which: €1 million was paid to PricewaterhouseCoopers Accountants N.V. (2010: €1 million; 2009: €1 million); and
€6 million was paid to PricewaterhouseCoopers LLP (2010: €6 million; 2009: €4 million).(b) Comprises fees paid to the network of separate and independent member firms of PricewaterhouseCoopers International Limited for audit work on statutory
financial statements and Group reporting returns of subsidiary companies.(c) In addition, €1 million of statutory audit fees were payable to PricewaterhouseCoopers in respect of services supplied to associated pension schemes
(2010: €1 million; 2009: €1 million).
25. Events after the balance sheet date
Where events occurring after the balance sheet date provide evidence of conditions that existed at the end of the reporting period, the impact of these events is adjusted within the financial statements. Otherwise, events after the balance sheet date of a material size or nature are disclosed below.
On 2 February 2012 Unilever announced a quarterly dividend with the 2011 fourth quarter results of €0.2250 per NV ordinary share and £0.1879 per PLC ordinary share.
Unilever Annual Report and Accounts 2011
Financial statements
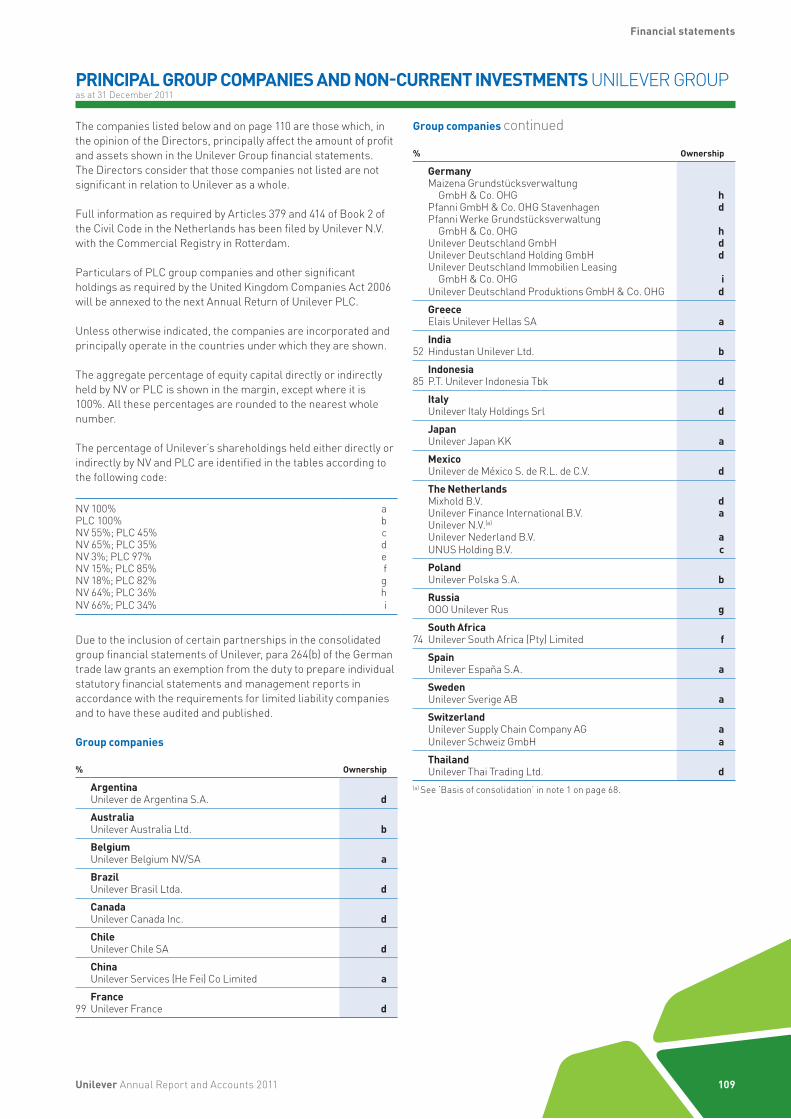
109
PRINCIPAL GROUP COMPANIES AND NON-CURRENT INVESTMENTS UNILEVER GROUP as at 31 December 2011
The companies listed below and on page 110 are those which, in the opinion of the Directors, principally affect the amount of profit and assets shown in the Unilever Group financial statements. The Directors consider that those companies not listed are not significant in relation to Unilever as a whole.
Full information as required by Articles 379 and 414 of Book 2 of the Civil Code in the Netherlands has been filed by Unilever N.V. with the Commercial Registry in Rotterdam.
Particulars of PLC group companies and other significant holdings as required by the United Kingdom Companies Act 2006 will be annexed to the next Annual Return of Unilever PLC.
Unless otherwise indicated, the companies are incorporated and principally operate in the countries under which they are shown.
The aggregate percentage of equity capital directly or indirectly held by NV or PLC is shown in the margin, except where it is 100%. All these percentages are rounded to the nearest whole number.
The percentage of Unilever’s shareholdings held either directly or indirectly by NV and PLC are identified in the tables according to the following code:
NV 100% aPLC 100% bNV 55%; PLC 45% cNV 65%; PLC 35% dNV 3%; PLC 97% eNV 15%; PLC 85% fNV 18%; PLC 82% gNV 64%; PLC 36% hNV 66%; PLC 34% i
Due to the inclusion of certain partnerships in the consolidated group financial statements of Unilever, para 264(b) of the German trade law grants an exemption from the duty to prepare individual statutory financial statements and management reports in accordance with the requirements for limited liability companies and to have these audited and published.
Group companies
% Ownership
ArgentinaUnilever de Argentina S.A. dAustraliaUnilever Australia Ltd. bBelgiumUnilever Belgium NV/SA aBrazilUnilever Brasil Ltda. dCanadaUnilever Canada Inc. dChileUnilever Chile SA dChinaUnilever Services (He Fei) Co Limited a
99FranceUnilever France d
Group companies continued
% Ownership
GermanyMaizena Grundstücksverwaltung
GmbH & Co. OHG hPfanni GmbH & Co. OHG Stavenhagen dPfanni Werke Grundstücksverwaltung
GmbH & Co. OHG hUnilever Deutschland GmbH dUnilever Deutschland Holding GmbH dUnilever Deutschland Immobilien Leasing
GmbH & Co. OHG iUnilever Deutschland Produktions GmbH & Co. OHG dGreeceElais Unilever Hellas SA a
52IndiaHindustan Unilever Ltd. b
85IndonesiaP.T. Unilever Indonesia Tbk dItalyUnilever Italy Holdings Srl dJapanUnilever Japan KK aMexicoUnilever de México S. de R.L. de C.V. dThe NetherlandsMixhold B.V. dUnilever Finance International B.V. aUnilever N.V.(a) Unilever Nederland B.V. aUNUS Holding B.V. cPolandUnilever Polska S.A. bRussiaOOO Unilever Rus g
74South AfricaUnilever South Africa (Pty) Limited fSpain Unilever España S.A. aSwedenUnilever Sverige AB aSwitzerland Unilever Supply Chain Company AG aUnilever Schweiz GmbH aThailandUnilever Thai Trading Ltd. d
(a) See ‘Basis of consolidation’ in note 1 on page 68.
Unilever Annual Report and Accounts 2011
Financial statements

110
PRINCIPAL GROUP COMPANIES AND NON-CURRENT INVESTMENTS UNILEVER GROUP as at 31 December 2011 continued
Group companies continued
% Ownership
Turkey Unilever Sanayi ve Ticaret Türk A.S,. dUnited Kingdom Unilever UK Ltd. eUnilever PLC(a) Unilever UK Holdings Ltd. bUnilever UK & CN Holdings Ltd. eUnited States of America Alberto – Culver USA, Inc. cConopco, Inc. cUnilever Capital Corporation cUnilever United States, Inc. c
(a) See ‘Basis of consolidation’ in note 1 on page 68.
Joint ventures
% Ownership
55PortugalUnilever Jerónimo Martins, Lda b
50United States of America Pepsi/Lipton Partnership c
Associates
% Ownership
40United Kingdom Langholm Capital Partners L.P. b
In addition, we have revenues either from our own operations or otherwise in the following locations: Albania, Algeria, Andorra, Angola, Antigua, Armenia, Austria, Azerbaijan, Bahamas, Bahrain, Bangladesh, Barbados, Belarus, Belize, Benin, Bhutan, Bolivia, Bosnia and Herzegovina, Botswana, Brunei, Bulgaria, Burkina Faso, Burundi, Cambodia, Cameroon, Cape Verde, Central African Republic, Chad, Colombia, Comoros, Congo, Costa Rica, Côte d’Ivoire, Croatia, Cuba, Cyprus, Czech Republic, Democratic Republic of Congo, Denmark, Djibouti, Dominica, Dominican Republic, Ecuador, Egypt, El Salvador, Equatorial Guinea, Eritrea, Estonia, Ethiopia, Fiji, Finland, Gabon, Gambia, Georgia, Ghana, Grenada, Guadeloupe, Guatemala, Guinea, Guinea-Bissau, Guyana, Haiti, Honduras, Hong Kong, Hungary, Iceland, Iran, Iraq, Ireland, Israel, Jamaica, Jordan, Kazakhstan, Kenya, Kiribati, Kuwait, Kyrgyzstan, Lao People’s Democratic Republic, Latvia, Lebanon, Lesotho, Liberia, Libya, Leichtenstein, Lithuania, Luxembourg, Macao, Macedonia, Madagascar, Malawi, Malaysia, Mali, Malta, Marshall Islands, Martinique, Mauritania, Mauritius, Micronesia (federated States Of), Moldova (Republic of), Monaco, Mongolia, Montenegro, Morocco, Mozambique, Myanmar, Namibia, Nauru, Nepal, New Zealand, Nicaragua, Niger, Nigeria, Norway, Oman, Pakistan, Palua, Palestine, Panama, Papua New Guinea, Paraguay, Peru, Philippines, Portugal, Qatar, Réunion, Romania, Rwanda, Saint Kitts and Nevis, Saint Lucia, Saint Vincent and the Grenadines, Samoa, San Marino, Saudi Arabia, Senegal, Serbia, Seychelles, Sierra Leone, Singapore, Slovakia, Slovenia, Solomon Islands, Somalia, South Korea, South Sudan, Sri Lanka, Sudan, Suriname, Swaziland, Syria, Taiwan, Tajikistan, Tanzania, Timor-Leste, Togo, Tonga, Trinidad & Tobago, Tunisia, Turkmenistan, Tuvalu, Uganda, Ukraine, United Arab Emirates, Uruguay, Uzbekistan, Vanuatu, Venezuela, Vietnam, Yemen, Zambia and Zimbabwe.
Unilever Annual Report and Accounts 2011
Financial statements

111
COMPANY ACCOUNTS AUDITOR’S REPORT – UNILEVER N.V.
Independent auditor’s report
To: the General Meeting of Shareholders of Unilever N.V.
Report on the company accountsWe have audited the accompanying company accounts 2011 as set out on pages 112 to 115 of the Annual Report and Accounts 2011 of Unilever N.V., Rotterdam, which comprise the balance sheet as at 31 December 2011, the profit and loss account for the year then ended and the notes, comprising a summary of accounting policies and other explanatory information.
Directors’ responsibilityThe Directors are responsible for the preparation and fair presentation of these company accounts in accordance with United Kingdom accounting standards and with Part 9 of Book 2 of the Dutch Civil Code and for the preparation of the Report of the Directors in accordance with Part 9 of Book 2 of the Dutch Civil Code. Furthermore, the Directors are responsible for such internal control as they determine is necessary to enable the preparation of the company accounts that are free from material misstatement, whether due to fraud or error.
Auditor’s responsibilityOur responsibility is to express an opinion on these company accounts based on our audit. We conducted our audit in accordance with Dutch law, including the Dutch Standards on Auditing. This requires that we comply with ethical requirements and plan and perform the audit to obtain reasonable assurance about whether the company accounts are free from material misstatement.
An audit involves performing procedures to obtain audit evidence about the amounts and disclosures in the company accounts. The procedures selected depend on the auditor’s judgement, including the assessment of the risks of material misstatement of the company accounts, whether due to fraud or error. In making those risk assessments, the auditor considers internal control relevant to the company’s preparation and fair presentation of the company accounts in order to design audit procedures that are appropriate in the circumstances, but not for the purpose of expressing an opinion on the effectiveness of the company’s internal control. An audit also includes evaluating the appropriateness of accounting policies used and the reasonableness of accounting estimates made by the Directors, as well as evaluating the overall presentation of the company accounts.
We believe that the audit evidence we have obtained is sufficient and appropriate to provide a basis for our audit opinion.
Opinion with respect to the company accountsIn our opinion, the company accounts give a true and fair view of the financial position of Unilever N.V. as at 31 December 2011, and of its result for the year then ended in accordance with United Kingdom accounting standards and with Part 9 of Book 2 of the Dutch Civil Code.
Separate report on consolidated financial statementsWe have reported separately on the consolidated financial statements of Unilever Group for the year ended 31 December 2011.
Report on other legal and regulatory requirementsPursuant to the legal requirement under Section 2: 393 sub 5 at e and f of the Dutch Civil Code, we have no deficiencies to report as a result of our examination whether the Report of the Directors, to the extent we can assess, has been prepared in accordance with Part 9 of Book 2 of this Code, and whether the information as required under Section 2: 392 sub 1 at b-h has been annexed. Further we report that the Report of the Directors, to the extent we can assess, is consistent with the company accounts as required by Section 2: 391 sub 4 of the Dutch Civil Code.
Amsterdam, 28 February 2012PricewaterhouseCoopers Accountants N.V.
R A J Swaak RA
Unilever Annual Report and Accounts 2011
Financial statements
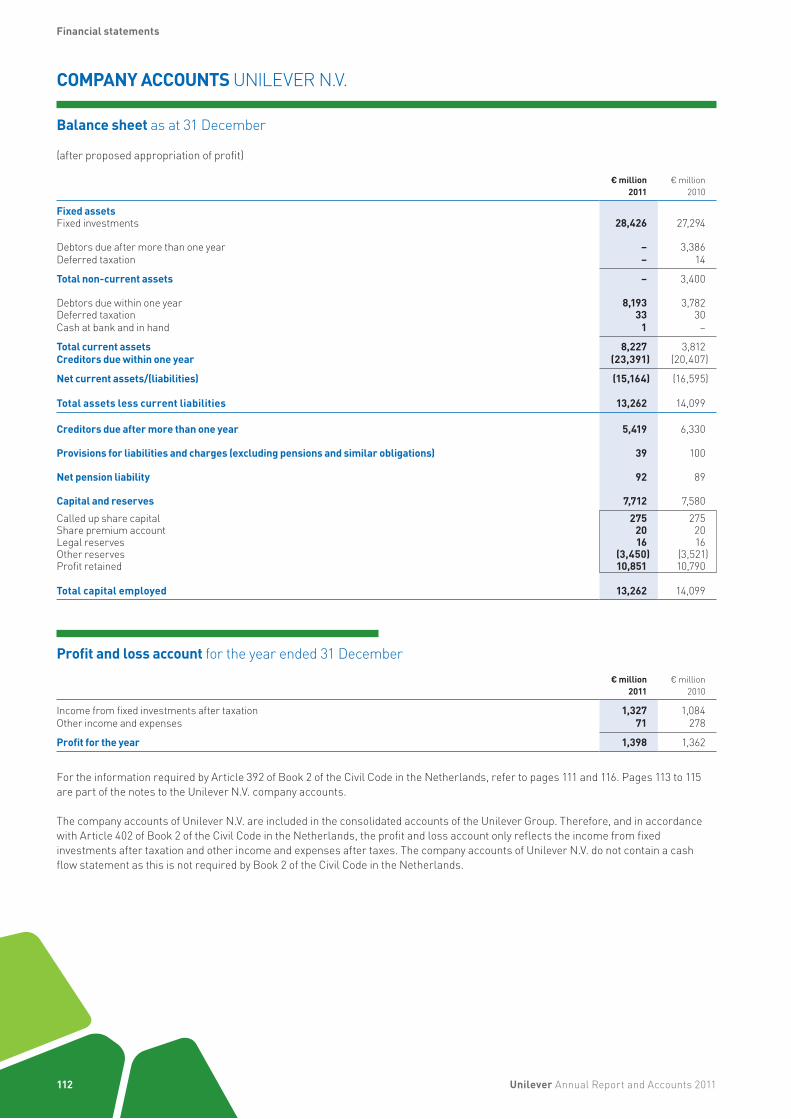
112
COMPANY ACCOUNTS UNILEVER N.V.
Balance sheet as at 31 December
(after proposed appropriation of profit)
€ million2011
€ million2010
Fixed assetsFixed investments 28,426 27,294
Debtors due after more than one year – 3,386Deferred taxation – 14
Total non-current assets – 3,400
Debtors due within one year 8,193 3,782Deferred taxation 33 30Cash at bank and in hand 1 –
Total current assets 8,227 3,812Creditors due within one year (23,391) (20,407)
Net current assets/(liabilities) (15,164) (16,595)
Total assets less current liabilities 13,262 14,099
Creditors due after more than one year 5,419 6,330
Provisions for liabilities and charges (excluding pensions and similar obligations) 39 100
Net pension liability 92 89
Capital and reserves 7,712 7,580Called up share capital 275 275Share premium account 20 20Legal reserves 16 16Other reserves (3,450) (3,521)Profit retained 10,851 10,790
Total capital employed 13,262 14,099
Profit and loss account for the year ended 31 December
€ million2011
€ million2010
Income from fixed investments after taxation 1,327 1,084Other income and expenses 71 278
Profit for the year 1,398 1,362
For the information required by Article 392 of Book 2 of the Civil Code in the Netherlands, refer to pages 111 and 116. Pages 113 to 115 are part of the notes to the Unilever N.V. company accounts.
The company accounts of Unilever N.V. are included in the consolidated accounts of the Unilever Group. Therefore, and in accordance with Article 402 of Book 2 of the Civil Code in the Netherlands, the profit and loss account only reflects the income from fixed investments after taxation and other income and expenses after taxes. The company accounts of Unilever N.V. do not contain a cash flow statement as this is not required by Book 2 of the Civil Code in the Netherlands.
Unilever Annual Report and Accounts 2011
Financial statements
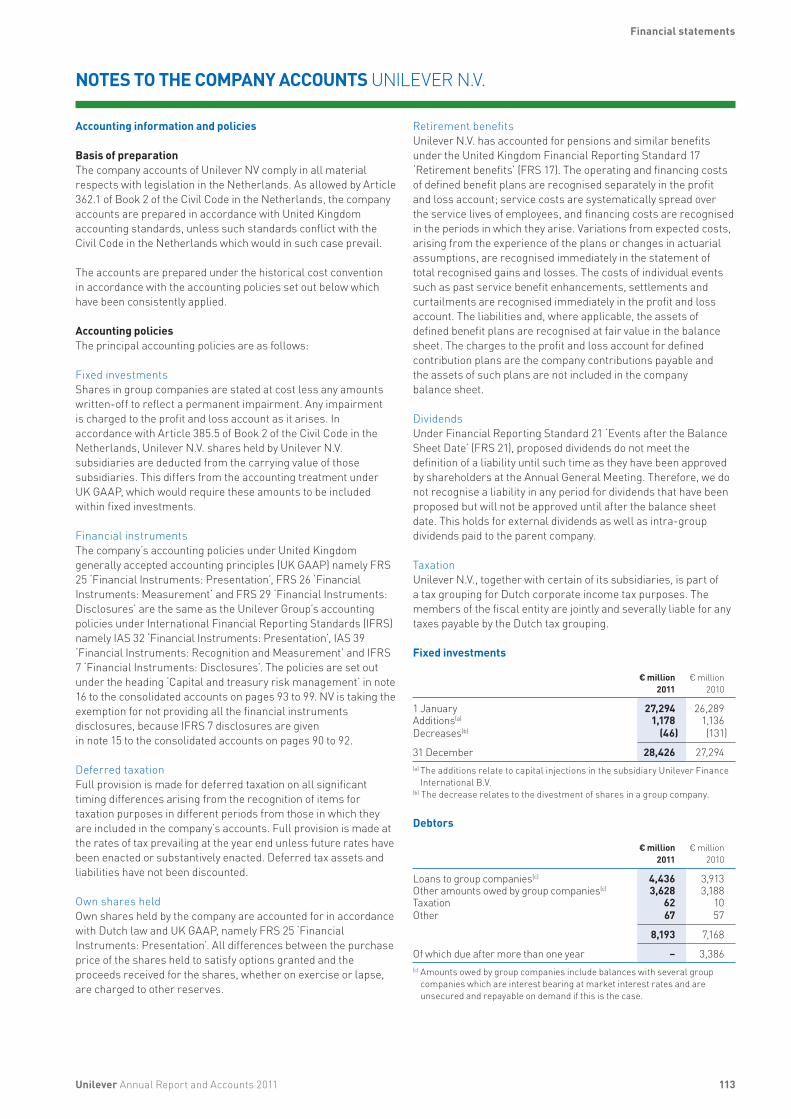
113
NOTES TO THE COMPANY ACCOUNTS UNILEVER N.V.
Accounting information and policies
Basis of preparationThe company accounts of Unilever NV comply in all material respects with legislation in the Netherlands. As allowed by Article 362.1 of Book 2 of the Civil Code in the Netherlands, the company accounts are prepared in accordance with United Kingdom accounting standards, unless such standards conflict with the Civil Code in the Netherlands which would in such case prevail.
The accounts are prepared under the historical cost convention in accordance with the accounting policies set out below which have been consistently applied.
Accounting policiesThe principal accounting policies are as follows:
Fixed investmentsShares in group companies are stated at cost less any amounts written-off to reflect a permanent impairment. Any impairment is charged to the profit and loss account as it arises. In accordance with Article 385.5 of Book 2 of the Civil Code in the Netherlands, Unilever N.V. shares held by Unilever N.V. subsidiaries are deducted from the carrying value of those subsidiaries. This differs from the accounting treatment under UK GAAP, which would require these amounts to be included within fixed investments.
Financial instrumentsThe company’s accounting policies under United Kingdom generally accepted accounting principles (UK GAAP) namely FRS 25 ‘Financial Instruments: Presentation’, FRS 26 ‘Financial Instruments: Measurement’ and FRS 29 ‘Financial Instruments: Disclosures’ are the same as the Unilever Group’s accounting policies under International Financial Reporting Standards (IFRS) namely IAS 32 ‘Financial Instruments: Presentation’, IAS 39 ‘Financial Instruments: Recognition and Measurement’ and IFRS 7 ‘Financial Instruments: Disclosures’. The policies are set out under the heading ‘Capital and treasury risk management’ in note 16 to the consolidated accounts on pages 93 to 99. NV is taking the exemption for not providing all the financial instruments disclosures, because IFRS 7 disclosures are given in note 15 to the consolidated accounts on pages 90 to 92.
Deferred taxationFull provision is made for deferred taxation on all significant timing differences arising from the recognition of items for taxation purposes in different periods from those in which they are included in the company’s accounts. Full provision is made at the rates of tax prevailing at the year end unless future rates have been enacted or substantively enacted. Deferred tax assets and liabilities have not been discounted.
Own shares held Own shares held by the company are accounted for in accordance with Dutch law and UK GAAP, namely FRS 25 ‘Financial Instruments: Presentation’. All differences between the purchase price of the shares held to satisfy options granted and the proceeds received for the shares, whether on exercise or lapse, are charged to other reserves.
Retirement benefitsUnilever N.V. has accounted for pensions and similar benefits under the United Kingdom Financial Reporting Standard 17 ‘Retirement benefits’ (FRS 17). The operating and financing costs of defined benefit plans are recognised separately in the profit and loss account; service costs are systematically spread over the service lives of employees, and financing costs are recognised in the periods in which they arise. Variations from expected costs, arising from the experience of the plans or changes in actuarial assumptions, are recognised immediately in the statement of total recognised gains and losses. The costs of individual events such as past service benefit enhancements, settlements and curtailments are recognised immediately in the profit and loss account. The liabilities and, where applicable, the assets of defined benefit plans are recognised at fair value in the balance sheet. The charges to the profit and loss account for defined contribution plans are the company contributions payable and the assets of such plans are not included in the company balance sheet.
DividendsUnder Financial Reporting Standard 21 ‘Events after the Balance Sheet Date’ (FRS 21), proposed dividends do not meet the definition of a liability until such time as they have been approved by shareholders at the Annual General Meeting. Therefore, we do not recognise a liability in any period for dividends that have been proposed but will not be approved until after the balance sheet date. This holds for external dividends as well as intra-group dividends paid to the parent company.
TaxationUnilever N.V., together with certain of its subsidiaries, is part of a tax grouping for Dutch corporate income tax purposes. The members of the fiscal entity are jointly and severally liable for any taxes payable by the Dutch tax grouping.
Fixed investments
€ million
2011€ million
2010
1 January 27,294 26,289Additions(a) 1,178 1,136Decreases(b) (46) (131)
31 December 28,426 27,294(a) The additions relate to capital injections in the subsidiary Unilever Finance
International B.V.(b) The decrease relates to the divestment of shares in a group company.
Debtors
€ million
2011€ million
2010
Loans to group companies(c) 4,436 3,913Other amounts owed by group companies(c) 3,628 3,188Taxation 62 10Other 67 57
8,193 7,168
Of which due after more than one year – 3,386(c) Amounts owed by group companies include balances with several group
companies which are interest bearing at market interest rates and are unsecured and repayable on demand if this is the case.
Unilever Annual Report and Accounts 2011
Financial statements
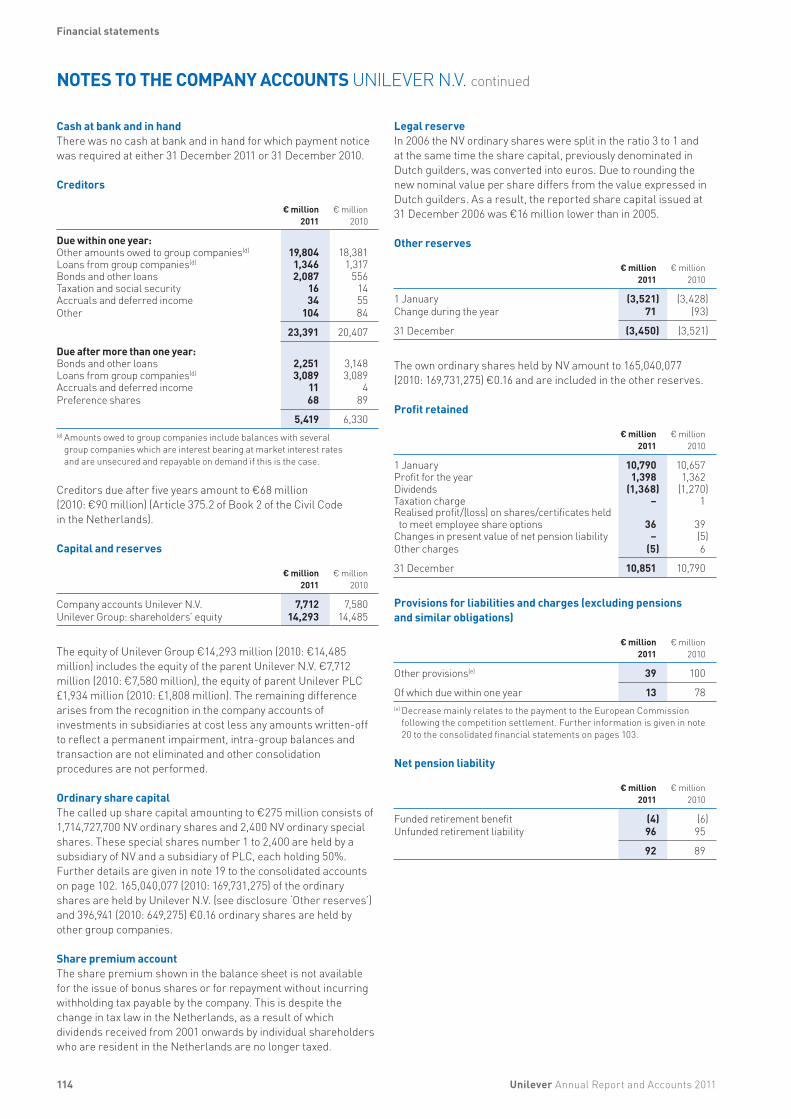
114
NOTES TO THE COMPANY ACCOUNTS UNILEVER N.V. continued
Cash at bank and in handThere was no cash at bank and in hand for which payment notice was required at either 31 December 2011 or 31 December 2010.
Creditors
€ million
2011€ million
2010
Due within one year:Other amounts owed to group companies(d) 19,804 18,381Loans from group companies(d) 1,346 1,317Bonds and other loans 2,087 556Taxation and social security 16 14Accruals and deferred income 34 55Other 104 84
23,391 20,407
Due after more than one year:Bonds and other loans 2,251 3,148Loans from group companies(d) 3,089 3,089Accruals and deferred income 11 4Preference shares 68 89
5,419 6,330(d) Amounts owed to group companies include balances with several
group companies which are interest bearing at market interest rates and are unsecured and repayable on demand if this is the case.
Creditors due after five years amount to €68 million (2010: €90 million) (Article 375.2 of Book 2 of the Civil Code in the Netherlands).
Capital and reserves
€ million
2011€ million
2010
Company accounts Unilever N.V. 7,712 7,580Unilever Group: shareholders’ equity 14,293 14,485
The equity of Unilever Group €14,293 million (2010: €14,485 million) includes the equity of the parent Unilever N.V. €7,712 million (2010: €7,580 million), the equity of parent Unilever PLC £1,934 million (2010: £1,808 million). The remaining difference arises from the recognition in the company accounts of investments in subsidiaries at cost less any amounts written-off to reflect a permanent impairment, intra-group balances and transaction are not eliminated and other consolidation procedures are not performed.
Ordinary share capitalThe called up share capital amounting to €275 million consists of 1,714,727,700 NV ordinary shares and 2,400 NV ordinary special shares. These special shares number 1 to 2,400 are held by a subsidiary of NV and a subsidiary of PLC, each holding 50%. Further details are given in note 19 to the consolidated accounts on page 102. 165,040,077 (2010: 169,731,275) of the ordinary shares are held by Unilever N.V. (see disclosure ‘Other reserves’) and 396,941 (2010: 649,275) €0.16 ordinary shares are held by other group companies.
Share premium accountThe share premium shown in the balance sheet is not available for the issue of bonus shares or for repayment without incurring withholding tax payable by the company. This is despite the change in tax law in the Netherlands, as a result of which dividends received from 2001 onwards by individual shareholders who are resident in the Netherlands are no longer taxed.
Unilever Annual Report and Accounts 2011
Financial statements
Legal reserveIn 2006 the NV ordinary shares were split in the ratio 3 to 1 and at the same time the share capital, previously denominated in Dutch guilders, was converted into euros. Due to rounding the new nominal value per share differs from the value expressed in Dutch guilders. As a result, the reported share capital issued at 31 December 2006 was €16 million lower than in 2005.
Other reserves
€ million
2011€ million
2010
1 January (3,521) (3,428)Change during the year 71 (93)
31 December (3,450) (3,521)
The own ordinary shares held by NV amount to 165,040,077 (2010: 169,731,275) €0.16 and are included in the other reserves.
Profit retained
€ million
2011€ million
2010
1 January 10,790 10,657Profit for the year 1,398 1,362Dividends (1,368) (1,270)Taxation charge – 1Realised profit/(loss) on shares/certificates held to meet employee share options 36 39
Changes in present value of net pension liability – (5)Other charges (5) 6
31 December 10,851 10,790
Provisions for liabilities and charges (excluding pensions and similar obligations)
€ million2011
€ million2010
Other provisions(e) 39 100
Of which due within one year 13 78(e) Decrease mainly relates to the payment to the European Commission
following the competition settlement. Further information is given in note 20 to the consolidated financial statements on pages 103.
Net pension liability
€ million2011
€ million2010
Funded retirement benefit (4) (6)Unfunded retirement liability 96 95
92 89
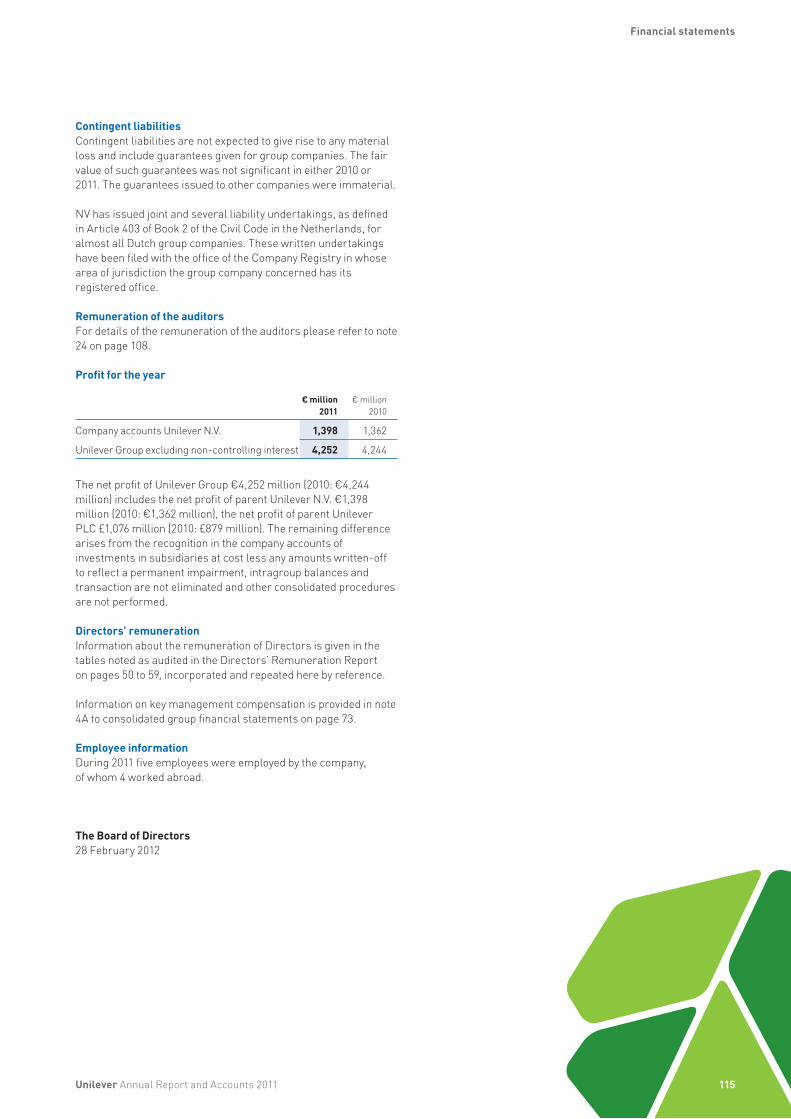
115
Contingent liabilitiesContingent liabilities are not expected to give rise to any material loss and include guarantees given for group companies. The fair value of such guarantees was not significant in either 2010 or 2011. The guarantees issued to other companies were immaterial.
NV has issued joint and several liability undertakings, as defined in Article 403 of Book 2 of the Civil Code in the Netherlands, for almost all Dutch group companies. These written undertakings have been filed with the office of the Company Registry in whose area of jurisdiction the group company concerned has its registered office.
Remuneration of the auditorsFor details of the remuneration of the auditors please refer to note 24 on page 108.
Profit for the year
€ million2011
€ million2010
Company accounts Unilever N.V. 1,398 1,362
Unilever Group excluding non-controlling interest 4,252 4,244
The net profit of Unilever Group €4,252 million (2010: €4,244 million) includes the net profit of parent Unilever N.V. €1,398 million (2010: €1,362 million), the net profit of parent Unilever PLC £1,076 million (2010: £879 million). The remaining difference arises from the recognition in the company accounts of investments in subsidiaries at cost less any amounts written-off to reflect a permanent impairment, intragroup balances and transaction are not eliminated and other consolidated procedures are not performed.
Directors’ remunerationInformation about the remuneration of Directors is given in the tables noted as audited in the Directors’ Remuneration Report on pages 50 to 59, incorporated and repeated here by reference.
Information on key management compensation is provided in note 4A to consolidated group financial statements on page 73.
Employee informationDuring 2011 five employees were employed by the company, of whom 4 worked abroad.
The Board of Directors28 February 2012
Unilever Annual Report and Accounts 2011
Financial statements
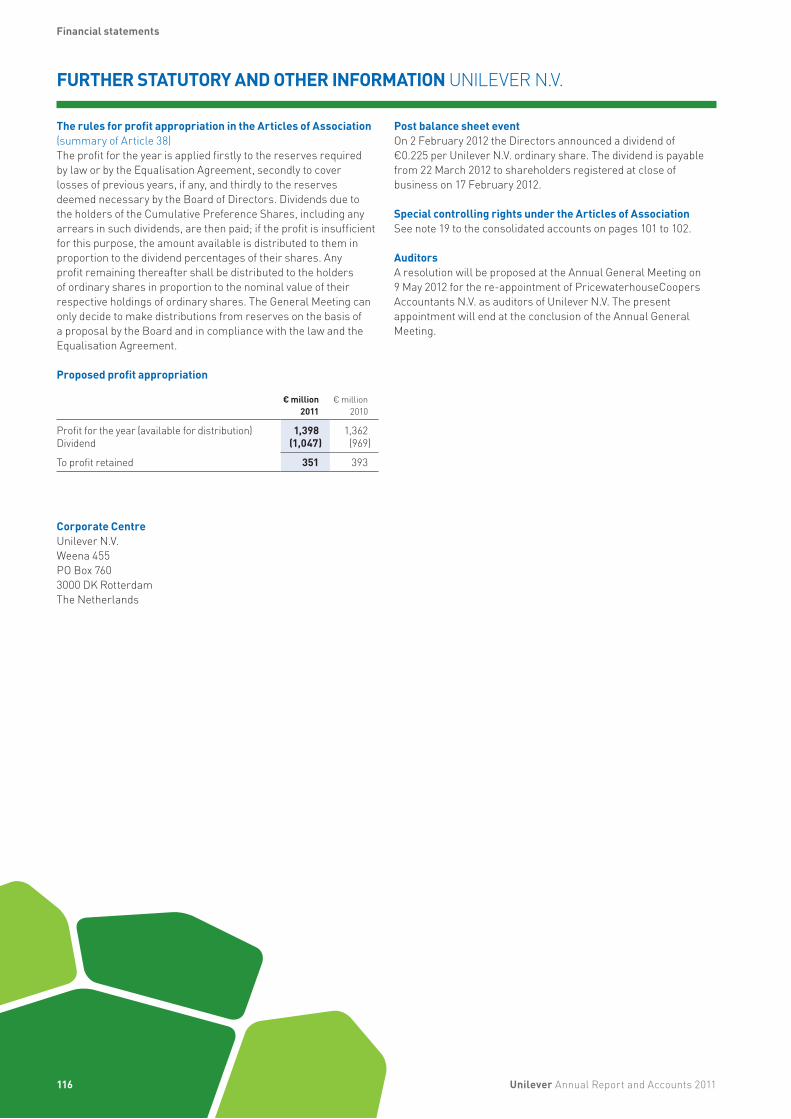
116 Unilever Annual Report and Accounts 2011
Financial statements
FURTHER STATUTORY AND OTHER INFORMATION UNILEVER N.V.
The rules for profit appropriation in the Articles of Association (summary of Article 38)The profit for the year is applied firstly to the reserves required by law or by the Equalisation Agreement, secondly to cover losses of previous years, if any, and thirdly to the reserves deemed necessary by the Board of Directors. Dividends due to the holders of the Cumulative Preference Shares, including any arrears in such dividends, are then paid; if the profit is insufficient for this purpose, the amount available is distributed to them in proportion to the dividend percentages of their shares. Any profit remaining thereafter shall be distributed to the holders of ordinary shares in proportion to the nominal value of their respective holdings of ordinary shares. The General Meeting can only decide to make distributions from reserves on the basis of a proposal by the Board and in compliance with the law and the Equalisation Agreement.
Proposed profit appropriation
€ million2011
€ million2010
Profit for the year (available for distribution) 1,398 1,362Dividend (1,047) (969)
To profit retained 351 393
Post balance sheet eventOn 2 February 2012 the Directors announced a dividend of €0.225 per Unilever N.V. ordinary share. The dividend is payable from 22 March 2012 to shareholders registered at close of business on 17 February 2012.
Special controlling rights under the Articles of AssociationSee note 19 to the consolidated accounts on pages 101 to 102.
AuditorsA resolution will be proposed at the Annual General Meeting on 9 May 2012 for the re-appointment of PricewaterhouseCoopers Accountants N.V. as auditors of Unilever N.V. The present appointment will end at the conclusion of the Annual General Meeting.
Corporate CentreUnilever N.V.Weena 455PO Box 7603000 DK RotterdamThe Netherlands

117
COMPANY ACCOUNTS AUDITOR’S REPORT – UNILEVER PLC
Independent auditor’s report to the members of Unilever PLCWe have audited the parent company financial statements of Unilever PLC for the year ended 31 December 2011 which comprise the balance sheet and the related notes on pages 118 to 120. The financial reporting framework that has been applied in their preparation is applicable law and United Kingdom Accounting Standards (United Kingdom Generally Accepted Accounting Practice).
Respective responsibilities of Directors and auditors As explained more fully in the Statement of Directors’ responsibilities set out on page 61, the Directors are responsible for the preparation of the parent company financial statements and for being satisfied that they give a true and fair view. Our responsibility is to audit and express an opinion on the parent company financial statements in accordance with applicable law and International Standards on Auditing (UK and Ireland). Those standards require us to comply with the Auditing Practices Board’s Ethical Standards for Auditors.
This report, including the opinions, has been prepared for and only for the parent company’s members as a body in accordance with Chapter 3 of Part 16 of the Companies Act 2006 and for no other purpose. We do not, in giving these opinions, accept or assume responsibility for any other purpose or to any other person to whom this report is shown or into whose hands it may come save where expressly agreed by our prior consent in writing.
Scope of the audit of the financial statementsAn audit involves obtaining evidence about the amounts and disclosures in the financial statements sufficient to give reasonable assurance that the parent company financial statements are free from material misstatement, whether caused by fraud or error. This includes an assessment of: whether the accounting policies are appropriate to the parent company’s circumstances and have been consistently applied and adequately disclosed; the reasonableness of significant accounting estimates made by the Directors; and the overall presentation of the parent company financial statements. In addition, we read all the financial and non-financial information in the Annual Report and Accounts 2011 to identify material inconsistencies with the audited financial statements. If we become aware of any apparent material misstatements or inconsistencies we consider the implications for our report.
Opinion on financial statements In our opinion the parent company financial statements: • give a true and fair view of the state of the parent company’s
affairs as at 31 December 2011;• have been properly prepared in accordance with United
Kingdom Generally Accepted Accounting Practice; and • have been prepared in accordance with the requirements of
the Companies Act 2006.
Opinion on other matters prescribed by the Companies Act 2006 In our opinion: • the part of the Directors’ Remuneration Report to be audited
has been properly prepared in accordance with the Companies Act 2006; and
• the information given in the Directors’ Report set out on pages 121 and 122 for the financial year for which the parent company financial statements are prepared is consistent with the parent company financial statements.
Unilever Annual Report and Accounts 2011
Financial statements
Matters on which we are required to report by exception We have nothing to report in respect of the following matters where the Companies Act 2006 requires us to report to you if, in our opinion: • adequate accounting records have not been kept by the parent
company, or returns adequate for our audit have not been received from branches not visited by us; or
• the parent company financial statements and the part of the Directors’ Remuneration Report to be audited are not in agreement with the accounting records and returns; or
• certain disclosures of Directors’ remuneration specified by law are not made; or
• we have not received all the information and explanations we require for our audit.
Other matters We have reported separately on the group financial statements of Unilever Group for the year ended 31 December 2011.
John Baker(Senior Statutory Auditor)For and on behalf of PricewaterhouseCoopers LLPChartered Accountants and Statutory AuditorsLondon, United Kingdom28 February 2012
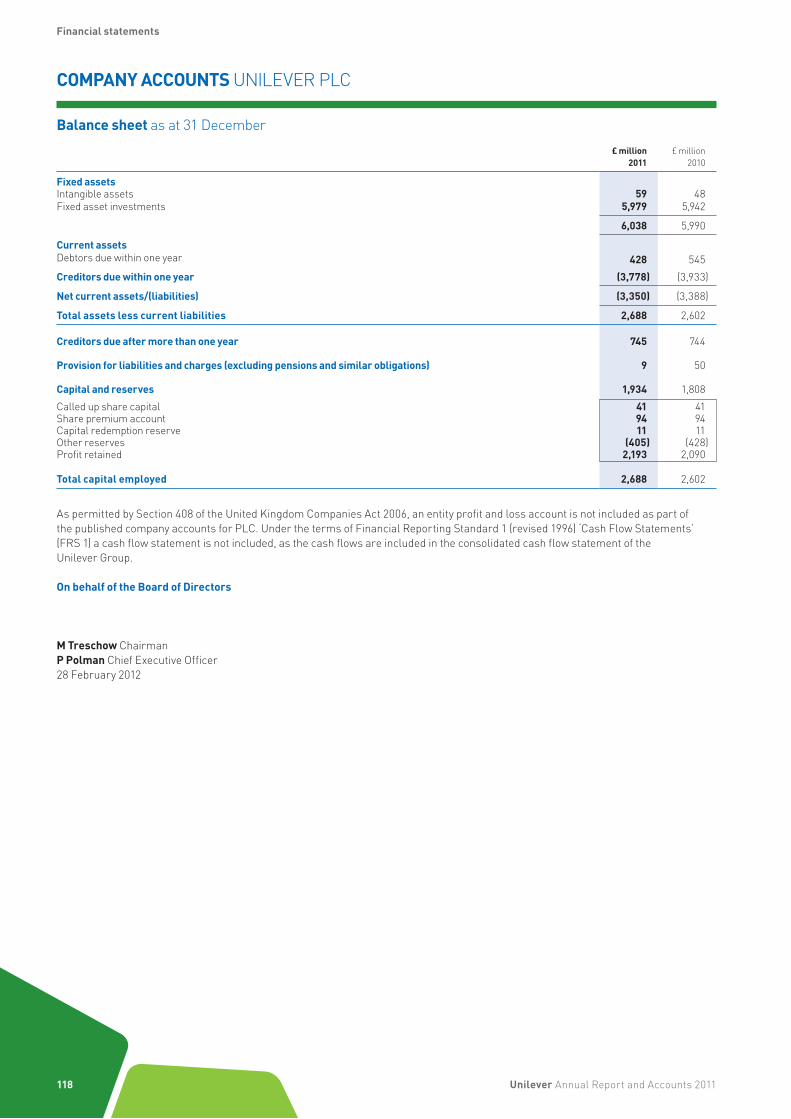
118
COMPANY ACCOUNTS UNILEVER PLC
Balance sheet as at 31 December
£ million2011
£ million2010
Fixed assetsIntangible assets 59 48Fixed asset investments 5,979 5,942
6,038 5,990
Current assetsDebtors due within one year 428 545Creditors due within one year (3,778) (3,933)
Net current assets/(liabilities) (3,350) (3,388)
Total assets less current liabilities 2,688 2,602
Creditors due after more than one year 745 744
Provision for liabilities and charges (excluding pensions and similar obligations) 9 50
Capital and reserves 1,934 1,808Called up share capital 41 41Share premium account 94 94Capital redemption reserve 11 11Other reserves (405) (428)Profit retained 2,193 2,090
Total capital employed 2,688 2,602
As permitted by Section 408 of the United Kingdom Companies Act 2006, an entity profit and loss account is not included as part of the published company accounts for PLC. Under the terms of Financial Reporting Standard 1 (revised 1996) ‘Cash Flow Statements’ (FRS 1) a cash flow statement is not included, as the cash flows are included in the consolidated cash flow statement of the Unilever Group.
On behalf of the Board of Directors
M Treschow ChairmanP Polman Chief Executive Officer28 February 2012
Unilever Annual Report and Accounts 2011
Financial statements

119
NOTES TO THE COMPANY ACCOUNTS UNILEVER PLC
Accounting information and policies
Basis of preparationThe accounts have been prepared in accordance with applicable United Kingdom accounting standards and the United Kingdom Companies Act 2006.
The accounts are prepared under the historical cost convention except for the revaluation of financial assets classified as ‘available-for-sale investments’ or ‘fair value through profit or loss’, and ‘derivative financial instruments’ in accordance with the accounting policies set out below which have been consistently applied.
Accounting policiesThe principal accounting policies are as follows:
Intangible assetsIntangible assets comprise trademarks purchased after 1 January 1998 and are amortised in the profit and loss account over their expected useful lives of up to a maximum of 20 years. These assets are held at cost less accumulated amortisation. They are subject to review for impairment in accordance with United Kingdom Financial Reporting Standard 11 ‘Impairment of Fixed Assets and Goodwill’ (FRS 11). Any impairment is charged to the profit and loss account as it arises.
Fixed investmentsShares in group companies are stated at cost less any amounts written-off to reflect a permanent impairment. Any impairment is charged to the profit and loss account as it arises.
Financial instruments The company’s accounting policies under United Kingdom generally accepted accounting principles (UK GAAP), namely FRS 25 ‘Financial Instruments: Presentation’, FRS 26 ‘Financial Instruments: Measurement’ and FRS 29 ‘Financial Instruments: Disclosures’, are the same as the Unilever Group’s accounting policies under International Financial Reporting Standards (IFRS) namely IAS 32 ‘Financial Instruments: Presentation’, IAS 39 ‘Financial Instruments: Recognition and Measurement’ and IFRS 7 ‘Financial Instruments: Disclosures’. The policies are set out under the heading ‘Capital and treasury risk management’ in note 16 to the consolidated accounts on pages 93 and 99. The company is taking the exemption for financial instruments disclosures, because IFRS 7 disclosures are given in note 15 to the consolidated accounts on pages 90 to 92.
Unilever Annual Report and Accounts 2011
Financial statements
Deferred taxationFull provision is made for deferred taxation on all significant timing differences arising from the recognition of items for taxation purposes in different periods from those in which they are included in the company’s accounts. Full provision is made at the rates of tax prevailing at the year end unless future rates have been enacted or substantively enacted. Deferred tax assets and liabilities have not been discounted.
Shares held by employee share trustsShares held to satisfy options are accounted for in accordance with UK GAAP, namely FRS 25 ‘Financial Instruments: Presentation’, FRS 20 ‘Share Based Payments’ and Urgent Issues Task Force abstract 38 ‘Accounting for ESOP Trusts’ (UITF 38). All differences between the purchase price of the shares held to satisfy options granted and the proceeds received for the shares, whether on exercise or lapse, are charged to other reserves.
DividendsUnder FRS 21 ‘Events after the Balance Sheet Date’, proposed dividends do not meet the definition of a liability until such time as they have been approved by shareholders at the Annual General Meeting. Therefore, we do not recognise a liability in any period for dividends that have been proposed but will not be approved until after the balance sheet date. This holds for external dividends as well as intra-group dividends paid to the parent company.
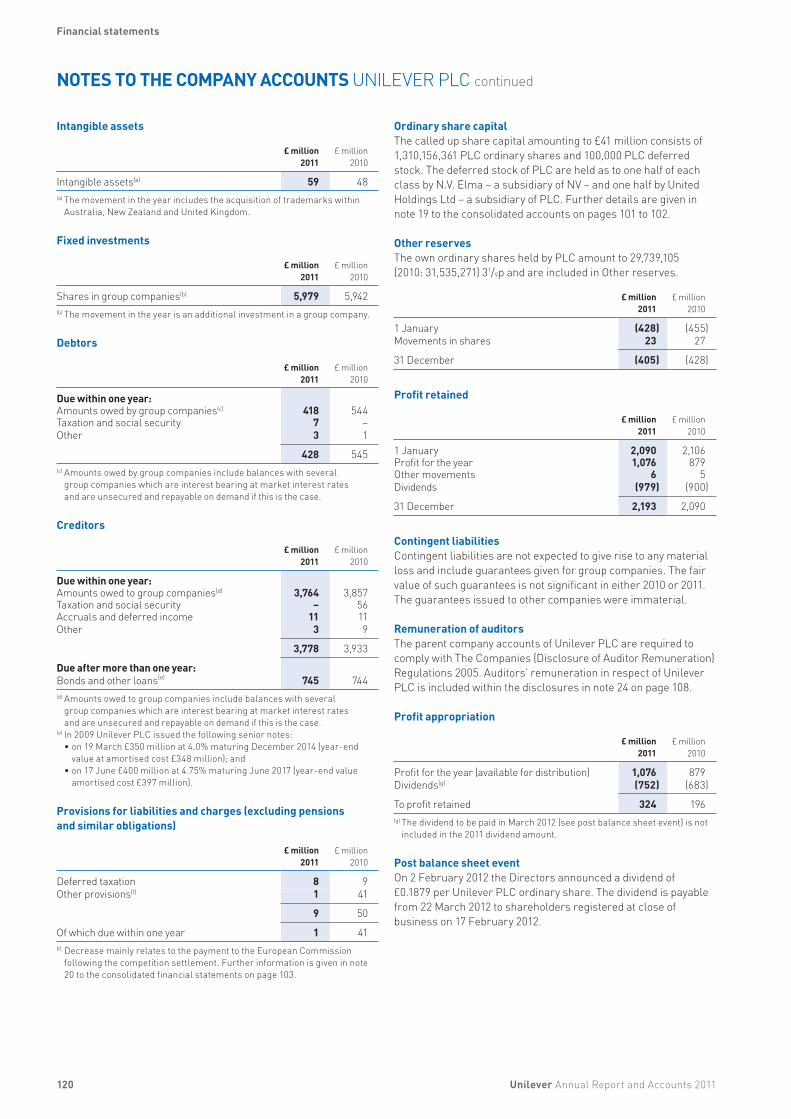
120
NOTES TO THE COMPANY ACCOUNTS UNILEVER PLC continued
Intangible assets
£ million2011
£ million2010
Intangible assets(a) 59 48(a) The movement in the year includes the acquisition of trademarks within
Australia, New Zealand and United Kingdom.
Fixed investments
£ million2011
£ million2010
Shares in group companies(b) 5,979 5,942(b) The movement in the year is an additional investment in a group company.
Debtors
£ million2011
£ million2010
Due within one year:Amounts owed by group companies(c) 418 544Taxation and social security 7 –Other 3 1
428 545(c) Amounts owed by group companies include balances with several
group companies which are interest bearing at market interest rates and are unsecured and repayable on demand if this is the case.
Creditors
£ million
2011£ million
2010
Due within one year:Amounts owed to group companies(d) 3,764 3,857Taxation and social security – 56Accruals and deferred income 11 11Other 3 9
3,778 3,933
Due after more than one year:Bonds and other loans(e) 745 744(d) Amounts owed to group companies include balances with several
group companies which are interest bearing at market interest rates and are unsecured and repayable on demand if this is the case.
(e) In 2009 Unilever PLC issued the following senior notes: • on 19 March £350 million at 4.0% maturing December 2014 (year-end
value at amortised cost £348 million); and • on 17 June £400 million at 4.75% maturing June 2017 (year-end value
amortised cost £397 million).
Provisions for liabilities and charges (excluding pensions and similar obligations)
Unilever Annual Report and Accounts 2011
Financial statements
£ million £ million2011 2010
Deferred taxation 8 9 Other provisions(f)
Of which due within one year
1 41
9 50
1 41(f) Decrease mainly relates to the payment to the European Commission
following the competition settlement. Further information is given in note 20 to the consolidated financial statements on page 103.
Ordinary share capitalThe called up share capital amounting to £41 million consists of 1,310,156,361 PLC ordinary shares and 100,000 PLC deferred stock. The deferred stock of PLC are held as to one half of each class by N.V. Elma – a subsidiary of NV – and one half by United Holdings Ltd – a subsidiary of PLC. Further details are given in note 19 to the consolidated accounts on pages 101 to 102.
Other reservesThe own ordinary shares held by PLC amount to 29,739,105 (2010: 31,535,271) 31/9p and are included in Other reserves.
£ million
2011£ million
2010
1 January (428) (455)Movements in shares 23 27
31 December (405) (428)
Profit retained
£ million
2011£ million
2010
1 January 2,090 2,106Profit for the year 1,076 879Other movements 6 5Dividends (979) (900)
31 December 2,193 2,090
Contingent liabilitiesContingent liabilities are not expected to give rise to any material loss and include guarantees given for group companies. The fair value of such guarantees is not significant in either 2010 or 2011. The guarantees issued to other companies were immaterial.
Remuneration of auditorsThe parent company accounts of Unilever PLC are required to comply with The Companies (Disclosure of Auditor Remuneration) Regulations 2005. Auditors’ remuneration in respect of Unilever PLC is included within the disclosures in note 24 on page 108.
Profit appropriation
£ million
2011£ million
2010
Profit for the year (available for distribution) 1,076 879Dividends(g) (752) (683)
To profit retained 324 196(g) The dividend to be paid in March 2012 (see post balance sheet event) is not
included in the 2011 dividend amount.
Post balance sheet eventOn 2 February 2012 the Directors announced a dividend of £0.1879 per Unilever PLC ordinary share. The dividend is payable from 22 March 2012 to shareholders registered at close of business on 17 February 2012.
121
FURTHER STATUTORY AND OTHER INFORMATION UNILEVER PLC
Directors’ Report of PLC and limitations of liabilityFor the purposes of the UK Companies Act 2006, the Directors’ Report of Unilever PLC for the year ended 31 December 2011 comprises this and the following page and the information contained in the Report of the Directors on pages 2 to 59 which includes the company’s position on environment and corporate responsibility matters, the Directors’ Remuneration Report in respect of Directors’ interests in shares or debentures of the Group on pages 57 and 59, Dividends on page 83, Principal group companies and non-current investments on pages 109 and 110, Significant shareholders of PLC as disclosed on page 124, and Capital and Treasury risk management on page 93 to 99. The information required to be given pursuant to Section 992 of the Companies Act 2006 is covered elsewhere in this Annual Report.
The Directors’ Report has been drawn up and presented in accordance with and in reliance upon English company law and liabilities of the Directors in connection with that report shall be subject to the limitations and restrictions provided by such law.
Under the Companies Act 2006, a safe harbour limits the liability of Directors in respect of statements in and omissions from the Directors’ Report. Under English Law the Directors would be liable to Unilever (but not to any third party) if the Directors’ Report contained errors as a result of recklessness or knowing misstatement or dishonest concealment of a material fact, but would not otherwise be liable.
Business reviewThe Companies Act 2006 requires Unilever PLC to set out in this report a fair review of the business of the Group during the financial year ended 31 December 2011 including a description of the principal risks and uncertainties facing the Group and an analysis of the position of the Group’s business at the end of the financial year, known as a ‘Business review’.
The information that fulfils the current Business review requirements can be found on the following pages of this Annual Report which are incorporated into this report by reference:• a description of the outlook of the Group and the principal risks
and uncertainties facing the Group – see pages 28 to 32;• the development and performance of the Group’s business
during the year – see pages 20 to 27;• the position of the Group’s business at the end of the
year – see pages 24 and 66;• key performance indicators – see pages 6, 21 to 23, 26 and 27;• other key indicators – see page 6;• main trends and factors likely to affect the future development,
performance and position of the Group – see page 28;• environmental matters and policy, including the impact of the
Group’s business on the environment – see pages 6 and 8 to 19;• employee matters and policy – see pages 18 and 19 and also
below; • social and community matters and policy–see pages 6 and 8 to
19;• a statement that the Directors do not believe that there are
any contracts or other arrangements which are essential to the business of the Group is given on page 43; and
• an explanation of the business model and the Group’s Strategy for delivering its objectives–see pages 8 and 9.
Employee involvement and communicationUnilever’s UK companies maintain formal processes to inform, consult and involve employees and their representatives. We recognise collective bargaining on a number of sites and engage with employees via the Sourcing Unit Forum including officer representation from the three recognised trade unions. Our sites use tools such as Total Productive Maintenance which rely heavily on employee involvement, contribution and commitment.
A National Consultative Council covering employees and management representatives exists to provide a forum for discussing issues relating to the United Kingdom. A European Works Council, embracing employee and management representatives from countries within Europe, has been in existence for several years and provides a forum for discussing issues that extend across national boundaries.
The company carries out regular and wide-ranging monitoring surveys providing valuable insight into employee views, attitudes and levels of engagement.
The Directors’ Reports of the United Kingdom group companies contain more details about how they have communicated with their employees during 2011.
Equal opportunities and diversityUnder the umbrella of our Code of Business Principles, Unilever aims to ensure that applications for employment from people with disabilities, and other under-represented groups, are given full and fair consideration and that such people are given the same training, development and prospects as other employees. Every effort is also made to retrain and support employees who become disabled while working within the Group.
Unilever continues to review ways in which greater diversity can be achieved in recruitment and selection. We have put in place policies which promote the achievement of diversity in our business and we review these regularly. For example, Unilever UK provides policies on home working, flexible working, maternity and paternity leave, child care provision and career breaks, which help us to meet the objective of greater employee diversity.
Charitable and other contributionsUnilever collates the cost of its community involvement activities using the London Benchmarking Group model. The model recommends the separation of charitable donations, community investment, commercial initiatives in the community and management costs relating to the programme of activity.
During 2011 UK group companies made a total contribution of £2.67 million, analysed as follows:• Charitable donations: £0.36 million• Community investment: £1.56 million• Commercial initiatives in the community: £0.75 million
No donation or contribution was made or expenditure incurred for political purposes.
Unilever Annual Report and Accounts 2011
Financial statements
122
FURTHER STATUTORY AND OTHER INFORMATION UNILEVER PLC continued
Supplier payment policiesIndividual operating companies are responsible for agreeing the terms and conditions under which business transactions with their suppliers are conducted. The Directors’ reports of the United Kingdom operating companies give information about their supplier payment policies as required by the Companies Act 2006. PLC, as a holding company, does not itself make any relevant payments in this respect.
Auditors and disclosure of information to auditorsA resolution will be proposed at the AGM on 9 May 2012 for the re-appointment of PricewaterhouseCoopers LLP as auditors of PLC. The present appointment will end at the conclusion of the AGM.
To the best of each of the Directors’ knowledge and belief, and having made appropriate enquiries of other officers of the Unilever Group, all information relevant to enabling the auditors to provide their opinions on PLC’s consolidated and parent company accounts has been provided. Each of the Directors has taken all reasonable steps to ensure their awareness of any relevant audit information and to establish that the company’s auditors are aware of any such information.
Authority to purchase own sharesAt the AGM of PLC held on 11 May 2011, authority was given to make market purchases of PLC ordinary shares of 31⁄9p each, to a maximum of 131 million shares. This authority will expire at the AGM on 9 May 2012, and a resolution will be proposed to renew the authority.
Details of shares purchased by an employee share trust and Unilever group companies to satisfy options granted under PLC’s employee share schemes are given in note 4 to the consolidated accounts on pages 79 and 80 and on page 124.
UK Capital Gains TaxThe market value of PLC 31/9p ordinary shares at 31 March 1982 would have been 76.84p per share. Since 1982, PLC ordinary shares have been sub-divided on two occasions and consolidated on two occasions. First, with effect on 26 June 1987, the 25p shares were split into five shares of 5p each. Secondly, with effect on 13 October 1997, the 5p shares were split into four shares of 1.25p each. Thirdly, with effect on 10 May 1999, the shares were consolidated by replacing every 112 shares of 1.25p each with 100 shares of 1.4p each. Lastly, with effect on 22 May 2006, the shares were consolidated by replacing every 20 shares of 1.4p each with nine shares of 31/9p each.
Corporate Centre Unilever PLC Registered OfficeUnilever PLC Port SunlightUnilever House Wirral100 Victoria Embankment Merseyside CH62 4ZDLondon EC4Y 0DY Registered number 41424
Unilever PLC RegistrarsComputershare Investor Services PLCThe PavilionsBridgwater RoadBristol BS99 6ZY
By Order of the Board
T E LovellSecretary of Unilever PLC28 February 2012
Unilever Annual Report and Accounts 2011
Financial statements
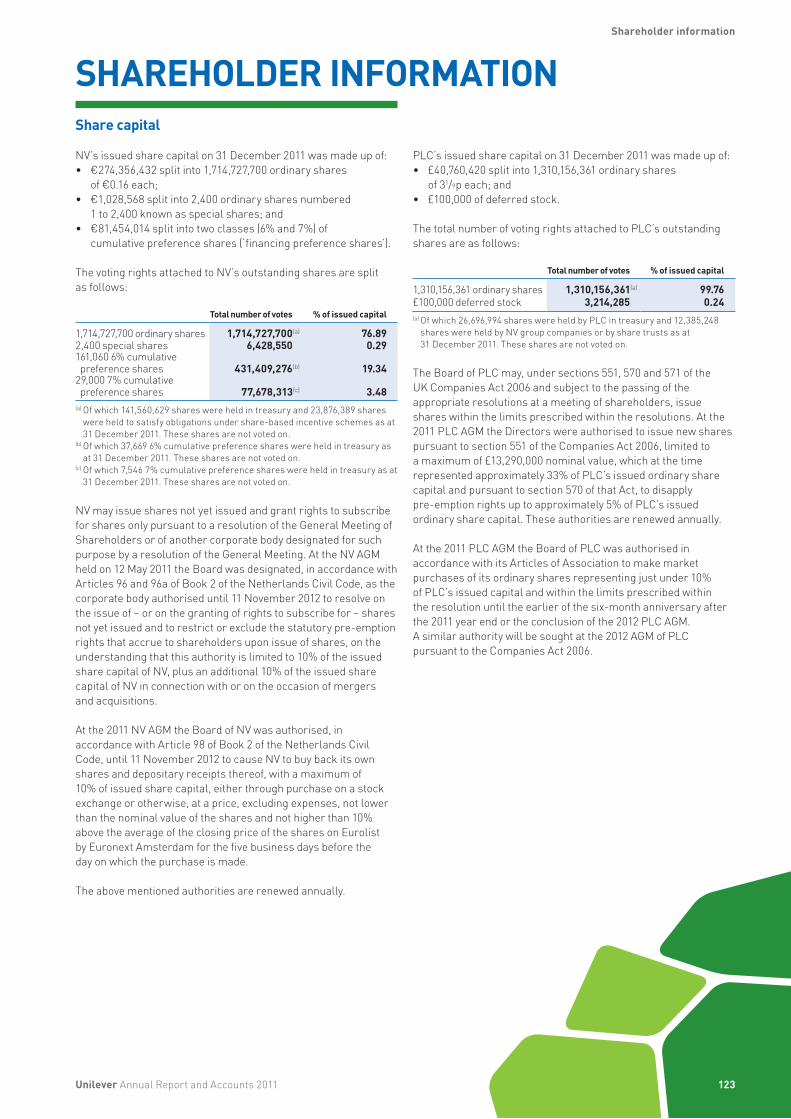
123
SHAREHOLDER INFORMATIONShare capital
NV’s issued share capital on 31 December 2011 was made up of:• €274,356,432 split into 1,714,727,700 ordinary shares
of €0.16 each; • €1,028,568 split into 2,400 ordinary shares numbered
1 to 2,400 known as special shares; and • €81,454,014 split into two classes (6% and 7%) of
cumulative preference shares (‘financing preference shares’).
The voting rights attached to NV’s outstanding shares are split as follows:
Total number of votes % of issued capital
1,714,727,700 ordinary shares 1,714,727,700(a) 76.892,400 special shares 6,428,550 0.29161,060 6% cumulative preference shares 431,409,276(b) 19.34
29,000 7% cumulative preference shares 77,678,313(c) 3.48
(a) Of which 141,560,629 shares were held in treasury and 23,876,389 shares were held to satisfy obligations under share-based incentive schemes as at 31 December 2011. These shares are not voted on.
(b) Of which 37,669 6% cumulative preference shares were held in treasury as at 31 December 2011. These shares are not voted on.
(c) Of which 7,546 7% cumulative preference shares were held in treasury as at 31 December 2011. These shares are not voted on.
NV may issue shares not yet issued and grant rights to subscribe for shares only pursuant to a resolution of the General Meeting of Shareholders or of another corporate body designated for such purpose by a resolution of the General Meeting. At the NV AGM held on 12 May 2011 the Board was designated, in accordance with Articles 96 and 96a of Book 2 of the Netherlands Civil Code, as the corporate body authorised until 11 November 2012 to resolve on the issue of – or on the granting of rights to subscribe for – shares not yet issued and to restrict or exclude the statutory pre-emption rights that accrue to shareholders upon issue of shares, on the understanding that this authority is limited to 10% of the issued share capital of NV, plus an additional 10% of the issued share capital of NV in connection with or on the occasion of mergers and acquisitions.
At the 2011 NV AGM the Board of NV was authorised, in accordance with Article 98 of Book 2 of the Netherlands Civil Code, until 11 November 2012 to cause NV to buy back its own shares and depositary receipts thereof, with a maximum of 10% of issued share capital, either through purchase on a stock exchange or otherwise, at a price, excluding expenses, not lower than the nominal value of the shares and not higher than 10% above the average of the closing price of the shares on Eurolist by Euronext Amsterdam for the five business days before the day on which the purchase is made.
The above mentioned authorities are renewed annually.
Unilever Annual Report and Accounts 2011
Shareholder information
PLC’s issued share capital on 31 December 2011 was made up of:• £40,760,420 split into 1,310,156,361 ordinary shares
of 31/9p each; and • £100,000 of deferred stock.
The total number of voting rights attached to PLC’s outstanding shares are as follows:
Total number of votes % of issued capital
1,310,156,361 ordinary shares 1,310,156,361(a) 99.76£100,000 deferred stock 3,214,285 0.24(a) Of which 26,696,994 shares were held by PLC in treasury and 12,385,248
shares were held by NV group companies or by share trusts as at 31 December 2011. These shares are not voted on.
The Board of PLC may, under sections 551, 570 and 571 of the UK Companies Act 2006 and subject to the passing of the appropriate resolutions at a meeting of shareholders, issue shares within the limits prescribed within the resolutions. At the 2011 PLC AGM the Directors were authorised to issue new shares pursuant to section 551 of the Companies Act 2006, limited to a maximum of £13,290,000 nominal value, which at the time represented approximately 33% of PLC’s issued ordinary share capital and pursuant to section 570 of that Act, to disapply pre-emption rights up to approximately 5% of PLC’s issued ordinary share capital. These authorities are renewed annually.
At the 2011 PLC AGM the Board of PLC was authorised in accordance with its Articles of Association to make market purchases of its ordinary shares representing just under 10% of PLC’s issued capital and within the limits prescribed within the resolution until the earlier of the six-month anniversary after the 2011 year end or the conclusion of the 2012 PLC AGM. A similar authority will be sought at the 2012 AGM of PLC pursuant to the Companies Act 2006.
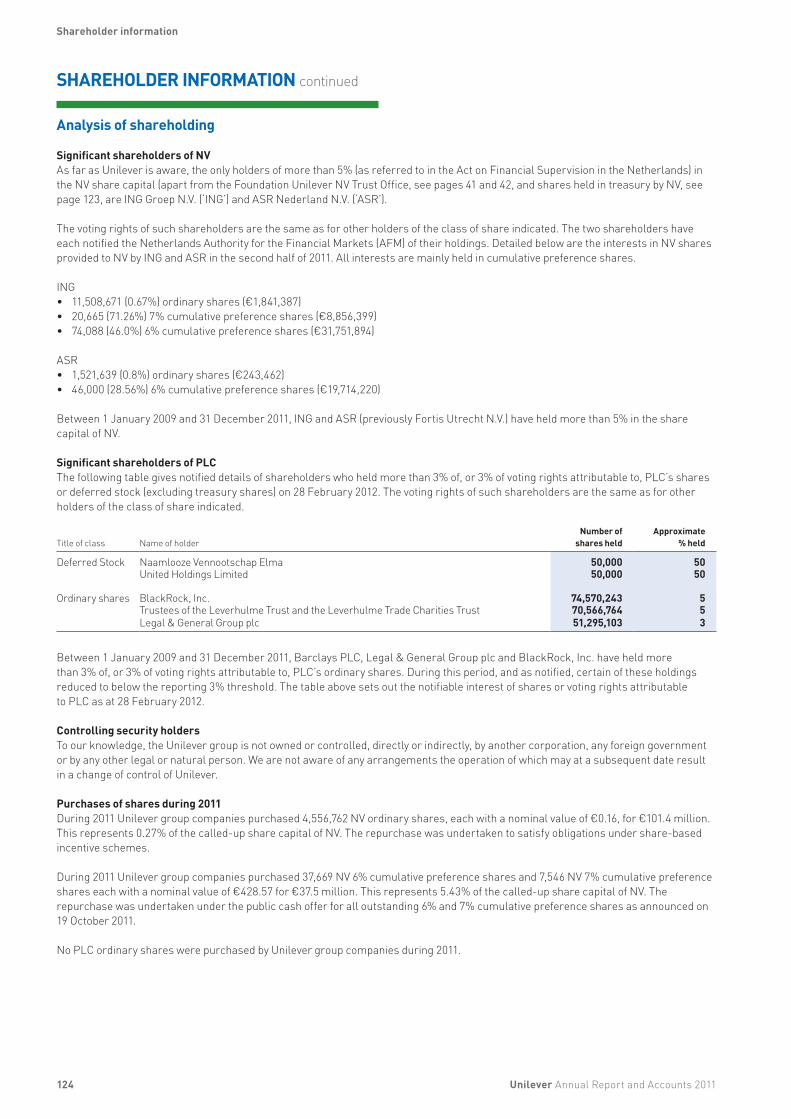
124
SHAREHOLDER INFORMATION continued
Analysis of shareholding
Significant shareholders of NVAs far as Unilever is aware, the only holders of more than 5% (as referred to in the Act on Financial Supervision in the Netherlands) in the NV share capital (apart from the Foundation Unilever NV Trust Office, see pages 41 and 42, and shares held in treasury by NV, see page 123, are ING Groep N.V. (‘ING’) and ASR Nederland N.V. (‘ASR’).
The voting rights of such shareholders are the same as for other holders of the class of share indicated. The two shareholders have each notified the Netherlands Authority for the Financial Markets (AFM) of their holdings. Detailed below are the interests in NV shares provided to NV by ING and ASR in the second half of 2011. All interests are mainly held in cumulative preference shares.
ING • 11,508,671 (0.67%) ordinary shares (€1,841,387)• 20,665 (71.26%) 7% cumulative preference shares (€8,856,399)• 74,088 (46.0%) 6% cumulative preference shares (€31,751,894)
ASR• 1,521,639 (0.8%) ordinary shares (€243,462)• 46,000 (28.56%) 6% cumulative preference shares (€19,714,220)
Between 1 January 2009 and 31 December 2011, ING and ASR (previously Fortis Utrecht N.V.) have held more than 5% in the share capital of NV.
Significant shareholders of PLCThe following table gives notified details of shareholders who held more than 3% of, or 3% of voting rights attributable to, PLC’s shares or deferred stock (excluding treasury shares) on 28 February 2012. The voting rights of such shareholders are the same as for other holders of the class of share indicated.
Title of class Name of holderNumber of
shares heldApproximate
% held
Deferred Stock Naamlooze Vennootschap Elma 50,000 50United Holdings Limited 50,000 50
Ordinary shares BlackRock, Inc. 74,570,243 5Trustees of the Leverhulme Trust and the Leverhulme Trade Charities Trust 70,566,764 5Legal & General Group plc 51,295,103 3
Between 1 January 2009 and 31 December 2011, Barclays PLC, Legal & General Group plc and BlackRock, Inc. have held more than 3% of, or 3% of voting rights attributable to, PLC’s ordinary shares. During this period, and as notified, certain of these holdings reduced to below the reporting 3% threshold. The table above sets out the notifiable interest of shares or voting rights attributable to PLC as at 28 February 2012.
Controlling security holdersTo our knowledge, the Unilever group is not owned or controlled, directly or indirectly, by another corporation, any foreign government or by any other legal or natural person. We are not aware of any arrangements the operation of which may at a subsequent date result in a change of control of Unilever.
Purchases of shares during 2011During 2011 Unilever group companies purchased 4,556,762 NV ordinary shares, each with a nominal value of €0.16, for €101.4 million. This represents 0.27% of the called-up share capital of NV. The repurchase was undertaken to satisfy obligations under share-based incentive schemes.
During 2011 Unilever group companies purchased 37,669 NV 6% cumulative preference shares and 7,546 NV 7% cumulative preference shares each with a nominal value of €428.57 for €37.5 million. This represents 5.43% of the called-up share capital of NV. The repurchase was undertaken under the public cash offer for all outstanding 6% and 7% cumulative preference shares as announced on 19 October 2011.
No PLC ordinary shares were purchased by Unilever group companies during 2011.
Unilever Annual Report and Accounts 2011
Shareholder information

125
Financial calendar
Annual General Meetings
DateVoting Record
dateVoting &
Registration date
NV 9.30am 9 May 2012 11 April 2012 2 May 2012
PLC 3.00pm 9 May 2012 4 May 2012 4 May 2012
Announcements of results
First Quarter 26 April 2012 Third Quarter 25 October 2012Second Quarter 26 July 2012 Fourth Quarter 24 January 2013
Quarterly DividendsDates listed below are applicable to all four Unilever listings (NV ordinary shares, PLC ordinary shares, NV New York shares, and PLC ADRs).
Announced Ex-dividend date Record date Payment date
Quarterly Dividend announced with the Q4 2011 results 2 February 2012 15 February 2012 17 February 2012 22 March 2012Quarterly Dividend announced with the Q1 2012 results 26 April 2012 9 May 2012 11 May 2012 13 June 2012Quarterly Dividend announced with the Q2 2012 results 26 July 2012 8 August 2012 10 August 2012 12 September 2012Quarterly Dividend announced with the Q3 2012 results 25 October 2012 7 November 2012 9 November 2012 12 December 2012
Preferential Dividends – NV
Announced Ex-dividend date Record date Payment date
6% and 7% 7 September 2012 10 September 2012 12 September 2012 1 October 2012
Contact details
Rotterdam LondonUnilever N.V. Unilever PLCInvestor Relations Department Investor Relations DepartmentWeena 455, PO Box 760 Unilever House3000 DK Rotterdam 100 Victoria EmbankmentThe Netherlands London EC4Y 0DY United Kingdom
Telephone +44 (0)20 7822 6830 Telephone +44 (0)20 7822 6830Telefax +44 (0)20 7822 5754 Telefax +44 (0)20 7822 5754
Any queries can also be sent to us electronically via www.unilever.com/resource/contactus.aspx.
Unilever Annual Report and Accounts 2011
Shareholder information
126
SHAREHOLDER INFORMATION continued
Website
Shareholders are encouraged to visit our website www.unilever.com which has a wealth of information about Unilever. Any information on or linked from the website is not incorporated by reference into this Annual Report and Accounts.
There is a section designed specifically for investors at www.unilever.com/investorrelations. It includes detailed coverage of the Unilever share price, our quarterly and annual results, performance charts, financial news and investor relations speeches and presentations. It also includes conference and investor/analyst presentations.
You can also view this year’s Annual Report and Accounts, and prior years’ Annual Review and Annual Report and Accounts documents at www.unilever.com/investorrelations.
PLC shareholders can elect to receive their shareholder communications such as Annual Report and Accounts and other shareholder documents electronically by registering at www.unilever.com/shareholderservices.
Shareholders are also able to view documents on our website.
Share registration
The NetherlandsANT Trust & Corporate Services N.V.Claude Debussylaan 241082 MD Amsterdam
Telephone +31 (0)20 522 2555 Telefax +31 (0)20 522 2500Website www.ant-trust.comEmail [email protected]
UKComputershare Investor Services PLCThe PavilionsBridgwater RoadBristol BS99 6ZY
Telephone +44 (0)870 600 3977Telefax +44 (0)870 703 6119Website www.unilever.com/shareholderservicesEmail [email protected]
USACitibank Shareholder ServicesPO Box 43077Providence RI 02940-3077
Toll free phone (inside US) 888 502 6356Toll phone (outside US) +1 781 575 4555Website www.citi.com/drEmail [email protected]
Publications
Copies of the following publications can be accessed directly or ordered through www.unilever.com/investorrelations or www.unilever.nl/onsbedrijf/beleggers.
Unilever Annual Report and Accounts 2011Available in English with figures in euros. It forms the basis for the Form 20-F that is filed with the United States Securities and Exchange Commission, which is also available free of charge at www.sec.gov.
Quarterly Results AnnouncementsAvailable in English with figures in euros.
Unilever Annual Report and Accounts 2011
Shareholder information
Unilever Annual Report and Accounts 2011 127
NOTES

128
INDEX
Accounting policies 6, 68-69, 113, 119Acquisitions 21, 104-106Advertising and promotion 16, 72Americas, The 7, 22, 26, 70, 73, 85Annual General Meetings 40, 125Asia Africa CEE 7, 22, 26, 70, 73, 85Associates 64, 67, 70-71, 87-88, 107, 110Audit Committee 39-40, 46-47Auditors 46-47, 62-63, 108, 111, 116, 117, 120, 122Balance sheet 24, 66, 68, 112, 118Biographies 34-35Board committees 39-40Board remuneration 50-59Boards 2, 36-37Brands 9, 10-13Capital expenditure 86-87Cash 90-91Cash flow 25, 67Categories 23, 71Cautionary statement inside back coverChairman 2, 34, 38Chief Executive Officer 4-5, 34, 38Commitments 24, 102-103Company accounts, statutory and other information 111-122Comprehensive income 65, 82Contingent liabilities 102-103, 115, 120Core operating margin 27Corporate governance 36-45Corporate responsibility 48Corporate Responsibility and Reputation Committee 39-40, 48Deferred tax 81-82, 113, 119Depreciation 72, 86-87Directors’ responsibilities 61Disposals 104-106Diversity 2, 18, 121Dividends 83, 113, 119, 125Earnings per share 21, 64, 83Employees 7, 18-19, 73, 121Equalisation Agreement 42Equity 100-101Europe, Western 7, 22, 70, 73, 85Exchange rates 68Executive Directors 34, 37, 38-39, 51-58Finance and liquidity 24, 93-94Finance costs and income 80Financial assets 90-91Financial calendar 125Financial instruments 91, 93-98Financial liabilities 91-92Financial review 20-27Foods 7, 23, 71Free cash flow 6, 20-21, 27Goodwill 84-85Gross profit 72Group structure 3, 68Home Care 7, 23, 71
Impairment 70, 72, 84-85Income statement 21, 64Innovation 9, 10-13Intangible assets 84-85, 119-120International Financial Reporting Standards 6, 68Inventories 88Joint ventures 70-71, 87, 107, 110Key management 73Key performance indicators 6, 20-27Leases 24, 102-103Legal proceedings 103Market capitalisation 25Net debt 25, 27Nomination Committee 39-40, 49Non-Executive Directors 34, 38-39, 58-59Non-GAAP measures 26-27Off-balance sheet arrangements 24Operating costs 72Operating profit 21, 70-72Outlook 28Payables 89Pensions and similar obligations 73-78Personal Care 7, 23, 71Post balance sheet events 108, 116, 120Preference shares and dividends 72, 125Principal group companies 109-110Property, plant and equipment 86-87Provisions 99-100Receivables 88-89Refreshment 7, 23, 71Regions 22, 26, 70, 73, 85Related party transactions 107Remuneration Committee 39-40, 44, 50-59Research and development 10-11, 72, 84Reserves 100, 114, 120Restructuring 70, 72, 99Revenue recognition 70Risk management and control 33, 43-45, 46Risks – principal risks 28-32Segment information 22-23, 70-71Share-based payments 79-80Share capital 41, 101-102, 114, 120, 123Shareholders 40-42, 123-124Share registration 126Staff costs 73Strategy 9Taxation 80-82, 113, 119Total shareholder return 59Treasury 25, 93-98Turnover 70-71Underlying operating margin 6, 20-27Underlying volume growth 6-7, 20-27Underlying sales growth 6-7, 20-27Unilever Leadership Executive 5, 35Voting 41Website 126
Unilever Annual Report and Accounts 2011
Cautionary statementThis document may contain forward-looking statements, including ‘forward-looking statements’ within the meaning of the United States Private Securities Litigation Reform Act of 1995. Words such as ‘will’, ‘aim’, ‘expects’, ‘anticipates’, ‘intends’, ‘believes’, ‘vision’, or the negative of these terms and other similar expressions of future performance or results, and their negatives, are intended to identify such forward-looking statements. These forward-looking statements are based upon current expectations and assumptions regarding anticipated developments and other factors affecting the Group. They are not historical facts, nor are they guarantees of future performance.
Because these forward-looking statements involve risks and uncertainties, there are important factors that could cause actual results to differ materially from those expressed or implied by these forward-looking statements, including, among others, competitive pricing and activities, economic slowdown, industry consolidation, access to credit markets, recruitment levels, reputational risks, commodity prices, continued availability of raw materials, prioritisation of projects, consumption levels, costs, the ability to maintain and manage key customer relationships and supply chain sources, consumer demands, currency values, interest rates, the ability to integrate acquisitions and complete planned divestitures, finalising fair values related to prior acquisitions, the ability to complete planned restructuring activities, physical risks, environmental risks, the ability to manage sustainability, regulatory, tax and legal matters and resolve pending matters within current estimates, legislative, fiscal and regulatory developments, political, economic and social conditions in the geographic markets where the Group operates, completion of the Sustainable Development Report 2011 and new or changed priorities of the Boards. Further details of potential risks and uncertainties affecting the Group are described in the Group’s filings with the London Stock Exchange, Euronext Amsterdam and the US Securities and Exchange Commission, including the Group’s Annual Report on Form 20-F for the year ended 31 December 2011 and the Annual Report and Accounts 2011. These forward-looking statements speak only as of the date of this document. Except as required by any applicable law or regulation, the Group expressly disclaims any obligation or undertaking to release publicly any updates or revisions to any forward-looking statements contained herein to reflect any change in the Group’s expectations with regard thereto or any change in events, conditions or circumstances on which any such statement is based.
This document is not prepared in accordance with US GAAP and should not therefore be relied upon by readers as such. The Group’s Annual Report on Form 20-F for 2011 is separately filed with the US Securities and Exchange Commission and is available on our corporate website www.unilever.com. Any information on or linked from the website is not incorporated by reference into this document or the Annual Report on Form 20-F. In addition, a printed copy of the Annual Report on Form 20-F is available, free of charge, upon request to Unilever PLC, Investor Relations Department, Unilever House, 100 Victoria Embankment, London EC4Y 0DY, United Kingdom.
Designed and produced by Unilever Communications in conjunction with Addison at www.addison.co.uk.Board photography by Oliver Edwards, Philip Gatward, Claudio Sforza and Indra Dab Photography Indonesia. Feature photography by Giles Barnard, Igor Emmerich, Michael Heffernan, Peter Jordan and Chris Moyse. Product photography by The Pack Shot Company. Additional photography from the Unilever image library.
Printed at Pureprint Group, ISO 14001. FSC® certified and CarbonNeutral®.
This document forms part of the Unilever Annual Report and Accounts 2011 suite of documents and is printed on Amadeus 100% Recycled Silk. This has been exclusively supplied by Denmaur Independent Papers which has offset the carbon produced by the production and delivery of this paper to the printer.
The paper contains 100% recycled content, of which 100% is de-inked post-consumer waste. All of the pulp is bleached using an elemental chlorine free process (ECF). Printed in the UK by Pureprint using its alcofree® and pureprint® environmental printing technology, and vegetable inks were used throughout. Pureprint is a CarbonNeutral® company. Both manufacturing mill and the printer are registered to the Environmental Management System ISO 14001 and are Forest Stewardship Council® (FSC) chain-of-custody certified. If you have finished with this document and no longer wish to retain it, please pass it on to other interested readers or dispose of it in your recycled paper waste. Thank you.

Unilever N.V.Weena 455, PO Box 7603000 DK RotterdamThe NetherlandsT +31 (0)10 217 4000F +31 (0)10 217 4798
Commercial Register RotterdamNumber: 24051830
Unilever PLCUnilever House100 Victoria EmbankmentLondon EC4Y 0DYUnited KingdomT +44 (0)20 7822 5252F +44 (0)20 7822 5951
Unilever PLC registered officeUnilever PLCPort SunlightWirralMerseyside CH62 4ZDUnited Kingdom
Registered in England and WalesCompany Number: 41424
www.unilever.com
Related Documents