Welcome message from author
This document is posted to help you gain knowledge. Please leave a comment to let me know what you think about it! Share it to your friends and learn new things together.
Transcript

8/3/2019 Annual Reports 2010 11
http://slidepdf.com/reader/full/annual-reports-2010-11 1/64

8/3/2019 Annual Reports 2010 11
http://slidepdf.com/reader/full/annual-reports-2010-11 2/64
Board of DirectorsMr. Abhay Aima
Mr. Aseem Dhru, Managing Director
Mr. Bharat Shah, Chairman
Ms. Latika Monga
Mr. S.S. Thakur
Mr. Santosh Haldankar, Whole Time Director & Company Secretary
Auditors
Deloitte Haskins & Sells
Chartered Accountants
BankersHDFC Bank Limited
Standard Chartered Bank
IndusInd Bank Limited
IDBI Bank Limited
Bank of America
Punjab National Bank
Corporation Bank
Whole Time Director &
Company Secretary
Mr. Santosh Haldankar
Registered Office
Office Floor 8,
I Think Techno Campus,
Building B - Alpha,
Kanjurmarg (E),
Mumbai - 400 042
Tel No. : 30753454
Fax No.: 30753435
Website : www.hdfcsec.com
Registrar & Share Transfer AgentsDatamatics Financial Services Limited,
Plot No A.16 & 17,
Part B Crosslane,
MIDC, Marol,
Andheri (East),
Mumbai - 400 093
Tel. No.: 66712214
Fax No.: 28213404

8/3/2019 Annual Reports 2010 11
http://slidepdf.com/reader/full/annual-reports-2010-11 3/64
CONTENTS Page
Directors’ Report 1-5
Auditors Report 6-7
Balance Sheet 8
Profit & Loss Account 9
Cash Flow Statement 10
Schedules to the Accounts 11-21
Balance Sheet Abstract and Company’s 22
General Business Profile

8/3/2019 Annual Reports 2010 11
http://slidepdf.com/reader/full/annual-reports-2010-11 4/64
DIRECTORS’ REPORT
TO THE MEMBERS
Your Directors have pleasure in presenting the Eleventh Annual
Report on the business and operations of the Company together
with audited accounts for the year ended 31 March 2011.
FINANCIAL RESULTS
(Rs. in Crores )
Year ended Year ended
31-3-2011 31-3-2010
Total Income 260.51 235.31
Total Expenses 136.14 105.94
Profit before depreciation 124.37 129.37
Depreciation and Amortisation 8.46 7.94
Profit before tax 115.91 121.43
Provision for Tax 38.75 43.25
Profit after tax 77.16 78.18
Balance brought forward 130.40 53.09
Amount available for appropriation 207.56 131.27
Proposed dividend 0.90 0.75
Tax including surcharge and education
cess on dividend 0.15 0.12
Balance carried over to Balance Sheet 206.51 130.40
OPERATIONS
During the year under review, the Company’s total income
amounted to Rs. 260.51 crores as against Rs. 235.31 crores in the
previous year, a growth of 10.71%. The operations have resulted
in a net profit after tax of Rs. 77.16 crores as against Rs. 78.18
crores in the previous year. The Company’s focus is primarily toemerge as a full-fledged financial services provider offering a
bouquet of financial services alongwith the core broking product.
The Company continued strengthening its distribution network
and by the end of the year has a branch network of 150 branches
across the country including separate linguistic call centres within
these branches to cater to the financial needs of its customers
across the country.
PROSPECTS AND OUTLOOK FOR THE FUTURE
Economic Outlook
For India, the year 2010 was a year of contrasts. On one ha
economy revived with steady growth, but inflation rema
concern and reforms were sluggish. Divestments and t
auction went off better than expected but governance hit
low, as corruption charges against the government dam
overall morale, affected its functioning and paralyzed the
winter session of Parliament.
While the stock market is still below its 2008 high, agri comm
and some metals (base as well as precious) have crosse
peaks a while ago. Agri-commodities by far have been one
best performing asset classes for 2010.
India's IIP growth fell to 3.7% in January 2011. India's si
industries grew by 6.8 per cent in February 2011. Indian ec
slowed to 8.2% real growth y-o-y in Q4CY10, from 8.9% yQ3CY10. However most economists/institutions still mai
GDP growth forecast of 7.5% to 8.5% for India in FY12. E
the index of industrial production (IIP) continues to be v
other indicators, such as the latest Purchasing Managers
(PMI), direct and indirect tax collections, merchandise e
and bank credit, suggest that the growth momentum pers
The Reserve Bank had expressed concern about the widen
the current account deficit (CAD) and the nature of its fin
in its Third Quarter Review. Going by the recent robust
performance, CAD for 2010-11 is now estimated to come
than earlier expected, at around 2.5 per cent of GDP. Wh
CAD this year has been financed comfortably, it is neces
focus on the quality of capital inflows with greater empha
attracting long-term components, including foreign
investment (FDI), so as to enhance the sustainability of the b
of payments (BoP) over the medium-term.
With exports growing at a much faster rate than imports,
trade deficit during April-Feb 2010-11 declined to $97.06 b
$100.24 bn in the same period previous fiscal (exports up
imports up 21.2%). The exporting sectors, which performe
during the 11 months of fiscal, include engineering, pet
and oil lubricants, cotton yarn and made-ups, chemica
electronics. The Centre's fiscal deficit during April-Feb 2
worked out to be 68.6% of the estimates, compared to 92%
same period last year, showing improvement in the fiscal po
India's foreign exchange reserves rose by $26.4 bn to $303
during the year ended March 25, 2011. On a BoP basis,
trade deficit widened to $ 102.1 bn during April-Decembe
1
8/3/2019 Annual Reports 2010 11
http://slidepdf.com/reader/full/annual-reports-2010-11 5/64
($ 86.8 bn during April-December 2009) mainly due to higher
absolute increase in imports relative to exports on the back of
robust domestic economic performance. Net invisibles surplus
increased to $ 63.2 bn during April-December 2010 ($ 61.2 bn last
year) mainly due to higher increase (41.2%) in services exports.
Net capital inflows increased significantly to $ 52.7 bn during
April-December 2010 ($ 37.6 bn a year ago) driven by higher net
inflows under FII investments, external assistance, short-term trade
credits, ECBs and banking capital.
The recent global crisis has shown that monetary policies in
advanced countries do have spillover effect on emerging market
economies (EMEs). For instance, persistence of low interest rates
in advanced economies, by increasing the interest rate differential
could push excessive capital flows to EMEs in search of higher
returns, thus exposing these economies to the risk of reversal
unrelated to their fundamentals. Excessive inflows could
accentuate asset prices and put upward pressure on exchangerate.
The global scenario presents a mixed picture. While growth in
EMEs remains strong, that in the US and the Euro area is now
gaining momentum. However, the sharp increase in oil prices as a
result of the turmoil in the Middle East and North Africa is adding
uncertainty to the pace of global recovery. Further, coming on top
of already elevated food and other commodity prices, the spike in
oil prices has engendered inflation concerns.
Consequently, an increasing number of EMEs have begun
monetary tightening, while the debate on exit from the
accommodative monetary stance has come to the fore in the
advanced economies. ECB raised interest rates in early April 2011
by 25 bps for the first time in nearly three years.
India's consumption story remains buoyant. As in 2010, the market
for skilled labour remains buoyant led by the service sector. US
tech spending, supported by higher corporate free cash flow and
the need to reduce cost pressure, would remain strong, spurring
additional hiring by the IT and ITeS sectors. We believe a skilled
labour shortage (reinforced by slowing population growth rate -
as per the latest census), coupled with the aggressive hiring plans
by IT and ITeS, could exert upward pressure on salaries across
other sectors. This augurs well for urban-consumption demand.
Rural consumption is likely to remain strong supported by higher
support prices for agricultural products and higher government
redistributive expenditure. We feel that consumption could be a
major growth driver for the economy going forward.
FY12 will test India Inc's resilience further, given the challenging
macroeconomic factors related to soaring costs of raw materials
and expensive borrowing costs due to rising interest rates.
rising costs can be passed over to the consumers upto a
there exists a risk of slowdown in consumption in case,
continue to rise unabatedly. Such a situation, if it develops
take a few quarters to reverse, affecting corporate sales and
growth.
Capital Market:
After making a low in late May 2010, India's equity marke
continuously till early November 2010 when the Sensex c
21,000. The broader markets underperformed as did m
sectoral indices. Later the markets corrected all the way to
from where a sharp bounce was seen. Participation fro
domestic investors (including institutions) remained subd
sharp shift was witnessed in trading activity from delivery (a
daily volumes on NSE down 17.3% y-o-y) to F&O m
(especially options) (average daily volumes on NSE up
y-o-y). This had an impact on the brokerage yields for all inparticipants.
FIIs were net buyers worth Rs. 1426.6 bn in FY10 & Rs. 146
in FY11 as compared to being net buyers of Rs. 661.8 bn in
Despite this the Indian markets did not breach the highs m
Jan 2008 due to large primary issuances in FY10 and
domestic selling & FIIs' unwillingness to buy at higher le
took nearly $29 bn in investor flows in CY10 to cause the m
to rise steadily until Nov 2010 but relatively tiny outflow
have caused sharp reversals. For markets to surpass the a
high, the retail participation (directly or through mutual fu
important.
The financial year 2011-12 has commenced on a positiv
However as in some other emerging economies, inflation r
a key concern for India. The drivers of inflation have ch
from food, fuel and power and primary non-food articles till O
2010 to manufactured non-food items since November 201
impending end of QE2 by the US in June 2011 could
repercussions across all asset markets including commo
equity, bonds and currencies. China's policy action on mo
tightening to slow down their economic growth rate will als
its own impact on commodity prices and global growt
Outcome of state elections in India in May 2011 would a
keenly watched to judge its impact on political equa
Continued foreign fund flows and strong risk appetite are es
for Indian markets to come out of rangebound move.
DIVIDEND
Your Directors are pleased to recommend a dividend of 6%
year ended 31 March 2011. This dividend shall be sub
2

8/3/2019 Annual Reports 2010 11
http://slidepdf.com/reader/full/annual-reports-2010-11 6/64
3
dividend distribution tax to be paid by the Company but will be
tax-free in the hands of the members.
AWARDS AND RECOGNITION
During the year, the Company received an award as the best
e-brokerage house (runner-up) at the Outlook Money Awards
(Personal Finance) 2010.
CORPORATE SOCIAL RESPONSIBILITY
As a responsible Corporate Citizen the Company strives for
community empowerment through socio-economic development
of underprivileged and marginalized sections of society. It’s been
the Company’s endeavour to put more value on bringing social
good, which is beneficial to the society and thus making a
difference in the livelihood of the people. The Company has
partnered with NGO to promote educational and social initiatives.
During the year under review, the Company supported a varietyof social causes ranging from promoting education for
underprivileged children, participating in blood donation camps,
employee services to old age homes, clothes donation and
distribution of computers to the underprivileged classes of society.
The effort of the Company on social initiatives is on an ongoing
basis.
PARTICULARS REGARDING CONSERVATION OF ENERGY,
TECHNOLOGY ABSORPTION AND FOREIGN EXCHANGE
EARNINGS & OUTGO
A. Since the Company does not carry out any manufacturing
activities, particulars to be disclosed with respect to
conservation of energy and technology absorption under
Section 217 (1) (e) of the Companies Act, 1956, read with the
Companies (Disclosure of Particulars in the Report of Board
of Directors) Rules, 1988 are not applicable.
B. Details of earnings and expenses in foreign currency are
reflected at schedule 13 (point no. 4) of the Financial
statements.
DIRECTORS:
Mr. Abhay Aima and Ms. Latika Monga retire by rotation at the
ensuing Annual General meeting and are eligible for
re-appointment.
The Board at its meeting held on 2 February 2011 re-appointed
Mr. Aseem Dhru as Managing Director of the Company for a
period of 3 years from 7 April 2011 to 6 April 2014 subject to the
approval of the shareholders at the ensuing Annual General
Meeting.
The Board at its meeting held on 25 October 201
re-appointed Mr. Santosh Haldankar as Whole Time Dire
the Company for a period of 3 years from 10 January 2
9 January 2014, subject to the approval of the shareholder
ensuing Annual General Meeting.
EMPLOYEE STOCK OPTION
The Company had granted 5,42,750 stock options to its emp
entitling them to receive an equivalent number of Equity
of face value of Rs. 10/- each in the Company at an exercis
of Rs. 135/- per share.
During the year under review 1,56,225 stock options vested
February 2011 out of which 67,700 stock options were exe
by eligible employees. The money realised due to exercise
said options was Rs. 91,39,500/- and consequently 67,700
shares of Rs. 10/- each have been allotted to the conc
employees. A detailed note on this subject is placed in theforming part of the accounts at point no. 14.
PUBLIC DEPOSIT:
During the year under review, the Company has not accept
deposit pursuant to Section 58A of the Companies Act, 19
INFORMATION PURSUANT TO SECTION 217 (2A) O
COMPANIES ACT, 1956:
The information required to be given under the provisi
Section 217(2A) of the Companies Act, 1956 read w
Companies (Particulars of Employees) Rules, 1975, is given
Annexure enclosed.
AUDITORS:
M/s. Deloitte Haskins & Sells, Chartered Accountants, St
Auditors of the Company will retire at the conclusion
forthcoming Annual General Meeting. Members are reque
consider their re-appointment on a remuneration, to be d
by the Board of Directors in mutual consultation with the Au
DIRECTORS’ RESPONSIBILITY STATEMENT:
The Board of Directors hereby state that:
1. in the preparation of annual accounts, the appl
accounting standards have been followed along with
explanation relating to material departures;
2. they have selected such accounting policies and applie
consistently and made judgements and estimates th
reasonable and prudent so as to give a true and fair v
the state of affairs of the Company as at 31 March, 20
8/3/2019 Annual Reports 2010 11
http://slidepdf.com/reader/full/annual-reports-2010-11 7/64
4
of the profit of the Company for the year ended on that date;
3. they have taken proper and sufficient care for the maintenance
of adequate accounting records in accordance with the
provisions of the Companies Act, 1956 for safeguarding the
assets of the Company and for preventing and detecting fraud
and other irregularities; and
4. they have prepared the annual accounts on a going concern
basis.
ACKNOWLEDGEMENT AND APPRECIATION:
Your Directors would like to place on record their gratitude
for all the guidance and co-operation received from the
Securities and Exchange Board of India, the Bombay Stock
Exchange Limited, National Stock Exchange of India Limited,
National Securities Depository Limited, Central Depository
Services (India) Limited and other government and regu
agencies.
Your Directors are grateful to the Company’s custome
bankers for their continued support.
Your Directors would also like to take this opportun
express their appreciation to the dedicated and com
team of employees for their contribution to the Compa
rendering high quality services to the customers. We
also like to thank all our shareholders for their support
endeavours.
On behalf of the Board of Dir
Place : Mumbai Bhara
Date: 13 April, 2011 Cha

8/3/2019 Annual Reports 2010 11
http://slidepdf.com/reader/full/annual-reports-2010-11 8/64
5
Annexure
Information pursuant to Section 217(2A) of the Companies Act, 1956.
Name and Age Designation / Date of Remuneration Experience Last Employment
Qual ification i n Nature of Duties commencement (Rs.) (No. of years)
yrs. of employment
Mr. Aseem Dhru $ 4 1 Managing Director 1 January 2008 1,61,58,987 1 6 HDFC Bank Ltd
B.Com, CA, CWA
Mr. C.V. Ganesh 3 9 Chief Financial Officer & 2 May 2008 60,90,140 1 7 Citi Technology Serv
B.Com, CA, CWA Head - Operations Ltd.
Mr. Siddharth Shah $ 5 1 Head - Branch Sales 1 June 2010 71,23,628 3 0 HDFC Bank Ltd
B.Com
Mr. Vinod Sharma 5 0 Head - Pvt October 30, 2009 61,52,316 2 6 Anagram Securities
B.Com, MBA Broking & Wealth Mgt. Limited
Employed for part of the year
Mr. Manish Dabir 3 6 Head, July 31, 2009 78,30,519 1 5 JM Financial
B.Com Institutional Business Institutional Securiti
Ltd.
$ - Staff on deputation for part of the year
Notes:
1. Remuneration as shown above includes salary, performance bonus paid during the year, house rent allowance, m
allowance, reimbursement of telephone bills, leave travel allowance, superannuation, other taxable allowances and Com
contribution to provident fund.
2. None of the above are related to any Director of the Company.
3. Nature of employment is contractual.
8/3/2019 Annual Reports 2010 11
http://slidepdf.com/reader/full/annual-reports-2010-11 9/64
AUDITORS’ REPORT
TO THE MEMBERS OF
HDFC SECURITIES LIMITED
1. We have audited the attached Balance Sheet of HDFC SECURITIES LIMITED (“the Company”)
31st March, 2011, the Profit and Loss Account and the Cash Flow Statement of the Company for the year ended o
date, both annexed thereto. These financial statements are the responsibility of the Company’s Manage
Our responsibility is to express an opinion on these financial statements based on our audit.
2. We conducted our audit in accordance with the auditing standards generally accepted in India. Those Sta
require that we plan and perform the audit to obtain reasonable assurance about whether the financial statemen
free of material misstatements. An audit includes examining, on a test basis, evidence supporting the amounts a
disclosures in the financial statements. An audit also includes assessing the accounting principles used an
significant estimates made by the Management, as well as evaluating the overall financial statement presentatio
believe that our audit provides a reasonable basis for our opinion.
3. As required by the Companies (Auditor’s Report) Order, 2003 (CARO) issued by the Central Governm
terms of Section 227(4A) of the Companies Act, 1956, we enclose in the Annexure a statement on the m
specified in paragraphs 4 and 5 of the said Order.
4. Further to our comments in the Annexure referred to in paragraph 3 above, we report as follows:
(a) we have obtained all the information and explanations which to the best of our knowledge and belief
necessary for the purposes of our audit;
(b) in our opinion, proper books of account as required by law have been kept by the Company so far as it a
from our examination of those books;
(c) the Balance Sheet, the Profit and Loss Account and the Cash Flow Statement dealt with by this report
agreement with the books of account;
(d) in our opinion, the Balance Sheet, the Profit and Loss Account and the Cash Flow Statement dealt with b
report are in compliance with the Accounting Standards referred to in Section 211(3C) of the Companie
1956;
(e) in our opinion and to the best of our information and according to the explanations given to us, the said ac
give the information required by the Companies Act, 1956 in the manner so required and give a true an
view in conformity with the accounting principles generally accepted in India:
(i) in the case of the Balance Sheet, of the state of affairs of the Company as at 31st March, 2011;
(ii) in the case of the Profit and Loss Account, of the profit of the Company for the year ended on that date and
(iii) in the case of the Cash Flow Statement, of the cash flows of the Company for the year ended on that date.
5. On the basis of the written representations received from the Directors as on 31st March, 2011 taken on reco
the Board of Directors, none of the Directors is disqualified as on 31 st March, 2011 from being appointe
director in terms of Section 274(1)(g) of the Companies Act, 1956.
For DELOITTE HASKINS & S
Chartered Accou
(Registration No.117
Nalin M
P
(Membership No.
MUMBAI, 13 April, 2011
6
8/3/2019 Annual Reports 2010 11
http://slidepdf.com/reader/full/annual-reports-2010-11 10/64
ANNEXURE TO THE AUDITORS’ REPORT(Referred to in paragraph 3 of our report of even date)
(i) Having regard to the nature of the Company's business/activities/result, clauses (ii), (viii), (x), (xiii), (xiv), (xv), (xvi), (xviii)(xx) of CARO are not applicable.
(ii) In respect of its fixed assets:(a) The Company has maintained proper records showing full particulars, including quantitative details and situation
fixed assets.
(b) The fixed assets were physically verified during the year by the Management in accordance with a regular programverification which, in our opinion, provides for physical verification of all the fixed assets at reasonable intervals. Accto the information and explanation given to us, no material discrepancies were noticed on such verification.
(c) The fixed assets disposed off during the year, in our opinion, do not constitute a substantial part of the fixed assetsCompany and such disposal has, in our opinion, not affected the going concern status of the Company.
(iii) The Company has neither granted nor taken any loan, secured or unsecured, to/from companies, firms or other parties lithe Register maintained under Section 301 of the Companies Act, 1956.
(iv) In our opinion and according to the information and explanations given to us, there is an adequate internal control commensurate with the size of the Company and the nature of its business with regard to purchases of fixed assets and tof services. During the course of our audit, we have not observed any major weakness in such internal control system.
(v) To the best of our knowledge and belief and according to the information and explanations given to us, there were no coor arrangements that needed to be entered in the Register maintained in pursuance of Section 301 of the Companies Act
(vi) According to the information and explanations given to us, the Company has not accepted any deposit from the publicmeaning of Sections 58A & 58AA of the Companies Act, 1956.
(vii) In our opinion, the internal audit functions carried out during the year by a firm appointed by the Management hav
commensurate with the size of the Company and the nature of its business.(viii) According to the information and explanations given to us in respect of statutory dues:
(a) The Company has been regular in depositing undisputed dues, including Provident Fund, Investor Education and ProFund, Employees' State Insurance, Income-tax, Wealth Tax, Service Tax, Cess and other material statutory dues appto it with the appropriate authorities.
(b) There were no undisputed amounts payable in respect of Income-tax, Wealth Tax, Service Tax, Cess and other mstatutory dues in arrears as at 31st March, 2011 for a period of more than six months from the date they became pay
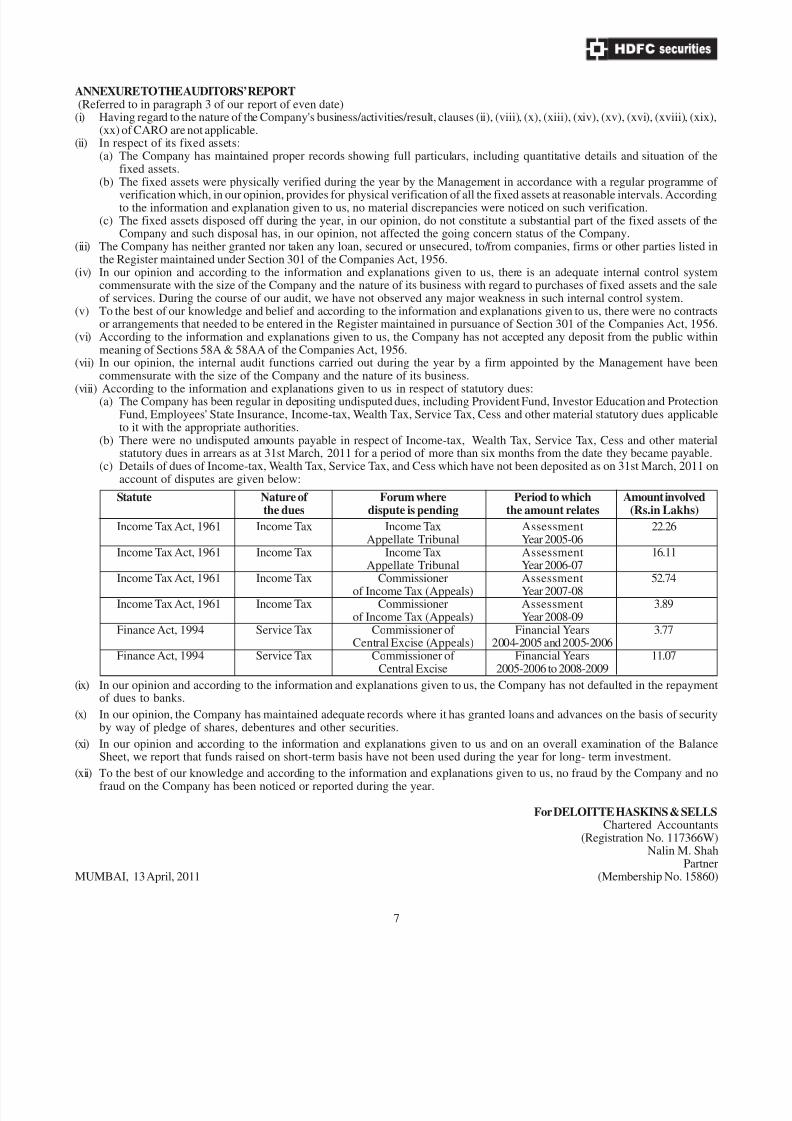
(c) Details of dues of Income-tax, Wealth Tax, Service Tax, and Cess which have not been deposited as on 31st March, 2account of disputes are given below:
Statute Nature of Forum where Period to which Amount invothe dues dispute is pending the amount relates (Rs.in Lakh
Income Tax Act, 1961 Income Tax Income Tax Assessment 22.26Appellate Tribunal Year 2005-06
Income Tax Act, 1961 Income Tax Income Tax Assessment 16.11Appellate Tribunal Year 2006-07
Income Tax Act, 1961 Income Tax Commissioner Assessment 52.74of Income Tax (Appeals) Year 2007-08
Income Tax Act, 1961 Income Tax Commissioner Assessment 3.89of Income Tax (Appeals) Year 2008-09
Finance Act, 1994 Service Tax Commissioner of Financial Years 3.77Central Excise (Appeals) 2004-2005 and 2005-2006
Finance Act, 1994 Service Tax Commissioner of Financial Years 11.07Central Excise 2005-2006 to 2008-2009
(ix) In our opinion and according to the information and explanations given to us, the Company has not defaulted in the repaof dues to banks.
(x) In our opinion, the Company has maintained adequate records where it has granted loans and advances on the basis of sby way of pledge of shares, debentures and other securities.
(xi) In our opinion and according to the information and explanations given to us and on an overall examination of the BSheet, we report that funds raised on short-term basis have not been used during the year for long- term investment.
(xii) To the best of our knowledge and according to the information and explanations given to us, no fraud by the Company fraud on the Company has been noticed or reported during the year.
For DELOITTE HASKINS & SChartered Accou
(Registration No. 117Nalin M
PMUMBAI, 13 April, 2011 (Membership No.
7

8/3/2019 Annual Reports 2010 11
http://slidepdf.com/reader/full/annual-reports-2010-11 11/64
8
Balance Sheet as at 31 March, 2011
(R
As at
Schedule 31 March, 2011 31 March
Sources of funds
Shareholders’ funds
Share Capital 1 150,687 150,010
Reserves and Surplus 2 2,345,070 2,495,757 1,575,536 1,7
Total 2,495,757 1,7
Application of funds
Fixed Assets 3
Gross Block 681,219 573,510
Less: Depreciation and Amortisation 480,193 402,864
Net Block 201,026 1
Capital Work-in-Progress 1,841
Investments 4 8,410
Deferred Tax Assets 5,958
Current assets, Loans and advances
Sundry Debtors 5 1,565,122 779,763
Cash and Bank balances 6 3,002,985 2,295,398
Loans and Advances 7 138,894 100,924
4,707,001 3,176,085
Less:
Current liabilities and Provisions 8
Current liabilities 2,404,730 1,628,284
Provisions 23,749 17,756
2,428,479 1,646,040
Net Current assets 2,278,522 1,5
Total 2,495,757 1,7
The attached notes form part of the Accounts 13
In terms of our report of even date attached.
ForDELOITTE HASKINS & SELLS
Chartered Accountants
NALIN M. SHAH
Partner
Place : Mumbai
Date : 13 April, 2011
For and on behalf of the Board
BHARAT SHAH
Chairman
ASEEM DHRU
Managing Director
SANTOSH HALDANKAR
Whole Time Director & Company Se

8/3/2019 Annual Reports 2010 11
http://slidepdf.com/reader/full/annual-reports-2010-11 12/64
9
Profit and Loss Account for the year ended 31 March, 2011
(R
Year ended YearSchedule 31 March, 2011 31 March
Income
Brokerage income (See Note 13) 2,062,589 1,9
Fee Income 383,200 2
Other income 9 159,349 1
2,605,138 2,3
Expenditure
Payments to and provisions for employees 10 807,241 5
Operating expenses 11 549,099 4
Finance charges 12 5,085
1,361,425 1,0
Profit before depreciation and tax 1,243,713 1,2
Less: Depreciation and Amortisation 84,606
Profit before Tax 1,159,107 1,2
Provision for taxation
Current tax [ See Note 9 (a)] 387,000 4
Deferred tax 493 (
Profit after Tax 771,614 7
Add: Balance brought forward from previous year 1,303,954 5
Amount available for appropriation 2,075,568 1,31
Appropriation :
a ) Proposed dividend 9,041
b ) Tax on dividend 1,502
c ) Balance carried to Balance Sheet 2,065,025 1,3
2,075,568 1,31
Earnings per Share (Basic & Diluted) (Rs) 51.21
(Face Value Rs 10)- (See Note 8)
The attached notes form part of the Accounts 13
In terms of our report of even date attached.
ForDELOITTE HASKINS & SELLS
Chartered Accountants
NALIN M. SHAH
Partner
Place : Mumbai
Date : 13 April, 2011
For and on behalf of the Board
BHARAT SHAH
Chairman
ASEEM DHRU
Managing Director
SANTOSH HALDANKAR
Whole Time Director & Company Se

8/3/2019 Annual Reports 2010 11
http://slidepdf.com/reader/full/annual-reports-2010-11 13/64
10
Cash Flow Statement for the year ended 31 March, 2011
(RsParticulars Year ended Year
31 March, 2011 31 March
(A) Cash flows from Operating activities :
Net Profit before taxation 1,159,107 1,2
Adjustments for :
Interest earned on Loans and Deposits (5,824) (
Loss on sale / write off of Fixed Assets 125
Dividend received (6,604) (
Provision for Doubtful Debts 320
Provision for Wealth Tax 127
Depreciation and Amortisation 84,606 7
Interest paid 35
Provision for Employee benefits 4,163
Operating profit before working capital changes 1,236,055 1,29
Adjustments for changes in working capital :
Sundry Debtors (785,931) (53
Loans and advances (25,628) 2Fixed deposits with Scheduled Banks under Lien (703,923) (16
Current liabilities and provisions 776,383 55
Cash generated from Operations 496,956 1,17
Direct taxes paid (net of refunds) (399,183) (46
Net Cash from Operating activities 97,773 7
(B) Cash flows from Investing activities :
Additions to Fixed Assets and Capital work in progress (99,523) (9
Proceeds from sale of Fixed Assets 965
Bonds (8,400)
Interest received 5,824
Dividend received 6,604
Net Cash used in Investing activities (94,530) (8(C) Cash flows from Financing activities :
Dividend Paid (including dividend tax) (8,684) (
Money received on excercise of stock options by employees 9,140
Interest paid (35) (
Net Cash generated from Financing activities 421 (
Net increase in cash and cash equivalents 3,664 6
Cash and cash equivalents at the beginning of the year 1,271,546 65
Cash and cash equivalents at the end of the year 1,275,210 1,27
Reconciliation
Cash and cash equivalents at the end of the year 1,275,210 1,27
Add: Fixed deposits with Scheduled Banks under Lien 1,727,775 1,02
Cash and cash equivalents at the end of the year as per Schedule 6 3,002,985 2,29
In terms of our report of even date attached.
ForDELOITTE HASKINS & SELLS
Chartered Accountants
NALIN M. SHAH
Partner
Place : Mumbai
Date : 13 April, 2010
For and on behalf of the Board
BHARAT SHAH
Chairman
ASEEM DHRU
Managing Director
SANTOSH HALDANKAR
Whole Time Director & Company Se
8/3/2019 Annual Reports 2010 11
http://slidepdf.com/reader/full/annual-reports-2010-11 14/64
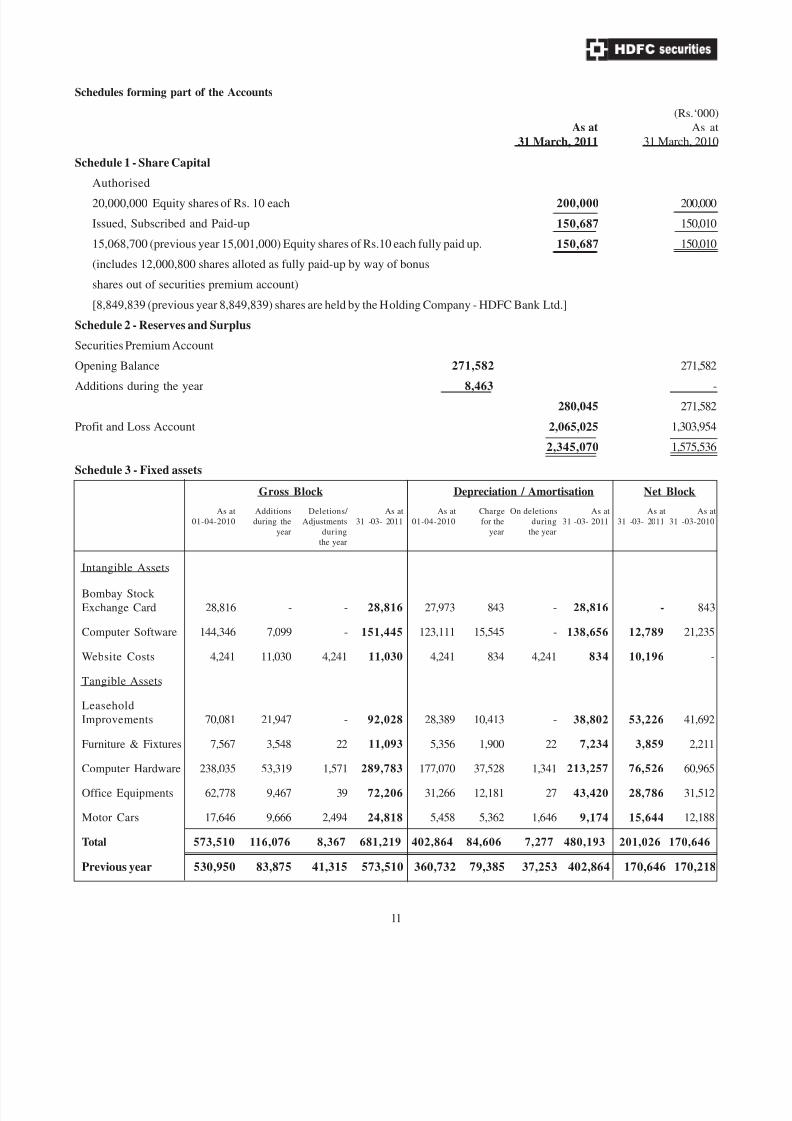
11
Schedule 3 - Fixed assets
Gross Block Depreciation / Amortisation Net Blo
As at Additions Deletions/ As at As at Charge On deletions As at As at
01-04-2010 during the Adjustments 31 -03- 2011 01-04-2010 for the during 31 -03- 2011 31 -03- 2011 31 -
year during year the year
the year
Intangible Assets
Bombay Stock
Exchange Card 28,816 - - 28,816 27,973 843 - 28,816 -
Computer Software 144,346 7,099 - 151,445 123,111 15,545 - 138,656 12,789
Website Costs 4,241 11,030 4,241 11,030 4,241 834 4,241 834 10,196
Tangible Assets
Leasehold
Improvements 70,081 21,947 - 92,028 28,389 10,413 - 38,802 53,226
Furniture & Fixtures 7,567 3,548 22 11,093 5,356 1,900 22 7,234 3,859
Computer Hardware 238,035 53,319 1,571 289,783 177,070 37,528 1,341 213,257 76,526
Office Equipments 62,778 9,467 39 72,206 31,266 12,181 27 43,420 28,786
Motor Cars 17,646 9,666 2,494 24,818 5,458 5,362 1,646 9,174 15,644
Total 573,510 116,076 8,367 681,219 402,864 84,606 7,277 480,193 201,026 17
Previous year 530,950 83,875 41,315 573,510 360,732 79,385 37,253 402,864 170,646 17
Schedules forming part of the Accounts
(R
As at
31 March, 2011 31 March
Schedule 1 - Share Capital
Authorised20,000,000 Equity shares of Rs. 10 each 200,000 2
Issued, Subscribed and Paid-up 150,687 1
15,068,700 (previous year 15,001,000) Equity shares of Rs.10 each fully paid up. 150,687 1
(includes 12,000,800 shares alloted as fully paid-up by way of bonus
shares out of securities premium account)
[8,849,839 (previous year 8,849,839) shares are held by the Holding Company - HDFC Bank Ltd.]
Schedule 2 - Reserves and Surplus
Securities Premium Account
Opening Balance 271,582 2
Additions during the year 8,463
280,045 2
Profit and Loss Account 2,065,025 1,3
2,345,070 1,5

8/3/2019 Annual Reports 2010 11
http://slidepdf.com/reader/full/annual-reports-2010-11 15/64
12
Schedules forming part of the Accounts (Contd.)
(R
As at
31 March, 2011 31 March
Schedule 4 - Investments (See note 12)
Unquoted: (non trade) (at cost)Equity Shares (Long Term)
1,30,000 Equity Shares of Re 1/- each fully paid-up of 10
Bombay Stock Exchange Limited
Quoted: (non trade) (at cost)
Bonds (Long Term)
840 State Bank of India Bonds - Series 2 Lower
Tier II Bonds of Rs. 10,000/- each 8,400
[Market value: Rs. 8,484 thousand (previous year - Nil)] 8,410
Schedule 5 - Sundry Debtors
Outstanding for a period exceeding six monthsUnsecured - Considered Good 4,116 4,116 -
Unsecured - Considered Doubtful 3,235 2,726
Less : Provision for Doubtful Debts 3,235 - 2,726
Outstanding for a period of less than six months
Secured - Considered Good 1,533,177 757,724
Unsecured - Considered Good 27,829 1,561,006 22,039 77
Unsecured - Considered Doubtful 424 363
Less : Provision for Doubtful Debts 424 - 363
1,565,122 7
Schedule 6 - Cash and Bank BalancesCash on hand 16
In current accounts with Scheduled Banks 1,039,694 7
Fixed deposits with Scheduled Banks 1,963,275 1,5
[Including deposits under lien Rs 17,27,775
thousand (previous year Rs 10,23,852 thousand)] 3,002,985 2,2
Schedule 7 - Loans and Advances
Unsecured, Considered Good
Advances recoverable in cash or in kind
or value to be received 91,464
Interest accrued on Investments 324Other Current Assets 10,749
Deposit with Stock Exchanges 21,125
Margin monies with clearing member 1,300
Advance Tax (Net) 13,932
Unsecured, considered doubtful 1,029 1,280
Less : Provision for doubtful advances 1,029 - 1,280
138,894 1
8/3/2019 Annual Reports 2010 11
http://slidepdf.com/reader/full/annual-reports-2010-11 16/64
13
Schedules forming part of the Accounts (Contd.)
(R
As at
31 March, 2011 31 March
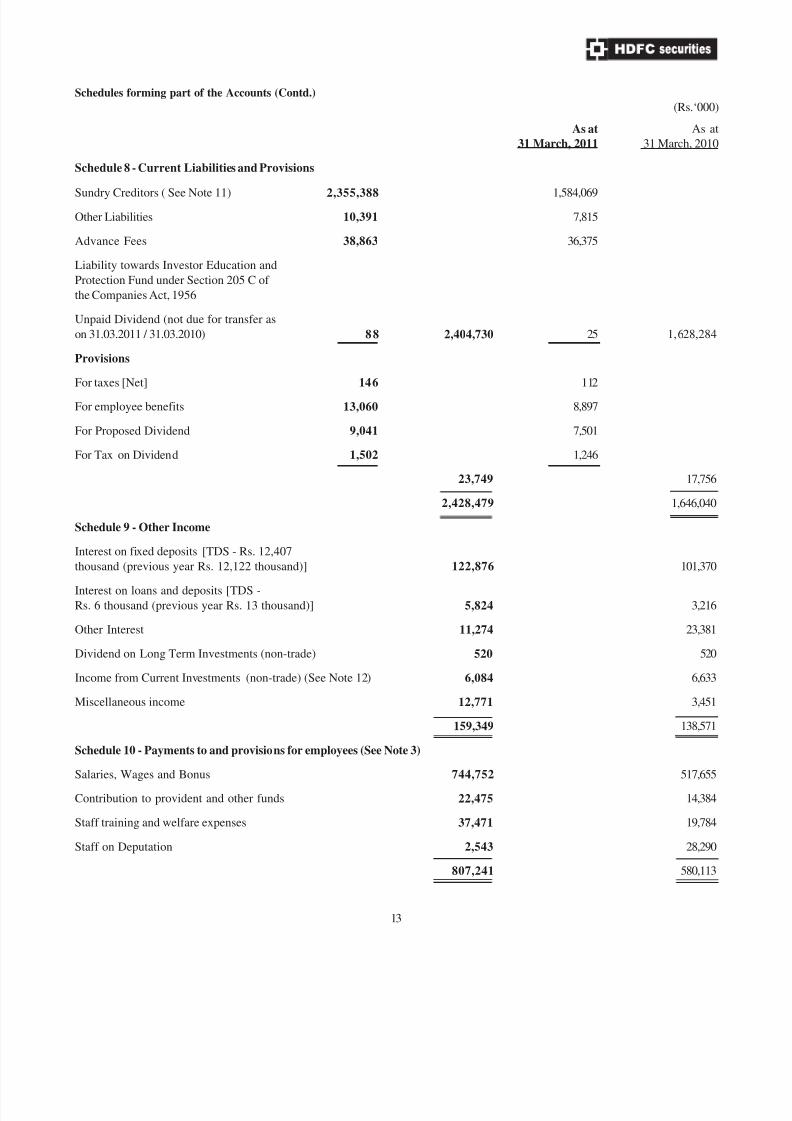
Schedule 8 - Current Liabilities and Provisions
Sundry Creditors ( See Note 11) 2,355,388 1,584,069
Other Liabilities 10,391 7,815
Advance Fees 38,863 36,375
Liability towards Investor Education and
Protection Fund under Section 205 C of
the Companies Act, 1956
Unpaid Dividend (not due for transfer as
on 31.03.2011 / 31.03.2010) 88 2,404,730 25 1,62
Provisions
For taxes [Net] 146 112
For employee benefits 13,060 8,897
For Proposed Dividend 9,041 7,501
For Tax on Dividend 1,502 1,246
23,749
2,428,479 1,6
Schedule 9 - Other Income
Interest on fixed deposits [TDS - Rs. 12,407
thousand (previous year Rs. 12,122 thousand)] 122,876 1
Interest on loans and deposits [TDS -
Rs. 6 thousand (previous year Rs. 13 thousand)] 5,824
Other Interest 11,274
Dividend on Long Term Investments (non-trade) 520
Income from Current Investments (non-trade) (See Note 12) 6,084
Miscellaneous income 12,771
159,349 1
Schedule 10 - Payments to and provisions for employees (See Note 3)
Salaries, Wages and Bonus 744,752 5
Contribution to provident and other funds 22,475
Staff training and welfare expenses 37,471
Staff on Deputation 2,543
807,241 5

8/3/2019 Annual Reports 2010 11
http://slidepdf.com/reader/full/annual-reports-2010-11 17/64
14
Schedules forming part of the Accounts (Contd.)
(R
Year ended Year
31 March, 2011 31 March
Schedule 11 - Operating Expenses
Stamp, registration and trading expenses 72,612
Outsourcing and Professional fees (See Note 3) 78,889 7
Directors’ sitting fees 580
Repairs and maintenance - Buildings 20,284 13,527
- Others 46,422 66,706 49,749 6
Rent 105,702 6
Rates and taxes 3,900
Membership and subscriptions 9,827
Advertisement and Marketing 28,937 2
Commission 2,624
Electricity 20,203 2
Auditors’ Remuneration
Audit fees 900
Other matters 10
Out of pocket expenses 6
Website maintenance expenses 5,293
Printing and stationery 12,892
Insurance 1,822
Travelling and Conveyance expenses 26,756 1
Postage & communication expenses 100,536 9
SEBI turnover fees 1,282
Wealth Tax 127
Provision for doubtful debts 320
Loss on sale of Fixed Assets (Net) 125
Miscellaneous expenses 9,050 1
549,099 47
Schedule 12 - Finance Charges
Bank Guarantee Charges 4,893
Bank charges 157
Interest paid - others 35
5,085
8/3/2019 Annual Reports 2010 11
http://slidepdf.com/reader/full/annual-reports-2010-11 18/64
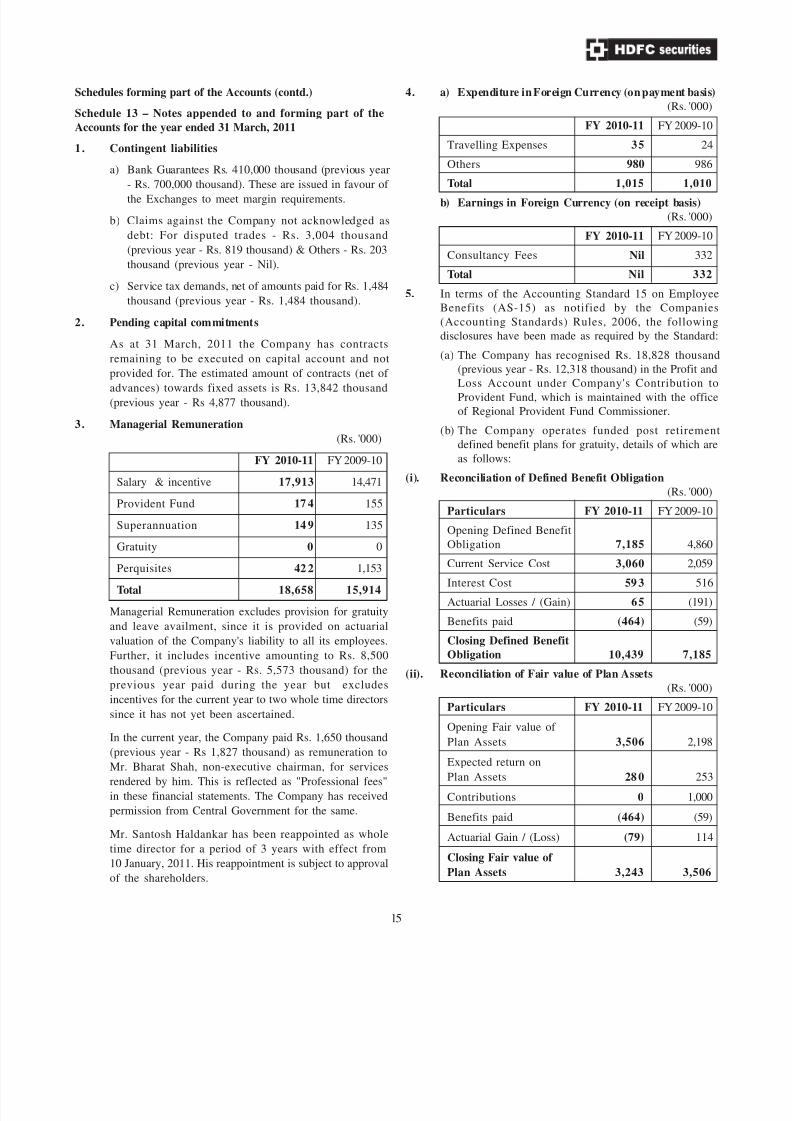
Schedules forming part of the Accounts (contd.)
Schedule 13 – Notes appended to and forming part of the
Accounts for the year ended 31 March, 2011
1. Contingent liabilities
a) Bank Guarantees Rs. 410,000 thousand (previous year
- Rs. 700,000 thousand). These are issued in favour of the Exchanges to meet margin requirements.
b) Claims against the Company not acknowledged as
debt: For disputed trades - Rs. 3,004 thousand
(previous year - Rs. 819 thousand) & Others - Rs. 203
thousand (previous year - Nil).
c) Service tax demands, net of amounts paid for Rs. 1,484
thousand (previous year - Rs. 1,484 thousand).
2. Pending capital commitments
As at 31 March, 2011 the Company has contracts
remaining to be executed on capital account and not
provided for. The estimated amount of contracts (net of advances) towards fixed assets is Rs. 13,842 thousand
(previous year - Rs 4,877 thousand).
3. Managerial Remuneration
(Rs. '000)
FY 2010-11 FY 2009-10
Salary & incentive 17,913 14,471
Provident Fund 17 4 155
Superannuation 14 9 135
Gratuity 0 0
Perquisites 42 2 1,153
Total 18,658 15,914
Managerial Remuneration excludes provision for gratuity
and leave availment, since it is provided on actuarial
valuation of the Company's liability to all its employees.
Further, it includes incentive amounting to Rs. 8,500
thousand (previous year - Rs. 5,573 thousand) for the
previous year paid during the year but excludes
incentives for the current year to two whole time directors
since it has not yet been ascertained.
In the current year, the Company paid Rs. 1,650 thousand
(previous year - Rs 1,827 thousand) as remuneration toMr. Bharat Shah, non-executive chairman, for services
rendered by him. This is reflected as "Professional fees"
in these financial statements. The Company has received
permission from Central Government for the same.
Mr. Santosh Haldankar has been reappointed as whole
time director for a period of 3 years with effect from
10 January, 2011. His reappointment is subject to approval
of the shareholders.
4. a) Expenditure in Foreign Currency (on paymen
(Rs
FY 2010-11 FY 20
Travelling Expenses 35
Others 980
Total 1,015b) Earnings in Foreign Currency (on receipt ba
(Rs
FY 2010-11 FY 20
Consultancy Fees Nil
Total Nil
5. In terms of the Accounting Standard 15 on Em
Benefits (AS-15) as notified by the Com
(Accounting Standards) Rules, 2006, the foll
disclosures have been made as required by the Sta
(a) The Company has recognised Rs. 18,828 th
(previous year - Rs. 12,318 thousand) in the ProLoss Account under Company's Contribut
Provident Fund, which is maintained with the
of Regional Provident Fund Commissioner.
(b) The Company operates funded post retir
defined benefit plans for gratuity, details of wh
as follows:
(i). Reconciliation of Defined Benefit Obligation
(Rs
Particulars FY 2010-11 FY 20
Opening Defined Benefit
Obligation 7,185
Current Service Cost 3,060
Interest Cost 59 3
Actuarial Losses / (Gain) 65
Benefits paid (464)
Closing Defined Benefit
Obligation 10,439 7
(ii). Reconciliation of Fair value of Plan Assets
(Rs
Particulars FY 2010-11 FY 20
Opening Fair value of
Plan Assets 3,506
Expected return on
Plan Assets 28 0
Contributions 0
Benefits paid (464)
Actuarial Gain / (Loss) (79)
Closing Fair value of
Plan Assets 3,243 3
15

8/3/2019 Annual Reports 2010 11
http://slidepdf.com/reader/full/annual-reports-2010-11 19/64
(iii). Amount to be recognised in Balance Sheet and movement
in net liability
(Rs. '000)
Particulars FY 2010-11 FY 2009-10
Present Value of Funded
Obligation 10,439 7,185
Fair Value of Plan Assets 3,243 3,506
Net Liability Recognised
in the Balance Sheet
under 'Sundry Creditors' (7,196) (3,679)
(iv). Expenses recognised in the Profit and Loss Account
(Rs. '000)
Particulars FY 2010-11 FY 2009-10
Current Service Cost 3,060 2,059
Interest Cost 59 3 516
Expected return on
Plan Assets (280) (253)
Actuarial Losses /
(Gain) - (net) 14 3 (306)
Net gratuity expenses
included in 'Payments
to and provisions for
employees' 3,516 2,016
(v). Description of Plan Assets
Particulars FY 2010-11 FY 2009-10
% Invested % Invested
Debentures/Bonds 71 61
Equity 10 11
Government Securities 12 17
Other assets 7 11
Grand Total 100 100
(vi). Experience Adjustment
(Rs. '0
Particulars FY 2010-11 FY 2009-10 FY 2008-09 FY 2007-08 FY 200
Defined Benefit Obligation 10, 439 7,185 4,860 3,309
Fair value of Plan Assets 3,243 3,506 2,198 1,751
Surplus / (Deficit) (7,196) (3,679) (2,662) (1,558)
Experience Adjustments on Plan liabilities 66 9 83 (423) *
(Gain) / Loss
Experience Adjustments on Plan Assets (78) 114 (49) *
(Loss) / Gain
* Information not available
(vii). Summary of Actuarial Assumptions
Particulars FY 2010-11 FY 20
Discount Rate 8.50 % 8
Expected rate of return 8 %
on Assets
Salary Escalation Rate 5 %
Mortality Published Publ
notes under notes u
the LIC th
(1994-96) (199
mortality mor
tables t
(viii). Actual Return on Plan Assets
(Rs
Particulars FY 2010-11 FY 20
Expected Return on 28 0
Plan Assets
Actuarial gain/(loss) on (78)
Plan Asets
Actual return on 20 2
Plan Assets
(ix). Other Details
The Employer's best estimate of the contrib
expected to be paid to the plan during the
year - Rs. 4,048 thousand (FY 2009-10 - Rs.thousand).
The estimates of future salary increase conside
actuarial valuation, take account of inflation, sen
promotion and other relevant factors. The above infor
is certified by the actuary and relied upon by the Au
16
8/3/2019 Annual Reports 2010 11
http://slidepdf.com/reader/full/annual-reports-2010-11 20/64
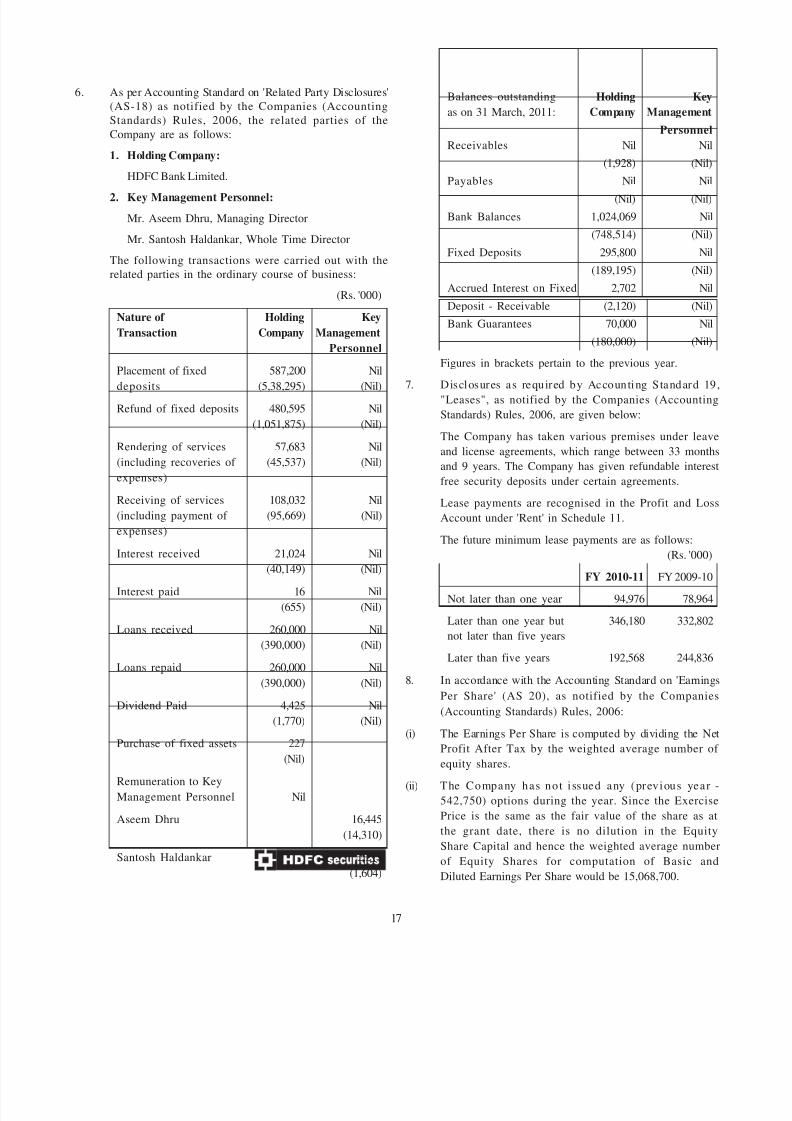
6. As per Accounting Standard on 'Related Party Disclosures'
(AS-18) as notified by the Companies (Accounting
Standards) Rules, 2006, the related parties of the
Company are as follows:
1. Holding Company:
HDFC Bank Limited.
2. Key Management Personnel:
Mr. Aseem Dhru, Managing Director
Mr. Santosh Haldankar, Whole Time Director
The following transactions were carried out with the
related parties in the ordinary course of business:
(Rs. '000)
Nature of Holding Key
Transaction Company Management
Personnel
Placement of fixed 587,200 Nildeposits (5,38,295) (Nil)
Refund of fixed deposits 480,595 Nil
(1,051,875) (Nil)
Rendering of services 57,683 Nil
(including recoveries of (45,537) (Nil)
expenses)
Receiving of services 108,032 Nil
(including payment of (95,669) (Nil)
expenses)
Interest received 21,024 Nil
(40,149) (Nil)
Interest paid 16 Nil
(655) (Nil)
Loans received 260,000 Nil
(390,000) (Nil)
Loans repaid 260,000 Nil
(390,000) (Nil)
Dividend Paid 4,425 Nil
(1,770) (Nil)
Purchase of fixed assets 227(Nil)
Remuneration to Key
Management Personnel Nil
Aseem Dhru 16,445
(14,310)
Santosh Haldankar 2,213
(1,604)
Balances outstanding Holding
as on 31 March, 2011: Company Manage
Pers
Receivables Nil
(1,928)
Payables Nil(Nil)
Bank Balances 1,024,069
(748,514)
Fixed Deposits 295,800
(189,195)
Accrued Interest on Fixed 2,702
Deposit - Receivable (2,120)
Bank Guarantees 70,000
(180,000)
Figures in brackets pertain to the previous year.
7. Disclosures as required by Accounting Standa
"Leases", as notified by the Companies (Acco
Standards) Rules, 2006, are given below:
The Company has taken various premises under
and license agreements, which range between 33 m
and 9 years. The Company has given refundable i
free security deposits under certain agreements.
Lease payments are recognised in the Profit an
Account under 'Rent' in Schedule 11.
The future minimum lease payments are as follow
(Rs
FY 2010-11 FY 20
Not later than one year 94,976 7
Later than one year but 346,180 33
not later than five years
Later than five years 192,568 24
8. In accordance with the Accounting Standard on 'E
Per Share' (AS 20), as notified by the Com
(Accounting Standards) Rules, 2006:
(i) The Earnings Per Share is computed by dividing t
Profit After Tax by the weighted average numequity shares.
(ii) The Company has not i ssued any (previous
542,750) options during the year. Since the Ex
Price is the same as the fair value of the share
the grant date, there is no dilution in the E
Share Capital and hence the weighted average n
of Equity Shares for computation of Basi
Diluted Earnings Per Share would be 15,068,700.
17

8/3/2019 Annual Reports 2010 11
http://slidepdf.com/reader/full/annual-reports-2010-11 21/64
FY 2010-11 FY 2009-10
a. Calculation of
weighted average
number of equity
shares:
Number of sharesat the beginning
of the year Nos. 15,001,000 15,001,000
Additions during
the year on
account of ESOP
exercised Nos. 67,700 -
Number of
shares at the
end of the year Nos. 15,068,700 15,001,000
b. Net profit after Rs. in
tax available '000for equity
shareholders 771,614 781,816
c. Basic and
Diluted
earnings per
share of
Rs. 10 each Rs. 51.21 52.12
9. Taxation
a) Provision for current tax includes interest - Rs. 1,001
thousand (previous year Rs. 3,848 thousand) and
earlier year's tax liability is Nil (previous year -Rs. 14,962 thousand).
b) Deferred Tax
The components of deferred tax assets and liabilities
arising on account of timing differences are:
(Rs. '000)
31 March, 2011 31 March, 2010
Assets
Provision for
employee benefits 2,492 1,473
Provision for
Doubtful debts 324 640
Provision for lease
rental - 3,602
Depreciation 3,142 736
Total 5,958 6,451
Deferred tax asset 5,958 6,451
10. Segment Reporting
The Company's business is to provide brokin
investment services to its clients in the capital ma
India. All other activities of the Company revolve
the main business. As such, there are no repo
segments as per the Accounting Standard on Se
Reporting (AS-17), as notified by the Com(Accounting Standards) Rules, 2006.
11. On the basis of the intimation received from 'su
regarding their status under the Micro, Small and M
Enterprises Development Act, 2006 there are eigh
(previous year - five) suppliers registered under th
Act and there are no amounts unpaid, to th
suppliers, as at the year end.
12. Investments
During the year the Company acquired and so
following investments in Mutual funds (inc
Dividend reinvested)
No. of units No. of
Particulars FY 2010-11 FY 20
203I / HDFC Cash 9,985,168.01
Management Fund-
Treasury Advantage
Plan-Wholesale-Daily
Dividend*,
Option : Reinvest
3010 / HDFC Liquid 4,078,769.15 28,516,6
Fund Premium Plan -
Dividend - Daily
Reinvest*, Option:
Reinvest
Reliance Medium 11,737,032.09 5,305,4
Term Fund - Daily
Dividend Plan
Reliance Liquid Fund- 26,878,664.36 8,241,6
Treasury Plan -
Institutional Option -
Daily Dividend Option
Reliance Monthly 4,039,618.60
Interval Fund -
Series I- Institutional
Dividend Plan1524 ICICI Prudential 8,190,674.80 3,249,7
Flexible Income Plan
Premium - Daily
Dividend
1564 ICICI Prudential 14,435,564.19 2,661,0
Liquid Super
Institutional Plan -
Div - Daily
18
8/3/2019 Annual Reports 2010 11
http://slidepdf.com/reader/full/annual-reports-2010-11 22/64
32ISD ICICI Prudential Nil 40,310,927.41
Institutional Liquid
Plan-Super
Institutional Daily Div
28Q ICICI Prudential Nil 31,636,540.57
Flexible Income Plan
Premium - DailyDividend
LFRCD ICICI 14,274,456.49 Nil
Prudential Long Term
Floating Rate Plan C -
Monthly Dividend,
Option : Dividend
Payout
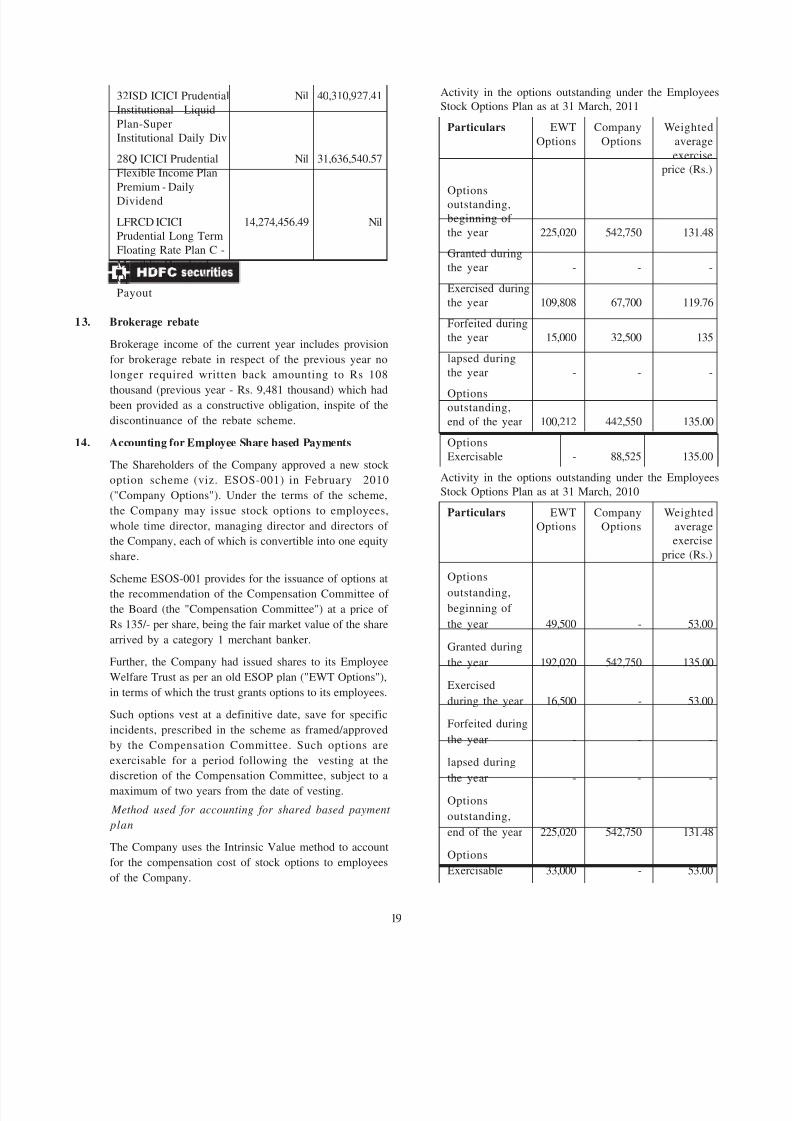
13. Brokerage rebate
Brokerage income of the current year includes provision
for brokerage rebate in respect of the previous year no
longer required written back amounting to Rs 108thousand (previous year - Rs. 9,481 thousand) which had
been provided as a constructive obligation, inspite of the
discontinuance of the rebate scheme.
14. Accounting for Employee Share based Payments
The Shareholders of the Company approved a new stock
option scheme (viz. ESOS-001) in February 2010
("Company Options"). Under the terms of the scheme,
the Company may issue stock options to employees,
whole time director, managing director and directors of
the Company, each of which is convertible into one equity
share.Scheme ESOS-001 provides for the issuance of options at
the recommendation of the Compensation Committee of
the Board (the "Compensation Committee") at a price of
Rs 135/- per share, being the fair market value of the share
arrived by a category 1 merchant banker.
Further, the Company had issued shares to its Employee
Welfare Trust as per an old ESOP plan ("EWT Options"),
in terms of which the trust grants options to its employees.
Such options vest at a definitive date, save for specific
incidents, prescribed in the scheme as framed/approved
by the Compensation Committee. Such options areexercisable for a period following the vesting at the
discretion of the Compensation Committee, subject to a
maximum of two years from the date of vesting.
Method used for accounting for shared based payment
plan
The Company uses the Intrinsic Value method to account
for the compensation cost of stock options to employees
of the Company.
Activity in the options outstanding under the Emp
Stock Options Plan as at 31 March, 2011
Particulars EWT Company Wei
Options Options av
ex
price
Optionsoutstanding,
beginning of
the year 225,020 542,750 1
Granted during
the year - -
Exercised during
the year 109,808 67,700 1
Forfeited during
the year 15,000 32,500
lapsed during
the year - -
Options
outstanding,
end of the year 100,212 442,550 1
Options
Exercisable - 88,525 1
Activity in the options outstanding under the Emp
Stock Options Plan as at 31 March, 2010
Particulars EWT Company Wei
Options Options av
ex
price
Options
outstanding,
beginning of
the year 49,500 -
Granted during
the year 192,020 542,750 1
Exercised
during the year 16,500 -
Forfeited during
the year - -
lapsed during
the year - -
Options
outstanding,
end of the year 225,020 542,750 1
Options
Exercisable 33,000 -
19

8/3/2019 Annual Reports 2010 11
http://slidepdf.com/reader/full/annual-reports-2010-11 23/64
Following summarises the information about stock
options outstanding as at 31 March, 2011
Plan Range Number Weighted Weighted
of of shares average average
exercise arising out life of exercise
price of options unvested price
(Rs.) options (Rs.)(in years)
Company
Options 135.00 442,550 3.14 135.00
EWT
Options 135.00 100,212 0.50 135.00
Following summarises the information about stock
options outstanding as at 31 March, 2010
Plan Range Number Weighted Weighted
of of shares average average
exercise arising out life of exercise
price of options unvested price
(Rs.) options (Rs.)
(in years)
Company
Options 135.00 542,750 4.10 135.00
EWT 53.00 to
Options 135.00 225,020 1.60 122.97
Fair Value methology
The fair value of options used to compute pro forma net
income and earnings per equity share have been
estimated on the dates of each grant using the Black andScholes model. The shares of the Company are not listed
on any stock exchange. Accordingly, the Company has
considered the volatility of the Company's stock price as
an average of the historical volatility of similar listed
enterprises for the purpose of calculating the fair value to
reduce any company specific variations. The various
assumptions considered in the pricing model for the stock
options granted by the Company during the year ended
31 March, 2010 are:
Particulars EWT Company
Options Options
Dividend Yield Nil Nil
Expected volatility 73.56% to 71.53% to
79.04% 72.67%
Risk - free interest rate 6.53% to 6.22% to
8.19% 7.18%
Expected life of the option 0 - 2 years 0 - 5 years
Impact of fair value method on net profit and EPS
Had compensation cost for the Company's stock
plans outstanding been determined based on the fai
approach, the Company's net profit and earnings pe
would have been as per the pro forma amounts in
below:
Particulars As at
31 March, 31 M2011
(Rs.'000) (Rs.
Net Profit (as reported) 771,614 78
Add: Stock based
compensation expense
included in net income -
Less: Stock based
compensation expense
determined under fair value
based method (pro forma) (19,861) (5
Net Profit (pro forma) 751,753 77(Rs.)
Basic and diluted earnings
per share (as reported) 51.21
Basic and diluted earnings
per share (pro forma) 49.89
15. Comparative figures
The previous year's figures are regrouped and rear
wherever necessary to conform to current
presentation.
B. Significant Accounting Policies1. Basis of preparation
The accounts are prepared on historical cost conv
on accrual basis and comply with the Acco
Standards notified by the Companies (Acco
Standards) Rules, 2006.
The preparation of the accounts requires the Manag
to make estimates and assumptions considered
reported amounts of assets and liabilities (inc
contingent liabilities) as of the date of the accoun
the reported income and expenses during the rep
period. The Management believes that the estimate
in preparation of the accounts are prudent and reasFuture results could differ due to these estimat
differences between actual results and estimat
recognised in the periods in which the results are k
materialise.
2 Revenue recognition
a) Income from brokerage activities is recogni
income on the trade date of the transa
Brokerage is stated net of rebate.
20
8/3/2019 Annual Reports 2010 11
http://slidepdf.com/reader/full/annual-reports-2010-11 24/64
b) Income from other services is recognised on
completion of services.
c) Interest income is recognised in the Profit and Loss
Account on an accrual basis.
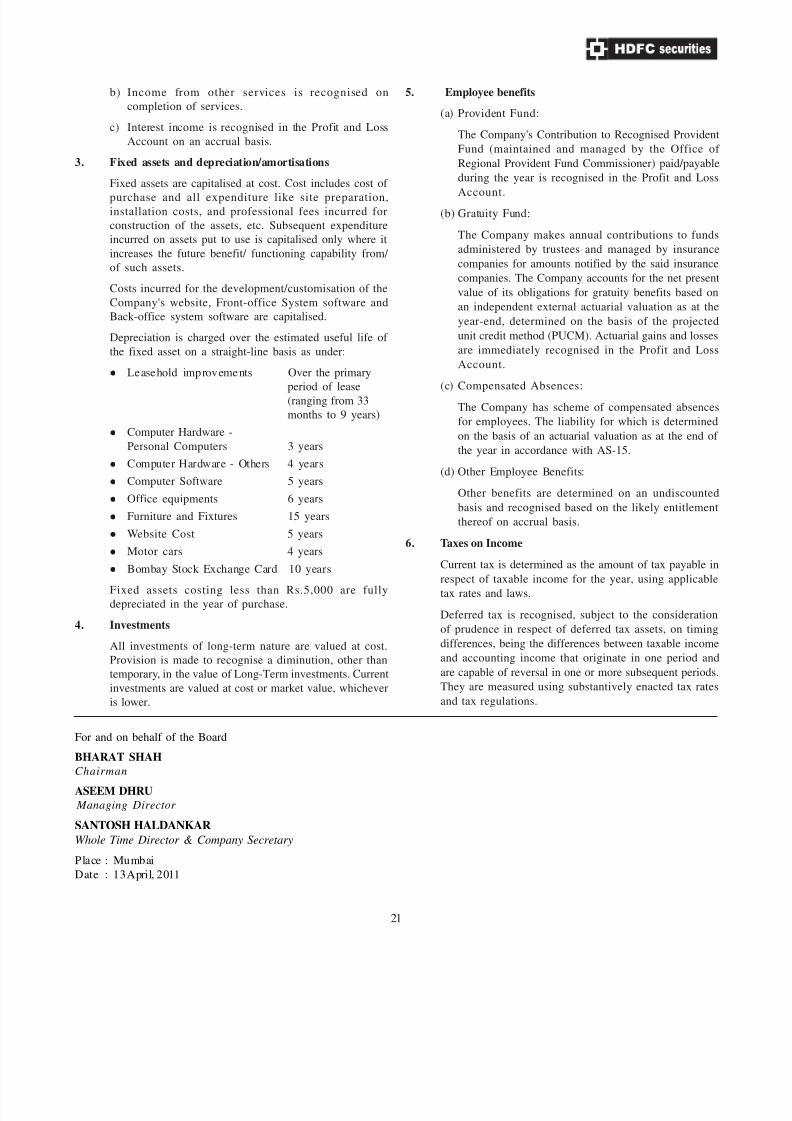
3. Fixed assets and depreciation/amortisations
Fixed assets are capitalised at cost. Cost includes cost of purchase and all expenditure like site preparation,
installation costs, and professional fees incurred for
construction of the assets, etc. Subsequent expenditure
incurred on assets put to use is capitalised only where it
increases the future benefit/ functioning capability from/
of such assets.
Costs incurred for the development/customisation of the
Company's website, Front-office System software and
Back-office system software are capitalised.
Depreciation is charged over the estimated useful life of
the fixed asset on a straight-line basis as under:
Leasehold improvements Over the primaryperiod of lease
(ranging from 33
months to 9 years)
Computer Hardware -
Personal Computers 3 years
Computer Hardware - Others 4 years
Computer Software 5 years
Office equipments 6 years
Furniture and Fixtures 15 years
Website Cost 5 years
Motor cars 4 years
Bombay Stock Exchange Card 10 years
Fixed assets costing less than Rs.5,000 are fully
depreciated in the year of purchase.
4. Investments
All investments of long-term nature are valued at cost.
Provision is made to recognise a diminution, other than
temporary, in the value of Long-Term investments. Current
investments are valued at cost or market value, whichever
is lower.
5. Employee benefits
(a) Provident Fund:
The Company's Contribution to Recognised Pro
Fund (maintained and managed by the Off
Regional Provident Fund Commissioner) paid/p
during the year is recognised in the Profit an
Account.
(b) Gratuity Fund:
The Company makes annual contributions to
administered by trustees and managed by ins
companies for amounts notified by the said ins
companies. The Company accounts for the net
value of its obligations for gratuity benefits ba
an independent external actuarial valuation as
year-end, determined on the basis of the pro
unit credit method (PUCM). Actuarial gains and
are immediately recognised in the Profit an
Account.
(c) Compensated Absences:
The Company has scheme of compensated ab
for employees. The liability for which is deter
on the basis of an actuarial valuation as at the
the year in accordance with AS-15.
(d) Other Employee Benefits:
Other benefits are determined on an undisc
basis and recognised based on the likely entit
thereof on accrual basis.
6. Taxes on Income
Current tax is determined as the amount of tax payrespect of taxable income for the year, using app
tax rates and laws.
Deferred tax is recognised, subject to the consid
of prudence in respect of deferred tax assets, on
differences, being the differences between taxable i
and accounting income that originate in one peri
are capable of reversal in one or more subsequent p
They are measured using substantively enacted ta
and tax regulations.
For and on behalf of the Board
BHARAT SHAH
Chairman
ASEEM DHRU
Managing Director
SANTOSH HALDANKAR
Whole Time Director & Company Secretary
Place : Mumbai
Date : 13 April, 2011
21

8/3/2019 Annual Reports 2010 11
http://slidepdf.com/reader/full/annual-reports-2010-11 25/64
PART IV
Balance Sheet abstract and Company’s General Business Profile
I Registration Details
Registration No. : 152193 State Code: : 1
Balance Sheet Date : 31-03-11
II Capital Raised during the period (Amount in Rs. ’000)
Public Issue : N I L Rights Issue : N I
Bonus Issue : N I L Private Placement : N I
ESOP : 677
III Position of Mobilisation and Deployment of Funds (Amount in Rs. ’000)
Total Liabilities : 24,95,757 Total Assets : 24,95,75
Sources of Funds (Amount in Rs. ’000)
Paid-up Capital : 150,687 Reserves & Surplus : 23,45,07
Secured Loans : N I L Unsecured Loans : N I
Deferred Tax Liability : N I L
Application of Funds (Amount in Rs. ’000)
Net Fixed Assets : 2,02,867 Investments : 8,41
Deferred Tax Assets : 5,958 Net Current Assets 22,78,52
Misc. Expenditure : N I L Accumulated losses N I
IV Performance of Company (Amount in Rs. ’000)
Turnover : 26,05,138 Total Expenditure : 14,46,03
Profit/Loss before Tax : 11,59,107 Profit/Loss after Tax : 7,71,61
Earning Per Share in Rs. : 51.21 Dividend Rate % : 6%
V Generic Names of Principal Product/Services of the Company (as per monetary terms)
Item Code No. (ITC Code) : -
Product Description : Stock broking and related services
22

8/3/2019 Annual Reports 2010 11
http://slidepdf.com/reader/full/annual-reports-2010-11 26/64
8/3/2019 Annual Reports 2010 11
http://slidepdf.com/reader/full/annual-reports-2010-11 27/64
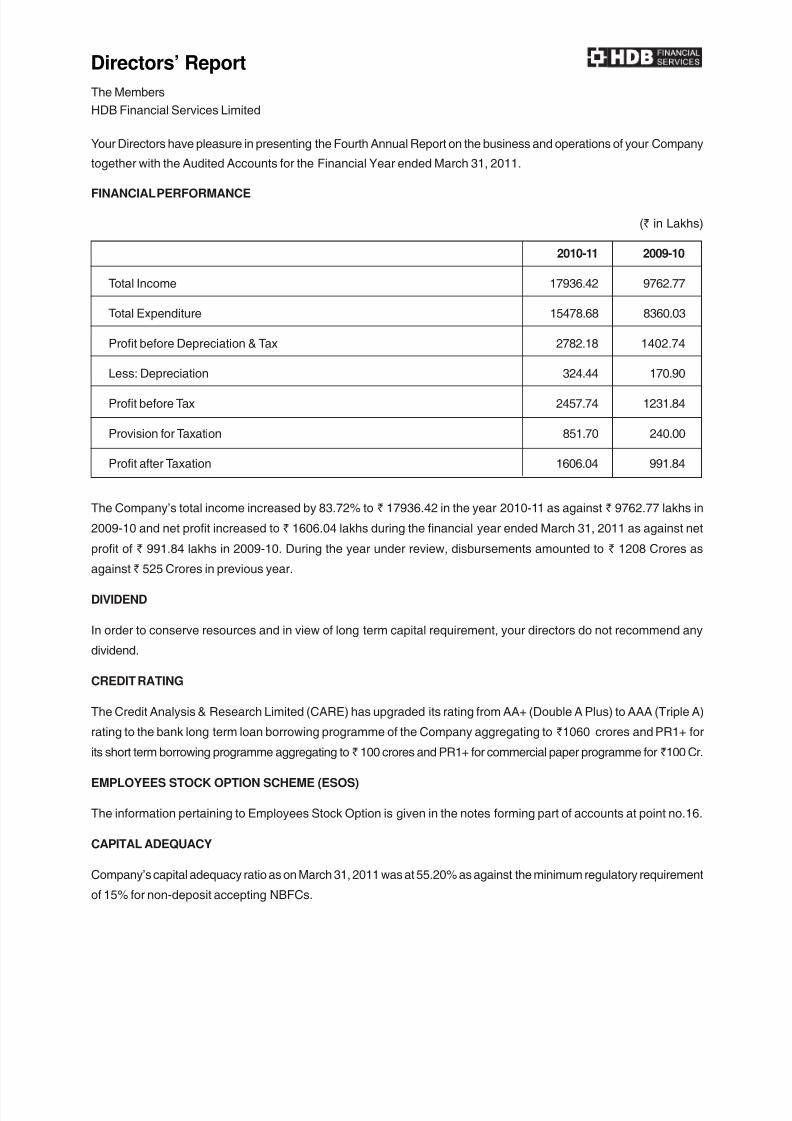
The Members
HDB Financial Services Limited
Your Directors have pleasure in presenting the Fourth Annual Report on the business and operations of your Comp
together with the Audited Accounts for the Financial Year ended March 31, 2011.
FINANCIAL PERFORMANCE
(` in Lak
2010-11 2009-10
Total Income 17936.42 9762.77
Total Expenditure 15478.68 8360.03
Profit before Depreciation & Tax 2782.18 1402.74
Less: Depreciation 324.44 170.90
Profit before Tax 2457.74 1231.84
Provision for Taxation 851.70 240.00
Profit after Taxation 1606.04 991.84
The Company’s total income increased by 83.72% to ` 17936.42 in the year 2010-11 as against ` 9762.77 lakh
2009-10 and net profit increased to ` 1606.04 lakhs during the financial year ended March 31, 2011 as against
profit of ` 991.84 lakhs in 2009-10. During the year under review, disbursements amounted to ` 1208 Crores
against ` 525 Crores in previous year.
DIVIDEND
In order to conserve resources and in view of long term capital requirement, your directors do not recommend
dividend.
CREDIT RATING
The Credit Analysis & Research Limited (CARE) has upgraded its rating from AA+ (Double A Plus) to AAA (Triple
rating to the bank long term loan borrowing programme of the Company aggregating to `1060 crores and PR1+
its short term borrowing programme aggregating to `100 crores and PR1+ for commercial paper programme for `100
EMPLOYEES STOCK OPTION SCHEME (ESOS)
The information pertaining to Employees Stock Option is given in the notes forming part of accounts at point no.
CAPITAL ADEQUACY
Company’s capital adequacy ratio as on March 31, 2011 was at 55.20% as against the minimum regulatory requirem
of 15% for non-deposit accepting NBFCs.
Directors’ Report
8/3/2019 Annual Reports 2010 11
http://slidepdf.com/reader/full/annual-reports-2010-11 28/64
MANAGEMENT DISCUSSIONS AND ANALYSIS REPORT
Macro Economic Environment
During 2010, the Indian economy saw acceleration in the pace of growth due to rebound in rural income with increa
in agricultural production and a good industrial service sector growth. The Economic Survey speaks for GDP grow
of 8.2% for current fiscal and 9% for 2011.
The Liquidity situation altered significantly since June, 2010 following the auction of telecom licenses which led
outflow of liquidity from the banking system. Further the credit growth on back of economic revival exerted a hu
strain on the liquidity position. High Interest rate regime continued during the major part for the financial year.
While the macro economic outlook remains positive, concerns remain due to pressures from rising crude prices
the wake of the ongoing turmoil in the Middle East and North Africa, the devastating earthquake that struck Jap
and continuing worries about the debt crisis in the Euro zone. On the domestic front, high inflation along with h
interest rates weighed on corporates.
Industry Structure and Developments
During the year 2010-11, NBFCs borrowed with increased cost of funds in line with the market liquidity. The Governme
in tandem with the regulatory bodies, took a number of policy and structural measures to contain the inflatio
Despite constraints, NBFCs have been able to grow their balance sheet and manage their non-performing ass
(NPAs) to sustainable levels.
NBFCs are poised to establish a stronger presence in the retail finance space and focus on the retail lend
portfolio. The recent trends of strong growth and improving asset quality and profitability are likely to contin
strengthening the credit risk profiles of NBFCs over the medium term.
Under the new RBI norms, in the interest of counter cyclicity, NBFCs will have to set aside 0.25 percent of stand
assets as contingent provisions. Further Capital adequacy for NBFC ND-SI has been increased from 12% to 1
with effect from March 31, 2011.
Opportunities
NBFC have with their understanding of customer needs, focused on product innovation and customization-fact
that will help them gain an edge over banks while maintaining their niche positioning.
The Company is confident that the year 2011-12 will bring reasonable growth. The lead indicators of econom
performance across sectors and high GDP growth rate suggest that economic revival will sustain and this will thrup opportunities for your company. The Company continues to focus on Product / Customer Segments that are lik
to give the company an advantage over the long term.
Threats
Growth of the company’s asset book, quality of assets and ability to raise funds depends significantly on t
economy. Unfavorable events in the Indian Economy can affect consumer sentiment and in turn impact consum
decisions to purchase financial products. Changes in Government policy and regulatory framework could impact
company’s operations.
Directors’ Report

8/3/2019 Annual Reports 2010 11
http://slidepdf.com/reader/full/annual-reports-2010-11 29/64
The Company has competition from a broad range of Financial Services Providers including Commercial Banks a
other NBFC Companies. Any action by other players could lead to pricing pressures and impact the company.
Ability to appropriately price risk and manage operational risks consistently are key to the company’s performan
over the long term.
Operations
Products and Services
Retail lending, besides individuals, also addresses requirements of businesses whose borrowing needs are akin
individual borrowers. Thus, requirements of small and micro enterprises that are too small to be serviced by corpor
Lending Institutions are also well serviced by Retail Lenders.
The segments being addressed are typically underserviced by the larger Commercial banks thus creating a profita
niche for the Company to address. The Company grants loans to small and medium business enterprises and mi
small and medium enterprises. More than half of the present book is lending towards this sector.
The Company has launched the following products and services:
Loans – The Company offers a range of Loans in the Unsecured and Secured Loans space that fulfill the finan
needs of its target Segment.
Insurance Services – The Company is a corporate agent for HDFC Standard Life Insurance Company Limit
The Company sells Standalone Insurance products and also products such as Loan Cover and Asset Cover.
Collections-BPO Services – The Company has a contract with HDFC Bank for collection services. The Compa
has 6 call centres with a capacity over 1500 seats. These centers cover collection requirements at over 100 tow
through its Calling and Field Teams.
Infrastructure
The Company has 100 branches in 65 cities thus creating the right distribution network to sell company’s Produ
and Services. The company has its Data Centre at Bengaluru and centralized operations at Hyderabad and Chenn
The Business Process Outsourcing (BPO) vertical of the Company which has call centre now operates fro
6 collection centers with a capacity of over 1500 work stations.
Internal Control Systems
In the opinion of the Management, the Company has adequate systems and procedures to provide assurance
recording transactions in all material respects.
The Company has appointed M/s. Contractor, Nayak & Kishnadwala, Chartered Accountants to conduct an inter
audit and such audit reports envisages all areas and the reports are placed before the Audit Committee of the Boa
Outlook
The markets will continue to grow and mature leading to differentiation of products and services. Each financ
intermediary will have to find his niche in order to add value to consumers. The company is optimistic in its outlo
for the year 2011-12.
Directors’ Report

8/3/2019 Annual Reports 2010 11
http://slidepdf.com/reader/full/annual-reports-2010-11 30/64
FIXED DEPOSITS
The Company is a non deposit taking company (NBFC-ND-SI). The Company had not accepted any Fixed Depo
during the period under review.
INCREASE IN PAID UP SHARE CAPITAL
During the period under review, the paid up capital of the company increased from ` 105 crores
` 410 Crores. In June 2010, the company issued 10,00,00,000 Equity at ` 15/- per share includ
premium of ` 5 per share as a preferential allotment to Promoter amounting to ` 150 crores. In March 20
the company offered 20,51,32,000 equity shares through a rights issue in the ratio of one share for ev
share held to all the existing shareholders at ` 22/- per share including a premium of ` 12 per share total amount
to ` 451 crores.
INTERNAL AUDIT AND COMPLIANCE
The internal control system of the company is well commensurate with the size, scale and complexity of operatio
It is constantly being reviewed and strengthened with new and revised operating procedures. The Company has
Internal Audit and Compliance functions in place in accordance with regulatory requirements. The internal au
function is being carried out by external firm of chartered accountants and their reports are placed on quarterly ba
to the Audit committee. The Audit Committee reviews the performance of the Audit and Compliance functions,
effectiveness of controls and compliance with regulatory guidelines and gives directions to the Manageme
appropriately.
RISK MANAGEMENT AND PORTFOLIO QUALITY
The Company recognizes the importance of Risk Management and has accordingly invested in processes, peo
and a management structure. Risk Committee of the Company also reviews the asset quality at frequent interva
Product Policy programs are duly approved before any new product launches and are fine tuned regularly. The as
quality of the company continues to remain healthy and the Gross Net Performing Asset of the company are
0.33% and Net Performing assets @ 0.18% as of March 31, 2011.
RBI GUIDELINES
The company has complied with all the applicable regulations of the Reserve Bank of India.
HUMAN RESOURCES
People remain the most valuable asset of your company. Your Company continued to build on its capabilit
in getting the right talent to support different products and geographies. Your company has employees in ov65 cities. To improve employee engagement, the Company has introduced a new Employee Self Service po
on Intranet. The policies and procedures pertaining to Human Resources and operations are also available to employe
in the intranet. As on date, the Company has staff strength of 2981. The Company has 51% of women staff in c
centres which show company’s commitment towards women’s empowerment.
STATUTORY DISCLOSURES
1. The information required under Section 217(2A) of the Companies Act, 1956 and the rules made there under
given in the Annexure I appended hereto and forms part of this report.
Directors’ Report

8/3/2019 Annual Reports 2010 11
http://slidepdf.com/reader/full/annual-reports-2010-11 31/64
Directors’ Report
2. The provisions of Section 217(1)(e) of the Companies Act, 1956 relating to conservation of energy and technolo
absorption do not apply to your Company as it is not a manufacturing company.
3. The Company had no Foreign Exchange inflow and outgo for the period under review.
DIRECTORS RESPONSIBILITY STATEMENT
The Board of Directors hereby state that:
1. In preparation of the annual accounts, the applicable accounting standards have been followed along with pro
explanation relating to material departures.
2. We have selected such accounting policies and applied them consistently and made judgments a
estimates that are reasonable and prudent so as to give a true and fair view of the state of affairs of the compa
at the end of the financial year and of the profit and loss of the company for that period.
3. Proper and sufficient care has been taken for the maintenance of adequate accounting records in accordan
with the provisions of the Companies Act, 1956 for safeguarding the assets of the company and for preventing adetecting fraud and other irregularities.
4. The annual accounts have been prepared on a going concern basis.
DIRECTORS
Pursuant to provisions of the Companies Act, 1956 and Articles of Association of the Company, Mr. Aseem Dhru
retire by rotation at the ensuing Annual General Meeting and being eligible offered himself for re-appointment.
AUDITORS
M/s. Haribhakti & Co., Chartered Accountants were appointed by the Board as Statutory Auditors of the Compawho hold office until the conclusion of the ensuing Annual General Meeting and are eligible for re-appointme
Your Directors recommend their re-appointment.
CORPORATE GOVERNANCE REPORT
A report on Corporate Governance is set in the Annexure forming part of this report.
ACKNOWLEDGEMENT
Your Directors would like to record their appreciation of the hard work and commitment of the Company’s employe
which resulted in the good performance, recorded for the year and warmly acknowledges the support extended
the Reserve Bank of India, other regulatory and government bodies, Company’s auditors, customers, banke
Promoters and shareholders.
By Order of the Boa
Place : Mumbai Vinod YennemDate : April 15, 2011 Chairm
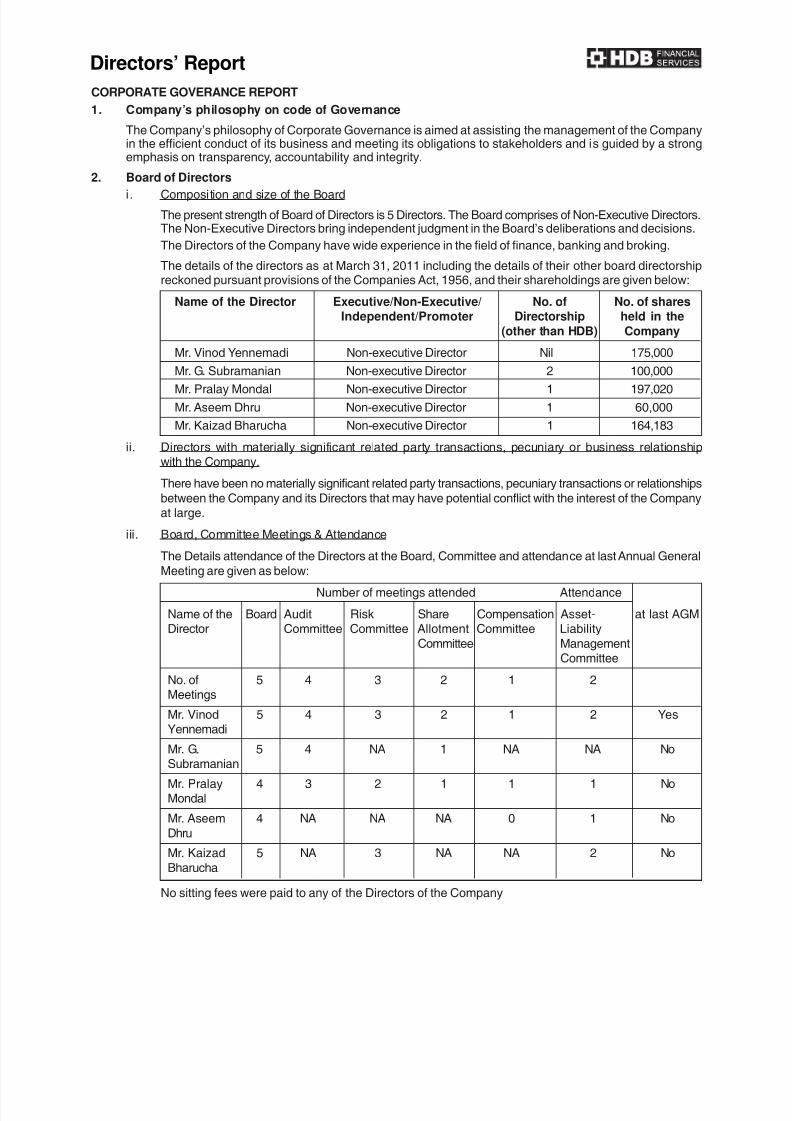
8/3/2019 Annual Reports 2010 11
http://slidepdf.com/reader/full/annual-reports-2010-11 32/64
Directors’ Report
CORPORATE GOVERANCE REPORT
1. Company’s philosophy on code of Governance
The Company’s philosophy of Corporate Governance is aimed at assisting the management of the Compain the efficient conduct of its business and meeting its obligations to stakeholders and is guided by a stroemphasis on transparency, accountability and integrity.
2. Board of Directors
i . Composition and size of the Board
The present strength of Board of Directors is 5 Directors. The Board comprises of Non-Executive DirectoThe Non-Executive Directors bring independent judgment in the Board’s deliberations and decision
The Directors of the Company have wide experience in the field of finance, banking and broking.
The details of the directors as at March 31, 2011 including the details of their other board directorsreckoned pursuant provisions of the Companies Act, 1956, and their shareholdings are given below
Name of the Director Executive/Non-Executive/ No. of No. of sharesIndependent/Promoter Directorship held in the
(other than HDB) Company
Mr. Vinod Yennemadi Non-executive Director Nil 175,000
Mr. G. Subramanian Non-executive Director 2 100,000Mr. Pralay Mondal Non-executive Director 1 197,020
Mr. Aseem Dhru Non-executive Director 1 60,000
Mr. Kaizad Bharucha Non-executive Director 1 164,183
ii. Directors with materially significant related party transactions, pecuniary or business relationswith the Company.
There have been no materially significant related party transactions, pecuniary transactions or relationsh
between the Company and its Directors that may have potential conflict with the interest of the Compaat large.
iii. Board, Committee Meetings & Attendance
The Details attendance of the Directors at the Board, Committee and attendance at last Annual GeneMeeting are given as below:
Number of meetings attended Attendance
Name of the Board Audit Risk Share Compensation Asset- at last AGDirector Committee Committee Allotment Committee Liability
Committee ManagementCommittee
No. of 5 4 3 2 1 2Meetings
Mr. Vinod 5 4 3 2 1 2 YesYennemadi
Mr. G. 5 4 NA 1 NA NA NoSubramanian
Mr. Pralay 4 3 2 1 1 1 NoMondal
Mr. Aseem 4 NA NA NA 0 1 No
Dhru
Mr. Kaizad 5 NA 3 NA NA 2 No
Bharucha
No sitting fees were paid to any of the Directors of the Company

8/3/2019 Annual Reports 2010 11
http://slidepdf.com/reader/full/annual-reports-2010-11 33/64
3. General Body Meetings (2010-11)
Meeting Date and Time Venue Resolutions passed
AGM 2.30 p.m. HDFC Bank House, i. To consider and adopt the audite
31.05.2010 Plot No. 287, Balance Sheet as at 31st MarchTownship 2010 and Profit and Loss Accoun
Scheme No. 3, for the year ended on that date anNavrangpura, Reports of the Directors an
Ahmedabad - 380009 Auditors.ii. Re-Appointment of
Mr. G. Subramanian as Directoriii. Re-Appointment of
Mr. Pralay Mondal as Director
iv. To re-appoint M/s. Haribhakti Co., Chartered Accountants a
Statutory Auditor.v. Preferential Issue of Equit
Shares.vi. Issue of shares under Employe
Stock Option Scheme (ESOS).
EGM 4.00 p.m. Madhusudan Estate, i. Borrowing in excess of Paid-u
24.02.2011 Ground Floor, capital and free reservesPandurang Budhkar Marg, ii. Re-Appointment of Mr. Hare
Lower Parel (West), Parekh as ManagerMumbai 400 013 iii. Rights Issue of Equity Shares.
4. Shareholding pattern as at 31.03.2011
Name of Shareholders Shares held %
HDFC Bank Ltd 40,00,00,000 97.50%
Others 10,264,000 2.50%Total (Issued and Paid-up Shares) 410,264,000 100.00%
Directors’ Report

8/3/2019 Annual Reports 2010 11
http://slidepdf.com/reader/full/annual-reports-2010-11 34/64
Auditors’ Report
TO THE MEMBERS OF HDB FINANCIAL SERVICES LIMITED
1. We have audited the attached Balance Sheet of HDB Financial Services Limited ('the Company') as
March 31, 2011 and also the Profit and Loss account and the Cash Flow Statement for the year ended on t
date annexed thereto. These financial statements are the responsibility of the Company's manageme
Our responsibility is to express an opinion on these financial statements based on our audit.
2. We conducted our audit in accordance with auditing standards generally accepted in India. Those Standa
require that we plan and perform the audit to obtain reasonable assurance about whether the financial stateme
are free of material misstatement. An audit includes examining, on a test basis, evidence supporting t
amounts and disclosures in the financial statements. An audit also includes assessing the account
principles used and significant estimates made by management, as well as evaluating the overall financ
statement presentation. We believe that our audit provides a reasonable basis for our opinion.
3. As required by the Companies (Auditor's Report) Order, 2003, as amended by the Companies (Audito
Report) (Amendment) Order, 2004, issued by the Central Government of India in terms of sub-section (4A
Section 227 of 'The Companies Act, 1956' of India (the 'Act') and on the basis of such checks of the books a
records of the company as we considered appropriate and according to the information and explanations giv
to us, we give in the Annexure a statement on the matters specified in paragraphs 4 and 5 of the said Ord
4. Further to our comments in the paragraph 3 above, we report that:
i. We have obtained all the information and explanations, which to the best of our knowledge and be
were necessary for the purposes of our audit;
ii. In our opinion, proper books of account as required by law have been kept by the Company so far
appears from our examination of those books;
iii. The balance sheet, profit and loss account and cash flow statement dealt with by this report are
agreement with the books of account;
iv. In our opinion, the balance sheet, profit and loss account and cash flow statement dealt with by t
report comply with the accounting standards referred to in sub-section (3C) of section 211 of the Compan
Act, 1956.
v. On the basis of the written representations received from the directors, as on March 31, 2011, and tak
on record by the Board of Directors, we report that none of the directors is disqualified as on March
2011 from being appointed as a director in terms of clause (g) of sub-section (1) of section 274 of
Companies Act, 1956.
vi. In our opinion and to the best of our information and according to the explanations given to us, the s
accounts give the information required by the Companies Act, 1956, in the manner so required and g
a true and fair view in conformity with the accounting principles generally accepted in India;
a) in the case of the balance sheet, of the state of affairs of the Company as at March 31, 2011;
b) in the case of the profit and loss account, of the profit for the year ended on that date; and
c) in the case of cash flow statement, of the cash flows for the year ended on that date.
For Haribhakti & CChartered Accounta
Firm Registration No. 10352
Manoj Da
Place : Mumbai Part
Date : April 15, 2011 Membership No. 485
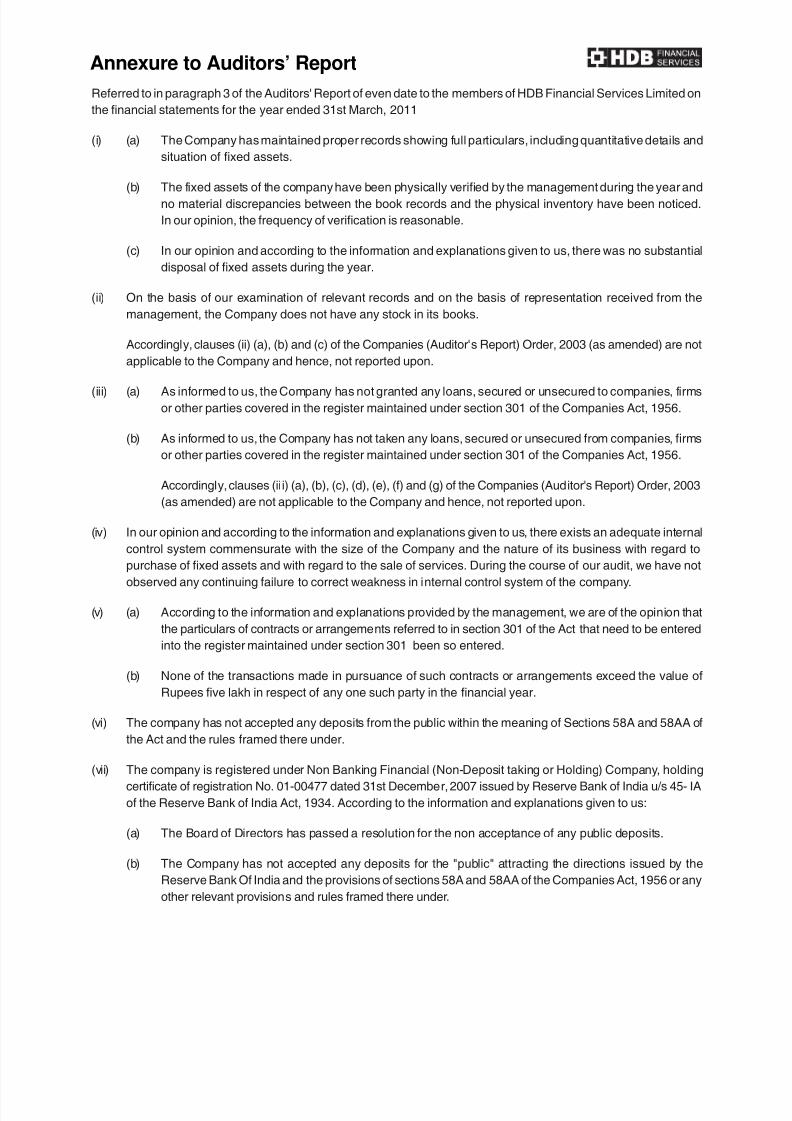
8/3/2019 Annual Reports 2010 11
http://slidepdf.com/reader/full/annual-reports-2010-11 35/64
Referred to in paragraph 3 of the Auditors' Report of even date to the members of HDB Financial Services Limited
the financial statements for the year ended 31st March, 2011
(i) (a) The Company has maintained proper records showing full particulars, including quantitative details a
situation of fixed assets.
(b) The fixed assets of the company have been physically verified by the management during the year ano material discrepancies between the book records and the physical inventory have been notic
In our opinion, the frequency of verification is reasonable.
(c) In our opinion and according to the information and explanations given to us, there was no substan
disposal of fixed assets during the year.
(ii) On the basis of our examination of relevant records and on the basis of representation received from
management, the Company does not have any stock in its books.
Accordingly, clauses (ii) (a), (b) and (c) of the Companies (Auditor's Report) Order, 2003 (as amended) are
applicable to the Company and hence, not reported upon.
(iii) (a) As informed to us, the Company has not granted any loans, secured or unsecured to companies, fir
or other parties covered in the register maintained under section 301 of the Companies Act, 1956.
(b) As informed to us, the Company has not taken any loans, secured or unsecured from companies, fir
or other parties covered in the register maintained under section 301 of the Companies Act, 1956.
Accordingly, clauses (iii) (a), (b), (c), (d), (e), (f) and (g) of the Companies (Auditor's Report) Order, 20
(as amended) are not applicable to the Company and hence, not reported upon.
(iv) In our opinion and according to the information and explanations given to us, there exists an adequate inter
control system commensurate with the size of the Company and the nature of its business with regard
purchase of fixed assets and with regard to the sale of services. During the course of our audit, we have
observed any continuing failure to correct weakness in internal control system of the company.
(v) (a) According to the information and explanations provided by the management, we are of the opinion t
the particulars of contracts or arrangements referred to in section 301 of the Act that need to be ente
into the register maintained under section 301 been so entered.
(b) None of the transactions made in pursuance of such contracts or arrangements exceed the value
Rupees five lakh in respect of any one such party in the financial year.
(vi) The company has not accepted any deposits from the public within the meaning of Sections 58A and 58AA
the Act and the rules framed there under.
(vii) The company is registered under Non Banking Financial (Non-Deposit taking or Holding) Company, hold
certificate of registration No. 01-00477 dated 31st December, 2007 issued by Reserve Bank of India u/s 45
of the Reserve Bank of India Act, 1934. According to the information and explanations given to us:
(a) The Board of Directors has passed a resolution for the non acceptance of any public deposits.
(b) The Company has not accepted any deposits for the "public" attracting the directions issued by
Reserve Bank Of India and the provisions of sections 58A and 58AA of the Companies Act, 1956 or a
other relevant provisions and rules framed there under.
Annexure to Auditors’ Report

8/3/2019 Annual Reports 2010 11
http://slidepdf.com/reader/full/annual-reports-2010-11 36/64
(c) The Company has complied with the prudential norms relating income recognition, accounting standar
asset classification and provisioning for bad and doubtful debts as applicable to it in terms
Non Banking Financial [Non Deposit Accepting or holding companies prudential norms (Reserve Ba
Directions, 2009].
(d) The capital adequacy ratio is in compliance with the minimum CRAR prescribed by Reserve Ban
India.
(viii) In our opinion, the Company has an internal audit system commensurate with the size and nature of
business.
(ix) The Central Government of India has not prescribed the maintenance of cost records under clause (d
sub-section (1) of Section 209 of the Act for any of the products of the company.
(x) (a) According to the records of the Company and the information and explanations given to us, the Compa
is regular in depositing with appropriate authorities undisputed statutory dues including provident fu
employees' state insurance, income-tax, service tax, cess and other material statutory dues applica
to it. As explained to us, the provisions regarding investor education and protection fund, sales ta
wealth tax, custom duty and excise duty are presently not applicable to the company.
Further, since the Central Government has till date not prescribed the amount of cess payable un
section 441A of the Companies Act,1956, we are not in a position to comment upon the regularity
otherwise of the company in depositing the same.
(b) According to the information and explanations given to us, no undisputed amounts payable in respec
provident fund, investor education and protection fund, employees' state insurance, income-tax, serv
tax, cess and other undisputed statutory dues were outstanding, at the year end, for a period of m
than six months from the date they became payable.
(c) According to the information and explanation given to us, there are no dues of income tax, sales-twealth tax, service tax, customs duty, excise duty and cess which have not been deposited on acco
of any dispute.
(xi) As the company is registered for a period less than five years, clause (x) of paragraph 4 of the Compan
(Auditor's Report) Order, 2003, as amended by the Companies (Auditor's Report) (Amendment) Order, 2004
not applicable to the company for the current year.
(xii) In our opinion and according to the information and explanations given to us, the Company has not defaul
in repayment of dues to a financial institution or bank. The Company has also not raised any money by iss
of debentures hence, this clause is not applicable.
(xiii) We are of the opinion that the Company has maintained adequate records where the Company has gran
loans and advances on the basis of security by way of pledge of shares, debentures and other securities
(xiv) In our opinion, the Company is not a chit fund or a nidhi / mutual benefit fund / society. Therefore, the provisio
of clause 4(xiii) of the Companies (Auditor's Report) Order, 2003 (as amended) are not applicable to
Company.
(xv) In respect of dealing/trading in shares, securities, debentures and other investments, in our opinion a
according to the information and explanations given to us, generally the Company did not deal or trade in
However, on short term basis, surplus funds were invested in mutual fund for which proper records for
Annexure to Auditors’ Report

8/3/2019 Annual Reports 2010 11
http://slidepdf.com/reader/full/annual-reports-2010-11 37/64
transaction and contracts have been maintained and timely entries have been made therein. The shar
securities, debentures and other investments have been held by the Company, in its own name.
(xvi) In our opinion and according to the information and explanations given to us, the company has not given a
guarantee for loans taken by others from banks or financial institutions during the year.
(xvii) In our opinion and according to the information and explanations given to us, the term loans have been appfor the purpose for which the loans were raised.
(xviii) According to the information and explanations given to us and on an overall examination of the balance sh
of the Company, we report that no funds raised on short-term basis have been used for long-term investme
(xix) According to the information and explanations given to us, the company has not made preferential allotmen
shares to parties and companies covered in the register maintained under section 301 of the Act.
(xx) The Company did not have any outstanding debentures during the year.
(xxi) The Company did not raise any money by way of public issue during the year.
(xxii) According to the information and explanations given to us, one instance of fraud is noticed and reported by
company during the year. One of the customers had provided false documents for obtaining the loan
` 9,78,159 from the company. Based on the outcome of the investigation carried out, the company h
created the provision on such loan amount and had reversed the interest of ` 1,82,865 recognized on su
loan amount.
For Haribhakti & C
Chartered AccountaFirm Registration No. 10352
Manoj Da
Place : Mumbai Partn
Date : April 15, 2011 Membership No. 485
Annexure to Auditors’ Report

8/3/2019 Annual Reports 2010 11
http://slidepdf.com/reader/full/annual-reports-2010-11 38/64
Sch As at As at As at AsMarch 31, 2011 March 31, 2011 March 31, 2010 March 31, 201
Amount in ` Amount in ` Amount in ` Amount in
Sources of Funds :
Shareholders Fund
Share Capital 1 4,102,640,000 1,050,070,000
Reserves & Surplus 2 3,090,051,212 7,192,691,212 - 1,050,070,00
Loan Fund
Secured Loans 3 6,677,446,446 4,101,051,086
Unsecured Loans 4 - 6,677,446,446 400,000,000 4,501,051,08
Total 13,870,137,658 5,551,121,08
Application of Funds :
Fixed Assets 5
Gross Block 165,251,759 123,257,397
Less: Accumulated
Depreciation (63,346,162) (31,358,060)
Net Block 101,905,597 91,899,337Capital Advances 2,996,940 104,902,537 6,530,233 98,429,57
Investments 6 334,999,996 34,999,99
Current Assets, Loans &
Advances
Current Assets
Sundry Debtors 7 73,593,395 36,663,309
Receivables under
Financing Activity 8 12,625,248,502 5,370,385,682
Cash & Bank Balances 9 1,683,358,646 129,115,729
Loans & Advances 10 135,792,569 81,227,063
14,517,993,112 5,617,391,784
Less: Current Liabilities
& Provisions
Current Liabilities 11 879,532,300 166,092,348
Provisions 12 208,225,686 63,218,261
1,087,757,987 229,310,609
Net Current Asset 13,430,235,125 5,388,081,17
Profit & Loss A/c - 29,610,34
Total 13,870,137,658 5,551,121,08
Accounting Policies and 17Notes on Accounts
Balance Sheet
For and on behalf of the Bo
Vinod Yennemadi G. RameChairman Chief Executive Offi
Pralay Mondal Haren PareDirector Finance Contro
Rakesh PathCompany Secret
& Manager Le
As per our report of even date
For Haribhakti & Co.Chartered AccountantsFirm Registration No. 103523W
Manoj DagaPartnerMembership No.48523
Place : MumbaiDate : April 15, 2011

8/3/2019 Annual Reports 2010 11
http://slidepdf.com/reader/full/annual-reports-2010-11 39/64
Sch For the For the For the For t
year ended year ended year ended year endeMarch 31, 2011 March 31, 2011 March 31, 2010 March 31, 20
Amount in ` Amount in ` Amount in ` Amount inIncome
Interest Income (TDS Current
Year `730,546 & PreviousYear ` 381,557) 1,259,856,400 600,229,445
Other Financial Charges 169,082,587 110,917,378
Fee Based Income 359,594,898 265,029,369
Other Income 13 5,107,962 100,562
Total Income 1,793,641,847 976,276,7
EXPENDITURE
Financial Charges 14 468,314,781 219,152,934
Administrative & other
expenses 15 833,994,110 576,050,559
Depreciation 32,444,142 17,089,407
Provisions & Write Offs 16 181,514,942 40,799,703Contigent Provision
against Standard Assets 31,600,000 -
Total Expenditure 1,547,867,975 853,092,6
Profit Before tax 245,773,872 123,184,1
Provision for taxation
Current Tax 102,946,499 -
MAT Credit Entitlement (17,946,499) 85,000,000 24,000,000 24,000,0
Provision for Fringe Benefit Tax 169,956
Profit After Taxation
for the Year 160,603,916 99,184,1
Prior Period item 2,526,358
Net Profit After tax 158,077,558 99,184,1
Balance B/F from Previous period (29,610,346) (128,794,49
Transfer to Statutory Reserve 53,000,000
Balance Carried to
Balance Sheet 75,467,212 (29,610,34
Earning Per Share (`)
Basic 0.88 0.
Diluted 0.88 0.
Face Value Per Share (`) 10
Accounting Policies and
Notes on Accounts 17
Profit and Loss Account
For and on behalf of the Bo
Vinod Yennemadi G. RameChairman Chief Executive Offi
Pralay Mondal Haren PareDirector Finance Contro
Rakesh PathCompany Secret
& Manager Le
As per our report of even date
For Haribhakti & Co.Chartered AccountantsFirm Registration No. 103523W
Manoj DagaPartnerMembership No.48523
Place : MumbaiDate : April 15, 2011
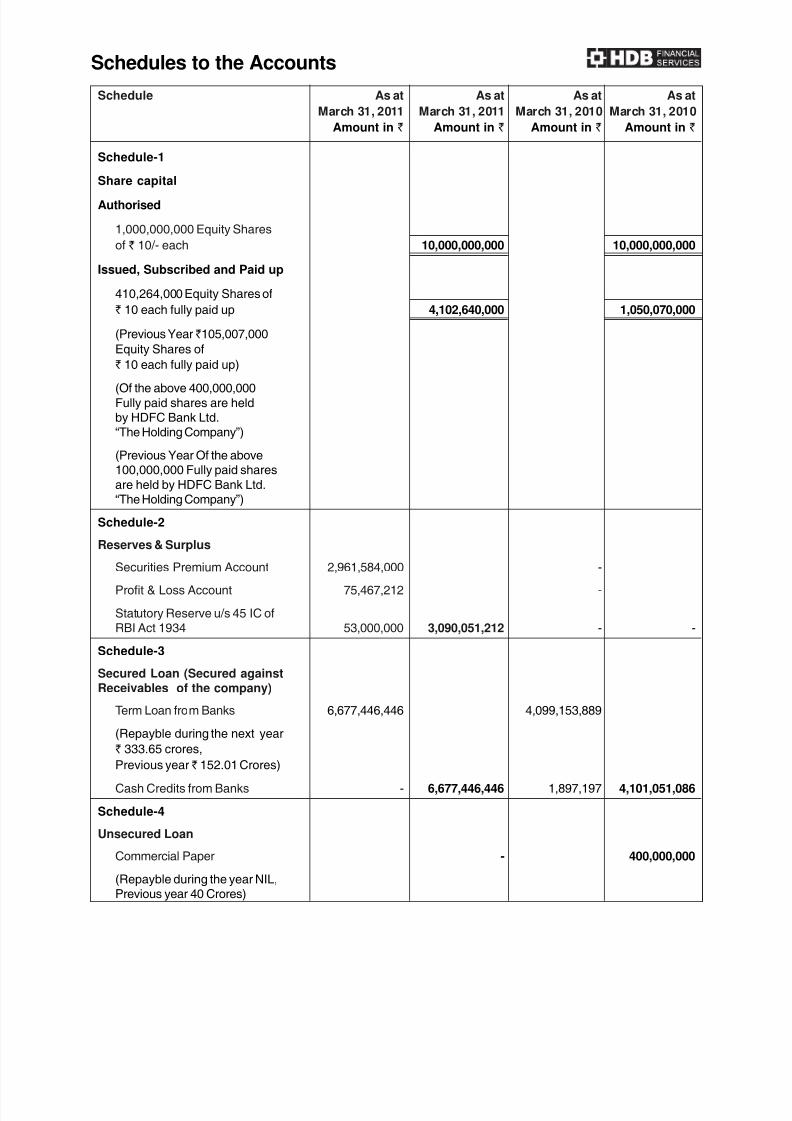
8/3/2019 Annual Reports 2010 11
http://slidepdf.com/reader/full/annual-reports-2010-11 40/64
Schedule As at As at As at As
March 31, 2011 March 31, 2011 March 31, 2010 March 31, 201
Amount in ` Amount in ` Amount in ` Amount in
Schedule-1
Share capitalAuthorised
1,000,000,000 Equity Shares
of ` 10/- each 10,000,000,000 10,000,000,00
Issued, Subscribed and Paid up
410,264,000 Equity Shares of
` 10 each fully paid up 4,102,640,000 1,050,070,00
(Previous Year `105,007,000
Equity Shares of
` 10 each fully paid up)
(Of the above 400,000,000
Fully paid shares are heldby HDFC Bank Ltd.“The Holding Company”)
(Previous Year Of the above100,000,000 Fully paid shares
are held by HDFC Bank Ltd.“The Holding Company”)
Schedule-2
Reserves & Surplus
Securities Premium Account 2,961,584,000 -
Profit & Loss Account 75,467,212 -
Statutory Reserve u/s 45 IC ofRBI Act 1934 53,000,000 3,090,051,212 -
Schedule-3
Secured Loan (Secured againstReceivables of the company)
Term Loan from Banks 6,677,446,446 4,099,153,889
(Repayble during the next year
` 333.65 crores,Previous year ` 152.01 Crores)
Cash Credits from Banks - 6,677,446,446 1,897,197 4,101,051,08
Schedule-4
Unsecured Loan
Commercial Paper - 400,000,00
(Repayble during the year NIL,Previous year 40 Crores)
Schedules to the Accounts

8/3/2019 Annual Reports 2010 11
http://slidepdf.com/reader/full/annual-reports-2010-11 41/64
As on Additions Deduction As on As on For the Accumalated As on As on AApril 1, f or during the March 31, April 1, p er io d on Assets Sold / March 31, March 31, March
2010 the year period 2011 2010 Discarded 2011 2011
Soft wa re 2 4,9 48 ,5 20 1 ,0 10 ,5 65 7 00 ,8 00 2 5, 25 8,2 85 9, 30 9,8 96 8 ,3 58 ,7 67 3 20 ,3 79 1 7, 34 8,2 84 7 ,9 10 ,0 01 1 5,6 38
Computers 22,091,185 4 ,344,366 - 26,435,551 6,527,698 8,420,006 - 14,947,704 11,487,847 15,563,
Furniture &
Fixtur e 25,200,667 9,025,426 - 34,226,093 6 ,639,722 5 ,096,668 - 11,736,390 22,489,703 18,560,
Leasehold
Impr ovements 31,469,423 17,462,754 - 4 8,932,177 4,520,190 5,805,912 - 10,326,102 38,606,075 26,949,
Off ice Equipment 19,547,602 11,069,249 217,198 30,399,653 4,360,554 4,762,789 135,661 8,987,682 21,411,971 15,187
TOTAL 123,257,397 42,912,360 917,998 165,251,759 31,358,060 32,444,142 456,040 63,346,162 101,905,597 91,899,3
Previous Year 99,550 ,843 23, 706, 554 - 123 ,257, 397 14, 268, 653 17,089 ,407 - 31,358 ,060 91,899 ,337 85,282
Schedule As at As at As at AsMarch 31, 2011 March 31, 2011 March 31, 2010 March 31, 201Amount in ` Amount in ` Amount in ` Amount in
Schedule-6
Investments
Long Term Investment
Investment in Unquoted
Equity Shares
(Non Trade Fully Paid)
Equity Shares of VayanaEnterprises Private Limited 34,999,996 34,999,996
(1,044,776 shares of` 10 each Fully Paid up)
(Previous Year 1,044,776 sharesof ` 10 each)
Short Term Investment - Non Trade
Investments in units of Mutual Funds
HDFC Cash Management FundTreasury Advantage Plan) 300,000,000 334,999,996 - 34,999,99
(29,905,796 Units of ` 10.0315)(NAV as of 31 March 2011 is
` 10.0315 Previous Year NIL)
Schedule-7
Sundry Debtors (Unsecured,Considered Good)
More than 6 months - - -
Others 73,593,395 73,593,395 36,663,309 36,663,30
Schedules to the Accounts
Schedule-5
Fixed Assets
Depreciation Net BlockParticulars Gross Block

8/3/2019 Annual Reports 2010 11
http://slidepdf.com/reader/full/annual-reports-2010-11 42/64
Schedules to the Accounts
Schedule As at As at As at AsMarch 31, 2011 March 31, 2011 March 31, 2010 March 31, 201
Amount in ` Amount in ` Amount in ` Amount in
Schedule-8
Receivables under Financing Activity
SecuredLoans against Immovable Property 7,069,545,432 2,555,991,226
Other Secured Loans 2,268,100,597 9,337,646,029 238,812,610 2,794,803,83
Unsecured
Personal Loan 3,287,602,473 2,575,581,84
Total 12,625,248,502 5,370,385,68
Schedule-9
Cash and Balances withScheduled Bank
Cash on Hand 685,686 257,727
In Current Account 682,672,960 128,858,002
In Deposit Account 1,000,000,000 1,683,358,646 - 129,115,72
Schedule-10
Loans & Advances
(Unsecured Considered Good)
Deposits 20,644,260 22,259,360
Interest Accrued but not Due 273,973 -
Unmatured Discount oncommercial paper - 19,112,932
Advances Recoverable in
Cash or in Kind 5,383,164 2,791,798
Advance payment against taxes 109,491,172 135,792,569 37,062,973 81,227,06
Schedule-11
Current Liabilities
Sundry Creditors
Due to MSME 9,500 -
Others 655,234,884 655,244,384 36,171,859 36,171,85
In Current Account with Bank(Overdrawn Balances) 7,175,851 14,112,14
Security Deposit Received 97,500,000 60,000,00
Other liabilities 119,612,065 55,808,34
Total 879,532,300 166,092,34
Schedule-12Provisions
Provisions for Tax 109,000,000 24,958,000
Provisions against doubtful loans 24,083,079 34,866,209
Contigent Provision againstStandard Assets 31,600,000 -
General Provisions 31,600,000 -
Provisions for Gratuity &Compensated Absences 11,942,607 208,225,686 3,394,052 63,218,26

8/3/2019 Annual Reports 2010 11
http://slidepdf.com/reader/full/annual-reports-2010-11 43/64
Schedule For the year ended For the year ende
March 31, 2011 March 31, 201Amount in` Amount in
Schedule-13Other IncomeProfit on Sale of Asset 238,842
Gain on sale of Current Investment 527,721 100,56Dividend on Non Trade Investments 4,340,987Others 412Total 5,107,962 100,56Schedule-14Interest & Finance ChargesInterestOn Fixed Loans 407,424,354 193,464,17Others 14,549,687 14,357,18Discount on Commercial Paper 40,473,232 6,464,66Other Charges 5,867,508 4,866,90Total 468,314,781 219,152,93Schedule-15Administrative and Other Expenses1) Payments to & Provision for Employees
Salaries 539,573,710 382,280,60Managerial Remuneration 4,500,844 3,397,31Staff welfare & Employee benefit expenses 15,337,080 6,690,92Contribution to Employee benefit funds & other related expenses 41,814,809 28,903,44Sub Total 601,226,443 421,272,29
2) Other ExpensesRent (Net of Sub Lease rent received `455,700, Previous year `251,123) 45,688,602 46,289,94Rates & Taxes 124,691 130,56Legal & Professional Fees 4,701,036 4,613,44Travelling & Conveyence 9,411,738 6,577,65Telephone 22,331,013 24,369,03Printing & Stationary 4,219,120 3,117,87
Postage & Courier Charges 2,031,064 1,641,59Equipment Hire Charges 14,058,380 10,275,53Recruitment Expense 2,026,563 963,69Computer Expenses 15,887,543 8,548,32Lease Car Rental & Petrol Expenses 1,332,414 1,785,63Power & Fuel 15,241,147 10,979,80Office Expenses 15,078,310 9,062,60Repairs & Maintainance- Premises 1,970,442 202,78Repairs & Maintainance-Plant & Machinery 979,558 708,11Repairs & Maintainance-Others 145,516 48,50Sales Promotion Expense 219,497 641,70Stamp Duty 2,913,765 1,468,03Credit Report Charges 18,991,550 12,325,03Auditor’s Remunaration 900,000 633,54Insurance 239,754 213,76Commision & Brokerage 48,753,744 8,836,28Collection Cost 5,055,363 1,261,41Storage Cost 466,857 83,37Sub Total 232,767,667 154,778,26Total 833,994,110 576,050,55
Schedule-16Provisions & Write offsProvisions for Non performing assets (Net) 25,393,245 25,476,34Write offs 156,121,697 15,323,35Total 181,514,942 40,799,70
Schedules to the Accounts
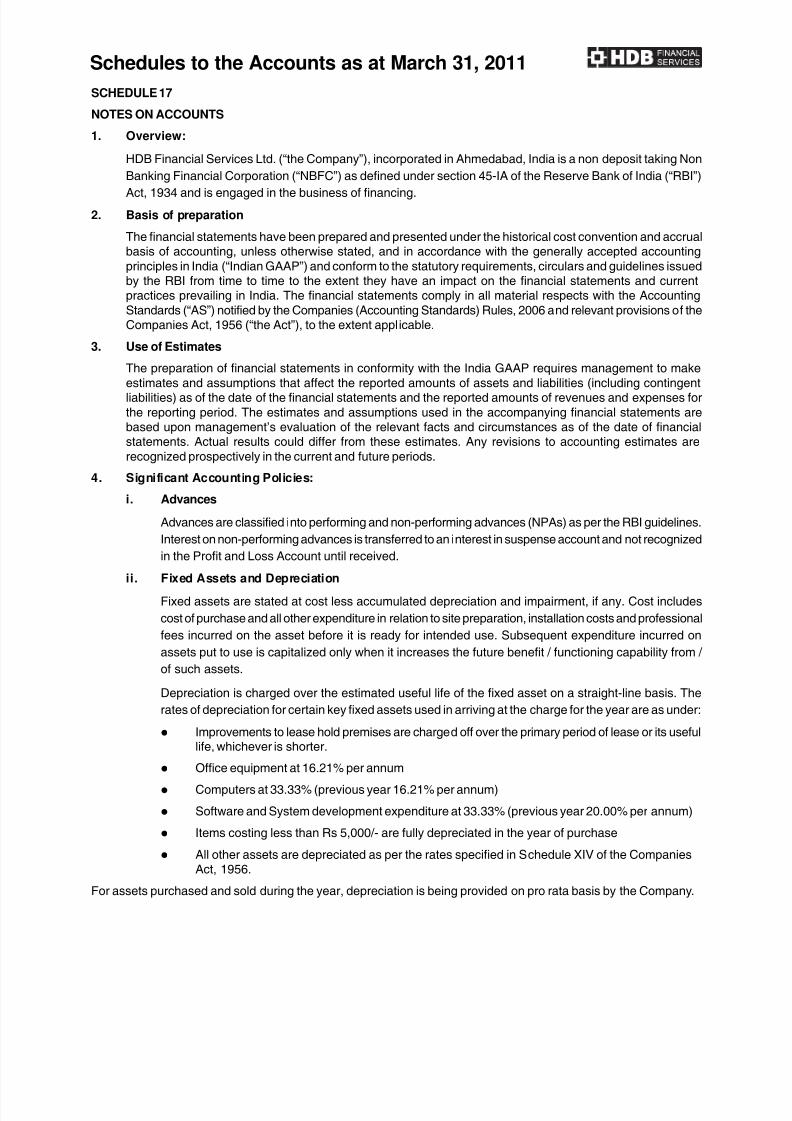
8/3/2019 Annual Reports 2010 11
http://slidepdf.com/reader/full/annual-reports-2010-11 44/64
Schedules to the Accounts as at March 31, 2011
SCHEDULE 17
NOTES ON ACCOUNTS
1. Overview:
HDB Financial Services Ltd. (“the Company”), incorporated in Ahmedabad, India is a non deposit taking N
Banking Financial Corporation (“NBFC”) as defined under section 45-IA of the Reserve Bank of India (“RB
Act, 1934 and is engaged in the business of financing.
2. Basis of preparation
The financial statements have been prepared and presented under the historical cost convention and accrbasis of accounting, unless otherwise stated, and in accordance with the generally accepted account
principles in India (“Indian GAAP”) and conform to the statutory requirements, circulars and guidelines issuby the RBI from time to time to the extent they have an impact on the financial statements and currepractices prevailing in India. The financial statements comply in all material respects with the Account
Standards (“AS”) notified by the Companies (Accounting Standards) Rules, 2006 and relevant provisions of Companies Act, 1956 (“the Act”), to the extent applicable.
3. Use of Estimates
The preparation of financial statements in conformity with the India GAAP requires management to maestimates and assumptions that affect the reported amounts of assets and liabilities (including contingeliabilities) as of the date of the financial statements and the reported amounts of revenues and expenses
the reporting period. The estimates and assumptions used in the accompanying financial statements based upon management’s evaluation of the relevant facts and circumstances as of the date of financstatements. Actual results could differ from these estimates. Any revisions to accounting estimates a
recognized prospectively in the current and future periods.
4. Significant Accounting Policies:
i. Advances
Advances are classified into performing and non-performing advances (NPAs) as per the RBI guidelin
Interest on non-performing advances is transferred to an interest in suspense account and not recogniz
in the Profit and Loss Account until received.ii. Fixed Assets and Depreciation
Fixed assets are stated at cost less accumulated depreciation and impairment, if any. Cost includ
cost of purchase and all other expenditure in relation to site preparation, installation costs and professio
fees incurred on the asset before it is ready for intended use. Subsequent expenditure incurred
assets put to use is capitalized only when it increases the future benefit / functioning capability fro
of such assets.
Depreciation is charged over the estimated useful life of the fixed asset on a straight-line basis. T
rates of depreciation for certain key fixed assets used in arriving at the charge for the year are as und
Improvements to lease hold premises are charged off over the primary period of lease or its use
life, whichever is shorter.
Office equipment at 16.21% per annum
Computers at 33.33% (previous year 16.21% per annum)
Software and System development expenditure at 33.33% (previous year 20.00% per annum
Items costing less than Rs 5,000/- are fully depreciated in the year of purchase
All other assets are depreciated as per the rates specified in Schedule XIV of the CompanieAct, 1956.
For assets purchased and sold during the year, depreciation is being provided on pro rata basis by the Compan
8/3/2019 Annual Reports 2010 11
http://slidepdf.com/reader/full/annual-reports-2010-11 45/64
iii. Impairment of Assets
The Company assesses at each balance sheet date whether there is any indication that an asset mbe impaired. If any such indication exists, the Company estimates the recoverable amount of the asor the cash generating unit (“CGU”). If such recoverable amount of the asset or the recoverable amoof the CGU to which the asset belongs is less than its carrying amount, the carrying amount is reducto its recoverable amount. The reduction is treated as an impairment loss and is recognized in the Pr
and Loss Account. If at the balance sheet date there is an indication that a previously assessed impairmloss no longer exists, the recoverable amount is reassessed and the asset is reflected at the revisrecoverable amount, subject to maximum of the depreciated historical cost.
iv. Investments
Investments which are long term in nature are stated at cost. Provisions are made only in casediminution, which is other than temporary, in the value of Investment. Current investments are valuedlower of cost and net realizable value.
v. Employee Benefits
Short term employee benefits
Short term employees benefits are recognize as a expense at the undiscounted amounts in the pr
& loss account for the year in which the related services rendered.Long term employee benefits
a) Gratuity
The Company provides for gratuity to all employees. The benefit is in the form of lump spayments to vested employees on resignation, retirement, on death while in employment ortermination of employment of an amount equivalent to 15 days basic salary payable for eacompleted year of service. Vesting occurs upon completion of five years of service. The Compamakes annual contributions to funds administered by trustees and managed by insurancompanies for amounts notified by the said insurance companies. The defined gratuity benplans are valued by an independent external actuary as at the balance sheet date using tprojected unit credit method to determine the present value of defined benefit obligation and related service costs. Under this method, the determination is based on actuarial calculatio
which include assumptions about demographics, early retirement, salary increases and interrates. Actuarial gain or loss is recognized in the Profit and Loss Account.
b) Provident fund
In accordance with law, all employees of the Company are entitled to receive benefits under provident fund. The Company contributes an amount, on a monthly basis, at a determined r(currently 12% of employee’s basic salary) to the Pension Scheme administered by the RegioProvident Fund Commissioner (RPFC) and the Company has no liability for future provident fubenefits other than its annual contribution. The contributions are accounted for on an accrbasis and recognized in the Profit and Loss Account, being a defined contribution plan.
c) Compensated Absences
The Company does not have a policy of encashment of unavailed leaves for its employees. TCompany provides for compensated absences in accordance with AS 15 (revised 2005) EmployBenefits. The provision is based on an independent external actuarial valuation at the balansheet date.
vi. Lease accounting
Lease payments for assets taken on operating lease are recognized in the Profit and Loss Account othe lease term in accordance with the AS 19, Leases, issued by the Institute of Chartered Accountaof India.
vii. Revenue Recognition
Interest income is recognized in the profit or loss account on an accrual basis. Income includ

8/3/2019 Annual Reports 2010 11
http://slidepdf.com/reader/full/annual-reports-2010-11 46/64
Schedules to the Accounts as at March 31, 2011
interest / discount or any other charges on Non-Performing Assets (NPA) is recognized o
when it is realized. Any such income recognized before the asset became non-performing aremaining unrealized is reversed.
Fee based income and other financial charges are recognized on an accrual basis, except
case of cheque bouncing charges, late payment charges, foreclosure charges and applicatmoney, which are accounted as and when received.
Income from dividend is recognized in profit & loss account when the right to receive is establish
viii. Taxation
Tax expenses are the aggregate of current tax and deferred tax charged or credited in the statemen
profit and loss for the period.
a) Current Tax
The current charge for income tax is calculated in accordance with the relevant tax regulatioapplicable to the company.
b) Minimum Alternate Tax (MAT)
In case the company is liable to pay income tax u/s 115JB of Income Tax Act,1961 (i.e. MAT),
amount of tax paid in excess of normal income tax is recognized as an asset (MAT CreEntitlement) only if there is convincing evidence for realization of such asset during the specif
period. MAT credit entitlement is reviewed at each balance sheet date.
c) Deferred Tax
Deferred tax charge or credit reflects the tax effects of timing differences between accountincome and taxable income for the period. The deferred tax charge or credit and the correspond
deferred tax liabilities or assets are recognized using the tax rates that have been enactedsubstantively enacted by the balance sheet date. Deferred tax assets are recognized only to
extent there is reasonable certainty that the assets can be realized in future; however, whethere is unabsorbed depreciation or carry forward of losses, deferred tax assets are recogniz
only if there is virtual certainty of realization of such assets. Deferred tax assets are reviewedeach balance sheet date.
ix. Earnings per share
The Company reports basic and diluted earnings per equity share in accordance with AS 20, Earnin
Per Share issued, by the Institute of Chartered Accountants of India. Basic earnings per equity shhave been computed by dividing net profit / loss attributable to the equity share holders for the yearthe weighted average number of equity shares outstanding during the year. Diluted earnings per eq
share have been computed by dividing the net profit attributable to the equity share holders for the yby the weighted average number of equity shares and dilutive potential equity shares outstanding dur
the year, except where the results are anti dilutive.
x. Accounting for Provisions, Contingent Liabilities and Contingent Assets
The Company recognises provision when there is present obligation as a result of a past event, iprobable that an outflow of resources embodying economic benefits will be required to settle the obligat
and a reliable estimate of the amount of the obligation can be made. In cases where the availainformation indicates that the loss on the contingency is reasonably possible but the amount of locannot be reasonably estimated, a disclosure is made in the financial statements. Provisions
reviewed at each balance sheet date and adjusted to reflect the current management estimates. If no longer probable that the outflow of resources would be required to settle the obligation, the provis
is reversed.
A disclosure of contingent liability is made when there is a possible obligation or a present obligatthat may, but probably will not, require an outflow of resources.
When there is a possible obligation or a present obligation in respect of which likelihood of outflow
resource is remote, no provision or disclosure is made.

8/3/2019 Annual Reports 2010 11
http://slidepdf.com/reader/full/annual-reports-2010-11 47/64
Contingent assets are not recognized in the financial statements.
However, contingent assets are assessed continually and if it is virtually certain that an econom
benefit will arise, the asset and related income are recognized in the period in which the change occu
xi. Interest on borrowings:
Interest on borrowings is recognized in Profit and Loss Account on an accrual basis.
5. Change in accounting policy
During the year company has changed the NPA policy due to which provision for NPA has increased by ` 2lakhs and the profit before tax has been decrease by this amount.
5A Provision against doubtful loans includes the amount of ` 47.15 lakhs (Previous Year ` 92.91 lakhs on acco
of reversal of interest income on non performing assets.
6. Capital Adequacy Ratio
The Company’s capital adequacy ratio, calculated in accordance with the Reserve Bank of India guidelines
as follows:
Particulars 2010-11 2009-10
CRAR% 55.20% 17.87%
CRAR –Tier I Capital % 54.72% 17.87%
CRAR-Tier II Capital % 0.48% Nil
7. Exposure to Real Estate Sector
(` in lakhs)
Categories 2010-11 2009-10
A. Direct Exposure
i. Residential Mortgages - 50,155 18,814
(Lending fully secured by mortgages on residentialproperty that is or will be occupied by the borrower or that is
rented)
ii. Commercial Real Estate – 19,087 6,733(Lending secured by mortgages on commercial real estates
(office buildings, retail space, multipurpose commercialpremises, multi-family residential buildings, multi-tenanted
commercial premises, industrial or warehouse space, hotels,land acquisition, development and construction, etc.). Exposurewould also include non-fund based (NFB) limits)
iii. Investments in Mortgage Backed Securities (MBS) and other - -
securitised exposures –
a) Residential
b) Commercial Real Estate
B. Indirect Exposure - -
(Fund based and non-fund based exposures on NationalHousing Bank (NHB) and Housing Finance Companies (HFCs).
Schedules to the Accounts as at March 31, 2011
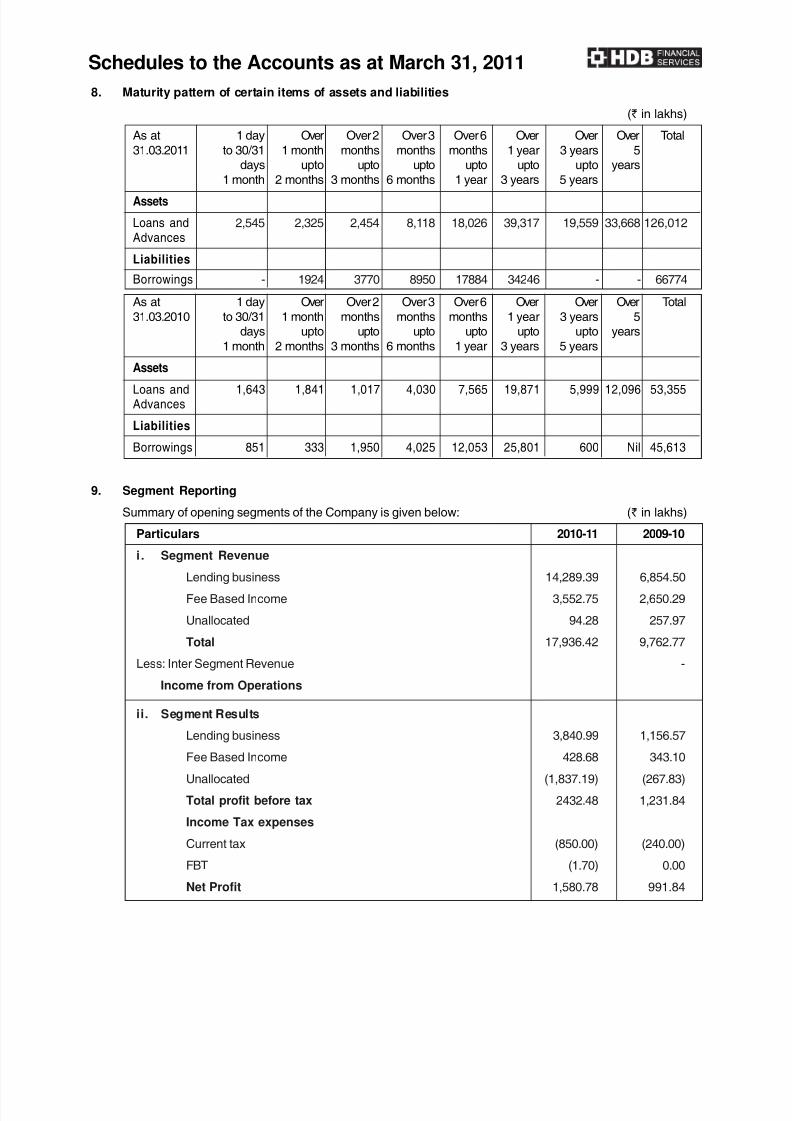
8/3/2019 Annual Reports 2010 11
http://slidepdf.com/reader/full/annual-reports-2010-11 48/64
Schedules to the Accounts as at March 31, 2011
8. Maturity pattern of certain items of assets and liabilities
(` in lakhs)
As at 1 day Over Over 2 Over 3 Over 6 Over Over Over Total
31.03.2011 to 30/31 1 month months months months 1 year 3 years 5days upto upto upto upto upto upto years
1 month 2 months 3 months 6 months 1 year 3 years 5 years
Assets
Loans and 2,545 2,325 2,454 8,118 18,026 39,317 19,559 33,668 126,012Advances
Liabilities
Borrowings - 1924 3770 8950 17884 34246 - - 66774
As at 1 day Over Over 2 Over 3 Over 6 Over Over Over Tota
31.03.2010 to 30/31 1 month months months months 1 year 3 years 5days upto upto upto upto upto upto years
1 month 2 months 3 months 6 months 1 year 3 years 5 years
AssetsLoans and 1,643 1,841 1,017 4,030 7,565 19,871 5,999 12,096 53,355Advances
Liabilities
Borrowings 851 333 1,950 4,025 12,053 25,801 600 Nil 45,613
9. Segment Reporting
Summary of opening segments of the Company is given below: (` in lakhs)
Particulars 2010-11 2009-10
i. Segment RevenueLending business 14,289.39 6,854.50
Fee Based Income 3,552.75 2,650.29
Unallocated 94.28 257.97
Total 17,936.42 9,762.77
Less: Inter Segment Revenue -
Income from Operations
ii. Segment Results
Lending business 3,840.99 1,156.57
Fee Based Income 428.68 343.10
Unallocated (1,837.19) (267.83)
Total profit before tax 2432.48 1,231.84
Income Tax expenses
Current tax (850.00) (240.00)
FBT (1.70) 0.00
Net Profit 1,580.78 991.84

8/3/2019 Annual Reports 2010 11
http://slidepdf.com/reader/full/annual-reports-2010-11 49/64
Particulars 2010-11 2009-10
iii. Capital Employed
Segment assets
Lending business 133,035.21 55,065.84
Fee based Income 1,371.75 779.13Unallocated 14,931.18 1,314.57
Total Assets 149,338.13 57,159.55
Segment Liabilities
Lending business 74,226.93 45,621.98
Fee based Income 1,127.20 724.50
Unallocated 2,057.10 608.47
Total Liabilities 77,411.22 46,954.95
Net Segment assets / (liabilities)
Lending business 58,808.29 9,443.86
Fee based Income 244.55 54.63
Unallocated 12,874.09 706.10
iv. Capital Expenditure (including net CWIP)
Lending business 77.16 93.26
Fee based Income 378.65 122.80
Unallocated (5.90) 86.30
Total 449.92 302.36
v. Depreciation
Lending business 169.35 104.50
Fee based Income 132.01 55.16
Unallocated 23.10 11.23
Total 324.45 170.89
vi Non performing asset & Write offs
Lending business 2,131.15 408.00
Fee based income - -
Unallocated - -
Total 2,131.15 408.00
A. PRIMARY SEGMENT
a) Business Segment:
Segment identified by the company comprises as under:
i. Collection services
ii. Lending Services
Schedules to the Accounts as at March 31, 2011
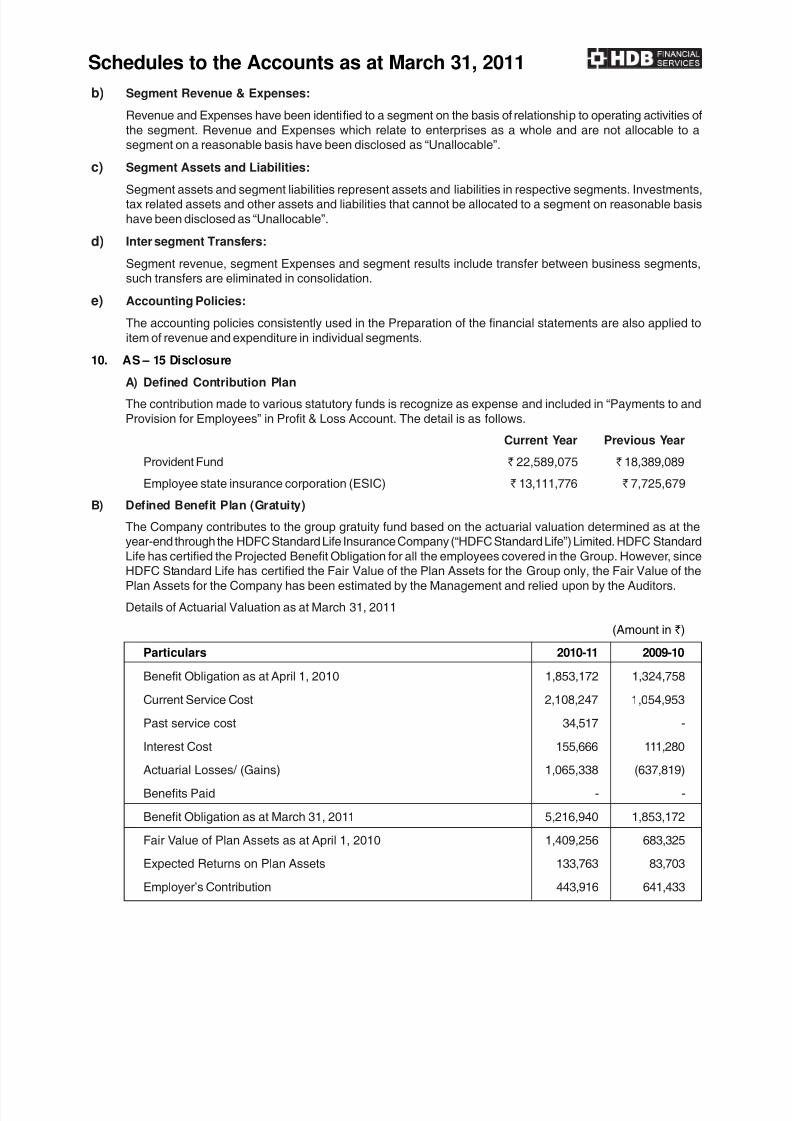
8/3/2019 Annual Reports 2010 11
http://slidepdf.com/reader/full/annual-reports-2010-11 50/64
Schedules to the Accounts as at March 31, 2011
b) Segment Revenue & Expenses:
Revenue and Expenses have been identified to a segment on the basis of relationship to operating activities
the segment. Revenue and Expenses which relate to enterprises as a whole and are not allocable tosegment on a reasonable basis have been disclosed as “Unallocable”.
c) Segment Assets and Liabilities:
Segment assets and segment liabilities represent assets and liabilities in respective segments. Investmentax related assets and other assets and liabilities that cannot be allocated to a segment on reasonable ba
have been disclosed as “Unallocable”.
d) Inter segment Transfers:
Segment revenue, segment Expenses and segment results include transfer between business segmensuch transfers are eliminated in consolidation.
e) Accounting Policies:
The accounting policies consistently used in the Preparation of the financial statements are also applied
item of revenue and expenditure in individual segments.
10. AS – 15 Disclosure
A) Defined Contribution Plan
The contribution made to various statutory funds is recognize as expense and included in “Payments to a
Provision for Employees” in Profit & Loss Account. The detail is as follows.
Current Year Previous Year
Provident Fund ` 22,589,075 ` 18,389,089
Employee state insurance corporation (ESIC) ` 13,111,776 ` 7,725,679
B) Defined Benefit Plan (Gratuity)
The Company contributes to the group gratuity fund based on the actuarial valuation determined as at tyear-end through the HDFC Standard Life Insurance Company (“HDFC Standard Life”) Limited. HDFC Stand
Life has certified the Projected Benefit Obligation for all the employees covered in the Group. However, sinHDFC Standard Life has certified the Fair Value of the Plan Assets for the Group only, the Fair Value of
Plan Assets for the Company has been estimated by the Management and relied upon by the Auditors.
Details of Actuarial Valuation as at March 31, 2011
(Amount in `)
Particulars 2010-11 2009-10
Benefit Obligation as at April 1, 2010 1,853,172 1,324,758
Current Service Cost 2,108,247 1,054,953
Past service cost 34,517 -
Interest Cost 155,666 111,280
Actuarial Losses/ (Gains) 1,065,338 (637,819)
Benefits Paid - -
Benefit Obligation as at March 31, 2011 5,216,940 1,853,172
Fair Value of Plan Assets as at April 1, 2010 1,409,256 683,325
Expected Returns on Plan Assets 133,763 83,703
Employer’s Contribution 443,916 641,433
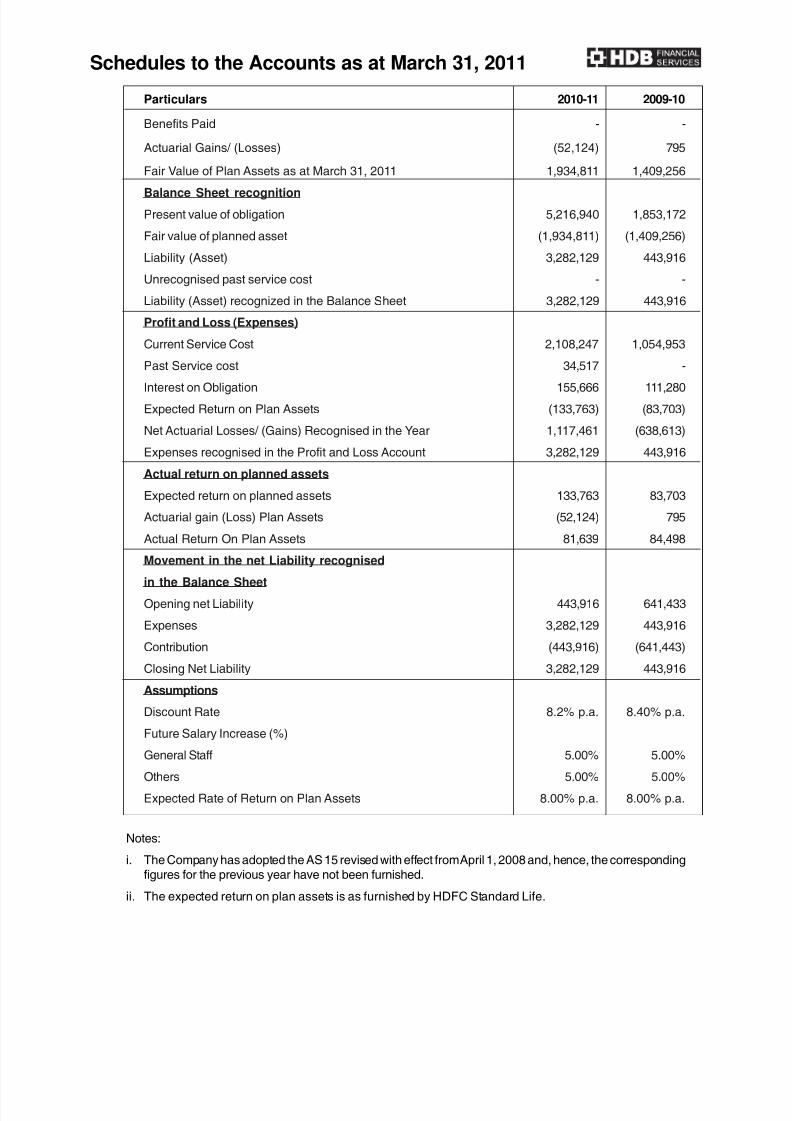
8/3/2019 Annual Reports 2010 11
http://slidepdf.com/reader/full/annual-reports-2010-11 51/64
Particulars 2010-11 2009-10
Benefits Paid - -
Actuarial Gains/ (Losses) (52,124) 795
Fair Value of Plan Assets as at March 31, 2011 1,934,811 1,409,256
Balance Sheet recognition
Present value of obligation 5,216,940 1,853,172
Fair value of planned asset (1,934,811) (1,409,256)
Liability (Asset) 3,282,129 443,916
Unrecognised past service cost - -
Liability (Asset) recognized in the Balance Sheet 3,282,129 443,916
Profit and Loss (Expenses)
Current Service Cost 2,108,247 1,054,953
Past Service cost 34,517 -
Interest on Obligation 155,666 111,280
Expected Return on Plan Assets (133,763) (83,703)
Net Actuarial Losses/ (Gains) Recognised in the Year 1,117,461 (638,613)
Expenses recognised in the Profit and Loss Account 3,282,129 443,916
Actual return on planned assets
Expected return on planned assets 133,763 83,703
Actuarial gain (Loss) Plan Assets (52,124) 795
Actual Return On Plan Assets 81,639 84,498
Movement in the net Liability recognised
in the Balance Sheet
Opening net Liability 443,916 641,433
Expenses 3,282,129 443,916
Contribution (443,916) (641,443)
Closing Net Liability 3,282,129 443,916
Assumptions
Discount Rate 8.2% p.a. 8.40% p.a.
Future Salary Increase (%)
General Staff 5.00% 5.00%
Others 5.00% 5.00%
Expected Rate of Return on Plan Assets 8.00% p.a. 8.00% p.a.
Notes:
i. The Company has adopted the AS 15 revised with effect from April 1, 2008 and, hence, the correspondingfigures for the previous year have not been furnished.
ii. The expected return on plan assets is as furnished by HDFC Standard Life.
Schedules to the Accounts as at March 31, 2011

8/3/2019 Annual Reports 2010 11
http://slidepdf.com/reader/full/annual-reports-2010-11 52/64
11. Related Party Disclosures
Name of the related Party and Nature of Relationship
Holding Company: HDFC Bank Limited
Enterprise under common control of Holding company: HDFC Securities Limited.
Enterprise over which holding company is able to exercise significant influence: HBL Global Pvt
Key Management Person: Vinod Yennemadi
Note: Related party relationships are as identified by the Management and relied upon by the Auditors.
Details of Related Party Transactions for the Year:
(Amount in `)
Nature Of Transaction Related Party 2010-11 2009-10
Tele Collection Charges/Field CollectionCharges Received/Recoverable forCollection Services Rendered HDFC Bank Ltd 391,868,209 294,206,107
Expenses Recoverable for expenses
incurred on behalf of HDFC bank HDFC Bank Ltd - 347,491Term loan availed during the year HDFC Bank Ltd 2,750,000,000 2,000,000,000
Term loan paid during the year HDFC Bank Ltd 636,336,364 -
Term loan outstanding HDFC Bank Ltd 4,113,663,636 2,000,000,000
Security Deposit received HDFC Bank Ltd 97,500,000 60,000,000
Interest Paid on term loan & OD account HDFC Bank Ltd 229,355,698 54,607,179
Interest Received On Fixed Deposits HDFC Bank Ltd 273,973 833,973
Rent Paid for premises taken on Sub-lease HDFC Bank Ltd 5,625,840 21,209,105
Balance in current accounts HDFC Bank Ltd 672,040,970 114,745,854
Fixed Deposits Placed HDFC Bank Ltd 1,000,000,000 -
Money received for Software surrendered HDFC Bank Ltd 700,800 -
Investment Banking Fees Paid HDFC Bank Ltd 6,435 6,303,580
IPA charges HDFC Bank Ltd 30,000 -
Locker Rent HDFC Bank Ltd 1,381 -
Bank Charges HDFC Bank Ltd 1,217,514 -
Balance receivable HDFC Bank Ltd 64,749,507 26,985,381
Rent Received/Receivable for premisesgiven on Sub-lease HBL Global Pvt Ltd. 337,848 176,433
Equipment Hire Charges Paid HBL Global Pvt Ltd. 976,873 NIL
Rent Paid HBL Global Pvt Ltd. 1,563,617 NIL
Security & House Keeping Charges
Receivable HBL Global Pvt Ltd. 112,887 NIL
Electricity Charges Paid HBL Global Pvt Ltd. 177,103 NIL
Balance payable HBL Global Pvt Ltd. 184,726 NIL
Expenses Recoverable HDFC Securities Ltd. 185,902 59,839
Expenses Payable HDFC Securities Ltd. 98,697 142,459
Rent Received/Receivable from
HDFC Securities for premises given onSub-lease HDFC Securities Ltd. 164,784 100,554
Balance Receivable HDFC Securities Ltd. 141,525 59,839
Professional fees Vinod Yennemadi 1,770,000 2,272,000
Schedules to the Accounts as at March 31, 2011

8/3/2019 Annual Reports 2010 11
http://slidepdf.com/reader/full/annual-reports-2010-11 53/64
Schedules to the Accounts as at March 31, 2011
12. Earnings per Share
(` in lakhs)
Particulars 2010-11 2009-10
Net Profit/Loss (`) 158,077,558 99,184,151
Weighted Average Number of Equity Shares
Basic 179,318,340 105,007,000
Diluted 179,941,840 105,007,000
Earnings per Share
Basic 0.88 0.94
Diluted 0.88 0.94
Face Value Per Share 10/- 10/-
13. Operating lease
i. Future Lease Rental payments
(Amount in `)
Period 2010-11 2009-2010
Not later than one year 60,575,665 43,712,563
Later than one year, but less than three years 111,245,227 88,393,095
More than three years, but less than five years 99,936,175 68,750,921
More than five years 115,632,203 97,944,505
ii. Lease payments recognized in the Profit and Loss Account ` 599.92 lakhs (Previous year ` 564
lakhs)
iii. Future sub lease income receivable is ` 32,37,987.
iv. General description of leasing arrangement
a) Leased Assets: Premises, Computers and Cars.
b) Future lease rentals are determined on the basis of agreed terms.
c) At the expiry of the lease term, the Company has an option either to return the asset or extend the te
by giving notice in writing.
14. Managerial Remuneration and Computation of Net Profits under Section 198/349 of t
Companies Act, 1956
i. Manager’s Remuneration(Amount in `)
Particulars 2010-11 2009-10
Salaries and Allowances 4,006,509 2,941,910
Contribution to Provident and other fund 118,800 100,848
Other benefits 375,535 354,555
Total 4,500,844 3397,313

8/3/2019 Annual Reports 2010 11
http://slidepdf.com/reader/full/annual-reports-2010-11 54/64
Schedules to the Accounts as at March 31, 2011
Note:
In computing the Manager Remuneration, perquisites have been valued in terms of actual expenditure incur
by the Company in providing the benefits except that in case of certain expenses where the actual amounexpenditure cannot be ascertained with reasonable accuracy, notional amount as per Income Tax Rules h
been added. Actuarial valuation based contribution/ provision with respect to gratuity and provision for leaencashment has not been included as these are for the Company as a whole.
ii. Computation of Net Profits under Section 198/349 of the Companies Act, 1956
(Amount in `)
Particulars 2010-11 2009-10
Profit before Tax as per Profit and Loss Account 245,773,872 123,184,151
Add: Depreciation as per Books 32,444,142 17,089,407
Provision for NPA
Manager’s Remuneration 4,500,844 3,397,313
Less: Depreciation as per Sec 350 of the Companies Act, 1956 32,444,142 17,089,407
Profit on Sale of Investments (Net) 238,842 100,562
Adjusted Profit 463,150,816 167,280,605
The Company depreciates its fixed assets based on estimated useful lives which are lower or equal to
implicit estimated useful lives prescribed by schedule XIV of the Act. Thus, the depreciation charged in books is higher than that prescribed as the minimum by the Act. Hence, this higher value has been consideas a deduction for the computation of managerial remuneration above.
iii. The total remuneration as stated in 6(i) above are within the maximum permissible limits under the CompanAct, 1956.
15. Auditors’ Remuneration(Amount in `)
Particulars 2010-11 2009-10
As Auditor 750,000 500,000
In other capacity
For Tax audit 130,000 100,000
For Certificates 20,000 -
For Expenses - 34,225
Sub Total 900,000 633,549
Service Tax 92,700 62,556
Total 992,700 696,105
16. Accounting for Employee Share based PaymentsThe shareholders of the Company approved stock option schemes ESOS – 1 and ESOS – 2 in April 20ESOS – 3 in October 2009 and ESOS – 4 in October, 2010. Under the term of the schemes, the Compa
may issue stock options to employees and directors of the Company, each of which is convertible into onequity share.
Shares under ESOS 1 have vested during the year and have been duly exercised.
Schemes ESOS – 2, ESOS – 3 provide for the issuance of options at the recommendation of the Compensat
Committee of the Board (the “Compensation Committee”) at a price of Rs. 10 per share, being the face vaof the share. ESOS – 4 provide for the issuance of options at the recommendation of the Compensat
Committee of the Board at a price of Rs. 17.50 per share.
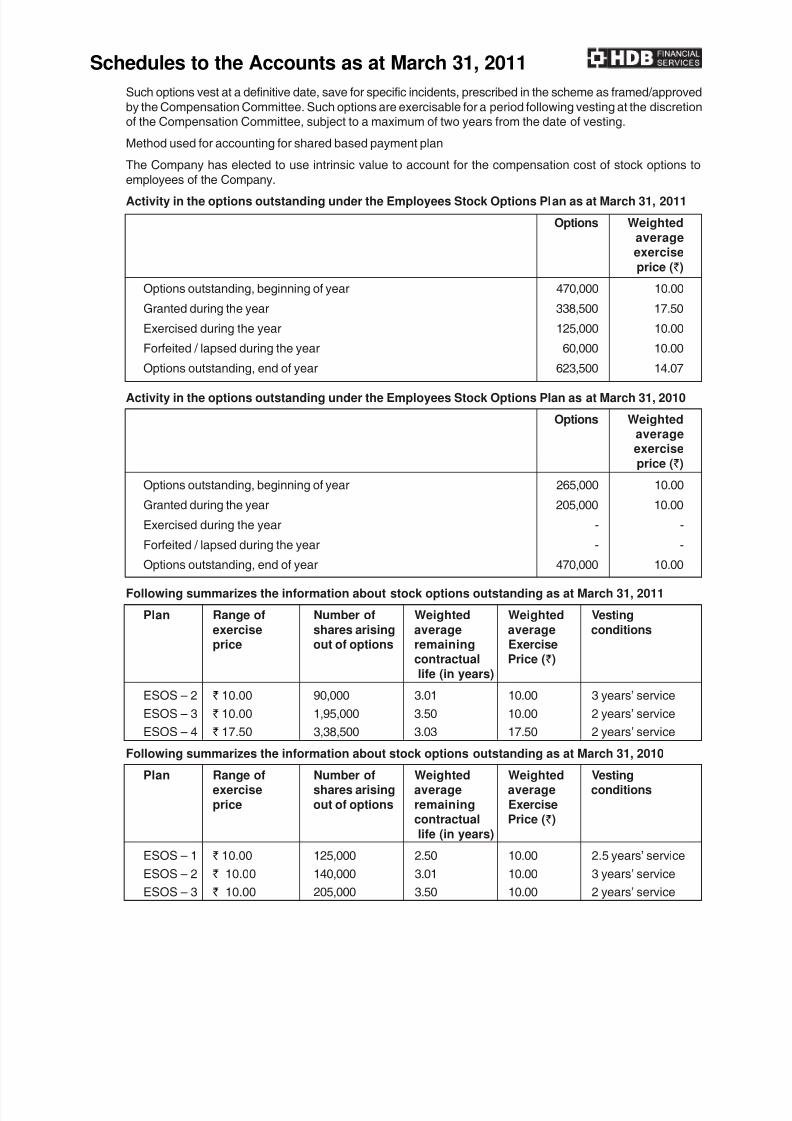
8/3/2019 Annual Reports 2010 11
http://slidepdf.com/reader/full/annual-reports-2010-11 55/64
Schedules to the Accounts as at March 31, 2011
Such options vest at a definitive date, save for specific incidents, prescribed in the scheme as framed/approv
by the Compensation Committee. Such options are exercisable for a period following vesting at the discretof the Compensation Committee, subject to a maximum of two years from the date of vesting.
Method used for accounting for shared based payment plan
The Company has elected to use intrinsic value to account for the compensation cost of stock options
employees of the Company.
Activity in the options outstanding under the Employees Stock Options Plan as at March 31, 2011
Options Weighted
averageexercise
price (`)
Options outstanding, beginning of year 470,000 10.00
Granted during the year 338,500 17.50
Exercised during the year 125,000 10.00
Forfeited / lapsed during the year 60,000 10.00
Options outstanding, end of year 623,500 14.07
Activity in the options outstanding under the Employees Stock Options Plan as at March 31, 2010
Options Weightedaverageexercise
price (`)
Options outstanding, beginning of year 265,000 10.00
Granted during the year 205,000 10.00
Exercised during the year - -
Forfeited / lapsed during the year - -
Options outstanding, end of year 470,000 10.00
Following summarizes the information about stock options outstanding as at March 31, 2011
Plan Range of Number of Weighted Weighted Vesting
exercise shares arising average average conditionsprice out of options remaining Exercise
contractual Price (`)
life (in years)
ESOS – 2 ` 10.00 90,000 3.01 10.00 3 years’ service
ESOS – 3 ` 10.00 1,95,000 3.50 10.00 2 years’ service
ESOS – 4 ` 17.50 3,38,500 3.03 17.50 2 years’ service
Following summarizes the information about stock options outstanding as at March 31, 2010
Plan Range of Number of Weighted Weighted Vestingexercise shares arising average average conditions
price out of options remaining Exercisecontractual Price (`)
life (in years)
ESOS – 1 ` 10.00 125,000 2.50 10.00 2.5 years’ service
ESOS – 2 ` 10.00 140,000 3.01 10.00 3 years’ service
ESOS – 3 ` 10.00 205,000 3.50 10.00 2 years’ service

8/3/2019 Annual Reports 2010 11
http://slidepdf.com/reader/full/annual-reports-2010-11 56/64
Fair Value methodology
The fair value of options used to compute pro forma net income and earnings per equity share have be
estimated on the dates of each grant using the Black-Scholes model. The shares of Company are not listed
any stock exchange. Accordingly, the Company has considered the volatility of the Company’s stock price
zero, since historical volatility of similar listed enterprise was not available. The various assumptions conside
in the pricing model for the stock options granted by the Company during the year ended March 31, 2011 a
March 31, 2011 March 31, 2010
Dividend yield - -
Expected volatility - -
Risk- free interest rate 7.67% 6.81%
Expected life of the option 1-5 years 1-5 years
Impact of fair value method on net profit and EPS
Had compensation cost for the Company’s stock option plans outstanding been determined based on the value approach, the Company’s net profit and earnings per share would have been as per the pro form
amounts indicated below:
(` in lakhs)
March 31, 2011 March 31, 2010
Net Profit/(Loss) (as reported) 1,580.78 991.84
Stock based compensation expense determined under
fair value based method: (pro forma) (5.29) (2.00)
Net Profit/(Loss) (pro forma) 1,575.49 989.84
Basic earnings per share (as reported) 0.91 0.94
Basic earnings per share (pro forma) 0.91 0.94
Diluted earnings per share (as reported) 0.91 0.94
Diluted earnings per share (pro forma) 0.91 0.94
17. Micro Small and Medium Enterprises
Company has send letter to suppliers to confirm whether they are covered under Micro, Small and Medi
Enterprises Act, 2006 as well as they have filed required memorandum with the prescribed authoriti
Out of the letters send to the parties some confirmation has been received till the date of finalization
Balance Sheet.
(Amount in `)
Particulars As at As at
31 March, 2011 31 March, 2010
The Principal amount remaining Unpaid at the end of the year 9,500 0
The Interest Amount remaining unpaid at the end of the year - -
Balance of MSME parties at the end of the year 9,500 -
Schedules to the Accounts as at March 31, 2011
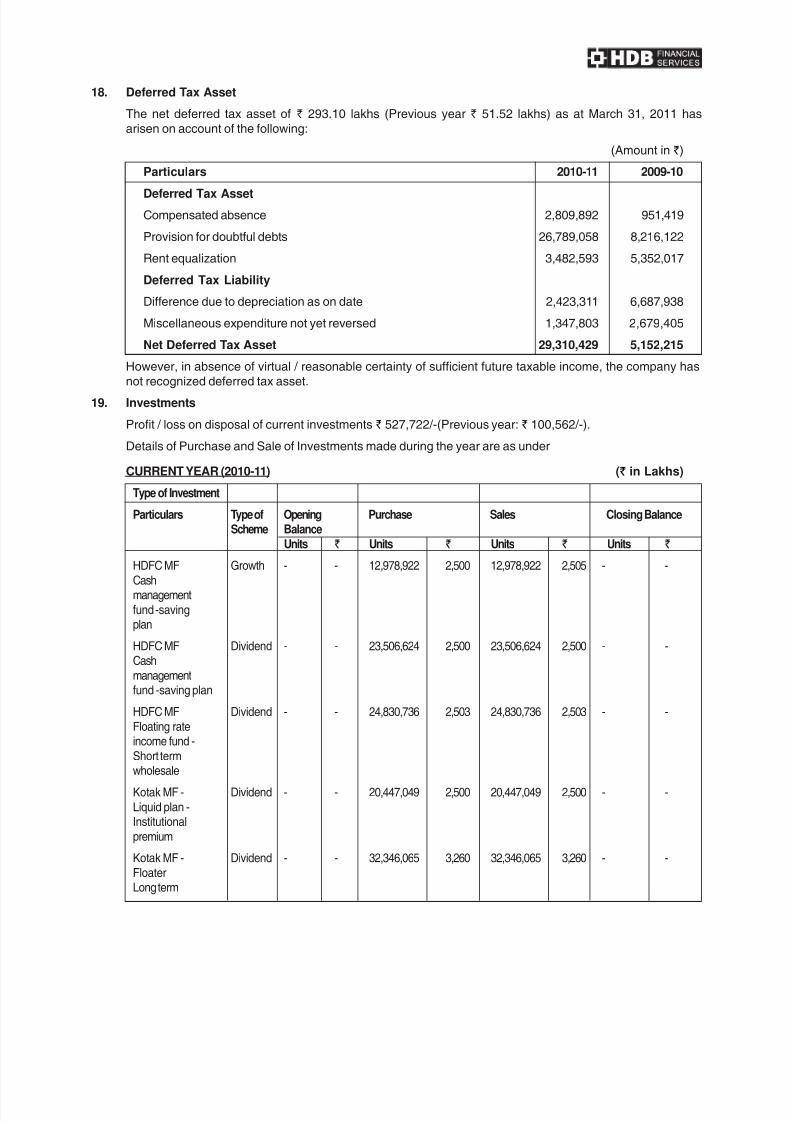
8/3/2019 Annual Reports 2010 11
http://slidepdf.com/reader/full/annual-reports-2010-11 57/64
18. Deferred Tax Asset
The net deferred tax asset of ` 293.10 lakhs (Previous year ` 51.52 lakhs) as at March 31, 2011 h
arisen on account of the following:
(Amount in `)
Particulars 2010-11 2009-10
Deferred Tax Asset
Compensated absence 2,809,892 951,419
Provision for doubtful debts 26,789,058 8,216,122
Rent equalization 3,482,593 5,352,017
Deferred Tax Liability
Difference due to depreciation as on date 2,423,311 6,687,938
Miscellaneous expenditure not yet reversed 1,347,803 2,679,405
Net Deferred Tax Asset 29,310,429 5,152,215
However, in absence of virtual / reasonable certainty of sufficient future taxable income, the company h
not recognized deferred tax asset.
19. Investments
Profit / loss on disposal of current investments ` 527,722/-(Previous year: ` 100,562/-).
Details of Purchase and Sale of Investments made during the year are as under
CURRENT YEAR (2010-11) (` in Lakhs)
Type of Investment
Particulars Type of Opening Purchase Sales Closing BalanceScheme Balance
Units ` Units ` Units ` Units `
HDFC MF Growth - - 12,978,922 2,500 12,978,922 2,505 - -Cashmanagement
fund -savingplan
HDFC MF Dividend - - 23,506,624 2,500 23,506,624 2,500 - -Cash
managementfund -saving plan
HDFC MF Dividend - - 24,830,736 2,503 24,830,736 2,503 - -
Floating rateincome fund -
Short termwholesale
Kotak MF - Dividend - - 20,447,049 2,500 20,447,049 2,500 - -
Liquid plan -Institutional
premium
Kotak MF - Dividend - - 32,346,065 3,260 32,346,065 3,260 - -
FloaterLong term

8/3/2019 Annual Reports 2010 11
http://slidepdf.com/reader/full/annual-reports-2010-11 58/64
Particulars Type of Opening Purchase Sales Closing Balance
Scheme BalanceUnits ` Units ` Units ` Units `
Birla sunlife Dividend - - 65,659,804 6,579 65,659,804 6,579 - -MF cash plus -
Institutionalpremium
Birla sunlife Dividend - - 34,995,868 3,502 34,995,868 3,502 - -MF Saving fund
Institutionalpremium
Birla sunlife Dividend - - 46,750,700 4,678 46,750,700 4,678 - -
MF Ultrashort term -Institutional
premium
Tata MF Dividend - - 269,304 3,001 269,304 3,001 - -Liquid superhigh investmentfund
HDFC MF Dividend - - 29,905,797 3,000 - - 29,905,797 3,000
Cashmanagement
fund - Treasuryadvantage -
Wholesale
PREVIOUS YEAR (2009-10) (` in Lakhs)
HDFC MF - Growth - - 1,900,986 350 1,900,986 351 - -Cash
managementfund -saving plan
Notes:
(` in Lakhs)
Aggregate of Investments As at As at As at As at
31-Mar-11 31-Mar-11 31-Mar-10 31-Mar-10
Cost Market Value Cost Market Value
1. Quoted Investments - - - -
2. Unquoted Investments 350.00 - 350.00 -
3. Immovable Properties - - - -
TOTAL 350.00 - 350.00 -
Less : Provision for Dimunition
in value of Shares - - - -
TOTAL 350.00 - 350.00 -
Note: Aggregate NAV of the Unquoted Mutual Fund Units is ` 30,00,00,000( Previous year nil)
8/3/2019 Annual Reports 2010 11
http://slidepdf.com/reader/full/annual-reports-2010-11 59/64
Schedules to the Accounts as at March 31, 2011
20. Capital commitments as at Balance Sheet date is `133.49 lakhs net of advances (Previous Year ` 277
lakhs)
21 During the year company has mobilized `15000 lakhs from preferential allotment of Equity shares to
promoter company & the same has been fully deployed for the purpose for which it has been raised.
22 Previous year figures have been regrouped/ rearranged, where necessary.
For and on behalf of the Board
Vinod YennemadiChairman
Pralay Mondal
Director
G. Ramesh
Chief Executive Officer
Haren Parekh
Finance Controller
Rakesh PathakCompany Secretary & Manager Legal
Place: MumbaiDate : April 15, 2011

8/3/2019 Annual Reports 2010 11
http://slidepdf.com/reader/full/annual-reports-2010-11 60/64
(Amount in
For the year For the ye
ended March ended Marc
31, 2011 31, 201
Cash flows from operating activities
Net profit before income tax 245,773,872 123,184,15
Profit on sale fo asset (238,842)
Adjustments for:
Prior Period item (2,526,358)
Depreciation 32,444,142 17,089,40
Adjustments for :
(Increase) in Investments -
Increase in Receivables under financing activity (7,265,645,950) (3,892,264,44
(Increase) in Advances (56,796,798) (28,168,98
(Decrease) in Borrowings 2,176,395,361 3,661,051,08
(Increase) in Other assets -
-Increase in Other liabilities and provisions 785,188,507 (27,040,07
(Increase)/Decrease in Deposit Placements
(4,085,406,067) (146,148,86
Direct taxes paid (net of refunds) (35,826,750) (11,000,00
Preliminary, pre-operating and share issue expenses incurred
Net cash flow from/(used in) operating activities (4,121,232,817) (157,148,86
Cash flows from investing activities
Purchase of fixed assets (39,379,067) (28,791,07
Proceeds from sale of fixed assets 700,800
Short term investments (300,000,000)
Long term investments - (34,999,99
Net cash used in investing activities (338,678,267) (63,791,07
Cash Flow Statement
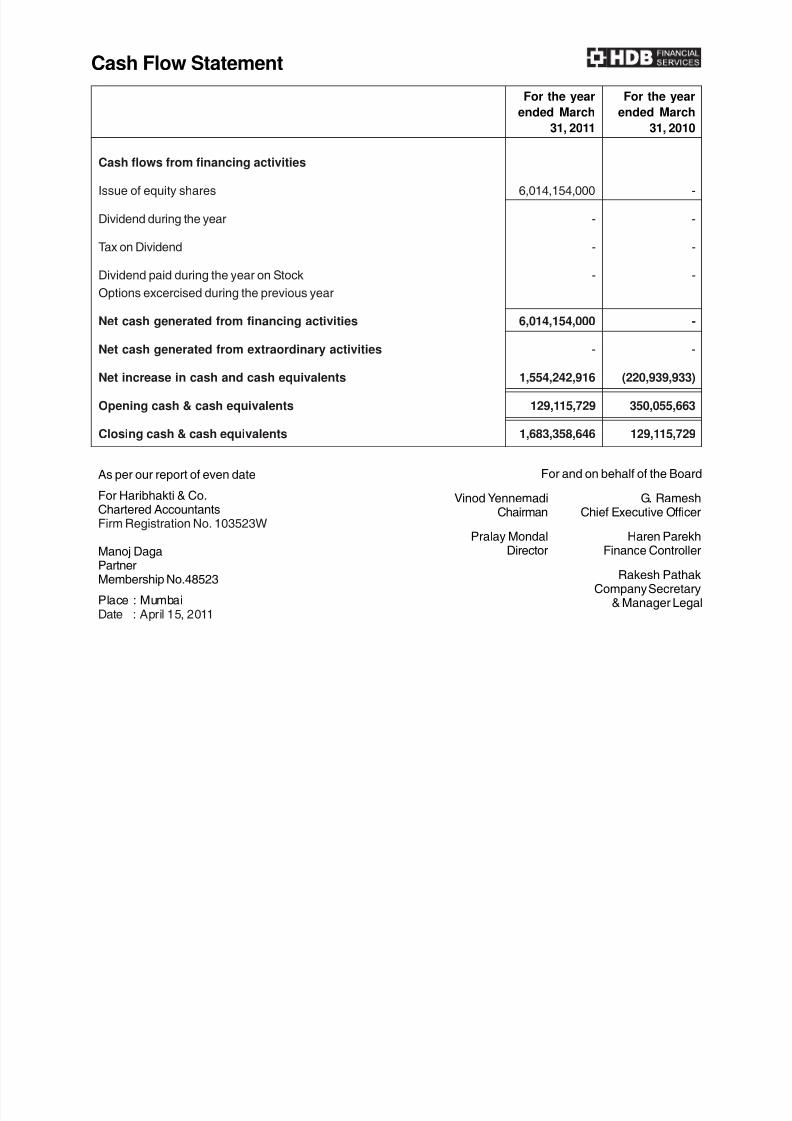
8/3/2019 Annual Reports 2010 11
http://slidepdf.com/reader/full/annual-reports-2010-11 61/64
For the year For the yea
ended March ended Marc
31, 2011 31, 201
Cash flows from financing activities
Issue of equity shares 6,014,154,000
Dividend during the year -
Tax on Dividend -
Dividend paid during the year on Stock -
Options excercised during the previous year
Net cash generated from financing activities 6,014,154,000
Net cash generated from extraordinary activities -
Net increase in cash and cash equivalents 1,554,242,916 (220,939,93
Opening cash & cash equivalents 129,115,729 350,055,66
Closing cash & cash equivalents 1,683,358,646 129,115,72
Cash Flow Statement
For and on behalf of the Bo
Vinod Yennemadi G. RameChairman Chief Executive Offi
Pralay Mondal Haren PareDirector Finance Contro
Rakesh PathCompany Secret
& Manager Le
As per our report of even date
For Haribhakti & Co.Chartered AccountantsFirm Registration No. 103523W
Manoj DagaPartnerMembership No.48523
Place : MumbaiDate : April 15, 2011
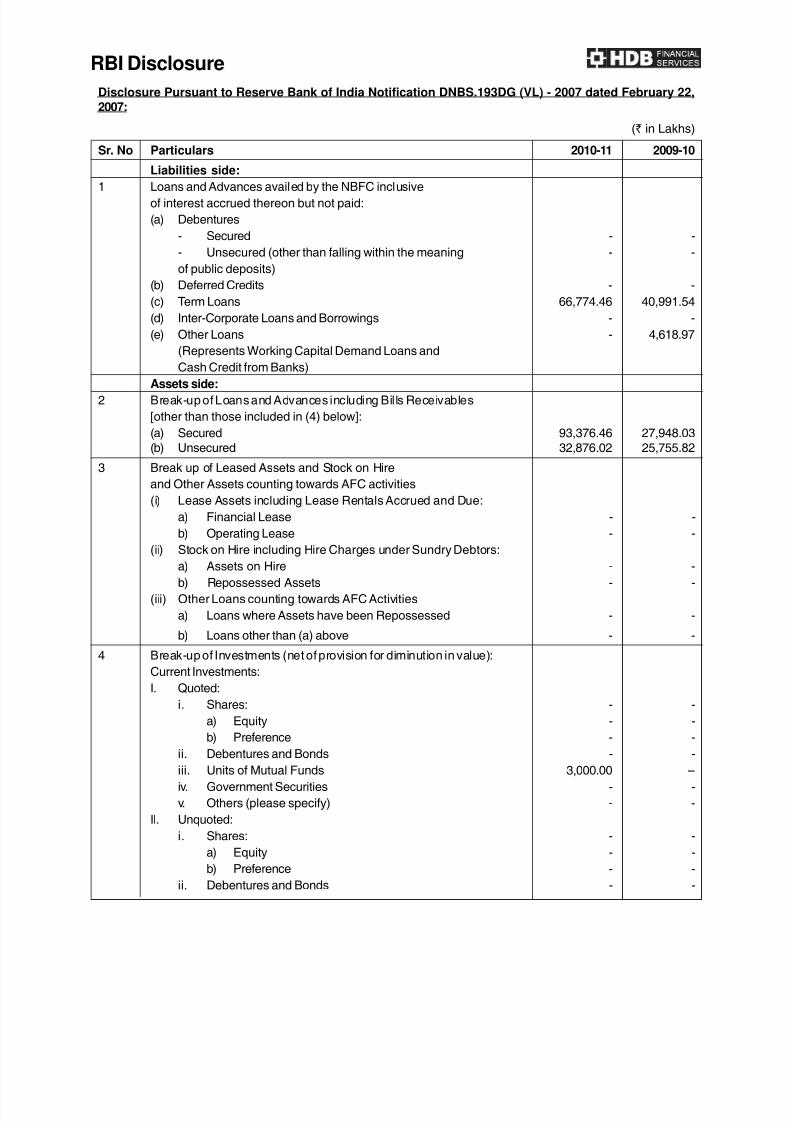
8/3/2019 Annual Reports 2010 11
http://slidepdf.com/reader/full/annual-reports-2010-11 62/64
RBI Disclosure
Disclosure Pursuant to Reserve Bank of India Notification DNBS.193DG (VL) - 2007 dated February 222007:
(` in Lakh
Sr. No Particulars 2010-11 2009-1
Liabilities side:
1 Loans and Advances availed by the NBFC inclusiveof interest accrued thereon but not paid:
(a) Debentures
- Secured -
- Unsecured (other than falling within the meaning -
of public deposits)
(b) Deferred Credits -
(c) Term Loans 66,774.46 40,991.5
(d) Inter-Corporate Loans and Borrowings -
(e) Other Loans - 4,618.9
(Represents Working Capital Demand Loans and
Cash Credit from Banks)Assets side:
2 Break-up of Loans and Advances including Bills Receivables
[other than those included in (4) below]:
(a) Secured 93,376.46 27,948.0
(b) Unsecured 32,876.02 25,755.8
3 Break up of Leased Assets and Stock on Hire
and Other Assets counting towards AFC activities
(i) Lease Assets including Lease Rentals Accrued and Due:
a) Financial Lease -
b) Operating Lease -
(ii) Stock on Hire including Hire Charges under Sundry Debtors:
a) Assets on Hire -
b) Repossessed Assets -
(iii) Other Loans counting towards AFC Activities
a) Loans where Assets have been Repossessed -
b) Loans other than (a) above -
4 Break-up of Investments (net of provision for diminution in value):
Current Investments:
I. Quoted:
i. Shares: -
a) Equity -
b) Preference -
ii. Debentures and Bonds -
iii. Units of Mutual Funds 3,000.00
iv. Government Securities -
v. Others (please specify) -
II. Unquoted:
i. Shares: -
a) Equity -
b) Preference -
ii. Debentures and Bonds -

8/3/2019 Annual Reports 2010 11
http://slidepdf.com/reader/full/annual-reports-2010-11 63/64
RBI Disclosure
Disclosure Pursuant to Reserve Bank of India Notification DNBS.193DG (VL) - 2007 dated February 22007:
(` in Lakh
Sr. No Particulars 2010-11 2009-1
Liabilities side:
iii. Units of Mutual Funds -iv. Government Securities -
v. Others (Please specify) -
Long Term Investments:
I. Quoted: -
i. Shares:
a) Equity -
b) Preference -
ii. Debentures and Bonds -
iii. Units of Mutual Funds -
iv. Government Securities -
v. Others (please specify) -II. Unquoted:
i. Shares: 349.99 349.9
a) Equity 349.99 349.9
b) Preference -
ii. Debentures and Bonds -
iii. Units of Mutual Funds -
iv. Government Securities -
v. Others (Please specify)
5 Borrower Group-wise Classification of Assets
Financed as in (2) and (3) above:
1. Related Parties(a) Subsidiaries -
(b) Companies in the same Group -
(c) Other Related Parties -
2. Other than Related Parties 126,252.48 53,703.8
6 Investor Group-wise Classification of all Investments
(Current and Long Term) in Shares and Securities
(both Quoted and Unquoted)
1. Related Parties
(a) Subsidiaries -
(b) Companies in the Same Group -
(c) Other Related Parties -
2. Other than Related Parties 349.99 349.9
7 Other Information
(i) Gross Non-Performing Assets
a. Related party -
b. Other than related party 413.77 509.5
(ii) Net Non-Performing Assets
(a) Related party -
(b) Other than related party 221.08 254.7
(iii) Assets Acquired in Satisfaction of Debt -

8/3/2019 Annual Reports 2010 11
http://slidepdf.com/reader/full/annual-reports-2010-11 64/64
(Submitted in terms of Part IV of schedule VI to the Companies Act, 1956)
I Registration Details
Registration No. : 051028 State Code: : 04
Balance Sheet Date : 31/03/2011
I I Capital Raised during the period (Amount in ` thousa
Public Issue : N I L Rights Issue :4,512,904,000
Bonus Issue : N I L Private Placement : N I L
III Position of Mobilisation and Deployment of Funds (Amount in ` thousan
Total Liabilities : 14,957,895 Total Assets : 14,957,895
Sources of Funds (Amount in ` thousa
Paid-up Capital : 4,102,640 Reserves & Surplus : 3,090,051
Secured Loans : 6,677,446 Unsecured Loans : NIL
Application of Funds (Amount in ` thousa
Loans : N I L Net Fixed Assets : 101,905
Capital work in Progress : 2,996 Deferred Tax Asset : N I L
Investments : 334,999 Net Current Assets : 13,430,235
Accumulated losses : N I L Miscellaneous Expenditure : N I L
IV Performance of Company (Amount in ` thousa
Total Income : 1,793,641 Total Expenditure : 1,547,867
Profit Before Tax : 245,773 Profit After Tax : 158,077
Balance Sheet Abstract and CompaniesGeneral Business Profile
Related Documents