ANNUAL REPORT 2007

Welcome message from author
This document is posted to help you gain knowledge. Please leave a comment to let me know what you think about it! Share it to your friends and learn new things together.
Transcript

ANNUAL REPORT 2007


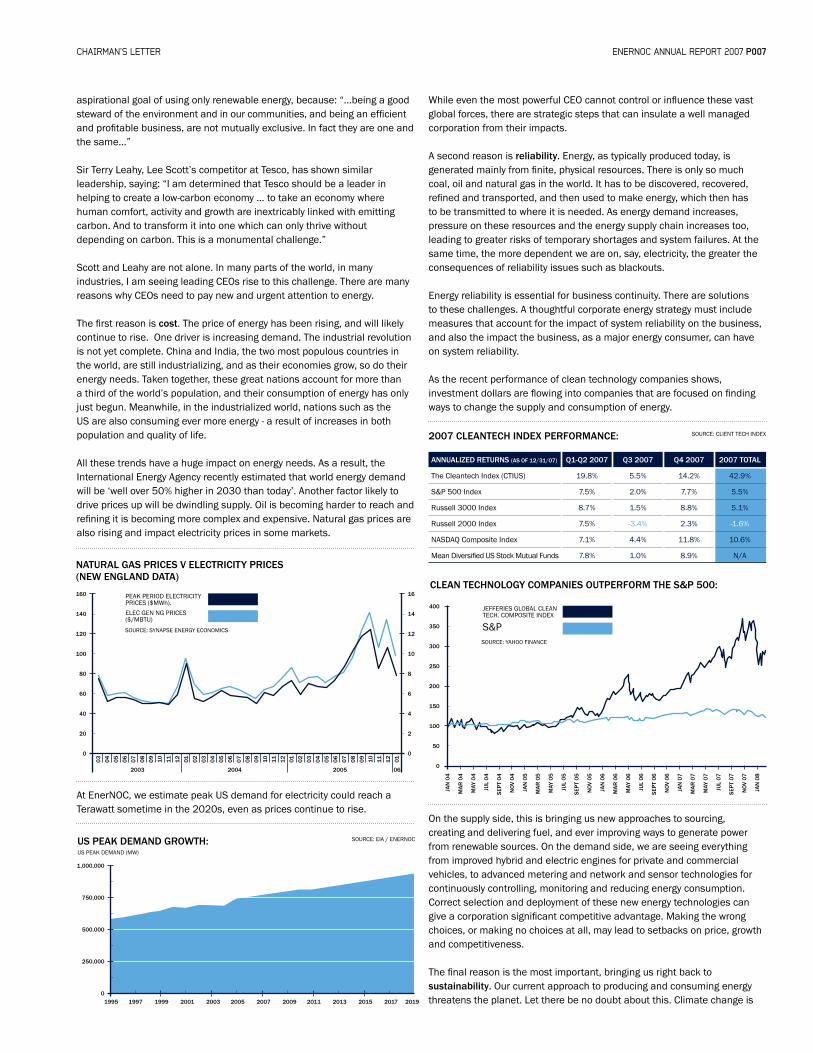
level of senior executive attention. For example, US corporations spent an estimated $129 billion per year on telecommunications in 2007, and all of them also invest in advanced products and services to actively manage these systems. But less than one percent of companies make a significant investment in advanced technology to manage electricity, even though electricity spending was greater at approximately $194 billion per year.
CHAIRMAN’S LETTER
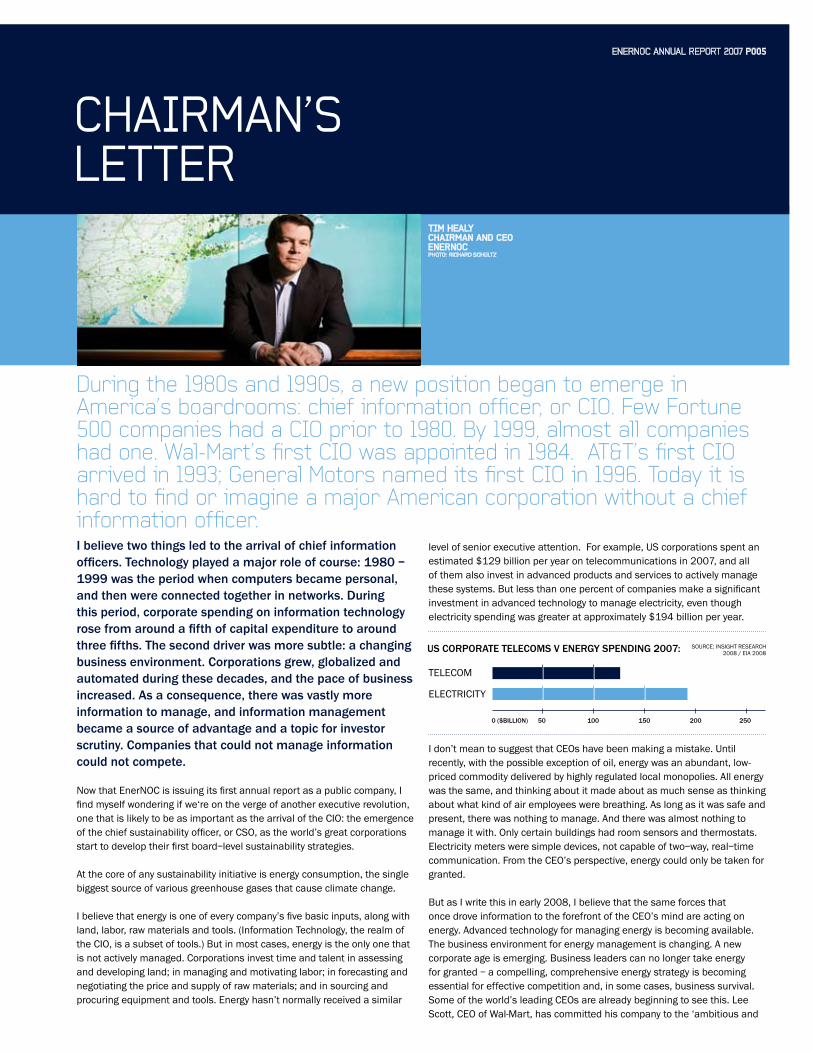
I believe two things led to the arrival of chief information officers. Technology played a major role of course: 1980 – 1999 was the period when computers became personal, and then were connected together in networks. During this period, corporate spending on information technology rose from around a fifth of capital expenditure to around three fifths. The second driver was more subtle: a changing business environment. Corporations grew, globalized and automated during these decades, and the pace of business increased. As a consequence, there was vastly more information to manage, and information management became a source of advantage and a topic for investor scrutiny. Companies that could not manage information could not compete.
Now that EnerNOC is issuing its first annual report as a public company, I find myself wondering if we‘re on the verge of another executive revolution, one that is likely to be as important as the arrival of the CIO: the emergence of the chief sustainability officer, or CSO, as the world’s great corporations start to develop their first board–level sustainability strategies.
At the core of any sustainability initiative is energy consumption, the single biggest source of various greenhouse gases that cause climate change.
I believe that energy is one of every company’s five basic inputs, along with land, labor, raw materials and tools. (Information Technology, the realm of the CIO, is a subset of tools.) But in most cases, energy is the only one that is not actively managed. Corporations invest time and talent in assessing and developing land; in managing and motivating labor; in forecasting and negotiating the price and supply of raw materials; and in sourcing and procuring equipment and tools. Energy hasn’t normally received a similar
During the 1980s and 1990s, a new position began to emerge in America’s boardrooms: chief information officer, or CIO. Few Fortune 500 companies had a CIO prior to 1980. By 1999, almost all companies had one. Wal-Mart’s first CIO was appointed in 1984. AT&T’s first CIO arrived in 1993; General Motors named its first CIO in 1996. Today it is hard to find or imagine a major American corporation without a chief information officer.
I don’t mean to suggest that CEOs have been making a mistake. Until recently, with the possible exception of oil, energy was an abundant, low-priced commodity delivered by highly regulated local monopolies. All energy was the same, and thinking about it made about as much sense as thinking about what kind of air employees were breathing. As long as it was safe and present, there was nothing to manage. And there was almost nothing to manage it with. Only certain buildings had room sensors and thermostats. Electricity meters were simple devices, not capable of two–way, real–time communication. From the CEO’s perspective, energy could only be taken for granted.
But as I write this in early 2008, I believe that the same forces that once drove information to the forefront of the CEO’s mind are acting on energy. Advanced technology for managing energy is becoming available. The business environment for energy management is changing. A new corporate age is emerging. Business leaders can no longer take energy for granted – a compelling, comprehensive energy strategy is becoming essential for effective competition and, in some cases, business survival. Some of the world’s leading CEOs are already beginning to see this. Lee Scott, CEO of Wal-Mart, has committed his company to the ‘ambitious and
US CorporATe TeleComS v energy SpenDIng 2007:
0 ($BIllIon) 50 100 150 200 250
TELECOM
ELECTRICITY
SOURCE: INSIghT RESEARCh2008 / EIA 2008

At EnerNOC, we estimate peak US demand for electricity could reach a Terawatt sometime in the 2020s, even as prices continue to rise.
ENERNOC ANNUAL REPORT 2007 P007CHAIRMAN’S LETTER
aspirational goal of using only renewable energy, because: “…being a good steward of the environment and in our communities, and being an efficient and profitable business, are not mutually exclusive. In fact they are one and the same…”
Sir Terry Leahy, Lee Scott’s competitor at Tesco, has shown similar leadership, saying: “I am determined that Tesco should be a leader in helping to create a low-carbon economy … to take an economy where human comfort, activity and growth are inextricably linked with emitting carbon. And to transform it into one which can only thrive without depending on carbon. This is a monumental challenge.”
Scott and Leahy are not alone. In many parts of the world, in many industries, I am seeing leading CEOs rise to this challenge. There are many reasons why CEOs need to pay new and urgent attention to energy.
The first reason is cost. The price of energy has been rising, and will likely continue to rise. One driver is increasing demand. The industrial revolution is not yet complete. China and India, the two most populous countries in the world, are still industrializing, and as their economies grow, so do their energy needs. Taken together, these great nations account for more than a third of the world’s population, and their consumption of energy has only just begun. Meanwhile, in the industrialized world, nations such as the US are also consuming ever more energy - a result of increases in both population and quality of life. All these trends have a huge impact on energy needs. As a result, the International Energy Agency recently estimated that world energy demand will be ‘well over 50% higher in 2030 than today’. Another factor likely to drive prices up will be dwindling supply. Oil is becoming harder to reach and refining it is becoming more complex and expensive. Natural gas prices are also rising and impact electricity prices in some markets.
nATUrAl gAS prICeS v eleCTrICITy prICeS(new englAnD DATA)
Q1-Q2 2007
19.8%
7.5%
8.7%
7.5%
7.1%
7.8%
Q3 2007
5.5%
2.0%
1.5%
-3.4%
4.4%
1.0%
Q4 2007
14.2%
7.7%
8.8%
2.3%
11.8%
8.9%
2007 ToTAl
42.9%
5.5%
5.1%
-1.6%
10.6%
N/A
2007 CleAnTeCH InDeX perFormAnCe:
AnnUAlIZeD reTUrnS (AS oF 12/31/07)
The Cleantech Index (CTIUS)
S&P 500 Index
Russell 3000 Index
Russell 2000 Index
NASDAQ Composite Index
Mean Diversified US Stock Mutual Funds
While even the most powerful CEO cannot control or influence these vast global forces, there are strategic steps that can insulate a well managed corporation from their impacts.
A second reason is reliability. Energy, as typically produced today, is generated mainly from finite, physical resources. There is only so much coal, oil and natural gas in the world. It has to be discovered, recovered, refined and transported, and then used to make energy, which then has to be transmitted to where it is needed. As energy demand increases, pressure on these resources and the energy supply chain increases too, leading to greater risks of temporary shortages and system failures. At the same time, the more dependent we are on, say, electricity, the greater the consequences of reliability issues such as blackouts.
Energy reliability is essential for business continuity. There are solutions to these challenges. A thoughtful corporate energy strategy must include measures that account for the impact of system reliability on the business, and also the impact the business, as a major energy consumer, can have on system reliability.
As the recent performance of clean technology companies shows, investment dollars are flowing into companies that are focused on finding ways to change the supply and consumption of energy.
160
140
120
100
80
60
40
20
0
2003 2004 2005 06
16
14
12
10
8
6
4
2
0
03
04
05
06
07
08
09
10
11
12 01 02
03
04
05
06
07
08
09
10
11
12 01 02
03
04
05
06
07
08
09
10
11
12 01
PEAK PERIOD ELECTRICITY PRICES ($MWh).
ELEC gEN Ng PRICES ($/MBTU)
1,000,000
750,000
500.000
250,000
01995 1997 1999 2001 2003 2005 2007 2009 2011 2013 2015 2017 2019
US peAK DemAnD growTH:US PEAK DEMAND (MW)
SOURCE: EIA / ENERNOC
SOURCE: SYNAPSE ENERgY ECONOMICS
SOURCE: CLIENT TECh INDEX
CleAn TeCHnology CompAnIeS oUTperForm THe S&p 500:
400
350
300
250
200
150
100
50
0
JAn
04
mA
r 0
4
mAy
04
JUl
04
Sep
T 0
4
no
v 0
4
JAn
05
mA
r 0
5
mAy
05
JUl
05
Sep
T 0
5
no
v 0
5
JAn
06
mA
r 0
6
mAy
06
JUl
06
Sep
T 0
6
no
v 0
6
JAn
07
mA
r 0
7
mAy
07
JUl
07
Sep
T 0
7
no
v 0
7
JAn
08
JEFFERIES gLOBAL CLEAN TECh. COMPOSITE INDEX
S&PSOURCE: YAhOO FINANCE
On the supply side, this is bringing us new approaches to sourcing, creating and delivering fuel, and ever improving ways to generate power from renewable sources. On the demand side, we are seeing everything from improved hybrid and electric engines for private and commercial vehicles, to advanced metering and network and sensor technologies for continuously controlling, monitoring and reducing energy consumption. Correct selection and deployment of these new energy technologies can give a corporation significant competitive advantage. Making the wrong choices, or making no choices at all, may lead to setbacks on price, growth and competitiveness.
The final reason is the most important, bringing us right back to sustainability. Our current approach to producing and consuming energy threatens the planet. Let there be no doubt about this. Climate change is

ENERNOC ANNUAL REPORT 2007 P009CHAIRMAN’S LETTER
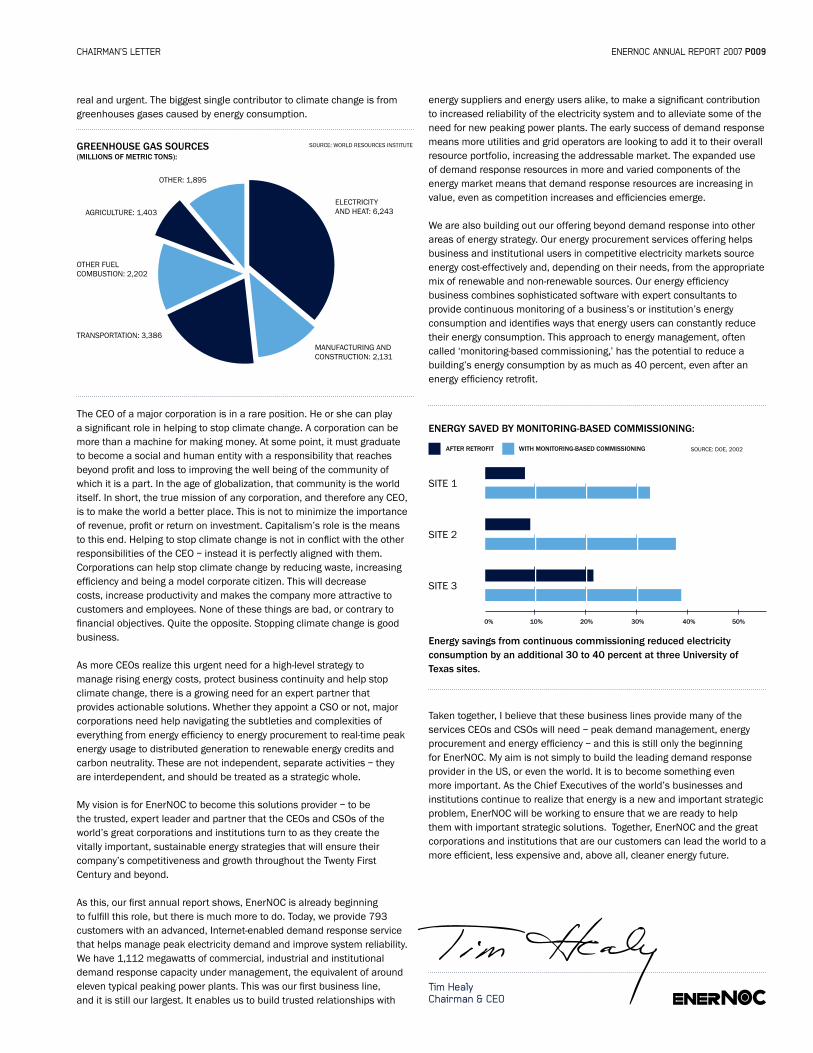
real and urgent. The biggest single contributor to climate change is from greenhouses gases caused by energy consumption.
The CEO of a major corporation is in a rare position. he or she can play a significant role in helping to stop climate change. A corporation can be more than a machine for making money. At some point, it must graduate to become a social and human entity with a responsibility that reaches beyond profit and loss to improving the well being of the community of which it is a part. In the age of globalization, that community is the world itself. In short, the true mission of any corporation, and therefore any CEO, is to make the world a better place. This is not to minimize the importance of revenue, profit or return on investment. Capitalism’s role is the means to this end. helping to stop climate change is not in conflict with the other responsibilities of the CEO – instead it is perfectly aligned with them. Corporations can help stop climate change by reducing waste, increasing efficiency and being a model corporate citizen. This will decrease costs, increase productivity and makes the company more attractive to customers and employees. None of these things are bad, or contrary to financial objectives. Quite the opposite. Stopping climate change is good business.
As more CEOs realize this urgent need for a high-level strategy to manage rising energy costs, protect business continuity and help stop climate change, there is a growing need for an expert partner that provides actionable solutions. Whether they appoint a CSO or not, major corporations need help navigating the subtleties and complexities of everything from energy efficiency to energy procurement to real-time peak energy usage to distributed generation to renewable energy credits and carbon neutrality. These are not independent, separate activities – they are interdependent, and should be treated as a strategic whole.
My vision is for EnerNOC to become this solutions provider – to be the trusted, expert leader and partner that the CEOs and CSOs of the world’s great corporations and institutions turn to as they create the vitally important, sustainable energy strategies that will ensure their company’s competitiveness and growth throughout the Twenty First Century and beyond.
As this, our first annual report shows, EnerNOC is already beginning to fulfill this role, but there is much more to do. Today, we provide 793 customers with an advanced, Internet-enabled demand response service that helps manage peak electricity demand and improve system reliability. We have 1,112 megawatts of commercial, industrial and institutional demand response capacity under management, the equivalent of around eleven typical peaking power plants. This was our first business line, and it is still our largest. It enables us to build trusted relationships with
energy suppliers and energy users alike, to make a significant contribution to increased reliability of the electricity system and to alleviate some of the need for new peaking power plants. The early success of demand response means more utilities and grid operators are looking to add it to their overall resource portfolio, increasing the addressable market. The expanded use of demand response resources in more and varied components of the energy market means that demand response resources are increasing in value, even as competition increases and efficiencies emerge.
We are also building out our offering beyond demand response into other areas of energy strategy. Our energy procurement services offering helps business and institutional users in competitive electricity markets source energy cost-effectively and, depending on their needs, from the appropriate mix of renewable and non-renewable sources. Our energy efficiency business combines sophisticated software with expert consultants to provide continuous monitoring of a business’s or institution’s energy consumption and identifies ways that energy users can constantly reduce their energy consumption. This approach to energy management, often called ‘monitoring-based commissioning,’ has the potential to reduce a building’s energy consumption by as much as 40 percent, even after an energy efficiency retrofit.
Tim HealyChairman & CEO
greenHoUSe gAS SoUrCeS (mIllIonS oF meTrIC TonS):
OThER: 1,895
ELECTRICITY AND hEAT: 6,243
MANUFACTURINg ANDCONSTRUCTION: 2,131
SOURCE: WORLD RESOURCES INSTITUTE
OThER FUEL COMBUSTION: 2,202
AgRICULTURE: 1,403
TRANSPORTATION: 3,386
energy SAveD By monITorIng-BASeD CommISSIonIng:
energy savings from continuous commissioning reduced electricity consumption by an additional 30 to 40 percent at three University of Texas sites.
0% 10% 20% 30% 40% 50%
SITE 3
SITE 2
SITE 1
AFTer reTroFIT wITH monITorIng-BASeD CommISSIonIng SOURCE: DOE, 2002
Taken together, I believe that these business lines provide many of the services CEOs and CSOs will need – peak demand management, energy procurement and energy efficiency – and this is still only the beginning for EnerNOC. My aim is not simply to build the leading demand response provider in the US, or even the world. It is to become something even more important. As the Chief Executives of the world’s businesses and institutions continue to realize that energy is a new and important strategic problem, EnerNOC will be working to ensure that we are ready to help them with important strategic solutions. Together, EnerNOC and the great corporations and institutions that are our customers can lead the world to a more efficient, less expensive and, above all, cleaner energy future.


STOCKPERFORMANCE 2007
05/18/07 06/30/07 07/31/07 08/31/07 09/30/07 10/31/07 11/30/07 12/31/07
enernoC InC nASDAQ mArKeT InDeX SIC CoDe InDeX
ASSUmeS $100 InveSTeD on mAy 18, 07ASSUmeS DIvIDenD reInveSTeD FISCAl yeAr enDIng DeC 31, 07
The stock performance graph set forth below compares the cumulativetotal stockholder return on our common stock from May 18, 2007 through December 31, 2007, with the cumulative total return of the NASDAQ Market Index and the SIC Code Index over the same period.
(1) This graph is not “soliciting material,” is not deemed filed with the Securities and Exchange Commission and is not to be incorporated by reference in any filing of the Company under the Securities Act or the Exchange Act, whether made before or after the date hereof, except to the extent that the Company specifically incorporates this graph or a portion of it by reference.
(2) The stock price performance of the Company shown on the graph is not necessarily indicative of future price performance.
(3) Information used on the graph was obtained from Morningstar, Inc., a source believed to be reliable, but the Company is not responsible for any errors or omissions in such information.
(4) Our market capitalization as of December 31, 2007 was approximately $941.8 million.
200
175
150
125
100
75
50
25
($) 0

UNITED STATESSECURITIES AND EXCHANGE COMMISSION
Washington, D.C. 20549
FORM 10-K(Mark One)
� ANNUAL REPORT PURSUANT TO SECTION 13 OR 15(d) OF THESECURITIES EXCHANGE ACT OF 1934
For the fiscal year ended December 31, 2007
or
� TRANSITION REPORT PURSUANT TO SECTION 13 OR 15(d) OF THESECURITIES EXCHANGE ACT OF 1934
For the transition period from to
Commission file number 001-33471
EnerNOC, Inc.(Exact Name of Registrant as Specified in its Charter)
Delaware 87-0698303(State or Other Jurisdiction of (IRS EmployerIncorporation or Organization) Identification No.)
75 Federal Street 02110Suite 300 (Zip Code)
Boston, Massachusetts(Address of Principal Executive Offices)
Registrant’s telephone number, including area code: (617) 224-9900
Securities registered pursuant to Section 12(b) of the Act:Title of Each Class Name of Each Exchange on Which Registered
Common Stock, $0.001 par value The Nasdaq Global MarketSecurities registered pursuant to Section 12(g) of the Act:
NoneIndicate by check mark if the Registrant is a well-known seasoned issuer, as defined in Rule 405 of the Securities
Act. Yes � No �Indicate by check mark if the Registrant is not required to file reports pursuant to Section 13 or Section 15(d) of the
Act. Yes � No �Indicate by check mark whether the Registrant (1) has filed all reports required to be filed by Section 13 or 15(d) of the
Securities Exchange Act of 1934 during the preceding 12 months (or for such shorter period that the Registrant was required tofile such reports), and (2) has been subject to such filing requirements for at least the past 90 days. Yes � No �
Indicate by check mark if disclosure of delinquent filers pursuant to Item 405 of Regulation S-K is not contained herein,and will not be contained, to the best of Registrant’s knowledge, in definitive proxy or information statements incorporated byreference in Part III of this Form 10-K or any amendment to this Form 10-K. �
Indicate by check mark whether the Registrant is a large accelerated filer, an accelerated filer, a non-accelerated filer or asmaller reporting company. See definitions of ‘‘large accelerated filer,’’ ‘‘accelerated filer’’ and ‘‘smaller reporting company’’ inRule 12b-2 of the Exchange Act. (Check one).
Large accelerated filer � Accelerated filer � Non-accelerated filer � Smaller reporting company �(Do not check if a smaller
reporting company)
Indicate by check mark whether the Registrant is a shell company (as defined in Rule 12b-2 of the ExchangeAct). Yes � No �
The aggregate market value of the Registrant’s common stock held by non-affiliates of the Registrant as of June 29, 2007,the last business day of the Registrant’s second quarter of fiscal 2007, was approximately $286.5 million based upon the last saleprice reported for such date on The Nasdaq Global Market.
The number of shares of the Registrant’s common stock (the Registrant’s only outstanding class of stock) outstanding as ofMarch 24, 2008 was 19,501,993.
DOCUMENTS INCORPORATED BY REFERENCEThe Registrant intends to file a proxy statement pursuant to Regulation 14A within 120 days of the end of the fiscal year
ended December 31, 2007. Pursuant to Paragraph G(3) of the General Instructions to Form 10-K, information required byItems 10, 11, 12, 13 and 14 of Part III have been omitted from this report (except for information required with respect to ourcorporate code of conduct and ethics, which is set forth under Item 10 of Part III of this report) and are incorporated byreference to the definitive proxy statement for the 2008 Annual Meeting of Stockholders to be held on May 9, 2008, to be filedwith the Securities and Exchange Commission.

ENERNOC, INC.ANNUAL REPORT ON FORM 10-K
FOR THE YEAR ENDED DECEMBER 31, 2007
Table of Contents
PART IItem 1. Business . . . . . . . . . . . . . . . . . . . . . . . . . . . . . . . . . . . . . . . . . . . . . . . . . . . . . . 1Item 1A. Risk Factors . . . . . . . . . . . . . . . . . . . . . . . . . . . . . . . . . . . . . . . . . . . . . . . . . . . 21Item 1B. Unresolved Staff Comments . . . . . . . . . . . . . . . . . . . . . . . . . . . . . . . . . . . . . . . . 40Item 2. Properties . . . . . . . . . . . . . . . . . . . . . . . . . . . . . . . . . . . . . . . . . . . . . . . . . . . . . 40Item 3. Legal Proceedings . . . . . . . . . . . . . . . . . . . . . . . . . . . . . . . . . . . . . . . . . . . . . . . 40Item 4. Submission of Matters to a Vote of Security Holders . . . . . . . . . . . . . . . . . . . . . . 41
Part IIItem 5. Market for Registrant’s Common Equity, Related Stockholder Matters and Issuer
Purchases of Equity Securities . . . . . . . . . . . . . . . . . . . . . . . . . . . . . . . . . . . . 42Item 6. Selected Financial Data . . . . . . . . . . . . . . . . . . . . . . . . . . . . . . . . . . . . . . . . . . . 45Item 7. Management’s Discussion and Analysis of Financial Condition and Results of
Operations . . . . . . . . . . . . . . . . . . . . . . . . . . . . . . . . . . . . . . . . . . . . . . . . . . 46Item 7A. Quantitative and Qualitative Disclosures About Market Risk . . . . . . . . . . . . . . . . 72Item 8. Financial Statements and Supplementary Data . . . . . . . . . . . . . . . . . . . . . . . . . . 73Item 9. Changes in and Disagreements with Accountants on Accounting and Financial
Disclosure . . . . . . . . . . . . . . . . . . . . . . . . . . . . . . . . . . . . . . . . . . . . . . . . . . . 73Item 9A(T). Controls and Procedures . . . . . . . . . . . . . . . . . . . . . . . . . . . . . . . . . . . . . . . . . . 73Item 9B. Other Information . . . . . . . . . . . . . . . . . . . . . . . . . . . . . . . . . . . . . . . . . . . . . . . 74
PART IIIItem 10. Directors, Executive Officers and Corporate Governance . . . . . . . . . . . . . . . . . . . 74Item 11. Executive Compensation . . . . . . . . . . . . . . . . . . . . . . . . . . . . . . . . . . . . . . . . . . 74Item 12. Security Ownership of Certain Beneficial Owners and Management and Related
Stockholder Matters . . . . . . . . . . . . . . . . . . . . . . . . . . . . . . . . . . . . . . . . . . . . 74Item 13. Certain Relationships and Related Transactions, and Director Independence . . . . . 74Item 14. Principal Accounting Fees and Services . . . . . . . . . . . . . . . . . . . . . . . . . . . . . . . . 75
PART IVItem 15. Exhibits, Financial Statement Schedules . . . . . . . . . . . . . . . . . . . . . . . . . . . . . . . 75Signatures . . . . . . . . . . . . . . . . . . . . . . . . . . . . . . . . . . . . . . . . . . . . . . . . . . . . . . . . . . . . . . . . 76Appendix A Consolidated Financial Statements . . . . . . . . . . . . . . . . . . . . . . . . . . . . . . . . . . . F-1Report of Ernst & Young LLP, Independent Registered Public Accounting Firm . . . . . . . . . . . . . F-2Exhibit Index

This Annual Report on Form 10-K includes forward-looking statements within the meaning ofSection 21E of the Securities Exchange Act of 1934, as amended, or the Exchange Act, andSection 27A of the Securities Act of 1933, as amended, or the Securities Act. For this purpose, anystatements contained herein regarding our strategy, future operations, financial position, futurerevenues, projected costs, market position, prospects, plans and objectives of management, other thanstatements of historical facts, are forward-looking statements. The words ‘‘anticipates,’’ ‘‘believes,’’‘‘estimates,’’ ‘‘expects,’’ ‘‘intends,’’ ‘‘may,’’ ‘‘plans,’’ ‘‘projects,’’ ‘‘will,’’ ‘‘would’’ and similar expressionsare intended to identify forward-looking statements, although not all forward-looking statementscontain these identifying words. We cannot guarantee that we actually will achieve the plans, intentionsor expectations expressed or implied in our forward-looking statements. Matters subject to forward-looking statements involve known and unknown risks and uncertainties, including economic, regulatory,competitive and other factors, which may cause actual results, levels of activity, performance or thetiming of events to be materially different than those exposed or implied by forward-lookingstatements. Important factors that could cause or contribute to such differences include the factors setforth under the caption ‘‘Risk Factors’’ in Item 1A of Part I of this Annual Report on Form 10-K.Although we may elect to update forward-looking statements in the future, we specifically disclaim anyobligation to do so, even if our estimates change, and readers should not rely on those forward-lookingstatements as representing our views as of any date subsequent to March 28, 2008.
Our trademarks include: EnerNOC, Get More from Energy, Energy for Education, Capacity onDemand, PowerTrak, EnerNOC Exchange, Celerity Energy, eNode, ebidenergy.com and ENTREX. Wehave trademark applications pending that correspond to the following marks: The Greenest kWh is theOne Never Used, The Greenest Kilowatt-hour is the One Never Used, The Greenest kW is the OneNever Built, The Greenest Kilowatt is the One Never Built, The Cleanest kWh is the One Never Used,One-Click Curtailment, Negawatt Network and CarbonTrak.
Other trademarks or service marks appearing in this Annual Report on Form 10-K are theproperty of their respective holders.
PART I
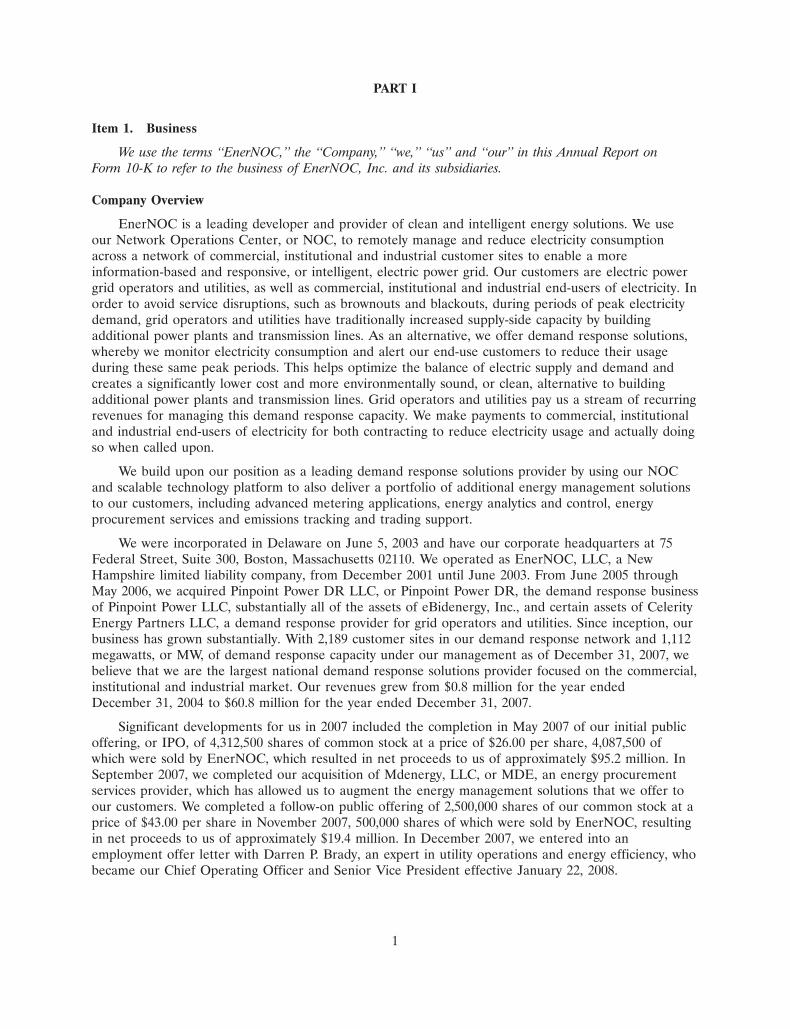
Item 1. Business
We use the terms ‘‘EnerNOC,’’ the ‘‘Company,’’ ‘‘we,’’ ‘‘us’’ and ‘‘our’’ in this Annual Report onForm 10-K to refer to the business of EnerNOC, Inc. and its subsidiaries.
Company Overview
EnerNOC is a leading developer and provider of clean and intelligent energy solutions. We useour Network Operations Center, or NOC, to remotely manage and reduce electricity consumptionacross a network of commercial, institutional and industrial customer sites to enable a moreinformation-based and responsive, or intelligent, electric power grid. Our customers are electric powergrid operators and utilities, as well as commercial, institutional and industrial end-users of electricity. Inorder to avoid service disruptions, such as brownouts and blackouts, during periods of peak electricitydemand, grid operators and utilities have traditionally increased supply-side capacity by buildingadditional power plants and transmission lines. As an alternative, we offer demand response solutions,whereby we monitor electricity consumption and alert our end-use customers to reduce their usageduring these same peak periods. This helps optimize the balance of electric supply and demand andcreates a significantly lower cost and more environmentally sound, or clean, alternative to buildingadditional power plants and transmission lines. Grid operators and utilities pay us a stream of recurringrevenues for managing this demand response capacity. We make payments to commercial, institutionaland industrial end-users of electricity for both contracting to reduce electricity usage and actually doingso when called upon.
We build upon our position as a leading demand response solutions provider by using our NOCand scalable technology platform to also deliver a portfolio of additional energy management solutionsto our customers, including advanced metering applications, energy analytics and control, energyprocurement services and emissions tracking and trading support.
We were incorporated in Delaware on June 5, 2003 and have our corporate headquarters at 75Federal Street, Suite 300, Boston, Massachusetts 02110. We operated as EnerNOC, LLC, a NewHampshire limited liability company, from December 2001 until June 2003. From June 2005 throughMay 2006, we acquired Pinpoint Power DR LLC, or Pinpoint Power DR, the demand response businessof Pinpoint Power LLC, substantially all of the assets of eBidenergy, Inc., and certain assets of CelerityEnergy Partners LLC, a demand response provider for grid operators and utilities. Since inception, ourbusiness has grown substantially. With 2,189 customer sites in our demand response network and 1,112megawatts, or MW, of demand response capacity under our management as of December 31, 2007, webelieve that we are the largest national demand response solutions provider focused on the commercial,institutional and industrial market. Our revenues grew from $0.8 million for the year endedDecember 31, 2004 to $60.8 million for the year ended December 31, 2007.
Significant developments for us in 2007 included the completion in May 2007 of our initial publicoffering, or IPO, of 4,312,500 shares of common stock at a price of $26.00 per share, 4,087,500 ofwhich were sold by EnerNOC, which resulted in net proceeds to us of approximately $95.2 million. InSeptember 2007, we completed our acquisition of Mdenergy, LLC, or MDE, an energy procurementservices provider, which has allowed us to augment the energy management solutions that we offer toour customers. We completed a follow-on public offering of 2,500,000 shares of our common stock at aprice of $43.00 per share in November 2007, 500,000 shares of which were sold by EnerNOC, resultingin net proceeds to us of approximately $19.4 million. In December 2007, we entered into anemployment offer letter with Darren P. Brady, an expert in utility operations and energy efficiency, whobecame our Chief Operating Officer and Senior Vice President effective January 22, 2008.
1

We are registered as a reporting company under the Exchange Act. Accordingly, we file or furnishwith the Securities and Exchange Commission, or the Commission or SEC, annual reports onForm 10-K, quarterly reports on Form 10-Q and current reports on Form 8-K, as required by theExchange Act and the rules and regulations of the Commission. We refer to these reports as PeriodicReports. The public may read and copy any Periodic Reports or other materials we file with theCommission at the Commission’s Public Reference Room at 100 F Street, NE, Washington, DC 20549.Information on the operation of the Public Reference Room is available by calling 1-800-SEC-0330. Inaddition, the Commission maintains an Internet website that contains reports, proxy and informationstatements and other information regarding issuers, such as EnerNOC, that file electronically with theCommission. The address of this website is http://www.sec.gov.
Our Internet website address is www.enernoc.com. We make available, free of charge, on orthrough our website our Periodic Reports and amendments to those Periodic Reports as soon asreasonably practicable after we electronically file them with the Commission. We are not, however,including the information contained on our website, or information that may be accessed through linkson our website, as part of, or incorporating it by reference into, this Annual Report on Form 10-K.
Industry Background
The Electric Power Industry
Historically, electric utility companies were formed in North America as regulated monopolies tomanage the capital intensive, mission critical service of delivering electricity to end-use customers. Eachlocal utility was vertically integrated, with responsibility for owning, managing and delivering allcomponents of the electric power industry: generation, transmission, distribution and retail sales. Eachutility was also responsible for maintaining reliability standards based on avoiding service disruptions,commonly known as blackouts. In about half of North America, the industry continues to operate inthis vertically integrated fashion.
In the rest of North America, including New England, New York, the Mid-Atlantic, the Midwest,Texas, California and Ontario, Canada, the electric power industry has been restructured to foster acompetitive environment. In these restructured markets, utilities continue to operate and maintaintransmission and distribution lines, delivering electricity to consumers as they had before, but powergenerators and electricity suppliers are now allowed to openly compete for business. Independentsystem operators, referred to as ISOs, or regional transmission organizations, referred to as RTOs, havebeen formed in these restructured markets to take control of the operation of the regional powersystem, coordinate the supply of electricity, and establish fair and efficient markets. ISOs and RTOs arecollectively referred to as grid operators. These grid operators are responsible for maintaining Federalreliability standards designed to avoid service disruptions.
Increasingly, grid operators and utilities in both restructured markets and in traditionally regulatedmarkets are challenged to reliably provide electricity during periods of peak demand. Clean andintelligent energy solutions can provide a lower cost, reliable and environmentally sound alternative tobuilding additional supply infrastructure in both traditionally regulated and restructured markets.
Challenges Facing the Electric Power Industry
The electric power industry in North America faces enormous challenges to keep pace with theincreasing demand for electricity. Because electricity cannot be economically stored using commerciallyavailable technology, it must be generated, delivered and consumed at the moment that it is needed byend-use customers. Maintaining a reliable electric power system therefore requires real-time balancingbetween supply and demand. Power generation, transmission and distribution facilities are built tocapacity levels that can service the maximum amount of anticipated demand plus a reserve marginintended to serve as a buffer to protect the system in critical periods of peak demand or unexpected
2

events such as failure of a power plant or major transmission line. However, under-investment ingeneration, transmission and distribution infrastructure in recent years in key regions, coupled with adramatic growth in electricity consumption, has led to an increased frequency of voltage reductions—commonly known as brownouts—and blackouts, which are collectively estimated to cost the UnitedStates $80 billion per year, primarily in lost productivity, according to a United States Department ofEnergy 2005 study. These challenges are exacerbated by environmental concerns and stringentregulatory environments that make it increasingly difficult to find suitable sites, obtain permits, andconstruct generation, transmission and distribution facilities where they are needed most, often indensely populated areas.
According to the North American Electric Reliability Council, demand for electricity is expected toincrease over the next 10 years by approximately 18% in the United States, but generation capacity isexpected to increase by only approximately 8% in the United States during that same period. As aresult, the margin between electric supply and demand is projected to drop below minimum targetlevels in Texas, New England, the Mid-Atlantic, the Midwest and the Rocky Mountain region in thenext two to three years, with other portions of the Northeastern United States, Southwest, and WesternUnited States falling below minimum target levels in the next 10 years. According to the InternationalEnergy Agency, North America is expected to add 932,000 MW of additional capacity at a cost of $1.98trillion between 2005 and 2030 to reliably meet expected annual growth in demand. This presentsenormous economic, environmental and logistical challenges.
In addition to the challenges arising from the need to build additional generation capacity in NorthAmerica, under-investment in the transmission and distribution infrastructure required to deliver powerfrom centralized power plants to end-use customers has resulted in an overburdened electric powergrid. This periodically prevents the transport of power to constrained areas during periods of peakdemand, which can affect reliability and cause significant economic impacts. Whereas demand forelectricity is expected to increase over the next 10 years by approximately 18% in the United States,total transmission miles in the United States are projected to increase by less than 9% during the sameperiod.
As the electric power industry confronts these challenges, demand response has emerged as animportant solution to help address the imbalance in electric supply and demand. For example, theEnergy Policy Act of 2005 declared it the official policy of the United States to encourage demandresponse and the adoption of devices that enable it.
Our Market Opportunity
According to the International Energy Agency, electric power infrastructure expenditures in NorthAmerica are expected to exceed $1.98 trillion between 2005 and 2030. We estimate that over 10% ofthe electric power infrastructure in North America has been constructed in order to meet peaks inelectricity demand that occur less than 1% of the time, or approximately 88 hours per year. Based onthese estimates, we believe that the market in North America for reducing demand during these criticalpeak hours, in place of building supply infrastructure, is $7.92 billion per year, if the need to build-outinfrastructure occurs on an equal annual basis. Using the same assumptions, we estimate that themarket for eliminating the top 1% of peak demand for electricity worldwide during this same periodcould be over $45.1 billion per year.
We are a pioneer in the development, implementation and broader adoption of technology-enableddemand response solutions. Our technology enables us to send control signals to, and receivebi-directional communications from, an Internet-enabled network of broadly dispersed end-usecustomer sites in order to initiate, monitor and terminate demand response activity. Our robust andscalable technology and proprietary operational processes automate demand response and simplifyend-use customer participation. These solutions are designed for the commercial, institutional and
3
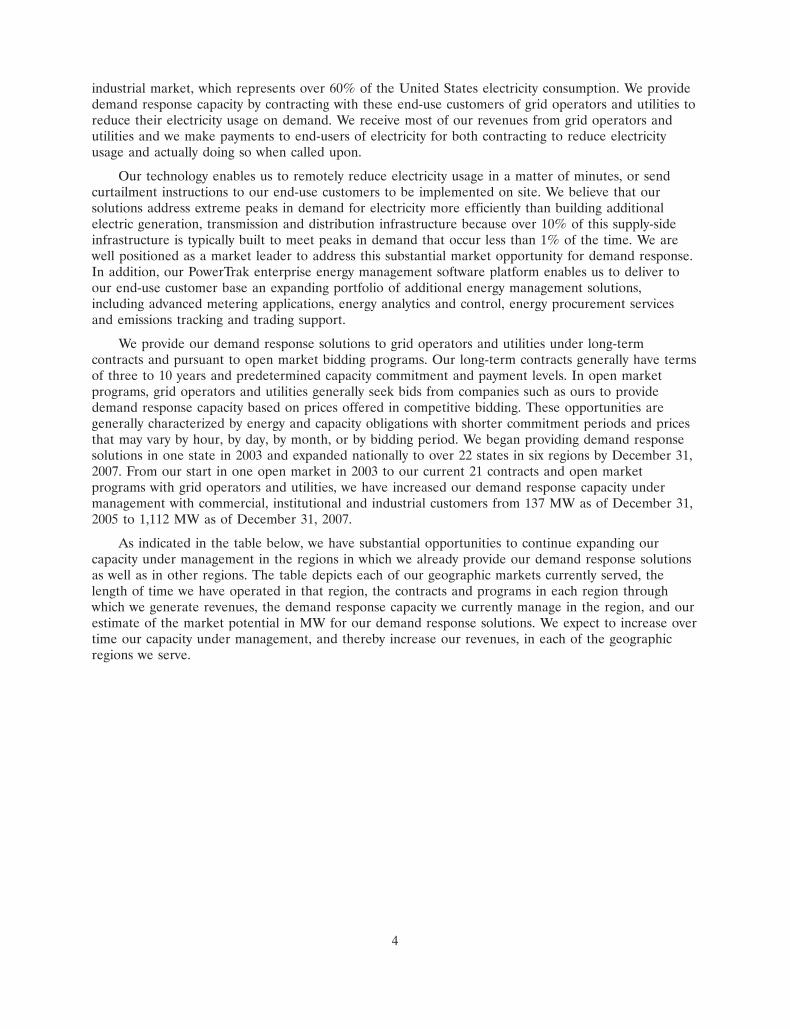
industrial market, which represents over 60% of the United States electricity consumption. We providedemand response capacity by contracting with these end-use customers of grid operators and utilities toreduce their electricity usage on demand. We receive most of our revenues from grid operators andutilities and we make payments to end-users of electricity for both contracting to reduce electricityusage and actually doing so when called upon.
Our technology enables us to remotely reduce electricity usage in a matter of minutes, or sendcurtailment instructions to our end-use customers to be implemented on site. We believe that oursolutions address extreme peaks in demand for electricity more efficiently than building additionalelectric generation, transmission and distribution infrastructure because over 10% of this supply-sideinfrastructure is typically built to meet peaks in demand that occur less than 1% of the time. We arewell positioned as a market leader to address this substantial market opportunity for demand response.In addition, our PowerTrak enterprise energy management software platform enables us to deliver toour end-use customer base an expanding portfolio of additional energy management solutions,including advanced metering applications, energy analytics and control, energy procurement servicesand emissions tracking and trading support.
We provide our demand response solutions to grid operators and utilities under long-termcontracts and pursuant to open market bidding programs. Our long-term contracts generally have termsof three to 10 years and predetermined capacity commitment and payment levels. In open marketprograms, grid operators and utilities generally seek bids from companies such as ours to providedemand response capacity based on prices offered in competitive bidding. These opportunities aregenerally characterized by energy and capacity obligations with shorter commitment periods and pricesthat may vary by hour, by day, by month, or by bidding period. We began providing demand responsesolutions in one state in 2003 and expanded nationally to over 22 states in six regions by December 31,2007. From our start in one open market in 2003 to our current 21 contracts and open marketprograms with grid operators and utilities, we have increased our demand response capacity undermanagement with commercial, institutional and industrial customers from 137 MW as of December 31,2005 to 1,112 MW as of December 31, 2007.
As indicated in the table below, we have substantial opportunities to continue expanding ourcapacity under management in the regions in which we already provide our demand response solutionsas well as in other regions. The table depicts each of our geographic markets currently served, thelength of time we have operated in that region, the contracts and programs in each region throughwhich we generate revenues, the demand response capacity we currently manage in the region, and ourestimate of the market potential in MW for our demand response solutions. We expect to increase overtime our capacity under management, and thereby increase our revenues, in each of the geographicregions we serve.
4
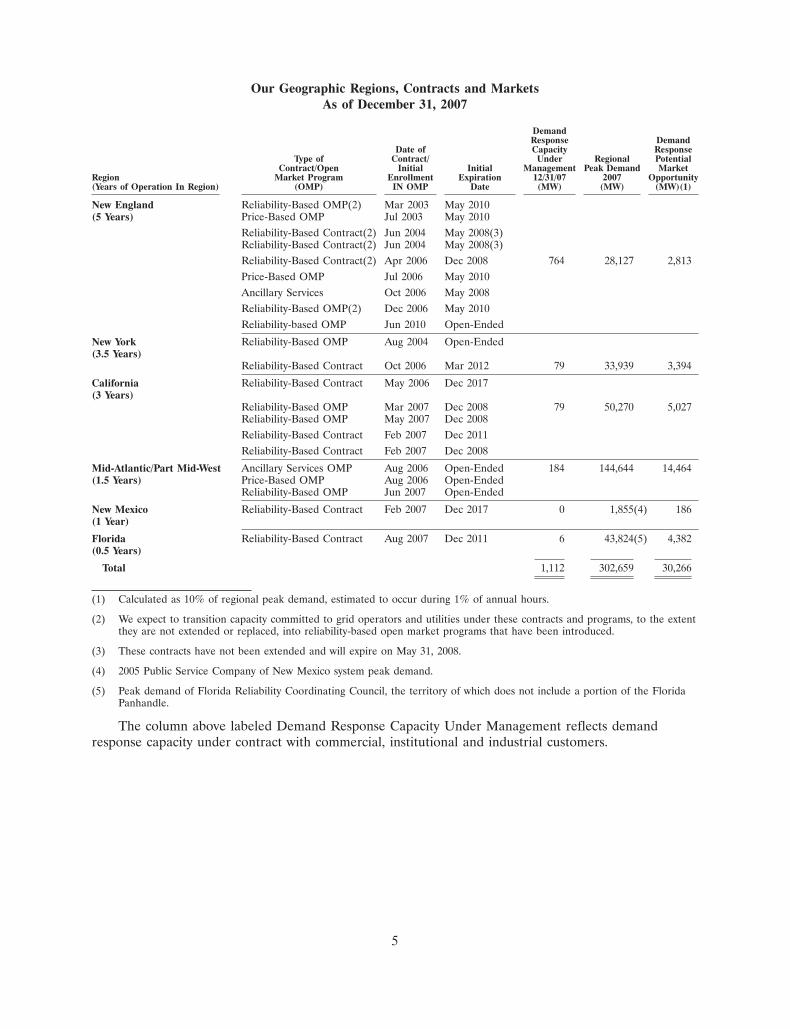
Our Geographic Regions, Contracts and MarketsAs of December 31, 2007
DemandResponse Demand
Date of Capacity ResponseType of Contract/ Under Regional Potential
Contract/Open Initial Initial Management Peak Demand MarketRegion Market Program Enrollment Expiration 12/31/07 2007 Opportunity(Years of Operation In Region) (OMP) IN OMP Date (MW) (MW) (MW)(1)
New England Reliability-Based OMP(2) Mar 2003 May 2010(5 Years) Price-Based OMP Jul 2003 May 2010
Reliability-Based Contract(2) Jun 2004 May 2008(3)Reliability-Based Contract(2) Jun 2004 May 2008(3)Reliability-Based Contract(2) Apr 2006 Dec 2008 764 28,127 2,813Price-Based OMP Jul 2006 May 2010Ancillary Services Oct 2006 May 2008Reliability-Based OMP(2) Dec 2006 May 2010Reliability-based OMP Jun 2010 Open-Ended
New York Reliability-Based OMP Aug 2004 Open-Ended(3.5 Years)
Reliability-Based Contract Oct 2006 Mar 2012 79 33,939 3,394
California Reliability-Based Contract May 2006 Dec 2017(3 Years)
Reliability-Based OMP Mar 2007 Dec 2008 79 50,270 5,027Reliability-Based OMP May 2007 Dec 2008Reliability-Based Contract Feb 2007 Dec 2011Reliability-Based Contract Feb 2007 Dec 2008
Mid-Atlantic/Part Mid-West Ancillary Services OMP Aug 2006 Open-Ended 184 144,644 14,464(1.5 Years) Price-Based OMP Aug 2006 Open-Ended
Reliability-Based OMP Jun 2007 Open-Ended
New Mexico Reliability-Based Contract Feb 2007 Dec 2017 0 1,855(4) 186(1 Year)
Florida Reliability-Based Contract Aug 2007 Dec 2011 6 43,824(5) 4,382(0.5 Years)
Total 1,112 302,659 30,266
(1) Calculated as 10% of regional peak demand, estimated to occur during 1% of annual hours.
(2) We expect to transition capacity committed to grid operators and utilities under these contracts and programs, to the extentthey are not extended or replaced, into reliability-based open market programs that have been introduced.
(3) These contracts have not been extended and will expire on May 31, 2008.
(4) 2005 Public Service Company of New Mexico system peak demand.
(5) Peak demand of Florida Reliability Coordinating Council, the territory of which does not include a portion of the FloridaPanhandle.
The column above labeled Demand Response Capacity Under Management reflects demandresponse capacity under contract with commercial, institutional and industrial customers.
5

The column above labeled Type of Contract/Open Market Program (OMP) describes, on a regionby region basis, how we provide our demand response solutions to electric power grid operators andutilities under long-term contracts and in open market programs. Our long-term contracts generallyhave terms of three to 10 years and predetermined capacity commitment and payment levels. Our openmarket program opportunities are generally characterized by flexible capacity commitments and pricesthat vary by hour, by day, by month or by bidding period. Within these contracts and open marketprograms we offer the following solutions to serve the needs of grid operators and utilities:
• reliability-based demand response, which requires a level of demand response capacity to beavailable for dispatch on call by grid operators and utilities;
• price-based demand response, which enables commercial, institutional and industrial customersto monitor and respond to electricity market price signals by reducing electricity usage; and
• ancillary services, which include resources utilized as a reserve pool of quick-start resources toprovide short-term support for grid operators and utilities, including operating reserves, calledupon by grid operators and utilities during short-term events such as the loss of a transmissionline or a power plant.
The EnerNOC Solution
We have developed a proprietary suite of technology applications and operational processes thatenable us to make demand response capacity and energy available to grid operators and utilities ondemand and remotely manage electricity consumption at commercial, institutional and industrialcustomer sites. Our solution provides the following benefits:
Compelling Value Proposition to Grid Operators and Utilities. On the supply side, grid operators andutilities deploy our technology-enabled demand response solutions to supplement, avoid or defer costlyinvestments in generation, transmission and distribution facilities and to enhance the reliability of theelectric power system. Our demand response solutions help grid operators and utilities achieve theircapacity and capacity reserve margin goals quickly and economically and allow them to diversify theirportfolio of resources, without requiring the installation of any hardware or software at their facilities.Whereas it typically takes years to site, permit and construct a power plant and the associatedtransmission and distribution infrastructure, demand response capacity can be enabled within months,in densely populated, constrained areas, exactly where the new capacity is needed most and with noneed for new transmission or distribution infrastructure. We either enter into long-term contracts to sellour demand response capacity to grid operators and utilities, or participate in the open marketopportunities for demand response that they establish. Together with these demand response solutions,our energy management solutions enhance the reliability of regional electric power grids by providinggrid operators and utilities the ability to measure, manage, shift and reduce energy consumption inspecific distribution areas within minutes.
Compelling Value Proposition To End-Use Customers. On the demand side, our turnkey, outsourceddemand response and energy management solutions create new streams of recurring cash flows, reduceenergy costs and simplify energy management for participating commercial, institutional and industrialcustomers. Our offerings typically involve no up-front capital investment on the part of the participatingcustomer. We share payments, called capacity payments, that we receive from grid operators andutilities with our end-use customers for giving us the ability to reduce their electrical consumptionwhether or not we are actually called upon to do so. We also generally make additional payments,called energy payments, when they actually reduce their consumption from the electric power grid.
Energy Management Solutions for End-Use Customers. Our demand response solutions position usto deliver additional energy management solutions to our commercial, institutional and industrialcustomers. These end-use customers are increasingly focused on efficiently managing their energy
6
consumption and reducing costs. The real-time energy consumption data that we gather in ourPowerTrak enterprise energy management software platform empowers us to develop customizedenergy management solutions that can be used across departments and functions throughout acustomer’s operations on an enterprise-wide basis, to reduce our end-use customers’ energy costs. Thedevices that we have installed in connection with our demand response solutions enable us toimplement many of these solutions. By delivering a recurring cash stream for our end-use customers,we are often viewed by them as a trusted partner who can help address their increasingly complexenergy challenges.
Open, Scalable and Secure Architecture. Our NOC is supported by our PowerTrak enterprise energymanagement software platform, which is built on an open and scalable Web services architecture.PowerTrak is able to interface with energy management and building automation systems atcommercial, institutional and industrial customer sites, thereby enabling us to cost-effectively leverageexisting technology for remote monitoring and control from our NOC. PowerTrak’s analytical toolsenable a single NOC operator to supervise hundreds of end-use metering and control points andsimultaneously optimize demand response performance and energy savings measures across numerouscustomer sites and geographic regions. We have built a comprehensive security infrastructure, includingfirewalls, intrusion detection systems and data encryption, and have established fail-over redundancy forour information technology systems.
Reduced Environmental Impact. By reducing electricity consumption during periods of peakdemand and other system emergencies, our demand response solutions can displace older,inefficiently-used power plants, and defer new generation, transmission and distribution development,resulting in reduced emissions and land use benefits. These environmental benefits are particularlyclear when demand response capacity qualifies under regional regulations as operating reserves. Inthese areas, grid operators and utilities call on demand response when contingencies such as powerplant or transmission outages occur, which can offset the need to keep centralized peaking powerplants running on idle for thousands of hours per year. Dispatchable demand response capacitytherefore allows grid operators and utilities to meet reserve requirements with significantly lessenvironmental impact than conventional supply-side alternatives. In addition, we believe that growingparticipation in demand response by commercial, institutional and industrial organizations will lead toan increased focus on energy management efforts, including energy efficiency and conservation, throughwhich end-use customers can significantly reduce air emissions.
Competitive Strengths
Our competitive strengths position us for continued leadership and rapid expansion in the cleanand intelligent energy solutions sector.
First-Mover Advantage with National Presence. We are a pioneer in the development,implementation and broader adoption of technology-enabled demand response solutions to commercial,institutional and industrial customers on a national scale. With 2,189 customer sites in our demandresponse network across multiple electric power grids as of December 31, 2007, we believe that we arethe largest national demand response service provider for commercial, institutional and industrialcustomers. We reliably delivered our demand response capacity over 50 times in 2006 and over 100times in 2007, when called upon by grid operators and utilities. We have responded to simultaneousevents in multiple geographic regions and on August 15, 2007, we dispatched resources within ourdemand response network in response to nine contemporaneous events in three different regions of theUnited States. As a result, we have developed a substantial base of operating experience in deliveringdemand response solutions.
Highly Scalable Business Model Focused on Commercial, Institutional and Industrial Customers. Thelarge size of our target customers, along with our enterprise energy management software platform,
7
enables us to rapidly scale our business in existing and new geographies. Once a demand responsemarket is established in a region, the marginal cost of acquiring and servicing commercial, institutionaland industrial customers is relatively low compared to traditional supply-side capacity resources. Inaddition, the large size of our target end-use customers significantly lowers our acquisition cost per unitof capacity compared to the acquisition cost of residential customers. Commercial, institutional andindustrial customers also often have one decision maker who controls multiple sites, therebyaccelerating our acquisition of new capacity under management, lowering our cost to expand ournetwork of managed sites and providing more opportunities to sell our additional energy managementsolutions.
Recurring Revenues. We engage in long-term contracts and participate in open market programswith grid operators and utilities through which we are paid recurring payments, typically on a monthlybasis, for the capacity that we make available, whether or not we are called upon to reduce our end-usecustomers’ electricity consumption from the electric power grid. These long-term contracts generallyrange between three and 10 years in duration. These recurring payments significantly increase thevisibility and predictability of our future revenues. In addition, we enter into long-term agreements withcommercial, institutional and industrial customers that provide us with demand response capacity.
Comprehensive Technology Platform. Our scalable, proprietary technology platform, in addition toour operational experience, creates significant barriers to entry. We communicate via the Internet usingadvanced metering applications and automation equipment that we install at end-use customer sites tomake demand response participation viable for a wide range of commercial, institutional and industrialorganizations. The open design architecture of our proprietary technology platform enables us tointerface with existing and new energy management and building automation systems which use avariety of protocol languages. Once an end-use customer is enabled in our network, we collect real-timeenergy consumption data. This data enables our software to perform demand response measurementand verification, and also provides the underlying information to conduct further energy managementanalysis and provide decision-making support. In addition, rather than being limited to curtailingelectricity used by a specific type of equipment, such as air-conditioning units, our platform enables usto manage a wide array of equipment and systems to implement appropriate demand responsesolutions on an end-user by end-user basis.
Growing Customer Base. We have rapidly and significantly grown our base of grid operator andutility customers since inception. As of December 31, 2007, our grid operator and utility customer baseincluded ISO New England, New York ISO, PJM Interconnection, The Connecticut Light and PowerCompany, Pacific Gas and Electric Company, Southern California Edison Company, San Diego Gasand Electric Company, Public Service Company of New Mexico and Tampa Electric Company, amongothers. As of December 31, 2007, we had 793 end-use commercial, institutional, and industrialcustomers for our demand response solutions, including Adobe Systems, Albertsons, AT&T, CaliforniaState University, General Electric, Level 3 Communications, Pfizer, and Stop & Shop, among others. Inaddition, because we have a national presence, we are able to offer a single platform for nationalchains to participate in our solutions across different geographic regions with different market rules andconditions.
Strategy
Our strategy is to capitalize on our scalable and proprietary technology platform as well as ourleading market position to continue providing clean and intelligent energy solutions to commercial,institutional and industrial customers, grid operators, and utilities. Ultimately, our aim is to become the
8
leading outsourced energy management solutions provider for commercial, institutional and industrialcustomers worldwide. Key elements of our strategy include:
Target Aggressive Expansion in Existing Territories. We will continue to pursue opportunities toprovide demand response capacity to grid operators and utilities in markets where we currently operatethrough additional long-term contracts and open market opportunities for demand response capacity.To provide this demand response capacity, we will enter into contracts with commercial, institutionaland industrial customers. We will also seek to provide additional energy management solutions to theseend-use customers. Our sales force will primarily focus their efforts on the six following verticalmarkets: technology, education, food sales and storage, government, healthcare and manufacturing/industrial. We believe that our full-service demand response and energy management solutions, therecurring payments that we provide and our national presence will enable us to continue to pursuerapid growth of our end-use customer base.
Strengthen North American Presence by Entering New Geographic Regions. We will also continue toexpand our addressable market by pursuing new demand response and energy managementopportunities in new geographic regions. We intend to accomplish this and capitalize on the trendtoward a more responsive and distributed electricity grid by (i) educating and marketing to existing andprospective customers, consumer advocates, consultants, industry experts, and policy makers;(ii) designing and developing demand response programs and goals in cooperation with grid operators,utilities, regulators, and governmental agencies; and (iii) continually enhancing our demand responseand energy management solutions.
Expand Sales of our Growing Portfolio of Technology-Enabled Energy Management Solutions. Webelieve that our demand response solutions have uniquely positioned us to deliver additional energymanagement solutions to our growing network of commercial, institutional and industrial customers.We will continue to develop our technology, including our PowerTrak enterprise energy managementsoftware platform. This platform enables us to measure, manage, benchmark and optimize end-usecustomers’ energy consumption and facility operations. We will continue to use real-time and historicalenergy data to help end-use customers analyze and control their consumption of electricity, forecastdemand, measure real-time performance during demand response events, continuously monitor buildingmanagement equipment to optimize system operation, model rates and tariffs and create energyscorecards to benchmark similar facilities. In addition, we will offer energy procurement-related servicesand emissions tracking solutions to our customers. We believe that end-use customers will becomeincreasingly aware of their energy costs and consumption and will look to advanced analytics andtrusted third-party providers to help them better manage their overall energy expenditures.
Pursue Targeted Strategic Acquisitions. We intend to pursue selective acquisitions to reinforce ourleadership position in the expanding clean and intelligent energy solutions sector. This sector consists ofa number of companies with offerings or customer relationships that present attractive acquisitionopportunities. Our track record includes successfully integrating acquired companies to increase ourcustomer base, enter new geographic regions and enhance our technology. In September 2007, weacquired MDE, an energy procurement services provider to expand our portfolio of energymanagement solutions.
Our Clean and Intelligent Energy Solutions
Demand Response Solutions
Demand response is achieved when end-use customers reduce their consumption of electricity fromthe electric power grid in response to a market signal. End-use customers can reduce their consumptionof electricity by reducing demand (for example, by dimming lights, resetting air conditioning set-pointsor shutting down production lines) or they can self-generate electricity with onsite generation (for
9

example, by means of a back-up generator or onsite cogeneration). Our demand response capacityprovides a more timely, cost-effective and environmentally sound alternative to building conventionalsupply-side resources, such as natural gas-fired peaking power plants, to meet infrequent periods ofpeak demand.
Although electric power utilities have offered less technology-enabled forms of demand responseto their largest electricity consumers for decades in the form of interruptible tariffs—a mechanism thatallows utilities to call on customers to reduce consumption during periods of peak demand in exchangefor lower rates—these programs typically lack an affordable means of real-time data communicationand adequate automation technologies to make demand response participation viable for mostcommercial, institutional and industrial organizations. We believe that the widespread adoption of theInternet, as well as cost-effective and robust metering and control technologies, have created a newopportunity for technology-enabled demand response solutions to drive significant benefits for allstakeholders.
We have pursued this opportunity by building our own proprietary technologies and operationalprocesses that make demand response participation possible for a wider range of electricity consumers.The devices that we install at our commercial, institutional and industrial customer sites transmit to usvia the Internet electrical consumption data on a 1-minute, 5-minute, 15-minute and hourly basis, whichis referred to in the electric power industry as near real-time data. Our proprietary softwareapplications analyze the data from individual sites and aggregate data for specific regions. When ademand response event occurs, our NOC automatically processes the notification coming from the gridoperator or utility. Our NOC operators then begin activating procedures to curtail demand from thegrid at our commercial, institutional and industrial customer sites. Our one-click curtailment activationsends signals to all registered sites in the targeted geography where the event is occurring. Uponactivation of remote demand reduction, our technology, which is receiving near real-time data fromeach site, is able to determine on a near real-time basis whether the location is performing as expected.Signals are relayed to our NOC operators when further steps are needed to achieve demand reductionsat any given location. Each customer site is monitored for the duration of the demand response eventand operations are automatically restored to normal when the event ends.
We offer the following three distinct demand response solutions to serve the needs of gridoperators and utilities: (i) reliability-based demand response, (ii) price-based demand response, and(iii) short-term reserve resources referred to in the electric power industry as ancillary services.
Reliability-Based Demand Response. We receive recurring capacity payments from grid operatorsand utilities for being on call, which means having available previously registered demand responsecapacity that we have aggregated from our commercial, institutional and industrial customers,regardless of whether we receive a signal to reduce consumption. When we receive a signal from a gridoperator or utility customer, which we refer to as a dispatch signal, our proprietary softwareapplications automatically notify our end-use customers that a demand reduction is needed and initiateprocesses that reduce electrical consumption by our commercial, institutional and industrial customersin the targeted area. When we are called to implement a demand reduction, we typically receive anadditional payment for the energy that we reduce. Our commercial, institutional and industrialcustomers will then receive a payment from us. We are called upon to perform by grid operators andutilities during periods of high demand or supply shortfalls, otherwise known as capacity deficiencyevents. By aggregating a large number of end-use customers to participate in these reliability-basedprograms, we believe that we have played a significant role over the past three years in helping toprevent brownouts and blackouts in some of the most capacity constrained regions in the United States.We currently provide reliability-based demand response solutions to the New York Independent SystemOperator, The Connecticut Light and Power Company, San Diego Gas and Electric Company,Southern California Edison Company and Pacific Gas and Electric Company, among others.
10

20MAR200809484484
Price-Based Demand Response. Our price-based demand response solutions enable commercial,institutional and industrial customers to monitor and respond to wholesale electricity market pricesignals when it is cost-effective for them to do so. We register a ‘‘strike price’’ with respect to eachcustomer using this solution, above which it may be economical for that end-use customer to reduce itsconsumption of electricity. We receive an energy payment in the amount of the wholesale market pricefor the electricity that the customer does not consume and share this payment with that customer. Ifprices in a given market approach a given strike price, our solutions automatically notify the customerand initiate processes that reduce electrical consumption from the electric power grid. We currentlyparticipate in price response programs in the Mid-Atlantic, New England and California.
Ancillary Services. Demand response is utilized for short-term reserve requirements, referred to inthe electric power industry as ancillary services, including operating reserves. This solution is calledupon by grid operators and utilities during short-term contingency events such as the loss of atransmission line or large power plant. Through our technology, certain end-use customers are able toprovide near instantaneous response for these numerous short-term system events, and often do so withnegligible impact on their business operations. Grid operators and utilities rely on a reserve pool ofthese quick-start resources to step in and provide short-term support as needed during thesecontingency events. The goal of grid operators and utilities is to get these resources back into standbymode as quickly as possible after they are dispatched so that the reserve pool of available capacity isreplenished. Examples of ancillary services markets in which we currently participate include PJMInterconnection’s Synchronized Reserves Market, in which we were the first provider of demandresponse capacity, and ISO New England’s Demand Response Reserves Pilot program.
Our Additional Energy Management Solutions
We have an expanding portfolio of additional energy management solutions. We believe that ourdemand response solutions have positioned us to deliver additional energy management solutions toour growing network of commercial, institutional and industrial customers. By collecting and reportingreal-time energy consumption data and by delivering a stream of recurring payments to our end-usecustomers through demand response solutions, we hope to be viewed as a trusted partner who can helpaddress their increasingly complex energy challenges. Our energy management solutions are aimed athelping address these challenges and at expanding our customer relationships. The diagram belowprovides an overview of these solutions.
EnerNOC supports customers’ efforts to reduce andtrade their emissions of carbon dioxide and othergreenhouse gasses.
EnerNOC’s energy management services distill datainto actionable strategies that reduce energy costs atcustomers’ facilities.
EnerNOC offers a turnkey solution that simplifies participation in demand response and enables customers to measure and manage energy consumption with advanced metering.
Demand Response and Advanced Metering
Energy Analytics and Control
Energy Procurement Services
Emissions Tracking and Trading Support
EnerNOC achieves further customer savings byhelping customers secure competitive commoditysupply contracts from electricity suppliers.
In September 2007, we acquired MDE, an energy procurement services provider to augment ourexpanding portfolio of additional energy management solutions. The MDE acquisition included the
11
addition of over 400 new commercial, institutional and industrial customers to whom we were providingenergy procurement services as of December 31, 2007. We intend to pursue opportunities to providedemand response solutions to a substantial number of these new customers.
We currently offer the following technology-enabled energy management solutions to ourcommercial, institutional and industrial customers:
• Advanced Metering Applications. We offer meter data gathering and storage services for advancedmeters that either we have installed as part of our demand response solutions or other entitieshave installed for various energy management and reporting purposes. In special cases, weprovide our advanced metering applications to other, smaller demand response service providers.
• Energy Analytics and Control. We offer a technology based energy analytics service designed tohelp optimize the way buildings operate, measure the impact of key energy and environmentaldecisions, and enhance the comfort of occupants. Our PowerTrak application integrates datafrom disparate energy management systems with utility metering to gather data on a customer’soverall energy usage. Our analysts then use analysis tools, filters, and applications to monitorand review this data, and provide distilled information and recommendations designed tooptimize performance; reduce energy consumption; reduce carbon emissions; prioritizemaintenance needs; and enhance occupant comfort.
• Energy Procurement Services. We offer to our end-use commercial, institutional and industrialcustomers various services related to procuring commodity supply contracts from competitiveelectricity suppliers. We use our market knowledge and industry relationships, along with actualcustomer electricity usage data that we track and manage through PowerTrak, to achieve savingsfor customers. We bring customers strategic advice to help them capture favorable energyprocurement contracts from competitive electricity suppliers. We take no position in thecommodities market and assume no associated risk.
Technology and Operations
Technology
Since inception, we have focused on delivering industry-leading, technology-enabled demandresponse and energy management solutions. Our proprietary technology has been developed to behighly reliable and scalable and to provide a platform on which to design, customize, and implementdemand response and energy management solutions. Our proprietary technology infrastructure is builton Linux, Java and Oracle and supports an open web services architecture. Our PowerTrak enterpriseenergy management software platform enables us to efficiently scale our demand response offerings innew geographic regions and rapidly grow the end-use customers in our network.
Web services connect applications directly with other applications. They do this through a form of‘‘loose coupling’’ which allows connections to be established across applications without customization.As a result, these connections can be established without regard to technology platform orprogramming language, making it easy to share technology across a broad range of users andcompanies. Web services enable business collaboration at the process level. Process-level collaborationrequires software that is architected for communication across firewalls. We believe that businessprocess collaboration over the Internet has wide-reaching implications for the ways in which energytransactions will be performed.
12
20MAR200809484694
Our technology can be broken down into three primary components: the Network OperationsCenter, the EnerNOC Site Server, or ESS, and PowerTrak, our enterprise energy managementsoftware.
Network Operations Center
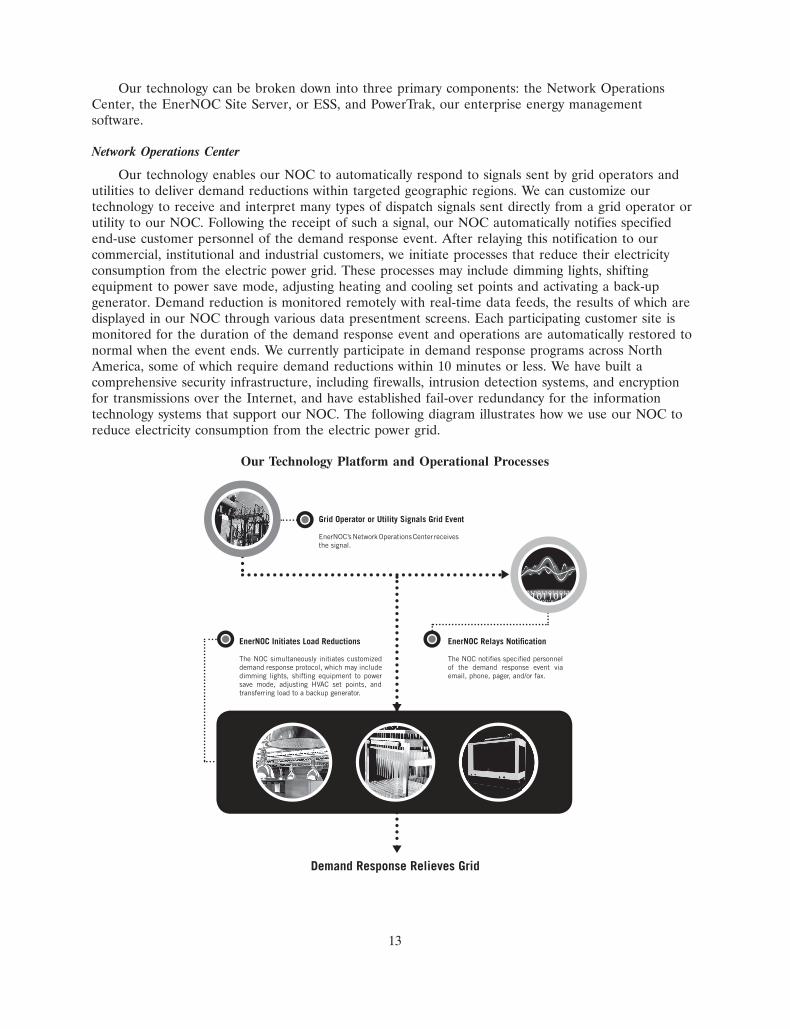
Our technology enables our NOC to automatically respond to signals sent by grid operators andutilities to deliver demand reductions within targeted geographic regions. We can customize ourtechnology to receive and interpret many types of dispatch signals sent directly from a grid operator orutility to our NOC. Following the receipt of such a signal, our NOC automatically notifies specifiedend-use customer personnel of the demand response event. After relaying this notification to ourcommercial, institutional and industrial customers, we initiate processes that reduce their electricityconsumption from the electric power grid. These processes may include dimming lights, shiftingequipment to power save mode, adjusting heating and cooling set points and activating a back-upgenerator. Demand reduction is monitored remotely with real-time data feeds, the results of which aredisplayed in our NOC through various data presentment screens. Each participating customer site ismonitored for the duration of the demand response event and operations are automatically restored tonormal when the event ends. We currently participate in demand response programs across NorthAmerica, some of which require demand reductions within 10 minutes or less. We have built acomprehensive security infrastructure, including firewalls, intrusion detection systems, and encryptionfor transmissions over the Internet, and have established fail-over redundancy for the informationtechnology systems that support our NOC. The following diagram illustrates how we use our NOC toreduce electricity consumption from the electric power grid.
Our Technology Platform and Operational Processes
Demand Response Relieves Grid
Grid Operator or Utility Signals Grid Event
EnerNOC’s Network Operations Center receives the signal.
EnerNOC Relays Notification
The NOC notifies specified personnel of the demand response event via email, phone, pager, and/or fax.
EnerNOC Initiates Load Reductions
The NOC simultaneously initiates customized demand response protocol, which may include dimming lights, shifting equipment to power save mode, adjusting HVAC set points, and transferring load to a backup generator.
13
20MAR200809485129
The EnerNOC Site Server
We work directly with end-use customers to ensure that they are able to respond quickly andcompletely to demand reduction instructions. We install a hardware device, called an EnerNOC SiteServer, or ESS, at each end-use customer site to collect and communicate real-time electricityconsumption data and, in many cases, enable remote control. The ESS communicates to our NOCthrough the customer’s LAN or other internet connection. The ESS is an open, integrated systemconsisting of a central hardware device residing inside a standard electrical box.
The ESS serves as a gateway to connect our NOC with a variety of data collection systems andequipment at end-use customer sites. The ESS is typically installed in the electrical room at an end-usecustomer’s site and is equipped to read and record voltage, current, power and other power qualityelectrical data of certain customer-owned electrical equipment, along with other important energy usageparameters, including natural gas, chilled water, steam and compressed air. It includes a web-basedservice software application which enables the secure, bi-directional transfer of data across firewalls andover the Internet. The ESS is used to locally connect into many types of building managementequipment and systems that support a range of communications protocols and interfaces such asLonWorks, BACnet/IP, Modbus RTU, Modbus TCP/IP, and SNMP. The ESS also provides protocoltranslation so that data from legacy building management systems can be connected directly to ourNOC. This advanced connectivity allows us to use a customer’s existing infrastructure investment,lowering our overall cost of enablement and making data available to corporate networks and theInternet through industry standard communication protocols.
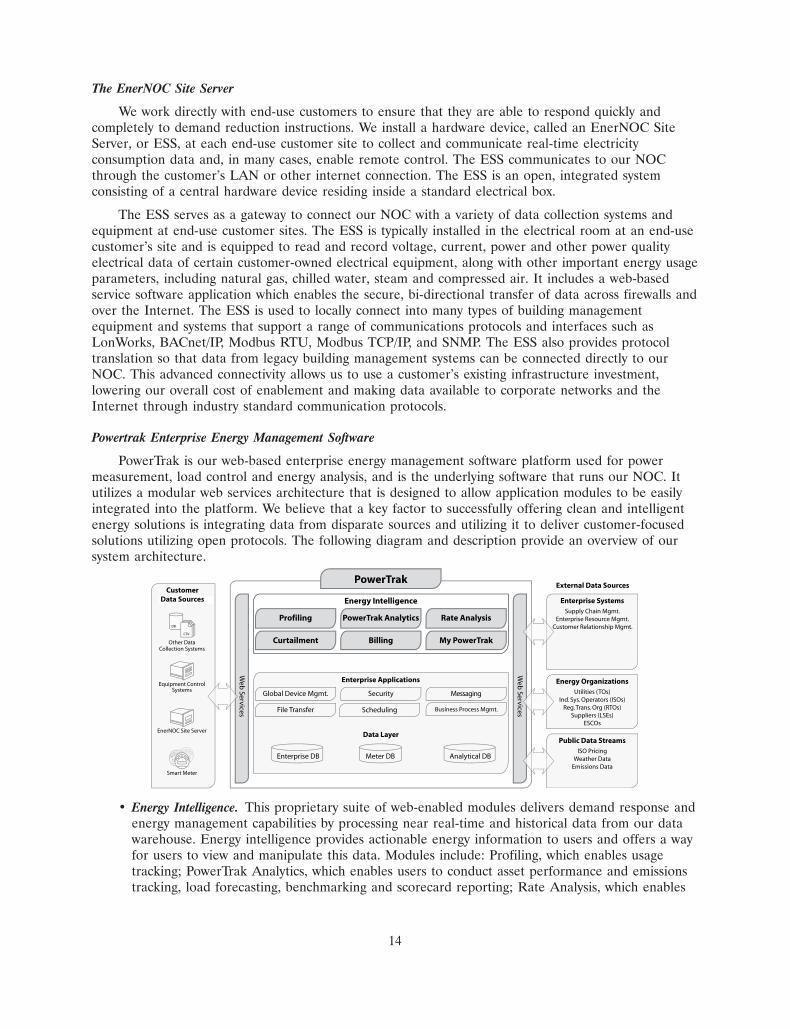
Powertrak Enterprise Energy Management Software
PowerTrak is our web-based enterprise energy management software platform used for powermeasurement, load control and energy analysis, and is the underlying software that runs our NOC. Itutilizes a modular web services architecture that is designed to allow application modules to be easilyintegrated into the platform. We believe that a key factor to successfully offering clean and intelligentenergy solutions is integrating data from disparate sources and utilizing it to deliver customer-focusedsolutions utilizing open protocols. The following diagram and description provide an overview of oursystem architecture.
Profiling
Web
Ser vices
Web
Ser vices
PowerTrak Analytics Rate Analysis
Curtailment Billing My PowerTrak
Enterprise Applications
Global Device Mgmt. Security Messaging
File Transfer Scheduling
Enterprise Systems
Energy Organizations
Public Data Streams
PowerTrak
Supply Chain Mgmt.Enterprise Resource Mgmt.
Customer Relationship Mgmt.
Utilities (TOs)Ind. Sys. Operators (ISOs)
Reg. Trans. Org (RTOs)Suppliers (LSEs)
ESCOs
ISO PricingWeather Data
Emissions Data
Data Sources
EnerNOC Site Server
Equipment ControlSystems
Other DataCollection Systems
DB
.CSV
Smart Meter
PowerTrak v3Customer
Data Sources
Business Process Mgmt.
External Data Sources
Energy Intelligence
Data Layer
Enterprise DB Meter DB Analytical DB
• Energy Intelligence. This proprietary suite of web-enabled modules delivers demand response andenergy management capabilities by processing near real-time and historical data from our datawarehouse. Energy intelligence provides actionable energy information to users and offers a wayfor users to view and manipulate this data. Modules include: Profiling, which enables usagetracking; PowerTrak Analytics, which enables users to conduct asset performance and emissionstracking, load forecasting, benchmarking and scorecard reporting; Rate Analysis, which enables
14
users to compare utility tariffs with competitive supply offers; Curtailment, which enables us tocurtail electricity consumption and dispatch generators based on signals from grid operators;Billing, which enables users to generate energy bills for internal cost allocation purposes; andMyPowerTrak, which is a customizable portal that enables our personnel and our customers tocreate user-defined dashboards with customized content.
• Enterprise Applications. This Java-based middle layer of the application is where we have definedand implemented our business processes, business rules, and business logic that pertain to globaldevice management, security, messaging, file transfer, scheduling and business processmanagement. These enterprise applications provide the core web services that coordinate thenear real-time exchange of data between devices, people, external data sources, and otherenterprise applications.
• Data Layer. The data layer is a relational database that is designed for query, analysis andtransaction processing and data collection, processing, aggregation and validation. It containshistorical energy data and data from other sources. It separates analysis workload fromtransaction workload and enables us to consolidate data from several sources. These recordsinclude customer demographics, interval energy information (for example, 1-minute, 5-minuteand 15-minute), as well as weather, emissions, pricing and aggregated summary data.
Currently, PowerTrak collects facility consumption data on a 1-minute, 5-minute, 15-minute andhourly basis and integrates that data with near real-time, historical and forecasted market variables. Weuse PowerTrak to measure, manage, benchmark and optimize end-use customers’ energy consumptionand facility operations. We use this data to help end-use customers analyze consumption patterns,forecast demand, measure real-time performance during demand response events, continuously monitorbuilding management equipment to optimize system operation, model rates and tariffs and createenergy scorecards to benchmark similar facilities. In addition, PowerTrak enables us to track eachend-use customer’s greenhouse gas emissions by mapping their energy consumption with the fuel mixused for generation in their location, such as the proportion of coal, nuclear, natural gas, fuel oil andother sources used.
We have generally provided basic PowerTrak functionality as part of the overall service offering tothe end-use customers who participate in our demand response programs. As part of our energymanagement solutions, we use PowerTrak to identify and deliver energy efficiency strategies for ourcustomers. We believe that end-use customers will become increasingly aware of their energy costs andconsumption and will look to advanced analytics and trusted third-party providers to help them bettermanage their overall energy expenditures.
Operations
As of December 31, 2007, our operations team consisted of 91 employees. This group comprisesseveral functionally distinct sub-groups:
• Customer Operations—customer operations is responsible for all on-site project management,hardware installation, and on-going customer relationship management. Members of this groupinclude project managers, site technicians including electricians, energy engineers, materialsmanagement, and staff with large capital project experience.
• Network Operations—the network operations group is responsible for maintaining theconnectivity and preparedness of 2,189 commercial, industrial, and institutional facilities. Thisgroup is also responsible for demand response event execution and call center support throughour NOC.
• Energy Markets—the energy markets group is responsible for managing our portfolio of demandresponse resources to maximize revenue and minimize risk of underperformance and penalties.
15

The group is composed of experts in market rules and regulations, enrollment procedures,performance measurements, and financial settlements. Combining this knowledge with nearreal-time data from thousands of end-use sites, energy markets actively manages its resourceportfolios to ensure reliable and consistent event performance.
• Energy Services Operations—the energy services operations group is responsible for ourmonitoring-based commissioning, energy efficiency, energy procurement and carbon avoidanceservices. Energy services operations leverages our PowerTrak platform, customer relationships,network of installed devices and customers’ pre-existing energy management systems to identifyand implement energy savings opportunities. In addition to this activity, energy servicesoperations is responsible for the analysis behind, and execution of, our energy procurementconsulting services.
Sales
As of December 31, 2007, our sales team consisted of 73 employees. We organize our sales effortsby customer type. Our utility sales group sells to grid operators and utilities, while our commercial andindustrial sales group sells to commercial, institutional and industrial customers.
Our utility sales group is responsible for securing additional long-term contracts from gridoperators and utilities. These sales typically take 12 to 18 months to complete and, when successful,typically result in multi-million dollar contracts with terms of between three and 10 years. We activelypursue long-term contracts in both restructured markets and in traditionally regulated markets.
Our commercial and industrial sales group sells our demand response and energy managementsolutions to commercial, institutional and industrial customers. These sales typically take two to fourmonths to complete and have terms of between one and five years. Our commercial and industrial salesgroup is located in major electricity regions throughout the United States, including New England, NewYork, the Mid-Atlantic, Texas, Florida, California and Ontario, Canada. In each of these territories, wehave a regional sales director, who reports to our Senior Vice President of Sales and BusinessDevelopment.
Marketing
Our marketing organization consisted of 17 employees as of December 31, 2007. This group isresponsible for influencing all market stakeholders including customers, energy users and policymakers,attracting prospects to our business, enabling the sales engagement process with messaging, trainingand sales tools, and sustaining and expanding relationships with existing customers through renewal andretention programs and by identifying cross selling opportunities. This group researches our current andfuture markets and leads our strategies for growth, competitiveness, profitability and increasing marketshare.
Customers
End-Use Customers
As of December 31, 2007, we managed 1,112 MW of technology-enabled demand responsecapacity from 793 different commercial, institutional and industrial customers in our demand responsenetwork across 2,189 customer sites. The following table lists some of our largest customers by capacity
16

under management as of December 31, 2007 in each of the six key vertical markets that ourcommercial and industrial sales group primarily targets for demand response opportunities:
Technology Education Food Sales and Storage
AT&T University of San Diego AlbertsonsLevel 3 Communications The California State University Raley’sGeneral Electric Southern Connecticut State PathmarkAdobe Systems University Stop & ShopNavisite Western Connecticut State Shop Rite
UniversityNew Haven Public Schools
Government Healthcare Manufacturing/Industrial
Suffolk County, NY Partners Healthcare O&G IndustriesCity of Stamford, CT Stamford Hospital PfizerTown of Vernon, CT Greenwich Hospital Verso PaperCity of Brockton, MA Hartford Hospital CascadesCity of New Haven, CT Umass Memorial
Supermarkets are a good example of how our technology and solutions function to deliver demandresponse capacity to grid operators and utilities while delivering significant value to the end-usecustomer. Supermarkets operate with thin margins, and energy savings can significantly increase netincome. On average, the supermarket industry generates net income of 1.5% of revenues and electricityconstitutes approximately 1.7% of the cost of doing business, as a percentage of revenues. This meansthat even modest savings in electricity costs can result in a disproportionate increase in net income.
Supermarkets have a number of measures that can be taken to reduce their electrical demandfrom the grid. Most supermarkets have a natural gas-fired emergency generator to ensure that shopperswho are in the checkout line can pay for products in the event of a power disruption. In many regions,these can be activated at times when a supermarket is called on to reduce demand. Supermarkets alsohave the option to curtail non-critical electrical loads that do not interfere with shopping. Lighting inmany supermarkets is separated into different circuits and curtailing approximately one-third of thelights does not impact business continuity. Additionally, air handlers, anti-sweat heaters, and otherancillary loads can be curtailed. On average, our supermarket customers are able to achieve 90 kW ofdemand reduction from the grid for each supermarket location by implementing these types of demandresponse strategies.
Our demand response solutions enable this demand reduction. Our hardware is installed in eachstore to provide for remote control of devices and collection and communication of real-time electricityconsumption information (i.e., metering). Our hardware communicates through the supermarket’s LANor through a broadband wireless connection. Our hardware has the ability to communicate directly withthe physical building management system at many supermarket sites. It also may have the ability tocommunicate directly with discrete lighting panels and automatic transfer switches coupled toemergency generators in the event that a building management system does not exist. From our NOC,depending on the configuration of our curtailment protocol at each supermarket, we are able to send acommand over the Internet to reduce electrical consumption. Demand reduction is monitored remotelywith real-time data feeds, the results of which are displayed in our NOC through various datapresentment screens. Each supermarket is monitored for the duration of the demand response eventand operations are automatically restored to normal when the event ends.
17
Grid Operator and Utility Customers
We have significantly grown our base of grid operator and utility customers since inception. As ofDecember 31, 2007, our grid operator and utility customer base included ISO New England Inc., TheNew York Independent System Operator, PJM Interconnection, L.L.C., The Connecticut Light andPower Company, Pacific Gas and Electric Company, Southern California Edison Company, San DiegoGas and Electric Company, Public Service Company of New Mexico and Tampa Electric Company. Weprovide reliability-based demand response, price-based demand response and ancillary services forthem.
Competition
We face competition from other clean and intelligent energy solutions providers, advancedmetering infrastructure service providers, as well as utilities and competitive electricity suppliers whooffer their own demand response and energy management solutions. We also compete with traditionalsupply-side resources, such as peaking power plants.
The clean and intelligent energy solutions sector is fragmented. In the demand response sector, wecompete with various providers on a regional basis. When competing for grid operator and utilitycustomers, we believe that the primary factors on which we compete are pricing of the capacity that ismade available, as well as the financial stability, historical performance levels and overall experience ofthe demand response solutions provider. When competing for commercial, institutional and industrialcustomers, we believe that the primary factors are the level of capacity payments shared with theend-use customer for their demand response capacity, level of sophistication employed by the demandresponse service provider to identify and optimize demand response capabilities at their facilities andability of the demand response service provider to service multiple sites across different geographicregions and provide additional technology-enabled energy management solutions. Some providers ofadvanced metering solutions have added, or may add, demand response products and services to theirexisting business. Some advanced metering infrastructure service providers are substantially larger andbetter capitalized than we are and have the ability to combine advanced metering and demand responsesolutions into an integrated offering to a large existing customer base. We believe that our operationalexperience, first mover advantage, leadership in the clean and intelligent energy solutions sector andour established base of customers gives us an advantage when competing for commercial, institutionaland industrial customers.
Utilities and competitive electricity suppliers could and sometimes do also offer their own demandresponse solutions, which could decrease our base of potential customers and could decrease ourrevenues and profitability. However, demand response programs, as administered by utilities alone, arebound to standard tariffs to which all end-use customers in the utility’s service territory must abide.Utilities must treat all rate class customers equally in order to serve them under public utilitycommission-approved tariffs. In contrast, we have the flexibility to offer customized solutions todifferent customers. We believe that we also have technology and operational experience at the facility-level, behind the meter, that both utilities and competitive electricity suppliers lack. Furthermore, webelieve that our solutions are complementary to utilities and competitive electricity suppliers’ demandresponse efforts because we can help enlist customers to their existing programs, reduce their workloadby serving as a single point of contact for an aggregated pool of customers who choose to participate intheir programs, and act to uphold or enhance end-use customer satisfaction. However, utilities andcompetitive electricity suppliers may offer clean and intelligent energy solutions at prices below cost oreven for free in order to improve their customer relations or competitive positions, which woulddecrease our base of potential customers and could decrease our revenues and profitability.
We also compete with traditional supply-side resources such as natural gas-fired peaking plants. Insome cases, utilities have an incentive to invest in these fixed assets rather than develop demandresponse as they are able to include the cost of fixed assets in their rate base and in turn receive a
18
return on investment. In addition, some utilities have a financial disincentive to invest in demandresponse and even more so in energy efficiency because reducing demand can have the effect ofreducing their sales of electricity. However, we believe that our solutions are gaining substantialregulatory support and will continue to do so as they are faster to market, require no electric powergeneration, transmission or distribution infrastructure, and are more cost-effective and environmentallysound.
Regulatory
We provide demand response solutions in restructured electricity markets and in traditionallyregulated electricity markets. In restructured markets, we often provide our solutions to the regionalgrid operators that are responsible for the reliability and efficient operation of the bulk electric powersystem, such as PJM Interconnection. In traditionally regulated markets, we provide our solutions toutilities, such as Public Service Company of New Mexico and Tampa Electric Company.
Regulations within both types of markets impact how quickly our solutions may be adopted, theprices we can charge and margins we can earn, the timing with respect to when we begin earningrevenue, and the various ways in which we are permitted or may choose to do business and accordingly,impact our assessments of which potential markets to most aggressively pursue. In addition, certain ofour contracts with utilities are subject to regulatory approval, which regulatory approval may not beobtained on a timely basis, if at all.
The prices we can charge and margins we can earn can be impacted by market policies, such asprogram rules that discount the value of demand response resources because they can only be availableduring a limited number of peak demand hours, unlike other types of capacity resources that may beavailable 24 hours per day, every day of the week. Similarly, regulations regarding the frequency andduration of demand response events can affect the amount of demand response capacity that we areable to enlist from end-use customers and the amount that we need to pay them for their participation.
The policies regarding the measurement and verification of demand response resources, safetyregulations and air quality or emissions regulations, which vary by state, affect how we do business. Forexample, some state environmental agencies may limit the amount of emissions allowed from back-upgenerators utilized by end-use customers, even when back-up generators are strictly used to maintainsystem reliability. For example, in California, demand response capacity is generally not permitted tocome from end-use customers who activate back-up generators in order to reduce their electric powergrid usage. Therefore, the use of back-up generators is limited under all of our contracts with thatstate’s utilities, with the exception of our contract with San Diego Gas & Electric Company, whichallows use of back-up generators on which we install emissions control equipment. Measurement andverification policies of various markets influence how we modify the metering and control devices weinstall and data we record at each customer site in those markets. In limited cases, we provide aninterconnected demand response resource that exports power to the electric power grid for resale, suchas in the case of our contract with San Diego Gas & Electric Company. The export of power for resaleis subject to the requirements of the Federal Power Act and the Federal Energy RegulatoryCommission’s direct regulation.
Intellectual Property
We utilize a combination of intellectual property safeguards, including patents, copyrights,trademarks and trade secrets, as well as employee and third-party confidentiality agreements, to protectour intellectual property. As of December 31, 2007, in the United States we held one business methodpatent, which expires in 2024, and we had eight pending patent applications, including two pendingUnited States applications, two pending Patent Cooperation Treaty international applications and fourpending foreign applications. Our patent applications, and any future patent applications, might notresult in a patent being issued with the scope of the claims we seek, or at all, and any patents we may
19
receive may be challenged, invalidated or declared unenforceable. We continually assess appropriatecircumstances for seeking patent protection for those aspects of our technology, designs andmethodologies and processes that we believe provide significant competitive advantages.
As of December 31, 2007, we held ten trademarks/service marks in the United States. These areEnerNOC, Get More from Energy, Energy for Education, Capacity on Demand, PowerTrak, EnerNOCExchange, Celerity Energy, eNode, ebidenergy.com and ENTREX. We also have trademarkapplications pending that correspond to the following marks: The Greenest kWh is the One NeverUsed, The Greenest Kilowatt-hour is the One Never Used, The Greenest kW is the One Never Built,The Greenest Kilowatt is the One Never Built, the Cleanest kWh is the One Never Used, One-ClickCurtailment, Negawatt Network and CarbonTrak.
With respect to, among other things, proprietary know-how that is not patentable and processes forwhich patents are difficult to enforce, we rely on trade secret protection and confidentiality agreementsto safeguard our interests. We believe that many elements of our demand response solutions involveproprietary know-how, technology or data that are not covered by patents or patent applications,including technical processes, equipment designs, algorithms and procedures. We have taken securitymeasures to protect these elements. All of our employees have entered into confidentiality andproprietary information agreements with us. These agreements address intellectual property protectionissues and require our employees to assign to us all of the inventions, designs, and technologies theydevelop during the course of employment with us. We also seek confidentiality from our customers andbusiness partners before we disclose any sensitive aspects of our demand response and energymanagement technology or business strategies. We have not been subject to any material intellectualproperty claims.
Employees
As of December 31, 2007, we had 253 full-time employees, including 90 in sales and marketing, 91in operations, 36 in research and development and 36 in general and administrative. Of these full-timeemployees, 170 were located in New England, 22 were located in New York, seven were located in theMid-Atlantic, 40 were located in California, five were located in Toronto, Ontario, three were located inTexas, one was located in Florida and five were located in other areas across the United States. Weexpect to grow our employee base and our future success will depend in part on our ability to attract,retain and motivate highly qualified personnel, for whom competition is intense. Our employees are notrepresented by any labor unions or covered by a collective bargaining agreement and we have notexperienced any work stoppages. We consider our relations with our employees to be good.
20

Item 1A. Risk Factors
The statements in this section, as well as statements described elsewhere in this Annual Report onForm 10-K, or in our other SEC filings, describe risks that could materially and adversely affect ourbusiness, financial condition and results of operations and the trading price of our securities. These risks arenot the only risks that we face. Our business, financial condition and results of operations could also bematerially affected by additional factors that are not presently known to us or that we currently consider tobe immaterial to our operations.
Risks Related to Our Business
We have incurred net losses since our inception, and we may continue to incur net losses in the future andmay never reach profitability.
Our net losses in 2007, 2006 and 2005 were $23.6 million, $5.8 million and $1.7 million,respectively. We have not achieved profitability for any calendar year, although we have for certainquarters, and we expect to continue to incur operating losses for the foreseeable future. As ofDecember 31, 2007, we had an accumulated deficit of $33.9 million. Initially, our operating losses wereprincipally driven by start-up costs and the costs of developing our technology, which included researchand development. More recently, our net losses have been principally driven by selling and marketing,and general and administrative expenses, including, without limitation, expenses related to theexpansion of the number of MW under our management. As we seek to grow our revenues andcustomer base, we plan to continue to expand our demand response and energy management solutions,which will require increased selling and marketing, general and administrative, and research anddevelopment expenses. These increased operating costs may cause us to incur net losses for theforeseeable future, and there can be no assurance that we will be able to grow our revenues, sustainthe growth rate of our revenues, expand our customer base or become profitable. Furthermore, theseexpenses are not the only factors that may contribute to our net losses. For example, interest expenseon our currently outstanding debt and on any debt that we incur in the future could contribute to ournet losses. As a result, even if we significantly increase our revenues, we may continue to incur netlosses in the future. If we fail to achieve profitability, the market price of our common stock coulddecline substantially.
We have a limited operating history in an emerging market, which may make it difficult to evaluate ourbusiness and prospects, and may expose us to increased risks and uncertainties.
We began operating as a New Hampshire limited liability company in December 2001 and wereincorporated as a Delaware corporation in June 2003. We first began generating revenues in 2003.Accordingly, we have only a limited history of generating revenues, and the future revenue potential ofour business in the emerging market for clean and intelligent energy solutions is uncertain. As a resultof our short operating history, we have limited financial data that can be used to evaluate our business,strategies, performance and prospects or an investment in our common stock. Any evaluation of ourbusiness and our prospects must be considered in light of our limited operating history and the risksand uncertainties encountered by companies at our stage of development. To address these risks anduncertainties, we must do the following:
• maintain our current relationships and develop new relationships with grid operators and utilitiesand the entities that regulate them;
• maintain and expand our current relationships and develop new relationships with commercial,institutional and industrial customers;
• maintain and enhance our existing demand response and energy management solutions;
21
• continue to develop clean and intelligent energy solutions that achieve significant marketacceptance;
• continue to enhance our information processing systems;
• execute our business and marketing strategies successfully;
• respond to competitive developments;
• attract, integrate, retain and motivate qualified personnel; and
• continue to participate in shaping the regulatory environment.
We may be unable to accomplish one or more of these objectives, which could cause our businessto suffer. In addition, accomplishing many of these goals might be very expensive, which couldadversely impact our operating results and financial condition. Any predictions about our futureoperating results may not be as accurate as they could be if we had a longer operating history and ifthe market in which we operate was more mature.
A substantial majority of our revenues are generated from contracts with, and open market sales to, a smallnumber of grid operator and utility customers, including in particular one grid operator customer with whichcertain of our contracts are expiring in May 2008, and the modification or termination of these contracts orsales relationships could materially adversely affect our business.
A majority of our revenues have been generated from contracts with, and open market sales to,ISO New England Inc., or ISO-NE. This customer accounted for 60%, 65% and 86% of our totalrevenues in 2007, 2006 and 2005, respectively. Moreover, revenues from our three largest grid operatorand utility customers represented approximately 88%, 93% and 88% of our total revenues in 2007,2006 and 2005, respectively.
A substantial portion of our revenues historically have been derived from three fixed pricecontracts, two of which are with ISO-NE and one of which is with Connecticut Light and PowerCompany, or CL&P. In 2007, 2006, and 2005, these contracts accounted for approximately 41%, 62%,and 86%, respectively, of our total revenues. Both fixed price contracts with ISO-NE expire in May2008, and ISO-NE has notified us that it will not extend either contract beyond that date. The fixedprice contract with CL&P expires in December 2008. These three contracts relate to an aggregate ofapproximately 190 MW of demand response capacity under our management as of December 31, 2007.Although we entered into a new 170 MW fixed price contract with CL&P in February 2008, which, ifapproved, will expire on May 31, 2010 and which we expect will partially offset the impact of theexpiration of our existing fixed price contracts with ISO-NE and CL&P on our revenues, the newCL&P contract is subject to approval by the Connecticut Department of Public Utility Control. Therecan be no assurance that such approval will be obtained or, if obtained, be issued on a timely basis. Ifwe are unable to obtain such approval, other available program options will likely provide significantlylower capacity payments than our existing fixed price contracts with ISO-NE and CL&P. For example,the capacity payments available under ISO-NE’s Real-Time Demand Response program are significantlylower than the capacity payments available under our existing fixed price contracts with ISO-NE andCL&P. Thus, the failure to obtain regulatory approval for our new contract with CL&P couldsignificantly reduce our future revenues and have a material adverse effect on our business.
Our results of operations could be adversely affected if our operating expenses do not correspond with thetiming of our revenues.
Most of our operating expenses, such as employee compensation and rental expense for properties,are either relatively fixed in the short-term or incurred in advance of sales. Moreover, our spendinglevels are based in part on our expectations regarding future revenues. As a result, if revenues for a
22

particular quarter are below expectations, we may not be able to proportionately reduce operatingexpenses for that quarter. For example, if a demand response event or metering and verification testdoes not occur in a particular quarter, we may not be able to recognize revenues for theundemonstrated capacity in that quarter. This shortfall in revenues could adversely affect our operatingresults for that quarter and could cause the market price of our common stock to decline substantially.
We incur significant up-front costs associated with the expansion of the number of MW under ourmanagement and the infrastructure necessary to enable such MW. In most of the markets in which weoriginally focused our growth, we generally begin earning revenues from our MW under managementwithin approximately one month from enablement of such MW. However, in certain forward capacitymarkets in which we choose to participate, it may take longer for us to begin earning revenues on MWthat we enable, in some cases up to a year after enablement. For example, the PJM Interconnection, orPJM, forward capacity market, which is a market in which we materially increased our participationduring the first quarter of 2008 and in which we expect to continue to increase our participation andderive revenues, operates on a June to May delivery-year basis, which means that a MW that we enableafter June of each year will typically not begin earning revenue until June of the following year. Thisresults in a longer average lag time in our portfolio from the point in time when we consider a MW tobe under management to when we earn revenues from such MW. The up-front costs we incur toexpand our MW under management in PJM and other similar markets, coupled with the delay inreceiving revenues from such MW, could adversely affect our operating results and could cause themarket price of our common stock to decline substantially.
We operate in highly competitive markets; if we are unable to compete successfully, we could lose market shareand revenues.
The market for clean and intelligent energy solutions is fragmented. Some traditional providers ofadvanced metering solutions have added, or may add, demand response services to their existingbusiness. We face strong competition from clean and intelligent energy solutions providers, both largerand smaller than we are. We also compete against traditional supply-side resources such as naturalgas-fired peaking power plants. In addition, utilities and competitive electricity suppliers offer their owndemand response solutions, which could decrease our base of potential customers along with ourrevenues and profitability.
Many of our competitors have greater financial resources than we do. Our competitors could focustheir substantial financial resources to develop a competing business model or develop products orservices that are more attractive to potential customers than what we offer. Some advanced meteringinfrastructure service providers, for example, are substantially larger and better capitalized than we areand have the ability to combine advanced metering and demand response solutions into an integratedoffering to a large, existing customer base. Our competitors may offer clean and intelligent energysolutions at prices below cost or even for free in order to improve their competitive positions. Any ofthese competitive factors could make it more difficult for us to attract and retain customers, cause usto lower our prices in order to compete, and reduce our market share and revenues, any of whichcould have a material adverse effect on our financial condition and results of operations. In addition,we may also face competition based on technological developments that reduce peak demand forelectricity, increase power supplies through existing infrastructure or that otherwise compete with ourdemand response and energy management solutions.
If we fail to successfully educate existing and potential grid operator and utility customers regarding thebenefits of our demand response and energy management solutions or a market otherwise fails to develop forthose solutions, our ability to sell our solutions and grow our business could be limited.
Our future success depends on commercial acceptance of our clean and intelligent energy solutionsand our ability to obtain additional contracts. We anticipate that revenues related to our demand
23

response solutions will constitute a substantial portion of our revenues for the foreseeable future. Themarket for clean and intelligent energy solutions in general is relatively new. If we are unable toeducate our potential customers about the advantages of our solutions over competing products andservices, or our existing customers no longer rely on our demand response solutions, our ability to sellour solutions will be limited. In addition, because the clean and intelligent energy solutions sector israpidly evolving, we cannot accurately assess the size of the market, and we may have limited insightinto trends that may emerge and affect our business. For example, we may have difficulty predictingcustomer needs and developing clean and intelligent energy solutions that address those needs. If themarket for our demand response and our energy management solutions does not continue to develop,our ability to grow our business could be limited and we may not be able to achieve profitability.
If the actual amount of demand response capacity that we make available under our capacity commitments ismaterially less than required, our committed capacity could be reduced and we could be required to makerefunds and pay penalty fees.
We provide demand response capacity to our grid operator and utility customers either under fixedprice long-term contracts, or under terms established in open bidding markets where capacity ispurchased. Under the long-term contracts and open bidding market commitments, grid operators andutilities make periodic payments to us based on the amount of demand response capacity that we areobligated to make available to them during the contract period, or make periodic payments to us basedon the amount of demand response capacity that we bid to make available to them during the relevantperiod. We refer to these payments as committed capacity payments. Committed capacity is negotiatedand established by the contract or set in the open market bidding process and is subject to subsequentconfirmation by measurement and verification tests or performance in a demand response event. In ouropen bidding markets, we offer different amounts of committed capacity to our grid operator andutility customers based on market rules on a periodic basis. We refer to measured and verified capacityas our demonstrated or proven capacity. Once demonstrated, the proven capacity amounts typicallyestablish a baseline of capacity for each end-use customer site in our portfolio, on which committedcapacity payments are calculated going forward and until the next demand response event ormeasurement and verification test when we are called to make capacity available.
The capacity level that we are able to achieve varies with the electricity demand of targetedequipment, such as heating and cooling equipment, at the time an end-use customer is called toperform. Accordingly, our ability to deliver committed capacity depends on factors beyond our control,such as temperature and humidity and the time of day that an end-use customer is called to perform.The correct operation of, and timely communication with, devices used to control equipment are alsoimportant factors that affect available capacity. Under some of our contracts, any difference betweenour demonstrated capacity and the committed capacity on which capacity payments were previouslymade will result in either a refund payment from us to our grid operator or utility customer or anadditional payment to us by such customer. Any refund payable by us would reduce our deferredrevenues, but would not impact our previously recognized revenues. If there is a true-up settlement dueto a grid operator or utility customer, we generally make a corresponding adjustment in our paymentsto the end-use customer or customers who failed to make the appropriate level of capacity available,however we are sometimes unable to do so. In addition, some of our contracts with and open marketprograms established by our grid operator and utility customers provide for penalty payments, whichcan be substantial, in certain circumstances in which we do not meet our capacity commitments, eitherin measurement and verification tests or in demand response events. Further, because measurementand verification test results for some capacity contracts establish capacity levels on which payments willbe made until the next test or demand response event, the payments to be made to us under suchcapacity contracts would be reduced until the level of capacity is established at the next test or demandresponse event. We could experience significant period-to-period fluctuations in our financial results infuture periods due to true-up settlements, capacity payment adjustments, replacement costs or other
24

payments, which could be substantial. We incurred aggregate penalty payments of $152,913 and $52,118during the years ended December 31, 2007 and December 31, 2006, respectively.
Our business is subject to government regulation, and may become subject to modified or new governmentregulation, which may negatively impact our ability to market our clean and intelligent energy solutions.
While the electric power markets in which we operate are regulated, most of our business is notdirectly subject to the regulatory framework applicable to the generation and transmission of electricity.However, we may become directly subject to the regulation of the Federal Energy RegulatoryCommission, or FERC, to the extent we own, operate, or control generation used to make wholesalesales of power. In addition, our subsidiary Celerity Energy Partners San Diego, LLC, or Celerity, issubject to direct regulation by FERC, because Celerity exports power to the electric power grid forresale pursuant to a contract with San Diego Gas & Electric Company.
In addition, the installation of devices used in providing our solutions and electric generatorssometimes installed or activated when providing demand response solutions may be subject togovernmental oversight and regulation under state and local ordinances relating to building codes,public safety regulations pertaining to electrical connections and local and state licensing requirements.In a relatively few instances, we have agreed to own and operate a back-up generator at a commercial,institutional or industrial customer location for a period of time and to activate the generator whencapacity is called for dispatch so that the commercial, institutional or industrial customer can reduce itsconsumption of electricity from the electric power grid. These generators could become ineligible toparticipate in demand response programs in the future, or be compensated less for such participation,thereby reducing our revenues and adversely affecting our financial position. In addition, certain of ourcontracts and expansion of existing contracts with grid operators and utility customers are subject toapproval by federal, state, provincial or local regulatory agencies. There can be no assurance that suchapprovals will be obtained or be issued on a timely basis, if at all. For example, we received notificationin March 2008 from the California Public Utilities Commission, or the CPUC, that the CPUC deniedour request for approval of our contract with Southern California Edison Company, or SCE, for up to160 MW of demand response capacity. Although we are working with SCE to submit a revisedproposal in connection with this contract, we cannot be certain that any revised proposal will besubmitted to, or approved by, the CPUC.
Additionally, federal, state, provincial or local governmental entities may seek to change existingregulations, impose additional regulations or change their interpretation of the applicability of existingregulations. Any modified or new government regulation applicable to our current or future solutions,whether at the federal, state, provincial or local level, may negatively impact the installation, servicingand marketing of those solutions and increase our costs and the price of our solutions.
Failure of third parties to manufacture quality products or provide reliable services in a timely manner couldcause delays in the delivery of our solutions, which could damage our reputation, cause us to lose customersand negatively impact our growth.
Our success depends on our ability to provide quality, reliable demand response and energymanagement solutions in a timely manner, which in part requires the proper functioning of facilitiesand equipment owned, operated or manufactured by third parties upon which we depend. For example,our reliance on third parties includes:
• utilizing components that we install or have installed at commercial, institutional and industriallocations;
• outsourcing email notification and cellular and paging wireless communications that are used tonotify our end-use customers of their need to reduce electricity consumption at a particular time
25

and to execute instructions to devices installed at our customer locations and which areprogrammed to automatically reduce consumption on receipt of such communications; and
• outsourcing certain installation and maintenance operations to third-party providers.
Any delays, malfunctions, inefficiencies or interruptions in these products, services or operationscould adversely affect the reliability or operation of our demand response and energy managementsolutions, which could cause us to experience difficulty retaining current customers and attracting newcustomers. Such delays could also result in our making refunds or paying penalty fees to our gridoperator and utility customers. In addition, our brand, reputation and growth could be negativelyimpacted.
If we lose key personnel upon whom we are dependent, we may not be able to manage our operations andmeet our strategic objectives.
Our continued success depends upon the continued availability, contributions, vision, skills,experience and effort of our senior management, sales and marketing, engineering and operationsteams. We do not maintain ‘‘key person’’ insurance on any of our employees. We have entered intoemployment agreements with certain members of our senior management team, but none of theseagreements guarantees the services of the individual for a specified period of time. All of theemployment arrangements with our key personnel, including the members of our senior managementteam, provide that employment is at-will and may be terminated by the employee at any time andwithout notice. Although we do not have any reason to believe that we may lose the services of any ofthese persons in the foreseeable future, the loss of the services of any of these persons might impedeour operations or the achievement of our strategic and financial objectives. We rely on our engineeringteam to research, design and develop new and enhanced demand response and energy managementsolutions. We rely on our operations team to install, test, deliver and manage our demand responsesolutions. We rely on our sales and marketing team to sell our solutions to grid operators, utilities andcommercial, institutional and industrial customers, and to build our brand and promote our company.The loss or interruption of the service of members of our senior management, sales and marketing,engineering or operations teams, or our inability to attract or retain other qualified personnel oradvisors could have a material adverse effect on our business, financial condition and results ofoperations and could significantly reduce our ability to manage our operations and implement ourstrategy.
We expect to continue to expand our sales and marketing, operations, engineering, research and developmentcapabilities and financial and reporting systems, and as a result, we may encounter difficulties in managingour growth, which could disrupt our operations.
We expect to experience significant growth in the number of our employees and the scope of ouroperations. To manage our anticipated future growth, we must continue to implement and improve ourmanagerial, operational, financial and reporting systems, expand our facilities, and continue to recruitand train additional qualified personnel. All of these measures will require significant expenditures andwill demand the attention of management. Due to our limited resources, we may not be able toeffectively manage the expansion of our operations or recruit and adequately train additional qualifiedpersonnel. The physical expansion of our operations may lead to significant costs and may divert ourmanagement and business development resources. Any inability to manage growth could delay theexecution of our business plans or disrupt our operations.
We compete for personnel and advisors with other companies and other organizations, many ofwhich are larger and have greater name recognition and financial and other resources than we do. Ifwe are not able to hire, train and retain the necessary personnel, or if these managerial, operational,
26

financial and reporting improvements are not implemented successfully, we could lose customers andrevenues.
We allocate our operations, sales and marketing, research and development, general andadministrative, and financial resources based on our business plan, which includes assumptions aboutcurrent and future contracts with grid operator and utility customers and commercial, institutional andindustrial customers, variable prices in open markets for demand response capacity, the development ofancillary services markets which enable demand response as a revenue generating resource and avariety of other factors relating to electricity markets, and the resulting demand for our demandresponse and energy management solutions. However, these factors are uncertain. If our assumptionsregarding these factors prove to be incorrect or if alternatives to those offered by our solutions gainfurther acceptance, then actual demand for our demand response and energy management solutionscould be significantly less than the demand we anticipate and we may not be able to sustain ourrevenue growth or achieve profitability.
An oversupply of electric generation capacity and varying regulatory structures in certain regional powermarkets could negatively affect our business and results of operations.
Although demand for electric capacity has been increasing throughout North America, a buildupof new electric generation facilities could result in excess electric generation capacity in certain regionalpower markets. In addition, the electric power industry is highly regulated. The regulatory structures inregional electricity markets are varied and some regulatory requirements make it more difficult for usto provide some or all of our demand response solutions in those regions. For instance, in somemarkets, regulated quantity or payment levels for demand response capacity or energy make it moredifficult for us to cost-effectively enroll and manage many commercial, institutional and industrialcustomers in demand response programs. Further, some markets, such as New York, have regulatorystructures that do not yet include demand response as a qualifying resource for purposes of short-termreserve requirements known as ancillary services. As part of our business strategy, we intend to expandinto additional regional electricity markets. However, the combination of excess electric generationcapacity and unfavorable regulatory structures could limit the number of regional electricity marketsavailable to us for expansion. Unfavorable regulatory decisions in markets where we currently operatecould also negatively affect our business. For example, regulators could modify market rules in certainareas to further limit the use of back-up generators in demand response markets or could implementbidding floors or caps that could lower our revenue opportunities. A limit on back-up generators wouldmean that some of the capacity reductions we aggregate from end-use customers willing to reduceconsumption from the grid by activating their own back-up generators during demand response eventswould not qualify as capacity, and we would have to find alternative sources of capacity from end-usecustomers willing to reduce load by curtailing consumption rather than by generating electricitythemselves.
We face pricing pressure relating to electric capacity made available to grid operators and utilities and in thepercentage or fixed amount paid to commercial, institutional and industrial customers for making capacityavailable, which could adversely affect our results of operations and financial position and delay or preventour future profitability.
The rapid growth of the clean and intelligent energy solutions sector is resulting in increasinglyaggressive pricing, which could cause the prices for clean and intelligent energy solutions to decreaseover time. Our grid operator and utility customers may switch to other clean and intelligent energysolutions providers based on price, particularly if they perceive the quality of our competitors’ productsor services to be equal or superior to ours. Continued decreases in the price of capacity by ourcompetitors could result in a loss of grid operator and utility customers or a decrease in the growth ofour business, or it may require us to lower our prices for capacity to remain competitive, which would
27

result in reduced revenues and lower profit margins and would adversely affect our results ofoperations and financial position and delay or prevent our future profitability. Continued increases inthe percentage or fixed amount paid to commercial, institutional and industrial customers by ourcompetitors for making capacity available could result in a loss of commercial, institutional andindustrial customers or a decrease in the growth of our business and could delay or prevent ourprofitability. It also may require us to increase the percentage or fixed amount we pay to ourcommercial, institutional and industrial customers to remain competitive, which would result inincreases in the cost of revenues and lower profit margins and would adversely affect our results ofoperations and financial position and delay or prevent our future profitability.
We are currently subject to securities class action litigation, the unfavorable outcome of which may have amaterial adverse effect on our financial condition, results of operations and cash flows.
In March 2008, purported class action lawsuits were filed against us, certain of our executiveofficers, the members of our Board of Directors and certain of the underwriters from our November2007 follow-on public offering of our common stock by investors alleging violations of the SecuritiesAct, the Exchange Act and Rule 10b-5 promulgated thereunder. While we believe we have substantiallegal and factual defenses to each of the claims in these lawsuits and we will vigorously defend thelawsuits, the outcome of litigation is difficult to predict and quantify, and the defense against suchclaims or actions can be costly. In addition to decreasing sales and profitability, diverting financial andmanagement resources and general business disruption, we may suffer from adverse publicity that couldharm our brand, regardless of whether the allegations are valid or whether we are ultimately liable. Ajudgment significantly in excess of our insurance coverage for any claims could materially and adverselyaffect our financial condition, results of operations and cash flows. Additionally, publicity about theseclaims may harm our reputation or prospects and adversely affect our results.
Our inability to protect our intellectual property could negatively affect our business and results of operations.
Our ability to compete effectively depends in part upon the maintenance and protection of theintellectual property related to our demand response solutions. We hold two issued patents, nineregistered trademarks and numerous copyrights. Patent protection is unavailable for certain aspects ofthe technology and operational processes that are important to our business. Any patent held by us orto be issued to us, or any of our pending patent applications, could be challenged, invalidated,unenforceable or circumvented. Moreover, some of our trademarks which are not in use may becomeavailable to others. To date, we have relied principally on copyright, trademark and trade secrecy laws,as well as confidentiality agreements and licensing arrangements, to establish and protect ourintellectual property. However, we have not obtained confidentiality agreements from all of ourcustomers and vendors and although we have entered into confidentiality agreements with all of ouremployees, we cannot be certain that these agreements will be honored. Some of our confidentialityagreements are not in writing, and some customers are subject to laws and regulations that requirethem to disclose information that we would otherwise seek to keep confidential. Policing unauthorizeduse of our intellectual property is difficult and expensive, as is enforcing our rights against unauthorizeduse. The steps that we have taken or may take may not prevent misappropriation of the intellectualproperty on which we rely. In addition, effective protection may be unavailable or limited if we expandto other jurisdictions outside the United States, as the intellectual property laws of foreign countriessometimes offer less protection or have onerous filing requirements. From time to time, third partiesmay infringe our intellectual property rights. Litigation may be necessary to enforce or protect ourrights or to determine the validity and scope of the rights of others. Any litigation could beunsuccessful, cause us to incur substantial costs, divert resources away from our daily operations andresult in the impairment of our intellectual property. Failure to adequately enforce our rights couldcause us to lose rights in our intellectual property and may negatively affect our business.
28

We may be subject to damaging and disruptive intellectual property litigation related to allegations that ourdemand response and energy management solutions infringe on intellectual property held by others, whichcould result in the loss of use of those solutions.
Third-party patent applications and patents may be applicable to our clean and intelligent energysolutions. As a result, third-parties may in the future make infringement and other allegations thatcould subject us to intellectual property litigation relating to our solutions, which litigation could betime-consuming and expensive, divert attention and resources away from our daily operations, impedeor prevent delivery of our solutions, and require us to pay significant royalties, licensing fees anddamages. In addition, parties making infringement and other claims may be able to obtain injunctive orother equitable relief that could effectively block our ability to provide our solutions and could cause usto pay substantial damages. In the event of a successful claim of infringement, we may need to obtainone or more licenses from third parties, which may not be available at a reasonable cost, or at all.
If our information technology systems fail to adequately gather and assess data used in providing our cleanand intelligent energy solutions, or if we experience an interruption in their operation, our business, financialcondition and results of operations could be adversely affected.
The efficient operation of our business is dependent on our information technology systems. Werely on our information technology systems to effectively control the devices which enable our demandresponse solutions; gather and assess data used in providing our energy management solutions; managerelationships with our customers; and maintain our research and development data. The failure of ourinformation technology systems to perform as we anticipate could disrupt our business and productdevelopment and make us unable, or severely limit our ability, to respond to demand response events.In addition, our information technology systems are vulnerable to damage or interruption from:
• earthquake, fire, flood and other natural disasters;
• terrorist attacks and attacks by computer viruses or hackers;
• power loss; and
• computer systems, Internet, telecommunications or data network failure.
Although our information technology systems have fail-over redundancy where they are housed, wedo not have geographic fail-over redundancy. Any interruption in the operation of our informationtechnology systems could result in decreased revenues under our demand response contracts andenergy management contracts and commitments, reduced margins on revenues where fixed paymentsare due to our commercial, institutional and industrial customers, reductions in our demonstratedcapacity levels going forward, customer dissatisfaction and lawsuits and could subject us to penalties,any of which could have a material adverse effect on our business, financial condition and results ofoperations.
We depend on the electric power industry for revenues and, as a result, our operating results have experienced,and may continue to experience, significant variability due to volatility in electric power industry spending andother factors affecting the electric utility industry, such as seasonality of peak demand.
We currently derive substantially all of our revenues from the sale of demand response solutions,directly or indirectly, to the electric power industry. Purchases of our demand response solutions bygrid operators or electric utilities may be deferred or cancelled as a result of many factors, includingmergers and acquisitions involving electric utilities, changing regulations or program rules, fluctuationsin interest rates and increased electric utility capital spending on traditional supply-side resources. Inaddition, sales of capacity in open markets are particularly susceptible to variability based on changes inthe spending patterns of our grid operator and utility customers and on associated fluctuating marketprices for capacity. For example, in February 2008, ISO-NE implemented a market rule change to its
29

Day-Ahead Load Response program, a program in which we have historically been an activeparticipant. The change, which is currently being reviewed by FERC, would result in less opportunityfor demand response to participate in this program and may negatively impact our revenues and coulddelay or prevent our profitability. In addition, peak demand for electricity and other capacityconstraints tend to be seasonal. Peak demand in the United States tends to be most extreme in warmermonths, which may lead some capacity markets to yield higher prices for capacity or contract for theavailability of a greater amount of capacity during these warmer months. As a result, our demandresponse revenues may be seasonal. For example, in 2006, our demand response revenues in the thirdquarter were higher than our demand response revenues in the fourth quarter. Further, occasionalevents, such as a spike in natural gas prices, can lead grid operators and utilities to implementshort-term calls for demand response capacity to respond to these events, but we cannot be sure thatsuch calls will continue or that we will be in a position to generate revenues when they do occur. Wehave experienced, and may in the future experience, significant variability in our revenues, on both anannual and a quarterly basis, as a result of these and other factors. Pronounced variability or anextended period of reduction in spending by grid operators and utilities, or continued requests fromgrid operators and utilities to pay for demand response capacity at prices that are not equal on amonthly or quarterly basis over the course of a contract year, could negatively impact our business andmake it difficult for us to accurately forecast our future sales, which could lead to increased spendingby us that does not result in increases in revenues.
Electric power industry sales cycles can be lengthy and unpredictable and require significant employee timeand financial resources with no assurances that we will realize revenues.
Sales cycles with grid operator and utility customers are generally long and unpredictable. The gridoperators and utilities that are our potential customers generally have extended budgeting, procurementand regulatory approval processes. They also tend to be risk averse and tend to follow industry trendsrather than be the first to purchase new products or services, which can extend the lead time for orprevent acceptance of new products or services such as our demand response solutions. Accordingly,our potential customers may take longer to reach a decision to purchase services. This extended salesprocess requires the dedication of significant time by our personnel and our use of significant financialresources, with no certainty of success or recovery of our related expenses. It is not unusual for a gridoperator or utility customer to go through the entire sales process and not accept any proposal orquote.
An increased rate of terminations by our commercial, institutional and industrial customers, or their failureto renew contracts when they expire, would negatively impact our business by reducing our revenues, delayingor preventing our profitability and requiring us to spend more money to maintain and grow our commercial,institutional and industrial customer base.
Our ability to provide demand response capacity under our demand response contracts depends onthe amount of MW that we manage across commercial, institutional and industrial customers who enterinto agreements with us to reduce electricity consumption on demand. A significant portion of ouragreements with our existing commercial, institutional and industrial customers are scheduled forrenewal in 2008 and annually thereafter. If customers do not renew their contracts as they expire, wewill need to acquire MW from additional commercial, institutional and industrial customers or expandour relationships with existing commercial, institutional and industrial customers in order to maintainour revenues and grow our business. The loss of revenues resulting from contract terminations could besignificant, and limiting customer terminations is an important factor in our ability to achieve futureprofitability. If we are unsuccessful in controlling our commercial, institutional and industrial customerterminations, we may be unable to acquire a sufficient amount of MW or we may incur significant coststo replace MW, which could cause our revenues to decrease and our cost of revenues to increase, anddelay or prevent our profitability.
30

We may incur significant penalties and fines if found to be in non-compliance with any applicable State orFederal regulation, despite best efforts at compliance and adherence.
While the electric power markets in which we operate are regulated, most of our business is notdirectly subject to the regulatory framework applicable to the generation and transmission of electricity.However, regulations by FERC related to market design, market rules, tariffs, and bidding rules impacthow we can interact with our grid operator and utility customers. In addition, we are aware that oursubsidiary Celerity Energy Partners San Diego, LLC, or Celerity, exports some power to the electricpower grid and is thus subject to direct regulation by FERC and its regulations related to the sale ofwholesale power at market based rates. Despite our efforts to manage compliance with suchregulations, we may be found to be in non-compliance with such regulations and therefore subject topenalties or fines. For example, we recently determined that prior to our acquisition of Celerity inMay 2006, Celerity may have failed to make requisite filings with FERC in connection with transactionsrelating to our acquisition. Our internal investigation is ongoing, and, once completed, Celerity willmake any required filings with FERC but may be subject to penalties and fines, any of which may havea material adverse effect on our business, financial condition and results of operations.
The success of our businesses depends in part on our ability to develop new clean and intelligent energysolutions and increase the functionality of our current demand response and energy management solutions.
The market for demand response and energy management solutions is characterized by rapidtechnological changes, frequent new software introductions, Internet-related technology enhancements,uncertain product life cycles, changes in customer demands and evolving industry standards andregulations. We may not be able to successfully develop and market new clean and intelligent energysolutions that comply with present or emerging industry regulations and technology standards. Also, anynew regulation or technology standard could increase our cost of doing business.
From time to time, our customers have expressed a need for increased functionality in oursolutions. In response, and as part of our strategy to enhance our clean and intelligent energy solutionsand grow our business, we plan to continue to make substantial investments in the research anddevelopment of new technologies. Our future success will depend in part on our ability to continue todesign and sell new, competitive clean and intelligent energy solutions, enhance our existing demandresponse and energy management solutions and provide new, value-added services to our customers.Initiatives to develop new solutions will require continued investment, and we may experienceunforeseen problems in the performance of our technologies and operational processes, including newtechnologies and operational processes that we develop and deploy, to implement our solutions. Inaddition, software addressing the procurement and management of energy assets is complex and can beexpensive to develop, and new software and software enhancements can require long development andtesting periods. If we are unable to develop new clean and intelligent energy solutions or enhancementsto our existing demand response and energy management solutions on a timely basis, or if the marketdoes not accept such solutions, we will lose opportunities to realize revenues and obtain customers, andour business and results of operations will be adversely affected.
Any internal or external security breaches involving our demand response and energy management solutions,and even the perception of security risks of our solutions or the transmission of data over the Internet,whether or not valid, could harm our reputation and inhibit market acceptance of our solutions and cause usto lose customers.
We and our customers use our demand response and energy management solutions to compile andanalyze sensitive or confidential information related to our customers. In addition, some of our demandresponse and energy management solutions allow us to remotely control equipment at commercial,institutional and industrial customer sites. Our demand response and energy management solutions relyon the secure transmission of proprietary data over the Internet for some of this functionality.
31

Well-publicized compromises of Internet security could have the effect of substantially reducingconfidence in the Internet as a medium of data transmission. The occurrence or perception of securitybreaches in our demand response and energy management solutions or our customers’ concerns aboutInternet security or the security of our solutions, whether or not they are warranted, could have amaterial adverse effect on our business, harm our reputation, inhibit market acceptance of our demandresponse and energy management solutions and cause us to lose customers, any of which could have amaterial adverse effect on our financial condition and results of operations.
We may come into contact with sensitive consumer information or data when we performoperational, installation or maintenance functions for our customers. Even the perception that we haveimproperly handled sensitive, confidential information could have a negative effect on our business. If,in handling this information, we fail to comply with privacy or security laws, we could incur civil liabilityto government agencies, customers and individuals whose privacy is compromised. In addition, thirdparties may attempt to breach our security or inappropriately use our demand response and energymanagement solutions through computer viruses, electronic break-ins and other disruptions. If a breachis successful, confidential information may be improperly obtained, and we may be subject to lawsuitsand other liabilities.
We may require significant additional capital to pursue our growth strategy, but we may not be able to obtainadditional financing on acceptable terms or at all.
The growth of our business will depend on substantial amounts of additional capital for marketingand product development of our demand response and energy management solutions. Our capitalrequirements will depend on many factors, including the rate of our revenue growth, our introductionof new solutions and enhancements to existing solutions, and our expansion of sales and marketing andproduct development activities. In addition, we may consider strategic acquisitions of complementarybusinesses or technologies to grow our business, such as our acquisition of Mdenergy, LLC, or MDE,which could require significant capital and could increase our capital expenditures related to futureoperation of the acquired business or technology. Because of our losses, we do not fit traditional creditlending criteria. We may not be able to obtain loans or additional capital on acceptable terms or at all.Moreover, our current loan and security agreement contains restrictions on our ability to incuradditional indebtedness, which, if not waived, could prevent us from obtaining needed capital. Anyfuture credit facilities would likely contain similar restrictions. In the event additional funding isrequired, we may not be able to obtain bank credit arrangements or effect an equity or debt financingon terms acceptable to us or at all. A failure to obtain additional financing when needed couldadversely affect our ability to maintain and grow our business.
Our loan and security agreement contains financial and operating restrictions that may limit our access tocredit. If we fail to comply with covenants in our loan and security agreement, we may be required to repayour indebtedness thereunder, which may have an adverse effect on our liquidity.
Provisions in our senior loan and security agreement with Bluecrest Capital Partners, L.P., orBluecrest Capital, as assignee of Ritchie Capital Finance, L.L.C., impose restrictions on our ability to,among other things:
• incur more debt;
• pay dividends and make distributions;
• redeem or repurchase capital stock;
• create liens;
• enter into transactions with affiliates; and
• merge or consolidate.
32
Our loan and security agreement also contains other customary covenants. We may not be able tocomply with these covenants in the future. Our failure to comply with these covenants may result in thedeclaration of an event of default and could cause us to be unable to borrow under our loan andsecurity agreement with Bluecrest Capital. In addition to preventing additional borrowings under ourloan and security agreement, an event of default, if not cured or waived, may result in the accelerationof the maturity of indebtedness outstanding under the agreement, which would require us to pay allamounts outstanding. If an event of default occurs, we may not be able to cure it within any applicablecure period, if at all. If the maturity of our indebtedness is accelerated, we may not have sufficientfunds available for repayment or we may not have the ability to borrow or obtain sufficient funds toreplace the accelerated indebtedness on terms acceptable to us, or at all.
Our ability to use our net operating loss carryforwards may be subject to limitation.
Generally, a change of more than 50% in the ownership of a company’s stock, by value, over athree year period constitutes an ownership change for United States federal income tax purposes. Anownership change may limit a company’s ability to use its net operating loss carryforwards attributableto the period prior to such change. The number of shares of our common stock that we issued in ourIPO and follow-on public offering, together with any subsequent shares of stock we issue, may besufficient, taking into account prior or future shifts in our ownership over a three year period, to causeus to undergo an ownership change. As a result, if we earn net taxable income, our ability to use ourpre-change net operating loss carryforwards to offset United States federal taxable income may becomesubject to limitations, which could potentially result in increased future tax liability for us.
We may not be able to identify suitable acquisition candidates or complete acquisitions successfully, which mayinhibit our rate of growth, and acquisitions that we complete may expose us to a number of unanticipatedoperational and financial risks.
In addition to organic growth, we intend to continue to pursue growth through the acquisition ofcompanies or assets that may enable us to enhance our technology and capabilities, expand ourgeographic market, add experienced management personnel and increase our service offerings.However, we may be unable to implement this growth strategy if we cannot identify suitable acquisitioncandidates, reach agreement on potential acquisitions on acceptable terms, successfully integratepersonnel or assets that we acquire or for other reasons. Our acquisition efforts may involve certainrisks, including:
• we may have difficulty integrating operations and systems;
• key personnel and customers of the acquired company may terminate their relationships with theacquired company as a result of the acquisition;
• we may experience additional financial and accounting challenges and complexities in areas suchas tax planning and financial reporting;
• we may assume or be held liable for risks and liabilities (including for environmental-relatedcosts) as a result of our acquisitions, some of which we may not discover during our duediligence;
• we may incur significant additional operating expenses;
• our ongoing business may be disrupted or receive insufficient management attention; and
• we may not be able to realize the cost savings or other financial and operational benefits weanticipated.
The process of negotiating acquisitions and integrating acquired products, services, technologies,personnel or businesses might result in operating difficulties and expenditures and might require
33

significant management attention that would otherwise be available for ongoing development of ourbusiness, whether or not any such transaction is ever consummated. Moreover, we might never realizethe anticipated benefits of any acquisition. Future acquisitions could result in potentially dilutiveissuances of equity securities, the incurrence of debt, contingent liabilities, or impairment expensesrelated to goodwill, and impairment or amortization expenses related to other intangible assets, whichcould harm our financial condition. In addition, if we are unable to integrate any acquired businesses,products or technologies effectively, our business, financial condition and results of operations may bematerially adversely affected. In September 2007, we acquired MDE and there can be no assurancethat we will be able to successfully integrate it or any other companies, products or technologies thatwe acquire.
Our ability to provide bid bonds, performance bonds or letters of credit is limited and could negatively affectour ability to bid on or enter into significant long-term agreements.
We are occasionally required to provide bid bonds or performance bonds to secure ourperformance under long-term contracts with our grid operator and utility customers. In addition, someof our customers also require collateral in the form of letters of credit to secure performance or tofund possible damages or true-up payments as the result of a failure to make available capacity atagreed levels or an event of default under our contracts with them. Our ability to obtain such bondsand letters of credit primarily depends upon our capitalization, working capital, past performance,management expertise and reputation and external factors beyond our control, including the overallcapacity of the surety market. Surety companies consider those factors in relation to the amount of ourtangible net worth and other underwriting standards that may change from time to time. Events thataffect surety markets generally may result in bonding becoming more difficult to obtain in the future,or being available only at a significantly greater cost. As of December 31, 2007, we had $3.0 million ofletters of credit outstanding. In addition, in 2007, we posted collateral of $1.2 million and $10.9 millionfor PJM, the majority of which we expect to be returned to us in June 2008, and $1.8 million forISO-NE in connection with our open market bidding programs. Our inability to obtain adequatebonding or letters of credit and, as a result, to bid or enter into significant long-term agreements, couldhave a material adverse effect on our future revenues and business prospects. In addition, in the eventthat we default under long-term contracts with our grid operator and utility customers pursuant towhich we have posted collateral, we may lose a portion or all of such collateral, which could have amaterial adverse effect on our financial condition and results of operations.
If the software we use in providing our demand response and energy management solutions producesinaccurate information or is incompatible with the systems used by our customers, it could make us unable toprovide our solutions, which could lead to a loss of revenues and trigger penalty payments.
Our software is complex and, accordingly, may contain undetected errors or failures whenintroduced or subsequently modified. Software defects or inaccurate data may cause incorrectrecording, reporting or display of information about the level of demand reduction at a commercial,institutional and industrial customer location, which could cause us to fail to meet our commitments tohave capacity available. Any such failures could cause us to be subject to penalty payments to our gridoperator and utility customers or reduce revenue in the period the adjustment is identified and resultin reductions in capacity payments under contracts in subsequent periods. In addition, such defects andinaccurate data may prevent us from successfully providing our energy management solutions, whichwould result in lost revenues. Software defects or inaccurate data may lead to customer dissatisfactionand our customers may seek to hold us liable for any damages incurred. As a result, we could losecustomers, our reputation could be harmed and our financial condition and results of operations couldbe materially adversely affected.
We currently serve a commercial, institutional and industrial customer base that uses a wide varietyof constantly changing hardware, software applications and operating systems. Building control, process
34
control and metering systems frequently reside on non-standard operating systems. Our demandresponse and energy management solutions need to interface with these non-standard systems in orderto gather and assess data and to implement changes in electricity consumption. Our business dependson the following factors, among others:
• our ability to integrate our technology with new and existing hardware and software systems,including metering, building control, process control, and distributed generation systems;
• our ability to anticipate and support new standards, especially Internet-based standards andbuilding control and metering system protocol languages; and
• our ability to integrate additional software modules under development with our existingtechnology and operational processes.
If we are unable to adequately address any of these factors, our results of operations and prospectsfor growth and profitability could be materially adversely effected.
We may face certain product liability or warranty claims if we disrupt our customers’ networks orapplications.
For some of our current and planned solutions, our software and hardware is integrated with ourcustomers’ networks and software applications. The integration of our software and hardware mayentail the risk of product liability or warranty claims based on disruption to these networks orapplications. In addition, the failure of our software and hardware to perform to customer expectationscould give rise to warranty claims against us. Any of these claims, even if without merit, could result incostly litigation or divert management’s attention and resources. Although we carry general liabilityinsurance, our current insurance coverage could be insufficient to protect us from all liability that maybe imposed under these types of claims. A material product liability claim may seriously harm ourresults of operations.
Our investments in marketable securities are subject to market risks which may cause losses and affect theliquidity of these investments.
At December 31, 2007, we had approximately $70.2 million in cash and cash equivalents andapproximately $15.5 million in investments in marketable securities. Historically, our investments insecurities have included auction-rate securities and municipal bonds. Certain of these investments aresubject to general credit, liquidity, market and interest rate risks. During the year ended December 31,2007, we did not have any unrealized losses on any of our investments or marketable securities. Theremay be declines in the value of these investments, which we may determine to be other-than-temporary.These market risks associated with our investment portfolio may have an adverse effect on our results ofoperations, liquidity and financial condition.
At December 31, 2007, we had investments in AAA-rated auction-rate securities with various statestudent loan authorities of $5.6 million. At the time of our initial investment and up to March 28, 2008,all of the securities we have invested in are rated AAA, the highest rating issued by a rating agency.Auction-rate securities are long-term variable rate bonds tied to short-term interest rates and areclassified as current assets. After the initial issuance of the securities, the interest rate on the securitiesis reset periodically, at intervals established at the time of issuance (e.g., every seven, twenty-eight, orthirty-five days; every six months; etc.), based on market demand for a reset period. Auction-ratesecurities are bought and sold in the marketplace through a competitive bidding process often referredto as a ‘‘Dutch auction.’’ If there is insufficient interest in the securities at the time of an auction, theauction may not be completed and the rates may be reset to predetermined higher ‘‘penalty’’ or‘‘maximum’’ rates. Following such a failed auction, we would not be able to access our funds that areinvested in the corresponding auction-rate securities until a future auction of these investments issuccessful, new buyers express interest in purchasing these securities in between reset dates, issuers
35

establish a different form of financing to replace these securities or final payments become dueaccording to contractual maturities. Given the current negative liquidity conditions in the global creditmarkets, subsequent to December 31, 2007 and as of March 28, 2008, $3.9 million of auction-ratesecurities we held as of December 31, 2007 experienced failed auctions, and as a result our ability toliquidate our investment and fully recover the carrying value of our investment in the near term may belimited or not exist. If future auctions fail and we believe we will not hold the security to maturity, wemay in the future be required to record an impairment charge on these investments, which wouldreduce the value of the assets on our balance sheet and impact our future operating results. We maysimilarly be required to record impairment charges if the ratings on any of these securities are reducedor if any of the issuers default on their obligations. In addition to impairment charges, any of theseevents could cause us to lose part or all of our investment in these securities. Any of these events couldmaterially affect our results of operations and our financial condition. We currently believe thesesecurities are not impaired, primarily due to the AAA credit rating of the issuers and the governmentbacking of the loans made by the issuers; however, it could take until the final maturity of theunderlying notes (up to 30 years) to realize our investments’ recorded value. Based on our expectedsources of cash, we do not anticipate the potential lack of liquidity on these investments will affect ourability to execute our current business plan.
Risks Related to Our Common Stock
We expect our quarterly revenues and operating results to fluctuate. If we fail to meet the expectations ofmarket analysts or investors, the market price of our common stock could decline substantially.
Our quarterly revenues and operating results have fluctuated in the past and may vary fromquarter to quarter in the future. Accordingly, we believe that period-to-period comparisons of ourresults of operations may be misleading. The results of one quarter should not be used as an indicationof future performance. Our revenues and operating results may fall below the expectations of securitiesanalysts or investors in some future quarter or quarters. Our failure to meet these expectations couldcause the market price of our common stock to decline substantially.
Our quarterly revenues and operating results may vary depending on a number of factors,including:
• demand for and acceptance of our clean and intelligent energy solutions;
• delays in the implementation and delivery of our clean and intelligent energy solutions, whichmay impact the timing of our recognition of revenues;
• delays or reductions in spending for clean and intelligent energy solutions by our customers andpotential customers;
• the long lead time associated with securing new customer contracts;
• the structure of any forward capacity market in which we participate, which may impact thetiming of our recognition of revenues related to such market;
• the mix of our revenues during any period, particularly on a regional basis, since local paymentsfor demand response capacity tend to vary according to the level of available capacity in givenregions;
• the termination of existing contracts with grid operator and utility customers and commercial,institutional and industrial customers;
• the potential interruptions of our customers’ operations;
• development of new relationships and maintenance and enhancement of existing relationshipswith customers and strategic partners;
36

• the pricing terms of some long-term capacity contracts that provide for higher payments duringwarmer months and lower payments during the rest of the year;
• temporary capacity programs that could be implemented by grid operators and utilities toaddress short-term capacity deficiencies;
• changes in open market rules and pricing for demand response capacity; and
• increased expenditures for sales and marketing, software development and other corporateactivities.
We do not intend to pay dividends on our common stock.
We have not declared or paid any cash dividends on our common stock to date, and we do notanticipate paying any dividends on our common stock in the foreseeable future. We currently intend toretain all available funds and any future earnings for use in the development, operation and growth ofour business. In addition, our loan and security agreement prohibits us from paying dividends andfuture loan agreements may also prohibit the payment of dividends. Any future determination relatingto our dividend policy will be at the discretion of our board of directors and will depend on our resultsof operations, financial condition, capital requirements, business opportunities, contractual restrictionsand other factors deemed relevant. To the extent we do not pay dividends on our common stock,investors must look solely to stock appreciation for a return on their investment in our common stock.
Shares eligible for future sale may cause the market price for our common stock to decline even if ourbusiness is doing well.
Sales of substantial amounts of our common stock in the public market, or the perception thatthese sales may occur, could cause the market price of our common stock to decline. This could alsoimpair our ability to raise additional capital in the future through the sale of our equity securities.Under our certificate of incorporation, we are authorized to issue up to 50,000,000 shares of commonstock, of which 19,180,504 shares of common stock were outstanding at December 31, 2007. Of theseshares, the shares of common stock sold in our IPO and follow-on public offering are freelytransferable without restriction or further registration under the Securities Act by persons other than‘‘affiliates,’’ as that term is defined in Rule 144 under the Securities Act. In addition, substantially all ofour shares of outstanding common stock became freely tradable upon the termination of the lock-upagreements described below. Certain of our stockholders will be able to cause us to register commonstock that they own under the Securities Act pursuant to registration rights that are described in‘‘Certain Relationships and Related Transactions—Registration Rights’’ contained in our finalprospectus related to our follow-on public offering, which we filed with the SEC on November 14,2007. We also registered all shares of common stock that we may issue under our Amended andRestated 2003 Stock Option and Incentive Plan, or 2003 Stock Plan, and our 2007 Employee, Directorand Consultant Stock Plan, or 2007 Stock Plan.
Our executive officers and directors and most of our stockholders entered into lock-up agreementsin connection with our IPO and follow-on public offering, pursuant to which they agreed, subject tocertain exceptions and extensions, not to sell or transfer, directly or indirectly, any shares of ourcommon stock for a certain period of time from the date of our final prospectus related to each of ourIPO and follow-on public offering, both of which are on file with the SEC, or to exercise registrationrights during such period with respect to such shares. These lock-up periods expired in February 2008,and such persons are currently able to sell their shares and exercise registration rights to cause them tobe registered. We cannot predict the size of future issuances of our common stock or the effect, if any,that future sales and issuances of shares of our common stock, or the perception of such sales orissuances, would have on the market price of our common stock.
37

Provisions of our charter, bylaws, and Delaware law and of some of our employment arrangements may makean acquisition of us or a change in our management more difficult and could discourage acquisition bids ormerger proposals, which may adversely affect the market price of our common stock.
Certain provisions of our certificate of incorporation and bylaws could discourage, delay or preventa merger, acquisition or other change of control that stockholders may consider favorable, includingtransactions in which we may have otherwise received a premium on the shares. These provisions alsocould limit the price that investors might be willing to pay in the future for shares of our commonstock, thereby depressing the market price of our common stock. Stockholders who wish to participatein these transactions may not have the opportunity to do so. Furthermore, these provisions couldprevent or frustrate attempts by our stockholders to replace or remove our management. Theseprovisions:
• allow the authorized number of directors to be changed only by resolution of our board ofdirectors;
• require that vacancies on the board of directors, including newly-created directorships, be filledonly by a majority vote of directors then in office;
• establish a classified board of directors, providing that not all members of the board be electedat one time;
• authorize our board of directors to issue, without stockholder approval, blank check preferredstock that, if issued, could operate as a ‘‘poison pill’’ to dilute the stock ownership of a potentialhostile acquirer to prevent an acquisition that is not approved by our board of directors;
• require that stockholder actions must be effected at a duly called stockholder meeting andprohibit stockholder action by written consent;
• prohibit cumulative voting in the election of directors, which would otherwise allow holders ofless than a majority of stock to elect some directors;
• establish advance notice requirements for stockholder nominations to our board of directors orfor stockholder proposals that can be acted on at stockholder meetings;
• limit who may call stockholder meetings; and
• require the approval of the holders of 75% of the outstanding shares of our capital stockentitled to vote in order to amend certain provisions of our certificate of incorporation andbylaws.
Some of our employment arrangements and restricted stock and incentive stock option agreementsprovide for severance payments and accelerated vesting of benefits, including accelerated vesting ofrestricted stock and options, upon a change of control. These provisions may discourage or prevent achange of control.
In addition, because we are incorporated in Delaware, we are governed by the provisions ofSection 203 of the Delaware General Corporation Law, which may, unless certain criteria are met,prohibit large stockholders, in particular those owning 15% or more of our outstanding voting stock,from merging or combining with us for a proscribed period of time.
38
The requirements of being a public company, including compliance with the reporting requirements of theExchange Act and The Nasdaq Global Market, require significant resources, increase our costs and distractour management, and we may be unable to comply with these requirements in a timely or cost-effectivemanner.
As a public company with equity securities listed on The Nasdaq Global Market, we must complywith statutes and regulations of the SEC and requirements of The Nasdaq Global Market, with whichwe were not required to comply prior to the completion of our IPO in May 2007. Complying with thesestatutes, regulations and requirements occupies a significant amount of the time of our board ofdirectors and management and will significantly increases our costs and expenses.
In addition, as a public company we incur substantially higher costs to obtain director and officerliability insurance policies than we did as a private company. These factors could make it more difficultfor us to attract and retain qualified members of our board of directors, particularly to serve on ouraudit committee.
Our failure to maintain adequate internal control over financial reporting in accordance with Section 404 ofthe Sarbanes-Oxley Act of 2002 or prevent or detect material misstatements in our annual or interimconsolidated financial statements in the future could materially harm our business and cause our stock priceto decline.
As a public company, our internal control over financial reporting is required to comply with thestandards adopted by the Public Company Accounting Oversight Board in compliance with therequirements of Section 404 of the Sarbanes-Oxley Act of 2002. Accordingly, we are required todocument and test our internal controls and procedures to assess the effectiveness of our internalcontrol over financial reporting beginning in 2008. In addition, our independent registered publicaccounting firm is required to report on management’s assessment of the effectiveness of our internalcontrol over financial reporting and the effectiveness of our internal control over financial reporting in2008. If we are unable to maintain effective control over financial reporting, such conclusion would bedisclosed in our Annual Report on Form 10-K for the year ending December 31, 2008. In the future,we may identify material weaknesses and deficiencies which we may not be able to remediate in atimely manner. If we fail to maintain effective internal control over financial reporting in accordancewith Section 404, we will not be able to conclude that we have and maintain effective internal controlover financial reporting or our independent registered accounting firm may not be able to issue anunqualified report on the effectiveness of our internal control over financial reporting. As a result, ourability to report our financial results on a timely and accurate basis may be adversely affected, we maybe subject to sanctions or investigation by regulatory authorities, including the SEC or The NasdaqGlobal Market, and investors may lose confidence in our financial information, which in turn couldcause the market price of our common stock to decrease. We may also be required to restate ourfinancial statements from prior periods. In addition, testing and maintaining internal control inaccordance with Section 404 requires increased management time and resources. Any failure tomaintain effective internal control over financial reporting could impair the success of our business andharm our financial results, and you could lose all or a significant portion of your investment.
Insiders will continue to have substantial control over us, which could delay or prevent a change of corporatecontrol or result in the entrenchment of management and/or the board of directors.
As of December 31, 2007, our directors, executive officers and principal stockholders, together withtheir affiliates and related persons, beneficially owned, in the aggregate, approximately 55% of ouroutstanding common stock. As a result, these stockholders, if acting together, will continue to have theability to determine the outcome of matters submitted to our stockholders for approval, including theelection and removal of directors and any merger, consolidation or sale of all or substantially all of ourassets. In addition, these persons, if acting together, will have the ability to control the management
39
and affairs of our company. Accordingly, this concentration of ownership may harm the market price ofour common stock by:
• delaying, deferring or preventing a change of control;
• entrenching our management and/or the board of directors;
• impeding a merger, consolidation, takeover or other business combination involving us;
• discouraging a potential acquirer from making a tender offer or otherwise attempting to obtaincontrol of us; or
• causing us to enter into transactions or agreements that are not in the best interests of allstockholders.
In addition, Delaware law limits the protection afforded minority stockholders, and we do notintend to enact provisions that may be beneficial to minority holders, such as cumulative voting.
If securities or industry analysts do not publish research or publish inaccurate or unfavorable research aboutour business, our stock price and trading volume could decline.
The trading market for our common stock will continue to depend in part on the research andreports that securities or industry analysts publish about us or our business. If these analysts do notcontinue to provide adequate research coverage or if one or more of the analysts who covers usdowngrades our stock or publishes inaccurate or unfavorable research about our business, our stockprice would likely decline. If one or more of these analysts ceases coverage of our company or fails topublish reports on us regularly, demand for our stock could decrease, which could cause our stock priceand trading volume to decline.
Item 1B. Unresolved Staff Comments
Not applicable.
Item 2. Properties
Our corporate headquarters and principal office is located in Boston, Massachusetts, where weoccupy approximately 21,965 square feet under a sublease agreement expiring in June 2009 andapproximately 15,425 square feet under a lease agreement expiring in November 2008. We also occupy3,892 square feet in New York, New York under a sublease agreement expiring in September 2008. Inaddition, we lease space in various locations throughout the United States for local sales, marketing,and field operations personnel. We expect to add new facilities and/or expand existing facilities in thenear future as existing leases expire and we continue to add employees and operate in new geographicareas, and we believe that suitable space will be available as needed to accommodate any suchexpansion of our operations. We do not own any facilities.
Item 3. Legal Proceedings
We are subject to legal proceedings, claims and litigation arising in the ordinary course of business.We do not expect the ultimate costs to resolve these matters to have a material adverse effect on ourconsolidated financial position, results of operations or cash flows. In addition to ordinary-courselitigation, we are a party to the litigation described below.
In March 2008, three purported class action lawsuits were filed in the United States District Courtfor the District of Massachusetts against us, several of our officers and directors and certain of theunderwriters from our November 2007 follow-on public offering of our common stock. The plaintiffsclaim to represent those persons who purchased shares of our common stock from November 1, 2007
40

through February 27, 2008 and/or those persons who purchased shares of our common stock inconnection with our follow-on public offering. The plaintiffs allege, among other things, that thedefendants made false and misleading statements and failed to disclose material information in variousSEC filings, press releases and other public statements. The complaints allege various claims under theSecurities Act, the Exchange Act and Rule 10b-5 promulgated thereunder. The complaints seek, amongother relief, class certification, unspecified damages, fees and such other relief as the court may deemjust and proper.
We believe that we and the other defendants have substantial legal and factual defenses to theclaims and allegations contained in the complaints, and we will pursue these defenses vigorously. Therecan be no assurance, however, that we will be successful, and an adverse resolution of any of thelawsuits could have a material effect on our consolidated financial position and results of operations inthe period in which a lawsuit is resolved. In addition, although we carry insurance for these types ofclaims, a judgment significantly in excess of our insurance coverage could materially and adverselyaffect our financial condition, results of operations and cash flows. We are not presently able toreasonably estimate potential losses, if any, related to the lawsuits.
Item 4. Submission of Matters to a Vote of Security Holders
Not applicable.
41
PART II
Item 5. Market for Registrant’s Common Equity, Related Stockholder Matters and Issuer Purchasesof Equity Securities
Price Range of Our Common Stock
Our common stock has been listed on The Nasdaq Global Market under the symbol ‘‘ENOC’’since May 18, 2007. Prior to this time, there was no public market for our common stock. Thefollowing table sets forth the range of high and low sales prices per share as reported on The NasdaqGlobal Market since our IPO for the periods indicated.
Fiscal 2007 High Low
Second Quarter (beginning May 18, 2007) . . . . . . . . . . . . . . . . . . . $43.49 $30.16Third Quarter . . . . . . . . . . . . . . . . . . . . . . . . . . . . . . . . . . . . . . . $41.99 $29.09Fourth Quarter . . . . . . . . . . . . . . . . . . . . . . . . . . . . . . . . . . . . . . $50.50 $37.31
Stockholders
As of March 24, 2008, there were approximately 154 record holders of the 19,501,993 outstandingshares of our common stock. This number does not include stockholders for whom shares are held in a‘‘nominee’’ or ‘‘street’’ name.
Dividend Policy
We have never paid or declared any cash dividends on our common stock. We currently intend toretain all available funds and any future earnings to fund the development and expansion of ourbusiness, and we do not anticipate paying any cash dividends in the foreseeable future. Any futuredetermination to pay dividends will be at the discretion of our board of directors and will depend onour financial condition, results of operations, capital requirements, and other factors that our board ofdirectors deems relevant. The terms of our current loan and security agreement with Bluecrest Capitalpreclude us, and the terms of any future debt or credit facility may preclude us, from paying dividends.
Use of Proceeds
We registered shares of our common stock in connection with our IPO under the Securities Act.The registration statement on Form S-1 (File No. 333-140632) filed in connection with our IPO wasdeclared effective by the SEC on May 17, 2007. The offering commenced on May 17, 2007 and did notterminate before any securities were sold. As of the date of this filing, the offering has terminated.Including shares sold pursuant to the exercise by the underwriters of their over-allotment option,4,087,500 shares of our common stock were registered and sold in the IPO by us and an additional225,000 shares of common stock were registered and sold by the selling stockholders named in theregistration statement. All the shares were sold at a price to the public of $26.00 per share.
The managing underwriters of the offering were Credit Suisse Securities (USA) LLC and MorganStanley & Co. Incorporated. The net offering proceeds received by us, after deducting underwritingdiscounts and commissions and expenses incurred in connection with the offering, were approximately$95.2 million. These expenses consisted of direct payments of:
i. $7.4 million in underwriters discounts, fees and commissions; and
ii. $3.6 million in legal, accounting and printing fees and miscellaneous expenses.
No payments for such expenses were directly or indirectly to (i) any of our directors, officers or theirassociates, (ii) any person(s) owning 10% or more of any class of our equity securities or (iii) any ofour affiliates.
42
Through December 31, 2007, approximately $2.3 million of the proceeds from our IPO have beenused to fund the operations of our business and for general corporate purposes, approximately$5.2 million have been used to purchase and install equipment, approximately $650,000 have been usedto repay indebtedness and approximately $2.8 million have been used to fund acquisitions and makepayments outstanding on prior acquisitions. The remainder of the net proceeds from the IPO areinvested in short-term investment grade securities and money market accounts. There has been nomaterial change in the planned use of proceeds from our IPO as described in our final prospectus filedwith the SEC on May 18, 2007 pursuant to Rule 424(b).
Unregistered Sales of Securities
During the year ended December 31, 2007, we made the following issuances of securities whichwere not registered under the Securities Act:
• on January 5, 2007, we issued and sold 166,425 shares of Series C Convertible Preferred Stockto four accredited investors at a price of $55.28 per share, and these shares of convertiblepreferred stock were converted into shares of our common stock in connection with our IPO;
• on April 25, 2007, we made a one-time grant to our chief executive officer and our president ofa total of 104,392 shares of our common stock that had been held in treasury as of March 31,2007;
• on May 23, 2007, in connection with our IPO, we issued 26,447 shares of our common stock toBlueCrest Venture Finance Master Fund Limited upon the net exercise of warrants to purchaseshares of our common stock;
• on June 1, 2007, in connection with our 2005 acquisition of 100% of the membership interests ofPinpoint Power DR, LLC, we issued 65,951 shares of our common stock to Thomas E. Atkins.The shares of common stock issued to Mr. Atkins were valued at $0.35 per share;
• on September 13, 2007, we issued 66,921 shares of our common stock to each of LighthouseCapital Partners IV, L.P. and Lighthouse Capital Partners V, L.P. upon each entity’s net exerciseof warrants to purchase shares of our common stock; and
• on September 13, 2007, in connection with our acquisition of 100% of the membership interestsof Mdenergy, LLC, or MDE, we issued an aggregate of 139,056 shares of our common stock tothe holders of membership interests in MDE. The shares of common stock issued were valued at$34.17 per share.
These issuances of securities were made in reliance on an exemption from the registrationprovisions of the Securities Act set forth in Rule 506 of Regulation D promulgated thereunder. Therecipients of securities in each such transaction represented their intention to acquire the securities forinvestment only and not with a view to or for sale in connection with any distribution thereof andappropriate legends were affixed to the share certificates and other instruments issued in suchtransactions. The sales of these securities were made without general solicitation or advertising.
From January 2007 until June 2007, we granted options to employees, consultants and directors topurchase an aggregate of 662,614 shares of our common stock pursuant to our stock option plans, at aweighted average exercise price of $10.54 per share. In addition, we issued 198,488 shares of commonstock in connection with the exercise of outstanding options under our stock option plans by optionees,at a weighted exercise price of $0.33 per share. These option exercises resulted in aggregate proceedsto us of approximately $64,826. No underwriters were involved in the foregoing stock or optionissuances. The foregoing stock and option issuances were exempt from registration under the SecuritiesAct, either pursuant to Rule 701 under the Securities Act, as transactions pursuant to a compensatory
43

benefit plan, or pursuant to Section 4(2) under the Securities Act, as a transaction by an issuer notinvolving a public offering.
Equity Compensation Plan Information
The following table provides certain aggregate information with respect to all of our equitycompensation plans in effect as of December 31, 2007.
(a) (b) (c)
Number of Number ofsecurities to be securities remaining
issued upon Weighted-average available for futureexercise of exercise price of issuance under
outstanding outstanding equity compensationoptions, options, plans (excluding
warrants and warrants and securities reflectedPlan category rights rights in column (a))
Equity compensation plans approved by securityholders(1)(2) . . . . . . . . . . . . . . . . . . . . . . . . . . . . 3,037,114 $8.73 2,022,581
Equity compensation plans not approved by securityholders . . . . . . . . . . . . . . . . . . . . . . . . . . . . . . . . — — —
Total . . . . . . . . . . . . . . . . . . . . . . . . . . . . . . . . . . . 3,037,114 $8.73 2,022,581
(1) These plans consist of our Amended and Restated 2003 Stock Option and Incentive Plan and our2007 Employee, Director and Consultant Stock Plan, or the 2007 Stock Plan.
(2) Includes options to purchase 15,918 shares of our common stock issued under the 2007 Stock Planthat were cancelled after December 31, 2007.
44
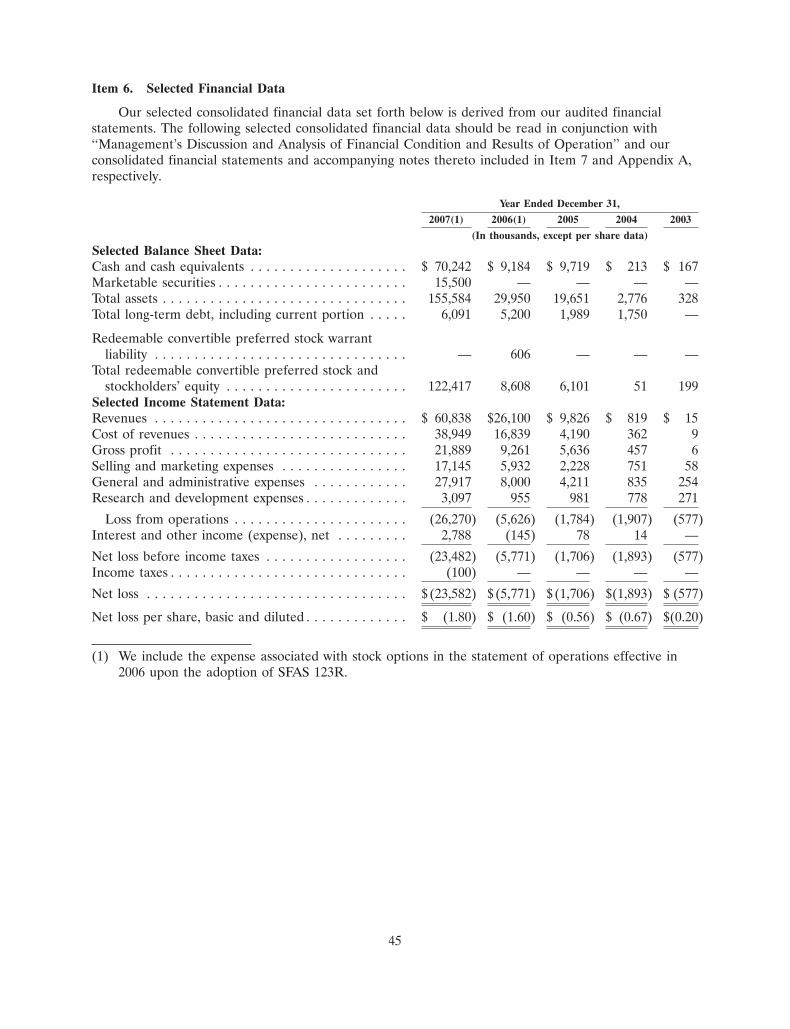
Item 6. Selected Financial Data
Our selected consolidated financial data set forth below is derived from our audited financialstatements. The following selected consolidated financial data should be read in conjunction with‘‘Management’s Discussion and Analysis of Financial Condition and Results of Operation’’ and ourconsolidated financial statements and accompanying notes thereto included in Item 7 and Appendix A,respectively.
Year Ended December 31,
2007(1) 2006(1) 2005 2004 2003
(In thousands, except per share data)
Selected Balance Sheet Data:Cash and cash equivalents . . . . . . . . . . . . . . . . . . . . $ 70,242 $ 9,184 $ 9,719 $ 213 $ 167Marketable securities . . . . . . . . . . . . . . . . . . . . . . . . 15,500 — — — —Total assets . . . . . . . . . . . . . . . . . . . . . . . . . . . . . . . 155,584 29,950 19,651 2,776 328Total long-term debt, including current portion . . . . . 6,091 5,200 1,989 1,750 —
Redeemable convertible preferred stock warrantliability . . . . . . . . . . . . . . . . . . . . . . . . . . . . . . . . — 606 — — —
Total redeemable convertible preferred stock andstockholders’ equity . . . . . . . . . . . . . . . . . . . . . . . 122,417 8,608 6,101 51 199
Selected Income Statement Data:Revenues . . . . . . . . . . . . . . . . . . . . . . . . . . . . . . . . $ 60,838 $26,100 $ 9,826 $ 819 $ 15Cost of revenues . . . . . . . . . . . . . . . . . . . . . . . . . . . 38,949 16,839 4,190 362 9Gross profit . . . . . . . . . . . . . . . . . . . . . . . . . . . . . . 21,889 9,261 5,636 457 6Selling and marketing expenses . . . . . . . . . . . . . . . . 17,145 5,932 2,228 751 58General and administrative expenses . . . . . . . . . . . . 27,917 8,000 4,211 835 254Research and development expenses . . . . . . . . . . . . . 3,097 955 981 778 271
Loss from operations . . . . . . . . . . . . . . . . . . . . . . (26,270) (5,626) (1,784) (1,907) (577)Interest and other income (expense), net . . . . . . . . . 2,788 (145) 78 14 —
Net loss before income taxes . . . . . . . . . . . . . . . . . . (23,482) (5,771) (1,706) (1,893) (577)Income taxes . . . . . . . . . . . . . . . . . . . . . . . . . . . . . . (100) — — — —
Net loss . . . . . . . . . . . . . . . . . . . . . . . . . . . . . . . . . $ (23,582) $(5,771) $(1,706) $(1,893) $ (577)
Net loss per share, basic and diluted . . . . . . . . . . . . . $ (1.80) $ (1.60) $ (0.56) $ (0.67) $(0.20)
(1) We include the expense associated with stock options in the statement of operations effective in2006 upon the adoption of SFAS 123R.
45
Item 7. Management’s Discussion and Analysis of Financial Condition and Results of Operations
You should read the following discussion and analysis of our financial condition and results ofoperations together with our ‘‘Selected Financial Data’’ and consolidated financial statements andaccompanying notes thereto included elsewhere in this Annual Report on Form 10-K. In addition to thehistorical information, the discussion contains certain forward-looking statements that involve risks anduncertainties. Our actual results could differ materially from those expressed or implied by the forward-looking statements due to applications of our critical accounting policies and factors including, but notlimited to, those set forth under the caption ‘‘Risk Factors’’ in Item 1A of Part I of this Annual Report onForm 10-K.
Overview
We are a leading developer and provider of clean and intelligent energy solutions. We use ourNetwork Operations Center, or NOC, to remotely manage and reduce electricity consumption across anetwork of commercial, institutional and industrial customer sites to enable a more information-basedand responsive, or intelligent, electric power grid. Our customers are electric power grid operators andutilities, as well as commercial, institutional and industrial end-users of electricity. Our demandresponse and energy management solutions help optimize the balance of electric supply and demandand create a lower risk and more environmentally sound alternative to building additional power plantsand transmission lines. Grid operators and utilities pay us a stream of recurring cash flows formanaging demand response capacity that we share with participating end-use customers. We receivemost of our revenues from grid operators and utilities and we make payments to end-users ofelectricity for both contracting to reduce electricity usage and actually doing so when called upon. Indoing so, we establish a base of installed users for an expanding portfolio of our technology-enabledenergy management solutions.
We operated as a New Hampshire limited liability company from December 2001 until June 2003,when we were incorporated in Delaware. From our incorporation in June 2003 through January 2007,we raised an aggregate of $28.1 million through the issuance of preferred stock in a series offinancings, the proceeds of which we invested in expanding our research and development organization,building our sales, marketing, operations and administration functions, and acquiring complementarybusinesses and technologies. Our customer base has grown from 19 commercial, institutional andindustrial customers with 70 sites in our network as of December 31, 2004 to 793 end-use customers forour demand response solutions with 2,189 sites in our demand response network as of December 31,2007. The demand response capacity we manage through our network has grown from 10 megawatts, orMW, as of December 31, 2004 to 1,112 MW as of December 31, 2007. Our revenues have grown from$0.8 million in 2004 to $60.8 million in 2007.
We continue to devote substantially all of our efforts toward the sale of our demand response andenergy management solutions. We have incurred cumulative net losses of $33.9 million from inceptionto December 31, 2007. Our net losses were $23.6 million, $5.8 million, and $1.7 million for the yearsended December 31, 2007, 2006 and 2005, respectively.
In November 2007, we successfully completed a follow-on public offering of 2,500,000 shares ofour common stock at a price of $43.00 per share, of which we sold 500,000 shares and sellingstockholders sold 2,000,000 shares. This transaction resulted in net proceeds to us of approximately$19.4 million.
In September 2007, we acquired all of the outstanding membership interests of Mdenergy, LLC, orMDE, an energy procurement service provider, for a total purchase price of approximately$11.6 million, of which approximately $6.5 million was paid in cash and the remainder of which waspaid by the issuance of 139,056 shares of our common stock. The acquisition of MDE enables us toapply leading energy market intelligence as well as an online reverse auction technology platform, now
46
called EnerNOC Exchange, to help commercial, institutional, and industrial customers make moreinformed commodity purchasing decisions. The MDE acquisition included the addition of over 400 newcommercial, institutional and industrial customers to whom we now provide energy managementsolutions. We intend to pursue opportunities to provide demand response solutions to a substantialnumber of these new customers.
In May 2007, we completed our initial public offering, or IPO, of 4,312,500 shares of commonstock at a price of $26.00 per share, which includes the exercise of the underwriters’ over-allotmentoption to purchase 562,500 shares and the sale of 225,000 shares by certain of our stockholders. Netproceeds to us from the offering were approximately $95.2 million, net of underwriting discounts andcommissions and offering expenses.
We made three other acquisitions through December 31, 2007. In June 2005, we acquired PinpointPower DR, the demand response business of Pinpoint Power LLC. This acquisition increased our baseof end-use customers and capacity under management in the New England region. To furtherstrengthen our technology platform, we acquired substantially all of the assets of eBidenergy, Inc. fromTrillium Capital Partners LLC in February 2006. In May 2006, we acquired certain of the assets ofCelerity Energy Partners LLC, a demand response provider for grid operators and utilities, including allof the membership interests in Celerity Energy Partners San Diego LLC. This acquisition increased ourbase of end-use customers and capacity under management in California.
Revenues and Expense Components
Revenues
We derive recurring revenues from the sale of our demand response and energy managementsolutions. Our revenues from our demand response solutions primarily consist of capacity and energypayments. In certain markets, we enter into long-term capacity contracts with grid operators andutilities, generally ranging from three to 10 years in duration, to deploy our demand response solutions.In addition, we derive revenues from demand response capacity that we make available in open marketprograms, which are open market bidding opportunities established by grid operators or utilities. Inthese open market programs, grid operators and utilities generally seek bids from companies such asours to provide demand response capacity based on prices offered in competitive bidding. Theseopportunities are generally characterized by flexible capacity commitments and prices that vary bymonth.
Where we have a long-term contract, we receive periodic capacity payments, which may varymonthly or seasonally, based upon enrolled capacity and predetermined payment rates. Where weoperate in open markets, our revenues from demand response capacity payments generally varymonth-to-month based upon our enrolled capacity and the market payment rate. Under both long-termcontracts and open market programs, we receive capacity payments regardless of whether we are calledupon to reduce demand for electricity from the electric power grid. At least once per year, wedemonstrate our capacity either through a demand response event or a measurement and verificationtest. This demonstrated capacity is typically used to calculate the continuing periodic capacity paymentsto be made to us until the next demand response event or test establishes a new demonstrated capacityamount. In most cases, we also receive an additional payment for the amount of energy usage that weactually curtail from the grid; we call this an energy payment. The energy payment is based upon theamount of energy usage that we actually reduce from the electricity grid in kilowatt hours during thedemand response event.
In accordance with Staff Accounting Bulletin No. 104, Revenue Recognition, or SAB No. 104, inall of our arrangements, we do not recognize any revenues until we can determine that persuasiveevidence of an arrangement exists, delivery has occurred, the fee is fixed or determinable, and we deemcollection to be probable. As program rules may differ for each contract and/or region where we
47

operate, we assess whether or not we have met the specific delivery requirements and defer revenues asnecessary. In accordance with SAB No. 104, we recognize demand response revenues when we haveprovided verification to the grid operator or utility of our ability to deliver the committed capacityunder the agreement. Committed capacity is verified through the results of an actual demand responseevent or a measurement and verification test. Once the capacity amount has been verified, the revenuesare recognized and future revenues become fixed or determinable and are recognized monthly until thenext verification event. In subsequent verification events, if our verified capacity is below the previouslyverified amount, the customer will reduce future payments based on the adjusted verified capacityamounts. The payments received from the customer can be decreased or increased, up to thecommitted capacity amounts under the agreement, in connection with subsequent verification events.Revenues recognized between demand response events or tests are not subject to customer refund.
As of December 31, 2007, we had 1,112 MW under management in our demand response network,meaning that we had entered into definitive contracts with respect to 1,112 MW of demand responsecapacity. In most of the markets in which we originally focused our growth, we generally begin earningrevenues from our MW under management within approximately one month from the date on whichwe ‘‘enable’’ such MW, or the date on which we can reduce such MW from the electricity grid if calledupon to do so. An exception is the PJM Interconnection, or PJM, forward capacity market, which is amarket in which we materially increased our participation during the first quarter of 2008 and in whichwe expect to continue to increase our participation and derive revenues. Because PJM operates on aJune to May delivery-year basis, a MW that we enable after June of each year may not begin earningrevenue until June of the following year. This results in a longer average lag time in our portfolio fromthe point in time when we consider a MW to be under management to when we earn revenues fromsuch MW. Of the 1,112 MW under management as of December 31, 2007, 82 were subject to this PJMlag, which means that those 82 MW will not begin generating revenue for us until June 2008, and 176MW were subject to our normal deployment queue, which means that those 176 MW will begin earningrevenue within approximately one month from enablement. As we approach June of each year, weexpect the number of MW subject to the PJM lag to increase.
Our energy management solutions include energy procurement services where we evaluate ourend-use customers’ energy purchasing needs and assist them in procuring more cost effective electricity.We receive a monthly fee from the competitive electricity provider based upon the actual consumptionof electricity used by our end-use customers. Demand response audits where we evaluate end-usecustomers’ energy utilization and operating flexibility to determine potential savings opportunities fromimplementing demand response, conserving energy and limiting peak demand. We receive a fee fromour electric grid operator and utility customers for each audit typically based upon a rate times theamount of kilowatts, or kW, we identify that can be reduced from the electric power grid. We also useour PowerTrak platform to deliver energy analytics and control and emissions tracking and tradingsupport. We generally receive either a subscription-based fee or a percentage savings fee for theseenergy management solutions. We have yet to earn substantial revenues from these energy managementsolutions.
A majority of our revenues have been generated from contracts with, and open market sales to,ISO-NE, a grid operator customer. This customer accounted for 60%, 65% and 86% of our totalrevenues in 2007, 2006 and 2005, respectively. Moreover, revenues from our three largest grid operatorand utility customers represented approximately 88%, 93% and 88% of our total revenues in 2007,2006 and 2005, respectively. A substantial portion of our revenues are derived from three fixed pricecontracts, two with ISO New England Inc., or ISO-NE, and one with Connecticut Light and PowerCompany, or CL&P. In 2007, 2006 and 2005, these contracts accounted for approximately 41%, 62%and 86%, respectively, of our total revenues. We anticipate that our dependence on these customerrelationships will decrease as we expand further into existing geographic markets and continue toextend our network to encompass new markets. Both fixed price contracts with ISO-NE expire in May
48
2008, and ISO-NE has notified us that it will not extend either contract beyond that date. The fixedprice contract with CL&P expires in December 2008. Although we entered into a new 170 MW fixedprice contract with CL&P in February 2008, which we expect will partially offset the impact of theexpiration of our existing fixed price contracts with ISO-NE and CL&P on our revenues, this newcontract is subject to approval by the Connecticut Department of Public Utility Control. There can beno assurance that such approval will be obtained or be issued on a timely basis, if at all. If we areunable to obtain such approval, other available program options will likely provide significantly lowercapacity payments than our existing fixed price contracts with ISO-NE and CL&P. For example, thecapacity payments available under ISO-NE’s Real-Time Demand Response program are significantlylower than the capacity payments available under our existing fixed price contracts with ISO-NE andCL&P.
Under our first contract with ISO-NE, which will terminate on May 31, 2008, we generated 13%and 25% of our 2007 and 2006 revenues, respectively, for services that we provided. Under thiscontract, we provide demand response capacity to ISO-NE from end-use customers who contract toreduce electricity consumption from the electric power grid on demand either by curtailing theirdemand for electricity or utilizing back-up generation instead of consuming electricity from the electricpower grid. The amount of demand response capacity that we are required to make available isreferred to as our committed capacity. Our level of committed capacity under this contract isapproximately 46 MW per month and we can provide and get paid for up to a maximum capacity of 51MW per month. We receive monthly payments from ISO-NE based upon our level of committedcapacity at the time of the payment and the then current dollar amount per MW under the contract.The amount that we are paid per MW of committed capacity fluctuates based on the month for whichpayment is made, with the amount per MW being higher during the summer months of June throughSeptember than during the months of January through May and October through December, which areknown as the shoulder months. Under the contract, we also receive an additional payment fromISO-NE each time we are called upon to reduce electricity consumption by end-use customers from theelectric power grid. These instances are known as demand response events. The amount of demandresponse capacity that we are able to deliver during a demand response event or to demonstrate theability to deliver during one of the periodic verification tests that are performed is referred to as ourdemonstrated capacity. If our demonstrated capacity is below our committed capacity during a demandresponse event or during a verification test, we are required to make penalty payments based on thedifference between our demonstrated and committed capacities. Additionally, the contract provides thatISO-NE may reduce our monthly committed capacity payments going forward until the next verificationtest or demand response event, at which time the payment may be readjusted based upon our newdemonstrated capacity. Under our other contract with ISO-NE, which will terminate on May 31, 2008,we generated 7% and 17% of our 2007 and 2006 revenues for services we provided. Under thiscontract, we provide demand response capacity to ISO-NE from end-use customers who contract toreduce electricity consumption from the electric power grid on demand either by curtailing theirdemand for electricity or utilizing back-up generation instead of consuming electricity from the electricpower grid. Our level of committed capacity under the contract increases over time, up to 30 MW permonth, and we can provide and get paid for up to a maximum capacity of 110% of our committedcapacity. We receive monthly payments from ISO-NE based upon our level of committed capacity atthe time of the payment and the then current dollar amount per MW under the contract. Under thecontract, we also received an additional payment from ISO-NE for demand response capacity that wedeliver during each demand response event. If our demonstrated capacity is below our committedcapacity during a demand response event or during a verification test, we are required to make penaltypayments based on the difference between our demonstrated and committed capacities. Additionally,the contract provides that ISO-NE may reduce our monthly committed capacity payments goingforward until the next test or demand response event, at which time the payment may be readjustedbased upon our new demonstrated capacity.
49

We entered into a contract in September 2007 with Southern California Edison Company, or SCE,relating to up to 160 MW of demand response capacity, which we amended in February 2008 to, amongother things, extend the date by which regulatory approval must be obtained. On March 13, 2008, theCalifornia Public Utilities Commission, or CPUC, issued an order denying approval of certain demandresponse contracts, including our 160 MW contract with SCE. Pursuant to the terms of the contractand as a result of the CPUC’s decision, this contract is expected to automatically terminate onApril 30, 2008. We have already entered into discussions with SCE regarding our intention to submitanother proposal to the CPUC related to this contract, and we are currently weighing our other optionswith respect to the CPUC’s decision. In the meantime, we will continue to provide demand responseservices under our original 40MW contract with SCE that we entered into in March 2007, which wasunaffected by the CPUC’s decision.
Cost of Revenues
Cost of revenues for our demand response solutions consists of payments that we make to ourcommercial, institutional and industrial customers for their participation in our demand responsenetwork. We generally enter into one to five year contracts with our end-use customers under which wedeliver recurring cash payments to them for the capacity they commit to make available on demand.We also generally make an additional payment when a customer reduces consumption of energy fromthe electric power grid. The equipment and installation costs for our devices at our commercial,institutional and industrial customer sites are capitalized and depreciated over the lesser of theremaining term of the contract, for fixed contracts, or the estimated useful life of the equipment andthis depreciation is also reflected in cost of revenues. We also include the monthly telecommunications/data costs we incur as a result of being connected to our commercial, institutional and industrial sites.Cost of revenues for energy management solutions include the wages and associated benefits that wepay to our project managers for the performance of those services.
Gross Profit
Gross profit consists of our total revenues less our cost of revenues. Our gross profit has been, andwill be, affected by many factors, including (a) the demand for our demand response and energymanagement solutions, (b) the selling price of our solutions, (c) our cost of revenues, (d) theintroduction of new clean and intelligent energy solutions and (e) our ability to open and enter newmarkets/regions and expand deeper into markets we already serve.
Operating Expenses
Operating expenses consist of selling and marketing, general and administrative, and research anddevelopment expenses. Personnel-related costs are the most significant component of each of theseexpense categories. We grew from eight employees at December 31, 2003 to 253 employees atDecember 31, 2007. We expect to continue to hire employees to support our growth for the foreseeablefuture. In addition, we incur significant up-front costs associated with the expansion of the number ofMW under our management, which we expect to continue for the foreseeable future. Although weexpect our overall operating expenses to increase in absolute dollar terms for the foreseeable future aswe grow our MW under management and further increase our headcount, we expect our overalloperating expenses to decrease as a percentage of total annual revenues as we leverage our existingemployee base and continue generating revenues from our MW under management.
Selling and Marketing
Selling and marketing expenses consist primarily of (a) salaries and related personnel costs,including costs associated with share-based payment awards, (b) commissions, (c) travel, lodging andother out-of-pocket expenses, (d) marketing programs such as trade shows, and (e) other related
50
overhead. Commissions are recorded as an expense when earned by the employee. We expect increasesin selling and marketing expenses in absolute dollar terms for the foreseeable future as we furtherincrease the number of sales professionals and, to a lesser extent, increase our marketing activities. Weexpect selling and marketing expenses to decrease as a percentage of total annual revenues as weleverage our current sales and marketing personnel.
General and Administrative
General and administrative expenses consist primarily of (a) salaries and related personnel costs,including costs associated with share-based payment awards, related to our executive, finance, humanresource, information technology and operations organizations, (b) facilities expenses, (c) accountingand legal professional fees, and (d) other related overhead. We expect general and administrativeexpenses to continue to increase in absolute dollar terms and as a percentage of total annual revenuesfor the foreseeable future as we invest in infrastructure to support continued growth and incuradditional expenses related to being a public company, including increased audit and legal professionalfees, costs of compliance with securities and other regulations, investor relations expenses, and higherinsurance premiums.
Research and Development
Research and development expenses consist primarily of (a) salaries and related personnel costs,including costs associated with share-based payment awards, related to our engineering organization,(b) payments to suppliers for design and consulting services, (c) costs relating to the design anddevelopment of new solutions and enhancement of existing solutions, (d) quality assurance and testing,and (e) other related overhead. During 2006 and through a portion of 2007, we capitalized internalsoftware and development costs of $1.5 million in accordance with SOP 98-1, Accounting for the Cost ofComputer Software Developed or Obtained for Internal Use, and the amount is included as software inproperty and equipment at December 31, 2007. We intend to continue to invest in our research anddevelopment efforts. We expect research and development expenses to increase in absolute dollar termsfor the foreseeable future and to decrease as a percentage of total revenues in the long term.
Stock-Based Compensation
Effective as of January 1, 2006, we adopted the requirements of Statement of Financial AccountingStandards (SFAS) No. 123R, Share Based Payment (SFAS No. 123(R)) using the modified prospectivemethod. SFAS No. 123(R) addresses all forms of share-based payment awards, including shares issuedunder employee stock purchase plans, stock options, restricted stock and stock appreciation rights.SFAS No. 123(R) requires us to expense share-based payment awards with compensation cost forshare-based payment transactions measured at fair value. Under our 2007 Employee, Director andConsultant Stock Plan, or the 2007 Plan, we offer performance based stock awards to certain membersof our sales team for meeting their quarterly and annual objectives. For the years ended December 31,2007, 2006 and 2005, we recorded expenses of approximately $7.6 million, $0.4 million and $1,000,respectively, in connection with share-based payment awards to employees and non-employees.Included in the year ended December 31, 2007 is $2.3 million in compensation expense associated witha grant that we made to our chief executive officer and president in April 2007. With respect to grantsthrough December 31, 2007, a future expense of non-vested options of approximately $21.8 million is tobe recognized over a weighted average period of 3.4 years and a future expense of restricted stockawards of approximately $1.5 million is to be recognized over a weighted average period of 3.5 years.
Interest and Other Income
Interest and other income consist primarily of interest income earned on cash balances and othernon-operating income. We historically have invested our cash in money market funds.
51
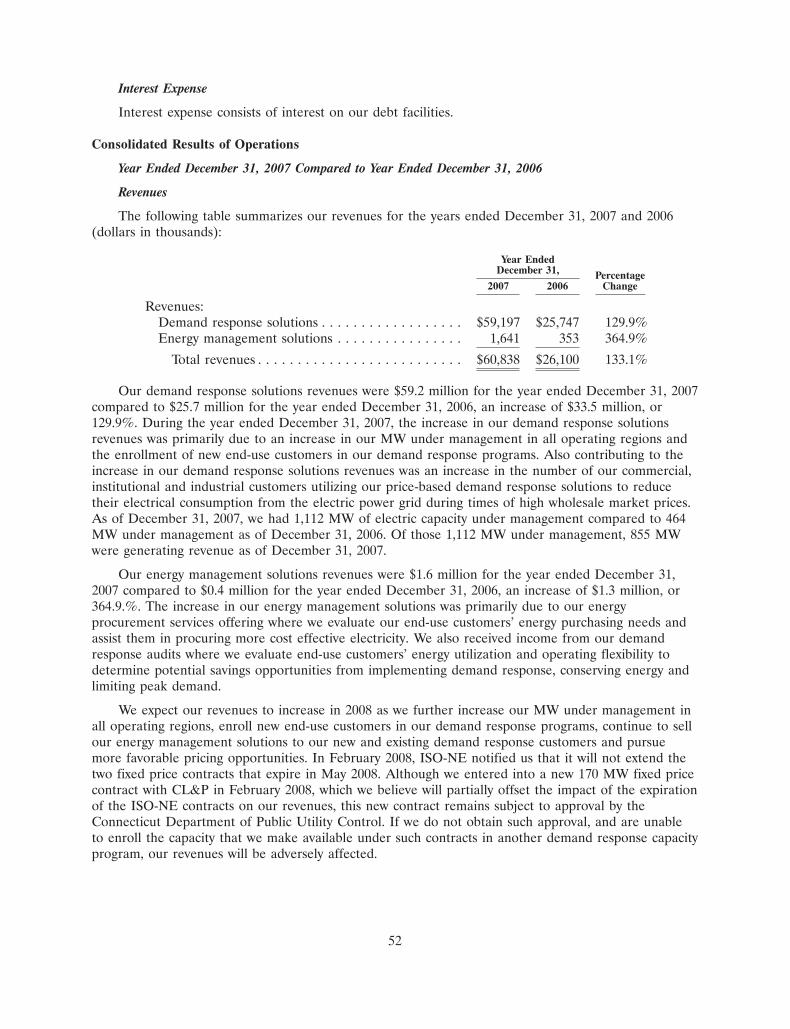
Interest Expense
Interest expense consists of interest on our debt facilities.
Consolidated Results of Operations
Year Ended December 31, 2007 Compared to Year Ended December 31, 2006
Revenues
The following table summarizes our revenues for the years ended December 31, 2007 and 2006(dollars in thousands):
Year EndedDecember 31, Percentage
2007 2006 Change
Revenues:Demand response solutions . . . . . . . . . . . . . . . . . . $59,197 $25,747 129.9%Energy management solutions . . . . . . . . . . . . . . . . 1,641 353 364.9%
Total revenues . . . . . . . . . . . . . . . . . . . . . . . . . . $60,838 $26,100 133.1%
Our demand response solutions revenues were $59.2 million for the year ended December 31, 2007compared to $25.7 million for the year ended December 31, 2006, an increase of $33.5 million, or129.9%. During the year ended December 31, 2007, the increase in our demand response solutionsrevenues was primarily due to an increase in our MW under management in all operating regions andthe enrollment of new end-use customers in our demand response programs. Also contributing to theincrease in our demand response solutions revenues was an increase in the number of our commercial,institutional and industrial customers utilizing our price-based demand response solutions to reducetheir electrical consumption from the electric power grid during times of high wholesale market prices.As of December 31, 2007, we had 1,112 MW of electric capacity under management compared to 464MW under management as of December 31, 2006. Of those 1,112 MW under management, 855 MWwere generating revenue as of December 31, 2007.
Our energy management solutions revenues were $1.6 million for the year ended December 31,2007 compared to $0.4 million for the year ended December 31, 2006, an increase of $1.3 million, or364.9.%. The increase in our energy management solutions was primarily due to our energyprocurement services offering where we evaluate our end-use customers’ energy purchasing needs andassist them in procuring more cost effective electricity. We also received income from our demandresponse audits where we evaluate end-use customers’ energy utilization and operating flexibility todetermine potential savings opportunities from implementing demand response, conserving energy andlimiting peak demand.
We expect our revenues to increase in 2008 as we further increase our MW under management inall operating regions, enroll new end-use customers in our demand response programs, continue to sellour energy management solutions to our new and existing demand response customers and pursuemore favorable pricing opportunities. In February 2008, ISO-NE notified us that it will not extend thetwo fixed price contracts that expire in May 2008. Although we entered into a new 170 MW fixed pricecontract with CL&P in February 2008, which we believe will partially offset the impact of the expirationof the ISO-NE contracts on our revenues, this new contract remains subject to approval by theConnecticut Department of Public Utility Control. If we do not obtain such approval, and are unableto enroll the capacity that we make available under such contracts in another demand response capacityprogram, our revenues will be adversely affected.
52
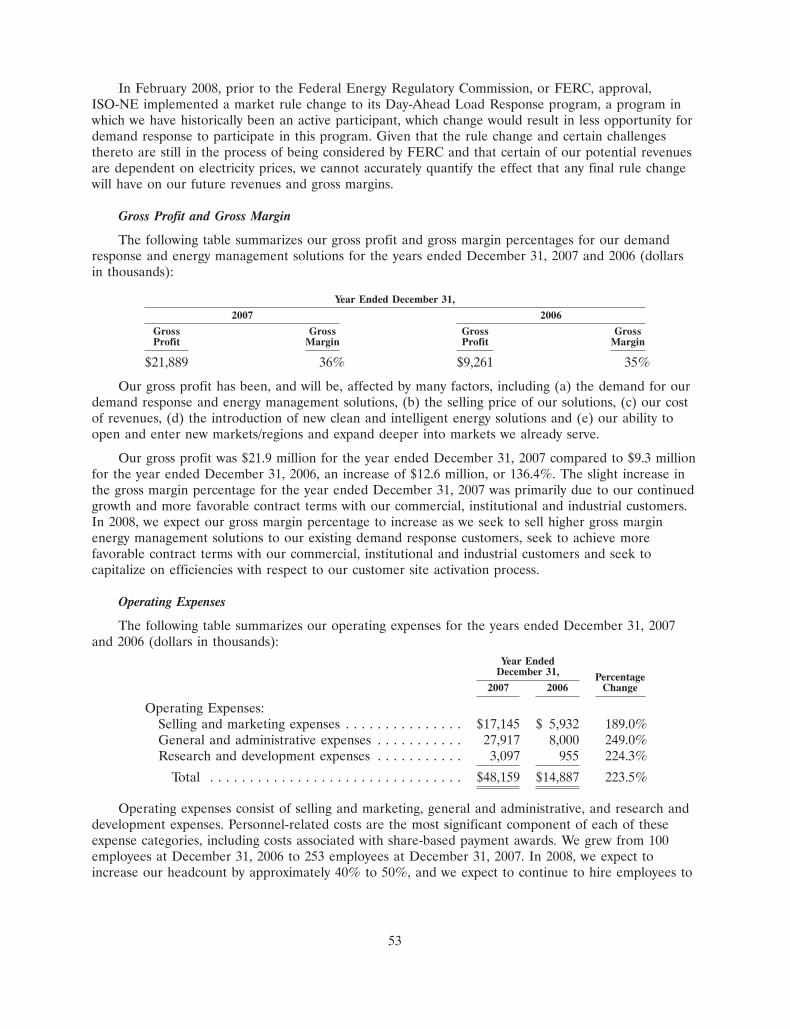
In February 2008, prior to the Federal Energy Regulatory Commission, or FERC, approval,ISO-NE implemented a market rule change to its Day-Ahead Load Response program, a program inwhich we have historically been an active participant, which change would result in less opportunity fordemand response to participate in this program. Given that the rule change and certain challengesthereto are still in the process of being considered by FERC and that certain of our potential revenuesare dependent on electricity prices, we cannot accurately quantify the effect that any final rule changewill have on our future revenues and gross margins.
Gross Profit and Gross Margin
The following table summarizes our gross profit and gross margin percentages for our demandresponse and energy management solutions for the years ended December 31, 2007 and 2006 (dollarsin thousands):
Year Ended December 31,
2007 2006
Gross Gross Gross GrossProfit Margin Profit Margin
$21,889 36% $9,261 35%
Our gross profit has been, and will be, affected by many factors, including (a) the demand for ourdemand response and energy management solutions, (b) the selling price of our solutions, (c) our costof revenues, (d) the introduction of new clean and intelligent energy solutions and (e) our ability toopen and enter new markets/regions and expand deeper into markets we already serve.
Our gross profit was $21.9 million for the year ended December 31, 2007 compared to $9.3 millionfor the year ended December 31, 2006, an increase of $12.6 million, or 136.4%. The slight increase inthe gross margin percentage for the year ended December 31, 2007 was primarily due to our continuedgrowth and more favorable contract terms with our commercial, institutional and industrial customers.In 2008, we expect our gross margin percentage to increase as we seek to sell higher gross marginenergy management solutions to our existing demand response customers, seek to achieve morefavorable contract terms with our commercial, institutional and industrial customers and seek tocapitalize on efficiencies with respect to our customer site activation process.
Operating Expenses
The following table summarizes our operating expenses for the years ended December 31, 2007and 2006 (dollars in thousands):
Year EndedDecember 31, Percentage
2007 2006 Change
Operating Expenses:Selling and marketing expenses . . . . . . . . . . . . . . . $17,145 $ 5,932 189.0%General and administrative expenses . . . . . . . . . . . 27,917 8,000 249.0%Research and development expenses . . . . . . . . . . . 3,097 955 224.3%
Total . . . . . . . . . . . . . . . . . . . . . . . . . . . . . . . . $48,159 $14,887 223.5%
Operating expenses consist of selling and marketing, general and administrative, and research anddevelopment expenses. Personnel-related costs are the most significant component of each of theseexpense categories, including costs associated with share-based payment awards. We grew from 100employees at December 31, 2006 to 253 employees at December 31, 2007. In 2008, we expect toincrease our headcount by approximately 40% to 50%, and we expect to continue to hire employees to
53

support our growth for the foreseeable future. In addition, we incur significant up-front costs associatedwith the expansion of the number of MW under our management, which we expect to continue for theforeseeable future. Although we expect our overall operating expenses to increase in absolute dollarterms for the foreseeable future as we grow our MW under management and further increase ourheadcount, we expect our overall operating expenses to decrease as a percentage of total annualrevenues as we leverage our existing employee base and continue generating revenues from our MWunder management.
In certain forward capacity markets in which we choose to participate, such as PJM, we mayenable our commercial, institutional and industrial customers up to twelve months in advance ofenrolling them in a particular program. This market feature creates a longer average lag time acrossour portfolio from the point in time when we consider a MW to be under management to when weearn revenues from such MW. Because we incur selling and marketing and operational expenses,including salaries and related personnel costs, at the time of enrollment, we believe there may be atrend of higher up-front costs than we have incurred historically.
Selling and Marketing Expenses
Selling and marketing expenses consist primarily of (a) salaries and related personnel costs,including costs associated with share-based payment awards, (b) commissions, (c) travel, lodging andother out-of-pocket expenses, (d) marketing programs such as trade shows, and (e) other relatedoverhead. Commissions are recorded as an expense when earned by the employee. We expect increasesin selling and marketing expenses in absolute dollar terms for the foreseeable future as we furtherincrease the number of sales professionals and, to a lesser extent, increase our marketing activities.
The increases in selling and marketing expenses were primarily driven by the costs associated withan increase in the number of selling and marketing employees from 41 at December 31, 2006 to 90 atDecember 31, 2007. Stock-based compensation expense related to selling and marketing employees forthe year ended December 31, 2007, increased from $0 to $2.2 million when compared to the sameperiod in 2006.
General and Administrative Expenses
General and administrative expenses consist primarily of (a) salaries and related personnel costs,including costs associated with share-based payment awards, related to our executive, finance, humanresource, information technology and operations organizations, (b) facilities expenses, (c) accountingand legal professional fees, and (d) other related overhead. We expect general and administrativeexpenses to continue to increase in absolute dollar terms for the foreseeable future as we invest ininfrastructure to support continued growth and incur additional expenses related to being a publiccompany, including increased audit and legal professional fees, costs of compliance with securities andother regulations, investor relations expenses, and higher insurance premiums.
The increases in general and administrative expenses were primarily due to costs associated withan increase in the number of general and administrative employees from 43 at December 31, 2006 to127 at December 31, 2007, as well as to greater costs associated with being a public company. Stock-based compensation expense related to general and administrative employees for the year endedDecember 31, 2007, increased from $0.4 million to $5.1 million, or $4.7 million when compared to thesame period in 2006. Included in the stock-based compensation during 2007 is $2.3 million related tostock granted to certain of our executives, which was recognized in full as compensation expense.
Research and Development Expenses
Research and development expenses consist primarily of (a) salaries and related personnel costs,including costs associated with share-based payment awards, related to our engineering organization,
54

(b) payments to suppliers for design and consulting services, (c) costs relating to the design anddevelopment of new solutions and enhancement of existing solutions, (d) quality assurance and testing,and (e) other related overhead. During 2006 and through a portion of 2007, we have capitalizedinternal software and development costs of $1.5 million in accordance with Statement of Position 98-1,Accounting for the Cost of Computer Software Developed or Obtained for Internal Use, and this amount isincluded as software in property and equipment at December 31, 2007. We intend to increase ourinvestment in research and development in absolute dollar terms for the foreseeable future.
The increase in research and development expenses from 2006 to 2007 was primarily due to costsassociated with an increase in the number of research and development employees from 16 atDecember 31, 2006 to 36 at December 31, 2007. Stock-based compensation expense related to researchand development employees for the year ended December 31, 2007 increased from $0 to $0.3 millionwhen compared to the same period in 2006. Expense increases for the year ended December 31, 2007were partially offset by capitalized internal software and development costs of $0.7 million.
Interest and Other Income (Expense), Net
Interest and other income (expense) consists primarily of interest income earned on cash balances.We historically have invested our cash in money market funds. Interest and other income (expense)includes interest expense on our debt facilities.
Net interest and other income was $2.8 million for the year ended December 31, 2007, comparedto net interest and other expense of $0.1 million for the year ended December 31, 2006.
The increase in interest and other income in the year ended December 31, 2007 as compared toDecember 31, 2006 was primarily due to interest income earned on the proceeds from our IPO andfollow-on public offering. In 2007, we invested in auction rate securities that yielded a higher rate ofreturn compared to the money market accounts we held at December 31, 2006. At December 31, 2007,we held approximately $5.6 million in AAA-rated auction rate securities. The majority of these auctionrate securities were student loan backed where the loans participate in the Federal Family EducationLoan Program and are ultimately re-insured by the US Department of Education.
The increase in interest expense for the year ended December 31, 2007 compared to the sameperiod in 2006 was primarily due to a higher average outstanding debt balance. In addition, for theyear ended December 31, 2007, we capitalized interest related to construction in progress projectstotaling approximately $0.7 million. During the same period in 2006, we capitalized interest of$0.1 million.
Income Taxes
We had a provision for income taxes of $0.1 million and $0 for the years ended December 31,2007 and 2006, respectively. The provision in 2007 relates to the non-deductibility of a portion of ourgoodwill. We provided a full valuation allowance for our deferred tax assets because the realization ofany future tax benefits could not be sufficiently assured as of December 31, 2007 or December 31,2006.
55
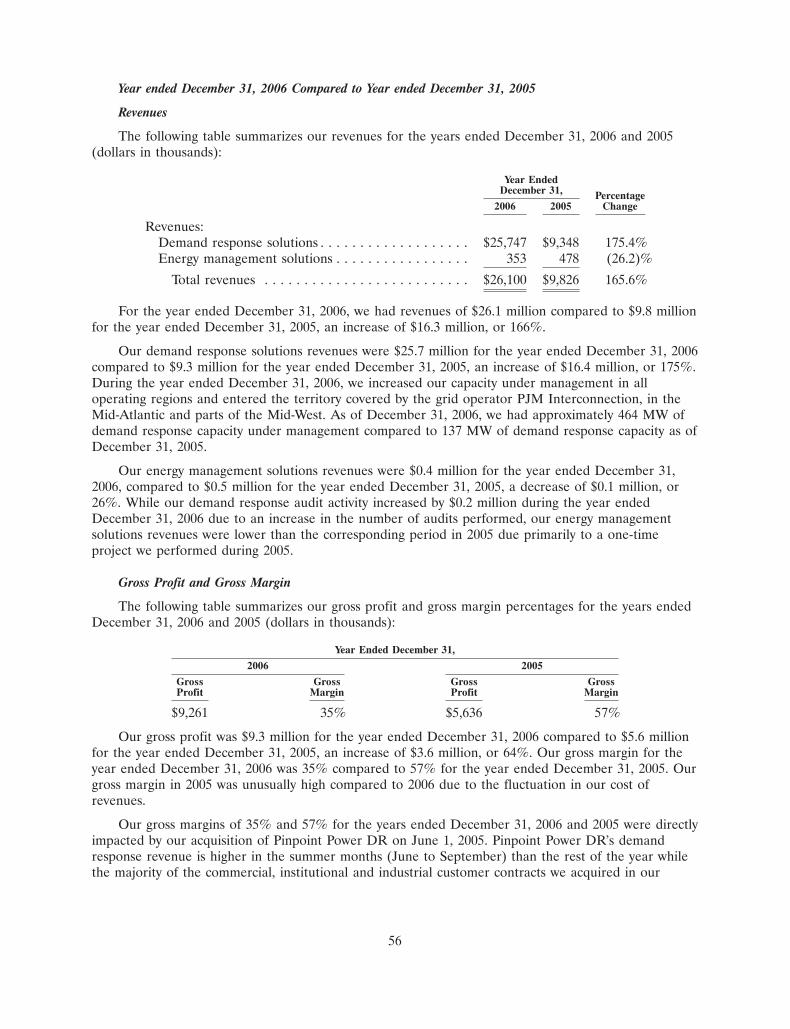
Year ended December 31, 2006 Compared to Year ended December 31, 2005
Revenues
The following table summarizes our revenues for the years ended December 31, 2006 and 2005(dollars in thousands):
Year EndedDecember 31, Percentage
2006 2005 Change
Revenues:Demand response solutions . . . . . . . . . . . . . . . . . . . $25,747 $9,348 175.4%Energy management solutions . . . . . . . . . . . . . . . . . 353 478 (26.2)%
Total revenues . . . . . . . . . . . . . . . . . . . . . . . . . . $26,100 $9,826 165.6%
For the year ended December 31, 2006, we had revenues of $26.1 million compared to $9.8 millionfor the year ended December 31, 2005, an increase of $16.3 million, or 166%.
Our demand response solutions revenues were $25.7 million for the year ended December 31, 2006compared to $9.3 million for the year ended December 31, 2005, an increase of $16.4 million, or 175%.During the year ended December 31, 2006, we increased our capacity under management in alloperating regions and entered the territory covered by the grid operator PJM Interconnection, in theMid-Atlantic and parts of the Mid-West. As of December 31, 2006, we had approximately 464 MW ofdemand response capacity under management compared to 137 MW of demand response capacity as ofDecember 31, 2005.
Our energy management solutions revenues were $0.4 million for the year ended December 31,2006, compared to $0.5 million for the year ended December 31, 2005, a decrease of $0.1 million, or26%. While our demand response audit activity increased by $0.2 million during the year endedDecember 31, 2006 due to an increase in the number of audits performed, our energy managementsolutions revenues were lower than the corresponding period in 2005 due primarily to a one-timeproject we performed during 2005.
Gross Profit and Gross Margin
The following table summarizes our gross profit and gross margin percentages for the years endedDecember 31, 2006 and 2005 (dollars in thousands):
Year Ended December 31,
2006 2005
Gross Gross Gross GrossProfit Margin Profit Margin
$9,261 35% $5,636 57%
Our gross profit was $9.3 million for the year ended December 31, 2006 compared to $5.6 millionfor the year ended December 31, 2005, an increase of $3.6 million, or 64%. Our gross margin for theyear ended December 31, 2006 was 35% compared to 57% for the year ended December 31, 2005. Ourgross margin in 2005 was unusually high compared to 2006 due to the fluctuation in our cost ofrevenues.
Our gross margins of 35% and 57% for the years ended December 31, 2006 and 2005 were directlyimpacted by our acquisition of Pinpoint Power DR on June 1, 2005. Pinpoint Power DR’s demandresponse revenue is higher in the summer months (June to September) than the rest of the year whilethe majority of the commercial, institutional and industrial customer contracts we acquired in our
56

acquisition of Pinpoint Power DR require us to make fixed payments to end-use customers rather thanvariable payments based upon a percentage of monthly revenue. Accordingly, gross margins associatedwith the Pinpoint Power DR demand response revenue are higher in June to September than the restof the year. Because we acquired Pinpoint Power DR in June 2005, our 2005 revenues included thehigher gross margin months and fewer of the lower gross margin months, which positively impacted ourgross margin in 2005. Excluding the impact of the acquisition of Pinpoint Power DR, our gross marginswould have been 36% and 51% for the years ended December 31, 2006 and 2005, respectively.
Our gross margin also fluctuates due to the amount of the payments we make to our commercial,institutional and industrial customers for their participation in our demand response network. Thepayments vary on a customer-by-customer basis primarily due to the following factors: (i) the amountof capacity in megawatts a particular commercial, institutional and industrial customer can reliablyreduce, (ii) whether a particular commercial, institutional and industrial customer contracts to receive afixed payment amount or a fluctuating payment based upon a percentage of the monthly paymentreceived from our grid operators and utility customers and (iii) the general characteristics of thedemand response opportunity such as the program term and number of hours that a customer may becalled upon to reduce their electricity consumption from the electric power grid.
For example, in December 2005, ISO New England Inc. implemented its temporary DemandResponse Winter Supplemental program, established in response to an anticipated shortage in naturalgas resulting from Hurricanes Katrina and Rita. The program ran from December 2005 through March2006. Due to the short-term nature of the program, we made payments to our commercial, institutionaland industrial customers for their participation that were higher than those we offer in most of ourlong term programs resulting in lower gross margins associated with the program. The associatedrevenues and costs of revenues were not recognized until 2006 and contributed to our lower grossmargins in 2006.
Operating Expenses
The following table summarizes our operating expenses for the years ended December 31, 2006and 2005 (dollars in thousands):
Year EndedDecember 31, Percentage
2006 2005 Change
Operating Expenses:Selling and marketing expenses . . . . . . . . . . . . . . . . $ 5,932 $2,228 166.3%General and administrative expenses . . . . . . . . . . . . 8,000 4,211 90.0%Research and development expenses . . . . . . . . . . . . 955 981 (2.7)%
Total . . . . . . . . . . . . . . . . . . . . . . . . . . . . . . . . . $14,887 $7,420 100.6%
Selling and Marketing Expenses
Selling and marketing expenses were $5.9 million for the year ended December 31, 2006 comparedto $2.2 million for the year ended December 31, 2005, an increase of $3.7 million, or 166%. Theincrease was primarily due to an increase of $2.4 million in employee-related costs as the number ofselling and marketing employees increased from 16 at December 31, 2005 to 41 at December 31, 2006.We also incurred an additional $1.3 million of external fees related to consulting, legal, marketing andresearch, public relations and other services to facilitate penetration into new markets and supportgrowth in existing markets. As discussed above under the caption ‘‘Revenues and ExpenseComponents—Operating Expenses,’’ we expect increases in selling and marketing expenses in absolute
57

dollar terms for the foreseeable future, though we expect those expenses to decrease as a percentage oftotal annual revenues.
General and Administrative Expenses
General and administrative expenses were $8.0 million for the year ended December 31, 2006compared to $4.2 million for the year ended December 31, 2005, an increase of $3.8 million, or 90%.The increase was primarily due to an increase of $2.0 million in employee-related costs as the numberof general and administrative employees increased from 20 at December 31, 2005 to 43 atDecember 31, 2006. The addition of larger office facilities and increases in professional fees and othergeneral expenses to support operations resulted in $0.6 million of additional expenses. Depreciationand amortization were also $1.2 million higher for the year ended December 31, 2006 compared to theyear ended December 31, 2005 due to our acquisitions of certain assets of Pinpoint Power DR,eBidenergy, Inc. and Celerity Energy Partners LLC. As discussed above under the caption ‘‘—Revenuesand Expense Components—Operating Expenses,’’ we expect general and administrative expenses tocontinue to increase in absolute dollar terms and as a percentage of total annual revenues for theforeseeable future.
Research and Development Expenses
Research and development expenses were $1.0 million for the year ended December 31, 2006 and2005. During 2006, an increase in the number of employees as of December 31, 2006 contributed to a$0.5 million increase in research and development expenses due primarily to increased compensationand benefits expenses. Higher operating expenses of $0.3 million to support our demand responseprograms contributed to the increase in research and development expenses. Both of these increaseswere offset by $0.8 million of capitalized internal software and development costs.
Interest and Other Income (Expense), Net
Net interest and other expense was $145,000 for the year ended December 31, 2006 compared tonet interest and other income of $78,000 for the year ended December 31, 2005, due to a decrease ininterest income of $124,000 related to lower average cash balances and an increase in interest expenseof $99,000 from higher average debt balances outstanding during the year ended December 31, 2006compared to the year ended December 31, 2005.
For the years ended December 31, 2006 and 2005, we capitalized interest expense of $127,000 and$0, respectively.
Income Taxes
No provision for income taxes was recorded for either the year ended December 31, 2006 orDecember 31, 2005. We provided a full valuation allowance for our deferred tax assets because therealization of any future tax benefits could not be sufficiently assured as of December 31, 2006 orDecember 31, 2005.
Liquidity and Capital Resources
Overview
In November 2007, we completed a follow-on public offering of 2,500,000 shares of our commonstock at a price of $43.00 per share. Of the 2,500,000 shares, we sold 500,000 shares and sellingstockholders sold 2,000,000 shares. This transaction resulted in net proceeds to us of approximately$19.4 million.
58

In May 2007, we completed our IPO of 4,312,500 shares of common stock at a price of $26.00 pershare, which includes the exercise of the underwriters’ over-allotment option to purchase 562,500 sharesand the sale of 225,000 shares by certain of our stockholders. Net proceeds to us from the offeringwere approximately $95.2 million. Prior to our IPO and follow-on offering, we primarily funded ouroperations through the issuance of an aggregate of $27.9 million in preferred stock and $7.5 million inborrowings under our loan and security agreement. We used these proceeds to fund our operations, todevelop our technology for our demand response programs, to open new markets and for acquisitions.
We had approximately $70.2 million in cash and cash equivalents as of December 31, 2007,compared to $9.2 million at December 31, 2006. In October 2007, we posted cash collateral of$10.9 million in connection with certain of our open market bidding commitments, the majority ofwhich we expect will be refunded to us in June 2008 once we enroll our committed capacity in acertain program. We believe that our existing cash and cash equivalents and marketable securities atDecember 31, 2007, our anticipated cash flows from operating activities and borrowings under our loanand security agreement will be sufficient to meet our anticipated cash needs, including investingactivities, for at least the next 24 months.
Our investments in securities include auction-rate securities, or ARS. The ARS we typically investin are AAA-rated government-backed securities with interest rates typically ranging from 6.5% to 6.8%that have approximate contractual maturities of at least 26 years. However, because of the short-termnature of our investment in these ARS, they have been classified as available-for-sale and included inshort-term investments on our consolidated balance sheet. Our holdings of ARS as of December 31,2007 and 2006 were $5.6 million and $0, respectively.
Subsequent to December 31, 2007, several of our ARS failed at auction; however, that did notimpact the valuation of our ARS as of December 31, 2007 because all of our holdings as of that datesucceeded in at least the first auction subsequent to year-end. As of March 28, 2008, we held$3.9 million worth of face amount auction rate securities, all of which have experienced a failed auctionand the status of which remains unchanged. As a result of these failed auctions, we have the potentialto benefit from a penalty feature in our interest rates, which allows us to earn an additional 5.1% to14.0% of interest on these ARS until the next auction is set to occur. All of our investments areAAA-rated government backed securities, backed by creditworthy financial institutions, and have theability to potentially be sold in a secondary market. Based on the underlying market conditions andliquidity of the capital markets, we will continue to reevaluate the appropriate valuation andclassification of these ARS throughout 2008.
We are contingently liable under unused letters of credit. Included in the December 31, 2007 andDecember 31, 2006 restricted cash balances are unused letters of credit in the amount of $3.0 millionand $0.5 million, respectively.
Cash Flows
The following table summarizes our cash flows for the years ended December 31, 2007, 2006 and2005 (dollars in thousands):
Year Ended December 31,
2007 2006 2005
Cash flows (used in) provided by operating activities . $ (7,163) $ (964) $2,498Cash flows used in investing activities . . . . . . . . . . . . (57,019) (10,453) (885)Cash flows provided by financing activities . . . . . . . . . 125,240 10,882 7,893
Increase (decrease) in cash and cash equivalents . . . . $ 61,058 $ (535) $9,506
59
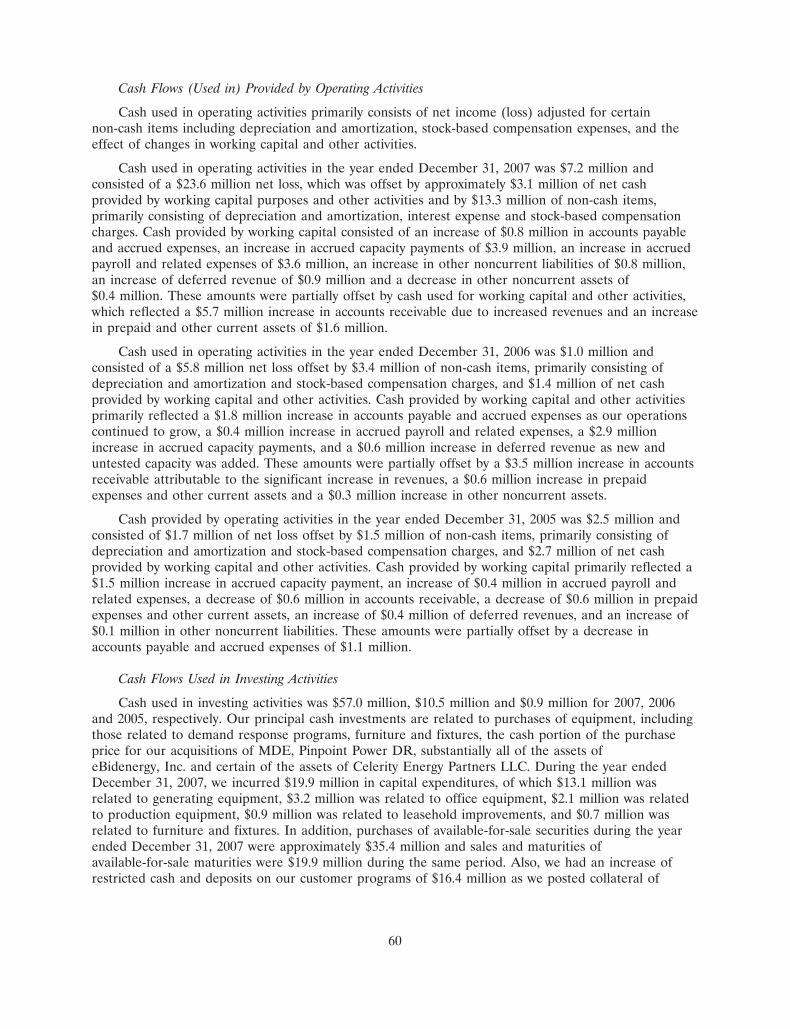
Cash Flows (Used in) Provided by Operating Activities
Cash used in operating activities primarily consists of net income (loss) adjusted for certainnon-cash items including depreciation and amortization, stock-based compensation expenses, and theeffect of changes in working capital and other activities.
Cash used in operating activities in the year ended December 31, 2007 was $7.2 million andconsisted of a $23.6 million net loss, which was offset by approximately $3.1 million of net cashprovided by working capital purposes and other activities and by $13.3 million of non-cash items,primarily consisting of depreciation and amortization, interest expense and stock-based compensationcharges. Cash provided by working capital consisted of an increase of $0.8 million in accounts payableand accrued expenses, an increase in accrued capacity payments of $3.9 million, an increase in accruedpayroll and related expenses of $3.6 million, an increase in other noncurrent liabilities of $0.8 million,an increase of deferred revenue of $0.9 million and a decrease in other noncurrent assets of$0.4 million. These amounts were partially offset by cash used for working capital and other activities,which reflected a $5.7 million increase in accounts receivable due to increased revenues and an increasein prepaid and other current assets of $1.6 million.
Cash used in operating activities in the year ended December 31, 2006 was $1.0 million andconsisted of a $5.8 million net loss offset by $3.4 million of non-cash items, primarily consisting ofdepreciation and amortization and stock-based compensation charges, and $1.4 million of net cashprovided by working capital and other activities. Cash provided by working capital and other activitiesprimarily reflected a $1.8 million increase in accounts payable and accrued expenses as our operationscontinued to grow, a $0.4 million increase in accrued payroll and related expenses, a $2.9 millionincrease in accrued capacity payments, and a $0.6 million increase in deferred revenue as new anduntested capacity was added. These amounts were partially offset by a $3.5 million increase in accountsreceivable attributable to the significant increase in revenues, a $0.6 million increase in prepaidexpenses and other current assets and a $0.3 million increase in other noncurrent assets.
Cash provided by operating activities in the year ended December 31, 2005 was $2.5 million andconsisted of $1.7 million of net loss offset by $1.5 million of non-cash items, primarily consisting ofdepreciation and amortization and stock-based compensation charges, and $2.7 million of net cashprovided by working capital and other activities. Cash provided by working capital primarily reflected a$1.5 million increase in accrued capacity payment, an increase of $0.4 million in accrued payroll andrelated expenses, a decrease of $0.6 million in accounts receivable, a decrease of $0.6 million in prepaidexpenses and other current assets, an increase of $0.4 million of deferred revenues, and an increase of$0.1 million in other noncurrent liabilities. These amounts were partially offset by a decrease inaccounts payable and accrued expenses of $1.1 million.
Cash Flows Used in Investing Activities
Cash used in investing activities was $57.0 million, $10.5 million and $0.9 million for 2007, 2006and 2005, respectively. Our principal cash investments are related to purchases of equipment, includingthose related to demand response programs, furniture and fixtures, the cash portion of the purchaseprice for our acquisitions of MDE, Pinpoint Power DR, substantially all of the assets ofeBidenergy, Inc. and certain of the assets of Celerity Energy Partners LLC. During the year endedDecember 31, 2007, we incurred $19.9 million in capital expenditures, of which $13.1 million wasrelated to generating equipment, $3.2 million was related to office equipment, $2.1 million was relatedto production equipment, $0.9 million was related to leasehold improvements, and $0.7 million wasrelated to furniture and fixtures. In addition, purchases of available-for-sale securities during the yearended December 31, 2007 were approximately $35.4 million and sales and maturities ofavailable-for-sale maturities were $19.9 million during the same period. Also, we had an increase ofrestricted cash and deposits on our customer programs of $16.4 million as we posted collateral of
60

$1.2 million and $10.9 million for PJM and $1.8 million for ISO-NE in connection with our openmarket bidding programs. In 2007, we made a payment of approximately $3.3 million and $1.9 millionin connection with our purchases of MDE and Pinpoint Power DR, respectively. During 2006, we madepayments of $3.0 million, $1.7 million and $27,000 for the purchase of certain all of the assets ofCelerity Energy Partners LLC, Pinpoint Power DR and substantially all of the assets ofeBidenergy, Inc., respectively. In addition, we incurred $5.0 million in capital expenditures forconstruction-in-progress, equipment, furniture and fixtures. During 2005 and in conjunction with ouracquisition of Pinpoint Power DR, we made payments of $1.6 million net of $1.2 million of cashacquired in the transaction, received payments of $1.1 million on related party notes receivable and wehad an additional $1.6 million in capital expenditures for equipment, furniture and fixtures.
Cash Flows Provided by Financing Activities
Cash flows provided by financing activities were $125.2 million, $10.9 million and $7.9 million forthe years 2007, 2006 and 2005, respectively. Cash flows provided by financing activities consisted of thefollowing:
Equity Financing Activities
In May 2007, we completed our IPO of 4,312,500 shares of common stock at a price of $26.00 pershare, which includes the exercise of the underwriters’ over-allotment option to purchase 562,500 sharesand the sale of 225,000 shares by certain of our stockholders. Net proceeds to us from the offeringwere approximately $95.2 million. In November 2007, we successfully completed our follow-on publicoffering of 2,500,000 shares of our common stock at a price of $43.00 per share. Of the 2,500,000shares, we sold 500,000 shares and selling stockholders sold 2,000,000 shares. This transaction resultedin net proceeds to us of approximately $19.4 million. In addition, we received approximately$0.2 million from exercises of stock options during both of the years ended December 31, 2007 andDecember 31, 2006, respectively.
In February 2007, we repurchased 104,392 shares of our common stock for $0.4 million.
We raised $5.0 million of proceeds through sales of a portion of our Series C ConvertiblePreferred Stock in December 2006. The remainder of the proceeds from the Series C ConvertiblePreferred Stock of $10.0 million was received in January 2007. We raised $2.6 million of net proceedsthrough sales of our Series B-1 Convertible Preferred Stock in May 2006. We raised $7.6 million of netproceeds through sales of our Series B Convertible Preferred Stock in January and September 2005.
Credit Facility Borrowings
In November 2006, we entered into a loan and security agreement with Ritchie Capital Finance,L.L.C, which has been assigned to Bluecrest Capital. We borrowed $5.0 million on November 20, 2006and used the proceeds to pay off our then outstanding loan from Lighthouse Capital Partners V, L.P.,or Lighthouse, in an amount of $1.5 million with the remainder for working capital purposes. The termloan portion of the facility allowed us to borrow up to an additional $2.5 million on or beforeMarch 31, 2007, which we borrowed on March 20, 2007 for working capital purposes.
During the years ended December 31, 2007, 2006 and 2005, we made $1.6 million, $2.0 million(including the $1.5 million payment on the Lighthouse loan) and $0.5 million, respectively, of scheduledprincipal payments under the loan and security agreement.
Capital Spending
We have made capital expenditures primarily for general corporate purposes to support our growthand for equipment installation related to our demand response programs. Our capital expenditures
61

totaled $20.0 million in 2007, $5.0 million in 2006, and $1.6 million in 2005. Under certain of ourcontracts, we are required to make capital expenditures of $4.0 million to $6.0 million related toenvironmental control facilities. Most of those expenditures were made in 2007 and will be made in thefirst half of 2008. We do not expect to make additional capital expenditures in connection with thosecontracts unless our capacity commitment is expanded under the contracts.
Contractual Obligations
Information regarding our significant contractual obligations of the types described below as ofDecember 31, 2007 is set forth in the following table (dollars in thousands):
Payments Due by Period
Less than More ThanContractual Obligations Total 1 Year 1-3 Years 3-5 Years 5 Years
Debt obligations, including interest . . . . . . . . . . . . $ 6,786 $2,979 $3,807 $ $ —Capital lease obligations . . . . . . . . . . . . . . . . . . . . 200 59 101 40 —Operating lease obligations . . . . . . . . . . . . . . . . . . 3,195 1,583 1,094 518 —Deferred acquisition payments resulting from
acquisition of Mdenergy . . . . . . . . . . . . . . . . . . 4,257 3,657 600 — —Deferred acquisition payments to related party
(cash and stock) . . . . . . . . . . . . . . . . . . . . . . . . 431 431 — — —
Total . . . . . . . . . . . . . . . . . . . . . . . . . . . . . . . . $14,869 $8,709 $5,602 $558 $ —
As of December 31, 2007, our debt obligations consisted of a $6.8 million loan from RitchieCapital Finance, L.L.C., which has been assigned to Bluecrest Capital. We used the proceeds to pay offour then outstanding loan from Lighthouse in an amount of $1.5 million and the rest for workingcapital purposes. The term loan portion of the facility had $2.5 million drawn down at December 31,2007, and the equipment loan portion of the facility allows us to borrow up to an additional$12.0 million. We are not aware of any events of default under this agreement.
Our capital lease obligations consist of computer equipment associated with our acquisition ofsubstantially all of the assets of eBidenergy, Inc. from Trillium Capital Partners LLC in February 2006and a telephone system we lease for which we have a bargain purchase option at the end of the fiveyear term.
Our operating lease obligations relate primarily to the lease of our corporate headquarters inBoston, Massachusetts, our offices in New York, New York, Rochester, New York, San Francisco,California and Meriden, Connecticut and other property and equipment.
On June 1, 2005, we acquired all the outstanding membership interests of Pinpoint Power DR forfixed payments of $5.9 million and were required to issue shares of our common stock valued at$0.3 million, the fair value at the date of the transaction. As of December 31, 2007, we had issued545,788 shares of our common stock and 44,260 additional shares of common stock will be issuedthrough 2008.
In addition to the amounts paid at closing, we were obligated to pay to the former holders ofMDE membership interests an earnout equal to two times the revenues of MDE’s business during theperiod from July 1, 2007 through December 31, 2007, such earnout to be payable in cash during thefirst quarter of 2008. The contingent consideration, in the amount of approximately $3.3 million relatedto the earnout was paid in January of 2008 and was recorded as additional purchase price.
Pursuant to the merger agreement, we are also obligated to pay to certain employees of MDE acash bonus payment of up to $0.3 million in the first quarter of 2008 and up to $0.6 million in the firstquarter of 2009 upon the achievement of certain revenue-based milestones during 2007 and 2008,
62
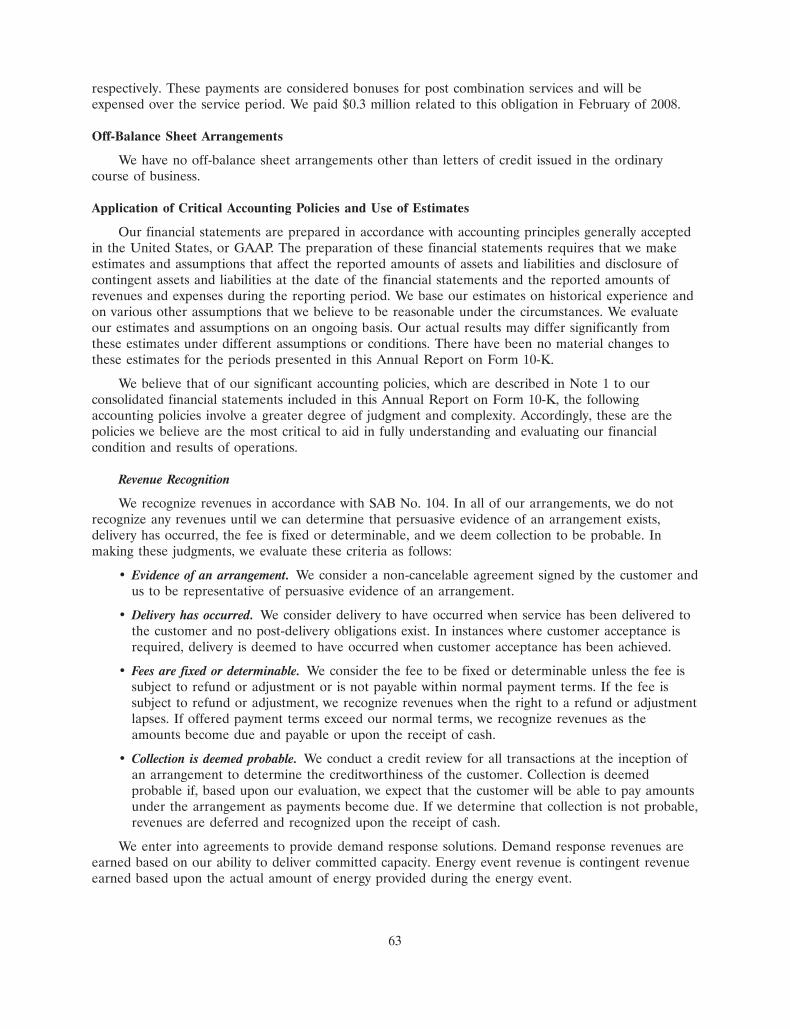
respectively. These payments are considered bonuses for post combination services and will beexpensed over the service period. We paid $0.3 million related to this obligation in February of 2008.
Off-Balance Sheet Arrangements
We have no off-balance sheet arrangements other than letters of credit issued in the ordinarycourse of business.
Application of Critical Accounting Policies and Use of Estimates
Our financial statements are prepared in accordance with accounting principles generally acceptedin the United States, or GAAP. The preparation of these financial statements requires that we makeestimates and assumptions that affect the reported amounts of assets and liabilities and disclosure ofcontingent assets and liabilities at the date of the financial statements and the reported amounts ofrevenues and expenses during the reporting period. We base our estimates on historical experience andon various other assumptions that we believe to be reasonable under the circumstances. We evaluateour estimates and assumptions on an ongoing basis. Our actual results may differ significantly fromthese estimates under different assumptions or conditions. There have been no material changes tothese estimates for the periods presented in this Annual Report on Form 10-K.
We believe that of our significant accounting policies, which are described in Note 1 to ourconsolidated financial statements included in this Annual Report on Form 10-K, the followingaccounting policies involve a greater degree of judgment and complexity. Accordingly, these are thepolicies we believe are the most critical to aid in fully understanding and evaluating our financialcondition and results of operations.
Revenue Recognition
We recognize revenues in accordance with SAB No. 104. In all of our arrangements, we do notrecognize any revenues until we can determine that persuasive evidence of an arrangement exists,delivery has occurred, the fee is fixed or determinable, and we deem collection to be probable. Inmaking these judgments, we evaluate these criteria as follows:
• Evidence of an arrangement. We consider a non-cancelable agreement signed by the customer andus to be representative of persuasive evidence of an arrangement.
• Delivery has occurred. We consider delivery to have occurred when service has been delivered tothe customer and no post-delivery obligations exist. In instances where customer acceptance isrequired, delivery is deemed to have occurred when customer acceptance has been achieved.
• Fees are fixed or determinable. We consider the fee to be fixed or determinable unless the fee issubject to refund or adjustment or is not payable within normal payment terms. If the fee issubject to refund or adjustment, we recognize revenues when the right to a refund or adjustmentlapses. If offered payment terms exceed our normal terms, we recognize revenues as theamounts become due and payable or upon the receipt of cash.
• Collection is deemed probable. We conduct a credit review for all transactions at the inception ofan arrangement to determine the creditworthiness of the customer. Collection is deemedprobable if, based upon our evaluation, we expect that the customer will be able to pay amountsunder the arrangement as payments become due. If we determine that collection is not probable,revenues are deferred and recognized upon the receipt of cash.
We enter into agreements to provide demand response solutions. Demand response revenues areearned based on our ability to deliver committed capacity. Energy event revenue is contingent revenueearned based upon the actual amount of energy provided during the energy event.
63

In accordance with SAB No. 104, we recognize demand response revenue when we have providedverification to the grid operator or utility of our ability to deliver the committed capacity under theagreement which entitles us to payments under the contract. Committed capacity is verified through theresults of an actual demand response event or a measurement and verification test. Once the capacityamount has been verified, the revenue is recognized and future revenue becomes fixed or determinableand is recognized monthly until the next demand response event or test. In subsequent verificationevents, if our verified capacity is below the previously verified amount, the customer will reduce futurepayments based on the adjusted verified capacity amounts. The payments received from the customercan be decreased or increased, up to the committed capacity amounts under the agreement, inconnection with subsequent verification events. Ongoing demand response revenue recognized betweendemand response events or tests that are not subject to penalty or customer refund are recognized inrevenue. If the revenue is subject to refund, the revenue is deferred until the liability is resolved.
In certain contracts, we receive both non refundable up-front payments for set up fees andmonthly demand response fees. These up-front payments are deferred and recognized on a straight-linebasis over the estimated customer life as a component of demand response revenue. The costs incurredfor the customer set up are capitalized and included in property and equipment as demand responseequipment.
Revenue from energy events is recognized when earned. Energy event revenue is deemed to besubstantive and represents the culmination of a separate earnings process and is recognized when theenergy event is initiated by the customer.
As described above, customer contracts may include performance guarantees. We do not recognizeany revenue prior to the successful completion of the performance requirement.
Allowance for Doubtful Accounts
The allowance for doubtful accounts is our best estimate of the amount of probable credit losses inour existing accounts receivable. We review our allowance for doubtful accounts on a regular basis, andall past due balances are reviewed individually for collectability. Account balances are charged againstthe allowance after all means of collection have been exhausted and the potential for recovery isconsidered remote. Provisions for allowance for doubtful accounts are recorded in general andadministrative expense. If our historical collection experience does not reflect our future ability tocollect outstanding accounts receivables, our future provision for doubtful accounts could be materiallyaffected. To date, we have not incurred any significant write-offs of accounts receivable and have notbeen required to revise any of our assumptions or estimates used in determining our allowance fordoubtful accounts. As of December 31, 2007, the allowance for doubtful accounts was $368,000.
Impairment of Long-Lived Assets
Long-lived assets, such as property and equipment, goodwill and intangible assets, are reviewed forimpairment at least annually or whenever events or changes in circumstances indicate that the carryingamount of an asset may not be recoverable. All of our identifiable intangible assets are amortized usingthe straight-line method over their estimated useful lives. We use estimates in determining the value ofgoodwill and intangible assets, including estimates of useful lives of intangible assets, discounted futurecash flows and fair values of the related operations. We intend to test goodwill for impairment eachyear, under the guidance of SFAS No. 142, Goodwill and Other Intangible Assets. To date, we have notrecorded any impairment charges on these long-lived assets.
Stock-Based Compensation
Through December 31, 2005, we accounted for our stock-based awards to employees using theintrinsic value method prescribed in Accounting Principles Board (APB) Opinion No. 25, Accounting
64
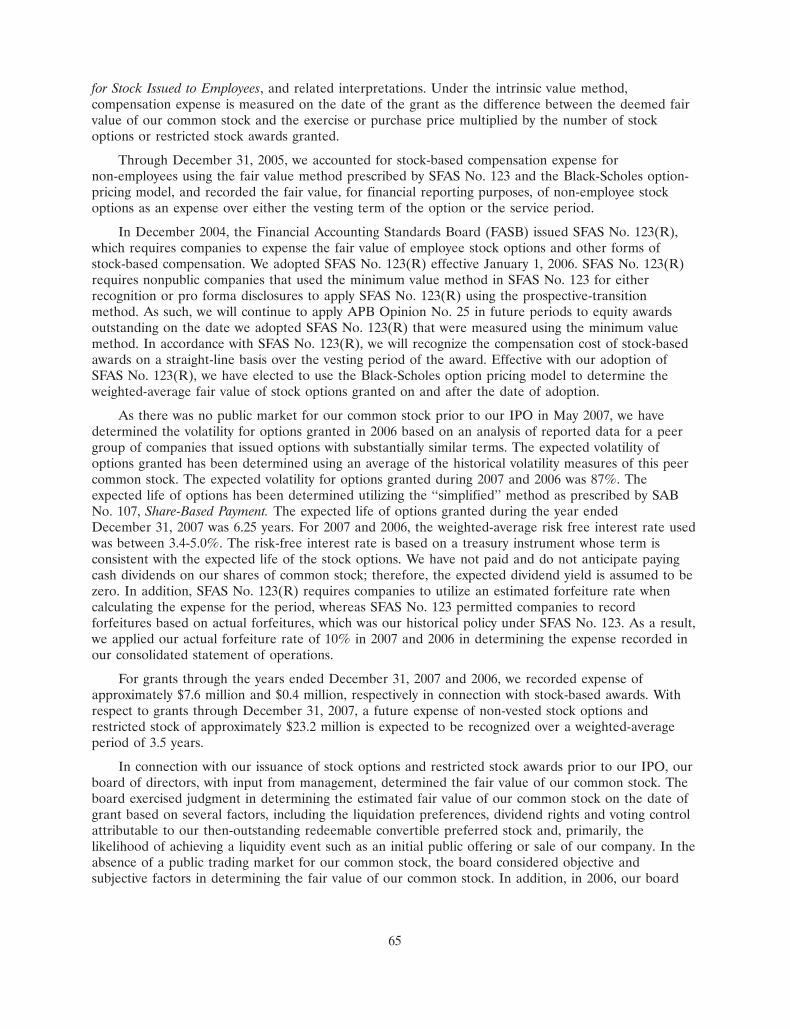
for Stock Issued to Employees, and related interpretations. Under the intrinsic value method,compensation expense is measured on the date of the grant as the difference between the deemed fairvalue of our common stock and the exercise or purchase price multiplied by the number of stockoptions or restricted stock awards granted.
Through December 31, 2005, we accounted for stock-based compensation expense fornon-employees using the fair value method prescribed by SFAS No. 123 and the Black-Scholes option-pricing model, and recorded the fair value, for financial reporting purposes, of non-employee stockoptions as an expense over either the vesting term of the option or the service period.
In December 2004, the Financial Accounting Standards Board (FASB) issued SFAS No. 123(R),which requires companies to expense the fair value of employee stock options and other forms ofstock-based compensation. We adopted SFAS No. 123(R) effective January 1, 2006. SFAS No. 123(R)requires nonpublic companies that used the minimum value method in SFAS No. 123 for eitherrecognition or pro forma disclosures to apply SFAS No. 123(R) using the prospective-transitionmethod. As such, we will continue to apply APB Opinion No. 25 in future periods to equity awardsoutstanding on the date we adopted SFAS No. 123(R) that were measured using the minimum valuemethod. In accordance with SFAS No. 123(R), we will recognize the compensation cost of stock-basedawards on a straight-line basis over the vesting period of the award. Effective with our adoption ofSFAS No. 123(R), we have elected to use the Black-Scholes option pricing model to determine theweighted-average fair value of stock options granted on and after the date of adoption.
As there was no public market for our common stock prior to our IPO in May 2007, we havedetermined the volatility for options granted in 2006 based on an analysis of reported data for a peergroup of companies that issued options with substantially similar terms. The expected volatility ofoptions granted has been determined using an average of the historical volatility measures of this peercommon stock. The expected volatility for options granted during 2007 and 2006 was 87%. Theexpected life of options has been determined utilizing the ‘‘simplified’’ method as prescribed by SABNo. 107, Share-Based Payment. The expected life of options granted during the year endedDecember 31, 2007 was 6.25 years. For 2007 and 2006, the weighted-average risk free interest rate usedwas between 3.4-5.0%. The risk-free interest rate is based on a treasury instrument whose term isconsistent with the expected life of the stock options. We have not paid and do not anticipate payingcash dividends on our shares of common stock; therefore, the expected dividend yield is assumed to bezero. In addition, SFAS No. 123(R) requires companies to utilize an estimated forfeiture rate whencalculating the expense for the period, whereas SFAS No. 123 permitted companies to recordforfeitures based on actual forfeitures, which was our historical policy under SFAS No. 123. As a result,we applied our actual forfeiture rate of 10% in 2007 and 2006 in determining the expense recorded inour consolidated statement of operations.
For grants through the years ended December 31, 2007 and 2006, we recorded expense ofapproximately $7.6 million and $0.4 million, respectively in connection with stock-based awards. Withrespect to grants through December 31, 2007, a future expense of non-vested stock options andrestricted stock of approximately $23.2 million is expected to be recognized over a weighted-averageperiod of 3.5 years.
In connection with our issuance of stock options and restricted stock awards prior to our IPO, ourboard of directors, with input from management, determined the fair value of our common stock. Theboard exercised judgment in determining the estimated fair value of our common stock on the date ofgrant based on several factors, including the liquidation preferences, dividend rights and voting controlattributable to our then-outstanding redeemable convertible preferred stock and, primarily, thelikelihood of achieving a liquidity event such as an initial public offering or sale of our company. In theabsence of a public trading market for our common stock, the board considered objective andsubjective factors in determining the fair value of our common stock. In addition, in 2006, our board
65
engaged an unrelated third-party valuation specialist, that we refer to as the valuation specialist, toassist management in preparing valuation reports for stock options and restricted stock awards grantedby the board. Based upon our internal peer company analyses and based on several arm’s-lengthtransactions involving our common stock supportive of the results produced by this valuationmethodology, we believe the methodology used was reasonable.
In connection with the preparation of our financial statements for the years ended December 31,2007 and in preparing for our IPO, we examined the valuations of our common stock during thoseperiods, in light of the Practice Aid of the American Institute of Certified Public Accountants entitledValuation of Privately-Held-Company Equity Securities Issued as Compensation, or the Practice Aid. InMarch 2006, we engaged the valuation specialist to provide a contemporaneous appraisal of the fairvalue of our common stock as of March 31, 2006. The resulting report provides the valuationspecialist’s opinion that the fair value of our common stock was approximately $0.51 as of March 31,2006. We believe that the valuation methodologies that we used prior to our IPO were consistent withthe Practice Aid.
During 2007, 2006, 2005, 2004 and 2003 we granted stock options and restricted stock awards toemployees to purchase a total of 4,711,417 shares of common stock at exercise or purchase pricesranging from $0.00 to $48.54 per share.
From our inception through December 31, 2002, we were considered a development stagecompany. We did not recognize any revenue during this period and incurred cumulative operatinglosses of $25,000. During 2003, we recognized revenue of $15,000 and incurred an operating loss of$0.6 million. During 2003 we granted stock options and restricted stock awards to purchase shares ofour common stock at an exercise or purchase price of $0.11 per share, the estimated fair value of ourcommon stock. This fair value was determined by our board using the market approach, taking intoconsideration the issuance price and associated liquidation preferences and rights of our Series AConvertible Preferred Stock, as well as the high degree of uncertainty surrounding our future prospectsand markets. The sales price of our Series A Convertible Preferred Stock on June 17, 2003 was $1.20per share. Each share of the Series A Convertible Preferred Stock was convertible into 2.831 shares ofour common stock and held a liquidation preference of $1.20 per share. Given the size of theliquidation preference, the values assigned to stock-based awards at the time of grant time weredeemed by our board to be fair value.
In January 2004, our Series A-1 Convertible Preferred Stock financing was completed at anissuance price of $1.90 per share. Based upon this issuance price, our board increased the estimatedfair value of our common stock by 58% to $0.17 per share. The fair value was determined by our boardusing the market approach, taking into consideration the issuance price and associated liquidationpreferences and rights of the Series A and A-1 Convertible Preferred Stock, as well as the high degreeof uncertainty surrounding our future prospects and markets. Each share of Series A-1 ConvertiblePreferred Stock was convertible into 2.831 shares of our common stock and held a liquidationpreference of $1.90 per share. Given the size of the liquidation preference of the combined Series Aand A-1 Convertible Preferred Stock, the values assigned to stock-based awards at the time of granttime were deemed to be fair value.
66
In December 2004, we finalized the negotiations of the terms of our Series B ConvertiblePreferred Stock with our investors. In January 2005, our Series B Convertible Preferred Stock financingwas completed at an issuance price of $6.58 per share. Based upon this issuance price, our boardincreased the estimated fair value of our common stock by 111% to $0.35 per share. The fair value wasdetermined by our board using the market approach, taking into consideration the issuance price andassociated liquidation preferences and rights of our Series A, A-1 and B Convertible Preferred Stock,as well as the high degree of uncertainty surrounding our future prospects and markets. Each share ofSeries B Convertible Preferred Stock was convertible into 2.831 shares of our common stock and held aliquidation preference of $6.58 per share. Given the size of the liquidation preference of the combinedSeries A, A-1 and B Convertible Preferred Stock, the values assigned to stock-based awards at the timeof grant time were deemed to be fair value.
On each of July 7, August 1, and September 15, 2005, the board granted stock options andrestricted stock awards to purchase shares of our common stock at an exercise or purchase price of$0.35 per share, the fair value of our common stock determined by the board on each of those dates.During the first half of 2005 we continued to operate in a loss position, and therefore used cash tofund operations. Certain acquisition discussions concluded without a transaction being consummated,our California open market program posed certain challenges and key management positions remainedunfilled. The board determined that there were no other significant events that had occurred duringthis period that would have given rise to an increase in the fair value of our common stock.
On both October 26, 2005 and December 15, 2005, the board granted stock options and restrictedstock awards to purchase shares of our common stock at an exercise or purchase price of $0.35 pershare, the fair value of our common stock determined by the board on each of those dates. The boardconsidered, among other factors, our positive financial performance through December 31, 2005,management’s operating forecast for 2006 and the continued uncertainty with respect to our ability toopen and enter new markets, as evidenced by the rejection of our proposal to provide demandresponse services in Laredo, Texas by the Electric Reliability Council of Texas.
During the period January 1, 2006 through April 30, 2007, we granted stock-based awards,consisting of stock options and restricted stock awards with exercise or purchase prices as follows:
Number of Option Weighted-AverageGrants Made during the period January 1, 2006 through and Restricted Exercise or Fair Value ofApril 30, 2007 Shares Granted Purchase Price(1) Common Stock(2)
April 13, 2006 . . . . . . . . . . . . . . . . . . . . . . . . . . . . 204,524 $ 0.51 $ 1.67May 11, 2006 . . . . . . . . . . . . . . . . . . . . . . . . . . . . 242,047 0.51 1.67September 7, 2006 . . . . . . . . . . . . . . . . . . . . . . . . 189,111 0.51 1.82November 6, 2006 . . . . . . . . . . . . . . . . . . . . . . . . . 354,038 0.51 1.82December 7, 2006 . . . . . . . . . . . . . . . . . . . . . . . . . 775,912 0.51 8.87February 7, 2007 . . . . . . . . . . . . . . . . . . . . . . . . . . 279,527 7.54 8.87March 26, 2007 . . . . . . . . . . . . . . . . . . . . . . . . . . . 171,976 9.94 12.61April 11, 2007 . . . . . . . . . . . . . . . . . . . . . . . . . . . . 64,544 11.34 11.34April 25, 2007 . . . . . . . . . . . . . . . . . . . . . . . . . . . . 146,567 16.60 16.60
Total: . . . . . . . . . . . . . . . . . . . . . . . . . . . . . . . . . . 2,428,246
(1) Fair value as determined in a contemporaneous valuation by an unrelated valuation specialist.
(2) Subsequently reassessed in preparation for our initial public offering.
In March 2006, we engaged the valuation specialist to perform a contemporaneous valuation ofour common stock as of March 31, 2006. The appraisal of our common stock was performed using theprobability weighted-expected return method consistent with the Practice Aid. For the future liquidity
67
events, liquidity dates of March 31, 2009 and March 31, 2010, were assumed. The most likely liquidityevent was assumed to be our continued operations in our current geographic territory and acquisitionby a company seeking to consolidate regional market participants, which we refer to as the regionalsale scenario, which was assigned a probability weighting of 50%. An initial public offering was assigneda probability of 10%, and the expansion of the geographic scope of our business and our subsequentsale to an industry leader, which we refer to as the geographic growth sale scenario, was assigned aprobability of 20%.
The indicated value for our common stock was determined by the valuation specialist to be $0.51per share. The indicated value was equal to 5% of the price of our Series B-1 Convertible PreferredStock of $9.90 per share issued on May 16, 2006, which included an assumption of marketability. Indetermining the fair value of our common stock, the valuation specialist applied a discount for lack ofmarketability to reflect the fact that there is no established trading market for our stock. The valuationspecialist determined the size of the discount for lack of marketability by using as a starting point theaverage discount for lack of marketability applicable to shares of restricted stock issued by publiclytraded companies, which various published studies have calculated to be approximately 60% to 65%,and adjusting such average discount to reflect those factors that were considered to make our commonstock less marketable than shares of restricted stock of public companies. These factors included thefollowing: the prospects and timeframe for an initial public offering of our stock or a sale of ourcompany; existing contractual restrictions on the transferability of our common stock; the perceived riskof the enterprise; the concentration of ownership of our stock among our venture capital investors; thedifficulty of valuing the enterprise and our common stock; and absence of dividend payments on ourcommon stock. The valuation specialist assessed these factors and their impact in further reducing themarketability of our common stock. A discount for lack of marketability was applied by the valuationspecialist, which yielded a fair value of approximately $0.51 per share, corroborating the fair valuedetermined by the board on April 13, 2006.
On both April 13 and May 11, 2006, the board granted stock options to purchase shares of ourcommon stock at an exercise or purchase price of $0.51 per share, the fair value of our common stockas of March 31, 2006 as determined by our valuation specialist. The board considered, among otherfactors, the results of our operations during the first quarter of 2006, the fact that we continued tooperate in a loss position and used cash to fund operations, and management’s operating forecastthrough December 31, 2006. The board determined that there were no other significant events that hadoccurred during this period that would have given rise to a change in the fair value of our commonstock.
On September 7, 2006, November 6, 2006 and December 7, 2006, the board granted stock optionsand restricted stock awards to purchase shares of our common stock at an exercise or purchase price of$0.51 per share, the fair value of our common stock as of March 31, 2006 as determined by ourvaluation specialist. Through the first three quarters of 2006 we continued to operate in a loss position,and therefore used cash to fund operations. Numerous opportunities to open new markets provedunsuccessful. We were adversely impacted by the Neptune cable transmission system brought on line toserve Long Island, New York. NYISO approved a filing with the Federal Energy RegulatoryCommission for an In-City Capacity Mitigation proposal that could drive down the prices for capacityin New York City. In addition, ISO New England was debating whether demand response capacitymade available by replacement of electricity consumption from the electric power grid with back-upgeneration, rather than reductions in consumption, would be allowed to participate at existing orincreased levels in upcoming capacity markets. The board determined that there were no othersignificant events that had occurred during this period that would have given rise to a change in thefair value of our common stock.
In December 2006, we engaged the valuation specialist to perform a contemporaneous valuation ofour common stock as of December 31, 2006. The appraisal of our common stock was performed using
68
the probability weighted-expected return method consistent with the Practice Aid. For the futureliquidity events, liquidity dates in the third quarter of 2007, and the fourth quarter of 2008, wereassumed. The most likely liquidity event was assumed to be the initial public offering scenario as wehad begun discussions with investment bankers about going public. This event was assigned aprobability weighting of 50%. The regional sale scenario was assigned a probability of 25%, and thegeographic growth sale scenario was assigned a probability of 10%.
The fair value of our common stock was determined by the valuation specialist to be $7.54 pershare as of December 31, 2006. This value was equal to 14% of the price of our Series C ConvertiblePreferred Stock of $55.28 per share issued on December 29, 2006 and January 5, 2007, which includedan assumption of marketability. The Series C financing was issued to existing investors and is not athird party indicator of value. In determining the fair value of our common stock, the valuationspecialist applied a discount for lack of marketability to reflect the fact that there is no establishedtrading market for our stock. The valuation specialist determined the size of the discount for lack ofmarketability by using as a starting point the average discount for lack of marketability applicable toshares of restricted stock issued by publicly traded companies, which various published studies havecalculated to be approximately 10% to 40%, and adjusting such average discount to reflect thosefactors that were considered to make our common stock less marketable than shares of restricted stockof public companies. These factors included the following: the prospects and timeframe for an initialpublic offering of our stock or a sale of our company; existing contractual restrictions on thetransferability of our common stock; the perceived risk of the enterprise; the concentration ofownership of our stock among our venture capital investors; the difficulty of valuing the enterprise andour common stock; and lack of dividends. The valuation specialist assessed these factors and theirimpact in further reducing the marketability of our common stock. A discount for lack of marketabilitywas applied by the valuation specialist, which yielded a fair value of approximately $7.54 per share.
As a result of our engaging a valuation specialist for the purposes of determining the value atMarch 31, 2006 and December 31, 2006 and in connection with the preparation for our IPO, wereassessed certain assumptions used by the valuation specialist in arriving at the value. Specifically, theassumptions reassessed were (i) the discount rate applied by an investor to achieve a required rate ofreturn for an investment in a business like ours, (ii) the probability weighting of liquidity events and(iii) the discount for lack of marketability used in determining the fair value of our common stock.
For options granted on April 13 and on May 11, 2006, (i) the discount rate applied by an investorto achieve a required rate of return for an investment in a business like ours was reduced from 60% to35%, (ii) the assigned probability weightings for a regional sale scenario decreased from a probabilityof 50% to a probability of 40%, an initial public offering increased from a probability of 10% to aprobability of 20%, and a geographic growth sale scenario remained at a probability of 20% and(iii) the discount for lack of marketability decreased from 40% to 0%. As a result of these changes, wereassessed the fair value of our common stock as of April 13 and May 11, 2006 to be $1.67 per sharefor fair value for financial statement purposes. Based on this reassessment, we will recognizecompensation expense of $0.1 million, $0.1 million, $0.1 million, $0.1 million and $39,340 in 2006, 2007,2008, 2009 and 2010, respectively, to reflect the difference between the reassessed fair value of ourcommon stock and the grant price using the Black-Scholes option pricing model for options granted inApril and May 2006.
For options and restricted stock granted on September 7 and on November 6, 2006, (i) thediscount rate applied by an investor to achieve a required rate of return for an investment in a businesslike ours was decreased from 60% to 35%, (ii) the assigned probability weightings for a regional salescenario decreased from a probability of 50% to a probability of 30%, an initial public offeringincreased from a probability of 10% to a probability of 30%, and a geographic growth sale scenarioremained at a probability of 20% and (iii) the discount for lack of marketability decreased from 40% to0%. As a result of these changes, we reassessed the fair value of our common stock as of September 7
69
and November 6, 2006 to be $1.82 per share for fair value for financial statement purposes. Based onthis reassessment, we will recognize compensation expense of $50,061, $0.2 million, $0.2 million,$0.2 million and $0.1 million in 2006, 2007, 2008, 2009 and 2010, respectively, to reflect the differencebetween the reassessed fair value of our common stock and the grant price using the Black-Scholesoption pricing model for options granted in September and November 2006.
For options granted on December 7, 2006, the discount for lack of marketability was decreasedfrom 15% to 0%. As a result of that change, we reassessed the fair value of our common stock as ofDecember 7, 2006 to be $8.87 per share for fair value for financial statement purposes. Based on thisreassessment, we will recognize compensation expense of $0.1 million, $1.6 million, $1.7 million,$1.7 million and $1.5 million in 2006, 2007, 2008, 2009 and 2010, respectively, to reflect the differencebetween the reassessed fair value of our common stock and the grant price using the Black-Scholesoption pricing model for options granted in December 2006.
For options granted on February 7, 2007 the discount for lack of marketability was decreased from15% to 0%. As a result of this change, the fair value of our common stock as of February 7, 2007increased to $8.87 per share for financial statement purposes. Based on this reassessment, we willrecognize compensation expense of $0.4 million, $0.4 million, $0.5 million, $0.5 million and $0.1 millionin 2007, 2008, 2009, 2010 and 2011 respectively, to reflect the difference between the reassessed fairvalue of our common stock and the grant price using the Black-Scholes option pricing model foroptions granted in February 2007.
For options granted on March 26, 2007, (i) we increased the probability of an initial public offeringto 62.5% (ii) assigned probability weightings of 17.5%, 7.5% and 12.5% for a geographic growth sale, aregional growth sale and dissolution, respectively, (iii) we decreased the time to a liquidity event and(iv) decreased the discount for lack of marketability from 15% to 0%. As a result of these changes, thefair value of our common stock as of March 26, 2007 increased to $12.61 per share for financialstatement purposes. Based on this reassessment, we will recognize compensation expense of$0.4 million, $0.4 million, $0.4 million, $0.4 million and $0.1 million in 2007, 2008, 2009, 2010 and 2011respectively, to reflect the difference between the reassessed fair value of our common stock and thegrant price using the Black-Scholes option pricing model for options granted in March 2007.
On April 25, 2007, we made a grant to our chief executive officer and our president of a total of104,392 shares of our common stock that had been held in treasury at March 31, 2007. We recognized$2.3 million as compensation expense associated with this grant in the second quarter of 2007.
For options granted on April 11 and on April 25, 2007, we used $22.00 per share as the fair valueof our common stock for financial statement purposes. This will result in us recognizing additionalcompensation expense of $0.8 million, $0.7 million, $0.7 million, $0.6 million and $0.1 million in 2007,2008, 2009, 2010, and 2011 respectively, to reflect the difference between the fair value of our commonstock for financial reporting purposes and the grant price.
All options issued after our IPO on May 17, 2007 were granted with an exercise price equal to thefair market value on the date of grant.
Accounting for Income Taxes
We have incurred net losses since our inception. We account for income taxes in accordance withSFAS No. 109, Accounting for Income Taxes, which requires companies to recognize deferred income taxassets and liabilities for temporary differences between the financial reporting and tax bases ofrecorded assets and liabilities and the expected benefits of net operating loss and credit carryforwards.SFAS No. 109 requires that deferred income tax assets be reduced by a valuation allowance if it ismore likely than not that some portion or all of the deferred income tax assets will not be realized. We
70

evaluate the realizability of our deferred income tax assets, primarily resulting from net operating lossand credit carryforwards, and adjust our valuation allowance, if necessary.
Once we utilize our net operating loss carryforwards, we would expect our provision for income taxexpense in future periods to reflect an effective tax rate that will be significantly higher than pastperiods. The adoption of SFAS No. 123(R) will potentially result in tax benefits that are currentlydifficult to predict.
In July 2006, the FASB issued FASB Interpretation No. 48, Accounting for Uncertainty in IncomeTaxes—an interpretation of FASB Statement No. 109 (FIN 48), which clarifies the accounting foruncertainty in tax positions. This interpretation requires that we recognize in our financial statementsthe impact of a tax position if that position is more likely than not of being sustained uponexamination, based on the technical merits of the position. The provisions of FIN 48 are effective as ofJanuary 1, 2007, with the cumulative effect of the change in accounting principle recorded as anadjustment to opening retained earnings.
We adopted FIN 48 on January 1, 2007. The adoption did not have a material impact on ourconsolidated financial statements.
New Accounting Pronouncements
SFAS No. 141R, Business Combinations
In December 2007, the FASB issued Statement of Financial Accounting Standards No. 141(R),Business Combinations (SFAS No. 141R). SFAS 141R will significantly change the accounting for andreporting of business combination transactions in consolidated financial statements. SFAS 141R retainsthe fundamental requirements in Statement 141, Business Combinations while providing additionaldefinitions, such as the definition of the acquirer in a purchase and improvements in the application ofhow the acquisition method is applied. This Statement becomes effective January 1, 2009. Earlyadoption is not permitted. We are currently evaluating the impact this guidance will have on ourconsolidated financial statements.
SFAS No. 157, Fair Value Measurements
In September 2006, the FASB issued SFAS No. 157, Fair Value Measurements (SFAS No. 157). Thisstatement defines fair value as used in numerous accounting pronouncements, establishes a frameworkfor measuring fair value in GAAP and expands disclosure related to the use of fair value measures infinancial statements. SFAS No. 157 does not expand the use of fair value measures in financialstatements, but standardizes its definition and guidance in GAAP. The standard emphasizes that fairvalue is a market-based measurement and not an entity-specific measurement based on an exchangetransaction in which the entity sells an asset or transfers a liability (exit price). SFAS No. 157establishes a fair value hierarchy from observable market data as the highest level to fair value basedon an entity’s own fair value assumptions as the lowest level. SFAS No. 157 became effective for ourfinancial statements starting January 1, 2008. It does not have a significant impact on our results ofoperations and financial condition at this time.
SFAS No. 159, The Fair Value Option for Financial Assets and Financial Liabilities
In February 2007, the FASB issued SFAS No. 159, The Fair Value Option for Financial Assets andFinancial Liabilities. SFAS No. 159 provides an entity with the option, at specified election dates, tomeasure certain financial assets and liabilities and other items at fair value, with changes in fair valuerecognized in earnings as those changes occur. SFAS No. 159 also establishes presentation anddisclosure requirements that include displaying the fair value of those assets on the face of the balancesheet and providing management’s reasons for electing the fair value option for each eligible item. The
71

provisions of SFAS No. 159 are effective beginning January 1, 2008. It does not have a significantimpact on our results of operations and financial condition at this time.
Selected Quarterly Financial Data (Unaudited)
The table below sets forth selected unaudited quarterly financial information. The information isderived from our unaudited consolidated financial statements and includes, in the opinion ofmanagement, all normal and recurring adjustments that management considers necessary for a fairstatement of results for such periods. The operating results for any quarter are not necessarilyindicative of results for any future period.
Year ended December 31, 2007(1) 1st Qtr 2nd Qtr 3rd Qtr 4th Qtr
In thousands, except per share data
Revenues . . . . . . . . . . . . . . . . . . . . . . . . . . . . . . . . . . . . . . . $ 9,971 $12,015 $19,139 $19,713Gross profit . . . . . . . . . . . . . . . . . . . . . . . . . . . . . . . . . . . . . . 2,906 4,105 7,881 6,997Operating expenses . . . . . . . . . . . . . . . . . . . . . . . . . . . . . . . . 6,874 12,777 12,046 16,462Loss from operations . . . . . . . . . . . . . . . . . . . . . . . . . . . . . . . (3,968) (8,672) (4,165) (9,465)Net loss before income taxes . . . . . . . . . . . . . . . . . . . . . . . . . (3,814) (8,206) (2,525) (8,937)Provision for income taxes . . . . . . . . . . . . . . . . . . . . . . . . . . . — — — (100)Net loss . . . . . . . . . . . . . . . . . . . . . . . . . . . . . . . . . . . . . . . . (3,814) (8,206) (2,525) (9,037)Net loss per share:
Basic and diluted . . . . . . . . . . . . . . . . . . . . . . . . . . . . . . . . (0.91) (0.74) (0.14) (0.48)
Year ended December 31, 2006(1) 1st Qtr 2nd Qtr 3rd Qtr 4th Qtr
In thousands, except per share data
Revenues . . . . . . . . . . . . . . . . . . . . . . . . . . . . . . . . . . . . . . . $ 5,114 $ 4,100 $10,978 $ 5,908Gross profit . . . . . . . . . . . . . . . . . . . . . . . . . . . . . . . . . . . . . . 700 1,431 5,766 1,364Operating expenses . . . . . . . . . . . . . . . . . . . . . . . . . . . . . . . . 2,702 2,923 3,879 5,383Operating (loss) income . . . . . . . . . . . . . . . . . . . . . . . . . . . . . (2,002) (1,492) 1,887 (4,019)Net (loss) income . . . . . . . . . . . . . . . . . . . . . . . . . . . . . . . . . (2,025) (1,523) 1,892 (4,115)Net (loss) income per share:
Basic . . . . . . . . . . . . . . . . . . . . . . . . . . . . . . . . . . . . . . . . . $ (0.59) $ (0.43) $ 0.52 $ (1.07)Diluted . . . . . . . . . . . . . . . . . . . . . . . . . . . . . . . . . . . . . . . $ (0.59) $ (0.43) $ 0.13 $ (1.07)
(1) On May 1, 2007, we effected a 2.831 for one split of its common stock. All amounts have beenretroactively presented.
Item 7A. Quantitative and Qualitative Disclosure About Market Risk
Foreign Exchange Risk
We face minimal exposure to adverse movements in foreign currency exchange rates.
Interest Rate Risk
As of December 31, 2007, all of our $6.1 million of outstanding debt was at fixed interest rates;therefore, there was no significant impact from changes in interest rates.
We manage our cash and cash equivalents and marketable securities portfolio consideringinvestment opportunities and risks, tax consequences and overall financing strategies. Our investmentportfolio consists primarily of cash and cash equivalents, money market funds, and municipal auctionrate securities with carrying amounts approximating market value. As our investments are made withhighly rated municipal auction rate securities and short-term securities, we are not anticipating anysignificant impact in the short term from a change in interest rates.
72
A portion of our investment balances are invested in auction rate securities, or ARS. Historically,we have had the option to liquidate these investments whenever the interest rate reset auctions close,usually every 35 days or less. In the event an auction is unsuccessful, we may be in a position where weare unable to liquidate our holdings as scheduled. Upon these occurrences, the interest earned on theseinvestments may vary and we may be unable to predict when future auctions for ARS will besuccessfully completed. At December 31, 2007, we held approximately $5.6 million in AAA-rated ARS.The majority of these securities were student loan backed where the loans participate in the FederalFamily Education Loan Program and are ultimately re-insured by the US Department of Education.
Subsequent to December 31, 2007, several of our securities failed at auction; however, that did notimpact the valuation of our securities as of December 31, 2007 because all of our holdings as of thatdate succeeded in at least the first auction subsequent to year-end. As of March 28, 2008, we held$3.9 million worth of face amount auction rate securities, all of which have experienced a failed auctionand the status of which remains unchanged. As a result of these failed auctions, we have the potentialto benefit from a penalty feature in our interest rates, which allows us to earn an additional 5.1% to14.0% of interest on these securities until the next auction is set to occur. All of our investments areAAA-rated government backed securities, backed by creditworthy financial institutions, and have theability to potentially be sold in a secondary market. Based on the underlying market conditions andliquidity of the capital markets, we will continue to reevaluate the appropriate valuation andclassification of these securities throughout 2008.
Item 8. Financial Statements and Supplementary Data
All financial statements and schedules required to be filed hereunder are included as Appendix Ahereto and incorporated into this Annual Report on Form 10-K by reference.
Item 9. Changes in and Disagreements with Accountants on Accounting and Financial Disclosure
Not applicable.
Item 9A(T). Controls and Procedures
(a) Evaluation of Disclosure Controls and Procedures. Our management, with the participation ofour Chief Executive Officer and Chief Financial Officer, evaluated the effectiveness of EnerNOC’sdisclosure controls and procedures as of December 31, 2007. The term ‘‘disclosure controls andprocedures,’’ as defined in Rules 13a-15(e) and 15d-15(e) under the Exchange Act, means controls andother procedures of a company that are designed to ensure that information required to be disclosedby a company in the reports that it files or submits under the Exchange Act is recorded, processed,summarized and reported, within the time periods specified in the SEC’s rules and forms. Disclosurecontrols and procedures include, without limitation, controls and procedures designed to ensure thatinformation required to be disclosed by a company in the reports that it files or submits under theExchange Act is accumulated and communicated to the company’s management, including its principalexecutive and principal financial officers, as appropriate to allow timely decisions regarding requireddisclosure. Management recognizes that any controls and procedures, no matter how well designed andoperated, can provide only reasonable assurance of achieving their objectives and managementnecessarily applies its judgment in evaluating the cost-benefit relationship of possible controls andprocedures. Based on the evaluation of our disclosure controls and procedures as of December 31,2007, our Chief Executive Officer and Chief Financial Officer concluded that, as of such date, ourdisclosure controls and procedures were effective at the reasonable assurance level.
(b) Changes in Internal Controls. No change in our internal control over financial reporting (asdefined in Rules 13a-15(f) and 15d-15(f) under the Exchange Act) occurred during the fiscal quarter
73
ended December 31, 2007 that has materially affected, or is reasonably likely to materially affect, ourinternal control over financial reporting.
This Annual Report on Form 10-K does not include a report of management’s assessmentregarding internal control over financial reporting or an attestation report of our independentregistered public accounting firm due to a transition period established by the rules of the SEC fornewly public companies.
Item 9B. Other Information
Not applicable.
PART III
Item 10. Directors, Executive Officers and Corporate Governance
The complete response to this Item regarding the backgrounds of our executive officers anddirectors and other information contemplated by Items 401, 405, 406 and 407 of Regulation S-K will becontained in our definitive proxy statement for our 2008 Annual Meeting of Stockholders under thecaptions ‘‘Directors and Executive Officers,’’ ‘‘Corporate Governance and Board Matters’’ and‘‘Section 16(a) Beneficial Ownership Reporting Compliance’’ and is incorporated by reference herein.
We have adopted a written code of business conduct and ethics that applies to our principalexecutive officer, principal financial officer, principal accounting officer or controller, or personsperforming similar functions and have posted it in the Corporate Governance section of our websitewhich is located at www.enernoc.com. We intend to satisfy any disclosure requirement under Item 5.05of Form 8-K regarding any amendments to, or waivers from, our code of business conduct and ethicsby posting such information on our website which is located at www.enernoc.com.
Item 11. Executive Compensation
The information required by this Item will be contained in our definitive proxy statement for our2008 Annual Meeting of Stockholders under the captions ‘‘Compensation Discussion and Analysis,’’‘‘Corporate Governance and Board Matters’’ and ‘‘Compensation Committee Report’’ and isincorporated by reference herein.
Item 12. Security Ownership of Certain Beneficial Owners and Management and Related StockholderMatters
The information required by this Item will be contained in our definitive proxy statement for our2008 Annual Meeting of Stockholders under the captions ‘‘Compensation Discussion and Analysis’’ and‘‘Security Ownership of Certain Beneficial Owners and Management’’ and is incorporated by referenceherein.
Item 13. Certain Relationships and Related Transactions, and Director Independence
The information required by this Item will be contained in our definitive proxy statement for our2008 Annual Meeting of Stockholders under the captions ‘‘Certain Relationships and RelatedTransactions’’ and ‘‘Corporate Governance and Board Matters’’ and is incorporated by referenceherein.
74
Item 14. Principal Accounting Fees and Services
The information required by this Item will be contained in our definitive proxy statement for our2008 Annual Meeting of Stockholders under the caption ‘‘Proposal Two—Ratification of Appointmentof Independent Registered Public Accounting Firm’’ and is incorporated by reference herein.
PART IV
Item 15. Exhibits, Financial Statement Schedules
(a) The following are filed as part of this Annual Report on Form 10-K:
1. Financial Statements
The following consolidated financial statements beginning on page F-1 are included in this AnnualReport on Form 10-K:
—Consolidated Balance Sheets as of December 31, 2007 and December 31, 2006
—Consolidated Statements of Operations for the years ended December 31, 2007, December 31,2006 and December 31, 2005
—Consolidated Statements of Redeemable Convertible Preferred Stock and Stockholders’ Deficitfor the years ended December 31, 2007, December 31, 2006 and December 31, 2005
—Consolidated Statements of Cash Flows for the years ended December 31, 2007, December 31,2006 and December 31, 2005
—Notes to the Consolidated Financial Statements
(b) Exhibits
The exhibits listed in the Exhibit Index immediately preceding the exhibits are filed with orincorporated by reference in this Annual Report on Form 10-K.
(c) Financial Statement Schedules
All other schedules have been omitted since the required information is not present, or notpresent in amounts sufficient to require submission of the schedule, or because the informationrequired is included in the consolidated financial statements or the Notes thereto.
75

SIGNATURES
Pursuant to the requirements of Section 13 or 15(d) of the Securities Exchange Act of 1934, theregistrant has duly caused this report to be signed on its behalf by the undersigned, thereunto dulyauthorized.
ENERNOC, INC.
March 28, 2008 By: /s/ TIMOTHY G. HEALY
Name: Timothy G. HealyTitle: Chairman of the Board and
Chief Executive Officer
Pursuant to the requirements of the Securities Exchange Act of 1934, this report has been signedbelow by the following persons on behalf of the registrant and in the capacities and on the datesindicated.
Signature Title Date
Chairman of the Board, Chief/s/ TIMOTHY G. HEALYExecutive Officer and Director March 28, 2008
Timothy G. Healy (principal executive officer)
Chief Financial Officer/s/ NEAL C. ISAACSON(principal financial officer and March 28, 2008
Neal C. Isaacson principal accounting officer)
/s/ DAVID B. BREWSTERDirector and President March 28, 2008
David B. Brewster
/s/ TJ GLAUTHIERDirector March 28, 2008
TJ Glauthier
/s/ ADAM GROSSERDirector March 28, 2008
Adam Grosser
/s/ RICHARD DIETERDirector March 28, 2008
Richard Dieter
/s/ WILLIAM D. LESEDirector March 28, 2008
William D. Lese
76
EnerNOC, INC.
INDEX TO CONSOLIDATED FINANCIAL STATEMENTS
Page
Annual Consolidated Financial Statements of EnerNOC, Inc.:
Report of Independent Registered Public Accounting Firm . . . . . . . . . . . . . . . . . . . . . . . . . . . . F-2
Consolidated Balance Sheets as of December 31, 2007 and 2006 . . . . . . . . . . . . . . . . . . . . . . . . F-3
Consolidated Statements of Operations for the Years Ended December 31, 2007, 2006 and 2005 . F-4
Consolidated Statements of Changes in Redeemable Convertible Preferred Stock andStockholders’ Deficit for the Years Ended December 31, 2007, 2006 and 2005 . . . . . . . . . . . . . . F-5
Consolidated Statements of Cash Flows for the Years Ended December 31, 2007, 2006 and 2005 . F-6
Notes to Consolidated Financial Statements . . . . . . . . . . . . . . . . . . . . . . . . . . . . . . . . . . . . . . . F-7
F-1

Report of Independent Registered Public Accounting Firm
To the Board of Directors and Stockholders of EnerNOC, Inc.:
We have audited the accompanying consolidated balance sheets of EnerNOC, Inc. as ofDecember 31, 2007 and 2006, and the related consolidated statements of operations, changes inredeemable convertible preferred stock and stockholders’ deficit, and cash flows for each of the threeyears in the period ended December 31, 2007. These financial statements are the responsibility of theCompany’s management. Our responsibility is to express an opinion on these financial statements basedon our audits.
We conducted our audits in accordance with the standards of the Public Company AccountingOversight Board (United States). Those standards require that we plan and perform the audit to obtainreasonable assurance about whether the financial statements are free of material misstatement. Wewere not engaged to perform an audit of the Company’s internal control over financial reporting. Ouraudits included consideration of internal control over financial reporting as a basis for designing auditprocedures that are appropriate in the circumstances, but not for the purpose of expressing an opinionon the effectiveness of the Company’s internal control over financial reporting. Accordingly, we expressno such opinion. An audit also includes examining, on a test basis, evidence supporting the amountsand disclosures in the financial statements, assessing the accounting principles used and significantestimates made by management, and evaluating the overall financial statement presentation. We believethat our audits provide a reasonable basis for our opinion.
In our opinion, the consolidated financial statements referred to above present fairly, in allmaterial respects, the consolidated financial position of EnerNOC, Inc. as of December 31, 2007 and2006, and the consolidated results of its operations and its cash flows for each of the three years in theperiod ended December 31, 2007, in conformity with U.S. generally accepted accounting principles.
As discussed in Note 1 to the consolidated financial statements, effective January 1, 2006, theCompany adopted the provisions of Statement of Financial Accounting Standards, No. 123(R), Share-Based Payment.
/s/ Ernst & Young LLP
Boston, MassachusettsMarch 17, 2008
F-2
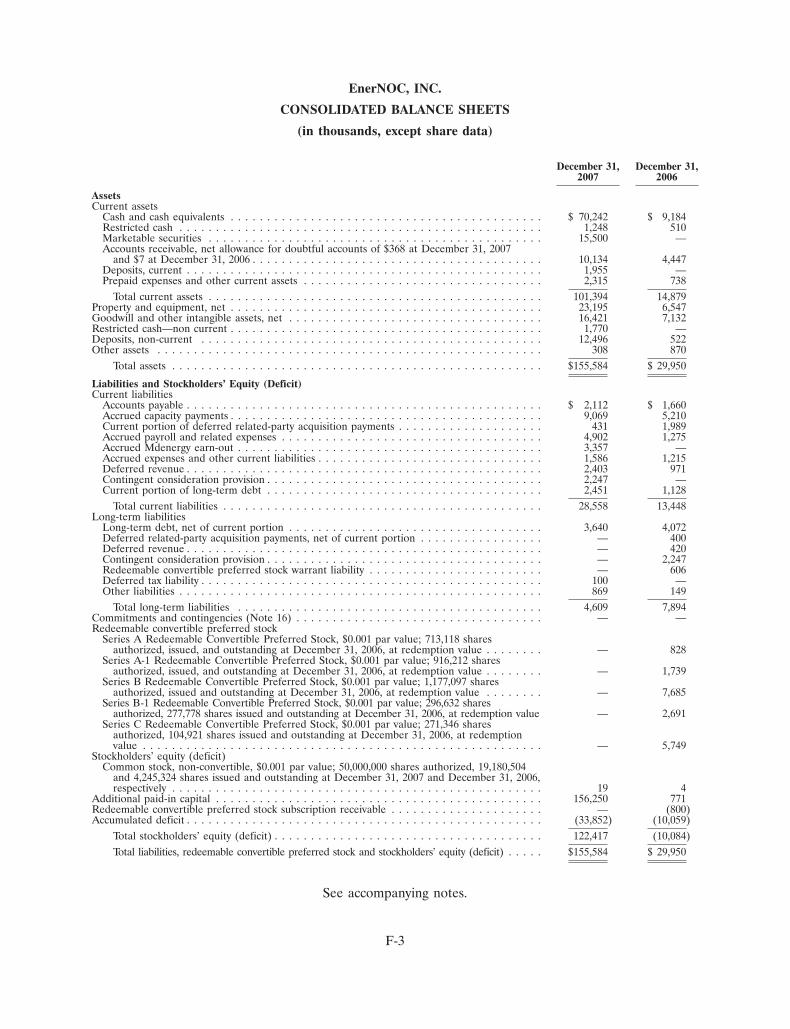
EnerNOC, INC.
CONSOLIDATED BALANCE SHEETS
(in thousands, except share data)
December 31, December 31,2007 2006
AssetsCurrent assets
Cash and cash equivalents . . . . . . . . . . . . . . . . . . . . . . . . . . . . . . . . . . . . . . . . . . . $ 70,242 $ 9,184Restricted cash . . . . . . . . . . . . . . . . . . . . . . . . . . . . . . . . . . . . . . . . . . . . . . . . . . 1,248 510Marketable securities . . . . . . . . . . . . . . . . . . . . . . . . . . . . . . . . . . . . . . . . . . . . . . 15,500 —Accounts receivable, net allowance for doubtful accounts of $368 at December 31, 2007
and $7 at December 31, 2006 . . . . . . . . . . . . . . . . . . . . . . . . . . . . . . . . . . . . . . . . 10,134 4,447Deposits, current . . . . . . . . . . . . . . . . . . . . . . . . . . . . . . . . . . . . . . . . . . . . . . . . . 1,955 —Prepaid expenses and other current assets . . . . . . . . . . . . . . . . . . . . . . . . . . . . . . . . . 2,315 738
Total current assets . . . . . . . . . . . . . . . . . . . . . . . . . . . . . . . . . . . . . . . . . . . . . . 101,394 14,879Property and equipment, net . . . . . . . . . . . . . . . . . . . . . . . . . . . . . . . . . . . . . . . . . . . 23,195 6,547Goodwill and other intangible assets, net . . . . . . . . . . . . . . . . . . . . . . . . . . . . . . . . . . . 16,421 7,132Restricted cash—non current . . . . . . . . . . . . . . . . . . . . . . . . . . . . . . . . . . . . . . . . . . . 1,770 —Deposits, non-current . . . . . . . . . . . . . . . . . . . . . . . . . . . . . . . . . . . . . . . . . . . . . . . 12,496 522Other assets . . . . . . . . . . . . . . . . . . . . . . . . . . . . . . . . . . . . . . . . . . . . . . . . . . . . . 308 870
Total assets . . . . . . . . . . . . . . . . . . . . . . . . . . . . . . . . . . . . . . . . . . . . . . . . . . . $155,584 $ 29,950
Liabilities and Stockholders’ Equity (Deficit)Current liabilities
Accounts payable . . . . . . . . . . . . . . . . . . . . . . . . . . . . . . . . . . . . . . . . . . . . . . . . . $ 2,112 $ 1,660Accrued capacity payments . . . . . . . . . . . . . . . . . . . . . . . . . . . . . . . . . . . . . . . . . . . 9,069 5,210Current portion of deferred related-party acquisition payments . . . . . . . . . . . . . . . . . . . . 431 1,989Accrued payroll and related expenses . . . . . . . . . . . . . . . . . . . . . . . . . . . . . . . . . . . . 4,902 1,275Accrued Mdenergy earn-out . . . . . . . . . . . . . . . . . . . . . . . . . . . . . . . . . . . . . . . . . . 3,357 —Accrued expenses and other current liabilities . . . . . . . . . . . . . . . . . . . . . . . . . . . . . . . 1,586 1,215Deferred revenue . . . . . . . . . . . . . . . . . . . . . . . . . . . . . . . . . . . . . . . . . . . . . . . . . 2,403 971Contingent consideration provision . . . . . . . . . . . . . . . . . . . . . . . . . . . . . . . . . . . . . . 2,247 —Current portion of long-term debt . . . . . . . . . . . . . . . . . . . . . . . . . . . . . . . . . . . . . . 2,451 1,128
Total current liabilities . . . . . . . . . . . . . . . . . . . . . . . . . . . . . . . . . . . . . . . . . . . . 28,558 13,448Long-term liabilities
Long-term debt, net of current portion . . . . . . . . . . . . . . . . . . . . . . . . . . . . . . . . . . . 3,640 4,072Deferred related-party acquisition payments, net of current portion . . . . . . . . . . . . . . . . . — 400Deferred revenue . . . . . . . . . . . . . . . . . . . . . . . . . . . . . . . . . . . . . . . . . . . . . . . . . — 420Contingent consideration provision . . . . . . . . . . . . . . . . . . . . . . . . . . . . . . . . . . . . . . — 2,247Redeemable convertible preferred stock warrant liability . . . . . . . . . . . . . . . . . . . . . . . . — 606Deferred tax liability . . . . . . . . . . . . . . . . . . . . . . . . . . . . . . . . . . . . . . . . . . . . . . . 100 —Other liabilities . . . . . . . . . . . . . . . . . . . . . . . . . . . . . . . . . . . . . . . . . . . . . . . . . . 869 149
Total long-term liabilities . . . . . . . . . . . . . . . . . . . . . . . . . . . . . . . . . . . . . . . . . . 4,609 7,894Commitments and contingencies (Note 16) . . . . . . . . . . . . . . . . . . . . . . . . . . . . . . . . . . — —Redeemable convertible preferred stock
Series A Redeemable Convertible Preferred Stock, $0.001 par value; 713,118 sharesauthorized, issued, and outstanding at December 31, 2006, at redemption value . . . . . . . . — 828
Series A-1 Redeemable Convertible Preferred Stock, $0.001 par value; 916,212 sharesauthorized, issued, and outstanding at December 31, 2006, at redemption value . . . . . . . . — 1,739
Series B Redeemable Convertible Preferred Stock, $0.001 par value; 1,177,097 sharesauthorized, issued and outstanding at December 31, 2006, at redemption value . . . . . . . . — 7,685
Series B-1 Redeemable Convertible Preferred Stock, $0.001 par value; 296,632 sharesauthorized, 277,778 shares issued and outstanding at December 31, 2006, at redemption value — 2,691
Series C Redeemable Convertible Preferred Stock, $0.001 par value; 271,346 sharesauthorized, 104,921 shares issued and outstanding at December 31, 2006, at redemptionvalue . . . . . . . . . . . . . . . . . . . . . . . . . . . . . . . . . . . . . . . . . . . . . . . . . . . . . . . — 5,749
Stockholders’ equity (deficit)Common stock, non-convertible, $0.001 par value; 50,000,000 shares authorized, 19,180,504
and 4,245,324 shares issued and outstanding at December 31, 2007 and December 31, 2006,respectively . . . . . . . . . . . . . . . . . . . . . . . . . . . . . . . . . . . . . . . . . . . . . . . . . . . 19 4
Additional paid-in capital . . . . . . . . . . . . . . . . . . . . . . . . . . . . . . . . . . . . . . . . . . . . . 156,250 771Redeemable convertible preferred stock subscription receivable . . . . . . . . . . . . . . . . . . . . . — (800)Accumulated deficit . . . . . . . . . . . . . . . . . . . . . . . . . . . . . . . . . . . . . . . . . . . . . . . . . (33,852) (10,059)
Total stockholders’ equity (deficit) . . . . . . . . . . . . . . . . . . . . . . . . . . . . . . . . . . . . . 122,417 (10,084)Total liabilities, redeemable convertible preferred stock and stockholders’ equity (deficit) . . . . . $155,584 $ 29,950
See accompanying notes.
F-3

EnerNOC, INC.
CONSOLIDATED STATEMENTS OF OPERATIONS
(in thousands, except share and per share data)
Year Ended December 31,
2007 2006 2005
Revenues . . . . . . . . . . . . . . . . . . . . . . . . . . . . . . . . . . . . . . . . $ 60,838 $ 26,100 $ 9,826Cost of revenues . . . . . . . . . . . . . . . . . . . . . . . . . . . . . . . . . . 38,949 16,839 4,190
Gross profit . . . . . . . . . . . . . . . . . . . . . . . . . . . . . . . . . . . . . . 21,889 9,261 5,636
Operating expenses:Selling and marketing expenses . . . . . . . . . . . . . . . . . . . . . . 17,145 5,932 2,228General and administrative expenses . . . . . . . . . . . . . . . . . . 27,917 8,000 4,211Research and development expenses . . . . . . . . . . . . . . . . . . 3,097 955 981
Total operating expenses . . . . . . . . . . . . . . . . . . . . . . . . . 48,159 14,887 7,420
Loss from operations . . . . . . . . . . . . . . . . . . . . . . . . . . . . . . . (26,270) (5,626) (1,784)Interest and other income . . . . . . . . . . . . . . . . . . . . . . . . . . 3,161 167 291Interest expense . . . . . . . . . . . . . . . . . . . . . . . . . . . . . . . . . (373) (312) (213)
Loss before income tax expense . . . . . . . . . . . . . . . . . . . . . . (23,482) (5,771) (1,706)Provision for income tax expense . . . . . . . . . . . . . . . . . . . . . (100) — —
Net loss . . . . . . . . . . . . . . . . . . . . . . . . . . . . . . . . . . . . . $ (23,582) $ (5,771) $ (1,706)
Net loss per shareBasic and diluted . . . . . . . . . . . . . . . . . . . . . . . . . . . . . . . . $ (1.80) $ (1.60) $ (0.56)
Weighted average number of basic and diluted shares . . . . . . 13,106,114 3,607,822 3,071,733
See accompanying notes.
F-4

F-5
EnerNOC, INC.CONSOLIDATED STATEMENTS OF CHANGES IN REDEEMABLE CONVERTIBLE PREFERRED STOCK
AND STOCKHOLDERS’ DEFICIT(in thousands, except share data)
Series A Series A-1 Series B Series B-1 Series CRedeemableRedeemable Redeemable Redeemable Redeemable RedeemableConvertibleConvertible Convertible Convertible Convertible ConvertiblePreferredPreferred Stock Preferred Stock Preferred Stock Preferred Stock Preferred Stock Common Stock
Additional StockNumber Number Number of Number Number Number of Paid-in Subscription Accumulated
of Shares Amount of Shares Amount Shares Amount of Shares Amount of Shares Amount Shares Amount Capital Receivable Deficit Total
Balances as of December 31, 2004 . . . . . . . . . . . . 713,118 $ 810 916,212 $ 1,738 — $ — — $ — — $ — 2,831,003 $ 3 $ 9 $ — $ (2,509) $ 51Issuance of stock upon exercise of stock options . . . . — — — — — — — — — — 83,633 — 11 — — 11Issuance of common shares in connection with the
acquisition of Pinpoint Power DR LLC . . . . . . . . — — — — — — — — — — 285,220 — 101 — — 101Stock-based compensation expense related to issuance
of stock options to non-employees . . . . . . . . . . — — — — — — — — — — — — 1 — — 1Issuance of Series B Redeemable Convertible Preferred
Stock, net of issuance costs . . . . . . . . . . . . . . — — — — 1,177,097 7,643 — — — — — — — — — 7,643Accretion of issuance costs . . . . . . . . . . . . . . . — 9 — 1 — 20 — — — — — — — — (30) —Net loss . . . . . . . . . . . . . . . . . . . . . . . . . — — — — — — — — — — — — — — (1,706) (1,706)
Balances as of December 31, 2005 . . . . . . . . . . . . 713,118 819 916,212 1,739 1,177,097 7,663 — — — — 3,199,856 3 122 — (4,245) 6,101Issuance of stock upon exercise of stock options . . . . — — — — — — — — — — 560,603 1 165 — — 166Issuance of restricted stock . . . . . . . . . . . . . . . — — — — — — — — — — 152,461 — — — — —Issuance of common shares in connection with the
acquisition of Pinpoint Power DR LLC . . . . . . . . — — — — — — — — — — 260,568 — 92 — — 92Issuance of common shares in connection with the
acquisition of eBidenergy, Inc. . . . . . . . . . . . . — — — — — — — — — — 71,836 — 25 — — 25Stock-based compensation expense . . . . . . . . . . . — — — — — — — — — — — — 367 — — 367Issuance of Series B-1 Redeemable Convertible
Preferred Stock, net of issuance costs . . . . . . . . . — — — — — — 277,778 2,679 — — — — — — — 2,679Issuance of Series C Redeemable Convertible Preferred
Stock, net of issuance costs . . . . . . . . . . . . . . — — — — — — — — 104,921 5,749 — — — (800) — 4,949Accretion of issuance costs . . . . . . . . . . . . . . . — 9 — — — 22 — 12 — — — — — — (43) —Net loss . . . . . . . . . . . . . . . . . . . . . . . . . — — — — — — — — — — — — — — (5,771) (5,771)
Balances as of December 31, 2006 . . . . . . . . . . . . 713,118 828 916,212 1,739 1,177,097 7,685 277,778 2,691 104,921 5,749 4,245,324 4 771 (800) (10,059) 8,608
Issuance of stock upon exercise of stock options . . . . — — — — — — — — — — 437,321 — 150 — — 150Issuance of restricted stock . . . . . . . . . . . . . . . — — — — — — — — — — 45,500 — — — — —Issuance of Series C Redeemable Convertible Preferred
Stock, net of issuance costs . . . . . . . . . . . . . . — — — — — — — — 106,425 9,187 — — — 800 — 9,987Exercise of warrant . . . . . . . . . . . . . . . . . . . — — — — — — — — — — 160,287 — 606 — — 606Conversion of Preferred Stock . . . . . . . . . . . . . . (713,118) $ (850) (916,212) $ (1,745) (1,177,097) $ (7,745) (277,778) $ (2,750) (211,346) $ (15,000) 9,499,565 10 28,080 — —Vesting of restricted stock . . . . . . . . . . . . . . . . — — — — — — — — — — — — 24 — — 24Accretion of issuance costs . . . . . . . . . . . . . . . — 22 — 6 — 60 — 59 — 64 — — — — (211) —Purchase and subsequent reissuance of treasury stock . . — — — — — — — — — — — — (395) — (395)Issuance of common stock in connection with the initial
public offering . . . . . . . . . . . . . . . . . . . . . — — — — — — — — — — 4,087,500 4 95,155 — — 95,159Issuance of common stock in connection with the
secondary offering . . . . . . . . . . . . . . . . . . . — — — — — — — — — — 500,000 1 19,445 — — 19,446Issuance of common shares in connection with the
acquisition of Pinpoint Power DR LLC . . . . . . . . — — — — — — — — — — 65,951 — 66 — — 66Issuance of common shares in connection with the
acquisition of MDEnergy LLC . . . . . . . . . . . . — — — — — — — — — — 139,056 — 4,751 — — 4,751Stock-based compensation expense . . . . . . . . . . . — — — — — — — — — — — — 7,597 — — 7,597Net loss . . . . . . . . . . . . . . . . . . . . . . . . . — — — — — — — — — — — — — — (23,582) (23,582)
Balances as of December 31, 2007 . . . . . . . . . . . . — $ — — $ — — $ — — $ — — $ — 19,180,504 $ 19 $ 156,250 $ — $ (33,852) $ 122,417
See accompanying notes.
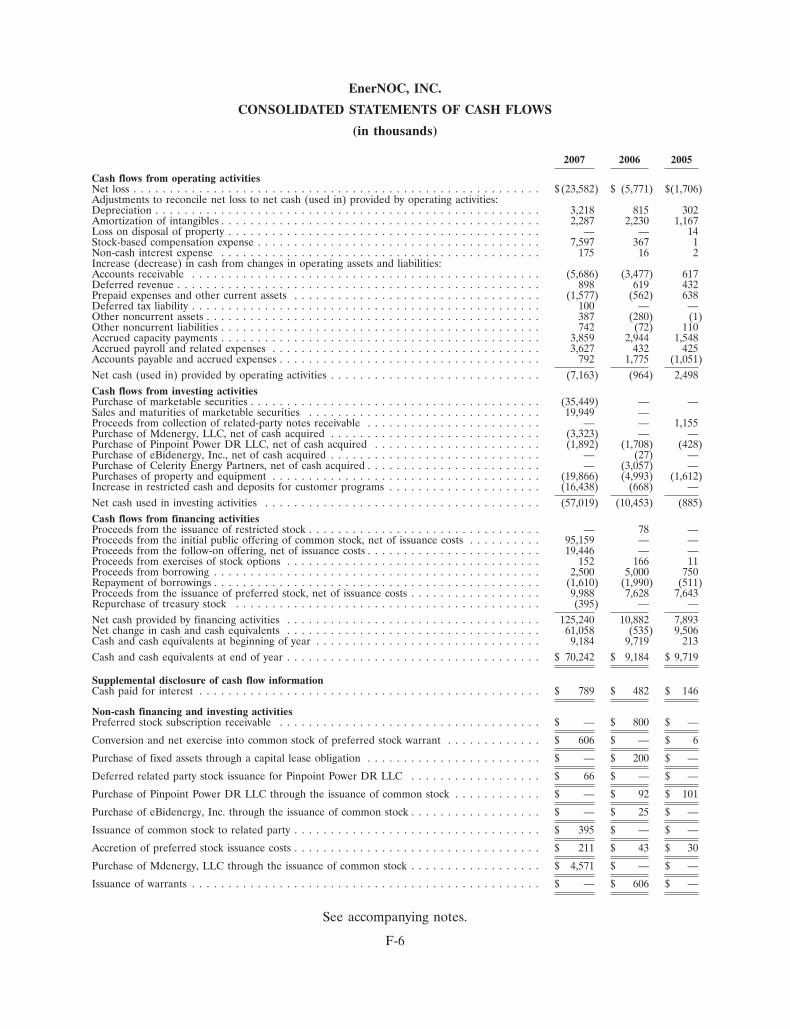
EnerNOC, INC.
CONSOLIDATED STATEMENTS OF CASH FLOWS
(in thousands)
2007 2006 2005
Cash flows from operating activitiesNet loss . . . . . . . . . . . . . . . . . . . . . . . . . . . . . . . . . . . . . . . . . . . . . . . . . . . . . . . . $ (23,582) $ (5,771) $(1,706)Adjustments to reconcile net loss to net cash (used in) provided by operating activities:Depreciation . . . . . . . . . . . . . . . . . . . . . . . . . . . . . . . . . . . . . . . . . . . . . . . . . . . . . 3,218 815 302Amortization of intangibles . . . . . . . . . . . . . . . . . . . . . . . . . . . . . . . . . . . . . . . . . . . . 2,287 2,230 1,167Loss on disposal of property . . . . . . . . . . . . . . . . . . . . . . . . . . . . . . . . . . . . . . . . . . . — — 14Stock-based compensation expense . . . . . . . . . . . . . . . . . . . . . . . . . . . . . . . . . . . . . . . 7,597 367 1Non-cash interest expense . . . . . . . . . . . . . . . . . . . . . . . . . . . . . . . . . . . . . . . . . . . . 175 16 2Increase (decrease) in cash from changes in operating assets and liabilities:Accounts receivable . . . . . . . . . . . . . . . . . . . . . . . . . . . . . . . . . . . . . . . . . . . . . . . . (5,686) (3,477) 617Deferred revenue . . . . . . . . . . . . . . . . . . . . . . . . . . . . . . . . . . . . . . . . . . . . . . . . . . 898 619 432Prepaid expenses and other current assets . . . . . . . . . . . . . . . . . . . . . . . . . . . . . . . . . . (1,577) (562) 638Deferred tax liability . . . . . . . . . . . . . . . . . . . . . . . . . . . . . . . . . . . . . . . . . . . . . . . . 100 — —Other noncurrent assets . . . . . . . . . . . . . . . . . . . . . . . . . . . . . . . . . . . . . . . . . . . . . . 387 (280) (1)Other noncurrent liabilities . . . . . . . . . . . . . . . . . . . . . . . . . . . . . . . . . . . . . . . . . . . . 742 (72) 110Accrued capacity payments . . . . . . . . . . . . . . . . . . . . . . . . . . . . . . . . . . . . . . . . . . . . 3,859 2,944 1,548Accrued payroll and related expenses . . . . . . . . . . . . . . . . . . . . . . . . . . . . . . . . . . . . . 3,627 432 425Accounts payable and accrued expenses . . . . . . . . . . . . . . . . . . . . . . . . . . . . . . . . . . . . 792 1,775 (1,051)Net cash (used in) provided by operating activities . . . . . . . . . . . . . . . . . . . . . . . . . . . . . (7,163) (964) 2,498Cash flows from investing activitiesPurchase of marketable securities . . . . . . . . . . . . . . . . . . . . . . . . . . . . . . . . . . . . . . . . (35,449) — —Sales and maturities of marketable securities . . . . . . . . . . . . . . . . . . . . . . . . . . . . . . . . 19,949 —Proceeds from collection of related-party notes receivable . . . . . . . . . . . . . . . . . . . . . . . . — — 1,155Purchase of Mdenergy, LLC, net of cash acquired . . . . . . . . . . . . . . . . . . . . . . . . . . . . . (3,323) — —Purchase of Pinpoint Power DR LLC, net of cash acquired . . . . . . . . . . . . . . . . . . . . . . . (1,892) (1,708) (428)Purchase of eBidenergy, Inc., net of cash acquired . . . . . . . . . . . . . . . . . . . . . . . . . . . . . — (27) —Purchase of Celerity Energy Partners, net of cash acquired . . . . . . . . . . . . . . . . . . . . . . . . — (3,057) —Purchases of property and equipment . . . . . . . . . . . . . . . . . . . . . . . . . . . . . . . . . . . . . (19,866) (4,993) (1,612)Increase in restricted cash and deposits for customer programs . . . . . . . . . . . . . . . . . . . . . (16,438) (668) —Net cash used in investing activities . . . . . . . . . . . . . . . . . . . . . . . . . . . . . . . . . . . . . . (57,019) (10,453) (885)Cash flows from financing activitiesProceeds from the issuance of restricted stock . . . . . . . . . . . . . . . . . . . . . . . . . . . . . . . . — 78 —Proceeds from the initial public offering of common stock, net of issuance costs . . . . . . . . . . 95,159 — —Proceeds from the follow-on offering, net of issuance costs . . . . . . . . . . . . . . . . . . . . . . . . 19,446 — —Proceeds from exercises of stock options . . . . . . . . . . . . . . . . . . . . . . . . . . . . . . . . . . . 152 166 11Proceeds from borrowing . . . . . . . . . . . . . . . . . . . . . . . . . . . . . . . . . . . . . . . . . . . . . 2,500 5,000 750Repayment of borrowings . . . . . . . . . . . . . . . . . . . . . . . . . . . . . . . . . . . . . . . . . . . . . (1,610) (1,990) (511)Proceeds from the issuance of preferred stock, net of issuance costs . . . . . . . . . . . . . . . . . . 9,988 7,628 7,643Repurchase of treasury stock . . . . . . . . . . . . . . . . . . . . . . . . . . . . . . . . . . . . . . . . . . (395) — —Net cash provided by financing activities . . . . . . . . . . . . . . . . . . . . . . . . . . . . . . . . . . . 125,240 10,882 7,893Net change in cash and cash equivalents . . . . . . . . . . . . . . . . . . . . . . . . . . . . . . . . . . . 61,058 (535) 9,506Cash and cash equivalents at beginning of year . . . . . . . . . . . . . . . . . . . . . . . . . . . . . . . 9,184 9,719 213Cash and cash equivalents at end of year . . . . . . . . . . . . . . . . . . . . . . . . . . . . . . . . . . . $ 70,242 $ 9,184 $ 9,719
Supplemental disclosure of cash flow informationCash paid for interest . . . . . . . . . . . . . . . . . . . . . . . . . . . . . . . . . . . . . . . . . . . . . . . $ 789 $ 482 $ 146
Non-cash financing and investing activitiesPreferred stock subscription receivable . . . . . . . . . . . . . . . . . . . . . . . . . . . . . . . . . . . . $ — $ 800 $ —
Conversion and net exercise into common stock of preferred stock warrant . . . . . . . . . . . . . $ 606 $ — $ 6
Purchase of fixed assets through a capital lease obligation . . . . . . . . . . . . . . . . . . . . . . . . $ — $ 200 $ —
Deferred related party stock issuance for Pinpoint Power DR LLC . . . . . . . . . . . . . . . . . . $ 66 $ — $ —
Purchase of Pinpoint Power DR LLC through the issuance of common stock . . . . . . . . . . . . $ — $ 92 $ 101
Purchase of eBidenergy, Inc. through the issuance of common stock . . . . . . . . . . . . . . . . . . $ — $ 25 $ —
Issuance of common stock to related party . . . . . . . . . . . . . . . . . . . . . . . . . . . . . . . . . . $ 395 $ — $ —
Accretion of preferred stock issuance costs . . . . . . . . . . . . . . . . . . . . . . . . . . . . . . . . . . $ 211 $ 43 $ 30
Purchase of Mdenergy, LLC through the issuance of common stock . . . . . . . . . . . . . . . . . . $ 4,571 $ — $ —
Issuance of warrants . . . . . . . . . . . . . . . . . . . . . . . . . . . . . . . . . . . . . . . . . . . . . . . . $ — $ 606 $ —
See accompanying notes.
F-6
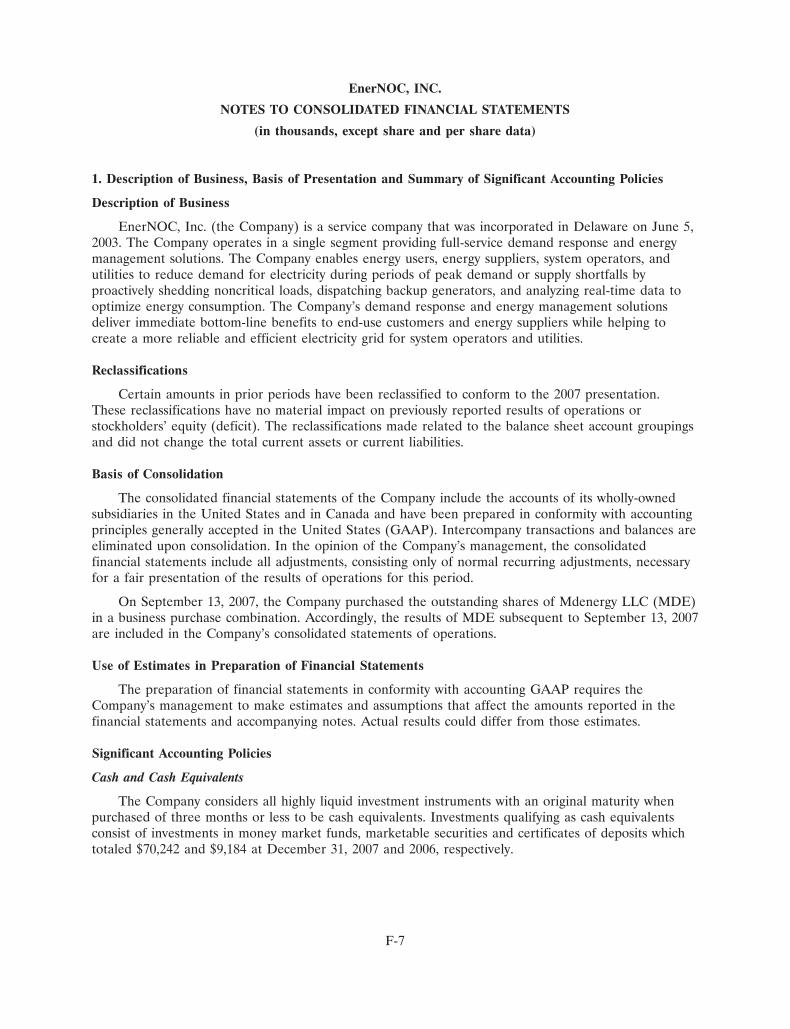
EnerNOC, INC.
NOTES TO CONSOLIDATED FINANCIAL STATEMENTS
(in thousands, except share and per share data)
1. Description of Business, Basis of Presentation and Summary of Significant Accounting Policies
Description of Business
EnerNOC, Inc. (the Company) is a service company that was incorporated in Delaware on June 5,2003. The Company operates in a single segment providing full-service demand response and energymanagement solutions. The Company enables energy users, energy suppliers, system operators, andutilities to reduce demand for electricity during periods of peak demand or supply shortfalls byproactively shedding noncritical loads, dispatching backup generators, and analyzing real-time data tooptimize energy consumption. The Company’s demand response and energy management solutionsdeliver immediate bottom-line benefits to end-use customers and energy suppliers while helping tocreate a more reliable and efficient electricity grid for system operators and utilities.
Reclassifications
Certain amounts in prior periods have been reclassified to conform to the 2007 presentation.These reclassifications have no material impact on previously reported results of operations orstockholders’ equity (deficit). The reclassifications made related to the balance sheet account groupingsand did not change the total current assets or current liabilities.
Basis of Consolidation
The consolidated financial statements of the Company include the accounts of its wholly-ownedsubsidiaries in the United States and in Canada and have been prepared in conformity with accountingprinciples generally accepted in the United States (GAAP). Intercompany transactions and balances areeliminated upon consolidation. In the opinion of the Company’s management, the consolidatedfinancial statements include all adjustments, consisting only of normal recurring adjustments, necessaryfor a fair presentation of the results of operations for this period.
On September 13, 2007, the Company purchased the outstanding shares of Mdenergy LLC (MDE)in a business purchase combination. Accordingly, the results of MDE subsequent to September 13, 2007are included in the Company’s consolidated statements of operations.
Use of Estimates in Preparation of Financial Statements
The preparation of financial statements in conformity with accounting GAAP requires theCompany’s management to make estimates and assumptions that affect the amounts reported in thefinancial statements and accompanying notes. Actual results could differ from those estimates.
Significant Accounting Policies
Cash and Cash Equivalents
The Company considers all highly liquid investment instruments with an original maturity whenpurchased of three months or less to be cash equivalents. Investments qualifying as cash equivalentsconsist of investments in money market funds, marketable securities and certificates of deposits whichtotaled $70,242 and $9,184 at December 31, 2007 and 2006, respectively.
F-7

EnerNOC, INC.
NOTES TO CONSOLIDATED FINANCIAL STATEMENTS (Continued)
(in thousands, except share and per share data)
1. Description of Business, Basis of Presentation and Summary of Significant Accounting Policies(Continued)
Marketable Securities
Marketable securities at December 31, 2007 are classified as ‘‘available-for-sale.’’ Our investmentsin securities include auction-rate securities (ARSs) and municipal bonds. Available-for-sale securitiesare carried at fair value, with the unrealized gains and losses reported in a separate component ofaccumulated other comprehensive income (loss) in stockholders’ equity (deficit). The cost of debtsecurities that are deemed available-for-sale securities is adjusted for amortization of premiums andaccretion of discounts to maturity. Such amortization and accretion are included in interest and otherincome. Realized gains and losses and declines in value judged to be other-than-temporary onavailable-for-sale securities and other investments are included in investment income. For the yearended December 31, 2007, there were no realized gains or losses on the Company’s marketablesecurities. The cost of securities sold is based on the specific identification method. Interest anddividends on securities classified as available-for-sale are included in interest and other income.
The Company periodically evaluates these investments for impairment in accordance with EITFNo. 03-01, The Meaning of Other-Than-Temporary Impairment and Its Application to Certain Investments(EITF No. 03-01). When a decline in fair value is deemed to be other-than-temporary, the Companyrecords an impairment adjustment in the statement of operations. There were no impairments ofmarketable securities at December 31, 2007 (See Note 4).
Concentrations of Credit Risk
Financial instruments that potentially subject the Company to significant concentrations of creditrisk principally consist of cash and cash equivalents, marketable securities and accounts receivable. TheCompany maintains its cash and cash equivalent balances with high-quality financial institutions and,consequently, such funds are subject to minimal credit risk. Accounts receivable are primarily fromcustomers in the northeastern and PJM Interconnection (PJM) regions of the United States. TheCompany estimates the allowance for doubtful accounts for trade receivables based on historical losses,existing economic conditions, and other information available at the balance sheet date.
For the years ended December 31, 2007, 2006 and 2005, the Company had 2 major customers,which accounted for 81%, 84% and 86%, respectively, of total revenues.
Year Ended December 31
2007 2006 2005
% of Total % of Total % of TotalRevenues Revenues Revenues Revenues Revenues Revenues
Customer 1 . . . . . . . . . . . . . . . . . . . . . $36,617 60% $16,945 65% $8,420 86%Customer 2 . . . . . . . . . . . . . . . . . . . . . 12,666 21% 4,973 19% — 0%
Totals . . . . . . . . . . . . . . . . . . . . . . . . . $49,283 81% $21,918 84% $8,420 86%
Accounts receivable from these customers was approximately $8,696 and $3,597 at December 31,2007 and 2006, respectively.
F-8
EnerNOC, INC.
NOTES TO CONSOLIDATED FINANCIAL STATEMENTS (Continued)
(in thousands, except share and per share data)
1. Description of Business, Basis of Presentation and Summary of Significant Accounting Policies(Continued)
Deposits and restricted cash consist of funds to secure performance on certain customer contracts.Deposits held by customers were $14,451 and $383 at December 31, 2007 and 2006, respectively.Restricted cash to secure letters of credit were $3,018 and $510 at December 31, 2007 and 2006,respectively.
In January 2008, the Company paid a total of $10,903 in deposits as collateral in connection withcertain open market bidding commitments.
In February 2008, the Company issued additional letters of credit associated with various programstotaling approximately $458.
In March 2008, the Company had a deposit that converted into a letter of credit ofapproximately $10,243. The Company expects that this will result in an increase of restricted cash by$10,243 in 2008.
Property and Equipment
Property and equipment is stated at cost and depreciated using the straight-line method over theestimated useful lives of the respective assets, ranging from three to ten years. Leasehold improvementsare amortized over their useful life or the life of the lease, whichever is shorter. The amortization ofcapital lease amounts are included in depreciation expense. Expenditures that improve or extend thelife of a respective asset are capitalized while repairs and maintenance expenditures are expensed asincurred.
The Company capitalizes interest incurred on debt during the course of qualified constructionprojects. Such costs are added to the asset base and amortized over the related asset’s estimated usefullife. For the years ended December 31, 2007, 2006 and 2005, the Company capitalized $722, $127 and$0, respectively.
Software development costs of $677 and $786 for the year ended December 31, 2007 and 2006,respectively, have been capitalized in accordance with Statement of Position No. 98-1, Accounting forthe Cost of Computer Software Developed or Obtained for Internal Use. The capitalized amount isincluded as software in property and equipment at December 31, 2007.
The Company capitalizes interest on projects that qualify for interest capitalization underStatement of Financial Accounting Standards No. 34, Capitalization of Interest Costs, as amended(FAS 34). Capitalized interest is included within construction in progress and is depreciated over theuseful life of the assets once the project is complete.
Software Development Costs
In accordance with AICPA Statement of Position 98-1, Accounting for the Cost of ComputerSoftware Developed or Obtained for Internal Use, costs for the post-implementation and operation stageare expensed as incurred. Cost incurred during the application development stage are capitalized andamortized over the estimated useful life of the software.
F-9

EnerNOC, INC.
NOTES TO CONSOLIDATED FINANCIAL STATEMENTS (Continued)
(in thousands, except share and per share data)
1. Description of Business, Basis of Presentation and Summary of Significant Accounting Policies(Continued)
Impairment of Long-Lived Assets
Consistent with SFAS No. 144, Accounting for the Impairment of Long-Lived Assets and Long-LivedAssets to Be Disposed Of, when impairment indicators exist, the Company evaluates its long-lived assetsfor potential impairment. Potential impairment is assessed when there is evidence that events orchanges in circumstances have occurred that indicate that the carrying amount of an asset may not berecovered. The Company noted no indicators of impairment.
The Company reviews property and equipment for impairment whenever events or changes incircumstances indicate that the carrying amount of assets may not be recoverable. Recoverability ofthese assets is measured by comparison of their carrying amount to the future undiscounted cash flowsthe assets are expected to generate over their remaining economic lives. If such assets are consideredto be impaired, the impairment is to be recognized in earnings equals the amount by which the carryingvalue of the assets exceeds their fair market value determined by either a quoted market price, if any,or a value determined by utilizing a discounted cash flow technique. If such assets are not impaired,but their useful lives have decreased, the remaining net book value is amortized over the revised usefullife. As of December 31, 2007, there have been no impairments to date.
Goodwill and Other Intangible Assets
The Company accounts for goodwill and other intangible assets under SFAS No. 141, BusinessCombinations, and SFAS No. 142, Goodwill and Other Intangible Assets. SFAS No. 141 requires that thepurchase method of accounting be used for all business combinations initiated after June 30, 2001, andthat certain intangible assets acquired in a business combination be recognized as assets apart fromgoodwill. Under SFAS No. 142, purchased goodwill and intangible assets with indefinite lives are nolonger amortized, but instead tested for impairment at least annually or whenever events or changes incircumstances indicate the carrying value may not be recoverable. Intangible assets with finite livescontinue to be amortized over their useful lives. The Company performed its annual impairment test asof November 30, 2007. Based on the results of the first step, the Company has determined that noimpairment had occurred, as the fair value of the reporting unit exceeded the respective carrying value.
Income Taxes
The Company provides for income taxes as set forth in SFAS No. 109, Accounting for IncomeTaxes. Under SFAS No. 109, the liability method is used in accounting for income taxes. Deferred taxassets and liabilities are determined based on differences between financial reporting and tax bases ofassets and liabilities and are measured using the enacted tax rates in effect when the differences areexpected to reverse. Deferred tax assets are reduced by a valuation allowance to reflect the uncertaintyassociated with their ultimate realization.
The Company adopted FASB Interpretation 48, Accounting for Uncertainty in Income Taxes—AnInterpretation of Statement 109 (FIN 48), as of January 1, 2007. The adoption of FIN 48 did not haveany impact on the Company’s consolidated financial statements.
F-10
EnerNOC, INC.
NOTES TO CONSOLIDATED FINANCIAL STATEMENTS (Continued)
(in thousands, except share and per share data)
1. Description of Business, Basis of Presentation and Summary of Significant Accounting Policies(Continued)
Industry Segment Information
Based on qualitative and quantitative criteria established by Statements of Financial AccountingStandards (SFAS) No. 131, Disclosures about Segments of an Enterprise and Related Information, theCompany operates within one reportable segment.
Revenue Recognition
The Company recognizes revenues in accordance with SAB No. 104. In all of The Company’sarrangements, it does not recognize any revenues until it can determine that persuasive evidence of anarrangement exists, delivery has occurred, the fee is fixed or determinable, and it deems collection tobe probable. In making these judgments, the Company evaluates these criteria as follows:
• Evidence of an arrangement. The Company considers a non-cancelable agreement signed by thecustomer and the Company to be representative of persuasive evidence of an arrangement.
• Delivery has occurred. The Company considers delivery to have occurred when service has beendelivered to the customer and no post-delivery obligations exist. In instances where customeracceptance is required, delivery is deemed to have occurred when customer acceptance has beenachieved.
• Fees are fixed or determinable. The Company considers the fee to be fixed or determinable unlessthe fee is subject to refund or adjustment or is not payable within normal payment terms. If thefee is subject to refund or adjustment, the Company recognizes revenues when the right to arefund or adjustment lapses. If offered payment terms exceed our normal terms, the Companyrecognizes revenues as the amounts become due and payable or upon the receipt of cash.
• Collection is deemed probable. The Company conducts a credit review for all transactions at theinception of an arrangement to determine the creditworthiness of the customer. Collection isdeemed probable if, based upon the Company’s evaluation, it expects that the customer will beable to pay amounts under the arrangement as payments become due. If the Companydetermines that collection is not probable, revenues are deferred and recognized upon thereceipt of cash.
The Company enters into agreements to provide demand response solutions. Demand responserevenues are earned based on the Company’s ability to deliver committed capacity. Energy eventrevenue is contingent revenue earned based upon the actual amount of energy provided during theenergy event.
In accordance with SAB No. 104, the Company recognizes demand response revenue when it hasprovided verification to the grid operator or utility of its ability to deliver the committed capacity underthe agreement which entitles us to payments under the contract. Committed capacity is verified throughthe results of an actual demand response event or a measurement and verification test. Once thecapacity amount has been verified, the revenue is recognized and future revenue becomes fixed ordeterminable and is recognized monthly until the next demand response event or test. In subsequentverification events, if the Company’s verified capacity is below the previously verified amount, thecustomer will reduce future payments based on the adjusted verified capacity amounts. The payments
F-11
EnerNOC, INC.
NOTES TO CONSOLIDATED FINANCIAL STATEMENTS (Continued)
(in thousands, except share and per share data)
1. Description of Business, Basis of Presentation and Summary of Significant Accounting Policies(Continued)
received from the customer can be decreased or increased, up to the committed capacity amountsunder the agreement, in connection with subsequent verification events. Ongoing demand responserevenue recognized between demand response events or tests that are not subject to penalty orcustomer refund are recognized in revenue. If the revenue is subject to refund, the revenue is deferreduntil the liability is resolved.
In certain contracts, the Company receives both non refundable up-front payments for set up feesand monthly demand response fees. These up-front payments are deferred and recognized on astraight-line basis over the estimated customer life as a component of demand response revenue. Thecosts incurred for the customer set up are capitalized and included in property and equipment asdemand response equipment.
Revenue from energy events is recognized when earned. Energy event revenue is deemed to besubstantive and represents the culmination of a separate earnings process and is recognized when theenergy event is initiated by the customer.
On March 13, 2008, the California Public Utilities Commission (CPUC) issued an order denyingapproval of certain demand response contracts including the Company’s 160 MW contract withSouthern California Edison Company (SCE). Pursuant to the terms of the contract and as a result ofthe CPUC’s decision, the contract is expected to automatically terminate on April 30, 2008. This orderhas no impact on the Company’s historical financial statements.
Cost of Revenues
Cost of revenues for demand response solutions consists of payments to commercial, institutionaland industrial customers for their participation in demand response programs. The Company generallyenters into one to five year contracts with end-use customers under which it delivers recurring cashpayments to them for the capacity they commit to make available on demand. The Company also maymake an additional payment when a customer reduces consumption of energy from the electric powergrid. As of December 31, 2007 and 2006, the Company deferred $1,042 and $410 of corresponding costof deferred revenue, respectively, under these agreements.
Research and Development Expenses
Research and development costs incurred by the Company are expensed as incurred and primarilyconsist of salaries and benefits.
Stock-Based Compensation
As of December 31, 2007, the Company had one stock-based compensation plan, which is morefully described in Note 11. Through December 31, 2005, the Company accounted for its stock-basedawards to employees using the intrinsic value method prescribed in Accounting Principles Board (APB)Opinion No. 25, Accounting for Stock Issued to Employees, and related interpretations. Under theintrinsic value method, compensation expense was measured on the date of grant as the differencebetween the deemed fair value of the Company’s common stock and the stock option exercise price orrestricted stock award purchase price multiplied by the number of stock options or restricted stock
F-12

EnerNOC, INC.
NOTES TO CONSOLIDATED FINANCIAL STATEMENTS (Continued)
(in thousands, except share and per share data)
1. Description of Business, Basis of Presentation and Summary of Significant Accounting Policies(Continued)
awards granted. Generally, the Company grants stock-based awards with exercise prices equal to theestimated fair value of its common stock; however, to the extent that the deemed fair value of thecommon stock exceeds the exercise or purchase price of stock-based awards granted to employees onthe date of grant, the Company amortizes the expense over the vesting schedule of the awards,generally four years.
On January 1, 2006, the Company adopted SFAS No. 123(R), which is a revision of SFAS No. 123.SFAS No. 123(R) supersedes APB Opinion No. 25. Generally, the approach under SFAS No. 123(R) issimilar to the approach described in SFAS No. 123. However, SFAS No. 123(R) requires all share-based payments to employees, including grants of employee stock options, to be recognized in theincome statement based on their fair values. Pro forma disclosure is no longer an alternative.
SFAS No. 123(R) requires nonpublic companies that used the minimum value method in SFASNo. 123 for either recognition or pro forma disclosures to apply SFAS No. 123(R) using theprospective-transition method. As such, the Company will continue to apply APB Opinion No. 25 infuture periods to equity awards outstanding at the date of SFAS No. 123(R)’s adoption that weremeasured using the minimum value method. In accordance with the requirements of SFAS No. 123(R),the Company will not present pro forma disclosures for periods prior to the adoption of SFASNo. 123(R) as the estimated fair value of the Company’s stock options granted through December 31,2005 was determined using the minimum value method.
Effective with the adoption of SFAS No. 123(R), the Company has elected to use the Black-Scholes option pricing model to determine the weighted average fair value of stock options granted. InMarch 2005, the Securities and Exchange Commission issued SAB No. 107, Share-Based Payment,relating to SFAS No. 123(R). The Company has applied applicable provisions of SAB No. 107 in itsadoption of SFAS No. 123(R). In accordance with SFAS No. 123(R), the Company recognizes thecompensation cost of stock-based awards on a straight-line basis over the vesting period of the award.Stock based compensation to employees for the year ended December 31, 2007 and 2006 was $7,318and $303 (See Note 11), before income taxes.
The Company accounts for transactions in which services are received from non-employees inexchange for equity instruments based on the fair value of such services received or of the equityinstruments issued, whichever is more reliably measured, in accordance with SFAS No. 123, Accountingfor Stock-Based Compensation, and EITF No. 96-18, Accounting for Equity Instruments That Are Issuedto Other Than Employees for Acquiring, or in Conjunction With Selling, Goods or Services. During theyear ended December 31, 2007 and 2006, the Company recognized $279 and $64 of stock-basedcompensation to non-employees, respectively.
Recent Accounting Pronouncements
SFAS No. 141R, Business Combinations
In December 2007, the FASB issued Statement of Financial Accounting Standards No. 141(R),Business Combinations (SFAS No. 141R). SFAS 141R will significantly change the accounting for andreporting of business combination transactions in consolidated financial statements. SFAS 141R retainsthe fundamental requirements in Statement 141, Business Combinations while providing additional
F-13
EnerNOC, INC.
NOTES TO CONSOLIDATED FINANCIAL STATEMENTS (Continued)
(in thousands, except share and per share data)
1. Description of Business, Basis of Presentation and Summary of Significant Accounting Policies(Continued)
definitions, such as the definition of the acquirer in a purchase and improvements in the application ofhow the acquisition method is applied. This Statement becomes effective January 1, 2009. Earlyadoption is not permitted. The Company is currently evaluating the impact this guidance will have onits consolidated financial statements.
SFAS No. 157, Fair Value Measurements
In September 2006, the FASB issued SFAS No. 157, Fair Value Measurements (SFAS No. 157). Thisstatement defines fair value as used in numerous accounting pronouncements, establishes a frameworkfor measuring fair value in GAAP and expands disclosure related to the use of fair value measures infinancial statements. SFAS No. 157 does not expand the use of fair value measures in financialstatements, but standardizes its definition and guidance in GAAP. The standard emphasizes that fairvalue is a market-based measurement and not an entity-specific measurement based on an exchangetransaction in which the entity sells an asset or transfers a liability (exit price). SFAS No. 157establishes a fair value hierarchy from observable market data as the highest level to fair value basedon an entity’s own fair value assumptions as the lowest level. SFAS No. 157 became effective for theCompany’s financial statements starting January 1, 2008. It does not have a significant impact on theCompany’s results of operations and financial condition at this time.
SFAS No. 159, The Fair Value Option for Financial Assets and Financial Liabilities
In February 2007, the FASB issued SFAS No. 159, The Fair Value Option for Financial Assets andFinancial Liabilities. SFAS No. 159 provides an entity with the option, at specified election dates, tomeasure certain financial assets and liabilities and other items at fair value, with changes in fair valuerecognized in earnings as those changes occur. SFAS No. 159 also establishes presentation anddisclosure requirements that include displaying the fair value of those assets on the face of the balancesheet and providing management’s reasons for electing the fair value option for each eligible item. Theprovisions of SFAS No. 159 are effective beginning January 1, 2008. It does not have a significantimpact on the Company’s results of operations and financial condition at this time.
2. Acquisitions
Mdenergy, LLC
On September 13, 2007, the Company acquired all of the outstanding membership interests ofMdenergy, LLC (MDE), an energy procurement service provider, pursuant to the terms of a mergeragreement. The total purchase price paid by the Company at closing was approximately $7.9 million, ofwhich $3,501 was paid in cash and the remainder of which was paid by the issuance of 139,056 sharesof the Company’s common stock. Of the total shares of the Company’s common stock issued in thetransaction, 35,114 shares worth approximately $1,200 at the closing were deposited into an escrowfund to secure certain indemnification obligations of the former holders of MDE membership interests.
In addition to the amounts paid at closing, the Company was obligated to pay to the formerholders of MDE membership interests an earnout equal to two times the revenues of MDE’s businessduring the period from July 1, 2007 through December 31, 2007, such earnout to be payable in cash
F-14

EnerNOC, INC.
NOTES TO CONSOLIDATED FINANCIAL STATEMENTS (Continued)
(in thousands, except share and per share data)
2. Acquisitions (Continued)
during the first quarter of 2008. The contingent consideration, in the amount of approximately $3,357related to the earnout was paid in January of 2008 and was recorded as additional purchase price.
Pursuant to the merger agreement, the Company is also obligated to pay to certain employees ofMDE a cash bonus payment of up to $300 in the first quarter of 2008 and up to $600 in the firstquarter of 2009 upon the achievement of certain revenue-based milestones during 2007 and 2008,respectively. These payments are considered bonuses for post combination services and will beexpensed over the service period. The Company paid $300 related to this obligation in January of 2008.
The MDE acquisition has been accounted for under SFAS No. 141, Business Combinations. Theclosing of the MDE acquisition was September 13, 2007, and as such, the Company’s ConsolidatedFinancial Statements reflect MDE’s results of operations from that date forward.
The aggregate purchase price of $11,609 consists of the following:
Common stock, $0.001 par value . . . . . . . . . . . . . . . . . . . . . . . . . . . . . . . $ 4,751Cash . . . . . . . . . . . . . . . . . . . . . . . . . . . . . . . . . . . . . . . . . . . . . . . . . . . 6,525Acquisition related expenses . . . . . . . . . . . . . . . . . . . . . . . . . . . . . . . . . . 333
Total purchase price . . . . . . . . . . . . . . . . . . . . . . . . . . . . . . . . . . . . . . . . $11,609
The aggregate purchase price has been allocated to the acquired assets based on their fair valuesas determined by the Company as follows:
Total purchase price . . . . . . . . . . . . . . . . . . . . . . . . . . . . . . . . . . . . . . . . $11,609
Prepaid expenses and other current assets . . . . . . . . . . . . . . . . . . . . . . . . . $ 20Computer equipment . . . . . . . . . . . . . . . . . . . . . . . . . . . . . . . . . . . . . . . . 12Customer contracts . . . . . . . . . . . . . . . . . . . . . . . . . . . . . . . . . . . . . . . . . 2,400Employment agreements . . . . . . . . . . . . . . . . . . . . . . . . . . . . . . . . . . . . . 90
Net assets acquired . . . . . . . . . . . . . . . . . . . . . . . . . . . . . . . . . . . . . . . 2,522
Excess purchase price over the fair value of assets acquired . . . . . . . . . . . . $ 9,087
Supplemental Information
The following pro forma combined financial information is presented for comparative purposes forthe years ended December 31, 2007 and 2006 and gives effect to certain adjustments, includingamortization of the definite life intangible assets as if the acquisition occurred on January 1, 2006. Theinformation below is not necessarily indicative of the results of operations that would have actuallybeen reported had the purchase occurred at the beginning of the periods presented, nor is it necessarily
F-15

EnerNOC, INC.
NOTES TO CONSOLIDATED FINANCIAL STATEMENTS (Continued)
(in thousands, except share and per share data)
2. Acquisitions (Continued)
indicative of future financial position or results of operations (dollars in thousands, except per sharedata):
Year ended December 31,
2007 2006
Revenues . . . . . . . . . . . . . . . . . . . . . . . . . . . . . . . . . . . . . $ 62,714 $27,943
Net loss . . . . . . . . . . . . . . . . . . . . . . . . . . . . . . . . . . . . . . $(23,872) $(5,225)
Pro forma net loss per share—basic and diluted . . . . . . . . . $ (1.80) $ (1.39)
eBidenergy, Inc. & Celerity Energy Partners
On February 23, 2006, the Company entered into a purchase agreement with the secured creditorsof eBidenergy, Inc. or eBid, to purchase substantially all of the assets of the company for $52 consistingof $27 in cash paid at closing, 71,836 shares of common stock at the fair market value of the commonstock on the date thereof of $1.00 per share for a total value of $25 and an earn-out payment basedupon a percentage of the direct margin for new business between February 2006 and August 2008 fromthe leads identified by the seller. The Company does not believe any payment associated with theearn-out is probable. The former CEO of eBid is now an employee of the Company. eBid developedthe PowerTrak total energy management software platform that integrates real-time metering,monitoring, and control systems to bring value-added online energy procurement, data acquisition, anddata analysis services to its customers.
The eBid acquisition has been accounted for in accordance with SFAS No. 141. The closing date ofthe eBid acquisition was February 23, 2006, and as such, the Company’s consolidated financialstatements reflect eBid’s results of operations only from that date forward. The value of the acquiredassets, assumed liabilities, and identified intangibles from the acquisition of eBid, as presented below,are based upon management’s estimates of fair value as of the date of the acquisition.
On May 15, 2006, the Company entered into a purchase agreement with the shareholders ofCelerity Energy Partners or Celerity, to purchase certain assets of the company for approximately$3.0 million paid at closing. Celerity is the largest, proven demand response provider for electricutilities, power marketers and electric power users in California.
The Celerity acquisition has been accounted for in accordance with SFAS No. 141. The closingdate of the Celerity acquisition was May 15, 2006, and as such, the Company’s consolidated financialstatements reflect Celerity’s results of operations only from that date forward. The value of theacquired assets, assumed liabilities, and identified intangibles from the acquisition of Celerity, aspresented below, are based upon management’s estimates of fair value as of the date of the acquisition.
F-16

EnerNOC, INC.
NOTES TO CONSOLIDATED FINANCIAL STATEMENTS (Continued)
(in thousands, except share and per share data)
2. Acquisitions (Continued)
The purchase price allocation for our two acquisitions is as follows:
eBid Celerity
Total purchase price (including acquisition costs of $0 and $57,respectively) . . . . . . . . . . . . . . . . . . . . . . . . . . . . . . . . . . . . . . . . . $52 $3,057
Trade receivables . . . . . . . . . . . . . . . . . . . . . . . . . . . . . . . . . . . . . . . 5 —Property, plant & equipment . . . . . . . . . . . . . . . . . . . . . . . . . . . . . . 19 411Intangible assets . . . . . . . . . . . . . . . . . . . . . . . . . . . . . . . . . . . . . . . 33 1,918
Total assets acquired . . . . . . . . . . . . . . . . . . . . . . . . . . . . . . . . . . . . 57 2,329Accounts payable and accruals . . . . . . . . . . . . . . . . . . . . . . . . . . . . . (5) —
Net assets acquired . . . . . . . . . . . . . . . . . . . . . . . . . . . . . . . . . . . . . 52 2,329
Excess purchase price over the fair value of net assets acquired . . . . . $— $ 728
The excess of the purchase price over the fair value of the net assets acquired was recorded asgoodwill. The estimated amounts recorded as intangible assets consist of the following:
eBid Celerity
Contracts and customer relationships . . . . . . . . . . . . . . . . . . . . . . . . $— $1,918Software . . . . . . . . . . . . . . . . . . . . . . . . . . . . . . . . . . . . . . . . . . . . . 33 —
Total intangible assets . . . . . . . . . . . . . . . . . . . . . . . . . . . . . . . . . . . $33 $1,918
Customer relationships are subject to amortization over their estimated useful lives which reflectthe anticipated periods over which the Company estimates it will benefit from the acquired assets. TheCompany anticipates that substantially all of this amortization is deductible for income tax purposes.The Company is considering its options relative to the deductibility of goodwill and is unable at thistime to determine what portion, if any, will be deductible for income tax purposes.
Pro forma net loss and net loss per share are not presented because the impact of the acquisitionsof eBidenergy, Inc. and Celerity Energy Partners LLC were immaterial.
Pinpoint Power DR LLC
In May 2004, the Company entered into a purchase agreement (Purchase Agreement) to acquireall of the outstanding membership interests of Pinpoint Power DR LLC (PPDR) effective June 1, 2005.In connection with the execution of the Purchase Agreement, the Company also entered into anemployment agreement with the shareholder of PPDR (Related Former Shareholder).
In June 2004, PPDR executed two promissory notes in the aggregate of $1,400 subject to a securityagreement with the Company. If the notes were not fully paid by December 2005, the Company wouldbecome the owner of all of the assets of PPDR and no further obligations would be due to PPDR. Thenotes were fully paid in May 2005.
F-17
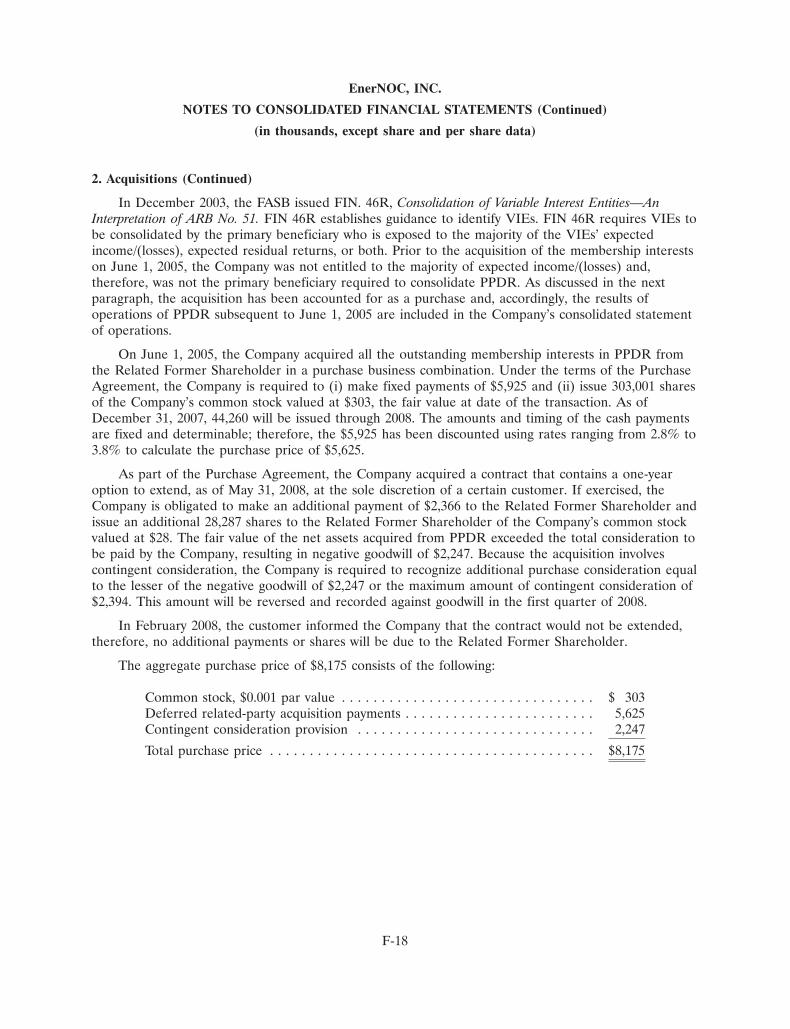
EnerNOC, INC.
NOTES TO CONSOLIDATED FINANCIAL STATEMENTS (Continued)
(in thousands, except share and per share data)
2. Acquisitions (Continued)
In December 2003, the FASB issued FIN. 46R, Consolidation of Variable Interest Entities—AnInterpretation of ARB No. 51. FIN 46R establishes guidance to identify VIEs. FIN 46R requires VIEs tobe consolidated by the primary beneficiary who is exposed to the majority of the VIEs’ expectedincome/(losses), expected residual returns, or both. Prior to the acquisition of the membership interestson June 1, 2005, the Company was not entitled to the majority of expected income/(losses) and,therefore, was not the primary beneficiary required to consolidate PPDR. As discussed in the nextparagraph, the acquisition has been accounted for as a purchase and, accordingly, the results ofoperations of PPDR subsequent to June 1, 2005 are included in the Company’s consolidated statementof operations.
On June 1, 2005, the Company acquired all the outstanding membership interests in PPDR fromthe Related Former Shareholder in a purchase business combination. Under the terms of the PurchaseAgreement, the Company is required to (i) make fixed payments of $5,925 and (ii) issue 303,001 sharesof the Company’s common stock valued at $303, the fair value at date of the transaction. As ofDecember 31, 2007, 44,260 will be issued through 2008. The amounts and timing of the cash paymentsare fixed and determinable; therefore, the $5,925 has been discounted using rates ranging from 2.8% to3.8% to calculate the purchase price of $5,625.
As part of the Purchase Agreement, the Company acquired a contract that contains a one-yearoption to extend, as of May 31, 2008, at the sole discretion of a certain customer. If exercised, theCompany is obligated to make an additional payment of $2,366 to the Related Former Shareholder andissue an additional 28,287 shares to the Related Former Shareholder of the Company’s common stockvalued at $28. The fair value of the net assets acquired from PPDR exceeded the total consideration tobe paid by the Company, resulting in negative goodwill of $2,247. Because the acquisition involvescontingent consideration, the Company is required to recognize additional purchase consideration equalto the lesser of the negative goodwill of $2,247 or the maximum amount of contingent consideration of$2,394. This amount will be reversed and recorded against goodwill in the first quarter of 2008.
In February 2008, the customer informed the Company that the contract would not be extended,therefore, no additional payments or shares will be due to the Related Former Shareholder.
The aggregate purchase price of $8,175 consists of the following:
Common stock, $0.001 par value . . . . . . . . . . . . . . . . . . . . . . . . . . . . . . . . $ 303Deferred related-party acquisition payments . . . . . . . . . . . . . . . . . . . . . . . . 5,625Contingent consideration provision . . . . . . . . . . . . . . . . . . . . . . . . . . . . . . 2,247
Total purchase price . . . . . . . . . . . . . . . . . . . . . . . . . . . . . . . . . . . . . . . . . $8,175
F-18
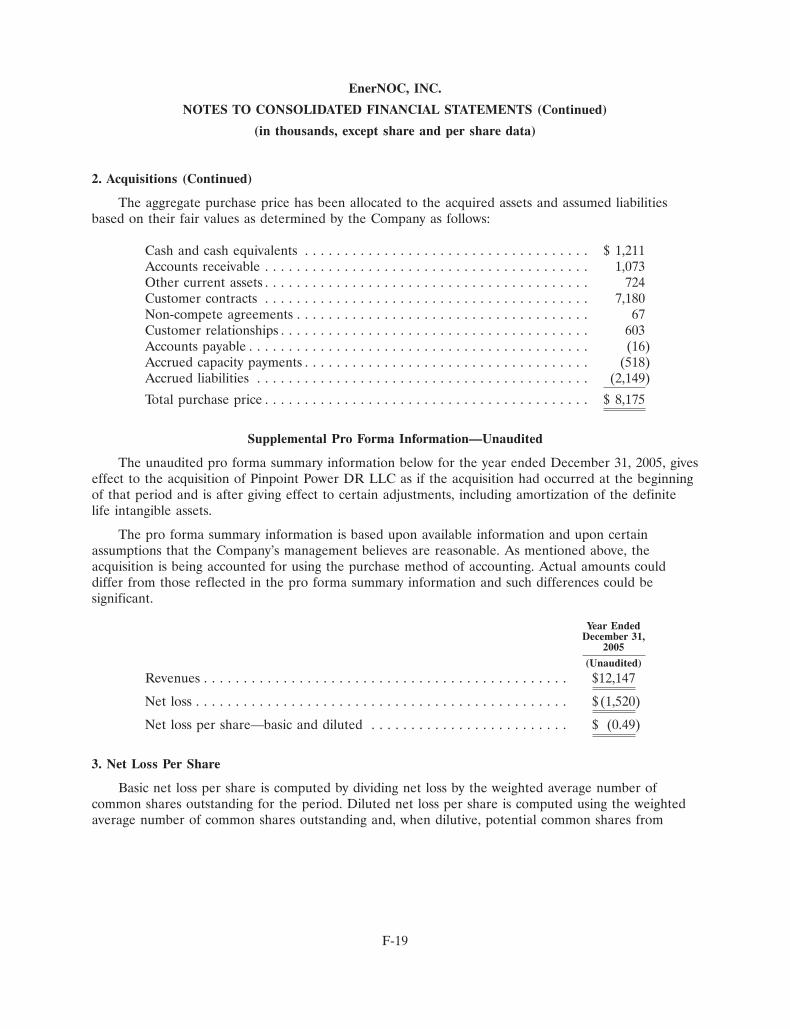
EnerNOC, INC.
NOTES TO CONSOLIDATED FINANCIAL STATEMENTS (Continued)
(in thousands, except share and per share data)
2. Acquisitions (Continued)
The aggregate purchase price has been allocated to the acquired assets and assumed liabilitiesbased on their fair values as determined by the Company as follows:
Cash and cash equivalents . . . . . . . . . . . . . . . . . . . . . . . . . . . . . . . . . . . . $ 1,211Accounts receivable . . . . . . . . . . . . . . . . . . . . . . . . . . . . . . . . . . . . . . . . . 1,073Other current assets . . . . . . . . . . . . . . . . . . . . . . . . . . . . . . . . . . . . . . . . . 724Customer contracts . . . . . . . . . . . . . . . . . . . . . . . . . . . . . . . . . . . . . . . . . 7,180Non-compete agreements . . . . . . . . . . . . . . . . . . . . . . . . . . . . . . . . . . . . . 67Customer relationships . . . . . . . . . . . . . . . . . . . . . . . . . . . . . . . . . . . . . . . 603Accounts payable . . . . . . . . . . . . . . . . . . . . . . . . . . . . . . . . . . . . . . . . . . . (16)Accrued capacity payments . . . . . . . . . . . . . . . . . . . . . . . . . . . . . . . . . . . . (518)Accrued liabilities . . . . . . . . . . . . . . . . . . . . . . . . . . . . . . . . . . . . . . . . . . (2,149)
Total purchase price . . . . . . . . . . . . . . . . . . . . . . . . . . . . . . . . . . . . . . . . . $ 8,175
Supplemental Pro Forma Information—Unaudited
The unaudited pro forma summary information below for the year ended December 31, 2005, giveseffect to the acquisition of Pinpoint Power DR LLC as if the acquisition had occurred at the beginningof that period and is after giving effect to certain adjustments, including amortization of the definitelife intangible assets.
The pro forma summary information is based upon available information and upon certainassumptions that the Company’s management believes are reasonable. As mentioned above, theacquisition is being accounted for using the purchase method of accounting. Actual amounts coulddiffer from those reflected in the pro forma summary information and such differences could besignificant.
Year EndedDecember 31,
2005
(Unaudited)
Revenues . . . . . . . . . . . . . . . . . . . . . . . . . . . . . . . . . . . . . . . . . . . . . . $12,147
Net loss . . . . . . . . . . . . . . . . . . . . . . . . . . . . . . . . . . . . . . . . . . . . . . . $ (1,520)
Net loss per share—basic and diluted . . . . . . . . . . . . . . . . . . . . . . . . . $ (0.49)
3. Net Loss Per Share
Basic net loss per share is computed by dividing net loss by the weighted average number ofcommon shares outstanding for the period. Diluted net loss per share is computed using the weightedaverage number of common shares outstanding and, when dilutive, potential common shares from
F-19
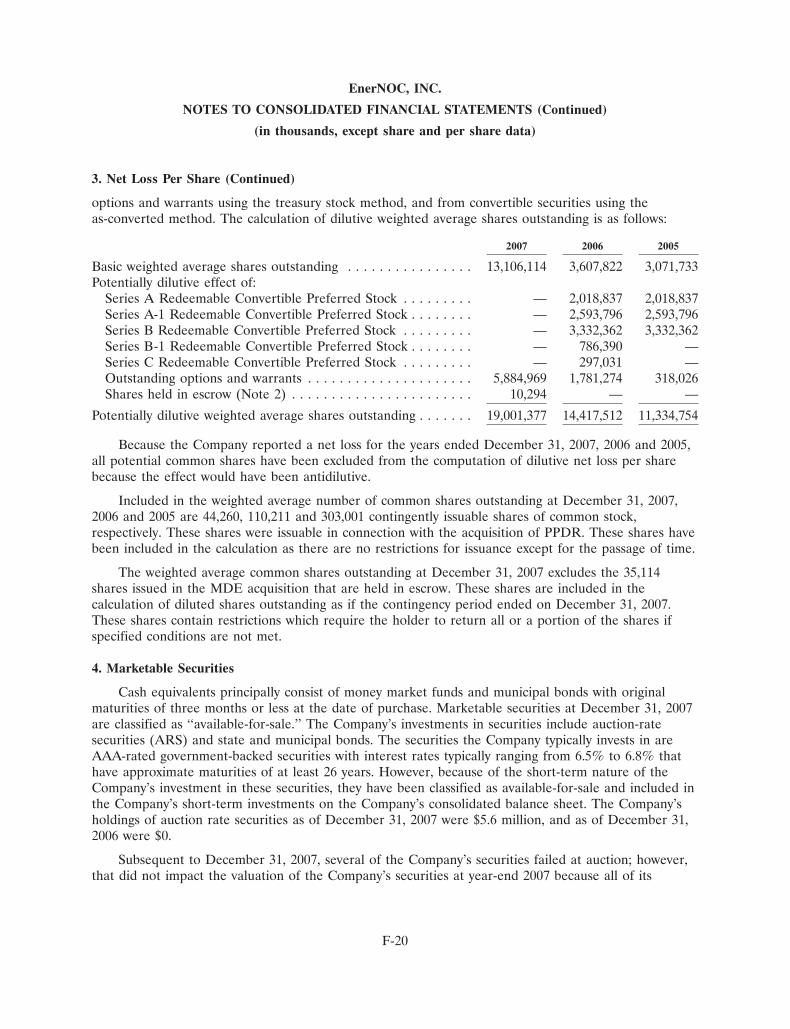
EnerNOC, INC.
NOTES TO CONSOLIDATED FINANCIAL STATEMENTS (Continued)
(in thousands, except share and per share data)
3. Net Loss Per Share (Continued)
options and warrants using the treasury stock method, and from convertible securities using theas-converted method. The calculation of dilutive weighted average shares outstanding is as follows:
2007 2006 2005
Basic weighted average shares outstanding . . . . . . . . . . . . . . . . 13,106,114 3,607,822 3,071,733Potentially dilutive effect of:
Series A Redeemable Convertible Preferred Stock . . . . . . . . . — 2,018,837 2,018,837Series A-1 Redeemable Convertible Preferred Stock . . . . . . . . — 2,593,796 2,593,796Series B Redeemable Convertible Preferred Stock . . . . . . . . . — 3,332,362 3,332,362Series B-1 Redeemable Convertible Preferred Stock . . . . . . . . — 786,390 —Series C Redeemable Convertible Preferred Stock . . . . . . . . . — 297,031 —Outstanding options and warrants . . . . . . . . . . . . . . . . . . . . . 5,884,969 1,781,274 318,026Shares held in escrow (Note 2) . . . . . . . . . . . . . . . . . . . . . . . 10,294 — —
Potentially dilutive weighted average shares outstanding . . . . . . . 19,001,377 14,417,512 11,334,754
Because the Company reported a net loss for the years ended December 31, 2007, 2006 and 2005,all potential common shares have been excluded from the computation of dilutive net loss per sharebecause the effect would have been antidilutive.
Included in the weighted average number of common shares outstanding at December 31, 2007,2006 and 2005 are 44,260, 110,211 and 303,001 contingently issuable shares of common stock,respectively. These shares were issuable in connection with the acquisition of PPDR. These shares havebeen included in the calculation as there are no restrictions for issuance except for the passage of time.
The weighted average common shares outstanding at December 31, 2007 excludes the 35,114shares issued in the MDE acquisition that are held in escrow. These shares are included in thecalculation of diluted shares outstanding as if the contingency period ended on December 31, 2007.These shares contain restrictions which require the holder to return all or a portion of the shares ifspecified conditions are not met.
4. Marketable Securities
Cash equivalents principally consist of money market funds and municipal bonds with originalmaturities of three months or less at the date of purchase. Marketable securities at December 31, 2007are classified as ‘‘available-for-sale.’’ The Company’s investments in securities include auction-ratesecurities (ARS) and state and municipal bonds. The securities the Company typically invests in areAAA-rated government-backed securities with interest rates typically ranging from 6.5% to 6.8% thathave approximate maturities of at least 26 years. However, because of the short-term nature of theCompany’s investment in these securities, they have been classified as available-for-sale and included inthe Company’s short-term investments on the Company’s consolidated balance sheet. The Company’sholdings of auction rate securities as of December 31, 2007 were $5.6 million, and as of December 31,2006 were $0.
Subsequent to December 31, 2007, several of the Company’s securities failed at auction; however,that did not impact the valuation of the Company’s securities at year-end 2007 because all of its
F-20
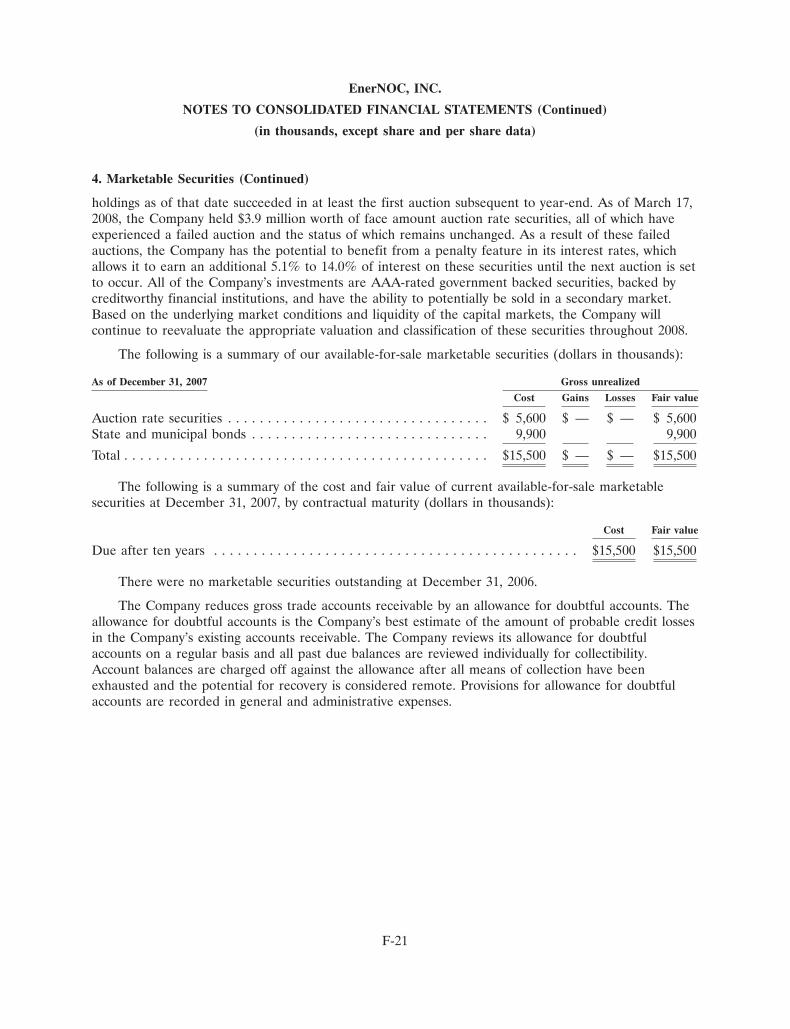
EnerNOC, INC.
NOTES TO CONSOLIDATED FINANCIAL STATEMENTS (Continued)
(in thousands, except share and per share data)
4. Marketable Securities (Continued)
holdings as of that date succeeded in at least the first auction subsequent to year-end. As of March 17,2008, the Company held $3.9 million worth of face amount auction rate securities, all of which haveexperienced a failed auction and the status of which remains unchanged. As a result of these failedauctions, the Company has the potential to benefit from a penalty feature in its interest rates, whichallows it to earn an additional 5.1% to 14.0% of interest on these securities until the next auction is setto occur. All of the Company’s investments are AAA-rated government backed securities, backed bycreditworthy financial institutions, and have the ability to potentially be sold in a secondary market.Based on the underlying market conditions and liquidity of the capital markets, the Company willcontinue to reevaluate the appropriate valuation and classification of these securities throughout 2008.
The following is a summary of our available-for-sale marketable securities (dollars in thousands):
As of December 31, 2007 Gross unrealized
Cost Gains Losses Fair value
Auction rate securities . . . . . . . . . . . . . . . . . . . . . . . . . . . . . . . . . $ 5,600 $ — $ — $ 5,600State and municipal bonds . . . . . . . . . . . . . . . . . . . . . . . . . . . . . . 9,900 9,900
Total . . . . . . . . . . . . . . . . . . . . . . . . . . . . . . . . . . . . . . . . . . . . . . $15,500 $ — $ — $15,500
The following is a summary of the cost and fair value of current available-for-sale marketablesecurities at December 31, 2007, by contractual maturity (dollars in thousands):
Cost Fair value
Due after ten years . . . . . . . . . . . . . . . . . . . . . . . . . . . . . . . . . . . . . . . . . . . . . . $15,500 $15,500
There were no marketable securities outstanding at December 31, 2006.
The Company reduces gross trade accounts receivable by an allowance for doubtful accounts. Theallowance for doubtful accounts is the Company’s best estimate of the amount of probable credit lossesin the Company’s existing accounts receivable. The Company reviews its allowance for doubtfulaccounts on a regular basis and all past due balances are reviewed individually for collectibility.Account balances are charged off against the allowance after all means of collection have beenexhausted and the potential for recovery is considered remote. Provisions for allowance for doubtfulaccounts are recorded in general and administrative expenses.
F-21
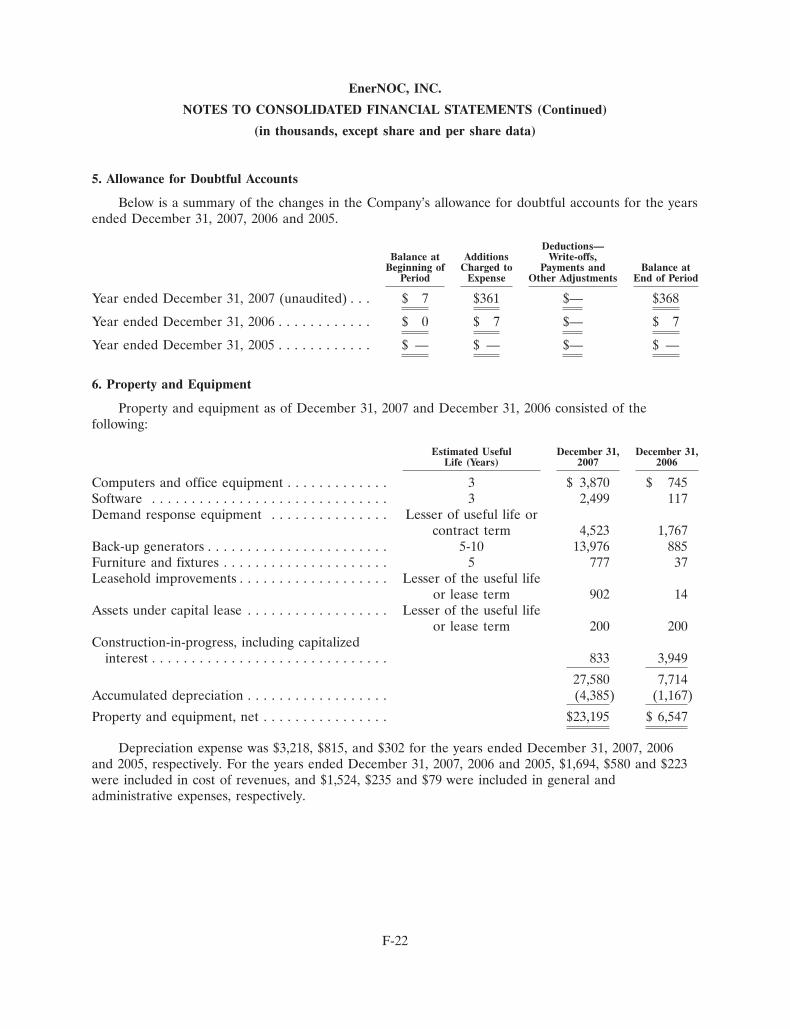
EnerNOC, INC.
NOTES TO CONSOLIDATED FINANCIAL STATEMENTS (Continued)
(in thousands, except share and per share data)
5. Allowance for Doubtful Accounts
Below is a summary of the changes in the Company’s allowance for doubtful accounts for the yearsended December 31, 2007, 2006 and 2005.
Deductions—Balance at Additions Write-offs,
Beginning of Charged to Payments and Balance atPeriod Expense Other Adjustments End of Period
Year ended December 31, 2007 (unaudited) . . . $ 7 $361 $— $368
Year ended December 31, 2006 . . . . . . . . . . . . $ 0 $ 7 $— $ 7
Year ended December 31, 2005 . . . . . . . . . . . . $ — $ — $— $ —
6. Property and Equipment
Property and equipment as of December 31, 2007 and December 31, 2006 consisted of thefollowing:
Estimated Useful December 31, December 31,Life (Years) 2007 2006
Computers and office equipment . . . . . . . . . . . . . 3 $ 3,870 $ 745Software . . . . . . . . . . . . . . . . . . . . . . . . . . . . . . 3 2,499 117Demand response equipment . . . . . . . . . . . . . . . Lesser of useful life or
contract term 4,523 1,767Back-up generators . . . . . . . . . . . . . . . . . . . . . . . 5-10 13,976 885Furniture and fixtures . . . . . . . . . . . . . . . . . . . . . 5 777 37Leasehold improvements . . . . . . . . . . . . . . . . . . . Lesser of the useful life
or lease term 902 14Assets under capital lease . . . . . . . . . . . . . . . . . . Lesser of the useful life
or lease term 200 200Construction-in-progress, including capitalized
interest . . . . . . . . . . . . . . . . . . . . . . . . . . . . . . 833 3,949
27,580 7,714Accumulated depreciation . . . . . . . . . . . . . . . . . . (4,385) (1,167)
Property and equipment, net . . . . . . . . . . . . . . . . $23,195 $ 6,547
Depreciation expense was $3,218, $815, and $302 for the years ended December 31, 2007, 2006and 2005, respectively. For the years ended December 31, 2007, 2006 and 2005, $1,694, $580 and $223were included in cost of revenues, and $1,524, $235 and $79 were included in general andadministrative expenses, respectively.
F-22

EnerNOC, INC.
NOTES TO CONSOLIDATED FINANCIAL STATEMENTS (Continued)
(in thousands, except share and per share data)
6. Property and Equipment (Continued)
Construction-in-progress consists principally of demand response equipment and back-upgenerators that have not been placed in service. Construction-in-progress at December 31, 2007 andDecember 31, 2006 consisted of the following:
December 31, December 31,2007 2006
Software . . . . . . . . . . . . . . . . . . . . . . . . . . . . . . . . . . . . . . . . . . . . . . . . . . $ — $ 786Back-up generators and demand response equipment . . . . . . . . . . . . . . . . . 778 3,036Capitalized interest . . . . . . . . . . . . . . . . . . . . . . . . . . . . . . . . . . . . . . . . . . 55 127
$833 $3,949
7. Goodwill and Intangible Assets, Net
The Company accounts for goodwill and other intangible assets under SFAS No. 141, BusinessCombinations, and SFAS No. 142, Goodwill and Other Intangible Assets. SFAS No. 141 requires that thepurchase method of accounting be used for all business combinations initiated after June 30, 2001, andthat certain intangible assets acquired in a business combination be recognized as assets apart fromgoodwill. Under SFAS No. 142, purchased goodwill and intangible assets with indefinite lives are nolonger amortized, but instead tested for impairment at least annually or whenever events or changes incircumstances indicate the carrying value may not be recoverable. Intangible assets with finite livescontinue to be amortized over their useful lives. The Company performed its annual impairment test asof December 31, 2007. Based on the results of the first step, the Company has determined that noimpairment had occurred, as the fair value of the reporting unit exceeded the respective carrying value.
Goodwill and intangible assets and accumulated amortization as of December 31, 2007 and 2006consisted of the following:
AmortizationPeriod 2007 2006
Goodwill . . . . . . . . . . . . . . . . . . . . . . . . . . . . . . . . . . . . . . . . . . . . . $ 9,815 $ 728
Amortizable intangible Asset:Customer Contracts . . . . . . . . . . . . . . . . . . . . . . . . . . . . . . . . . . . . . 4-10 years 11,497 9,098Software . . . . . . . . . . . . . . . . . . . . . . . . . . . . . . . . . . . . . . . . . . . . . 3 years 33 33Employment agreements and non-compete agreements . . . . . . . . . . . . 4 years 157 67Customer relationships . . . . . . . . . . . . . . . . . . . . . . . . . . . . . . . . . . . 3-5 years 603 603
12,290 9,801
Less accumulated amortization . . . . . . . . . . . . . . . . . . . . . . . . . . . . . (5,684) (3,397)
Intangible assets, net . . . . . . . . . . . . . . . . . . . . . . . . . . . . . . . . . . . . 6,606 6,404
Goodwill and intangibles, net . . . . . . . . . . . . . . . . . . . . . . . . . . . . . . $16,421 $ 7,132
Amortization expense related to intangible assets amounted to $2,287 and $2,230 for years endedDecember 31, 2007 and 2006, respectively. The intangible asset lives range from 3 to 10 years and the
F-23
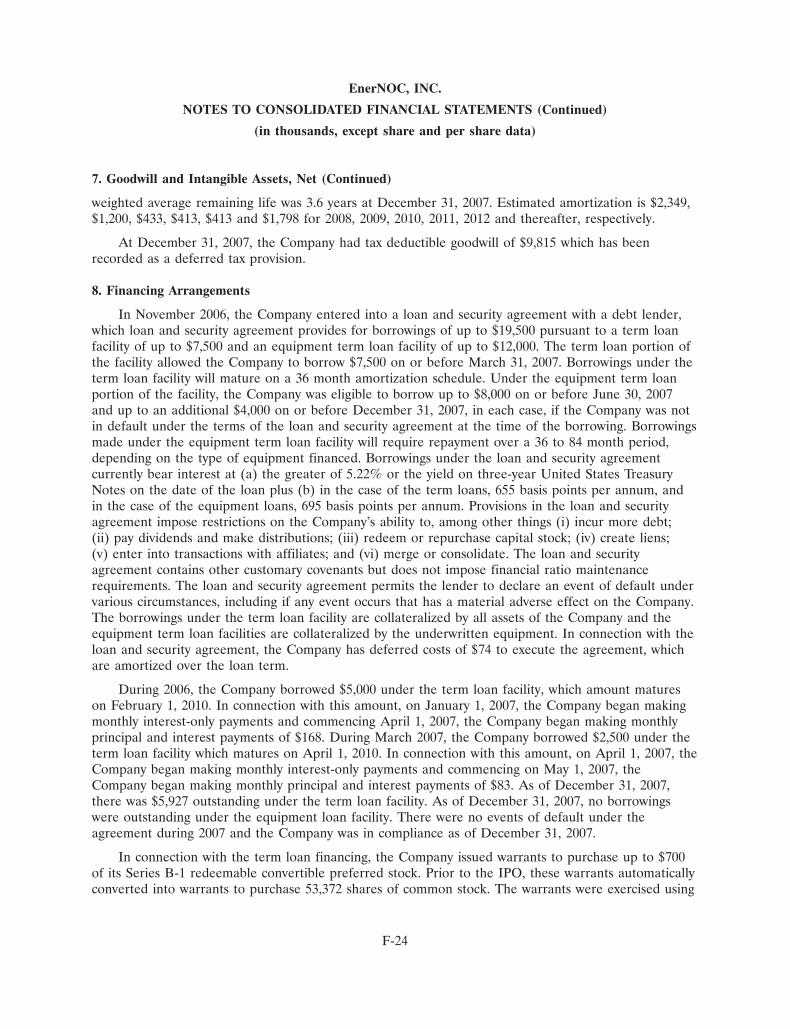
EnerNOC, INC.
NOTES TO CONSOLIDATED FINANCIAL STATEMENTS (Continued)
(in thousands, except share and per share data)
7. Goodwill and Intangible Assets, Net (Continued)
weighted average remaining life was 3.6 years at December 31, 2007. Estimated amortization is $2,349,$1,200, $433, $413, $413 and $1,798 for 2008, 2009, 2010, 2011, 2012 and thereafter, respectively.
At December 31, 2007, the Company had tax deductible goodwill of $9,815 which has beenrecorded as a deferred tax provision.
8. Financing Arrangements
In November 2006, the Company entered into a loan and security agreement with a debt lender,which loan and security agreement provides for borrowings of up to $19,500 pursuant to a term loanfacility of up to $7,500 and an equipment term loan facility of up to $12,000. The term loan portion ofthe facility allowed the Company to borrow $7,500 on or before March 31, 2007. Borrowings under theterm loan facility will mature on a 36 month amortization schedule. Under the equipment term loanportion of the facility, the Company was eligible to borrow up to $8,000 on or before June 30, 2007and up to an additional $4,000 on or before December 31, 2007, in each case, if the Company was notin default under the terms of the loan and security agreement at the time of the borrowing. Borrowingsmade under the equipment term loan facility will require repayment over a 36 to 84 month period,depending on the type of equipment financed. Borrowings under the loan and security agreementcurrently bear interest at (a) the greater of 5.22% or the yield on three-year United States TreasuryNotes on the date of the loan plus (b) in the case of the term loans, 655 basis points per annum, andin the case of the equipment loans, 695 basis points per annum. Provisions in the loan and securityagreement impose restrictions on the Company’s ability to, among other things (i) incur more debt;(ii) pay dividends and make distributions; (iii) redeem or repurchase capital stock; (iv) create liens;(v) enter into transactions with affiliates; and (vi) merge or consolidate. The loan and securityagreement contains other customary covenants but does not impose financial ratio maintenancerequirements. The loan and security agreement permits the lender to declare an event of default undervarious circumstances, including if any event occurs that has a material adverse effect on the Company.The borrowings under the term loan facility are collateralized by all assets of the Company and theequipment term loan facilities are collateralized by the underwritten equipment. In connection with theloan and security agreement, the Company has deferred costs of $74 to execute the agreement, whichare amortized over the loan term.
During 2006, the Company borrowed $5,000 under the term loan facility, which amount matureson February 1, 2010. In connection with this amount, on January 1, 2007, the Company began makingmonthly interest-only payments and commencing April 1, 2007, the Company began making monthlyprincipal and interest payments of $168. During March 2007, the Company borrowed $2,500 under theterm loan facility which matures on April 1, 2010. In connection with this amount, on April 1, 2007, theCompany began making monthly interest-only payments and commencing on May 1, 2007, theCompany began making monthly principal and interest payments of $83. As of December 31, 2007,there was $5,927 outstanding under the term loan facility. As of December 31, 2007, no borrowingswere outstanding under the equipment loan facility. There were no events of default under theagreement during 2007 and the Company was in compliance as of December 31, 2007.
In connection with the term loan financing, the Company issued warrants to purchase up to $700of its Series B-1 redeemable convertible preferred stock. Prior to the IPO, these warrants automaticallyconverted into warrants to purchase 53,372 shares of common stock. The warrants were exercised using
F-24

EnerNOC, INC.
NOTES TO CONSOLIDATED FINANCIAL STATEMENTS (Continued)
(in thousands, except share and per share data)
8. Financing Arrangements (Continued)
the net exercise method which resulted in the issuance by the Company of 26,447 shares of commonstock. There were no proceeds received by the Company related to this transaction.
The Company leases it office equipment under non-cancelable capital leases, which expire through2012. The majority of the office leases require payments for additional expenses such as taxes. Theannual maturities of long-term debt and capital lease obligations are as follows (in thousands):
Year: Total
2008 . . . . . . . . . . . . . . . . . . . . . . . . . . . . . . . . . . . . . . . . . . . . . . . . . . . . . $2,4512009 . . . . . . . . . . . . . . . . . . . . . . . . . . . . . . . . . . . . . . . . . . . . . . . . . . . . . 2,7692010 . . . . . . . . . . . . . . . . . . . . . . . . . . . . . . . . . . . . . . . . . . . . . . . . . . . . . 8382011 . . . . . . . . . . . . . . . . . . . . . . . . . . . . . . . . . . . . . . . . . . . . . . . . . . . . . 332012 . . . . . . . . . . . . . . . . . . . . . . . . . . . . . . . . . . . . . . . . . . . . . . . . . . . . . —Thereafter . . . . . . . . . . . . . . . . . . . . . . . . . . . . . . . . . . . . . . . . . . . . . . . . —
$6,091
Future minimum lease payments under capital leases of $157, excluding $43 of interest, areincluded in aggregate annual maturities shown above.
9. Stockholders’ Equity
Stock Split
On May 1, 2007, the Company effected a 2.831 for one split of its common stock. All financialinformation in the financial statements presented reflects the impact of this split.
Initial and Follow-On Public Offerings
On May 18, 2007, the Company completed its IPO. The IPO consisted of the sale of 4,312,500shares of common stock at a price of $26.00 per share. Of these 4,312,500 shares, 4,087,500 shares weresold in the IPO by the Company, including 562,500 shares sold pursuant to the exercise by theunderwriters of their over-allotment option, which exercise occurred in May 2007, and 225,000 shareswere sold by certain stockholders of the Company. Net proceeds to the Company from the IPO afterdeducting underwriters’ discounts and commissions and offering expenses were approximately $95,159.Upon closing of the IPO, all of the Company’s outstanding shares of convertible preferred stockconverted into an aggregate of 9,499,556 shares of common stock. Also in connection with the IPO,outstanding warrants to purchase Series B-1 redeemable convertible preferred stock were automaticallyconverted into warrants to purchase 26,477 shares of the Company’s common stock.
In November 2007, the Company completed its follow-on public offering of 2,500,000 shares of itscommon stock at a price of $43.00 per share. Of the 2,500,000 shares, the Company sold 500,000 sharesand selling stockholders sold 2,000,000 shares. This transaction resulted in net proceeds to theCompany of $19,446.
F-25

EnerNOC, INC.
NOTES TO CONSOLIDATED FINANCIAL STATEMENTS (Continued)
(in thousands, except share and per share data)
9. Stockholders’ Equity (Continued)
Redeemable Convertible Preferred Stock
In May 2006, the Company issued 277,778 shares of Series B-1 Redeemable Convertible PreferredStock at a price of $9.90 per share for net cash proceeds of $2,679, net of $71 in issuance costs.
In December 2006, the Company issued 104,921 shares of Series C Redeemable ConvertiblePreferred Stock at a price of $55.28 per share for net proceeds of $5,749, net of $51 in issuance costs.Of the proceeds, $800 were received in January 2007 and are classified on the accompanying financialstatements as Redeemable Convertible Preferred Stock subscription receivables.
In January 2007, the Company issued 166,425 shares of Series C Redeemable ConvertiblePreferred Stock for cash at a price of $55.28 per share, for total proceeds of approximately $9,200. TheSeries C Redeemable Convertible Preferred Stock was issued with substantively the same terms andconditions as the Series A, Series A-1, Series B Redeemable and Series B-1 Convertible PreferredStock.
The rights, preferences, and privileges of the Series A Redeemable Convertible Preferred Stock,the Series A-1 Redeemable Convertible Preferred Stock, the Series B Redeemable ConvertiblePreferred Stock, Series B-1 Redeemable Convertible Preferred Stock and the Series C RedeemableConvertible Preferred Stock (together, known as the Preferred Stock) are as follows:
Conversion
At the option of the holder, each share of Preferred Stock was convertible into the Company’scommon stock at the conversion price of $0.42 for the Series A Redeemable Convertible PreferredStock, $0.67 for the Series A-1 Redeemable Convertible Preferred Stock, $2.32 for the Series BRedeemable Convertible Preferred Stock, $3.50 for the Series B-1 Redeemable Convertible PreferredStock and $19.53 for the Series C Redeemable Convertible Preferred Stock at December 31, 2006, orthe equivalent price after adjustment for certain events defined in the Company’s Certificate ofIncorporation. The above conversion prices are consistent with the redemption value of the relatedPreferred Stock. Accordingly, the Preferred Stock was convertible into common stock at a one-for-onebasis.
Shares of the Preferred Stock automatically converted to common stock upon the closing of theCompany’s IPO of the Company’s common stock where the aggregate market capitalization of theCompany was at least $50,000 and the aggregate gross proceeds was at least $10,000. In connectionwith the IPO on May 18, 2007, the following Series of Preferred Stock were redeemed into commonstock, on a one-for-one basis: 2,018,837 shares of Series A, 2,593,796 shares of Series A-1, 3,332,362shares of Series B, 786,390 shares of Series B-1, and 768,181 shares of Series C.
Shares of the Preferred Stock also would have converted to common stock upon the writtenapproval of (i) in the case of each of the Series A Redeemable Convertible Preferred Stock and theSeries A-1 Redeemable Convertible Preferred Stock, the vote of the holders of a majority of therespective Series of Preferred Stock and (ii) in the case of the Series B Redeemable ConvertiblePreferred Stock and the Series B-1 Redeemable Convertible Preferred Stock, the vote of the holders ofa majority of the Series B Redeemable Convertible Preferred Stock and the Series B-1 RedeemableConvertible Preferred Stock, voting together as a single class.
F-26

EnerNOC, INC.
NOTES TO CONSOLIDATED FINANCIAL STATEMENTS (Continued)
(in thousands, except share and per share data)
9. Stockholders’ Equity (Continued)
Dividends
The holders of the Preferred Stock were entitled to receive, when and if declared by the Board,dividends at the per annum rate of 5% of the original issue price of each outstanding share of thePreferred Stock. The right to receive dividends on Preferred Stock is noncumulative. No dividends havebeen declared since inception.
Voting Rights
The holders of the Preferred Stock were entitled to the number of votes equal to the number ofcommon stock shares into which they are convertible. The Preferred Stockholders vote with thecommon stockholders as a single class, provided that a separate vote of each class was required incertain circumstances.
The holders of the Series A Redeemable Convertible Preferred Stock and the Series A-1Redeemable Convertible Preferred Stock, voting together as a single, separate class, were entitled toelect two directors to the Board and the holders of the Series B Redeemable Convertible PreferredStock and the Series B-1 Redeemable Convertible Preferred Stock, voting together as a single separateclass, were entitled to elect one director to the Board.
Liquidation, Dissolution, or Winding-up
Upon any liquidation, dissolution, or winding-up of the Company, whether voluntary orinvoluntary, and before any payment shall be made to the holders of the common stock or any stockranking on liquidation junior to the Preferred Stock, the holders of the shares of Series A RedeemablePreferred Stock shall be paid, pari passu, an amount equal to the original purchase price per share ofthe Preferred Stock plus, in the case of each share, an amount equal to dividends declared but unpaidthereon. If the assets of the Company are insufficient to pay the full preferential amounts to thepreferred stockholders, the assets will be distributed ratably among the holders of the Preferred Stockin proportion to their aggregate liquidation preference amounts.
Redemption
At any time subsequent to January 11, 2010, with the approval of the holders of at least 75% ofthe then-outstanding Preferred Stock, holders of shares of Preferred Stock may redeem the thenoutstanding shares of Preferred Stock by requiring the Company to pay in cash an amount equal to thegreater of the fair market value per share or the original issuance purchase price plus any declared butunpaid dividends thereon, computed to such redemption date. The payment will be made in threeequal annual installments beginning on the redemption date.
Common Stock
At December 31, 2007, the Company has authorized 50,000,000 shares of common stock, of which19,180,504 shares were outstanding and 2,022,581 shares have been reserved for issuance under theCompany’s stock option plan.
The holders of common stock are entitled to one vote per share.
F-27
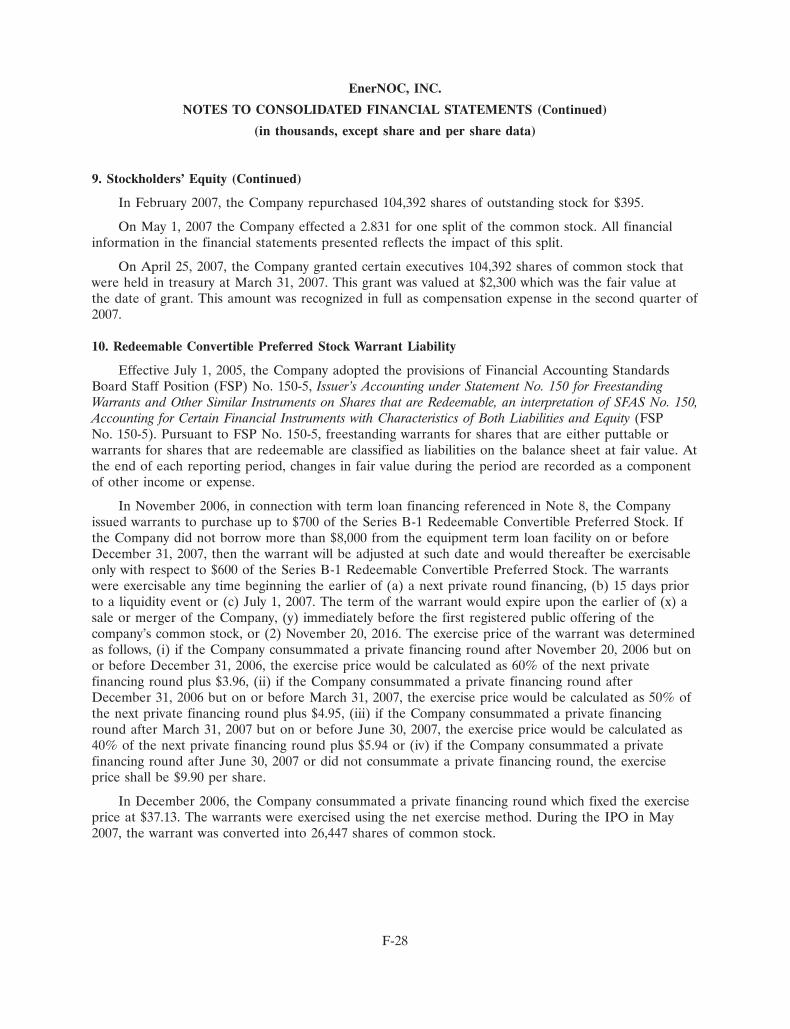
EnerNOC, INC.
NOTES TO CONSOLIDATED FINANCIAL STATEMENTS (Continued)
(in thousands, except share and per share data)
9. Stockholders’ Equity (Continued)
In February 2007, the Company repurchased 104,392 shares of outstanding stock for $395.
On May 1, 2007 the Company effected a 2.831 for one split of the common stock. All financialinformation in the financial statements presented reflects the impact of this split.
On April 25, 2007, the Company granted certain executives 104,392 shares of common stock thatwere held in treasury at March 31, 2007. This grant was valued at $2,300 which was the fair value atthe date of grant. This amount was recognized in full as compensation expense in the second quarter of2007.
10. Redeemable Convertible Preferred Stock Warrant Liability
Effective July 1, 2005, the Company adopted the provisions of Financial Accounting StandardsBoard Staff Position (FSP) No. 150-5, Issuer’s Accounting under Statement No. 150 for FreestandingWarrants and Other Similar Instruments on Shares that are Redeemable, an interpretation of SFAS No. 150,Accounting for Certain Financial Instruments with Characteristics of Both Liabilities and Equity (FSPNo. 150-5). Pursuant to FSP No. 150-5, freestanding warrants for shares that are either puttable orwarrants for shares that are redeemable are classified as liabilities on the balance sheet at fair value. Atthe end of each reporting period, changes in fair value during the period are recorded as a componentof other income or expense.
In November 2006, in connection with term loan financing referenced in Note 8, the Companyissued warrants to purchase up to $700 of the Series B-1 Redeemable Convertible Preferred Stock. Ifthe Company did not borrow more than $8,000 from the equipment term loan facility on or beforeDecember 31, 2007, then the warrant will be adjusted at such date and would thereafter be exercisableonly with respect to $600 of the Series B-1 Redeemable Convertible Preferred Stock. The warrantswere exercisable any time beginning the earlier of (a) a next private round financing, (b) 15 days priorto a liquidity event or (c) July 1, 2007. The term of the warrant would expire upon the earlier of (x) asale or merger of the Company, (y) immediately before the first registered public offering of thecompany’s common stock, or (2) November 20, 2016. The exercise price of the warrant was determinedas follows, (i) if the Company consummated a private financing round after November 20, 2006 but onor before December 31, 2006, the exercise price would be calculated as 60% of the next privatefinancing round plus $3.96, (ii) if the Company consummated a private financing round afterDecember 31, 2006 but on or before March 31, 2007, the exercise price would be calculated as 50% ofthe next private financing round plus $4.95, (iii) if the Company consummated a private financinground after March 31, 2007 but on or before June 30, 2007, the exercise price would be calculated as40% of the next private financing round plus $5.94 or (iv) if the Company consummated a privatefinancing round after June 30, 2007 or did not consummate a private financing round, the exerciseprice shall be $9.90 per share.
In December 2006, the Company consummated a private financing round which fixed the exerciseprice at $37.13. The warrants were exercised using the net exercise method. During the IPO in May2007, the warrant was converted into 26,447 shares of common stock.
F-28
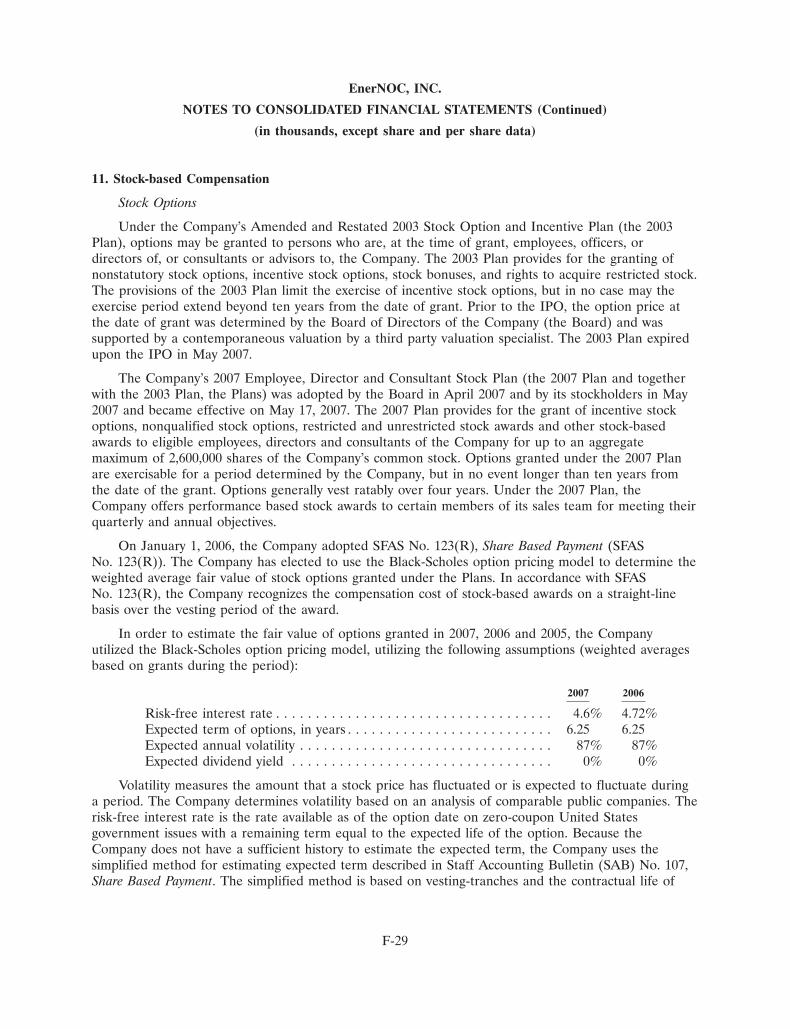
EnerNOC, INC.
NOTES TO CONSOLIDATED FINANCIAL STATEMENTS (Continued)
(in thousands, except share and per share data)
11. Stock-based Compensation
Stock Options
Under the Company’s Amended and Restated 2003 Stock Option and Incentive Plan (the 2003Plan), options may be granted to persons who are, at the time of grant, employees, officers, ordirectors of, or consultants or advisors to, the Company. The 2003 Plan provides for the granting ofnonstatutory stock options, incentive stock options, stock bonuses, and rights to acquire restricted stock.The provisions of the 2003 Plan limit the exercise of incentive stock options, but in no case may theexercise period extend beyond ten years from the date of grant. Prior to the IPO, the option price atthe date of grant was determined by the Board of Directors of the Company (the Board) and wassupported by a contemporaneous valuation by a third party valuation specialist. The 2003 Plan expiredupon the IPO in May 2007.
The Company’s 2007 Employee, Director and Consultant Stock Plan (the 2007 Plan and togetherwith the 2003 Plan, the Plans) was adopted by the Board in April 2007 and by its stockholders in May2007 and became effective on May 17, 2007. The 2007 Plan provides for the grant of incentive stockoptions, nonqualified stock options, restricted and unrestricted stock awards and other stock-basedawards to eligible employees, directors and consultants of the Company for up to an aggregatemaximum of 2,600,000 shares of the Company’s common stock. Options granted under the 2007 Planare exercisable for a period determined by the Company, but in no event longer than ten years fromthe date of the grant. Options generally vest ratably over four years. Under the 2007 Plan, theCompany offers performance based stock awards to certain members of its sales team for meeting theirquarterly and annual objectives.
On January 1, 2006, the Company adopted SFAS No. 123(R), Share Based Payment (SFASNo. 123(R)). The Company has elected to use the Black-Scholes option pricing model to determine theweighted average fair value of stock options granted under the Plans. In accordance with SFASNo. 123(R), the Company recognizes the compensation cost of stock-based awards on a straight-linebasis over the vesting period of the award.
In order to estimate the fair value of options granted in 2007, 2006 and 2005, the Companyutilized the Black-Scholes option pricing model, utilizing the following assumptions (weighted averagesbased on grants during the period):
2007 2006
Risk-free interest rate . . . . . . . . . . . . . . . . . . . . . . . . . . . . . . . . . . . 4.6% 4.72%Expected term of options, in years . . . . . . . . . . . . . . . . . . . . . . . . . . 6.25 6.25Expected annual volatility . . . . . . . . . . . . . . . . . . . . . . . . . . . . . . . . 87% 87%Expected dividend yield . . . . . . . . . . . . . . . . . . . . . . . . . . . . . . . . . 0% 0%
Volatility measures the amount that a stock price has fluctuated or is expected to fluctuate duringa period. The Company determines volatility based on an analysis of comparable public companies. Therisk-free interest rate is the rate available as of the option date on zero-coupon United Statesgovernment issues with a remaining term equal to the expected life of the option. Because theCompany does not have a sufficient history to estimate the expected term, the Company uses thesimplified method for estimating expected term described in Staff Accounting Bulletin (SAB) No. 107,Share Based Payment. The simplified method is based on vesting-tranches and the contractual life of
F-29
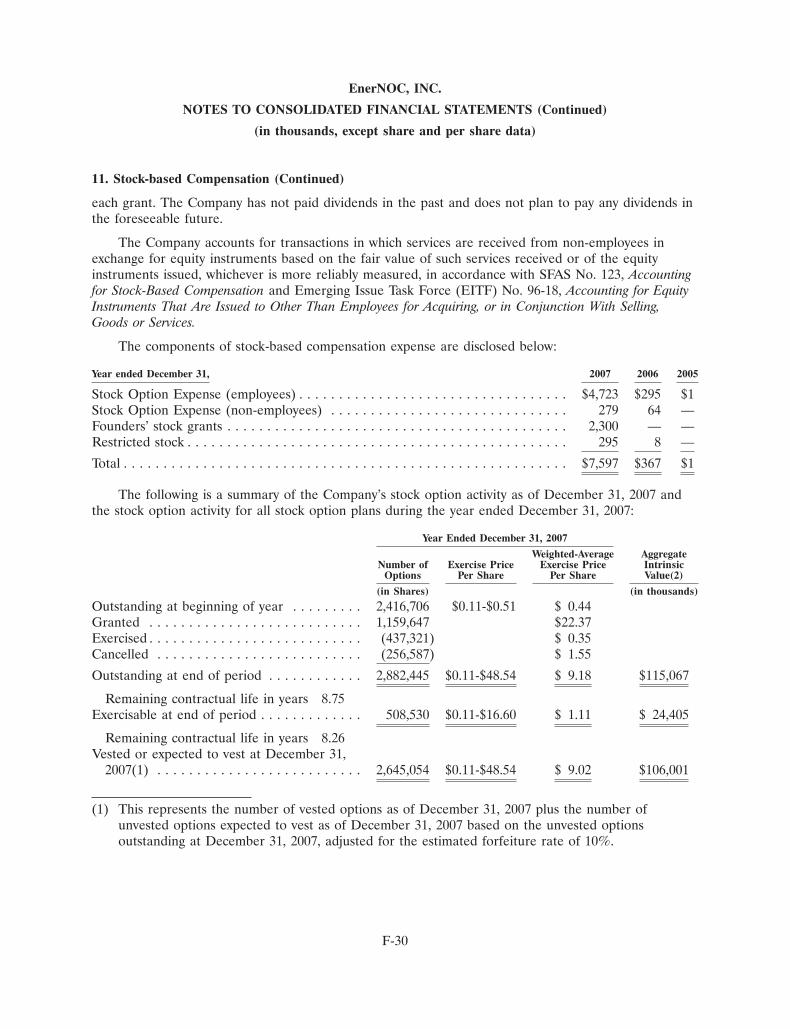
EnerNOC, INC.
NOTES TO CONSOLIDATED FINANCIAL STATEMENTS (Continued)
(in thousands, except share and per share data)
11. Stock-based Compensation (Continued)
each grant. The Company has not paid dividends in the past and does not plan to pay any dividends inthe foreseeable future.
The Company accounts for transactions in which services are received from non-employees inexchange for equity instruments based on the fair value of such services received or of the equityinstruments issued, whichever is more reliably measured, in accordance with SFAS No. 123, Accountingfor Stock-Based Compensation and Emerging Issue Task Force (EITF) No. 96-18, Accounting for EquityInstruments That Are Issued to Other Than Employees for Acquiring, or in Conjunction With Selling,Goods or Services.
The components of stock-based compensation expense are disclosed below:
Year ended December 31, 2007 2006 2005
Stock Option Expense (employees) . . . . . . . . . . . . . . . . . . . . . . . . . . . . . . . . . . $4,723 $295 $1Stock Option Expense (non-employees) . . . . . . . . . . . . . . . . . . . . . . . . . . . . . . 279 64 —Founders’ stock grants . . . . . . . . . . . . . . . . . . . . . . . . . . . . . . . . . . . . . . . . . . . 2,300 — —Restricted stock . . . . . . . . . . . . . . . . . . . . . . . . . . . . . . . . . . . . . . . . . . . . . . . . 295 8 —
Total . . . . . . . . . . . . . . . . . . . . . . . . . . . . . . . . . . . . . . . . . . . . . . . . . . . . . . . . $7,597 $367 $1
The following is a summary of the Company’s stock option activity as of December 31, 2007 andthe stock option activity for all stock option plans during the year ended December 31, 2007:
Year Ended December 31, 2007
Weighted-Average AggregateNumber of Exercise Price Exercise Price Intrinsic
Options Per Share Per Share Value(2)
(in Shares) (in thousands)
Outstanding at beginning of year . . . . . . . . . 2,416,706 $0.11-$0.51 $ 0.44Granted . . . . . . . . . . . . . . . . . . . . . . . . . . . 1,159,647 $22.37Exercised . . . . . . . . . . . . . . . . . . . . . . . . . . . (437,321) $ 0.35Cancelled . . . . . . . . . . . . . . . . . . . . . . . . . . (256,587) $ 1.55
Outstanding at end of period . . . . . . . . . . . . 2,882,445 $0.11-$48.54 $ 9.18 $115,067
Remaining contractual life in years 8.75Exercisable at end of period . . . . . . . . . . . . . 508,530 $0.11-$16.60 $ 1.11 $ 24,405
Remaining contractual life in years 8.26Vested or expected to vest at December 31,
2007(1) . . . . . . . . . . . . . . . . . . . . . . . . . . 2,645,054 $0.11-$48.54 $ 9.02 $106,001
(1) This represents the number of vested options as of December 31, 2007 plus the number ofunvested options expected to vest as of December 31, 2007 based on the unvested optionsoutstanding at December 31, 2007, adjusted for the estimated forfeiture rate of 10%.
F-30
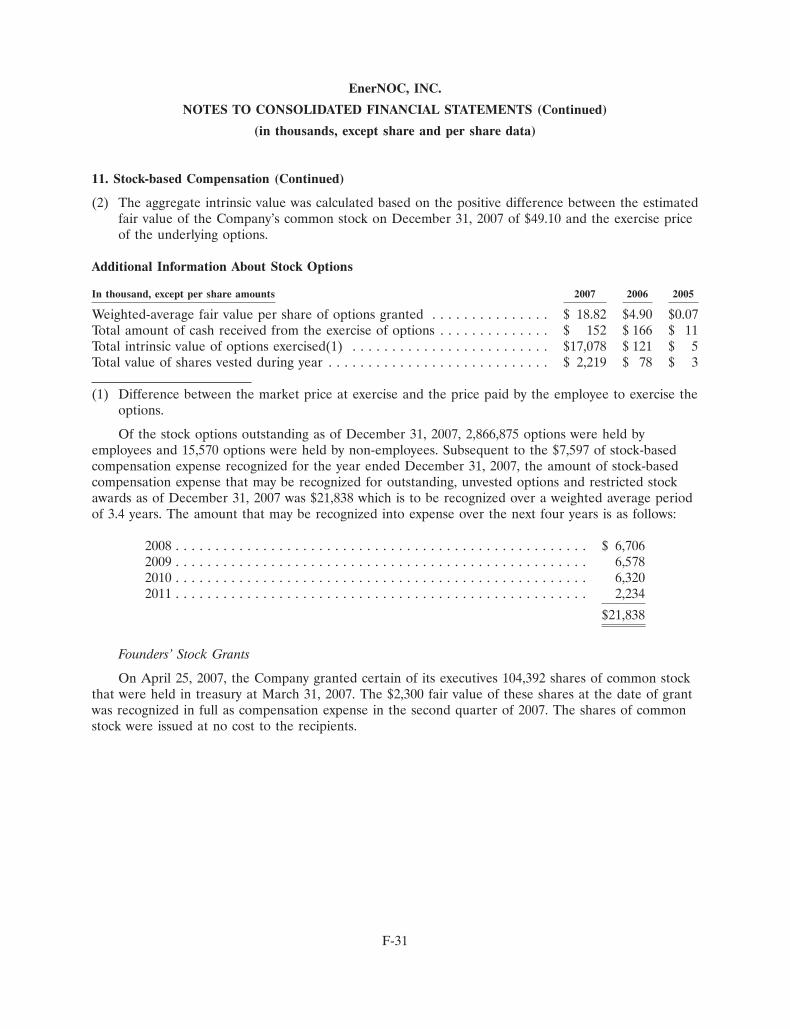
EnerNOC, INC.
NOTES TO CONSOLIDATED FINANCIAL STATEMENTS (Continued)
(in thousands, except share and per share data)
11. Stock-based Compensation (Continued)
(2) The aggregate intrinsic value was calculated based on the positive difference between the estimatedfair value of the Company’s common stock on December 31, 2007 of $49.10 and the exercise priceof the underlying options.
Additional Information About Stock Options
In thousand, except per share amounts 2007 2006 2005
Weighted-average fair value per share of options granted . . . . . . . . . . . . . . . $ 18.82 $4.90 $0.07Total amount of cash received from the exercise of options . . . . . . . . . . . . . . $ 152 $ 166 $ 11Total intrinsic value of options exercised(1) . . . . . . . . . . . . . . . . . . . . . . . . . $17,078 $ 121 $ 5Total value of shares vested during year . . . . . . . . . . . . . . . . . . . . . . . . . . . . $ 2,219 $ 78 $ 3
(1) Difference between the market price at exercise and the price paid by the employee to exercise theoptions.
Of the stock options outstanding as of December 31, 2007, 2,866,875 options were held byemployees and 15,570 options were held by non-employees. Subsequent to the $7,597 of stock-basedcompensation expense recognized for the year ended December 31, 2007, the amount of stock-basedcompensation expense that may be recognized for outstanding, unvested options and restricted stockawards as of December 31, 2007 was $21,838 which is to be recognized over a weighted average periodof 3.4 years. The amount that may be recognized into expense over the next four years is as follows:
2008 . . . . . . . . . . . . . . . . . . . . . . . . . . . . . . . . . . . . . . . . . . . . . . . . . . . . $ 6,7062009 . . . . . . . . . . . . . . . . . . . . . . . . . . . . . . . . . . . . . . . . . . . . . . . . . . . . 6,5782010 . . . . . . . . . . . . . . . . . . . . . . . . . . . . . . . . . . . . . . . . . . . . . . . . . . . . 6,3202011 . . . . . . . . . . . . . . . . . . . . . . . . . . . . . . . . . . . . . . . . . . . . . . . . . . . . 2,234
$21,838
Founders’ Stock Grants
On April 25, 2007, the Company granted certain of its executives 104,392 shares of common stockthat were held in treasury at March 31, 2007. The $2,300 fair value of these shares at the date of grantwas recognized in full as compensation expense in the second quarter of 2007. The shares of commonstock were issued at no cost to the recipients.
F-31
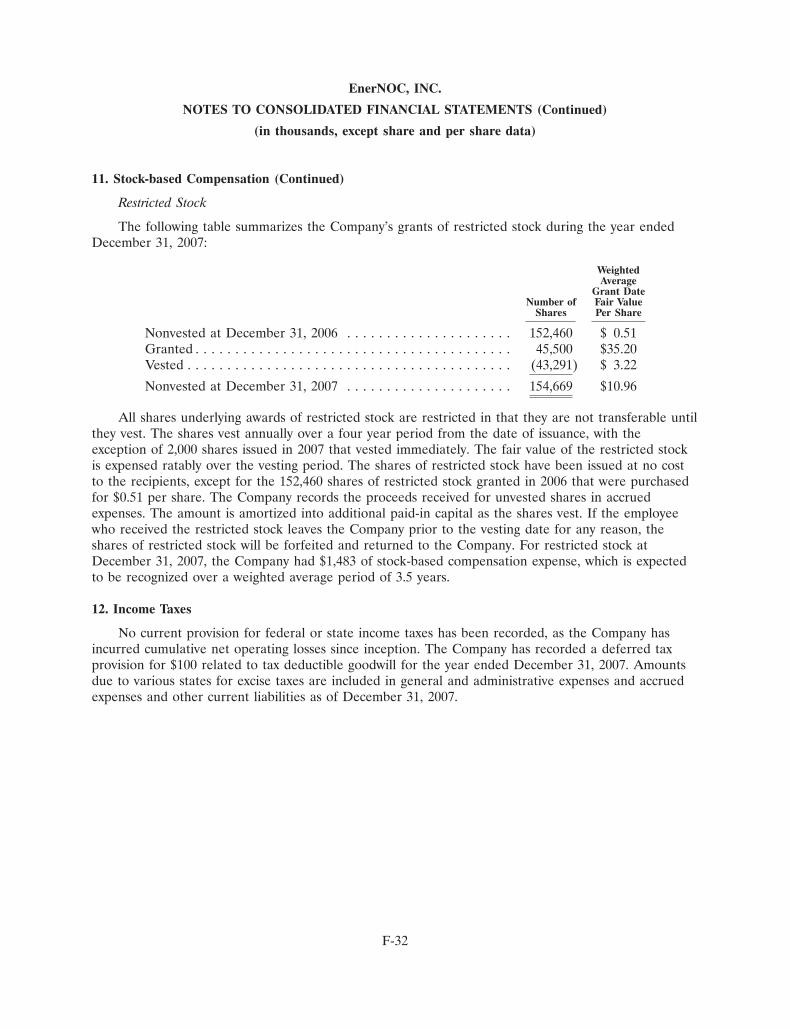
EnerNOC, INC.
NOTES TO CONSOLIDATED FINANCIAL STATEMENTS (Continued)
(in thousands, except share and per share data)
11. Stock-based Compensation (Continued)
Restricted Stock
The following table summarizes the Company’s grants of restricted stock during the year endedDecember 31, 2007:
WeightedAverage
Grant DateNumber of Fair Value
Shares Per Share
Nonvested at December 31, 2006 . . . . . . . . . . . . . . . . . . . . . 152,460 $ 0.51Granted . . . . . . . . . . . . . . . . . . . . . . . . . . . . . . . . . . . . . . . . 45,500 $35.20Vested . . . . . . . . . . . . . . . . . . . . . . . . . . . . . . . . . . . . . . . . . (43,291) $ 3.22
Nonvested at December 31, 2007 . . . . . . . . . . . . . . . . . . . . . 154,669 $10.96
All shares underlying awards of restricted stock are restricted in that they are not transferable untilthey vest. The shares vest annually over a four year period from the date of issuance, with theexception of 2,000 shares issued in 2007 that vested immediately. The fair value of the restricted stockis expensed ratably over the vesting period. The shares of restricted stock have been issued at no costto the recipients, except for the 152,460 shares of restricted stock granted in 2006 that were purchasedfor $0.51 per share. The Company records the proceeds received for unvested shares in accruedexpenses. The amount is amortized into additional paid-in capital as the shares vest. If the employeewho received the restricted stock leaves the Company prior to the vesting date for any reason, theshares of restricted stock will be forfeited and returned to the Company. For restricted stock atDecember 31, 2007, the Company had $1,483 of stock-based compensation expense, which is expectedto be recognized over a weighted average period of 3.5 years.
12. Income Taxes
No current provision for federal or state income taxes has been recorded, as the Company hasincurred cumulative net operating losses since inception. The Company has recorded a deferred taxprovision for $100 related to tax deductible goodwill for the year ended December 31, 2007. Amountsdue to various states for excise taxes are included in general and administrative expenses and accruedexpenses and other current liabilities as of December 31, 2007.
F-32

EnerNOC, INC.
NOTES TO CONSOLIDATED FINANCIAL STATEMENTS (Continued)
(in thousands, except share and per share data)
12. Income Taxes (Continued)
A reconciliation of income tax expense (benefit) at the statutory federal income tax rate andincome taxes as reflected in the consolidated financial statements is as follows:
Year Ended December 31,
2007 2006 2005
Federal income tax at statutory federal rate . . . . . . . . . . . . 34.0% 34.0% 34.0%Tax-deductible goodwill . . . . . . . . . . . . . . . . . . . . . . . . . . . (0.4) — —Stock-based compensation expense . . . . . . . . . . . . . . . . . . (5.4) (2.2) —Other . . . . . . . . . . . . . . . . . . . . . . . . . . . . . . . . . . . . . . . . (0.4) (0.3) (0.8)Change in valuation allowance . . . . . . . . . . . . . . . . . . . . . . (28.2) (31.5) (33.2)
(0.4)% 0.0% 0.0%
Deferred tax assets (liabilities) consisted of the following:
Year Ended December 31,
2007 2006
Deferred income tax assets:Net operating loss carryforwards . . . . . . . . . . . . . . . . . . . $ 9,515 $ 2,526Reserves and accruals . . . . . . . . . . . . . . . . . . . . . . . . . . . 280 80Deferred revenue . . . . . . . . . . . . . . . . . . . . . . . . . . . . . . 489 168Deferred rent . . . . . . . . . . . . . . . . . . . . . . . . . . . . . . . . . 48 28Intangible assets . . . . . . . . . . . . . . . . . . . . . . . . . . . . . . . 1,660 1,006Fixed assets . . . . . . . . . . . . . . . . . . . . . . . . . . . . . . . . . . (894) (119)Stock-based compensation expense . . . . . . . . . . . . . . . . . . 532 —Other . . . . . . . . . . . . . . . . . . . . . . . . . . . . . . . . . . . . . . . 12 3
11,642 3,692Valuation allowance . . . . . . . . . . . . . . . . . . . . . . . . . . . . . . (11,642) (3,692)
Net deferred tax assets . . . . . . . . . . . . . . . . . . . . . . . . . $ — $ —
Tax deductible goodwill . . . . . . . . . . . . . . . . . . . . . . . . . . . . $ (100) $ —
Deferred tax liability . . . . . . . . . . . . . . . . . . . . . . . . . . . . . . $ (100) $ —
Due to the uncertainty related to the ultimate use of the deferred income tax asset, the Companyhas provided a full valuation allowance for these tax benefits in 2007, 2006 and 2005. The valuationallowance increased $7,950 during the year, due primarily to the increase in the net operating losscarryforwards.
As of December 31, 2007, the Company has federal, state and local net operating losscarryforwards of $25,547 and $25,395, respectively, to offset future federal and state taxable income,which expire at various times through 2027. The net operating loss carryforwards may be subject to theannual limitations under the ‘‘Change of Ownership’’ rules provided in Internal Revenue Code (IRC)Sections 382. The Company’s net operating carryforwards at December 31, 2007 included $1,675 in
F-33
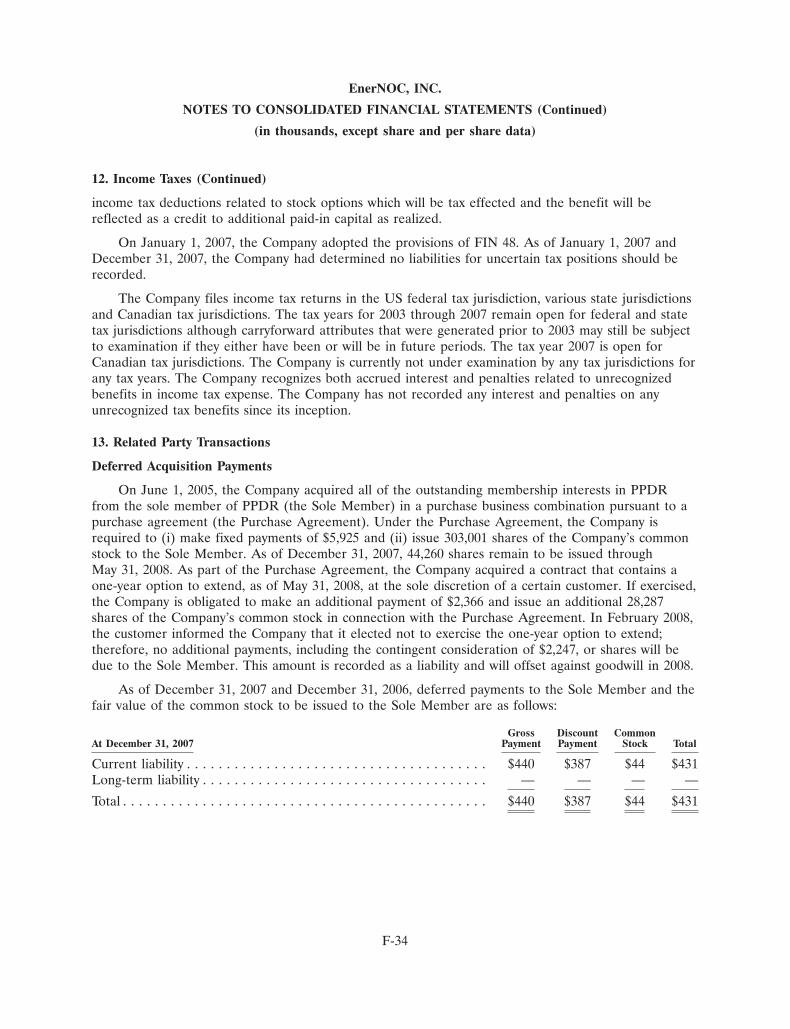
EnerNOC, INC.
NOTES TO CONSOLIDATED FINANCIAL STATEMENTS (Continued)
(in thousands, except share and per share data)
12. Income Taxes (Continued)
income tax deductions related to stock options which will be tax effected and the benefit will bereflected as a credit to additional paid-in capital as realized.
On January 1, 2007, the Company adopted the provisions of FIN 48. As of January 1, 2007 andDecember 31, 2007, the Company had determined no liabilities for uncertain tax positions should berecorded.
The Company files income tax returns in the US federal tax jurisdiction, various state jurisdictionsand Canadian tax jurisdictions. The tax years for 2003 through 2007 remain open for federal and statetax jurisdictions although carryforward attributes that were generated prior to 2003 may still be subjectto examination if they either have been or will be in future periods. The tax year 2007 is open forCanadian tax jurisdictions. The Company is currently not under examination by any tax jurisdictions forany tax years. The Company recognizes both accrued interest and penalties related to unrecognizedbenefits in income tax expense. The Company has not recorded any interest and penalties on anyunrecognized tax benefits since its inception.
13. Related Party Transactions
Deferred Acquisition Payments
On June 1, 2005, the Company acquired all of the outstanding membership interests in PPDRfrom the sole member of PPDR (the Sole Member) in a purchase business combination pursuant to apurchase agreement (the Purchase Agreement). Under the Purchase Agreement, the Company isrequired to (i) make fixed payments of $5,925 and (ii) issue 303,001 shares of the Company’s commonstock to the Sole Member. As of December 31, 2007, 44,260 shares remain to be issued throughMay 31, 2008. As part of the Purchase Agreement, the Company acquired a contract that contains aone-year option to extend, as of May 31, 2008, at the sole discretion of a certain customer. If exercised,the Company is obligated to make an additional payment of $2,366 and issue an additional 28,287shares of the Company’s common stock in connection with the Purchase Agreement. In February 2008,the customer informed the Company that it elected not to exercise the one-year option to extend;therefore, no additional payments, including the contingent consideration of $2,247, or shares will bedue to the Sole Member. This amount is recorded as a liability and will offset against goodwill in 2008.
As of December 31, 2007 and December 31, 2006, deferred payments to the Sole Member and thefair value of the common stock to be issued to the Sole Member are as follows:
Gross Discount CommonAt December 31, 2007 Payment Payment Stock Total
Current liability . . . . . . . . . . . . . . . . . . . . . . . . . . . . . . . . . . . . . . $440 $387 $44 $431Long-term liability . . . . . . . . . . . . . . . . . . . . . . . . . . . . . . . . . . . . — — — —
Total . . . . . . . . . . . . . . . . . . . . . . . . . . . . . . . . . . . . . . . . . . . . . . $440 $387 $44 $431
F-34

EnerNOC, INC.
NOTES TO CONSOLIDATED FINANCIAL STATEMENTS (Continued)
(in thousands, except share and per share data)
13. Related Party Transactions (Continued)
Gross Discount CommonAt December 31, 2006 Payment Payment Stock Total
Current liability . . . . . . . . . . . . . . . . . . . . . . . . . . . . . . . . . . . . $2,023 $1,923 $ 66 $1,989Long-term liability . . . . . . . . . . . . . . . . . . . . . . . . . . . . . . . . . . 440 356 44 400
Total . . . . . . . . . . . . . . . . . . . . . . . . . . . . . . . . . . . . . . . . . . . . $2,463 $2,279 $110 $2,389
14. Industry Segment Information
Based on qualitative and quantitative criteria established by SFAS No. 131 Disclosures aboutSegments of an Enterprise and Related Information, the Company operates within one reportablesegment.
During the years ended December 31, 2007, 2006 and 2005, the Company had certain customerswhose revenue individually represented 10% or more of the Company’s total revenues as follows:
Year Ended December 31
2007 2006 2005
% of Total % of Total % of TotalRevenues Revenues Revenues Revenues Revenues Revenues
Customer 1 . . . . . . . . . . . . . . . . . . . . . $36,617 60% $16,945 65% $8,420 86%Customer 2 . . . . . . . . . . . . . . . . . . . . . 12,666 21% 4,973 19% — 0%
Totals . . . . . . . . . . . . . . . . . . . . . . . . . $49,283 81% $21,918 84% $8,420 86%
Accounts receivable from these customers was approximately $8,696 and $3,597 at December 31,2007 and 2006, respectively.
15. Employee Savings and Retirement Plan
The Company has established a 401(k) Profit Sharing Plan and Trust (the 401(k) Plan) coveringsubstantially all employees. Once the employees have met the eligibility and participation requirementsunder the 401(k) Plan, employees may contribute a portion of their earnings to the 401(k) Plan to beinvested in various savings alternatives. Annually, at the discretion of the Board, the Company maymake matching contributions to the 401(k) Plan, which vests ratably over periods ranging from one tothree years. The Company has not made any matching contributions to the 401(k) Plan since inception.
16. Commitments and Contingencies
The Company leases it office facilities and equipment under non-cancelable operating leases, whichexpire through 2012. The majority of the office leases require payments for additional expenses such astaxes, maintenance, and utilities. Certain of the leases contain renewal options.
F-35
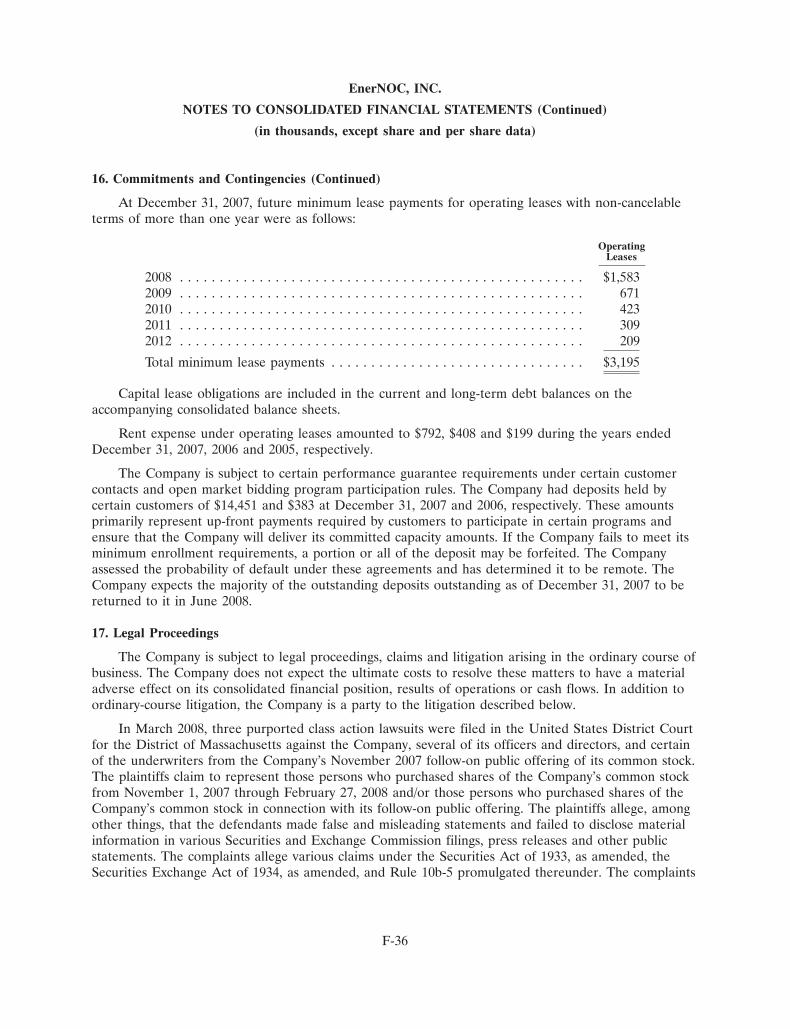
EnerNOC, INC.
NOTES TO CONSOLIDATED FINANCIAL STATEMENTS (Continued)
(in thousands, except share and per share data)
16. Commitments and Contingencies (Continued)
At December 31, 2007, future minimum lease payments for operating leases with non-cancelableterms of more than one year were as follows:
OperatingLeases
2008 . . . . . . . . . . . . . . . . . . . . . . . . . . . . . . . . . . . . . . . . . . . . . . . . . . . $1,5832009 . . . . . . . . . . . . . . . . . . . . . . . . . . . . . . . . . . . . . . . . . . . . . . . . . . . 6712010 . . . . . . . . . . . . . . . . . . . . . . . . . . . . . . . . . . . . . . . . . . . . . . . . . . . 4232011 . . . . . . . . . . . . . . . . . . . . . . . . . . . . . . . . . . . . . . . . . . . . . . . . . . . 3092012 . . . . . . . . . . . . . . . . . . . . . . . . . . . . . . . . . . . . . . . . . . . . . . . . . . . 209
Total minimum lease payments . . . . . . . . . . . . . . . . . . . . . . . . . . . . . . . . $3,195
Capital lease obligations are included in the current and long-term debt balances on theaccompanying consolidated balance sheets.
Rent expense under operating leases amounted to $792, $408 and $199 during the years endedDecember 31, 2007, 2006 and 2005, respectively.
The Company is subject to certain performance guarantee requirements under certain customercontacts and open market bidding program participation rules. The Company had deposits held bycertain customers of $14,451 and $383 at December 31, 2007 and 2006, respectively. These amountsprimarily represent up-front payments required by customers to participate in certain programs andensure that the Company will deliver its committed capacity amounts. If the Company fails to meet itsminimum enrollment requirements, a portion or all of the deposit may be forfeited. The Companyassessed the probability of default under these agreements and has determined it to be remote. TheCompany expects the majority of the outstanding deposits outstanding as of December 31, 2007 to bereturned to it in June 2008.
17. Legal Proceedings
The Company is subject to legal proceedings, claims and litigation arising in the ordinary course ofbusiness. The Company does not expect the ultimate costs to resolve these matters to have a materialadverse effect on its consolidated financial position, results of operations or cash flows. In addition toordinary-course litigation, the Company is a party to the litigation described below.
In March 2008, three purported class action lawsuits were filed in the United States District Courtfor the District of Massachusetts against the Company, several of its officers and directors, and certainof the underwriters from the Company’s November 2007 follow-on public offering of its common stock.The plaintiffs claim to represent those persons who purchased shares of the Company’s common stockfrom November 1, 2007 through February 27, 2008 and/or those persons who purchased shares of theCompany’s common stock in connection with its follow-on public offering. The plaintiffs allege, amongother things, that the defendants made false and misleading statements and failed to disclose materialinformation in various Securities and Exchange Commission filings, press releases and other publicstatements. The complaints allege various claims under the Securities Act of 1933, as amended, theSecurities Exchange Act of 1934, as amended, and Rule 10b-5 promulgated thereunder. The complaints
F-36
EnerNOC, INC.
NOTES TO CONSOLIDATED FINANCIAL STATEMENTS (Continued)
(in thousands, except share and per share data)
17. Legal Proceedings (Continued)
seek, among other relief, class certification, unspecified damages, fees, and such other relief as thecourt may deem just and proper.
The Company believes that it and the other defendants have substantial legal and factual defensesto the claims and allegations contained in the complaints, and the Company intends to pursue thesedefenses vigorously. There can be no assurance, however, that the Company will be successful, and anadverse resolution of any of the lawsuits could have a material effect on the Company’s consolidatedfinancial position and results of operations in the period in which a lawsuit is resolved. In addition,although the Company carries insurance for these types of claims, a judgment significantly in excess ofthe Company’s insurance coverage could materially and adversely affect the Company’s financialcondition, results of operations and cash flows. The Company is not presently able to reasonablyestimate potential losses, if any, related to the lawsuits.
F-37

(This page has been left blank intentionally.)
Exhibit Index
Number Exhibit Title
2.1 Membership Interest Purchase Agreement by and among EnerNOC, Inc., Pinpoint PowerDR LLC, Pinpoint Power LLC and Thomas E. Atkins, dated June 24, 2004, as amended,filed as Exhibit 2.1 to the Registrant’s Form S-1 filed February 12, 2007 (FileNo. 333-140632), is hereby incorporated by reference as Exhibit 2.1.
2.2 Agreement and Plan of Merger, dated as of September 12, 2007, by and amongEnerNOC, Inc., Mdenergy, LLC, MDE Acquisition LLC, Clifford Sirlin, in his capacity asthe Mdenergy, LLC members’ representative, Clifford Sirlin and Andrew Appelbaum, filedas Exhibit 2.1 to the Registrants Form 8-K filed September 18, 2007 (File No. 001-33471), ishereby incorporated by reference as Exhibit 2.2.
3.1 Amended and Restated Certificate of Incorporation of EnerNOC, Inc., filed as Exhibit 3.2to the Registrant’s Form S-1/A filed May 3, 2007 (File No. 333-140632), is herebyincorporated by reference as Exhibit 3.1.
3.2 Amended and Restated Bylaws of EnerNOC, Inc., filed as Exhibit 3.4 to the Registrant’sForm S-1/A filed May 3, 2007 (File No. 333-140632), is hereby incorporated by reference asExhibit 3.2.
4.1 Form of Specimen Common Stock Certificate, filed as Exhibit 4.1 to the Registrant’sForm S-1/A filed May 3, 2007 (File No. 333-140632), is hereby incorporated by reference asExhibit 4.1.
4.2 Fifth Amended and Restated Investor Rights Agreement, filed as Exhibit 4.1 to theRegistrant’s Form 10-Q filed November 5, 2007 (File No. 001-33471), is hereby incorporatedby reference as Exhibit 4.2.
10.1 Loan and Security Agreement, dated November 20, 2006 by and between Ritchie CapitalFinance, L.L.C. and EnerNOC, Inc., and Assignment to Bluecrest Capital Partners, L.P.,filed as Exhibit 10.1 to the Registrant’s Registration Statement on Form S-1 filedFebruary 12, 2007 (File No. 333-140632), is hereby incorporated by reference asExhibit 10.1.
10.2@* Amended and Restated Employment Agreement, dated as of August 10, 2007, by andbetween Timothy G. Healy and EnerNOC, Inc., together with Amendment No. 1 dated asof February 21, 2008.
10.3@* Amended and Restated Employment Agreement, dated as of August 10, 2007, by andbetween David B. Brewster and EnerNOC, Inc., together with Amendment No. 1 dated asof February 21, 2008.
10.4@ Form of Severance Agreement by and between EnerNOC, Inc. and Neal C. Isaacson,Gregg Dixon, Terrence Sick and David Samuels, filed as Exhibit 10.6 to the Registrant’sForm S-1 filed February 12, 2007 (File No. 333-140632), is hereby incorporated by referenceas Exhibit 10.4.
10.5@ Form of Amendment No. 1 to Form of Severance Agreement by and between EnerNOC,Inc, and Neal C. Isaacson, Gregg Dixon, Terrence Sick and David Samuels, filed asExhibit 10.3 to the Registrant’s Form 10-Q filed August 10, 2007 (File No. 001-33471), ishereby incorporated by reference as Exhibit 10.5.
10.6@ Employment Agreement, dated June 24, 2004 and as amended on July 1, 2005, by andbetween EnerNOC, Inc. and Thomas E. Atkins, as amended, filed as Exhibit 10.7 to theRegistrant’s Form S-1 filed February 12, 2007 (File No. 333-140632), is hereby incorporatedby reference as Exhibit 10.6.
10.7@ Sublease Agreement by and between Amdocs, Inc. and EnerNOC, Inc. dated October 3,2005, and First Amendment to Sublease Agreement, dated November 3, 2006, filed asExhibit 10.8 to the Registrant’s Form S-1 filed February 12, 2007 (File No. 333-140632), ishereby incorporated by reference as Exhibit 10.7.
Number Exhibit Title
10.8 Office Lease, dated as of December 10, 2007, between Transwestern Federal, L.L.C., asLandlord, and EnerNOC, Inc., as Tenant, filed as Exhibit 10.1 to the Registrant’s CurrentReport on Form 8-K filed December 12, 2007 (File No. 001-33471), is hereby incorporatedby reference as Exhibit 10.8.
10.9@ EnerNOC, Inc. Amended and Restated 2003 Stock Option and Incentive Plan, filed asExhibit 10.9 to the Registrant’s Registration Statement on Form S-1, as amended, filedMay 3, 2007 (File No. 333-140632), is hereby incorporated by reference as Exhibit 10.9.
10.10@ Form of Incentive Stock Option Agreement under the EnerNOC, Inc. 2003 Stock Optionand Incentive Plan, filed as Exhibit 10.10 to the Registrant’s Form S-1 filed February 12,2007 (File No. 333-140632), is hereby incorporated by reference as Exhibit 10.10.
10.11@ Form of Incentive Stock Option Agreement by and between EnerNOC, Inc. and Timothy G.Healy, David B. Brewster, Neal C. Isaacson, Gregg Dixon, Terrence Sick and DavidSamuels, filed as Exhibit 10.11 to the Registrant’s Registration Statement on Form S-1 filedFebruary 12, 2007 (File No. 333-140632), is hereby incorporated by reference asExhibit 10.11.
10.12@ Form of Amendment to Incentive Stock Option Agreement by and between EnerNOC, Inc.Timothy G. Healy, David B. Brewster, Neal C. Isaacson, Gregg Dixon, Terrence Sick andDavid Samuels, filed as Exhibit 10.12 to the Registrant’s Registration Statement onForm S-1 filed February 12, 2007 (File No. 333-140632), is hereby incorporated by referenceas Exhibit 10.12.
10.13@ EnerNOC, Inc. 2007 Employee, Director and Consultant Stock Plan, filed as Exhibit 10.14to the Registrant’s Registration Statement on Form S-1, as amended, filed May 3, 2007 (FileNo. 333-140632), is hereby incorporated by reference as Exhibit 10.13.
10.14@ Form of Incentive Stock Option Agreement under the EnerNOC, Inc. 2007 Employee,Director and Consultant Stock Plan, filed as Exhibit 10.15 to the Registrant’s RegistrationStatement on Form S-1, as amended, filed May 3, 2007 (File No. 333-140632), is herebyincorporated by reference as Exhibit 10.14.
10.15@ Form of Non-Qualified Stock Option Agreement under the EnerNOC, Inc. 2007 Employee,Director and Consultant Stock Plan, filed as Exhibit 10.16 to the Registrant’s RegistrationStatement on Form S-1, as amended, filed May 3, 2007 (File No. 333-140632), is herebyincorporated by reference as Exhibit 10.15.
10.16@ Form of Restricted Stock Agreement under the EnerNOC, Inc. 2007 Employee, Directorand Consultant Stock Plan, filed as Exhibit 10.17 to the Registrant’s Registration Statementon Form S-1, as amended, filed May 3, 2007 (File No. 333-140632), is hereby incorporatedby reference as Exhibit 10.16.
10.17@* Summary of 2008 Executive Officer Bonus Plan.10.18@ Agreement for Supplemental Installed Capacity Southwest Connecticut (LRP Resources),
dated April 13, 2004, by and between ISO New England Inc. and EnerNOC, Inc., filed asExhibit 10.18 to the Registrant’s Registration Statement on Form S-1, as amended, filedMarch 28, 2007 (File No. 333-140632), is hereby incorporated by reference as Exhibit 10.18.
10.19† Agreement for Supplemental Installed Capacity Southwest Connecticut (LRP Resources),dated April 15, 2004, by and between ISO New England Inc. and Pinpoint Power, LLC, asamended June 1, 2005, filed as Exhibit 10.19 to the Registrant’s Registration Statement onForm S-1, as amended, filed March 28, 2007 (File No. 333-140632), is hereby incorporatedby reference as Exhibit 10.19.
10.20† Agreement, dated March 3, 2006, by and between The Connecticut Light and PowerCompany and EnerNOC, Inc., as amended April 12, 2006, filed as Exhibit 10.20 to theRegistrant’s Registration Statement on Form S-1, as amended, filed March 28, 2007 (FileNo. 333-140632), is hereby incorporated by reference as Exhibit 10.20.

Number Exhibit Title
10.21† Demand Response Resource Purchase Agreement, by and between EnerNOC, Inc. andSouthern California Edison Company, dated September 27, 2007, filed as Exhibit 10.1 to theRegistrant’s Form 8-K/A filed October 12, 2007 (File No. 001-33471), is hereby incorporatedby reference as Exhibit 10.21.
10.22† Form of Indemnification Agreement between EnerNOC, Inc. and each of the directors andexecutive officers thereof, filed as Exhibit 10.21 to the Registrant’s Registration Statementon Form S-1, as amended, filed May 3, 2007 (File No. 333-140632), is hereby incorporatedby reference as Exhibit 10.22.
10.23* Offer Letter, dated as of December 19, 2007, by and between EnerNOC, Inc. and Darren P.Brady.
10.24@ Severance Agreement, dated as of January 22, 2008, by and between EnerNOC, Inc. andDarren P. Brady filed as Exhibit 10.1 to the Registrant’s Current Report on Form 8-K filedJanuary 24, 2008 (File No. 001-33471), is hereby incorporated by reference as Exhibit 10.24.
10.25@* Form of Executive Incentive Stock Option Agreement under the EnerNOC, Inc. 2007Employee, Director and Consultant Stock Plan.
10.26@* Form of Executive Non-Qualified Stock Option Agreement under the EnerNOC, Inc. 2007Employee, Director and Consultant Stock Plan.
21.1* Subsidiaries of EnerNOC, Inc.23.1* Consent of Ernst & Young LLP, Independent Registered Public Accounting Firm31.1* Certification of Chief Executive Officer of EnerNOC, Inc. pursuant to Rule 13a-14(a) or
Rule 15d-14(a) promulgated under the Securities Exchange Act of 1934, as amended.31.2* Certification of Chief Financial Officer of EnerNOC, Inc. pursuant to Rule 13a-14(a) or
Rule 15d-14(a) promulgated under the Securities Exchange Act of 1934, as amended.32.1* Certification of the Chief Executive Officer and Chief Financial Officer of EnerNOC, Inc.
pursuant to Rule 13a-14(b) promulgated under the Securities Exchange Act of 1934, asamended, and 18 U.S.C. Section 1350, as adopted pursuant to Section 906 of the Sarbanes-Oxley Act of 2002.
† Confidential portions of these documents have been filed separately with the Securities andExchange Commission pursuant to a grant of confidential treatment.
@ Management contract, compensatory plan or arrangement.
* Filed herewith

(This page has been left blank intentionally.)

Exhibit 23.1
Consent of Independent Registered Public Accounting Firm
We consent to the incorporation by reference in the Registration Statement (Form S-8No. 333-143906) pertaining to the Amended and Restated 2003 Stock Option and Incentive Plan andthe 2007 Employee, Director and Consultant Stock Plan of EnerNOC, Inc., of our report datedMarch 17, 2008, with respect to the consolidated financial statements of EnerNOC, Inc., included inthis Annual Report (Form 10-K) for the year ended December 31, 2007.
/s/ Ernst & Young LLP
Boston, MassachusettsMarch 25, 2008

Exhibit 31.1
CERTIFICATIONS UNDER SECTION 302
I, Timothy G. Healy, certify that:
1. I have reviewed this annual report on Form 10-K of EnerNOC, Inc.;
2. Based on my knowledge, this report does not contain any untrue statement of a material factor omit to state a material fact necessary to make the statements made, in light of the circumstancesunder which such statements were made, not misleading with respect to the period covered by thisreport;
3. Based on my knowledge, the financial statements, and other financial information included inthis report, fairly present in all material respects the financial condition, results of operations and cashflows of the registrant as of, and for, the periods presented in this report;
4. The registrant’s other certifying officer(s) and I are responsible for establishing andmaintaining disclosure controls and procedures (as defined in Exchange Act Rules 13a-15(e) and15d-15(e)) for the registrant and have:
a) Designed such disclosure controls and procedures, or caused such disclosure controls andprocedures to be designed under our supervision, to ensure that material information relating tothe registrant, including its consolidated subsidiaries, is made known to us by others within thoseentities, particularly during the period in which this report is being prepared;
b) [Paragraph omitted in accordance with SEC transition instructions contained in SECRelease No. 34-47986];
c) Evaluated the effectiveness of the registrant’s disclosure controls and procedures andpresented in this report our conclusions about the effectiveness of the disclosure controls andprocedures, as of the end of the period covered by this report based on such evaluation; and
d) Disclosed in this report any change in the registrant’s internal control over financialreporting that occurred during the registrant’s most recent fiscal quarter (the registrant’s fourthfiscal quarter in the case of an annual report) that has materially affected, or is reasonably likely tomaterially affect, the registrant’s internal control over financial reporting; and
5. The registrant’s other certifying officer(s) and I have disclosed, based on our most recentevaluation of internal control over financial reporting, to the registrant’s auditors and the auditcommittee of the registrant’s board of directors (or persons performing the equivalent functions):
a) All significant deficiencies and material weaknesses in the design or operation of internalcontrol over financial reporting which are reasonably likely to adversely affect the registrant’sability to record, process, summarize and report financial information; and
b) Any fraud, whether or not material, that involves management or other employees whohave a significant role in the registrant’s internal control over financial reporting.
Date: March 28, 2008
/s/ TIMOTHY G. HEALY
Timothy G. HealyChairman of the Board andChief Executive Officer
Exhibit 31.2
CERTIFICATIONS UNDER SECTION 302
I, Neal C. Isaacson, certify that:
1. I have reviewed this annual report on Form 10-K of EnerNOC, Inc.;
2. Based on my knowledge, this report does not contain any untrue statement of a material factor omit to state a material fact necessary to make the statements made, in light of the circumstancesunder which such statements were made, not misleading with respect to the period covered by thisreport;
3. Based on my knowledge, the financial statements, and other financial information included inthis report, fairly present in all material respects the financial condition, results of operations and cashflows of the registrant as of, and for, the periods presented in this report;
4. The registrant’s other certifying officer(s) and I are responsible for establishing andmaintaining disclosure controls and procedures (as defined in Exchange Act Rules 13a-15(e) and15d-15(e)) for the registrant and have:
a) designed such disclosure controls and procedures, or caused such disclosure controls andprocedures to be designed under our supervision, to ensure that material information relating tothe registrant, including its consolidated subsidiaries, is made known to us by others within thoseentities, particularly during the period in which this report is being prepared;
b) [Paragraph omitted in accordance with SEC transition instructions contained in SECrelease No. 34-47986];
c) Evaluated the effectiveness of the registrant’s disclosure controls and procedures andpresented in this report our conclusions about the effectiveness of the disclosure controls andprocedures, as of the end of the period covered by this report based on such evaluation; and
d) Disclosed in this report any change in the registrant’s internal control over financialreporting that occurred during the registrant’s most recent fiscal quarter (the registrant’s fourthfiscal quarter in the case of an annual report) that has materially affected, or is reasonably likely tomaterially affect, the registrant’s internal control over financial reporting; and
5. The registrant’s other certifying officer(s) and I have disclosed, based on our most recentevaluation of internal control over financial reporting, to the registrant’s auditors and the auditcommittee of the registrant’s board of directors (or persons performing the equivalent functions):
a) All significant deficiencies and material weaknesses in the design or operation of internalcontrol over financial reporting which are reasonably likely to adversely affect the registrant’sability to record, process, summarize and report financial information; and
b) Any fraud, whether or not material, that involves management or other employees whohave a significant role in the registrant’s internal control over financial reporting.
Date: March 28, 2008
/s/ NEAL C. ISAACSON
Neal C. IsaacsonChief Financial Officer
Exhibit 32.1
CERTIFICATIONS UNDER SECTION 906
Pursuant to section 906 of the Sarbanes-Oxley Act of 2002 (subsections (a) and (b) ofsection 1350, chapter 63 of title 18, United States Code), each of the undersigned officers ofEnerNOC, Inc., a Delaware corporation (the ‘‘Company’’), does hereby certify, to such officer’sknowledge, that:
The Annual Report for the year ended December 31, 2007 (the ‘‘Form 10-K’’) of the Companyfully complies with the requirements of Section 13(a) or 15(d) of the Securities Exchange Act of 1934,and the information contained in the Form 10-K fairly presents, in all material respects, the financialcondition and results of operations of the Company.
Dated: March 28, 2008
/s/ TIMOTHY G. HEALY
Timothy G. HealyChairman of the Board andChief Executive Officer
Dated: March 28, 2008
/s/ NEAL C. ISAACSON
Neal C. IsaacsonChief Financial Officer
A signed original of this written statement required by Section 906 has been provided to the Companyand will be retained by the Company and furnished to the Securities and Exchange Commission or itsstaff upon request.


Related Documents