ORIGINAL : FRENCH ANNUAL REPORT TRADE AMONG THE MEMBER STATES OF THE ORGANISATION OF ISLAMIC COOPERATION ISLAMIC CENTRE FOR DEVELOPMENT OF TRADE (ICDT) www.icdt‐oic.org

Welcome message from author
This document is posted to help you gain knowledge. Please leave a comment to let me know what you think about it! Share it to your friends and learn new things together.
Transcript
ORIGINAL : FRENCH
ANNUAL REPORT
TRADE AMONG THE MEMBER STATES
OF THE ORGANISATION OF ISLAMIC COOPERATION
ISLAMIC CENTRE FOR DEVELOPMENT OF TRADE (ICDT)
www.icdt‐oic.org
ICDT - Annual Report on Trade among the OIC Member States 2019-2020
2
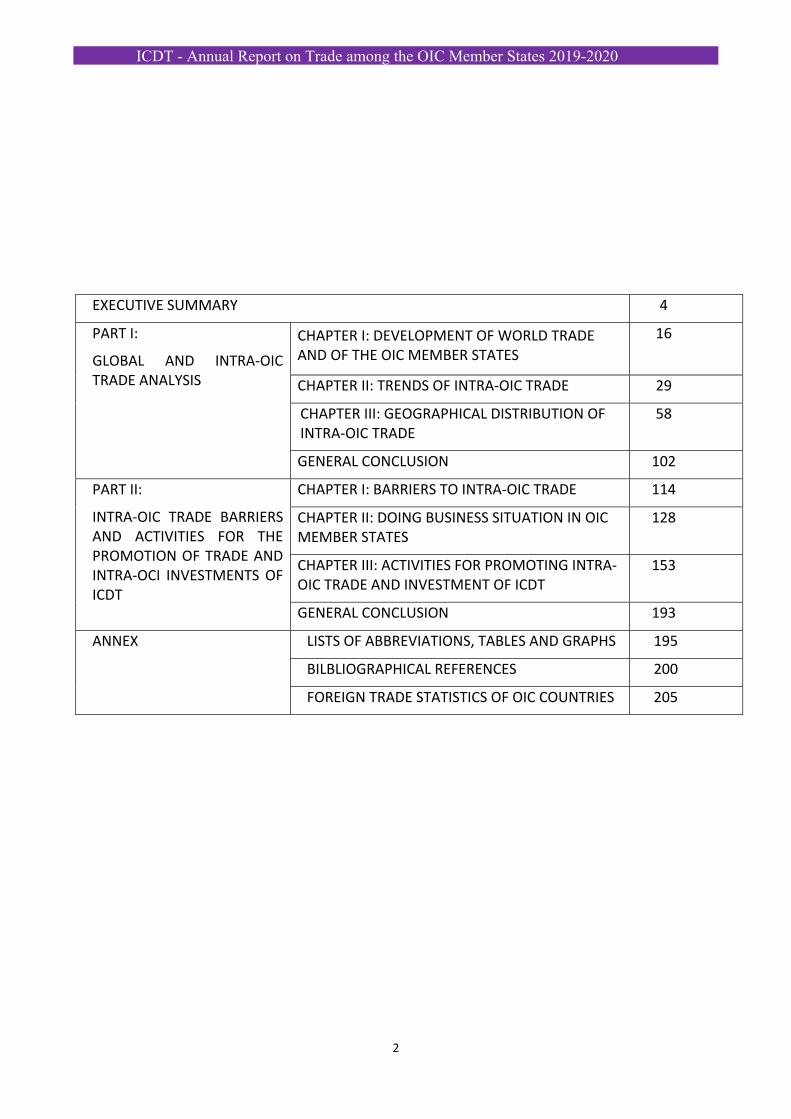
EXECUTIVE SUMMARY 4
PART I:
GLOBAL AND INTRA‐OIC TRADE ANALYSIS
CHAPTER I: DEVELOPMENT OF WORLD TRADE AND OF THE OIC MEMBER STATES
16
CHAPTER II: TRENDS OF INTRA‐OIC TRADE 29
CHAPTER III: GEOGRAPHICAL DISTRIBUTION OF INTRA‐OIC TRADE
58
GENERAL CONCLUSION 102
PART II:
INTRA‐OIC TRADE BARRIERS AND ACTIVITIES FOR THE PROMOTION OF TRADE AND INTRA‐OCI INVESTMENTS OF ICDT
CHAPTER I: BARRIERS TO INTRA‐OIC TRADE 114
CHAPTER II: DOING BUSINESS SITUATION IN OIC MEMBER STATES
128
CHAPTER III: ACTIVITIES FOR PROMOTING INTRA‐OIC TRADE AND INVESTMENT OF ICDT
153
GENERAL CONCLUSION 193
ANNEX LISTS OF ABBREVIATIONS, TABLES AND GRAPHS 195
BILBLIOGRAPHICAL REFERENCES 200
FOREIGN TRADE STATISTICS OF OIC COUNTRIES 205
ICDT - Annual Report on Trade among the OIC Member States 2019-2020
3
GLOBAL AND INTRA‐OIC TRADE ANALYSIS
ICDT - Annual Report on Trade among the OIC Member States 2019-2020
4
EXECUTIVE SUMMARY
I / RECENT DEVELOPMENTS OF THE WORLD ECONOMY:
According to IMF data (Outlook, April 2020) global growth forecasts from 2019 to 2020 have declined from 2.90 to ‐4.9% respectively due to the negative impact of COVID‐19 pandemic on low income households and lockdown in the first and second quarters of 2020 and also effects of tariff increases adopted in the United States and China in early 2019. This decrease was reinforced by the introduction by Germany new fuel emission standards and natural disasters in Japan and Italy concerning sovereign and financial risks which contributed to strengthening domestic demand but also weakened the financial market in certain emerging countries.
Besides, the world growth could reach 5.4% in 2021, after mastering the pandemic outbreak in many countries through the international cooperation supply chain in medical and food products to assist vulnerable countries in collaboration with the private sector. This collaboration will generate supplies of medicines, protective equipment, manufacturing essential products to limit of the outbreak of the virus and supporting national public health systems.
The growth of emerging markets and developing economies is also impacted and reached 3.7% in 2019 and declined by 3% in 2020 and to increase by 5.9% in 2021 by a possibly recovery of some countries such as China, India, ASEAN‐5, Russia, Mexico, Saudi Arabia, Nigeria, etc… according the IMF Projections.
The growth of the OIC Member States is expected to decline by 3.7% in 2017 and 2.4% in 2019 and progress to around 3.8% in 2020. The OIC GDP was 19.5 trillion $ in 2017 against 20.6 trillion $ in 2018 accounting for 15.2% of World GDP. In 2018, GDP growth of more than 5% was recorded in the following countries: Guinea, Côte d'Ivoire, Turkey, Tajikistan, Djibouti, Senegal, Bangladesh, Turkmenistan, Burkina Faso, Maldives, Malaysia, Guinea‐Bissau, Benin, Pakistan, Mali, Uzbekistan, Niger and Indonesia.
According SESRIC projections, the OIC average per capita income level is also expected to decrease by $ 11,500 in 2019 to $ 11,100 in 2020, i.e. 3.4% decline.
Globally, economies are connected to each other through cross‐border flows and bilateral, regional and international relations, COVID‐19 will have an impact on their transactions in goods, services, technology transfer, and project financing, technical assistance, movement of professionals, financial capital, direct foreign investment, international banking and exchange rates.
International trade is surely one of the leading mechanisms through which the virus damages domestic economies and spreads internationally. COVID‐19 contributed to the factory and company’s closures particularly SMEs including SMIs, temporary travel and exports bans and restrictions, border closings, catering services and tourism‐related services bans and will reduce exports of services to affected countries including OIC Member Countries.
According to World Bank analysis, many OIC Member Countries are from Sub‐Saharan Africa (SSA) and the Middle East and North Africa (MENA) are the least affected. Their estimated loss of GDP is estimated at around 3% and the rest of South Asia by 4.6% due to soaring prices for oil, mines, chemicals and food in this region. In countries like Indonesia and Malaysia, their GDP will drop by 3.50% and 4.23% respectively.
ICDT - Annual Report on Trade among the OIC Member States 2019-2020
5
The coronavirus will have a negative impact on several levels: restrictions on the movement of people, disruptions in supply chains around the world, and negative effects on confidence, financial markets and the travel industry. A barrel went from 70 to 23 $ a barrel during the health crisis. The average petroleum spot prices per barrel are estimated at $36.20 in 2020 and $37.50 in 2021. This sharp drop in oil prices combined with lower global growth (and investor mistrust of the future) ultimately rippled through the financial markets.
Several countries and regional and international organizations have injected funds to relieve populations and structures to mitigate the effect of this health crisis by several billion dollars.
In this regard, OIC General Secretariat, OIC Member Countries governments, Institutions and International partners are joining their efforts to tackle this COVID‐19 pandemic depending on the nature of the shock and country‐specific circumstances by injecting funds at national, regional and international levels reaching globally many $ trillion.
In the same vein and during the Extraordinary Videoconference of the OIC Executive Committee at the Level of Foreign Ministers on the Consequences of the Novel Coronavirus Disease (COVID‐19) Pandemic and Joint Response held on 22nd April 2020, it was requested to convene an establishment of a Committee of the Permanent Representatives (CPR) with a participation of the relevant OIC institutions in order to follow up the efforts and initiatives towards assisting Member States in their respective response.
Besides, IsDB has launched a US$2.2 billion Strategic Preparedness and Response Program to counter the coronavirus disease (COVID‐19) pandemic through supporting the efforts to prevent, contain, mitigate, and recover from its impacts.
Besides, ITFC provides also $850 Million to help OIC Countries to fight COVID‐19 pandemic for two years within the framework of the Rapid Response Initiative ($ 300 Million) and the Recovery Response Program ($550 Million) and the Arab‐Africa Trade Bridge. This programme was implemented in collaboration with Moroccan Company SMAAR in order to share knowledge and best practices on the online platform with more than 130 African Physicians teams through webinars from 18 OIC African Countries and IsDB Reverse Linkage Program.
In this respect, ICIEC provides $150 Million to help OIC Countries to fight COVID‐19 pandemic through ensuring the insurance and export credit of the trade transactions within the framework of the Rapid Response Initiative in collaboration the OIC Export Credit Agencies.
Also, the OIC‐Islamic Solidarity Fund (ISF) launched an Urgent Initiative to assist Member States and an ISF donation of $ 1 million to the emergency account.
These initiatives will contribute to the recovery efforts against the coronavirus pandemic, including the provision of the essential medical products and equipment, strengthen the capacity of health personnel, improving health services and effectively share information and experience in this area and to address the social, economic, and financial implications of this pandemic on Member States.
Several Member States have taken exceptional measures to counter the effects of this crisis by allocating exorbitant budgets to help the poor in terms of food and medical supplies to respond to this health insecurity.
Regional growth will also benefit from the reduction of uncertainties related to global trade policies and from a recovery even if it remains weak in world trade.
In the region, comprising the Middle East, North Africa, Afghanistan and Pakistan the forecast rate is of 0.1% in 2019 before recovering to 2.4% in 2020 and 2.7% in 2021 following the improvement of the business climate and investments in infrastructure and the rise in private
ICDT - Annual Report on Trade among the OIC Member States 2019-2020
6
consumption but also the increase in growth by 2021 would be around 3% in Djibouti, Egypt, Oman, Morocco, Qatar and the Emirates. The Economic and Social Commission for Western Asia (ESCWA) has made an initial assessment of the cost of COVID‐19 in the Arab region. The initial estimate of the impact of the COVID‐19 pandemic in 2020 is about a loss of $42 billion on their GDP.
In addition, in sub‐Saharan Africa growth should drop from 2.4% in 2019 then progress to 2.9% in 2020 and then 3.1% in 2021 especially, in Côte d’Ivoire, Senegal, Benin, Uganda, The Gambia, Mauritania, Niger, Togo, Guinea‐Bissau whose growth is expected to exceed 5% due to soaring prices of petroleum, mining and agricultural products but also to the improvement of the business climate and the intensification of local production of basic products.
In the countries of Europe and Central Asia (EAC), growth should drop from 2% in 2019 to 2.6% in 2020 then rise to 2.9% in 2021 due to the expected growth in Uzbekistan, in Tajikistan and in Turkmenistan because of the possible skyrocketing of the prices of the energy products which, abound this zone but also in the assumption of a stabilization of the prices of the principal basic products and in favor of advancing structural reforms. Furthermore, in South Asia, growth should climb to 5.5% in 2020 subject to a slight recovery in domestic demand and as economic activity benefits from an accommodative policy in India and Sri Lanka and improved business confidence and support for infrastructure investment in Afghanistan Bangladesh and Pakistan.
According the Asian Development Bank (ADB) report, the GDP of Asian Countries will drop by 2.2% in 2020 and could increase by 6.2% in 2021. Indeed, the GDP growth could increase in 2020 in Brunei by about 2%, Indonesia (5%) and Malaysia (4.2%) depending on the duration of uncertainty and severity of the pandemic in Asian Countries. The World Bank estimates that growth in developing East Asia and the Pacific (excluding China) will drop to 1.3% in 2020.
Key sectors have been affected, particularly travel and tourism, and retail and other services sectors; business operations hence supply chains disrupted; employment and livelihood put at risk; while consumer and investor confidence has declined.
Indeed, it is remarkable that Asian tourism flows declined due to the disruption in air travels, logistics and food servicing, weakening in consumer and business confidence resulting to the temporary measures such as lockdowns, community quarantines, stay‐at‐home orders, temporary business closures, and travel restrictions or exports prohibitions to fight the COVID‐19.
Growth in America and the Caribbean is expected to reach 1.8% in 2020 driven by a strengthening of growth in the main economies and a recovery in domestic demand at regional level and the renewed confidence of investors in the banking, energy and infrastructure sectors in Brazil, Mexico, Argentina, Costa Rica, Guyana and Colombia. Given this situation, the OIC countries are not outdone. But due the COVID‐19, Guyana’s expected oil‐related revenues (US$ 230 million) could decline by 15%‐40% in 2020‐2021, which would be the main impact on Guyana from the oil soaring price. Indeed, Guyana’s wholesale and retail and transportation sectors are exposed to these risks. In Suriname, the economic growth is expected to decline due to COVID‐19 at least similar to the 2015 decline by 5.6% in 2020 and the soaring prices of commodities such as gold and oil will impact the Surinamese economy and can further weaken the fiscal and external positions.
Moreover, new investments in Suriname are expected to be postponed and ongoing infrastructure projects could suffer delays in implementation, affecting economic activity in the construction sector. Although the tourism value chain sector and fisheries will be also affected due to the huge unemployment in hotels, restaurants, transportation, tour operators, distribution of fish products during the pandemic.
II / WORLD TRADE:
ICDT - Annual Report on Trade among the OIC Member States 2019-2020
7
According to the WTO projection, world trade is expected to fall by between 18.5% in 2020 and can reach 13% by the end of 2020 following the COVID 19 pandemic impact on world economy. The average of OIC Member Countries trade could decrease from 17% to 33% in 2020 due to the economic behaviour of each country and also the impact of soaring price of oil and other commodities combined with the drop of tourism, logistics, business services receipts. During the second quarter of 2020, world trade dropped by 27% and commodity prices by 20.4% according to UNCTAD Data on May 2020.
Indeed, all regions could reach double‐digit declines in their exports and imports in 2020. Consequently, if the pandemic is brought under control and trade starts to expand again, most
regions could record double‐digit rebounds in 2021 of around 21% in the optimistic scenario and 24% in the pessimistic projection.
Within COVID‐19, some OIC Regions such as Asia, Africa, Middle East and Commonwealth of Independent States (CIS), exports will register a drop from 8 to 36.2% in 2020 and will increase from 8.6 to 36.1% in 2021 according to WTO data analysis. Besides, imports of these areas will drop from 10 to 31.6% in 2020 and will progress from 13.6% to 25.1% in 2021 ceteris paribus.
According to Economic Commission for Africa (ECA) estimates, COVID‐19 pandemic will contribute to the immediate decline in GDP growth from 3.2% to 1.8% in 2020. Thus, 51% of Africa’s exports go to countries highly impacted by COVID‐19, while 53% of its imports originate from such highly impacted countries.
Indeed, OIC Member Countries exports and imports could drop at least respectively by 22% and 21% in 2020 and 23% and 19% in 2021.
According the ESCWA Study, world exports of Arab Countries will decrease by $ 88 Billion during the COVID‐19 outbreak under the scenario of 3% GDP drop and a downward of $ 28.1 Billion of world Arab Exports within the scenario of 1.5% GDP decrease.
Besides, within the scenario of 3% drop of GDP, the intra‐Arab exports will decrease by $ 14 Billion and within the second scenario of 1.5% of GDP decrease, the intra‐Arab exports will fall by $ 4.4 Billion in 2020. this decrease will impact some exports sectors such as: World Arab energy (‐$43Billion under the first scenario and ‐$13.8 Billion under the second one) and Intra‐Arab energy respectively (‐$12 Billion and ‐$3.8 Billion), world Arab mining and chemical sectors exports will decrease by 71%, mechanical and electrical industry will drop by 13%, agricultural and agro‐food products will fall by 8% in 2020.
On the other side, world Arab imports will fall by $ 111 Billion under the scenario of 3% GDP drop and will decrease by $35 Billion under the second scenario. Intra‐Arab imports will fall by $26 Billion under the first scenario and by $8.1 Billion under the second one in 2020. Besides, intra‐Arab imports will drop by $ 17 Billion under the first scenario and $5.3 Billion under the second one in 2020.
Indeed, global Arab imports of oil products will decrease by $ 89 Billion under the scenario of 3% decline of GDP and by $28 Billion in the case of 1.5% GDP drop. For the other sectors, world Arab imports of mechanical and electrical industry will decline by 51%, chemicals will decrease by 17% and agricultural and agro‐food products will fall by14% in 2020.
In fact, the prevailing oil prices will contribute to the Arab region loses nearly $550 million on daily basis and the gains of oil importers within the region are negligible compared to the losses of oil exporters. Between January and mid‐March 2020, businesses in the region lost $420 billion in market capital. The consequent loss of wealth is equivalent to 8% of the total regional wealth.
According to data from the 2019 WTO Report, the volume of world trade increased by 17.6% reaching $33.2 trillion in 2017 and then $39.2 trillion in 2018, mainly due to soaring prices commodities (energy, foodmanufactured goods (clothing and textiles and pharmaceuticals and minerals) and exchange rates (US$/Euro against basket of currencies) also due to the participation of developing economies (Asia) and least developed countries in world trade the latest
ICDT - Annual Report on Trade among the OIC Member States 2019-2020
8
developments in regional trade agreements, value‐added trade and trade digital trade, (implementation of the Trade Facilitation Agreement (TFA) ), aid for trade, trade in services (ICT travel, Transport, consultancy services in United States, CIS and China) ($5.7 billion) and trade finance).
According to the WTO report of July 2019, world merchandise trade increased by 3% in 2018, slightly exceeding GDP (2.9%) but below the growth of 4.6% recorded in 2017 because of growing trade tensions and historically high restrictions.
World exports reached $19.48 billion in 2018 compared to $17.33 billion in 2017, representing a growth rate of 11.5% and imports increased from $17.57 billion in 2017 to $19.69 billion in 2018, an increase of 17.7% due to the fluctuations of commodity prices and the exchange rate of the US dollar relative to the power of certain currencies.
In fact, the increase in exports was mainly due to high energy prices while Asia was the main contributor to an increase in global imports. World exports of fuel and mining products, manufactured goods and agricultural products grew by 23%; 8% and 5% respectively. Developing economies exported a total of $8,779 billion in 2018, including $193 billion from the least developed countries. The value of merchandise trade increased by10% and trade in commercial services grew strongly for the second consecutive year, reaching $5.63 billion dollars in 2018.
In addition, information and communication technologies recorded the highest export growth (15%) among the service sectors in 2018, led by IT services. Growth in exports of commercial services was highest in the Commonwealth of Independent States (12%) in 2018, partly due to the Football World Cup in Russia. China was the leading exporter of commercial services (by value) among developing countries with exports increasing by 17% in 2018.
III /RECENT EVOLUTION OF THE FOREIGN TRADE OF THE OIC MEMBER STATES:
a) Ten Year Plan of Action of the OIC Member States (OIC‐2025):
At the 13th Islamic Summit of April 2016 held in Istanbul in the Republic of Turkey, a New Ten‐Year Plan of Action was adopted aiming at achieving a 25% intra‐OIC trade share by 2025 (OIC ‐2025) covering the period 2016‐2025.
In this regard, the OIC General Secretariat has initiated an Annual Coordination Meeting of OIC Institutions (ACMOI) every December starting from the end of 2015.
During the first meeting held in December 2015, two subcommittees were created: a subcommittee on Trade and Investment (TISC) under the chairmanship of the Islamic Centre for Development of Trade (ICDT) and another on the development of the Private Sector and Finance under the direction of the Islamic Development Bank Group (IsDB).
Thus, the TISC subcommittee organized 4 meetings (March 16 and 17, 2016 in Marrakech, March 6 and 7, 2017 in Casablanca, March 8 and 9, 2018 in Marrakech and April 1, 2019 in Marrakech) bringing together the institutions of the OIC dealing with trade and investment and technical services, and a technical meeting in Jeddah at ITFC’s headquarters to coordinate the activities of member institutions (May 27, 2016 and February 9, 2017).
Five integrated projects have been initiated namely: development of Halal Industry, the Single Window Initiative and Trade Facilitation, the development of strategic products; Investment Promotion and Support for Investment Promotion Agencies of OIC Member States, private sector and SMEs development.
For this purpose, Trade Fairs, Specialized Exhibitions, Business Fora and Buyers Sellers Meetings were organized jointly by ICDT, ITFC and SMIIC as well as capacity building programs by ICDT, SESRIC and IDB between 2017 and 2020.
ICDT - Annual Report on Trade among the OIC Member States 2019-2020
9
Since May 2019, the OIC General Secretariat has decided that the TISC meeting will be held virtually. It is in this context that ICDT has created an electronic platform to collect all the information from the TISC Members to make a report to be submitted to the institutional meetings of the OIC.
b) World Trade of OIC Countries:
Efforts made by Member States, OIC Institutions and Development Partners have contributed to the improvement of foreign and Intra‐OIC Trade Volume despite fluctuations in commodity prices and US Dollar parity relative to local currencies as well as the geopolitical and economic situation of the OIC country.
Despite these joint activities and projects, trade in OIC Member States accounted for 9.29% of world trade in 2016 against 9.22% in 2018, i.e. a downturn of 10.6% due to the Action Program (TYPOA) implemented by all OIC institutions has contributed to improving growth in the volume of trade of Member States, from $ 3 trillion in 2016 to around $ 3.6 trillion in 2018, an increase by 20% and international economic environment.
This growth was boosted, among others, in the following countries during this period: Togo, Afghanistan, Comoros, Benin, Libya, Guinea, Pakistan, Mauritania, Oman, Maldives, Uganda, Egypt, Saudi Arabia, Albania, Indonesia, Qatar, Morocco, Azerbaijan, Malaysia, Yemen, Bahrain, Kyrgyzstan, Sierra Leone and Mozambique.
In addition, the main players in OIC trade are: the United Arab Emirates ($ 492 billion equivalent to 13.7% of OIC trade share followed by Malaysia ($438.6 billion; 12.2%); Saudi Arabia ($ 429.7 billion; 12%); Turkey ($391 billion; 10.9%); Indonesia ($371.1 billion; 10.4%); Iran ($128.6 billion; 3.6%); Qatar ($112.5 billion; 3.1%); Egypt ($110.4 billion; 3.1%). Iraq ($86.4 billion; 2.4%) and Algeria ($84 billion; 2.4%). These ten countries recorded 74% of OIC trade for a total amount of $2.6 billion.
c) World Trade in Services of OIC Member States:
According to UNCTAD data for July 2019 and ICDT’ calculations, world trade in commercial services of OIC countries in 2016 reached $811 billion compared to $895 billion in 2018, an increase of 10% and represents 24.8% of global trade of OIC countries and 9% of world trade in services in 2018. More than 82% consisted of transport and travel services as well as other services (18%).
The main players in trade in services were: United Arab Emirates, Saudi Arabia, Malaysia, Turkey, Indonesia, Qatar, Kuwait, Egypt, Nigeria and Lebanon. These 10 countries recorded 51% of total trade of OIC countries in 2018.
Besides, trade in services represented more than 10% in 2018 of world trade in the following countries: Somalia, Maldives, Lebanon, Bahrain, Albania, United Arab Emirates, Djibouti, Mozambique, Kuwait, Jordan, Qatar, Azerbaijan, Morocco, Malaysia, Kyrgyzstan and Togo.
The main services marketed by Member States are as follows in 2018: travel (32.9%), transport (29%), other business services (11.2%), financial services, insurance, pensions and intellectual property (10%); government, personal, cultural and recreational services (7.5%); ICT services (4.8%) and construction, manufacturing and maintenance services (4.7%).
In addition, Moreover, the diaspora of OIC Member States have made money transfer of around 160 billion $ in 2018. i.e. 18% of the services exported
In addition. the diaspora of the OIC Member States carried out money transfers of around $160 billion in 2018. i.e. 18% of the services exports.
IV / CURRENT STATE OF INTRA‐OIC TRADE:
ICDT - Annual Report on Trade among the OIC Member States 2019-2020
10
The volume of trade between OIC Member States (intra‐OIC exports + intra‐OIC imports) recorded a considerable increase and rising from $556.32 billion in 2016 to $751.5 billion in 2018, representing a rate growth of 35% thanks to the growth of intra‐OIC trade of more than $2 billion in the United Arab Emirates, Saudi Arabia, Iraq, Iran, Indonesia, Bahrain, Pakistan, Oman, Egypt, Malaysia, Afghanistan, Turkey, Kuwait. Algeria, Bangladesh, Nigeria, Kazakhstan, Uzbekistan and Azerbaijan.
So, the TISC subcommittee organized 4 meetings (March 16th and 17th , 2016 in Marrakech, March 6th and 7th , 2017 in Casablanca, March 8th and 9th , 2018 in Marrakech and April 1st, 2019 in Marrakech) bringing together the institutions of the OIC dealing with trade and investment and technical services. and a technical meeting in Jeddah at ITFC’ headquarters to coordinate the activities of member institutions (May 27th, 2016 and February 9th, 2017).
According to the figures of the gravity model developed by the ICDT from the Trade Map data of the ITC and the IMF DOTS, the observed potential of intra‐OIC trade is around $5.3 trillion in 2018 only 21% of which is exploited and which can reach 33.4% to 74% if tariff and non‐tariff barriers between Member States are gradually lifted. About 94% of this trade potential is concentrated in the following countries: Qatar. the United Arab Emirates, Turkey, Saudi Arabia,Kuwait, Malaysia, Bahrain, Indonesia, Iran and Pakistan.
The potential of intra‐OIC trade is mainly made up of: mineral fuels, electrical machinery and equipment. clothing and accessories. mechanical machines and devices, pearls, motor cars, tractors and cycles; iron and steel and related items; plastic items; cereals; vegetable and animal fats and oils; pharmaceuticals, organic chemicals; photographic or cinematographic instruments and apparatus. It should be noted that more than 75% of intra‐OIC trade is concentrated on non‐fuel products in 2018.
The joint efforts of the programs of the OIC institutions and the partnership with other regional and international organizations contributed to increase the share of intra‐OIC trade in the total trade of the Member States from 18.69% in 2016 to 21.02% in 2018. which represents an increase of 12.5% thanks to the growth rate of intra‐OIC trade share of more than 50% from the following countries: Iraq, Togo, Afghanistan, Guyana, Bahrain, Benin, Uganda, The Gambia, Maldives, Iran Mauritania, Saudi Arabia, Niger and Albania.
Indeed, around 28 countries have reached the target of intra‐OIC trade share (25%) in 2018: Djibouti (75%)%), followed by Sudan (74.4), the Gambia (74.3%), Bahrain (61.8%, Somalia (61%), Tajikistan (60.5%), Afghanistan (59.4%), Niger (43.4%), Syria (43.3%), Senegal (43.1%), Oman (40.8%), Lebanon (40.6%), Benin (39.9%), Jordan (39 %), Mali (37.9%), Togo (37.5%), the United Arab Emirates (36.4%), Uzbekistan (35.9), Yemen (35.8%), Iraq (35%), Iran (32.7%), Egypt (32.3%), Pakistan (31%), Chad (28.5%)Kyrgyzstan (27.6%) Kuwait (26.2%) Côte d'Ivoire, (25.1 %) and Azerbaijan (25%).
In addition, countries such as Albania, Mozambique, Guyana, Malaysia, Guinea, Gabon, Morocco, Indonesia, Kazakhstan, Nigeria, Qatar, Brunei, Bangladesh and Algeria whose intra‐OIC trade is less than 15% can diversify their exportable offer in OIC area to explore new markets in order to be able to reach the new target of 25% of intra‐OIC trade in 2025.
Intra‐OIC exports increased by 21%, from $322.8 billion in 2017 to $390.5 billion in 2018 and imports from $321.5 billion in 2017 to $361 billion in 2018 recording an improvement of 12.3%. The main players in intra‐OIC trade in 2018 are: the United Arab Emirates, which recorded $140.5 billion, representing 18.7% of intra‐OIC trade, followed by Saudi Arabia ($82.8 billion US; 11%), Turkey ($69.6 billion; 9.3%), Indonesia ($46.5 billion; 6.2%), Malaysia ($45.6 billion; 6 %), Iran ($38.4 bill; 5.1%), Iraq ($35.1 billion; 4.7%), ($30.6 billion, 4.1%), Pakistan ($28.7 billion; 3.8%) and Oman ($28.4
ICDT - Annual Report on Trade among the OIC Member States 2019-2020
11
billion. 3.8%). These ten countries accounted for 72.7% of intra‐OIC trade in 2018 for a total amount of $546.2 billion.
At the regional level, the distribution of intra‐OIC trade in 2018 was as follows: 40% insured by the Gulf countries followed by the Asian countries (28%), the Middle‐East countries (21%), the Sub‐Saharan Africa (6%) and the AMU countries (5%).
Intra‐regional trade
The governments and institutions of the Member States have developed in recent years, trade and investment policies to facilitate OIC intra and interregional trade. These policies are concentrated in the establishment of logistics platforms such as roads, the highways, the airports, the ports, dry ports and storage units, the automation of commercial one‐stop shops in collaboration with customs, tourism offices, trade and investment promotion agencies.
At the OIC level, the ICDT, the IDB group, the CICIA and the SESRIC organized several activities such as the TPOs and IPAs Forums, high‐level trade and investment and B2B to further boost intra‐OIC trade and investment.
Intra‐regional trade of OIC countries increased from 118.1 billion $ in 2016 to 165.4 billion $ in 2018, i.e. an increase of 40.1% due to the increase of intra‐regional trade with OIC countries of the GCC of 24.2 billion $, followed by Asian countries (+15.3 billion $), the Middle East (+4.3 billion $), Sub‐Saharan Africa (3.3 billion $) and the AMU (+389.3 million $).
Thus, the share of intra‐regional trade in intra‐OIC trade increased by 21% from 42.4% in 2016 to 51.4% in 2018.
This increase became possible due to the reinforcement of intra‐regional cooperation via the existence of bilateral and regional cooperation agreements on trade and investments, but also commercial complementarity through products and services with high potential for trade between OIC countries from sub‐Saharan Africa, Arab, Asia and Latin America.
However, we note a decrease in the share of intra‐regional trade of the AMU countries in intra‐OIC trade of 2.9% due to the decrease recorded in Tunisia and Morocco during this period.
The main players in intra‐regional trade in 2018 are: the United Arab Emirates with (44.8 billion $, i.e. 27.1% of intra‐regional trade), followed by Turkey (15.7 billion $; 9.5%); Indonesia ($ 14.4 billion; 8.7%); Malaysia ($ 13 billion; 7.9%); Saudi Arabia ($ 9.6 billion; 5.8%); Bahrain ($ 9.6 billion; 5.8%); Oman ($ 8 billion; 4.9%); Iran (US $ 6.5 billion; 3.9%); Kazakhstan (US $ 4.4 billion; 2.7%) and Egypt (US $ 4.4 billion; 2.7%). This top 10 countries ensured 130.4 billion $ or 78.8% of intraregional trade in 2018.
Interregional trade
Interregional trade of OIC countries experienced the same trend, it raised from $16.1 billion in 2016 to $225.1 billion in 2018, i.e. an increase of 40.6% given the increase of inter‐ regional trade of GCC countries of $46.7 billion with other OIC countries, followed by Asian countries (+$15.1 billion), AMU countries (+$3.3 billion) and Sub‐Saharan Africa countries (+$2.4 billion).
In addition, interregional trade in the Middle East countries decreased by $2.6 billion due to the decline in interregional trade in Turkey, Iraq, Jordan and Egypt.
Furthermore, the share of interregional trade in intra‐OIC trade increased by 21.5% from 57.6% in 2016 to 69.9% in 2018. The main actors in interregional trade in 2018 are: the United Arab Emirates with $53.1 billion or 23.6% of interregional trade, followed by Saudi Arabia ($47.9 billion; 21.3%); Turkey ($25.5 billion; 11.3%); Iran ($19.2 billion; 8.5%); Malaysia ($9.6 billion; 4.3%); Indonesia ($ 7.9 billion; 3.6%); Egypt ($7.9 billion; 3.5%); Qatar ($6.9 billion; 3.1%); Kuwait ($5.3
ICDT - Annual Report on Trade among the OIC Member States 2019-2020
12
billion; 2.4%) and Nigeria ($3.9 billion; 1.7%). These ten countries totalled $187.2 billion or 83.2% of interregional trade in 2018.
In sum, OIC member countries exchange more between regions than within their own region between 2016 and 2018, seeking new growth markets, but also due to economic and commercial complementarity and the increase in the organization of trade missions, trade fairs and exhibitions, business forums and buyers‐sellers meetings of strategic products among OIC countries.
V / EFFECTS OF TARIFF AND NON‐TARIFF BARRIERS:
Despite the considerable efforts made by Member States, the OIC General Secretariat and its institutions to promote intra‐OIC trade and reduce barriers many obstacles remain.
According to the statistics of the Global Trade Alert of March 2020 around 15,431 trade measures were applied by the Member States and which helped to impede the expansion of intra‐OIC trade but also with their trading partners between 2015 and 2018.
Indeed, the most important measures applied by Member States are: import taxes (5,987 cases), financial subsidies (1,414 cases). export subsidies (1,392 cases). export taxes (1,227 cases), non‐tariff import measures (838 cases), import licenses (729 cases), safeguard measures (582 cases), anti‐dumping measures (417 cases), non‐tariff export measures (374 cases), import quotas (362 cases), local content (281 cases), financial incentives for IDEs (274 cases), export licenses ((271 cases), internal taxation in import (252 cases), import bans (243 cases) and export quotas (202 cases).
These measures have been applied mainly by the following countries: Indonesia (3909 measures), Kazakhstan (2209), Turkey (1965), Pakistan (1740), Malaysia (1578), Saudi Arabia (1154 ), Egypt (495), Morocco (288), Nigeria (233), the United Arab Emirates (229), Tunisia (228), Bangladesh (204) and Jordan (199).
These measures had negative impacts on intra‐OIC trade of all OIC countries mostly Malaysia (254 cases), Turkey (233), United Arab Emirates (222), Egypt (155) , Indonesia (154), Saudi Arabia (148), Pakistan (110), Bahrain (97), Oman (88), Morocco (84), Iran (83), Kuwait (82), Jordan (70), Qatar (68), Tunisia (66), Azerbaijan (58), Bangladesh (56), Algeria (53), Uganda (53), Lebanon (51) and Togo (51).
It is true that some of these measures are intended to protect national economies and the activities of economic operators while others help to hamper the expansion of intra‐OIC trade.
In this regard, Member States and OIC bodies have developed tools to strengthen intra‐OIC trade, especially in the area of trade facilitation.
VI / TOOLS FOR STRENGTHENING INTRA‐OIC TRADE:
To strengthen economic and trade cooperation among the OIC countries, the OIC Institutions and the public and private sectors shall contribute to the implementation of the OIC‐2025 Ten‐Year Plan of Action in particular through the five integrated projects adopted by the TISC, especially the trade facilitation, capacity building, in the field of professional training and international trade businesses, empowerment of women and youth, participation in fairs, international exhibitions, trade missions, buyers‐sellers meetings of strategic products and services and Business Forums, but also by easing foreign trade procedures and those of intra‐OIC investment in order to boost trade between Member States by raising awareness on the establishment of Single Windows for foreign trade and the modernization of customs administrations.
In addition, the diversification of the exportable supply is a necessity for developing foreign trade and intra‐OIC investment.
ICDT - Annual Report on Trade among the OIC Member States 2019-2020
13
It is also important that OIC Member States invest progressively to set up the Free Trade Area and adhere to the guiding principles of investment facilitation and the integration of intra and interregional value chains of OIC countries in the field of Halal industry, ICT, logistics and transport, food industry, textile, pharmaceutical, leather, automotive and renewable energies of which the Member States are full of considerable potential.
VII / SUMMARY OF ICDT ACTIVITIES (2018‐2019)
As part of the development of intra‐OIC trade and investment, ICDT organized several events between 2018 and 2019 such as:
Trade and investment promotion:
- Five workshops for the preparation of the OIC participation to Expo Dubai 2020, Dubai;
- the Exceptional Edition of the Trade Fair of the OIC Member States, Kuwait City, State of Kuwait, 6‐10 February 2018;
- The "2nd edition of the Furniture and Interior Decoration Fair of the OIC Member States" on 13‐16 March, 2018 in Jeddah. Kingdom of Saudi Arabia;
- the 11th Exhibition of Agribusiness Industries of the OIC Member States, Jeddah ‐ Kingdom of Saudi Arabia, 20th ‐ 23rd March, 2018;
- the 4th Specialized Exhibition on "Higher Education Services in the OIC Member States", Casablanca ‐ Kingdom of Morocco, 26th ‐29th April, 2018;
- Within the framework of the Arab‐African Trade Bridge Program, the ITFC, the ICDT and the Technical Unit of the Agadir Agreement (ATU) organized a Business Forum of the Agadir Agreement Countries and West African OIC Member Countries on May 10 and 11, 2018 in Casablanca, Kingdom of Morocco;
- the 6th Exhibition of Halal Products of the OIC Member States, Istanbul ‐ Republic of Turkey, 29 November ‐ 2 December 2018;
- the 16th edition of the Trade Fair of the OIC Member States, from 7 to 13 April 2019, Baghdad ‐ Republic of Iraq;
- The Exhibition and Forum on Transport and Logistics in the OIC Member States, Casablanca ‐ Kingdom of Morocco, 9‐11 April 2019.
- The 9th Muslim World Biz, Kuala Lumpur, Malaysia, 4‐6 September 2019;
- The 7th Exhibition of Halal Products of the OIC Member States, Istanbul ‐ Republic of Turkey, 28th November–1st December 2019;
- the Exceptional Edition of the Tourism, Handicrafts and Interior Decoration Exhibition of the OIC Member States”, State of Kuwait, 18 ‐ 23 December 2019;
- The ICDT also organized missions of Egyptian date businessmen in April 2018, Malaysian in January and February 2019 in Casablanca, and Pakistani businessmen in Casablanca in December 2019 to boost bilateral trade relations between these countries and Morocco.
Capacity building:
Capacity building sessions have also been organized by ICDT, as follows:
- in collaboration with ICIEC and UNCTAD, a High Level OIC Expert Meeting on “Investment
Obstacles in Africa: Challenges and Opportunities” was held on 24‐25 January 2018 in
ICDT - Annual Report on Trade among the OIC Member States 2019-2020
14
Casablanca, Kingdom of Morocco; and a panel on Obstacles and Solutions to Investment in
Africa on 23rd October 2018 on the side lines of the World Investment Forum in Geneva;
- the 7th regional online marketing workshop for the benefit of businesswomen from April15th to 18th 2019 in Abidjan, Côte d´Ivoire;
- in collaboration with the IDB's Country Strategy and Cooperation Department, a Workshop on the joint ICDT / IDB study with a view to strengthening coordination among OIC Member States on issues related to WTO, October19th‐20th 2018, Geneva, Switzerland; a workshop on Post‐WTO Eleventh Ministerial Conference (MC11) for the OIC Member States, Dubai, State of United Arab Emirates, November19th‐20th 2018; a training workshop on "the outcomes of the Eleventh WTO Ministerial Conference (MC11) for the benefit of African OIC Member States" on June 26t‐27th 2019 in Casablanca; a training workshop on "Ongoing Negotiations at the WTO for Permanent Missions of OIC Member States in Geneva", Switzerland on November 14th‐15th 2019.
- ICDT, COMCEC and ICCIA organized a training workshop on "Trade Preferential System Agreement between Member States of the OIC (SPC‐OIC)" in Khartoum from December 17th to 18th 2018;
- The ICDT and the SESRIC organized a Workshop for the benefit of Managers of Cross‐border Parks and Protected Areas in West Africa in Ankara, Turkey from 5 to 7 November 2019;
- In collaboration with the COMCEC, The ICDT co‐organized a training workshop on the development of family tourism for the benefit of Suriname and Guyana in Paramaribo from July 15th to 17th 2019; and a Seminar on the Review of Economic and Commercial Common Action of the OIC, Rabat‐Kingdom of Morocco, December12th, 2019The ICDT also organized the 3rd and 4th meeting of the Sub‐Committee on Trade and Investment (TISC) in March 2018 and April 2019 in Marrakech, Morocco.
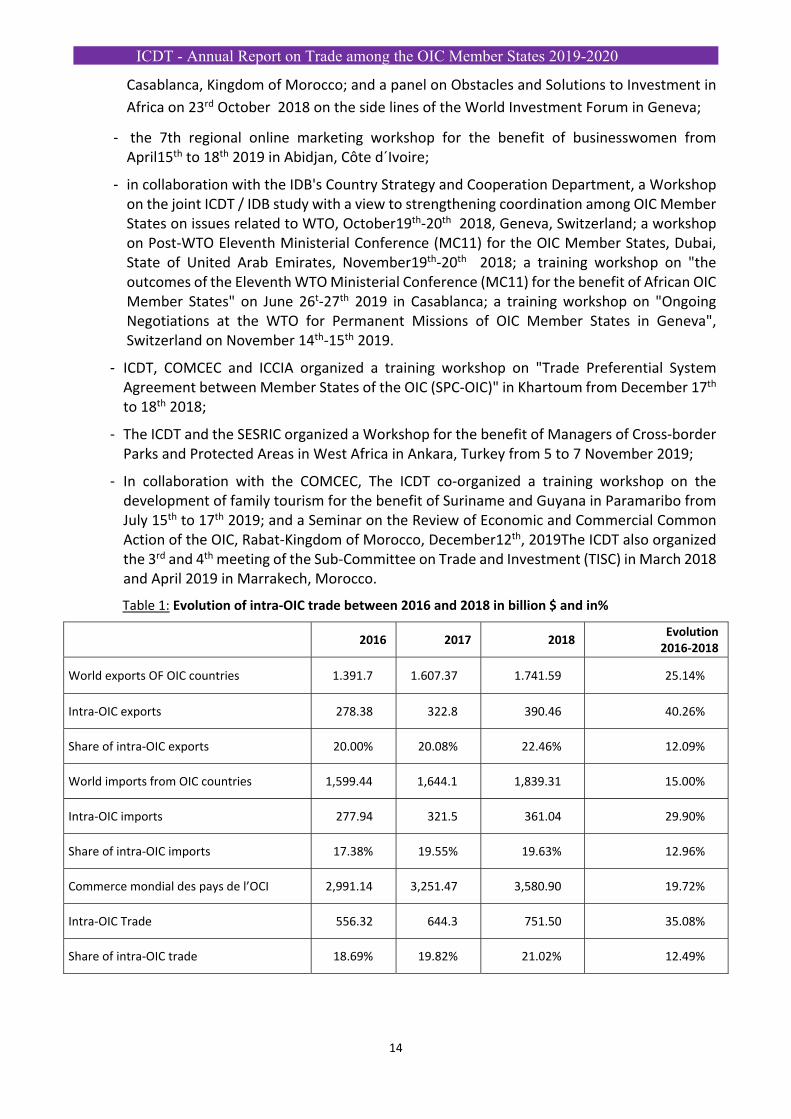
Table 1: Evolution of intra‐OIC trade between 2016 and 2018 in billion $ and in%
2016 2017 2018 Evolution 2016‐2018
World exports OF OIC countries 1.391.7 1.607.37 1.741.59 25.14%
Intra‐OIC exports 278.38 322.8 390.46 40.26%
Share of intra‐OIC exports 20.00% 20.08% 22.46% 12.09%
World imports from OIC countries 1,599.44 1,644.1 1,839.31 15.00%
Intra‐OIC imports 277.94 321.5 361.04 29.90%
Share of intra‐OIC imports 17.38% 19.55% 19.63% 12.96%
Commerce mondial des pays de l’OCI 2,991.14 3,251.47 3,580.90 19.72%
Intra‐OIC Trade 556.32 644.3 751.50 35.08%
Share of intra‐OIC trade 18.69% 19.82% 21.02% 12.49%
ICDT - Annual Report on Trade among the OIC Member States 2019-2020
15
PART I:
GLOBAL AND INTRA‐OIC TRADE ANALYSIS
ICDT - Annual Report on Trade among the OIC Member States 2019-2020
16
CHAPTER I:
DEVELOPMENT OF WORLD TRADE
AND OF THE OIC MEMBER STATES
ICDT - Annual Report on Trade among the OIC Member States 2019-2020
17
The international economic environment between 2018 and 2020, namely the negative effects of the tariff increases adopted in the United States and China at the beginning of 2019, the introduction by Germany of new fuel emission standards, and natural disasters in Japan and Italy regarding sovereign and financial risks in addition to the effect of fluctuations in the $ exchange rate, Brexit and the Coronavirus pandemic contributed to the decline in economic and commercial performance from many countries including the OIC Member States
This conjuncture led to the fluctuating commodity prices (energy, mining, food) and often for some, recording below the prices of 2009.
Given this situation, the OIC countries are not left behind, the growth of the OIC Member States was expected to decline by 3.7% in 2017 and 2.4% in 2019 and progress to around 3.8% in 2020. The overall OIC GDP recorded $ 19.5 trillion in 2017 against $20.6 trillion in 2018, i.e 15.2% of world GDP, which should experience a decline in 2020 because of the colossal sums allocated to fight against the coronavirus pandemic but also against an unprecedented food crisis which can rage in several OIC countries net importers of these commodities.
Despite the fact that in 2018, the GDP growth of more than 5% was recorded in the following countries: Guinea, Côte d'Ivoire, Turkey, Tajikistan, Djibouti, Senegal, Bangladesh, Turkmenistan, Burkina Faso, Maldives, Malaysia, Guinea‐ Bissau, Benin, Pakistan, Mali, Uzbekistan, Niger and Indonesia, which could drop between 2019 and 2020.
The Member States, the OIC General Secretariat and the OIC Institutions will continue to support the implementation of the Ten‐Year Plan of Action 2016‐2025 in order to strengthen economic, social, political, technological and humanitarian relations between them and partners through multiplication of activities and projects for the benefit of national economies.
Despite these joint activities and projects, trade in OIC Member States accounted for 9.29% of world trade in 2016 compared to 9.22% in 2018, a decrease of 10.6% due to the international economic environment.
This section will be devoted to the importance of regional economic groupings, the existence of high potential trade products and recent developments in foreign trade of the OIC countries.
I. Trends in intra‐regional trade in Regional Trade Agreements (RTAs)
Trade tensions between the USA and China, Brexit, the state of European Union (EU) trade relations, the United States, Canada and Mexico Agreement (USMCA signed on November 30th, 2018), of the Southeast Asian Nations Agreement (ASEAN) and MERCOSUR to name a few, have impacts on the trade and investment relations of OIC Member States.
Several OIC countries have signed with the members of these RTAs the type of preferential bilateral agreements, of free trade area, or customs union in order to develop economic and trade complementarity with these so‐called advanced countries.
The EU is the most integrated area within RTAs in 2018, reaching a share of intra‐regional trade of around 61.5%, a slight drop of 0.3% compared to 2016 given the economic and social crisis in Europe during this period.
The USMCA countries recorded a share of intra‐regional trade of 41.2% in 2018. i.e. an increase of 2.2% compared to 2016 following the renewal of the NAFTA agreement with its component on the reform of labour law in Mexico and the resurgence of investor confidence in the Zone. The share of intra‐regional trade in ASEAN countries decreased by 1.1% from 23.5% in 2016 to 23.2% in 2018 due to fluctuations in commodity and manufactured prices, dollar / euro, but also the repercussions of trade tensions between China and USA. The same trend is noted in the MERCOSUR countries,
ICDT - Annual Report on Trade among the OIC Member States 2019-2020
18
whose share of intra‐regional continues to decrease because of the socio‐economic situation in this area. This share decreased by 5.5% from 14.3% in 2016 to 13.5% in 2018.
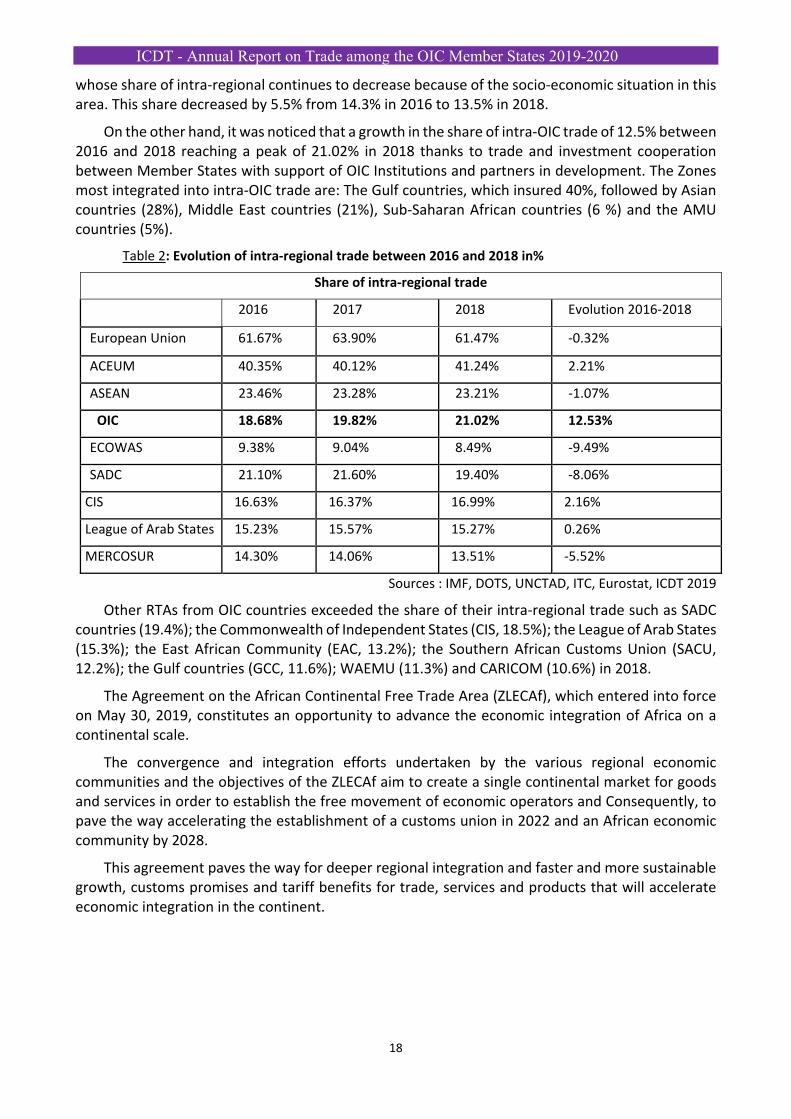
On the other hand, it was noticed that a growth in the share of intra‐OIC trade of 12.5% between 2016 and 2018 reaching a peak of 21.02% in 2018 thanks to trade and investment cooperation between Member States with support of OIC Institutions and partners in development. The Zones most integrated into intra‐OIC trade are: The Gulf countries, which insured 40%, followed by Asian countries (28%), Middle East countries (21%), Sub‐Saharan African countries (6 %) and the AMU countries (5%).
Table 2: Evolution of intra‐regional trade between 2016 and 2018 in%
Share of intra‐regional trade
2016 2017 2018 Evolution 2016‐2018
European Union 61.67% 63.90% 61.47% ‐0.32%
ACEUM 40.35% 40.12% 41.24% 2.21%
ASEAN 23.46% 23.28% 23.21% ‐1.07%
OIC 18.68% 19.82% 21.02% 12.53%
ECOWAS 9.38% 9.04% 8.49% ‐9.49%
SADC 21.10% 21.60% 19.40% ‐8.06%
CIS 16.63% 16.37% 16.99% 2.16%
League of Arab States 15.23% 15.57% 15.27% 0.26%
MERCOSUR 14.30% 14.06% 13.51% ‐5.52%
Sources : IMF, DOTS, UNCTAD, ITC, Eurostat, ICDT 2019
Other RTAs from OIC countries exceeded the share of their intra‐regional trade such as SADC countries (19.4%); the Commonwealth of Independent States (CIS, 18.5%); the League of Arab States (15.3%); the East African Community (EAC, 13.2%); the Southern African Customs Union (SACU, 12.2%); the Gulf countries (GCC, 11.6%); WAEMU (11.3%) and CARICOM (10.6%) in 2018.
The Agreement on the African Continental Free Trade Area (ZLECAf), which entered into force on May 30, 2019, constitutes an opportunity to advance the economic integration of Africa on a continental scale.
The convergence and integration efforts undertaken by the various regional economic communities and the objectives of the ZLECAf aim to create a single continental market for goods and services in order to establish the free movement of economic operators and Consequently, to pave the way accelerating the establishment of a customs union in 2022 and an African economic community by 2028.
This agreement paves the way for deeper regional integration and faster and more sustainable growth, customs promises and tariff benefits for trade, services and products that will accelerate economic integration in the continent.
ICDT - Annual Report on Trade among the OIC Member States 2019-2020
19
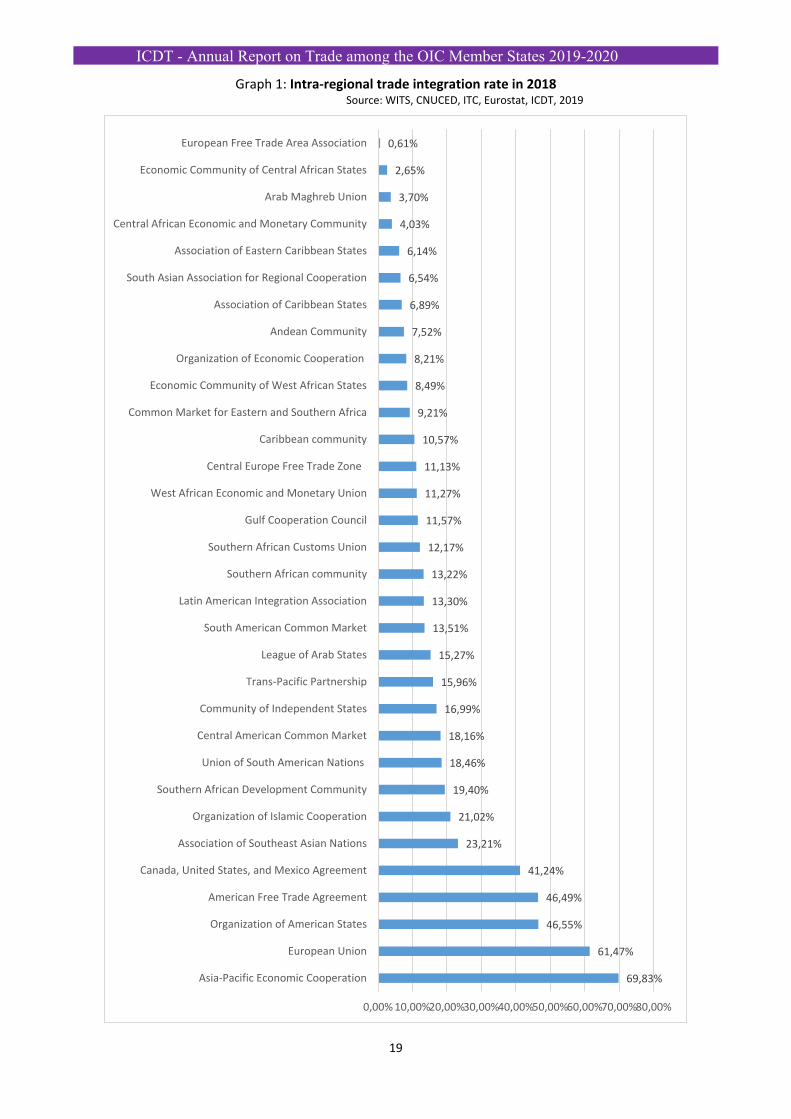
Graph 1: Intra‐regional trade integration rate in 2018 Source: WITS, CNUCED, ITC, Eurostat, ICDT, 2019
69,83%
61,47%
46,55%
46,49%
41,24%
23,21%
21,02%
19,40%
18,46%
18,16%
16,99%
15,96%
15,27%
13,51%
13,30%
13,22%
12,17%
11,57%
11,27%
11,13%
10,57%
9,21%
8,49%
8,21%
7,52%
6,89%
6,54%
6,14%
4,03%
3,70%
2,65%
0,61%
0,00%10,00%20,00%30,00%40,00%50,00%60,00%70,00%80,00%
Asia‐Pacific Economic Cooperation
European Union
Organization of American States
American Free Trade Agreement
Canada, United States, and Mexico Agreement
Association of Southeast Asian Nations
Organization of Islamic Cooperation
Southern African Development Community
Union of South American Nations
Central American Common Market
Community of Independent States
Trans‐Pacific Partnership
League of Arab States
South American Common Market
Latin American Integration Association
Southern African community
Southern African Customs Union
Gulf Cooperation Council
West African Economic and Monetary Union
Central Europe Free Trade Zone
Caribbean community
Common Market for Eastern and Southern Africa
Economic Community of West African States
Organization of Economic Cooperation
Andean Community
Association of Caribbean States
South Asian Association for Regional Cooperation
Association of Eastern Caribbean States
Central African Economic and Monetary Community
Arab Maghreb Union
Economic Community of Central African States
European Free Trade Area Association
ICDT - Annual Report on Trade among the OIC Member States 2019-2020
20
II. Structure and main actors of foreign trade of OIC
Main actors of OIC Foreign trade
The 2016‐2018 OIC Ten‐Year Program of Action (TYPOA), implemented by all OIC institutions, has contributed to the improvement in the growth of the volume of trade of Member States which has increased from $ 3 trillion in 2016 to around $ 3.6 trillion in 2018, i.e. an increase of 20%.
Indeed, this growth was boosted by that among others, in the following countries during this period: Togo, Afghanistan, Comoros, Benin, Libya, Guinea, Pakistan, Mauritania, Oman, Maldives, Uganda, Egypt, Saudi Arabia, Albania, Indonesia, Qatar, Morocco, Azerbaijan, Malaysia, Yemen, Bahrain, Kyrgyzstan, Sierra Leone and Mozambique.
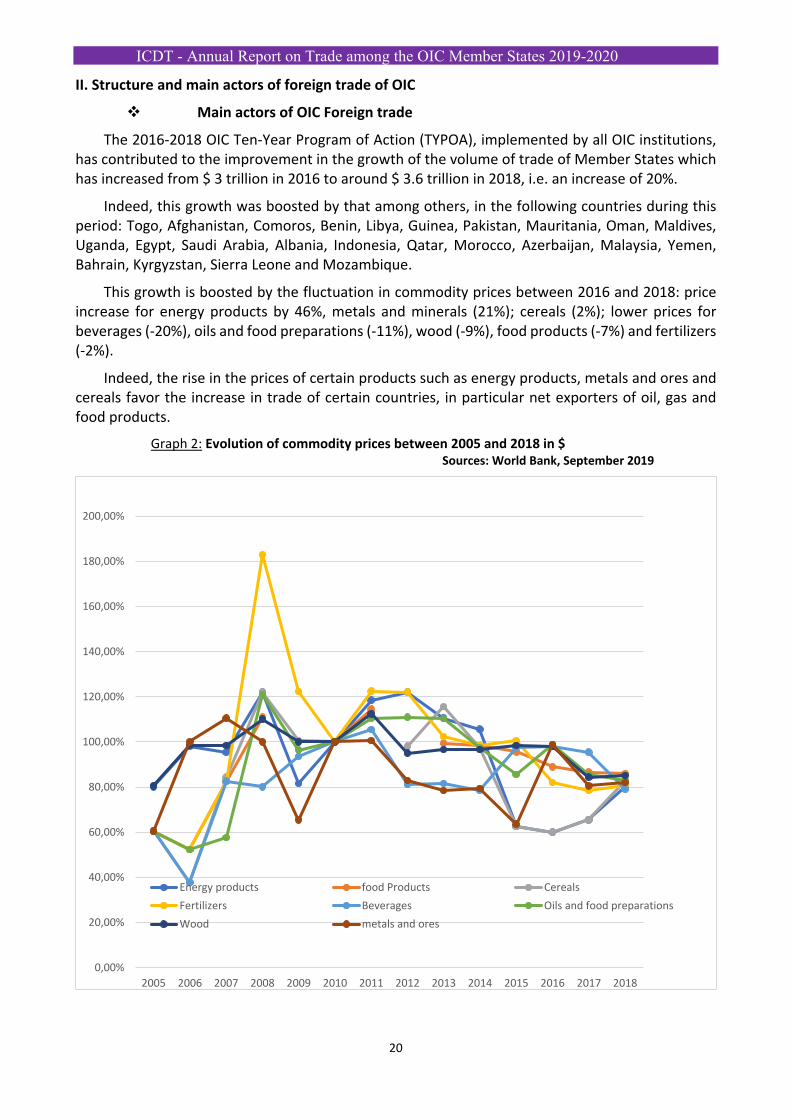
This growth is boosted by the fluctuation in commodity prices between 2016 and 2018: price increase for energy products by 46%, metals and minerals (21%); cereals (2%); lower prices for beverages (‐20%), oils and food preparations (‐11%), wood (‐9%), food products (‐7%) and fertilizers (‐2%).
Indeed, the rise in the prices of certain products such as energy products, metals and ores and cereals favor the increase in trade of certain countries, in particular net exporters of oil, gas and food products.
Graph 2: Evolution of commodity prices between 2005 and 2018 in $ Sources: World Bank, September 2019
0,00%
20,00%
40,00%
60,00%
80,00%
100,00%
120,00%
140,00%
160,00%
180,00%
200,00%
2005 2006 2007 2008 2009 2010 2011 2012 2013 2014 2015 2016 2017 2018
Energy products food Products Cereals
Fertilizers Beverages Oils and food preparations
Wood metals and ores
ICDT - Annual Report on Trade among the OIC Member States 2019-2020
21
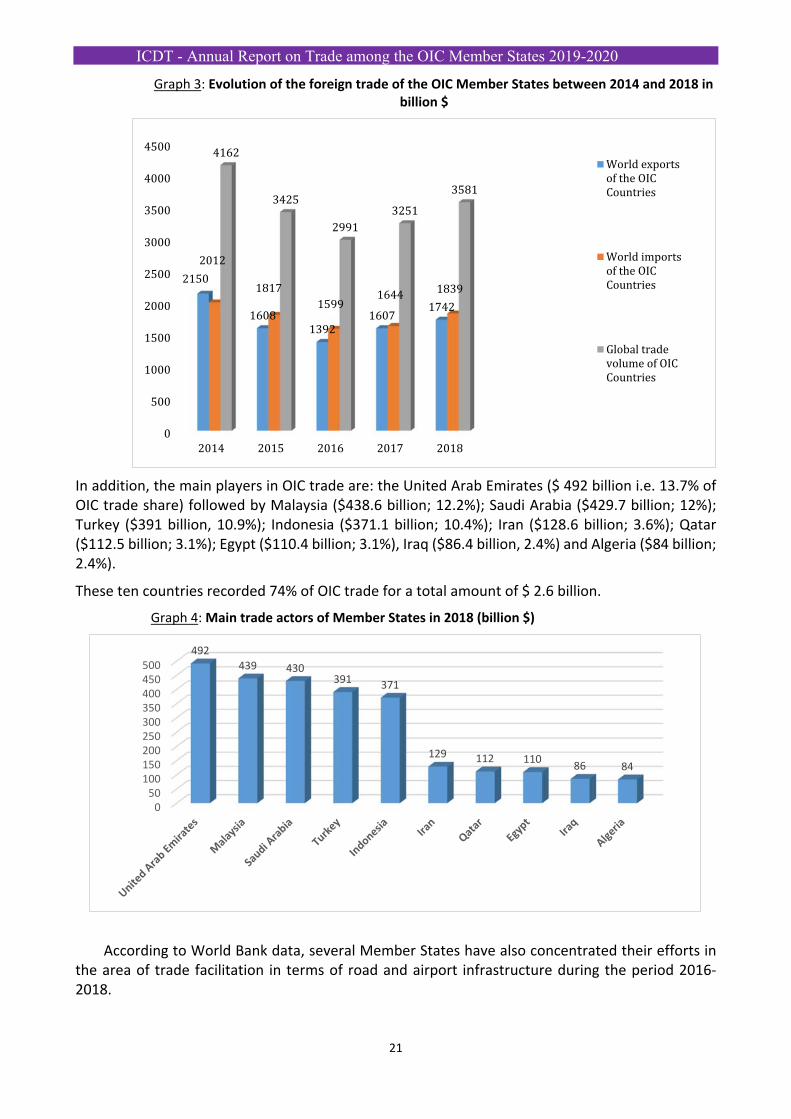
Graph 3: Evolution of the foreign trade of the OIC Member States between 2014 and 2018 in billion $
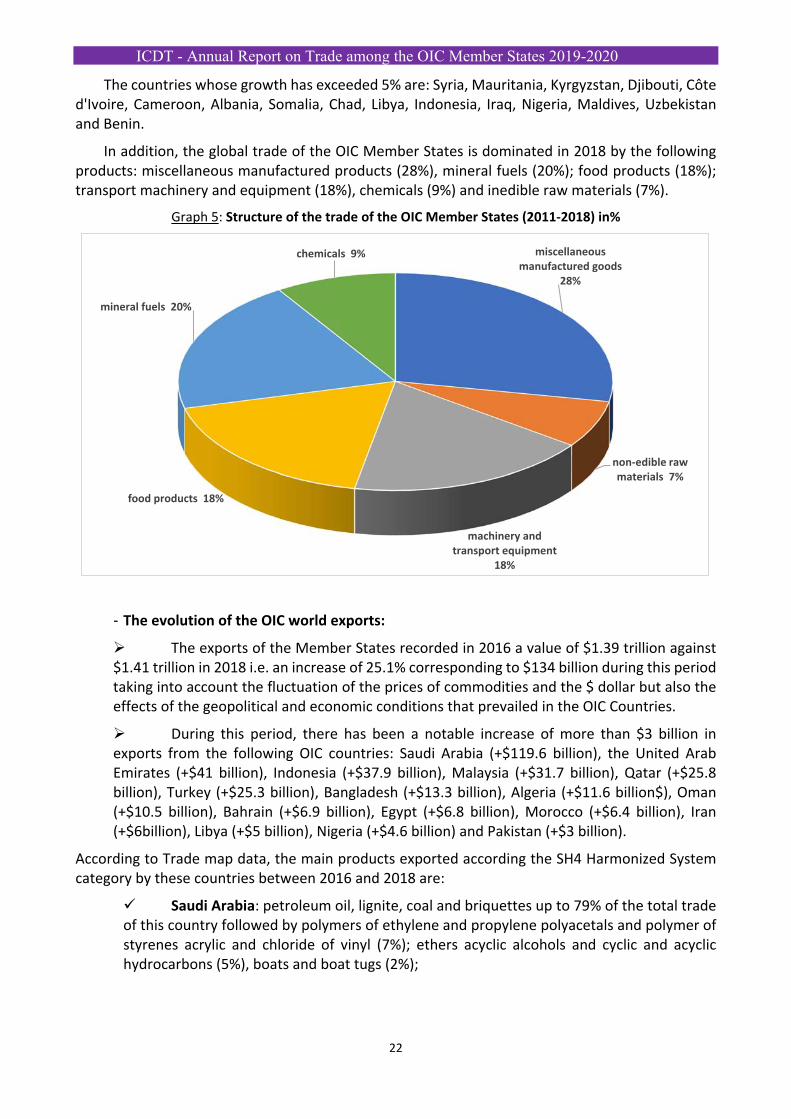
In addition, the main players in OIC trade are: the United Arab Emirates ($ 492 billion i.e. 13.7% of OIC trade share) followed by Malaysia ($438.6 billion; 12.2%); Saudi Arabia ($429.7 billion; 12%); Turkey ($391 billion, 10.9%); Indonesia ($371.1 billion; 10.4%); Iran ($128.6 billion; 3.6%); Qatar ($112.5 billion; 3.1%); Egypt ($110.4 billion; 3.1%), Iraq ($86.4 billion, 2.4%) and Algeria ($84 billion; 2.4%).
These ten countries recorded 74% of OIC trade for a total amount of $ 2.6 billion.
Graph 4: Main trade actors of Member States in 2018 (billion $)
According to World Bank data, several Member States have also concentrated their efforts in the area of trade facilitation in terms of road and airport infrastructure during the period 2016‐2018.
0
500
1000
1500
2000
2500
3000
3500
4000
4500
2014 2015 2016 2017 2018
2150
16081392
16071742
2012
18171599
1644 1839
4162
3425
29913251
3581
World exportsof the OICCountries
World importsof the OICCountries
Global tradevolume of OICCountries
050
100150200250300350400450500
492
439 430391 371
129 112 11086 84
ICDT - Annual Report on Trade among the OIC Member States 2019-2020
22
The countries whose growth has exceeded 5% are: Syria, Mauritania, Kyrgyzstan, Djibouti, Côte d'Ivoire, Cameroon, Albania, Somalia, Chad, Libya, Indonesia, Iraq, Nigeria, Maldives, Uzbekistan and Benin.
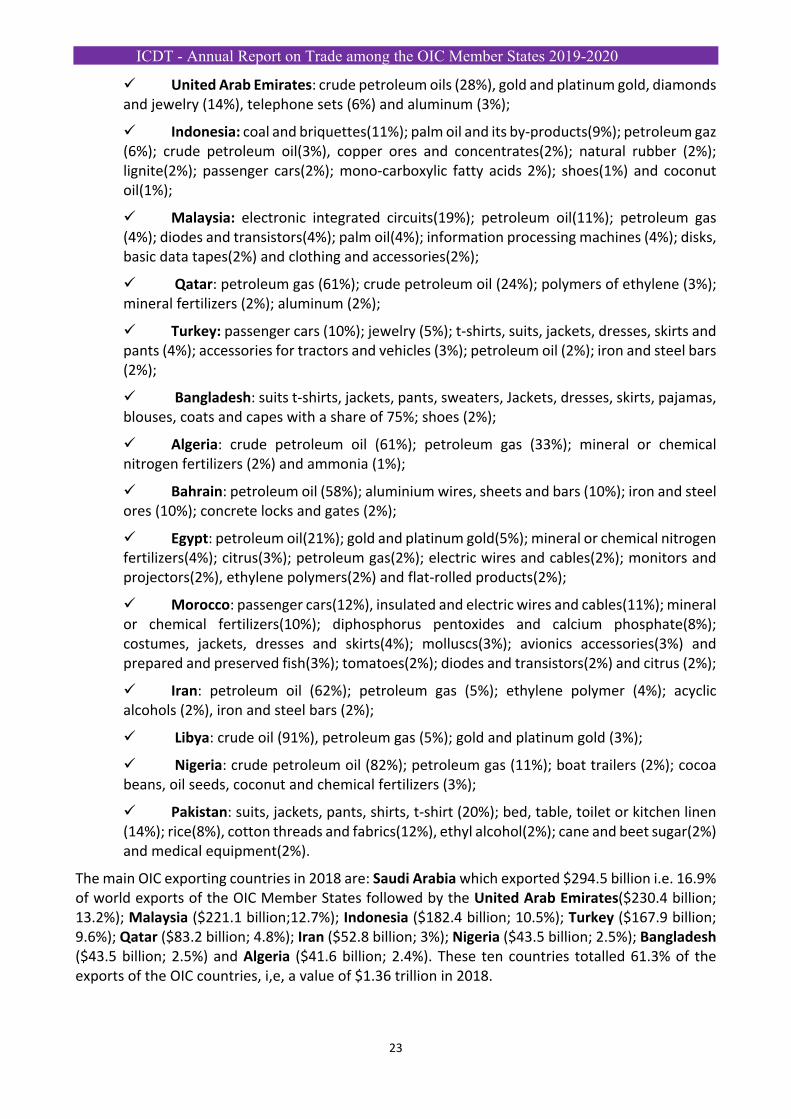
In addition, the global trade of the OIC Member States is dominated in 2018 by the following products: miscellaneous manufactured products (28%), mineral fuels (20%); food products (18%); transport machinery and equipment (18%), chemicals (9%) and inedible raw materials (7%).
Graph 5: Structure of the trade of the OIC Member States (2011‐2018) in%
- The evolution of the OIC world exports:
The exports of the Member States recorded in 2016 a value of $1.39 trillion against $1.41 trillion in 2018 i.e. an increase of 25.1% corresponding to $134 billion during this period taking into account the fluctuation of the prices of commodities and the $ dollar but also the effects of the geopolitical and economic conditions that prevailed in the OIC Countries.
During this period, there has been a notable increase of more than $3 billion in exports from the following OIC countries: Saudi Arabia (+$119.6 billion), the United Arab Emirates (+$41 billion), Indonesia (+$37.9 billion), Malaysia (+$31.7 billion), Qatar (+$25.8 billion), Turkey (+$25.3 billion), Bangladesh (+$13.3 billion), Algeria (+$11.6 billion$), Oman (+$10.5 billion), Bahrain (+$6.9 billion), Egypt (+$6.8 billion), Morocco (+$6.4 billion), Iran (+$6billion), Libya (+$5 billion), Nigeria (+$4.6 billion) and Pakistan (+$3 billion).
According to Trade map data, the main products exported according the SH4 Harmonized System category by these countries between 2016 and 2018 are:
Saudi Arabia: petroleum oil, lignite, coal and briquettes up to 79% of the total trade of this country followed by polymers of ethylene and propylene polyacetals and polymer of styrenes acrylic and chloride of vinyl (7%); ethers acyclic alcohols and cyclic and acyclic hydrocarbons (5%), boats and boat tugs (2%);
miscellaneous manufactured goods
28%
non‐edible raw materials 7%
machinery and transport equipment
18%
food products 18%
mineral fuels 20%
chemicals 9%
ICDT - Annual Report on Trade among the OIC Member States 2019-2020
23
United Arab Emirates: crude petroleum oils (28%), gold and platinum gold, diamonds and jewelry (14%), telephone sets (6%) and aluminum (3%);
Indonesia: coal and briquettes(11%); palm oil and its by‐products(9%); petroleum gaz (6%); crude petroleum oil(3%), copper ores and concentrates(2%); natural rubber (2%); lignite(2%); passenger cars(2%); mono‐carboxylic fatty acids 2%); shoes(1%) and coconut oil(1%);
Malaysia: electronic integrated circuits(19%); petroleum oil(11%); petroleum gas (4%); diodes and transistors(4%); palm oil(4%); information processing machines (4%); disks, basic data tapes(2%) and clothing and accessories(2%);
Qatar: petroleum gas (61%); crude petroleum oil (24%); polymers of ethylene (3%); mineral fertilizers (2%); aluminum (2%);
Turkey: passenger cars (10%); jewelry (5%); t‐shirts, suits, jackets, dresses, skirts and pants (4%); accessories for tractors and vehicles (3%); petroleum oil (2%); iron and steel bars (2%);
Bangladesh: suits t‐shirts, jackets, pants, sweaters, Jackets, dresses, skirts, pajamas, blouses, coats and capes with a share of 75%; shoes (2%);
Algeria: crude petroleum oil (61%); petroleum gas (33%); mineral or chemical nitrogen fertilizers (2%) and ammonia (1%);
Bahrain: petroleum oil (58%); aluminium wires, sheets and bars (10%); iron and steel ores (10%); concrete locks and gates (2%);
Egypt: petroleum oil(21%); gold and platinum gold(5%); mineral or chemical nitrogen fertilizers(4%); citrus(3%); petroleum gas(2%); electric wires and cables(2%); monitors and projectors(2%), ethylene polymers(2%) and flat‐rolled products(2%);
Morocco: passenger cars(12%), insulated and electric wires and cables(11%); mineral or chemical fertilizers(10%); diphosphorus pentoxides and calcium phosphate(8%); costumes, jackets, dresses and skirts(4%); molluscs(3%); avionics accessories(3%) and prepared and preserved fish(3%); tomatoes(2%); diodes and transistors(2%) and citrus (2%);
Iran: petroleum oil (62%); petroleum gas (5%); ethylene polymer (4%); acyclic alcohols (2%), iron and steel bars (2%);
Libya: crude oil (91%), petroleum gas (5%); gold and platinum gold (3%);
Nigeria: crude petroleum oil (82%); petroleum gas (11%); boat trailers (2%); cocoa beans, oil seeds, coconut and chemical fertilizers (3%);
Pakistan: suits, jackets, pants, shirts, t‐shirt (20%); bed, table, toilet or kitchen linen (14%); rice(8%), cotton threads and fabrics(12%), ethyl alcohol(2%); cane and beet sugar(2%) and medical equipment(2%).
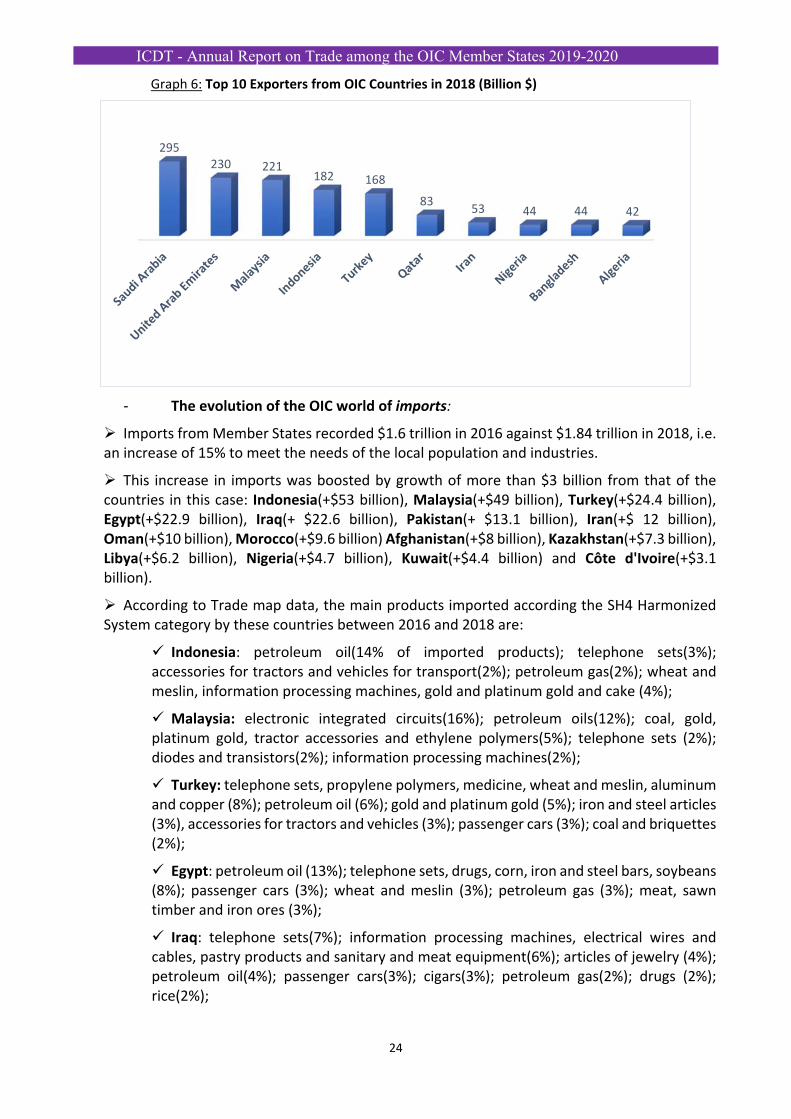
The main OIC exporting countries in 2018 are: Saudi Arabia which exported $294.5 billion i.e. 16.9% of world exports of the OIC Member States followed by the United Arab Emirates($230.4 billion; 13.2%); Malaysia ($221.1 billion;12.7%); Indonesia ($182.4 billion; 10.5%); Turkey ($167.9 billion; 9.6%); Qatar ($83.2 billion; 4.8%); Iran ($52.8 billion; 3%); Nigeria ($43.5 billion; 2.5%); Bangladesh ($43.5 billion; 2.5%) and Algeria ($41.6 billion; 2.4%). These ten countries totalled 61.3% of the exports of the OIC countries, i,e, a value of $1.36 trillion in 2018.
ICDT - Annual Report on Trade among the OIC Member States 2019-2020
24
Graph 6: Top 10 Exporters from OIC Countries in 2018 (Billion $)
- The evolution of the OIC world of imports:
Imports from Member States recorded $1.6 trillion in 2016 against $1.84 trillion in 2018, i.e. an increase of 15% to meet the needs of the local population and industries.
This increase in imports was boosted by growth of more than $3 billion from that of the countries in this case: Indonesia(+$53 billion), Malaysia(+$49 billion), Turkey(+$24.4 billion), Egypt(+$22.9 billion), Iraq(+ $22.6 billion), Pakistan(+ $13.1 billion), Iran(+$ 12 billion), Oman(+$10 billion), Morocco(+$9.6 billion) Afghanistan(+$8 billion), Kazakhstan(+$7.3 billion), Libya(+$6.2 billion), Nigeria(+$4.7 billion), Kuwait(+$4.4 billion) and Côte d'Ivoire(+$3.1 billion).
According to Trade map data, the main products imported according the SH4 Harmonized System category by these countries between 2016 and 2018 are:
Indonesia: petroleum oil(14% of imported products); telephone sets(3%); accessories for tractors and vehicles for transport(2%); petroleum gas(2%); wheat and meslin, information processing machines, gold and platinum gold and cake (4%);
Malaysia: electronic integrated circuits(16%); petroleum oils(12%); coal, gold, platinum gold, tractor accessories and ethylene polymers(5%); telephone sets (2%); diodes and transistors(2%); information processing machines(2%);
Turkey: telephone sets, propylene polymers, medicine, wheat and meslin, aluminum and copper (8%); petroleum oil (6%); gold and platinum gold (5%); iron and steel articles (3%), accessories for tractors and vehicles (3%); passenger cars (3%); coal and briquettes (2%);
Egypt: petroleum oil (13%); telephone sets, drugs, corn, iron and steel bars, soybeans (8%); passenger cars (3%); wheat and meslin (3%); petroleum gas (3%); meat, sawn timber and iron ores (3%);
Iraq: telephone sets(7%); information processing machines, electrical wires and cables, pastry products and sanitary and meat equipment(6%); articles of jewelry (4%); petroleum oil(4%); passenger cars(3%); cigars(3%); petroleum gas(2%); drugs (2%); rice(2%);
295230 221
182 168
8353 44 44 42
ICDT - Annual Report on Trade among the OIC Member States 2019-2020
25
Pakistan: petroleum oils(19%); fertilizers, propylene and ethylene polymers, tea, vegetables and medicines(8%); petroleum gas(6%); palm oil(3%); passenger cars (2%); telephone sets(2%); cotton and soybeans(4%);
Iran: electrical equipment, accessories for tractors and coal electrodes(6%); corn (5%); rice(4%); soy beans(3%); medication(3%); telephone sets(2%); oil cakes, air pumps, barley and sanitary equipment(4%), sunflower oil and meat(2%);
Oman: passenger cars(8%); petroleum oil(6%); telephone sets(3%); gold and platinum gold(3%); articles of jewellery, polycarboxylic acids and fittings and tubes (3%); iron ores(2%); avionics articles(2%); copper wire(2%);
Morocco: petroleum oil(11%); passenger cars(5%); petroleum gas(3%); electric insulated wires and cables(3%); accessories for tractors and vehicles(3%); coal, briquettes, telephone sets and copper wire(3%); wheat and meslin(2%); sulfur (2%); avionics accessories(2%);
Afghanistan: wheat or meslin flour(10%); peat(8%); rice, tea, wheat(6%); animal and vegetable fats and oils(5%); linen fabrics(4%); pavers and curbs for sidewalks (4%); gas or liquid meters(4%); medical equipment(4%); petroleum gas(3%); cane or beet sugar (3%)and tractor accessories(3%);
Kazakhstan: telephone sets (3%); medication (3%); petroleum oils (2%); passenger cars (2%); fittings (2%); hollow profile tubes and pipes (2%); air vehicles (2%);
Libya: petroleum oil (17%); telephone sets (7%); passenger cars (4%); articles of jewellery, preparation and preservation of fish, edible meats and offal and barley (4%); cigars (3%); medication (3%); wheat (2%);
Nigeria: petroleum oils (29%); boats (9%); fish, telephone sets, cane or beet sugar and medicines (4%) wheat (3%); passenger cars (3%); motorcycles (2%);
Kuwait: passenger cars (8%); telephone sets (5%); medication (3%); motor vehicles, aluminium and information processing machines (3%); articles of jewellery (2%); concrete bridges for construction (2%); air pumps (2%); gold and platinum gold (2%); electric wires and cables; hollow profile tubes and pipes (2%); fittings (2%);
Côte d'Ivoire: petroleum oil(20%); rice(6%); fish(5%); medicines(3%); passenger cars(3%); petroleum gas(2%); boats(2%); insecticides(2%); wheat and meslin (2%); hydraulic cements(2%) and motor vehicles(2%).
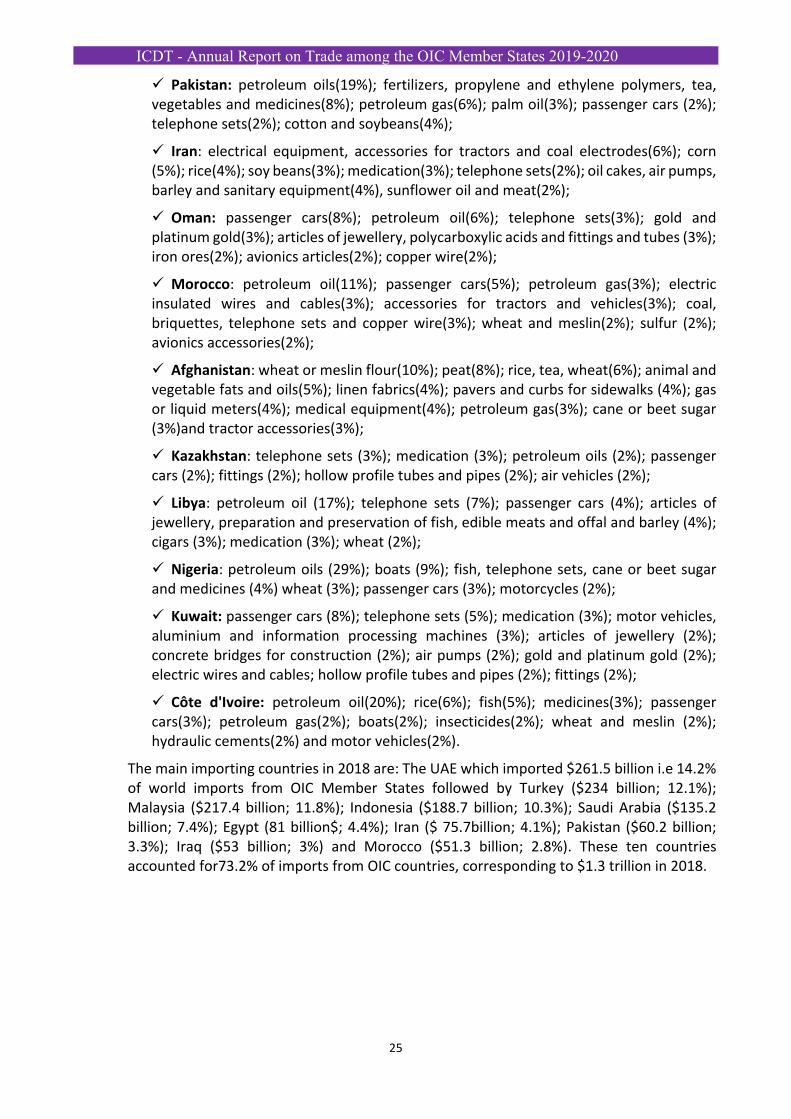
The main importing countries in 2018 are: The UAE which imported $261.5 billion i.e 14.2% of world imports from OIC Member States followed by Turkey ($234 billion; 12.1%); Malaysia ($217.4 billion; 11.8%); Indonesia ($188.7 billion; 10.3%); Saudi Arabia ($135.2 billion; 7.4%); Egypt (81 billion$; 4.4%); Iran ($ 75.7billion; 4.1%); Pakistan ($60.2 billion; 3.3%); Iraq ($53 billion; 3%) and Morocco ($51.3 billion; 2.8%). These ten countries accounted for73.2% of imports from OIC countries, corresponding to $1.3 trillion in 2018.
ICDT - Annual Report on Trade among the OIC Member States 2019-2020
26
Graph 7: Top 10 Importers from OIC Countries in 2018 (billion $)
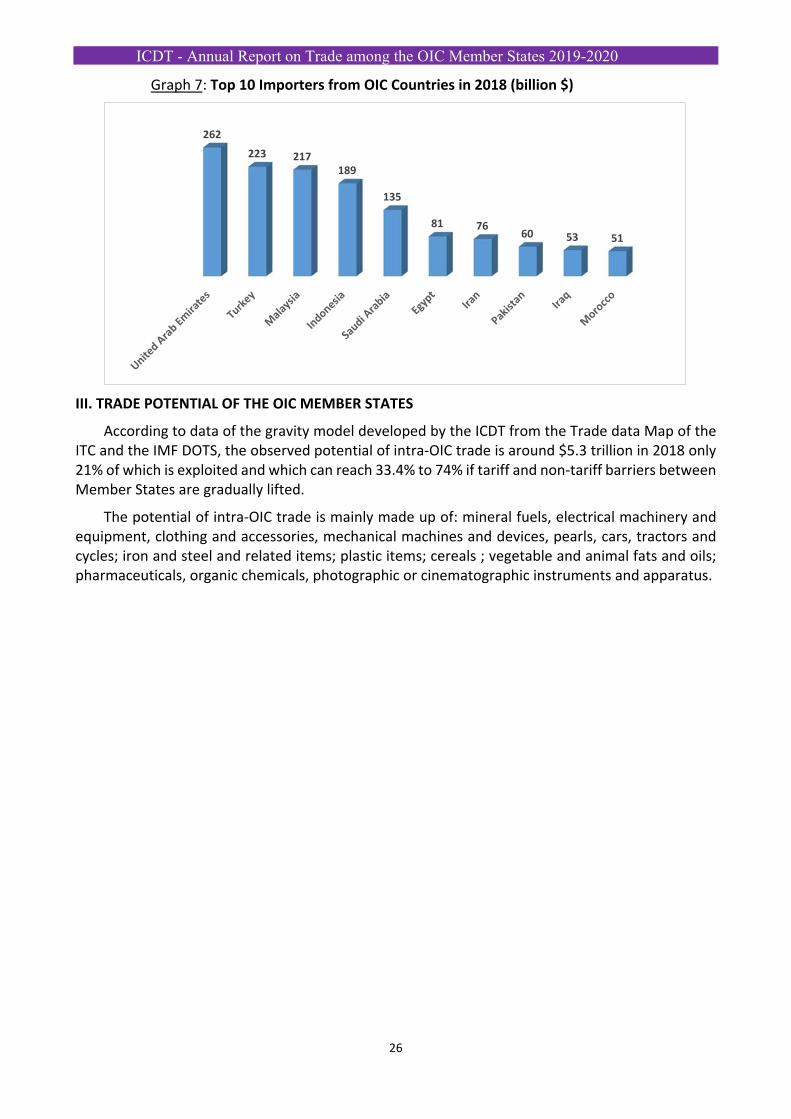
III. TRADE POTENTIAL OF THE OIC MEMBER STATES
According to data of the gravity model developed by the ICDT from the Trade data Map of the ITC and the IMF DOTS, the observed potential of intra‐OIC trade is around $5.3 trillion in 2018 only 21% of which is exploited and which can reach 33.4% to 74% if tariff and non‐tariff barriers between Member States are gradually lifted.
The potential of intra‐OIC trade is mainly made up of: mineral fuels, electrical machinery and equipment, clothing and accessories, mechanical machines and devices, pearls, cars, tractors and cycles; iron and steel and related items; plastic items; cereals ; vegetable and animal fats and oils; pharmaceuticals, organic chemicals, photographic or cinematographic instruments and apparatus.
262
223 217189
135
81 7660 53 51
ICDT - Annual Report on Trade among the OIC Member States 2019-2020
27
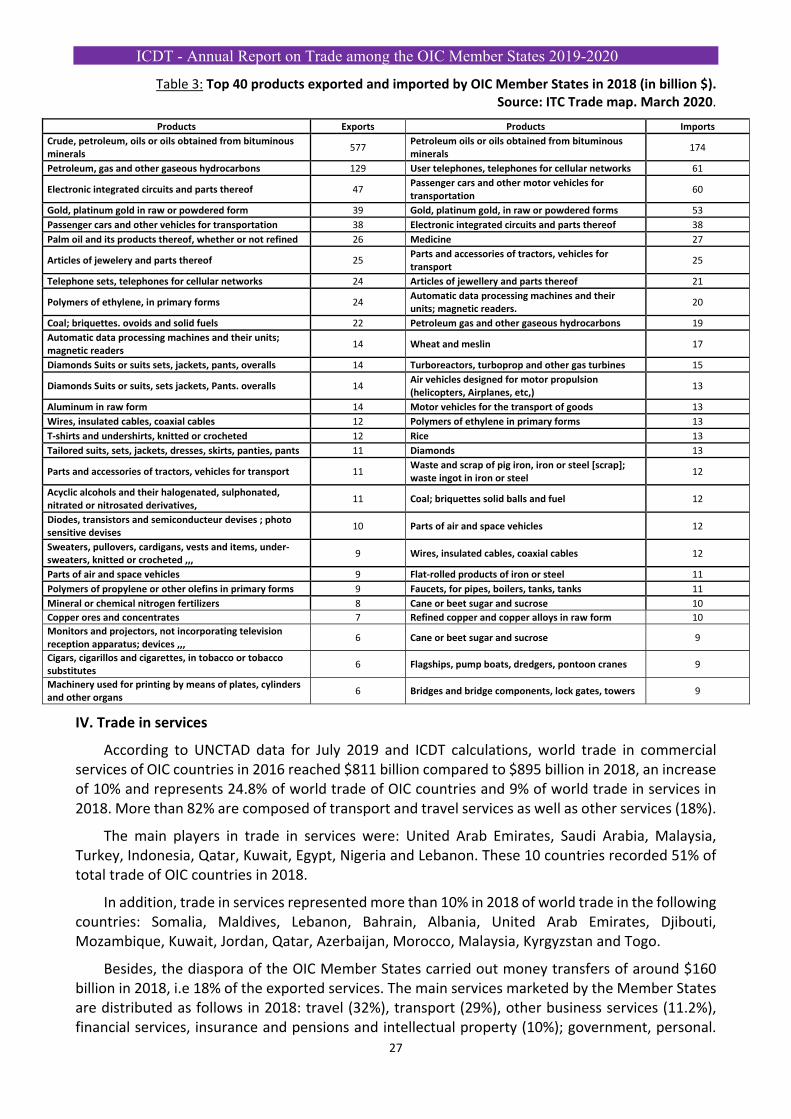
Table 3: Top 40 products exported and imported by OIC Member States in 2018 (in billion $). Source: ITC Trade map. March 2020.
Products Exports Products Imports
Crude, petroleum, oils or oils obtained from bituminous minerals
577 Petroleum oils or oils obtained from bituminous minerals
174
Petroleum, gas and other gaseous hydrocarbons 129 User telephones, telephones for cellular networks 61
Electronic integrated circuits and parts thereof 47 Passenger cars and other motor vehicles for transportation
60
Gold, platinum gold in raw or powdered form 39 Gold, platinum gold, in raw or powdered forms 53
Passenger cars and other vehicles for transportation 38 Electronic integrated circuits and parts thereof 38
Palm oil and its products thereof, whether or not refined 26 Medicine 27
Articles of jewelery and parts thereof 25 Parts and accessories of tractors, vehicles for transport
25
Telephone sets, telephones for cellular networks 24 Articles of jewellery and parts thereof 21
Polymers of ethylene, in primary forms 24 Automatic data processing machines and their units; magnetic readers.
20
Coal; briquettes. ovoids and solid fuels 22 Petroleum gas and other gaseous hydrocarbons 19
Automatic data processing machines and their units; magnetic readers
14 Wheat and meslin 17
Diamonds Suits or suits sets, jackets, pants, overalls 14 Turboreactors, turboprop and other gas turbines 15
Diamonds Suits or suits, sets jackets, Pants. overalls 14 Air vehicles designed for motor propulsion (helicopters, Airplanes, etc,)
13
Aluminum in raw form 14 Motor vehicles for the transport of goods 13
Wires, insulated cables, coaxial cables 12 Polymers of ethylene in primary forms 13
T‐shirts and undershirts, knitted or crocheted 12 Rice 13
Tailored suits, sets, jackets, dresses, skirts, panties, pants 11 Diamonds 13
Parts and accessories of tractors, vehicles for transport 11 Waste and scrap of pig iron, iron or steel [scrap]; waste ingot in iron or steel
12
Acyclic alcohols and their halogenated, sulphonated, nitrated or nitrosated derivatives,
11 Coal; briquettes solid balls and fuel 12
Diodes, transistors and semiconducteur devises ; photo sensitive devises
10 Parts of air and space vehicles 12
Sweaters, pullovers, cardigans, vests and items, under‐sweaters, knitted or crocheted ,,,
9 Wires, insulated cables, coaxial cables 12
Parts of air and space vehicles 9 Flat‐rolled products of iron or steel 11
Polymers of propylene or other olefins in primary forms 9 Faucets, for pipes, boilers, tanks, tanks 11
Mineral or chemical nitrogen fertilizers 8 Cane or beet sugar and sucrose 10
Copper ores and concentrates 7 Refined copper and copper alloys in raw form 10
Monitors and projectors, not incorporating television reception apparatus; devices ,,,
6 Cane or beet sugar and sucrose 9
Cigars, cigarillos and cigarettes, in tobacco or tobacco substitutes
6 Flagships, pump boats, dredgers, pontoon cranes 9
Machinery used for printing by means of plates, cylinders and other organs
6 Bridges and bridge components, lock gates, towers 9
IV. Trade in services
According to UNCTAD data for July 2019 and ICDT calculations, world trade in commercial services of OIC countries in 2016 reached $811 billion compared to $895 billion in 2018, an increase of 10% and represents 24.8% of world trade of OIC countries and 9% of world trade in services in 2018. More than 82% are composed of transport and travel services as well as other services (18%).
The main players in trade in services were: United Arab Emirates, Saudi Arabia, Malaysia, Turkey, Indonesia, Qatar, Kuwait, Egypt, Nigeria and Lebanon. These 10 countries recorded 51% of total trade of OIC countries in 2018.
In addition, trade in services represented more than 10% in 2018 of world trade in the following countries: Somalia, Maldives, Lebanon, Bahrain, Albania, United Arab Emirates, Djibouti, Mozambique, Kuwait, Jordan, Qatar, Azerbaijan, Morocco, Malaysia, Kyrgyzstan and Togo.
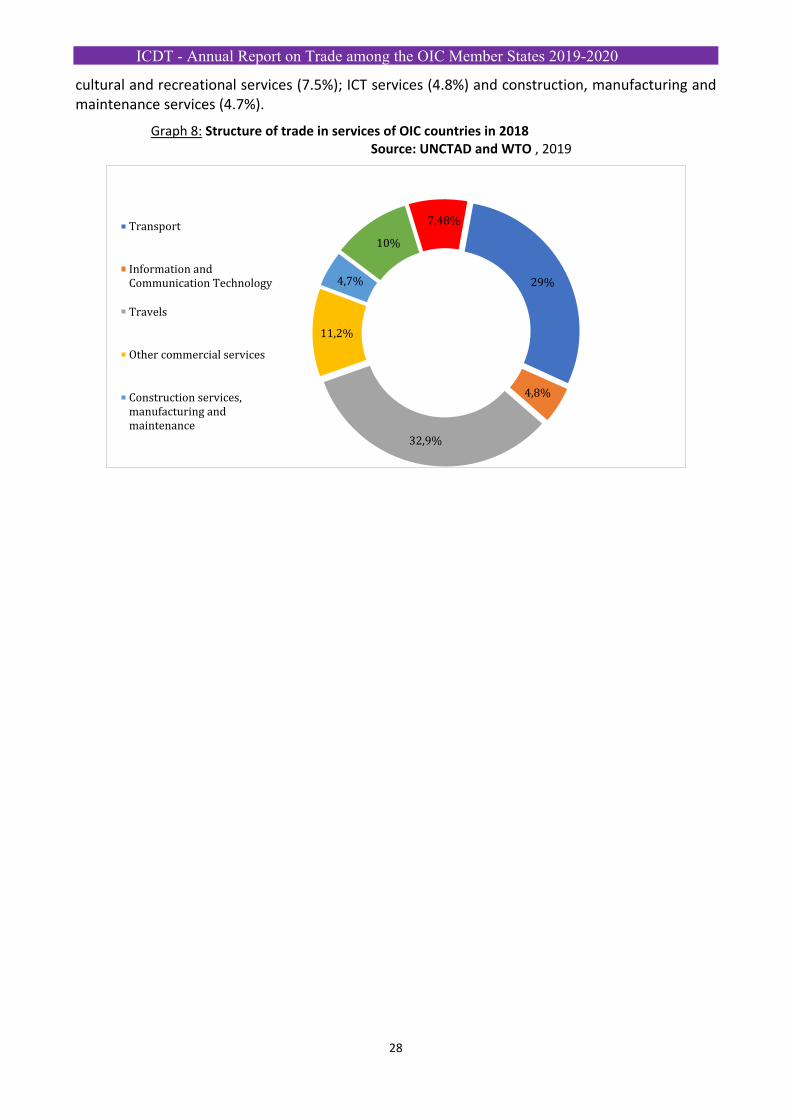
Besides, the diaspora of the OIC Member States carried out money transfers of around $160 billion in 2018, i.e 18% of the exported services. The main services marketed by the Member States are distributed as follows in 2018: travel (32%), transport (29%), other business services (11.2%), financial services, insurance and pensions and intellectual property (10%); government, personal.
ICDT - Annual Report on Trade among the OIC Member States 2019-2020
28
cultural and recreational services (7.5%); ICT services (4.8%) and construction, manufacturing and maintenance services (4.7%).
Graph 8: Structure of trade in services of OIC countries in 2018 Source: UNCTAD and WTO , 2019
29%
4,8%
32,9%
11,2%
4,7%
10%
7,48%Transport
Information andCommunication Technology
Travels
Other commercial services
Construction services,manufacturing andmaintenance
ICDT - Annual Report on Trade among the OIC Member States 2019-2020
29
CHAPTER II:
TRENDS OF ITRA‐OIC TRADE
ICDT - Annual Report on Trade among the OIC Member States 2019-2020
30
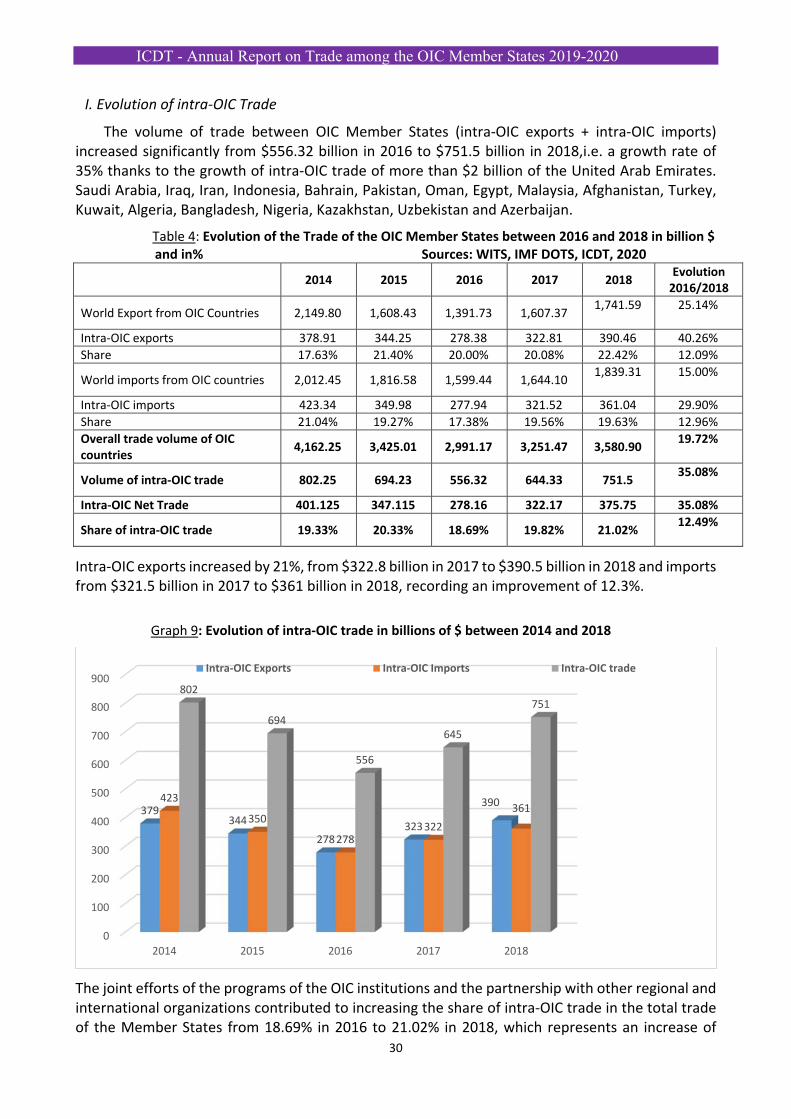
I. Evolution of intra‐OIC Trade
The volume of trade between OIC Member States (intra‐OIC exports + intra‐OIC imports) increased significantly from $556.32 billion in 2016 to $751.5 billion in 2018,i.e. a growth rate of 35% thanks to the growth of intra‐OIC trade of more than $2 billion of the United Arab Emirates. Saudi Arabia, Iraq, Iran, Indonesia, Bahrain, Pakistan, Oman, Egypt, Malaysia, Afghanistan, Turkey, Kuwait, Algeria, Bangladesh, Nigeria, Kazakhstan, Uzbekistan and Azerbaijan.
Table 4: Evolution of the Trade of the OIC Member States between 2016 and 2018 in billion $ and in% Sources: WITS, IMF DOTS, ICDT, 2020
2014 2015 2016 2017 2018
Evolution 2016/2018
World Export from OIC Countries 2,149.80 1,608.43 1,391.73 1,607.37 1,741.59
25.14%
Intra‐OIC exports 378.91 344.25 278.38 322.81 390.46 40.26%
Share 17.63% 21.40% 20.00% 20.08% 22.42% 12.09%
World imports from OIC countries 2,012.45 1,816.58 1,599.44 1,644.10 1,839.31
15.00%
Intra‐OIC imports 423.34 349.98 277.94 321.52 361.04 29.90%
Share 21.04% 19.27% 17.38% 19.56% 19.63% 12.96%
Overall trade volume of OIC countries
4,162.25 3,425.01 2,991.17 3,251.47 3,580.90 19.72%
Volume of intra‐OIC trade 802.25 694.23 556.32 644.33 751.5 35.08%
Intra‐OIC Net Trade 401.125 347.115 278.16 322.17 375.75 35.08%
Share of intra‐OIC trade 19.33% 20.33% 18.69% 19.82% 21.02% 12.49%
Intra‐OIC exports increased by 21%, from $322.8 billion in 2017 to $390.5 billion in 2018 and imports from $321.5 billion in 2017 to $361 billion in 2018, recording an improvement of 12.3%.
Graph 9: Evolution of intra‐OIC trade in billions of $ between 2014 and 2018
The joint efforts of the programs of the OIC institutions and the partnership with other regional and international organizations contributed to increasing the share of intra‐OIC trade in the total trade of the Member States from 18.69% in 2016 to 21.02% in 2018, which represents an increase of
0
100
200
300
400
500
600
700
800
900
2014 2015 2016 2017 2018
379344
278323
390423
350
278322
361
802
694
556
645
751
Intra‐OIC Exports Intra‐OIC Imports Intra‐OIC trade
ICDT - Annual Report on Trade among the OIC Member States 2019-2020
31
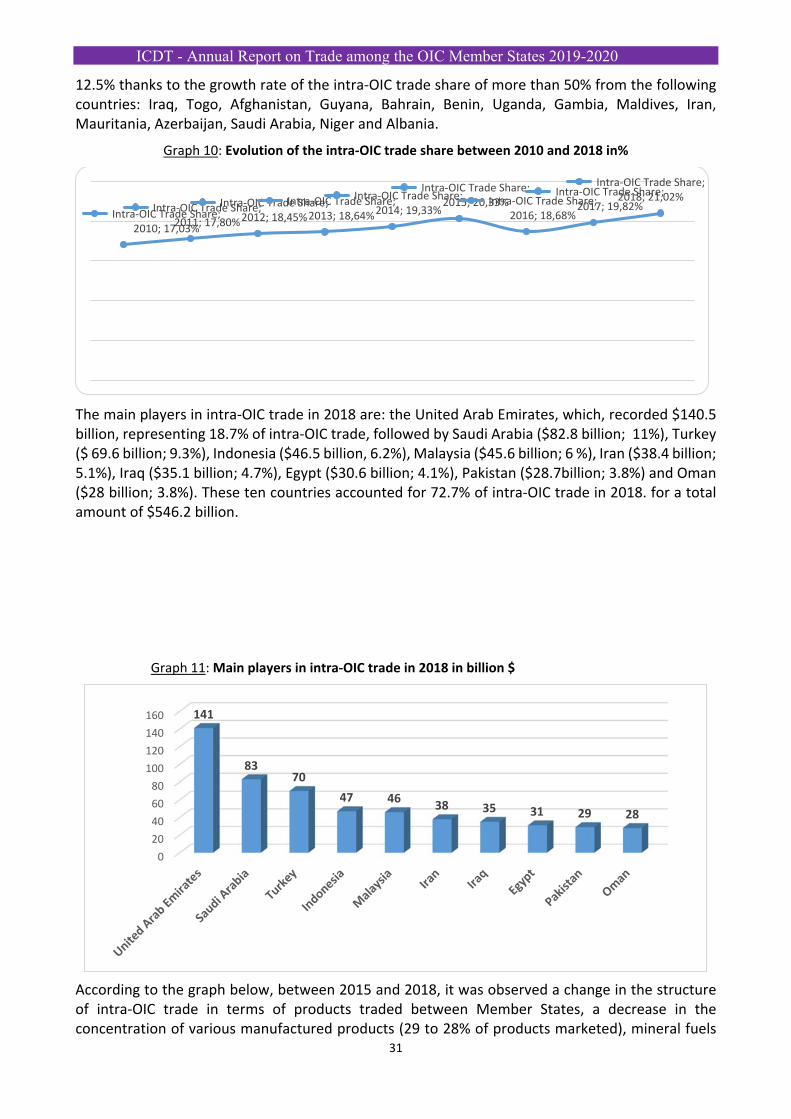
12.5% thanks to the growth rate of the intra‐OIC trade share of more than 50% from the following countries: Iraq, Togo, Afghanistan, Guyana, Bahrain, Benin, Uganda, Gambia, Maldives, Iran, Mauritania, Azerbaijan, Saudi Arabia, Niger and Albania.
Graph 10: Evolution of the intra‐OIC trade share between 2010 and 2018 in%
The main players in intra‐OIC trade in 2018 are: the United Arab Emirates, which, recorded $140.5 billion, representing 18.7% of intra‐OIC trade, followed by Saudi Arabia ($82.8 billion; 11%), Turkey ($ 69.6 billion; 9.3%), Indonesia ($46.5 billion, 6.2%), Malaysia ($45.6 billion; 6 %), Iran ($38.4 billion; 5.1%), Iraq ($35.1 billion; 4.7%), Egypt ($30.6 billion; 4.1%), Pakistan ($28.7billion; 3.8%) and Oman ($28 billion; 3.8%). These ten countries accounted for 72.7% of intra‐OIC trade in 2018. for a total amount of $546.2 billion.
Graph 11: Main players in intra‐OIC trade in 2018 in billion $
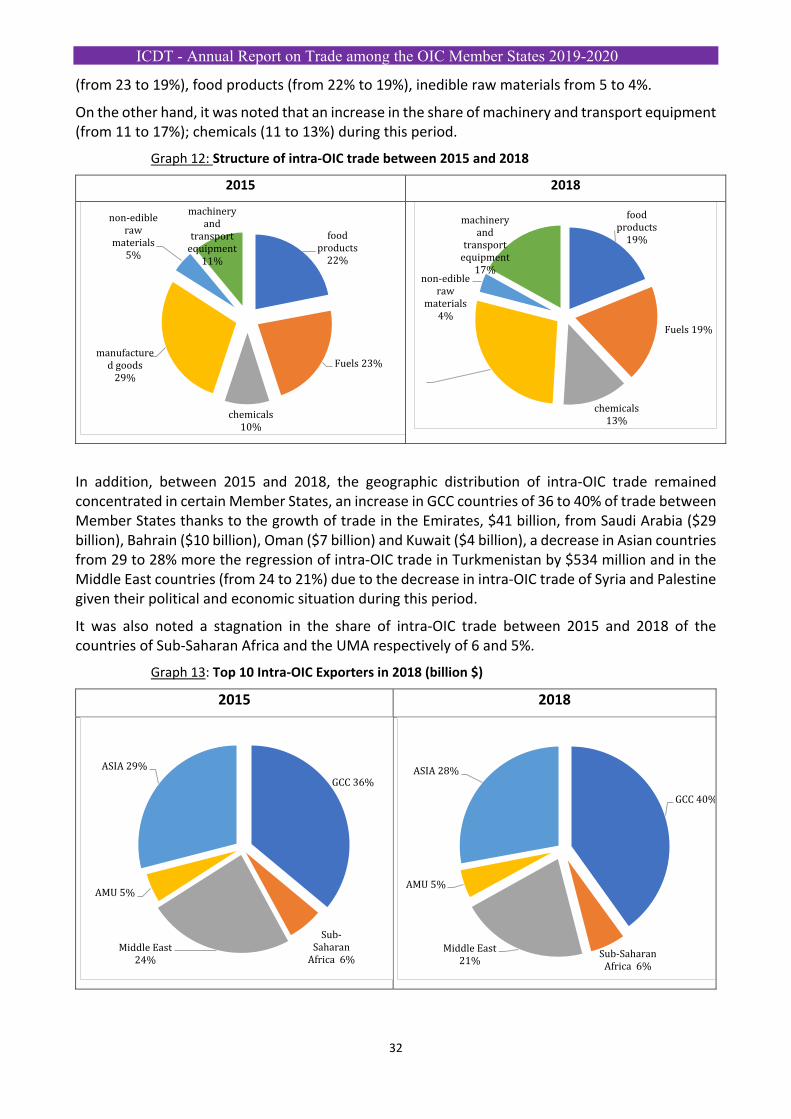
According to the graph below, between 2015 and 2018, it was observed a change in the structure of intra‐OIC trade in terms of products traded between Member States, a decrease in the concentration of various manufactured products (29 to 28% of products marketed), mineral fuels
Intra‐OIC Trade Share; 2010; 17,03%
Intra‐OIC Trade Share; 2011; 17,80%
Intra‐OIC Trade Share; 2012; 18,45%
Intra‐OIC Trade Share; 2013; 18,64%
Intra‐OIC Trade Share; 2014; 19,33%
Intra‐OIC Trade Share; 2015; 20,33%Intra‐OIC Trade Share;
2016; 18,68%
Intra‐OIC Trade Share; 2017; 19,82%
Intra‐OIC Trade Share; 2018; 21,02%
0
20
40
60
80
100
120
140
160 141
8370
47 4638 35 31 29 28
ICDT - Annual Report on Trade among the OIC Member States 2019-2020
32
(from 23 to 19%), food products (from 22% to 19%), inedible raw materials from 5 to 4%.
On the other hand, it was noted that an increase in the share of machinery and transport equipment (from 11 to 17%); chemicals (11 to 13%) during this period.
Graph 12: Structure of intra‐OIC trade between 2015 and 2018
2015 2018
In addition, between 2015 and 2018, the geographic distribution of intra‐OIC trade remained concentrated in certain Member States, an increase in GCC countries of 36 to 40% of trade between Member States thanks to the growth of trade in the Emirates, $41 billion, from Saudi Arabia ($29 billion), Bahrain ($10 billion), Oman ($7 billion) and Kuwait ($4 billion), a decrease in Asian countries from 29 to 28% more the regression of intra‐OIC trade in Turkmenistan by $534 million and in the Middle East countries (from 24 to 21%) due to the decrease in intra‐OIC trade of Syria and Palestine given their political and economic situation during this period.
It was also noted a stagnation in the share of intra‐OIC trade between 2015 and 2018 of the countries of Sub‐Saharan Africa and the UMA respectively of 6 and 5%.
Graph 13: Top 10 Intra‐OIC Exporters in 2018 (billion $)
2015 2018
food products
22%
Fuels 23%
chemicals 10%
manufactured goods
29%
non-edible raw
materials 5%
machinery and
transport equipment
11%
food products
19%
Fuels 19%
chemicals 13%
non-edible raw
materials 4%
machinery and
transport equipment
17%
GCC 36%
Sub-Saharan
Africa 6%Middle East
24%
AMU 5%
ASIA 29%
GCC 40%
Sub-Saharan Africa 6%
Middle East21%
AMU 5%
ASIA 28%
ICDT - Annual Report on Trade among the OIC Member States 2019-2020
33
To strengthen economic and commercial cooperation between the OIC countries, the Institutions and the OIC countries must contribute to the directives initiated by the OIC General Secretariat through its OIC‐2025 Ten‐Year Action Plan through activities of its trade and investment, finance and private sector sub‐committees and especially those relating to capacity building. participation in fairs, international fairs and business fora and in particular those organized by the ICDT and the IDB.
It is also essential to streamline their foreign trade and intra‐OIC investment procedure in order to boost trade between Member States by raising awareness of the establishment of single windows for foreign trade and the modernization of customs administrations, investment in strategic sectors such as food, mining, petroleum, forestry, logistics services, ICT, Islamic finance, family tourism, cultural and higher education services and l exchange of experience in quality management of semi‐industrial products.
It is also important that the OIC Member States participate actively in the activities of the OIC Institutions in charge of intra‐OIC trade development namely those of ICDT, IDB Group, ICCIA, SMIIC and COMCEC projects within the framework of Project Financing.
II. Structure of intra‐OIC trade
II.1. Structure of intra‐OIC exports
Intra‐OIC exports have increased by 40.3% in the last three years, going from $ 278.4 billion in 2016 to $390.5 billion in 2018 thanks among other things, to promotional activities (fairs, shows, trade missions, joint meetings), financing, investment in trade between Member States strengthened by the OIC Institutions, regional and international but also by improved the doing business procedures of Member States.
This growth was supported by that of some of the following OIC Member States: the UAE AU (+$34 billion; +53%) followed by Saudi Arabia (+$26.1 billion; +83%), Iran (+$16.8 billion; + 191%), Indonesia (+$4 billion; +22%), Oman (+$4 billion; +53%), Bahrain (+$3.8 billion; + 54%), Nigeria (+ $3.2 billion; +73%), Malaysia (+$2.7 billion; +14%) and Kazakhstan (+$2,2 billion; +54%).
On the other hand, other countries registered their intra‐OIC exports decrease between 2016 and 2018 by 50 million such as: Mali, Jordan, Guinea, Suriname, Sierra Leone, Turkey, Bangladesh, Gambia and Chad.
The share of intra‐OIC exports in total exports of Member States increased by 12.1% during this period from 20% in 2016 to 22.4% in 2018.
In addition, there are about 20 OIC countries exporting 30% of their total exports to Member States in 2018 thanks to geographic proximity regard to consumption, economic complementarity but also to the existence of agreements bilateral and regional cooperation.
These countries are: Djibouti, Somalia, Sudan, Tajikistan, Gambia, Syria, Togo, Benin, Lebanon, Bahrain, Afghanistan, Iran, Niger, Jordan, Senegal, United Arab Emirates, Egypt, Uzbekistan, Kyrgyzstan and Oman.
The main exporting countries to the OIC zone in 2018 are: the United Arab Emirates, which totaled $97.8 billion i.e 25.1% of intra‐OIC exports) followed by Saudi Arabia ($57.5 billion; 14.7%), Turkey ($41.2 billion; 10.5%), Iran ($25.6 billion; 6.6%), Malaysia ($22.6 billion; 5.8%), Indonesia ($22.3 billion; 5.7%), Egypt ($12.4 billion; 3.2%), Oman ($11.6 billion; 3%), Bahrain ($11.1 billion; 2.8%) and Qatar ($10.1 billion; 2.6%).
This group of countries recorded around $312.2 billion or 80% of intra‐OIC exports in 2018.
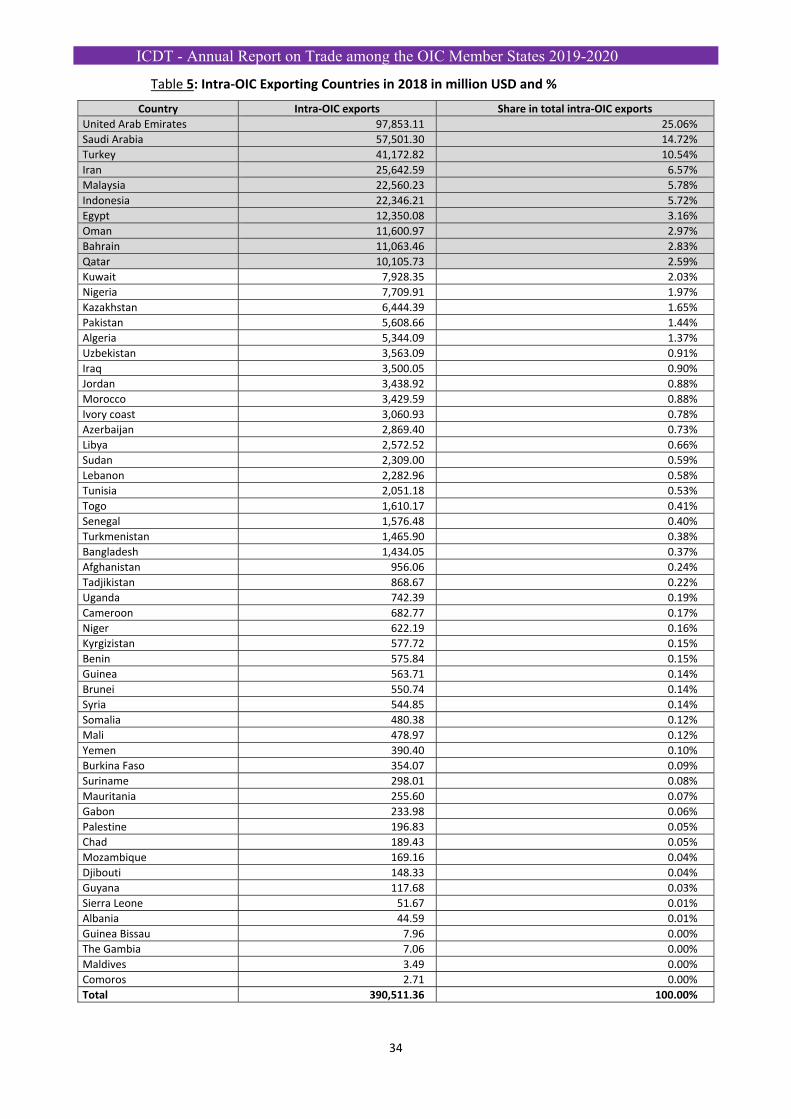
ICDT - Annual Report on Trade among the OIC Member States 2019-2020
34
Table 5: Intra‐OIC Exporting Countries in 2018 in million USD and %
Country Intra‐OIC exports Share in total intra‐OIC exports
United Arab Emirates 97,853.11 25.06%
Saudi Arabia 57,501.30 14.72%
Turkey 41,172.82 10.54%
Iran 25,642.59 6.57%
Malaysia 22,560.23 5.78%
Indonesia 22,346.21 5.72%
Egypt 12,350.08 3.16%
Oman 11,600.97 2.97%
Bahrain 11,063.46 2.83%
Qatar 10,105.73 2.59%
Kuwait 7,928.35 2.03%
Nigeria 7,709.91 1.97%
Kazakhstan 6,444.39 1.65%
Pakistan 5,608.66 1.44%
Algeria 5,344.09 1.37%
Uzbekistan 3,563.09 0.91%
Iraq 3,500.05 0.90%
Jordan 3,438.92 0.88%
Morocco 3,429.59 0.88%
Ivory coast 3,060.93 0.78%
Azerbaijan 2,869.40 0.73%
Libya 2,572.52 0.66%
Sudan 2,309.00 0.59%
Lebanon 2,282.96 0.58%
Tunisia 2,051.18 0.53%
Togo 1,610.17 0.41%
Senegal 1,576.48 0.40%
Turkmenistan 1,465.90 0.38%
Bangladesh 1,434.05 0.37%
Afghanistan 956.06 0.24%
Tadjikistan 868.67 0.22%
Uganda 742.39 0.19%
Cameroon 682.77 0.17%
Niger 622.19 0.16%
Kyrgizistan 577.72 0.15%
Benin 575.84 0.15%
Guinea 563.71 0.14%
Brunei 550.74 0.14%
Syria 544.85 0.14%
Somalia 480.38 0.12%
Mali 478.97 0.12%
Yemen 390.40 0.10%
Burkina Faso 354.07 0.09%
Suriname 298.01 0.08%
Mauritania 255.60 0.07%
Gabon 233.98 0.06%
Palestine 196.83 0.05%
Chad 189.43 0.05%
Mozambique 169.16 0.04%
Djibouti 148.33 0.04%
Guyana 117.68 0.03%
Sierra Leone 51.67 0.01%
Albania 44.59 0.01%
Guinea Bissau 7.96 0.00%
The Gambia 7.06 0.00%
Maldives 3.49 0.00%
Comoros 2.71 0.00%
Total 390,511.36 100.00%
ICDT - Annual Report on Trade among the OIC Member States 2019-2020
35
The main products exported according the HS4 Harmonized System category by country in 2018 are:
United Arab Emirates: telephone sets (16% of intra‐OIC exports); gold and platinum gold (9%); articles of jewellery (5%); passenger cars (4%); information processing machines (4%); cigars (4%); petroleum oil (3%); tractor and vehicle accessories (2%); copper wire (2%);
Saudi Arabia: polymers of ethylene (15% of total intra‐OIC exports); polymers of propylene (11%); tugs and pusher craft (9%); ethers (3%); cyclic alcohols; fruit juices, milk and cheese (3%); electrically insulated wires and cables (2%); passenger cars (2%); cyclic hydrocarbons (2%);
Turkey: articles of jewellery(7%); bridges for construction; passenger cars; electric insulated wires and cables; sanitary napkins; meat and edible offal and bird eggs (6%); iron or steel bars (3%); petroleum oils (2%); medical furniture (2%); carpet (2%); wheat or meslin flour (2%); gold and platinum gold (2%); bakery and pastry products (2%);
Iran: petroleum oil (17%); petroleum gas (12%); iron or steel bars (7%); acyclic and cyclic hydrocarbons (4%); hydraulic cements, packaging articles, bakery or pastry products (3%); petroleum coke (2%); ethylene polymers (2%); ceramic tiles (2%);
Malaysia: petroleum oil (14%); palm oil (13%); information processing machines; clothing. electronic integrated circuits; acyclic alcohols, soaps (4%); articles of jewelry (3%); aluminium (2%); animal and vegetable fats and oils (2%); telephone sets (2%); ethylene polymers (2%);
Indonesia: palm oil (22%); hard coal and briquettes (9%); passenger cars (4%); petroleum oil (4%); paper and cardboard (3%); petroleum coke (3%); petroleum gas (2%); coconut oil (2%); monocarboxylic fatty acids (2%); copper (2%); tractor and vehicle accessories (2%);
Egypt: gold and platinum gold (11%); petroleum oil (10%); soaps; insulated electric wires and cables; petroleum gas; cane or sugar beet (5%); monitors and projectors (4%); mineral or chemical fertilizers (3%); citrus (2%); cheese and curd (2%); medical equipment (2%); propylene polymers (2%); sanitary napkins (2%);
Oman: petroleum oil (20%); iron ores (12%); iron or steel bars (9%); cigars (4%); milk (3%); electric insulated wires; cables (3%); aluminium (3%); bakery or pastry products; food preparations; acyclic alcohols (3%); propylene polymers (2%); cyclic hydrocarbons (2%);
Bahrain: iron ores and ferrous articles (28%); aluminium and aluminium wires (22%); bridges for construction (4%); articles of jewellery (3%); food preparations (3%); cheese and curd (2%); cigars (2%).
Qatar: petroleum gas (60%); polymers of ethylene (7%); tugs and pusher craft (5%); petroleum oils (9%); aluminum (3%); iron or steel bars (2%); ocean liners and cruise ships (2%); ethers (2%).
In conclusion, the main products exported between the OIC Member States in 2018 are dominated by miscellaneous manufactured products up to 30% followed by machinery and transport equipment (21%); food products (16%); chemicals (15%); fuels (14%) and inedible raw materials (4%) due to the fluctuation in the prices of these products on the world market.
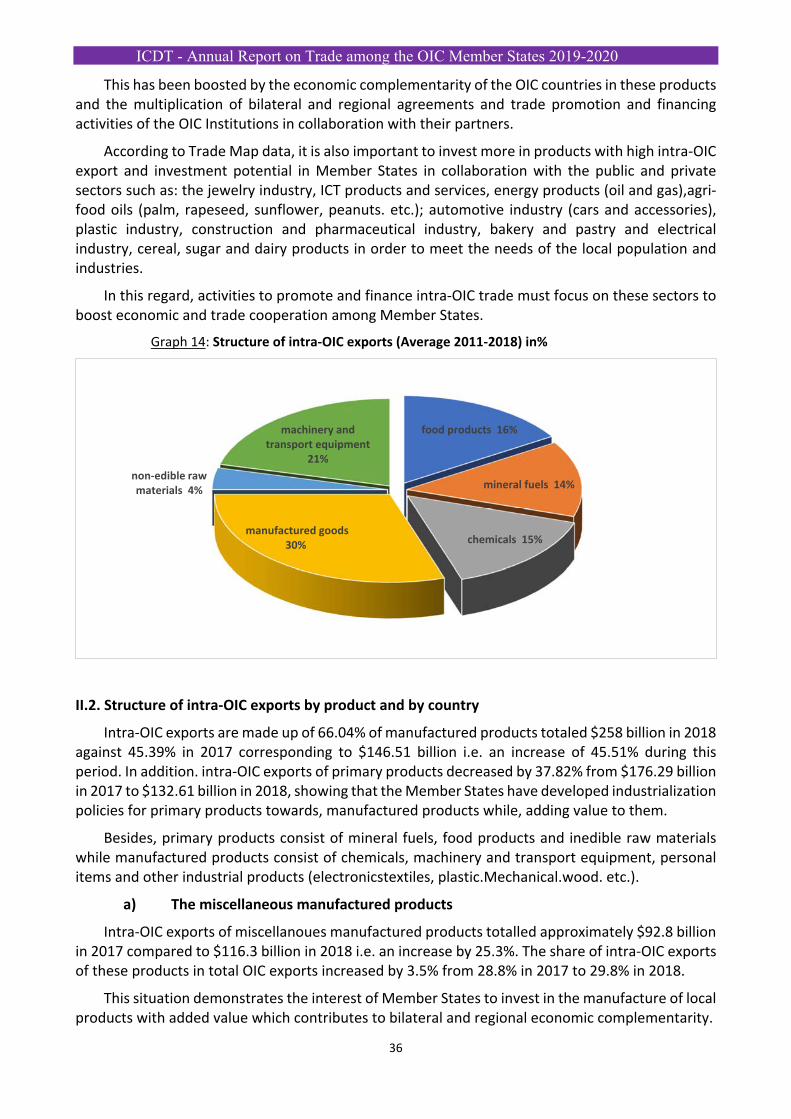
ICDT - Annual Report on Trade among the OIC Member States 2019-2020
36
This has been boosted by the economic complementarity of the OIC countries in these products and the multiplication of bilateral and regional agreements and trade promotion and financing activities of the OIC Institutions in collaboration with their partners.
According to Trade Map data, it is also important to invest more in products with high intra‐OIC export and investment potential in Member States in collaboration with the public and private sectors such as: the jewelry industry, ICT products and services, energy products (oil and gas),agri‐food oils (palm, rapeseed, sunflower, peanuts. etc.); automotive industry (cars and accessories), plastic industry, construction and pharmaceutical industry, bakery and pastry and electrical industry, cereal, sugar and dairy products in order to meet the needs of the local population and industries.
In this regard, activities to promote and finance intra‐OIC trade must focus on these sectors to boost economic and trade cooperation among Member States.
Graph 14: Structure of intra‐OIC exports (Average 2011‐2018) in%
II.2. Structure of intra‐OIC exports by product and by country
Intra‐OIC exports are made up of 66.04% of manufactured products totaled $258 billion in 2018 against 45.39% in 2017 corresponding to $146.51 billion i.e. an increase of 45.51% during this period. In addition. intra‐OIC exports of primary products decreased by 37.82% from $176.29 billion in 2017 to $132.61 billion in 2018, showing that the Member States have developed industrialization policies for primary products towards, manufactured products while, adding value to them.
Besides, primary products consist of mineral fuels, food products and inedible raw materials while manufactured products consist of chemicals, machinery and transport equipment, personal items and other industrial products (electronicstextiles, plastic.Mechanical.wood. etc.).
a) The miscellaneous manufactured products
Intra‐OIC exports of miscellanoues manufactured products totalled approximately $92.8 billion in 2017 compared to $116.3 billion in 2018 i.e. an increase by 25.3%. The share of intra‐OIC exports of these products in total OIC exports increased by 3.5% from 28.8% in 2017 to 29.8% in 2018.
This situation demonstrates the interest of Member States to invest in the manufacture of local products with added value which contributes to bilateral and regional economic complementarity.
food products 16%
mineral fuels 14%
chemicals 15%manufactured goods
30%
non‐edible raw materials 4%
machinery and transport equipment
21%
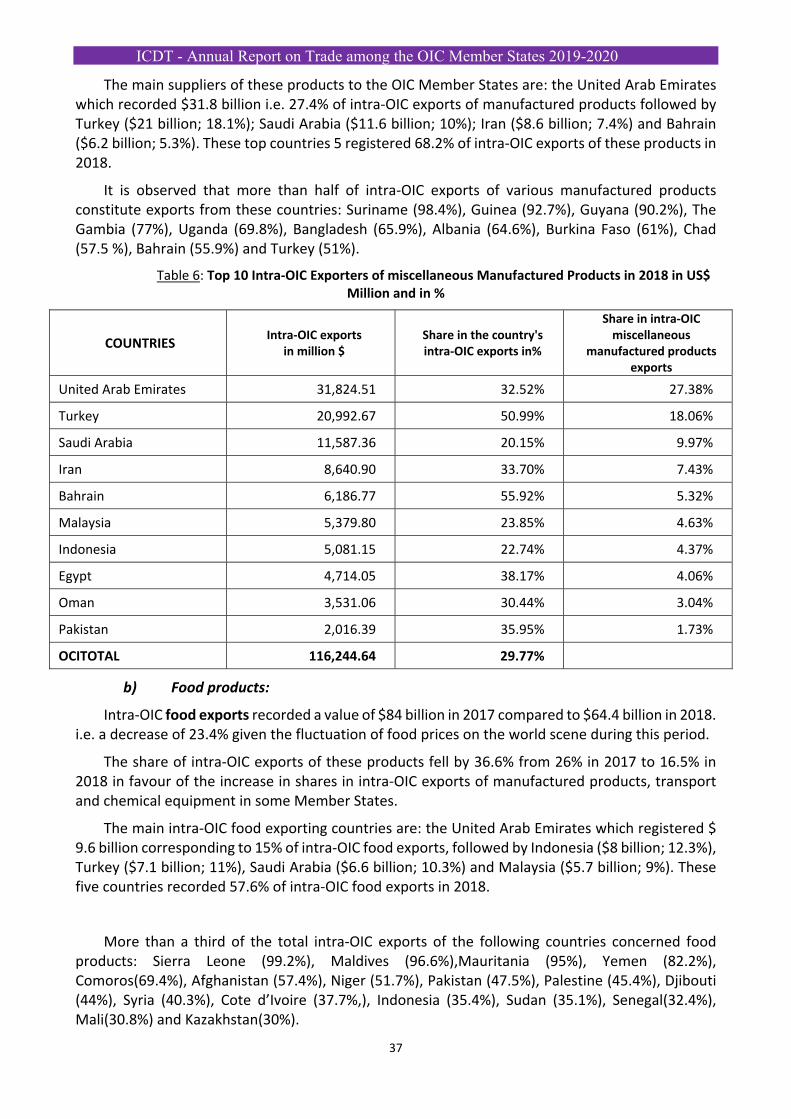
ICDT - Annual Report on Trade among the OIC Member States 2019-2020
37
The main suppliers of these products to the OIC Member States are: the United Arab Emirates which recorded $31.8 billion i.e. 27.4% of intra‐OIC exports of manufactured products followed by Turkey ($21 billion; 18.1%); Saudi Arabia ($11.6 billion; 10%); Iran ($8.6 billion; 7.4%) and Bahrain ($6.2 billion; 5.3%). These top countries 5 registered 68.2% of intra‐OIC exports of these products in 2018.
It is observed that more than half of intra‐OIC exports of various manufactured products constitute exports from these countries: Suriname (98.4%), Guinea (92.7%), Guyana (90.2%), The Gambia (77%), Uganda (69.8%), Bangladesh (65.9%), Albania (64.6%), Burkina Faso (61%), Chad (57.5 %), Bahrain (55.9%) and Turkey (51%).
Table 6: Top 10 Intra‐OIC Exporters of miscellaneous Manufactured Products in 2018 in US$ Million and in %
COUNTRIES Intra‐OIC exports
in million $ Share in the country's intra‐OIC exports in%
Share in intra‐OIC miscellaneous
manufactured products exports
United Arab Emirates 31,824.51 32.52% 27.38%
Turkey 20,992.67 50.99% 18.06%
Saudi Arabia 11,587.36 20.15% 9.97%
Iran 8,640.90 33.70% 7.43%
Bahrain 6,186.77 55.92% 5.32%
Malaysia 5,379.80 23.85% 4.63%
Indonesia 5,081.15 22.74% 4.37%
Egypt 4,714.05 38.17% 4.06%
Oman 3,531.06 30.44% 3.04%
Pakistan 2,016.39 35.95% 1.73%
OCITOTAL 116,244.64 29.77%
b) Food products:
Intra‐OIC food exports recorded a value of $84 billion in 2017 compared to $64.4 billion in 2018. i.e. a decrease of 23.4% given the fluctuation of food prices on the world scene during this period.
The share of intra‐OIC exports of these products fell by 36.6% from 26% in 2017 to 16.5% in 2018 in favour of the increase in shares in intra‐OIC exports of manufactured products, transport and chemical equipment in some Member States.
The main intra‐OIC food exporting countries are: the United Arab Emirates which registered $ 9.6 billion corresponding to 15% of intra‐OIC food exports, followed by Indonesia ($8 billion; 12.3%), Turkey ($7.1 billion; 11%), Saudi Arabia ($6.6 billion; 10.3%) and Malaysia ($5.7 billion; 9%). These five countries recorded 57.6% of intra‐OIC food exports in 2018.
More than a third of the total intra‐OIC exports of the following countries concerned food products: Sierra Leone (99.2%), Maldives (96.6%),Mauritania (95%), Yemen (82.2%), Comoros(69.4%), Afghanistan (57.4%), Niger (51.7%), Pakistan (47.5%), Palestine (45.4%), Djibouti (44%), Syria (40.3%), Cote d’Ivoire (37.7%,), Indonesia (35.4%), Sudan (35.1%), Senegal(32.4%), Mali(30.8%) and Kazakhstan(30%).
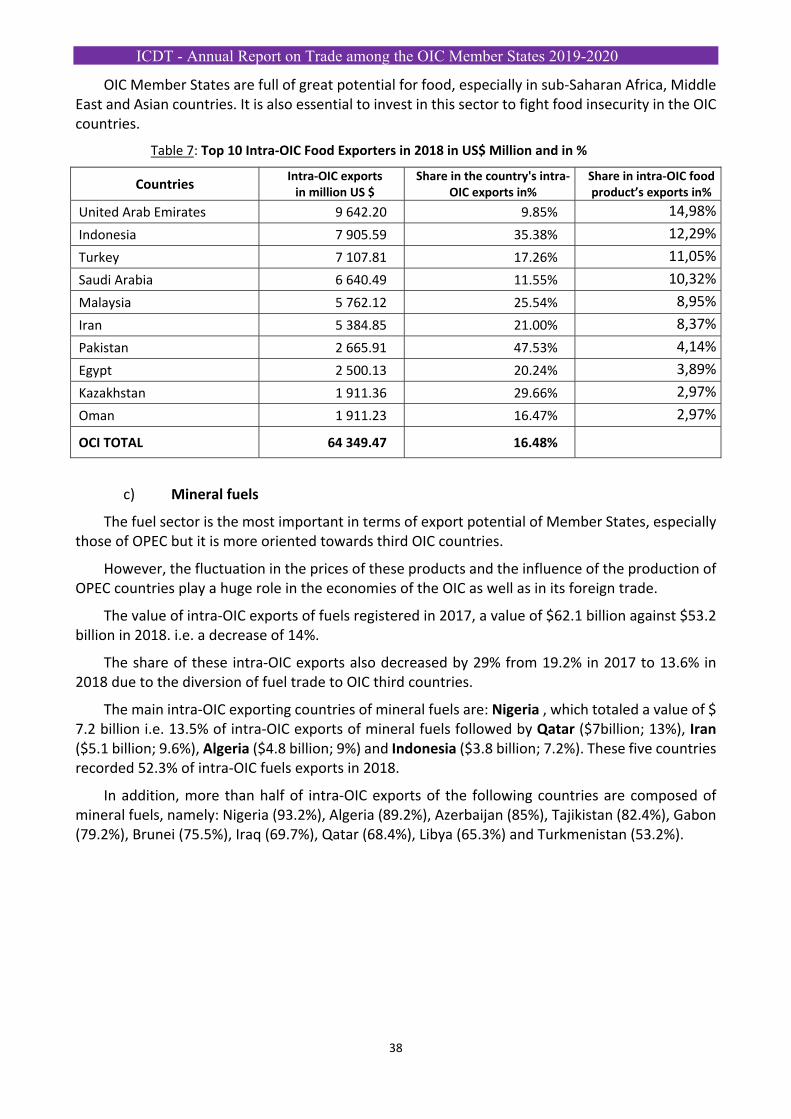
ICDT - Annual Report on Trade among the OIC Member States 2019-2020
38
OIC Member States are full of great potential for food, especially in sub‐Saharan Africa, Middle East and Asian countries. It is also essential to invest in this sector to fight food insecurity in the OIC countries.
Table 7: Top 10 Intra‐OIC Food Exporters in 2018 in US$ Million and in %
Countries Intra‐OIC exportsin million US $
Share in the country's intra‐OIC exports in%
Share in intra‐OIC food product’s exports in%
United Arab Emirates 9 642.20 9.85% 14,98%
Indonesia 7 905.59 35.38% 12,29%
Turkey 7 107.81 17.26% 11,05%
Saudi Arabia 6 640.49 11.55% 10,32%
Malaysia 5 762.12 25.54% 8,95%
Iran 5 384.85 21.00% 8,37%
Pakistan 2 665.91 47.53% 4,14%
Egypt 2 500.13 20.24% 3,89%
Kazakhstan 1 911.36 29.66% 2,97%
Oman 1 911.23 16.47% 2,97%
OCI TOTAL 64 349.47 16.48%
c) Mineral fuels
The fuel sector is the most important in terms of export potential of Member States, especially those of OPEC but it is more oriented towards third OIC countries.
However, the fluctuation in the prices of these products and the influence of the production of OPEC countries play a huge role in the economies of the OIC as well as in its foreign trade.
The value of intra‐OIC exports of fuels registered in 2017, a value of $62.1 billion against $53.2 billion in 2018. i.e. a decrease of 14%.
The share of these intra‐OIC exports also decreased by 29% from 19.2% in 2017 to 13.6% in 2018 due to the diversion of fuel trade to OIC third countries.
The main intra‐OIC exporting countries of mineral fuels are: Nigeria , which totaled a value of $ 7.2 billion i.e. 13.5% of intra‐OIC exports of mineral fuels followed by Qatar ($7billion; 13%), Iran ($5.1 billion; 9.6%), Algeria ($4.8 billion; 9%) and Indonesia ($3.8 billion; 7.2%). These five countries recorded 52.3% of intra‐OIC fuels exports in 2018.
In addition, more than half of intra‐OIC exports of the following countries are composed of mineral fuels, namely: Nigeria (93.2%), Algeria (89.2%), Azerbaijan (85%), Tajikistan (82.4%), Gabon (79.2%), Brunei (75.5%), Iraq (69.7%), Qatar (68.4%), Libya (65.3%) and Turkmenistan (53.2%).
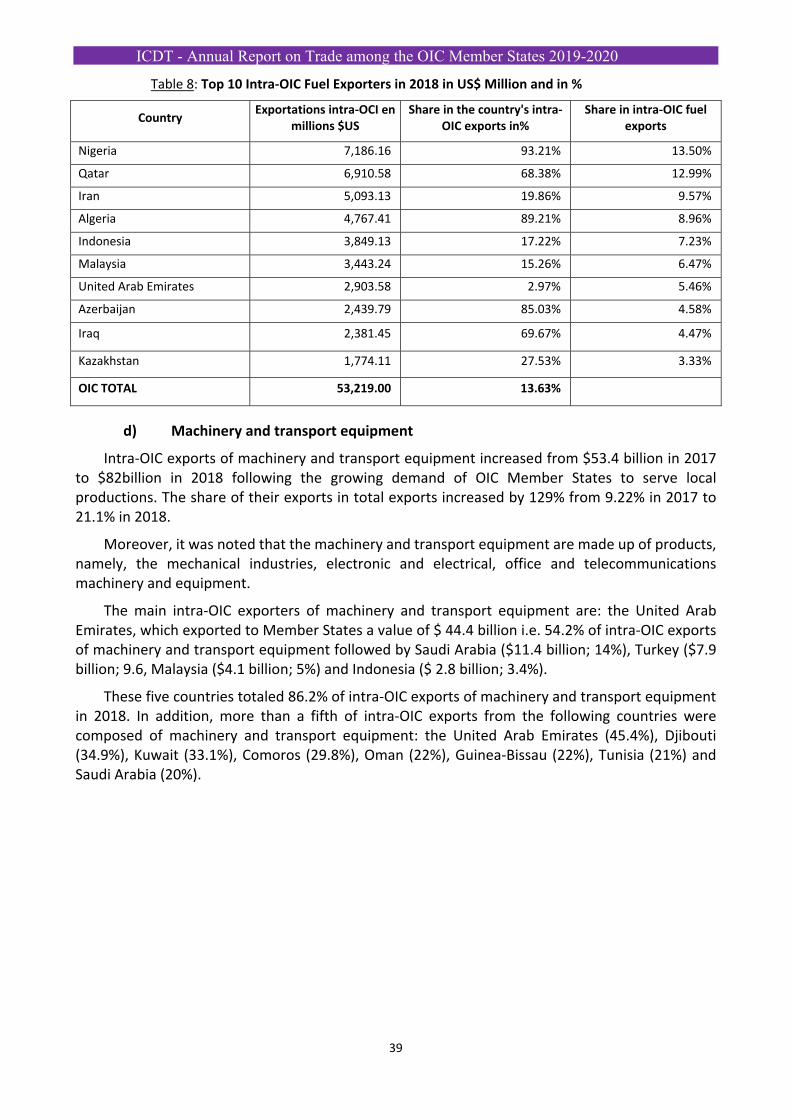
ICDT - Annual Report on Trade among the OIC Member States 2019-2020
39
Table 8: Top 10 Intra‐OIC Fuel Exporters in 2018 in US$ Million and in %
Country Exportations intra‐OCI en
millions $US Share in the country's intra‐
OIC exports in% Share in intra‐OIC fuel
exports
Nigeria 7,186.16 93.21% 13.50%
Qatar 6,910.58 68.38% 12.99%
Iran 5,093.13 19.86% 9.57%
Algeria 4,767.41 89.21% 8.96%
Indonesia 3,849.13 17.22% 7.23%
Malaysia 3,443.24 15.26% 6.47%
United Arab Emirates 2,903.58 2.97% 5.46%
Azerbaijan 2,439.79 85.03% 4.58%
Iraq 2,381.45 69.67% 4.47%
Kazakhstan 1,774.11 27.53% 3.33%
OIC TOTAL 53,219.00 13.63%
d) Machinery and transport equipment
Intra‐OIC exports of machinery and transport equipment increased from $53.4 billion in 2017 to $82billion in 2018 following the growing demand of OIC Member States to serve local productions. The share of their exports in total exports increased by 129% from 9.22% in 2017 to 21.1% in 2018.
Moreover, it was noted that the machinery and transport equipment are made up of products, namely, the mechanical industries, electronic and electrical, office and telecommunications machinery and equipment.
The main intra‐OIC exporters of machinery and transport equipment are: the United Arab Emirates, which exported to Member States a value of $ 44.4 billion i.e. 54.2% of intra‐OIC exports of machinery and transport equipment followed by Saudi Arabia ($11.4 billion; 14%), Turkey ($7.9 billion; 9.6, Malaysia ($4.1 billion; 5%) and Indonesia ($ 2.8 billion; 3.4%).
These five countries totaled 86.2% of intra‐OIC exports of machinery and transport equipment in 2018. In addition, more than a fifth of intra‐OIC exports from the following countries were composed of machinery and transport equipment: the United Arab Emirates (45.4%), Djibouti (34.9%), Kuwait (33.1%), Comoros (29.8%), Oman (22%), Guinea‐Bissau (22%), Tunisia (21%) and Saudi Arabia (20%).
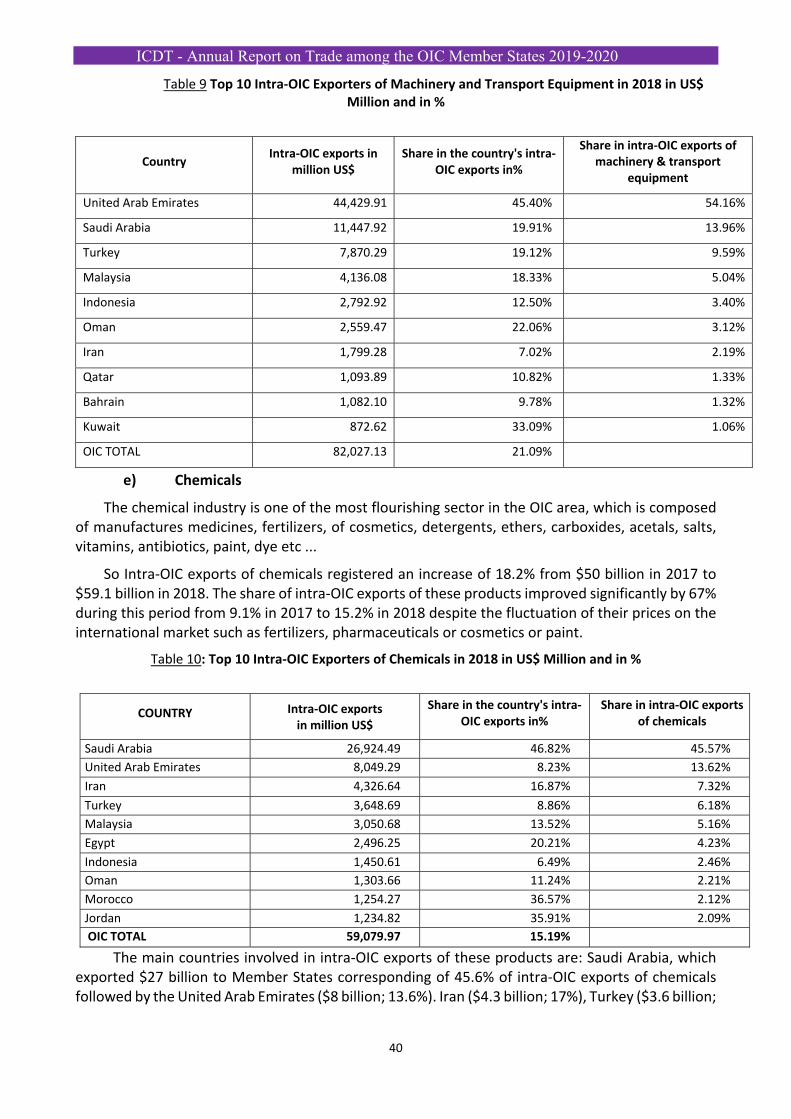
ICDT - Annual Report on Trade among the OIC Member States 2019-2020
40
Table 9 Top 10 Intra‐OIC Exporters of Machinery and Transport Equipment in 2018 in US$ Million and in %
Country Intra‐OIC exports in
million US$ Share in the country's intra‐
OIC exports in%
Share in intra‐OIC exports of machinery & transport
equipment
United Arab Emirates 44,429.91 45.40% 54.16%
Saudi Arabia 11,447.92 19.91% 13.96%
Turkey 7,870.29 19.12% 9.59%
Malaysia 4,136.08 18.33% 5.04%
Indonesia 2,792.92 12.50% 3.40%
Oman 2,559.47 22.06% 3.12%
Iran 1,799.28 7.02% 2.19%
Qatar 1,093.89 10.82% 1.33%
Bahrain 1,082.10 9.78% 1.32%
Kuwait 872.62 33.09% 1.06%
OIC TOTAL 82,027.13 21.09%
e) Chemicals
The chemical industry is one of the most flourishing sector in the OIC area, which is composed of manufactures medicines, fertilizers, of cosmetics, detergents, ethers, carboxides, acetals, salts, vitamins, antibiotics, paint, dye etc ...
So Intra‐OIC exports of chemicals registered an increase of 18.2% from $50 billion in 2017 to $59.1 billion in 2018. The share of intra‐OIC exports of these products improved significantly by 67% during this period from 9.1% in 2017 to 15.2% in 2018 despite the fluctuation of their prices on the international market such as fertilizers, pharmaceuticals or cosmetics or paint.
Table 10: Top 10 Intra‐OIC Exporters of Chemicals in 2018 in US$ Million and in %
COUNTRY Intra‐OIC exports in million US$
Share in the country's intra‐OIC exports in%
Share in intra‐OIC exports of chemicals
Saudi Arabia 26,924.49 46.82% 45.57%
United Arab Emirates 8,049.29 8.23% 13.62%
Iran 4,326.64 16.87% 7.32%
Turkey 3,648.69 8.86% 6.18%
Malaysia 3,050.68 13.52% 5.16%
Egypt 2,496.25 20.21% 4.23%
Indonesia 1,450.61 6.49% 2.46%
Oman 1,303.66 11.24% 2.21%
Morocco 1,254.27 36.57% 2.12%
Jordan 1,234.82 35.91% 2.09%
OIC TOTAL 59,079.97 15.19%
The main countries involved in intra‐OIC exports of these products are: Saudi Arabia, which exported $27 billion to Member States corresponding of 45.6% of intra‐OIC exports of chemicals followed by the United Arab Emirates ($8 billion; 13.6%). Iran ($4.3 billion; 17%), Turkey ($3.6 billion;
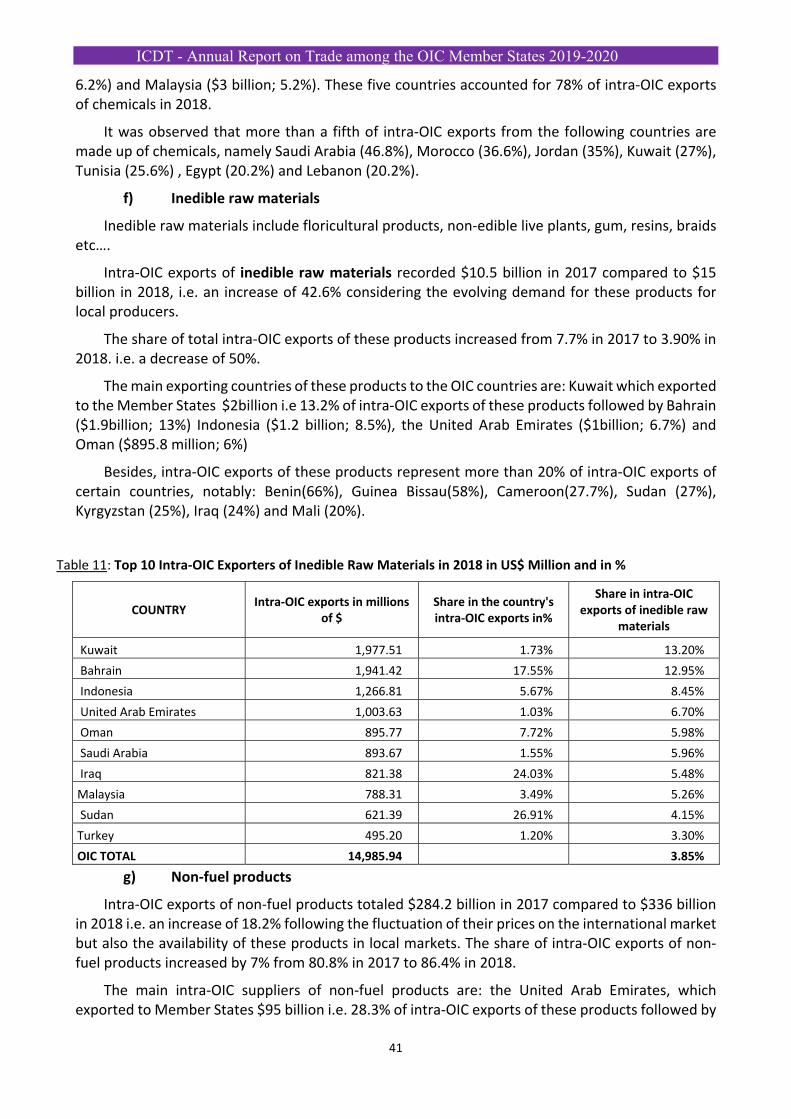
ICDT - Annual Report on Trade among the OIC Member States 2019-2020
41
6.2%) and Malaysia ($3 billion; 5.2%). These five countries accounted for 78% of intra‐OIC exports of chemicals in 2018.
It was observed that more than a fifth of intra‐OIC exports from the following countries are made up of chemicals, namely Saudi Arabia (46.8%), Morocco (36.6%), Jordan (35%), Kuwait (27%), Tunisia (25.6%) , Egypt (20.2%) and Lebanon (20.2%).
f) Inedible raw materials
Inedible raw materials include floricultural products, non‐edible live plants, gum, resins, braids etc….
Intra‐OIC exports of inedible raw materials recorded $10.5 billion in 2017 compared to $15 billion in 2018, i.e. an increase of 42.6% considering the evolving demand for these products for local producers.
The share of total intra‐OIC exports of these products increased from 7.7% in 2017 to 3.90% in 2018. i.e. a decrease of 50%.
The main exporting countries of these products to the OIC countries are: Kuwait which exported to the Member States $2billion i.e 13.2% of intra‐OIC exports of these products followed by Bahrain ($1.9billion; 13%) Indonesia ($1.2 billion; 8.5%), the United Arab Emirates ($1billion; 6.7%) and Oman ($895.8 million; 6%)
Besides, intra‐OIC exports of these products represent more than 20% of intra‐OIC exports of certain countries, notably: Benin(66%), Guinea Bissau(58%), Cameroon(27.7%), Sudan (27%), Kyrgyzstan (25%), Iraq (24%) and Mali (20%).
Table 11: Top 10 Intra‐OIC Exporters of Inedible Raw Materials in 2018 in US$ Million and in %
COUNTRY Intra‐OIC exports in millions
of $ Share in the country's intra‐OIC exports in%
Share in intra‐OIC exports of inedible raw
materials
Kuwait 1,977.51 1.73% 13.20%
Bahrain 1,941.42 17.55% 12.95%
Indonesia 1,266.81 5.67% 8.45%
United Arab Emirates 1,003.63 1.03% 6.70%
Oman 895.77 7.72% 5.98%
Saudi Arabia 893.67 1.55% 5.96%
Iraq 821.38 24.03% 5.48%
Malaysia 788.31 3.49% 5.26%
Sudan 621.39 26.91% 4.15%
Turkey 495.20 1.20% 3.30%
OIC TOTAL 14,985.94 3.85%
g) Non‐fuel products
Intra‐OIC exports of non‐fuel products totaled $284.2 billion in 2017 compared to $336 billion in 2018 i.e. an increase of 18.2% following the fluctuation of their prices on the international market but also the availability of these products in local markets. The share of intra‐OIC exports of non‐fuel products increased by 7% from 80.8% in 2017 to 86.4% in 2018.
The main intra‐OIC suppliers of non‐fuel products are: the United Arab Emirates, which exported to Member States $95 billion i.e. 28.3% of intra‐OIC exports of these products followed by
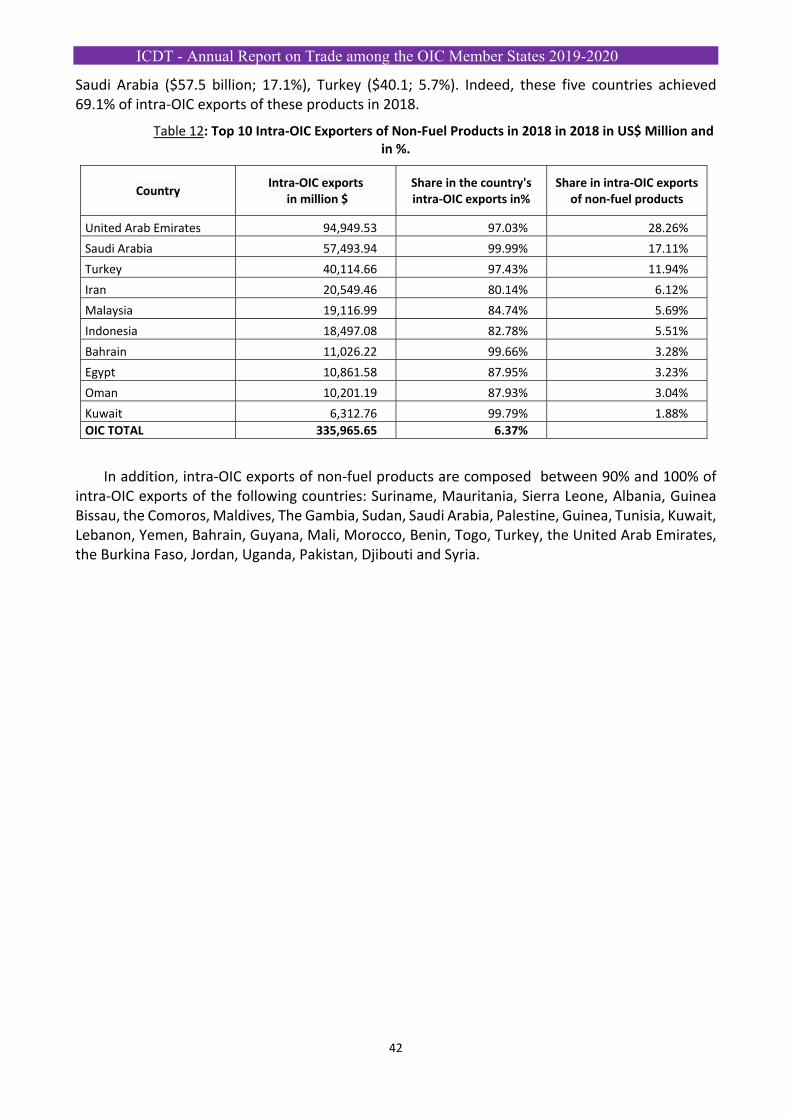
ICDT - Annual Report on Trade among the OIC Member States 2019-2020
42
Saudi Arabia ($57.5 billion; 17.1%), Turkey ($40.1; 5.7%). Indeed, these five countries achieved 69.1% of intra‐OIC exports of these products in 2018.
Table 12: Top 10 Intra‐OIC Exporters of Non‐Fuel Products in 2018 in 2018 in US$ Million and in %.
Country Intra‐OIC exports
in million $ Share in the country's intra‐OIC exports in%
Share in intra‐OIC exports of non‐fuel products
United Arab Emirates 94,949.53 97.03% 28.26%
Saudi Arabia 57,493.94 99.99% 17.11%
Turkey 40,114.66 97.43% 11.94%
Iran 20,549.46 80.14% 6.12%
Malaysia 19,116.99 84.74% 5.69%
Indonesia 18,497.08 82.78% 5.51%
Bahrain 11,026.22 99.66% 3.28%
Egypt 10,861.58 87.95% 3.23%
Oman 10,201.19 87.93% 3.04%
Kuwait 6,312.76 99.79% 1.88%
OIC TOTAL 335,965.65 6.37%
In addition, intra‐OIC exports of non‐fuel products are composed between 90% and 100% of intra‐OIC exports of the following countries: Suriname, Mauritania, Sierra Leone, Albania, Guinea Bissau, the Comoros, Maldives, The Gambia, Sudan, Saudi Arabia, Palestine, Guinea, Tunisia, Kuwait, Lebanon, Yemen, Bahrain, Guyana, Mali, Morocco, Benin, Togo, Turkey, the United Arab Emirates, the Burkina Faso, Jordan, Uganda, Pakistan, Djibouti and Syria.
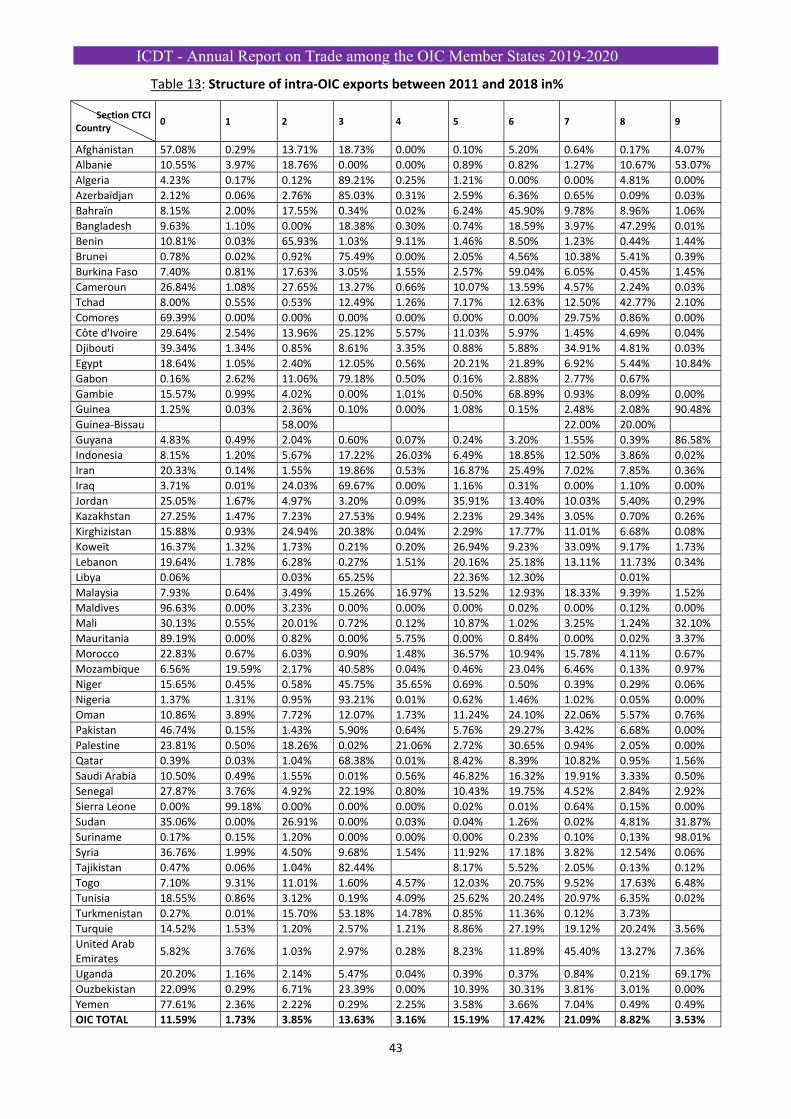
ICDT - Annual Report on Trade among the OIC Member States 2019-2020
43
Table 13: Structure of intra‐OIC exports between 2011 and 2018 in%
Section CTCI Country
0 1 2 3 4 5 6 7 8 9
Afghanistan 57.08% 0.29% 13.71% 18.73% 0.00% 0.10% 5.20% 0.64% 0.17% 4.07%
Albanie 10.55% 3.97% 18.76% 0.00% 0.00% 0.89% 0.82% 1.27% 10.67% 53.07%
Algeria 4.23% 0.17% 0.12% 89.21% 0.25% 1.21% 0.00% 0.00% 4.81% 0.00%
Azerbaïdjan 2.12% 0.06% 2.76% 85.03% 0.31% 2.59% 6.36% 0.65% 0.09% 0.03%
Bahraïn 8.15% 2.00% 17.55% 0.34% 0.02% 6.24% 45.90% 9.78% 8.96% 1.06%
Bangladesh 9.63% 1.10% 0.00% 18.38% 0.30% 0.74% 18.59% 3.97% 47.29% 0.01%
Benin 10.81% 0.03% 65.93% 1.03% 9.11% 1.46% 8.50% 1.23% 0.44% 1.44%
Brunei 0.78% 0.02% 0.92% 75.49% 0.00% 2.05% 4.56% 10.38% 5.41% 0.39%
Burkina Faso 7.40% 0.81% 17.63% 3.05% 1.55% 2.57% 59.04% 6.05% 0.45% 1.45%
Cameroun 26.84% 1.08% 27.65% 13.27% 0.66% 10.07% 13.59% 4.57% 2.24% 0.03%
Tchad 8.00% 0.55% 0.53% 12.49% 1.26% 7.17% 12.63% 12.50% 42.77% 2.10%
Comores 69.39% 0.00% 0.00% 0.00% 0.00% 0.00% 0.00% 29.75% 0.86% 0.00%
Côte d'Ivoire 29.64% 2.54% 13.96% 25.12% 5.57% 11.03% 5.97% 1.45% 4.69% 0.04%
Djibouti 39.34% 1.34% 0.85% 8.61% 3.35% 0.88% 5.88% 34.91% 4.81% 0.03%
Egypt 18.64% 1.05% 2.40% 12.05% 0.56% 20.21% 21.89% 6.92% 5.44% 10.84%
Gabon 0.16% 2.62% 11.06% 79.18% 0.50% 0.16% 2.88% 2.77% 0.67%
Gambie 15.57% 0.99% 4.02% 0.00% 1.01% 0.50% 68.89% 0.93% 8.09% 0.00%
Guinea 1.25% 0.03% 2.36% 0.10% 0.00% 1.08% 0.15% 2.48% 2.08% 90.48%
Guinea‐Bissau 58.00% 22.00% 20.00%
Guyana 4.83% 0.49% 2.04% 0.60% 0.07% 0.24% 3.20% 1.55% 0.39% 86.58%
Indonesia 8.15% 1.20% 5.67% 17.22% 26.03% 6.49% 18.85% 12.50% 3.86% 0.02%
Iran 20.33% 0.14% 1.55% 19.86% 0.53% 16.87% 25.49% 7.02% 7.85% 0.36%
Iraq 3.71% 0.01% 24.03% 69.67% 0.00% 1.16% 0.31% 0.00% 1.10% 0.00%
Jordan 25.05% 1.67% 4.97% 3.20% 0.09% 35.91% 13.40% 10.03% 5.40% 0.29%
Kazakhstan 27.25% 1.47% 7.23% 27.53% 0.94% 2.23% 29.34% 3.05% 0.70% 0.26%
Kirghizistan 15.88% 0.93% 24.94% 20.38% 0.04% 2.29% 17.77% 11.01% 6.68% 0.08%
Koweït 16.37% 1.32% 1.73% 0.21% 0.20% 26.94% 9.23% 33.09% 9.17% 1.73%
Lebanon 19.64% 1.78% 6.28% 0.27% 1.51% 20.16% 25.18% 13.11% 11.73% 0.34%
Libya 0.06% 0.03% 65.25% 22.36% 12.30% 0.01%
Malaysia 7.93% 0.64% 3.49% 15.26% 16.97% 13.52% 12.93% 18.33% 9.39% 1.52%
Maldives 96.63% 0.00% 3.23% 0.00% 0.00% 0.00% 0.02% 0.00% 0.12% 0.00%
Mali 30.13% 0.55% 20.01% 0.72% 0.12% 10.87% 1.02% 3.25% 1.24% 32.10%
Mauritania 89.19% 0.00% 0.82% 0.00% 5.75% 0.00% 0.84% 0.00% 0.02% 3.37%
Morocco 22.83% 0.67% 6.03% 0.90% 1.48% 36.57% 10.94% 15.78% 4.11% 0.67%
Mozambique 6.56% 19.59% 2.17% 40.58% 0.04% 0.46% 23.04% 6.46% 0.13% 0.97%
Niger 15.65% 0.45% 0.58% 45.75% 35.65% 0.69% 0.50% 0.39% 0.29% 0.06%
Nigeria 1.37% 1.31% 0.95% 93.21% 0.01% 0.62% 1.46% 1.02% 0.05% 0.00%
Oman 10.86% 3.89% 7.72% 12.07% 1.73% 11.24% 24.10% 22.06% 5.57% 0.76%
Pakistan 46.74% 0.15% 1.43% 5.90% 0.64% 5.76% 29.27% 3.42% 6.68% 0.00%
Palestine 23.81% 0.50% 18.26% 0.02% 21.06% 2.72% 30.65% 0.94% 2.05% 0.00%
Qatar 0.39% 0.03% 1.04% 68.38% 0.01% 8.42% 8.39% 10.82% 0.95% 1.56%
Saudi Arabia 10.50% 0.49% 1.55% 0.01% 0.56% 46.82% 16.32% 19.91% 3.33% 0.50%
Senegal 27.87% 3.76% 4.92% 22.19% 0.80% 10.43% 19.75% 4.52% 2.84% 2.92%
Sierra Leone 0.00% 99.18% 0.00% 0.00% 0.00% 0.02% 0.01% 0.64% 0.15% 0.00%
Sudan 35.06% 0.00% 26.91% 0.00% 0.03% 0.04% 1.26% 0.02% 4.81% 31.87%
Suriname 0.17% 0.15% 1.20% 0.00% 0.00% 0.00% 0.23% 0.10% 0.13% 98.01%
Syria 36.76% 1.99% 4.50% 9.68% 1.54% 11.92% 17.18% 3.82% 12.54% 0.06%
Tajikistan 0.47% 0.06% 1.04% 82.44% 8.17% 5.52% 2.05% 0.13% 0.12%
Togo 7.10% 9.31% 11.01% 1.60% 4.57% 12.03% 20.75% 9.52% 17.63% 6.48%
Tunisia 18.55% 0.86% 3.12% 0.19% 4.09% 25.62% 20.24% 20.97% 6.35% 0.02%
Turkmenistan 0.27% 0.01% 15.70% 53.18% 14.78% 0.85% 11.36% 0.12% 3.73%
Turquie 14.52% 1.53% 1.20% 2.57% 1.21% 8.86% 27.19% 19.12% 20.24% 3.56%
United Arab Emirates
5.82% 3.76% 1.03% 2.97% 0.28% 8.23% 11.89% 45.40% 13.27% 7.36%
Uganda 20.20% 1.16% 2.14% 5.47% 0.04% 0.39% 0.37% 0.84% 0.21% 69.17%
Ouzbekistan 22.09% 0.29% 6.71% 23.39% 0.00% 10.39% 30.31% 3.81% 3.01% 0.00%
Yemen 77.61% 2.36% 2.22% 0.29% 2.25% 3.58% 3.66% 7.04% 0.49% 0.49%
OIC TOTAL 11.59% 1.73% 3.85% 13.63% 3.16% 15.19% 17.42% 21.09% 8.82% 3.53%
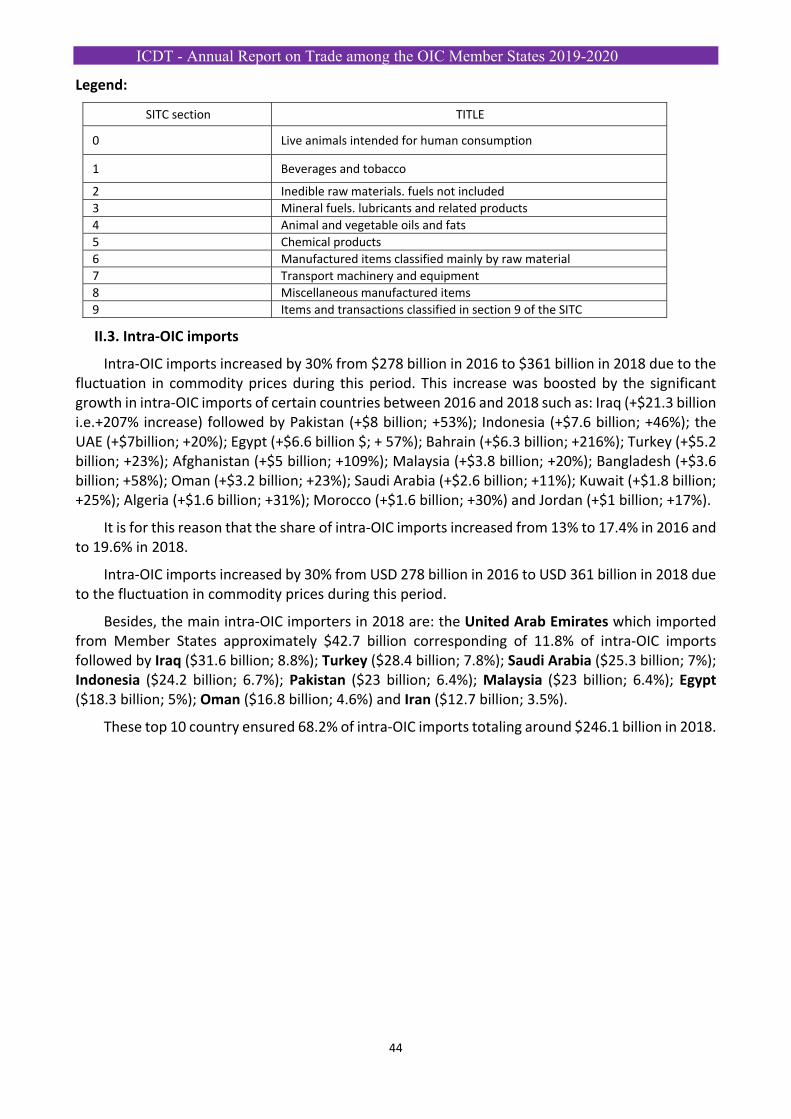
ICDT - Annual Report on Trade among the OIC Member States 2019-2020
44
Legend:
SITC section TITLE
0 Live animals intended for human consumption
1 Beverages and tobacco
2 Inedible raw materials. fuels not included
3 Mineral fuels. lubricants and related products
4 Animal and vegetable oils and fats
5 Chemical products
6 Manufactured items classified mainly by raw material
7 Transport machinery and equipment
8 Miscellaneous manufactured items
9 Items and transactions classified in section 9 of the SITC
II.3. Intra‐OIC imports
Intra‐OIC imports increased by 30% from $278 billion in 2016 to $361 billion in 2018 due to the fluctuation in commodity prices during this period. This increase was boosted by the significant growth in intra‐OIC imports of certain countries between 2016 and 2018 such as: Iraq (+$21.3 billion i.e.+207% increase) followed by Pakistan (+$8 billion; +53%); Indonesia (+$7.6 billion; +46%); the UAE (+$7billion; +20%); Egypt (+$6.6 billion $; + 57%); Bahrain (+$6.3 billion; +216%); Turkey (+$5.2 billion; +23%); Afghanistan (+$5 billion; +109%); Malaysia (+$3.8 billion; +20%); Bangladesh (+$3.6 billion; +58%); Oman (+$3.2 billion; +23%); Saudi Arabia (+$2.6 billion; +11%); Kuwait (+$1.8 billion; +25%); Algeria (+$1.6 billion; +31%); Morocco (+$1.6 billion; +30%) and Jordan (+$1 billion; +17%).
It is for this reason that the share of intra‐OIC imports increased from 13% to 17.4% in 2016 and to 19.6% in 2018.
Intra‐OIC imports increased by 30% from USD 278 billion in 2016 to USD 361 billion in 2018 due to the fluctuation in commodity prices during this period.
Besides, the main intra‐OIC importers in 2018 are: the United Arab Emirates which imported from Member States approximately $42.7 billion corresponding of 11.8% of intra‐OIC imports followed by Iraq ($31.6 billion; 8.8%); Turkey ($28.4 billion; 7.8%); Saudi Arabia ($25.3 billion; 7%); Indonesia ($24.2 billion; 6.7%); Pakistan ($23 billion; 6.4%); Malaysia ($23 billion; 6.4%); Egypt ($18.3 billion; 5%); Oman ($16.8 billion; 4.6%) and Iran ($12.7 billion; 3.5%).
These top 10 country ensured 68.2% of intra‐OIC imports totaling around $246.1 billion in 2018.
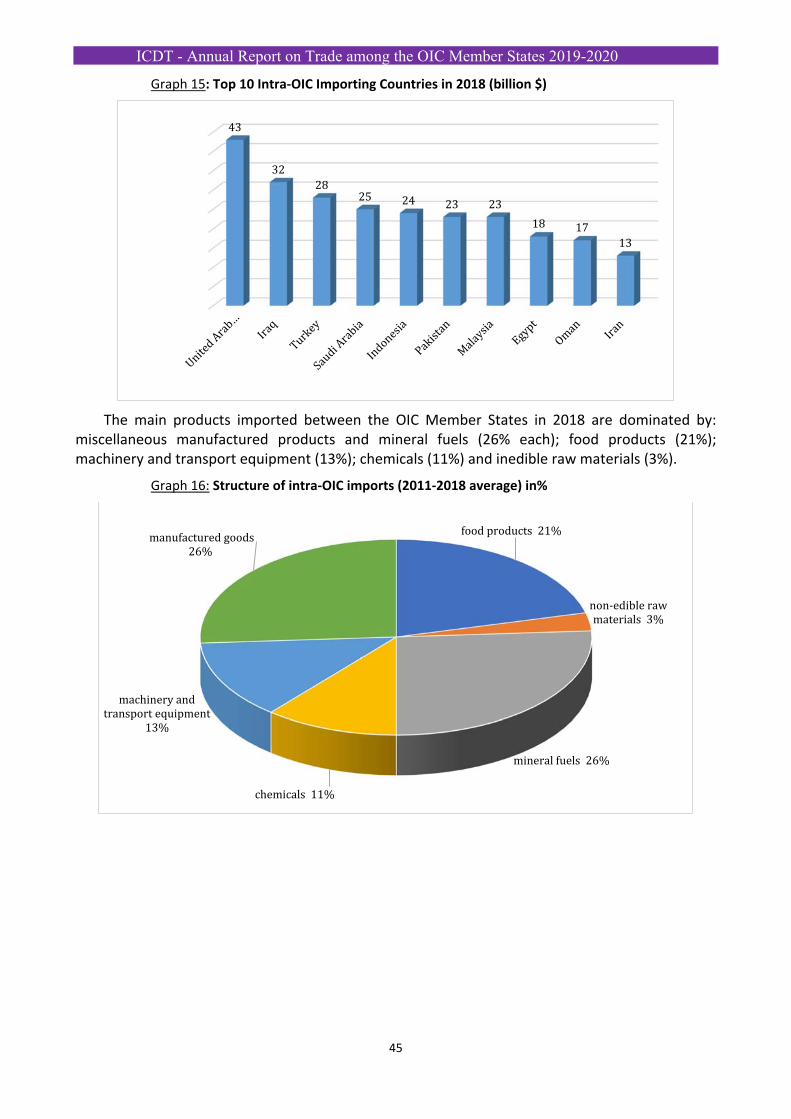
ICDT - Annual Report on Trade among the OIC Member States 2019-2020
45
Graph 15: Top 10 Intra‐OIC Importing Countries in 2018 (billion $)
The main products imported between the OIC Member States in 2018 are dominated by: miscellaneous manufactured products and mineral fuels (26% each); food products (21%); machinery and transport equipment (13%); chemicals (11%) and inedible raw materials (3%).
Graph 16: Structure of intra‐OIC imports (2011‐2018 average) in%
43
3228
25 24 23 23
18 1713
food products 21%
non-edible raw materials 3%
mineral fuels 26%
chemicals 11%
machinery and transport equipment
13%
manufactured goods26%
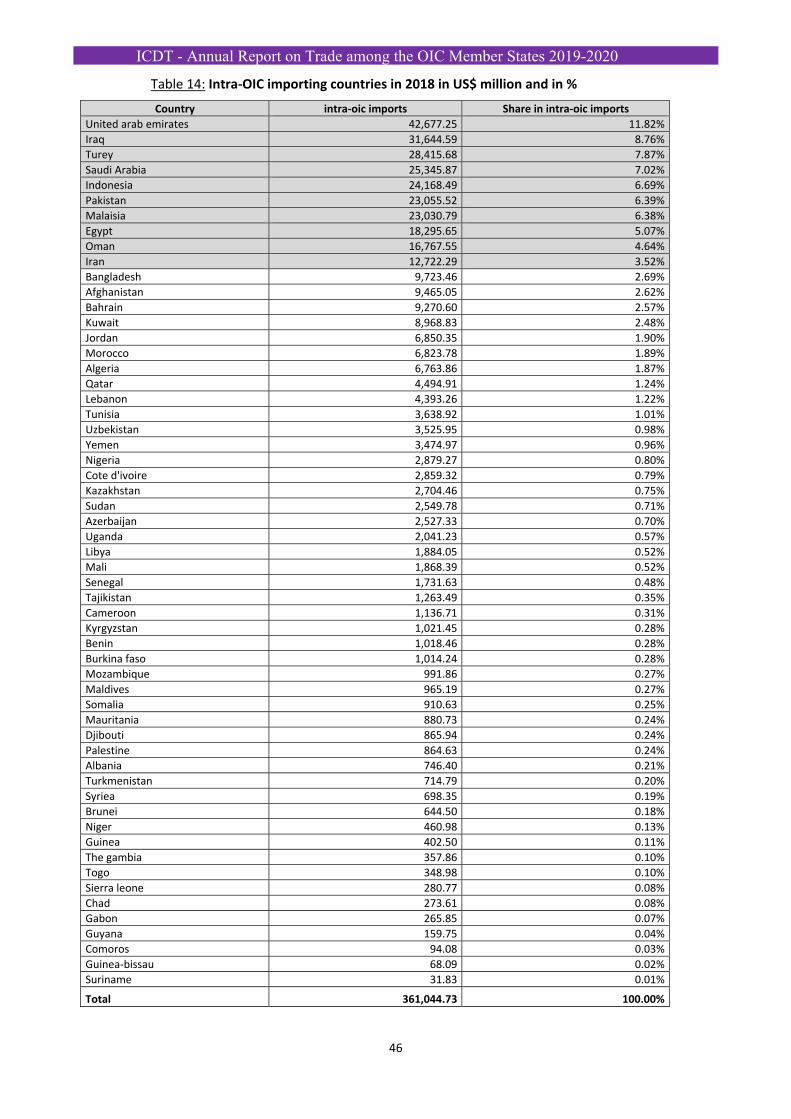
ICDT - Annual Report on Trade among the OIC Member States 2019-2020
46
Table 14: Intra‐OIC importing countries in 2018 in US$ million and in %
Country intra‐oic imports Share in intra‐oic imports
United arab emirates 42,677.25 11.82%
Iraq 31,644.59 8.76%
Turey 28,415.68 7.87%
Saudi Arabia 25,345.87 7.02%
Indonesia 24,168.49 6.69%
Pakistan 23,055.52 6.39%
Malaisia 23,030.79 6.38%
Egypt 18,295.65 5.07%
Oman 16,767.55 4.64%
Iran 12,722.29 3.52%
Bangladesh 9,723.46 2.69%
Afghanistan 9,465.05 2.62%
Bahrain 9,270.60 2.57%
Kuwait 8,968.83 2.48%
Jordan 6,850.35 1.90%
Morocco 6,823.78 1.89%
Algeria 6,763.86 1.87%
Qatar 4,494.91 1.24%
Lebanon 4,393.26 1.22%
Tunisia 3,638.92 1.01%
Uzbekistan 3,525.95 0.98%
Yemen 3,474.97 0.96%
Nigeria 2,879.27 0.80%
Cote d'ivoire 2,859.32 0.79%
Kazakhstan 2,704.46 0.75%
Sudan 2,549.78 0.71%
Azerbaijan 2,527.33 0.70%
Uganda 2,041.23 0.57%
Libya 1,884.05 0.52%
Mali 1,868.39 0.52%
Senegal 1,731.63 0.48%
Tajikistan 1,263.49 0.35%
Cameroon 1,136.71 0.31%
Kyrgyzstan 1,021.45 0.28%
Benin 1,018.46 0.28%
Burkina faso 1,014.24 0.28%
Mozambique 991.86 0.27%
Maldives 965.19 0.27%
Somalia 910.63 0.25%
Mauritania 880.73 0.24%
Djibouti 865.94 0.24%
Palestine 864.63 0.24%
Albania 746.40 0.21%
Turkmenistan 714.79 0.20%
Syriea 698.35 0.19%
Brunei 644.50 0.18%
Niger 460.98 0.13%
Guinea 402.50 0.11%
The gambia 357.86 0.10%
Togo 348.98 0.10%
Sierra leone 280.77 0.08%
Chad 273.61 0.08%
Gabon 265.85 0.07%
Guyana 159.75 0.04%
Comoros 94.08 0.03%
Guinea‐bissau 68.09 0.02%
Suriname 31.83 0.01%
Total 361,044.73 100.00%
ICDT - Annual Report on Trade among the OIC Member States 2019-2020
47
The main products imported according to the HS4 Harmonized System category by these main countries in 2018 are:
United Arab Emirates: gold and platinum gold (26%); petroleum oil (25%); jewellery (6%); iron or steel bars (4%); monitors and projectors; electrical insulated wires and cables; copper (3%); ethylene polymers (2%);
Iraq: telephone sets (7%); jewellery (4%); petroleum oil (4%); passenger cars (3%); cigars (3%); petroleum gas (2%); drugs (2%); rice (2%); information processing machines; electrical insulated wires and cables. bakery and pastry products (3%);
Turkey: gold and platinum gold (17%); polymers of propylene and ethylene (9%); aluminium (5%); petroleum gas (4%); copper (4%); petroleum oils (3%); mineral or chemical fertilizers (2%); acyclic alcohols (2%); zinc; Palm oil; cotton and cotton yarn (4%);
Saudi Arabia: gold and platinum gold (10%); petroleum oil (7%); boats (5%); copper wire (3%); ferrous products (4%); passenger cars (2%); bakery products; Palm oil, milk and jewellery (4%); Indonesia: petroleum oils (45%); petroleum gas (9%); iron or steel bars (4%); polymers of ethylene and propylene (4%); acyclic alcohols (3%); acyclic hydrocarbons (2%); cocoa beans; aluminium and phosphate (3%);
Pakistan: petroleum oils (48%); petroleum gas (13%); palm oil (8%); polymers of ethylene and propylene (4%); hard coal and briquettes (2%); acyclic alcohols (2%); scrap (2%);
Malaysia : petroleum oils (31%); hard coal and briquettes (9%); ethylen, epolymers; (7%); copper and aluminum (4%); gold and platinum gold (3%) ; monocarboxylic fatty acids (2%); petroleum gas (2%); palm oil (2%); cocoa beans (2%);
Egypt: petroleum oils (39%); petroleum gas (10%); polymers of ethylene and propylene (7%); palm oil (4%); iron ores; crustaceans (3%); passenger cars (2%); gold and platinum gold (2%);
Oman: passenger cars (8%); petroleum oils (6%); telephone sets (3%):gold and platinum gold (3%); jewelry items; carboxylic acids and fittings (3%); iron ores (2%); air vehicles (2%). copper wire (2%);
Iran: telephone sets (3%); rice (3%); steam turbines (3%); information processing machines (2%); electrical appliances (2%); passenger cars (2%); bananas (2%); butters (2%); drugs (2%); gas turbines (2%); vegetables (2%).
II. 4. Structure of intra‐OIC imports by product and by country
Intra‐OIC imports are slightly dominated by primary products with 50.3% corresponding to a value of $181.4 billion in 2018 ie. an increase of 18% in value compared to 2017.Besides, Intra‐OIC imports of manufactured products totalled $179.6 billion and shared of 49.7% of intra‐OIC imports i.e. an increase in value of 7% compared to 2017.
On the other hand, the share of manufactured products decreased by 4.7% going from 52.2% in 2017 to otherwise. There is an increase in intra‐OIC imports of primary products to serve local industries and strengthen exports of manufactured products as indicated in the previous section between 2017 and 2018.
The main products imported between the OIC countries are concentrated in the following sectors:
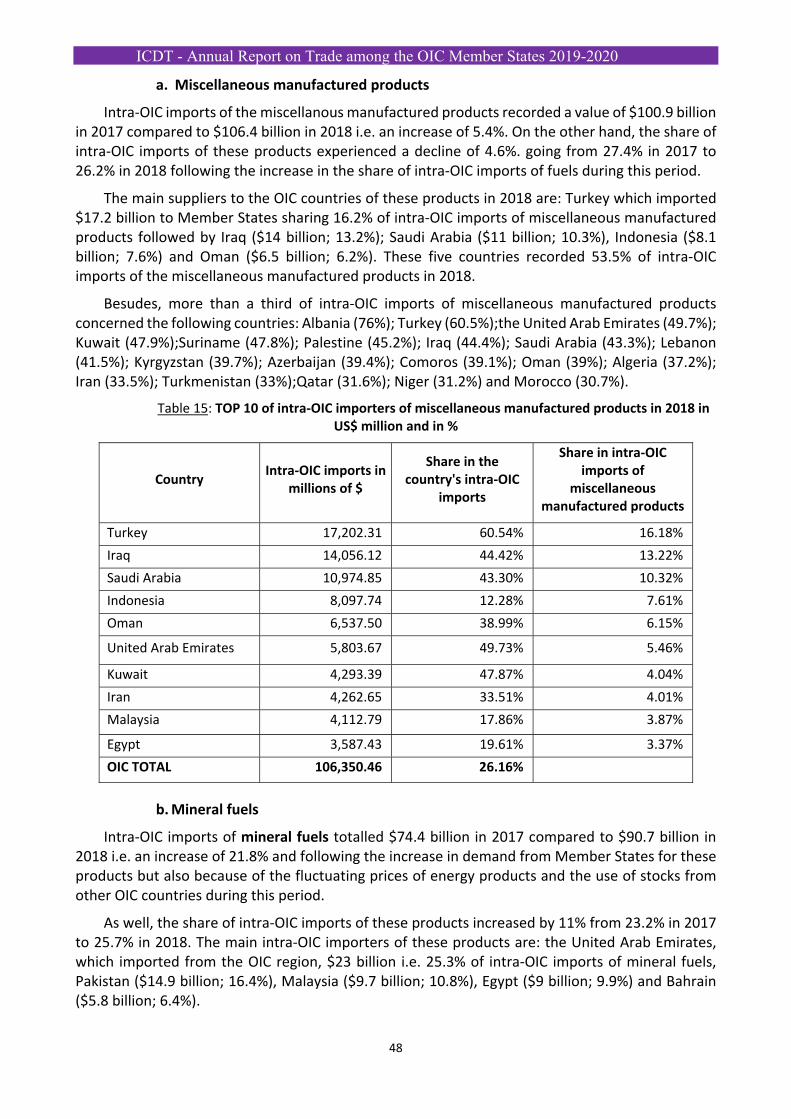
ICDT - Annual Report on Trade among the OIC Member States 2019-2020
48
a. Miscellaneous manufactured products
Intra‐OIC imports of the miscellanous manufactured products recorded a value of $100.9 billion in 2017 compared to $106.4 billion in 2018 i.e. an increase of 5.4%. On the other hand, the share of intra‐OIC imports of these products experienced a decline of 4.6%. going from 27.4% in 2017 to 26.2% in 2018 following the increase in the share of intra‐OIC imports of fuels during this period.
The main suppliers to the OIC countries of these products in 2018 are: Turkey which imported $17.2 billion to Member States sharing 16.2% of intra‐OIC imports of miscellaneous manufactured products followed by Iraq ($14 billion; 13.2%); Saudi Arabia ($11 billion; 10.3%), Indonesia ($8.1 billion; 7.6%) and Oman ($6.5 billion; 6.2%). These five countries recorded 53.5% of intra‐OIC imports of the miscellaneous manufactured products in 2018.
Besudes, more than a third of intra‐OIC imports of miscellaneous manufactured products concerned the following countries: Albania (76%); Turkey (60.5%);the United Arab Emirates (49.7%); Kuwait (47.9%);Suriname (47.8%); Palestine (45.2%); Iraq (44.4%); Saudi Arabia (43.3%); Lebanon (41.5%); Kyrgyzstan (39.7%); Azerbaijan (39.4%); Comoros (39.1%); Oman (39%); Algeria (37.2%); Iran (33.5%); Turkmenistan (33%);Qatar (31.6%); Niger (31.2%) and Morocco (30.7%).
Table 15: TOP 10 of intra‐OIC importers of miscellaneous manufactured products in 2018 in US$ million and in %
Country Intra‐OIC imports in
millions of $
Share in the country's intra‐OIC
imports
Share in intra‐OIC imports of
miscellaneous manufactured products
Turkey 17,202.31 60.54% 16.18%
Iraq 14,056.12 44.42% 13.22%
Saudi Arabia 10,974.85 43.30% 10.32%
Indonesia 8,097.74 12.28% 7.61%
Oman 6,537.50 38.99% 6.15%
United Arab Emirates 5,803.67 49.73% 5.46%
Kuwait 4,293.39 47.87% 4.04%
Iran 4,262.65 33.51% 4.01%
Malaysia 4,112.79 17.86% 3.87%
Egypt 3,587.43 19.61% 3.37%
OIC TOTAL 106,350.46 26.16%
b. Mineral fuels
Intra‐OIC imports of mineral fuels totalled $74.4 billion in 2017 compared to $90.7 billion in 2018 i.e. an increase of 21.8% and following the increase in demand from Member States for these products but also because of the fluctuating prices of energy products and the use of stocks from other OIC countries during this period.
As well, the share of intra‐OIC imports of these products increased by 11% from 23.2% in 2017 to 25.7% in 2018. The main intra‐OIC importers of these products are: the United Arab Emirates, which imported from the OIC region, $23 billion i.e. 25.3% of intra‐OIC imports of mineral fuels, Pakistan ($14.9 billion; 16.4%), Malaysia ($9.7 billion; 10.8%), Egypt ($9 billion; 9.9%) and Bahrain ($5.8 billion; 6.4%).
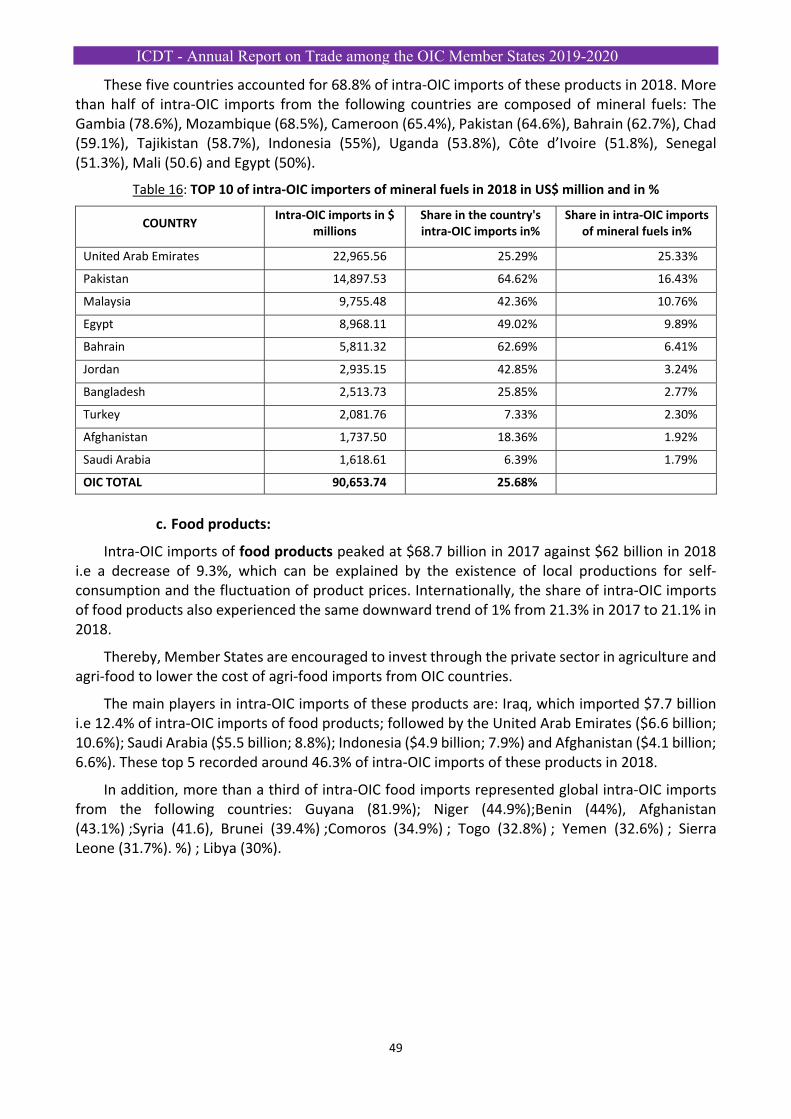
ICDT - Annual Report on Trade among the OIC Member States 2019-2020
49
These five countries accounted for 68.8% of intra‐OIC imports of these products in 2018. More than half of intra‐OIC imports from the following countries are composed of mineral fuels: The Gambia (78.6%), Mozambique (68.5%), Cameroon (65.4%), Pakistan (64.6%), Bahrain (62.7%), Chad (59.1%), Tajikistan (58.7%), Indonesia (55%), Uganda (53.8%), Côte d’Ivoire (51.8%), Senegal (51.3%), Mali (50.6) and Egypt (50%).
Table 16: TOP 10 of intra‐OIC importers of mineral fuels in 2018 in US$ million and in %
COUNTRY Intra‐OIC imports in $
millions Share in the country's intra‐OIC imports in%
Share in intra‐OIC imports of mineral fuels in%
United Arab Emirates 22,965.56 25.29% 25.33%
Pakistan 14,897.53 64.62% 16.43%
Malaysia 9,755.48 42.36% 10.76%
Egypt 8,968.11 49.02% 9.89%
Bahrain 5,811.32 62.69% 6.41%
Jordan 2,935.15 42.85% 3.24%
Bangladesh 2,513.73 25.85% 2.77%
Turkey 2,081.76 7.33% 2.30%
Afghanistan 1,737.50 18.36% 1.92%
Saudi Arabia 1,618.61 6.39% 1.79%
OIC TOTAL 90,653.74 25.68%
c. Food products:
Intra‐OIC imports of food products peaked at $68.7 billion in 2017 against $62 billion in 2018 i.e a decrease of 9.3%, which can be explained by the existence of local productions for self‐consumption and the fluctuation of product prices. Internationally, the share of intra‐OIC imports of food products also experienced the same downward trend of 1% from 21.3% in 2017 to 21.1% in 2018.
Thereby, Member States are encouraged to invest through the private sector in agriculture and agri‐food to lower the cost of agri‐food imports from OIC countries.
The main players in intra‐OIC imports of these products are: Iraq, which imported $7.7 billion i.e 12.4% of intra‐OIC imports of food products; followed by the United Arab Emirates ($6.6 billion; 10.6%); Saudi Arabia ($5.5 billion; 8.8%); Indonesia ($4.9 billion; 7.9%) and Afghanistan ($4.1 billion; 6.6%). These top 5 recorded around 46.3% of intra‐OIC imports of these products in 2018.
In addition, more than a third of intra‐OIC food imports represented global intra‐OIC imports from the following countries: Guyana (81.9%); Niger (44.9%);Benin (44%), Afghanistan (43.1%) ;Syria (41.6), Brunei (39.4%) ;Comoros (34.9%) ; Togo (32.8%) ; Yemen (32.6%) ; Sierra Leone (31.7%). %) ; Libya (30%).
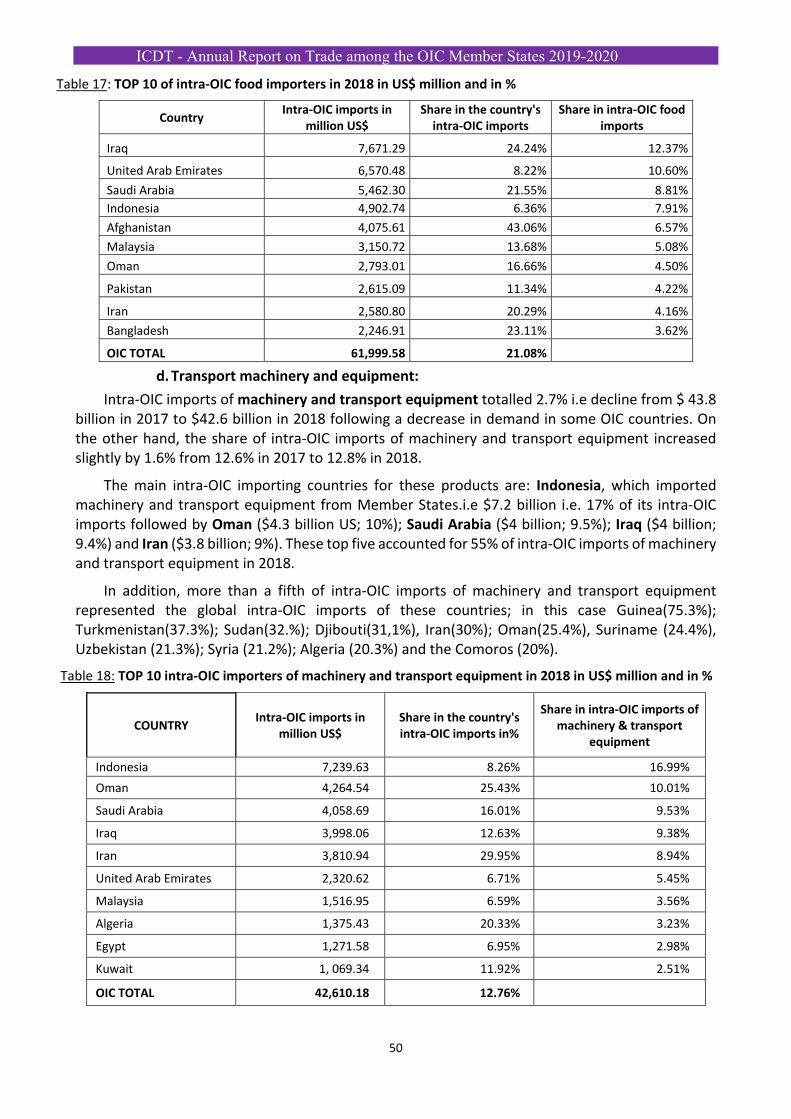
ICDT - Annual Report on Trade among the OIC Member States 2019-2020
50
Table 17: TOP 10 of intra‐OIC food importers in 2018 in US$ million and in %
Country Intra‐OIC imports in
million US$ Share in the country's intra‐OIC imports
Share in intra‐OIC food imports
Iraq 7,671.29 24.24% 12.37%
United Arab Emirates 6,570.48 8.22% 10.60%
Saudi Arabia 5,462.30 21.55% 8.81%
Indonesia 4,902.74 6.36% 7.91%
Afghanistan 4,075.61 43.06% 6.57%
Malaysia 3,150.72 13.68% 5.08%
Oman 2,793.01 16.66% 4.50%
Pakistan 2,615.09 11.34% 4.22%
Iran 2,580.80 20.29% 4.16%
Bangladesh 2,246.91 23.11% 3.62%
OIC TOTAL 61,999.58 21.08%
d. Transport machinery and equipment:
Intra‐OIC imports of machinery and transport equipment totalled 2.7% i.e decline from $ 43.8 billion in 2017 to $42.6 billion in 2018 following a decrease in demand in some OIC countries. On the other hand, the share of intra‐OIC imports of machinery and transport equipment increased slightly by 1.6% from 12.6% in 2017 to 12.8% in 2018.
The main intra‐OIC importing countries for these products are: Indonesia, which imported machinery and transport equipment from Member States.i.e $7.2 billion i.e. 17% of its intra‐OIC imports followed by Oman ($4.3 billion US; 10%); Saudi Arabia ($4 billion; 9.5%); Iraq ($4 billion; 9.4%) and Iran ($3.8 billion; 9%). These top five accounted for 55% of intra‐OIC imports of machinery and transport equipment in 2018.
In addition, more than a fifth of intra‐OIC imports of machinery and transport equipment represented the global intra‐OIC imports of these countries; in this case Guinea(75.3%); Turkmenistan(37.3%); Sudan(32.%); Djibouti(31,1%), Iran(30%); Oman(25.4%), Suriname (24.4%), Uzbekistan (21.3%); Syria (21.2%); Algeria (20.3%) and the Comoros (20%).
Table 18: TOP 10 intra‐OIC importers of machinery and transport equipment in 2018 in US$ million and in %
COUNTRY Intra‐OIC imports in
million US$ Share in the country's intra‐OIC imports in%
Share in intra‐OIC imports of machinery & transport
equipment
Indonesia 7,239.63 8.26% 16.99%
Oman 4,264.54 25.43% 10.01%
Saudi Arabia 4,058.69 16.01% 9.53%
Iraq 3,998.06 12.63% 9.38%
Iran 3,810.94 29.95% 8.94%
United Arab Emirates 2,320.62 6.71% 5.45%
Malaysia 1,516.95 6.59% 3.56%
Algeria 1,375.43 20.33% 3.23%
Egypt 1,271.58 6.95% 2.98%
Kuwait 1, 069.34 11.92% 2.51%
OIC TOTAL 42,610.18 12.76%
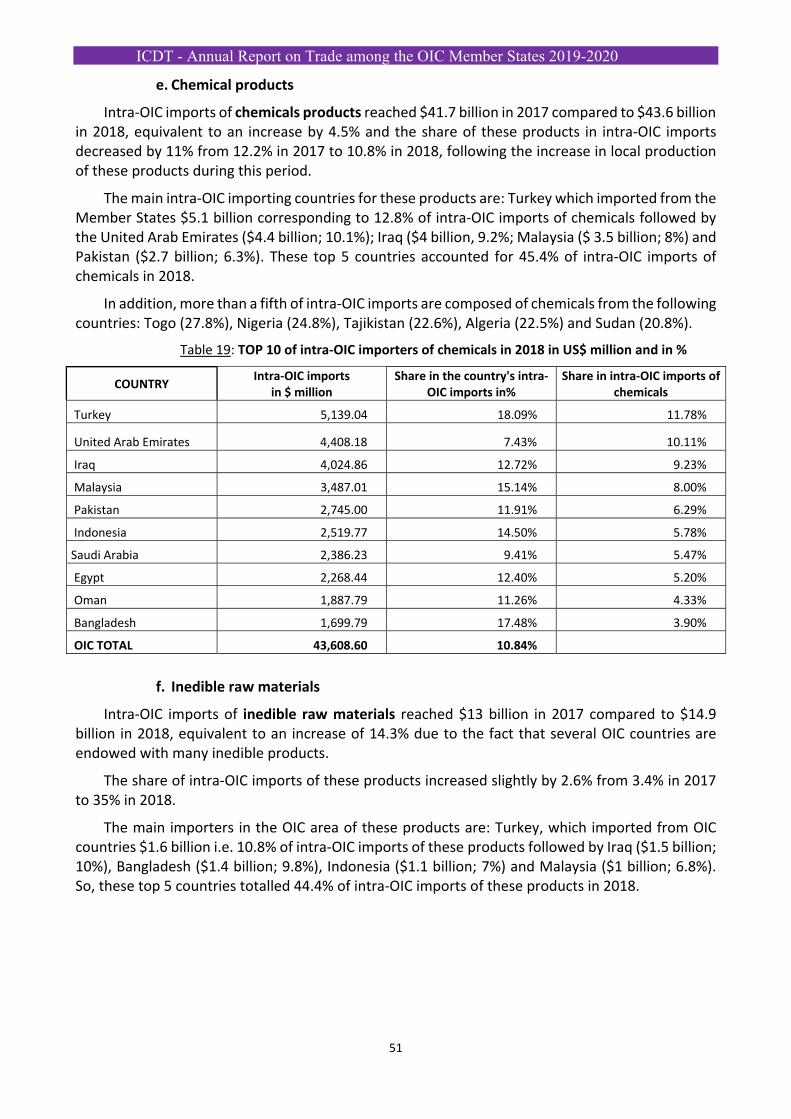
ICDT - Annual Report on Trade among the OIC Member States 2019-2020
51
e. Chemical products
Intra‐OIC imports of chemicals products reached $41.7 billion in 2017 compared to $43.6 billion in 2018, equivalent to an increase by 4.5% and the share of these products in intra‐OIC imports decreased by 11% from 12.2% in 2017 to 10.8% in 2018, following the increase in local production of these products during this period.
The main intra‐OIC importing countries for these products are: Turkey which imported from the Member States $5.1 billion corresponding to 12.8% of intra‐OIC imports of chemicals followed by the United Arab Emirates ($4.4 billion; 10.1%); Iraq ($4 billion, 9.2%; Malaysia ($ 3.5 billion; 8%) and Pakistan ($2.7 billion; 6.3%). These top 5 countries accounted for 45.4% of intra‐OIC imports of chemicals in 2018.
In addition, more than a fifth of intra‐OIC imports are composed of chemicals from the following countries: Togo (27.8%), Nigeria (24.8%), Tajikistan (22.6%), Algeria (22.5%) and Sudan (20.8%).
Table 19: TOP 10 of intra‐OIC importers of chemicals in 2018 in US$ million and in %
COUNTRY Intra‐OIC imports
in $ million Share in the country's intra‐
OIC imports in% Share in intra‐OIC imports of
chemicals
Turkey 5,139.04 18.09% 11.78%
United Arab Emirates 4,408.18 7.43% 10.11%
Iraq 4,024.86 12.72% 9.23%
Malaysia 3,487.01 15.14% 8.00%
Pakistan 2,745.00 11.91% 6.29%
Indonesia 2,519.77 14.50% 5.78%
Saudi Arabia 2,386.23 9.41% 5.47%
Egypt 2,268.44 12.40% 5.20%
Oman 1,887.79 11.26% 4.33%
Bangladesh 1,699.79 17.48% 3.90%
OIC TOTAL 43,608.60 10.84%
f. Inedible raw materials
Intra‐OIC imports of inedible raw materials reached $13 billion in 2017 compared to $14.9 billion in 2018, equivalent to an increase of 14.3% due to the fact that several OIC countries are endowed with many inedible products.
The share of intra‐OIC imports of these products increased slightly by 2.6% from 3.4% in 2017 to 35% in 2018.
The main importers in the OIC area of these products are: Turkey, which imported from OIC countries $1.6 billion i.e. 10.8% of intra‐OIC imports of these products followed by Iraq ($1.5 billion; 10%), Bangladesh ($1.4 billion; 9.8%), Indonesia ($1.1 billion; 7%) and Malaysia ($1 billion; 6.8%). So, these top 5 countries totalled 44.4% of intra‐OIC imports of these products in 2018.
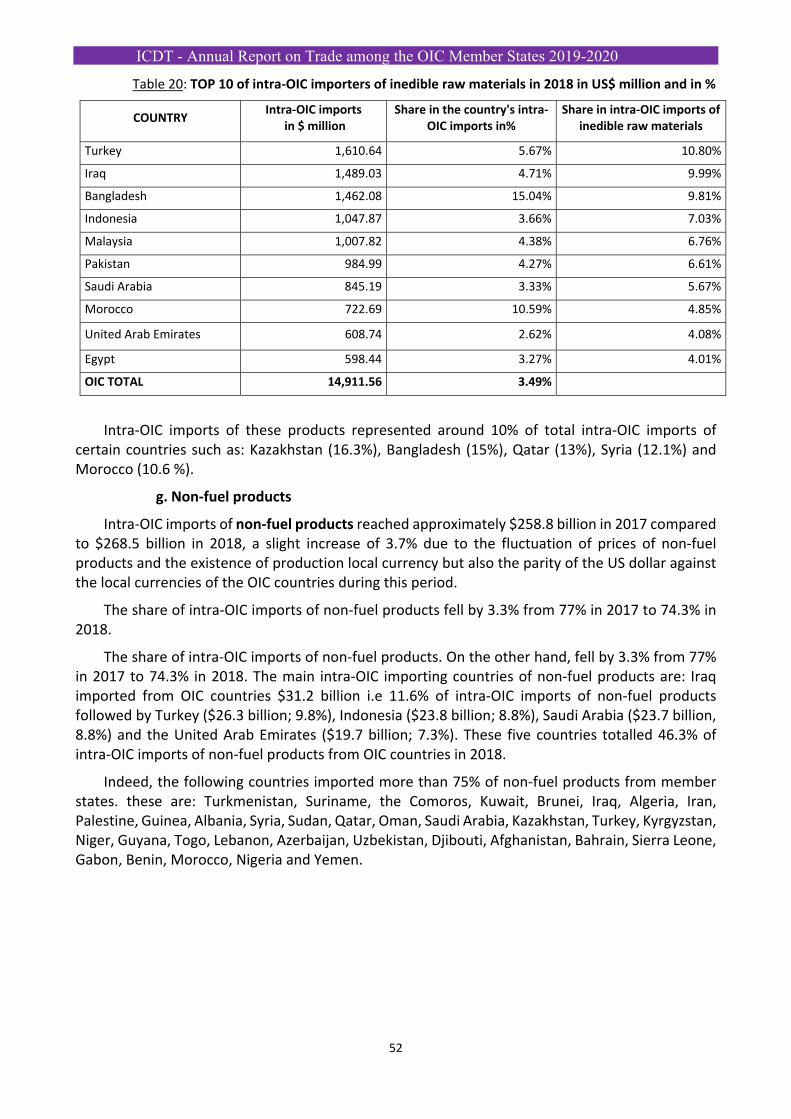
ICDT - Annual Report on Trade among the OIC Member States 2019-2020
52
Table 20: TOP 10 of intra‐OIC importers of inedible raw materials in 2018 in US$ million and in %
COUNTRY Intra‐OIC imports
in $ million Share in the country's intra‐
OIC imports in% Share in intra‐OIC imports of
inedible raw materials
Turkey 1,610.64 5.67% 10.80%
Iraq 1,489.03 4.71% 9.99%
Bangladesh 1,462.08 15.04% 9.81%
Indonesia 1,047.87 3.66% 7.03%
Malaysia 1,007.82 4.38% 6.76%
Pakistan 984.99 4.27% 6.61%
Saudi Arabia 845.19 3.33% 5.67%
Morocco 722.69 10.59% 4.85%
United Arab Emirates 608.74 2.62% 4.08%
Egypt 598.44 3.27% 4.01%
OIC TOTAL 14,911.56 3.49%
Intra‐OIC imports of these products represented around 10% of total intra‐OIC imports of certain countries such as: Kazakhstan (16.3%), Bangladesh (15%), Qatar (13%), Syria (12.1%) and Morocco (10.6 %).
g. Non‐fuel products
Intra‐OIC imports of non‐fuel products reached approximately $258.8 billion in 2017 compared to $268.5 billion in 2018, a slight increase of 3.7% due to the fluctuation of prices of non‐fuel products and the existence of production local currency but also the parity of the US dollar against the local currencies of the OIC countries during this period.
The share of intra‐OIC imports of non‐fuel products fell by 3.3% from 77% in 2017 to 74.3% in 2018.
The share of intra‐OIC imports of non‐fuel products. On the other hand, fell by 3.3% from 77% in 2017 to 74.3% in 2018. The main intra‐OIC importing countries of non‐fuel products are: Iraq imported from OIC countries $31.2 billion i.e 11.6% of intra‐OIC imports of non‐fuel products followed by Turkey ($26.3 billion; 9.8%), Indonesia ($23.8 billion; 8.8%), Saudi Arabia ($23.7 billion, 8.8%) and the United Arab Emirates ($19.7 billion; 7.3%). These five countries totalled 46.3% of intra‐OIC imports of non‐fuel products from OIC countries in 2018.
Indeed, the following countries imported more than 75% of non‐fuel products from member states. these are: Turkmenistan, Suriname, the Comoros, Kuwait, Brunei, Iraq, Algeria, Iran, Palestine, Guinea, Albania, Syria, Sudan, Qatar, Oman, Saudi Arabia, Kazakhstan, Turkey, Kyrgyzstan, Niger, Guyana, Togo, Lebanon, Azerbaijan, Uzbekistan, Djibouti, Afghanistan, Bahrain, Sierra Leone, Gabon, Benin, Morocco, Nigeria and Yemen.
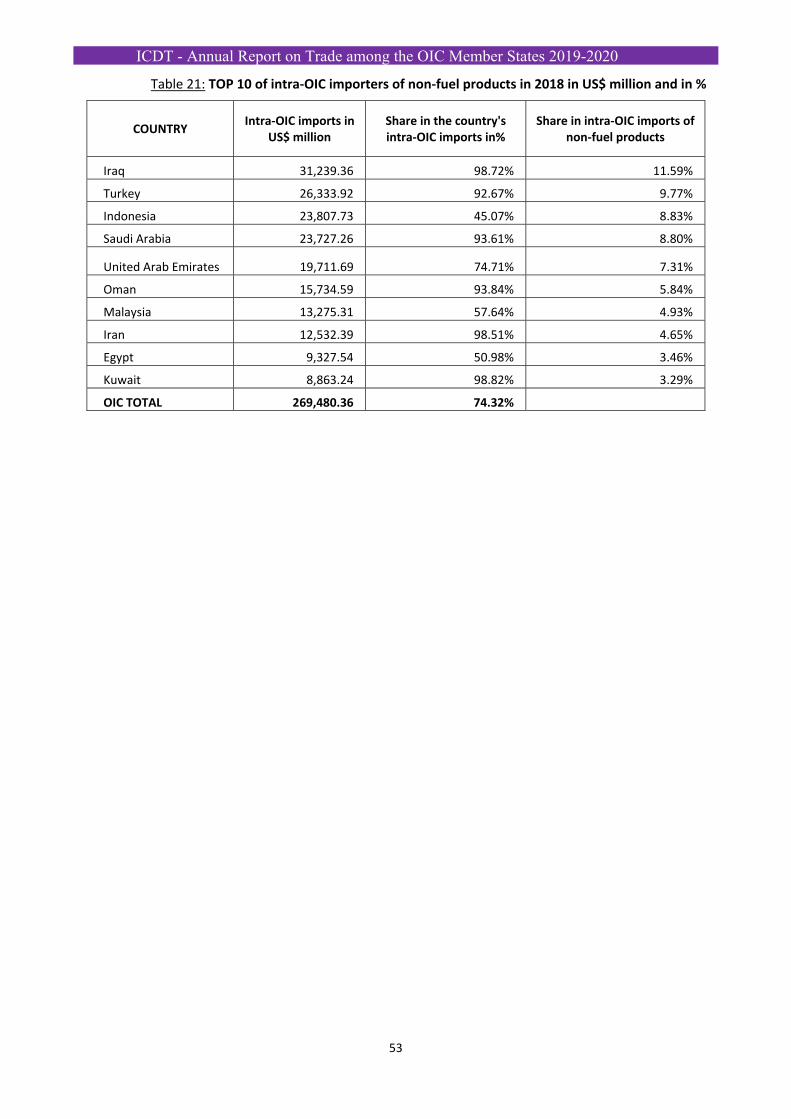
ICDT - Annual Report on Trade among the OIC Member States 2019-2020
53
Table 21: TOP 10 of intra‐OIC importers of non‐fuel products in 2018 in US$ million and in %
COUNTRY Intra‐OIC imports in
US$ million Share in the country's intra‐OIC imports in%
Share in intra‐OIC imports of non‐fuel products
Iraq 31,239.36 98.72% 11.59%
Turkey 26,333.92 92.67% 9.77%
Indonesia 23,807.73 45.07% 8.83%
Saudi Arabia 23,727.26 93.61% 8.80%
United Arab Emirates 19,711.69 74.71% 7.31%
Oman 15,734.59 93.84% 5.84%
Malaysia 13,275.31 57.64% 4.93%
Iran 12,532.39 98.51% 4.65%
Egypt 9,327.54 50.98% 3.46%
Kuwait 8,863.24 98.82% 3.29%
OIC TOTAL 269,480.36 74.32%
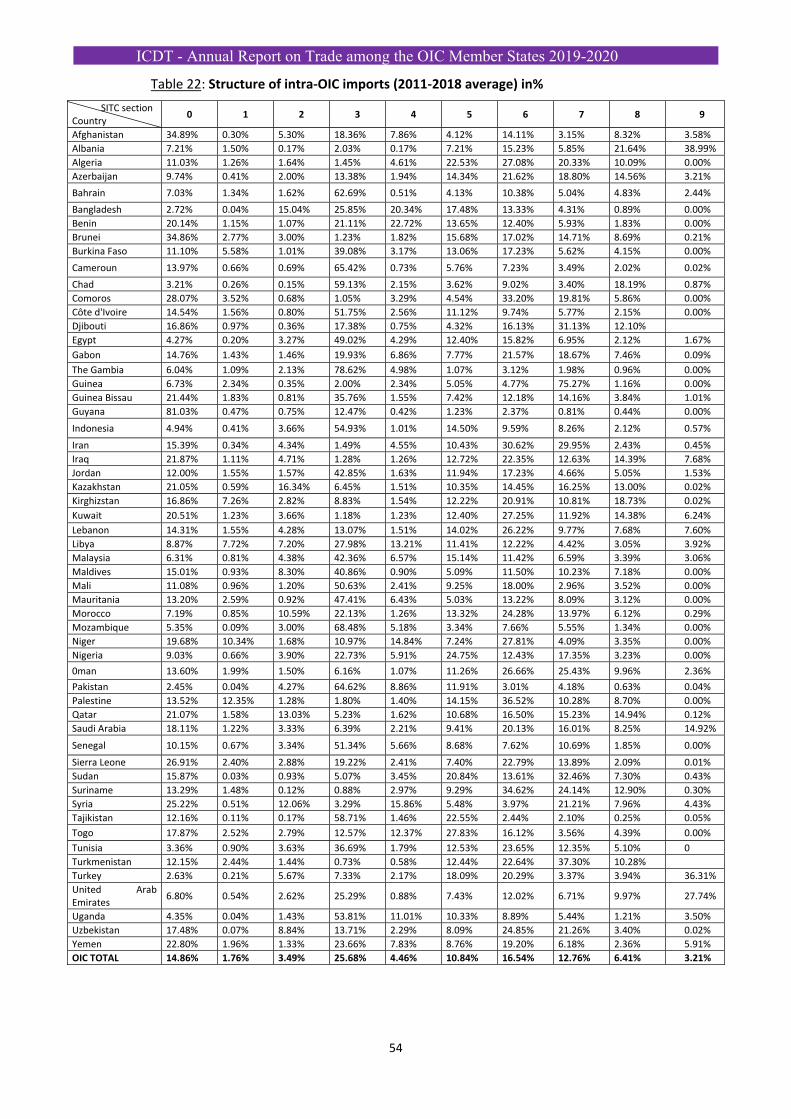
ICDT - Annual Report on Trade among the OIC Member States 2019-2020
54
Table 22: Structure of intra‐OIC imports (2011‐2018 average) in%
SITC section Country
0 1 2 3 4 5 6 7 8 9
Afghanistan 34.89% 0.30% 5.30% 18.36% 7.86% 4.12% 14.11% 3.15% 8.32% 3.58%
Albania 7.21% 1.50% 0.17% 2.03% 0.17% 7.21% 15.23% 5.85% 21.64% 38.99%
Algeria 11.03% 1.26% 1.64% 1.45% 4.61% 22.53% 27.08% 20.33% 10.09% 0.00%
Azerbaijan 9.74% 0.41% 2.00% 13.38% 1.94% 14.34% 21.62% 18.80% 14.56% 3.21%
Bahrain 7.03% 1.34% 1.62% 62.69% 0.51% 4.13% 10.38% 5.04% 4.83% 2.44%
Bangladesh 2.72% 0.04% 15.04% 25.85% 20.34% 17.48% 13.33% 4.31% 0.89% 0.00%
Benin 20.14% 1.15% 1.07% 21.11% 22.72% 13.65% 12.40% 5.93% 1.83% 0.00%
Brunei 34.86% 2.77% 3.00% 1.23% 1.82% 15.68% 17.02% 14.71% 8.69% 0.21%
Burkina Faso 11.10% 5.58% 1.01% 39.08% 3.17% 13.06% 17.23% 5.62% 4.15% 0.00%
Cameroun 13.97% 0.66% 0.69% 65.42% 0.73% 5.76% 7.23% 3.49% 2.02% 0.02%
Chad 3.21% 0.26% 0.15% 59.13% 2.15% 3.62% 9.02% 3.40% 18.19% 0.87%
Comoros 28.07% 3.52% 0.68% 1.05% 3.29% 4.54% 33.20% 19.81% 5.86% 0.00%
Côte d'Ivoire 14.54% 1.56% 0.80% 51.75% 2.56% 11.12% 9.74% 5.77% 2.15% 0.00%
Djibouti 16.86% 0.97% 0.36% 17.38% 0.75% 4.32% 16.13% 31.13% 12.10%
Egypt 4.27% 0.20% 3.27% 49.02% 4.29% 12.40% 15.82% 6.95% 2.12% 1.67%
Gabon 14.76% 1.43% 1.46% 19.93% 6.86% 7.77% 21.57% 18.67% 7.46% 0.09%
The Gambia 6.04% 1.09% 2.13% 78.62% 4.98% 1.07% 3.12% 1.98% 0.96% 0.00%
Guinea 6.73% 2.34% 0.35% 2.00% 2.34% 5.05% 4.77% 75.27% 1.16% 0.00%
Guinea Bissau 21.44% 1.83% 0.81% 35.76% 1.55% 7.42% 12.18% 14.16% 3.84% 1.01%
Guyana 81.03% 0.47% 0.75% 12.47% 0.42% 1.23% 2.37% 0.81% 0.44% 0.00%
Indonesia 4.94% 0.41% 3.66% 54.93% 1.01% 14.50% 9.59% 8.26% 2.12% 0.57%
Iran 15.39% 0.34% 4.34% 1.49% 4.55% 10.43% 30.62% 29.95% 2.43% 0.45%
Iraq 21.87% 1.11% 4.71% 1.28% 1.26% 12.72% 22.35% 12.63% 14.39% 7.68%
Jordan 12.00% 1.55% 1.57% 42.85% 1.63% 11.94% 17.23% 4.66% 5.05% 1.53%
Kazakhstan 21.05% 0.59% 16.34% 6.45% 1.51% 10.35% 14.45% 16.25% 13.00% 0.02%
Kirghizstan 16.86% 7.26% 2.82% 8.83% 1.54% 12.22% 20.91% 10.81% 18.73% 0.02%
Kuwait 20.51% 1.23% 3.66% 1.18% 1.23% 12.40% 27.25% 11.92% 14.38% 6.24%
Lebanon 14.31% 1.55% 4.28% 13.07% 1.51% 14.02% 26.22% 9.77% 7.68% 7.60%
Libya 8.87% 7.72% 7.20% 27.98% 13.21% 11.41% 12.22% 4.42% 3.05% 3.92%
Malaysia 6.31% 0.81% 4.38% 42.36% 6.57% 15.14% 11.42% 6.59% 3.39% 3.06%
Maldives 15.01% 0.93% 8.30% 40.86% 0.90% 5.09% 11.50% 10.23% 7.18% 0.00%
Mali 11.08% 0.96% 1.20% 50.63% 2.41% 9.25% 18.00% 2.96% 3.52% 0.00%
Mauritania 13.20% 2.59% 0.92% 47.41% 6.43% 5.03% 13.22% 8.09% 3.12% 0.00%
Morocco 7.19% 0.85% 10.59% 22.13% 1.26% 13.32% 24.28% 13.97% 6.12% 0.29%
Mozambique 5.35% 0.09% 3.00% 68.48% 5.18% 3.34% 7.66% 5.55% 1.34% 0.00%
Niger 19.68% 10.34% 1.68% 10.97% 14.84% 7.24% 27.81% 4.09% 3.35% 0.00%
Nigeria 9.03% 0.66% 3.90% 22.73% 5.91% 24.75% 12.43% 17.35% 3.23% 0.00%
0man 13.60% 1.99% 1.50% 6.16% 1.07% 11.26% 26.66% 25.43% 9.96% 2.36%
Pakistan 2.45% 0.04% 4.27% 64.62% 8.86% 11.91% 3.01% 4.18% 0.63% 0.04%
Palestine 13.52% 12.35% 1.28% 1.80% 1.40% 14.15% 36.52% 10.28% 8.70% 0.00%
Qatar 21.07% 1.58% 13.03% 5.23% 1.62% 10.68% 16.50% 15.23% 14.94% 0.12%
Saudi Arabia 18.11% 1.22% 3.33% 6.39% 2.21% 9.41% 20.13% 16.01% 8.25% 14.92%
Senegal 10.15% 0.67% 3.34% 51.34% 5.66% 8.68% 7.62% 10.69% 1.85% 0.00%
Sierra Leone 26.91% 2.40% 2.88% 19.22% 2.41% 7.40% 22.79% 13.89% 2.09% 0.01%
Sudan 15.87% 0.03% 0.93% 5.07% 3.45% 20.84% 13.61% 32.46% 7.30% 0.43%
Suriname 13.29% 1.48% 0.12% 0.88% 2.97% 9.29% 34.62% 24.14% 12.90% 0.30%
Syria 25.22% 0.51% 12.06% 3.29% 15.86% 5.48% 3.97% 21.21% 7.96% 4.43%
Tajikistan 12.16% 0.11% 0.17% 58.71% 1.46% 22.55% 2.44% 2.10% 0.25% 0.05%
Togo 17.87% 2.52% 2.79% 12.57% 12.37% 27.83% 16.12% 3.56% 4.39% 0.00%
Tunisia 3.36% 0.90% 3.63% 36.69% 1.79% 12.53% 23.65% 12.35% 5.10% 0
Turkmenistan 12.15% 2.44% 1.44% 0.73% 0.58% 12.44% 22.64% 37.30% 10.28%
Turkey 2.63% 0.21% 5.67% 7.33% 2.17% 18.09% 20.29% 3.37% 3.94% 36.31%
United Arab Emirates
6.80% 0.54% 2.62% 25.29% 0.88% 7.43% 12.02% 6.71% 9.97% 27.74%
Uganda 4.35% 0.04% 1.43% 53.81% 11.01% 10.33% 8.89% 5.44% 1.21% 3.50%
Uzbekistan 17.48% 0.07% 8.84% 13.71% 2.29% 8.09% 24.85% 21.26% 3.40% 0.02%
Yemen 22.80% 1.96% 1.33% 23.66% 7.83% 8.76% 19.20% 6.18% 2.36% 5.91%
OIC TOTAL 14.86% 1.76% 3.49% 25.68% 4.46% 10.84% 16.54% 12.76% 6.41% 3.21%
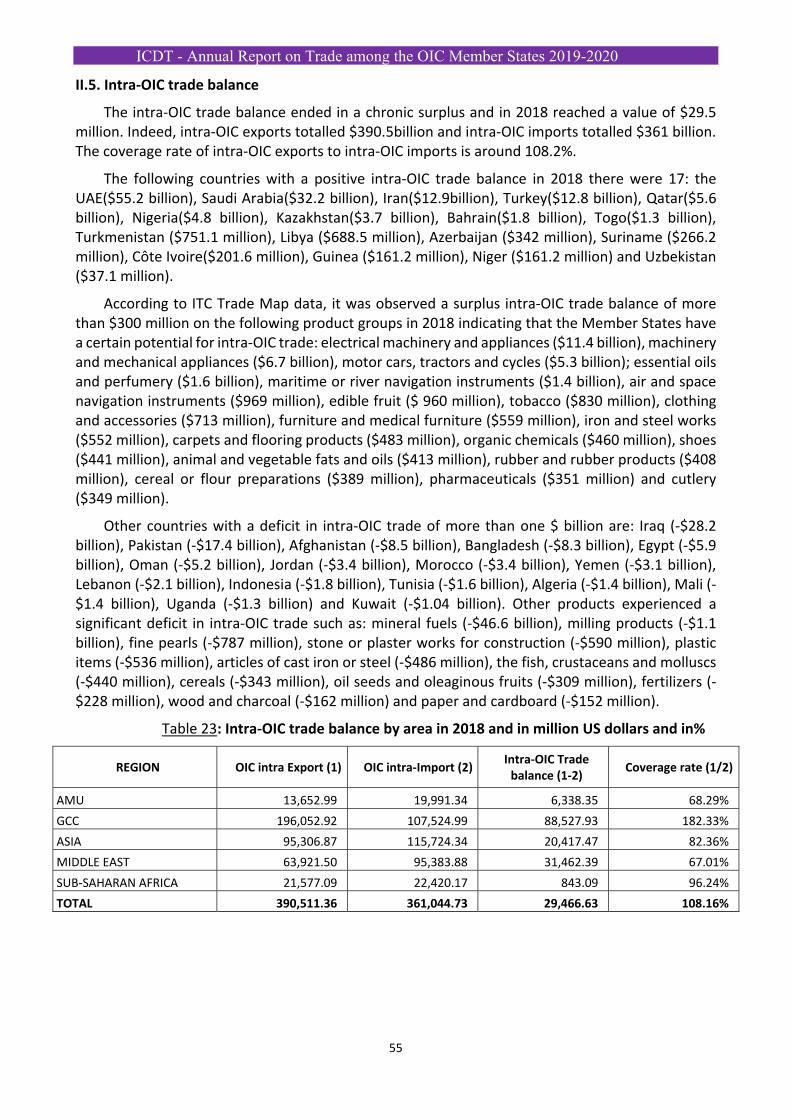
ICDT - Annual Report on Trade among the OIC Member States 2019-2020
55
II.5. Intra‐OIC trade balance
The intra‐OIC trade balance ended in a chronic surplus and in 2018 reached a value of $29.5 million. Indeed, intra‐OIC exports totalled $390.5billion and intra‐OIC imports totalled $361 billion. The coverage rate of intra‐OIC exports to intra‐OIC imports is around 108.2%.
The following countries with a positive intra‐OIC trade balance in 2018 there were 17: the UAE($55.2 billion), Saudi Arabia($32.2 billion), Iran($12.9billion), Turkey($12.8 billion), Qatar($5.6 billion), Nigeria($4.8 billion), Kazakhstan($3.7 billion), Bahrain($1.8 billion), Togo($1.3 billion), Turkmenistan ($751.1 million), Libya ($688.5 million), Azerbaijan ($342 million), Suriname ($266.2 million), Côte Ivoire($201.6 million), Guinea ($161.2 million), Niger ($161.2 million) and Uzbekistan ($37.1 million).
According to ITC Trade Map data, it was observed a surplus intra‐OIC trade balance of more than $300 million on the following product groups in 2018 indicating that the Member States have a certain potential for intra‐OIC trade: electrical machinery and appliances ($11.4 billion), machinery and mechanical appliances ($6.7 billion), motor cars, tractors and cycles ($5.3 billion); essential oils and perfumery ($1.6 billion), maritime or river navigation instruments ($1.4 billion), air and space navigation instruments ($969 million), edible fruit ($ 960 million), tobacco ($830 million), clothing and accessories ($713 million), furniture and medical furniture ($559 million), iron and steel works ($552 million), carpets and flooring products ($483 million), organic chemicals ($460 million), shoes ($441 million), animal and vegetable fats and oils ($413 million), rubber and rubber products ($408 million), cereal or flour preparations ($389 million), pharmaceuticals ($351 million) and cutlery ($349 million).
Other countries with a deficit in intra‐OIC trade of more than one $ billion are: Iraq (‐$28.2 billion), Pakistan (‐$17.4 billion), Afghanistan (‐$8.5 billion), Bangladesh (‐$8.3 billion), Egypt (‐$5.9 billion), Oman (‐$5.2 billion), Jordan (‐$3.4 billion), Morocco (‐$3.4 billion), Yemen (‐$3.1 billion), Lebanon (‐$2.1 billion), Indonesia (‐$1.8 billion), Tunisia (‐$1.6 billion), Algeria (‐$1.4 billion), Mali (‐$1.4 billion), Uganda (‐$1.3 billion) and Kuwait (‐$1.04 billion). Other products experienced a significant deficit in intra‐OIC trade such as: mineral fuels (‐$46.6 billion), milling products (‐$1.1 billion), fine pearls (‐$787 million), stone or plaster works for construction (‐$590 million), plastic items (‐$536 million), articles of cast iron or steel (‐$486 million), the fish, crustaceans and molluscs (‐$440 million), cereals (‐$343 million), oil seeds and oleaginous fruits (‐$309 million), fertilizers (‐$228 million), wood and charcoal (‐$162 million) and paper and cardboard (‐$152 million).
Table 23: Intra‐OIC trade balance by area in 2018 and in million US dollars and in%
REGION OIC intra Export (1) OIC intra‐Import (2)Intra‐OIC Trade balance (1‐2)
Coverage rate (1/2)
AMU 13,652.99 19,991.34 6,338.35 68.29%
GCC 196,052.92 107,524.99 88,527.93 182.33%
ASIA 95,306.87 115,724.34 20,417.47 82.36%
MIDDLE EAST 63,921.50 95,383.88 31,462.39 67.01%
SUB‐SAHARAN AFRICA 21,577.09 22,420.17 843.09 96.24%
TOTAL 390,511.36 361,044.73 29,466.63 108.16%
ICDT - Annual Report on Trade among the OIC Member States 2019-2020
56
It is observed by group of countries that only the countries of the Gulf Cooperation Council present a surplus in intra‐OIC trade balance ($88.5 billion) thanks to intra‐OIC exports of non‐fuel products. There are also significant deficits in the regions of Asia (‐31.5 billion $) and the Middle East (‐20.4 billion $), AMU (‐$ 6.3 billion) and sub‐Saharan Africa (‐US$ 843 million) in 2018.
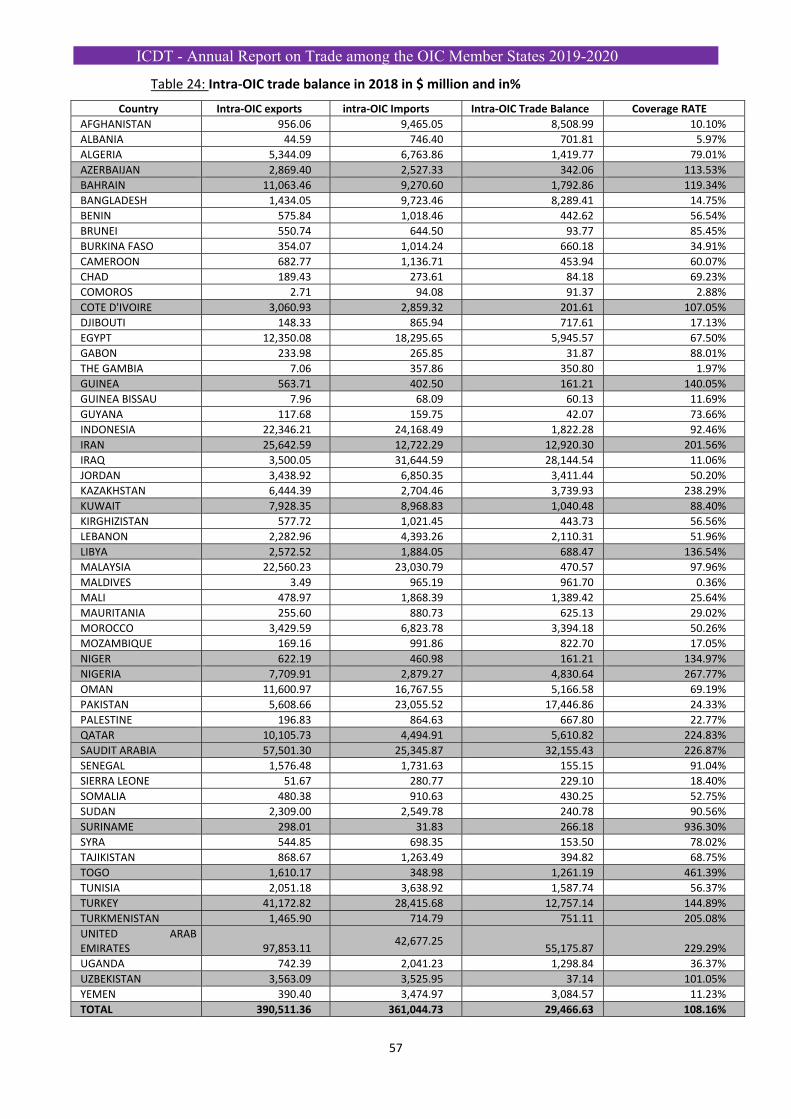
ICDT - Annual Report on Trade among the OIC Member States 2019-2020
57
Table 24: Intra‐OIC trade balance in 2018 in $ million and in%
Country Intra‐OIC exports intra‐OIC Imports Intra‐OIC Trade Balance Coverage RATE
AFGHANISTAN 956.06 9,465.05 8,508.99 10.10%
ALBANIA 44.59 746.40 701.81 5.97%
ALGERIA 5,344.09 6,763.86 1,419.77 79.01%
AZERBAIJAN 2,869.40 2,527.33 342.06 113.53%
BAHRAIN 11,063.46 9,270.60 1,792.86 119.34%
BANGLADESH 1,434.05 9,723.46 8,289.41 14.75%
BENIN 575.84 1,018.46 442.62 56.54%
BRUNEI 550.74 644.50 93.77 85.45%
BURKINA FASO 354.07 1,014.24 660.18 34.91%
CAMEROON 682.77 1,136.71 453.94 60.07%
CHAD 189.43 273.61 84.18 69.23%
COMOROS 2.71 94.08 91.37 2.88%
COTE D'IVOIRE 3,060.93 2,859.32 201.61 107.05%
DJIBOUTI 148.33 865.94 717.61 17.13%
EGYPT 12,350.08 18,295.65 5,945.57 67.50%
GABON 233.98 265.85 31.87 88.01%
THE GAMBIA 7.06 357.86 350.80 1.97%
GUINEA 563.71 402.50 161.21 140.05%
GUINEA BISSAU 7.96 68.09 60.13 11.69%
GUYANA 117.68 159.75 42.07 73.66%
INDONESIA 22,346.21 24,168.49 1,822.28 92.46%
IRAN 25,642.59 12,722.29 12,920.30 201.56%
IRAQ 3,500.05 31,644.59 28,144.54 11.06%
JORDAN 3,438.92 6,850.35 3,411.44 50.20%
KAZAKHSTAN 6,444.39 2,704.46 3,739.93 238.29%
KUWAIT 7,928.35 8,968.83 1,040.48 88.40%
KIRGHIZISTAN 577.72 1,021.45 443.73 56.56%
LEBANON 2,282.96 4,393.26 2,110.31 51.96%
LIBYA 2,572.52 1,884.05 688.47 136.54%
MALAYSIA 22,560.23 23,030.79 470.57 97.96%
MALDIVES 3.49 965.19 961.70 0.36%
MALI 478.97 1,868.39 1,389.42 25.64%
MAURITANIA 255.60 880.73 625.13 29.02%
MOROCCO 3,429.59 6,823.78 3,394.18 50.26%
MOZAMBIQUE 169.16 991.86 822.70 17.05%
NIGER 622.19 460.98 161.21 134.97%
NIGERIA 7,709.91 2,879.27 4,830.64 267.77%
OMAN 11,600.97 16,767.55 5,166.58 69.19%
PAKISTAN 5,608.66 23,055.52 17,446.86 24.33%
PALESTINE 196.83 864.63 667.80 22.77%
QATAR 10,105.73 4,494.91 5,610.82 224.83%
SAUDIT ARABIA 57,501.30 25,345.87 32,155.43 226.87%
SENEGAL 1,576.48 1,731.63 155.15 91.04%
SIERRA LEONE 51.67 280.77 229.10 18.40%
SOMALIA 480.38 910.63 430.25 52.75%
SUDAN 2,309.00 2,549.78 240.78 90.56%
SURINAME 298.01 31.83 266.18 936.30%
SYRA 544.85 698.35 153.50 78.02%
TAJIKISTAN 868.67 1,263.49 394.82 68.75%
TOGO 1,610.17 348.98 1,261.19 461.39%
TUNISIA 2,051.18 3,638.92 1,587.74 56.37%
TURKEY 41,172.82 28,415.68 12,757.14 144.89%
TURKMENISTAN 1,465.90 714.79 751.11 205.08%
UNITED ARAB EMIRATES 97,853.11
42,677.25 55,175.87 229.29%
UGANDA 742.39 2,041.23 1,298.84 36.37%
UZBEKISTAN 3,563.09 3,525.95 37.14 101.05%
YEMEN 390.40 3,474.97 3,084.57 11.23%
TOTAL 390,511.36 361,044.73 29,466.63 108.16%
ICDT - Annual Report on Trade among the OIC Member States 2019-2020
58
CHAPTER III:
GEOGRAPHICAL DISTRUBUTION
OF
INTRA‐OIC TRADE
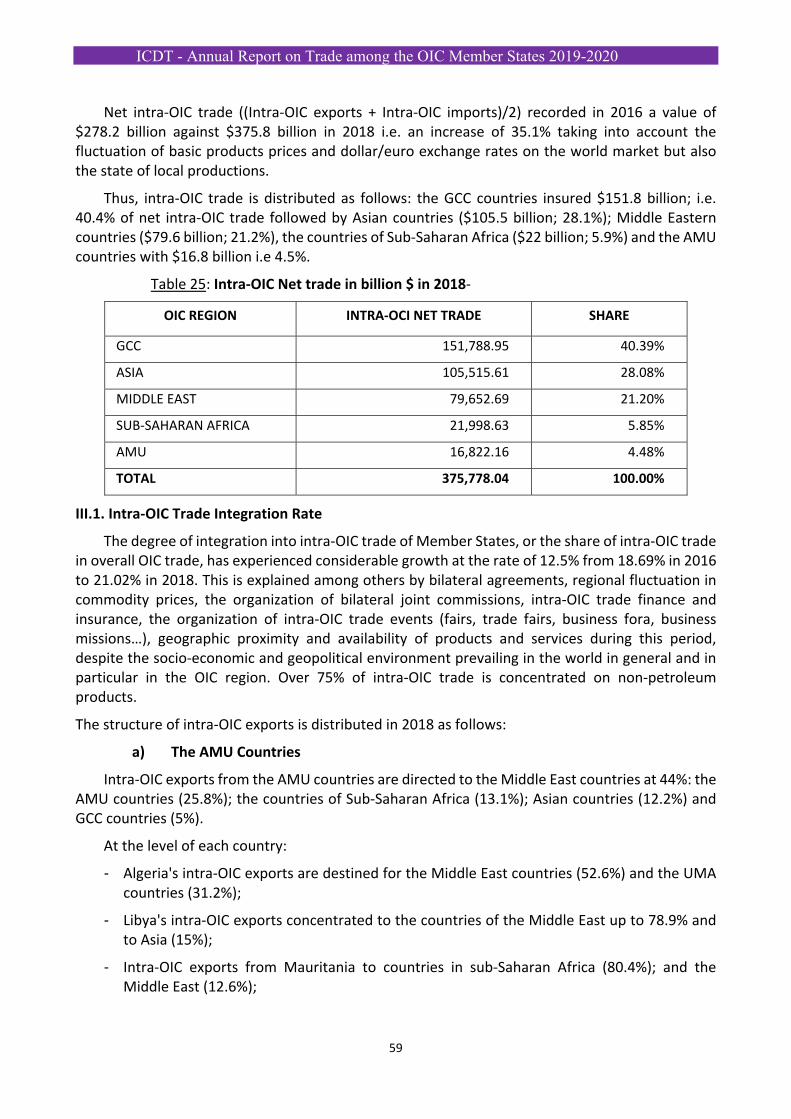
ICDT - Annual Report on Trade among the OIC Member States 2019-2020
59
Net intra‐OIC trade ((Intra‐OIC exports + Intra‐OIC imports)/2) recorded in 2016 a value of $278.2 billion against $375.8 billion in 2018 i.e. an increase of 35.1% taking into account the fluctuation of basic products prices and dollar/euro exchange rates on the world market but also the state of local productions.
Thus, intra‐OIC trade is distributed as follows: the GCC countries insured $151.8 billion; i.e. 40.4% of net intra‐OIC trade followed by Asian countries ($105.5 billion; 28.1%); Middle Eastern countries ($79.6 billion; 21.2%), the countries of Sub‐Saharan Africa ($22 billion; 5.9%) and the AMU countries with $16.8 billion i.e 4.5%.
Table 25: Intra‐OIC Net trade in billion $ in 2018‐
OIC REGION INTRA‐OCI NET TRADE SHARE
GCC 151,788.95 40.39%
ASIA 105,515.61 28.08%
MIDDLE EAST 79,652.69 21.20%
SUB‐SAHARAN AFRICA 21,998.63 5.85%
AMU 16,822.16 4.48%
TOTAL 375,778.04 100.00%
III.1. Intra‐OIC Trade Integration Rate
The degree of integration into intra‐OIC trade of Member States, or the share of intra‐OIC trade in overall OIC trade, has experienced considerable growth at the rate of 12.5% from 18.69% in 2016 to 21.02% in 2018. This is explained among others by bilateral agreements, regional fluctuation in commodity prices, the organization of bilateral joint commissions, intra‐OIC trade finance and insurance, the organization of intra‐OIC trade events (fairs, trade fairs, business fora, business missions…), geographic proximity and availability of products and services during this period, despite the socio‐economic and geopolitical environment prevailing in the world in general and in particular in the OIC region. Over 75% of intra‐OIC trade is concentrated on non‐petroleum products.
The structure of intra‐OIC exports is distributed in 2018 as follows:
a) The AMU Countries
Intra‐OIC exports from the AMU countries are directed to the Middle East countries at 44%: the AMU countries (25.8%); the countries of Sub‐Saharan Africa (13.1%); Asian countries (12.2%) and GCC countries (5%).
At the level of each country:
- Algeria's intra‐OIC exports are destined for the Middle East countries (52.6%) and the UMA countries (31.2%);
- Libya's intra‐OIC exports concentrated to the countries of the Middle East up to 78.9% and to Asia (15%);
- Intra‐OIC exports from Mauritania to countries in sub‐Saharan Africa (80.4%); and the Middle East (12.6%);
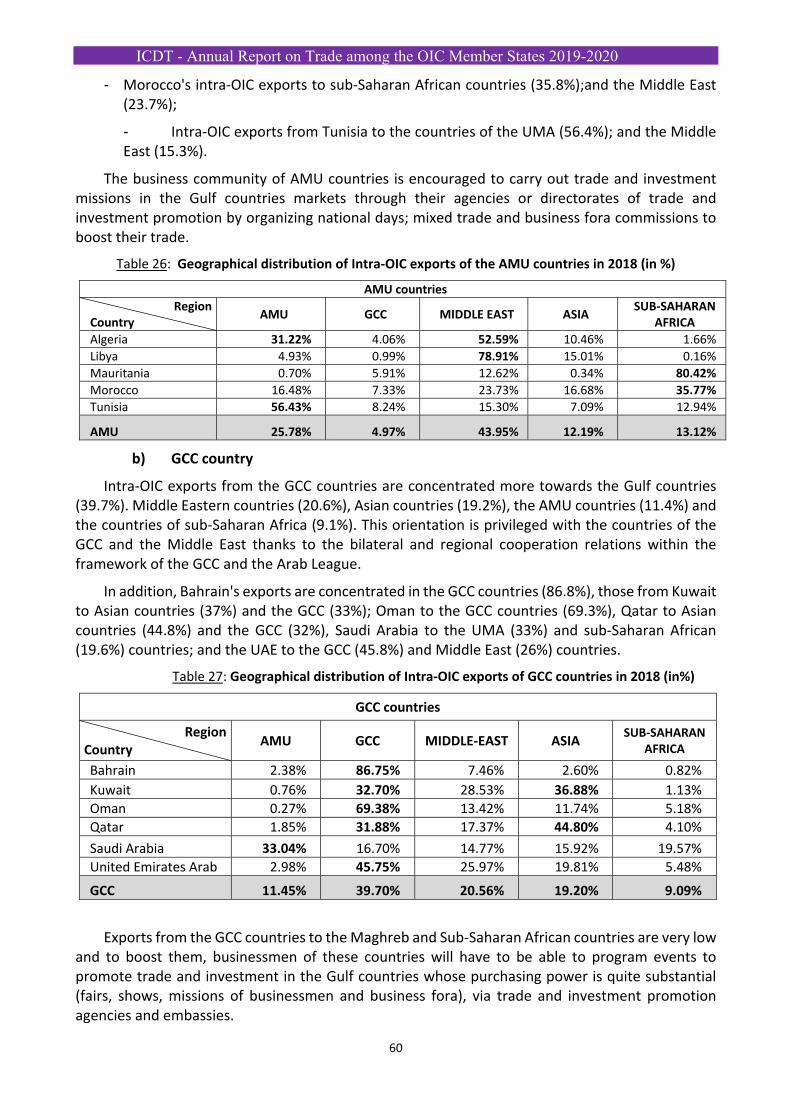
ICDT - Annual Report on Trade among the OIC Member States 2019-2020
60
- Morocco's intra‐OIC exports to sub‐Saharan African countries (35.8%);and the Middle East (23.7%);
- Intra‐OIC exports from Tunisia to the countries of the UMA (56.4%); and the Middle East (15.3%).
The business community of AMU countries is encouraged to carry out trade and investment missions in the Gulf countries markets through their agencies or directorates of trade and investment promotion by organizing national days; mixed trade and business fora commissions to boost their trade.
Table 26: Geographical distribution of Intra‐OIC exports of the AMU countries in 2018 (in %)
AMU countries
Region Country
AMU GCC MIDDLE EAST ASIA SUB‐SAHARAN
AFRICA
Algeria 31.22% 4.06% 52.59% 10.46% 1.66%
Libya 4.93% 0.99% 78.91% 15.01% 0.16%
Mauritania 0.70% 5.91% 12.62% 0.34% 80.42%
Morocco 16.48% 7.33% 23.73% 16.68% 35.77%
Tunisia 56.43% 8.24% 15.30% 7.09% 12.94%
AMU 25.78% 4.97% 43.95% 12.19% 13.12%
b) GCC country
Intra‐OIC exports from the GCC countries are concentrated more towards the Gulf countries (39.7%). Middle Eastern countries (20.6%), Asian countries (19.2%), the AMU countries (11.4%) and the countries of sub‐Saharan Africa (9.1%). This orientation is privileged with the countries of the GCC and the Middle East thanks to the bilateral and regional cooperation relations within the framework of the GCC and the Arab League.
In addition, Bahrain's exports are concentrated in the GCC countries (86.8%), those from Kuwait to Asian countries (37%) and the GCC (33%); Oman to the GCC countries (69.3%), Qatar to Asian countries (44.8%) and the GCC (32%), Saudi Arabia to the UMA (33%) and sub‐Saharan African (19.6%) countries; and the UAE to the GCC (45.8%) and Middle East (26%) countries.
Table 27: Geographical distribution of Intra‐OIC exports of GCC countries in 2018 (in%)
GCC countries
Region Country
AMU GCC MIDDLE‐EAST ASIA SUB‐SAHARAN
AFRICA
Bahrain 2.38% 86.75% 7.46% 2.60% 0.82%
Kuwait 0.76% 32.70% 28.53% 36.88% 1.13%
Oman 0.27% 69.38% 13.42% 11.74% 5.18%
Qatar 1.85% 31.88% 17.37% 44.80% 4.10%
Saudi Arabia 33.04% 16.70% 14.77% 15.92% 19.57%
United Emirates Arab 2.98% 45.75% 25.97% 19.81% 5.48%
GCC 11.45% 39.70% 20.56% 19.20% 9.09%
Exports from the GCC countries to the Maghreb and Sub‐Saharan African countries are very low and to boost them, businessmen of these countries will have to be able to program events to promote trade and investment in the Gulf countries whose purchasing power is quite substantial (fairs, shows, missions of businessmen and business fora), via trade and investment promotion agencies and embassies.
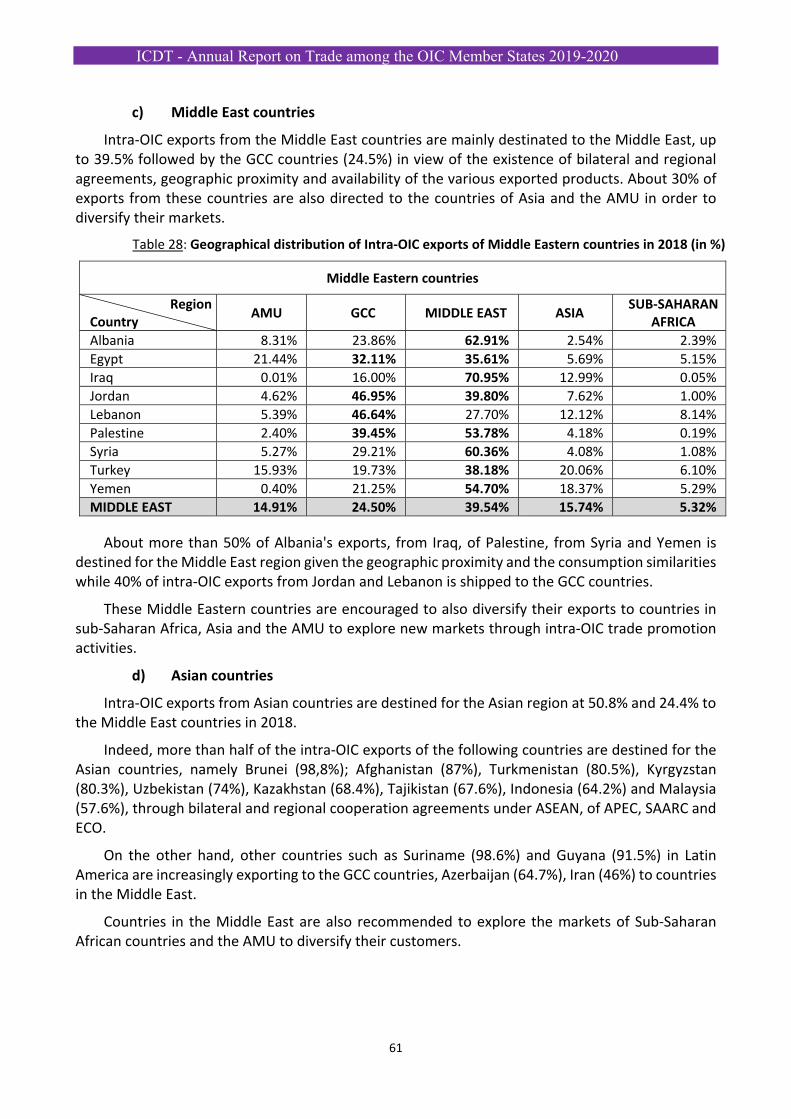
ICDT - Annual Report on Trade among the OIC Member States 2019-2020
61
c) Middle East countries
Intra‐OIC exports from the Middle East countries are mainly destinated to the Middle East, up to 39.5% followed by the GCC countries (24.5%) in view of the existence of bilateral and regional agreements, geographic proximity and availability of the various exported products. About 30% of exports from these countries are also directed to the countries of Asia and the AMU in order to diversify their markets.
Table 28: Geographical distribution of Intra‐OIC exports of Middle Eastern countries in 2018 (in %)
Middle Eastern countries
Region Country
AMU GCC MIDDLE EAST ASIA SUB‐SAHARAN
AFRICA
Albania 8.31% 23.86% 62.91% 2.54% 2.39%
Egypt 21.44% 32.11% 35.61% 5.69% 5.15%
Iraq 0.01% 16.00% 70.95% 12.99% 0.05%
Jordan 4.62% 46.95% 39.80% 7.62% 1.00%
Lebanon 5.39% 46.64% 27.70% 12.12% 8.14%
Palestine 2.40% 39.45% 53.78% 4.18% 0.19%
Syria 5.27% 29.21% 60.36% 4.08% 1.08%
Turkey 15.93% 19.73% 38.18% 20.06% 6.10%
Yemen 0.40% 21.25% 54.70% 18.37% 5.29%
MIDDLE EAST 14.91% 24.50% 39.54% 15.74% 5.32%
About more than 50% of Albania's exports, from Iraq, of Palestine, from Syria and Yemen is destined for the Middle East region given the geographic proximity and the consumption similarities while 40% of intra‐OIC exports from Jordan and Lebanon is shipped to the GCC countries.
These Middle Eastern countries are encouraged to also diversify their exports to countries in sub‐Saharan Africa, Asia and the AMU to explore new markets through intra‐OIC trade promotion activities.
d) Asian countries
Intra‐OIC exports from Asian countries are destined for the Asian region at 50.8% and 24.4% to the Middle East countries in 2018.
Indeed, more than half of the intra‐OIC exports of the following countries are destined for the Asian countries, namely Brunei (98,8%); Afghanistan (87%), Turkmenistan (80.5%), Kyrgyzstan (80.3%), Uzbekistan (74%), Kazakhstan (68.4%), Tajikistan (67.6%), Indonesia (64.2%) and Malaysia (57.6%), through bilateral and regional cooperation agreements under ASEAN, of APEC, SAARC and ECO.
On the other hand, other countries such as Suriname (98.6%) and Guyana (91.5%) in Latin America are increasingly exporting to the GCC countries, Azerbaijan (64.7%), Iran (46%) to countries in the Middle East.
Countries in the Middle East are also recommended to explore the markets of Sub‐Saharan African countries and the AMU to diversify their customers.
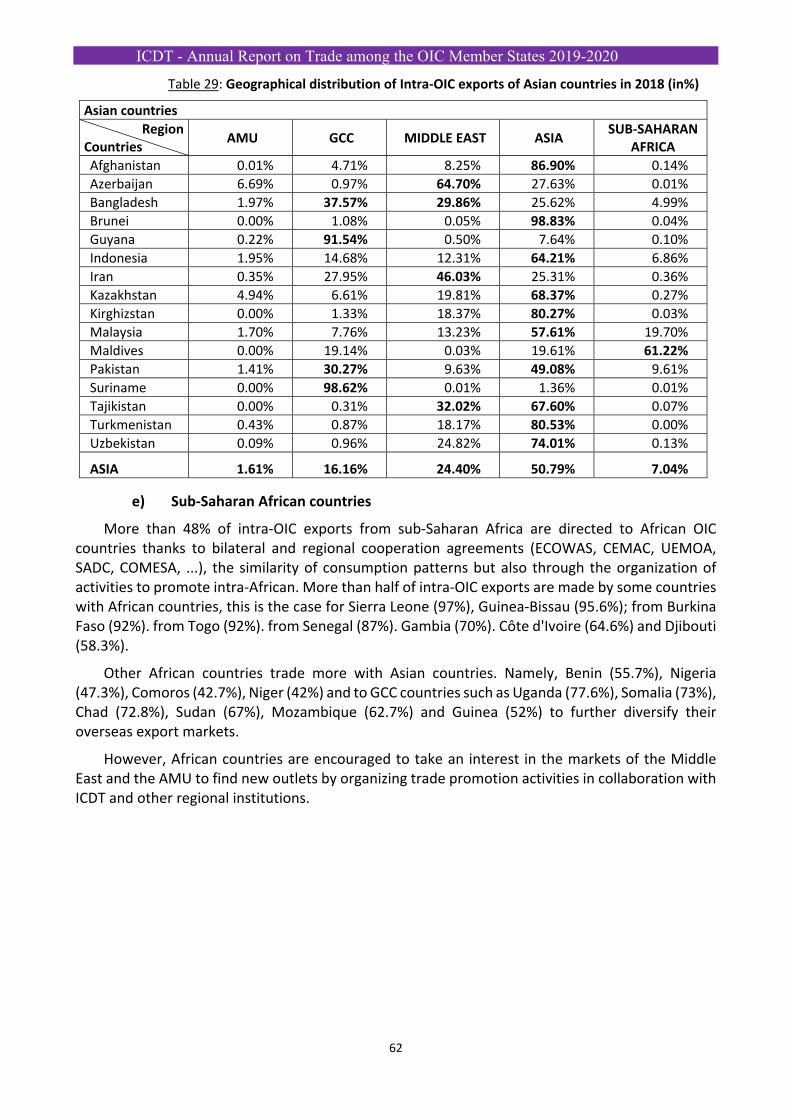
ICDT - Annual Report on Trade among the OIC Member States 2019-2020
62
Table 29: Geographical distribution of Intra‐OIC exports of Asian countries in 2018 (in%)
Asian countries
Region Countries
AMU GCC MIDDLE EAST ASIA SUB‐SAHARAN
AFRICA
Afghanistan 0.01% 4.71% 8.25% 86.90% 0.14%
Azerbaijan 6.69% 0.97% 64.70% 27.63% 0.01%
Bangladesh 1.97% 37.57% 29.86% 25.62% 4.99%
Brunei 0.00% 1.08% 0.05% 98.83% 0.04%
Guyana 0.22% 91.54% 0.50% 7.64% 0.10%
Indonesia 1.95% 14.68% 12.31% 64.21% 6.86%
Iran 0.35% 27.95% 46.03% 25.31% 0.36%
Kazakhstan 4.94% 6.61% 19.81% 68.37% 0.27%
Kirghizstan 0.00% 1.33% 18.37% 80.27% 0.03%
Malaysia 1.70% 7.76% 13.23% 57.61% 19.70%
Maldives 0.00% 19.14% 0.03% 19.61% 61.22%
Pakistan 1.41% 30.27% 9.63% 49.08% 9.61%
Suriname 0.00% 98.62% 0.01% 1.36% 0.01%
Tajikistan 0.00% 0.31% 32.02% 67.60% 0.07%
Turkmenistan 0.43% 0.87% 18.17% 80.53% 0.00%
Uzbekistan 0.09% 0.96% 24.82% 74.01% 0.13%
ASIA 1.61% 16.16% 24.40% 50.79% 7.04%
e) Sub‐Saharan African countries
More than 48% of intra‐OIC exports from sub‐Saharan Africa are directed to African OIC countries thanks to bilateral and regional cooperation agreements (ECOWAS, CEMAC, UEMOA, SADC, COMESA, ...), the similarity of consumption patterns but also through the organization of activities to promote intra‐African. More than half of intra‐OIC exports are made by some countries with African countries, this is the case for Sierra Leone (97%), Guinea‐Bissau (95.6%); from Burkina Faso (92%). from Togo (92%). from Senegal (87%). Gambia (70%). Côte d'Ivoire (64.6%) and Djibouti (58.3%).
Other African countries trade more with Asian countries. Namely, Benin (55.7%), Nigeria (47.3%), Comoros (42.7%), Niger (42%) and to GCC countries such as Uganda (77.6%), Somalia (73%), Chad (72.8%), Sudan (67%), Mozambique (62.7%) and Guinea (52%) to further diversify their overseas export markets.
However, African countries are encouraged to take an interest in the markets of the Middle East and the AMU to find new outlets by organizing trade promotion activities in collaboration with ICDT and other regional institutions.
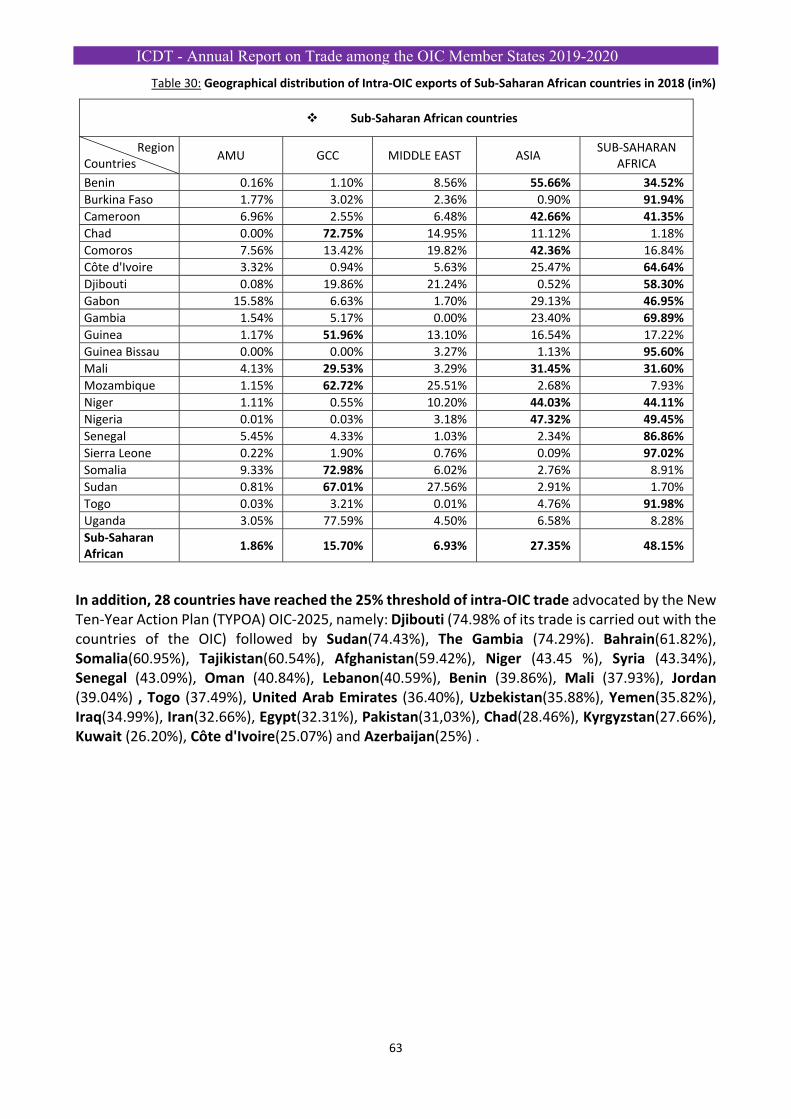
ICDT - Annual Report on Trade among the OIC Member States 2019-2020
63
Table 30: Geographical distribution of Intra‐OIC exports of Sub‐Saharan African countries in 2018 (in%)
Sub‐Saharan African countries
Region Countries
AMU GCC MIDDLE EAST ASIA SUB‐SAHARAN
AFRICA
Benin 0.16% 1.10% 8.56% 55.66% 34.52%
Burkina Faso 1.77% 3.02% 2.36% 0.90% 91.94%
Cameroon 6.96% 2.55% 6.48% 42.66% 41.35%
Chad 0.00% 72.75% 14.95% 11.12% 1.18%
Comoros 7.56% 13.42% 19.82% 42.36% 16.84%
Côte d'Ivoire 3.32% 0.94% 5.63% 25.47% 64.64%
Djibouti 0.08% 19.86% 21.24% 0.52% 58.30%
Gabon 15.58% 6.63% 1.70% 29.13% 46.95%
Gambia 1.54% 5.17% 0.00% 23.40% 69.89%
Guinea 1.17% 51.96% 13.10% 16.54% 17.22%
Guinea Bissau 0.00% 0.00% 3.27% 1.13% 95.60%
Mali 4.13% 29.53% 3.29% 31.45% 31.60%
Mozambique 1.15% 62.72% 25.51% 2.68% 7.93%
Niger 1.11% 0.55% 10.20% 44.03% 44.11%
Nigeria 0.01% 0.03% 3.18% 47.32% 49.45%
Senegal 5.45% 4.33% 1.03% 2.34% 86.86%
Sierra Leone 0.22% 1.90% 0.76% 0.09% 97.02%
Somalia 9.33% 72.98% 6.02% 2.76% 8.91%
Sudan 0.81% 67.01% 27.56% 2.91% 1.70%
Togo 0.03% 3.21% 0.01% 4.76% 91.98%
Uganda 3.05% 77.59% 4.50% 6.58% 8.28%
Sub‐Saharan African
1.86% 15.70% 6.93% 27.35% 48.15%
In addition, 28 countries have reached the 25% threshold of intra‐OIC trade advocated by the New Ten‐Year Action Plan (TYPOA) OIC‐2025, namely: Djibouti (74.98% of its trade is carried out with the countries of the OIC) followed by Sudan(74.43%), The Gambia (74.29%). Bahrain(61.82%), Somalia(60.95%), Tajikistan(60.54%), Afghanistan(59.42%), Niger (43.45 %), Syria (43.34%), Senegal (43.09%), Oman (40.84%), Lebanon(40.59%), Benin (39.86%), Mali (37.93%), Jordan (39.04%) , Togo (37.49%), United Arab Emirates (36.40%), Uzbekistan(35.88%), Yemen(35.82%), Iraq(34.99%), Iran(32.66%), Egypt(32.31%), Pakistan(31,03%), Chad(28.46%), Kyrgyzstan(27.66%), Kuwait (26.20%), Côte d'Ivoire(25.07%) and Azerbaijan(25%) .
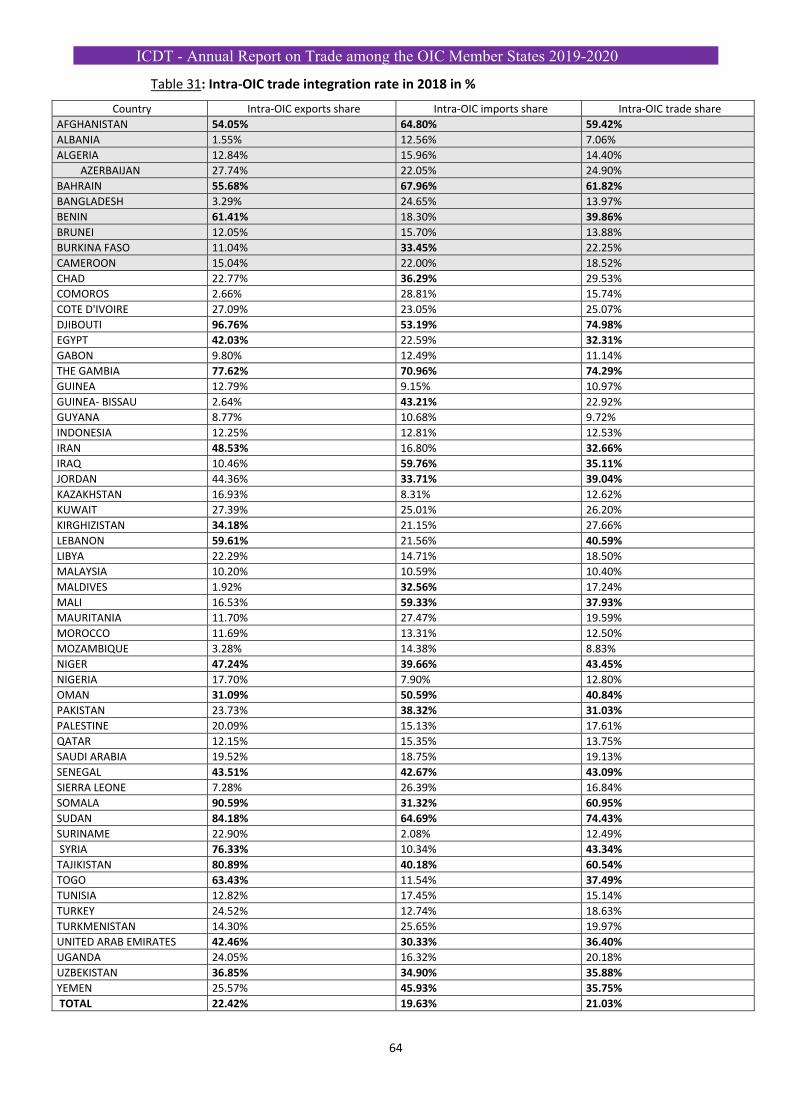
ICDT - Annual Report on Trade among the OIC Member States 2019-2020
64
Table 31: Intra‐OIC trade integration rate in 2018 in %
Country Intra‐OIC exports share Intra‐OIC imports share Intra‐OIC trade share
AFGHANISTAN 54.05% 64.80% 59.42%
ALBANIA 1.55% 12.56% 7.06%
ALGERIA 12.84% 15.96% 14.40%
AZERBAIJAN 27.74% 22.05% 24.90%
BAHRAIN 55.68% 67.96% 61.82%
BANGLADESH 3.29% 24.65% 13.97%
BENIN 61.41% 18.30% 39.86%
BRUNEI 12.05% 15.70% 13.88%
BURKINA FASO 11.04% 33.45% 22.25%
CAMEROON 15.04% 22.00% 18.52%
CHAD 22.77% 36.29% 29.53%
COMOROS 2.66% 28.81% 15.74%
COTE D'IVOIRE 27.09% 23.05% 25.07%
DJIBOUTI 96.76% 53.19% 74.98%
EGYPT 42.03% 22.59% 32.31%
GABON 9.80% 12.49% 11.14%
THE GAMBIA 77.62% 70.96% 74.29%
GUINEA 12.79% 9.15% 10.97%
GUINEA‐ BISSAU 2.64% 43.21% 22.92%
GUYANA 8.77% 10.68% 9.72%
INDONESIA 12.25% 12.81% 12.53%
IRAN 48.53% 16.80% 32.66%
IRAQ 10.46% 59.76% 35.11%
JORDAN 44.36% 33.71% 39.04%
KAZAKHSTAN 16.93% 8.31% 12.62%
KUWAIT 27.39% 25.01% 26.20%
KIRGHIZISTAN 34.18% 21.15% 27.66%
LEBANON 59.61% 21.56% 40.59%
LIBYA 22.29% 14.71% 18.50%
MALAYSIA 10.20% 10.59% 10.40%
MALDIVES 1.92% 32.56% 17.24%
MALI 16.53% 59.33% 37.93%
MAURITANIA 11.70% 27.47% 19.59%
MOROCCO 11.69% 13.31% 12.50%
MOZAMBIQUE 3.28% 14.38% 8.83%
NIGER 47.24% 39.66% 43.45%
NIGERIA 17.70% 7.90% 12.80%
OMAN 31.09% 50.59% 40.84%
PAKISTAN 23.73% 38.32% 31.03%
PALESTINE 20.09% 15.13% 17.61%
QATAR 12.15% 15.35% 13.75%
SAUDI ARABIA 19.52% 18.75% 19.13%
SENEGAL 43.51% 42.67% 43.09%
SIERRA LEONE 7.28% 26.39% 16.84%
SOMALA 90.59% 31.32% 60.95%
SUDAN 84.18% 64.69% 74.43%
SURINAME 22.90% 2.08% 12.49%
SYRIA 76.33% 10.34% 43.34%
TAJIKISTAN 80.89% 40.18% 60.54%
TOGO 63.43% 11.54% 37.49%
TUNISIA 12.82% 17.45% 15.14%
TURKEY 24.52% 12.74% 18.63%
TURKMENISTAN 14.30% 25.65% 19.97%
UNITED ARAB EMIRATES 42.46% 30.33% 36.40%
UGANDA 24.05% 16.32% 20.18%
UZBEKISTAN 36.85% 34.90% 35.88%
YEMEN 25.57% 45.93% 35.75%
TOTAL 22.42% 19.63% 21.03%
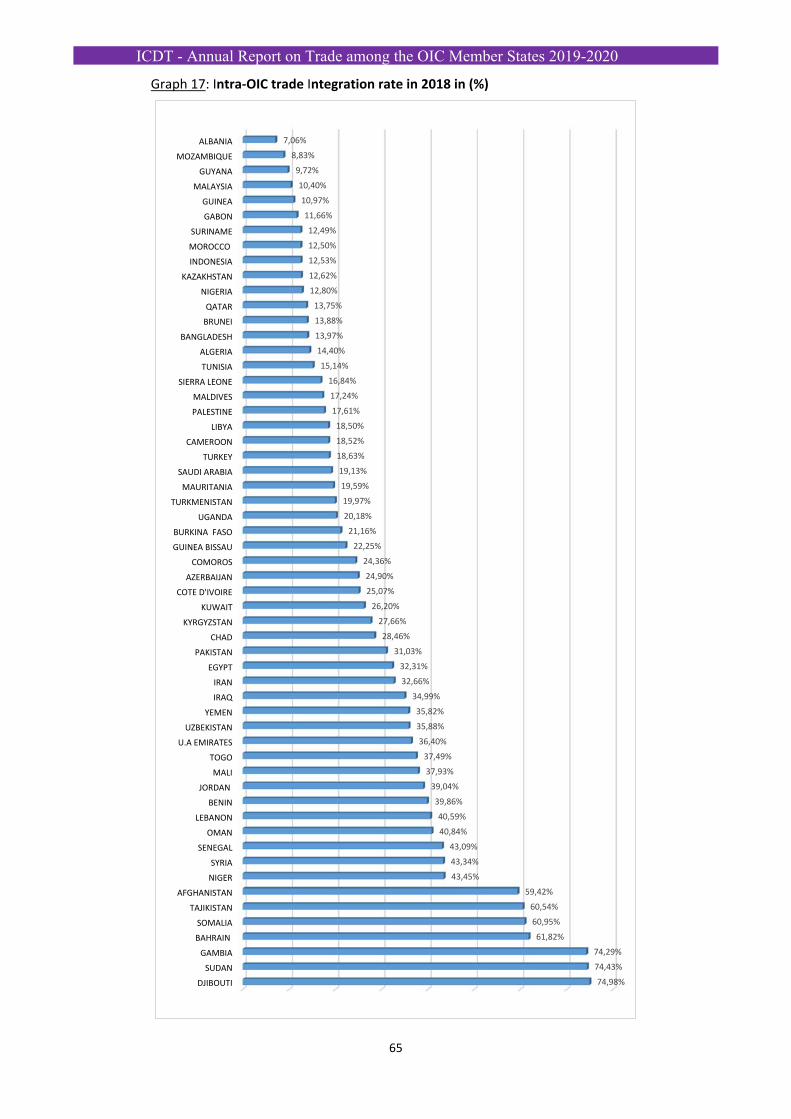
ICDT - Annual Report on Trade among the OIC Member States 2019-2020
65
Graph 17: Intra‐OIC trade Integration rate in 2018 in (%)
DJIBOUTI
SUDAN
GAMBIA
BAHRAIN
SOMALIA
TAJIKISTAN
AFGHANISTAN
NIGER
SYRIA
SENEGAL
OMAN
LEBANON
BENIN
JORDAN
MALI
TOGO
U.A EMIRATES
UZBEKISTAN
YEMEN
IRAQ
IRAN
EGYPT
PAKISTAN
CHAD
KYRGYZSTAN
KUWAIT
COTE D'IVOIRE
AZERBAIJAN
COMOROS
GUINEA BISSAU
BURKINA FASO
UGANDA
TURKMENISTAN
MAURITANIA
SAUDI ARABIA
TURKEY
CAMEROON
LIBYA
PALESTINE
MALDIVES
SIERRA LEONE
TUNISIA
ALGERIA
BANGLADESH
BRUNEI
QATAR
NIGERIA
KAZAKHSTAN
INDONESIA
MOROCCO
SURINAME
GABON
GUINEA
MALAYSIA
GUYANA
MOZAMBIQUE
ALBANIA
74,98%
74,43%
74,29%
61,82%
60,95%
60,54%
59,42%
43,45%
43,34%
43,09%
40,84%
40,59%
39,86%
39,04%
37,93%
37,49%
36,40%
35,88%
35,82%
34,99%
32,66%
32,31%
31,03%
28,46%
27,66%
26,20%
25,07%
24,90%
24,36%
22,25%
21,16%
20,18%
19,97%
19,59%
19,13%
18,63%
18,52%
18,50%
17,61%
17,24%
16,84%
15,14%
14,40%
13,97%
13,88%
13,75%
12,80%
12,62%
12,53%
12,50%
12,49%
11,66%
10,97%
10,40%
9,72%
8,83%
7,06%
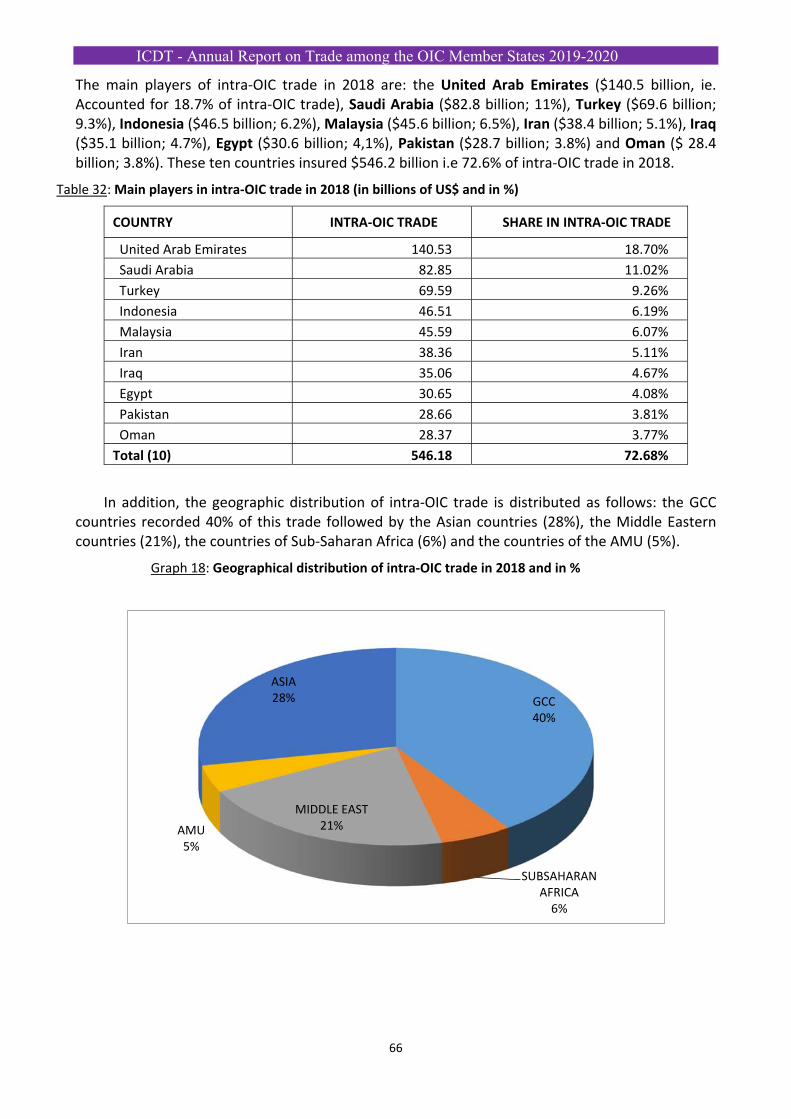
ICDT - Annual Report on Trade among the OIC Member States 2019-2020
66
The main players of intra‐OIC trade in 2018 are: the United Arab Emirates ($140.5 billion, ie. Accounted for 18.7% of intra‐OIC trade), Saudi Arabia ($82.8 billion; 11%), Turkey ($69.6 billion; 9.3%), Indonesia ($46.5 billion; 6.2%), Malaysia ($45.6 billion; 6.5%), Iran ($38.4 billion; 5.1%), Iraq ($35.1 billion; 4.7%), Egypt ($30.6 billion; 4,1%), Pakistan ($28.7 billion; 3.8%) and Oman ($ 28.4 billion; 3.8%). These ten countries insured $546.2 billion i.e 72.6% of intra‐OIC trade in 2018.
Table 32: Main players in intra‐OIC trade in 2018 (in billions of US$ and in %)
COUNTRY INTRA‐OIC TRADE SHARE IN INTRA‐OIC TRADE
United Arab Emirates 140.53 18.70%
Saudi Arabia 82.85 11.02%
Turkey 69.59 9.26%
Indonesia 46.51 6.19%
Malaysia 45.59 6.07%
Iran 38.36 5.11%
Iraq 35.06 4.67%
Egypt 30.65 4.08%
Pakistan 28.66 3.81%
Oman 28.37 3.77%
Total (10) 546.18 72.68%
In addition, the geographic distribution of intra‐OIC trade is distributed as follows: the GCC countries recorded 40% of this trade followed by the Asian countries (28%), the Middle Eastern countries (21%), the countries of Sub‐Saharan Africa (6%) and the countries of the AMU (5%).
Graph 18: Geographical distribution of intra‐OIC trade in 2018 and in %
GCC40%
SUBSAHARAN AFRICA6%
MIDDLE EAST21%AMU
5%
ASIA28%
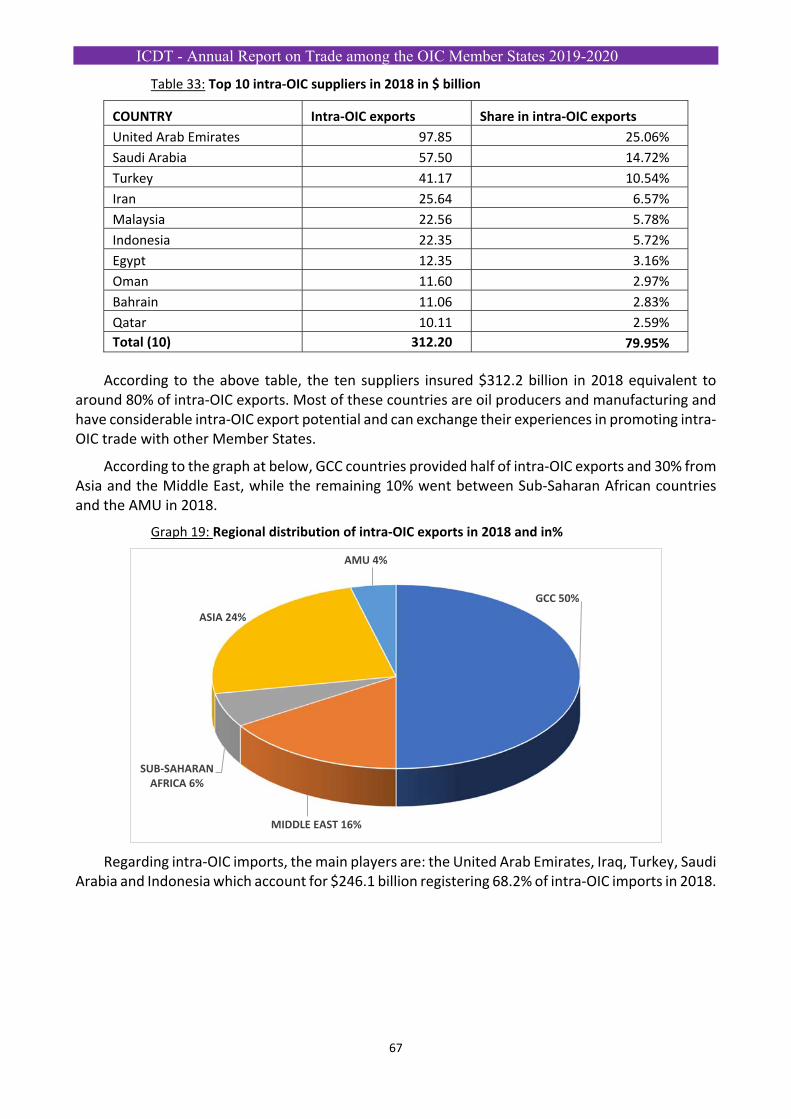
ICDT - Annual Report on Trade among the OIC Member States 2019-2020
67
Table 33: Top 10 intra‐OIC suppliers in 2018 in $ billion
COUNTRY Intra‐OIC exports Share in intra‐OIC exports
United Arab Emirates 97.85 25.06%
Saudi Arabia 57.50 14.72%
Turkey 41.17 10.54%
Iran 25.64 6.57%
Malaysia 22.56 5.78%
Indonesia 22.35 5.72%
Egypt 12.35 3.16%
Oman 11.60 2.97%
Bahrain 11.06 2.83%
Qatar 10.11 2.59%
Total (10) 312.20 79.95%
According to the above table, the ten suppliers insured $312.2 billion in 2018 equivalent to around 80% of intra‐OIC exports. Most of these countries are oil producers and manufacturing and have considerable intra‐OIC export potential and can exchange their experiences in promoting intra‐OIC trade with other Member States.
According to the graph at below, GCC countries provided half of intra‐OIC exports and 30% from Asia and the Middle East, while the remaining 10% went between Sub‐Saharan African countries and the AMU in 2018.
Graph 19: Regional distribution of intra‐OIC exports in 2018 and in%
Regarding intra‐OIC imports, the main players are: the United Arab Emirates, Iraq, Turkey, Saudi Arabia and Indonesia which account for $246.1 billion registering 68.2% of intra‐OIC imports in 2018.
GCC 50%
MIDDLE EAST 16%
SUB‐SAHARAN AFRICA 6%
ASIA 24%
AMU 4%
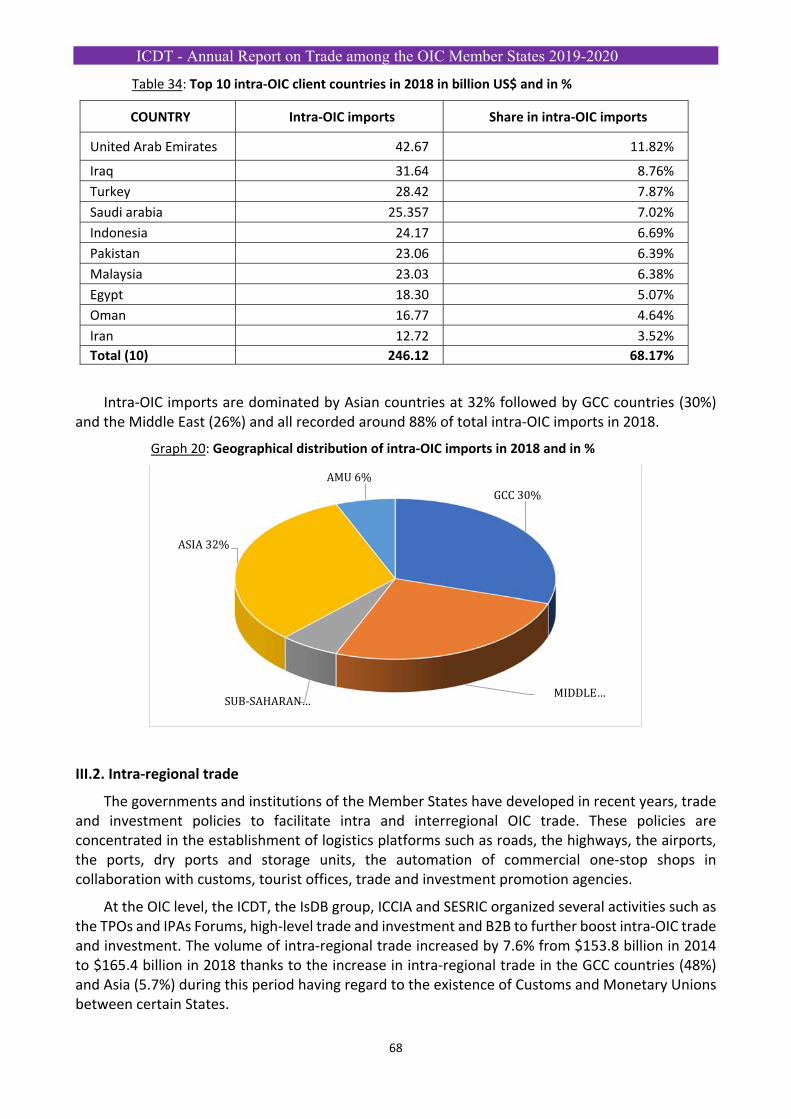
ICDT - Annual Report on Trade among the OIC Member States 2019-2020
68
Table 34: Top 10 intra‐OIC client countries in 2018 in billion US$ and in %
COUNTRY Intra‐OIC imports Share in intra‐OIC imports
United Arab Emirates 42.67 11.82%
Iraq 31.64 8.76%
Turkey 28.42 7.87%
Saudi arabia 25.357 7.02%
Indonesia 24.17 6.69%
Pakistan 23.06 6.39%
Malaysia 23.03 6.38%
Egypt 18.30 5.07%
Oman 16.77 4.64%
Iran 12.72 3.52%
Total (10) 246.12 68.17%
Intra‐OIC imports are dominated by Asian countries at 32% followed by GCC countries (30%) and the Middle East (26%) and all recorded around 88% of total intra‐OIC imports in 2018.
Graph 20: Geographical distribution of intra‐OIC imports in 2018 and in %
III.2. Intra‐regional trade
The governments and institutions of the Member States have developed in recent years, trade and investment policies to facilitate intra and interregional OIC trade. These policies are concentrated in the establishment of logistics platforms such as roads, the highways, the airports, the ports, dry ports and storage units, the automation of commercial one‐stop shops in collaboration with customs, tourist offices, trade and investment promotion agencies.
At the OIC level, the ICDT, the IsDB group, ICCIA and SESRIC organized several activities such as the TPOs and IPAs Forums, high‐level trade and investment and B2B to further boost intra‐OIC trade and investment. The volume of intra‐regional trade increased by 7.6% from $153.8 billion in 2014 to $165.4 billion in 2018 thanks to the increase in intra‐regional trade in the GCC countries (48%) and Asia (5.7%) during this period having regard to the existence of Customs and Monetary Unions between certain States.
GCC 30%
MIDDLE …SUB-SAHARAN …
ASIA 32%
AMU 6%
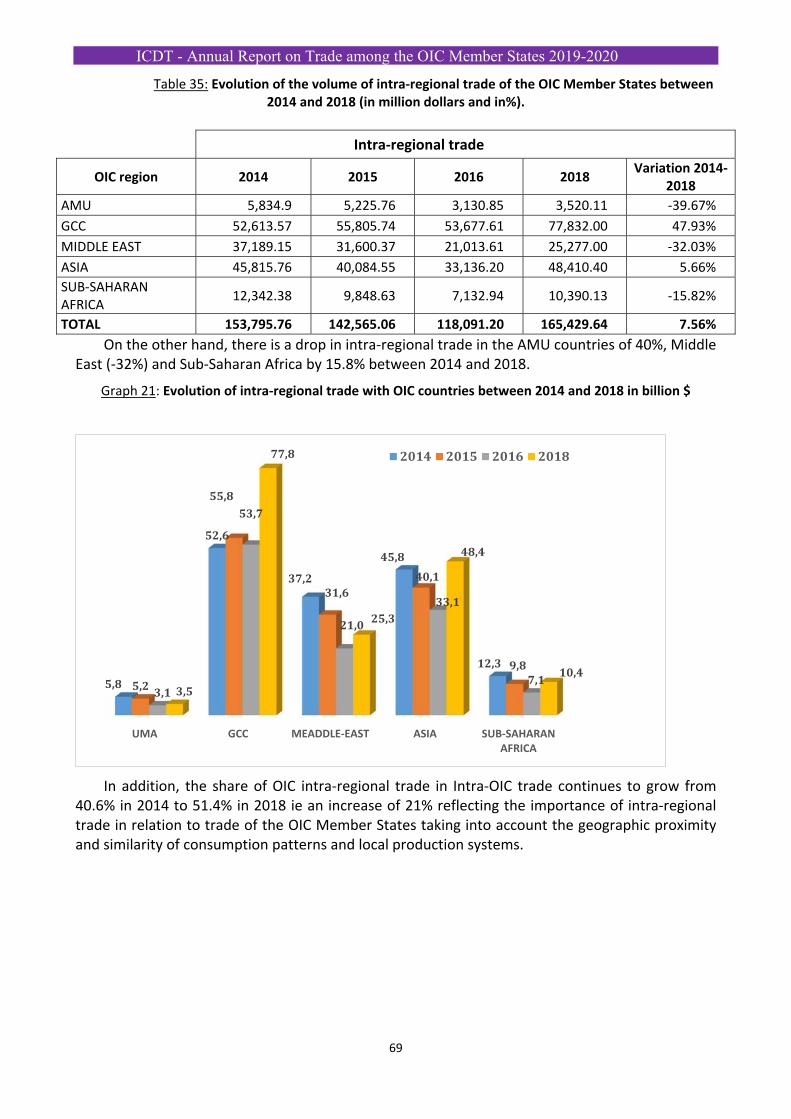
ICDT - Annual Report on Trade among the OIC Member States 2019-2020
69
Table 35: Evolution of the volume of intra‐regional trade of the OIC Member States between 2014 and 2018 (in million dollars and in%).
On the other hand, there is a drop in intra‐regional trade in the AMU countries of 40%, Middle East (‐32%) and Sub‐Saharan Africa by 15.8% between 2014 and 2018.
Graph 21: Evolution of intra‐regional trade with OIC countries between 2014 and 2018 in billion $
In addition, the share of OIC intra‐regional trade in Intra‐OIC trade continues to grow from 40.6% in 2014 to 51.4% in 2018 ie an increase of 21% reflecting the importance of intra‐regional trade in relation to trade of the OIC Member States taking into account the geographic proximity and similarity of consumption patterns and local production systems.
UMA GCC MEADDLE‐EAST ASIA SUB‐SAHARANAFRICA
5,8
52,6
37,2
45,8
12,3
5,2
55,8
31,640,1
9,8
3,1
53,7
21,0
33,1
7,13,5
77,8
25,3
48,4
10,4
2014 2015 2016 2018
Intra‐regional trade
OIC region 2014 2015 2016 2018 Variation 2014‐
2018
AMU 5,834.9 5,225.76 3,130.85 3,520.11 ‐39.67%
GCC 52,613.57 55,805.74 53,677.61 77,832.00 47.93%
MIDDLE EAST 37,189.15 31,600.37 21,013.61 25,277.00 ‐32.03%
ASIA 45,815.76 40,084.55 33,136.20 48,410.40 5.66%
SUB‐SAHARAN AFRICA
12,342.38 9,848.63 7,132.94 10,390.13 ‐15.82%
TOTAL 153,795.76 142,565.06 118,091.20 165,429.64 7.56%
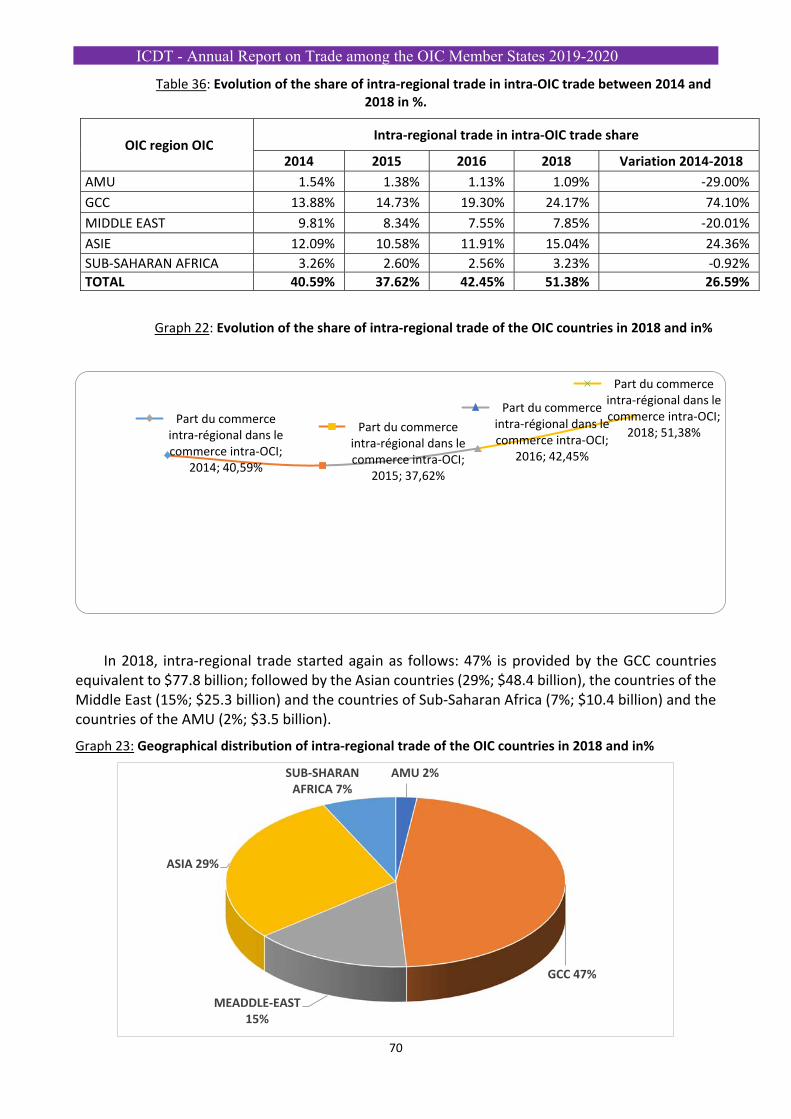
ICDT - Annual Report on Trade among the OIC Member States 2019-2020
70
Table 36: Evolution of the share of intra‐regional trade in intra‐OIC trade between 2014 and 2018 in %.
OIC region OIC Intra‐regional trade in intra‐OIC trade share
2014 2015 2016 2018 Variation 2014‐2018
AMU 1.54% 1.38% 1.13% 1.09% ‐29.00%
GCC 13.88% 14.73% 19.30% 24.17% 74.10%
MIDDLE EAST 9.81% 8.34% 7.55% 7.85% ‐20.01%
ASIE 12.09% 10.58% 11.91% 15.04% 24.36%
SUB‐SAHARAN AFRICA 3.26% 2.60% 2.56% 3.23% ‐0.92%
TOTAL 40.59% 37.62% 42.45% 51.38% 26.59%
Graph 22: Evolution of the share of intra‐regional trade of the OIC countries in 2018 and in%
In 2018, intra‐regional trade started again as follows: 47% is provided by the GCC countries equivalent to $77.8 billion; followed by the Asian countries (29%; $48.4 billion), the countries of the Middle East (15%; $25.3 billion) and the countries of Sub‐Saharan Africa (7%; $10.4 billion) and the countries of the AMU (2%; $3.5 billion).
Graph 23: Geographical distribution of intra‐regional trade of the OIC countries in 2018 and in%
Part du commerce intra‐régional dans le commerce intra‐OCI;
2014; 40,59%
Part du commerce intra‐régional dans le commerce intra‐OCI;
2015; 37,62%
Part du commerce intra‐régional dans le commerce intra‐OCI;
2016; 42,45%
Part du commerce intra‐régional dans le commerce intra‐OCI;
2018; 51,38%
AMU 2%
GCC 47%
MEADDLE‐EAST15%
ASIA 29%
SUB‐SHARAN AFRICA 7%
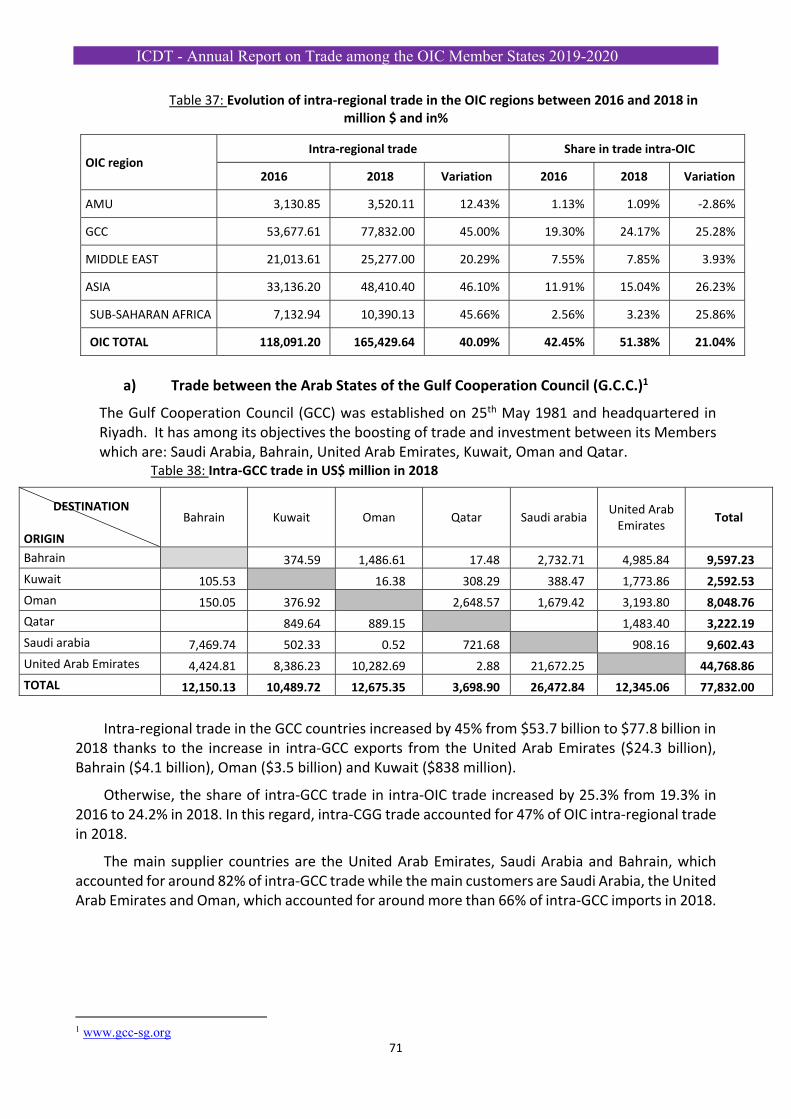
ICDT - Annual Report on Trade among the OIC Member States 2019-2020
71
Table 37: Evolution of intra‐regional trade in the OIC regions between 2016 and 2018 in million $ and in%
OIC region Intra‐regional trade Share in trade intra‐OIC
2016 2018 Variation 2016 2018 Variation
AMU 3,130.85 3,520.11 12.43% 1.13% 1.09% ‐2.86%
GCC 53,677.61 77,832.00 45.00% 19.30% 24.17% 25.28%
MIDDLE EAST 21,013.61 25,277.00 20.29% 7.55% 7.85% 3.93%
ASIA 33,136.20 48,410.40 46.10% 11.91% 15.04% 26.23%
SUB‐SAHARAN AFRICA 7,132.94 10,390.13 45.66% 2.56% 3.23% 25.86%
OIC TOTAL 118,091.20 165,429.64 40.09% 42.45% 51.38% 21.04%
a) Trade between the Arab States of the Gulf Cooperation Council (G.C.C.)1
The Gulf Cooperation Council (GCC) was established on 25th May 1981 and headquartered in Riyadh. It has among its objectives the boosting of trade and investment between its Members which are: Saudi Arabia, Bahrain, United Arab Emirates, Kuwait, Oman and Qatar.
Table 38: Intra‐GCC trade in US$ million in 2018
DESTINATION
ORIGIN
Bahrain Kuwait Oman Qatar Saudi arabia United Arab Emirates
Total
Bahrain 374.59 1,486.61 17.48 2,732.71 4,985.84 9,597.23
Kuwait 105.53 16.38 308.29 388.47 1,773.86 2,592.53
Oman 150.05 376.92 2,648.57 1,679.42 3,193.80 8,048.76
Qatar 849.64 889.15 1,483.40 3,222.19
Saudi arabia 7,469.74 502.33 0.52 721.68 908.16 9,602.43
United Arab Emirates 4,424.81 8,386.23 10,282.69 2.88 21,672.25 44,768.86
TOTAL 12,150.13 10,489.72 12,675.35 3,698.90 26,472.84 12,345.06 77,832.00
Intra‐regional trade in the GCC countries increased by 45% from $53.7 billion to $77.8 billion in 2018 thanks to the increase in intra‐GCC exports from the United Arab Emirates ($24.3 billion), Bahrain ($4.1 billion), Oman ($3.5 billion) and Kuwait ($838 million).
Otherwise, the share of intra‐GCC trade in intra‐OIC trade increased by 25.3% from 19.3% in 2016 to 24.2% in 2018. In this regard, intra‐CGG trade accounted for 47% of OIC intra‐regional trade in 2018.
The main supplier countries are the United Arab Emirates, Saudi Arabia and Bahrain, which accounted for around 82% of intra‐GCC trade while the main customers are Saudi Arabia, the United Arab Emirates and Oman, which accounted for around more than 66% of intra‐GCC imports in 2018.
1 www.gcc-sg.org
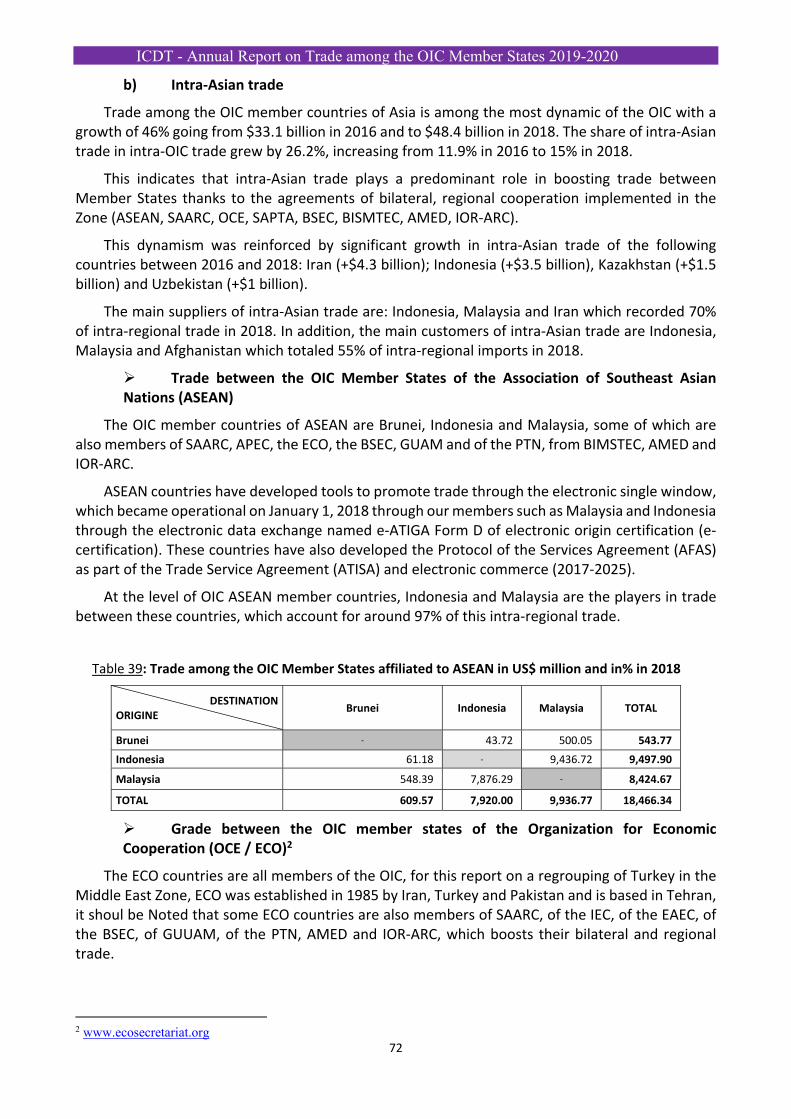
ICDT - Annual Report on Trade among the OIC Member States 2019-2020
72
b) Intra‐Asian trade
Trade among the OIC member countries of Asia is among the most dynamic of the OIC with a growth of 46% going from $33.1 billion in 2016 and to $48.4 billion in 2018. The share of intra‐Asian trade in intra‐OIC trade grew by 26.2%, increasing from 11.9% in 2016 to 15% in 2018.
This indicates that intra‐Asian trade plays a predominant role in boosting trade between Member States thanks to the agreements of bilateral, regional cooperation implemented in the Zone (ASEAN, SAARC, OCE, SAPTA, BSEC, BISMTEC, AMED, IOR‐ARC).
This dynamism was reinforced by significant growth in intra‐Asian trade of the following countries between 2016 and 2018: Iran (+$4.3 billion); Indonesia (+$3.5 billion), Kazakhstan (+$1.5 billion) and Uzbekistan (+$1 billion).
The main suppliers of intra‐Asian trade are: Indonesia, Malaysia and Iran which recorded 70% of intra‐regional trade in 2018. In addition, the main customers of intra‐Asian trade are Indonesia, Malaysia and Afghanistan which totaled 55% of intra‐regional imports in 2018.
Trade between the OIC Member States of the Association of Southeast Asian Nations (ASEAN)
The OIC member countries of ASEAN are Brunei, Indonesia and Malaysia, some of which are also members of SAARC, APEC, the ECO, the BSEC, GUAM and of the PTN, from BIMSTEC, AMED and IOR‐ARC.
ASEAN countries have developed tools to promote trade through the electronic single window, which became operational on January 1, 2018 through our members such as Malaysia and Indonesia through the electronic data exchange named e‐ATIGA Form D of electronic origin certification (e‐certification). These countries have also developed the Protocol of the Services Agreement (AFAS) as part of the Trade Service Agreement (ATISA) and electronic commerce (2017‐2025).
At the level of OIC ASEAN member countries, Indonesia and Malaysia are the players in trade between these countries, which account for around 97% of this intra‐regional trade.
Table 39: Trade among the OIC Member States affiliated to ASEAN in US$ million and in% in 2018
DESTINATION ORIGINE
Brunei Indonesia Malaysia TOTAL
Brunei ‐ 43.72 500.05 543.77
Indonesia 61.18 ‐ 9,436.72 9,497.90
Malaysia 548.39 7,876.29 ‐ 8,424.67
TOTAL 609.57 7,920.00 9,936.77 18,466.34
Grade between the OIC member states of the Organization for Economic Cooperation (OCE / ECO)2
The ECO countries are all members of the OIC, for this report on a regrouping of Turkey in the Middle East Zone, ECO was established in 1985 by Iran, Turkey and Pakistan and is based in Tehran, it shoul be Noted that some ECO countries are also members of SAARC, of the IEC, of the EAEC, of the BSEC, of GUUAM, of the PTN, AMED and IOR‐ARC, which boosts their bilateral and regional trade.
2 www.ecosecretariat.org
ICDT - Annual Report on Trade among the OIC Member States 2019-2020
73
The aim of ECO is to create an FTA between its members by removing all barriers to intra‐ECO trade and investment, During the ECOTA meeting from 18 to 19 August 2019, the Member States decided to double intra‐ECO trade to reach 16% in 2025.
Intra‐ECO exports recorded a value of $9.2 billion in 2016 against $16.6 billion in 2018 i.e an increase of 80% reinforced by the increase, among others, intra‐ECO exports during this period from Iran (+$3.4 billion), Uzbekistan (+$1.3 billion), Kazakhstan ($1.2 billion) and Afghanistan (+$519 million).
In addition, the most integrated in this region are: Iran, Kazakhstan and Uzbekistan which totalled around 72% of intra‐ECO exports in 2018.
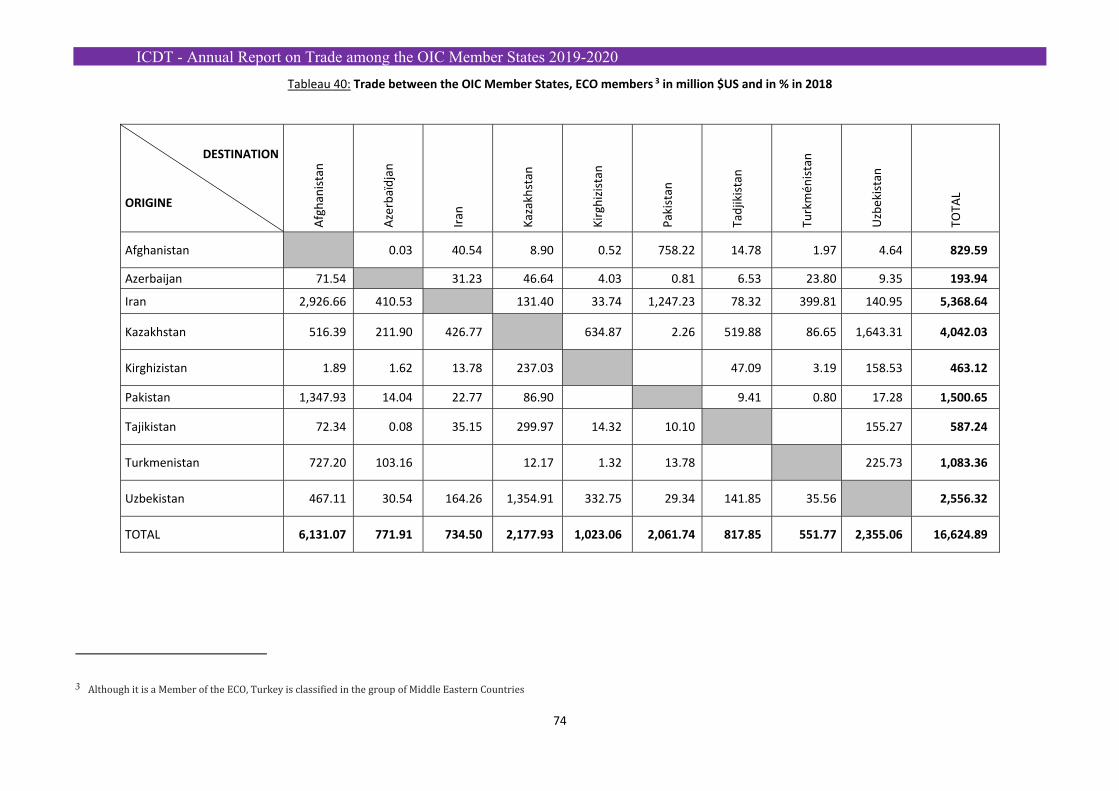
ICDT - Annual Report on Trade among the OIC Member States 2019-2020
74
Tableau 40: Trade between the OIC Member States, ECO members 3 in million $US and in % in 2018
DESTINATION
ORIGINE
Afghan
istan
Azerbaïdjan
Iran
Kazakhstan
Kirgh
izistan
Pakistan
Tadjikistan
Turkmén
istan
Uzbekistan
TOTA
L
Afghanistan 0.03 40.54 8.90 0.52 758.22 14.78 1.97 4.64 829.59
Azerbaijan 71.54 31.23 46.64 4.03 0.81 6.53 23.80 9.35 193.94
Iran 2,926.66 410.53 131.40 33.74 1,247.23 78.32 399.81 140.95 5,368.64
Kazakhstan 516.39 211.90 426.77 634.87 2.26 519.88 86.65 1,643.31 4,042.03
Kirghizistan 1.89 1.62 13.78 237.03 47.09 3.19 158.53 463.12
Pakistan 1,347.93 14.04 22.77 86.90 9.41 0.80 17.28 1,500.65
Tajikistan 72.34 0.08 35.15 299.97 14.32 10.10 155.27 587.24
Turkmenistan 727.20 103.16 12.17 1.32 13.78 225.73 1,083.36
Uzbekistan 467.11 30.54 164.26 1,354.91 332.75 29.34 141.85 35.56 2,556.32
TOTAL 6,131.07 771.91 734.50 2,177.93 1,023.06 2,061.74 817.85 551.77 2,355.06 16,624.89
3 Although it is a Member of the ECO, Turkey is classified in the group of Middle Eastern Countries
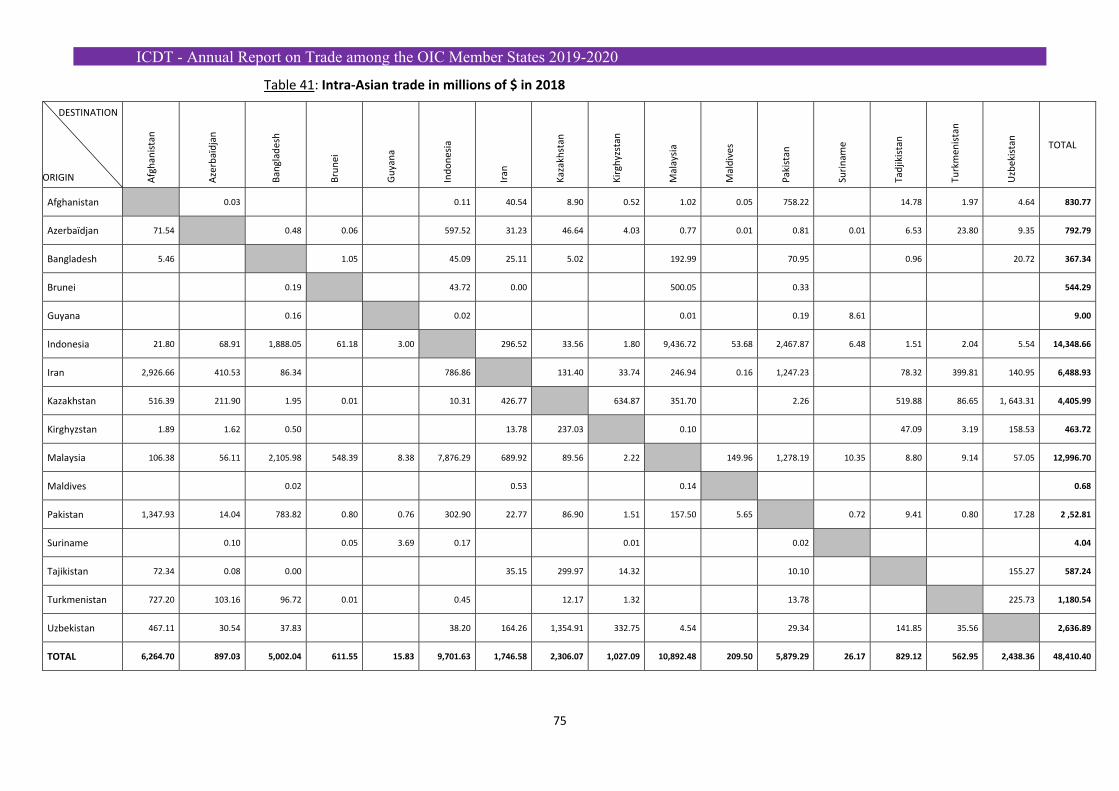
ICDT - Annual Report on Trade among the OIC Member States 2019-2020
75
Table 41: Intra‐Asian trade in millions of $ in 2018
DESTINATION
ORIGIN Afghan
istan
Azerbaïdjan
Ban
glad
esh
Brunei
Guyana
Indonesia
Iran
Kazakhstan
Kirgh
yzstan
Malaysia
Maldives
Pakistan
Surinam
e
Tadjikistan
Turkmen
istan
Uzbekistan
TOTAL
Afghanistan 0.03 0.11 40.54 8.90 0.52 1.02 0.05 758.22 14.78 1.97 4.64 830.77
Azerbaïdjan 71.54 0.48 0.06 597.52 31.23 46.64 4.03 0.77 0.01 0.81 0.01 6.53 23.80 9.35 792.79
Bangladesh 5.46 1.05 45.09 25.11 5.02 192.99 70.95 0.96 20.72 367.34
Brunei 0.19 43.72 0.00 500.05 0.33 544.29
Guyana 0.16 0.02 0.01 0.19 8.61 9.00
Indonesia 21.80 68.91 1,888.05 61.18 3.00 296.52 33.56 1.80 9,436.72 53.68 2,467.87 6.48 1.51 2.04 5.54 14,348.66
Iran 2,926.66 410.53 86.34 786.86 131.40 33.74 246.94 0.16 1,247.23 78.32 399.81 140.95 6,488.93
Kazakhstan 516.39 211.90 1.95 0.01 10.31 426.77 634.87 351.70 2.26 519.88 86.65 1, 643.31 4,405.99
Kirghyzstan 1.89 1.62 0.50 13.78 237.03 0.10 47.09 3.19 158.53 463.72
Malaysia 106.38 56.11 2,105.98 548.39 8.38 7,876.29 689.92 89.56 2.22 149.96 1,278.19 10.35 8.80 9.14 57.05 12,996.70
Maldives 0.02 0.53 0.14 0.68
Pakistan 1,347.93 14.04 783.82 0.80 0.76 302.90 22.77 86.90 1.51 157.50 5.65 0.72 9.41 0.80 17.28 2 ,52.81
Suriname 0.10 0.05 3.69 0.17 0.01 0.02 4.04
Tajikistan 72.34 0.08 0.00 35.15 299.97 14.32 10.10 155.27 587.24
Turkmenistan 727.20 103.16 96.72 0.01 0.45 12.17 1.32 13.78 225.73 1,180.54
Uzbekistan 467.11 30.54 37.83 38.20 164.26 1,354.91 332.75 4.54 29.34 141.85 35.56 2,636.89
TOTAL 6,264.70 897.03 5,002.04 611.55 15.83 9,701.63 1,746.58 2,306.07 1,027.09 10,892.48 209.50 5,879.29 26.17 829.12 562.95 2,438.36 48,410.40
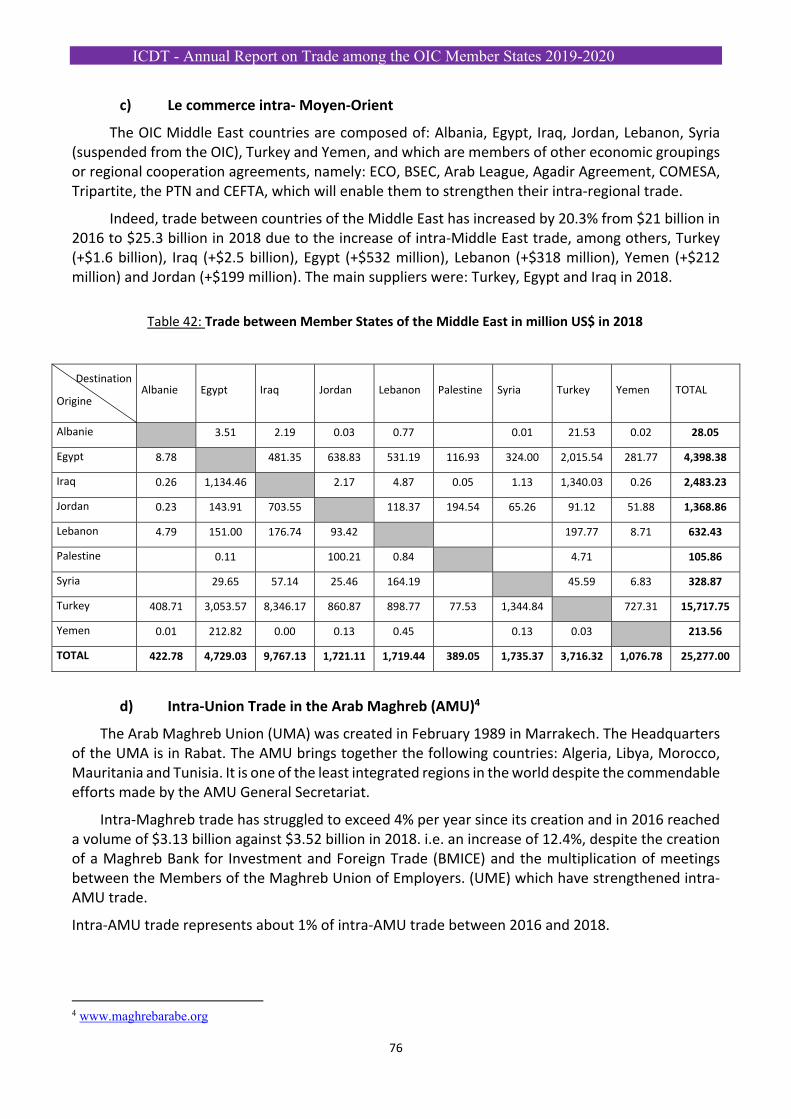
ICDT - Annual Report on Trade among the OIC Member States 2019-2020
76
c) Le commerce intra‐ Moyen‐Orient
The OIC Middle East countries are composed of: Albania, Egypt, Iraq, Jordan, Lebanon, Syria (suspended from the OIC), Turkey and Yemen, and which are members of other economic groupings or regional cooperation agreements, namely: ECO, BSEC, Arab League, Agadir Agreement, COMESA, Tripartite, the PTN and CEFTA, which will enable them to strengthen their intra‐regional trade.
Indeed, trade between countries of the Middle East has increased by 20.3% from $21 billion in 2016 to $25.3 billion in 2018 due to the increase of intra‐Middle East trade, among others, Turkey (+$1.6 billion), Iraq (+$2.5 billion), Egypt (+$532 million), Lebanon (+$318 million), Yemen (+$212 million) and Jordan (+$199 million). The main suppliers were: Turkey, Egypt and Iraq in 2018.
Table 42: Trade between Member States of the Middle East in million US$ in 2018
Destination
Origine Albanie Egypt Iraq Jordan Lebanon Palestine Syria Turkey Yemen TOTAL
Albanie
3.51 2.19 0.03 0.77 0.01 21.53 0.02 28.05
Egypt 8.78
481.35 638.83 531.19 116.93 324.00 2,015.54 281.77 4,398.38
Iraq 0.26 1,134.46
2.17 4.87 0.05 1.13 1,340.03 0.26 2,483.23
Jordan 0.23 143.91 703.55
118.37 194.54 65.26 91.12 51.88 1,368.86
Lebanon 4.79 151.00 176.74 93.42
197.77 8.71 632.43
Palestine 0.11 100.21 0.84
4.71 105.86
Syria 29.65 57.14 25.46 164.19
45.59 6.83 328.87
Turkey 408.71 3,053.57 8,346.17 860.87 898.77 77.53 1,344.84
727.31 15,717.75
Yemen 0.01 212.82 0.00 0.13 0.45 0.13 0.03
213.56
TOTAL 422.78 4,729.03 9,767.13 1,721.11 1,719.44 389.05 1,735.37 3,716.32 1,076.78 25,277.00
d) Intra‐Union Trade in the Arab Maghreb (AMU)4
The Arab Maghreb Union (UMA) was created in February 1989 in Marrakech. The Headquarters of the UMA is in Rabat. The AMU brings together the following countries: Algeria, Libya, Morocco, Mauritania and Tunisia. It is one of the least integrated regions in the world despite the commendable efforts made by the AMU General Secretariat.
Intra‐Maghreb trade has struggled to exceed 4% per year since its creation and in 2016 reached a volume of $3.13 billion against $3.52 billion in 2018. i.e. an increase of 12.4%, despite the creation of a Maghreb Bank for Investment and Foreign Trade (BMICE) and the multiplication of meetings between the Members of the Maghreb Union of Employers. (UME) which have strengthened intra‐AMU trade.
Intra‐AMU trade represents about 1% of intra‐AMU trade between 2016 and 2018.
4 www.maghrebarabe.org
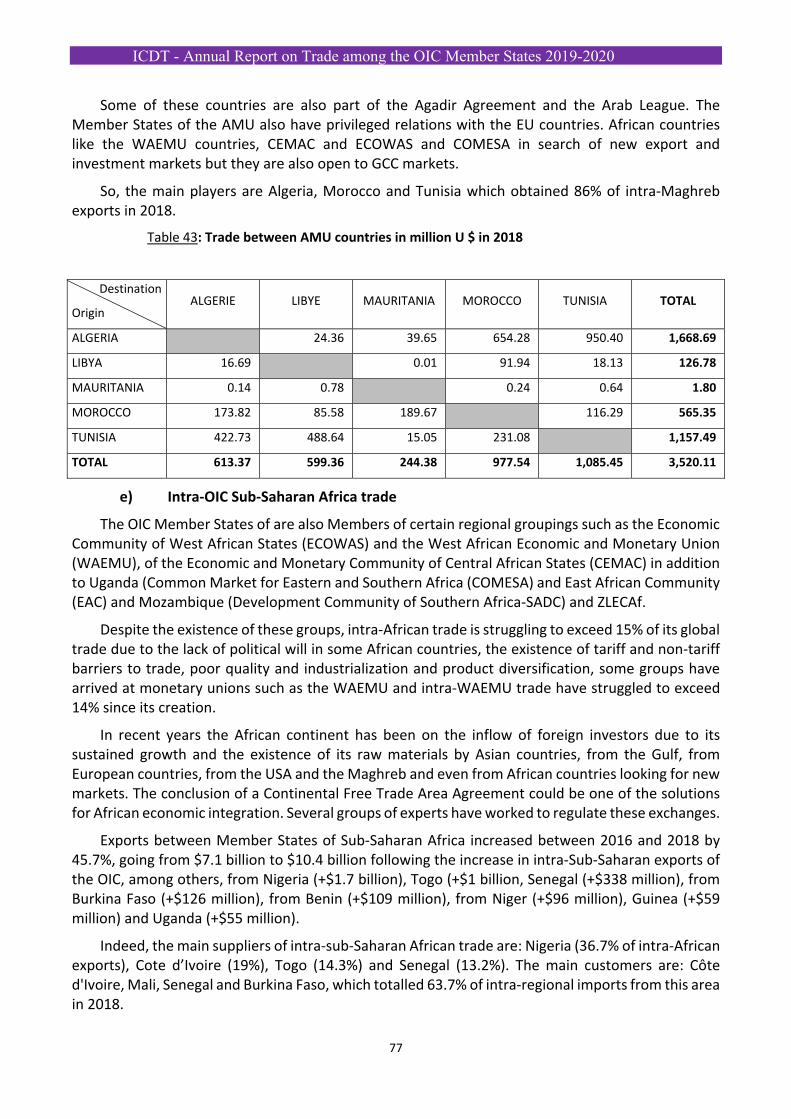
ICDT - Annual Report on Trade among the OIC Member States 2019-2020
77
Some of these countries are also part of the Agadir Agreement and the Arab League. The Member States of the AMU also have privileged relations with the EU countries. African countries like the WAEMU countries, CEMAC and ECOWAS and COMESA in search of new export and investment markets but they are also open to GCC markets.
So, the main players are Algeria, Morocco and Tunisia which obtained 86% of intra‐Maghreb exports in 2018.
Table 43: Trade between AMU countries in million U $ in 2018
Destination
Origin ALGERIE LIBYE MAURITANIA MOROCCO TUNISIA TOTAL
ALGERIA 24.36 39.65 654.28 950.40 1,668.69
LIBYA 16.69 0.01 91.94 18.13 126.78
MAURITANIA 0.14 0.78 0.24 0.64 1.80
MOROCCO 173.82 85.58 189.67 116.29 565.35
TUNISIA 422.73 488.64 15.05 231.08 1,157.49
TOTAL 613.37 599.36 244.38 977.54 1,085.45 3,520.11
e) Intra‐OIC Sub‐Saharan Africa trade
The OIC Member States of are also Members of certain regional groupings such as the Economic Community of West African States (ECOWAS) and the West African Economic and Monetary Union (WAEMU), of the Economic and Monetary Community of Central African States (CEMAC) in addition to Uganda (Common Market for Eastern and Southern Africa (COMESA) and East African Community (EAC) and Mozambique (Development Community of Southern Africa‐SADC) and ZLECAf.
Despite the existence of these groups, intra‐African trade is struggling to exceed 15% of its global trade due to the lack of political will in some African countries, the existence of tariff and non‐tariff barriers to trade, poor quality and industrialization and product diversification, some groups have arrived at monetary unions such as the WAEMU and intra‐WAEMU trade have struggled to exceed 14% since its creation.
In recent years the African continent has been on the inflow of foreign investors due to its sustained growth and the existence of its raw materials by Asian countries, from the Gulf, from European countries, from the USA and the Maghreb and even from African countries looking for new markets. The conclusion of a Continental Free Trade Area Agreement could be one of the solutions for African economic integration. Several groups of experts have worked to regulate these exchanges.
Exports between Member States of Sub‐Saharan Africa increased between 2016 and 2018 by 45.7%, going from $7.1 billion to $10.4 billion following the increase in intra‐Sub‐Saharan exports of the OIC, among others, from Nigeria (+$1.7 billion), Togo (+$1 billion, Senegal (+$338 million), from Burkina Faso (+$126 million), from Benin (+$109 million), from Niger (+$96 million), Guinea (+$59 million) and Uganda (+$55 million).
Indeed, the main suppliers of intra‐sub‐Saharan African trade are: Nigeria (36.7% of intra‐African exports), Cote d’Ivoire (19%), Togo (14.3%) and Senegal (13.2%). The main customers are: Côte d'Ivoire, Mali, Senegal and Burkina Faso, which totalled 63.7% of intra‐regional imports from this area in 2018.
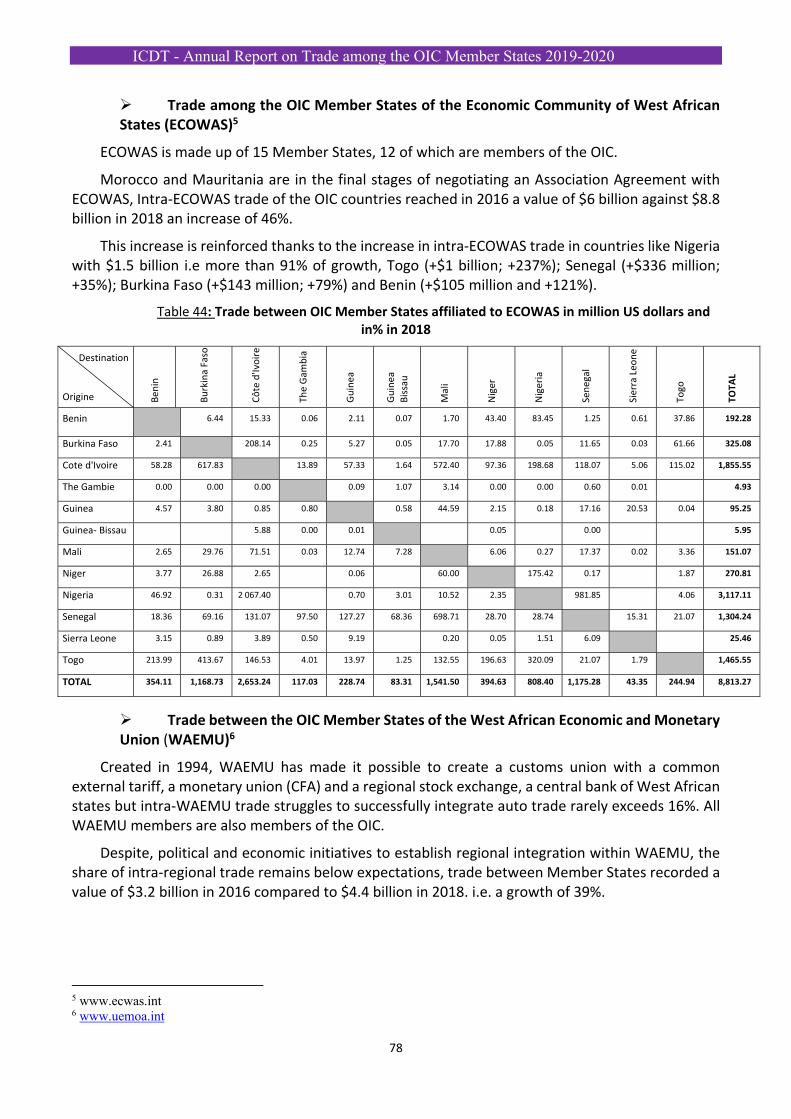
ICDT - Annual Report on Trade among the OIC Member States 2019-2020
78
Trade among the OIC Member States of the Economic Community of West African States (ECOWAS)5
ECOWAS is made up of 15 Member States, 12 of which are members of the OIC.
Morocco and Mauritania are in the final stages of negotiating an Association Agreement with ECOWAS, Intra‐ECOWAS trade of the OIC countries reached in 2016 a value of $6 billion against $8.8 billion in 2018 an increase of 46%.
This increase is reinforced thanks to the increase in intra‐ECOWAS trade in countries like Nigeria with $1.5 billion i.e more than 91% of growth, Togo (+$1 billion; +237%); Senegal (+$336 million; +35%); Burkina Faso (+$143 million; +79%) and Benin (+$105 million and +121%).
Table 44: Trade between OIC Member States affiliated to ECOWAS in million US dollars and in% in 2018
Destination
Origine B
enin
Burkina Faso
Côte d'Ivoire
The Gam
bia
Guinea
Guinea
Bissau
Mali
Niger
Nigeria
Senegal
Sierra Leo
ne
Togo
TOTA
L
Benin 6.44 15.33 0.06 2.11 0.07 1.70 43.40 83.45 1.25 0.61 37.86 192.28
Burkina Faso 2.41 208.14 0.25 5.27 0.05 17.70 17.88 0.05 11.65 0.03 61.66 325.08
Cote d'Ivoire 58.28 617.83 13.89 57.33 1.64 572.40 97.36 198.68 118.07 5.06 115.02 1,855.55
The Gambie 0.00 0.00 0.00 0.09 1.07 3.14 0.00 0.00 0.60 0.01 4.93
Guinea 4.57 3.80 0.85 0.80 0.58 44.59 2.15 0.18 17.16 20.53 0.04 95.25
Guinea‐ Bissau 5.88 0.00 0.01 0.05 0.00 5.95
Mali 2.65 29.76 71.51 0.03 12.74 7.28 6.06 0.27 17.37 0.02 3.36 151.07
Niger 3.77 26.88 2.65 0.06 60.00 175.42 0.17 1.87 270.81
Nigeria 46.92 0.31 2 067.40 0.70 3.01 10.52 2.35 981.85 4.06 3,117.11
Senegal 18.36 69.16 131.07 97.50 127.27 68.36 698.71 28.70 28.74 15.31 21.07 1,304.24
Sierra Leone 3.15 0.89 3.89 0.50 9.19 0.20 0.05 1.51 6.09 25.46
Togo 213.99 413.67 146.53 4.01 13.97 1.25 132.55 196.63 320.09 21.07 1.79 1,465.55
TOTAL 354.11 1,168.73 2,653.24 117.03 228.74 83.31 1,541.50 394.63 808.40 1,175.28 43.35 244.94 8,813.27
Trade between the OIC Member States of the West African Economic and Monetary Union (WAEMU)6
Created in 1994, WAEMU has made it possible to create a customs union with a common external tariff, a monetary union (CFA) and a regional stock exchange, a central bank of West African states but intra‐WAEMU trade struggles to successfully integrate auto trade rarely exceeds 16%. All WAEMU members are also members of the OIC.
Despite, political and economic initiatives to establish regional integration within WAEMU, the share of intra‐regional trade remains below expectations, trade between Member States recorded a value of $3.2 billion in 2016 compared to $4.4 billion in 2018. i.e. a growth of 39%.
5 www.ecwas.int 6 www.uemoa.int
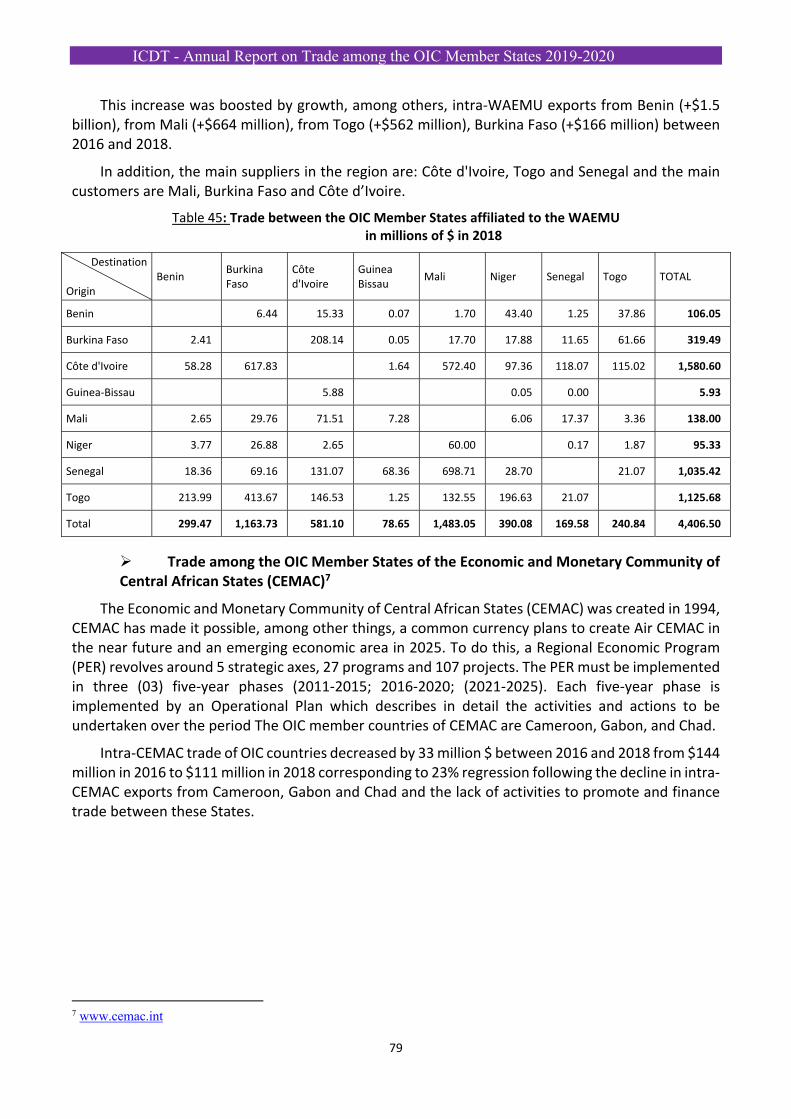
ICDT - Annual Report on Trade among the OIC Member States 2019-2020
79
This increase was boosted by growth, among others, intra‐WAEMU exports from Benin (+$1.5 billion), from Mali (+$664 million), from Togo (+$562 million), Burkina Faso (+$166 million) between 2016 and 2018.
In addition, the main suppliers in the region are: Côte d'Ivoire, Togo and Senegal and the main customers are Mali, Burkina Faso and Côte d’Ivoire.
Table 45: Trade between the OIC Member States affiliated to the WAEMU in millions of $ in 2018
Destination Origin
Benin Burkina Faso
Côte d'Ivoire
Guinea Bissau
Mali Niger Senegal Togo TOTAL
Benin 6.44 15.33 0.07 1.70 43.40 1.25 37.86 106.05
Burkina Faso 2.41 208.14 0.05 17.70 17.88 11.65 61.66 319.49
Côte d'Ivoire 58.28 617.83 1.64 572.40 97.36 118.07 115.02 1,580.60
Guinea‐Bissau 5.88 0.05 0.00 5.93
Mali 2.65 29.76 71.51 7.28 6.06 17.37 3.36 138.00
Niger 3.77 26.88 2.65 60.00 0.17 1.87 95.33
Senegal 18.36 69.16 131.07 68.36 698.71 28.70 21.07 1,035.42
Togo 213.99 413.67 146.53 1.25 132.55 196.63 21.07 1,125.68
Total 299.47 1,163.73 581.10 78.65 1,483.05 390.08 169.58 240.84 4,406.50
Trade among the OIC Member States of the Economic and Monetary Community of Central African States (CEMAC)7
The Economic and Monetary Community of Central African States (CEMAC) was created in 1994, CEMAC has made it possible, among other things, a common currency plans to create Air CEMAC in the near future and an emerging economic area in 2025. To do this, a Regional Economic Program (PER) revolves around 5 strategic axes, 27 programs and 107 projects. The PER must be implemented in three (03) five‐year phases (2011‐2015; 2016‐2020; (2021‐2025). Each five‐year phase is implemented by an Operational Plan which describes in detail the activities and actions to be undertaken over the period The OIC member countries of CEMAC are Cameroon, Gabon, and Chad.
Intra‐CEMAC trade of OIC countries decreased by 33 million $ between 2016 and 2018 from $144 million in 2016 to $111 million in 2018 corresponding to 23% regression following the decline in intra‐CEMAC exports from Cameroon, Gabon and Chad and the lack of activities to promote and finance trade between these States.
7 www.cemac.int
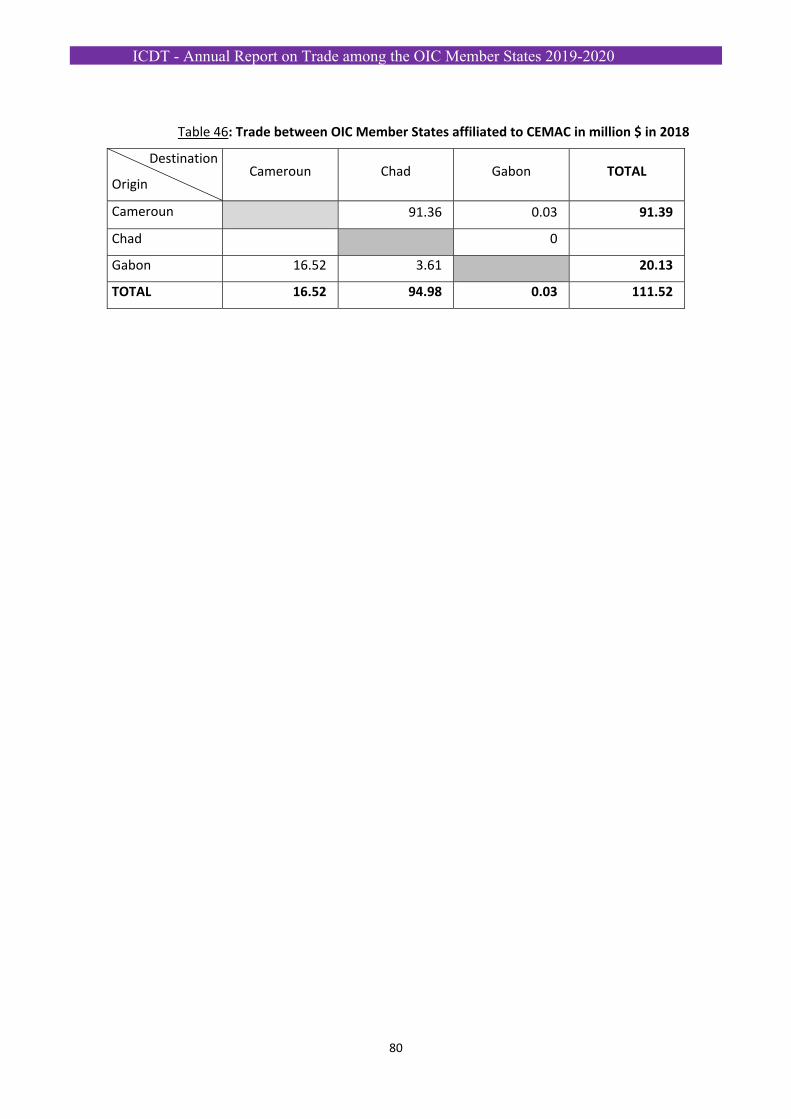
ICDT - Annual Report on Trade among the OIC Member States 2019-2020
80
Table 46: Trade between OIC Member States affiliated to CEMAC in million $ in 2018
Destination
Origin Cameroun Chad Gabon TOTAL
Cameroun
91.36 0.03 91.39
Chad
0
Gabon 16.52 3.61
20.13
TOTAL 16.52 94.98 0.03 111.52
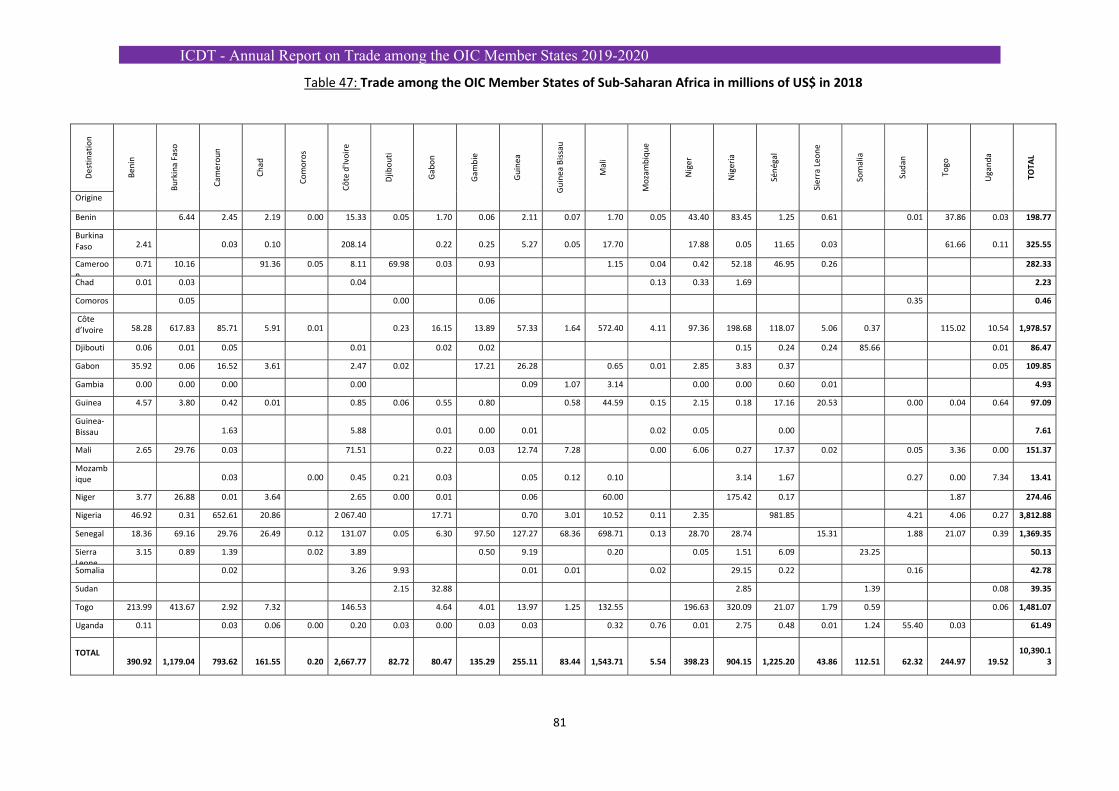
ICDT - Annual Report on Trade among the OIC Member States 2019-2020
81
Table 47: Trade among the OIC Member States of Sub‐Saharan Africa in millions of US$ in 2018
Destination
Benin
Burkina Faso
Cam
eroun
Chad
Comoros
Côte d'Ivoire
Djib
outi
Gab
on
Gam
bie
Guinea
Guinea Bissau
Mali
Mozambique
Niger
Nigeria
Sénégal
Sierra Leone
Somalia
Sudan
Togo
Uganda
TOTA
L
Origine
Benin 6.44 2.45 2.19 0.00 15.33 0.05 1.70 0.06 2.11 0.07 1.70 0.05 43.40 83.45 1.25 0.61 0.01 37.86 0.03 198.77
Burkina Faso 2.41 0.03 0.10 208.14 0.22 0.25 5.27 0.05 17.70 17.88 0.05 11.65 0.03 61.66 0.11 325.55
Cameroon
0.71 10.16 91.36 0.05 8.11 69.98 0.03 0.93 1.15 0.04 0.42 52.18 46.95 0.26 282.33
Chad 0.01 0.03 0.04 0.13 0.33 1.69 2.23
Comoros 0.05 0.00 0.06 0.35 0.46
Côte d’Ivoire 58.28 617.83 85.71 5.91 0.01 0.23 16.15 13.89 57.33 1.64 572.40 4.11 97.36 198.68 118.07 5.06 0.37 115.02 10.54 1,978.57
Djibouti 0.06 0.01 0.05 0.01 0.02 0.02 0.15 0.24 0.24 85.66 0.01 86.47
Gabon 35.92 0.06 16.52 3.61 2.47 0.02 17.21 26.28 0.65 0.01 2.85 3.83 0.37 0.05 109.85
Gambia 0.00 0.00 0.00 0.00 0.09 1.07 3.14 0.00 0.00 0.60 0.01 4.93
Guinea 4.57 3.80 0.42 0.01 0.85 0.06 0.55 0.80 0.58 44.59 0.15 2.15 0.18 17.16 20.53 0.00 0.04 0.64 97.09
Guinea‐Bissau 1.63 5.88 0.01 0.00 0.01 0.02 0.05 0.00 7.61
Mali 2.65 29.76 0.03 71.51 0.22 0.03 12.74 7.28 0.00 6.06 0.27 17.37 0.02 0.05 3.36 0.00 151.37
Mozambique 0.03 0.00 0.45 0.21 0.03 0.05 0.12 0.10 3.14 1.67 0.27 0.00 7.34 13.41
Niger 3.77 26.88 0.01 3.64 2.65 0.00 0.01 0.06 60.00 175.42 0.17 1.87 274.46
Nigeria 46.92 0.31 652.61 20.86 2 067.40 17.71 0.70 3.01 10.52 0.11 2.35 981.85 4.21 4.06 0.27 3,812.88
Senegal 18.36 69.16 29.76 26.49 0.12 131.07 0.05 6.30 97.50 127.27 68.36 698.71 0.13 28.70 28.74 15.31 1.88 21.07 0.39 1,369.35
Sierra Leone
3.15 0.89 1.39 0.02 3.89 0.50 9.19 0.20 0.05 1.51 6.09 23.25 50.13
Somalia 0.02 3.26 9.93 0.01 0.01 0.02 29.15 0.22 0.16 42.78
Sudan 2.15 32.88 2.85 1.39 0.08 39.35
Togo 213.99 413.67 2.92 7.32 146.53 4.64 4.01 13.97 1.25 132.55 196.63 320.09 21.07 1.79 0.59 0.06 1,481.07
Uganda 0.11 0.03 0.06 0.00 0.20 0.03 0.00 0.03 0.03 0.32 0.76 0.01 2.75 0.48 0.01 1.24 55.40 0.03 61.49
TOTAL 390.92 1,179.04 793.62 161.55 0.20 2,667.77 82.72 80.47 135.29 255.11 83.44 1,543.71 5.54 398.23 904.15 1,225.20 43.86 112.51 62.32 244.97 19.52
10,390.13
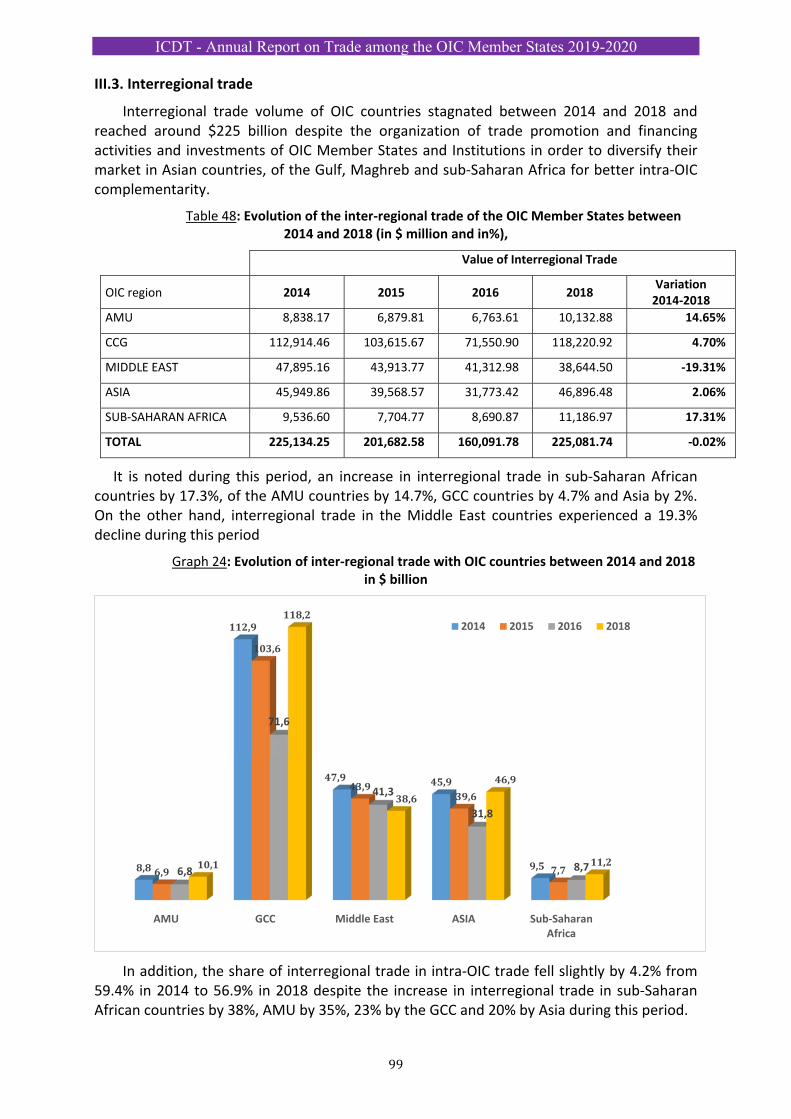
ICDT - Annual Report on Trade among the OIC Member States 2019-2020
99
III.3. Interregional trade
Interregional trade volume of OIC countries stagnated between 2014 and 2018 and reached around $225 billion despite the organization of trade promotion and financing activities and investments of OIC Member States and Institutions in order to diversify their market in Asian countries, of the Gulf, Maghreb and sub‐Saharan Africa for better intra‐OIC complementarity.
Table 48: Evolution of the inter‐regional trade of the OIC Member States between 2014 and 2018 (in $ million and in%),
Value of Interregional Trade
OIC region 2014 2015 2016 2018 Variation2014‐2018
AMU 8,838.17 6,879.81 6,763.61 10,132.88 14.65%
CCG 112,914.46 103,615.67 71,550.90 118,220.92 4.70%
MIDDLE EAST 47,895.16 43,913.77 41,312.98 38,644.50 ‐19.31%
ASIA 45,949.86 39,568.57 31,773.42 46,896.48 2.06%
SUB‐SAHARAN AFRICA 9,536.60 7,704.77 8,690.87 11,186.97 17.31%
TOTAL 225,134.25 201,682.58 160,091.78 225,081.74 ‐0.02%
It is noted during this period, an increase in interregional trade in sub‐Saharan African countries by 17.3%, of the AMU countries by 14.7%, GCC countries by 4.7% and Asia by 2%. On the other hand, interregional trade in the Middle East countries experienced a 19.3% decline during this period
Graph 24: Evolution of inter‐regional trade with OIC countries between 2014 and 2018 in $ billion
In addition, the share of interregional trade in intra‐OIC trade fell slightly by 4.2% from 59.4% in 2014 to 56.9% in 2018 despite the increase in interregional trade in sub‐Saharan African countries by 38%, AMU by 35%, 23% by the GCC and 20% by Asia during this period.
AMU GCC Middle East ASIA Sub‐SaharanAfrica
8,8
112,9
47,9 45,9
9,56,9
103,6
43,939,6
7,76,8
71,6
41,3
31,8
8,710,1
118,2
38,6
46,9
11,2
2014 2015 2016 2018
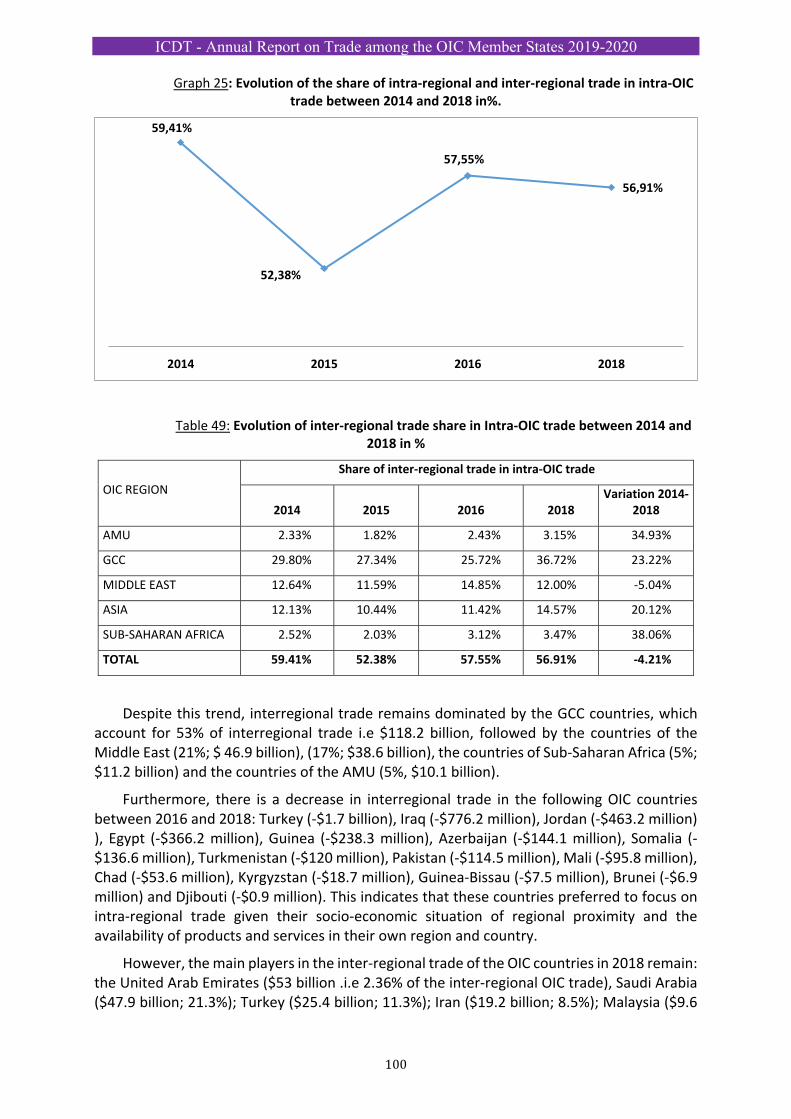
ICDT - Annual Report on Trade among the OIC Member States 2019-2020
100
Graph 25: Evolution of the share of intra‐regional and inter‐regional trade in intra‐OIC trade between 2014 and 2018 in%.
Table 49: Evolution of inter‐regional trade share in Intra‐OIC trade between 2014 and 2018 in %
OIC REGION
Share of inter‐regional trade in intra‐OIC trade
2014 2015 2016 2018 Variation 2014‐
2018
AMU 2.33% 1.82% 2.43% 3.15% 34.93%
GCC 29.80% 27.34% 25.72% 36.72% 23.22%
MIDDLE EAST 12.64% 11.59% 14.85% 12.00% ‐5.04%
ASIA 12.13% 10.44% 11.42% 14.57% 20.12%
SUB‐SAHARAN AFRICA 2.52% 2.03% 3.12% 3.47% 38.06%
TOTAL 59.41% 52.38% 57.55% 56.91% ‐4.21%
Despite this trend, interregional trade remains dominated by the GCC countries, which account for 53% of interregional trade i.e $118.2 billion, followed by the countries of the Middle East (21%; $ 46.9 billion), (17%; $38.6 billion), the countries of Sub‐Saharan Africa (5%; $11.2 billion) and the countries of the AMU (5%, $10.1 billion).
Furthermore, there is a decrease in interregional trade in the following OIC countries between 2016 and 2018: Turkey (‐$1.7 billion), Iraq (‐$776.2 million), Jordan (‐$463.2 million) ), Egypt (‐$366.2 million), Guinea (‐$238.3 million), Azerbaijan (‐$144.1 million), Somalia (‐$136.6 million), Turkmenistan (‐$120 million), Pakistan (‐$114.5 million), Mali (‐$95.8 million), Chad (‐$53.6 million), Kyrgyzstan (‐$18.7 million), Guinea‐Bissau (‐$7.5 million), Brunei (‐$6.9 million) and Djibouti (‐$0.9 million). This indicates that these countries preferred to focus on intra‐regional trade given their socio‐economic situation of regional proximity and the availability of products and services in their own region and country.
However, the main players in the inter‐regional trade of the OIC countries in 2018 remain: the United Arab Emirates ($53 billion .i.e 2.36% of the inter‐regional OIC trade), Saudi Arabia ($47.9 billion; 21.3%); Turkey ($25.4 billion; 11.3%); Iran ($19.2 billion; 8.5%); Malaysia ($9.6
59,41%
52,38%
57,55%
56,91%
2014 2015 2016 2018
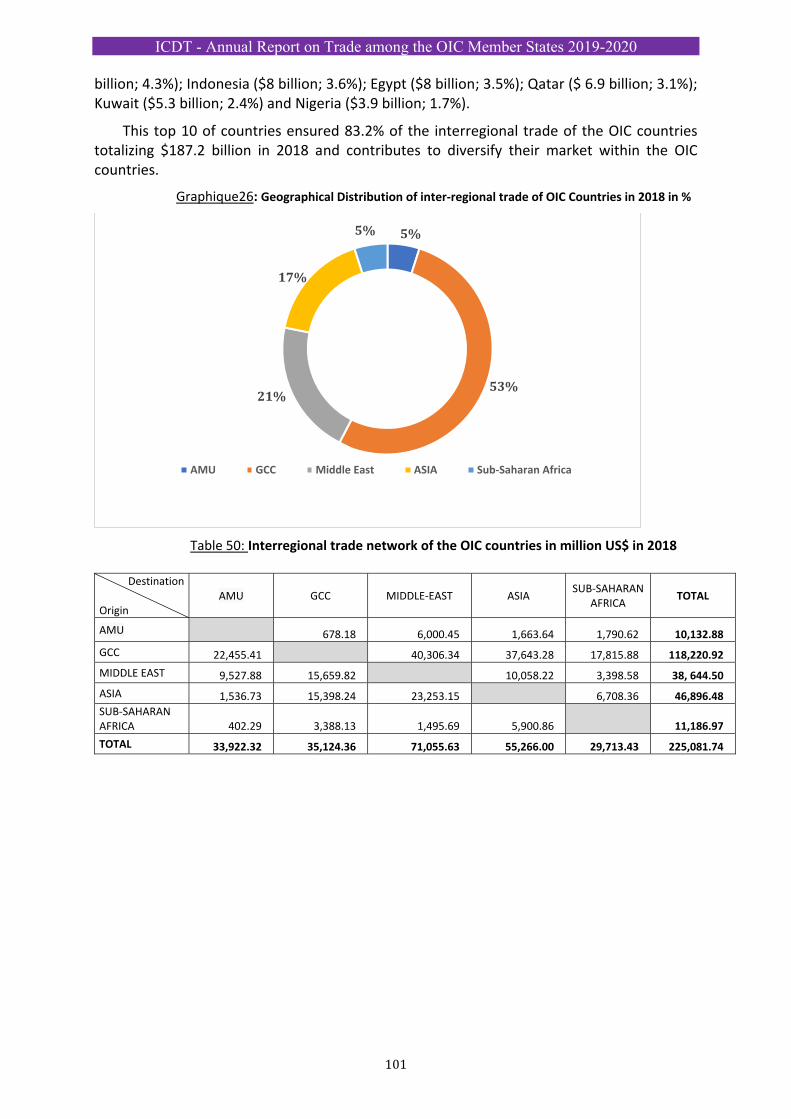
ICDT - Annual Report on Trade among the OIC Member States 2019-2020
101
billion; 4.3%); Indonesia ($8 billion; 3.6%); Egypt ($8 billion; 3.5%); Qatar ($ 6.9 billion; 3.1%); Kuwait ($5.3 billion; 2.4%) and Nigeria ($3.9 billion; 1.7%).
This top 10 of countries ensured 83.2% of the interregional trade of the OIC countries totalizing $187.2 billion in 2018 and contributes to diversify their market within the OIC countries.
Graphique26: Geographical Distribution of inter‐regional trade of OIC Countries in 2018 in %
Table 50: Interregional trade network of the OIC countries in million US$ in 2018
5%
53%21%
17%
5%
AMU GCC Middle East ASIA Sub‐Saharan Africa
Destination Origin
AMU GCC MIDDLE‐EAST ASIA SUB‐SAHARAN
AFRICA TOTAL
AMU 678.18 6,000.45 1,663.64 1,790.62 10,132.88
GCC 22,455.41 40,306.34 37,643.28 17,815.88 118,220.92
MIDDLE EAST 9,527.88 15,659.82 10,058.22 3,398.58 38, 644.50
ASIA 1,536.73 15,398.24 23,253.15 6,708.36 46,896.48
SUB‐SAHARAN AFRICA 402.29 3,388.13 1,495.69 5,900.86 11,186.97
TOTAL 33,922.32 35,124.36 71,055.63 55,266.00 29,713.43 225,081.74
ICDT - Annual Report on Trade among the OIC Member States 2019-2020
102
GENERAL CONCLUSION:
ICDT - Annual Report on Trade among the OIC Member States 2019-2020
103
According to IMF data (Outlook, April 2020) global growth forecasts from 2019 to 2020 have declined from 2.90 to ‐4.9% respectively due to the negative impact of COVID‐19 pandemic on low income households and lockdown in the first and second quarters of 2020 and also effects of tariff increases adopted in the United States and China in early 2019. This decrease was reinforced by the introduction by Germany new fuel emission standards and natural disasters in Japan and Italy concerning sovereign and financial risks which contributed to strengthening domestic demand but also weakened the financial market in certain emerging countries.
Besides, the world growth could reach 5.4% in 2021, after mastering the pandemic outbreak in many countries through the international cooperation supply chain in medical and food products to assist vulnerable countries in collaboration with the private sector. This collaboration will generate supplies of medicines, protective equipment, manufacturing essential products to limit of the outbreak of the virus and supporting national public health systems.
The growth of emerging markets and developing economies is also impacted and reached 3.7% in 2019 and declined by 3% in 2020 and to increase by 5.9% in 2021 by a possibly recovery of some countries such as China, India, ASEAN‐5, Russia, Mexico, Saudi Arabia, Nigeria, etc… according the IMF Projections.
According SESRIC projections, the OIC average per capita income level is also expected to decrease by $ 11,500 in 2019 to $ 11,100 in 2020, i.e. 3.4% decline.
Globally, economies are connected to each other through cross‐border flows and bilateral, regional and international relations, COVID‐19 will have an impact on their transactions in goods, services, technology transfer, and project financing, technical assistance, movement of professionals, financial capital, direct foreign investment, international banking and exchange rates.
International trade is surely one of the leading mechanisms through which the virus damages domestic economies and spreads internationally. COVID‐19 contributed to the factory and company’s closures particularly SMEs including SMIs, temporary travel and exports bans and restrictions, border closings, catering services and tourism‐related services bans and will reduce exports of services to affected countries including OIC Member Countries.
Several countries and regional and international organizations have injected funds to relieve populations and structures to mitigate the effect of this health crisis by several billion dollars.
In this regard, OIC General Secretariat, OIC Member Countries governments, Institutions and International partners are joining their efforts to tackle this COVID‐19 pandemic depending on the nature of the shock and country‐specific circumstances by injecting funds at national, regional and international levels reaching globally many $ trillion.
In the same vein and during the Extraordinary Videoconference of the OIC Executive Committee at the Level of Foreign Ministers on the Consequences of the Novel Coronavirus Disease (COVID‐19) Pandemic and Joint Response held on 22nd April 2020, it was requested to convene an establishment of a Committee of the Permanent Representatives (CPR) with a participation of the relevant OIC institutions in order to follow up the efforts and initiatives towards assisting Member States in their respective response.
ICDT - Annual Report on Trade among the OIC Member States 2019-2020
104
Besides, IsDB has launched a US$2.2 billion Strategic Preparedness and Response Program to counter the coronavirus disease (COVID‐19) pandemic through supporting the efforts to prevent, contain, mitigate, and recover from its impacts.
Several Member States have taken exceptional measures to counter the effects of this crisis by allocating exorbitant budgets to help the poor in terms of food and medical supplies to respond to this health insecurity.
Regional growth will also benefit from the reduction of uncertainties related to global trade policies and from a recovery even if it remains weak in world trade.
Indeed, the OIC 2016‐2018 Ten‐Year Action Program (TYPOA), implemented by all OIC institutions has contributed to improving growth in the volume of trade of Member States, which went from $ 3 trillion in 2016 to around $ 3.6 trillion in 2018, an increase of 20%.
According to World Bank data, several Member States have also concentrated their efforts in the area of trade facilitation in terms of road and airport infrastructure during the period 2016‐2018.
Indeed, the OIC 2016‐2018 Ten‐Year Action Program (TYPOA), implemented by all OIC institutions, has contributed to improving growth in the volume of trade of Member States, which went from $ 3 trillion in 2016 to around $ 3.6 trillion in 2018, an increase of 20%.
According to World Bank data, several Member States have also concentrated their efforts in the area of trade facilitation in terms of road and airport infrastructure during the period 2016‐2018, According to UNCTAD data for July 2019 and ICDT calculations, world trade in commercial services of OIC countries in 2016 reached $ 811 billion compared to $ 895 billion in 2018, an increase of 10% and represents 24.8% of world trade of OIC countries and 9% of world trade in services in 2018. More than 82% consisted of transport and travel services as well as other services (18%).
In addition, the diaspora of the OIC Member States carried out money transfers of around 160 billion $ in 2018, i.e. 18% of the services exported.
The volume of trade between OIC Member States (intra‐OIC exports + intra‐OIC imports) has increased considerably, from $ 556.32 billion in 2016 to $ 751.5 billion in 2018, ie a growth rate of 35%.
According to the figures of the gravity model developed by the ICDT from the ITC and IMF DOTS Trade Map data, the observed potential of intra‐OIC trade is around 5.3 trillion $ in 2018 of which only 21% is exploited and which can reach 33.4% to 74% if the tariff and non‐tariff barriers between Member States are gradually lifted.
The potential for intra‐OIC trade is mainly made up of: mineral fuels, electrical machinery and equipment, clothing and accessories, mechanical machines and devices, pearls, motor cars, tractors and cycles; iron and steel and related items; plastic items; cereals ; vegetable and animal fats and oils; pharmaceuticals, organic chemicals, photographic or cinematographic instruments and devices.
It should be noted that more than 75% of intra‐OIC trade is concentrated on non‐fuel products in 2018.
The joint efforts of the programs of the OIC institutions and the partnership with other regional and international organizations contributed to increase the share of intra‐OIC trade
ICDT - Annual Report on Trade among the OIC Member States 2019-2020
105
in the total trade of the Member States from 18,69% in 2016 to 21.02% in 2018, which represents an increase of 12.5%.
In addition, around 28 countries reached the target of intra‐OIC trade share (25%) in 2018.
Intra‐regional trade of the OIC countries increased from 118.1 billion $ in 2016 to 165.4 billion $ in 2018, i.e. an increase of 40.1% thanks to the increase in intra‐regional trade with the countries, OIC of the GCC countries of 24.2 billion $ followed by those of Asia (+15.3 billion $), the Middle East (+4.3 billion $), sub‐Saharan Africa (3.3 billion $) and the Maghreb (+389.3 million $).
Interregional trade in the OIC countries experienced the same trend, going from 16.1 billion $ in 2016 to 225.1 billion $ in 2018, i.e. an increase of 40.6% in view of the increase in inter‐ regional of GCC countries with other OIC countries in the range of 46.7 billion $, followed by Asian countries (+15.1 billion $). AMU countries (+3.3 billion $), the countries of Sub‐Saharan Africa (+2.4 billion $).
In sum, the OIC Member States exchange more between the regions than within their own region between 2016 and 2018 and this, to conquer new growth markets but also thanks to the economic and commercial complementarity and the resurgence in the organization of trade missions, trade fairs and shows, business forums and buyers‐sellers meetings of strategic products between OIC countries.
Despite the considerable efforts made by Member States, the OIC General Secretariat and its institutions to promote intra‐OIC trade and reduce barriers, many barriers remain.
According to the statistics of the Global Trade Alert of March 2020, around 15.431 trade measures were applied by the Member States which contributed to hamper the expansion of intra‐OIC trade but also with their trading partners between 2015 and 2018.
It is true that some of these measures are intended to protect national economies and the activities of economic operators while others help to hamper the expansion of intra‐OIC trade.
In this regard, Member States and OIC bodies have developed tools to strengthen intra‐OIC trade, especially in the area of trade facilitation.
To strengthen economic and trade cooperation among OIC countries, OIC institutions and the public and private sectors must contribute to the implementation of the OIC‐2025 Ten‐Year Action Plan, notably, through the five integrated projects adopted by TISC, in particular: trade facilitation, capacity building in the field of vocational training and trades in international trade, empowerment of women and young people, participation in fairs, international exhibitions, trade missions, buyers‐sellers meetings of strategic products and services and business forums, but also by softening foreign trade procedures and intra‐OIC investments in order to stimulate trade between Member States, by raising awareness of the creation of one‐stop shops for foreign trade and modernization of customs administrations. In addition, the diversification of exportable supply is needed to develop foreign trade and intra‐OIC investments.
It is also important that OIC Member States invest in the progressive creation of a free trade area and adhere to the guiding principles of investment facilitation and the integration of intra and interregional value chains, OIC countries in the field of Halal industry, ICTs, logistics and transport, food industry, textiles, pharmaceuticals, leather, automotive and renewable energy of Member States have considerable potential.
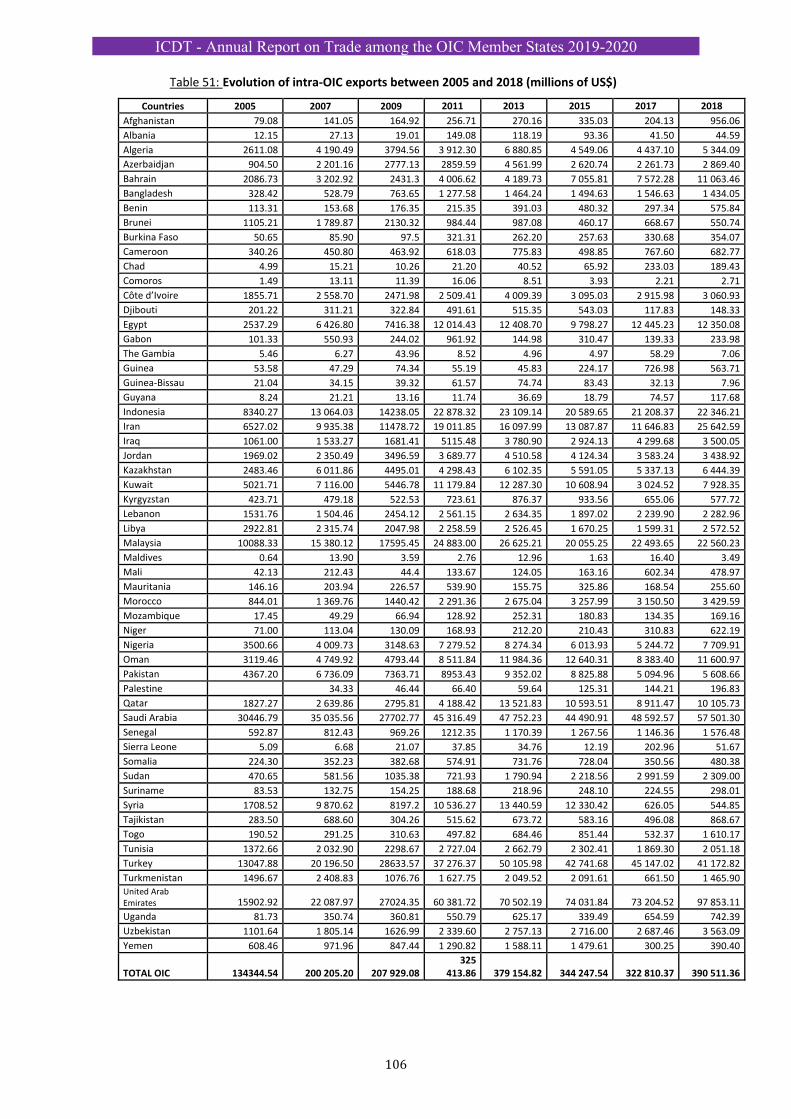
ICDT - Annual Report on Trade among the OIC Member States 2019-2020
106
Table 51: Evolution of intra‐OIC exports between 2005 and 2018 (millions of US$)
Countries 2005 2007 2009 2011 2013 2015 2017 2018
Afghanistan 79.08 141.05 164.92 256.71 270.16 335.03 204.13 956.06
Albania 12.15 27.13 19.01 149.08 118.19 93.36 41.50 44.59
Algeria 2611.08 4 190.49 3794.56 3 912.30 6 880.85 4 549.06 4 437.10 5 344.09
Azerbaidjan 904.50 2 201.16 2777.13 2859.59 4 561.99 2 620.74 2 261.73 2 869.40
Bahrain 2086.73 3 202.92 2431.3 4 006.62 4 189.73 7 055.81 7 572.28 11 063.46
Bangladesh 328.42 528.79 763.65 1 277.58 1 464.24 1 494.63 1 546.63 1 434.05
Benin 113.31 153.68 176.35 215.35 391.03 480.32 297.34 575.84
Brunei 1105.21 1 789.87 2130.32 984.44 987.08 460.17 668.67 550.74
Burkina Faso 50.65 85.90 97.5 321.31 262.20 257.63 330.68 354.07
Cameroon 340.26 450.80 463.92 618.03 775.83 498.85 767.60 682.77
Chad 4.99 15.21 10.26 21.20 40.52 65.92 233.03 189.43
Comoros 1.49 13.11 11.39 16.06 8.51 3.93 2.21 2.71
Côte d’Ivoire 1855.71 2 558.70 2471.98 2 509.41 4 009.39 3 095.03 2 915.98 3 060.93
Djibouti 201.22 311.21 322.84 491.61 515.35 543.03 117.83 148.33
Egypt 2537.29 6 426.80 7416.38 12 014.43 12 408.70 9 798.27 12 445.23 12 350.08
Gabon 101.33 550.93 244.02 961.92 144.98 310.47 139.33 233.98
The Gambia 5.46 6.27 43.96 8.52 4.96 4.97 58.29 7.06
Guinea 53.58 47.29 74.34 55.19 45.83 224.17 726.98 563.71
Guinea‐Bissau 21.04 34.15 39.32 61.57 74.74 83.43 32.13 7.96
Guyana 8.24 21.21 13.16 11.74 36.69 18.79 74.57 117.68
Indonesia 8340.27 13 064.03 14238.05 22 878.32 23 109.14 20 589.65 21 208.37 22 346.21
Iran 6527.02 9 935.38 11478.72 19 011.85 16 097.99 13 087.87 11 646.83 25 642.59
Iraq 1061.00 1 533.27 1681.41 5115.48 3 780.90 2 924.13 4 299.68 3 500.05
Jordan 1969.02 2 350.49 3496.59 3 689.77 4 510.58 4 124.34 3 583.24 3 438.92
Kazakhstan 2483.46 6 011.86 4495.01 4 298.43 6 102.35 5 591.05 5 337.13 6 444.39
Kuwait 5021.71 7 116.00 5446.78 11 179.84 12 287.30 10 608.94 3 024.52 7 928.35
Kyrgyzstan 423.71 479.18 522.53 723.61 876.37 933.56 655.06 577.72
Lebanon 1531.76 1 504.46 2454.12 2 561.15 2 634.35 1 897.02 2 239.90 2 282.96
Libya 2922.81 2 315.74 2047.98 2 258.59 2 526.45 1 670.25 1 599.31 2 572.52
Malaysia 10088.33 15 380.12 17595.45 24 883.00 26 625.21 20 055.25 22 493.65 22 560.23
Maldives 0.64 13.90 3.59 2.76 12.96 1.63 16.40 3.49
Mali 42.13 212.43 44.4 133.67 124.05 163.16 602.34 478.97
Mauritania 146.16 203.94 226.57 539.90 155.75 325.86 168.54 255.60
Morocco 844.01 1 369.76 1440.42 2 291.36 2 675.04 3 257.99 3 150.50 3 429.59
Mozambique 17.45 49.29 66.94 128.92 252.31 180.83 134.35 169.16
Niger 71.00 113.04 130.09 168.93 212.20 210.43 310.83 622.19
Nigeria 3500.66 4 009.73 3148.63 7 279.52 8 274.34 6 013.93 5 244.72 7 709.91
Oman 3119.46 4 749.92 4793.44 8 511.84 11 984.36 12 640.31 8 383.40 11 600.97
Pakistan 4367.20 6 736.09 7363.71 8953.43 9 352.02 8 825.88 5 094.96 5 608.66
Palestine 34.33 46.44 66.40 59.64 125.31 144.21 196.83
Qatar 1827.27 2 639.86 2795.81 4 188.42 13 521.83 10 593.51 8 911.47 10 105.73
Saudi Arabia 30446.79 35 035.56 27702.77 45 316.49 47 752.23 44 490.91 48 592.57 57 501.30
Senegal 592.87 812.43 969.26 1212.35 1 170.39 1 267.56 1 146.36 1 576.48
Sierra Leone 5.09 6.68 21.07 37.85 34.76 12.19 202.96 51.67
Somalia 224.30 352.23 382.68 574.91 731.76 728.04 350.56 480.38
Sudan 470.65 581.56 1035.38 721.93 1 790.94 2 218.56 2 991.59 2 309.00
Suriname 83.53 132.75 154.25 188.68 218.96 248.10 224.55 298.01
Syria 1708.52 9 870.62 8197.2 10 536.27 13 440.59 12 330.42 626.05 544.85
Tajikistan 283.50 688.60 304.26 515.62 673.72 583.16 496.08 868.67
Togo 190.52 291.25 310.63 497.82 684.46 851.44 532.37 1 610.17
Tunisia 1372.66 2 032.90 2298.67 2 727.04 2 662.79 2 302.41 1 869.30 2 051.18
Turkey 13047.88 20 196.50 28633.57 37 276.37 50 105.98 42 741.68 45 147.02 41 172.82
Turkmenistan 1496.67 2 408.83 1076.76 1 627.75 2 049.52 2 091.61 661.50 1 465.90United Arab Emirates 15902.92 22 087.97 27024.35 60 381.72 70 502.19 74 031.84 73 204.52 97 853.11
Uganda 81.73 350.74 360.81 550.79 625.17 339.49 654.59 742.39
Uzbekistan 1101.64 1 805.14 1626.99 2 339.60 2 757.13 2 716.00 2 687.46 3 563.09
Yemen 608.46 971.96 847.44 1 290.82 1 588.11 1 479.61 300.25 390.40
TOTAL OIC 134344.54 200 205.20 207 929.08325
413.86 379 154.82 344 247.54 322 810.37 390 511.36
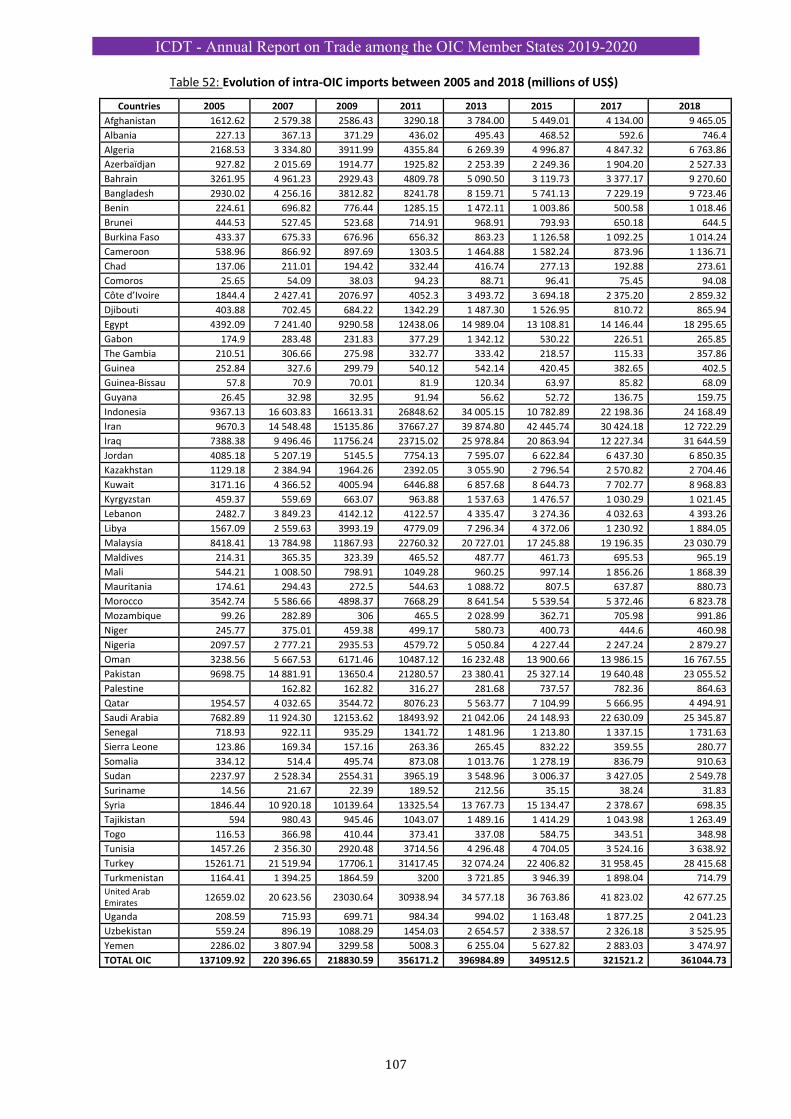
ICDT - Annual Report on Trade among the OIC Member States 2019-2020
107
Table 52: Evolution of intra‐OIC imports between 2005 and 2018 (millions of US$)
Countries 2005 2007 2009 2011 2013 2015 2017 2018
Afghanistan 1612.62 2 579.38 2586.43 3290.18 3 784.00 5 449.01 4 134.00 9 465.05
Albania 227.13 367.13 371.29 436.02 495.43 468.52 592.6 746.4
Algeria 2168.53 3 334.80 3911.99 4355.84 6 269.39 4 996.87 4 847.32 6 763.86
Azerbaïdjan 927.82 2 015.69 1914.77 1925.82 2 253.39 2 249.36 1 904.20 2 527.33
Bahrain 3261.95 4 961.23 2929.43 4809.78 5 090.50 3 119.73 3 377.17 9 270.60
Bangladesh 2930.02 4 256.16 3812.82 8241.78 8 159.71 5 741.13 7 229.19 9 723.46
Benin 224.61 696.82 776.44 1285.15 1 472.11 1 003.86 500.58 1 018.46
Brunei 444.53 527.45 523.68 714.91 968.91 793.93 650.18 644.5
Burkina Faso 433.37 675.33 676.96 656.32 863.23 1 126.58 1 092.25 1 014.24
Cameroon 538.96 866.92 897.69 1303.5 1 464.88 1 582.24 873.96 1 136.71
Chad 137.06 211.01 194.42 332.44 416.74 277.13 192.88 273.61
Comoros 25.65 54.09 38.03 94.23 88.71 96.41 75.45 94.08
Côte d’Ivoire 1844.4 2 427.41 2076.97 4052.3 3 493.72 3 694.18 2 375.20 2 859.32
Djibouti 403.88 702.45 684.22 1342.29 1 487.30 1 526.95 810.72 865.94
Egypt 4392.09 7 241.40 9290.58 12438.06 14 989.04 13 108.81 14 146.44 18 295.65
Gabon 174.9 283.48 231.83 377.29 1 342.12 530.22 226.51 265.85
The Gambia 210.51 306.66 275.98 332.77 333.42 218.57 115.33 357.86
Guinea 252.84 327.6 299.79 540.12 542.14 420.45 382.65 402.5
Guinea‐Bissau 57.8 70.9 70.01 81.9 120.34 63.97 85.82 68.09
Guyana 26.45 32.98 32.95 91.94 56.62 52.72 136.75 159.75
Indonesia 9367.13 16 603.83 16613.31 26848.62 34 005.15 10 782.89 22 198.36 24 168.49
Iran 9670.3 14 548.48 15135.86 37667.27 39 874.80 42 445.74 30 424.18 12 722.29
Iraq 7388.38 9 496.46 11756.24 23715.02 25 978.84 20 863.94 12 227.34 31 644.59
Jordan 4085.18 5 207.19 5145.5 7754.13 7 595.07 6 622.84 6 437.30 6 850.35
Kazakhstan 1129.18 2 384.94 1964.26 2392.05 3 055.90 2 796.54 2 570.82 2 704.46
Kuwait 3171.16 4 366.52 4005.94 6446.88 6 857.68 8 644.73 7 702.77 8 968.83
Kyrgyzstan 459.37 559.69 663.07 963.88 1 537.63 1 476.57 1 030.29 1 021.45
Lebanon 2482.7 3 849.23 4142.12 4122.57 4 335.47 3 274.36 4 032.63 4 393.26
Libya 1567.09 2 559.63 3993.19 4779.09 7 296.34 4 372.06 1 230.92 1 884.05
Malaysia 8418.41 13 784.98 11867.93 22760.32 20 727.01 17 245.88 19 196.35 23 030.79
Maldives 214.31 365.35 323.39 465.52 487.77 461.73 695.53 965.19
Mali 544.21 1 008.50 798.91 1049.28 960.25 997.14 1 856.26 1 868.39
Mauritania 174.61 294.43 272.5 544.63 1 088.72 807.5 637.87 880.73
Morocco 3542.74 5 586.66 4898.37 7668.29 8 641.54 5 539.54 5 372.46 6 823.78
Mozambique 99.26 282.89 306 465.5 2 028.99 362.71 705.98 991.86
Niger 245.77 375.01 459.38 499.17 580.73 400.73 444.6 460.98
Nigeria 2097.57 2 777.21 2935.53 4579.72 5 050.84 4 227.44 2 247.24 2 879.27
Oman 3238.56 5 667.53 6171.46 10487.12 16 232.48 13 900.66 13 986.15 16 767.55
Pakistan 9698.75 14 881.91 13650.4 21280.57 23 380.41 25 327.14 19 640.48 23 055.52
Palestine 162.82 162.82 316.27 281.68 737.57 782.36 864.63
Qatar 1954.57 4 032.65 3544.72 8076.23 5 563.77 7 104.99 5 666.95 4 494.91
Saudi Arabia 7682.89 11 924.30 12153.62 18493.92 21 042.06 24 148.93 22 630.09 25 345.87
Senegal 718.93 922.11 935.29 1341.72 1 481.96 1 213.80 1 337.15 1 731.63
Sierra Leone 123.86 169.34 157.16 263.36 265.45 832.22 359.55 280.77
Somalia 334.12 514.4 495.74 873.08 1 013.76 1 278.19 836.79 910.63
Sudan 2237.97 2 528.34 2554.31 3965.19 3 548.96 3 006.37 3 427.05 2 549.78
Suriname 14.56 21.67 22.39 189.52 212.56 35.15 38.24 31.83
Syria 1846.44 10 920.18 10139.64 13325.54 13 767.73 15 134.47 2 378.67 698.35
Tajikistan 594 980.43 945.46 1043.07 1 489.16 1 414.29 1 043.98 1 263.49
Togo 116.53 366.98 410.44 373.41 337.08 584.75 343.51 348.98
Tunisia 1457.26 2 356.30 2920.48 3714.56 4 296.48 4 704.05 3 524.16 3 638.92
Turkey 15261.71 21 519.94 17706.1 31417.45 32 074.24 22 406.82 31 958.45 28 415.68
Turkmenistan 1164.41 1 394.25 1864.59 3200 3 721.85 3 946.39 1 898.04 714.79United Arab Emirates 12659.02 20 623.56 23030.64 30938.94 34 577.18 36 763.86 41 823.02 42 677.25
Uganda 208.59 715.93 699.71 984.34 994.02 1 163.48 1 877.25 2 041.23
Uzbekistan 559.24 896.19 1088.29 1454.03 2 654.57 2 338.57 2 326.18 3 525.95
Yemen 2286.02 3 807.94 3299.58 5008.3 6 255.04 5 627.82 2 883.03 3 474.97
TOTAL OIC 137109.92 220 396.65 218830.59 356171.2 396984.89 349512.5 321521.2 361044.73
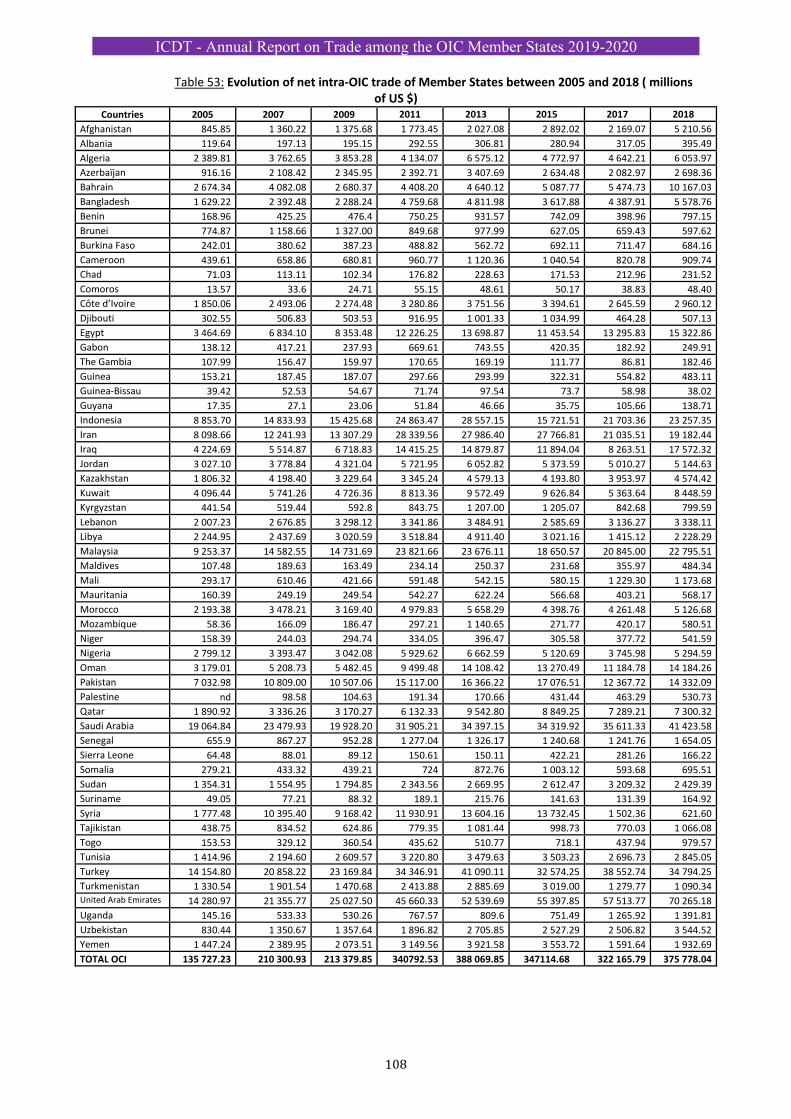
ICDT - Annual Report on Trade among the OIC Member States 2019-2020
108
Table 53: Evolution of net intra‐OIC trade of Member States between 2005 and 2018 ( millions of US $)
Countries 2005 2007 2009 2011 2013 2015 2017 2018
Afghanistan 845.85 1 360.22 1 375.68 1 773.45 2 027.08 2 892.02 2 169.07 5 210.56
Albania 119.64 197.13 195.15 292.55 306.81 280.94 317.05 395.49
Algeria 2 389.81 3 762.65 3 853.28 4 134.07 6 575.12 4 772.97 4 642.21 6 053.97
Azerbaïjan 916.16 2 108.42 2 345.95 2 392.71 3 407.69 2 634.48 2 082.97 2 698.36
Bahrain 2 674.34 4 082.08 2 680.37 4 408.20 4 640.12 5 087.77 5 474.73 10 167.03
Bangladesh 1 629.22 2 392.48 2 288.24 4 759.68 4 811.98 3 617.88 4 387.91 5 578.76
Benin 168.96 425.25 476.4 750.25 931.57 742.09 398.96 797.15
Brunei 774.87 1 158.66 1 327.00 849.68 977.99 627.05 659.43 597.62
Burkina Faso 242.01 380.62 387.23 488.82 562.72 692.11 711.47 684.16
Cameroon 439.61 658.86 680.81 960.77 1 120.36 1 040.54 820.78 909.74
Chad 71.03 113.11 102.34 176.82 228.63 171.53 212.96 231.52
Comoros 13.57 33.6 24.71 55.15 48.61 50.17 38.83 48.40
Côte d’Ivoire 1 850.06 2 493.06 2 274.48 3 280.86 3 751.56 3 394.61 2 645.59 2 960.12
Djibouti 302.55 506.83 503.53 916.95 1 001.33 1 034.99 464.28 507.13
Egypt 3 464.69 6 834.10 8 353.48 12 226.25 13 698.87 11 453.54 13 295.83 15 322.86
Gabon 138.12 417.21 237.93 669.61 743.55 420.35 182.92 249.91
The Gambia 107.99 156.47 159.97 170.65 169.19 111.77 86.81 182.46
Guinea 153.21 187.45 187.07 297.66 293.99 322.31 554.82 483.11
Guinea‐Bissau 39.42 52.53 54.67 71.74 97.54 73.7 58.98 38.02
Guyana 17.35 27.1 23.06 51.84 46.66 35.75 105.66 138.71
Indonesia 8 853.70 14 833.93 15 425.68 24 863.47 28 557.15 15 721.51 21 703.36 23 257.35
Iran 8 098.66 12 241.93 13 307.29 28 339.56 27 986.40 27 766.81 21 035.51 19 182.44
Iraq 4 224.69 5 514.87 6 718.83 14 415.25 14 879.87 11 894.04 8 263.51 17 572.32
Jordan 3 027.10 3 778.84 4 321.04 5 721.95 6 052.82 5 373.59 5 010.27 5 144.63
Kazakhstan 1 806.32 4 198.40 3 229.64 3 345.24 4 579.13 4 193.80 3 953.97 4 574.42
Kuwait 4 096.44 5 741.26 4 726.36 8 813.36 9 572.49 9 626.84 5 363.64 8 448.59
Kyrgyzstan 441.54 519.44 592.8 843.75 1 207.00 1 205.07 842.68 799.59
Lebanon 2 007.23 2 676.85 3 298.12 3 341.86 3 484.91 2 585.69 3 136.27 3 338.11
Libya 2 244.95 2 437.69 3 020.59 3 518.84 4 911.40 3 021.16 1 415.12 2 228.29
Malaysia 9 253.37 14 582.55 14 731.69 23 821.66 23 676.11 18 650.57 20 845.00 22 795.51
Maldives 107.48 189.63 163.49 234.14 250.37 231.68 355.97 484.34
Mali 293.17 610.46 421.66 591.48 542.15 580.15 1 229.30 1 173.68
Mauritania 160.39 249.19 249.54 542.27 622.24 566.68 403.21 568.17
Morocco 2 193.38 3 478.21 3 169.40 4 979.83 5 658.29 4 398.76 4 261.48 5 126.68
Mozambique 58.36 166.09 186.47 297.21 1 140.65 271.77 420.17 580.51
Niger 158.39 244.03 294.74 334.05 396.47 305.58 377.72 541.59
Nigeria 2 799.12 3 393.47 3 042.08 5 929.62 6 662.59 5 120.69 3 745.98 5 294.59
Oman 3 179.01 5 208.73 5 482.45 9 499.48 14 108.42 13 270.49 11 184.78 14 184.26
Pakistan 7 032.98 10 809.00 10 507.06 15 117.00 16 366.22 17 076.51 12 367.72 14 332.09
Palestine nd 98.58 104.63 191.34 170.66 431.44 463.29 530.73
Qatar 1 890.92 3 336.26 3 170.27 6 132.33 9 542.80 8 849.25 7 289.21 7 300.32
Saudi Arabia 19 064.84 23 479.93 19 928.20 31 905.21 34 397.15 34 319.92 35 611.33 41 423.58
Senegal 655.9 867.27 952.28 1 277.04 1 326.17 1 240.68 1 241.76 1 654.05
Sierra Leone 64.48 88.01 89.12 150.61 150.11 422.21 281.26 166.22
Somalia 279.21 433.32 439.21 724 872.76 1 003.12 593.68 695.51
Sudan 1 354.31 1 554.95 1 794.85 2 343.56 2 669.95 2 612.47 3 209.32 2 429.39
Suriname 49.05 77.21 88.32 189.1 215.76 141.63 131.39 164.92
Syria 1 777.48 10 395.40 9 168.42 11 930.91 13 604.16 13 732.45 1 502.36 621.60
Tajikistan 438.75 834.52 624.86 779.35 1 081.44 998.73 770.03 1 066.08
Togo 153.53 329.12 360.54 435.62 510.77 718.1 437.94 979.57
Tunisia 1 414.96 2 194.60 2 609.57 3 220.80 3 479.63 3 503.23 2 696.73 2 845.05
Turkey 14 154.80 20 858.22 23 169.84 34 346.91 41 090.11 32 574.25 38 552.74 34 794.25
Turkmenistan 1 330.54 1 901.54 1 470.68 2 413.88 2 885.69 3 019.00 1 279.77 1 090.34United Arab Emirates 14 280.97 21 355.77 25 027.50 45 660.33 52 539.69 55 397.85 57 513.77 70 265.18
Uganda 145.16 533.33 530.26 767.57 809.6 751.49 1 265.92 1 391.81
Uzbekistan 830.44 1 350.67 1 357.64 1 896.82 2 705.85 2 527.29 2 506.82 3 544.52
Yemen 1 447.24 2 389.95 2 073.51 3 149.56 3 921.58 3 553.72 1 591.64 1 932.69
TOTAL OCI 135 727.23 210 300.93 213 379.85 340792.53 388 069.85 347114.68 322 165.79 375 778.04
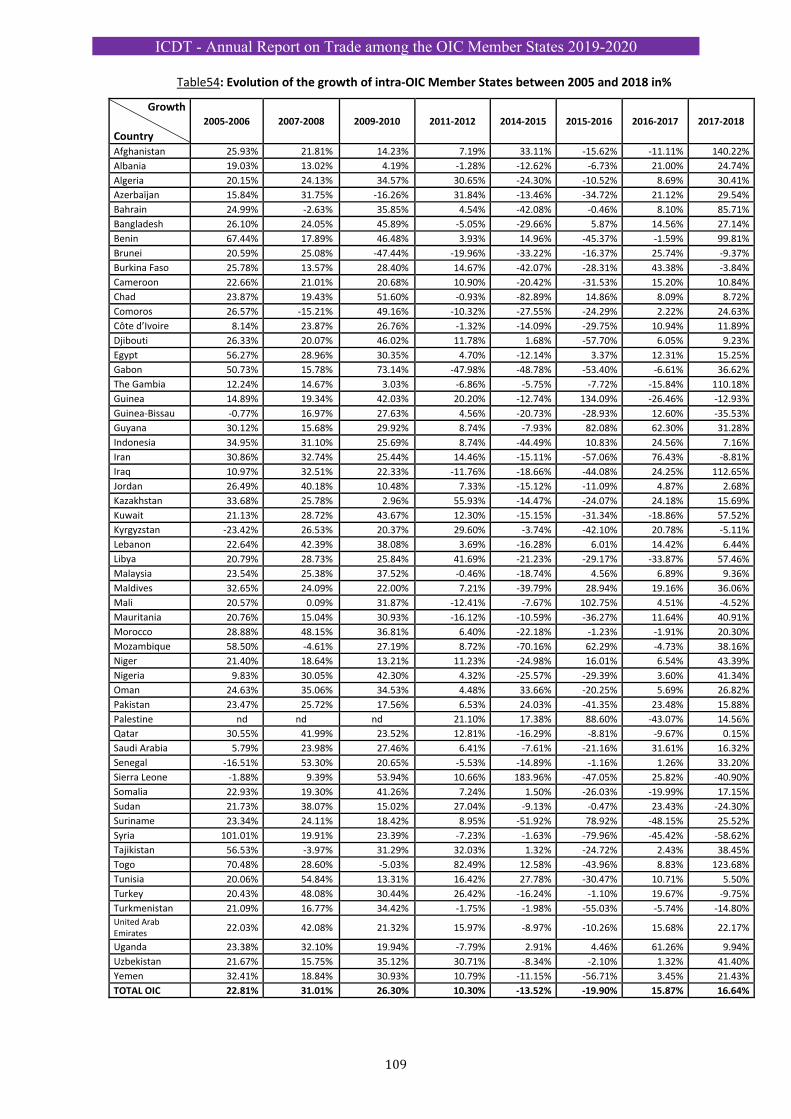
ICDT - Annual Report on Trade among the OIC Member States 2019-2020
109
Table54: Evolution of the growth of intra‐OIC Member States between 2005 and 2018 in%
Growth
Country
2005‐2006 2007‐2008 2009‐2010 2011‐2012 2014‐2015 2015‐2016 2016‐2017 2017‐2018
Afghanistan 25.93% 21.81% 14.23% 7.19% 33.11% ‐15.62% ‐11.11% 140.22%
Albania 19.03% 13.02% 4.19% ‐1.28% ‐12.62% ‐6.73% 21.00% 24.74%
Algeria 20.15% 24.13% 34.57% 30.65% ‐24.30% ‐10.52% 8.69% 30.41%
Azerbaïjan 15.84% 31.75% ‐16.26% 31.84% ‐13.46% ‐34.72% 21.12% 29.54%
Bahrain 24.99% ‐2.63% 35.85% 4.54% ‐42.08% ‐0.46% 8.10% 85.71%
Bangladesh 26.10% 24.05% 45.89% ‐5.05% ‐29.66% 5.87% 14.56% 27.14%
Benin 67.44% 17.89% 46.48% 3.93% 14.96% ‐45.37% ‐1.59% 99.81%
Brunei 20.59% 25.08% ‐47.44% ‐19.96% ‐33.22% ‐16.37% 25.74% ‐9.37%
Burkina Faso 25.78% 13.57% 28.40% 14.67% ‐42.07% ‐28.31% 43.38% ‐3.84%
Cameroon 22.66% 21.01% 20.68% 10.90% ‐20.42% ‐31.53% 15.20% 10.84%
Chad 23.87% 19.43% 51.60% ‐0.93% ‐82.89% 14.86% 8.09% 8.72%
Comoros 26.57% ‐15.21% 49.16% ‐10.32% ‐27.55% ‐24.29% 2.22% 24.63%
Côte d’Ivoire 8.14% 23.87% 26.76% ‐1.32% ‐14.09% ‐29.75% 10.94% 11.89%
Djibouti 26.33% 20.07% 46.02% 11.78% 1.68% ‐57.70% 6.05% 9.23%
Egypt 56.27% 28.96% 30.35% 4.70% ‐12.14% 3.37% 12.31% 15.25%
Gabon 50.73% 15.78% 73.14% ‐47.98% ‐48.78% ‐53.40% ‐6.61% 36.62%
The Gambia 12.24% 14.67% 3.03% ‐6.86% ‐5.75% ‐7.72% ‐15.84% 110.18%
Guinea 14.89% 19.34% 42.03% 20.20% ‐12.74% 134.09% ‐26.46% ‐12.93%
Guinea‐Bissau ‐0.77% 16.97% 27.63% 4.56% ‐20.73% ‐28.93% 12.60% ‐35.53%
Guyana 30.12% 15.68% 29.92% 8.74% ‐7.93% 82.08% 62.30% 31.28%
Indonesia 34.95% 31.10% 25.69% 8.74% ‐44.49% 10.83% 24.56% 7.16%
Iran 30.86% 32.74% 25.44% 14.46% ‐15.11% ‐57.06% 76.43% ‐8.81%
Iraq 10.97% 32.51% 22.33% ‐11.76% ‐18.66% ‐44.08% 24.25% 112.65%
Jordan 26.49% 40.18% 10.48% 7.33% ‐15.12% ‐11.09% 4.87% 2.68%
Kazakhstan 33.68% 25.78% 2.96% 55.93% ‐14.47% ‐24.07% 24.18% 15.69%
Kuwait 21.13% 28.72% 43.67% 12.30% ‐15.15% ‐31.34% ‐18.86% 57.52%
Kyrgyzstan ‐23.42% 26.53% 20.37% 29.60% ‐3.74% ‐42.10% 20.78% ‐5.11%
Lebanon 22.64% 42.39% 38.08% 3.69% ‐16.28% 6.01% 14.42% 6.44%
Libya 20.79% 28.73% 25.84% 41.69% ‐21.23% ‐29.17% ‐33.87% 57.46%
Malaysia 23.54% 25.38% 37.52% ‐0.46% ‐18.74% 4.56% 6.89% 9.36%
Maldives 32.65% 24.09% 22.00% 7.21% ‐39.79% 28.94% 19.16% 36.06%
Mali 20.57% 0.09% 31.87% ‐12.41% ‐7.67% 102.75% 4.51% ‐4.52%
Mauritania 20.76% 15.04% 30.93% ‐16.12% ‐10.59% ‐36.27% 11.64% 40.91%
Morocco 28.88% 48.15% 36.81% 6.40% ‐22.18% ‐1.23% ‐1.91% 20.30%
Mozambique 58.50% ‐4.61% 27.19% 8.72% ‐70.16% 62.29% ‐4.73% 38.16%
Niger 21.40% 18.64% 13.21% 11.23% ‐24.98% 16.01% 6.54% 43.39%
Nigeria 9.83% 30.05% 42.30% 4.32% ‐25.57% ‐29.39% 3.60% 41.34%
Oman 24.63% 35.06% 34.53% 4.48% 33.66% ‐20.25% 5.69% 26.82%
Pakistan 23.47% 25.72% 17.56% 6.53% 24.03% ‐41.35% 23.48% 15.88%
Palestine nd nd nd 21.10% 17.38% 88.60% ‐43.07% 14.56%
Qatar 30.55% 41.99% 23.52% 12.81% ‐16.29% ‐8.81% ‐9.67% 0.15%
Saudi Arabia 5.79% 23.98% 27.46% 6.41% ‐7.61% ‐21.16% 31.61% 16.32%
Senegal ‐16.51% 53.30% 20.65% ‐5.53% ‐14.89% ‐1.16% 1.26% 33.20%
Sierra Leone ‐1.88% 9.39% 53.94% 10.66% 183.96% ‐47.05% 25.82% ‐40.90%
Somalia 22.93% 19.30% 41.26% 7.24% 1.50% ‐26.03% ‐19.99% 17.15%
Sudan 21.73% 38.07% 15.02% 27.04% ‐9.13% ‐0.47% 23.43% ‐24.30%
Suriname 23.34% 24.11% 18.42% 8.95% ‐51.92% 78.92% ‐48.15% 25.52%
Syria 101.01% 19.91% 23.39% ‐7.23% ‐1.63% ‐79.96% ‐45.42% ‐58.62%
Tajikistan 56.53% ‐3.97% 31.29% 32.03% 1.32% ‐24.72% 2.43% 38.45%
Togo 70.48% 28.60% ‐5.03% 82.49% 12.58% ‐43.96% 8.83% 123.68%
Tunisia 20.06% 54.84% 13.31% 16.42% 27.78% ‐30.47% 10.71% 5.50%
Turkey 20.43% 48.08% 30.44% 26.42% ‐16.24% ‐1.10% 19.67% ‐9.75%
Turkmenistan 21.09% 16.77% 34.42% ‐1.75% ‐1.98% ‐55.03% ‐5.74% ‐14.80%United Arab Emirates 22.03% 42.08% 21.32% 15.97% ‐8.97% ‐10.26% 15.68% 22.17%
Uganda 23.38% 32.10% 19.94% ‐7.79% 2.91% 4.46% 61.26% 9.94%
Uzbekistan 21.67% 15.75% 35.12% 30.71% ‐8.34% ‐2.10% 1.32% 41.40%
Yemen 32.41% 18.84% 30.93% 10.79% ‐11.15% ‐56.71% 3.45% 21.43%
TOTAL OIC 22.81% 31.01% 26.30% 10.30% ‐13.52% ‐19.90% 15.87% 16.64%
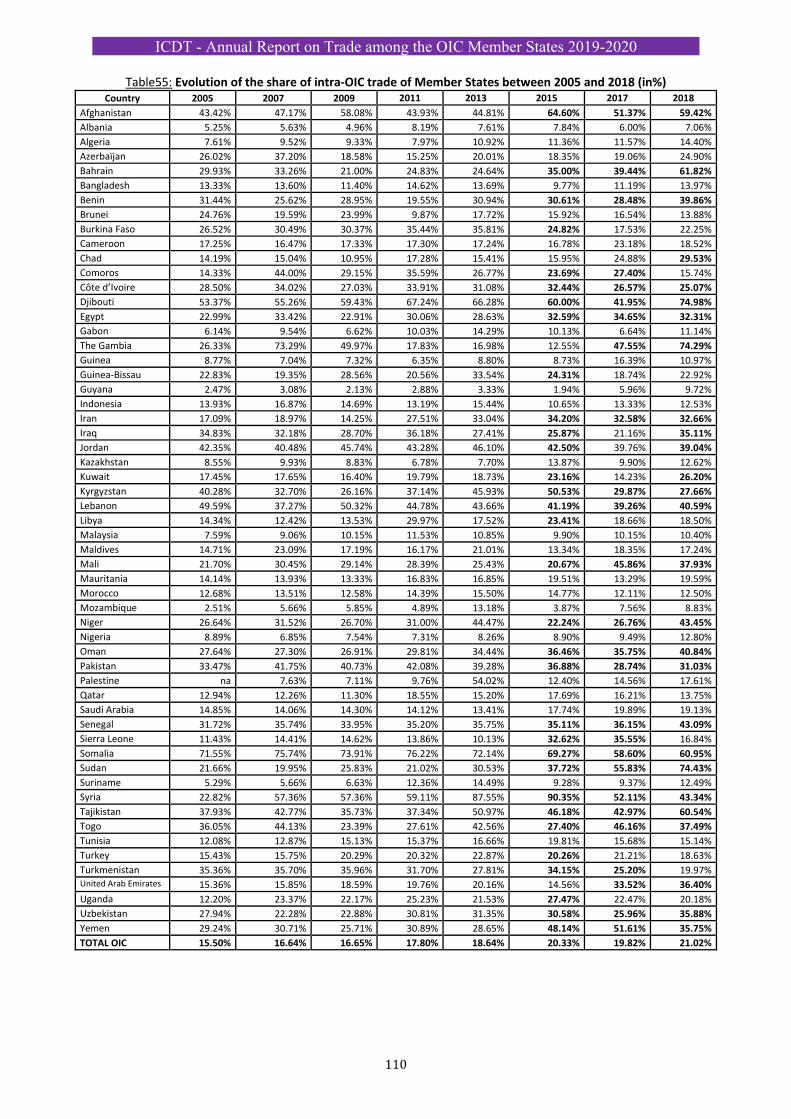
ICDT - Annual Report on Trade among the OIC Member States 2019-2020
110
Table55: Evolution of the share of intra‐OIC trade of Member States between 2005 and 2018 (in%) Country 2005 2007 2009 2011 2013 2015 2017 2018
Afghanistan 43.42% 47.17% 58.08% 43.93% 44.81% 64.60% 51.37% 59.42%
Albania 5.25% 5.63% 4.96% 8.19% 7.61% 7.84% 6.00% 7.06%
Algeria 7.61% 9.52% 9.33% 7.97% 10.92% 11.36% 11.57% 14.40%
Azerbaïjan 26.02% 37.20% 18.58% 15.25% 20.01% 18.35% 19.06% 24.90%
Bahrain 29.93% 33.26% 21.00% 24.83% 24.64% 35.00% 39.44% 61.82%
Bangladesh 13.33% 13.60% 11.40% 14.62% 13.69% 9.77% 11.19% 13.97%
Benin 31.44% 25.62% 28.95% 19.55% 30.94% 30.61% 28.48% 39.86%
Brunei 24.76% 19.59% 23.99% 9.87% 17.72% 15.92% 16.54% 13.88%
Burkina Faso 26.52% 30.49% 30.37% 35.44% 35.81% 24.82% 17.53% 22.25%
Cameroon 17.25% 16.47% 17.33% 17.30% 17.24% 16.78% 23.18% 18.52%
Chad 14.19% 15.04% 10.95% 17.28% 15.41% 15.95% 24.88% 29.53%
Comoros 14.33% 44.00% 29.15% 35.59% 26.77% 23.69% 27.40% 15.74%
Côte d’Ivoire 28.50% 34.02% 27.03% 33.91% 31.08% 32.44% 26.57% 25.07%
Djibouti 53.37% 55.26% 59.43% 67.24% 66.28% 60.00% 41.95% 74.98%
Egypt 22.99% 33.42% 22.91% 30.06% 28.63% 32.59% 34.65% 32.31%
Gabon 6.14% 9.54% 6.62% 10.03% 14.29% 10.13% 6.64% 11.14%
The Gambia 26.33% 73.29% 49.97% 17.83% 16.98% 12.55% 47.55% 74.29%
Guinea 8.77% 7.04% 7.32% 6.35% 8.80% 8.73% 16.39% 10.97%
Guinea‐Bissau 22.83% 19.35% 28.56% 20.56% 33.54% 24.31% 18.74% 22.92%
Guyana 2.47% 3.08% 2.13% 2.88% 3.33% 1.94% 5.96% 9.72%
Indonesia 13.93% 16.87% 14.69% 13.19% 15.44% 10.65% 13.33% 12.53%
Iran 17.09% 18.97% 14.25% 27.51% 33.04% 34.20% 32.58% 32.66%
Iraq 34.83% 32.18% 28.70% 36.18% 27.41% 25.87% 21.16% 35.11%
Jordan 42.35% 40.48% 45.74% 43.28% 46.10% 42.50% 39.76% 39.04%
Kazakhstan 8.55% 9.93% 8.83% 6.78% 7.70% 13.87% 9.90% 12.62%
Kuwait 17.45% 17.65% 16.40% 19.79% 18.73% 23.16% 14.23% 26.20%
Kyrgyzstan 40.28% 32.70% 26.16% 37.14% 45.93% 50.53% 29.87% 27.66%
Lebanon 49.59% 37.27% 50.32% 44.78% 43.66% 41.19% 39.26% 40.59%
Libya 14.34% 12.42% 13.53% 29.97% 17.52% 23.41% 18.66% 18.50%
Malaysia 7.59% 9.06% 10.15% 11.53% 10.85% 9.90% 10.15% 10.40%
Maldives 14.71% 23.09% 17.19% 16.17% 21.01% 13.34% 18.35% 17.24%
Mali 21.70% 30.45% 29.14% 28.39% 25.43% 20.67% 45.86% 37.93%
Mauritania 14.14% 13.93% 13.33% 16.83% 16.85% 19.51% 13.29% 19.59%
Morocco 12.68% 13.51% 12.58% 14.39% 15.50% 14.77% 12.11% 12.50%
Mozambique 2.51% 5.66% 5.85% 4.89% 13.18% 3.87% 7.56% 8.83%
Niger 26.64% 31.52% 26.70% 31.00% 44.47% 22.24% 26.76% 43.45%
Nigeria 8.89% 6.85% 7.54% 7.31% 8.26% 8.90% 9.49% 12.80%
Oman 27.64% 27.30% 26.91% 29.81% 34.44% 36.46% 35.75% 40.84%
Pakistan 33.47% 41.75% 40.73% 42.08% 39.28% 36.88% 28.74% 31.03%
Palestine na 7.63% 7.11% 9.76% 54.02% 12.40% 14.56% 17.61%
Qatar 12.94% 12.26% 11.30% 18.55% 15.20% 17.69% 16.21% 13.75%
Saudi Arabia 14.85% 14.06% 14.30% 14.12% 13.41% 17.74% 19.89% 19.13%
Senegal 31.72% 35.74% 33.95% 35.20% 35.75% 35.11% 36.15% 43.09%
Sierra Leone 11.43% 14.41% 14.62% 13.86% 10.13% 32.62% 35.55% 16.84%
Somalia 71.55% 75.74% 73.91% 76.22% 72.14% 69.27% 58.60% 60.95%
Sudan 21.66% 19.95% 25.83% 21.02% 30.53% 37.72% 55.83% 74.43%
Suriname 5.29% 5.66% 6.63% 12.36% 14.49% 9.28% 9.37% 12.49%
Syria 22.82% 57.36% 57.36% 59.11% 87.55% 90.35% 52.11% 43.34%
Tajikistan 37.93% 42.77% 35.73% 37.34% 50.97% 46.18% 42.97% 60.54%
Togo 36.05% 44.13% 23.39% 27.61% 42.56% 27.40% 46.16% 37.49%
Tunisia 12.08% 12.87% 15.13% 15.37% 16.66% 19.81% 15.68% 15.14%
Turkey 15.43% 15.75% 20.29% 20.32% 22.87% 20.26% 21.21% 18.63%
Turkmenistan 35.36% 35.70% 35.96% 31.70% 27.81% 34.15% 25.20% 19.97%United Arab Emirates 15.36% 15.85% 18.59% 19.76% 20.16% 14.56% 33.52% 36.40%
Uganda 12.20% 23.37% 22.17% 25.23% 21.53% 27.47% 22.47% 20.18%
Uzbekistan 27.94% 22.28% 22.88% 30.81% 31.35% 30.58% 25.96% 35.88%
Yemen 29.24% 30.71% 25.71% 30.89% 28.65% 48.14% 51.61% 35.75%
TOTAL OIC 15.50% 16.64% 16.65% 17.80% 18.64% 20.33% 19.82% 21.02%
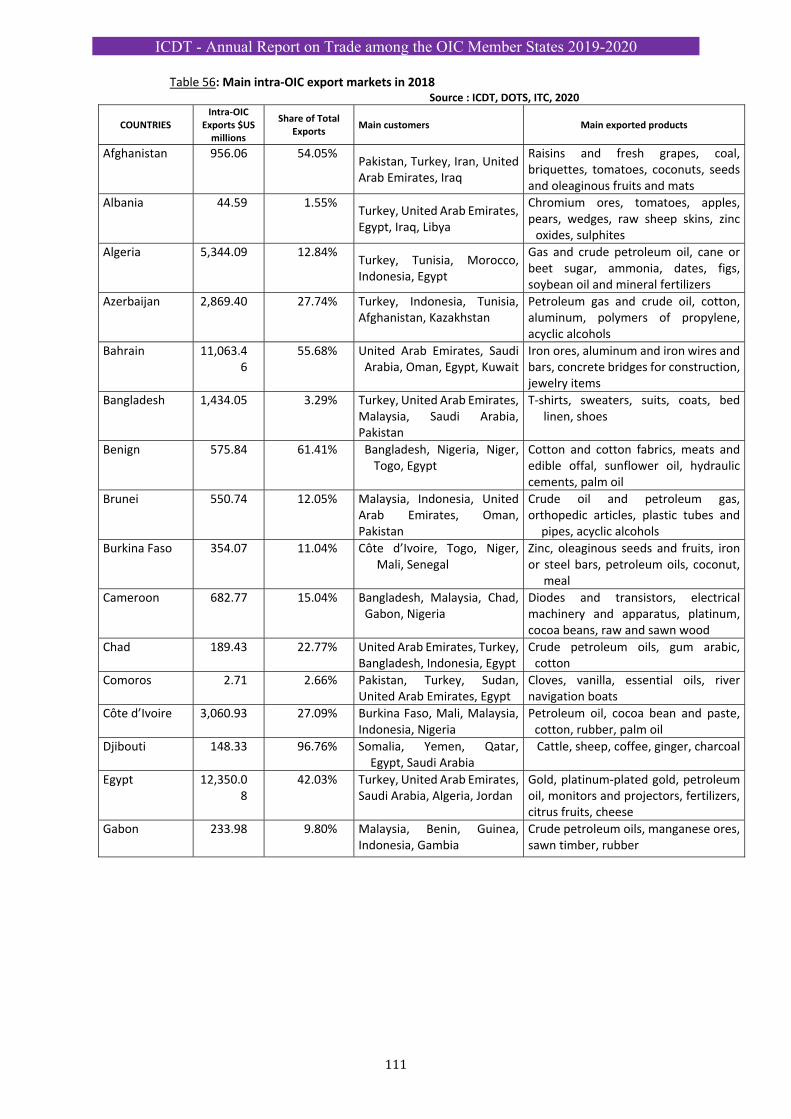
ICDT - Annual Report on Trade among the OIC Member States 2019-2020
111
Table 56: Main intra‐OIC export markets in 2018 Source : ICDT, DOTS, ITC, 2020
COUNTRIES Intra‐OIC
Exports $US millions
Share of Total Exports
Main customers Main exported products
Afghanistan 956.06 54.05%Pakistan, Turkey, Iran, United Arab Emirates, Iraq
Raisins and fresh grapes, coal, briquettes, tomatoes, coconuts, seeds and oleaginous fruits and mats
Albania 44.59 1.55%Turkey, United Arab Emirates, Egypt, Iraq, Libya
Chromium ores, tomatoes, apples, pears, wedges, raw sheep skins, zinc oxides, sulphites
Algeria 5,344.09 12.84%Turkey, Tunisia, Morocco, Indonesia, Egypt
Gas and crude petroleum oil, cane or beet sugar, ammonia, dates, figs, soybean oil and mineral fertilizers
Azerbaijan 2,869.40 27.74% Turkey, Indonesia, Tunisia, Afghanistan, Kazakhstan
Petroleum gas and crude oil, cotton, aluminum, polymers of propylene, acyclic alcohols
Bahrain 11,063.46
55.68% United Arab Emirates, Saudi Arabia, Oman, Egypt, Kuwait
Iron ores, aluminum and iron wires and bars, concrete bridges for construction, jewelry items
Bangladesh 1,434.05 3.29% Turkey, United Arab Emirates, Malaysia, Saudi Arabia, Pakistan
T‐shirts, sweaters, suits, coats, bed linen, shoes
Benign 575.84 61.41% Bangladesh, Nigeria, Niger, Togo, Egypt
Cotton and cotton fabrics, meats and edible offal, sunflower oil, hydraulic cements, palm oil
Brunei 550.74 12.05% Malaysia, Indonesia, United Arab Emirates, Oman, Pakistan
Crude oil and petroleum gas, orthopedic articles, plastic tubes and
pipes, acyclic alcohols
Burkina Faso 354.07 11.04% Côte d’Ivoire, Togo, Niger, Mali, Senegal
Zinc, oleaginous seeds and fruits, iron or steel bars, petroleum oils, coconut,
meal
Cameroon 682.77 15.04% Bangladesh, Malaysia, Chad, Gabon, Nigeria
Diodes and transistors, electrical machinery and apparatus, platinum, cocoa beans, raw and sawn wood
Chad 189.43 22.77% United Arab Emirates, Turkey, Bangladesh, Indonesia, Egypt
Crude petroleum oils, gum arabic, cotton
Comoros 2.71 2.66% Pakistan, Turkey, Sudan, United Arab Emirates, Egypt
Cloves, vanilla, essential oils, river navigation boats
Côte d’Ivoire 3,060.93 27.09% Burkina Faso, Mali, Malaysia, Indonesia, Nigeria
Petroleum oil, cocoa bean and paste, cotton, rubber, palm oil
Djibouti 148.33 96.76% Somalia, Yemen, Qatar, Egypt, Saudi Arabia
Cattle, sheep, coffee, ginger, charcoal
Egypt 12,350.08
42.03% Turkey, United Arab Emirates, Saudi Arabia, Algeria, Jordan
Gold, platinum‐plated gold, petroleum oil, monitors and projectors, fertilizers, citrus fruits, cheese
Gabon 233.98 9.80% Malaysia, Benin, Guinea, Indonesia, Gambia
Crude petroleum oils, manganese ores, sawn timber, rubber
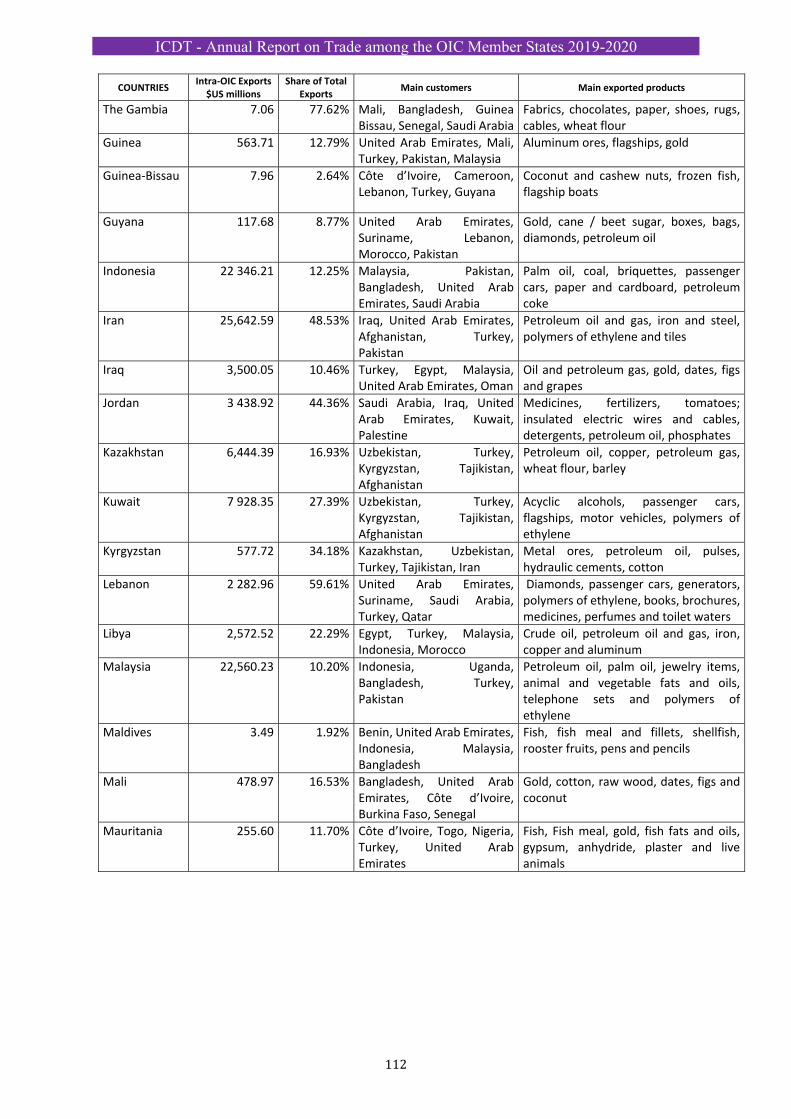
ICDT - Annual Report on Trade among the OIC Member States 2019-2020
112
COUNTRIES Intra‐OIC Exports
$US millions Share of Total
Exports Main customers Main exported products
The Gambia 7.06 77.62% Mali, Bangladesh, Guinea Bissau, Senegal, Saudi Arabia
Fabrics, chocolates, paper, shoes, rugs, cables, wheat flour
Guinea 563.71 12.79% United Arab Emirates, Mali, Turkey, Pakistan, Malaysia
Aluminum ores, flagships, gold
Guinea‐Bissau 7.96 2.64% Côte d’Ivoire, Cameroon, Lebanon, Turkey, Guyana
Coconut and cashew nuts, frozen fish, flagship boats
Guyana 117.68 8.77% United Arab Emirates, Suriname, Lebanon, Morocco, Pakistan
Gold, cane / beet sugar, boxes, bags, diamonds, petroleum oil
Indonesia 22 346.21 12.25% Malaysia, Pakistan, Bangladesh, United Arab Emirates, Saudi Arabia
Palm oil, coal, briquettes, passenger cars, paper and cardboard, petroleum coke
Iran 25,642.59 48.53% Iraq, United Arab Emirates, Afghanistan, Turkey, Pakistan
Petroleum oil and gas, iron and steel, polymers of ethylene and tiles
Iraq 3,500.05 10.46% Turkey, Egypt, Malaysia, United Arab Emirates, Oman
Oil and petroleum gas, gold, dates, figs and grapes
Jordan 3 438.92 44.36% Saudi Arabia, Iraq, United Arab Emirates, Kuwait, Palestine
Medicines, fertilizers, tomatoes; insulated electric wires and cables, detergents, petroleum oil, phosphates
Kazakhstan 6,444.39 16.93% Uzbekistan, Turkey, Kyrgyzstan, Tajikistan, Afghanistan
Petroleum oil, copper, petroleum gas, wheat flour, barley
Kuwait 7 928.35 27.39% Uzbekistan, Turkey, Kyrgyzstan, Tajikistan, Afghanistan
Acyclic alcohols, passenger cars, flagships, motor vehicles, polymers of ethylene
Kyrgyzstan 577.72 34.18% Kazakhstan, Uzbekistan, Turkey, Tajikistan, Iran
Metal ores, petroleum oil, pulses, hydraulic cements, cotton
Lebanon 2 282.96 59.61% United Arab Emirates, Suriname, Saudi Arabia, Turkey, Qatar
Diamonds, passenger cars, generators, polymers of ethylene, books, brochures, medicines, perfumes and toilet waters
Libya 2,572.52 22.29% Egypt, Turkey, Malaysia, Indonesia, Morocco
Crude oil, petroleum oil and gas, iron, copper and aluminum
Malaysia 22,560.23 10.20% Indonesia, Uganda, Bangladesh, Turkey, Pakistan
Petroleum oil, palm oil, jewelry items, animal and vegetable fats and oils, telephone sets and polymers of ethylene
Maldives 3.49 1.92% Benin, United Arab Emirates, Indonesia, Malaysia, Bangladesh
Fish, fish meal and fillets, shellfish, rooster fruits, pens and pencils
Mali 478.97 16.53% Bangladesh, United Arab Emirates, Côte d’Ivoire, Burkina Faso, Senegal
Gold, cotton, raw wood, dates, figs and coconut
Mauritania 255.60 11.70% Côte d’Ivoire, Togo, Nigeria, Turkey, United Arab Emirates
Fish, Fish meal, gold, fish fats and oils, gypsum, anhydride, plaster and live animals
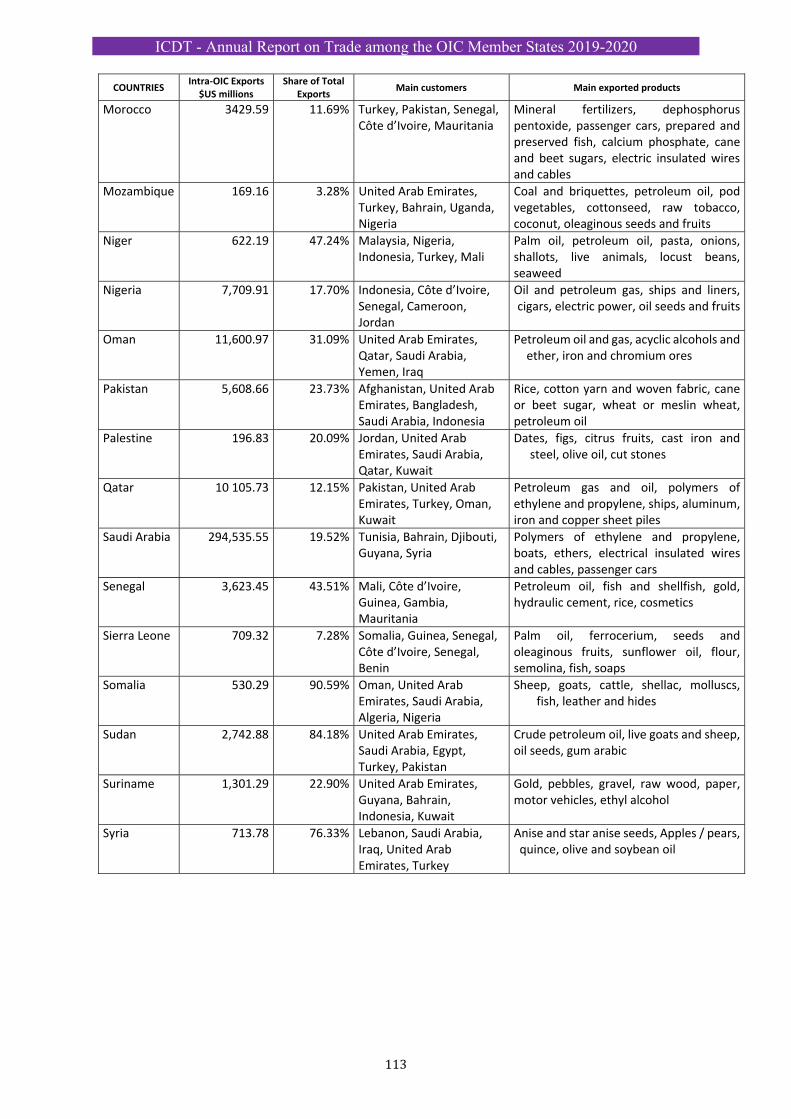
ICDT - Annual Report on Trade among the OIC Member States 2019-2020
113
COUNTRIES Intra‐OIC Exports
$US millions Share of Total
Exports Main customers Main exported products
Morocco 3429.59 11.69% Turkey, Pakistan, Senegal, Côte d’Ivoire, Mauritania
Mineral fertilizers, dephosphorus pentoxide, passenger cars, prepared and preserved fish, calcium phosphate, cane and beet sugars, electric insulated wires and cables
Mozambique 169.16 3.28% United Arab Emirates, Turkey, Bahrain, Uganda, Nigeria
Coal and briquettes, petroleum oil, pod vegetables, cottonseed, raw tobacco, coconut, oleaginous seeds and fruits
Niger 622.19 47.24% Malaysia, Nigeria, Indonesia, Turkey, Mali
Palm oil, petroleum oil, pasta, onions, shallots, live animals, locust beans, seaweed
Nigeria 7,709.91 17.70% Indonesia, Côte d’Ivoire, Senegal, Cameroon, Jordan
Oil and petroleum gas, ships and liners, cigars, electric power, oil seeds and fruits
Oman 11,600.97 31.09% United Arab Emirates, Qatar, Saudi Arabia, Yemen, Iraq
Petroleum oil and gas, acyclic alcohols and ether, iron and chromium ores
Pakistan 5,608.66 23.73% Afghanistan, United Arab Emirates, Bangladesh, Saudi Arabia, Indonesia
Rice, cotton yarn and woven fabric, cane or beet sugar, wheat or meslin wheat, petroleum oil
Palestine 196.83 20.09% Jordan, United Arab Emirates, Saudi Arabia, Qatar, Kuwait
Dates, figs, citrus fruits, cast iron and steel, olive oil, cut stones
Qatar 10 105.73 12.15% Pakistan, United Arab Emirates, Turkey, Oman, Kuwait
Petroleum gas and oil, polymers of ethylene and propylene, ships, aluminum, iron and copper sheet piles
Saudi Arabia 294,535.55 19.52% Tunisia, Bahrain, Djibouti, Guyana, Syria
Polymers of ethylene and propylene, boats, ethers, electrical insulated wires and cables, passenger cars
Senegal 3,623.45 43.51% Mali, Côte d’Ivoire, Guinea, Gambia, Mauritania
Petroleum oil, fish and shellfish, gold, hydraulic cement, rice, cosmetics
Sierra Leone 709.32 7.28% Somalia, Guinea, Senegal, Côte d’Ivoire, Senegal, Benin
Palm oil, ferrocerium, seeds and oleaginous fruits, sunflower oil, flour, semolina, fish, soaps
Somalia 530.29 90.59% Oman, United Arab Emirates, Saudi Arabia, Algeria, Nigeria
Sheep, goats, cattle, shellac, molluscs, fish, leather and hides
Sudan 2,742.88 84.18% United Arab Emirates, Saudi Arabia, Egypt, Turkey, Pakistan
Crude petroleum oil, live goats and sheep, oil seeds, gum arabic
Suriname 1,301.29 22.90% United Arab Emirates, Guyana, Bahrain, Indonesia, Kuwait
Gold, pebbles, gravel, raw wood, paper, motor vehicles, ethyl alcohol
Syria 713.78 76.33% Lebanon, Saudi Arabia, Iraq, United Arab Emirates, Turkey
Anise and star anise seeds, Apples / pears, quince, olive and soybean oil
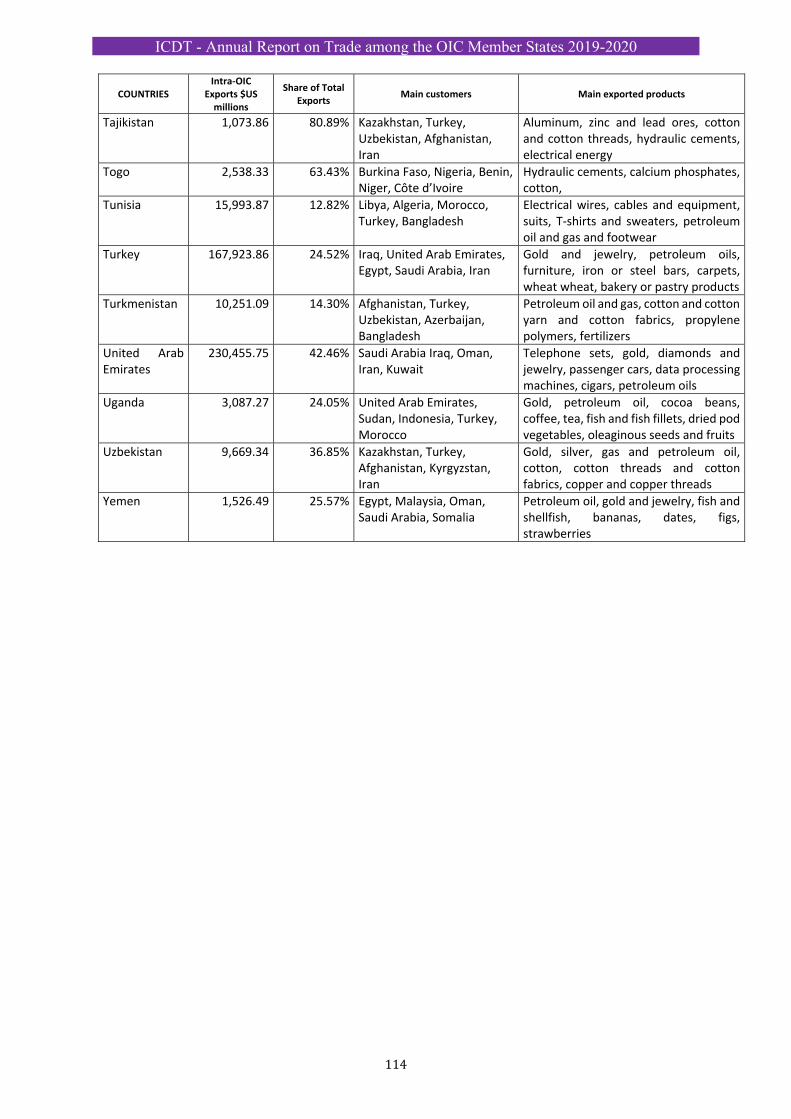
ICDT - Annual Report on Trade among the OIC Member States 2019-2020
114
COUNTRIES Intra‐OIC
Exports $US millions
Share of Total Exports
Main customers Main exported products
Tajikistan 1,073.86 80.89% Kazakhstan, Turkey, Uzbekistan, Afghanistan, Iran
Aluminum, zinc and lead ores, cotton and cotton threads, hydraulic cements, electrical energy
Togo 2,538.33 63.43% Burkina Faso, Nigeria, Benin, Niger, Côte d’Ivoire
Hydraulic cements, calcium phosphates, cotton,
Tunisia 15,993.87 12.82% Libya, Algeria, Morocco, Turkey, Bangladesh
Electrical wires, cables and equipment, suits, T‐shirts and sweaters, petroleum oil and gas and footwear
Turkey 167,923.86 24.52% Iraq, United Arab Emirates, Egypt, Saudi Arabia, Iran
Gold and jewelry, petroleum oils, furniture, iron or steel bars, carpets, wheat wheat, bakery or pastry products
Turkmenistan 10,251.09 14.30% Afghanistan, Turkey, Uzbekistan, Azerbaijan, Bangladesh
Petroleum oil and gas, cotton and cotton yarn and cotton fabrics, propylene polymers, fertilizers
United Arab Emirates
230,455.75 42.46% Saudi Arabia Iraq, Oman, Iran, Kuwait
Telephone sets, gold, diamonds and jewelry, passenger cars, data processing machines, cigars, petroleum oils
Uganda 3,087.27 24.05% United Arab Emirates, Sudan, Indonesia, Turkey, Morocco
Gold, petroleum oil, cocoa beans, coffee, tea, fish and fish fillets, dried pod vegetables, oleaginous seeds and fruits
Uzbekistan 9,669.34 36.85% Kazakhstan, Turkey, Afghanistan, Kyrgyzstan, Iran
Gold, silver, gas and petroleum oil, cotton, cotton threads and cotton fabrics, copper and copper threads
Yemen 1,526.49 25.57% Egypt, Malaysia, Oman, Saudi Arabia, Somalia
Petroleum oil, gold and jewelry, fish and shellfish, bananas, dates, figs, strawberries
ICDT - Annual Report on Trade among the OIC Member States 2019-2020
115
µ
PART II
MAIN OBSTACLES TO THE DEVELOPMENT
OF TRADE AMONG OIC MEMBER STATES
AND INTRA‐OIC TRADE AND INVESTMENT PROMOTION ACTIVITIES
ICDT - Annual Report on Trade among the OIC Member States 2019-2020
116
CHAPTER I:
BARRIERS TO INTRA‐OIC TRADE
ICDT - Annual Report on Trade among the OIC Member States 2019-2020
117
SECTION I: BARRIERS TO INTRA‐OIC TRADE
OIC Member States have signed several bilateral, regional, and multilateral trade and investment agreements to better regulate trade and investment flows and further liberalize international trade transactions with local incentives.
The WTO Trade Facilitation Agreement (TFA), which came into force on 22 February 2017, following its ratification by two‐thirds of WTO members, contains provisions to speed up the movement, the release and customs clearance of goods, an effective cooperation between customs and other relevant authorities on trade facilitation and customs compliance issues. The TFA, in its Category C, provides technical assistance and capacity building in this area for the benefit of Member States to set policies and implement activities to facilitate trade flows.
Despite these agreements and incentives for trade and investment, some measures and laws have contributed to the development of cooperative relationships but have also hampered the acceleration of these flows at both technical and procedural levels.
Studies conducted by the International Trade Centre (ITC) and UNCTAD over a decade on Non‐Tariff Trade Measures (NTBs) have shown that States apply more restrictive domestic measures to companies than those encountered with commercial partners.
According to Global Trade Alert (GTA) statistics for March 2020, about 15,431 trade measures have been applied by the Member States and which have contributed to hamper the expansion of intra‐OIC trade, and also with their partners between 2015 and 2018. These measures have impacted 215 partner countries.
Indeed, the most important measures applied by Member States are: import tariffs (5,987 cases), financial subsidies (1,414 cases), export subsidies (1,392 cases), export tariffs (1,227 cases), non‐tariff import measures (838 cases), import licensing (729 cases), safeguard measures (582 cases), anti‐dumping measures (417 cases), non‐tariff export measures (374 cases), import quotas (362 cases), local content (281 cases), financial incentives for FDI (274 cases), export licensing (271 cases), internal import taxes (252 cases), import bans (243 cases) and export quotas (202 cases).
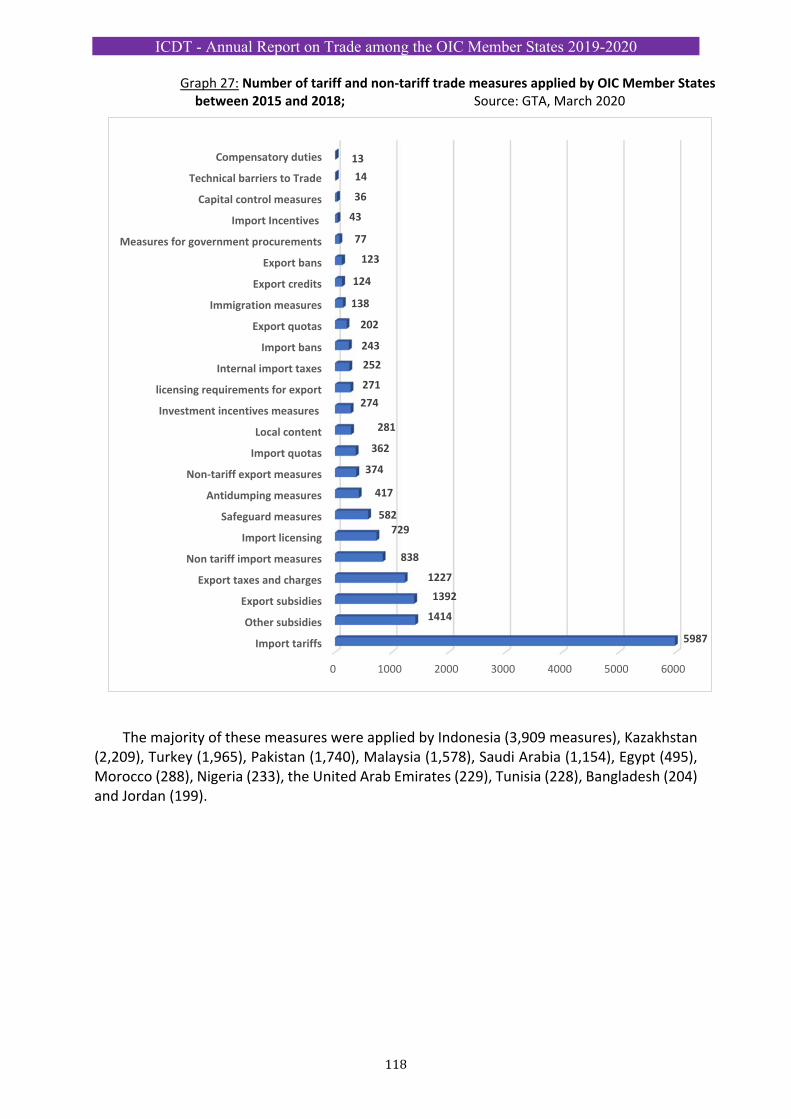
ICDT - Annual Report on Trade among the OIC Member States 2019-2020
118
Graph 27: Number of tariff and non‐tariff trade measures applied by OIC Member States between 2015 and 2018; Source: GTA, March 2020
The majority of these measures were applied by Indonesia (3,909 measures), Kazakhstan (2,209), Turkey (1,965), Pakistan (1,740), Malaysia (1,578), Saudi Arabia (1,154), Egypt (495), Morocco (288), Nigeria (233), the United Arab Emirates (229), Tunisia (228), Bangladesh (204) and Jordan (199).
0 1000 2000 3000 4000 5000 6000
Import tariffs
Other subsidies
Export subsidies
Export taxes and charges
Non tariff import measures
Import licensing
Safeguard measures
Antidumping measures
Non‐tariff export measures
Import quotas
Local content
Investment incentives measures
licensing requirements for export
Internal import taxes
Import bans
Export quotas
Immigration measures
Export credits
Export bans
Measures for government procurements
Import Incentives
Capital control measures
Technical barriers to Trade
Compensatory duties
5987
1414
1392
1227
838
729582
417
374
362
281
274
271
252
243
202
138
124
123
77
43
36
14
13
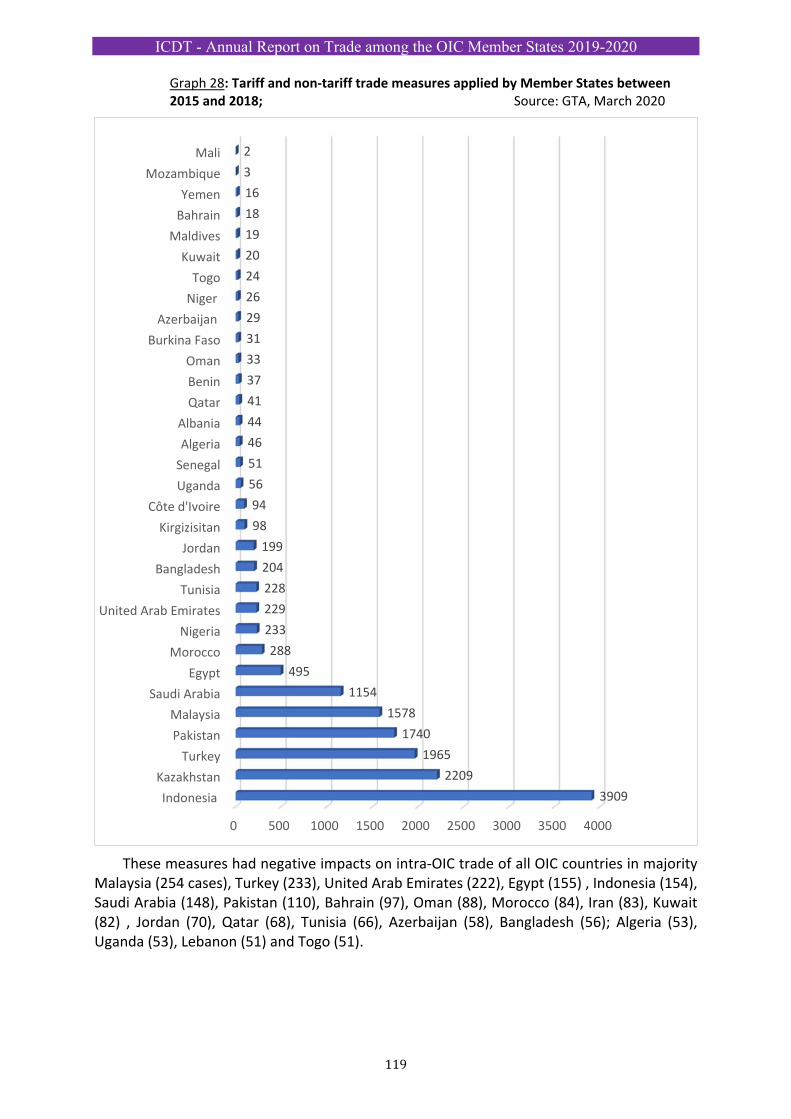
ICDT - Annual Report on Trade among the OIC Member States 2019-2020
119
Graph 28: Tariff and non‐tariff trade measures applied by Member States between 2015 and 2018; Source: GTA, March 2020
These measures had negative impacts on intra‐OIC trade of all OIC countries in majority Malaysia (254 cases), Turkey (233), United Arab Emirates (222), Egypt (155) , Indonesia (154), Saudi Arabia (148), Pakistan (110), Bahrain (97), Oman (88), Morocco (84), Iran (83), Kuwait (82) , Jordan (70), Qatar (68), Tunisia (66), Azerbaijan (58), Bangladesh (56); Algeria (53), Uganda (53), Lebanon (51) and Togo (51).
0 500 1000 1500 2000 2500 3000 3500 4000
Indonesia
Kazakhstan
Turkey
Pakistan
Malaysia
Saudi Arabia
Egypt
Morocco
Nigeria
United Arab Emirates
Tunisia
Bangladesh
Jordan
Kirgizisitan
Côte d'Ivoire
Uganda
Senegal
Algeria
Albania
Qatar
Benin
Oman
Burkina Faso
Azerbaijan
Niger
Togo
Kuwait
Maldives
Bahrain
Yemen
Mozambique
Mali
3909
2209
1965
1740
1578
1154
495
288
233
229
228
204
199
98
94
56
51
46
44
41
37
33
31
29
26
24
20
19
18
16
3
2
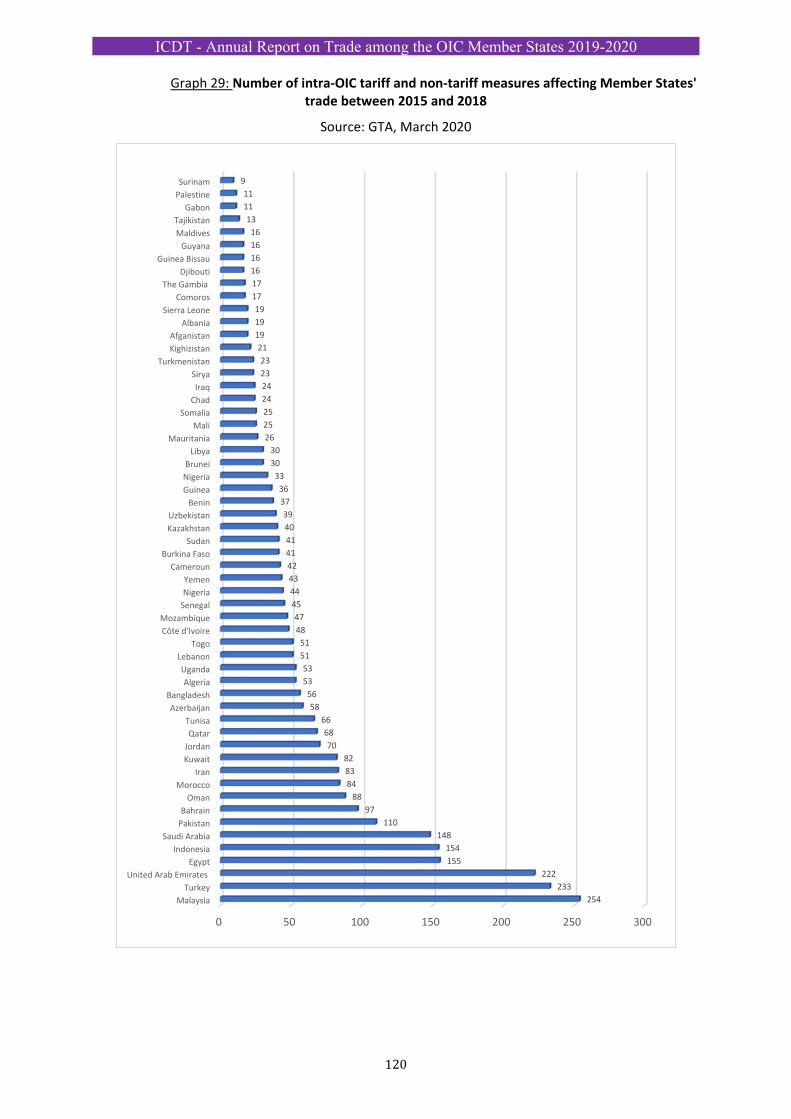
ICDT - Annual Report on Trade among the OIC Member States 2019-2020
120
Graph 29: Number of intra‐OIC tariff and non‐tariff measures affecting Member States' trade between 2015 and 2018
Source: GTA, March 2020
0 50 100 150 200 250 300
Malaysia
Turkey
United Arab Emirates
Egypt
Indonesia
Saudi Arabia
Pakistan
Bahrain
Oman
Morocco
Iran
Kuwait
Jordan
Qatar
Tunisa
Azerbaijan
Bangladesh
Algeria
Uganda
Lebanon
Togo
Côte d'Ivoire
Mozambique
Senegal
Nigeria
Yemen
Cameroun
Burkina Faso
Sudan
Kazakhstan
Uzbekistan
Benin
Guinea
Nigeria
Brunei
Libya
Mauritania
Mali
Somalia
Chad
Iraq
Sirya
Turkmenistan
Kighizistan
Afganistan
Albania
Sierra Leone
Comoros
The Gambia
Djibouti
Guinea Bissau
Guyana
Maldives
Tajikistan
Gabon
Palestine
Surinam
254
233
222
155
154
148
110
97
88
84
83
82
70
68
66
58
56
53
53
51
51
48
47
45
44
43
42
41
41
40
39
37
36
33
30
30
26
25
25
24
24
23
23
21
19
19
19
17
17
16
16
16
16
13
11
11
9
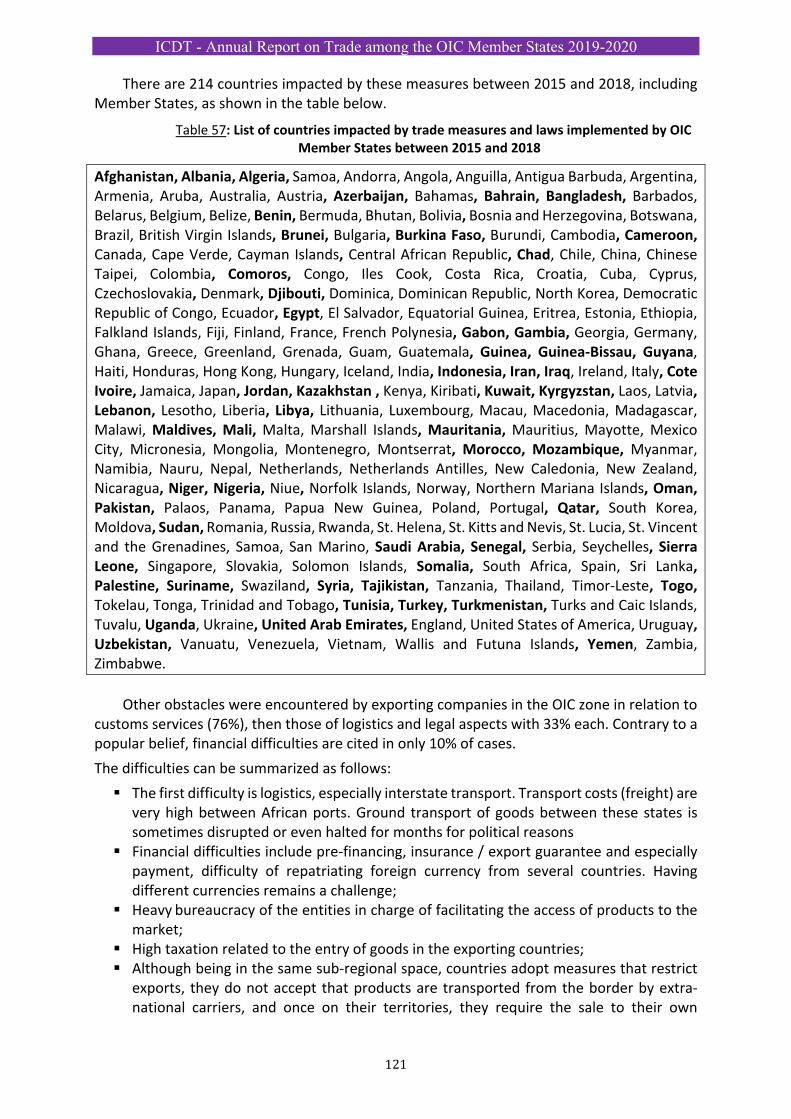
ICDT - Annual Report on Trade among the OIC Member States 2019-2020
121
There are 214 countries impacted by these measures between 2015 and 2018, including Member States, as shown in the table below.
Table 57: List of countries impacted by trade measures and laws implemented by OIC Member States between 2015 and 2018
Afghanistan, Albania, Algeria, Samoa, Andorra, Angola, Anguilla, Antigua Barbuda, Argentina, Armenia, Aruba, Australia, Austria, Azerbaijan, Bahamas, Bahrain, Bangladesh, Barbados, Belarus, Belgium, Belize, Benin, Bermuda, Bhutan, Bolivia, Bosnia and Herzegovina, Botswana, Brazil, British Virgin Islands, Brunei, Bulgaria, Burkina Faso, Burundi, Cambodia, Cameroon, Canada, Cape Verde, Cayman Islands, Central African Republic, Chad, Chile, China, Chinese Taipei, Colombia, Comoros, Congo, Iles Cook, Costa Rica, Croatia, Cuba, Cyprus, Czechoslovakia, Denmark, Djibouti, Dominica, Dominican Republic, North Korea, Democratic Republic of Congo, Ecuador, Egypt, El Salvador, Equatorial Guinea, Eritrea, Estonia, Ethiopia, Falkland Islands, Fiji, Finland, France, French Polynesia, Gabon, Gambia, Georgia, Germany, Ghana, Greece, Greenland, Grenada, Guam, Guatemala, Guinea, Guinea‐Bissau, Guyana, Haiti, Honduras, Hong Kong, Hungary, Iceland, India, Indonesia, Iran, Iraq, Ireland, Italy, Cote Ivoire, Jamaica, Japan, Jordan, Kazakhstan , Kenya, Kiribati, Kuwait, Kyrgyzstan, Laos, Latvia, Lebanon, Lesotho, Liberia, Libya, Lithuania, Luxembourg, Macau, Macedonia, Madagascar, Malawi, Maldives, Mali, Malta, Marshall Islands, Mauritania, Mauritius, Mayotte, Mexico City, Micronesia, Mongolia, Montenegro, Montserrat, Morocco, Mozambique, Myanmar, Namibia, Nauru, Nepal, Netherlands, Netherlands Antilles, New Caledonia, New Zealand, Nicaragua, Niger, Nigeria, Niue, Norfolk Islands, Norway, Northern Mariana Islands, Oman, Pakistan, Palaos, Panama, Papua New Guinea, Poland, Portugal, Qatar, South Korea, Moldova, Sudan, Romania, Russia, Rwanda, St. Helena, St. Kitts and Nevis, St. Lucia, St. Vincent and the Grenadines, Samoa, San Marino, Saudi Arabia, Senegal, Serbia, Seychelles, Sierra Leone, Singapore, Slovakia, Solomon Islands, Somalia, South Africa, Spain, Sri Lanka, Palestine, Suriname, Swaziland, Syria, Tajikistan, Tanzania, Thailand, Timor‐Leste, Togo, Tokelau, Tonga, Trinidad and Tobago, Tunisia, Turkey, Turkmenistan, Turks and Caic Islands, Tuvalu, Uganda, Ukraine, United Arab Emirates, England, United States of America, Uruguay, Uzbekistan, Vanuatu, Venezuela, Vietnam, Wallis and Futuna Islands, Yemen, Zambia, Zimbabwe.
Other obstacles were encountered by exporting companies in the OIC zone in relation to
customs services (76%), then those of logistics and legal aspects with 33% each. Contrary to a popular belief, financial difficulties are cited in only 10% of cases.
The difficulties can be summarized as follows:
The first difficulty is logistics, especially interstate transport. Transport costs (freight) are very high between African ports. Ground transport of goods between these states is sometimes disrupted or even halted for months for political reasons
Financial difficulties include pre‐financing, insurance / export guarantee and especially payment, difficulty of repatriating foreign currency from several countries. Having different currencies remains a challenge;
Heavy bureaucracy of the entities in charge of facilitating the access of products to the market;
High taxation related to the entry of goods in the exporting countries; Although being in the same sub‐regional space, countries adopt measures that restrict
exports, they do not accept that products are transported from the border by extra‐national carriers, and once on their territories, they require the sale to their own
ICDT - Annual Report on Trade among the OIC Member States 2019-2020
122
customers; Obtaining import licenses; Export conditions at the level of obtaining documents by a relevant public authority; Authentication of the certificate of origin. In addition, non‐recognition of some
certificates of origin with an HS code from an earlier version; Unpredictable delivery times; Goods badly reconditioned after visit; Harassment and frequent cancellation of the carrier towards some OIC countries; Disputes regarding the product value;
Control and inspection time considered too long. Regarding the place where these difficulties were encountered, 75% of respondents
report facing them abroad, compared to 58% who blame the authorities and organizations of their own country.
It is true that some of these measures are aimed at protecting national economies and the activities of economic operators while others contribute to hamper the expansion of intra‐OIC trade.
In this regard, Member States and OIC bodies have developed tools for strengthening intra‐OIC trade especially in the area of trade facilitation.
Among the solutions suggested by the companies, we can mention the following: Promote intra‐OIC trade and harmonize procedures between countries to facilitate
trade; Strengthen the banking system and encourage banks to facilitate operations for
exporters; Make customs services more available and more accessible to operators; Strengthen the management and control of agents involved in the export process and
improve their motivation; Improve the conditions of transport between the OIC countries; Make the Chambers of Commerce more accountable so that they can perform some
export‐related tasks themselves; Reduce ancillary costs related to export; Reduce the number of checks and if possible, automate the checking process. For
example, systematization of the use of scanners to activate control and fluidify the movement of goods.
Concerning imports, the difficulties relate to products whose importation is subject to obtaining a license, or even an approval, i.e. new products not included in the customs nomenclature of the importing country.
A‐ NON‐TARIFF MEASURES
It is true that bilateral, multilateral, and regional trade agreements have helped to lower tariff barriers to world trade, but non‐tariff barriers persist in international trade transactions that hamper companies exporting or importing goods and services.
Tariff measures are measures based on the Customs Tariff of the Most Favoured Nation (MFN) or bilateral preferential customs tariff, regional (customs union, common external tariff, trade preferences, for example in the framework of the TPS/OIC by sectors). The decline in tariffs has led to the increase of Non‐Tariff Barriers (NTBs) to trade of all kinds, either related to consumer demands or the protectionism of certain governments or the lobbying of multinationals.
ICDT - Annual Report on Trade among the OIC Member States 2019-2020
123
Non‐tariff measures (NTMs) are political measures, other than customs tariffs, which can affect international trade flow of goods. When these measures are illegal or negatively affect the trade development of a country, they are called Non‐Tariff Barriers (NTBs) to trade (quotas or import bans). NTMs are legitimate when they allow the growth of global trade. Most of these measures are provisions to protect the markets, also to control, consumption and circulation of products for sanitary, environmental, religious or security reasons.
According to the WTO agreements, the use of NTMs is allowed in certain circumstances. They include in particular the Agreement on Technical Barriers to Trade (TBT) and the one on Sanitary and Phytosanitary measures (SPS), both negotiated during the Uruguay Round. It is very difficult and sometimes impossible to distinguish between legitimate NTMs and protectionist NTMs. Especially since the same measure can be used for different reasons.
In fact, NTMs relate to technical regulations, SPS measures, certification requirements, quantitative restrictions, regulations on the origin of products or financial measures.
To better regulate international trade flows, the WTO Member States signed in Bali, Indonesia, the Trade Facilitation Agreement (TFA) which has been implemented in Geneva in November 2014. This implies that efforts should be made by developing countries in cooperation with the so‐called advanced partners to further contribute to the free circulation of goods and services between Member States.
Data from surveys conducted among businesses by the International Trade Centre (ITC) in 39 developing countries and 28 countries of the EU between 2009 and 2019 and from which 19 are OIC Member States namely: Uganda, Tunisia, Indonesia, Morocco, Burkina Faso, Egypt, Côte d'Ivoire, Senegal, Palestine, Kazakhstan, Guinea, Mali, Bangladesh, Benin, Comoros, Oman, Jordan, Kyrgyzstan and Pakistan suggest that TBT/SPS are the most restrictive measures for exporters. In 2016, ITC and UNCTAD have begun to carry out an investigation on NTMs in ECOWAS countries.
More than 30,000 obstacles to trade development have been identified, 80% of which are met with foreign partners. These surveys focused on the following points:
Business activity in the last year before the survey (testimonies);
Trade flows (imported/exported product and partner countries);
The NTMs, which are a major obstacle in commercial operations;
Regulatory and procedural barriers to NTMs;
The type of foreign or domestic restrictive NTM;
Procedural obstacles that are related to NTMs at the national level or in partner countries.
These official data on NTMs recently collected in 41 developing countries, the European Union and Japan indicate the existence of a proliferation of TBTs, SPS measures and rules of origin, ie around 90% of NTMs. Procedural measures dominate obstacles by 66%.
During these surveys, over 39,000 interviews (telephone and face‐to‐face interviews) were conducted with the business community in these countries.
Most of the surveys carried out concern companies in countries whose exports represent at least 90% of the total exported (except minerals and arms).
The following products were covered during the investigations of ITC: food and
ICDT - Annual Report on Trade among the OIC Member States 2019-2020
124
agricultural raw materials costs, processed food products, wood and wood products and paper, textile yarn, fabrics and clothing, chemicals, leather, metals and metal‐based manufacturing products, non‐electrical machinery, computers and telecommunications equipment, consumables and electronics, transport equipment and other miscellaneous manufactured goods.
In general, common NTMs are those related to: time constraints of trade, the abnormal and often expensive payments, the administrative burden, the infrastructure challenge (ports, dilapidated or non‐existent roads), transparency issues and market information, the regulation and the lack of security of business operations.
The sectors most affected by NTMs as reported by the surveyed exporting companies by ITC are: fresh food and agricultural commodities, processed foods, non‐electrical machinery, transportation equipment, wood, wood products and paper, clothes, yarn, fabrics and other textile products, leather and leather products, metals and metal‐based products, electronic components, computers, Telecom products, other electronic consumables and chemicals.
In addition, according to ITC's survey carried out among OIC Member States, we note that NTMs affect more than 50% of companies in Guinea, Tunisia, Bangladesh, Uganda, Benin, Comoros, Cote d’Ivoire, Senegal, Burkina Faso, Palestine, Jordan, Kyrgyzstan and Mali in particular technical measures and procedural operations. Between 2009 and 2018, the ITC interviewed more than 5,700 companies from 18 OIC countries.
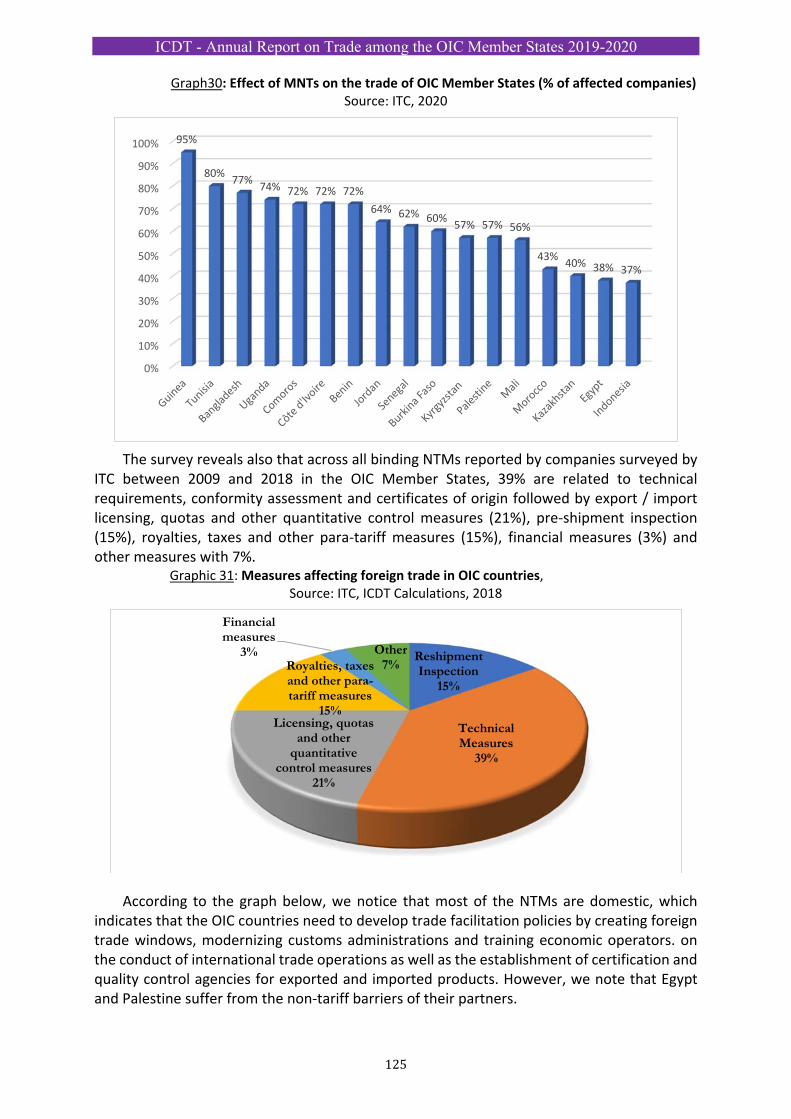
ICDT - Annual Report on Trade among the OIC Member States 2019-2020
125
Graph30: Effect of MNTs on the trade of OIC Member States (% of affected companies) Source: ITC, 2020
The survey reveals also that across all binding NTMs reported by companies surveyed by ITC between 2009 and 2018 in the OIC Member States, 39% are related to technical requirements, conformity assessment and certificates of origin followed by export / import licensing, quotas and other quantitative control measures (21%), pre‐shipment inspection (15%), royalties, taxes and other para‐tariff measures (15%), financial measures (3%) and other measures with 7%.
Graphic 31: Measures affecting foreign trade in OIC countries, Source: ITC, ICDT Calculations, 2018
According to the graph below, we notice that most of the NTMs are domestic, which indicates that the OIC countries need to develop trade facilitation policies by creating foreign trade windows, modernizing customs administrations and training economic operators. on the conduct of international trade operations as well as the establishment of certification and quality control agencies for exported and imported products. However, we note that Egypt and Palestine suffer from the non‐tariff barriers of their partners.
0%
10%
20%
30%
40%
50%
60%
70%
80%
90%
100% 95%
80%77%
74% 72% 72% 72%
64% 62% 60%57% 57% 56%
43%40% 38% 37%
Reshipment Inspection
15%
Technical Measures
39%
Licensing, quotas and other
quantitative control measures
21%
Royalties, taxes and other para-tariff measures
15%
Financial measures
3% Other7%
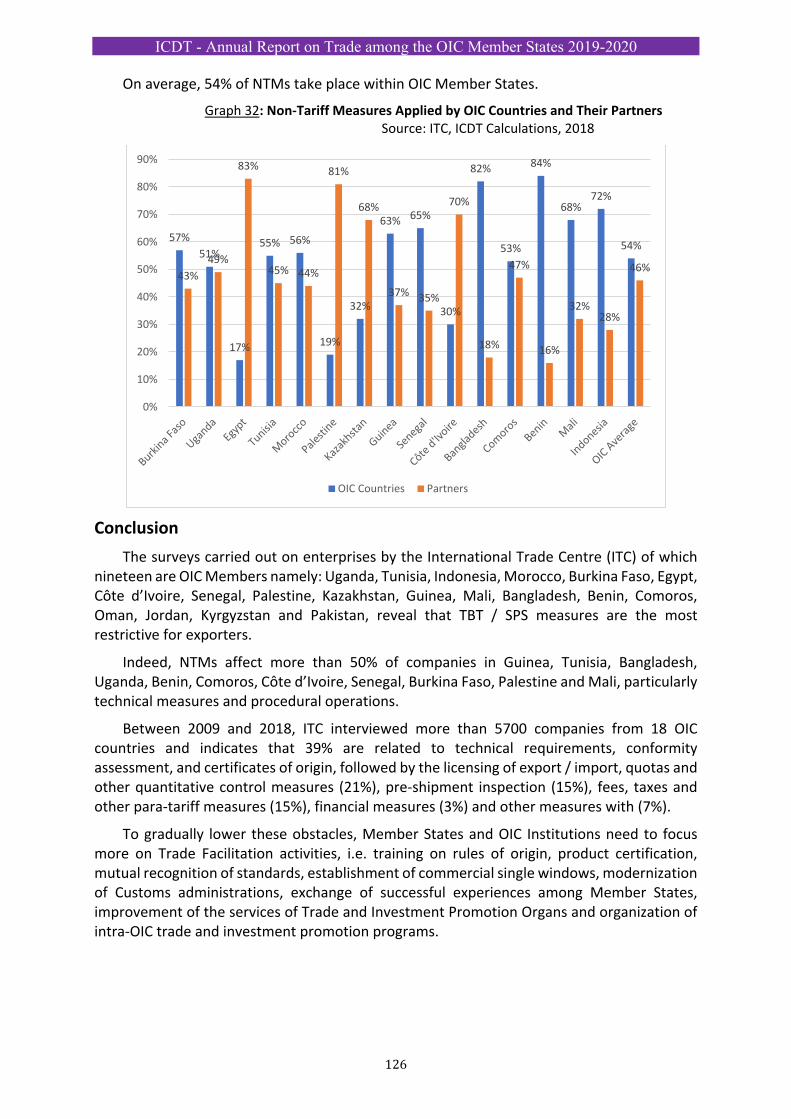
ICDT - Annual Report on Trade among the OIC Member States 2019-2020
126
On average, 54% of NTMs take place within OIC Member States.
Graph 32: Non‐Tariff Measures Applied by OIC Countries and Their Partners Source: ITC, ICDT Calculations, 2018
Conclusion
The surveys carried out on enterprises by the International Trade Centre (ITC) of which nineteen are OIC Members namely: Uganda, Tunisia, Indonesia, Morocco, Burkina Faso, Egypt, Côte d’Ivoire, Senegal, Palestine, Kazakhstan, Guinea, Mali, Bangladesh, Benin, Comoros, Oman, Jordan, Kyrgyzstan and Pakistan, reveal that TBT / SPS measures are the most restrictive for exporters.
Indeed, NTMs affect more than 50% of companies in Guinea, Tunisia, Bangladesh, Uganda, Benin, Comoros, Côte d’Ivoire, Senegal, Burkina Faso, Palestine and Mali, particularly technical measures and procedural operations.
Between 2009 and 2018, ITC interviewed more than 5700 companies from 18 OIC countries and indicates that 39% are related to technical requirements, conformity assessment, and certificates of origin, followed by the licensing of export / import, quotas and other quantitative control measures (21%), pre‐shipment inspection (15%), fees, taxes and other para‐tariff measures (15%), financial measures (3%) and other measures with (7%).
To gradually lower these obstacles, Member States and OIC Institutions need to focus more on Trade Facilitation activities, i.e. training on rules of origin, product certification, mutual recognition of standards, establishment of commercial single windows, modernization of Customs administrations, exchange of successful experiences among Member States, improvement of the services of Trade and Investment Promotion Organs and organization of intra‐OIC trade and investment promotion programs.
57%
51%
17%
55% 56%
19%
32%
63% 65%
30%
82%
53%
84%
68%72%
54%
43%
49%
83%
45% 44%
81%
68%
37% 35%
70%
18%
47%
16%
32%28%
46%
0%
10%
20%
30%
40%
50%
60%
70%
80%
90%
OIC Countries Partners
ICDT - Annual Report on Trade among the OIC Member States 2019-2020
127
SECTION II: TRADE FACILITATION ACTIVITIES IN OIC MEMBER STATES
In recent years, the OIC Countries have reformed their foreign trade policies in order to liberalize their trade and simplify international business transactions and provide investment incentives at the national, regional and multilateral levels.
The OIC organs have included in their program activities related to trade and investment facilitation, promotion, financing and development of strategic products and services for the benefit of the Member States, with the aim of economic and commercial integration of the OIC countries within the framework of the new OIC Ten‐Year Programme of Action 2016‐2025. This Plan aims to bring the intra‐OIC trade share to 25% of the global trade of the OIC Member States in 2025.
It is in this context that the Islamic Centre for Development of Trade (ICDT) continues to actively organize general Trade Fairs, specialized Exhibitions, Business Forums, buyers‐sellers meetings, seminars and training workshops in the area of international trade in order to boost intra‐OIC trade. These activities have been strongly supported by the IDB Group and particularly the International Islamic Trade Finance Corporation (ITFC) and other OIC institutions operating in the field of economic affairs, namely the Islamic Corporation for the Insurance of Investment and Export Credit (ICIEC), Ankara Centre (SESRIC) and the Islamic Chamber of Commerce, Industry and Agriculture (ICCIA) of Karachi. The coordination of these efforts led to an improvement in the share of intra‐OIC trade in the global trade, which grew from 15.9% in 2006 to 21.02% in 2018, an increase of about 32%.
This increase has been strengthened among others, by the participation of several Member States in the activities of the OIC organs for the trade promotion and facilitation, trade financing and insurance, capacity building, development of national strategic products and also thanks to factors relating to commodity markets and the evolution of trade in manufactured goods observed in recent years.
This strengthening of intra‐OIC cooperation is supported by the proliferation of economic cooperation agreements at both bilateral and multilateral levels, but also by trade and investment facilitation measures.
For this purpose, the OIC General Secretariat has initiated an Annual Meeting of the OIC Institutions every December, starting from 2015.
During this first 1st Annual coordination meeting of the OIC institutions (ACMOI) held in December 2015, two subcommittees have emerged: a subcommittee on Trade and Investments chaired by the Islamic Centre for Development of Trade (ICDT) and a subcommittee on finance and private sector development chaired by SESRIC.
The TISC Subcommittee organized 5 meetings between March 2016 and April 2019 either in Marrakech or Casablanca in Morocco.
Five themes of the integrated projects have been initiated namely: industrial development of Halal, Single Window Initiative and Trade Facilitation, development of strategic products, Investment Promotion and Support for Investment Promotion Agencies of Member States, private sector and SME development. A concept notes and a matrix of integrated activities of the Institutions were to be finalized between 2017 and 2019.
Since May 2019, the OIC General Secretariat has sent a verbal note to the ICDT indicating that the TISC meetings will be from now onwards held online.
To this end, ICDT has created a TISC website allowing each focal point member to update their
ICDT - Annual Report on Trade among the OIC Member States 2019-2020
128
data online via a login and a password. This will allow ICDT to facilitate the collection of information from each Member Institution to prepare an annual report for submission to ACMOI, COMCEC and CFM meetings.
During the 5th Meeting of ACMOI held in December 2019, it was recommended to submit a quarterly report to the OIC General Secretariat.
To further boost intra‐OIC trade and investment, Member States have reduced their business procedures by taking the following actions:
The electronic submission and processing of business transactions: Albania, Saudi Arabia, Bahrain, Bangladesh, Benin, Brunei, Burkina Faso, Cameroon, Comoros, Côte d'Ivoire, Djibouti, Egypt, United Arab Emirates, Indonesia, Gabon, Gambia, Guinea, Guinea Bissau, Guyana, Indonesia, Jordan, Kazakhstan, Mali, Malaysia, Maldives, Mauritania, Morocco, Mozambique, Niger, Nigeria, Uganda, Uzbekistan, Pakistan, Palestine, Qatar, , Senegal, Sierra Leone, Sudan, Suriname, Syria, Tajikistan, Togo, Tunisia, Turkey, Yemen, Afghanistan, Azerbaijan, Kuwait and Oman;
The establishment of National Single Windows: Malaysia, Indonesia, Morocco, Brunei, Turkey, Senegal, Egypt, United Arab Emirates, Tunisia, Azerbaijan, Burkina Faso, Benin, Cameroon, Bangladesh, Gambia, Jordan, Mozambique, Uganda, Uzbekistan, Pakistan, Sierra Leone, Qatar, Saudi Arabia, Kuwait, Bahrain, Kazakhstan, Kyrgyzstan, Tajikistan, Côte d'Ivoire, Togo, Lebanon, Guyana, Sudan, Iran, Oman, Gabon, Nigeria, Algeria, Libya, Albania, Maldives, Niger, Mali, Mauritania and Suriname;
Improvement of the index of the logistics performance by more than 5% between 2016 and 2018: Somalia (21%), Mauritania (20%), Cameroon (17%), Côte d'Ivoire (16%), Kyrgyzstan (15%), Djibouti (12%), Tajikistan (12%) , Benin (12%), Chad (10%), Albania (9%), Iran (9%), Turkmenistan (8%), Uzbekistan (7%), Maldives (6 %) and Uzbekistan (5%) through the construction of new logistical and transport infrastructure during this period to better perform international business operations;
Improvement of Customs performance by more than 5% between 2016 and 2018: Somalia (36%), Kyrgyzstan (35%), Tunisia (17%), Cameroon (15%), Turkmenistan (15%), Benin (14%), Iran (11%), Guinea (7%), Guyana (6%), Kazakhstan (6%), Albania (5%) and Morocco (5%), because government authorities have made significant investments in the national customs equipment (scanners, risk management, electronic data exchange, establishment of Single Windows...);
Improvement of national infrastructure by more than 5% between 2014 and 2018 in: Mauritania (32%), Djibouti (18%), Kyrgyzstan (17%), Côte d'Ivoire (15%), Cameroon (14%), Albania (14%), Somalia (13% ), Chad (13%), Libya (9%), Indonesia (9%), Iraq (8%), Nigeria (6%), Maldives (6%) and Uzbekistan ( 5%) which have invested in improving roads, ports and international airports, in order to ensure greater mobility of people and goods;
Improvement of the distance to frontier by more than 5% between 2017 and 2019: in some countries, namely Libya, Suriname, Palestine, Guinea‐Bissau, Albania, Mali, Comoros, Mozambique, Benin, Pakistan, Turkey, Jordan, Togo, Burkina Faso, Morocco, Oman, Niger, Saudi Arabia, Djibouti, Mauritania, Tunisia, Iran, Uganda, Bahrain, Senegal, Kyrgyzstan, Malaysia, Qatar, Azerbaijan, Sierra Leone, Tajikistan and Lebanon in order to facilitate cross‐border trade of these countries most of which are landlocked with business partners by investing in infrastructure, ports, airports and land;
Improvement of maritime connectivity index for countries with coastline by more than 5% between 2016 and 2019: Qatar, Iraq, Libya, Indonesia, Bahrain, Gabon, Jordan, Saudi
ICDT - Annual Report on Trade among the OIC Member States 2019-2020
129
Arabia, Oman, Bangladesh, Guinea‐Bissau, United Arab Emirates, Togo, Turkey and Benin following the joint efforts of the various governments to increase maritime service levels with business partners and respond to logistical emergencies to provide essential national and regional goods and equipment;
Existence of Trade and Investment Promotion Organs in several OIC Member States that facilitate direct contact between businessmen of the OIC Member States, which have developed incentive tools for export and investment in order to facilitate cross‐border trade and Foreign Direct Investments.
According to Doing Business 2018‐2019, About 115 economies implemented 294 business regulatory reforms in these 10 different indicators assessed during this period.
Between 2006 and 2019, over 3,847 reforms were implemented by countries including 1,289 from the OIC Member States in order to facilitate their international trade operations. The OIC countries with the most adopted business facilitation reforms in between 2006 and 2019 are: Kazakhstan, Indonesia, Azerbaijan, Saudi Arabia, Morocco, United Arab Emirates, Uzbekistan, Egypt, Côte d'Ivoire, Senegal, Togo, Turkey, Brunei and Niger. Among these, we can note 153 measures on facilitating cross‐border trade of OIC countries, most of which come from the following countries with at least four reforms: Pakistan, Uganda, Benin, Morocco, Jordan, Mauritania, Saudi Arabia, Uzbekistan, Azerbaijan, Bahrain, Egypt, Indonesia, Iran, Kazakhstan, Mali, Mozambique, Nigeria, Oman, Sierra Leone and the United Arab Emirates.
In addition, the implementation of the PRETAS protocols and the Rules of Origin of the TPS/OIC in particular in its Fast‐Track option, the initiative of a single commercial window of the OIC Member States as well as an observatory on non‐tariff barriers and a Centre for Arbitration and Dispute Settlement between Member States will gradually reduce barriers to intra‐OIC trade and investment. It is also appropriate that Members of the ACMOI’s Trade, Investment, Private Sector Promotion and Finance Committees and COMCEC Working Groups take action to strengthen intra‐ OIC trade and investment. in order to achieve the objectives of the OIC Ten‐Year Plan of Action which is to increase the share of intra‐OIC trade in global trade to 25% by 2025.
ICDT - Annual Report on Trade among the OIC Member States 2019-2020
130
CHAPTER II:
DOING BUSINESS SITUATION IN OIC MEMBER STATES
ICDT - Annual Report on Trade among the OIC Member States 2019-2020
131
Problems related to trade facilitation generally concern the following elements:
infrastructure, ports management, airports and cross‐border posts, transport legislation, land locking of some countries, payment systems, automation, and the digitalization of the services of cross‐border trade players, transportation and transit taxation, officer functions and behavior, integrity and efficiency of customs services, integrity of the business environment and compliance with the rules procedural operations.
For this reason, Doing Business tries to measure the efficiency of the logistics of foreign trade and insists on trade facilitation policies namely, the digitization of the ports and the safety of their workers in order to lower the trade costs by investing in the newest‐generation of infrastructures.
The time and cost of complying with cross‐border trade procedures include the time and cost for obtaining, preparing and submitting documents during port or border handling, customs procedures and inspections.
I‐ Compliance with procedures for export and import:
According to the surveys of Doing Business of the World Bank Group (May 2019), the indicators of cross‐border trade from 186 countries are based on time and logistics costs of exports and imports. Thus, Doing Business measures the delivery time and cost (excluding the customs duties) associated with three categories of the following procedures: Compliance with the requirements for documentation, compliance with cross‐border trade procedures and internal transport that are part of the overall process of export or import of a shipment of goods. This ranking takes also into account the indicator “distance to frontier’’.
Between May 2, 2018 and May 1, 2019, 115 economies carried out 294 business regulatory reforms in particular starting a business, obtaining building permits, connecting to electricity, paying taxes and taxes and insolvency settlement of operating companies.
The most common reforms are improving the functionality of credit bureaus and credit registries, developing or improving online platforms to comply with regulatory requirements, improving the reliability of power electricity, the reduction of certain taxes, the strengthening of protection of minority investors, the streamlining of property registration processes and the automation of international trade logistics.
II- Performance of Doing Business indicators in OIC countries
For export and import, OECD countries are more effective in the respect of the deadline with a lower cost for cross‐border trade procedures and requirements of trade documents given their significant investment in infrastructure and administrative staff agencies operating in foreign trade (roads, ports, airports, equipment cross‐border customs posts, staff training, freight forwarders, banks and insurance companies and transporters, harmonization of IT systems (single windows of foreign trade).
In some African countries, the procedures remain complex and heavy, given the non‐compliance with these procedures of cross‐border trade and documentation requirements (Sub‐Saharan and North African countries) but also in some Latin American countries and especially landlocked Central Asian countries.
In the OIC Member States, scores are acceptable due to the fluidity of operations in some Gulf and Asian countries and some countries in North Africa and the Middle East.
According to Doing business 2019, the main OIC countries having a high index of cross‐
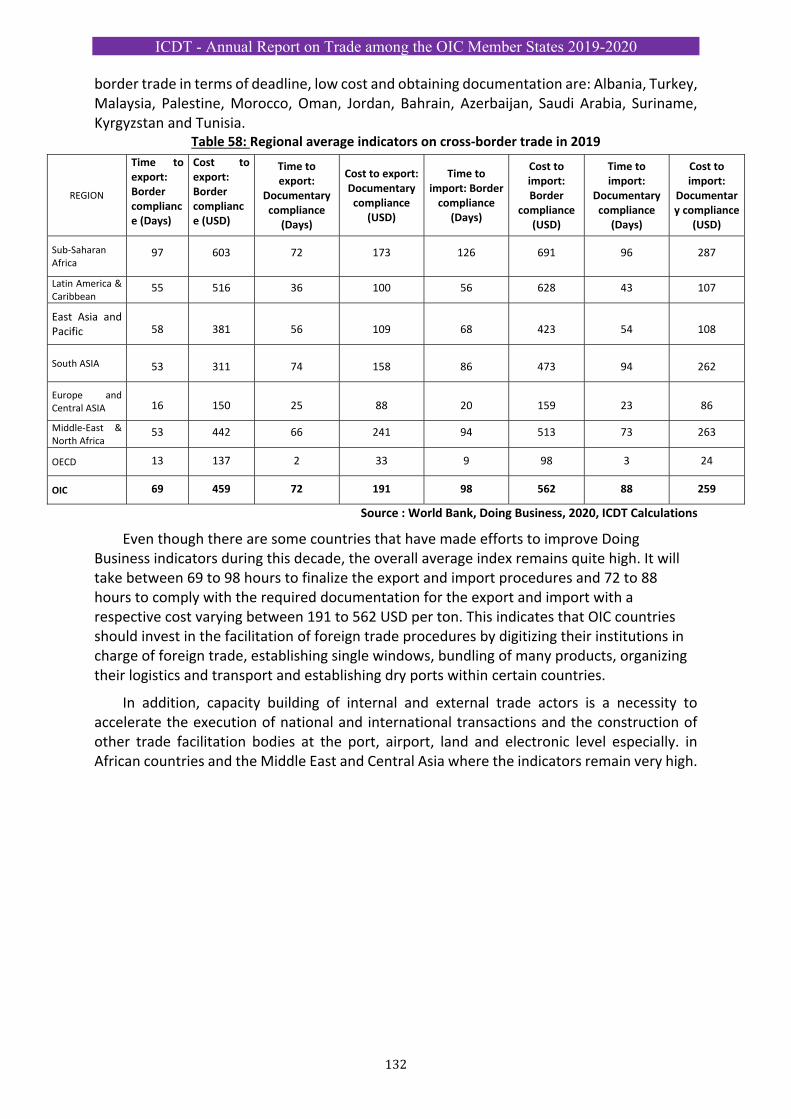
ICDT - Annual Report on Trade among the OIC Member States 2019-2020
132
border trade in terms of deadline, low cost and obtaining documentation are: Albania, Turkey, Malaysia, Palestine, Morocco, Oman, Jordan, Bahrain, Azerbaijan, Saudi Arabia, Suriname, Kyrgyzstan and Tunisia.
Table 58: Regional average indicators on cross‐border trade in 2019
REGION
Time to export: Border compliance (Days)
Cost to export: Border compliance (USD)
Time to export:
Documentary compliance
(Days)
Cost to export: Documentary compliance
(USD)
Time to import: Border compliance
(Days)
Cost to import: Border
compliance (USD)
Time to import:
Documentary compliance
(Days)
Cost to import:
Documentary compliance
(USD)
Sub‐Saharan Africa
97 603 72 173 126 691 96 287
Latin America & Caribbean
55 516 36 100 56 628 43 107
East Asia and Pacific 58 381 56 109 68 423 54 108
South ASIA 53 311 74 158 86 473 94 262
Europe and Central ASIA 16 150 25 88 20 159 23 86
Middle‐East & North Africa
53 442 66 241 94 513 73 263
OECD 13 137 2 33 9 98 3 24
OIC 69 459 72 191 98 562 88 259
Source : World Bank, Doing Business, 2020, ICDT Calculations
Even though there are some countries that have made efforts to improve Doing Business indicators during this decade, the overall average index remains quite high. It will take between 69 to 98 hours to finalize the export and import procedures and 72 to 88 hours to comply with the required documentation for the export and import with a respective cost varying between 191 to 562 USD per ton. This indicates that OIC countries should invest in the facilitation of foreign trade procedures by digitizing their institutions in charge of foreign trade, establishing single windows, bundling of many products, organizing their logistics and transport and establishing dry ports within certain countries.
In addition, capacity building of internal and external trade actors is a necessity to accelerate the execution of national and international transactions and the construction of other trade facilitation bodies at the port, airport, land and electronic level especially. in African countries and the Middle East and Central Asia where the indicators remain very high.
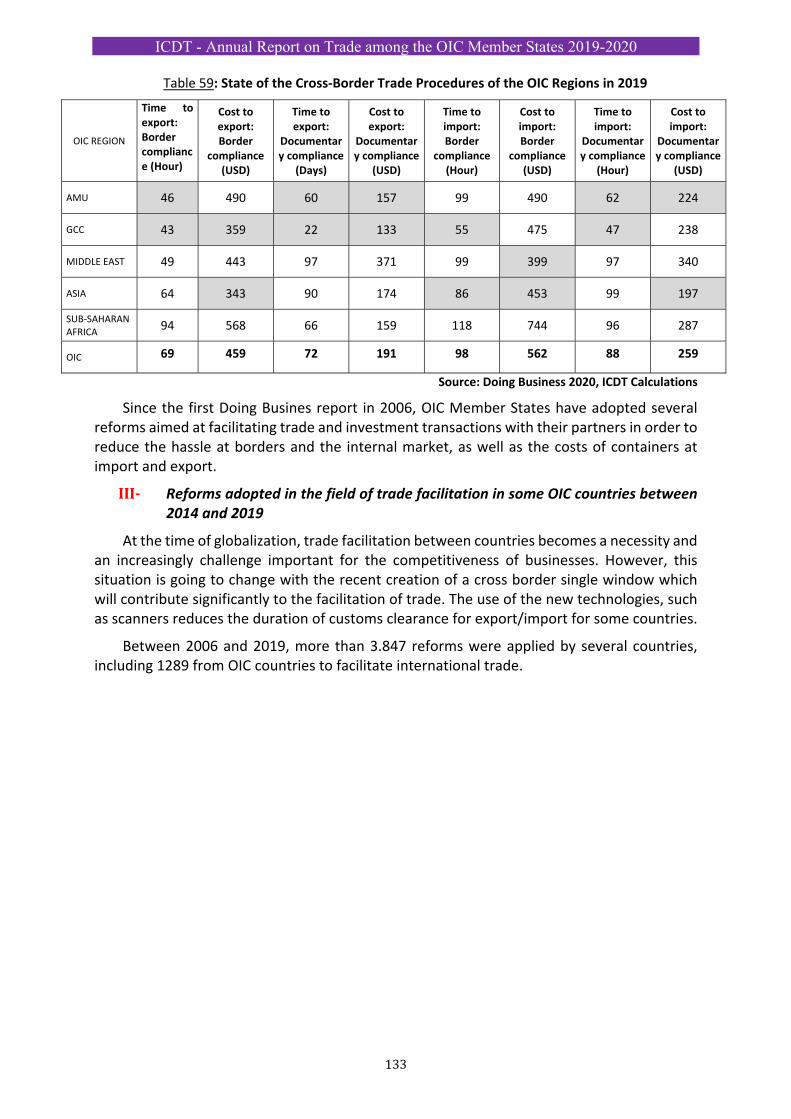
ICDT - Annual Report on Trade among the OIC Member States 2019-2020
133
Table 59: State of the Cross‐Border Trade Procedures of the OIC Regions in 2019
OIC REGION
Time to export: Border compliance (Hour)
Cost to export: Border
compliance (USD)
Time to export:
Documentary compliance
(Days)
Cost to export:
Documentary compliance
(USD)
Time to import: Border
compliance (Hour)
Cost to import: Border
compliance (USD)
Time to import:
Documentary compliance
(Hour)
Cost to import:
Documentary compliance
(USD)
AMU 46 490 60 157 99 490 62 224
GCC 43 359 22 133 55 475 47 238
MIDDLE EAST 49 443 97 371 99 399 97 340
ASIA 64 343 90 174 86 453 99 197
SUB‐SAHARAN AFRICA
94 568 66 159 118 744 96 287
OIC 69 459 72 191 98 562 88 259
Source: Doing Business 2020, ICDT Calculations
Since the first Doing Busines report in 2006, OIC Member States have adopted several reforms aimed at facilitating trade and investment transactions with their partners in order to reduce the hassle at borders and the internal market, as well as the costs of containers at import and export.
III‐ Reforms adopted in the field of trade facilitation in some OIC countries between 2014 and 2019
At the time of globalization, trade facilitation between countries becomes a necessity and an increasingly challenge important for the competitiveness of businesses. However, this situation is going to change with the recent creation of a cross border single window which will contribute significantly to the facilitation of trade. The use of the new technologies, such as scanners reduces the duration of customs clearance for export/import for some countries.
Between 2006 and 2019, more than 3.847 reforms were applied by several countries, including 1289 from OIC countries to facilitate international trade.
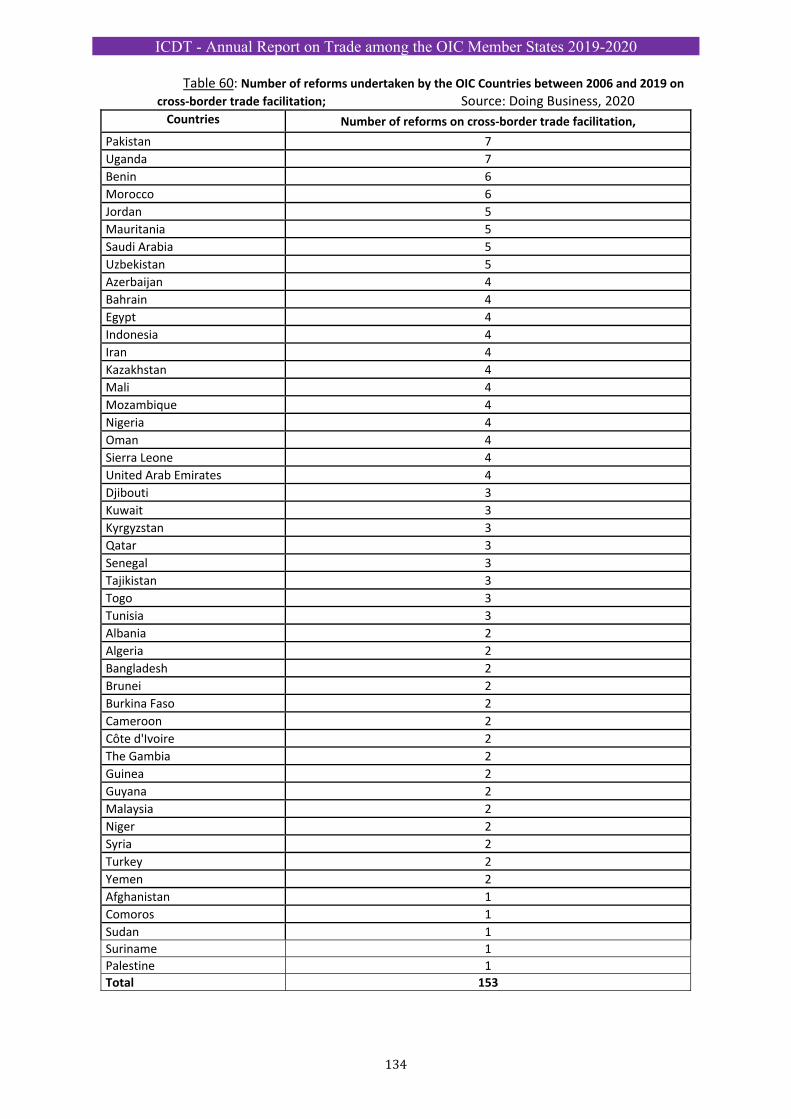
ICDT - Annual Report on Trade among the OIC Member States 2019-2020
134
Table 60: Number of reforms undertaken by the OIC Countries between 2006 and 2019 on
cross‐border trade facilitation; Source: Doing Business, 2020 Countries Number of reforms on cross‐border trade facilitation,
Pakistan 7
Uganda 7
Benin 6
Morocco 6
Jordan 5
Mauritania 5
Saudi Arabia 5
Uzbekistan 5
Azerbaijan 4
Bahrain 4
Egypt 4
Indonesia 4
Iran 4
Kazakhstan 4
Mali 4
Mozambique 4
Nigeria 4
Oman 4
Sierra Leone 4
United Arab Emirates 4
Djibouti 3
Kuwait 3
Kyrgyzstan 3
Qatar 3
Senegal 3
Tajikistan 3
Togo 3
Tunisia 3
Albania 2
Algeria 2
Bangladesh 2
Brunei 2
Burkina Faso 2
Cameroon 2
Côte d'Ivoire 2
The Gambia 2
Guinea 2
Guyana 2
Malaysia 2
Niger 2
Syria 2
Turkey 2
Yemen 2
Afghanistan 1
Comoros 1
Sudan 1
Suriname 1
Palestine 1
Total 153
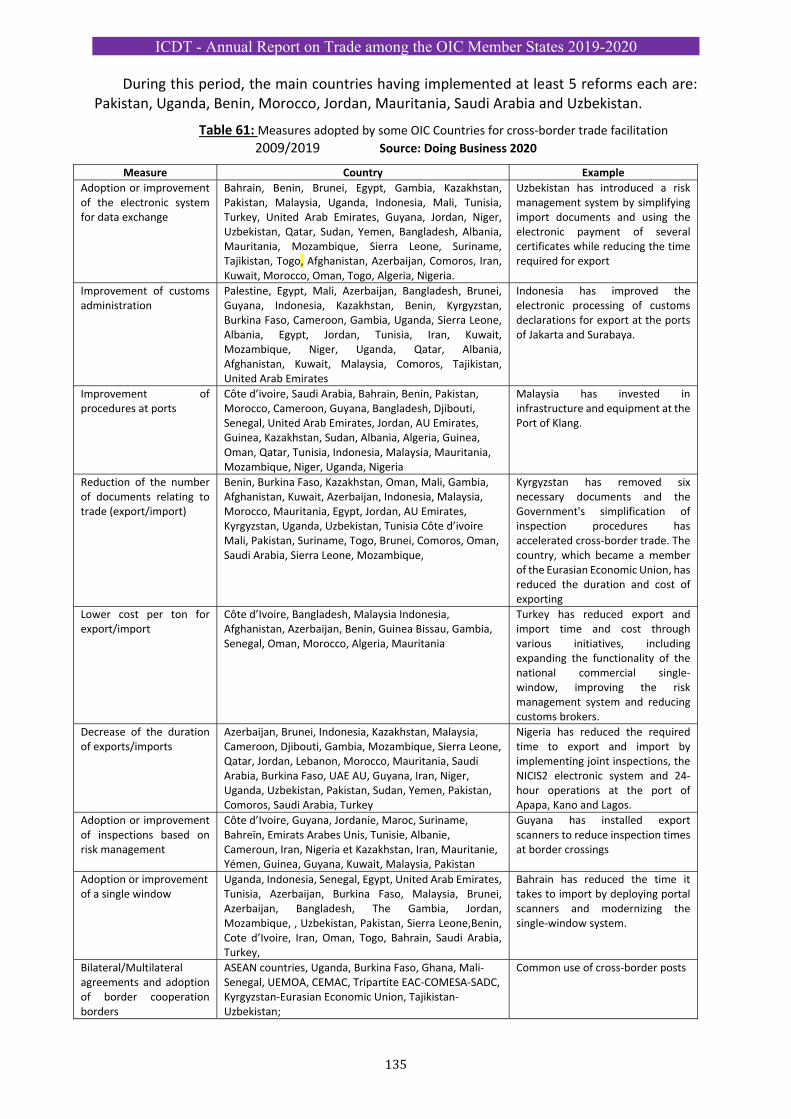
ICDT - Annual Report on Trade among the OIC Member States 2019-2020
135
During this period, the main countries having implemented at least 5 reforms each are: Pakistan, Uganda, Benin, Morocco, Jordan, Mauritania, Saudi Arabia and Uzbekistan.
Table 61: Measures adopted by some OIC Countries for cross‐border trade facilitation
2009/2019 Source: Doing Business 2020
Measure Country Example
Adoption or improvement of the electronic system for data exchange
Bahrain, Benin, Brunei, Egypt, Gambia, Kazakhstan, Pakistan, Malaysia, Uganda, Indonesia, Mali, Tunisia, Turkey, United Arab Emirates, Guyana, Jordan, Niger, Uzbekistan, Qatar, Sudan, Yemen, Bangladesh, Albania, Mauritania, Mozambique, Sierra Leone, Suriname, Tajikistan, Togo, Afghanistan, Azerbaijan, Comoros, Iran, Kuwait, Morocco, Oman, Togo, Algeria, Nigeria.
Uzbekistan has introduced a risk management system by simplifying import documents and using the electronic payment of several certificates while reducing the time required for export
Improvement of customs administration
Palestine, Egypt, Mali, Azerbaijan, Bangladesh, Brunei, Guyana, Indonesia, Kazakhstan, Benin, Kyrgyzstan, Burkina Faso, Cameroon, Gambia, Uganda, Sierra Leone, Albania, Egypt, Jordan, Tunisia, Iran, Kuwait, Mozambique, Niger, Uganda, Qatar, Albania, Afghanistan, Kuwait, Malaysia, Comoros, Tajikistan, United Arab Emirates
Indonesia has improved the electronic processing of customs declarations for export at the ports of Jakarta and Surabaya.
Improvement of procedures at ports
Côte d’ivoire, Saudi Arabia, Bahrain, Benin, Pakistan, Morocco, Cameroon, Guyana, Bangladesh, Djibouti, Senegal, United Arab Emirates, Jordan, AU Emirates, Guinea, Kazakhstan, Sudan, Albania, Algeria, Guinea, Oman, Qatar, Tunisia, Indonesia, Malaysia, Mauritania, Mozambique, Niger, Uganda, Nigeria
Malaysia has invested in infrastructure and equipment at the Port of Klang.
Reduction of the number of documents relating to trade (export/import)
Benin, Burkina Faso, Kazakhstan, Oman, Mali, Gambia, Afghanistan, Kuwait, Azerbaijan, Indonesia, Malaysia, Morocco, Mauritania, Egypt, Jordan, AU Emirates, Kyrgyzstan, Uganda, Uzbekistan, Tunisia Côte d’ivoire Mali, Pakistan, Suriname, Togo, Brunei, Comoros, Oman, Saudi Arabia, Sierra Leone, Mozambique,
Kyrgyzstan has removed six necessary documents and the Government's simplification of inspection procedures has accelerated cross‐border trade. The country, which became a member of the Eurasian Economic Union, has reduced the duration and cost of exporting
Lower cost per ton for export/import
Côte d’Ivoire, Bangladesh, Malaysia Indonesia, Afghanistan, Azerbaijan, Benin, Guinea Bissau, Gambia, Senegal, Oman, Morocco, Algeria, Mauritania
Turkey has reduced export and import time and cost through various initiatives, including expanding the functionality of the national commercial single‐window, improving the risk management system and reducing customs brokers.
Decrease of the duration of exports/imports
Azerbaijan, Brunei, Indonesia, Kazakhstan, Malaysia, Cameroon, Djibouti, Gambia, Mozambique, Sierra Leone, Qatar, Jordan, Lebanon, Morocco, Mauritania, Saudi Arabia, Burkina Faso, UAE AU, Guyana, Iran, Niger, Uganda, Uzbekistan, Pakistan, Sudan, Yemen, Pakistan, Comoros, Saudi Arabia, Turkey
Nigeria has reduced the required time to export and import by implementing joint inspections, the NICIS2 electronic system and 24‐hour operations at the port of Apapa, Kano and Lagos.
Adoption or improvement of inspections based on risk management
Côte d’Ivoire, Guyana, Jordanie, Maroc, Suriname, Bahreïn, Emirats Arabes Unis, Tunisie, Albanie, Cameroun, Iran, Nigeria et Kazakhstan, Iran, Mauritanie, Yémen, Guinea, Guyana, Kuwait, Malaysia, Pakistan
Guyana has installed export scanners to reduce inspection times at border crossings
Adoption or improvement of a single window
Uganda, Indonesia, Senegal, Egypt, United Arab Emirates, Tunisia, Azerbaijan, Burkina Faso, Malaysia, Brunei, Azerbaijan, Bangladesh, The Gambia, Jordan, Mozambique, , Uzbekistan, Pakistan, Sierra Leone,Benin, Cote d’Ivoire, Iran, Oman, Togo, Bahrain, Saudi Arabia, Turkey,
Bahrain has reduced the time it takes to import by deploying portal scanners and modernizing the single‐window system.
Bilateral/Multilateral agreements and adoption of border cooperation borders
ASEAN countries, Uganda, Burkina Faso, Ghana, Mali‐Senegal, UEMOA, CEMAC, Tripartite EAC‐COMESA‐SADC, Kyrgyzstan‐Eurasian Economic Union, Tajikistan‐Uzbekistan;
Common use of cross‐border posts
ICDT - Annual Report on Trade among the OIC Member States 2019-2020
136
1/ State of cross‐border trade procedures in Asian OIC Member States:
Indicators for cross‐border exchanges in the OIC Asian Member Countries:
According to the table below, the Asian Member States of the OIC have made considerable progress in facilitating their cross‐border trade and especially the landlocked countries of this region through bilateral, regional and multilateral agreements i.e. with ASEAN, SAARC, ECO, etc....
Thus, the procedures for cross‐border export trade take about 5 hours in Kyrgyzstan, 17 hours of time in Azerbaijan and 27 hours in Tajikistan, and the documentation requirements can be processed in 10 hours in Malaysia, 12 hours in Suriname and 33 hours in Iran and in Azerbaijan. The cost of cross‐border procedures and documentation requirements range from 10 USD in Kyrgyzstan and Malaysia to 596 USD in Maldives. The cheapest costs for this treatment are also found in Malaysia, Indonesia, Azerbaijan and Uzbekistan.
At imports, procedures are generally slower and more expensive, cross‐border trade procedures require around 2 hours in Kazakhstan, 14 hours in Azerbaijan and 36 hours in Malaysia and the fulfilment of documentary requirements around 6 hours in Kazakhstan and Malaysia and 24 hours in Suriname through the single window and electronic data exchange.
In addition, the cost of cross‐border import procedures is around USD 213 in Malaysia, USD 223 in Tajikistan and USD 981 in Maldives; and documentary requirements of USD 40 in Suriname, USD 50 in Brunei and 900 USD in Afghanistan. In landlocked Asian countries, the cost of doing business across borders is too high.
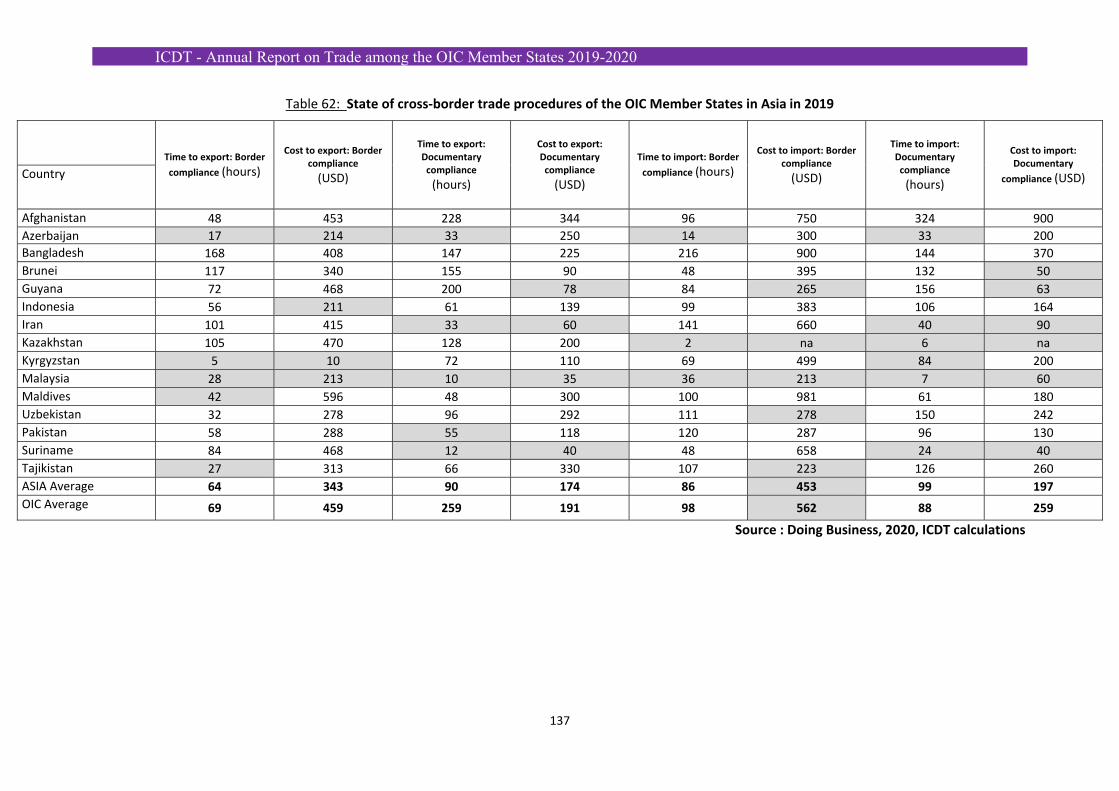
ICDT - Annual Report on Trade among the OIC Member States 2019-2020
137
Table 62: State of cross‐border trade procedures of the OIC Member States in Asia in 2019
Time to export: Border
compliance (hours)
Cost to export: Border compliance
(USD)
Time to export: Documentary compliance
(hours)
Cost to export: Documentary compliance
(USD)
Time to import: Border
compliance (hours)
Cost to import: Border compliance
(USD)
Time to import: Documentary compliance
(hours)
Cost to import: Documentary
compliance (USD) Country
Afghanistan 48 453 228 344 96 750 324 900
Azerbaijan 17 214 33 250 14 300 33 200
Bangladesh 168 408 147 225 216 900 144 370
Brunei 117 340 155 90 48 395 132 50
Guyana 72 468 200 78 84 265 156 63
Indonesia 56 211 61 139 99 383 106 164
Iran 101 415 33 60 141 660 40 90
Kazakhstan 105 470 128 200 2 na 6 na
Kyrgyzstan 5 10 72 110 69 499 84 200
Malaysia 28 213 10 35 36 213 7 60
Maldives 42 596 48 300 100 981 61 180
Uzbekistan 32 278 96 292 111 278 150 242
Pakistan 58 288 55 118 120 287 96 130
Suriname 84 468 12 40 48 658 24 40
Tajikistan 27 313 66 330 107 223 126 260
ASIA Average 64 343 90 174 86 453 99 197
OIC Average 69 459 259 191 98 562 88 259
Source : Doing Business, 2020, ICDT calculations
ICDT - Annual Report on Trade among the OIC Member States 2019-2020
138
Facilitation reforms of cross‐border trade in Asian OIC Member Countries:
To better facilitate cross‐border trade, some Asian countries including Guyana and Suriname, have introduced the following reforms: Afghanistan has improved the use of different sections of the Automated Customs System
“ASYCUDA World” to facilitate customs clearance procedures for export and import. Azerbaijan: has consolidated all foreign trade agencies into a single window to reduce
customs clearance time and has also simplified customs internal procedures. It has also introduced the electronic data exchange system to facilitate customs declarations for export and import, as well as installing a green corridor entrance for fast‐track.
Bangladesh: the automation of customs clearance at the port of Chittagong has reduced the time required for customs clearance. This country has introduced a fully automated and computerized customs data management system, ASYCUDA World (Automated System for Customs). This reform will be implemented in the ports of Chittagong and Dhaka.
Brunei: has adopted an electronic system allowing the Customs to facilitate trade; it has improved the customs declaration process for export and import through its National Single Window System.
Guyana: has improved Risk Management system of customs inspection, thereby reducing the number of physical inspections of ships and accelerating trade and installed scanners for export.
Indonesia: has reduced the time to export by launching a Single Window. The Government has improved customs services by developing new features of its national Single Window to facilitate customs clearances for export and import; and has introduced the electronic billing system especially in Jakarta and Surabaya. It has improved the electronic processing of customs declarations for export at both ports.
Iran: has reduced the time at the export and import levels through the installation of scanners at the port of Shahid Rajaee and the reorganization of the clearing customs offices in order to separate the inspections of special goods (chemicals, oil) from those of general goods. It has expanded and enhanced the services offered by the Single Window modalities to facilitate customs clearance. It has improved the national Single window to facilitate international trade transactions.
Kazakhstan: has accelerated cross‐border trade through efforts to modernize customs, including the implementation of the risk management system and introduced improvements to the customs computerization. It has also built a new border post and rail link that helped reduce congestion at the border with China. Kazakhstan has withdrawn two documents during customs export declarations. It has introduced the ASTANA‐1 IS electronic customs declaration system and reduced customs administrative taxes.
Kyrgyzstan: the deletion of six required documents and the simplification of procedures for inspection by the Government have accelerated the cross‐border trade. The country becoming a Member of the Eurasian Economic Union has reduced the duration and cost of exports. It has made exports with the Union easier by aligning itself with regional
ICDT - Annual Report on Trade among the OIC Member States 2019-2020
139
procedures.
Malaysia: it has invested in infrastructure and equipment at the Port of Klang and established electronic forms to avoid the risk of inspections of cargo at said port.
Pakistan: has reduced the export time by improving electronic communication between the Karachi Port authorities and private terminals, which have also increased their efficiency by adopting new equipment. It has introduced a fully computerized system (One Customs System Web‐based) for the submission and processing of import and export documentation. This reform is implemented in the ports of Lahore and Karachi contributed to the efficiency of these two ports. Pakistan has also built a new container terminal, improved the Customs website and submitted more electronic documents. It has improved cross‐border transactions by integrating all customs agencies into a single electronic platform to coordinate physical inspections at the ports of Karachi and Lahore.
Suriname: has reduced the time associated with procedures for obtaining export and import documentation by introducing an automated Customs Management System (ASYCUDA) World.
Tajikistan: has taken measures to facilitate cross‐border trade by submitting customs declarations electronically, and prioritizing export procedures and simplifying declarations with Uzbekistan by signing a simplified customs agreement.
Uzbekistan: has proceeded to the reduction of operations export time by establishing a single window for customs declaration and has reduces the number of documents required for each import transaction. It has also eliminated the registration of import contracts between operators and customs, decreased the waiting time for banks during the recording of export and import operations and reduced the number of required documents. In 2015, the country introduced the electronic customs declarations. It has introduced a risk management system by simplifying import documents and using the electronic payment of several certificates while reducing the time required for export.
2/ State of cross‐border trade in the OIC Member States of Sub‐Saharan Africa:
Indicators relating to cross‐border trade in the OIC Sub‐Saharan Africa countries.
Between 2006 and 2019, around 38 reforms were introduced to facilitate the business of African OIC countries out of the 153 reforms carried out by OIC countries. Many other sub‐Saharan countries have introduced at least three reforms over the past ten years: Mali (7), Nigeria (4), Sierra Leone (4), Djibouti (3), Senegal (3) and Togo (3 reforms). But we note that several African countries have not made any reforms for ten years, which makes the cost and duration of cross‐border transactions more expensive
In the context of the facilitation of cross‐border procedures, some countries have reduced as follows:
At export:
Meeting the deadline for cross‐border trade procedures for a 20‐foot container would take approximately 51 hours in the Comoros to 128 hours in Nigeria and the cost of these procedures is estimated on average at 163 USD in Togo compared to 1633 UD in Gabon. Regarding the respect
ICDT - Annual Report on Trade among the OIC Member States 2019-2020
140
of the procedures of the documentary requirements, the time is of the order of 11h in Togo to 190h in Sudan and the cost of these procedures varies between 25USD in Togo to 428 USD in Sudan in 2019. It is fitting to say that the countries of Sub‐Saharan Africa have procedures which remain the most expensive and the slowest of the OIC countries and this in connection with the lack of modern logistics infrastructure but also by the existence of landlocked countries despite some efforts by certain States in the establishment of single commercial windows and the digitization of customs services.
At import:
Meeting the deadline for cross‐border trade procedures and documentation remains more expensive than exporting. The timeframe is around 9h in Mozambique to 271h in Cameroon with a cost varying between 265 USD in Burkina Faso and 1407 USD in Cameroon to accomplish this operation. In terms of documentation, it will take around 16 hours in Mozambique to 180 hours in Togo to finalize a documentary requirement and the average cost ranges from 60 USD in Mozambique to 849 USD in Cameroon. This means that African OIC countries need to invest more in facilitating goods clearance operations.
The member states of UEMOA, ECOWAS, CEMAC, SADC and COMESA have in recent years developed a regional policy to facilitate intra‐regional trade, making the cost of cross‐border trade acceptable.
Reforms to facilitate cross‐border trade in OIC Sub‐Saharan African countries
In order to better facilitate cross‐border trade, some OIC Sub‐Saharan African countries adopted reforms between 2006 and 2019, such as:
Benin has introduced the single window modalities to reduce the period of cross‐border trade procedures including customs, inspection agencies, port authorities and other service providers in the port of Cotonou. Just as it has improved the port management system and infrastructure by introducing new rules for the transit of trucks. It has also reduced the number of documents required for import and export. The established Single Window helped also to reduce the time of export and import operations.
Burkina Faso has also facilitated trade by reducing the number of documents required for importers and exporters, following the creation of a single window of foreign trade.
Cameroon has improved the single window of foreign trade of Douala and implemented the GPS tracking system of goods and scanners which helped reducing the time of import and export and improved the security of goods in transit in Cameroon.
Comoros has implemented an Automated System for Customs Data (ASYCUDA++) that reduced the time required to prepare and submit documents for export and import.
Cote d’Ivoire simplified the process of preparing the inspection file and reduced the costs of handling at the port of Abidjan and it has also created an online Alert Mechanism of Non‐Tariff Barriers to trade in collaboration with ITC. It has introduced a single window platform for import which reduced the required time period and the required documents.
Djibouti improved cross‐border trade by setting up the new container terminal of Doraleh (DTC). The new terminal is capable of serving larger vessels and increasing handling capacity to 1.2 million of units twenty feet equivalent (TEUs). This terminal has increased the export capacity of the country.
ICDT - Annual Report on Trade among the OIC Member States 2019-2020
141
Gabon has introduced a supplementary document at import and export levels, which makes it more difficult to trading partners.
The Gambia has improved the payment of taxes by reducing the minimum tax rate on income and on corporate income. The Gambia has also accelerated cross‐border trade by implementing an Automatic system for Customs Data (ASYCUDA SYSTEM).
Guinea: has improved the management system for the port of Conakry. The country has made its import operations easier by eliminating pre‐unloading inspections.
Mali: has removed redundant inspections on imported goods, thus decreasing delays on cross‐border trade through the implementation of electronic data exchanges used by Malian businessmen, and lowering the time for obtaining the documentation required for foreign trade. It has reduced the duration of obtaining documents for export or import by establishing an electronic Single Window system.
Mozambique: has implemented the electronic Single Window to facilitate cross border trade transactions. It has also built a complex to improve export operations at the port of Maputo‐Matola. The country has facilitated cross‐border trade by streamlining the presentation of import documents, improving infrastructure at the Ressano Garcia border post and simplifying the compliance of export documents.
Niger: has reduced the time of import operations by expanding and optimizing the use of the system of electronic data exchange of customs declarations. It has removed mandatory pre‐shipment inspection on imported products to expedite customs clearance. Nigeria: has reduced the time to export and import by further improving its electronic
system and launching electronic payment of duties. This reform applies to both Kano and Lagos. It has also reduced the time needed to export and import by implementing joint inspections, the NICIS2 electronic system and 24‐hour operations at the port of Apapa.
Uganda: has implemented the electronic system ASYCUDA World with Kenya Simba System to provide a single platform to facilitate the presentation of export and import documents and manage the revenues of their respective customs. This country has also reduced the duration of cross‐border trade operations by increasing the opening hours at the port of Mombasa and improving customs procedures and border cooperation. Uganda has reduced the time needed to export and import by continuing to implement the Single Customs Territory, as well as expanding the Uganda Electronic Single Window and Central Document Processing Centre.
Senegal: has reduced the costs linked to cross‐border trade by opening the transport market, which has fostered competition. The country has also improved the execution of contracts by setting up specialized courts at the Chambers of Commerce. Similarly, it has improved the treatment process at Dakar port and the connection of the numerous agencies to the Single Window System GAINDE, which reduced the duration of cross‐border trade transactions. Sierra Leone: has also expedited cross‐border trade by implementing the Automatic
System for Customs Data (ASYCUDA System). It has made transactions more efficient by implementing a series of initiatives on the elimination of export permits and the beginning of the process prior to arrival of the goods. Sierra Leone has accelerated cross‐border trade by improving its electronic customs data exchange system, thereby reducing the time it takes to bring import documents into compliance.
ICDT - Annual Report on Trade among the OIC Member States 2019-2020
142
Togo: has introduced an electronic platform for the exchange of documents connecting several payment agencies for border trade transactions reducing the time required for such operations. It has also introduced a Single Window system which has reduced the time for obtaining the documentation for export and import.
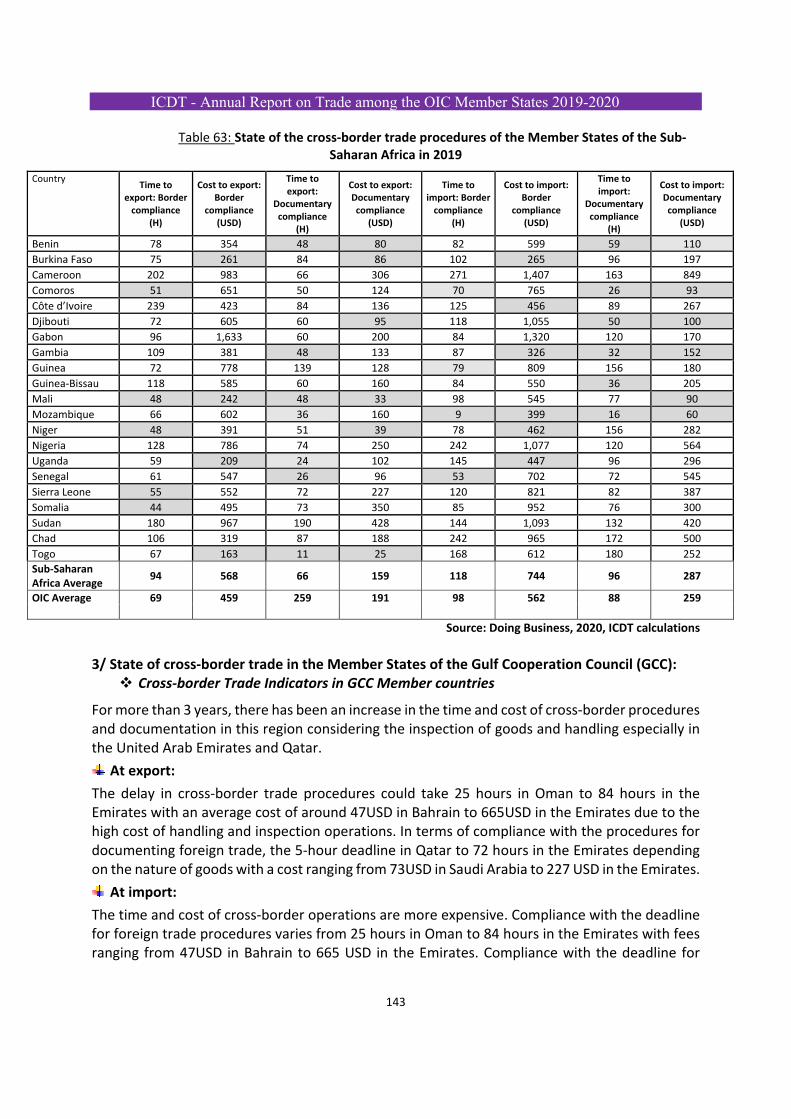
ICDT - Annual Report on Trade among the OIC Member States 2019-2020
143
Table 63: State of the cross‐border trade procedures of the Member States of the Sub‐Saharan Africa in 2019
Country Time to
export: Border compliance
(H)
Cost to export: Border
compliance (USD)
Time to export:
Documentary compliance
(H)
Cost to export: Documentary compliance
(USD)
Time to import: Border compliance
(H)
Cost to import: Border
compliance (USD)
Time to import:
Documentary compliance
(H)
Cost to import: Documentary compliance
(USD)
Benin 78 354 48 80 82 599 59 110
Burkina Faso 75 261 84 86 102 265 96 197
Cameroon 202 983 66 306 271 1,407 163 849
Comoros 51 651 50 124 70 765 26 93
Côte d’Ivoire 239 423 84 136 125 456 89 267
Djibouti 72 605 60 95 118 1,055 50 100
Gabon 96 1,633 60 200 84 1,320 120 170
Gambia 109 381 48 133 87 326 32 152
Guinea 72 778 139 128 79 809 156 180
Guinea‐Bissau 118 585 60 160 84 550 36 205
Mali 48 242 48 33 98 545 77 90
Mozambique 66 602 36 160 9 399 16 60
Niger 48 391 51 39 78 462 156 282
Nigeria 128 786 74 250 242 1,077 120 564
Uganda 59 209 24 102 145 447 96 296
Senegal 61 547 26 96 53 702 72 545
Sierra Leone 55 552 72 227 120 821 82 387
Somalia 44 495 73 350 85 952 76 300
Sudan 180 967 190 428 144 1,093 132 420
Chad 106 319 87 188 242 965 172 500
Togo 67 163 11 25 168 612 180 252
Sub‐Saharan Africa Average
94 568 66 159 118 744 96 287
OIC Average 69 459 259 191 98 562 88 259
Source: Doing Business, 2020, ICDT calculations
3/ State of cross‐border trade in the Member States of the Gulf Cooperation Council (GCC): Cross‐border Trade Indicators in GCC Member countries
For more than 3 years, there has been an increase in the time and cost of cross‐border procedures and documentation in this region considering the inspection of goods and handling especially in the United Arab Emirates and Qatar.
At export:
The delay in cross‐border trade procedures could take 25 hours in Oman to 84 hours in the Emirates with an average cost of around 47USD in Bahrain to 665USD in the Emirates due to the high cost of handling and inspection operations. In terms of compliance with the procedures for documenting foreign trade, the 5‐hour deadline in Qatar to 72 hours in the Emirates depending on the nature of goods with a cost ranging from 73USD in Saudi Arabia to 227 USD in the Emirates.
At import:
The time and cost of cross‐border operations are more expensive. Compliance with the deadline for foreign trade procedures varies from 25 hours in Oman to 84 hours in the Emirates with fees ranging from 47USD in Bahrain to 665 USD in the Emirates. Compliance with the deadline for
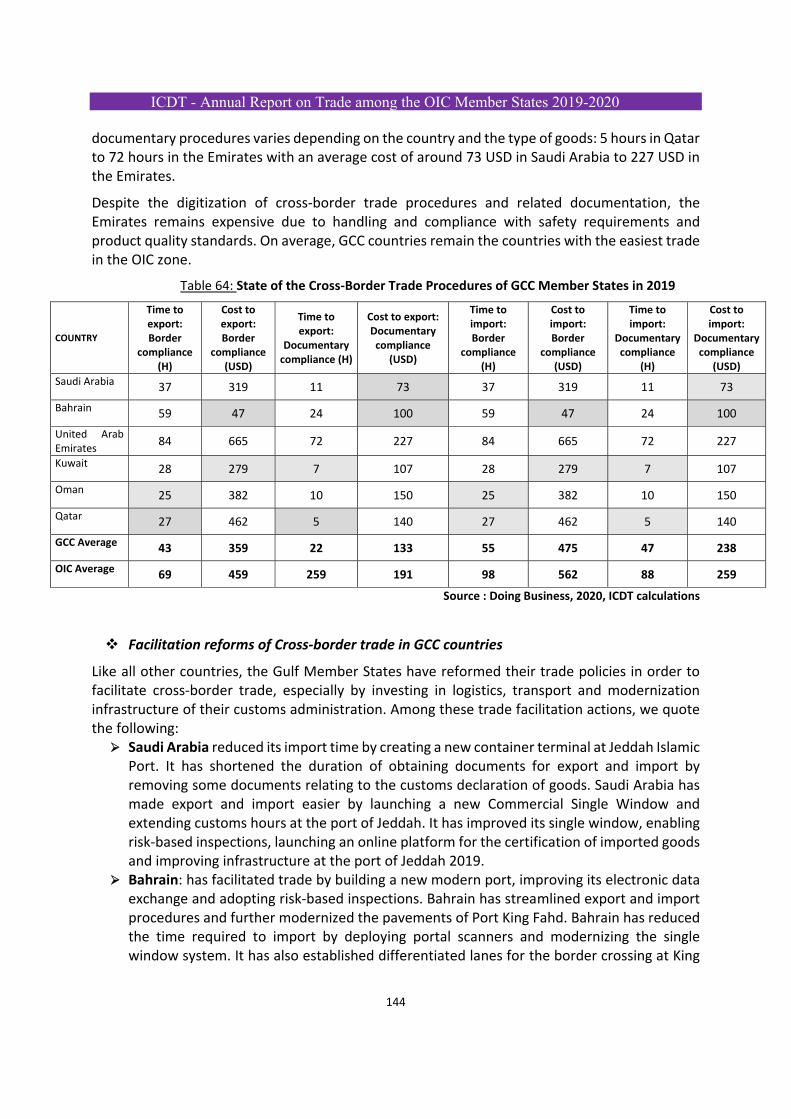
ICDT - Annual Report on Trade among the OIC Member States 2019-2020
144
documentary procedures varies depending on the country and the type of goods: 5 hours in Qatar to 72 hours in the Emirates with an average cost of around 73 USD in Saudi Arabia to 227 USD in the Emirates.
Despite the digitization of cross‐border trade procedures and related documentation, the Emirates remains expensive due to handling and compliance with safety requirements and product quality standards. On average, GCC countries remain the countries with the easiest trade in the OIC zone.
Table 64: State of the Cross‐Border Trade Procedures of GCC Member States in 2019
COUNTRY
Time to export: Border
compliance (H)
Cost to export: Border
compliance (USD)
Time to export:
Documentary compliance (H)
Cost to export: Documentary compliance
(USD)
Time to import: Border
compliance (H)
Cost to import: Border
compliance (USD)
Time to import:
Documentary compliance
(H)
Cost to import:
Documentary compliance
(USD)
Saudi Arabia 37 319 11 73 37 319 11 73
Bahrain 59 47 24 100 59 47 24 100
United Arab Emirates
84 665 72 227 84 665 72 227
Kuwait 28 279 7 107 28 279 7 107
Oman 25 382 10 150 25 382 10 150
Qatar 27 462 5 140 27 462 5 140
GCC Average 43 359 22 133 55 475 47 238
OIC Average 69 459 259 191 98 562 88 259
Source : Doing Business, 2020, ICDT calculations
Facilitation reforms of Cross‐border trade in GCC countries
Like all other countries, the Gulf Member States have reformed their trade policies in order to facilitate cross‐border trade, especially by investing in logistics, transport and modernization infrastructure of their customs administration. Among these trade facilitation actions, we quote the following: Saudi Arabia reduced its import time by creating a new container terminal at Jeddah Islamic
Port. It has shortened the duration of obtaining documents for export and import by removing some documents relating to the customs declaration of goods. Saudi Arabia has made export and import easier by launching a new Commercial Single Window and extending customs hours at the port of Jeddah. It has improved its single window, enabling risk‐based inspections, launching an online platform for the certification of imported goods and improving infrastructure at the port of Jeddah 2019.
Bahrain: has facilitated trade by building a new modern port, improving its electronic data exchange and adopting risk‐based inspections. Bahrain has streamlined export and import procedures and further modernized the pavements of Port King Fahd. Bahrain has reduced the time required to import by deploying portal scanners and modernizing the single window system. It has also established differentiated lanes for the border crossing at King
ICDT - Annual Report on Trade among the OIC Member States 2019-2020
145
Fahd Port. United Arab Emirates have streamlined the preparation of documents and reduced the
time required to trade by launching the new comprehensive system of Dubai Customs, the Mirsal 2. It has also set up a single window; improved inspections based on risk management, introduced the electronic exchange of data to facilitate cross‐border trade, eliminated handling receipts and diversified handling process of financial products for export.
Kuwait has reduced the time required for customs declarations by improving administrative procedures and the training of its employees. It has improved export and import procedures by introducing an electronic information exchange link between several national customs agencies. Kuwait has improved the customs risk management system and introducing a new electronic customs clearance system. Oman has decreased the time required for cross‐border trade procedures by transferring
freight operations from the Port Sultan Qaboos to the Port of Sohar to decongest the main port. It has reduced the length of procedures and the obtaining of documents for export and import by establishing a single window system to speed up electronic goods clearance operations. Oman has invested in infrastructure at the port of Sohar to speed up cross‐border trade operations while introducing risk‐based inspections and post‐clearance audits.
Qatar has reduced the duration of export and import by introducing a new online portal for the electronic submission of customs declarations to the port of Doha. The country has reduced the period of cross‐border trade procedures by reducing the number of free days’ storage at the port which has significantly lowered the port handling. It has built a new Hamad Port to streamline Qatar's port processes and facilitate export and import operations.
4/ State of cross‐border trade of the OIC Middle East Member States:
Indicators relating to cross‐border trade in the OIC Middle East Member States:
The indicators of the cross‐border trade procedures of the OIC Middle East Member States are among the lowest of the OIC Member States as in Turkey, Albania and Palestine (case of sanitary and food emergencies). Countries such as Albania, Egypt, Jordan and Turkey have invested in the area of cross‐border trade facilitation in recent years. Albania is a country where the conduct of business is more flexible and less expensive.
Given the difficult economic situation in Iraq, Yemen, Syria and Palestine, the conduct of cross‐border transactions remains very important.
At export:
The time for cross‐border trade procedures could reach 6 hours in Palestine (in relation to urgent necessities) to 96 hours in Lebanon depending on the nature of the product with an average cost of 51 USD in Palestine, 1,118 USD in Iraq due to the high cost of handling and inspection operations. For foreign trade documentation procedures, the timeframe varies from 4 hours in Turkey to 504 hours in Iraq depending on the nature of goods with a cost ranging from 10 USD in Albania to 1,800 USD in Iraq.
At import:
Compliance with the timeframe for foreign trade procedures ranges from 10 hours in Albania
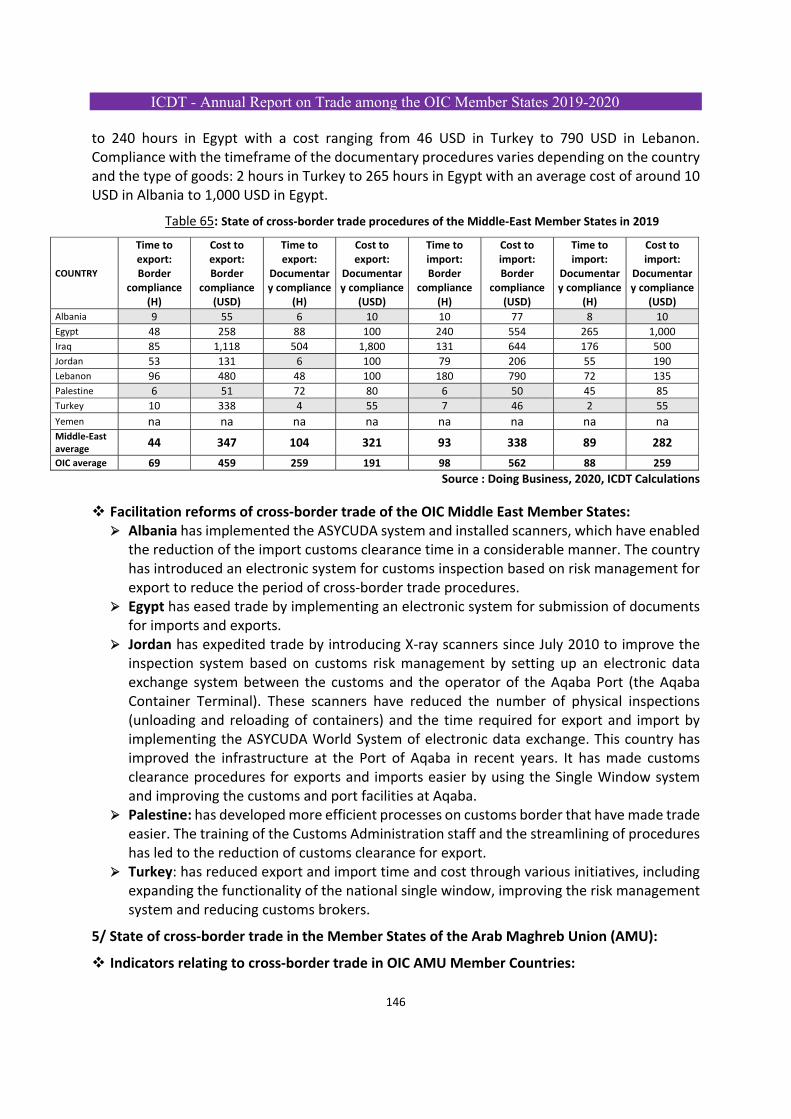
ICDT - Annual Report on Trade among the OIC Member States 2019-2020
146
to 240 hours in Egypt with a cost ranging from 46 USD in Turkey to 790 USD in Lebanon. Compliance with the timeframe of the documentary procedures varies depending on the country and the type of goods: 2 hours in Turkey to 265 hours in Egypt with an average cost of around 10 USD in Albania to 1,000 USD in Egypt.
Table 65: State of cross‐border trade procedures of the Middle‐East Member States in 2019
COUNTRY
Time to export: Border
compliance (H)
Cost to export: Border
compliance (USD)
Time to export:
Documentary compliance
(H)
Cost to export:
Documentary compliance
(USD)
Time to import: Border
compliance (H)
Cost to import: Border
compliance (USD)
Time to import:
Documentary compliance
(H)
Cost to import:
Documentary compliance
(USD) Albania 9 55 6 10 10 77 8 10 Egypt 48 258 88 100 240 554 265 1,000 Iraq 85 1,118 504 1,800 131 644 176 500 Jordan 53 131 6 100 79 206 55 190 Lebanon 96 480 48 100 180 790 72 135 Palestine 6 51 72 80 6 50 45 85 Turkey 10 338 4 55 7 46 2 55
Yemen na na na na na na na na Middle‐East average
44 347 104 321 93 338 89 282
OIC average 69 459 259 191 98 562 88 259
Source : Doing Business, 2020, ICDT Calculations
Facilitation reforms of cross‐border trade of the OIC Middle East Member States: Albania has implemented the ASYCUDA system and installed scanners, which have enabled
the reduction of the import customs clearance time in a considerable manner. The country has introduced an electronic system for customs inspection based on risk management for export to reduce the period of cross‐border trade procedures.
Egypt has eased trade by implementing an electronic system for submission of documents for imports and exports.
Jordan has expedited trade by introducing X‐ray scanners since July 2010 to improve the inspection system based on customs risk management by setting up an electronic data exchange system between the customs and the operator of the Aqaba Port (the Aqaba Container Terminal). These scanners have reduced the number of physical inspections (unloading and reloading of containers) and the time required for export and import by implementing the ASYCUDA World System of electronic data exchange. This country has improved the infrastructure at the Port of Aqaba in recent years. It has made customs clearance procedures for exports and imports easier by using the Single Window system and improving the customs and port facilities at Aqaba.
Palestine: has developed more efficient processes on customs border that have made trade easier. The training of the Customs Administration staff and the streamlining of procedures has led to the reduction of customs clearance for export.
Turkey: has reduced export and import time and cost through various initiatives, including expanding the functionality of the national single window, improving the risk management system and reducing customs brokers.
5/ State of cross‐border trade in the Member States of the Arab Maghreb Union (AMU):
Indicators relating to cross‐border trade in OIC AMU Member Countries:
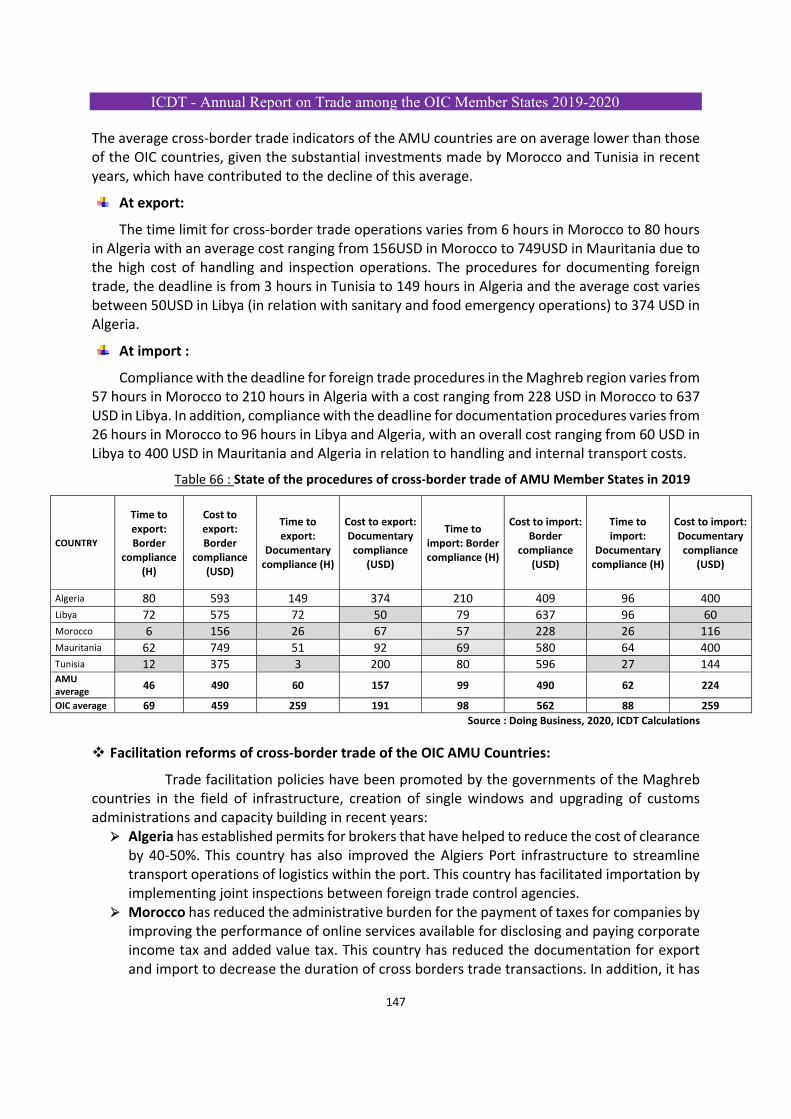
ICDT - Annual Report on Trade among the OIC Member States 2019-2020
147
The average cross‐border trade indicators of the AMU countries are on average lower than those of the OIC countries, given the substantial investments made by Morocco and Tunisia in recent years, which have contributed to the decline of this average.
At export:
The time limit for cross‐border trade operations varies from 6 hours in Morocco to 80 hours in Algeria with an average cost ranging from 156USD in Morocco to 749USD in Mauritania due to the high cost of handling and inspection operations. The procedures for documenting foreign trade, the deadline is from 3 hours in Tunisia to 149 hours in Algeria and the average cost varies between 50USD in Libya (in relation with sanitary and food emergency operations) to 374 USD in Algeria.
At import :
Compliance with the deadline for foreign trade procedures in the Maghreb region varies from 57 hours in Morocco to 210 hours in Algeria with a cost ranging from 228 USD in Morocco to 637 USD in Libya. In addition, compliance with the deadline for documentation procedures varies from 26 hours in Morocco to 96 hours in Libya and Algeria, with an overall cost ranging from 60 USD in Libya to 400 USD in Mauritania and Algeria in relation to handling and internal transport costs.
Table 66 : State of the procedures of cross‐border trade of AMU Member States in 2019
COUNTRY
Time to export: Border
compliance (H)
Cost to export: Border
compliance (USD)
Time to export:
Documentary compliance (H)
Cost to export: Documentary compliance
(USD)
Time to import: Border compliance (H)
Cost to import: Border
compliance (USD)
Time to import:
Documentary compliance (H)
Cost to import: Documentary compliance
(USD)
Algeria 80 593 149 374 210 409 96 400 Libya 72 575 72 50 79 637 96 60 Morocco 6 156 26 67 57 228 26 116 Mauritania 62 749 51 92 69 580 64 400 Tunisia 12 375 3 200 80 596 27 144 AMU average
46 490 60 157 99 490 62 224
OIC average 69 459 259 191 98 562 88 259
Source : Doing Business, 2020, ICDT Calculations
Facilitation reforms of cross‐border trade of the OIC AMU Countries:
Trade facilitation policies have been promoted by the governments of the Maghreb countries in the field of infrastructure, creation of single windows and upgrading of customs administrations and capacity building in recent years: Algeria has established permits for brokers that have helped to reduce the cost of clearance
by 40‐50%. This country has also improved the Algiers Port infrastructure to streamline transport operations of logistics within the port. This country has facilitated importation by implementing joint inspections between foreign trade control agencies.
Morocco has reduced the administrative burden for the payment of taxes for companies by improving the performance of online services available for disclosing and paying corporate income tax and added value tax. This country has reduced the documentation for export and import to decrease the duration of cross borders trade transactions. In addition, it has
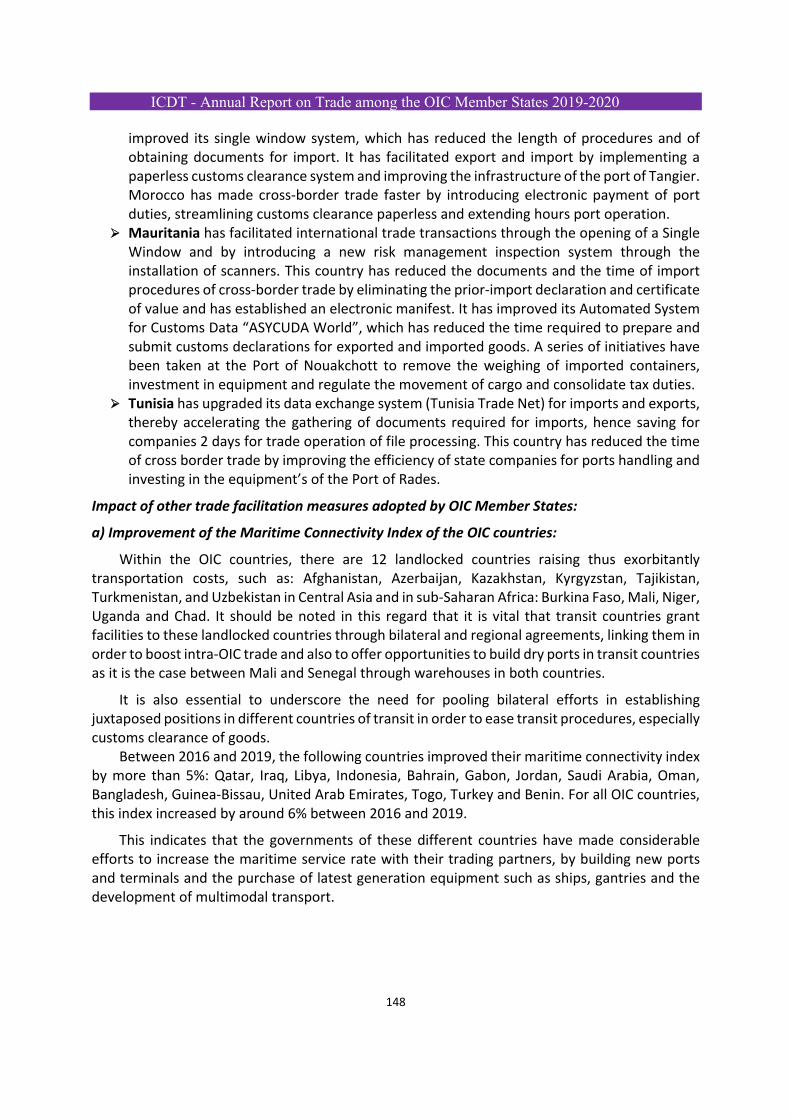
ICDT - Annual Report on Trade among the OIC Member States 2019-2020
148
improved its single window system, which has reduced the length of procedures and of obtaining documents for import. It has facilitated export and import by implementing a paperless customs clearance system and improving the infrastructure of the port of Tangier. Morocco has made cross‐border trade faster by introducing electronic payment of port duties, streamlining customs clearance paperless and extending hours port operation.
Mauritania has facilitated international trade transactions through the opening of a Single Window and by introducing a new risk management inspection system through the installation of scanners. This country has reduced the documents and the time of import procedures of cross‐border trade by eliminating the prior‐import declaration and certificate of value and has established an electronic manifest. It has improved its Automated System for Customs Data “ASYCUDA World”, which has reduced the time required to prepare and submit customs declarations for exported and imported goods. A series of initiatives have been taken at the Port of Nouakchott to remove the weighing of imported containers, investment in equipment and regulate the movement of cargo and consolidate tax duties.
Tunisia has upgraded its data exchange system (Tunisia Trade Net) for imports and exports, thereby accelerating the gathering of documents required for imports, hence saving for companies 2 days for trade operation of file processing. This country has reduced the time of cross border trade by improving the efficiency of state companies for ports handling and investing in the equipment’s of the Port of Rades.
Impact of other trade facilitation measures adopted by OIC Member States:
a) Improvement of the Maritime Connectivity Index of the OIC countries:
Within the OIC countries, there are 12 landlocked countries raising thus exorbitantly transportation costs, such as: Afghanistan, Azerbaijan, Kazakhstan, Kyrgyzstan, Tajikistan, Turkmenistan, and Uzbekistan in Central Asia and in sub‐Saharan Africa: Burkina Faso, Mali, Niger, Uganda and Chad. It should be noted in this regard that it is vital that transit countries grant facilities to these landlocked countries through bilateral and regional agreements, linking them in order to boost intra‐OIC trade and also to offer opportunities to build dry ports in transit countries as it is the case between Mali and Senegal through warehouses in both countries.
It is also essential to underscore the need for pooling bilateral efforts in establishing juxtaposed positions in different countries of transit in order to ease transit procedures, especially customs clearance of goods.
Between 2016 and 2019, the following countries improved their maritime connectivity index by more than 5%: Qatar, Iraq, Libya, Indonesia, Bahrain, Gabon, Jordan, Saudi Arabia, Oman, Bangladesh, Guinea‐Bissau, United Arab Emirates, Togo, Turkey and Benin. For all OIC countries, this index increased by around 6% between 2016 and 2019.
This indicates that the governments of these different countries have made considerable efforts to increase the maritime service rate with their trading partners, by building new ports and terminals and the purchase of latest generation equipment such as ships, gantries and the development of multimodal transport.
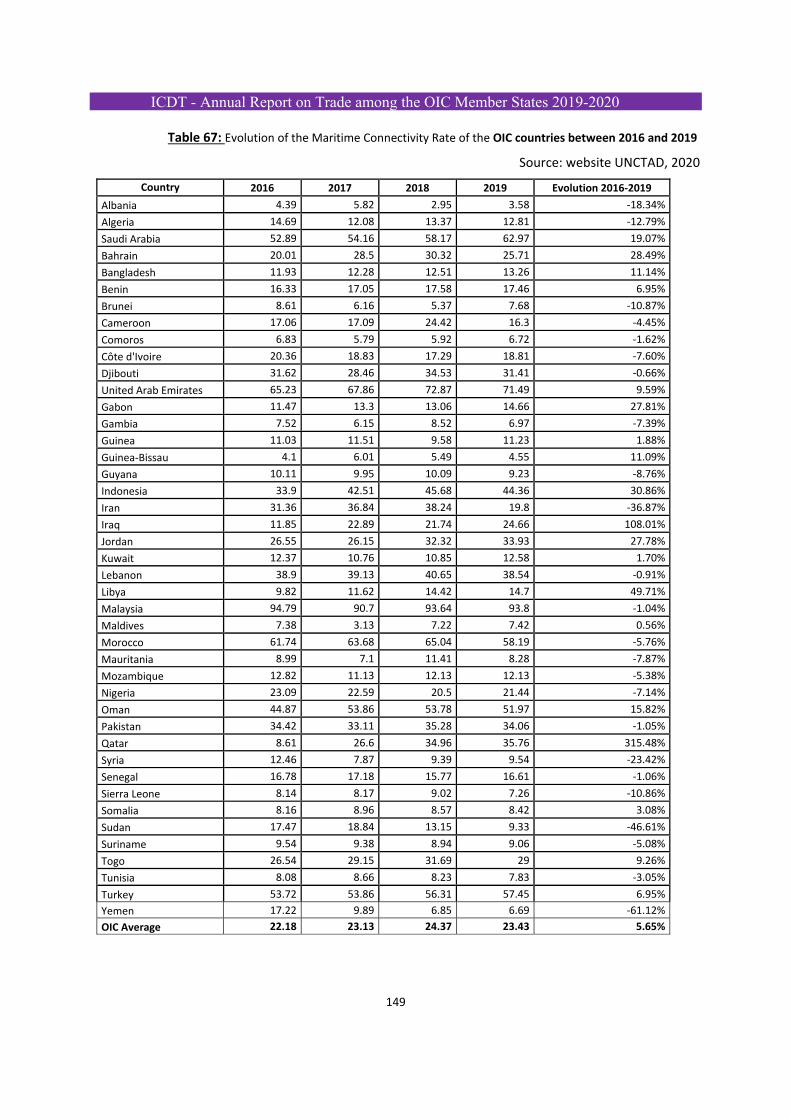
ICDT - Annual Report on Trade among the OIC Member States 2019-2020
149
Table 67: Evolution of the Maritime Connectivity Rate of the OIC countries between 2016 and 2019
Source: website UNCTAD, 2020
Country 2016 2017 2018 2019 Evolution 2016‐2019
Albania 4.39 5.82 2.95 3.58 ‐18.34%
Algeria 14.69 12.08 13.37 12.81 ‐12.79%
Saudi Arabia 52.89 54.16 58.17 62.97 19.07%
Bahrain 20.01 28.5 30.32 25.71 28.49%
Bangladesh 11.93 12.28 12.51 13.26 11.14%
Benin 16.33 17.05 17.58 17.46 6.95%
Brunei 8.61 6.16 5.37 7.68 ‐10.87%
Cameroon 17.06 17.09 24.42 16.3 ‐4.45%
Comoros 6.83 5.79 5.92 6.72 ‐1.62%
Côte d'Ivoire 20.36 18.83 17.29 18.81 ‐7.60%
Djibouti 31.62 28.46 34.53 31.41 ‐0.66%
United Arab Emirates 65.23 67.86 72.87 71.49 9.59%
Gabon 11.47 13.3 13.06 14.66 27.81%
Gambia 7.52 6.15 8.52 6.97 ‐7.39%
Guinea 11.03 11.51 9.58 11.23 1.88%
Guinea‐Bissau 4.1 6.01 5.49 4.55 11.09%
Guyana 10.11 9.95 10.09 9.23 ‐8.76%
Indonesia 33.9 42.51 45.68 44.36 30.86%
Iran 31.36 36.84 38.24 19.8 ‐36.87%
Iraq 11.85 22.89 21.74 24.66 108.01%
Jordan 26.55 26.15 32.32 33.93 27.78%
Kuwait 12.37 10.76 10.85 12.58 1.70%
Lebanon 38.9 39.13 40.65 38.54 ‐0.91%
Libya 9.82 11.62 14.42 14.7 49.71%
Malaysia 94.79 90.7 93.64 93.8 ‐1.04%
Maldives 7.38 3.13 7.22 7.42 0.56%
Morocco 61.74 63.68 65.04 58.19 ‐5.76%
Mauritania 8.99 7.1 11.41 8.28 ‐7.87%
Mozambique 12.82 11.13 12.13 12.13 ‐5.38%
Nigeria 23.09 22.59 20.5 21.44 ‐7.14%
Oman 44.87 53.86 53.78 51.97 15.82%
Pakistan 34.42 33.11 35.28 34.06 ‐1.05%
Qatar 8.61 26.6 34.96 35.76 315.48%
Syria 12.46 7.87 9.39 9.54 ‐23.42%
Senegal 16.78 17.18 15.77 16.61 ‐1.06%
Sierra Leone 8.14 8.17 9.02 7.26 ‐10.86%
Somalia 8.16 8.96 8.57 8.42 3.08%
Sudan 17.47 18.84 13.15 9.33 ‐46.61%
Suriname 9.54 9.38 8.94 9.06 ‐5.08%
Togo 26.54 29.15 31.69 29 9.26%
Tunisia 8.08 8.66 8.23 7.83 ‐3.05%
Turkey 53.72 53.86 56.31 57.45 6.95%
Yemen 17.22 9.89 6.85 6.69 ‐61.12%
OIC Average 22.18 23.13 24.37 23.43 5.65%
ICDT - Annual Report on Trade among the OIC Member States 2019-2020
150
b) Improvement of Logistics Performance Index (LPI)
The overall rating of the performance index of logistics reflects the perceptions of a country's logistics based on efficiency of customs clearance process, the quality of commercial infrastructure and related transport infrastructure, ease of organization of shipments at competitive prices, quality of infrastructure services, monitoring capacity and traceability of consignments and frequency by which shipments reach the recipient on time.
The index ranges from 1 to 5 and the highest grade represents the best performance. The index data is derived from surveys of the index of the performance of the supply made by the World Bank in partnership with academic and international institutions, private companies and economically active persons, in the market of international logistics.
There has been an improvement of this Logistic Performance Index of more than 5% between 2016 and 2018 for the Gambia, Yemen, Syria, Somalia, Mauritania, Cameroon, Côte d’Ivoire, Kyrgyzstan, Djibouti, Tajikistan, Benin, Chad, Albania, Iran, Turkmenistan, Uzbekistan, Maldives and Indonesia, due to the construction of new logistic infrastructures during this period to better perform international trade operations, but also to respond to health and food emergencies.
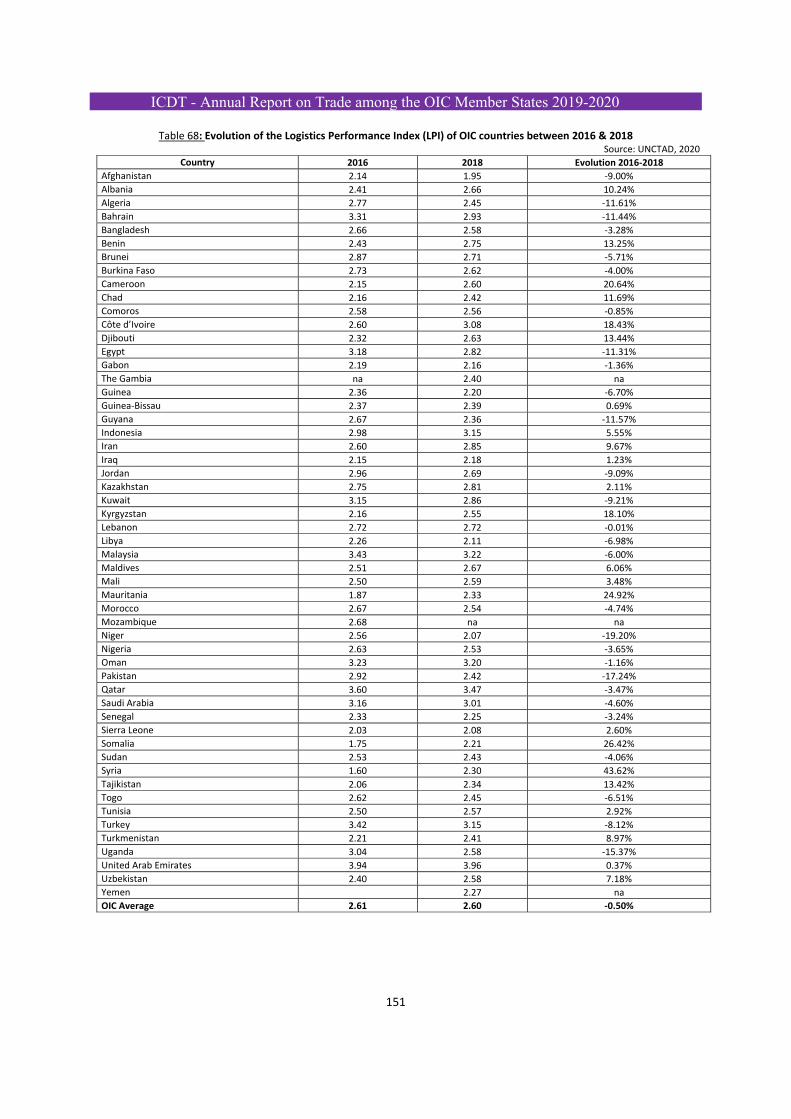
ICDT - Annual Report on Trade among the OIC Member States 2019-2020
151
Table 68: Evolution of the Logistics Performance Index (LPI) of OIC countries between 2016 & 2018 Source: UNCTAD, 2020
Country 2016 2018 Evolution 2016‐2018
Afghanistan 2.14 1.95 ‐9.00%
Albania 2.41 2.66 10.24%
Algeria 2.77 2.45 ‐11.61%
Bahrain 3.31 2.93 ‐11.44%
Bangladesh 2.66 2.58 ‐3.28%
Benin 2.43 2.75 13.25%
Brunei 2.87 2.71 ‐5.71%
Burkina Faso 2.73 2.62 ‐4.00%
Cameroon 2.15 2.60 20.64%
Chad 2.16 2.42 11.69%
Comoros 2.58 2.56 ‐0.85%
Côte d’Ivoire 2.60 3.08 18.43%
Djibouti 2.32 2.63 13.44%
Egypt 3.18 2.82 ‐11.31%
Gabon 2.19 2.16 ‐1.36%
The Gambia na 2.40 na
Guinea 2.36 2.20 ‐6.70%
Guinea‐Bissau 2.37 2.39 0.69%
Guyana 2.67 2.36 ‐11.57%
Indonesia 2.98 3.15 5.55%
Iran 2.60 2.85 9.67%
Iraq 2.15 2.18 1.23%
Jordan 2.96 2.69 ‐9.09%
Kazakhstan 2.75 2.81 2.11%
Kuwait 3.15 2.86 ‐9.21%
Kyrgyzstan 2.16 2.55 18.10%
Lebanon 2.72 2.72 ‐0.01%
Libya 2.26 2.11 ‐6.98%
Malaysia 3.43 3.22 ‐6.00%
Maldives 2.51 2.67 6.06%
Mali 2.50 2.59 3.48%
Mauritania 1.87 2.33 24.92%
Morocco 2.67 2.54 ‐4.74%
Mozambique 2.68 na na
Niger 2.56 2.07 ‐19.20%
Nigeria 2.63 2.53 ‐3.65%
Oman 3.23 3.20 ‐1.16%
Pakistan 2.92 2.42 ‐17.24%
Qatar 3.60 3.47 ‐3.47%
Saudi Arabia 3.16 3.01 ‐4.60%
Senegal 2.33 2.25 ‐3.24%
Sierra Leone 2.03 2.08 2.60%
Somalia 1.75 2.21 26.42%
Sudan 2.53 2.43 ‐4.06%
Syria 1.60 2.30 43.62%
Tajikistan 2.06 2.34 13.42%
Togo 2.62 2.45 ‐6.51%
Tunisia 2.50 2.57 2.92%
Turkey 3.42 3.15 ‐8.12%
Turkmenistan 2.21 2.41 8.97%
Uganda 3.04 2.58 ‐15.37%
United Arab Emirates 3.94 3.96 0.37%
Uzbekistan 2.40 2.58 7.18%
Yemen 2.27 na
OIC Average 2.61 2.60 ‐0.50%
ICDT - Annual Report on Trade among the OIC Member States 2019-2020
152
CONCLUSION
OIC Member States have signed several bilateral, regional and multilateral trade and investment agreements in order to better regulate trade and investment flows and further liberalize international trade transactions with local incentives.
The WTO Trade Facilitation Agreement (TFA), which entered into force on February 22, 2017, following its ratification by two‐thirds of the WTO Members, contains provisions aimed at accelerating the movement, release and customs clearance of goods, effective cooperation between customs and other competent authorities on matters of trade facilitation and compliance with customs procedures. The AFE in its category C, provides technical assistance and capacity building in this area for the benefit of Member States to establish policies and implement activities to facilitate trade.
Despite these trade and investment agreements and incentives, certain measures and laws have contributed to the development of cooperation relations but also hampered the acceleration of these flows both at the technical and procedural levels.
Studies conducted by the International Trade Center (ITC) and UNCTAD for more than ten years on Non‐Tariff Trade Measures (NTMs) have shown that States apply more restrictive domestic measures to companies than those encountered with Commercial Partners.
Indeed, the most important measures applied by Member States are: import tariffs, financial subsidies, export subsidies, export tariffs, non‐tariff import measures, import licensing, safeguard measures, anti‐dumping measures, non‐tariff export measures, import quotas, local content, financial incentives for FDI, export licensing, internal import taxes, import bans and export quotas.
Despite these barriers, Member States have also initiated trade facilitation measures to streamline foreign trade transaction procedures such as the establishment of singles windows, the construction of road, rail and airport infrastructure, and the automation of customs administration, the exchange of electronic data inter‐agency stakeholders of trade and the elimination of several foreign trade documents.
In order to better develop intra‐OIC trade, it is appropriate for Member States to activate the operationalization of the OIC trade preferential system either through the normal or fast‐track way taking into account the evolution of the environment of regional trade agreements and to increase the organization of trade and investment promotion activities in order to develop the markets for products and services in these countries.
ICDT - Annual Report on Trade among the OIC Member States 2019-2020
153
CHAPTER III:
ACTIVITIES FOR PROMOTING INTRA‐OIC TRADE AND INVESTMENT OF ICDT
ICDT - Annual Report on Trade among the OIC Member States 2019-2020
154
SECTION I: ICDT ACTIVITIES RELATEDG TO WTO
The Islamic Centre for Development of Trade (ICDT) was entrusted by the OIC General Secretariat and the Standing Committee for Economic and Commercial Cooperation (COMCEC), to pursue in collaboration with the Islamic Development Bank, the Multilateral Trade Negotiations organized by the World Trade Organization and to provide support, training and technical assistance to the OIC Member States.
In that capacity, ICDT regularly reports on the progress of these negotiations at the annual meetings of the COMCEC, the Islamic Commission for Economic, Cultural and Social Affairs of the OIC and the annual meetings of the OIC Foreign Ministers.
In view of the ministerial meetings of the World Trade Organization, the ICDT also prepares reports and preliminary studies in order to know the views of the Islamic countries and try to establish a common platform that can reconcile the different approaches.
The Centre also organizes training courses in the form of seminars and workshops for representatives of Member States from the public and private sectors on international trade negotiations and intra‐OIC trade negotiations.
I‐ ACCESSION TO WTO
The total number of memberships of the WTO reached 164 countries with the accession of the Islamic Republic of Afghanistan during the 10th WTO Ministerial Conference. Currently, 44 WTO Member States are OIC Members, i.e. more than a quarter of WTO Members. WTO Member States, accounting for about 97% of the world economy.
The number of OIC Member States seeking accession to the WTO amounts to Eleven: Algeria, Azerbaijan, Iraq, Iran, Lebanon, Libya, Uzbekistan, Sudan, Syria, Comoros and Somalia. The current status of WTO membership is as follows: Working group established for Libya, Syria and Somalia. Memorandum on the Foreign Trade Regime submitted by Iran, Iraq and Uzbekistan. Factual summary of issues raised (circulated) by Sudan. Ongoing: Bilateral Negotiations for Goods Market Access by Algeria, Azerbaijan, Lebanon,
Sudan and Uzbekistan. Ongoing: Bilateral Negotiations for Access to the Services Market by Algeria, Azerbaijan,
Lebanon, Sudan and Uzbekistan. Draft Report of the Working Group (circulated) by Algeria, Azerbaijan and Lebanon.
The activities related to the accession of Comoros, Sudan and Somalia have intensified, especially during the second half of 2016. For Example:
Algeria: Upcoming consultations between Members, the Algerian government and the WTO Secretariat will determine when the next meeting of the Working Group will be held. On May 8, 2018, the WTO General Council confirmed the appointment of Ambassador José Luís Cancela Gómez, Permanent Representative of Uruguay to the WTO, as the new Chairman of the Working Group.
Azerbaijan: At the invitation of the Government of Azerbaijan, Ambassador Walter Werner (Germany), Chairman of the Working Group, visited Baku on June 27 and 28, 2018. Accompanied by members of the Secretariat of the WTO, he held a series of high‐
ICDT - Annual Report on Trade among the OIC Member States 2019-2020
155
level meetings, in particular with the Azerbaijani ministers in charge of the file. The meetings confirmed broad support for Azerbaijan's accession to the WTO.
Comoros: The 4th meeting of the Working Group is scheduled for March 28, 2018. The purpose of this meeting is to review the draft report of the Working Group and other documents recently distributed by Comoros, including responses to Members' questions, a revised legislative action plan, other revised action plans in several specific areas and copies of legislative texts. The Comoros are preparing a 5th Meeting of the Working Group.
Iraq: Members are invited to comment on the Aide Memoire by March 9, 2018. Iraq is in regular contact with the Secretariat and continues to work on updating other contributions for the negotiations, including offers on market access for goods and services, the legislative action plan and explanatory tables for agriculture, which will be distributed to the Working Party in the coming months.
Sudan: Sudan entered into bilateral market access agreements with Japan and Nigeria on April 11 and April 19, 2018, respectively. The total number of bilateral market access agreements concluded by Sudan is now increased to six. On July 22, 2018, Sudan appointed Dr Mohamed Khair Al‐Zubair as the National Negotiator for the country’s accession to the WTO.
Uzbekistan: On July 26, 2018, the General Council of the OIC confirmed Ambassador Ji‐ah Paik (Republic of Korea) as Chairman of the Working Group for the Accession of Uzbekistan to the WTO.
Somalia: The delegation of Somalia, led by Chief Negotiator Ms. Maryan Hassan, met on July 26, 2018 with Members, partners and the WTO Accessions Division. The issues discussed included the country's readiness and the technical and institutional support it needs to successfully complete its accession process.
Important technical work has been undertaken on several accessions. Thus, the combination of the Secretariat's technical assistance and outreach activities is essential to help Members and governments enter their negotiations and to better understand what the effects and outcomes of accessions mean for the future of the Organization. In this regard, the contributions of the Chairs of the working groups have been vital. It should be noted that this technical assistance has seen the financial contribution of the following countries: Australia, Brazil, China, the United States, India and the European Union (EU) and its various Member States.
The Secretariat organized a training seminar on goods concessions for acceding governments from 18 to 22 November 2019. 20 officials from 12 acceding governments (Algeria, Azerbaijan, Belarus, Bhutan, Bosnia and Herzegovina, Comoros, Ethiopia, Lebanon, Serbia, South Sudan, Sudan, Uzbekistan) attended this seminar, together with officials from three WTO Members. The seminar provided in‐depth training on accession related aspects of trade in goods, including programming techniques, speeches on commitments and concessions in market access in goods as well as experience sharing sessions where participants could interact with WTO Members involved in the accession negotiations. In addition, former negotiators from four recently acceded Members ‐ Kazakhstan, Lao PDR, Montenegro and Yemen shared their experiences in the area of market access negotiations and presented recommendations to acceding governments. The thematic focus will be "Economic transformation through accession to WTO and implementation
ICDT - Annual Report on Trade among the OIC Member States 2019-2020
156
of the AfCFTA". Target participants are government officials responsible for WTO accession and representatives of the private sector from acceding African governments.
TRANSPARENCY OF THE ACCESSION PROCESS.
Transparency and predictability of the accession process remain key priorities for Members and the WTO Secretariat. In 2013, transparency measures and initiatives over the past four years continued to be implemented and strengthened.
For example, the Informal Accession Group (GIA) met regularly.
Its consultations focused on the following issues:
(i) Sharing and exchange of information on accessions with Members; (ii) Secretariat reports on technical developments in accession processes; (iii) Reports by working groups Chairs to Members on the results of their country visits; (iv) Planning of accession meetings and related activities on the basis of the evolving
calendar of accession meetings proposed by the Secretariat; (v) And response to specific concerns raised by Members and Acceding Governments.
The WTO Accession Information Bulletin aims to provide accessing governments, Presidents and Members with a summary report of GIA meetings. It also contains operationally useful information to help prepare for accession meetings and negotiations.
The practice of meetings with various groups of members at the WTO has intensified, in order to focus on the specific issues and concerns of each group. The overall objective is to report to Members on the activities of the calendar year, to gather their observations and to identify concerns to be addressed.
The Secretariat met with the LDC Advisory Group, the Informal Group of Developing Countries, the Asian Group of Developing Countries, GRULAC, the African Group and the Arab Group. During these meetings, he briefed the groups on the status of accessions, reported on its activities, exchanged views on the responsibilities of neighbors/regional groups, discussed the concerns raised by accessing governments and members, and consulted with its interlocutors on technical accession priorities for 2014.
TECHNICAL ASSISTANCE AND AWARENESS
Technical assistance and capacity building related to accession are focused on training government officials. They also include outreach activities for parliamentarians, the private sector, academia, civil society and the media.
The technical assistance and capacity building activities are as follows:
(i) National seminars;
(ii) Sessions on accessions during advanced trade policy courses, regional courses and introductory courses for LDCs;
(iii) Workshops;
(iv) Technical missions;
ICDT - Annual Report on Trade among the OIC Member States 2019-2020
157
(v) Visits by working group chairs;
(vi) Creating or strengthening WTO reference Centres;
(vii) Online training;
(viii) Dialogue with WTO member groups;
(ix) And attending conferences.
TOOLS FOR ACCESSIONS
In July 2016, the WTO launched a new Intelligent Membership Portal that improves access to WTO membership information as well as many new features, such as direct access to all laws notified for completed memberships. The portal is available at: https://www.wto.org/accessions.
Membership Commitments Database (ACDB): The Membership Commitments Database was launched in May 2012. It provides access to all of the commitments and related information contained in the membership working group reports and membership protocols of the 31 Members under Article XII MC (http://acdb.wto.org).
In 2018, the database has been updated to include the accession protocols of all Article XII Members and the commitments contained in them.
The Second Regional Dialogue on WTO Accessions of the Great Horn of Africa was held in Djibouti from 3 to 6 December 2018. It was organized by the WTO Secretariat in partnership with the government of Djibouti and the International Trade Centre (ITC) and focused on "Trade in the Service of Peace through WTO accession". The Dialogue attracted more than 80 participants, including ministers, senior officials and private sector representatives from acceding LDC governments in the OIC region such as Comoros, Somalia and Sudan. Other participants from Member States include Afghanistan, Yemen and Djibouti, development partners (the Intergovernmental Authority for Development, the Trade Policy Training Centre in Africa, the United Nations Economic Commission for Africa, and the World Bank) and international experts,
II‐ Ratification of the Trade Facilitation Agreement:
The Trade Facilitation Agreement (TFA) concluded in Bali in December 2013 came into force on 22 February 2017, following its ratification by two‐thirds of WTO members. The last countries that have ratified the EFA are: Guinea, Burundi, Cape Verde, Tanzania, Vanuatu, Tunisia, and Colombia (10 August 2020), bringing the increase to 153 the total number of ratifications out of the 164 WTO members.
Among the Member States that have ratified the EFA, 41 out of 153: Malaysia, Niger, Togo, Pakistan, Guyana, Côte d'Ivoire, Brunei, Mali, Turkey, United Arab Emirates, Albania, Kazakhstan, Saudi Arabia, Afghanistan, Senegal, Bahrain, Bangladesh, Gabon, Kyrgyzstan, Mozambique, Nigeria, Oman, Chad Jordan; Qatar, Gambia, Indonesia, Djibouti, Benin, Uganda, Burkina Faso, Cameroon, Morocco, Egypt, Tajikistan, Guinea and Tunisia.
About 121 notified TFA Category A including 40 OIC countries such as : Afghanistan, Albania, Bangladesh, Burkina Faso, Bahrain, Brunei, Chad, Côte d'Ivoire, Cameroun, Djibouti, Egypt, Gabon, The Gambia, Guyana, Indonesia, Jordan, Kirghizstan, Kuwait, Kazakhstan, Morocco, Mali,
ICDT - Annual Report on Trade among the OIC Member States 2019-2020
158
Mauritania, Malaysia, Maldives, Mozambique, Niger, Nigeria, Oman, Pakistan, Qatar, Saudi Arabia, Sierra Leone, Senegal, Suriname, Togo, Tajikistan, Tunisia, Turkey, Uganda and United Arab Uni.
In addition, 104 countries reported Category B and 94 Category C of the Agreement according to WTO data from 12 May 2020. 36 OIC Member States have notified Category B such as Albania, Chad, Guyana, Mozambique, Nigeria, Pakistan, Afghanistan, Bangladesh, Bahrain, Brunei, Gambia, Mali, Malaysia, Niger, Sierra Leone, Togo, Burkina Faso, Côte d'Ivoire, Cameroon, Djibouti, Egypt, Gabon, Indonesia, Jordan, Kazakhstan, Kyrgyzstan, Maldives, Mauritania, Morocco, Oman, Senegal, Tajikistan and the United Arab Emirates, Benin, Guinea and Uganda.
33 OIC countries have notified Category C of the AFE Agreement, they are: Albania, Chad, Guyana, Mozambique, Nigeria, Pakistan, Afghanistan, Bangladesh, Bahrain, Gambia, Mali, Niger, Sierra Leone, Togo, Morocco, Burkina Faso, Côte d’Ivoire, Cameroon, Djibouti, Egypt, Gabon, Jordan, Kazakhstan, Kyrgyzstan, Maldives, Mauritania, Senegal, Suriname and Tajikistan, Benin, Guinea, Tunisia and Uganda. We recall that 44 OIC Member States are WTO members with Afghanistan, which acceded to it on 29 July 2016. Eleven OIC Member States are in the process of joining the WTO.
In addition, ICDT organized awareness‐raising seminars between 2015 and 2020 with the IDB's Department of Economic Integration on the WTO Trade Facilitation Agreement to encourage them to ratify this agreement, to notify its categories A, B and C and contribute to the development of trade of the OIC countries with the rest of the World.
Between 9 and 12 October 2019, WTO members held a meeting of the Trade Facilitation Committee and additional workshops on TFA related topics. Thus, these workshops are open to all WTO members and observers during which the TFA donation program is launched on 9 October 2019. Additional closed sessions will be held for LDCs and Pacific Island countries.
In addition, the ICDT organized awareness seminars between 2017 and 2020 with the Department of Country Strategy and Cooperation of the IDB on the WTO Trade Facilitation Agreement, Trade in Services in order to encourage to ratify this agreement, notify its categories A, B and C and contribute to the development of trade of OIC countries with the rest of the world.
While membership to the WTO brings clear advantages, accession negotiations are a challenge for all acceding governments, especially those of LDCs. The terms and conditions of accession call for domestic reforms. Acceding LDCs have limited technical and human capacities and financial resources to deal with the complex aspects of WTO accession.
Providing technical assistance to acceding governments, in particular to acceding developing and least developed countries (LDCs), is a fundamental priority for the OIC and the WTO. Technical assistance, capacity building and awareness‐raising activities related to accessions are organized by the WTO Secretariat, IDB and ICDT in response to specific requests from an acceding government. These activities are carried out in close coordination with the Accessions Division and the Institute for Training and Technical Cooperation (IFCT).
III – TRADE IN SERVICES:
On 9 April 2018, WTO members appointed Ambassador Aitzhanova, Chair of Trade in Services
ICDT - Annual Report on Trade among the OIC Member States 2019-2020
159
Negotiations Committee, who stressed the importance of service sector to all countries, regardless of their level of development, and the dynamism of the sector. She announced that she would consult with Members to facilitate future discussions.
Services negotiators expressed their willingness to resume negotiations on:
(i) Better access to service and service provider markets for other WTO members.
(ii) the development of new disciplines to make domestic regulation more objective and transparent and to ensure that domestic regulation is not unnecessarily cumbersome.
(iii) the services aspects of e‐commerce (the electronic provision of services).
Some Member States have indicated that this could help pave the way for the potential outcomes of the Services at the Eleventh Ministerial Conference in 2017.
V‐ ICDT’S ACTIVITIES RELATING TO THE WTO ISSUES:
1. The High Level OIC Expert Meeting on “Investment Obstacles in Africa: Challenges and Opportunities”, Casablanca, Kingdom of Morocco, 24 – 25 January 2018
In implementation of the agreement between H.E. the Secretary General of the Organization of Islamic Cooperation (OIC) and H.E. President of the Republic of Cote d’Ivoire, during the OIC 44th Council of Foreign Ministers held in Abidjan in July 2017, to organize an OIC Conference on Obstacles and Facilitation of Investment in Africa, the Islamic Center for Development of Trade (ICDT) took the initiative of organizing a High Level OIC Expert Meeting on “Investment Obstacles in Africa: Challenges and Opportunities” which was held on 24‐25 January 2018 in Casablanca, Kingdom of Morocco.
The main objectives of this Meeting are to share international, regional and national perspectives on main obstacles, to propose better solutions to Investment in Africa in one hand and on the other hand to prepare the draft Conference Declaration and the draft OIC Investment Guidelines that will be presented for the consideration of the 2018 OIC Africa Investment Conference in Abidjan, Republic of Cote d’Ivoire.
ICDT organized the meeting in partnership with the Investment Division of the United Nations Conference on Trade and Development (UNCTAD). The following OIC Member States and OIC institutions participated in the meeting: Kingdom of Morocco, Kingdom of Saudi Arabia, Republic of Turkey, Federal Republic of Nigeria, Republic of Senegal, Republic of Côte d’Ivoire, Department of Legal Affairs of the OIC General Secretariat.
The Islamic Centre for Development of Trade (ICDT), The Islamic Corporation for the Insurance of Investment and Export Credit (ICIEC), The Statistical, Economic and Social Research and Training Center for Islamic Countries (SESRIC), United Nations Conference on Trade and Development (UNCTAD), University of Geneva, and University of East Anglia (UK).
Experts have prepared two draft documents to be considered as final documents to be submitted to the 2018 OIC Investment Conference in Africa; “Draft OIC Guiding Principles for Investment Policymaking” and “Draft Declaration of the Conference”.
The “Draft OIC Guiding Principles for Investment Policymaking” and “Draft Declaration” shall be endorsed by the OIC General Secretariat before their submission to the Forthcoming OIC
ICDT - Annual Report on Trade among the OIC Member States 2019-2020
160
Investment Conference in Africa” and to the OIC Member States. The said documents are not binding and remain of indicative nature as long as they are not officially adopted by the relevant decision‐making body at the OIC.
2. Workshop on coordination mechanism between OIC Member States vis‐à‐vis WTO issues, 19‐20 October 2018, Geneva, Switzerland
Referring to the Resolution N° 52 of the Thirty‐Third Session of the COMCEC held during the period 20‐23 November 2017 in Istanbul, Republic of Turkey which has requested ICDT and IsDB Group to submit a working paper for the consideration of the next COMCEC meeting about Practical options to increase OIC Ministers of Trade Coordination vis‐à‐vis recent developments in the negotiations at the WTO and to formulate positions on priority issues for OIC Countries currently being proposed in the WTO, ICDT and IDB in collaboration with OIC Permanent Representative in Geneva, organized a Workshop on this theme in Geneva, Switzerland on 19‐20 October 2018.
The objectives of this workshop are to review the draft study and gather the observations and comments made by Member States (MS) in one hand and on the other hand to elaborate practical recommendations to better enhance common coordination mechanisms between Member States in WTO matters.
The Workshop was attended by the following representatives of the OIC Permanent Missions in Geneva: Niger, Algeria, Saudi Arabia, Morocco, Sudan, Palestine, Pakistan, Oman, Albania, Bangladesh, Mali, Djibouti, Senegal, Gabon, Turkey, Maldives, Brunei, Pakistan, Jordan, Comoros, Yemen and Kazakhstan.
ICDT, the OIC Mission in Geneva and IsDB Group facilitated this meeting.
3. Panel on Obstacles and Solutions to Investment in Africa, 23rd October 2018, Geneva, Switzerland
Within the framework of the instructions of H.E. The Secretary General of OIC, OIC/UN Cooperation and TISC Integrated Project on Investment, UNCTAD, ICDT, ICIEC, SESRIC, organised in collaboration with the OIC Permanent Mission in Geneva a workshop on « Obstacles and Solutions to Investment in Africa » on 23rd October 2018.
The workshop was chaired by H.E. Amb. Nassima BAGHLI with the participation of Mrs Isabelle Durant, Deputy Secretary General of UNCTAD and representatives of ICDT, ICIEC, SESRIC, Saudi Arabian General Investment Authority (SAGIA), Nigerian Investment Promotion Commission (NIPC) and the Inoks Capital.
More than 200 participants representing plus 50 countries attended this workshop
The main objectives of this Meeting are on one hand to share international, regional and national perspectives on main obstacles and propose better solutions for Investment in Africa in the one hand and to prepare the draft Declaration of the Conference and the draft OIC Guiding Principles for Investment Policymaking.
The representatives from ICDT, ICIEC and SESRIC presented the activities of their institutions in the field of investment promotion, obstacles, and practical recommendations to invest in Africa.
ICDT - Annual Report on Trade among the OIC Member States 2019-2020
161
4. Workshop on Post‐WTO Eleventh Ministerial Conference (MC11) for the OIC Member States, Dubai, United Arab Emirates, 19‐20 November 2018.
Within the framework of the implementation of the Resolution of Thirty‐Third Session of the COMCEC, held during the period 20‐23 November 2017 in Istanbul, Republic of Turkey, which has called upon the IDB and ICDT to continue providing technical assistance to the OIC Member States on WTO related issues and to enhance their efforts in sensitizing the Member States to the impact of WTO trade negotiations on their economies. The resolution also requested the IDB and ICDT to synergize and coordinate their efforts to strengthen the human and institutional capacity of the OIC Member States, so as to facilitate their full integration into the Multilateral Trading System in a fair and equitable manner. In this regard, ICDT and IDB Department of Strategy and Cooperation organized in collaboration with the Ministry of Economy of the State of the United Arab Emirates a Workshop on Post‐WTO Eleventh Ministerial Conference (MC11) for the OIC Member States in Dubai on 19‐20 November 2018.
This Workshop is organized to discuss important topics including the state of play of WTO negotiations, the Ministerial Decisions by MC11, the Status of OIC Member States’ accession to WTO and future OIC Coordination for WTO issues and to share views of the OIC Countries’ Representatives in the OIC priorities of negotiations within WTO and issues to be discussed for the upcoming Ministerial Conference.
The following Member countries participated in this Workshop: Egypt, Oman, Suriname, Tajikistan, Kyrgyzstan, Palestine, Sudan, Malaysia, Pakistan, and United Arab Emirates.
ICDT, IDB, South Centre and Third Word Network experts also attended the workshop.
5. Workshop on Post‐WTO Eleventh Ministerial Conference (MC11) for the OIC African Member States, Casablanca, Kingdom of Morocco, 26‐27 June 2019:
Within the framework of the implementation of the Resolution of Thirty‐Third Session of the Standing Committee on Commercial and Economic Cooperation among OIC Countries (COMCEC), held during the period 20‐23 November 2017 in Istanbul, Republic of Turkey, which has called upon the IsDB and ICDT to continue providing technical assistance to the OIC Member States on WTO related issues and to enhance their efforts in sensitizing the Member States to the impact of WTO trade negotiations on their economies. ICDT and IsDB Country Strategy and Cooperation organized in collaboration with the Secretary of State in Charge of Foreign Trade of the Kingdom of Morocco on Post‐WTO Eleventh Ministerial Conference (MC11) for the OIC African Member States in Casablanca on 26‐27 June 2019.
This Workshop is organized to discuss important topics including the state of play of WTO negotiations, the Ministerial Decisions by MC11, WTO reforms, the Status of OIC Member States’ accession to WTO and future OIC Coordination for WTO issues and to share views of the OIC Countries Representatives in the OIC priorities of negotiations within WTO and to tackle MC12 issues to be held in Nur‐Sultan, Republic of Kazakhstan on 8‐11 June 2020.
The following countries participated in this Workshop: Benin, Burkina Faso, Cameroon, Chad, Cote d’Ivoire, The Gambia, Guinea, Guinea Bissau, Mauritania, Niger, Nigeria, Senegal, Togo, Tunisia, Uganda and Morocco.
ICDT - Annual Report on Trade among the OIC Member States 2019-2020
162
6. Workshop on “Current WTO Negotiations for the OIC Member States Embassies in Geneva”, Geneva, Switzerland, 14‐15 November 2019
The Islamic Centre for Development of Trade (ICDT), the Country Strategy and Cooperation Department of the Islamic Development Bank (IsDB) organized in collaboration of the Permanent Mission of the Organization of Islamic Cooperation (OIC) to the United Nations Office and other International Organizations in Geneva a Workshop on “Current WTO Negotiations for the OIC Member States Embassies in Geneva”, Geneva, Switzerland, 14‐15 November 2019.
The objectives of this workshop were to discuss important topics including current negotiations and their impact on OIC Member Countries trade on some important issues such as Agriculture, Fisheries subsidies, Electronic Commerce, Trade in Services, Investment Facilitation for Development, Micro, Small & Medium Enterprises (MSMEs), Trade & Women's Economic Empowerment, WTO Reform and Coordination for WTO Issue. This event contributed to provide greater awareness to the OIC Permanent Missions participants on recent developments on WTO Negotiations in order to prepare them to raise issues for their delegations to the upcoming Ministerial Conference (MC12) to be held in Nur‐Sultan, Republic of Kazakhstan on 8‐11 June 2020. More than 20 Countries and 8 Regional and International Organizations participated in this event.
ICDT - Annual Report on Trade among the OIC Member States 2019-2020
163
SECTION II: INTRA‐OIC COMMERCIAL NEGOTIATIONS UNDER THE TRADE PREFERENCIAL SYSTEM AMONG THE OIC MEMBER STATES
A/ CONTEXT:
The idea of establishing a Trade Preferential System specific to O.I.C Member States is based on the recommendations of the General Agreement on Economic and Technical Cooperation between the OIC Member States and more precisely of the MECCA Declaration and the Plan of Action to strengthen economic and commercial cooperation among the OIC Member States set up by the 3rd OIC Summit Conference in 1981.
In fact, paragraph II item 7 of the Plan of Action recommended:
"To make an inventory of the existing preferential schemes applied by groups of Member States with a view to strengthening and linking them in order to establish a system of trade preferences through a step by step approach by all interested Member States.
It should be based on the principles of mutuality of advantages yielding benefits to all participants and taking into account the respective levels of economic and industrial development, trade regimes and obligations of individual Member States …".
In implementation of these relevant resolutions of the third and the fourth summit of the OIC, which included trade among the priority sectors, the Standing Committee for Economic and Commercial Cooperation (COMCEC) and ICDT have strived jointly since 1984 for the working out of a draft Framework Agreement on TPS/OIC.
In fact, since the holding of its first session in 1984 in Istanbul, the COMCEC recommended the setting of a working group to define the principles and rules that are to direct negotiations; this group held its first session in Izmir (Turkey) and was followed by the presentation by ICDT of the first version of TPS/OIC.
In order to solemnly corroborate the necessity of setting up a Trade Preferential System specific to the OIC Member States, the COMCEC adopted at its fourth session held in Istanbul in September 1988, a declaration of intent on the establishment of a Trade Preferential System among the OIC Member States specifying the basic principles and the orientations to be followed for the setting up of such a system.
During this period of time, ICDT finalised the draft agreement, in consultation with the GATT and the UNCTAD, and submitted it to experts for appreciation, who met twice, in December 1989 in (Turkey) and in 1990 in (Casablanca), to put the finishing touches to the draft agreement.
Six years after its inclusion in the agenda items of the COMCEC’s meetings, the Framework Agreement on TPS/OIC was endorsed by the sixth session of the COMCEC, which submitted it to the OIC General Secretariat for signature and ratification.
Legally, TPS/OIC came into force in October 2003.
B/ ENFORCEMENT OF THE AGREEMENT:
The TPS/OIC agreement was deposited in 1990 in the OIC General Secretariat for signature and ratification, in compliance with article 18; it had to enter into force three months after ten Member States have deposited their instruments of ratification.
ICDT - Annual Report on Trade among the OIC Member States 2019-2020
164
In April 2019, forty‐two Member States have signed the framework Agreement TPS/OIC:
Kingdom of Saudi Arabia, People's Republic of Bangladesh, Kingdom of Bahrain, Republic of Benin, Brunei Darussalam, Burkina Faso, Republic of Cameroon, Republic of Côte d'Ivoire, Republic of Djibouti, Arab Republic of Egypt, State of the United Arab Emirates, Republic of Gabon, The Gambia, Republic of Guinea, Republic of Guinea Bissau, Republic of Indonesia, Republic of Iraq, Islamic Republic of Iran, Hashemite Kingdom of Jordan, State of Kuwait, Republic of Lebanon, Libya, Kingdom of Morocco, Malaysia, Maldives, Islamic Republic of Mauritania, Niger, Federal Republic of Nigeria, Sultanate of Oman, Republic of Uganda, Islamic Republic of Pakistan, State of Palestine, State of Qatar, Republic of Senegal, Republic of Sierra Leone, Republic of Somalia, Republic of Sudan, Syrian Arab Republic, Republic of Chad, Republic of Tunisia, Republic of Turkey and Union of Comoros.
Thirty‐two Member States have ratified it:
Kingdom of Saudi Arabia, Kingdom of Bahrain, People's Republic of Bangladesh, Brunei Darussalam, Republic of Cameroon, Republic of Djibouti, Arab Republic of Egypt, State of the United Arab Emirates, Republic of Gabon, Republic of the Gambia, Republic of Guinea, Republic of Indonesia, Republic of Iraq, Islamic Republic of Iran, Hashemite Kingdom of Jordan, State of Kuwait, Republic of Lebanon, Libya, Malaysia, Maldives, Kingdom of Morocco, Islamic Republic of Mauritania, Sultanate of Oman, Republic of Uganda, Islamic Republic of Pakistan, State of Palestine, State of Qatar, Republic Senegal, Republic of Somalia, Syrian Arab Republic, Republic of Tunisia and Republic of Turkey.
The legal quorum (10 states) required for the entry into force of the Framework Agreement on Trade Preferences among Islamic Countries has therefore been exceeded, following the ratification of the Republic of Cameroon in September 2002.
18 Member States of the OIC have ratified the Protocol on Preferential Tariff Scheme for TPS‐OIC (PRETAS), these are: Kingdom of Saudi Arabia, Kingdom of Bahrain, People's Republic of Bangladesh, State of the United Arab Emirates, Republic of The Gambia, State of Kuwait, the Hashemite Kingdom of Jordan, Islamic Republic of Iran, Malaysia, Kingdom of Morocco, Islamic Republic of Mauritania, Sultanate Oman, State of Palestine, Islamic Republic of Pakistan, State of Qatar, Republic of Somalia, Syrian Arab Republic and the Republic of Turkey.
The PRETAS became effective on 5 February 2010.
33 countries have signed the Rules of Origin of the TPS/OIC, namely Saudi Arabia, Bahrain, Bangladesh, Benin, Burkina Faso, Cameroon, Comoros, Côte d'Ivoire, Djibouti, United Arab Emirates, The Gambia, Guinea, Guinea Bissau, Indonesia, Iran, Jordan, Kuwait, Malaysia, Morocco, Mauritania, Niger, Nigeria, Oman, Pakistan, Palestine, Qatar, Sierra Leone, Somalia, Sudan, Syria, Tunisia and Turkey. In addition, 18 countries have ratified: Bahrain, Bangladesh, UAE, Gambia, Indonesia, Iran, Jordan, Kuwait, Malaysia, Morocco, Oman, Pakistan, Palestine, Qatar, Saudi Arabia, Somalia, Syria and Turkey. The Rules of Origin came into force on 9th August 2011.
To date, the following 14 OIC Member States: Saudi Arabia, Bahrain, United Arab Emirates, Kuwait, Morocco, Oman, Qatar, Turkey, Malaysia, Syria, Bangladesh, Iran, Pakistan and Jordan, have sent to the TNC Secretariat the List of Products for tariff concessions under the TPS/OIC.
ICDT - Annual Report on Trade among the OIC Member States 2019-2020
165
Besides, during the seminar on the rules of origin of the TPS/OIC Agreement organized by the COMCEC Office and Turkey's TOBB in January 2015 in Ankara, it was recommended to the participating countries to update their products’ list of concessions into a Harmonized System with 8 digits, 2015 Version, in order to facilitate the launching of a new round of trade negotiations among the OIC Member Countries.
During the 32nd Follow‐up Committee of the COMCEC held in Ankara on 17‐18 May 2016, the Committee invited the GCC Secretariat, on behalf of its six Member States and Morocco, to convey their updated concession lists to the TNC Secretariat with the view to early realization of market access opportunities to brought by the TPS/OIC.
The Committee welcomed the submission by Turkey, Bangladesh, Pakistan, Jordan, Malaysia, Iran and Morocco of updated concession list to the TNC Secretariat.
In September 2019, Turkey, Malaysia, Pakistan, Jordan, Bangladesh, Iran, Morocco and the Gulf Cooperation Council on behalf of its 6 member states submitted their updated concession lists.
The Committee requested the Member States concerned to notify the TNC Secretariat of their relevant domestic measures to be undertaken for the implementation of the TPS‐OIC Rules of Origin at the earliest convenience.
For this purpose, Participating States are requested to transmit copies of certificates of origin and specimens of the stamp imprints used by their customs offices to the Secretariat of the Trade Negotiations Committee.
The Committee requested ICDT, the COMCEC Coordination Office and other relevant OIC Institutions to continue to organize awareness‐raising and capacity‐building activities within the TPS‐OIC.
Tariff reduction programme:
The approach that has been adopted consists of two systems of tariff and non‐tariff reduction; a normal track and a fast track.
The normal track of tariff reduction.
Tariff lines between 0 and 10% are exempted from tariff reduction
Each participating state should cover 7% of all its tariff lines identified at HS level of National Tariff Codes above 10%.
Participating States, of which 90% and above of its total tariff lines, estimated at the base rate, are between 0% and 10%, shall only cover 1% of the same total HS lines.
Tariff slabs at the end of the tariff reduction process.
The tariffs levied on 7% of all the HS lines of Participating States shall be reduced as follows:
Tariffs above 25% shall be reduced to 25%.
Tariffs above 15% and up to 25%, shall be reduced to 15%.
Tariffs above 10% and up to 15% shall be reduced to 10%.
ICDT - Annual Report on Trade among the OIC Member States 2019-2020
166
The implementation period was divided into six annual instalments by the Least Developed Countries and into four annual instalments by the other countries, beginning from the date of coming into force of the PRETAS.
Similarly, Participating States are free to choose the list of products to be liberalised each year. To that effect, they shall notify on an annual basis, the TNC Secretariat of their specific annual instalments along with the list of products.
Abolition of Non‐Tariff Barriers:
Another new aspect of the PRETAS is that it also deals with non‐tariff barriers upon the entry into force of the Protocol. Thus, Participating States shall abolish their para‐tariffs and their non‐tariff barriers on products subjected to reduction over a two‐year period for DCs and four years for the LDCs. Likewise, no new para‐tariff or non‐tariff barriers shall be introduced, nor shall those already applied be increased, on the products which are already subject to tariff reduction.
Voluntary Fast Track Tariff Reduction Schedule:
The Participating States wishing to further deepen the concessions may do so on a voluntary basis. The participating States willing to join the Fast Track Tariff Reduction will notify the TNC Secretariat within three months after the coming into force of the PRETAS.
Contrarily to the normal process of Tariff Reduction, which covers only 7% of the HS lines, the fast track covers all products other than those included in the negative list; covered products may range according to the amplitude of the negative list of the country, from 70% for the LDCS to 85%, which is very promising.
The negative list:
It shall not exceed:
25% of all HS tariff lines, plus lines with tariffs of 10% and below, for developing countries whose average tariff is 20% and above;
20% of all HS tariff lines, plus lines with tariffs of 10% and below, for developing countries whose average tariff rate is between 15% and 20%;
15% of all tariff lines for developing countries whose average tariff is below 15%;
30% of all HS tariff lines for LDCs.
Modality of the fast track tariff reduction schedule:
The fast track tariff reduction, which has been adopted for the fast track tariff reduction, is relatively innovative in so much as it is not referred to tariffs slab, as in the normal process, but rather to a preferential margin to current MFN applied rate (HS level National Tariff Codes). It means that this modality will prevent any possible erosion of preferences due to the erga omnes of the MFN tariff, notably following the multilateral trade negotiations within the WTO.
The reduction of the preferential margin will be as follows:
The preferential margin should increase to 50% of the MFN rate in five instalments for the participating developing countries and in seven instalments for the LDCs from the 90th day of the entry into force of the Protocol.
ICDT - Annual Report on Trade among the OIC Member States 2019-2020
167
Developing countries should reserve preferential treatment for LDCs to join the Fast Track process by increasing the preferential margin to 50% for LDC products in three instalments.
At the beginning or before the fifth year of the implementation of the Voluntary Fast Track Table, participating States may enter into negotiations to extend product coverage and to increase concessions
C/ ICDT’S ROLE AS MEMBER OF THE TNC SECRETARIAT:
The 19th Session of the Standing Committee for Economic and Commercial Cooperation has entrusted to ICDT and the COMCEC coordination Office the Secretariat of the Trade Negotiating committee.
Within this framework, the Islamic Centre for Development of Trade provides Member States with technical assistance under the form of training sessions intended for the executive staff operating in the field of foreign trade or by submitting explanatory notes on the framework Agreement on the Trade Preferential System among the OIC Member States and on the Protocol on the Preferential Tariff Scheme for TPS/OIC (PRETAS) and the protocol on the Rules of Origin.
The Islamic Centre for Development of Trade provides comprehensive explanatory notes related to issues debated within the framework of negotiations on the Trade Preferential System (TPS/OIC), the Protocol on the Preferential Tariff Scheme (PRETAS and the Protocol on the Rules of Origin.
In this regard, the Islamic Centre for Development of Trade has recently prepared explanatory notes on “the Framework Agreement on the Trade Preferential System among the OIC Member States, the PRETAS Protocol, intended for the Countries of the Gulf Cooperation Council and Indonesia.
Upon the successful conclusion of the 1st and 2nd Rounds, the Trade Negotiating Committee will carry on its work that will focus on two main actions: on the one hand, the implementation of the PRETAS, notably by applying the fast track, and the consideration of issue relating to the removal of para‐ and non‐tariff measures on the other.
I‐ ORGANIZATION OF TPS/OIC AWARENESS SEMINARS
Training Workshop on "Trade Preferential System among the Member States of the Organization (TPS/ OIC) and Multilateral Trading System ", Khartoum, Republic of Sudan, 17‐18 December 2018.
Within the framework of the implementation of the 33rd Session of the COMCEC held in Istanbul, Republic of Turkey on 23‐26 November 2017 resolution relating to TPS‐OIC and other relevant Resolutions of the OIC Council of Foreign Ministers, particularly those relating to the raising awareness of the Framework Agreement on Trade Preferential System among OIC Member States (TPS/OIC) and its protocols, the Islamic Centre for Development of Trade (ICDT), the COMCEC Coordination Office (CCO) and the Islamic Chamber of Commerce, Industry and Agriculture (ICCIA) organized in collaboration with the Ministry of Trade and Industry of the Republic of Sudan, a training Workshop on the “Trade Preferential System among the Member States of the Organization of Islamic Cooperation (TPS – OIC) and Multilateral Trading System”, in Khartoum, Republic of Sudan on 17–18 December 2018.
ICDT - Annual Report on Trade among the OIC Member States 2019-2020
168
The workshop aimed at raising the awareness of Sudan officials and business stakeholders of the TPS‐OIC implementation and its benefits. It also provided an interactive discussion that helps participants to address some of the issues and challenges faced by the Sudanese government in completing the ratification process of the TPS‐OIC and its protocols (PRETAS and Rules of Origin (ROO)).
More than 60 Participants from Sudan Public and Private Sector, senior officials from several ministries attended this event, such as Ministry of Industry and Trade, Ministry of Finance and Economic Planning, Ministry of Agriculture and Forestry, Ministry of Animal Resources, Ministry of Minerals, Ministry of Justice, Sudanese Standards Organization, Customs Authority, Federation of Chambers of Commerce, Sea Port Corporation, Federation of Chambers of Industry, National Secretariat WTO in Sudan, National Agency for Export Insurance and Finance, Marine Ports Authority, Customs Clearance Agents Association and also COMCEC Coordination Office, ICCIA and ICDT attended this workshop.
After fruitful interactive debate, participants agreed on the following:
- To expedite the ratification formalities of TPS/OIC and call upon the concerned authority in the Ministry of Industry and Trade to urgently undertake the necessary steps to complete the needful for obtaining the consent of the Cabinet and the approval of the Parliament as soon as possible;
- To provide Sudan stakeholders technical assistance on TPS/OIC in finalizing the ratification of the Agreement and its protocols and the technical methods to select the list of Concessions of Sudan;
- To call upon the Republic of Sudan to continue to benefit from the instruments of the COMCEC Strategy, the COMCEC Working Groups and COMCEC Project Funding;
- To encourage the Ministry of Trade and Industry to participate in the activities organized by COMCEC, ICDT, ICCIA and IDB Group in the field of trade facilitations activities;
- To organize other workshops and events in the trade facilitation and trade promotion in Sudan;
- To hold workshops on Sudan Accession to WTO and TPS/OIC;
- To involve private sector in the process of the preparation of concession positive list to be submitted to TNC;
- To request Sudanese Customs Authority to convey to COMCEC and ICDT, relevant documents including latest statistics and figures on Sudan Tariff lines less than 10% in order to facilitate the selection of updated concession list to be submitted to TNC.
At the end of the Workshop, certificates of participation were distributed to all participants.
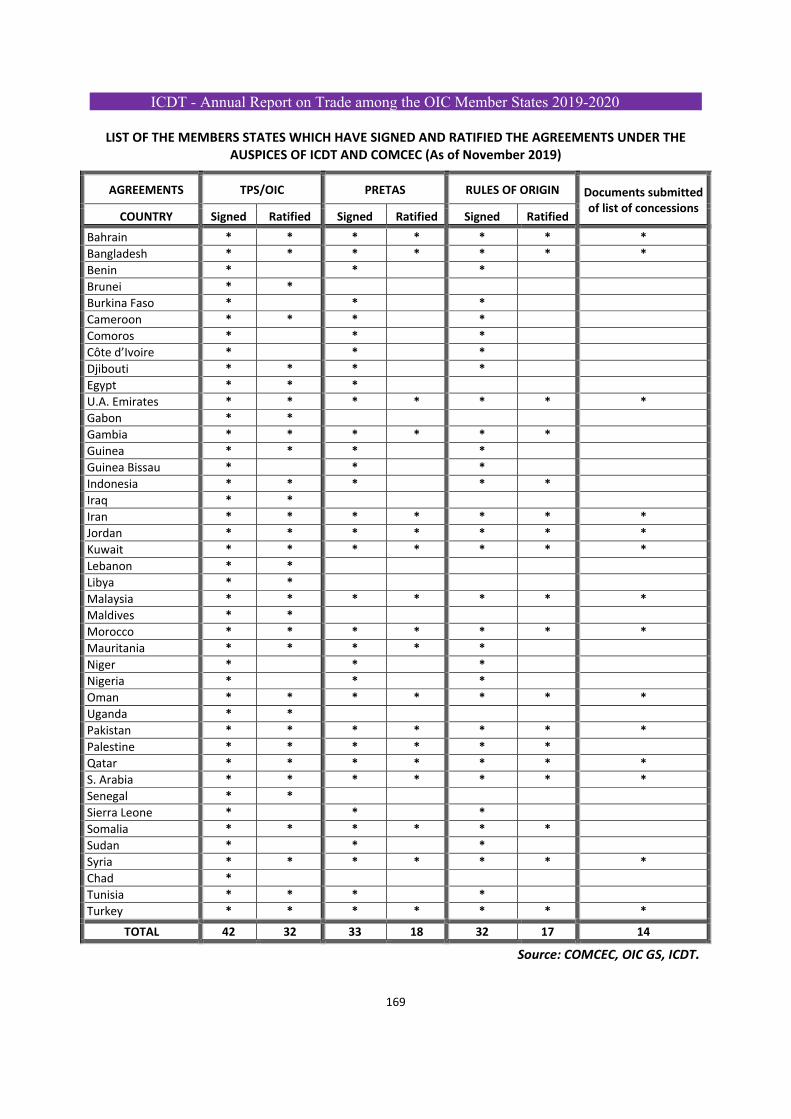
ICDT - Annual Report on Trade among the OIC Member States 2019-2020
169
LIST OF THE MEMBERS STATES WHICH HAVE SIGNED AND RATIFIED THE AGREEMENTS UNDER THE AUSPICES OF ICDT AND COMCEC (As of November 2019)
AGREEMENTS TPS/OIC PRETAS RULES OF ORIGIN Documents submitted of list of concessions
COUNTRY Signed Ratified Signed Ratified Signed Ratified
Bahrain * * * * * * *
Bangladesh * * * * * * *
Benin * * *
Brunei * *
Burkina Faso * * *
Cameroon * * * *
Comoros * * *
Côte d’Ivoire * * *
Djibouti * * * *
Egypt * * *
U.A. Emirates * * * * * * *
Gabon * *
Gambia * * * * * *
Guinea * * * *
Guinea Bissau * * *
Indonesia * * * * *
Iraq * *
Iran * * * * * * *
Jordan * * * * * * *
Kuwait * * * * * * *
Lebanon * *
Libya * *
Malaysia * * * * * * *
Maldives * *
Morocco * * * * * * *
Mauritania * * * * *
Niger * * *
Nigeria * * *
Oman * * * * * * *
Uganda * *
Pakistan * * * * * * *
Palestine * * * * * *
Qatar * * * * * * *
S. Arabia * * * * * * *
Senegal * *
Sierra Leone * * *
Somalia * * * * * *
Sudan * * *
Syria * * * * * * *
Chad *
Tunisia * * * *
Turkey * * * * * * *
TOTAL 42 32 33 18 32 17 14
Source: COMCEC, OIC GS, ICDT.
ICDT - Annual Report on Trade among the OIC Member States 2019-2020
170
II‐ PROMOTION ACTIVITIES
A/ FAIRS AND EXHIBITIONS:
1. 2nd interactive workshop for the preparation of the OIC participation in Expo Dubai 2020, Jeddah ‐ Kingdom of Saudi Arabia, 14th January 2019:
Within the framework of the preparation of the participation of the OIC in the Expo Dubai 2020, scheduled to be held in Dubai from 20th October 2020 to 10th April 2021, the Islamic Centre for Development of Trade as the OIC focal point in charge of co‐ordinating the aforesaid participation, organised in Jeddah at the Headquarters of the OIC a coordination Meeting with Expo Dubai 2020 Team on 14th January 2019.
The objective of this Meeting is to exchange views on all aspects of the OIC participation in the Expo Dubai 2020 including logistics, presentation of the OIC Pavilion, contribution of each OIC Institution and the potential collaboration between Dubai Islamic Economy Development Centre and OIC Institutions.
The Meeting was attended by the Expo Dubai 2020 Bureau, The Dubai Islamic Economy Development Centre (DIEDC), The Islamic Centre for Development of Trade (ICDT); The Department of Economic Affairs of OIC; The Department of Political Affairs of OIC; The OIC Department of Palestine; The OIC Department of Media; The Cultural, Social and Family Affairs Department of OIC; The Statistical, Economic and Social Research and training Centre for Islamic Countries (SESRIC); The Research Centre for Islamic History, Art and Culture (IRCICA); The Islamic Educational, Scientific and Cultural Organization (ISESCO); Bayt Mal Al Qods Alsharif Agency (BMQA); The Global Partnerships and Resource Mobilization Department of IsDB (GPRM) (IsDB Group Focal Point of Expo Dubai 2020); The International Islamic Trade Finance Corporation (ITFC); The Islamic Corporation for the Insurance of Investment and Export Credit (ICIEC); The Islamic Cooperation for Development of Private Sector (ICD); The Strategy & Cooperation Department of IDB; The Islamic Chamber of Commerce, Industry and Agriculture (ICCIA); The Islamic University of Technology (IUT) and The Standard and Metrology Institute for Islamic Countries (SMIIC).
2. Participation of ICDT in the 1st Edition of the OIC Festival, Cairo‐Arab Republic of Egypt, 5‐9 February 2019:
ICDT participated in the 1st Edition of the OIC Festival which took place from 5 to 9 February 2019 in Cairo, Arab Republic of Egypt, held under the theme "One nation, diverse cultures Palestine in our heart".
Several member countries of the Organization of Islamic Cooperation (OIC) participated in this important event including Niger, Senegal, Mali, Saudi Arabia, Djibouti, Guinea, Yemen, Azerbaijan, Palestine, Egypt, Burkina Faso, Cameroon. Several subsidiaries affiliated and specialized OIC Institutions also took part in this event.
The aim of this Festival was to strengthen the bonds of unity, cooperation and solidarity among peoples through traditional folk songs, folk dances and the exhibition of handicrafts and the traditional heritage of some countries including Benin, Pakistan, Palestine, Burkina Faso, Mauritania, Yemen and Egypt.
ICDT - Annual Report on Trade among the OIC Member States 2019-2020
171
On the sidelines of these cultural activities, lectures, seminars and symposia were organized to deepen reflection on themes, such as those dealing with the causes of contemporary literature in the Islamic world, the challenges of sustainable development in the Islamic world, the fight against Islamophobia, the protection of the Arabic language, etc.
During this important event, ICDT participated with a booth where it presented its services and activities to the general public.
3. Workshop on the preparation of the OIC participation in Expo Dubai 2020, Marrakesh, Kingdom of Morocco, 2nd April 2019:
Within the framework of the preparations of the participation of the OIC in the Expo Dubai 2020, scheduled to be held in Dubai from 20th October 2020 to 10th April 2021, the Islamic Centre for Development of Trade as the OIC focal point in charge of co‐ordinating the aforesaid participation, organised in Marrakesh; Kingdom of Morocco, the Third Coordination Meeting of OIC Institutions and Expo Dubai 2020 Bureau on 2nd April 2019.
The objective of this Meeting was to exchange views on all aspects of the OIC participation in the Expo Dubai 2020 including logistics, presentation of the OIC Pitch Pavilion and Pavilion design, the sidelines events to be organised on the margin of this Expo and items to be exhibited by each OIC Institution and technical assistance to be provided by Expo Dubai 2020 Bureau.
The Meeting was attended by the Expo Dubai 2020 Bureau, the Islamic Centre for Development of Trade (ICDT); the Statistical, Economic and Social Research and training Centre for Islamic Countries (SESRIC); the Islamic Educational, Scientific and Cultural Organization (ISESCO); Bayt Mal Al Qods Alsharif Agency (BMAQ); the International Islamic Trade Finance Corporation (ITFC); the Islamic Cooperation for Development of Private Sector (ICD); the Islamic Development Bank Group (IsDB); the Islamic Chamber of Commerce, Industry and Agriculture (ICCIA); the Islamic University of Technology (IUT); The Standard and Metrology Institute for Islamic Countries (SMIIC) and The Islamic Cooperation Youth Forum (ICYF).
4. 16th edition of the Trade Fair of the OIC Member States, Baghdad ‐ Republic of Iraq, 7‐ 13 April 2019:
In accordance with the resolutions adopted by the 45th Session of the Council of Foreign Ministers of the OIC Countries held in May 2018 in Dhaka, Republic of Bangladesh, the Ministry of Commerce of the Republic of Iraq and the Islamic Centre for the Development of the Trade (ICDT) organized under the High Patronage of the Iraqi Head of Government, and in collaboration with the Iraqi General Company of Fairs and Commercial Services, the 16th Edition of the Trade Fair of the OIC Member States, from 7 to 13 April 2019 at the International Exhibition Centre of Baghdad ‐ Republic of Iraq.
The fair was attended by exhibitors from the following countries: Kingdom of Bahrain, Republic of Côte d’Ivoire, the Arab Republic of Egypt, Republic of Iraq, Republic of Lebanon, Islamic Republic of Mauritania, Sultanate of Oman, Republic of Senegal, Republic of Tunisia and Republic of Turkey.
Activities on the sidelines:
On the sidelines of the Fair, the following events were organized:
ICDT - Annual Report on Trade among the OIC Member States 2019-2020
172
ICDT led a seminar on Iraq's trade with OIC Member States during which the OIC Permanent Representative in Baghdad and the Director General of ICDT made presentations on intra‐OIC trade and on trade prospects between Iraq and the rest of the OIC Countries.
5. Exhibition and Forum on Transport and Logistics in the OIC Member States, Casablanca ‐ Kingdom of Morocco, 9‐11 April 2019:
As part of the cooperation between ICDT and the Kingdom of Morocco; the Centre and the National Single Window of the Foreign Trade Procedures of the Kingdom of Morocco (PORTNET) and the Moroccan company COMESIUM, organizer of the LOGISMED Fair organized the Exhibition and Forum on Transport and Logistics in the Member States of the Organization of Islamic Cooperation (OCI), from 9 to 11 April 2019, in conjunction with the 8th Edition of the International Exhibition of Transport and Logistics (LOGISMED 2019).
This event was an opportunity to highlight on the one hand the opportunities and challenges of the transport and logistics industry in the OIC countries in the light of the global digital revolution, and on the other hand the opportunities offered by Morocco as a logistics hub to access African markets.
The ICDT, Logismed, Portnet SA, and the Logistics Development Agency (AMDL) organized, on March 21st, 2019 at the Farah Hotel Casablanca, a Press Conference followed by a lunch‐debate with the aim of promoting the Exhibition and Forum on Transport and Logistics in the OIC Member States, the 8th Edition of the Logismed Trade Show, the 5th Annual Portnet Single Window Conference and the 4th Edition of the Moroccan Logistics Awards.
The purpose of these different events was to highlight on the one hand the opportunities and challenges of the transport and logistics industry in the OIC countries in the light of the global digital revolution, and on the other hand the opportunities offered by Morocco as a logistics hub to access African markets.
6. 11th International Economic Summit, Russia, Islamic World, Kazan Expo, 24‐26 April 2019:
ICDT participated in the Eleventh International Economic Summit "Russia ‐ Islamic World: KAZANSUMMIT 2019", held from 24 to 26 April 2019 in the capital of Tatarstan, on the International Exhibition Centre "Kazan Expo" site.
The event took place within the framework of the Russian‐Islamic Global Strategic Vision, led by the President of the Republic of Tatarstan, Rustam Minnikhanov.
More than 3,000 visitors attended the summit – representing more than 50 countries worldwide, 30 Russian regions and 25 diplomatic missions.
Activities carried out in the margins of the Summit:
For the third time, the International Halal Industry Exhibition "Russia Halal Expo" was held, where 54 exhibitors were represented.
It should be noted that the Islamic Centre for the Development of Trade (ICDT) participated through an exhibition stand whose space was provided free of charge by the organizers. The representative of ICDT took the opportunity to promote the activities and services of the Centre as well as upcoming trade fairs and exhibitions.
ICDT - Annual Report on Trade among the OIC Member States 2019-2020
173
The main objective of RUSSIA HALAL EXPO 2019 was to popularize the halal industry in the Russian Federation, to establish commercial, economic, social and cultural links, to demonstrate the potential of the halal segment of the Russian economy and to present products to potential buyers and business partners. It should be noted that the popularity of the international RUSSIAN HALAL EXPO exhibition is constantly increasing.
7. 2nd OIC FESTIVAL, Abu Dhabi, United Arab Emirates, 24‐27 April 2019:
The 2nd Edition of the OIC Festival was held from 24 to 27 April 2019 at the Abu Dhabi National Exhibition Centre (ADNEC), Abu Dhabi, United Arab Emirates, under the theme "A Nation United through Benevolent Cooperation, Justice and Tolerance" under the patronage of His Excellency Sheikh Nahyan Bin Mubarak Al‐Nahyan, Minister of Tolerance of the United Arab Emirates.
The Festival aimed to highlight the message and teachings of Islam by bringing together different cultures of the world regardless of religion, race and gender. The four‐day festival provided an opportunity to raise awareness of Islamic culture and the role of the OIC worldwide in promoting cultural diversity and enhancing the value of the Islamic artistic, musical and culinary heritage.
Numerous OIC Member States and institutions have responded to the call, the program highlighted the cultures, traditions and values of the Islamic faith. It addressed a range of issues, including tolerance as the foundation of Islam, the role of youth in spreading the culture of tolerance, and the importance of tolerance and moderation in worship.
Throughout the festival, Ulemas and opinion leaders presented a number of lectures and conducted workshops that highlighted different aspects of Muslim culture and recounted a modern image of Islam that goes beyond the false doctrines and beliefs and shapes a more complete understanding of Islam as a way of life. Other highlights of this event included working sessions on the basics of calligraphy, the presentation of Prophet Mohammad's biography, stories by renowned children's writers and more.
During this Festival, Palestine was brought to the spotlight in a central way to remind how the Palestinian cause is of great importance for the OIC and its Member Countries.
8. Coordination meeting with Kuwait International Fair, Casablanca, Kingdom of Morocco, 17‐18 June 2019:
As part of the cooperation between ICDT and the State of Kuwait in areas of common interest, a delegation from the Kuwait International Fair (KIF) held a coordination meeting at ICDT headquarters in on 17 and 18 June 2019.
This coordination meeting was devoted to the organization and promotion of the Outstanding Edition of the Tourism, Crafts and Decoration Fair of the OIC Member States which the Centre and KIF plan to organize jointly from 18 to 23 December 2019 in Kuwait City;
A training workshop on e‐commerce will be organized in conjunction with this Fair for the benefit of Kuwaiti businesswomen and neighboring countries.
The two sides also agreed to jointly organize the 14th Edition of the Agribusiness Fair in 2021.
At the end of the meeting, the representative of the Centre affirmed that the launching of the network of Fairs and Conferences of the OIC Member States after its presentation to the
ICDT - Annual Report on Trade among the OIC Member States 2019-2020
174
Board of Directors of ICDT and the OIC General Secretariat, and afterwards make the official declaration and launching of the network, the secretariat of which will be provided by ICDT.
9. Plastics Industry Fair, Casablanca, Kingdom of Morocco, 25‐28 June 2019:
An ICDC delegation chaired by its Director General Dr. El Hassane Hzaine took part in the Plast Expo 2019 organized by the Moroccan Federation of Plastics (FMP), from 25 to 28 June 2019 at the Office of Fairs and Expositions of Casablanca (OFEC).
On this occasion and at the initiative of the ICDT, the Islamic Chamber of Commerce, Industry and Agriculture (ICCIA) and the FMP signed a Memorandum of Understanding to promote the Plastics Industry Sector in the Countries of the OIC.
ICDT seized this opportunity to promote its activities through a stand as well as during the Assizes on the Plastics Industry, the Centre has delivered two presentations on the Plastics Industry Sector and the Trainings dedicated to it in the OIC Countries.
10. International Participants Technical Meeting for Thematic District Pavilions, Dubai, United Arab Emirates, 14‐16 July 2019:
Within the framework of the preparations of the participation of the Organization of Islamic Cooperation (OIC) to the World Expo 2020 to be held in Dubai, State of United Arab Emirates, from 20th October 2020 to 10th April 2021, the OIC delegation chaired by Dr. EL Hassane HZAINE, attended the International Participants Technical Meeting (IPTM) for Thematic District Pavilions hosted by Expo 2020 Dubai to provide critical updates to OIC delegates on the status of the Expo 2020 Dubai site and the services available to participants through the One‐Stop Shop, for pavilion delivery and operations.
11. 9th Muslim World Biz, Kuala Lumpur, Malaysia, 4‐6 September 2019:
The Islamic Centre for Development of Trade participated in the 9th Muslim World Biz which was organised by the OIC International Business Centre Malaysia in collaboration with ICDT in Kuala Lumpur on 4‐6 September 2019 under the theme “Spearheading Sustainable Economic Growth”.
More than 300 entrepreneurs, 30 countries, 800 delegates, 50 speakers attend this biggest event of the Muslim Word coupled with than more 300 participants with 300 booths of each panel discussion and 10.000 visitors.
The following OIC and non OIC Countries attended Forums and Expo of this event namely: Indonesia, Iran, Jordan, Saudi Arabia, Kuwait, Brunei, Senegal, Qatar, UAE, Turkey, Pakistan, and Malaysia and Singapore, Mauritius, Ghana, China, Korea, Vietnam, Thailand and Japan.
The following activities and forums were also organised:
OIC Arab‐Asia Trade & Economic Forum (4 September)
Round Table Talk – The Jewels of Muslim World (4 & 5 September)
International Trade Exhibition (4 – 6 September)
International Trade Business Matching (4 – 6 September)
The Muslim World Women’s Summit (5 & 6 September)
ICDT - Annual Report on Trade among the OIC Member States 2019-2020
175
Jewels of The Muslim World Award 2019 (5 September)
The Muslim World Rania Award 2019 (6 September).
12. 4th Meeting of the OIC Institutions for the Preparation of the OIC Participation in EXPO 2020 DUBAI, Istanbul, Republic of Turkey, 9‐10 September 2019:
Within the framework of the preparations of the participation of the OIC in the Expo 2020Dubai, scheduled to be held in Dubai from 20th October 2020 to 10th April 2021, the Islamic Centre for Development of Trade (ICDT) and the Research Centre For Islamic History, Art and Culture (IRCICA) organised the 4th Coordination Meeting of the OIC participation in EXPO 2020 Dubai in Istanbul; Republic of Turkey at the IRCICA Headquarters on 9‐10 September 2019.
The objective of this Meeting was to take stock of the progress of the OIC participation in different fields such as the Design, Content and Curation Document of the OIC Pavilion, the activities planned by the OIC Institutions on the Side‐lines as well as the logistical aspects.
The Meeting was attended by the following Institutions: the COMCEC Coordination Office (CCO); the Islamic Centre for Development of Trade (ICDT); the Research Centre for Islamic History, Art and Culture (IRCICA); the Statistical, Economic and Social Research and training Centre for Islamic Countries (SESRIC); the Islamic Educational, Scientific and Cultural Organization (ISESCO); Bayt Mal Al Qods Alsharif Agency (BMAQ); the International Islamic Trade Finance Corporation (ITFC); the Islamic Corporation for the Insurance of Investment and Export Credit (ICIEC); The Islamic Development Bank Group (IsDB); the Islamic Chamber of Commerce, Industry and Agriculture (ICCIA); the Islamic University of Technology (IUT); the Standard and Metrology Institute for Islamic Countries (SMIIC) and the Islamic Solidarity Sports Federation (ISSF).
13. 5th Coordination Meeting on the preparation of OIC Participation in Expo 2020 Dubai, Dubai, United Arab Emirates, 11 September 2019:
Within the framework of the preparations of the participation of the Organization of Islamic Cooperation (OIC) to the World Expo 2020 to be held in Dubai, State of United Arab Emirates, from 20th October 2020 to 10th April 2021, the OIC delegation chaired by Dr. EL Hassane HZAINE, attended the 5th Coordination Meeting of the OIC participation hosted by Expo 2020 Dubai to provide critical updates on the 4th OIC Coordination meeting and to initiate discussions on various key operational, exhibition and programming aspects of the exhibition, in Dubai, UAE on 11 September 2019.
The follow‐up Meeting is dedicated to the participation of the OIC Institutions in Expo 2020 Dubai through the pavilion and the side‐lines events, followed by series of operational level presentations performed by high level officers on topics such as Dubai Exhibition Centre offers, Event booking system, Media operations & communication, OIC Curation Document, accommodation and logistics issues etc..
The Meeting was attended by the following Institutions: Expo Dubai Bureau, The Islamic Centre for Development of Trade (ICDT); The Statistical, Economic and Social Research and training Centre for Islamic Countries (SESRIC); The Islamic Educational, Scientific and Cultural Organization (ISESCO); Bayt Mal Al Qods Alsharif Agency (BMAQ); The Islamic University of Technology (IUT) and The Islamic Corporation for the Insurance of Investment and Export Credit (ICIEC).
ICDT - Annual Report on Trade among the OIC Member States 2019-2020
176
14. 7th Exhibition of the Halal Products of the OIC Member States, Istanbul, Republic of Turkey, 28 November‐ 1st December 2019:
In compliance with the resolution adopted by the 34th Ministerial Session of the Standing Committee for Economic and Commercial Cooperation of the OIC Member States (COMCEC), held from 26 to 29 November 2018 in Istanbul – Republic of Turkey, the Islamic Centre for Development of Trade (ICDT) and the Standards and Metrology Institute for the Islamic Countries (SMIIC) organized under the Patronage of the Presidency of the Republic of Turkey and in collaboration with the Turkish company “Discover Events”, the “7th OIC Halal Exhibition” from 29th November to 2nd December 2019 in Istanbul – Republic of Turkey, concomitantly with the World Halal Summit 2019.
This Exhibition which was dedicated to halal trade, halal standards and halal production and logistics, was an excellent opportunity for the actors of the halal industry to promote their products and services and to develop trade and investment in this important sector.
The Exhibition, which lasted for 5 days, was organised over an area of 7000sqm and was opened to the public and professionals and recorded the participation of the following OIC Member States: Bangladesh, Nigeria, Senegal, Cameroon, Indonesia, Tunisia, Thailand, Algeria, Iran, Saudi Arabia, Chad, Burkina Faso, Libya, Mali, Lebanon, Oman, Afghanistan, Djibouti and Somalia, as well as other non‐OIC Member Countries : Bella Russia, Ghana, Tatarstan, India, Germany, Spain, France, Portugal, South Korea, USA, Canada, Belgium, Italy, Kenya and Ethiopia. This Exhibition registered also the participation of about 80,000 visitors and 350 exhibitors.
Institutions operating in the field of Halal product standards also took part in this Exhibition.
SMIIC and Discover Events organized on the side‐lines of this Exhibition, thematic conferences and workshops on Standardization and related issues for Halal quality Infrastructure, Certification and accreditation in Halal Industry, Islamic Banking and Finance Conference Halal and Health as well as B2B meetings.
15. 4th International Participants Meeting, Dubai, United Arab Emirates, 29‐30 November 2019:
Within the framework of the preparation of the participation of the OIC Institutions in Expo 2020 Dubai, the Bureau of Expo Dubai organized the Expo 2020 Dubai International Participants Meeting (IPM) on 29‐30 November 2019.
The objective of this meeting was to follow up the recent developments on the organization of this event by the leaders of the poles of programs of this event and to examine the possibility for OIC Institutions to co‐organize activities with regional organizations and agencies of the United Arab Emirates.
The objective of this meeting was to hear presentations on how daily programming at Expo is coming to life and to attend workshops giving further detail on what was addressed on the plenary stage the day before as well as to discuss programming for effective interaction between Participants.
This event gathered more a thousand representatives from nearly 192 Countries.
ICDT - Annual Report on Trade among the OIC Member States 2019-2020
177
On the Sidelines of the plenary session dedicated to general information on the Expo2020 programming the ICDT’s representative had a bilateral meeting with the International Bureau of Expositions (Expo2020) to take stock on the OIC Pavilion content.
The second day was dedicated to technical sessions, in the form of workshops, giving further detail on what was addressed on the plenary stage, as well as covering operational topics for specific types of participation.
The date of the next OIC Coordination meeting on Expo 2020 will be provided in due course.
16. Exceptional Edition of the Tourism and Handicrafts Fair of the OIC Member States, Kuwait City‐State of Kuwait, 18‐23 December 2019:
In pursuance of the relevant resolution adopted by the 34th Ministerial Session of the Standing Committee for Economic and Commercial Cooperation of the OIC Member States (COMCEC), held from 26 to 29 November 2018 in Istanbul ‐ Republic of Turkey and by the 35th Ordinary Session of the ICDT Board of Directors held in March 2018 in Marrakech, the Ministry of Commerce and Industry of the State of Kuwait and the Islamic Centre for Development of Trade (ICDT) organized in collaboration with "Kuwait International Fair Company" an “Exceptional Edition of Tourism, Handicrafts and Interior Decoration Exhibition of the OIC Member States”, from 18 to 23 December 2019 at the "Kuwait International Fairground (KIF)". In concomitance with the following exhibitions: Crafts and small projects, Building Exhibition "Beitek" and Health and beauty.
The objective of this Fair is to strengthen cooperation among OIC Member States in the tourism and Handicraft sectors, to promote historical monuments and tourist sites of Member States, and encourage investment in this sector. It was also a platform for stakeholders in the Handicraft sector in OIC Member States, seeking business opportunities to stablish partnership between them.
These events, which lasted 5 days, were open to the public and professionals, and were organised over an area of 13000sqm. It recorded the participation of the following Member States: Kingdom of Bahrain; Republic of Turkey; Republic of Tunisia; Sultanate of Oman; Republic of Lebanon; Arab Republic of Egypt; State of Qatar; Islamic Republic of Pakistan
Other non OIC Member States (France, Great Britain and Sri Lanka) have also participated in this Exhibition.
B/ OTHER PROMOTIONAL ACTIVITIES
1. Malaysian Business Mission in Morocco, Casablanca, 22 January 2019:
Within the framework of its program of cooperation with the OIC Member States, the Islamic Centre for Development of Trade (ICDT) organized, in collaboration with the Malaysian Embassy in Rabat and the Event company "Say Yes Event ", a Seminar and B2B Meetings between Malaysian Business People and their Moroccan Counterparts on 22 January 2019 at Farah Hotel ‐ Casablanca.
The Malaysian Delegation was composed of companies covering the food, agriculture, health, cosmetics, catering, computer and road infrastructure sectors.
The following Ministries and Institutions took part in this event: Ministry of Industry,
ICDT - Annual Report on Trade among the OIC Member States 2019-2020
178
Investment, Trade and Digital Economy of Morocco, Moroccan Association of Exporters (ASMEX), General Confederation of Moroccan Enterprises (CGEM), Moroccan Agency for Development of Investments and Exports (AMDIE), Moroccan Office of Industrial and Commercial Property (OMPIC) and several Moroccan companies specializing in the aforementioned sectors.
On this occasion, the Malaysian Companies showcased demonstrations of their products and services, the ICDT made a presentation on "How to do Business in Morocco" while the OMPIC presented the theme "Overview on the Protection of Industrial Property in Morocco".
2. Technical Seminar on the Promotion of Malaysian Palm Oil, Morocco, Casablanca, 7 February 2019:
Within the framework of its program of cooperation with OIC Member States, the Islamic Centre for Development of Trade (ICDT) organized with the Malaysian Embassy in Rabat and the Malaysian Palm Oil Board (MPOB) Regional Office in Cairo, a Technical Seminar for the Promotion of Malaysian Palm Oil in Morocco on 7th February 2019 at the Sheraton Casablanca Hotel.
The aim of this Technical Seminar is to raise awareness among industry and consumers on the benefits of palm oil, to increase the use of palm oil and to establish direct links with the users of oils and fats, especially palm oil.
The event was attended by the Ambassador of Malaysia to the Kingdom of Morocco, H.E. Mrs. Astanah Abdul Aziz, the Director General of ICDT, Deputy Director General of the Regional Office of the Malaysian Palm Oil Board (MPOB) in Cairo, the Representative of the Moroccan Association of Exporters (ASMEX) as well as the Organizations, Federations and specialized companies in Edible Oils Sector in Morocco.
3. 17th Meeting of the Economic Advisers to the Embassies of the OIC Member States accredited to the Kingdom of Morocco, Rabat ‐ Kingdom of Morocco, 14 February 2019:
Within the framework of its regular contacts with the Embassies of the Member States of the Organization of Islamic Cooperation (OIC) accredited to the Kingdom of Morocco, the Islamic Centre for Development of Trade (ICDT) organized the 17th Meeting of Economic Advisors of the Embassies of the OIC Member States accredited to the Kingdom of Morocco on 14th February 2019 in Rabat ‐ Kingdom of Morocco.
This meeting focused in particular on the presentation of the latest developments of the trade between the OIC Member States, the Information Network for Islamic Countries (TINIC), Trade Missions as well as the Forums and Seminars to be organized by the ICDT in 2019. The discussions also focused on cooperation between the ICDT and the Embassies of the OIC Member States accredited to the Kingdom of Morocco as part of the Centre's assistance program for the benefit of the OIC Member States.
Also took part in this meeting the Economic Advisers of the Embassies of the OIC Member States accredited to the Kingdom of Morocco as well as the Representatives of the Ministry of Foreign Affairs and International Cooperation of the Kingdom of Morocco, the Ministry of Industry, Investment, Trade and Digital Economy of the Kingdom of Morocco, the Regional Office of the of the Islamic Development Bank (IDB) Group in Rabat, the Arab Organization for Industrial Development and Mining (AIDMO), the Islamic Educational, Scientific and Cultural Organization (ISESCO) and Bayt Mal Al‐Quds Asharif Agency.
ICDT - Annual Report on Trade among the OIC Member States 2019-2020
179
4. Activities of the Business Centre for Islamic Countries (BCIC):
The Islamic Countries’ Business Centre is a space for meetings and exchanges dedicated to Business People. Located at the headquarters of ICDT, it was inaugurated in December 2013. ICDT has found it useful to set up this Business Centre to enable businessmen arriving in Morocco and Casablanca in particular to benefit from all the assistance and services provided by ICDT in this area in order to promote and strengthen investment and partnership relations between Member States and provide assistance in such areas as trade promotion, training and consulting.
In 2019, this space will be made available free of charge for the benefit of the Businessmen delegations wishing to use it for their meetings with their counterparts.
The Business Centre's objectives are:
To develop trade and partnership agreements between the OIC Countries;
To serve as a platform for exchanges and B2B meetings between the business people of Islamic Countries;
To host seminars dedicated to the OIC countries and specific markets;
To provide assistance to the businessmen of the OIC Countries in order to facilitate business contacts.
It should be noted that since the creation of the Business Centre, ICDT hosted business missions from Saudi Arabia, Bangladesh, Malaysia, Indonesia and Tunisia interested in developing their trade with the OIC Countries. In order to encourage the Economic Operators of the OIC Countries to use this meeting and exchange platform in a bid to develop their business, ICDT made a plea at the last meeting of Economic Advisers to the Embassies of the OIC Member States accredited to the Kingdom of Morocco held in Rabat on 18th January 2018. The Centre intends to do so in the next institutional meetings of the OIC and other meetings.
5. Visit of a Delegation of Businessmen from the Federation of Pakistan Chambers of Commerce & Industry, Casablanca, 5 December 2019:
The ICDT received on 5th December 2019 at its headquarters the visit of a high‐level Delegation of Businessmen from the Federation of Pakistan Chambers of Commerce & Industry (FPCCI). This Delegation was led by His Excellency Hamid Asghar KHAN, Ambassador of Pakistan in Morocco and Dr. Mirza Ikhtiar BAIG, Vice‐President of the Federation.
The Delegation was composed of Businessmen representing the following sectors: Food and Rice, Oil, Cement, Textile and Denim, Hospitality, Higher Education Services, Furniture, Cosmetics and Pharmaceutical products, Construction and Real Estate.
After a fruitful debate, both parties decided to organize the following activities for the benefit of Pakistan:
‐ 18th Trade Fair of the OIC Member States in Pakistan in 2022;
‐ Morocco‐Pakistan Business Forum in 2020 in Morocco;
‐ Awareness Raising Seminar on the TPS/OIC Agreement and its Protocols in 2020 in Pakistan;
‐ Various Trade Events to promote key Sectors in Pakistan: Halal Food, Islamic Banking, Higher
ICDT - Annual Report on Trade among the OIC Member States 2019-2020
180
Education Services and Rice.
At the end of the meeting, ICDT requested Pakistan representatives to actively take part in the Center’s activities planned for the year 2020.
6. Virtual Fair:
The project of a virtual Fair adopted by the 17th Session of ICDT’s Board of Directors has been developed on the Internet Site of ICDT. Henceforth, companies of the OIC countries can promote their products through this virtual fair with a presentation of a catalogue, prices and items etc.
It is planned to intensify the promotion of this Fair at the level of the enterprises of the OIC Member States.
In 2019, it is planned to intensify the promotion of this fair and to include more companies from the OIC countries, especially as it is completely free for all Member States.
III: TRAINING, FORUMS AND SEMINARS
A/ TRAINING:
1. 7th Regional Online Marketing Workshop of the Foundation of the World Islamic Economic Forum, Abidjan – Côte d’Ivoire, 15‐18 April 2019:
As part of the cooperation with Malaysia and the World Islamic Foundation (WIEF), the Islamic Centre for the Development of Trade (ICDT) and the Foundation of the World Economic Forum in collaboration with the State Secretariat for the Promotion of SMEs from Côte d'Ivoire organized the 7th Regional Online Marketing Workshop from April 15 to 18, 2019 in Abidjan.
This regional meeting brought together 32 businesswomen in UEMOA and CEMAC Member States, two of which in Mauritania aimed first at assisting women entrepreneurs in the design of their projects websites and the marketing of their products and services online and secondly to provide them with the necessary techniques and tools to familiarize them with marketing strategies.
2. OMC Post Workshop MC 11 / French speaking countries, Casablanca, 26‐27 June 2019:
As part of the implementation of the Thirty‐third Session of the COMCEC, which took place from 20 to 23 November 2017 in Istanbul, Republic of Turkey, which called on the IDB Group and ICDT to continue to provide technical assistance to OIC Member States on WTO‐related issues, to intensify their efforts to sensitize Member States to the impact of WTO trade negotiations on their economies, ICDT and the IDB Country Strategy and Cooperation Department, in collaboration with the State Secretariat for Foreign Trade of the Kingdom of Morocco, organized a Workshop on the "Results of the Eleventh Conference". Ministerial Conference (MC11) for the benefit of the African Member States of the OIC "26‐27 June 2019 in Casablanca.
This workshop was organized to discuss important topics, including the state of play of the WTO negotiations, ministerial decisions of the 11th Ministerial Conference (MC11), membership status of OIC Member States at the WTO, the future coordination of the OIC on WTO issues, the exchange of views of the representatives of the OIC countries on the OIC negotiating priorities within the WTO and the issues to be discussed at the next Ministerial Conference to be held in Nur‐Sultan, Republic of Kazakhstan, from 8 to 11 June 2020.
ICDT - Annual Report on Trade among the OIC Member States 2019-2020
181
The following Member States participated in this workshop: Benin, Burkina Faso, Cameroon, Chad, Côte d'Ivoire, The Gambia, Guinea, Guinea‐Bissau, Mauritania, Niger, Nigeria, Senegal, Togo, Tunisia, Uganda and Morocco.
3. Training Workshop on Family Tourism (MFT) Development, Paramaribo, Suriname, 15‐17 July 2019:
As part of the implementation of the project financed by the COMCEC and the Turkish Development and Investment Bank, ICDT organized a training workshop on the development of family tourism (MFT?) for the benefit of Suriname and Guyana, in Paramaribo from July 15 to 17, 2019.
The objective of this workshop was to improve the capacity building of Suriname and Guyana in the field of Family Tourism in order to increase tourism receipts and arrivals in these countries from OIC Member States.
More than 60 people (countries) participated in this workshop from Suriname and Guyana and National and International Experts.
4. Workshop on “Ongoing WTO Negotiations for Permanent Missions of OIC Member States in Geneva”, Geneva, Switzerland, November 14‐15, 2019,
The Islamic Centre for Development of Trade (ICDT), the Department of Country Strategy and Cooperation of the Islamic Development Bank (IDB) organized in collaboration with the Permanent Mission of the Organization of Islamic Cooperation (OIC) to the United Nations Office and other International Organizations in Geneva, a Workshop on "Ongoing WTO Negotiations for Permanent Missions of OIC Member States in Geneva", Geneva, Switzerland, on 14‐15 November 2019.
The objectives of this workshop were to discuss important topics, including the current negotiations and their impact on the trade of OIC Member States namely Agriculture, Fisheries Subsidies, E‐Commerce, Trade in Services , the Facilitation of Investment for Development, Micro, Small and Medium Enterprises (MSME), Trade and economic empowerment of women and the reform and coordination of the WTO for WTO matters. This event helped to raise awareness among the representatives of the OIC Permanent Missions on recent developments in WTO negotiations in order to prepare them to raise issues relevant to their delegations at the next Ministerial Conference (MC12) which will be held in Nur‐Sultan, Republic of Kazakhstan, from 8 to 11 June 2020. More than 20 Countries and 8 regional and international Organizations participated in this event.
B/ FORUMS AND SEMINARS :
1. 2nd Forum on Public‐Private Partnerships (PPP), Rabat, 28 February 2019:
The Islamic Centre for Development of Trade participated in the 2nd Forum on Public‐Private Partnerships (PPP) organized by the Islamic Development Bank Group in collaboration with the Ministry of Economy and Finance of the Kingdom of Morocco in Rabat on 28th February 2019 under the theme "Common efforts for common goals".
ICDT - Annual Report on Trade among the OIC Member States 2019-2020
182
The 2nd Public‐Private Partnership Forum brought together more than 300 internationally renowned participants and experts, government officials and private investors to discuss ways to improve the legal and institutional environment for PPPs, particularly in the African continent.
The meeting focused on three panels on the potential of PPPs to shape future cities, the creation of an enabling environment for PPPs in social infrastructure (health and education) and innovative mechanisms for PPPs.
2. 5th Halal Forum of Morocco, Casablanca, 14th March 2019:
The Islamic Centre for Development of Trade co‐organized with the Moroccan Institute of Standardization (IMANOR) the 5th Edition of the Halal Forum of Morocco in Casablanca on 14 March 2019 under the theme "Halal ecosystem to improve the competitiveness of Moroccan companies on the Halal World Market ".
More than 200 participants attended this forum from the public and private sectors, regional and international organizations of which SMIIC as well as academics and consultants.
A Memorandum of Understanding (MOU) has been signed between IMANOR, ASMEX and Instituto Halal de Cordoba to strengthen cooperation in the field of Halal industry.
The representative of ICDT made a presentation on the realities and trends of the Global Halal Market and the opportunities.
The main recommendations are to strengthen PPP collaboration in the Halal field in Morocco and support funding to expand the IMANOR certification and establish mutual recognition agreements for the standardization of Moroccan Halal products with potential partner countries in Europe, Asia, Middle East and Africa.
3. 1st Conference on Social Development of OIC Countries, Istanbul, Republic of Turkey, 7‐9 December 2019:
ICDT represented by Its Acting Director General participated in the 1st Conference on Social Development of OIC Countries in Istanbul, Republic of Turkey, from 7 to 9 December 2019. This Conference was organized by the Ministry of Family, Labour and Social Services of the Republic of Turkey.
About 46 Member States represented by Ministers and Ambassadors and regional and international organizations took part in this Conference.
The representatives of the countries took the floor to present their policies and advances on social development and exchange their experience in this field for the benefit of the other member states. Representatives of regional and international organizations made presentations on their experiences in the area of social development.
The draft resolution of the Republic of Turkey on the establishment of the OIC Family Council will be discussed during the next 47th OIC Council of Ministers of Foreign Affairs in Niger.
Participants agreed to hold the OIC Social Development Conference every two years. The Arab Republic of Egypt has expressed interest in officially hosting the next Conference in 2021.
Participants adopted the Istanbul Declaration at the conference.
ICDT - Annual Report on Trade among the OIC Member States 2019-2020
183
4. OIC High Level Conference on Private Public Investment, Istanbul, Republic of Turkey, 8‐9 December 2019:
ICDT participated in the OIC High Level Conference on Private Public Investment held on 8‐9 December 2019 in Istanbul, Republic of Turkey.
This Conference was organized by the Government of the Republic of Turkey and the Islamic Development Bank. Over 1200 Delegates from 50 Countries and International Organizations participated in this event. The objective of this Conference was to discuss ways and means of strengthening relations between the OIC member States in the field of promotion and exchange of investment experiences. Six discussion panels were moderated by national and international Experts.
In addition, the participants encouraged the organization of this type of events frequently in OIC member countries in collaboration with Regional and International Institutions working in the field of investment and finance.
5. Seminar on the Review of Economic and Commercial Common Action of the OIC, Rabat‐Kingdom of Morocco, December 12th, 2019:
On the occasion of the Celebration of the 50th Anniversary of the Organization of Islamic Cooperation (OIC), the Islamic Centre for Development of Trade (ICDT) organized a "Seminar on the Review of Economic and Commercial Common Action of the OCI”, on December 12th ,2019 in Rabat.
The axes of the seminar focused on the following themes: Current state and prospects of Intra‐OIC Trade; Trade and Investment Financing and Insurance, Investment flows between the OIC Member States; Role of Private Sector Institutions in boosting business relationships between OIC Member States; Facilitation of Trade and State of Logistics and Transport between the OIC Member States.
Experts from ICDT, ITFC, ICIEC, SESRIC and ICCIA led the presentations of this seminar.
C/ STUDIES
1. Annual Report on Trade among the OIC Member States, 2019/2020 edition:
The Annual Report on Trade among the OIC Member States for the year 2019/2020 is under preparation. It presents the evolution of the foreign trade of the OIC Member States in general and intra‐OIC trade in particular at the level of the product structure of exports and imports and at the level of the geographical orientation of trade flows.
Besides, the report contains a new chapter on potential trade among the OIC Member States in addition to the chapter on “Intra‐OIC Trade Expansion; problems and prospects”, which brings out the obstacles that are hampering intra‐OIC Trade Development and proposes a series of recommendations concerning measures to be taken in order to increase the levels of intra‐OIC Trade and trade related investments. It also includes statistical annexes, which present intra‐OIC trade of each Member State.
2. Report on ‘’Multilateral Trade Negotiations within the WTO’’:
In compliance with the recommendations of the 24th session of the COMCEC, the ICDT
ICDT - Annual Report on Trade among the OIC Member States 2019-2020
184
prepares the report on multilateral trade negotiations within the WTO on an annual basis and published at the meetings of the COMCEC, the CFM and the WTO.
3. Study on the potential of Kuwait‐OIC trade:
Following the request of the Administrator of the State of Kuwait to the 35th Board of ICDT held in December 2018, ICDT carried out a study on the export potential of the State of Kuwait, excluding hydrocarbons.
The study looked at Kuwait's global trade at INRA‐OIC level as well as the export structure and major exports of Kuwait. The study highlighted products with high trade potential and export opportunities and diversification of the products that Kuwait should seize to enhance its trade and strengthen its position in the ranking of Intra‐OIC countries
D/ DOCUMENTATION AND INFORMATION
1. Documentation:
The documentary material is progressively developing thanks to the contribution of Member States and international organisations: the documentation service steadily receives inquiries concerning Inter‐Islamic Trade exchanges from businessmen or academics.
2. Information:
Trade Information Network for Islamic Countries (TINIC):
Like in the previous years, the content of the existing databases of the Trade Information Network for Islamic Countries (TINIC) will be updated, new databases of this network will be launched, and the Site’s design will be improved.
In this direction, periodical adjustments are rigorously and steadily made every 3 months at the utmost. These adjustments are absolutely necessary in order to take into account the latest technologies and trends of the NICT that are developed worldwide. Besides, during this financial year, special efforts will be made for the permanent promotion of the site and with respect to cooperation in this field, especially, with the TINIC, National Focal Points, IDB, ITC and UNIDO.
Well laid out search engines have been developed concerning the main databases to help the visitors of ICDT’s site to find well screened required information in a simple manner. Furthermore, subscription forms are also available and operational on the site to help those visitors wishing to subscribe to ICDT’s databases, to do so directly on the Internet, which would allow them to gain time and benefit from increased efficiency.
In order to provide more and updated information, the OIC Trade Centre launched since December 2016 the OIC Integrated Trade Map, which is a trade map adapted to the 57 OIC Member countries.
With the aim of providing additional and updated information, ICDT launched the first part of the OIC Trade Embedded Map on the ICDT’s website with data from Morocco since October 2016. This new database, which is entitled OIC Trade Embedded Map, provides information on trade flows in a user‐friendly and easily accessible format.
TINIC users can now have access to indicators on national export performance, international demand, alternative markets and the role of competitors from the product and country
ICDT - Annual Report on Trade among the OIC Member States 2019-2020
185
perspective, and will help companies and the business community to tackle issues related to international trade, and thus facilitate strategic market studies.
Regarding the regional version which allowed displaying on the TINIC the data available in the Trade Map for the 57 OIC Member States, was finalized in March 2017.
In addition, this new version of OIC Trade Embedded Map is closely linked to Market Access Map, providing information on tariffs (including preferential tariffs) applied by more than 200 countries and established in 239 countries and territories, tariff quotas, trade remedies, rules and certificates of origin, bound tariffs of WTO Member Countries, non‐tariff measures and trade flows in order to help users prioritize and analyze export markets as well as to prepare negotiations on market access conditions.
Users can also find ad valorem equivalents for all non‐ad valorem tariffs and perform product and country aggregations as well as simulations of tariff reduction scenarios.
During the 15th meeting of the Economic Advisers to the Embassies of the OIC Member States accredited to Rabat, held on 19th January 2017, the ICDT took note of the request of the Embassy of the Republic of Benin concerning the setting up of its website, task that ICDT has undertook, and by June 2017 the website was operational.
In addition, as part of its collaboration with the International Trade Centre (ITC‐Geneva), ICDT launched at the same meeting, the OIC Trade Embedded Map, which is a trade map solution adapted to the 57 OIC Member States.
OIC Trade Embedded Map provides information on trade flows in a user‐friendly and easily accessible format. TINIC users can now have access to the larger and unique OIC Trade databases containing indicators on national export performance, international demand, alternative markets and on the role of competitors from the product and country perspective.
This newly launched database will also help companies and the business community to tackle issues related to international trade, and thus facilitate strategic market studies.
Market Access Map provides information on custom tariffs (including preferential tariffs) applied by more than 200 countries and established in 239 countries and territories, tariff quotas, trade remedies, rules and certificates of origin, bound tariffs of WTO Member Countries, non‐tariff measures and trade flows in order to help users prioritize and analyze export markets as well as to prepare negotiations on market access conditions. Users can also find ad valorem equivalents for all non‐ad valorem tariffs and perform product and country aggregations as well as simulations of tariff reduction scenarios.
The embedded version of the OIC TradeMap and MacMap is available at the link mentioned below on the Centre's website (http://icdt‐oic.org/ICDT) and responds satisfactorily to the terms of reference, and it also incorporates access to Non‐Tariff Measures (NTMs) available in OIC Trade Map.
ICDT has proceeded with the United Nations Office for South‐South Cooperation (UNOSSC) to the Mapping of the TINIC databases with those of the UNOSSC databases during the meeting held in Dubai from 31 October to 4 November 2016.
ICDT - Annual Report on Trade among the OIC Member States 2019-2020
186
Finally, ICDT launched the dedicated platform to OIC NTMs / NTBs (http://ntb.icdt‐oic.org/Main/) as well as the links of the different questionnaires about the NTMs survey aimed at identifying NTMs that exporters from OIC Member States perceive as Non‐Tariff Barriers, during the Workshop on Non‐Tariff Barriers in the OIC Member States that it organized in collaboration with the Ministry of Foreign Trade of the Kingdom of the Morocco, on 24th and 25th October 2017 in Rabat.
ICDT took this opportunity to present the link: http://ntb.icdt‐oic.org/survey and to ask them to circulate the questionnaire to the business community in their respective countries.
In 2019, ICDT developed the Expo 2020 platform in order to facilitate to OIC Institutions to keep informed of the evolution of their participation and to update the information relating to the organization of their events on the sidelines of Expo2020, because ICDT is the focal point designated by the OIC. Following the recommendation of the 5th ACMOI meeting held in December 2019 in Jeddah, ICDT will launch another platform on TISC in order to allow the focal points of the OIC Institutions to update their activities in order to carry out quarterly reports.
E/ TECHNICAL ASSISTANCE
Regional Project on "Sustainable Tourism Development in a Network of Cross‐border Parks and Protected Areas in West Africa:
In compliance with the decision of H.E the OIC Secretary General, ICDT ensures, since 2006, the follow up of the implementation of the project on “Sustainable Tourism Development in a Network of Cross‐Border Parks and Protected Areas”. This project includes ten OIC Member States (Benin, Burkina Faso, The Gambia, Guinea, Guinea Bissau, Mali, Mauritania, Niger, Senegal, and Sierra Leone).
Objectives of the Project:
- Support the process of sub‐regional economic integration on the basis of rational management of Cross‐border protected areas;
- Promote sustainable tourism and ecotourism;
- Ensure the conservation of biological diversity at sub‐regional level;
- Reduce poverty in local communities through increased incomes, increased employment and the promotion of income‐generating activities;
- Create a network of national and regional parks of Cross‐Border Protected Areas.
The Cross‐border Parks and Protected Areas concerned by the Project:
- Djoudj ‐ Diawling (Senegal / Mauritania);
- Niokolo Koba ‐ Badiar (Senegal / Guinea);
- Gambia River Basin ‐ Kayanga ‐ Geba ‐ Koliba ‐ Corubal (Gambia / Guinea Bissau/Senegal);
- Rios Kogon ‐ Korubal ‐ Nunez (Guinea Bissau / Guinea);
- Pinselli ‐ Outamba ‐ Kilimi (Sierra Leone / Guinea) ;
- Bafing ‐ Faleme (Mali / Guinea);
ICDT - Annual Report on Trade among the OIC Member States 2019-2020
187
- W (Benin / Bukina Faso / Niger).
The Project Feasibility Study, adopted at the Steering Committee Meeting held at WTO Headquarters in Madrid in December 2009, was conducted by the Cabinet "Sécheresse Consultant" with funding from the South‐ Korean agency ‐ KOICA. The cost of the Project has been estimated at approximately USD 46 million. In May 2011, Project stakeholders organized a Donor Conference in Dakar, but none of the participating financial institutions and development agencies made a firm commitment to fund the Project.
Since 2006, ICDT has initiated many actions to promote this project at the OIC institutional meetings and more particularly at the Islamic Conferences of the Ministers of Tourism. The Centre also held at its headquarters in Casablanca several meetings of the Steering Committee of the Project, including the latest one as announced below.
Meeting of the Steering Committee of the "Regional Project on the Sustainable Tourism Development in a Network of Cross‐Border Parks and Protected Areas in West Africa", Casablanca, 11 March 2019:
With the aim of reviving the "Regional Project on the Sustainable Tourism Development in a Network of Cross‐Border Parks and Protected Areas in West Africa ", the Director General of ICDT Dr. El Hassane HZAINE held a preparatory Meeting of the Steering Committee of the Project on 11th March 2019, at the headquarters of ICDT in Casablanca.
Took part in this meeting H.E Aboubacar DIONE, Ambassador of the Republic of Guinea to the Kingdom of Morocco and Representative of HE Thierno Ousmane DIALLO ‐ Minister of Handicrafts, Hotels and Tourism of the Republic of Guinea as well as the ICDT staff.
On this occasion, H.E Aboubacar DIONE thanked Dr HZAINE for his warm welcome and presented to the participants the actions he considered useful to undertake with a view to strengthening the implementation of this project, namely:
Initiate Advocacy for the Project at the level of States, Ministries of Foreign Affairs and Technical Ministries (Tourism and Environment) and during the next OIC Summit.
In this regard, His Excellency has suggested to consolidate the resolution adopted at the 46th Session of the OIC Council of Foreign Ministers in Abu Dhabi to raise awareness among Heads of State and seek the support of the IDB Group and other partners including the Green Fund and UNEP;
Continue capacity building program related to the Project;
Invite countries to explore the bilateral approach in parallel with the multilateral channel with a view to facilitating the fundraising for the national segments of the Project, pending the holding of the next Conference of Donors;
Nominate a technical focal point at the level of the Regional Coordination Office of the Project and the relevant Ministries;
Provide support to the Regional Project Coordination.
ICDT is committed to taking the following actions:
ICDT - Annual Report on Trade among the OIC Member States 2019-2020
188
Participation in "Africa Investment Meetings Road Show" Organized by Winvestnet in Rabat (29‐30 April 2019);
Organization of a Training Workshop and Visits of tourist parks in Turkey by the managers of park and protected area, in partnership with SESRIC (September 2019);
Participation in the OIC Investment Forum planned in Tunis through a stand and presentation of the Project by the Regional Coordination Office (2019);
Participation in the Exhibition and Forum on Tourism to be held in Dhaka (2nd semester of 2019).
Workshop for the benefit of the Managers of West African Cross‐border Parks and Protected Areas, Ankara – Turkey, 5‐7 November 2019:
ICDT and SESRIC organized in Ankara on 5‐7 November 2019 a Workshop for the benefit of the Managers of West African Cross‐border Parks and Protected Areas. The Republic of Guinea which was represented by His Excellency Mr Daouda BANGOURA, Ambassador of Guinea in Turkey and Mr Mohamed Sanoussy CISSE, National Director of Tourism in Guinea chaired the different sessions of the Workshop along with ICDT and SESRIC. On this occasion, participants from Guinea, Burkina Faso, Gambia Guinea‐Bissau and Mali gathered in working groups to discuss the current management of West African Parks and Protected Areas and formulate recommendations for their upgrade. The results of the works were presented in plenary session. The 3rd day of the Workshop was dedicated to the visit of Soğuksu National Park located in Kızılcahamam in the province of Ankara.
E/ PUBLICATIONS
1. Tijaris:
At the request of the Board of Directors, this magazine is henceforth issued every two months, in English and Arabic and continues to cover international and inter‐Islamic Trade issues. A special "Country" is published in each issue of "Tijaris" in order to provide information on each Member State (description of economic sectors, the business climate,) and highlight trade and investment opportunities of the Islamic World.
ICDT added new headings in the magazine as the one dedicated to the promotion of SMEs and the part "practical and useful information» for business has been enriched.
2. Business guide of the OIC Member Countries (OIC Business Guide)
Combination and updating of the exporter’s and the investor’s guides of the OIC Member States and inclusion of the countries that have not been covered yet.
This guide presents to the businessmen of Member States the general business environment and conditions in each country along with the trade and investment regulations in force in each studied country.
Publication of the study on “the Project of a Free Trade Area among the OIC Member States”;
Publication of the study on “the Impact of the High Energy and basic products Prices on the Foreign Trade of the OIC Member States”;
ICDT - Annual Report on Trade among the OIC Member States 2019-2020
189
Publication of the study on “the trade in products linked to information and communication technologies between the OIC Member States”;
Publication of the Study on Central Asia Countries, Members of the Organization of Islamic Cooperation;
Publication of the Study on Export Competitiveness of the OIC SMEs. Barriers and leverages of improvement;
Study on pharmaceutical Industry in the OIC Member States.
The update of this guide as well as that on tourism will take place in 2020.
F/ COOPERATION
ICDT has undertaken this year the follow up of the implementation of the memorandums of understanding and agreements signed with the different national, regional and international organizations that were approved by its Board of Directors, notably with: IDB, the International Islamic Trade Finance Corporation (ITFC), the International Trade Centre (ITC), UNCTAD, the Standards and Metrology Institute for the Islamic Countries (SMIIC), the Statistical, Economic and Social Research and Training Centre for Islamic Countries (SESRIC), International Center of Foreign Trade (CICES), OICBIZ Malaysia, the Saudi Corporation “Al Harithy Company For Exhibitions”, the State Company for Iraqi Fairs & Commercial Services, Kuwait International Fair Company, the Ministry of Commerce of the Republic of Côte d'Ivoire, the Agadir Technical Unit (ATU), which are example of institutions that have participated in organizing in collaboration with ICDT its activities over the past five years.
G/ INSTITUTIONAL MEETINGS
1. 42nd Islamic Commission for Economic, Cultural and Social Affairs, Jeddah‐ Kingdom of Saudi Arabia, 15‐17 January 2019:
The Islamic Centre for Development of Commerce took part to the proceedings of the 42nd Islamic Commission for Economic Social and Cultural Affairs held in Jeddah ‐Kingdom of Saudi Arabia from 15th to 17th January 2019.
The Islamic Commission for Economic, Cultural and Social Affairs (ICECS), met beforehand as the Assembly General of the subsidiary organs of the OIC, before continuing its work as the 42nd Commission of Economic and Social Affairs.
2. 46th OIC Council of Foreign Ministers, Abu Dhabi ‐ United Arab Emirates, 28 February – 3rd March 2019:
ICDT participated in the 46th Session of the Council of Foreign Ministers, held from 28 February to 3 March 2019 in Abu Dhabi‐ United Arab Emirates.
This session was organized under the theme: “50 years of Islamic cooperation: roadmap for prosperity and development".
The Centre delegation held several sideline meetings with delegations from OIC Member Countries in a bid to strengthen cooperation in areas of common interest, including through the organization of capacity‐building seminars, the organization of Fairs and Exhibitions and
ICDT - Annual Report on Trade among the OIC Member States 2019-2020
190
Businessmen Missions.
3. 13th Meeting of the COMCEC Trade Working Group, Ankara; Turkey, 7 March 2019:
The Islamic Centre for Development of Trade participated in the 13th Meeting of the COMCEC Trade Working Group organized by the COMCEC Coordination Office on 7th March 2019 in Ankara, Turkey under the theme “Increasing Public Availability of Customs Information in the OIC Member States”.
The representatives of 17 Member States attended the Meeting, namely: Turkey, Saudi Arabia, Tunisia, Qatar, Pakistan, Oman, Nigeria, Malaysia, Libya, Kuwait, Iran, Indonesia, Guinea, Egypt, Azerbaijan, Iraq and Kazakhstan. Moreover, representatives of COMCEC Coordination Office, GCC, ICDT, ITFC, WCO, SMIIC, GCC Secretariat and Solmaz Customs Consultancy.
ICDT was represented by Mr. Mamoudou Bocar SALL, Head of Studies and Training Department who participated actively in the COMCEC Trade Outlook and the Analytical Study on Increasing Public Availability of Customs Information in the OIC Member States presented respectively by Ms Vildan BARAN from the COMCEC and Dr. Ben SHEPHERD, COMCEC Expert and Senior Consultant in Trade Development.
4. Fourth Meeting of Sub‐Committee (ACMOI) on Trade and Investment (TISC), Marrakesh ‐ Kingdom of Morocco, 1st April 2019:
Following the recommendations of the Third Meeting of Trade and Investment Sub‐Committee of ACMOI (TISC), the Fourth Annual Coordination Meeting of the Organization of Islamic Cooperation Institutions (ACMOI) organized respectively in Casablanca, Kingdom of Morocco on March 8th, 2018 and in Jeddah, Kingdom of Saudi Arabia on 3‐4 December 2018, the Islamic Centre for Development of Trade (ICDT) organized the Fourth Meeting in Marrakesh on 1st April 2019. This Meeting was chaired by the Director General of ICDT and the CEO of ITFC.
The meeting was attended by the COMCEC Coordination Office (CCO), the International Islamic Trade Finance Corporation (ITFC), the Islamic Corporation for the Development of the Private Sector (ICD), the Islamic Development Group (IsDB), the Statistical, Economic and Social Research and Training Centre for Islamic Countries (SESRIC), the Islamic Chamber of Commerce, Industry and Agriculture (ICCIA), the Standards and Metrology Institute for Islamic Countries (SMIIC), the Islamic Cooperation Youth Forum (ICYF), the Kingdom of Morocco, Bayt Al Mal AlQods (BAMQ).
5. 48th Standing Committee on Finance, Jeddah‐ Kingdom of Saudi Arabia, 16‐18 April 2019:
The Islamic Centre for the Development of Trade participated in the work of the 48th Standing Committee on Finance held at the OIC General Secretariat in Jeddah from 16 to 18 April 2019.
This meeting was attended by 35 OIC Member States, chaired by HE Ahmed Sari Al‐Mazrouei, Under‐Secretary for Foreign Affairs of the United Arab Emirates, the Vice‐Presidents were from the Republic of Afghanistan, Republic Uganda, and the State of Palestine and the Rapporteur was from the People's Republic of Bangladesh.
The Commission has extended the budget of ICDT for the year 2020 to the same amount of that of 2019, namely US $ 2,536,000.
6. 35th Session of the COMCEC Follow‐up Committee, Ankara ‐ Republic of Turkey, 24‐25 April
ICDT - Annual Report on Trade among the OIC Member States 2019-2020
191
2019:
The Islamic Centre for Development of Trade participated in the 35th Session of the Follow‐Up Committee of the COMCEC held in Ankara, Republic of Turkey from 24th to 25th April 2019. During the meeting, the Centre presented the following reports:
a) Intra‐OIC Trade;
b) Exhibitions and Trade fairs of the OIC Member States;
c) Roadmap for the promotion of intra‐OIC trade;
d) Activities related to the WTO;
e) The Regional Project of Parks and Protected Areas in West Africa.
7. 37th Session of the ICDT’s Board of Directors, Casablanca‐ Kingdom of Morocco, 16‐17 October 2019:
The Islamic Centre for Development of Trade (ICDT) held its 37th Ordinary Session in Casablanca ‐ Kingdom of Morocco, on 16‐17 October 2019.
The Board of Directors examined the following agenda items:
The Activity Report of the Islamic Centre for Development of Trade;
Closing Accounts for the year 2018,
Work programme for the year 2021,
Draft Budget for the year 2021;
Miscellaneous;
Date and venue of the next meeting.
8. 35th Session of the COMCEC, Istanbul, Republic of Turkey, 25‐28 November 2019:
ICDT participated in the 35th Ministerial Session of the COMCEC held from 25 to 28 November 2019 in Istanbul ‐ Republic of Turkey. During this meeting, the ICDT delegation presented the following reports:
Intra‐OIC trade;
Trade Fairs and Exhibitions of OIC Member States;
Road Map for the Promotion of Intra‐OIC Trade;
Activities related to the WTO.
This Session recorded the participation of 47 OIC Member States, 5 Observer Countries, 12 OIC Organs and 5 Regional Organizations
9. 5th Annual Coordination Meeting of the OIC Institutions "ACMOI”, Jeddah ‐ Kingdom of Saudi Arabia, 4‐5 December 2019:
The Acting Director General of ICDT took part in the "5th Annual Coordinating Meeting of the OIC Institutions", which was held on 4th and 5th December 2019 at the headquarters of the OIC General Secretariat in Jeddah‐ Kingdom of Saudi Arabia.
ICDT - Annual Report on Trade among the OIC Member States 2019-2020
192
This meeting, which was chaired by the Secretary General in Charge of Humanitarian, Cultural and Social Affairs, was attended by the heads of institutions and affiliated organs of the OIC.
The purpose of this meeting was to ensure coordination and effective allocation of resources among the OIC institutions in order to report back to the Council of Foreign Ministers.
ICDT - Annual Report on Trade among the OIC Member States 2019-2020
193
GENERAL CONCLUSION:
ICDT - Annual Report on Trade among the OIC Member States 2019-2020
194
Trade facilitation activities are of great importance to promote intra‐OIC trade and investment. In this context, ICDT carried out a study indicating that the majority of barriers facing trade relate to tariff barriers measures and sanitary and phytosanitary measures, which constitute a burden for exporters. Non‐tariff measures affect more than 50% of companies in Member States, especially technical measures and measures related to procedures.
To gradually lower these obstacles, Member States and OIC Institutions need to focus more on Trade Facilitation activities, i.e. training on rules of origin, product certification, mutual recognition of standards, establishment of commercial single windows, modernization of Customs administrations, exchange of successful experiences among Member States, improvement of the services of Trade and Investment Promotion Organs and organization of intra‐OIC trade and investment promotion programs. OIC Member States have signed several bilateral, regional and multilateral trade and investment agreements in order to better regulate trade and investment flows and further liberalize international trade transactions with local incentives.
Studies conducted by the International Trade Center (ITC) and UNCTAD for more than ten years on Non‐Tariff Trade Measures (NTMs) have shown that States apply more restrictive domestic measures to companies than those encountered with Commercial Partners.
Indeed, the most important measures applied by Member States are: import tariffs, financial subsidies, export subsidies, export tariffs, non‐tariff import measures, import licensing, safeguard measures, anti‐dumping measures, non‐tariff export measures, import quotas, local content, financial incentives for FDI, export licensing, internal import taxes, import bans and export quotas.
Despite these barriers, Member States have also initiated trade facilitation measures to streamline foreign trade transaction procedures such as the establishment of singles windows, the construction of road, rail and airport infrastructure, and the automation of customs administration, the exchange of electronic data inter‐agency stakeholders of trade and the elimination of several foreign trade documents.
In order to better develop intra‐OIC trade, it is appropriate for Member States to activate the operationalization of the OIC trade preferential system either through the normal or fast‐track way taking into account the evolution of the environment of regional trade agreements and to increase the organization of trade and investment promotion activities in order to develop the markets for products and services in these countries.
On the other hand, the countries that have not signed or ratified yet the TPS‐OIC should do so as soon as possible, and move to the stage of its implementation.
In this regard, between 2018 and 2019, the ICDT organized 16 activities in the field of general and specialized exhibitions, 6 promotional activities, 9 seminars and meetings in the field of training, especially within the framework of the WTO, export strategies, online marketing, regional trade integration and a number of activities in the area of regional tourism.
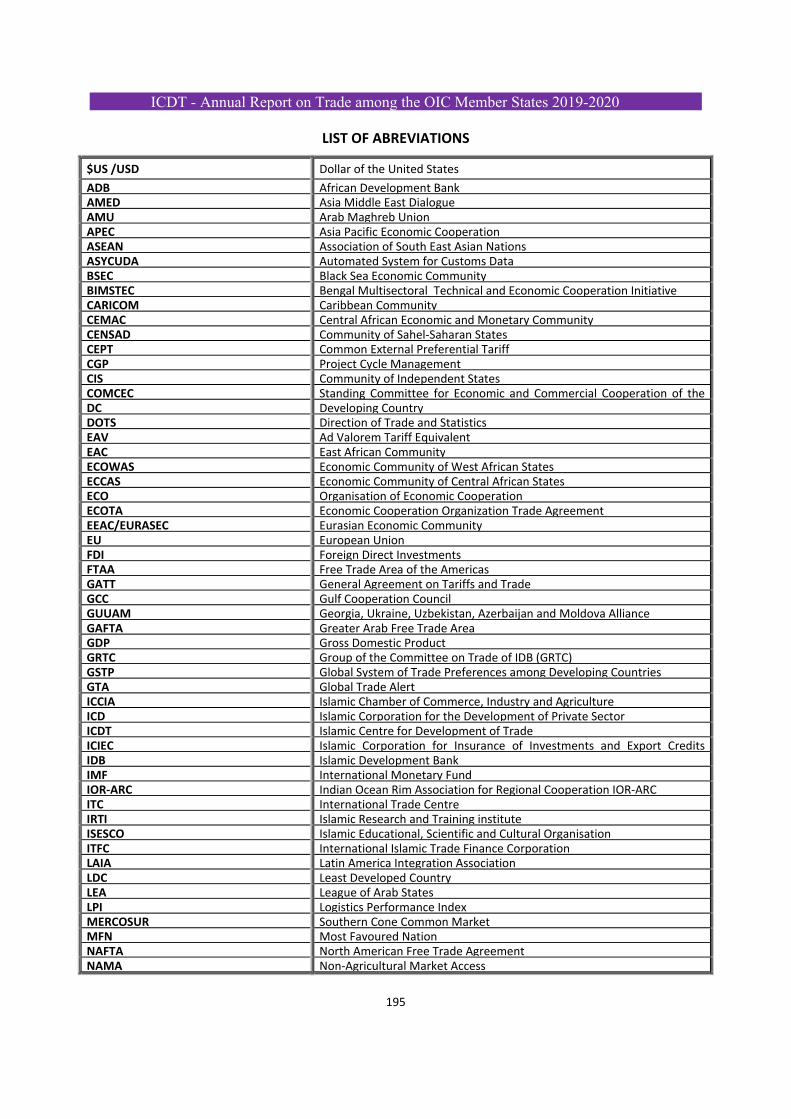
ICDT - Annual Report on Trade among the OIC Member States 2019-2020
195
LIST OF ABREVIATIONS
$US /USD Dollar of the United States
ADB African Development BankAMED Asia Middle East DialogueAMU Arab Maghreb UnionAPEC Asia Pacific Economic CooperationASEAN Association of South East Asian NationsASYCUDA Automated System for Customs DataBSEC Black Sea Economic CommunityBIMSTEC Bengal Multisectoral Technical and Economic Cooperation InitiativeCARICOM Caribbean CommunityCEMAC Central African Economic and Monetary Community CENSAD Community of Sahel‐Saharan StatesCEPT Common External Preferential TariffCGP Project Cycle ManagementCIS Community of Independent StatesCOMCEC Standing Committee for Economic and Commercial Cooperation of the DC Developing CountryDOTS Direction of Trade and StatisticsEAV Ad Valorem Tariff Equivalent EAC East African CommunityECOWAS Economic Community of West African StatesECCAS Economic Community of Central African States ECO Organisation of Economic Cooperation ECOTA Economic Cooperation Organization Trade Agreement EEAC/EURASEC Eurasian Economic CommunityEU European Union FDI Foreign Direct Investments FTAA Free Trade Area of the AmericasGATT General Agreement on Tariffs and TradeGCC Gulf Cooperation CouncilGUUAM Georgia, Ukraine, Uzbekistan, Azerbaijan and Moldova Alliance GAFTA Greater Arab Free Trade AreaGDP Gross Domestic ProductGRTC Group of the Committee on Trade of IDB (GRTC) GSTP Global System of Trade Preferences among Developing CountriesGTA Global Trade Alert ICCIA Islamic Chamber of Commerce, Industry and Agriculture ICD Islamic Corporation for the Development of Private Sector ICDT Islamic Centre for Development of TradeICIEC Islamic Corporation for Insurance of Investments and Export Credits IDB Islamic Development Bank IMF International Monetary Fund IOR‐ARC Indian Ocean Rim Association for Regional Cooperation IOR‐ARCITC International Trade Centre IRTI Islamic Research and Training instituteISESCO Islamic Educational, Scientific and Cultural Organisation ITFC International Islamic Trade Finance Corporation LAIA Latin America Integration AssociationLDC Least Developed CountryLEA League of Arab States LPI Logistics Performance IndexMERCOSUR Southern Cone Common MarketMFN Most Favoured NationNAFTA North American Free Trade AgreementNAMA Non‐Agricultural Market Access
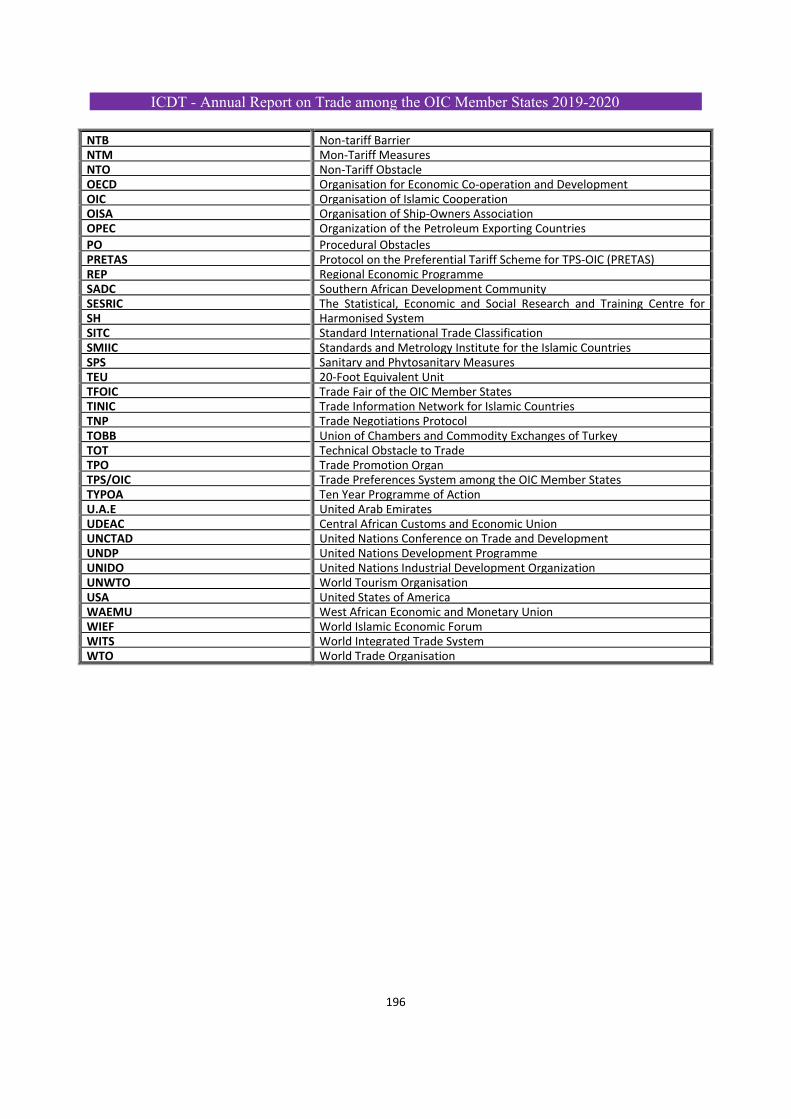
ICDT - Annual Report on Trade among the OIC Member States 2019-2020
196
NTB Non‐tariff BarrierNTM Mon‐Tariff Measures NTO Non‐Tariff ObstacleOECD Organisation for Economic Co‐operation and Development OIC Organisation of Islamic CooperationOISA Organisation of Ship‐Owners AssociationOPEC Organization of the Petroleum Exporting Countries
PO Procedural Obstacles PRETAS Protocol on the Preferential Tariff Scheme for TPS‐OIC (PRETAS)REP Regional Economic ProgrammeSADC Southern African Development CommunitySESRIC The Statistical, Economic and Social Research and Training Centre for SH Harmonised System SITC Standard International Trade ClassificationSMIIC Standards and Metrology Institute for the Islamic Countries SPS Sanitary and Phytosanitary MeasuresTEU 20‐Foot Equivalent UnitTFOIC Trade Fair of the OIC Member StatesTINIC Trade Information Network for Islamic Countries TNP Trade Negotiations ProtocolTOBB Union of Chambers and Commodity Exchanges of Turkey TOT Technical Obstacle to TradeTPO Trade Promotion OrganTPS/OIC Trade Preferences System among the OIC Member States TYPOA Ten Year Programme of Action U.A.E United Arab Emirates UDEAC Central African Customs and Economic UnionUNCTAD United Nations Conference on Trade and Development UNDP United Nations Development ProgrammeUNIDO United Nations Industrial Development Organization UNWTO World Tourism OrganisationUSA United States of America WAEMU West African Economic and Monetary UnionWIEF World Islamic Economic ForumWITS World Integrated Trade SystemWTO World Trade Organisation
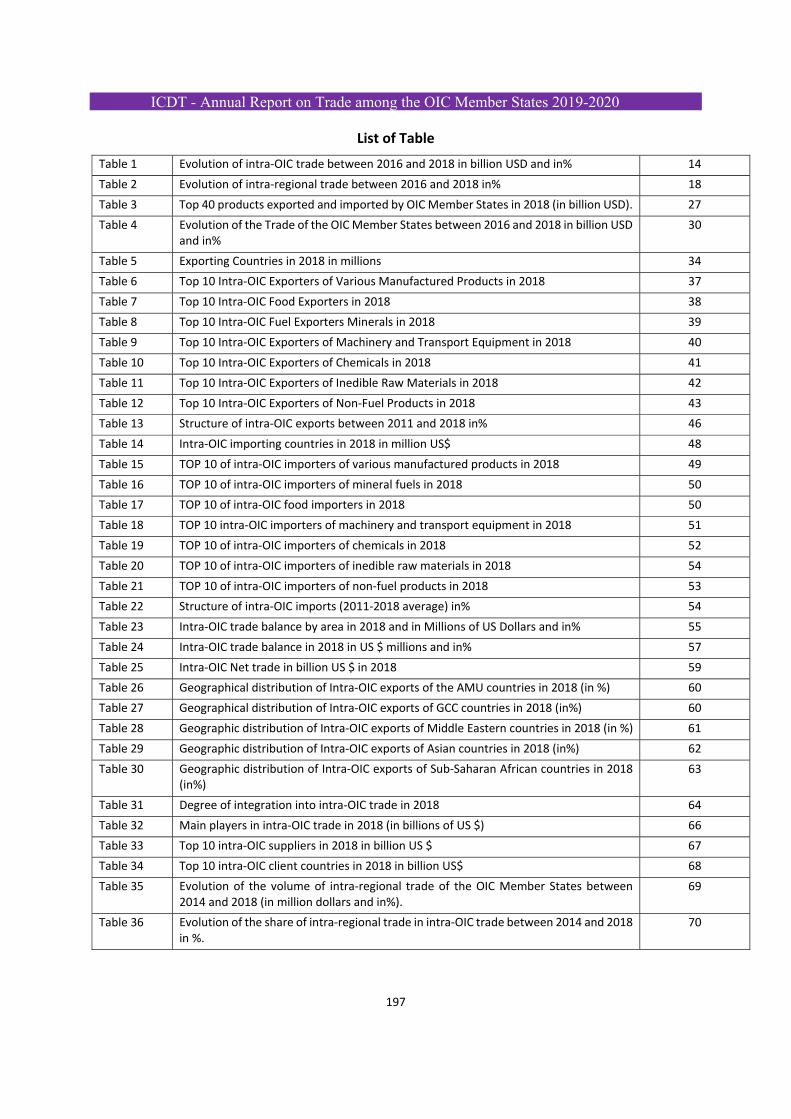
ICDT - Annual Report on Trade among the OIC Member States 2019-2020
197
List of Table
Table 1 Evolution of intra‐OIC trade between 2016 and 2018 in billion USD and in% 14
Table 2 Evolution of intra‐regional trade between 2016 and 2018 in% 18
Table 3 Top 40 products exported and imported by OIC Member States in 2018 (in billion USD). 27
Table 4 Evolution of the Trade of the OIC Member States between 2016 and 2018 in billion USD and in%
30
Table 5 Exporting Countries in 2018 in millions 34
Table 6 Top 10 Intra‐OIC Exporters of Various Manufactured Products in 2018 37
Table 7 Top 10 Intra‐OIC Food Exporters in 2018 38
Table 8 Top 10 Intra‐OIC Fuel Exporters Minerals in 2018 39
Table 9 Top 10 Intra‐OIC Exporters of Machinery and Transport Equipment in 2018 40
Table 10 Top 10 Intra‐OIC Exporters of Chemicals in 2018 41
Table 11 Top 10 Intra‐OIC Exporters of Inedible Raw Materials in 2018 42
Table 12 Top 10 Intra‐OIC Exporters of Non‐Fuel Products in 2018 43
Table 13 Structure of intra‐OIC exports between 2011 and 2018 in% 46
Table 14 Intra‐OIC importing countries in 2018 in million US$ 48
Table 15 TOP 10 of intra‐OIC importers of various manufactured products in 2018 49
Table 16 TOP 10 of intra‐OIC importers of mineral fuels in 2018 50
Table 17 TOP 10 of intra‐OIC food importers in 2018 50
Table 18 TOP 10 intra‐OIC importers of machinery and transport equipment in 2018 51
Table 19 TOP 10 of intra‐OIC importers of chemicals in 2018 52
Table 20 TOP 10 of intra‐OIC importers of inedible raw materials in 2018 54
Table 21 TOP 10 of intra‐OIC importers of non‐fuel products in 2018 53
Table 22 Structure of intra‐OIC imports (2011‐2018 average) in% 54
Table 23 Intra‐OIC trade balance by area in 2018 and in Millions of US Dollars and in% 55
Table 24 Intra‐OIC trade balance in 2018 in US $ millions and in% 57
Table 25 Intra‐OIC Net trade in billion US $ in 2018 59
Table 26 Geographical distribution of Intra‐OIC exports of the AMU countries in 2018 (in %) 60
Table 27 Geographical distribution of Intra‐OIC exports of GCC countries in 2018 (in%) 60
Table 28 Geographic distribution of Intra‐OIC exports of Middle Eastern countries in 2018 (in %) 61
Table 29 Geographic distribution of Intra‐OIC exports of Asian countries in 2018 (in%) 62
Table 30 Geographic distribution of Intra‐OIC exports of Sub‐Saharan African countries in 2018 (in%)
63
Table 31 Degree of integration into intra‐OIC trade in 2018 64
Table 32 Main players in intra‐OIC trade in 2018 (in billions of US $) 66
Table 33 Top 10 intra‐OIC suppliers in 2018 in billion US $ 67
Table 34 Top 10 intra‐OIC client countries in 2018 in billion US$ 68
Table 35 Evolution of the volume of intra‐regional trade of the OIC Member States between 2014 and 2018 (in million dollars and in%).
69
Table 36 Evolution of the share of intra‐regional trade in intra‐OIC trade between 2014 and 2018 in %.
70
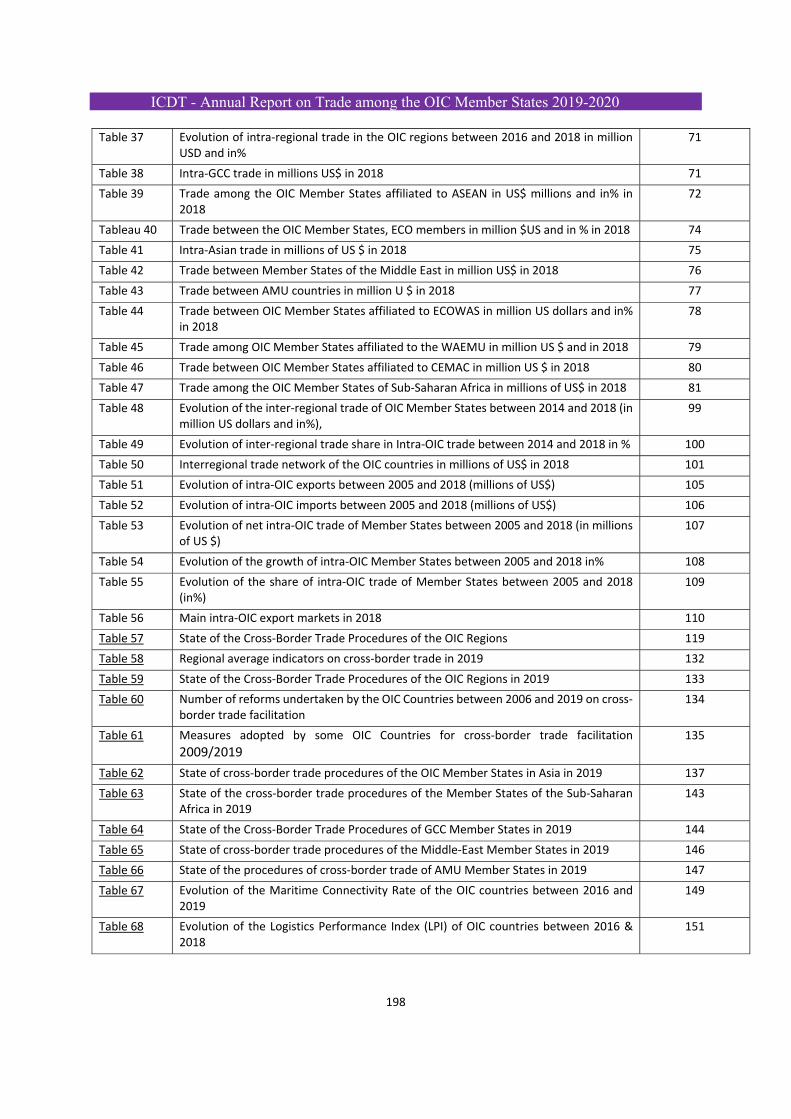
ICDT - Annual Report on Trade among the OIC Member States 2019-2020
198
Table 37 Evolution of intra‐regional trade in the OIC regions between 2016 and 2018 in million USD and in%
71
Table 38 Intra‐GCC trade in millions US$ in 2018 71
Table 39 Trade among the OIC Member States affiliated to ASEAN in US$ millions and in% in 2018
72
Tableau 40 Trade between the OIC Member States, ECO members in million $US and in % in 2018 74
Table 41 Intra‐Asian trade in millions of US $ in 2018 75
Table 42 Trade between Member States of the Middle East in million US$ in 2018 76
Table 43 Trade between AMU countries in million U $ in 2018 77
Table 44 Trade between OIC Member States affiliated to ECOWAS in million US dollars and in% in 2018
78
Table 45 Trade among OIC Member States affiliated to the WAEMU in million US $ and in 2018 79
Table 46 Trade between OIC Member States affiliated to CEMAC in million US $ in 2018 80
Table 47 Trade among the OIC Member States of Sub‐Saharan Africa in millions of US$ in 2018 81
Table 48 Evolution of the inter‐regional trade of OIC Member States between 2014 and 2018 (in million US dollars and in%),
99
Table 49 Evolution of inter‐regional trade share in Intra‐OIC trade between 2014 and 2018 in % 100
Table 50 Interregional trade network of the OIC countries in millions of US$ in 2018 101
Table 51 Evolution of intra‐OIC exports between 2005 and 2018 (millions of US$) 105
Table 52 Evolution of intra‐OIC imports between 2005 and 2018 (millions of US$) 106
Table 53 Evolution of net intra‐OIC trade of Member States between 2005 and 2018 (in millions of US $)
107
Table 54 Evolution of the growth of intra‐OIC Member States between 2005 and 2018 in% 108
Table 55 Evolution of the share of intra‐OIC trade of Member States between 2005 and 2018 (in%)
109
Table 56 Main intra‐OIC export markets in 2018 110
Table 57 State of the Cross‐Border Trade Procedures of the OIC Regions 119
Table 58 Regional average indicators on cross‐border trade in 2019 132
Table 59 State of the Cross‐Border Trade Procedures of the OIC Regions in 2019 133
Table 60 Number of reforms undertaken by the OIC Countries between 2006 and 2019 on cross‐border trade facilitation
134
Table 61 Measures adopted by some OIC Countries for cross‐border trade facilitation
2009/2019 135
Table 62 State of cross‐border trade procedures of the OIC Member States in Asia in 2019 137
Table 63 State of the cross‐border trade procedures of the Member States of the Sub‐Saharan Africa in 2019
143
Table 64 State of the Cross‐Border Trade Procedures of GCC Member States in 2019 144
Table 65 State of cross‐border trade procedures of the Middle‐East Member States in 2019 146
Table 66 State of the procedures of cross‐border trade of AMU Member States in 2019 147
Table 67 Evolution of the Maritime Connectivity Rate of the OIC countries between 2016 and 2019
149
Table 68 Evolution of the Logistics Performance Index (LPI) of OIC countries between 2016 & 2018
151
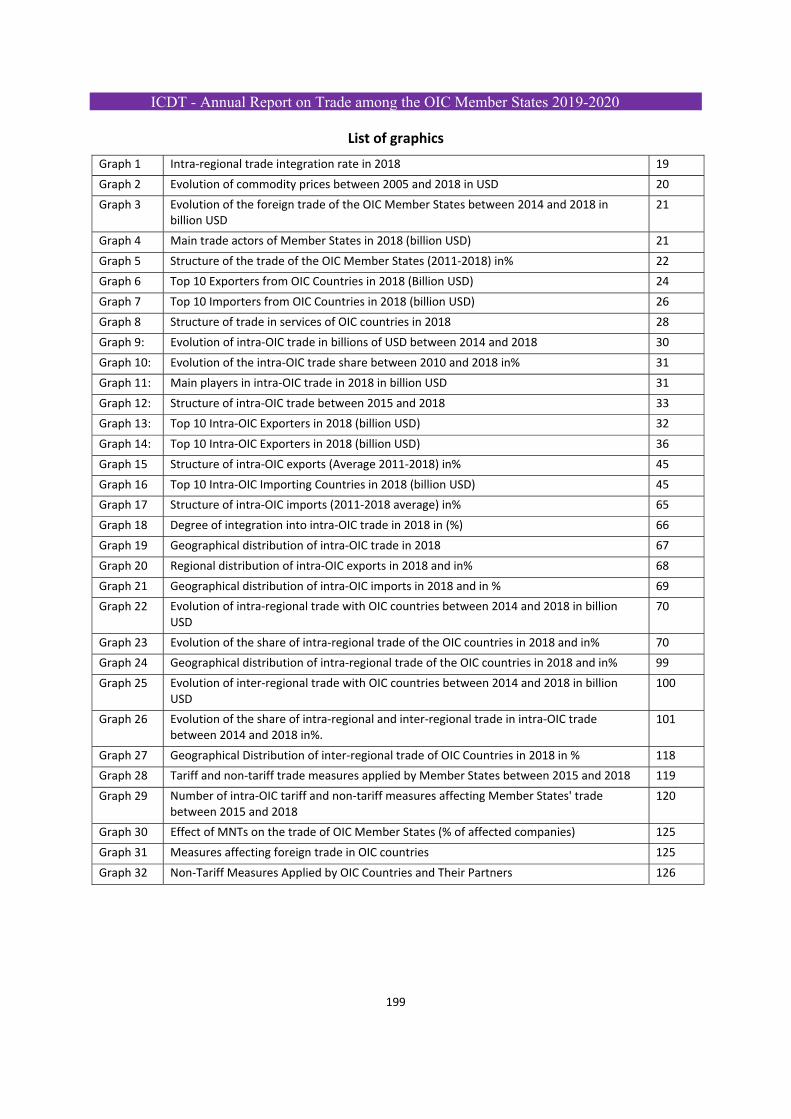
ICDT - Annual Report on Trade among the OIC Member States 2019-2020
199
List of graphics
Graph 1 Intra‐regional trade integration rate in 2018 19
Graph 2 Evolution of commodity prices between 2005 and 2018 in USD 20
Graph 3 Evolution of the foreign trade of the OIC Member States between 2014 and 2018 in billion USD
21
Graph 4 Main trade actors of Member States in 2018 (billion USD) 21
Graph 5 Structure of the trade of the OIC Member States (2011‐2018) in% 22
Graph 6 Top 10 Exporters from OIC Countries in 2018 (Billion USD) 24
Graph 7 Top 10 Importers from OIC Countries in 2018 (billion USD) 26
Graph 8 Structure of trade in services of OIC countries in 2018 28
Graph 9: Evolution of intra‐OIC trade in billions of USD between 2014 and 2018 30
Graph 10: Evolution of the intra‐OIC trade share between 2010 and 2018 in% 31
Graph 11: Main players in intra‐OIC trade in 2018 in billion USD 31
Graph 12: Structure of intra‐OIC trade between 2015 and 2018 33
Graph 13: Top 10 Intra‐OIC Exporters in 2018 (billion USD) 32
Graph 14: Top 10 Intra‐OIC Exporters in 2018 (billion USD) 36
Graph 15 Structure of intra‐OIC exports (Average 2011‐2018) in% 45
Graph 16 Top 10 Intra‐OIC Importing Countries in 2018 (billion USD) 45
Graph 17 Structure of intra‐OIC imports (2011‐2018 average) in% 65
Graph 18 Degree of integration into intra‐OIC trade in 2018 in (%) 66
Graph 19 Geographical distribution of intra‐OIC trade in 2018 67
Graph 20 Regional distribution of intra‐OIC exports in 2018 and in% 68
Graph 21 Geographical distribution of intra‐OIC imports in 2018 and in % 69
Graph 22 Evolution of intra‐regional trade with OIC countries between 2014 and 2018 in billion USD
70
Graph 23 Evolution of the share of intra‐regional trade of the OIC countries in 2018 and in% 70
Graph 24 Geographical distribution of intra‐regional trade of the OIC countries in 2018 and in% 99
Graph 25 Evolution of inter‐regional trade with OIC countries between 2014 and 2018 in billion USD
100
Graph 26 Evolution of the share of intra‐regional and inter‐regional trade in intra‐OIC trade between 2014 and 2018 in%.
101
Graph 27 Geographical Distribution of inter‐regional trade of OIC Countries in 2018 in % 118
Graph 28 Tariff and non‐tariff trade measures applied by Member States between 2015 and 2018 119
Graph 29 Number of intra‐OIC tariff and non‐tariff measures affecting Member States' trade between 2015 and 2018
120
Graph 30 Effect of MNTs on the trade of OIC Member States (% of affected companies) 125
Graph 31 Measures affecting foreign trade in OIC countries 125
Graph 32 Non‐Tariff Measures Applied by OIC Countries and Their Partners 126
ICDT - Annual Report on Trade among the OIC Member States 2019-2020
200
BIBLIOGRAPHICAL REFERENCES
ICDT - Annual Report on Trade among the OIC Member States 2019-2020
201
Bibliographical references
Documentary references and webography
- Bank of Tanzania: intra‐SADC Trade in goods and services (including assessing the condition for the dynamism of intra‐regional trade, 62p.
- Centre du Commerce International : Burkina Faso, perspectives des entreprises : Série de l’ITC sur les Mesures Non Tarifaires, 2012, 93p.
- Centre du Commerce International : Côte d’Ivoire, perspectives des entreprises : Série de l’ITC sur les Mesures Non Tarifaires, 2014, 124p.
- Centre du Commerce International : Maroc, perspectives des entreprises : Série de l’ITC sur les Mesures Non Tarifaires, 2012, 107p.
- Centre du Commerce International : Sénégal, perspectives des entreprises : Série de l’ITC sur les Mesures Non Tarifaires, 2014, 115p.
- Centre du Commerce International : Tunisie, perspectives des entreprises : Série de l’ITC sur les Mesures Non Tarifaires, 2014, 130p.
- Centre du Commerce International : les Comores, perspectives des entreprises : Série de l’ITC sur les Mesures Non Tarifaires, 2018, 62p.
- Centre Islamique pour le Développement du Commerce: Rapport annuel sur le commerce intra‐OCI, 2005‐2015, 138p/173p.
- Centre Islamique pour le Développement du Commerce: Rapport consolidé de suivi de mise en œuvre du Programme Exécutif la feuille de route pour réaliser les objectifs du commerce intra‐OCI (2009‐2015), mars 2015, 16p.
- Rapports du Sous‐Comité sur le Commerce et de l’Investissement du CIDC, Mars 2016 et Mars 2017, 50p.
- Dr Debapriya Bhattacharya, NTMs and LDCs, ITC Seminar on Non‐Tariff Measures: new challenges and road ahead, February 2012, PowerPoint presentation 21p.
- Economic Commission for Africa and African Union: Boosting intra‐african trade, October 2011, 33p.
- Euler Hermes: Mahmoud Islam, Ana Boata, Ludovic Subran, Francois De Paniss Passis: Global Trade Report: The show must go on; 14p.
- Fonds Monétaire International : Perspectives de l’économie mondiale, Octobre 2016, 289p.
- Fonds Monétaire International : Perspectives de l’économie mondiale, Avril 2017, 258p.
- General Organization for Export and Import Control (GOEIC), the Ministry of Industry and Foreign Trade in Egypt by Hoda El‐Enbaby, Rana Hendy and Chahir Zaki, Do Product Standards Matter for Margins of Trade in Egypt? Evidence from Firm‐Level Data, June 2014, 37p.
ICDT - Annual Report on Trade among the OIC Member States 2019-2020
202
- IMF: Wold Economic Outlook Update, June 2020, 20p.
- International Trade Center, Anders Aeroe, ITC Support to Landlocked Developing Countries: Brainstorming Meeting on the Priorities of a New Development Agenda for the Landlocked Developing Countries, 21 March 2013, ppt, 17p.
- International Trade Center, Mondher MIMOUNI: Firms surveys to assess NTMs restrictiveness, Seminar on NTBs among the OIC African Countries, November 2014, Casablanca, ppt, 93p.
- International Trade Center, Ursula Hermelink: The role of trade facilitation in addressing non‐tariff measures, December 01, 2013, 58p.
- International Trade Center: League of Arab States’ Regional Integration: Opportunities for trade and employment, executive summary, 2012, 20p.
- International Trade Center: More than a third of Indonesia’s exporters affected by non‐tariff measures, PRESS RELEASE: 27.11.2013, 2p.
- International Trade Centre: Jordan, Company perspectives, An ITC Series on non‐tariff measures;2018, 66p.
- International Trade Centre: Kyrgyzstan, Company perspectives, An ITC Series on non‐tariff measures;2018, 74p.
- International Trade Centre: Samidh Shrestha; The Private Sector Perspectives on NTMs, ITC’s on NTMs,Subregional workshop on non‐tariff measures in Azerbaijan and North and Central Asia, 9 December 2019, 75p.
- Ministry of Trade of the Republic of Turkey: Economic outlook, 22 August 2019, 63p.
- MO Ibrahim Foundation 2014: Regional Integration: Uniting to compete, facts and figures, 40p.
- OECD and WTO: Aid for Trade: case story of the International Trade Centre: Aid for Trade and export performance: A business perspective – Uganda; 2011, 29p.
- World Tariff Profiles 2016 explores changes impacting international trade, 230p
- Said Jafarli, NTM Data Collection in Azerbaijan: Process and Results; Subregional workshop on non‐tariff measures in Azerbaijan and North and Central Asia, 9 December 2019, 21p.
- World Trade Organisation, World Trade Report 2016: Levelling the trading field for SMEs, 177 p
- World Trade Organisation: World Trade Report 2015: Speeding up trade: benefits and challenges of implementing the WTO Trade Facilitation Agreement, 158p
- The Heritage Foundation: 2015 Index of Economic Freedom, Promoting Economic Opportunity and Prosperity, 508p.
- UNCTAD, Sudip Ranjan Basu, Hiroaki Kuwahara, Fabien Dumesnil: Policy issues in international trade and commodities, Study series no. 52, Evolution of non‐tariff measures: Emerging cases from selected developing countries, 2012, 39p.
ICDT - Annual Report on Trade among the OIC Member States 2019-2020
203
- UNCTAD: Classification of Non‐Tariff Measures, 2009, 30p.
- UNCTAD: The future international agenda on Non‐Tariff Measures, April 2012, 3p.
- UNCTAD: Ralph Peters, the rise of NTMs, implications for trade and sustainable development; Subregional workshop on non‐tariff measures in Azerbaijan and North and Central Asia, 9 December 2019, 23p.
- UNECE‐ITC: Regulatory and procedural barriers to trade in Kazakhstan: need assessment; 2014, 245p.
- United Nations ESCAP: addressing Non‐Tariff Measures in ASEAN, O. Pasadilla, Asia‐Pacific Research and Training Network on Trade, Working Paper, NO. 130 | September 2013, 63p.
- US Trade Representative, 2014 Report on Technical Barriers to Trade, April 2014, 107p.
- World Bank: 2014Doing Business report: Understanding Regulations for Small and Medium‐Size Enterprises, 29 October 2013, 316p.
- World Bank: 2015Doing Business report: Going beyond Efficiency, 29 October 2014, 331p.
- World Bank Group: Doing Business 2019: Training for report, 311 p.
- World Economic Forum: The Global Competitiveness Report, 2015.2016, 403p.
- WTO: Committee on Technical Barriers to Trade, Nineteenth Annual Review of the implementation and operation on the TBT Agreements, 7 March 2014, 27p.
- WTO Report 2018: Chapter II: Highlights of world trade and world trade statistics reviews 2019, 10p.
- WTO Report 2018: world trade statistics reviews 2019, 178p.
- WTO: Simon Padilla, Introduction to the TBT and SPS Agreements, Subregional workshop on non‐tariff measures in Azerbaijan and North and Central Asia, 9 December 2019, 33p.
ICDT - Annual Report on Trade among the OIC Member States 2019-2020
204
STATISTICAL ANNEXES
- Bases de données du CIDC, 2005‐2015
- COMTRADE online data 2016‐2017.
- Heritage Freedom index, online data 2016
- IMF Data on Trade Statistics (CD Roms December 2016 et February 2017).
- ITC online data (trademap) 2016‐2017.
- National data from the ICDT questionnaire 2015.
- UNCTAD trade statistics online data 2016‐2017.
- World Integrated Trade Statistics: online website 2016‐2017.
- World Bank, 2016‐2017
- WTO online data on services 2016‐2017
- Global Trade Alert online 2016‐2017.
- World Economic Forum Statistics online 2016‐2017.
ICDT - Annual Report on Trade among the OIC Member States 2019-2020
205
STATISTICAL ANNEXES (CD‐ROM)
Related Documents