
Welcome message from author
This document is posted to help you gain knowledge. Please leave a comment to let me know what you think about it! Share it to your friends and learn new things together.
Transcript

²

FUSION TECHNOLOGY
Annual Report of the Association EURATOM-CEA
2004 (full report)
Compiled by : Ph. MAGAUD and F. LE VAGUERES
ASSOCIATION EURATOM-CEA DSM/DRFC
CEA CADARACHE 13108 Saint-Paul-Lez-Durance (France)
Tél. : 33 - 4 42 25 46 59 Fax : 33 - 4 42 25 64 21 e-mail : [email protected] Web : http://www-fusion-magnetique.cea.fr
This report is also available on-line at : http://www-fusion-magnetique.cea.fr
Cover : The Articulated Inspection Arm (AIA), an articulated multipurpose tool to demonstrate the feasibility of close inspection of the ITER Divertor cassettes and Vacuum Vessel first wall. The AIA is able to operate under temperature
(120°C) and vacuum (10-6 Pa).

- I -
CONTENTS
INTRODUCTION ................................................................................................................................ 1
EFDA TECHNOLOGY PROGRAMME ........................................................................ 3
Physics Integration Plasma Edge TW3-TPP-ERDIAG Evaluation of Laser Ablation Optical Emission Spectroscopy (LA-OES) method for graphite co-deposited layer characterization ....................................... 5 Heating and Current Drive CEFDA01-645 TW2-TPHN-NBDES1: Support to neutral beam physics and testing 1 ................ 9 CEFDA03-1129 TW3-TPHI-ICRDES1: ITER ICRF Antenna and matching system design .......... 13 Diagnostics CEFDA02-1003 TW2-TPDS-DIASUP4 and TW3-TPDS-DIASUP1: CEFDA03-1111 Support to the ITER diagnostic design .................................................................. 17 TW2-TPDS-DIADEV-D02 Development of diagnostic components - First mirror study ................................. 19
Vessel-In Vessel Vessel-Blanket and Materials CEFDA03-1067 TW3-TVM-MDB: Rules for design, fabrication and inspection Establishment and Operation of a Material Database ............................................ 23 CEFDA03-1091 TW4-TVM-LIP: Rules for design, fabrication and inspection
Modification of ITER materials documents and assessment of material data for licensing TBM’s design rules ................................................. 25
TW0-T508/05 Development of Be/CuCrZr brazing techniques .................................................... 27 TW1-TVV-HIP Improvement of HIP Fabrication techniques ......................................................... 31 TW2-TVV-ROBOT Dynamic test rig for Intersector Welding Robot (IWR) for VV sector field joining ..................................................................................... 33 TW3-TVM-JOINT Characterization of the CuCrZr/SS junction strength for different blanket manufacturing conditions ..................................................... 35 TW3-TVV-DISFREE Further development of the hybrid MIG/Laser welding technique for VV sector field joining ..................................................................................... 39
- II -
TW3-TVV-ROBASS Long detection range seam tracker ........................................................................ 43 TW4-TVV-OSWELD Qualification of multiple phased array UT for one sided welds during VV manufacture ......................................................................................... 45 Plasma Facing Components CEFDA01-585 TW1-TVP-TESTAN: Monitoring and analysis of thermal fatigue testing of divertor prototypes - 200 kW electron beam gun test ........................................ 49 CEFDA02-583 TW1-TVV-DES: Destructive examination of primary first wall panels and mock-ups ......................................................................................................... 55 CEFDA03-1029 TW3-TVB-JOINOP: Optimization of Be/Cu alloy joints for primary first wall panels .................................................................................. 59 CEFDA03-1051 TW4-TVD-ACCEPT: Study on acceptance criteria for the ITER divertor vertical target ...................................................................... 63 CEFDA03-1077 TW3-TVB-INMOCK: Fabrication of primary first wall mock-ups for in-pile experiments ........................................................................................... 67 TW0-T438-01 Development and testing of time resolved erosion detecting techniques .............. 71 Remote Handling TW4-TVR-AIA Articulated Inspection Arm (AIA) ......................................................................... 73 TW4-TVR-Radtol Radiation tolerance assessment of standard electronic components for remote handling ............................................................................................... 77 TW4-TVR-WHMAN Development of a water hydraulic manipulator ..................................................... 83
Magnet Structure CEFDA03-1015 TW2-TMSM-COOLINL: Mock-ups for the TF and CS Terminal regions and Cooling Inlets .................................................................................................. 87 CEFDA03-1120 TW3-TMSC-ASTEST: Tests of advanced Nb3Sn strands Extensive characterization of industrial advanced Nb3Sn strands developed for ITER TF coils system ..................................................................... 91 CEFDA04-1127 TW4-TMSC-SAMAN1: Manufacture of sub-size samples ................................... 93 CEFDA04-1134 TW4-TMSC-BARBEN: Bending strain effects of single strands Study of bending strain effect on critical properties of Nb3Sn strands jacketed with stainless steel for various bending amplitudes and temperatures .... 95 TW1-TMC-CODES Design and Interpretation Codes Determination of thermohydraulic properties of cable-in-conduit conductors with a central channel ............................................................................................ 99 TW1-TMS-PFCITE Poloidal Field Conductor Insert (PFCI) ................................................................. 103 TW2-TMST-TOSKA TFMC testing with the LCT coil ........................................................................... 105 TW3-TMSC-ELRES Experimental assessment of the effect of electrical resistances on the V-I characteristics of superconductive cables ............................................. 109
- III -
Tritium Breeding and Materials Breeding Blanket Helium Cooled Pebble Bed (HCPB) blanket TW2-TTBB-002b-D01 Blanket manufacturing techniques - First wall HIPping with open channels ........ 113 TW4-TTBB-005-D01 HCPB breeder and neutrons multiplier materials Procurement and quality control of Li2TiO3 pebbles ............................................. 115 Helium Cooled Lithium Lead (HCLL) blanket TW2-TTBC-001-D01 Helium Cooled Lithium Lead - TBM design, integration and analysis Blanket system design and analysis - Integration and testing in ITER .................. 117 TW2-TTBC-002-D01 Blanket manufacturing techniques Fabrication processes for HCLL and HCPB TBMs ............................................... 123 TW2-TTBC-002-D03 Testing of small-scale mocks-ups to qualify manufacturing technologies ............ 127 TW2-TTBC-005-D01 Helium Cooled Lithium Lead - Safety and Licensing Test Blanket Module (TBM) accidental safety study ............................................ 129 TW4-TTBC-001-D01 TBM design, integration and analysis - Testing programme
and engineering design of the first HCLL TBM for ITER H-H phase .................. 133 Structural materials development Reduced Activation Ferritic Martensitic (RAFM) steels TW2-TTMS-001b-D02 Irradiation performance - Neutron irradiation to 70 dpa at 325°C and PIE ........... 135 TW2-TTMS-004a-D04 Eurofer : Fusion welds development - Evaluation of a welding process adapted to the Test Blanket Module’s geometry : Assembly of the horizontal cooling plates with the continuous wave YAG laser welding process .................. 139 TW2-TTMS-004b-D01 Tubing process qualification - Advanced process development and testing for the production of TBM's cooling channels ...................................................... 143 TW2-TTMS-004b-D02 Qualification of fabrication processes - Processing of high quality welds according to TBM design ...................................................................................... 145 TW2-TTMS-005b-D03 Rules for design, fabrication and inspection Fracture Mechanics Assessments of TBM's .......................................................... 151 TW4-TTMS-005-D01 Rules for design, fabrication and inspection Update Data Base and Appendix A of DEMO-SDC ............................................. 155 TW4-TTMS-007-D02 Modelisation of irradiation effects Ab-initio defect energy calculations in the Fe-He system ..................................... 157 Advanced materials TW3-TTMA-001-D04 SiC/SiC ceramic composites - Divertor and Plasma Facing Materials .................. 161 TW3-TTMA-002-D04 TW4-TTMA-001-D04 Modelling of the mechanical behaviour of advanced 3D SiCf/SiC composite ...... 163 Neutron source TW4-TTMI-001-D01 IFMIF accelerator facilities - Accelerator system design ...................................... 167
- IV -
Safety and Environment SEA5-1 Validation of computer codes and models ............................................................. 171 TW1-TSW-002 Waste and decommissioning strategy .................................................................... 175 TW3-TSS-SEA5.3 Ice formation on cryogenic surfaces ...................................................................... 181 TW3-TSW-002 Assessment of radioactive waste in ITER hot cell facility .................................... 183 TW4-TSS-SEA5.5-D02&D05 Validation of the PAXITR and PACTITER code against fusion-specific experiments ....................................................................... 187 TW4-TSS-SEA5.5-D11 Validation of the PACTITER code against fusion-specific experiments Development of the PACTITER code ................................................................... 191
System Studies Power Plant Conceptual Studies (PPCS) TW2-TRP-PPCS15-D03 Waste management strategy on mode A and B ..................................................... 193 TW4-TRP-002-D02b Conceptual design of a HCLL reactor - Tritium control & management analysis, thermo-hydraulic and thermo-mechanical analyses ........... 197 TW4-TRP-002-D04 Conceptual design of a HCLL reactor - Design Integration .................................. 201
ITER Site Preparation European ITER Site Studies (EISS) CEFDA03-1069 European ITER Site Studies (EISS) CEFDA03-1082 TW3-TES-EISSg1: EISS 3 generic tasks CEA CEFDA04-1161 TW3-TES-EISS2c: EISS 3 stage 2 TW4-TES-COLABA TW3-TES-EISS4F: European ITER site study 4 – Cadarache TW4-TES-COLABA: Cadarache site for ITER - Collaboration with Local Authorities .................................................................... 207 Site and Plant Layout CEFDA03-1083 TW3-TEP-CRYO2: Design of ITER cryoplant/cryo-distribution system (auxilliary coldboxes, cryoline…) ......................................................................... 211
Design Support and Procurement Design Support CEFDA03-1098 TW3-TDS-MAGCEA: Detailed engineering and manufacturing studies of the ITER magnet system: Poloidal Field (PF) coil windings and cold test assessment ......... 215
- V -
JET Technology Physics Integration Heating Systems CEFDA03-1031 JW3-EP-ICRH and JW4-EP-ICRH: Contribution to ICRH CEFDA04-1146 components antenna limiter ................................................................................... 219 Diagnostics CEFDA03-1044 JW3-EP-IRV: Diagnostics enhancement - Wide angle IR endoscope ................... 221 Vessel-In Vessel Plasma Facing Components JW0-FT-3.1 Internal PFC components behaviour and modelling .............................................. 223 Safety and Environment JW3-FT-2.15-D01 Detritiation of soft housekeeping materials (mainly plastics) ................................ 227 JW3-FT-2.15-D02 Detritiation of vacuum oil and organic liquids ...................................................... 231 JW4-FT-3.19 Laser decontamination/Tritium removal - Studies on Tokamak wall surfaces decontamination by pulsed repetition rate lasers ................................................... 235
Heating Systems Technology Project CEFDA03-1047 TW3-THHN-IITF1: The first ITER NB injector and the ITER NB test facility: design ........................................................................... 239 CEFDA04-1140 TW4-THHN-ADSD2: Neutral beam development for EFDA extension .............. 243 TW3-THHE-CCGDS1 Coaxial cavity gyrotron and test facility - Design, support to the industrial development and preparation of the technical specifications ................................ 247 TW3-THHI-GTFDS1 Fusion diacrode, IC RF generator, IC power supply and IC test facility - Design, support to the industrial development and preparation of the technical specifications ...................................................... 249
UNDERLYING TECHNOLOGY PROGRAMME ................................................ 251
Vessel-In Vessel Plasma Facing Components UT-VIV/PFC-Damage Study of damage mechanisms in plasma facing components ................................ 253 UT-VIV/PFC-HIP Improvement of reliability, performance and industrial relevancy of HIP processes for PFC components .................................................................. 255
- VI -
UT-VIV/PFC-NanoSic Nanocrystalline silicon carbide (SiC) Optimization of the preparation of NanoSiC ......................................................... 259 UT-VIV/PFC-Pyro Application of a tricolour pyroreflectometer to plasma facing components in-situ infrared monitoring ..................................................................................... 263 Remote Handling UT-VIV/AM-ECIr Remote handling techniques - Radiation effects on electronic components .......... 267 UT-VIV/AM-Hydro Technologies and control for remote handling systems ......................................... 273 UT-VIV/AM-Vacuum Technologies for vacuum and temperature and magnetic field conditions for remote handling systems .................................................................................. 275
Tritium Breeding and Materials Breeding Blanket UT-TBM/BB-He Helium components technology - Problems and outline of solutions .................... 279 Materials Development Structural Materials UT-TBM/MAT-LAM/Opti Development of new RAFM steels with regard to creep properties ...................... 283 UT-TBM/MAT-Modpulse Pulsed irradiation of the martensitic alloy Eurofer Irradiations by krypton ions at 350 and 550°C at high flux during short time ....... 287
Safety and Environment UT-S&E-LASER/DEC Laser decontamination/Tritium removal – Modelling of lasers surface heating .... 291 UT-S&E-LiPbwater Recalculation of the LIFUS experiment (interaction between lithium-lead and water) with the 3D version of SIMMER ......................................................... 295
APPENDIX 1 : Directions contribution to the fusion programme ........................ 299
APPENDIX 2 : Allocations of tasks .......................................................................................... 303
APPENDIX 3 : Reports and publications .............................................................................. 309
APPENDIX 4 : CEA tasks in alphabetical order .............................................................. 317
APPENDIX 5 : CEA sites ................................................................................................................. 321
- 1 -
INTRODUCTION
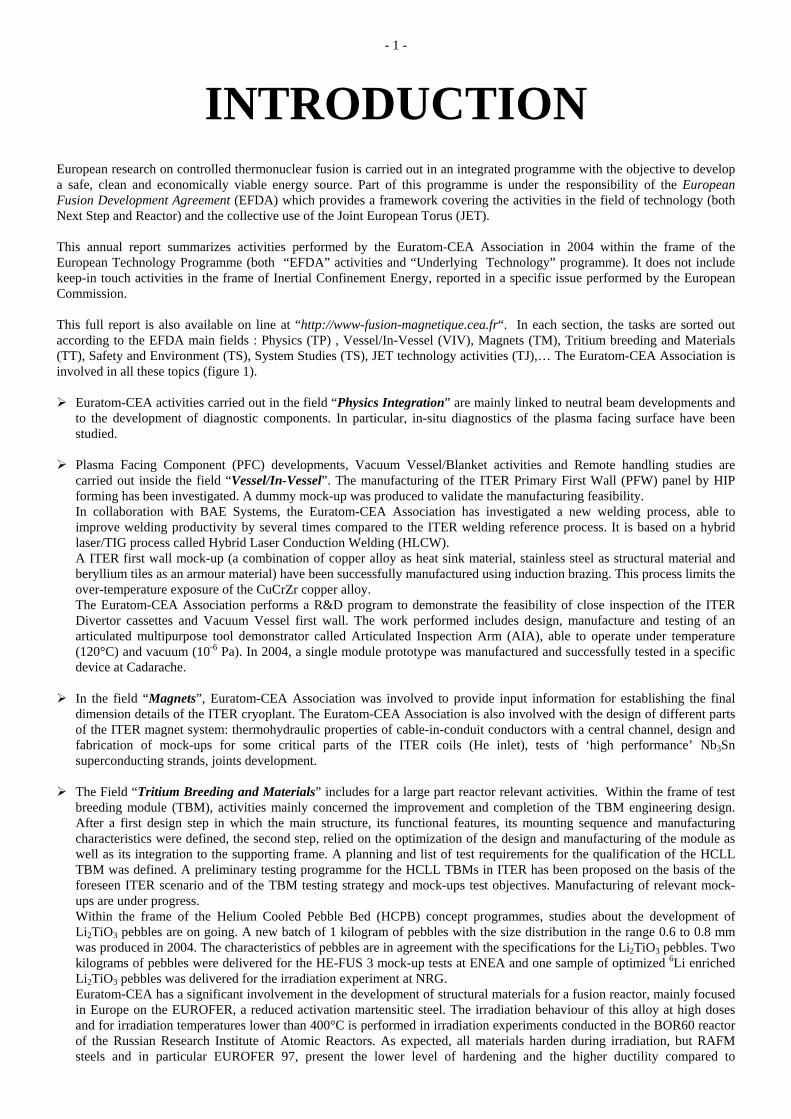
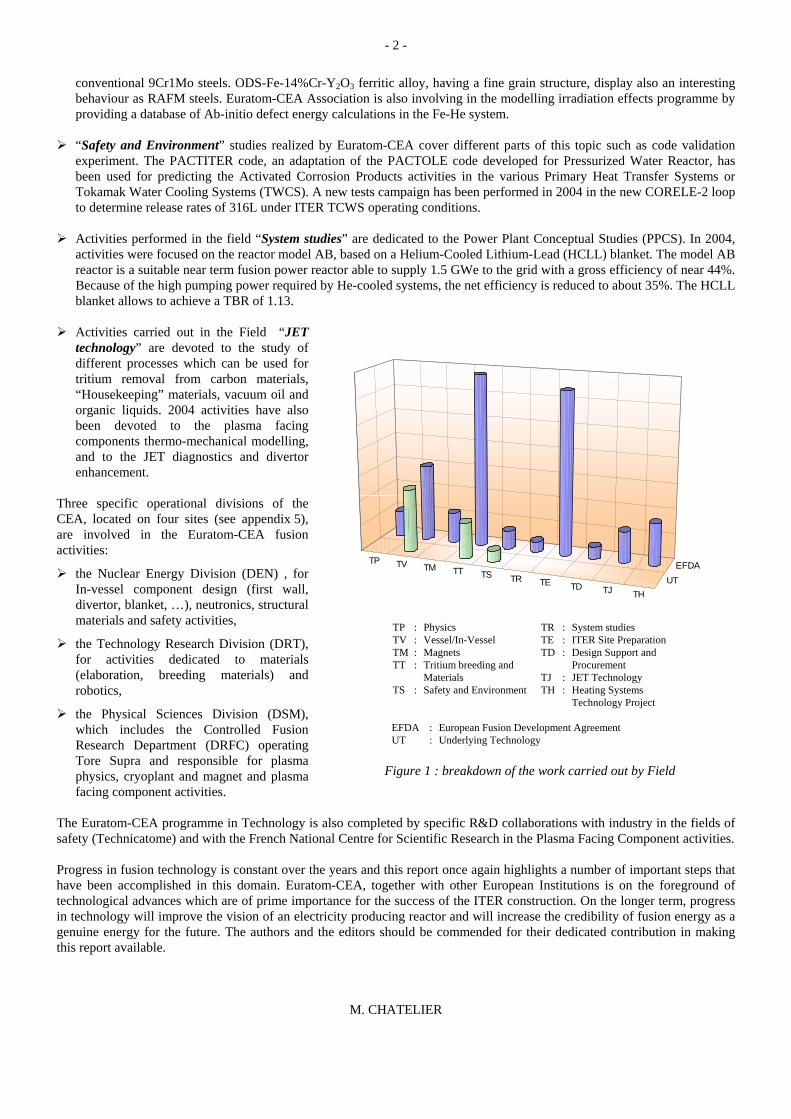
European research on controlled thermonuclear fusion is carried out in an integrated programme with the objective to develop a safe, clean and economically viable energy source. Part of this programme is under the responsibility of the European Fusion Development Agreement (EFDA) which provides a framework covering the activities in the field of technology (both Next Step and Reactor) and the collective use of the Joint European Torus (JET). This annual report summarizes activities performed by the Euratom-CEA Association in 2004 within the frame of the European Technology Programme (both “EFDA” activities and “Underlying Technology” programme). It does not include keep-in touch activities in the frame of Inertial Confinement Energy, reported in a specific issue performed by the European Commission. This full report is also available on line at “http://www-fusion-magnetique.cea.fr“. In each section, the tasks are sorted out according to the EFDA main fields : Physics (TP) , Vessel/In-Vessel (VIV), Magnets (TM), Tritium breeding and Materials (TT), Safety and Environment (TS), System Studies (TS), JET technology activities (TJ),… The Euratom-CEA Association is involved in all these topics (figure 1). Euratom-CEA activities carried out in the field “Physics Integration” are mainly linked to neutral beam developments and
to the development of diagnostic components. In particular, in-situ diagnostics of the plasma facing surface have been studied.
Plasma Facing Component (PFC) developments, Vacuum Vessel/Blanket activities and Remote handling studies are
carried out inside the field “Vessel/In-Vessel”. The manufacturing of the ITER Primary First Wall (PFW) panel by HIP forming has been investigated. A dummy mock-up was produced to validate the manufacturing feasibility. In collaboration with BAE Systems, the Euratom-CEA Association has investigated a new welding process, able to improve welding productivity by several times compared to the ITER welding reference process. It is based on a hybrid laser/TIG process called Hybrid Laser Conduction Welding (HLCW). A ITER first wall mock-up (a combination of copper alloy as heat sink material, stainless steel as structural material and beryllium tiles as an armour material) have been successfully manufactured using induction brazing. This process limits the over-temperature exposure of the CuCrZr copper alloy. The Euratom-CEA Association performs a R&D program to demonstrate the feasibility of close inspection of the ITER Divertor cassettes and Vacuum Vessel first wall. The work performed includes design, manufacture and testing of an articulated multipurpose tool demonstrator called Articulated Inspection Arm (AIA), able to operate under temperature (120°C) and vacuum (10-6 Pa). In 2004, a single module prototype was manufactured and successfully tested in a specific device at Cadarache.
In the field “Magnets”, Euratom-CEA Association was involved to provide input information for establishing the final
dimension details of the ITER cryoplant. The Euratom-CEA Association is also involved with the design of different parts of the ITER magnet system: thermohydraulic properties of cable-in-conduit conductors with a central channel, design and fabrication of mock-ups for some critical parts of the ITER coils (He inlet), tests of ‘high performance’ Nb3Sn superconducting strands, joints development.
The Field “Tritium Breeding and Materials” includes for a large part reactor relevant activities. Within the frame of test
breeding module (TBM), activities mainly concerned the improvement and completion of the TBM engineering design. After a first design step in which the main structure, its functional features, its mounting sequence and manufacturing characteristics were defined, the second step, relied on the optimization of the design and manufacturing of the module as well as its integration to the supporting frame. A planning and list of test requirements for the qualification of the HCLL TBM was defined. A preliminary testing programme for the HCLL TBMs in ITER has been proposed on the basis of the foreseen ITER scenario and of the TBM testing strategy and mock-ups test objectives. Manufacturing of relevant mock-ups are under progress. Within the frame of the Helium Cooled Pebble Bed (HCPB) concept programmes, studies about the development of Li2TiO3 pebbles are on going. A new batch of 1 kilogram of pebbles with the size distribution in the range 0.6 to 0.8 mm was produced in 2004. The characteristics of pebbles are in agreement with the specifications for the Li2TiO3 pebbles. Two kilograms of pebbles were delivered for the HE-FUS 3 mock-up tests at ENEA and one sample of optimized 6Li enriched Li2TiO3 pebbles was delivered for the irradiation experiment at NRG. Euratom-CEA has a significant involvement in the development of structural materials for a fusion reactor, mainly focused in Europe on the EUROFER, a reduced activation martensitic steel. The irradiation behaviour of this alloy at high doses and for irradiation temperatures lower than 400°C is performed in irradiation experiments conducted in the BOR60 reactor of the Russian Research Institute of Atomic Reactors. As expected, all materials harden during irradiation, but RAFM steels and in particular EUROFER 97, present the lower level of hardening and the higher ductility compared to
- 2 -
conventional 9Cr1Mo steels. ODS-Fe-14%Cr-Y2O3 ferritic alloy, having a fine grain structure, display also an interesting behaviour as RAFM steels. Euratom-CEA Association is also involving in the modelling irradiation effects programme by providing a database of Ab-initio defect energy calculations in the Fe-He system.
“Safety and Environment” studies realized by Euratom-CEA cover different parts of this topic such as code validation
experiment. The PACTITER code, an adaptation of the PACTOLE code developed for Pressurized Water Reactor, has been used for predicting the Activated Corrosion Products activities in the various Primary Heat Transfer Systems or Tokamak Water Cooling Systems (TWCS). A new tests campaign has been performed in 2004 in the new CORELE-2 loop to determine release rates of 316L under ITER TCWS operating conditions.
Activities performed in the field “System studies” are dedicated to the Power Plant Conceptual Studies (PPCS). In 2004,
activities were focused on the reactor model AB, based on a Helium-Cooled Lithium-Lead (HCLL) blanket. The model AB reactor is a suitable near term fusion power reactor able to supply 1.5 GWe to the grid with a gross efficiency of near 44%. Because of the high pumping power required by He-cooled systems, the net efficiency is reduced to about 35%. The HCLL blanket allows to achieve a TBR of 1.13.
Activities carried out in the Field “JET
technology” are devoted to the study of different processes which can be used for tritium removal from carbon materials, “Housekeeping” materials, vacuum oil and organic liquids. 2004 activities have also been devoted to the plasma facing components thermo-mechanical modelling, and to the JET diagnostics and divertor enhancement.
Three specific operational divisions of the CEA, located on four sites (see appendix 5), are involved in the Euratom-CEA fusion activities:
the Nuclear Energy Division (DEN) , for In-vessel component design (first wall, divertor, blanket, …), neutronics, structural materials and safety activities,
the Technology Research Division (DRT), for activities dedicated to materials (elaboration, breeding materials) and robotics,
the Physical Sciences Division (DSM), which includes the Controlled Fusion Research Department (DRFC) operating Tore Supra and responsible for plasma physics, cryoplant and magnet and plasma facing component activities.
The Euratom-CEA programme in Technology is also completed by specific R&D collaborations with industry in the fields of safety (Technicatome) and with the French National Centre for Scientific Research in the Plasma Facing Component activities. Progress in fusion technology is constant over the years and this report once again highlights a number of important steps that have been accomplished in this domain. Euratom-CEA, together with other European Institutions is on the foreground of technological advances which are of prime importance for the success of the ITER construction. On the longer term, progress in technology will improve the vision of an electricity producing reactor and will increase the credibility of fusion energy as a genuine energy for the future. The authors and the editors should be commended for their dedicated contribution in making this report available.
M. CHATELIER
TP TV TM TT TS TR TE TD TJ THUT
EFDA
TP : Physics TV : Vessel/In-Vessel TM : Magnets TT : Tritium breeding and Materials TS : Safety and Environment
TR : System studies TE : ITER Site Preparation TD : Design Support and Procurement TJ : JET Technology TH : Heating Systems Technology Project
EFDA : European Fusion Development Agreement UT : Underlying Technology
Figure 1 : breakdown of the work carried out by Field
- 3 -
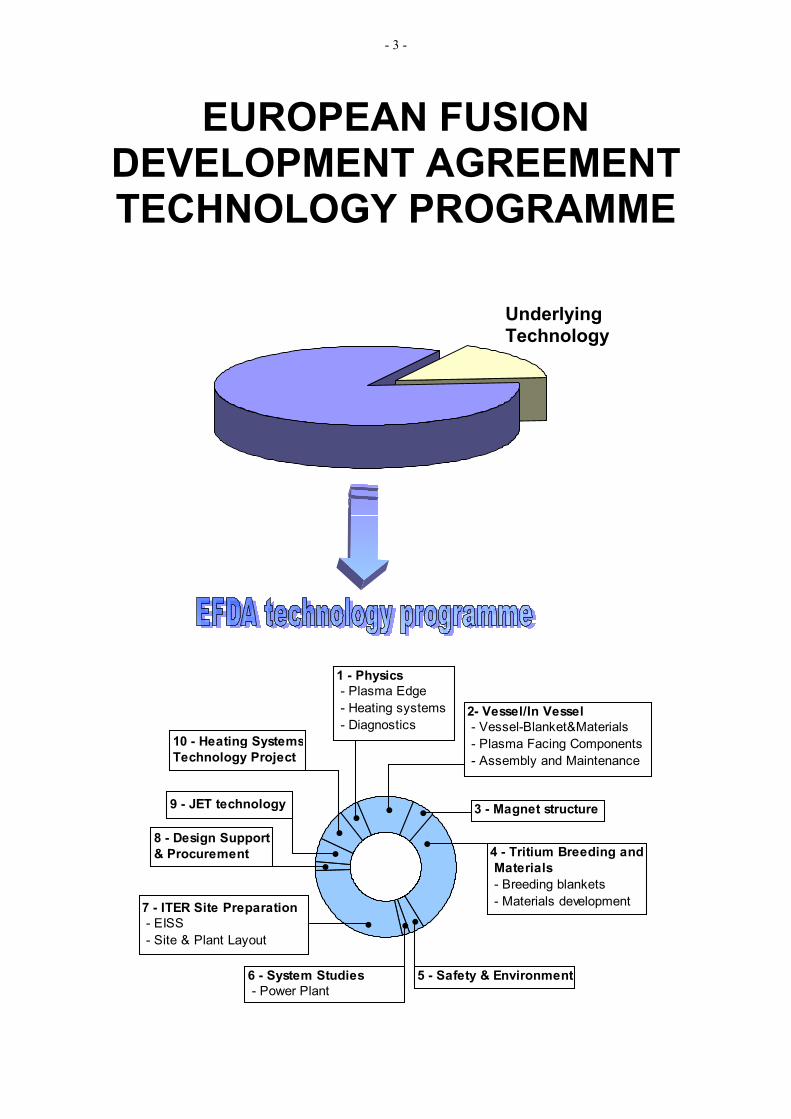
EUROPEAN FUSION DEVELOPMENT AGREEMENT TECHNOLOGY PROGRAMME
1 - Physics - Plasma Edge - Heating systems - Diagnostics
2- Vessel/In Vessel - Vessel-Blanket&Materials - Plasma Facing Components - Assembly and Maintenance
4 - Tritium Breeding and Materials - Breeding blankets - Materials development
8 - Design Support & Procurement
6 - System Studies - Power Plant
3 - Magnet structure
7 - ITER Site Preparation - EISS - Site & Plant Layout
9 - JET technology
10 - Heating Systems Technology Project
5 - Safety & Environment
Underlying Technology

- 4 -
- 5 - EFDA Technology / Physics Integration / Plasma Edge
TW3-TPP-ERDIAG Task Title: EVALUATION OF LASER ABLATION OPTICAL EMISSION
SPECTROSCOPY (LA-OES) METHOD FOR GRAPHITE CO-DEPOSITED LAYER CHARACTERIZATION
INTRODUCTION In-situ diagnostics of the plasma facing surface is regarded crucial for fusion investigations. A further development of the diagnostics is seen essential in dealing with erosion and deposition in nuclear fusion experiments. The application of new materials such as beryllium (instead of graphite) and carbon fibre composite (CFC) requires also further improvement and development of the diagnostics. It should be stressed that the available diagnostics can not completely explain the matter transport from plasma to the component surface in modern TOKAMAK reactors. Within the frames of our investigations on laser detritiation [1-2], some ablation and thermal measurements were made and analysed. The rigid nuclear safety rules in working with tritium and beryllium limited the investigations. Thus, the laboratory measurements were made only with a few available samples of TexTor and TORE SUPRA graphite. Laser Ablation Optical Emission Spectroscopy (LA-OES) diagnostics (in some publications referred as LIBS - Laser Induced Breakdown Spectroscopy) was under study. The possibility to make in-situ completely optical measurements inside the vacuum chamber is regarded as an advantage of this method. LA-OES is applied for a surface quantitative or qualitative elemental analysis. The analysis allows to detect the atomic lines emitted by plasma induced after the nanosecond laser pulse interaction with the surface. Generally, LA-OES is applied with the nearly Gaussian laser beam [3-4]. The craters are conical. Each laser pulse results in a sample ablation from different depths. This paper demonstrates that it is possible to use a “homogeneous” laser beam to form cylindrical craters when each laser pulse ablates the sample from a definite depth. The possible LA-OES application to determine both the composition and the thickness of a co-deposited layer was under investigation. In our experiments, thin (up to 10 µm) and thick (50 µm) layers were studied. Our previous experiments [5] demonstrated that LA-OES allows to detect certain impurities of a co-deposited layer. The development of the diagnostics to analyse the hydrogen and the impurities contents in a co-deposited layer was the aim of our recent investigations. Hydrogen contents measurements are of the fundamental importance for future TOKAMAK (ITER). The hydrogen Balmer series line (n=3 → n=2) in the visible spectral range at 656 nm was observed and detected. The isotopic shift between hydrogen and deuterium line is 0.2 nm. As H-line width was ≈ 2 nm (a full width at half maximum), it was not possible to distinguish hydrogen isotopes. The energy of the upper transition level is ≈12 eV. Thus, it was necessary to create hot plasma on the sample by high laser fluence.
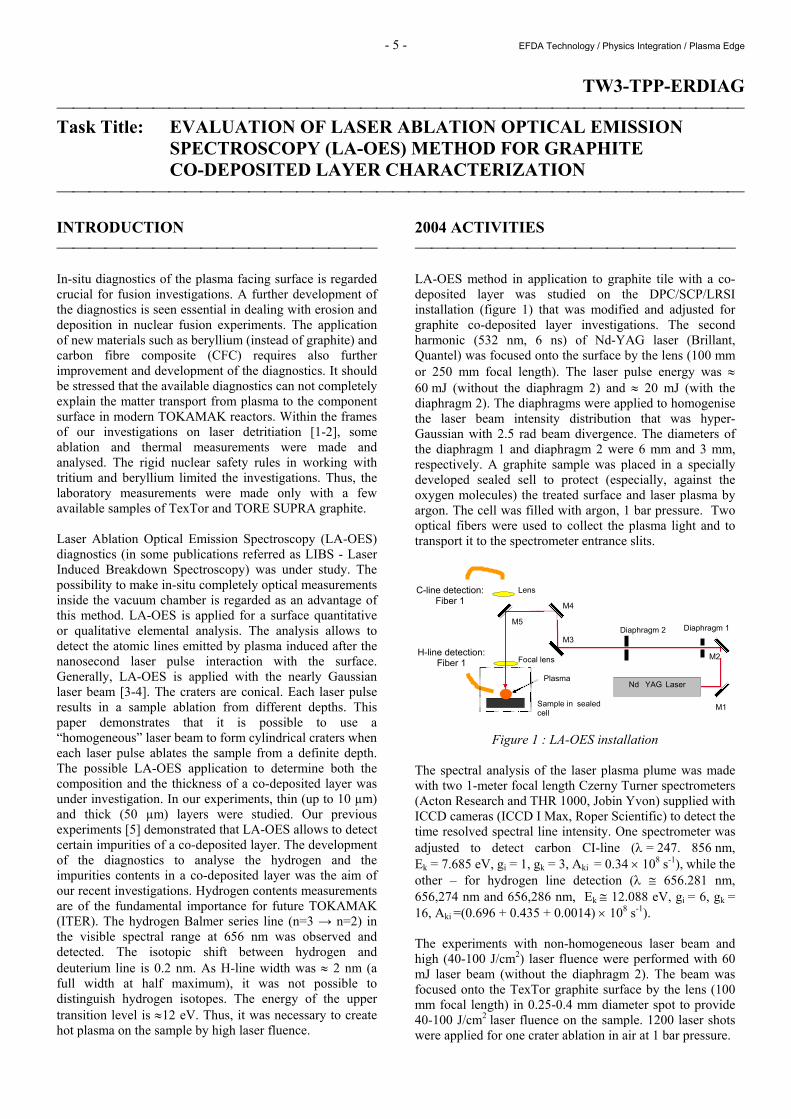
2004 ACTIVITIES LA-OES method in application to graphite tile with a co-deposited layer was studied on the DPC/SCP/LRSI installation (figure 1) that was modified and adjusted for graphite co-deposited layer investigations. The second harmonic (532 nm, 6 ns) of Nd-YAG laser (Brillant, Quantel) was focused onto the surface by the lens (100 mm or 250 mm focal length). The laser pulse energy was ≈ 60 mJ (without the diaphragm 2) and ≈ 20 mJ (with the diaphragm 2). The diaphragms were applied to homogenise the laser beam intensity distribution that was hyper-Gaussian with 2.5 rad beam divergence. The diameters of the diaphragm 1 and diaphragm 2 were 6 mm and 3 mm, respectively. A graphite sample was placed in a specially developed sealed sell to protect (especially, against the oxygen molecules) the treated surface and laser plasma by argon. The cell was filled with argon, 1 bar pressure. Two optical fibers were used to collect the plasma light and to transport it to the spectrometer entrance slits.
Figure 1 : LA-OES installation The spectral analysis of the laser plasma plume was made with two 1-meter focal length Czerny Turner spectrometers (Acton Research and THR 1000, Jobin Yvon) supplied with ICCD cameras (ICCD I Max, Roper Scientific) to detect the time resolved spectral line intensity. One spectrometer was adjusted to detect carbon CI-line (λ = 247. 856 nm, Ek = 7.685 eV, gi = 1, gk = 3, Aki = 0.34 × 10⁸ s-1), while the other – for hydrogen line detection (λ ≅ 656.281 nm, 656,274 nm and 656,286 nm, Ek ≅ 12.088 eV, gi = 6, gk = 16, Aki =(0.696 + 0.435 + 0.0014) × 108 s-1). The experiments with non-homogeneous laser beam and high (40-100 J/cm2) laser fluence were performed with 60 mJ laser beam (without the diaphragm 2). The beam was focused onto the TexTor graphite surface by the lens (100 mm focal length) in 0.25-0.4 mm diameter spot to provide 40-100 J/cm2 laser fluence on the sample. 1200 laser shots were applied for one crater ablation in air at 1 bar pressure.
C-line detection: Fiber 1
Nd YAG Laser
Focal lens
Lens
Sample in sealed cell
M3
M4
M5
Plasma
Diaphragm 2 Diaphragm 1
M2
M1
H-line detection: Fiber 1
- 6 - EFDA Technology / Physics Integration / Plasma Edge
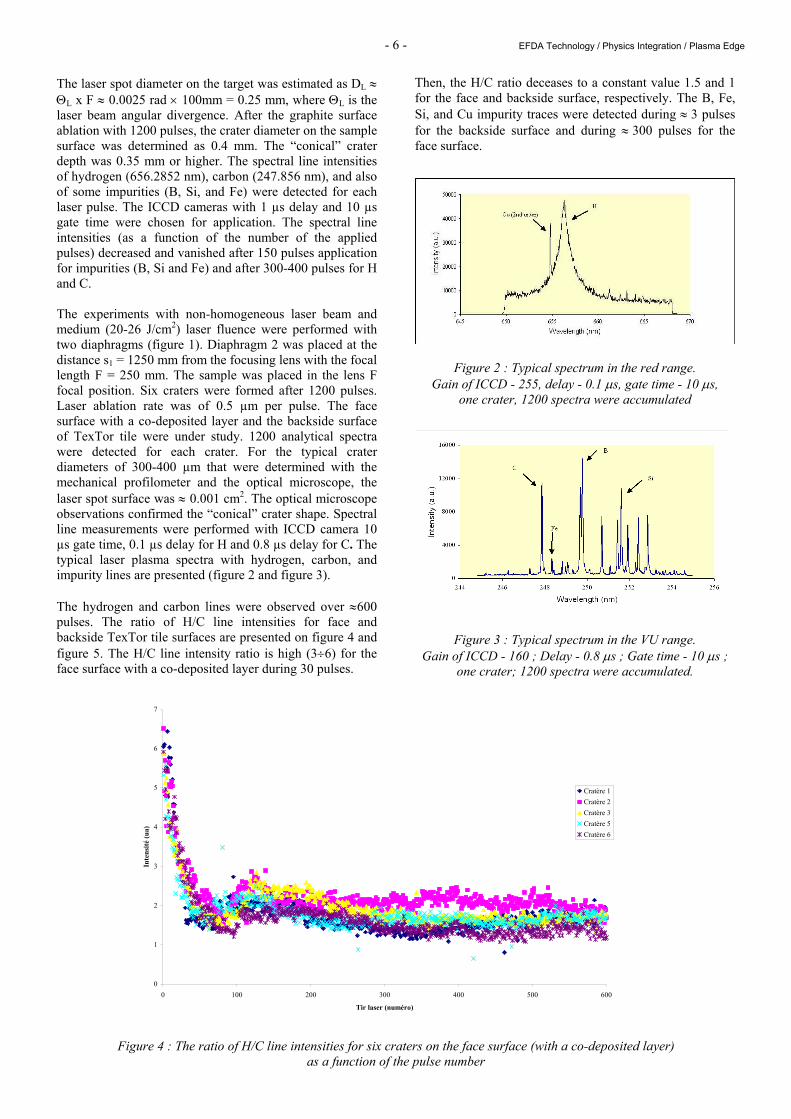
The laser spot diameter on the target was estimated as DL ≈ ΘL x F ≈ 0.0025 rad × 100mm = 0.25 mm, where ΘL is the laser beam angular divergence. After the graphite surface ablation with 1200 pulses, the crater diameter on the sample surface was determined as 0.4 mm. The “conical” crater depth was 0.35 mm or higher. The spectral line intensities of hydrogen (656.2852 nm), carbon (247.856 nm), and also of some impurities (B, Si, and Fe) were detected for each laser pulse. The ICCD cameras with 1 µs delay and 10 µs gate time were chosen for application. The spectral line intensities (as a function of the number of the applied pulses) decreased and vanished after 150 pulses application for impurities (B, Si and Fe) and after 300-400 pulses for H and C. The experiments with non-homogeneous laser beam and medium (20-26 J/cm2) laser fluence were performed with two diaphragms (figure 1). Diaphragm 2 was placed at the distance s1 = 1250 mm from the focusing lens with the focal length F = 250 mm. The sample was placed in the lens F focal position. Six craters were formed after 1200 pulses. Laser ablation rate was of 0.5 µm per pulse. The face surface with a co-deposited layer and the backside surface of TexTor tile were under study. 1200 analytical spectra were detected for each crater. For the typical crater diameters of 300-400 µm that were determined with the mechanical profilometer and the optical microscope, the laser spot surface was ≈ 0.001 cm2. The optical microscope observations confirmed the “conical” crater shape. Spectral line measurements were performed with ICCD camera 10 µs gate time, 0.1 µs delay for H and 0.8 µs delay for C. The typical laser plasma spectra with hydrogen, carbon, and impurity lines are presented (figure 2 and figure 3). The hydrogen and carbon lines were observed over ≈600 pulses. The ratio of H/C line intensities for face and backside TexTor tile surfaces are presented on figure 4 and figure 5. The H/C line intensity ratio is high (3÷6) for the face surface with a co-deposited layer during 30 pulses.
Then, the H/C ratio deceases to a constant value 1.5 and 1 for the face and backside surface, respectively. The B, Fe, Si, and Cu impurity traces were detected during ≈ 3 pulses for the backside surface and during ≈ 300 pulses for the face surface.
Figure 2 : Typical spectrum in the red range.
Gain of ICCD - 255, delay - 0.1 µs, gate time - 10 µs, one crater, 1200 spectra were accumulated
Figure 3 : Typical spectrum in the VU range. Gain of ICCD - 160 ; Delay - 0.8 µs ; Gate time - 10 µs ;
one crater; 1200 spectra were accumulated.
0
1
2
3
4
5
6
7
0 100 200 300 400 500 600
Tir laser (numéro)
Inte
nsité
(ua)
Cratère 1Cratère 2Cratère 3Cratère 5Cratère 6
Figure 4 : The ratio of H/C line intensities for six craters on the face surface (with a co-deposited layer) as a function of the pulse number
- 7 - EFDA Technology / Physics Integration / Plasma Edge
0
1
2
3
4
5
6
0 100 200 300 400 500 600
Tir laser (numéro)
Inte
nsité
(ua)
Cratère 1Cratère 2Cratère 3Cratère 4Cratère 5Cratère 6
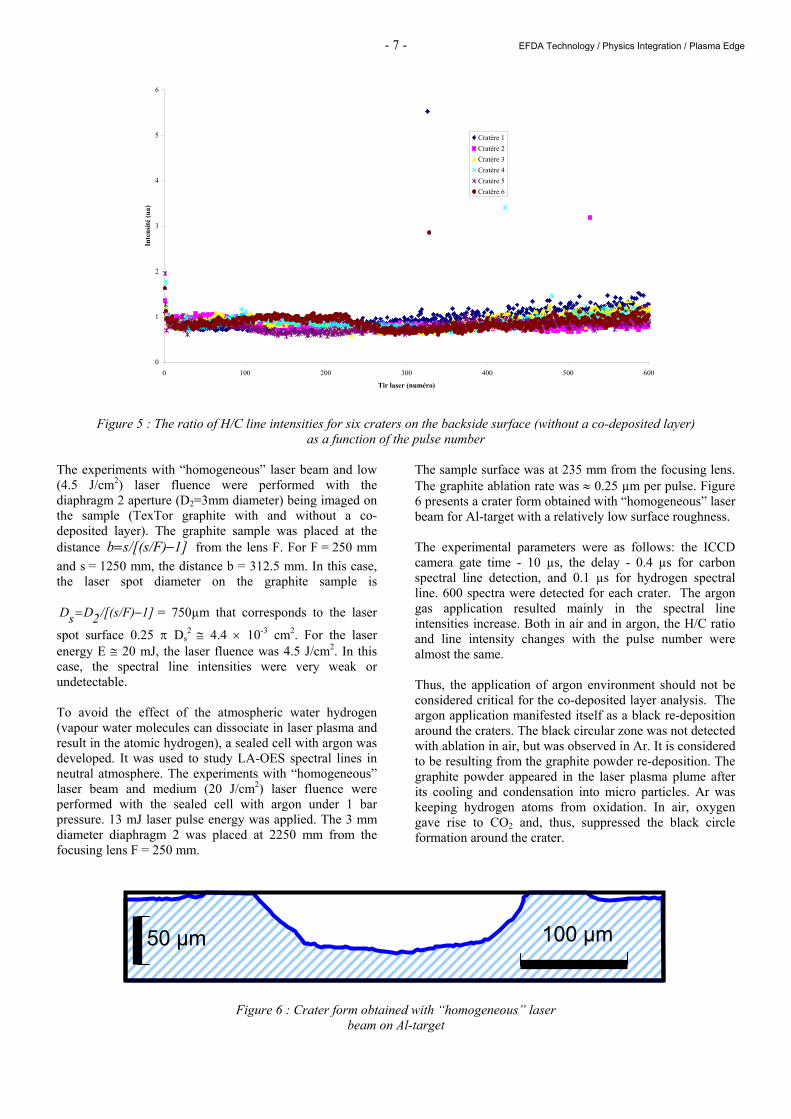
Figure 5 : The ratio of H/C line intensities for six craters on the backside surface (without a co-deposited layer) as a function of the pulse number
The experiments with “homogeneous” laser beam and low (4.5 J/cm2) laser fluence were performed with the diaphragm 2 aperture (D2=3mm diameter) being imaged on the sample (TexTor graphite with and without a co-deposited layer). The graphite sample was placed at the distance 1]s/[(s/F)b −= from the lens F. For F = 250 mm and s = 1250 mm, the distance b = 312.5 mm. In this case, the laser spot diameter on the graphite sample is
1]/[(s/F)2DsD −= = 750µm that corresponds to the laser
spot surface 0.25 π Ds2 ≅ 4.4 × 10⁻³ cm2. For the laser
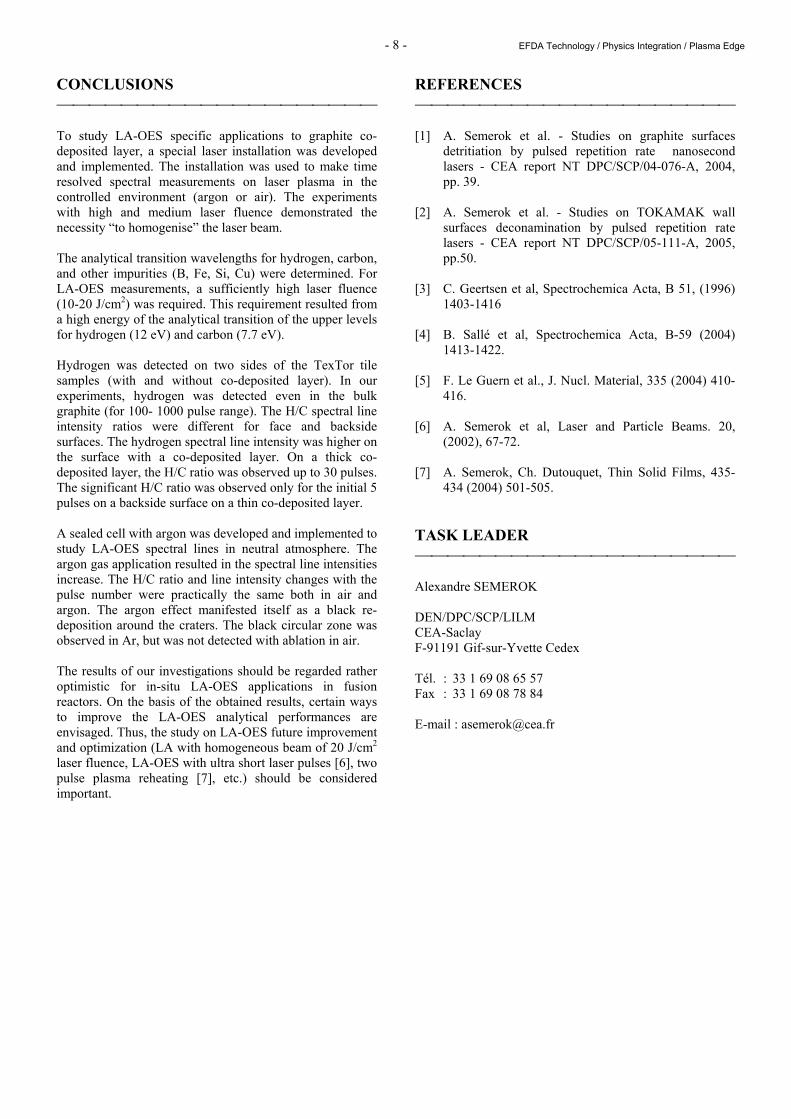
energy E ≅ 20 mJ, the laser fluence was 4.5 J/cm2. In this case, the spectral line intensities were very weak or undetectable. To avoid the effect of the atmospheric water hydrogen (vapour water molecules can dissociate in laser plasma and result in the atomic hydrogen), a sealed cell with argon was developed. It was used to study LA-OES spectral lines in neutral atmosphere. The experiments with “homogeneous” laser beam and medium (20 J/cm2) laser fluence were performed with the sealed cell with argon under 1 bar pressure. 13 mJ laser pulse energy was applied. The 3 mm diameter diaphragm 2 was placed at 2250 mm from the focusing lens F = 250 mm.
The sample surface was at 235 mm from the focusing lens. The graphite ablation rate was ≈ 0.25 µm per pulse. Figure 6 presents a crater form obtained with “homogeneous” laser beam for Al-target with a relatively low surface roughness. The experimental parameters were as follows: the ICCD camera gate time - 10 µs, the delay - 0.4 µs for carbon spectral line detection, and 0.1 µs for hydrogen spectral line. 600 spectra were detected for each crater. The argon gas application resulted mainly in the spectral line intensities increase. Both in air and in argon, the H/C ratio and line intensity changes with the pulse number were almost the same. Thus, the application of argon environment should not be considered critical for the co-deposited layer analysis. The argon application manifested itself as a black re-deposition around the craters. The black circular zone was not detected with ablation in air, but was observed in Ar. It is considered to be resulting from the graphite powder re-deposition. The graphite powder appeared in the laser plasma plume after its cooling and condensation into micro particles. Ar was keeping hydrogen atoms from oxidation. In air, oxygen gave rise to CO2 and, thus, suppressed the black circle formation around the crater.
Figure 6 : Crater form obtained with “homogeneous” laser beam on Al-target
50 µm 100 µm
- 8 - EFDA Technology / Physics Integration / Plasma Edge
CONCLUSIONS To study LA-OES specific applications to graphite co-deposited layer, a special laser installation was developed and implemented. The installation was used to make time resolved spectral measurements on laser plasma in the controlled environment (argon or air). The experiments with high and medium laser fluence demonstrated the necessity “to homogenise” the laser beam. The analytical transition wavelengths for hydrogen, carbon, and other impurities (B, Fe, Si, Cu) were determined. For LA-OES measurements, a sufficiently high laser fluence (10-20 J/cm2) was required. This requirement resulted from a high energy of the analytical transition of the upper levels for hydrogen (12 eV) and carbon (7.7 eV). Hydrogen was detected on two sides of the TexTor tile samples (with and without co-deposited layer). In our experiments, hydrogen was detected even in the bulk graphite (for 100- 1000 pulse range). The H/C spectral line intensity ratios were different for face and backside surfaces. The hydrogen spectral line intensity was higher on the surface with a co-deposited layer. On a thick co-deposited layer, the H/C ratio was observed up to 30 pulses. The significant H/C ratio was observed only for the initial 5 pulses on a backside surface on a thin co-deposited layer. A sealed cell with argon was developed and implemented to study LA-OES spectral lines in neutral atmosphere. The argon gas application resulted in the spectral line intensities increase. The H/C ratio and line intensity changes with the pulse number were practically the same both in air and argon. The argon effect manifested itself as a black re-deposition around the craters. The black circular zone was observed in Ar, but was not detected with ablation in air. The results of our investigations should be regarded rather optimistic for in-situ LA-OES applications in fusion reactors. On the basis of the obtained results, certain ways to improve the LA-OES analytical performances are envisaged. Thus, the study on LA-OES future improvement and optimization (LA with homogeneous beam of 20 J/cm2 laser fluence, LA-OES with ultra short laser pulses [6], two pulse plasma reheating [7], etc.) should be considered important.
REFERENCES [1] A. Semerok et al. - Studies on graphite surfaces
detritiation by pulsed repetition rate nanosecond lasers - CEA report NT DPC/SCP/04-076-A, 2004, pp. 39.
[2] A. Semerok et al. - Studies on TOKAMAK wall
surfaces deconamination by pulsed repetition rate lasers - CEA report NT DPC/SCP/05-111-A, 2005, pp.50.
[3] C. Geertsen et al, Spectrochemica Acta, B 51, (1996)
1403-1416 [4] B. Sallé et al, Spectrochemica Acta, B-59 (2004)
1413-1422. [5] F. Le Guern et al., J. Nucl. Material, 335 (2004) 410-
416. [6] A. Semerok et al, Laser and Particle Beams. 20,
(2002), 67-72. [7] A. Semerok, Ch. Dutouquet, Thin Solid Films, 435-
434 (2004) 501-505. TASK LEADER Alexandre SEMEROK DEN/DPC/SCP/LILM CEA-Saclay F-91191 Gif-sur-Yvette Cedex Tél. : 33 1 69 08 65 57 Fax : 33 1 69 08 78 84 E-mail : [email protected]
- 9 - EFDA Technology / Physics Integration / Heating and Current Drive
CEFDA01-645 Task Title: TW2-TPHN-NBDES1: SUPPORT TO NEUTRAL BEAM PHYSICS
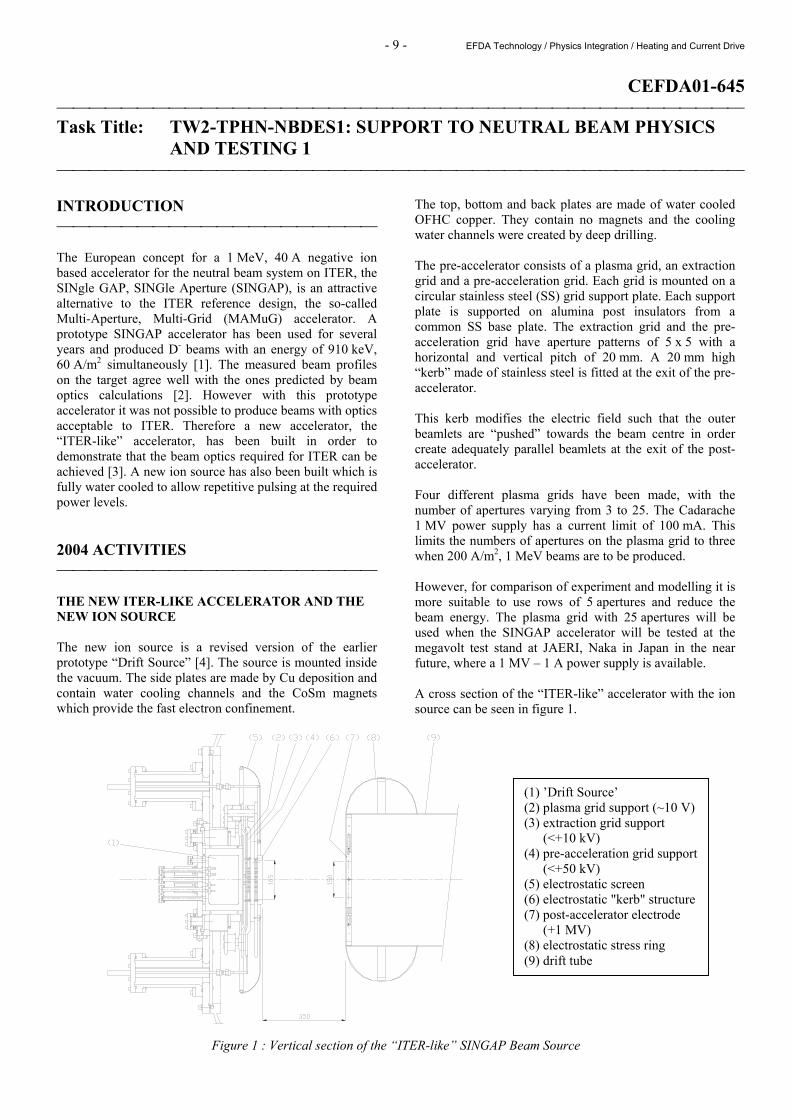
AND TESTING 1 INTRODUCTION The European concept for a 1 MeV, 40 A negative ion based accelerator for the neutral beam system on ITER, the SINgle GAP, SINGle Aperture (SINGAP), is an attractive alternative to the ITER reference design, the so-called Multi-Aperture, Multi-Grid (MAMuG) accelerator. A prototype SINGAP accelerator has been used for several years and produced D- beams with an energy of 910 keV, 60 A/m2 simultaneously [1]. The measured beam profiles on the target agree well with the ones predicted by beam optics calculations [2]. However with this prototype accelerator it was not possible to produce beams with optics acceptable to ITER. Therefore a new accelerator, the “ITER-like” accelerator, has been built in order to demonstrate that the beam optics required for ITER can be achieved [3]. A new ion source has also been built which is fully water cooled to allow repetitive pulsing at the required power levels. 2004 ACTIVITIES THE NEW ITER-LIKE ACCELERATOR AND THE NEW ION SOURCE The new ion source is a revised version of the earlier prototype “Drift Source” [4]. The source is mounted inside the vacuum. The side plates are made by Cu deposition and contain water cooling channels and the CoSm magnets which provide the fast electron confinement.
The top, bottom and back plates are made of water cooled OFHC copper. They contain no magnets and the cooling water channels were created by deep drilling. The pre-accelerator consists of a plasma grid, an extraction grid and a pre-acceleration grid. Each grid is mounted on a circular stainless steel (SS) grid support plate. Each support plate is supported on alumina post insulators from a common SS base plate. The extraction grid and the pre-acceleration grid have aperture patterns of 5 x 5 with a horizontal and vertical pitch of 20 mm. A 20 mm high “kerb” made of stainless steel is fitted at the exit of the pre-accelerator. This kerb modifies the electric field such that the outer beamlets are “pushed” towards the beam centre in order create adequately parallel beamlets at the exit of the post-accelerator. Four different plasma grids have been made, with the number of apertures varying from 3 to 25. The Cadarache 1 MV power supply has a current limit of 100 mA. This limits the numbers of apertures on the plasma grid to three when 200 A/m2, 1 MeV beams are to be produced. However, for comparison of experiment and modelling it is more suitable to use rows of 5 apertures and reduce the beam energy. The plasma grid with 25 apertures will be used when the SINGAP accelerator will be tested at the megavolt test stand at JAERI, Naka in Japan in the near future, where a 1 MV – 1 A power supply is available. A cross section of the “ITER-like” accelerator with the ion source can be seen in figure 1.
Figure 1 : Vertical section of the “ITER-like” SINGAP Beam Source
(1) ’Drift Source’ (2) plasma grid support (~10 V) (3) extraction grid support
(<+10 kV) (4) pre-acceleration grid support
(<+50 kV) (5) electrostatic screen (6) electrostatic "kerb" structure (7) post-accelerator electrode
(+1 MV) (8) electrostatic stress ring (9) drift tube
- 10 - EFDA Technology / Physics Integration / Heating and Current Drive
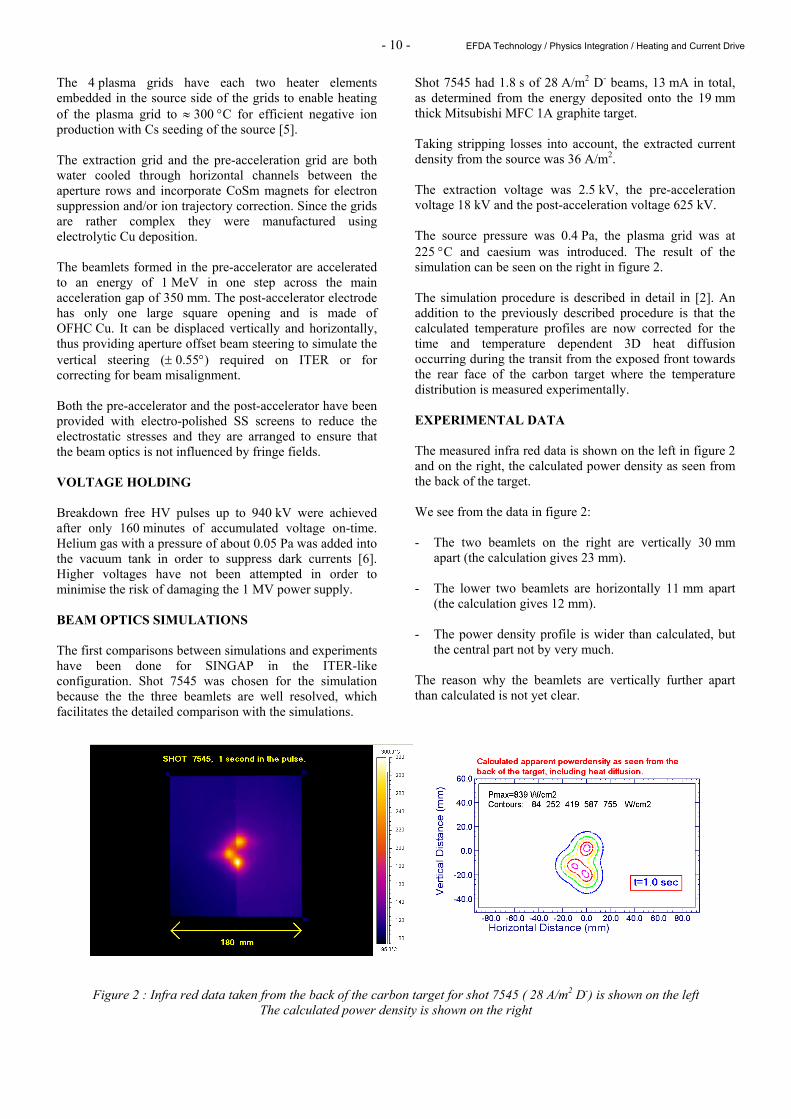
The 4 plasma grids have each two heater elements embedded in the source side of the grids to enable heating of the plasma grid to ≈ 300 °C for efficient negative ion production with Cs seeding of the source [5]. The extraction grid and the pre-acceleration grid are both water cooled through horizontal channels between the aperture rows and incorporate CoSm magnets for electron suppression and/or ion trajectory correction. Since the grids are rather complex they were manufactured using electrolytic Cu deposition. The beamlets formed in the pre-accelerator are accelerated to an energy of 1 MeV in one step across the main acceleration gap of 350 mm. The post-accelerator electrode has only one large square opening and is made of OFHC Cu. It can be displaced vertically and horizontally, thus providing aperture offset beam steering to simulate the vertical steering (± 0.55°) required on ITER or for correcting for beam misalignment. Both the pre-accelerator and the post-accelerator have been provided with electro-polished SS screens to reduce the electrostatic stresses and they are arranged to ensure that the beam optics is not influenced by fringe fields. VOLTAGE HOLDING Breakdown free HV pulses up to 940 kV were achieved after only 160 minutes of accumulated voltage on-time. Helium gas with a pressure of about 0.05 Pa was added into the vacuum tank in order to suppress dark currents [6]. Higher voltages have not been attempted in order to minimise the risk of damaging the 1 MV power supply. BEAM OPTICS SIMULATIONS The first comparisons between simulations and experiments have been done for SINGAP in the ITER-like configuration. Shot 7545 was chosen for the simulation because the the three beamlets are well resolved, which facilitates the detailed comparison with the simulations.
Shot 7545 had 1.8 s of 28 A/m2 D- beams, 13 mA in total, as determined from the energy deposited onto the 19 mm thick Mitsubishi MFC 1A graphite target. Taking stripping losses into account, the extracted current density from the source was 36 A/m2. The extraction voltage was 2.5 kV, the pre-acceleration voltage 18 kV and the post-acceleration voltage 625 kV. The source pressure was 0.4 Pa, the plasma grid was at 225 °C and caesium was introduced. The result of the simulation can be seen on the right in figure 2. The simulation procedure is described in detail in [2]. An addition to the previously described procedure is that the calculated temperature profiles are now corrected for the time and temperature dependent 3D heat diffusion occurring during the transit from the exposed front towards the rear face of the carbon target where the temperature distribution is measured experimentally. EXPERIMENTAL DATA The measured infra red data is shown on the left in figure 2 and on the right, the calculated power density as seen from the back of the target. We see from the data in figure 2: - The two beamlets on the right are vertically 30 mm
apart (the calculation gives 23 mm). - The lower two beamlets are horizontally 11 mm apart
(the calculation gives 12 mm). - The power density profile is wider than calculated, but
the central part not by very much. The reason why the beamlets are vertically further apart than calculated is not yet clear.
Figure 2 : Infra red data taken from the back of the carbon target for shot 7545 ( 28 A/m2 D-) is shown on the left The calculated power density is shown on the right
- 11 - EFDA Technology / Physics Integration / Heating and Current Drive
0
250
500
750
1000
7000 7100 7200 7300 7400 7500 7600 7700
SHOT NUMBER
V bea
m (k
V)
0
50
100
150
200
j min
(A/m
2 )
Vbeam Jmin
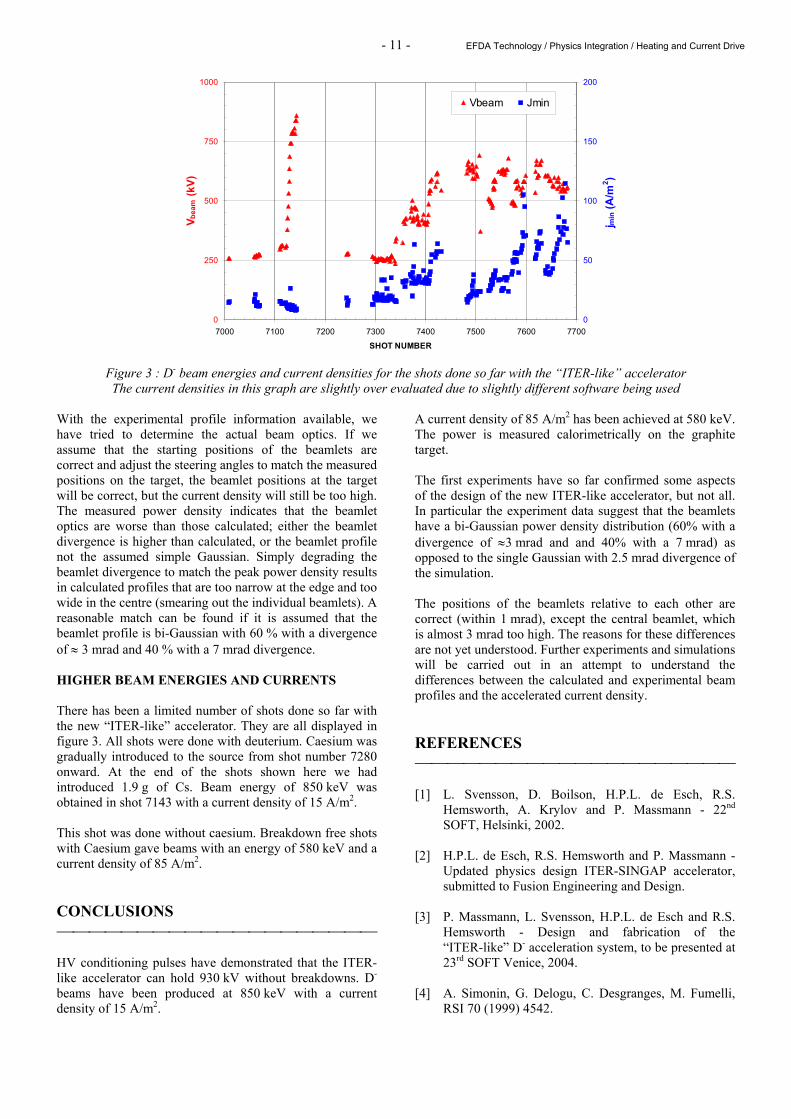
Figure 3 : D- beam energies and current densities for the shots done so far with the “ITER-like” accelerator The current densities in this graph are slightly over evaluated due to slightly different software being used
With the experimental profile information available, we have tried to determine the actual beam optics. If we assume that the starting positions of the beamlets are correct and adjust the steering angles to match the measured positions on the target, the beamlet positions at the target will be correct, but the current density will still be too high. The measured power density indicates that the beamlet optics are worse than those calculated; either the beamlet divergence is higher than calculated, or the beamlet profile not the assumed simple Gaussian. Simply degrading the beamlet divergence to match the peak power density results in calculated profiles that are too narrow at the edge and too wide in the centre (smearing out the individual beamlets). A reasonable match can be found if it is assumed that the beamlet profile is bi-Gaussian with 60 % with a divergence of ≈ 3 mrad and 40 % with a 7 mrad divergence. HIGHER BEAM ENERGIES AND CURRENTS There has been a limited number of shots done so far with the new “ITER-like” accelerator. They are all displayed in figure 3. All shots were done with deuterium. Caesium was gradually introduced to the source from shot number 7280 onward. At the end of the shots shown here we had introduced 1.9 g of Cs. Beam energy of 850 keV was obtained in shot 7143 with a current density of 15 A/m2. This shot was done without caesium. Breakdown free shots with Caesium gave beams with an energy of 580 keV and a current density of 85 A/m2. CONCLUSIONS HV conditioning pulses have demonstrated that the ITER-like accelerator can hold 930 kV without breakdowns. D- beams have been produced at 850 keV with a current density of 15 A/m2.
A current density of 85 A/m2 has been achieved at 580 keV. The power is measured calorimetrically on the graphite target. The first experiments have so far confirmed some aspects of the design of the new ITER-like accelerator, but not all. In particular the experiment data suggest that the beamlets have a bi-Gaussian power density distribution (60% with a divergence of ≈3 mrad and and 40% with a 7 mrad) as opposed to the single Gaussian with 2.5 mrad divergence of the simulation. The positions of the beamlets relative to each other are correct (within 1 mrad), except the central beamlet, which is almost 3 mrad too high. The reasons for these differences are not yet understood. Further experiments and simulations will be carried out in an attempt to understand the differences between the calculated and experimental beam profiles and the accelerated current density. REFERENCES [1] L. Svensson, D. Boilson, H.P.L. de Esch, R.S.
Hemsworth, A. Krylov and P. Massmann - 22nd SOFT, Helsinki, 2002.
[2] H.P.L. de Esch, R.S. Hemsworth and P. Massmann -
Updated physics design ITER-SINGAP accelerator, submitted to Fusion Engineering and Design.
[3] P. Massmann, L. Svensson, H.P.L. de Esch and R.S.
Hemsworth - Design and fabrication of the “ITER-like” D- acceleration system, to be presented at 23rd SOFT Venice, 2004.
[4] A. Simonin, G. Delogu, C. Desgranges, M. Fumelli,
RSI 70 (1999) 4542.
- 12 - EFDA Technology / Physics Integration / Heating and Current Drive
[5] Y. Okumura - Advanced Negative Ion Beam Technology to Improve the System Efficiency of Neutral Beam Injectors, 18th International Conference on Fusion Energy, Sorrento, Italy, 4-10 October 2000.
[6] P. Massmann, D. Boilson, H.P.L. de Esch, R.S.
Hemsworth and L. Svensson - 20th ISDEIV - Tours, 2002.
[7] A. Krylov, R.S. Hemsworth - Gas losses and related
beam losses in the ITER NBI, submitted to Fusion Engineering and Design.
REPORTS AND PUBLICATIONS Experimental results with the new ITER-like 1 MV SINGAP accelerator - L. Svensson, D. Boilson, H.P.L. de Esch, R.S. Hemsworth and P. Massmann - 10th International Symposium on the Production and Neutralization of Negative Ions and Beams, Kiev, 13-17 September 2004. Design and Fabrication of the “ITER-like” SINGAP D- Acceleration System – P. Massmann, L. Svensson, H.P.L. de Esch and R.S. Hemsworth - 23rd symposium of fusion technology 20-24 September 2004.
TASK LEADER Lennart SVENSSON DRFC/SCCP/GIDEA CEA-Cadarache F-13108 Saint-Paul-Lez-Durance Cedex Tél. : 33 4 42 25 61 69 Fax : 33 4 42 25 62 33 E-mail : [email protected]
- 13 - EFDA Technology / Physics Integration / Heating and Current Drive
CEFDA03-1129 Task Title: TW3-TPHI-ICRDES1: ITER ICRF ANTENNA AND MATCHING
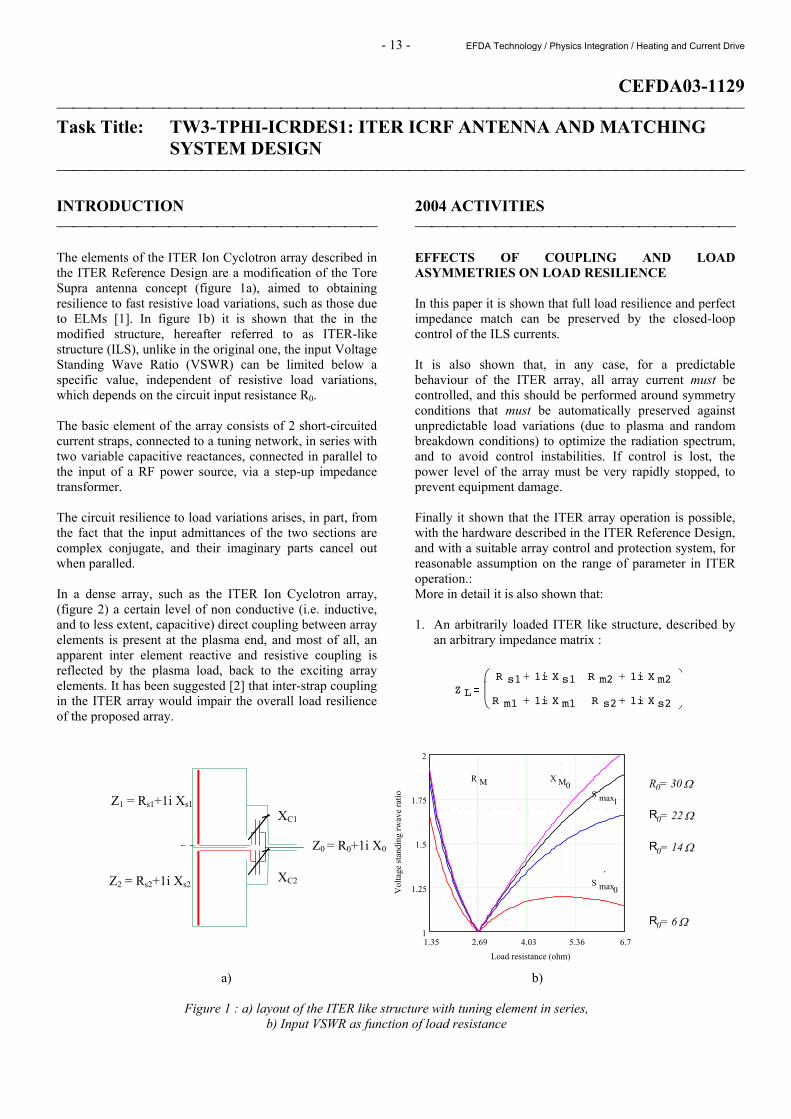
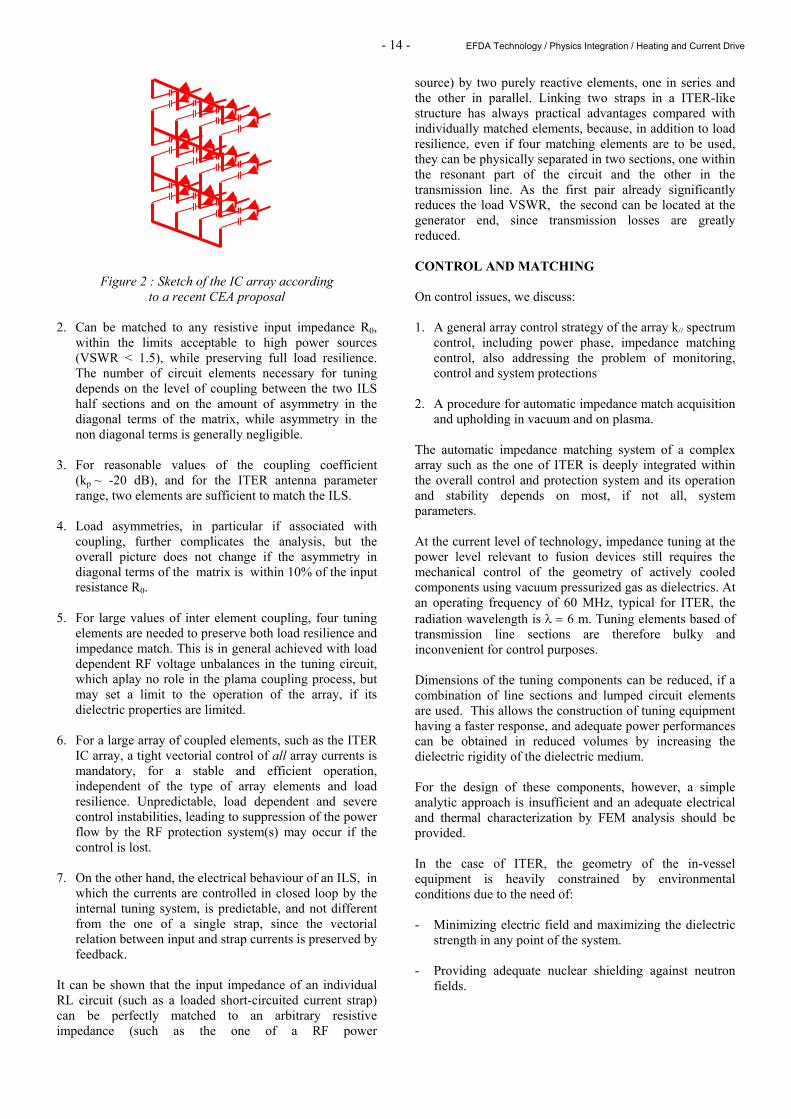
SYSTEM DESIGN INTRODUCTION The elements of the ITER Ion Cyclotron array described in the ITER Reference Design are a modification of the Tore Supra antenna concept (figure 1a), aimed to obtaining resilience to fast resistive load variations, such as those due to ELMs [1]. In figure 1b) it is shown that the in the modified structure, hereafter referred to as ITER-like structure (ILS), unlike in the original one, the input Voltage Standing Wave Ratio (VSWR) can be limited below a specific value, independent of resistive load variations, which depends on the circuit input resistance R0. The basic element of the array consists of 2 short-circuited current straps, connected to a tuning network, in series with two variable capacitive reactances, connected in parallel to the input of a RF power source, via a step-up impedance transformer. The circuit resilience to load variations arises, in part, from the fact that the input admittances of the two sections are complex conjugate, and their imaginary parts cancel out when paralled. In a dense array, such as the ITER Ion Cyclotron array, (figure 2) a certain level of non conductive (i.e. inductive, and to less extent, capacitive) direct coupling between array elements is present at the plasma end, and most of all, an apparent inter element reactive and resistive coupling is reflected by the plasma load, back to the exciting array elements. It has been suggested [2] that inter-strap coupling in the ITER array would impair the overall load resilience of the proposed array.
2004 ACTIVITIES EFFECTS OF COUPLING AND LOAD ASYMMETRIES ON LOAD RESILIENCE In this paper it is shown that full load resilience and perfect impedance match can be preserved by the closed-loop control of the ILS currents. It is also shown that, in any case, for a predictable behaviour of the ITER array, all array current must be controlled, and this should be performed around symmetry conditions that must be automatically preserved against unpredictable load variations (due to plasma and random breakdown conditions) to optimize the radiation spectrum, and to avoid control instabilities. If control is lost, the power level of the array must be very rapidly stopped, to prevent equipment damage. Finally it shown that the ITER array operation is possible, with the hardware described in the ITER Reference Design, and with a suitable array control and protection system, for reasonable assumption on the range of parameter in ITER operation.: More in detail it is also shown that: 1. An arbitrarily loaded ITER like structure, described by
an arbitrary impedance matrix :
a) b)
Figure 1 : a) layout of the ITER like structure with tuning element in series, b) Input VSWR as function of load resistance
S max1
S max0
X M0R M
1.35 2.69 4.03 5.36 6.71
1.25
1.5
1.75
2
Load resistance (ohm)
Vol
tage
stan
ding
rwav
e ra
tio
R0= 30 Ω
R0= 22 Ω
R0= 14 Ω
R0= 6 Ω
.
Z0 = R0+1i X0
XC1 XC2
Z1 = Rs1+1i Xs1
Z2 = Rs2+1i Xs2
Z L
R s1 1i X s1⋅+
R m1 1i X m1⋅+
R m2 1i X m2⋅+
R s2 1i X s2⋅+
- 14 - EFDA Technology / Physics Integration / Heating and Current Drive
Figure 2 : Sketch of the IC array according to a recent CEA proposal
2. Can be matched to any resistive input impedance R0,
within the limits acceptable to high power sources (VSWR < 1.5), while preserving full load resilience. The number of circuit elements necessary for tuning depends on the level of coupling between the two ILS half sections and on the amount of asymmetry in the diagonal terms of the matrix, while asymmetry in the non diagonal terms is generally negligible.
3. For reasonable values of the coupling coefficient
(kp ~ -20 dB), and for the ITER antenna parameter range, two elements are sufficient to match the ILS.
4. Load asymmetries, in particular if associated with
coupling, further complicates the analysis, but the overall picture does not change if the asymmetry in diagonal terms of the matrix is within 10% of the input resistance R0.
5. For large values of inter element coupling, four tuning
elements are needed to preserve both load resilience and impedance match. This is in general achieved with load dependent RF voltage unbalances in the tuning circuit, which aplay no role in the plama coupling process, but may set a limit to the operation of the array, if its dielectric properties are limited.
6. For a large array of coupled elements, such as the ITER
IC array, a tight vectorial control of all array currents is mandatory, for a stable and efficient operation, independent of the type of array elements and load resilience. Unpredictable, load dependent and severe control instabilities, leading to suppression of the power flow by the RF protection system(s) may occur if the control is lost.
7. On the other hand, the electrical behaviour of an ILS, in
which the currents are controlled in closed loop by the internal tuning system, is predictable, and not different from the one of a single strap, since the vectorial relation between input and strap currents is preserved by feedback.
It can be shown that the input impedance of an individual RL circuit (such as a loaded short-circuited current strap) can be perfectly matched to an arbitrary resistive impedance (such as the one of a RF power
source) by two purely reactive elements, one in series and the other in parallel. Linking two straps in a ITER-like structure has always practical advantages compared with individually matched elements, because, in addition to load resilience, even if four matching elements are to be used, they can be physically separated in two sections, one within the resonant part of the circuit and the other in the transmission line. As the first pair already significantly reduces the load VSWR, the second can be located at the generator end, since transmission losses are greatly reduced. CONTROL AND MATCHING On control issues, we discuss: 1. A general array control strategy of the array k// spectrum
control, including power phase, impedance matching control, also addressing the problem of monitoring, control and system protections
2. A procedure for automatic impedance match acquisition
and upholding in vacuum and on plasma. The automatic impedance matching system of a complex array such as the one of ITER is deeply integrated within the overall control and protection system and its operation and stability depends on most, if not all, system parameters. At the current level of technology, impedance tuning at the power level relevant to fusion devices still requires the mechanical control of the geometry of actively cooled components using vacuum pressurized gas as dielectrics. At an operating frequency of 60 MHz, typical for ITER, the radiation wavelength is λ = 6 m. Tuning elements based of transmission line sections are therefore bulky and inconvenient for control purposes. Dimensions of the tuning components can be reduced, if a combination of line sections and lumped circuit elements are used. This allows the construction of tuning equipment having a faster response, and adequate power performances can be obtained in reduced volumes by increasing the dielectric rigidity of the dielectric medium. For the design of these components, however, a simple analytic approach is insufficient and an adequate electrical and thermal characterization by FEM analysis should be provided. In the case of ITER, the geometry of the in-vessel equipment is heavily constrained by environmental conditions due to the need of: - Minimizing electric field and maximizing the dielectric
strength in any point of the system. - Providing adequate nuclear shielding against neutron
fields.
- 15 - EFDA Technology / Physics Integration / Heating and Current Drive
- Implementing in the design an adequate structural hardiness to support large electro-magnetic and gravitational loads, due to plasma disruptions and a sufficient flexibility to accept important differential thermal loads.
- Providing a safe vacuum/tritium confinement. - Allowing intensive water cooling of all components and
support structures. - Permitting remote handling operation on the system. - Facilitating Hot Cell maintenance, repairs and
dismantling. - Minimizing waste inventory. In view of these constraints, a simple electrical description of the array control system is insufficient. A description of geometry and electrical properties of the control components and a detailed explanation of how these integrate in the system is needed. PROPOSALS FOR UPGRADES FOR THE REFERENCE DESIGN In the paper the discussion of the matching system is part of a wider context, including recent proposals [3] for an upgrade of the ITER IC Reference Design. The proposed changes have the purpose of: - Upgrading the array performance. - Improving the dielectric strength in most part of the
array. - Greatly simplifying the array layout. - Facilitating maintenance in Hot Cell and, possibly, in
situ. - Implementing an effective vectorial control of the array
currents. - Providing means for breakdown detection and
protection. The new design includes modifications to: - Strap layout - VTL layout - Tuning components and vacuum feed trough The geometry of the array is significantly changed compared to previous proposals and this has required a substantial revision of the array electrical analysis.
REPORTS AND PUBLICATIONS [1] G. Bosia - Fusion Science & Technology - 43 pp. 153-
159, (2003). [2] A. Messiaen - Proc of the 15th Topical Conference on
RF Power in Plasmas - AIP CP 694, 142, (2003). [3] G. Bosia - Proposals for upgrades to the ITER
Reference design - CEA CNN/NTT (2004). TASK LEADER Giuseppe BOSIA in collaboration with S. BREMOND L. NICOLAS K. VULLIEZ DSM/DRFC/SCCP CEA-Cadarache F-13108 Saint-Paul-Lez-Durance Cedex Tél. : 33 4 42 25 49 22 Fax : 33 4 42 25 62 33 E-mail : [email protected]

- 16 - EFDA Technology / Physics Integration / Heating and Current Drive
- 17 - EFDA Technology / Physics Integration / Diagnostics
CEFDA02-1003 CEFDA03-1111
Task Title: TW2-TPDS-DIASUP4 and TW3-TPDS-DIASUP1: SUPPORT TO THE
ITER DIAGNOSTIC DESIGN INTRODUCTION ITER requires an extensive set of diagnostic systems to provide several key functions in support of the design goals that include: protection of the device, input to plasma control systems, evaluation and analysis of plasma performance. The process of adapting the design of the diagnostic systems from the original ITER design in 1998 was begun during the EDA Extension Phase. However, considerable detailed design work remains to optimize the measurement capability of the individual systems and to prepare procurement packages for individual diagnostics. The overall objective of these tasks is to advance the design of several ITER diagnostic systems for which the EU has developed conceptual designs, to re-evaluate their performance for the most recent analysis of plasma conditions, to provide support for the ITER IT in the preparation of the relevant ITER documentation and in evaluating the cost. These studies have been carried out under two contracts: CEFDA02-1003 signed in August 2003 and CEFDA03-1111 signed in April 2004. However, the technical scope and completion dates of the second contract were modified in a supplementary agreement, signed in Brussels on 31 December 2004, to reflect the revised emphasis of the expected European contribution to ITER diagnostics. The main changes were to cancel a further study that had been planned for polarimetry, to change the focus of the reflectometer study onto the plasma position system and to extend the scope of the other studies. Studies covered by the first contract were completed during 2004 but studies under the second contract, because of the revisions to its technical content and the extension of the completion dates, will extend into 2005. The work involves studies of the following diagnostic systems. BOLOMETRY The first phase of this study agreed, in collaboration with the ITER IT, a generic design for the bolometer camera and carried out analysis of the thermal response, defined the cooling requirements and assessed the sensitivity of the bolometer. The second phase (carried out in collaboration with the HAS and IPP fusion Associations) is advancing a number of design and integration issues concerning ITER bolometers. CEA’s main contribution is to perform a detailed design analysis of the bolometer camera housing and the internal camera structure for several different camera locations in the ITER vessel.
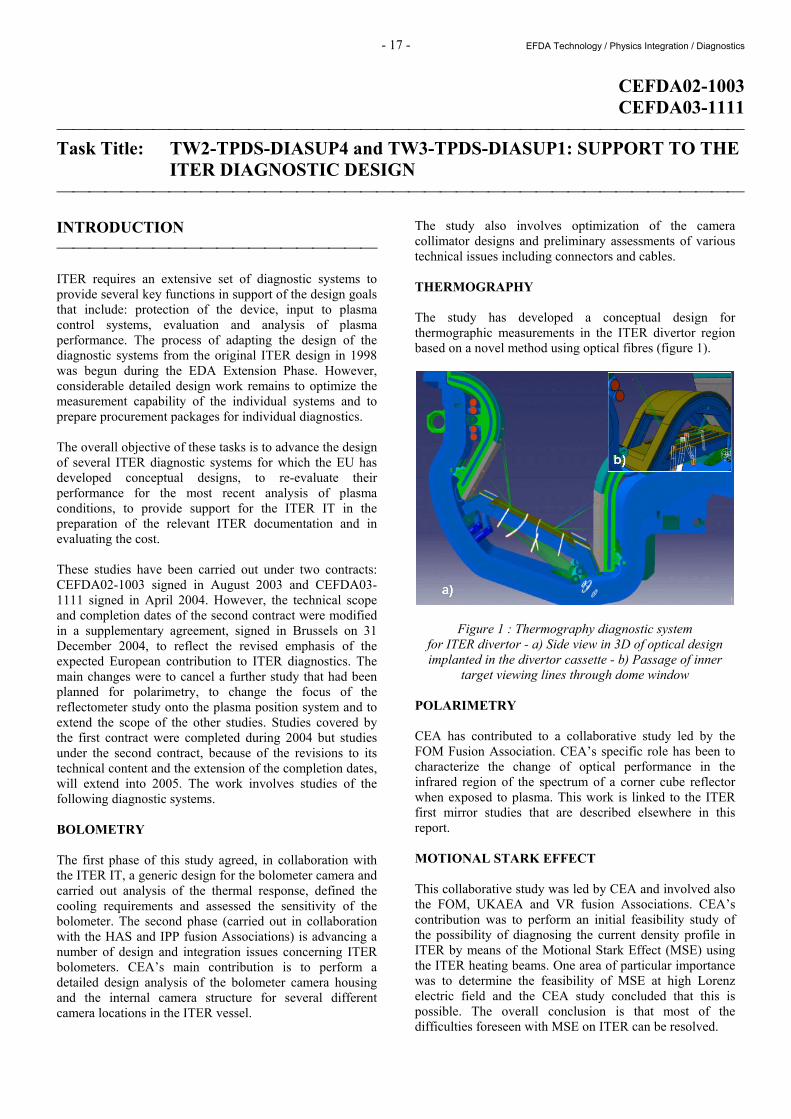
The study also involves optimization of the camera collimator designs and preliminary assessments of various technical issues including connectors and cables. THERMOGRAPHY The study has developed a conceptual design for thermographic measurements in the ITER divertor region based on a novel method using optical fibres (figure 1).
Figure 1 : Thermography diagnostic system for ITER divertor - a) Side view in 3D of optical design implanted in the divertor cassette - b) Passage of inner
target viewing lines through dome window POLARIMETRY CEA has contributed to a collaborative study led by the FOM Fusion Association. CEA’s specific role has been to characterize the change of optical performance in the infrared region of the spectrum of a corner cube reflector when exposed to plasma. This work is linked to the ITER first mirror studies that are described elsewhere in this report. MOTIONAL STARK EFFECT This collaborative study was led by CEA and involved also the FOM, UKAEA and VR fusion Associations. CEA’s contribution was to perform an initial feasibility study of the possibility of diagnosing the current density profile in ITER by means of the Motional Stark Effect (MSE) using the ITER heating beams. One area of particular importance was to determine the feasibility of MSE at high Lorenz electric field and the CEA study concluded that this is possible. The overall conclusion is that most of the difficulties foreseen with MSE on ITER can be resolved.
- 18 - EFDA Technology / Physics Integration / Diagnostics
WIDE-ANGLE VIEWING This is a new collaborative study, led by CEA and involving the ENEA and FOM Associations, to perform a design analysis of the optical layouts of the ITER wide-angle viewing systems, with particular emphasis on the systems to be installed on the main horizontal ports. The wide-angle plasma viewing system is an extensive and complex diagnostic with as many as 18 cameras. The original specification, based on a study from the original ITER design in 1998, needs to be brought up to date to take account of recent changes in the ITER design and significant advances in the techniques and expertise for this diagnostic method. An important issue is to assess the extent to which this diagnostic system can complement or even replace other systems. CALORIMETRY CEA has carried out an initial study of the feasibility of a diagnostic system for fusion power based on calorimetric measurements of the ITER machine cooling systems. Q-PROFILE DETERMINATION This is a 2-part study with the DCU Association (University College Cork) responsible for the first stage and CEA for the second stage. The CEA study has provided expert advice on the determination of MSE measurements in ITER with particular emphasis on the optimization and number of MSE viewing lines and channels. REFLECTOMETRY CEA is participating in a collaborative design study (led by the IST Fusion Association) of the plasma position reflectometer systems for ITER. CEA is assessing an existing design for the antenna and estimating antenna loss over the relevant frequency range. CEA is contributing also to the performance analysis of waveguides. CONCLUSION Studies covered by the EFDA02-1003 contact are completed: generic design for the bolometer camera [1], conceptual design for thermographic measurements [2], optical performance of the polarimeter system [3], feasibility study of the possibility of diagnosing the current density profile in ITER by means of the Motional Stark Effect [4]. Tasks under the EFDA03-1111 are running according to the revised planning agreed in December 2004.
REPORTS AND PUBLICATIONS [1] Thermal analysis of the ITER reference bolometers,
Final report - DIAG/NTT-2004.027, 10/2004. [2] Preliminary final report for the EFDA task TWP2002
TW2-TPDS-DIASUP-231 concerning task 2.3 Thermography - part II : CEA, 12/2004.
[3] Support of the ITER Diagnostic design : Polarimetry -
Final report - DIAG/NTT 2005-003, 01/2005. [4] Design analysis of motional stark effect diagnostic for
ITER - DIAG/NTT-2004.029, 11/2004. TASK LEADER Peter STOTT DSM/DRFC/SCCP/GCBD CEA-Cadarache F-13108 Saint-Paul-Lez-Durance Cedex Tél. : 33 4 42 25 66 94 Fax : 33 4 42 25 62 33 E-mail : [email protected]
- 19 - EFDA Technology / Physics Integration / Diagnostics
TW2-TPDS-DIADEV-D02 Task Title: DEVELOPMENT OF DIAGNOSTIC COMPONENTS FIRST MIRROR STUDY INTRODUCTION First mirrors will be the plasma facing components of optical diagnostic systems in ITER. Attention is concentrated on two processes, which can lead to degradation of mirror optical properties, namely: - sputtering by charge exchange (CX) neutrals and ions
during plasma operation and conditioning procedures such as discharge cleaning, which leads to erosion;
- deposition of material eroded from the divertor (e.g.,
limiters in TS) and first wall, which leads to surface contamination [1]. In the frame of an EFDA contract, metallic mirror samples (22 mm in diameter, 4 mm thick) of three different materials- mono-crystalline molybdenum (mc-Mo), polycrystalline stainless steel (SS) and copper (Cu) - were installed in TS for long-term plasma exposure during the experimental campaign 2003-2004 [2]. The task included also post exposure mirror analysis. The final report has been delivered according the due date (end 2004).
2004 ACTIVITIES OPERATION CONDITION Mirror materials and the experimental layout of mirror exposure have been described in Technofusion 2003. During the roughly one year exposure period, about 1400 plasma pulses (mainly D2) of more than Ip = 200 kA (ne0 ~ 2-4 1019 m-3) have been performed with a cumulative pulse length of ~ 26000 s (7 h 10). The accumulation of injected energy in TS between March 2003 and April 2004 was roughly 37 Gigajoules (GJ) composed of ~ 13 GJ ohmic, ~ 22 GJ lower hybrid and ~ 2 GJ ICRH. In addition wall conditioning procedures of glow discharges in He (t = 362 h, I = 7 µA/cm²; Ua = 300 V, p = 0.3 Pa), in D2 (t = 606 h, I = 7µA/cm², Ua = 400 V, p = 0.3 Pa) and 13 h of boronisation, alternating with plasma operation, have been performed during this exposure time. A major water leak of an actively cooled in-vessel component in September 2003 led to local mirror “splashing” (the mirrors have not been cleaned after that, before further exposure). POST EXPOSURE MIRROR ANALYSES Surface roughness and 3D surface profiles have been measured by confocal microscopy (CM). Surface topography and chemical analyses were performed by SEM imaging, EDX, XPS and SIMS.
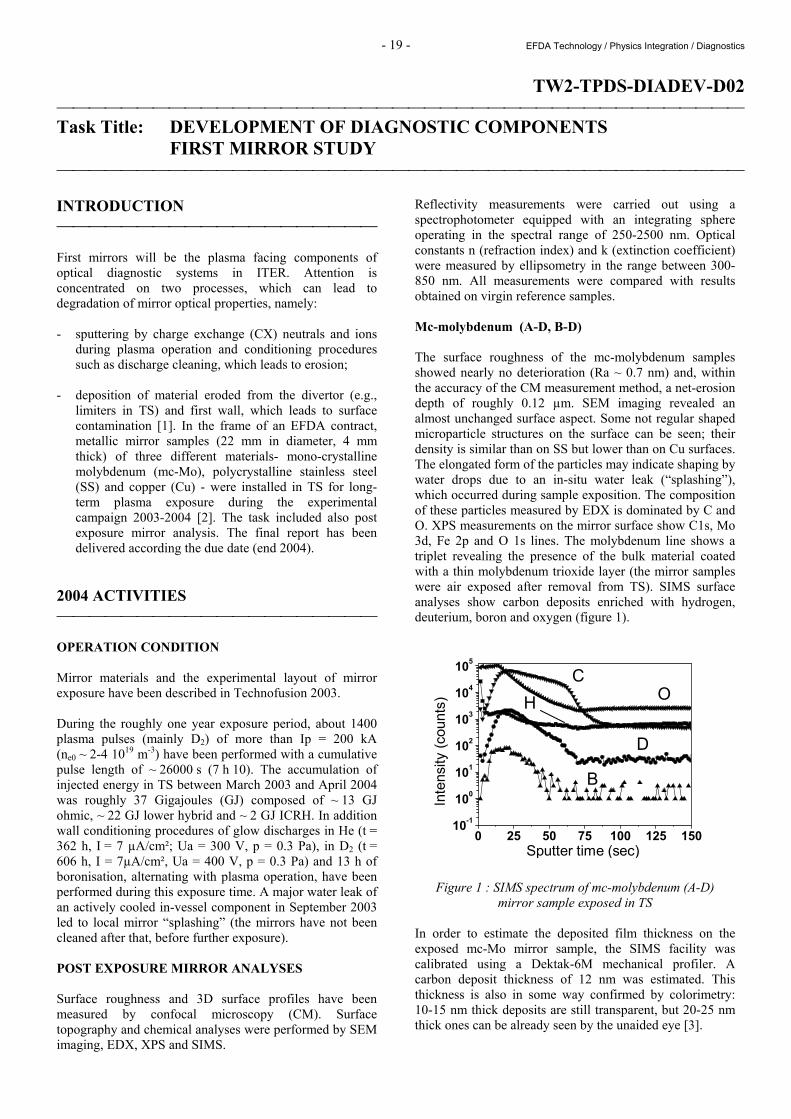
Reflectivity measurements were carried out using a spectrophotometer equipped with an integrating sphere operating in the spectral range of 250-2500 nm. Optical constants n (refraction index) and k (extinction coefficient) were measured by ellipsometry in the range between 300-850 nm. All measurements were compared with results obtained on virgin reference samples. Mc-molybdenum (A-D, B-D) The surface roughness of the mc-molybdenum samples showed nearly no deterioration (Ra ~ 0.7 nm) and, within the accuracy of the CM measurement method, a net-erosion depth of roughly 0.12 µm. SEM imaging revealed an almost unchanged surface aspect. Some not regular shaped microparticle structures on the surface can be seen; their density is similar than on SS but lower than on Cu surfaces. The elongated form of the particles may indicate shaping by water drops due to an in-situ water leak (“splashing”), which occurred during sample exposition. The composition of these particles measured by EDX is dominated by C and O. XPS measurements on the mirror surface show C1s, Mo 3d, Fe 2p and O 1s lines. The molybdenum line shows a triplet revealing the presence of the bulk material coated with a thin molybdenum trioxide layer (the mirror samples were air exposed after removal from TS). SIMS surface analyses show carbon deposits enriched with hydrogen, deuterium, boron and oxygen (figure 1).
Inte
nsity
(cou
nts)
Sputter time (sec)
OC
H
D
B
0 25 50 75 100 125 15010-1
100
101
102
103
104
105
Figure 1 : SIMS spectrum of mc-molybdenum (A-D) mirror sample exposed in TS
In order to estimate the deposited film thickness on the exposed mc-Mo mirror sample, the SIMS facility was calibrated using a Dektak-6M mechanical profiler. A carbon deposit thickness of 12 nm was estimated. This thickness is also in some way confirmed by colorimetry: 10-15 nm thick deposits are still transparent, but 20-25 nm thick ones can be already seen by the unaided eye [3].
- 20 - EFDA Technology / Physics Integration / Diagnostics
The total and the specular reflectivity show a slight decrease compared to the virgin sample. Specular values are compared to SS and Cu in figure 2. This decrease is more pronounced in the UV region. The diffuse reflectivity remains very low (< 2 %). Since the diffusive component of the reflectivity is linked to the roughness of the material, we can deduce that the roughness has not evolved sensibly during exposure (plasma and conditioning procedures), which has been confirmed by surface roughness measurements. We can assume that the decrease of the specular reflectivity is due to light absorption in the thin layer of carbon deposited.
500 1000 1500 2000 25000
102030405060708090
100
Spec
ular
refle
ctiv
ity (%
)
Wavelength (nm)
Virgin Mo Exposed Mo Virgin SS Exposed SS Virgin Cu Exposed Cu
Figure 2 : Specular reflectivity versus wavelength
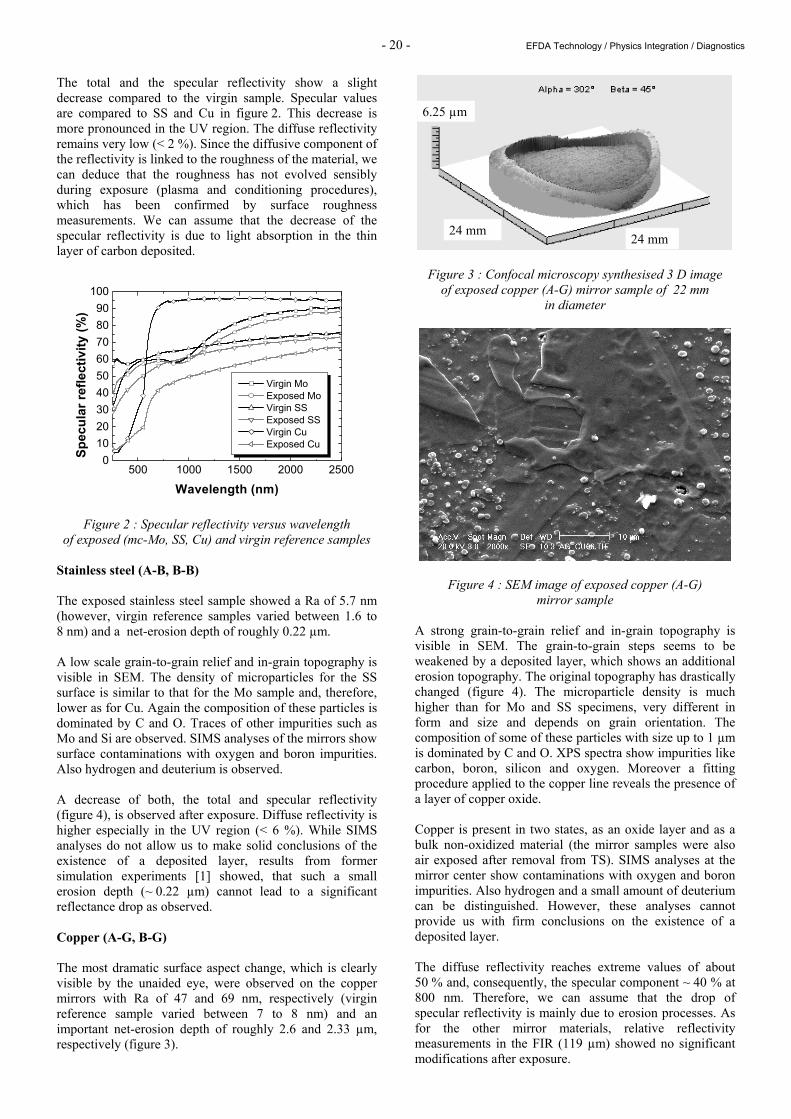
of exposed (mc-Mo, SS, Cu) and virgin reference samples Stainless steel (A-B, B-B) The exposed stainless steel sample showed a Ra of 5.7 nm (however, virgin reference samples varied between 1.6 to 8 nm) and a net-erosion depth of roughly 0.22 µm. A low scale grain-to-grain relief and in-grain topography is visible in SEM. The density of microparticles for the SS surface is similar to that for the Mo sample and, therefore, lower as for Cu. Again the composition of these particles is dominated by C and O. Traces of other impurities such as Mo and Si are observed. SIMS analyses of the mirrors show surface contaminations with oxygen and boron impurities. Also hydrogen and deuterium is observed. A decrease of both, the total and specular reflectivity (figure 4), is observed after exposure. Diffuse reflectivity is higher especially in the UV region (< 6 %). While SIMS analyses do not allow us to make solid conclusions of the existence of a deposited layer, results from former simulation experiments [1] showed, that such a small erosion depth (~ 0.22 µm) cannot lead to a significant reflectance drop as observed. Copper (A-G, B-G) The most dramatic surface aspect change, which is clearly visible by the unaided eye, were observed on the copper mirrors with Ra of 47 and 69 nm, respectively (virgin reference sample varied between 7 to 8 nm) and an important net-erosion depth of roughly 2.6 and 2.33 µm, respectively (figure 3).
24 mm24 mm
6.25 µm
24 mm24 mm
6.25 µm
Figure 3 : Confocal microscopy synthesised 3 D image of exposed copper (A-G) mirror sample of 22 mm
in diameter
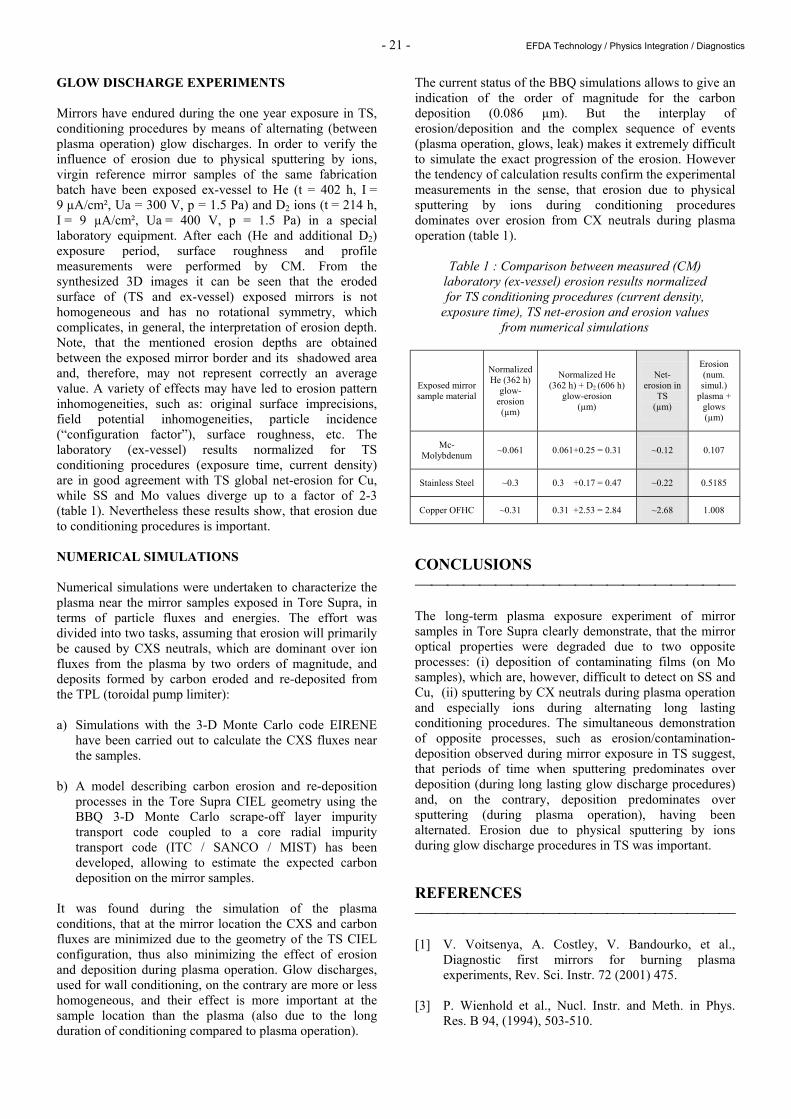
Figure 4 : SEM image of exposed copper (A-G) mirror sample
A strong grain-to-grain relief and in-grain topography is visible in SEM. The grain-to-grain steps seems to be weakened by a deposited layer, which shows an additional erosion topography. The original topography has drastically changed (figure 4). The microparticle density is much higher than for Mo and SS specimens, very different in form and size and depends on grain orientation. The composition of some of these particles with size up to 1 µm is dominated by C and O. XPS spectra show impurities like carbon, boron, silicon and oxygen. Moreover a fitting procedure applied to the copper line reveals the presence of a layer of copper oxide. Copper is present in two states, as an oxide layer and as a bulk non-oxidized material (the mirror samples were also air exposed after removal from TS). SIMS analyses at the mirror center show contaminations with oxygen and boron impurities. Also hydrogen and a small amount of deuterium can be distinguished. However, these analyses cannot provide us with firm conclusions on the existence of a deposited layer. The diffuse reflectivity reaches extreme values of about 50 % and, consequently, the specular component ~ 40 % at 800 nm. Therefore, we can assume that the drop of specular reflectivity is mainly due to erosion processes. As for the other mirror materials, relative reflectivity measurements in the FIR (119 µm) showed no significant modifications after exposure.
- 21 - EFDA Technology / Physics Integration / Diagnostics
GLOW DISCHARGE EXPERIMENTS Mirrors have endured during the one year exposure in TS, conditioning procedures by means of alternating (between plasma operation) glow discharges. In order to verify the influence of erosion due to physical sputtering by ions, virgin reference mirror samples of the same fabrication batch have been exposed ex-vessel to He (t = 402 h, I = 9 µA/cm², Ua = 300 V, p = 1.5 Pa) and D2 ions (t = 214 h, I = 9 µA/cm², Ua = 400 V, p = 1.5 Pa) in a special laboratory equipment. After each (He and additional D2) exposure period, surface roughness and profile measurements were performed by CM. From the synthesized 3D images it can be seen that the eroded surface of (TS and ex-vessel) exposed mirrors is not homogeneous and has no rotational symmetry, which complicates, in general, the interpretation of erosion depth. Note, that the mentioned erosion depths are obtained between the exposed mirror border and its shadowed area and, therefore, may not represent correctly an average value. A variety of effects may have led to erosion pattern inhomogeneities, such as: original surface imprecisions, field potential inhomogeneities, particle incidence (“configuration factor”), surface roughness, etc. The laboratory (ex-vessel) results normalized for TS conditioning procedures (exposure time, current density) are in good agreement with TS global net-erosion for Cu, while SS and Mo values diverge up to a factor of 2-3 (table 1). Nevertheless these results show, that erosion due to conditioning procedures is important. NUMERICAL SIMULATIONS Numerical simulations were undertaken to characterize the plasma near the mirror samples exposed in Tore Supra, in terms of particle fluxes and energies. The effort was divided into two tasks, assuming that erosion will primarily be caused by CXS neutrals, which are dominant over ion fluxes from the plasma by two orders of magnitude, and deposits formed by carbon eroded and re-deposited from the TPL (toroidal pump limiter): a) Simulations with the 3-D Monte Carlo code EIRENE
have been carried out to calculate the CXS fluxes near the samples.
b) A model describing carbon erosion and re-deposition
processes in the Tore Supra CIEL geometry using the BBQ 3-D Monte Carlo scrape-off layer impurity transport code coupled to a core radial impurity transport code (ITC / SANCO / MIST) has been developed, allowing to estimate the expected carbon deposition on the mirror samples.
It was found during the simulation of the plasma conditions, that at the mirror location the CXS and carbon fluxes are minimized due to the geometry of the TS CIEL configuration, thus also minimizing the effect of erosion and deposition during plasma operation. Glow discharges, used for wall conditioning, on the contrary are more or less homogeneous, and their effect is more important at the sample location than the plasma (also due to the long duration of conditioning compared to plasma operation).
The current status of the BBQ simulations allows to give an indication of the order of magnitude for the carbon deposition (0.086 µm). But the interplay of erosion/deposition and the complex sequence of events (plasma operation, glows, leak) makes it extremely difficult to simulate the exact progression of the erosion. However the tendency of calculation results confirm the experimental measurements in the sense, that erosion due to physical sputtering by ions during conditioning procedures dominates over erosion from CX neutrals during plasma operation (table 1).
Table 1 : Comparison between measured (CM) laboratory (ex-vessel) erosion results normalized for TS conditioning procedures (current density,
exposure time), TS net-erosion and erosion values from numerical simulations
Exposed mirror sample material
Normalized He (362 h)
glow-erosion (µm)
Normalized He (362 h) + D2 (606 h)
glow-erosion (µm)
Net-erosion in
TS (µm)
Erosion (num. simul.)
plasma + glows (µm)
Mc-Molybdenum ~0.061 0.061+0.25 = 0.31 ~0.12 0.107
Stainless Steel ~0.3 0.3 +0.17 = 0.47 ~0.22 0.5185
Copper OFHC ~0.31 0.31 +2.53 = 2.84 ~2.68 1.008
CONCLUSIONS The long-term plasma exposure experiment of mirror samples in Tore Supra clearly demonstrate, that the mirror optical properties were degraded due to two opposite processes: (i) deposition of contaminating films (on Mo samples), which are, however, difficult to detect on SS and Cu, (ii) sputtering by CX neutrals during plasma operation and especially ions during alternating long lasting conditioning procedures. The simultaneous demonstration of opposite processes, such as erosion/contamination-deposition observed during mirror exposure in TS suggest, that periods of time when sputtering predominates over deposition (during long lasting glow discharge procedures) and, on the contrary, deposition predominates over sputtering (during plasma operation), having been alternated. Erosion due to physical sputtering by ions during glow discharge procedures in TS was important. REFERENCES [1] V. Voitsenya, A. Costley, V. Bandourko, et al.,
Diagnostic first mirrors for burning plasma experiments, Rev. Sci. Instr. 72 (2001) 475.
[3] P. Wienhold et al., Nucl. Instr. and Meth. in Phys.
Res. B 94, (1994), 503-510.
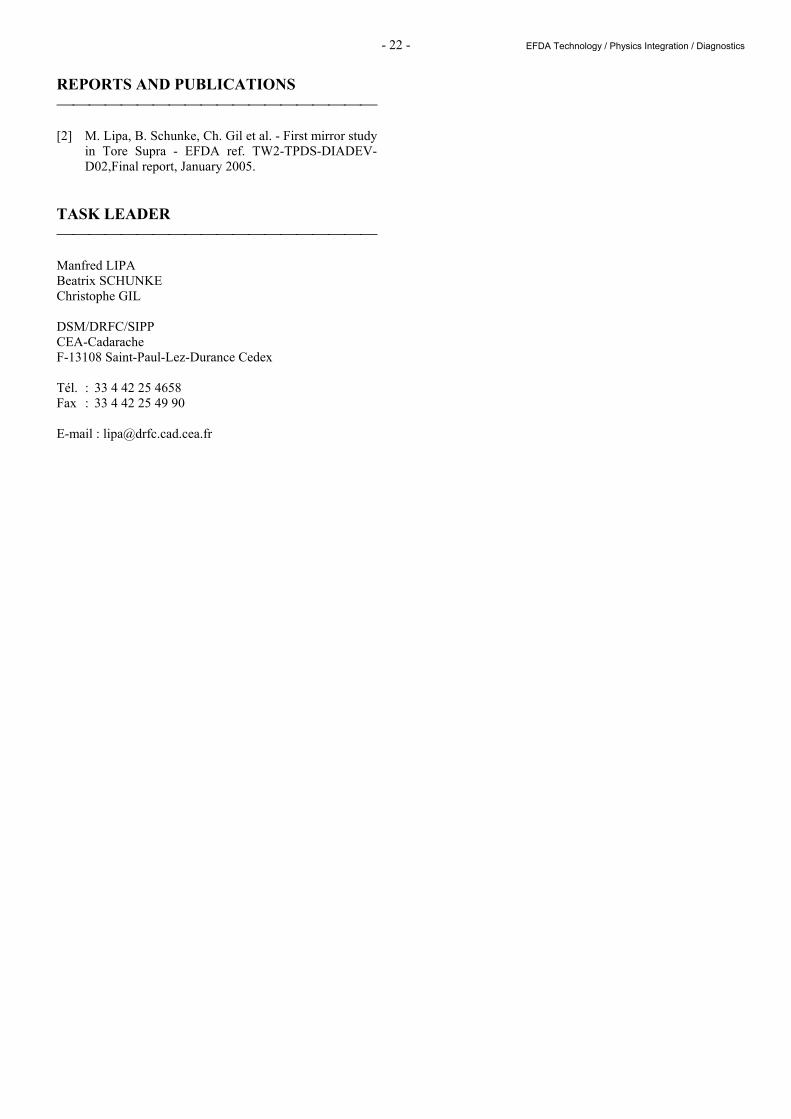
- 22 - EFDA Technology / Physics Integration / Diagnostics
REPORTS AND PUBLICATIONS [2] M. Lipa, B. Schunke, Ch. Gil et al. - First mirror study
in Tore Supra - EFDA ref. TW2-TPDS-DIADEV-D02,Final report, January 2005.
TASK LEADER Manfred LIPA Beatrix SCHUNKE Christophe GIL DSM/DRFC/SIPP CEA-Cadarache F-13108 Saint-Paul-Lez-Durance Cedex Tél. : 33 4 42 25 4658 Fax : 33 4 42 25 49 90 E-mail : [email protected]
- 23 - EFDA Technology / Vessel-In Vessel / Vessel-Blanket and Materials
CEFDA03-1067 Task Title: TW3-TVM-MDB: RULES FOR DESIGN, FABRICATION AND
INSPECTION Establishment and Operation of a Material Database
INTRODUCTION Material research represents a significant part of the European and Worldwide efforts on Fusion research. The properties of new and existing materials need to be known in detail by Designers, by Licensing Authorities and not the least by Material Scientists. The present requirement for a materials Database comes firstly from a need by ITER to establish the status of Fusion materials data for licensing purposes and secondly to consolidate the data so that it is easily available to material researchers in the future, to identify holes in our existing knowledge base and to help establish directions for future material research. The data that are subject of this proposal are those that have been measured and collected as part of the European Fusion program in support of NET and ITER over the past two decades. The database constructed shall in the first instance, concentrate on the mechanical properties and thermal properties of both structural and plasma facing materials collected as part of the Next Step activities. For this purpose UKAEA has been granted a contract as leading Association, with CEA and HAS (Hungarian Academy of Sciences) as supporting associations. The final task report is expected to describe the following aspects of the work done: - A description of the database and its structure. - A list of procedures generated during the database
activity. - A list of users of the database. - A list of contributors to the database and their
contribution. - A list of reports referred to by the database. As one of the supporting associations, CEA will advise the leading Association, UKAEA, throughout the project on the following issues: - The definition of the detailed database structure and
format of the information. - The collection of data. - Checking of data. - Maintenance of database. - Installation, running of database and development of
criteria to access and use the database.
2003-2004 ACTIVITIES Two meetings were held in 2003 and one in 2004, where the progress of work was examined. During the first meeting CEA was asked to help UKAEA with examples of the database format files. These were sent to EFDA and UKAEA and included format files for data collection (product, chemical compositions, tension, impact, impact plots, fracture, creep, fatigue), all with definitions of fields in the databases. Also CEA supplied UKAEA with an example of the Internet server used at CEA for consulting materials properties databases. It was emphasized that in this Intranet system all actions are performed on the server side and the user only needs a simple browser for consulting the databases, extracting data and plotting the figures. Furthermore, the databases can be on local and remote stations. The server in response to a user’s request will instantly fetch data from local or remote servers and presents them on the screen. Since then, UKAEA has presented the latest status of their database, data entry and searching, data templates and administrative tools. They have now extended these by proposals for data qualification and implementation, as well as, future work (short term and long term). CEA has provided extended comments to all parties and two short assessment reports analyzing the work done at UKAEA. It is noted that the progress of the work so far has been satisfactory and promising. The fact that the database uses free and open access software is in particular appreciated. Also the fact that the database can be consulted and maintained via a browser satisfies another main objective of this task. However, there are still some concerns, particularly when new and lesser-known materials are added to database. Most of these will be resolved as the work proceeds and more experience is gained. For this reason the flexibility of the database is important. To ensure perennially of the database it has been proposed and accepted by UKAEA, that the actual data should be independent of the database structure and should permit downloading with all links in a way to be picked up by another database system. Also, a working server configuration should be installed on another server outside the actual UKAEA or JET servers, e.g. at EFDA. With regards to the proposed future work, these are welcomed but should not be at the expense of data collection and verification.
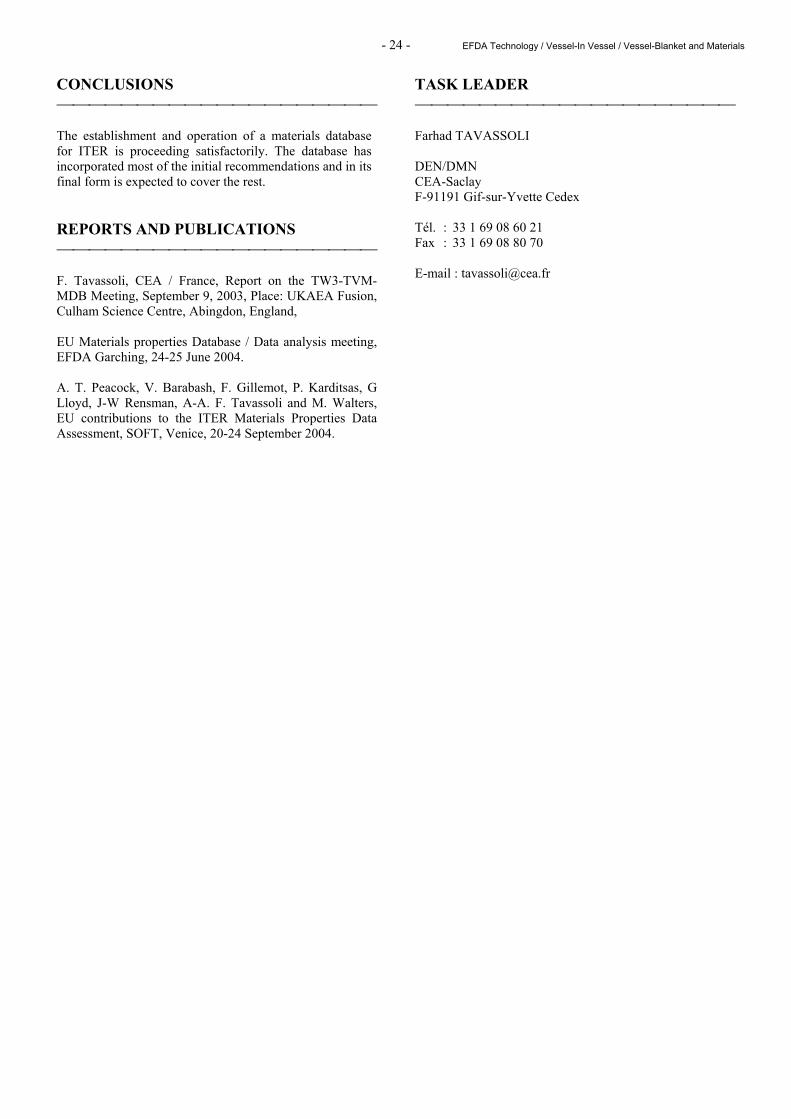
- 24 - EFDA Technology / Vessel-In Vessel / Vessel-Blanket and Materials
CONCLUSIONS The establishment and operation of a materials database for ITER is proceeding satisfactorily. The database has incorporated most of the initial recommendations and in its final form is expected to cover the rest. REPORTS AND PUBLICATIONS F. Tavassoli, CEA / France, Report on the TW3-TVM-MDB Meeting, September 9, 2003, Place: UKAEA Fusion, Culham Science Centre, Abingdon, England, EU Materials properties Database / Data analysis meeting, EFDA Garching, 24-25 June 2004. A. T. Peacock, V. Barabash, F. Gillemot, P. Karditsas, G Lloyd, J-W Rensman, A-A. F. Tavassoli and M. Walters, EU contributions to the ITER Materials Properties Data Assessment, SOFT, Venice, 20-24 September 2004.
TASK LEADER Farhad TAVASSOLI DEN/DMN CEA-Saclay F-91191 Gif-sur-Yvette Cedex Tél. : 33 1 69 08 60 21 Fax : 33 1 69 08 80 70 E-mail : [email protected]
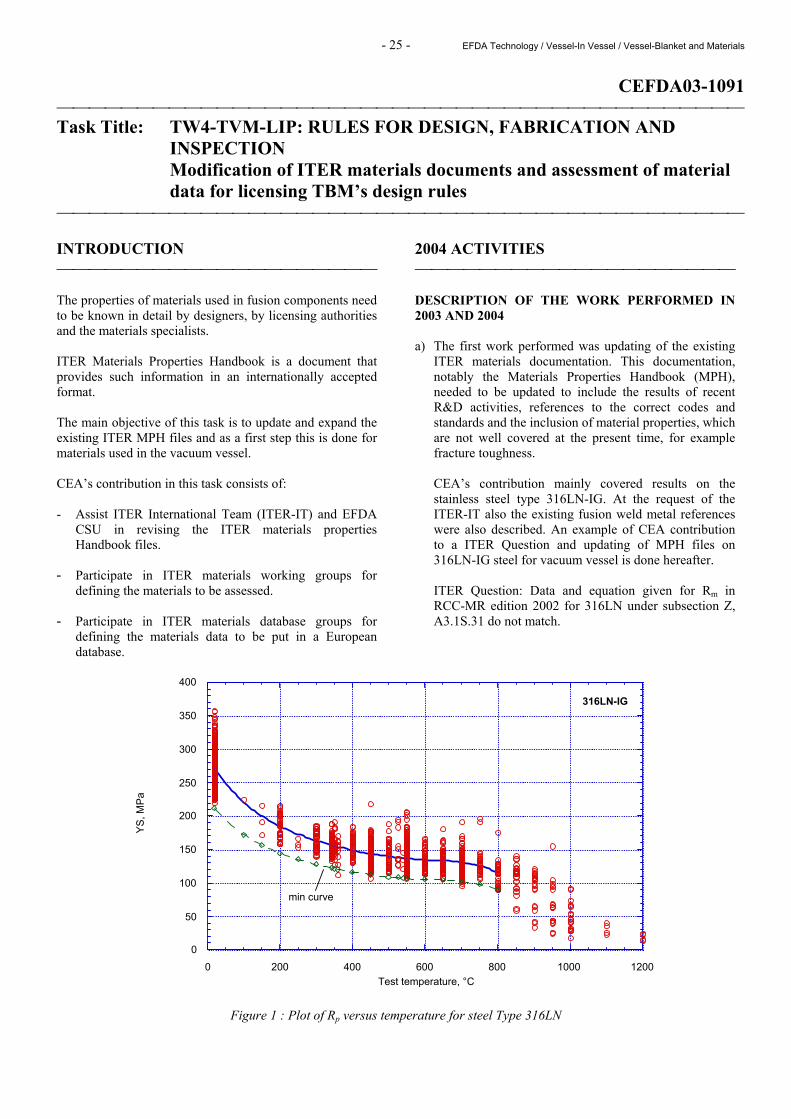
- 25 - EFDA Technology / Vessel-In Vessel / Vessel-Blanket and Materials
CEFDA03-1091 Task Title: TW4-TVM-LIP: RULES FOR DESIGN, FABRICATION AND
INSPECTION Modification of ITER materials documents and assessment of material data for licensing TBM’s design rules
INTRODUCTION The properties of materials used in fusion components need to be known in detail by designers, by licensing authorities and the materials specialists. ITER Materials Properties Handbook is a document that provides such information in an internationally accepted format. The main objective of this task is to update and expand the existing ITER MPH files and as a first step this is done for materials used in the vacuum vessel. CEA’s contribution in this task consists of: - Assist ITER International Team (ITER-IT) and EFDA
CSU in revising the ITER materials properties Handbook files.
- Participate in ITER materials working groups for
defining the materials to be assessed. - Participate in ITER materials database groups for
defining the materials data to be put in a European database.
2004 ACTIVITIES DESCRIPTION OF THE WORK PERFORMED IN 2003 AND 2004 a) The first work performed was updating of the existing
ITER materials documentation. This documentation, notably the Materials Properties Handbook (MPH), needed to be updated to include the results of recent R&D activities, references to the correct codes and standards and the inclusion of material properties, which are not well covered at the present time, for example fracture toughness.
CEA’s contribution mainly covered results on the stainless steel type 316LN-IG. At the request of the ITER-IT also the existing fusion weld metal references were also described. An example of CEA contribution to a ITER Question and updating of MPH files on 316LN-IG steel for vacuum vessel is done hereafter.
ITER Question: Data and equation given for Rm in
RCC-MR edition 2002 for 316LN under subsection Z, A3.1S.31 do not match.
0
50
100
150
200
250
300
350
400
0 200 400 600 800 1000 1200
316LN-IG
YS, M
Pa
Test temperature, °C
min curve
Figure 1 : Plot of Rp versus temperature for steel Type 316LN
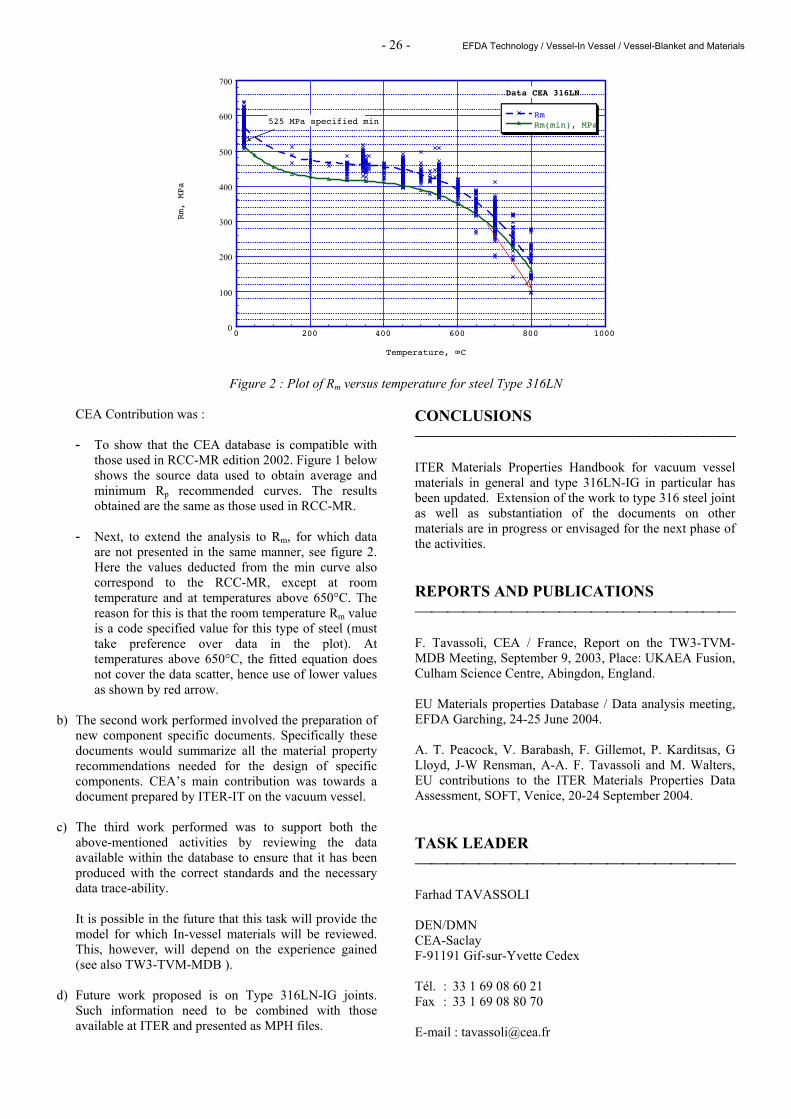
- 26 - EFDA Technology / Vessel-In Vessel / Vessel-Blanket and Materials
0
100
200
300
400
500
600
700
0 200 400 600 800 1000
Data CEA 316LN
RmRm(min), MPa
Rm, MPa
Temperature, ∞C
525 MPa specified min
Figure 2 : Plot of Rm versus temperature for steel Type 316LN CEA Contribution was :
- To show that the CEA database is compatible with
those used in RCC-MR edition 2002. Figure 1 below shows the source data used to obtain average and minimum Rp recommended curves. The results obtained are the same as those used in RCC-MR.
- Next, to extend the analysis to Rm, for which data
are not presented in the same manner, see figure 2. Here the values deducted from the min curve also correspond to the RCC-MR, except at room temperature and at temperatures above 650°C. The reason for this is that the room temperature Rm value is a code specified value for this type of steel (must take preference over data in the plot). At temperatures above 650°C, the fitted equation does not cover the data scatter, hence use of lower values as shown by red arrow.
b) The second work performed involved the preparation of
new component specific documents. Specifically these documents would summarize all the material property recommendations needed for the design of specific components. CEA’s main contribution was towards a document prepared by ITER-IT on the vacuum vessel.
c) The third work performed was to support both the
above-mentioned activities by reviewing the data available within the database to ensure that it has been produced with the correct standards and the necessary data trace-ability.
It is possible in the future that this task will provide the
model for which In-vessel materials will be reviewed. This, however, will depend on the experience gained (see also TW3-TVM-MDB ).
d) Future work proposed is on Type 316LN-IG joints.
Such information need to be combined with those available at ITER and presented as MPH files.
CONCLUSIONS ITER Materials Properties Handbook for vacuum vessel materials in general and type 316LN-IG in particular has been updated. Extension of the work to type 316 steel joint as well as substantiation of the documents on other materials are in progress or envisaged for the next phase of the activities. REPORTS AND PUBLICATIONS F. Tavassoli, CEA / France, Report on the TW3-TVM-MDB Meeting, September 9, 2003, Place: UKAEA Fusion, Culham Science Centre, Abingdon, England. EU Materials properties Database / Data analysis meeting, EFDA Garching, 24-25 June 2004. A. T. Peacock, V. Barabash, F. Gillemot, P. Karditsas, G Lloyd, J-W Rensman, A-A. F. Tavassoli and M. Walters, EU contributions to the ITER Materials Properties Data Assessment, SOFT, Venice, 20-24 September 2004. TASK LEADER Farhad TAVASSOLI DEN/DMN CEA-Saclay F-91191 Gif-sur-Yvette Cedex Tél. : 33 1 69 08 60 21 Fax : 33 1 69 08 80 70 E-mail : [email protected]
- 27 - EFDA Technology / Vessel-In Vessel / Vessel-Blanket and Materials
TW0-T508/05 Task Title: DEVELOPMENT OF Be/CuCrZr BRAZING TECHNIQUES INTRODUCTION The aim of this task is to demonstrate the applicability of induction brazing technologies for manufacturing a Primary First Wall mock-up made from a combination of copper alloy (as heat sink material), stainless steel (as structural material) and beryllium tiles (as an armour material). Up to now several mock-ups using HIP and oven brazing technology were fabricated and thermal fatigue tested. In this task, it has been proposed to evaluate fast brazing and especially, induction brazing in order to limit the over-temperature exposure of the CuCrZr copper alloy. 2004 ACTIVITIES For manufacturing this mock-up, two steps of machining, one HIP cycle and induction brazing were necessary. After the first step of machining, needed to get all the parts required for the fabrication of the mock-up by solid HIP, all the surfaces to be bonded were cleaned and the parts were inserted in a canister to perform the first HIP cycle : diffusion welding between 316LN and CuCrZr. Just after the HIP cycle the mock-up was heat treated in a furnace in which a fast gas quenching was performed. The second step of machining was realised to remove the canister and to obtain the shape needed to realise the junction between the CuCrZr and the beryllium tiles. MATERIAL DESCRIPTION The structural material and the copper alloy, which are used for the fabrication of these mock-ups, are respectively an austenitic stainless steel (316LN) and a copper alloy (CuCrZr). The stainless steel is provided by Tecphy, the CuCrZr is provided by KME under the standard reference Elbrodur type G. Beryllium tiles are provided by Brush Wellman. The brazing alloy used in this study is provided by MIFI-AMETO under the standard grade STEMET 1108. MANUFACTURING OF THE 316/CuCrZr BASE The first step of the assembly consists in inserting the SS tubes in the milled grooves of the copper heat sink and the SS structural part. To complete the manufacturing of the mock-up, the canister was closed and welded. Before degassing, mock-up was helium tested. The HIP cycle applied to the 316/CuCrZr base is the following one : 1040°C/140MPa step 2 hours. To confer good mechanical properties to the CuCrZr after hipping, the HIP cycle was performed in the vessel equipped with a specific tool allowing carrying out a HIP cycle with a cooling rate around 100°C/min.
This specific tooling was developed with TCS Company in the framework of the task TW1-T420-06. INDUCTION BRAZING : PRELIMINARY WORK Induction brazing tests were carried out in the laboratory of Célès Company to validate the final shape of the inductor which was used in CEA/Valduc for the induction brazing of the mock-up PH/S-8J and to validate the parameters (temperature and time) of the cycle of brazing. These tests were carried out on various mock-ups having the same size than the mock-up PH/S-8J. In the laboratory test of the company Célès we used CuCrZr tiles to simulate Be and we used the brazing tool that was designed to be set in a vacuum vessel located in a CEA/Valduc laboratory glove box. The CuCrZr was chosen for safety reasons but also because the thermal conduction and electrical resistance of this material is quite the same than beryllium. For a good positioning of the beryllium tiles a special tool was designed and tested (figure 1).
Figure 1 : View of the tool used for the brazing of the mock-up
During the tests performed in the laboratory of Célès company we have noted that: - When the inductor is not parallel to the surface of the
mock-up or when there is a bad contact between the tiles and the base of CuCrZr/SS, there is a variation of about 100°C between the temperature recorded on the right side and the left side.
- The power delivered by the generator is lower when the inductor touches the mock-up.
The last test performed in the Célès laboratory was the brazing of four CuCrZr tiles on a SS/CuCrZr base. This brazing was carried out in three steps : first step brazing of the two tiles, second step decrease of the temperature under 350°C, third step brazing of the two other tiles.
Screw used to apply the load
Inductor
Insulating material
Thermocouples
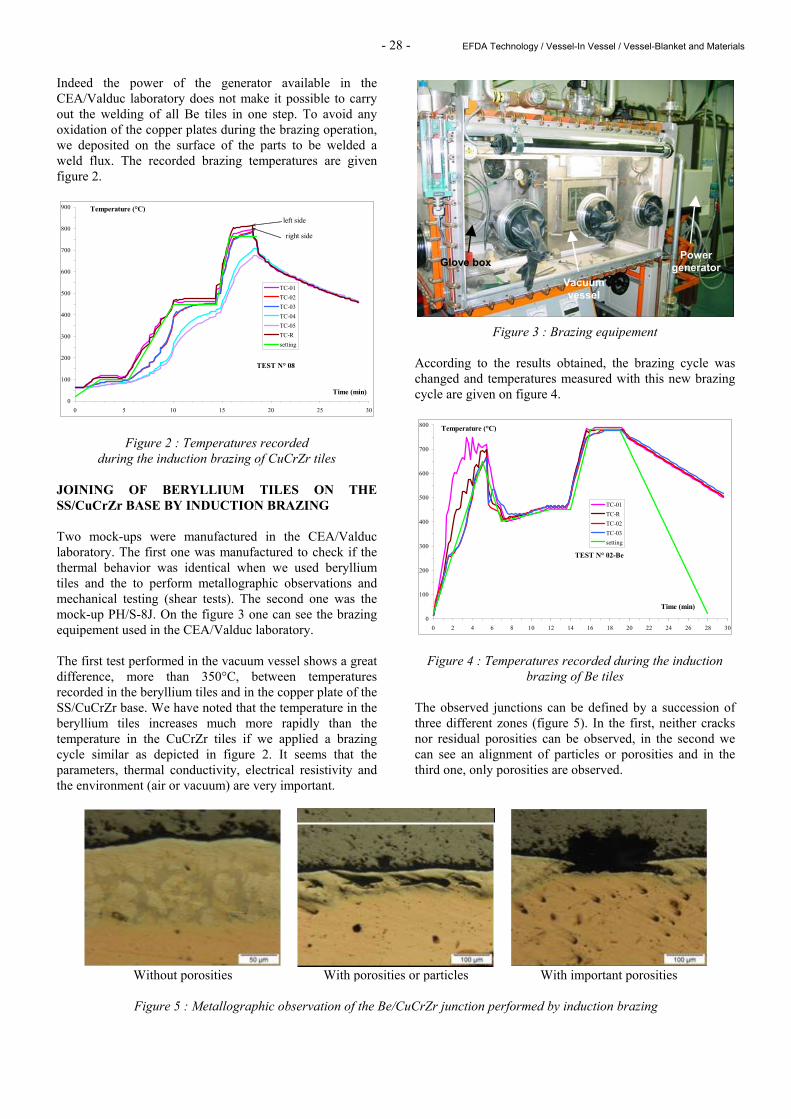
- 28 - EFDA Technology / Vessel-In Vessel / Vessel-Blanket and Materials
Indeed the power of the generator available in the CEA/Valduc laboratory does not make it possible to carry out the welding of all Be tiles in one step. To avoid any oxidation of the copper plates during the brazing operation, we deposited on the surface of the parts to be welded a weld flux. The recorded brazing temperatures are given figure 2.
TEST N° 08
0
100
200
300
400
500
600
700
800
900
0 5 10 15 20 25 30
Time (min)
Temperature (°C)
TC-01TC-02TC-03TC-04TC-05TC-Rsetting
left side
right side
Figure 2 : Temperatures recorded during the induction brazing of CuCrZr tiles
JOINING OF BERYLLIUM TILES ON THE SS/CuCrZr BASE BY INDUCTION BRAZING Two mock-ups were manufactured in the CEA/Valduc laboratory. The first one was manufactured to check if the thermal behavior was identical when we used beryllium tiles and the to perform metallographic observations and mechanical testing (shear tests). The second one was the mock-up PH/S-8J. On the figure 3 one can see the brazing equipement used in the CEA/Valduc laboratory. The first test performed in the vacuum vessel shows a great difference, more than 350°C, between temperatures recorded in the beryllium tiles and in the copper plate of the SS/CuCrZr base. We have noted that the temperature in the beryllium tiles increases much more rapidly than the temperature in the CuCrZr tiles if we applied a brazing cycle similar as depicted in figure 2. It seems that the parameters, thermal conductivity, electrical resistivity and the environment (air or vacuum) are very important.
Figure 3 : Brazing equipement According to the results obtained, the brazing cycle was changed and temperatures measured with this new brazing cycle are given on figure 4.
TEST N° 02-Be
0
100
200
300
400
500
600
700
800
0 2 4 6 8 10 12 14 16 18 20 22 24 26 28 30
Time (min)
Temperature (°C)
TC-01TC-RTC-02TC-03setting
Figure 4 : Temperatures recorded during the induction brazing of Be tiles
The observed junctions can be defined by a succession of three different zones (figure 5). In the first, neither cracks nor residual porosities can be observed, in the second we can see an alignment of particles or porosities and in the third one, only porosities are observed.
Without porosities With porosities or particles With important porosities
Figure 5 : Metallographic observation of the Be/CuCrZr junction performed by induction brazing
Power generator
Vacuum vessel
Glove box
- 29 - EFDA Technology / Vessel-In Vessel / Vessel-Blanket and Materials
Shear tests were performed on CuCrZr/Be junction at 20°C. The specimens had the following geometry: 25 x 25 x 30 mm. Ultimate shear strengths are given in table 1.
Table 1 : Ultimate shear strength of the Be/CuCrZr
Task Specimen n° T (°C) (KN) (MPa)
T508-05 Cu/Be-01 20 36.8 59
T508-05 Cu/Be-02 20 3.2 5 Figure 6 shows the fracture surfaces of one of the samples after shear testing. We can notice on this sample a line that represents the junction between the two sheets of the brazing alloy.
Figure 6 : Shear sample after testing
INDUCTION BRAZING OF THE MOCK-UP PH/S-8J As for the trial mock-up, the brazing of the mock-up PH/S-8J was performed in three steps. On the figure 7 a view of the mock-up is given after the first step of brazing.
Figure 7 : View of the mock-up PH/S-8J after the first step of induction brazing
The temperatures recorded during the first of induction brazing are given here after.
TEST N° 04-Be
0
100
200
300
400
500
600
700
800
0 2 4 6 8 10 12 14 16 18 20 22 24 26 28 30
Time (min)
Temperature (°C)
TC-01TC-RTC-02TC-03setting
After the brazing cycles, the coolant channels were welded on the mock-up PH/S-8J. A picture of the mock-up after this last step of assembly is given on figure 8. The mock-up has been delivered and ultra sonic tested. No defects were found on the whole beryllium copper junctions.
CONCLUSIONS The main conclusions of this study are the following: - We succeed in developing a brazing process to weld
beryllium tiles on a CuCrZr alloy. - The parameters of the brazing cycle which have been
optimised with the copper tiles did not give the same temperature field with the beryllium tiles. The process parameters are much dependant on the materials to be brazed and on the environment (air/vacuum).
- With the chosen brazing cycle; the Stemet foils did not
melt completely at the edge of the mock-up. The temperature reached during the plateau is not high enough or there is a too important gradient of temperature on this point.
- The cooling rate reached in the vacuum vessel used to
braze the beryllium tiles is not high enough to confer to the CuCrZr material good mechanical properties. We expect a significant loss of strength of the copper alloy close to the beryllium tiles.
Stemet foil
Insulating material
inductor
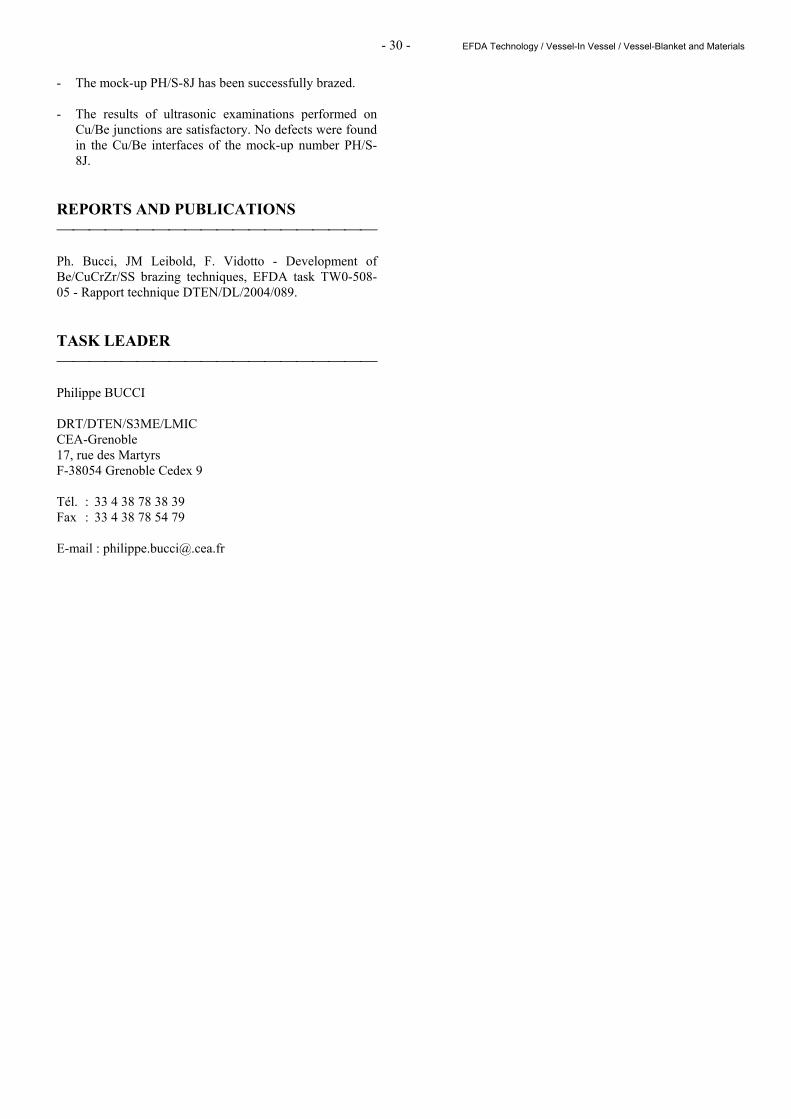
- 30 - EFDA Technology / Vessel-In Vessel / Vessel-Blanket and Materials
- The mock-up PH/S-8J has been successfully brazed. - The results of ultrasonic examinations performed on
Cu/Be junctions are satisfactory. No defects were found in the Cu/Be interfaces of the mock-up number PH/S-8J.
REPORTS AND PUBLICATIONS Ph. Bucci, JM Leibold, F. Vidotto - Development of Be/CuCrZr/SS brazing techniques, EFDA task TW0-508-05 - Rapport technique DTEN/DL/2004/089. TASK LEADER Philippe BUCCI DRT/DTEN/S3ME/LMIC CEA-Grenoble 17, rue des Martyrs F-38054 Grenoble Cedex 9 Tél. : 33 4 38 78 38 39 Fax : 33 4 38 78 54 79 E-mail : [email protected]
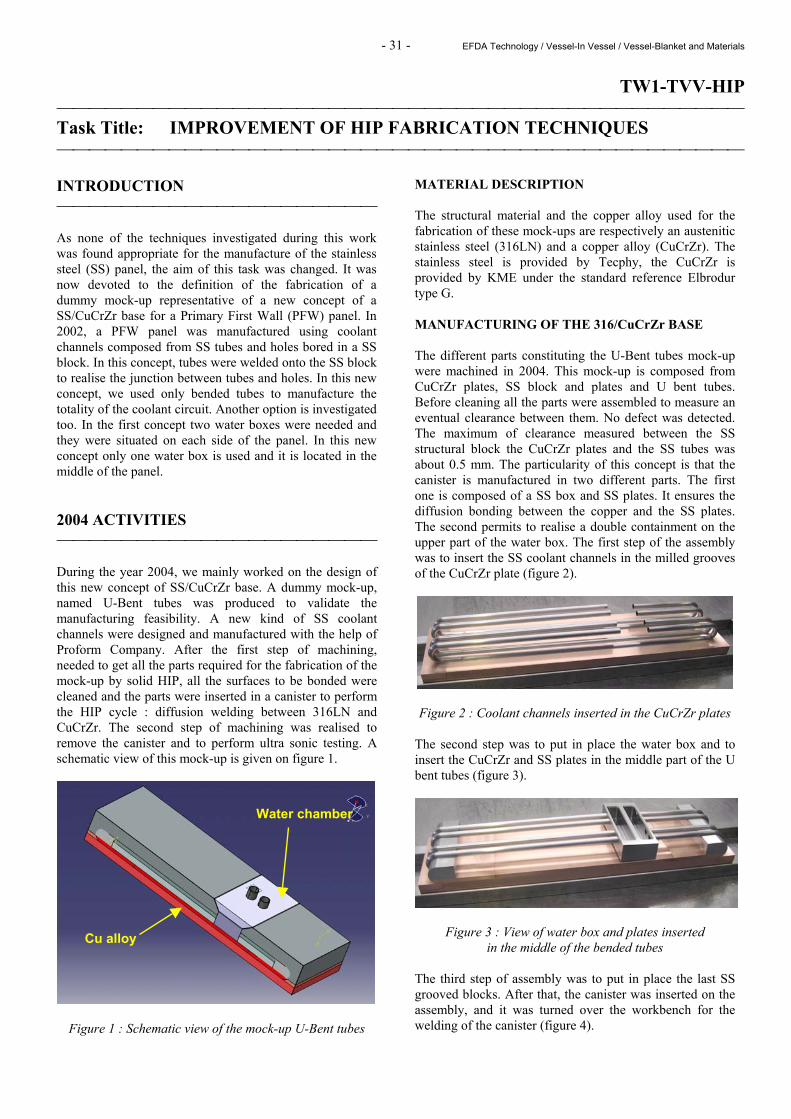
- 31 - EFDA Technology / Vessel-In Vessel / Vessel-Blanket and Materials
TW1-TVV-HIP Task Title: IMPROVEMENT OF HIP FABRICATION TECHNIQUES INTRODUCTION As none of the techniques investigated during this work was found appropriate for the manufacture of the stainless steel (SS) panel, the aim of this task was changed. It was now devoted to the definition of the fabrication of a dummy mock-up representative of a new concept of a SS/CuCrZr base for a Primary First Wall (PFW) panel. In 2002, a PFW panel was manufactured using coolant channels composed from SS tubes and holes bored in a SS block. In this concept, tubes were welded onto the SS block to realise the junction between tubes and holes. In this new concept, we used only bended tubes to manufacture the totality of the coolant circuit. Another option is investigated too. In the first concept two water boxes were needed and they were situated on each side of the panel. In this new concept only one water box is used and it is located in the middle of the panel. 2004 ACTIVITIES During the year 2004, we mainly worked on the design of this new concept of SS/CuCrZr base. A dummy mock-up, named U-Bent tubes was produced to validate the manufacturing feasibility. A new kind of SS coolant channels were designed and manufactured with the help of Proform Company. After the first step of machining, needed to get all the parts required for the fabrication of the mock-up by solid HIP, all the surfaces to be bonded were cleaned and the parts were inserted in a canister to perform the HIP cycle : diffusion welding between 316LN and CuCrZr. The second step of machining was realised to remove the canister and to perform ultra sonic testing. A schematic view of this mock-up is given on figure 1.
Figure 1 : Schematic view of the mock-up U-Bent tubes
MATERIAL DESCRIPTION The structural material and the copper alloy used for the fabrication of these mock-ups are respectively an austenitic stainless steel (316LN) and a copper alloy (CuCrZr). The stainless steel is provided by Tecphy, the CuCrZr is provided by KME under the standard reference Elbrodur type G. MANUFACTURING OF THE 316/CuCrZr BASE The different parts constituting the U-Bent tubes mock-up were machined in 2004. This mock-up is composed from CuCrZr plates, SS block and plates and U bent tubes. Before cleaning all the parts were assembled to measure an eventual clearance between them. No defect was detected. The maximum of clearance measured between the SS structural block the CuCrZr plates and the SS tubes was about 0.5 mm. The particularity of this concept is that the canister is manufactured in two different parts. The first one is composed of a SS box and SS plates. It ensures the diffusion bonding between the copper and the SS plates. The second permits to realise a double containment on the upper part of the water box. The first step of the assembly was to insert the SS coolant channels in the milled grooves of the CuCrZr plate (figure 2).
Figure 2 : Coolant channels inserted in the CuCrZr plates
The second step was to put in place the water box and to insert the CuCrZr and SS plates in the middle part of the U bent tubes (figure 3).
Figure 3 : View of water box and plates inserted in the middle of the bended tubes
The third step of assembly was to put in place the last SS grooved blocks. After that, the canister was inserted on the assembly, and it was turned over the workbench for the welding of the canister (figure 4).
Cu alloy
Water chamber
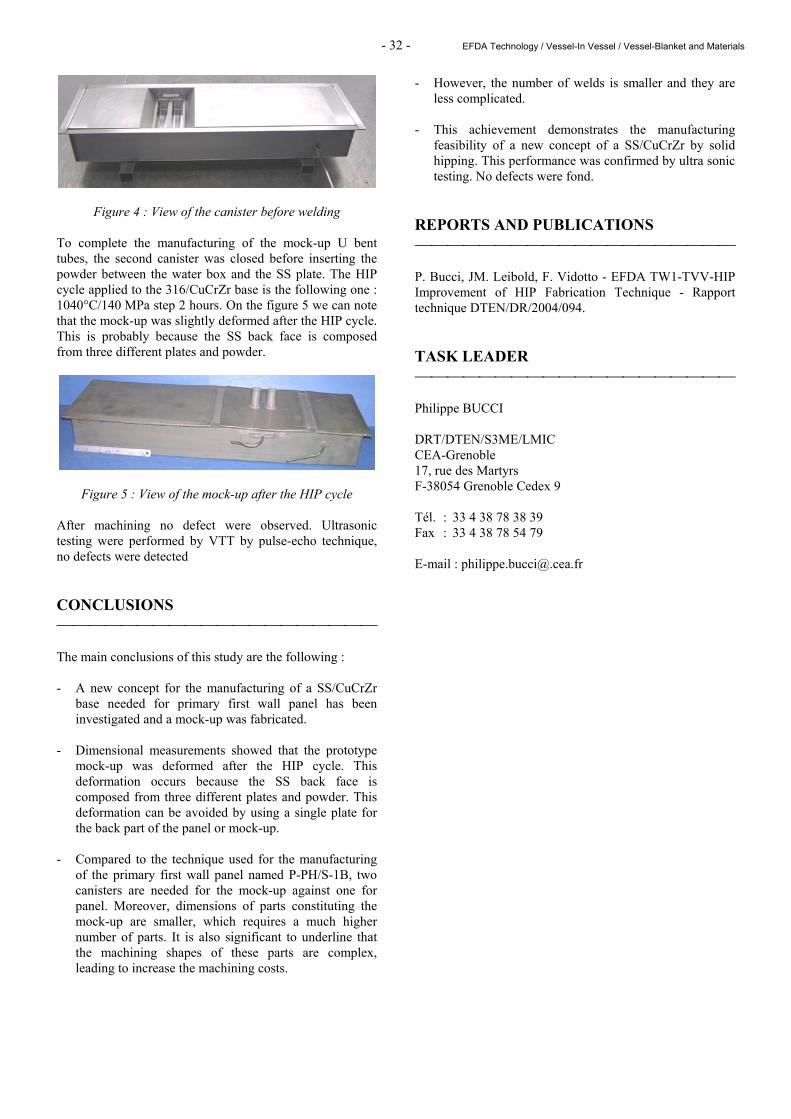
- 32 - EFDA Technology / Vessel-In Vessel / Vessel-Blanket and Materials
Figure 4 : View of the canister before welding To complete the manufacturing of the mock-up U bent tubes, the second canister was closed before inserting the powder between the water box and the SS plate. The HIP cycle applied to the 316/CuCrZr base is the following one : 1040°C/140 MPa step 2 hours. On the figure 5 we can note that the mock-up was slightly deformed after the HIP cycle. This is probably because the SS back face is composed from three different plates and powder.
Figure 5 : View of the mock-up after the HIP cycle After machining no defect were observed. Ultrasonic testing were performed by VTT by pulse-echo technique, no defects were detected CONCLUSIONS The main conclusions of this study are the following : - A new concept for the manufacturing of a SS/CuCrZr
base needed for primary first wall panel has been investigated and a mock-up was fabricated.
- Dimensional measurements showed that the prototype
mock-up was deformed after the HIP cycle. This deformation occurs because the SS back face is composed from three different plates and powder. This deformation can be avoided by using a single plate for the back part of the panel or mock-up.
- Compared to the technique used for the manufacturing
of the primary first wall panel named P-PH/S-1B, two canisters are needed for the mock-up against one for panel. Moreover, dimensions of parts constituting the mock-up are smaller, which requires a much higher number of parts. It is also significant to underline that the machining shapes of these parts are complex, leading to increase the machining costs.
- However, the number of welds is smaller and they are less complicated.
- This achievement demonstrates the manufacturing
feasibility of a new concept of a SS/CuCrZr by solid hipping. This performance was confirmed by ultra sonic testing. No defects were fond.
REPORTS AND PUBLICATIONS P. Bucci, JM. Leibold, F. Vidotto - EFDA TW1-TVV-HIP Improvement of HIP Fabrication Technique - Rapport technique DTEN/DR/2004/094. TASK LEADER Philippe BUCCI DRT/DTEN/S3ME/LMIC CEA-Grenoble 17, rue des Martyrs F-38054 Grenoble Cedex 9 Tél. : 33 4 38 78 38 39 Fax : 33 4 38 78 54 79 E-mail : [email protected]
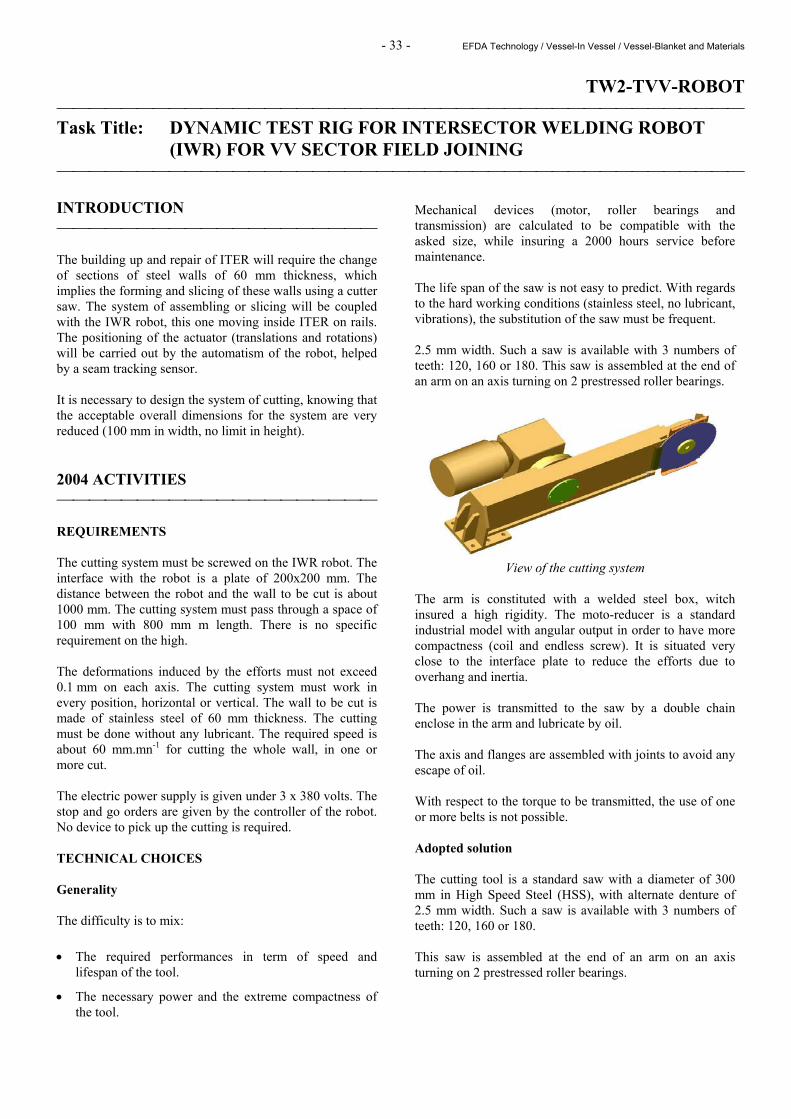
- 33 - EFDA Technology / Vessel-In Vessel / Vessel-Blanket and Materials
TW2-TVV-ROBOT Task Title: DYNAMIC TEST RIG FOR INTERSECTOR WELDING ROBOT
(IWR) FOR VV SECTOR FIELD JOINING INTRODUCTION The building up and repair of ITER will require the change of sections of steel walls of 60 mm thickness, which implies the forming and slicing of these walls using a cutter saw. The system of assembling or slicing will be coupled with the IWR robot, this one moving inside ITER on rails. The positioning of the actuator (translations and rotations) will be carried out by the automatism of the robot, helped by a seam tracking sensor. It is necessary to design the system of cutting, knowing that the acceptable overall dimensions for the system are very reduced (100 mm in width, no limit in height). 2004 ACTIVITIES REQUIREMENTS The cutting system must be screwed on the IWR robot. The interface with the robot is a plate of 200x200 mm. The distance between the robot and the wall to be cut is about 1000 mm. The cutting system must pass through a space of 100 mm with 800 mm m length. There is no specific requirement on the high. The deformations induced by the efforts must not exceed 0.1 mm on each axis. The cutting system must work in every position, horizontal or vertical. The wall to be cut is made of stainless steel of 60 mm thickness. The cutting must be done without any lubricant. The required speed is about 60 mm.mn-1 for cutting the whole wall, in one or more cut. The electric power supply is given under 3 x 380 volts. The stop and go orders are given by the controller of the robot. No device to pick up the cutting is required. TECHNICAL CHOICES Generality The difficulty is to mix: • The required performances in term of speed and
lifespan of the tool.
• The necessary power and the extreme compactness of the tool.
Mechanical devices (motor, roller bearings and transmission) are calculated to be compatible with the asked size, while insuring a 2000 hours service before maintenance. The life span of the saw is not easy to predict. With regards to the hard working conditions (stainless steel, no lubricant, vibrations), the substitution of the saw must be frequent. 2.5 mm width. Such a saw is available with 3 numbers of teeth: 120, 160 or 180. This saw is assembled at the end of an arm on an axis turning on 2 prestressed roller bearings.
View of the cutting system The arm is constituted with a welded steel box, witch insured a high rigidity. The moto-reducer is a standard industrial model with angular output in order to have more compactness (coil and endless screw). It is situated very close to the interface plate to reduce the efforts due to overhang and inertia. The power is transmitted to the saw by a double chain enclose in the arm and lubricate by oil. The axis and flanges are assembled with joints to avoid any escape of oil. With respect to the torque to be transmitted, the use of one or more belts is not possible. Adopted solution The cutting tool is a standard saw with a diameter of 300 mm in High Speed Steel (HSS), with alternate denture of 2.5 mm width. Such a saw is available with 3 numbers of teeth: 120, 160 or 180. This saw is assembled at the end of an arm on an axis turning on 2 prestressed roller bearings.
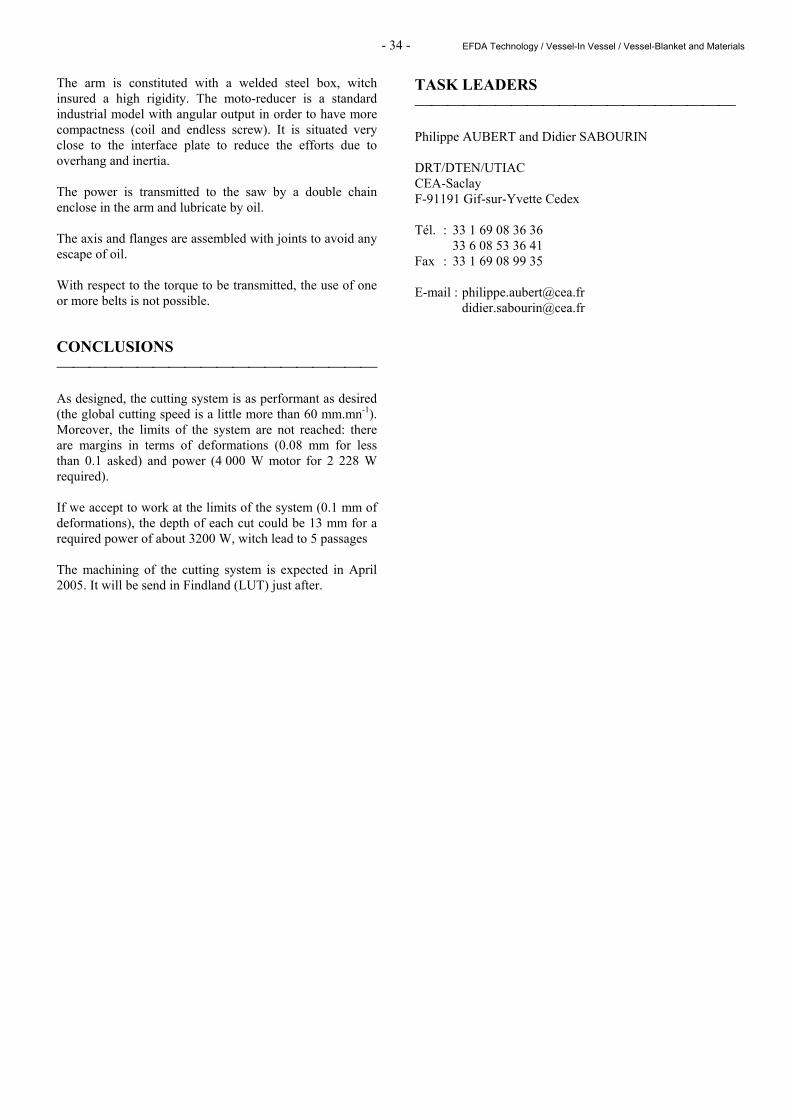
- 34 - EFDA Technology / Vessel-In Vessel / Vessel-Blanket and Materials
The arm is constituted with a welded steel box, witch insured a high rigidity. The moto-reducer is a standard industrial model with angular output in order to have more compactness (coil and endless screw). It is situated very close to the interface plate to reduce the efforts due to overhang and inertia. The power is transmitted to the saw by a double chain enclose in the arm and lubricate by oil. The axis and flanges are assembled with joints to avoid any escape of oil. With respect to the torque to be transmitted, the use of one or more belts is not possible. CONCLUSIONS As designed, the cutting system is as performant as desired (the global cutting speed is a little more than 60 mm.mn-1). Moreover, the limits of the system are not reached: there are margins in terms of deformations (0.08 mm for less than 0.1 asked) and power (4 000 W motor for 2 228 W required). If we accept to work at the limits of the system (0.1 mm of deformations), the depth of each cut could be 13 mm for a required power of about 3200 W, witch lead to 5 passages The machining of the cutting system is expected in April 2005. It will be send in Findland (LUT) just after.
TASK LEADERS Philippe AUBERT and Didier SABOURIN DRT/DTEN/UTIAC CEA-Saclay F-91191 Gif-sur-Yvette Cedex Tél. : 33 1 69 08 36 36 33 6 08 53 36 41 Fax : 33 1 69 08 99 35 E-mail : [email protected] [email protected]
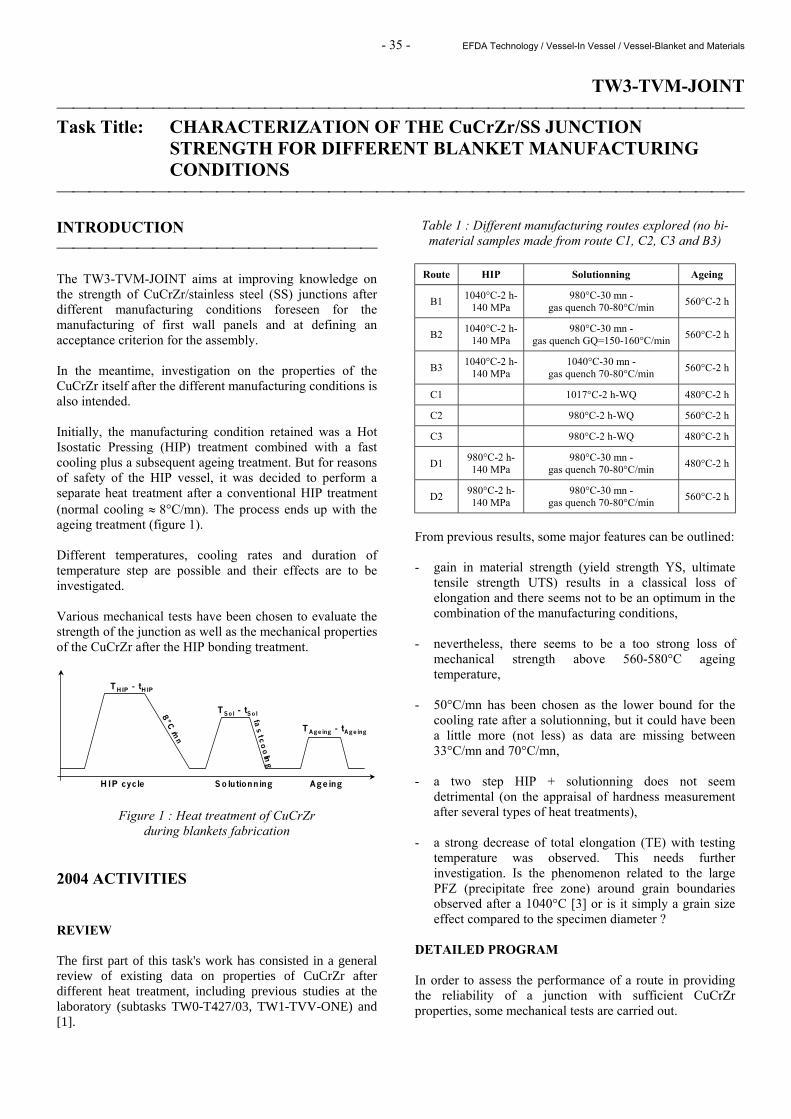
- 35 - EFDA Technology / Vessel-In Vessel / Vessel-Blanket and Materials
TW3-TVM-JOINT Task Title: CHARACTERIZATION OF THE CuCrZr/SS JUNCTION
STRENGTH FOR DIFFERENT BLANKET MANUFACTURING CONDITIONS
INTRODUCTION The TW3-TVM-JOINT aims at improving knowledge on the strength of CuCrZr/stainless steel (SS) junctions after different manufacturing conditions foreseen for the manufacturing of first wall panels and at defining an acceptance criterion for the assembly. In the meantime, investigation on the properties of the CuCrZr itself after the different manufacturing conditions is also intended. Initially, the manufacturing condition retained was a Hot Isostatic Pressing (HIP) treatment combined with a fast cooling plus a subsequent ageing treatment. But for reasons of safety of the HIP vessel, it was decided to perform a separate heat treatment after a conventional HIP treatment (normal cooling ≈ 8°C/mn). The process ends up with the ageing treatment (figure 1). Different temperatures, cooling rates and duration of temperature step are possible and their effects are to be investigated. Various mechanical tests have been chosen to evaluate the strength of the junction as well as the mechanical properties of the CuCrZr after the HIP bonding treatment.
B1 1040°C-2 h-140 MPa
980°C-30 mn - gas quench 70-80°C/min 560°C-2 h
B2 1040°C-2 h-140 MPa
980°C-30 mn - gas quench GQ=150-160°C/min 560°C-2 h
B3 1040°C-2 h-140 MPa
1040°C-30 mn - gas quench 70-80°C/min 560°C-2 h
C1 1017°C-2 h-WQ 480°C-2 h
C2 980°C-2 h-WQ 560°C-2 h
C3 980°C-2 h-WQ 480°C-2 h
D1 980°C-2 h-140 MPa
980°C-30 mn - gas quench 70-80°C/min 480°C-2 h
D2 980°C-2 h-140 MPa
980°C-30 mn - gas quench 70-80°C/min 560°C-2 h
From previous results, some major features can be outlined: - gain in material strength (yield strength YS, ultimate
tensile strength UTS) results in a classical loss of elongation and there seems not to be an optimum in the combination of the manufacturing conditions,
- nevertheless, there seems to be a too strong loss of
mechanical strength above 560-580°C ageing temperature,
- 50°C/mn has been chosen as the lower bound for the
cooling rate after a solutionning, but it could have been a little more (not less) as data are missing between 33°C/mn and 70°C/mn,
- a two step HIP + solutionning does not seem
detrimental (on the appraisal of hardness measurement after several types of heat treatments),
- a strong decrease of total elongation (TE) with testing
temperature was observed. This needs further investigation. Is the phenomenon related to the large PFZ (precipitate free zone) around grain boundaries observed after a 1040°C [3] or is it simply a grain size effect compared to the specimen diameter ?
DETAILED PROGRAM In order to assess the performance of a route in providing the reliability of a junction with sufficient CuCrZr properties, some mechanical tests are carried out.
THIP - tHIP
8°C
/mn
TSol - tSol
So lutionning Ageing
TAgeing - tAgeing
HIP cycle
fas
t co
olin
g
Figure 1 : Heat treatment of CuCrZr during blankets fabrication
2004 ACTIVITIES REVIEW The first part of this task's work has consisted in a general review of existing data on properties of CuCrZr after different heat treatment, including previous studies at the laboratory (subtasks TW0-T427/03, TW1-TVV-ONE) and [1].
Table 1 : Different manufacturing routes explored (no bi-material samples made from route C1, C2, C3 and B3)
Route HIP Solutionning Ageing
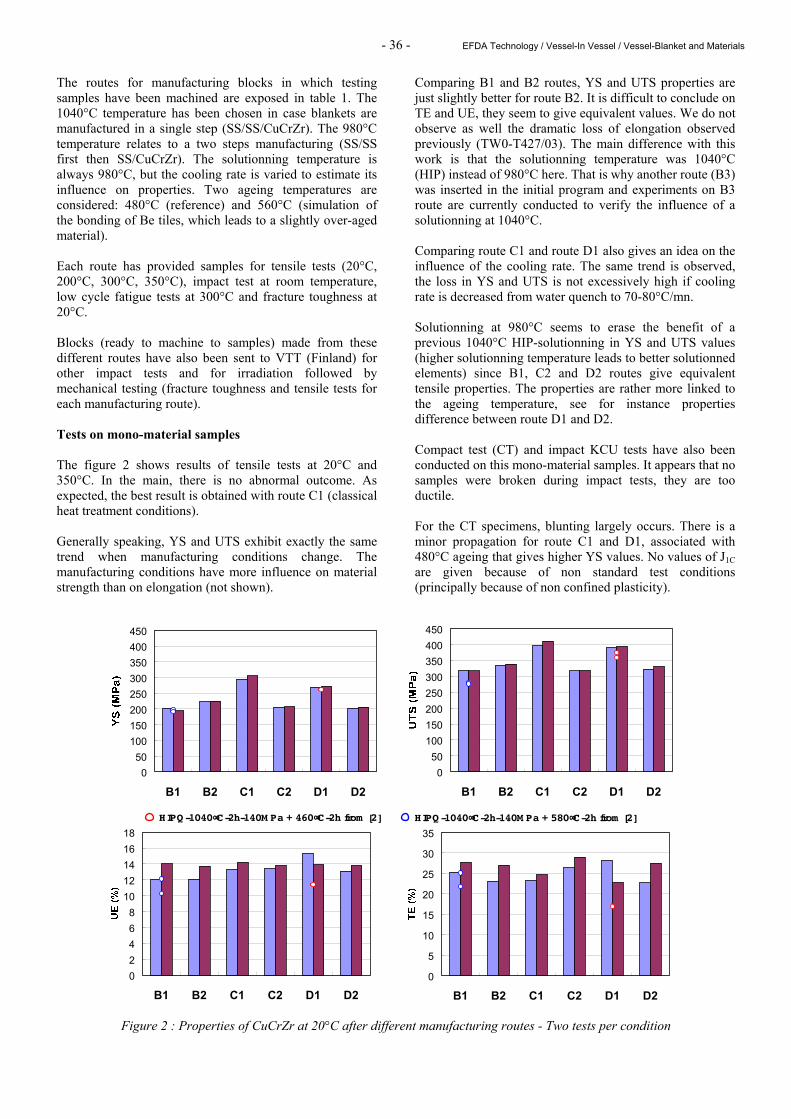
- 36 - EFDA Technology / Vessel-In Vessel / Vessel-Blanket and Materials
The routes for manufacturing blocks in which testing samples have been machined are exposed in table 1. The 1040°C temperature has been chosen in case blankets are manufactured in a single step (SS/SS/CuCrZr). The 980°C temperature relates to a two steps manufacturing (SS/SS first then SS/CuCrZr). The solutionning temperature is always 980°C, but the cooling rate is varied to estimate its influence on properties. Two ageing temperatures are considered: 480°C (reference) and 560°C (simulation of the bonding of Be tiles, which leads to a slightly over-aged material). Each route has provided samples for tensile tests (20°C, 200°C, 300°C, 350°C), impact test at room temperature, low cycle fatigue tests at 300°C and fracture toughness at 20°C. Blocks (ready to machine to samples) made from these different routes have also been sent to VTT (Finland) for other impact tests and for irradiation followed by mechanical testing (fracture toughness and tensile tests for each manufacturing route). Tests on mono-material samples The figure 2 shows results of tensile tests at 20°C and 350°C. In the main, there is no abnormal outcome. As expected, the best result is obtained with route C1 (classical heat treatment conditions). Generally speaking, YS and UTS exhibit exactly the same trend when manufacturing conditions change. The manufacturing conditions have more influence on material strength than on elongation (not shown).
Comparing B1 and B2 routes, YS and UTS properties are just slightly better for route B2. It is difficult to conclude on TE and UE, they seem to give equivalent values. We do not observe as well the dramatic loss of elongation observed previously (TW0-T427/03). The main difference with this work is that the solutionning temperature was 1040°C (HIP) instead of 980°C here. That is why another route (B3) was inserted in the initial program and experiments on B3 route are currently conducted to verify the influence of a solutionning at 1040°C. Comparing route C1 and route D1 also gives an idea on the influence of the cooling rate. The same trend is observed, the loss in YS and UTS is not excessively high if cooling rate is decreased from water quench to 70-80°C/mn. Solutionning at 980°C seems to erase the benefit of a previous 1040°C HIP-solutionning in YS and UTS values (higher solutionning temperature leads to better solutionned elements) since B1, C2 and D2 routes give equivalent tensile properties. The properties are rather more linked to the ageing temperature, see for instance properties difference between route D1 and D2. Compact test (CT) and impact KCU tests have also been conducted on this mono-material samples. It appears that no samples were broken during impact tests, they are too ductile. For the CT specimens, blunting largely occurs. There is a minor propagation for route C1 and D1, associated with 480°C ageing that gives higher YS values. No values of J1C are given because of non standard test conditions (principally because of non confined plasticity).
050
100150200250300350400450
B1 B2 C1 C2 D1 D2
050
100150200250300350400450
B1 B2 C1 C2 D1 D2
HIPQ-1040∞C-2h-140M Pa + 580∞C-2h from [2]HIPQ-1040∞C-2h-140M Pa + 460∞C-2h from [2]
02468
1012141618
B1 B2 C1 C2 D1 D2
0
5
10
15
20
25
30
35
B1 B2 C1 C2 D1 D2
Figure 2 : Properties of CuCrZr at 20°C after different manufacturing routes - Two tests per condition
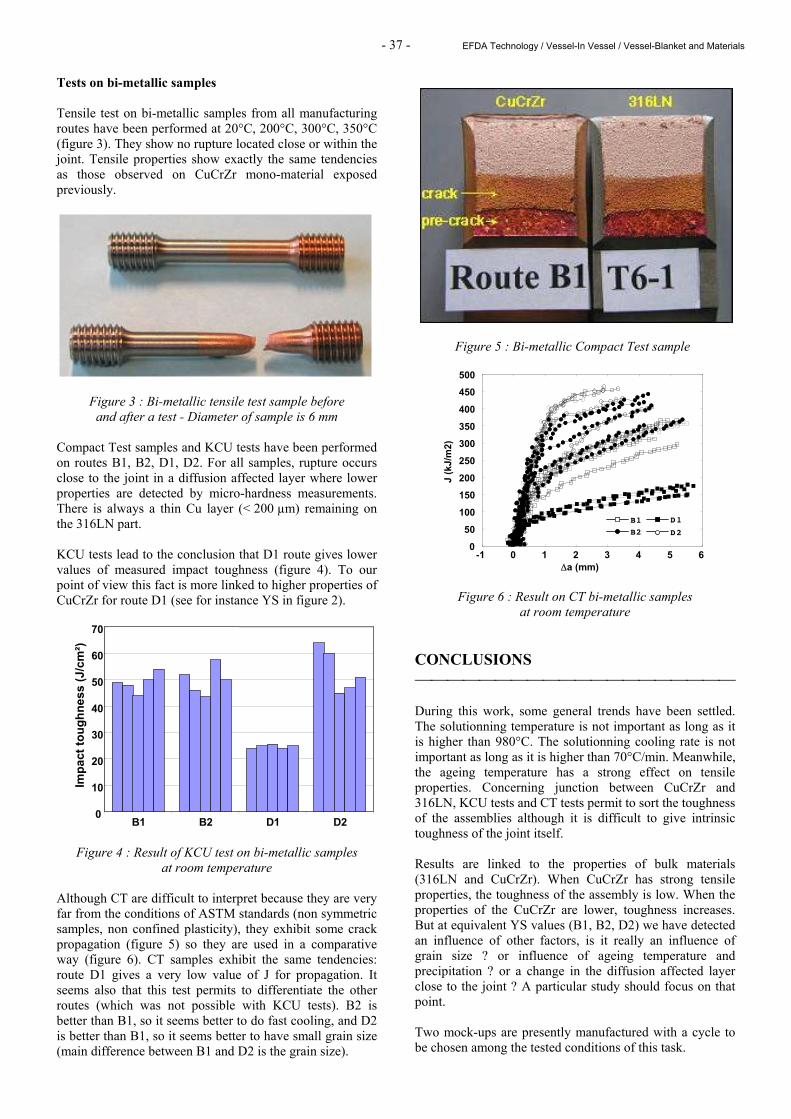
- 37 - EFDA Technology / Vessel-In Vessel / Vessel-Blanket and Materials
Tests on bi-metallic samples Tensile test on bi-metallic samples from all manufacturing routes have been performed at 20°C, 200°C, 300°C, 350°C (figure 3). They show no rupture located close or within the joint. Tensile properties show exactly the same tendencies as those observed on CuCrZr mono-material exposed previously.
Figure 3 : Bi-metallic tensile test sample before and after a test - Diameter of sample is 6 mm
Compact Test samples and KCU tests have been performed on routes B1, B2, D1, D2. For all samples, rupture occurs close to the joint in a diffusion affected layer where lower properties are detected by micro-hardness measurements. There is always a thin Cu layer (< 200 µm) remaining on the 316LN part. KCU tests lead to the conclusion that D1 route gives lower values of measured impact toughness (figure 4). To our point of view this fact is more linked to higher properties of CuCrZr for route D1 (see for instance YS in figure 2).
0
10
20
30
40
50
60
70
B1 B2 D1 D2
Impa
ct to
ughn
ess
(J/c
m²)
Figure 4 : Result of KCU test on bi-metallic samples at room temperature
Although CT are difficult to interpret because they are very far from the conditions of ASTM standards (non symmetric samples, non confined plasticity), they exhibit some crack propagation (figure 5) so they are used in a comparative way (figure 6). CT samples exhibit the same tendencies: route D1 gives a very low value of J for propagation. It seems also that this test permits to differentiate the other routes (which was not possible with KCU tests). B2 is better than B1, so it seems better to do fast cooling, and D2 is better than B1, so it seems better to have small grain size (main difference between B1 and D2 is the grain size).
Figure 5 : Bi-metallic Compact Test sample
050
100150200250300350400450500
-1 0 1 2 3 4 5 6
J (k
J/m
2)
∆a (mm)
D2B2
D1B1
Figure 6 : Result on CT bi-metallic samples at room temperature
CONCLUSIONS During this work, some general trends have been settled. The solutionning temperature is not important as long as it is higher than 980°C. The solutionning cooling rate is not important as long as it is higher than 70°C/min. Meanwhile, the ageing temperature has a strong effect on tensile properties. Concerning junction between CuCrZr and 316LN, KCU tests and CT tests permit to sort the toughness of the assemblies although it is difficult to give intrinsic toughness of the joint itself. Results are linked to the properties of bulk materials (316LN and CuCrZr). When CuCrZr has strong tensile properties, the toughness of the assembly is low. When the properties of the CuCrZr are lower, toughness increases. But at equivalent YS values (B1, B2, D2) we have detected an influence of other factors, is it really an influence of grain size ? or influence of ageing temperature and precipitation ? or a change in the diffusion affected layer close to the joint ? A particular study should focus on that point. Two mock-ups are presently manufactured with a cycle to be chosen among the tested conditions of this task.
- 38 - EFDA Technology / Vessel-In Vessel / Vessel-Blanket and Materials
REFERENCES [1] I. Bretherton, G. Knowles, K.M.S Rigby, S. Jacques
C.J. Austin - The mechanical properties of two copper alloys : final report - AEAT/RJCB/RD01267/R02, Issue 1, June 2001.
REPORTS AND PUBLICATIONS O. Gillia, I. Chu, P. Lemoine - TW3-TVM-JOINT Characterization of the CuCrZr/SS junction strength for different blanket manufacturing conditions, Intermediate report - Rapport technique DTEN/DL/2004/008.
TASK LEADER Olivier GILLIA DRT/LITEN/DTEN/S3ME/LMIC CEA-Grenoble 17, rue des Martyrs F-38054 Grenoble Cedex 9 Tél. : 33 4 38 78 62 07 Fax : 33 4 38 78 58 91 E-mail : [email protected]
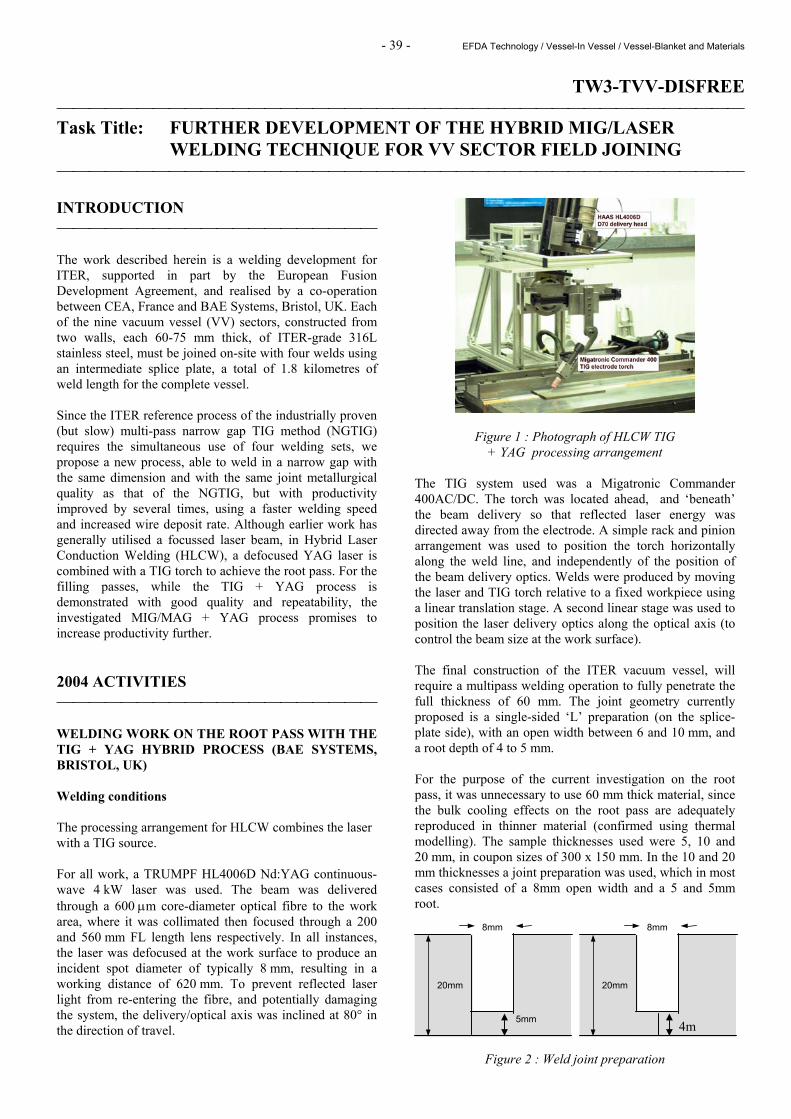
- 39 - EFDA Technology / Vessel-In Vessel / Vessel-Blanket and Materials
TW3-TVV-DISFREE Task Title: FURTHER DEVELOPMENT OF THE HYBRID MIG/LASER
WELDING TECHNIQUE FOR VV SECTOR FIELD JOINING INTRODUCTION The work described herein is a welding development for ITER, supported in part by the European Fusion Development Agreement, and realised by a co-operation between CEA, France and BAE Systems, Bristol, UK. Each of the nine vacuum vessel (VV) sectors, constructed from two walls, each 60-75 mm thick, of ITER-grade 316L stainless steel, must be joined on-site with four welds using an intermediate splice plate, a total of 1.8 kilometres of weld length for the complete vessel. Since the ITER reference process of the industrially proven (but slow) multi-pass narrow gap TIG method (NGTIG) requires the simultaneous use of four welding sets, we propose a new process, able to weld in a narrow gap with the same dimension and with the same joint metallurgical quality as that of the NGTIG, but with productivity improved by several times, using a faster welding speed and increased wire deposit rate. Although earlier work has generally utilised a focussed laser beam, in Hybrid Laser Conduction Welding (HLCW), a defocused YAG laser is combined with a TIG torch to achieve the root pass. For the filling passes, while the TIG + YAG process is demonstrated with good quality and repeatability, the investigated MIG/MAG + YAG process promises to increase productivity further. 2004 ACTIVITIES WELDING WORK ON THE ROOT PASS WITH THE TIG + YAG HYBRID PROCESS (BAE SYSTEMS, BRISTOL, UK) Welding conditions The processing arrangement for HLCW combines the laser with a TIG source. For all work, a TRUMPF HL4006D Nd:YAG continuous-wave 4 kW laser was used. The beam was delivered through a 600 µm core-diameter optical fibre to the work area, where it was collimated then focused through a 200 and 560 mm FL length lens respectively. In all instances, the laser was defocused at the work surface to produce an incident spot diameter of typically 8 mm, resulting in a working distance of 620 mm. To prevent reflected laser light from re-entering the fibre, and potentially damaging the system, the delivery/optical axis was inclined at 80° in the direction of travel.
Figure 1 : Photograph of HLCW TIG + YAG processing arrangement
The TIG system used was a Migatronic Commander 400AC/DC. The torch was located ahead, and ‘beneath’ the beam delivery so that reflected laser energy was directed away from the electrode. A simple rack and pinion arrangement was used to position the torch horizontally along the weld line, and independently of the position of the beam delivery optics. Welds were produced by moving the laser and TIG torch relative to a fixed workpiece using a linear translation stage. A second linear stage was used to position the laser delivery optics along the optical axis (to control the beam size at the work surface). The final construction of the ITER vacuum vessel, will require a multipass welding operation to fully penetrate the full thickness of 60 mm. The joint geometry currently proposed is a single-sided ‘L’ preparation (on the splice-plate side), with an open width between 6 and 10 mm, and a root depth of 4 to 5 mm. For the purpose of the current investigation on the root pass, it was unnecessary to use 60 mm thick material, since the bulk cooling effects on the root pass are adequately reproduced in thinner material (confirmed using thermal modelling). The sample thicknesses used were 5, 10 and 20 mm, in coupon sizes of 300 x 150 mm. In the 10 and 20 mm thicknesses a joint preparation was used, which in most cases consisted of a 8mm open width and a 5 and 5mm root.
Figure 2 : Weld joint preparation
8mm
20mm
5mm
8mm
20mm
4m
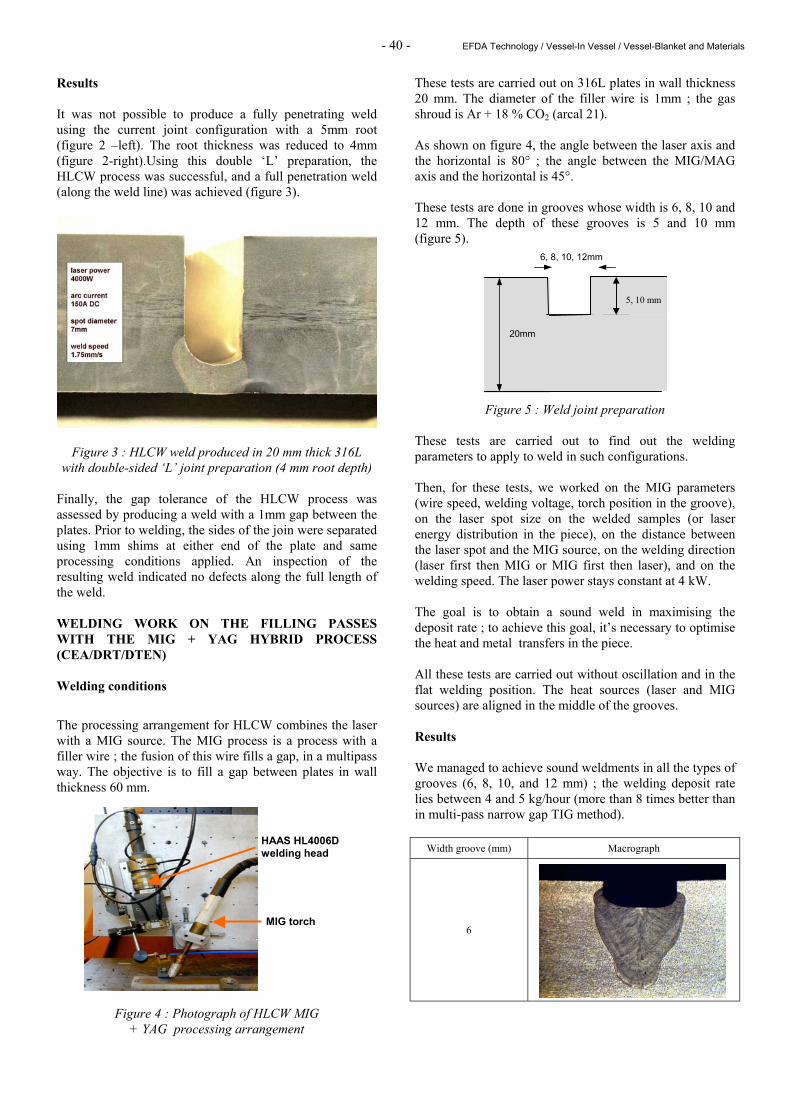
- 40 - EFDA Technology / Vessel-In Vessel / Vessel-Blanket and Materials
Results It was not possible to produce a fully penetrating weld using the current joint configuration with a 5mm root (figure 2 –left). The root thickness was reduced to 4mm (figure 2-right).Using this double ‘L’ preparation, the HLCW process was successful, and a full penetration weld (along the weld line) was achieved (figure 3).
Figure 3 : HLCW weld produced in 20 mm thick 316L with double-sided ‘L’ joint preparation (4 mm root depth)
Finally, the gap tolerance of the HLCW process was assessed by producing a weld with a 1mm gap between the plates. Prior to welding, the sides of the join were separated using 1mm shims at either end of the plate and same processing conditions applied. An inspection of the resulting weld indicated no defects along the full length of the weld. WELDING WORK ON THE FILLING PASSES WITH THE MIG + YAG HYBRID PROCESS (CEA/DRT/DTEN) Welding conditions
The processing arrangement for HLCW combines the laser with a MIG source. The MIG process is a process with a filler wire ; the fusion of this wire fills a gap, in a multipass way. The objective is to fill a gap between plates in wall thickness 60 mm.
Figure 4 : Photograph of HLCW MIG + YAG processing arrangement
These tests are carried out on 316L plates in wall thickness 20 mm. The diameter of the filler wire is 1mm ; the gas shroud is Ar + 18 % CO2 (arcal 21). As shown on figure 4, the angle between the laser axis and the horizontal is 80° ; the angle between the MIG/MAG axis and the horizontal is 45°. These tests are done in grooves whose width is 6, 8, 10 and 12 mm. The depth of these grooves is 5 and 10 mm (figure 5).
Figure 5 : Weld joint preparation These tests are carried out to find out the welding parameters to apply to weld in such configurations. Then, for these tests, we worked on the MIG parameters (wire speed, welding voltage, torch position in the groove), on the laser spot size on the welded samples (or laser energy distribution in the piece), on the distance between the laser spot and the MIG source, on the welding direction (laser first then MIG or MIG first then laser), and on the welding speed. The laser power stays constant at 4 kW. The goal is to obtain a sound weld in maximising the deposit rate ; to achieve this goal, it’s necessary to optimise the heat and metal transfers in the piece. All these tests are carried out without oscillation and in the flat welding position. The heat sources (laser and MIG sources) are aligned in the middle of the grooves. Results We managed to achieve sound weldments in all the types of grooves (6, 8, 10, and 12 mm) ; the welding deposit rate lies between 4 and 5 kg/hour (more than 8 times better than in multi-pass narrow gap TIG method).
Width groove (mm) Macrograph
6
MIG torch
HAAS HL4006D welding head
6, 8, 10, 12mm
20mm
5, 10 mm
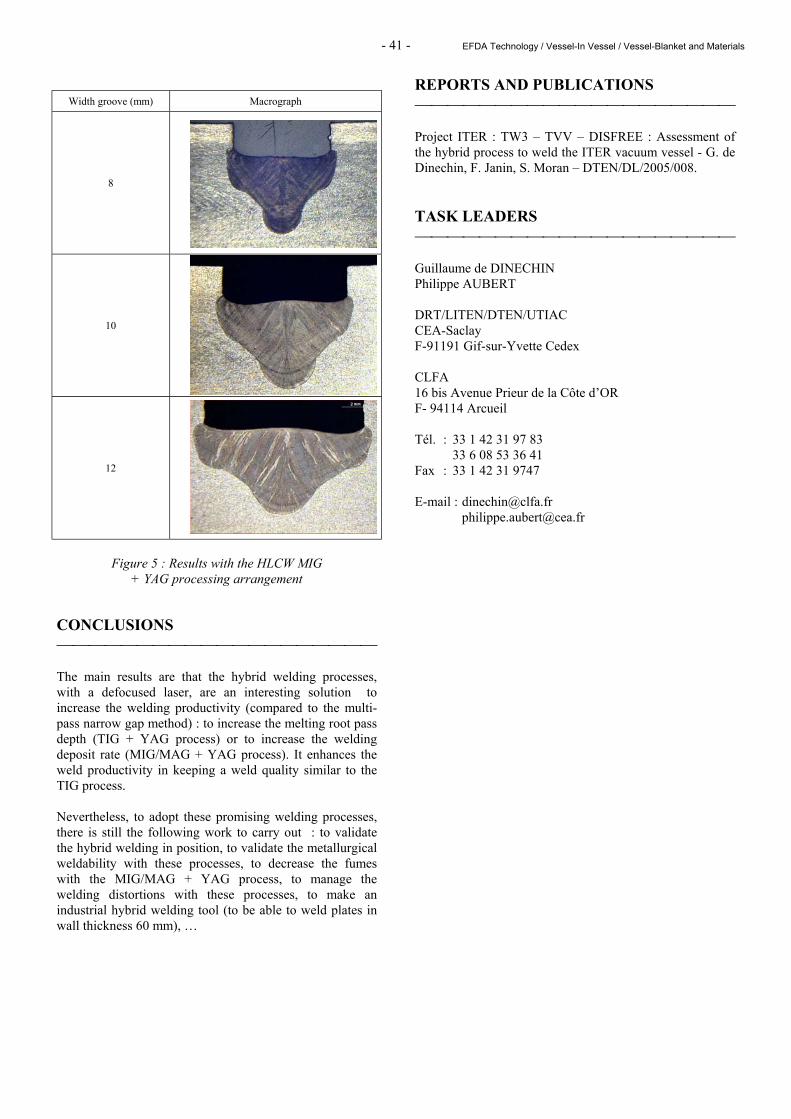
- 41 - EFDA Technology / Vessel-In Vessel / Vessel-Blanket and Materials
Width groove (mm) Macrograph
8
10
12
Figure 5 : Results with the HLCW MIG
+ YAG processing arrangement CONCLUSIONS The main results are that the hybrid welding processes, with a defocused laser, are an interesting solution to increase the welding productivity (compared to the multi-pass narrow gap method) : to increase the melting root pass depth (TIG + YAG process) or to increase the welding deposit rate (MIG/MAG + YAG process). It enhances the weld productivity in keeping a weld quality similar to the TIG process. Nevertheless, to adopt these promising welding processes, there is still the following work to carry out : to validate the hybrid welding in position, to validate the metallurgical weldability with these processes, to decrease the fumes with the MIG/MAG + YAG process, to manage the welding distortions with these processes, to make an industrial hybrid welding tool (to be able to weld plates in wall thickness 60 mm), …
REPORTS AND PUBLICATIONS Project ITER : TW3 – TVV – DISFREE : Assessment of the hybrid process to weld the ITER vacuum vessel - G. de Dinechin, F. Janin, S. Moran – DTEN/DL/2005/008. TASK LEADERS Guillaume de DINECHIN Philippe AUBERT DRT/LITEN/DTEN/UTIAC CEA-Saclay F-91191 Gif-sur-Yvette Cedex CLFA 16 bis Avenue Prieur de la Côte d’OR F- 94114 Arcueil Tél. : 33 1 42 31 97 83 33 6 08 53 36 41 Fax : 33 1 42 31 9747 E-mail : [email protected] [email protected]

- 42 - EFDA Technology / Vessel-In Vessel / Vessel-Blanket and Materials
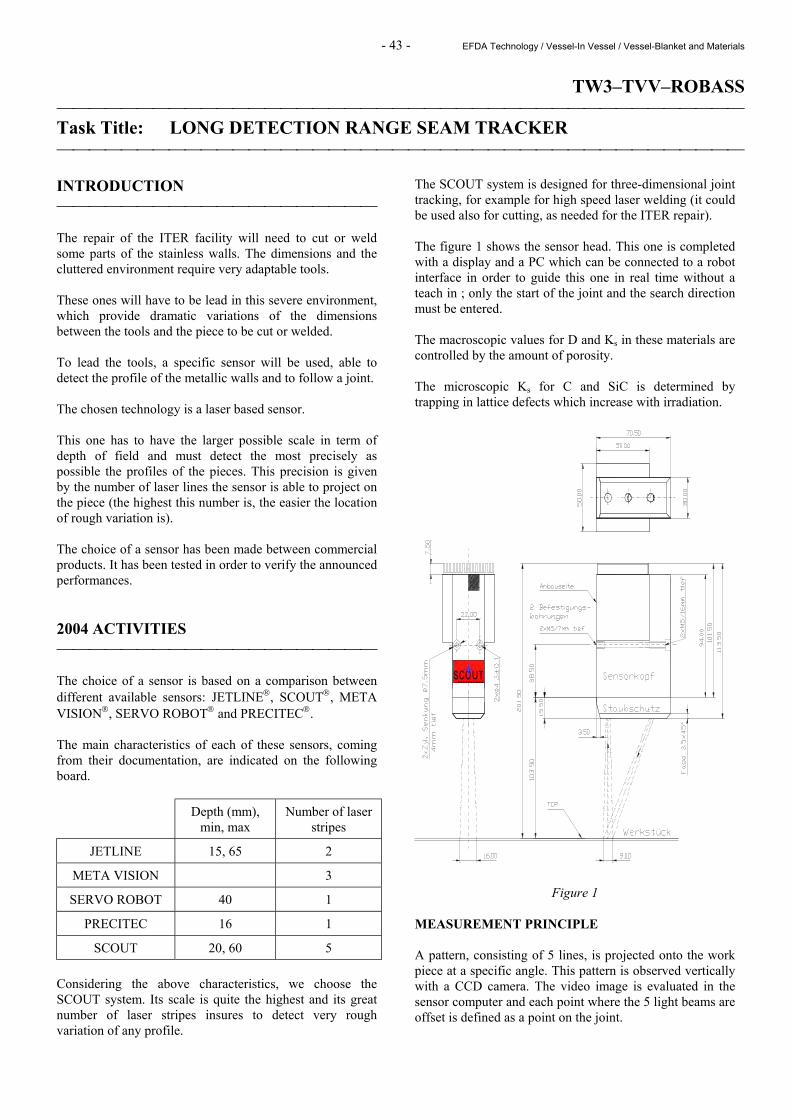
- 43 - EFDA Technology / Vessel-In Vessel / Vessel-Blanket and Materials
TW3–TVV–ROBASS Task Title: LONG DETECTION RANGE SEAM TRACKER INTRODUCTION The repair of the ITER facility will need to cut or weld some parts of the stainless walls. The dimensions and the cluttered environment require very adaptable tools. These ones will have to be lead in this severe environment, which provide dramatic variations of the dimensions between the tools and the piece to be cut or welded. To lead the tools, a specific sensor will be used, able to detect the profile of the metallic walls and to follow a joint. The chosen technology is a laser based sensor. This one has to have the larger possible scale in term of depth of field and must detect the most precisely as possible the profiles of the pieces. This precision is given by the number of laser lines the sensor is able to project on the piece (the highest this number is, the easier the location of rough variation is). The choice of a sensor has been made between commercial products. It has been tested in order to verify the announced performances. 2004 ACTIVITIES The choice of a sensor is based on a comparison between different available sensors: JETLINE, SCOUT, META VISION, SERVO ROBOT and PRECITEC. The main characteristics of each of these sensors, coming from their documentation, are indicated on the following board.
Depth (mm), min, max
Number of laser stripes
JETLINE 15, 65 2
META VISION 3
SERVO ROBOT 40 1
PRECITEC 16 1
SCOUT 20, 60 5 Considering the above characteristics, we choose the SCOUT system. Its scale is quite the highest and its great number of laser stripes insures to detect very rough variation of any profile.
The SCOUT system is designed for three-dimensional joint tracking, for example for high speed laser welding (it could be used also for cutting, as needed for the ITER repair). The figure 1 shows the sensor head. This one is completed with a display and a PC which can be connected to a robot interface in order to guide this one in real time without a teach in ; only the start of the joint and the search direction must be entered. The macroscopic values for D and Ks in these materials are controlled by the amount of porosity. The microscopic Ks for C and SiC is determined by trapping in lattice defects which increase with irradiation.
Figure 1 MEASUREMENT PRINCIPLE A pattern, consisting of 5 lines, is projected onto the work piece at a specific angle. This pattern is observed vertically with a CCD camera. The video image is evaluated in the sensor computer and each point where the 5 light beams are offset is defined as a point on the joint.
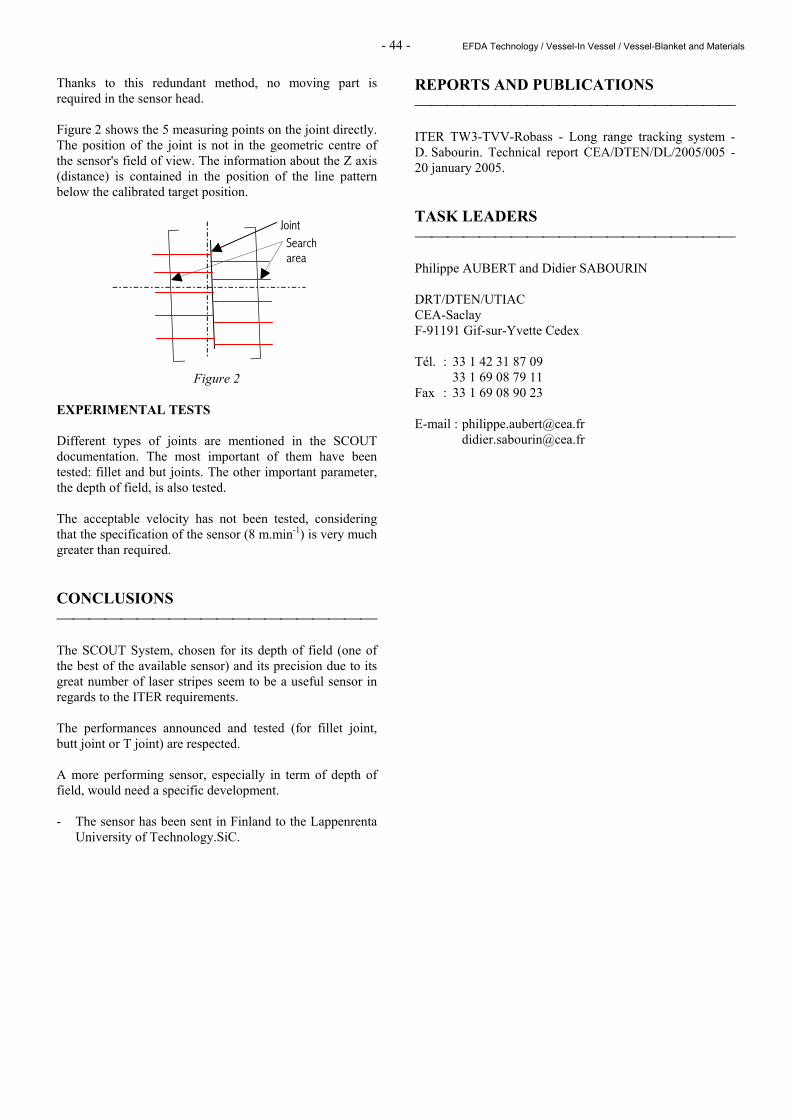
- 44 - EFDA Technology / Vessel-In Vessel / Vessel-Blanket and Materials
Thanks to this redundant method, no moving part is required in the sensor head. Figure 2 shows the 5 measuring points on the joint directly. The position of the joint is not in the geometric centre of the sensor's field of view. The information about the Z axis (distance) is contained in the position of the line pattern below the calibrated target position.
Figure 2 EXPERIMENTAL TESTS Different types of joints are mentioned in the SCOUT documentation. The most important of them have been tested: fillet and but joints. The other important parameter, the depth of field, is also tested. The acceptable velocity has not been tested, considering that the specification of the sensor (8 m.min-1) is very much greater than required. CONCLUSIONS The SCOUT System, chosen for its depth of field (one of the best of the available sensor) and its precision due to its great number of laser stripes seem to be a useful sensor in regards to the ITER requirements. The performances announced and tested (for fillet joint, butt joint or T joint) are respected. A more performing sensor, especially in term of depth of field, would need a specific development. - The sensor has been sent in Finland to the Lappenrenta
University of Technology.SiC.
REPORTS AND PUBLICATIONS ITER TW3-TVV-Robass - Long range tracking system - D. Sabourin. Technical report CEA/DTEN/DL/2005/005 - 20 january 2005. TASK LEADERS Philippe AUBERT and Didier SABOURIN DRT/DTEN/UTIAC CEA-Saclay F-91191 Gif-sur-Yvette Cedex Tél. : 33 1 42 31 87 09 33 1 69 08 79 11 Fax : 33 1 69 08 90 23 E-mail : [email protected] [email protected]
Search area
Joint
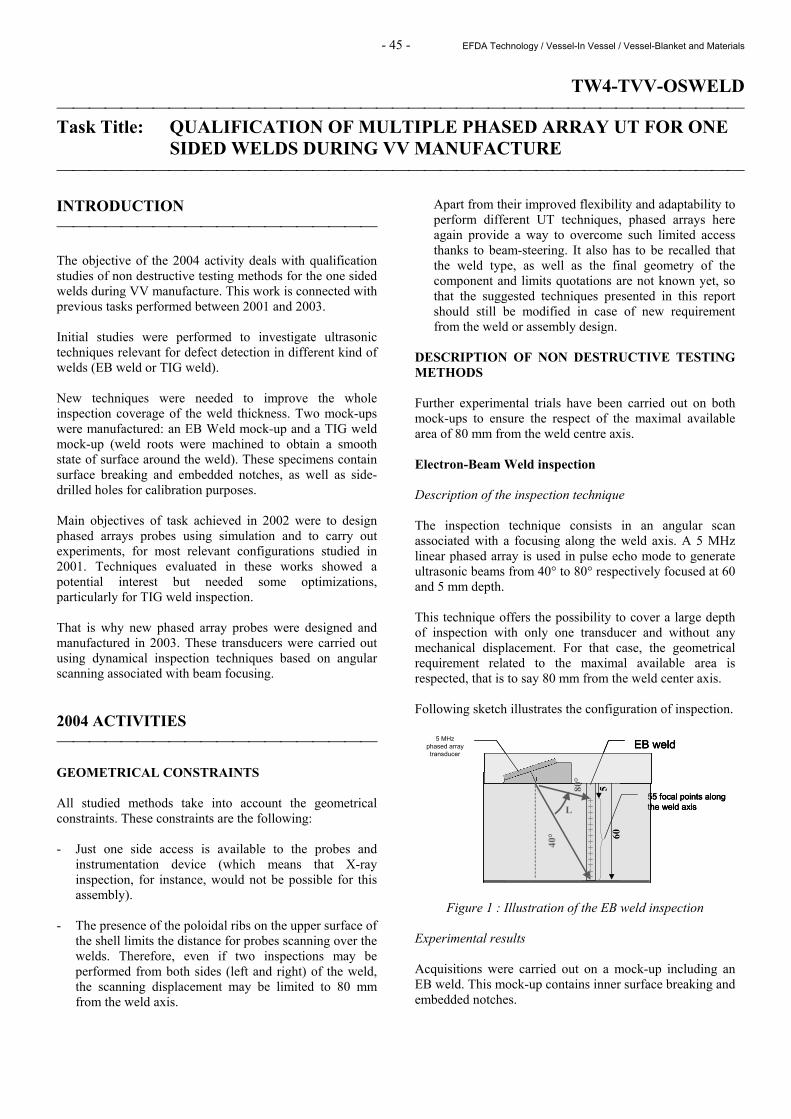
- 45 - EFDA Technology / Vessel-In Vessel / Vessel-Blanket and Materials
TW4-TVV-OSWELD Task Title: QUALIFICATION OF MULTIPLE PHASED ARRAY UT FOR ONE
SIDED WELDS DURING VV MANUFACTURE INTRODUCTION The objective of the 2004 activity deals with qualification studies of non destructive testing methods for the one sided welds during VV manufacture. This work is connected with previous tasks performed between 2001 and 2003. Initial studies were performed to investigate ultrasonic techniques relevant for defect detection in different kind of welds (EB weld or TIG weld). New techniques were needed to improve the whole inspection coverage of the weld thickness. Two mock-ups were manufactured: an EB Weld mock-up and a TIG weld mock-up (weld roots were machined to obtain a smooth state of surface around the weld). These specimens contain surface breaking and embedded notches, as well as side-drilled holes for calibration purposes. Main objectives of task achieved in 2002 were to design phased arrays probes using simulation and to carry out experiments, for most relevant configurations studied in 2001. Techniques evaluated in these works showed a potential interest but needed some optimizations, particularly for TIG weld inspection. That is why new phased array probes were designed and manufactured in 2003. These transducers were carried out using dynamical inspection techniques based on angular scanning associated with beam focusing. 2004 ACTIVITIES GEOMETRICAL CONSTRAINTS All studied methods take into account the geometrical constraints. These constraints are the following: - Just one side access is available to the probes and
instrumentation device (which means that X-ray inspection, for instance, would not be possible for this assembly).
- The presence of the poloidal ribs on the upper surface of
the shell limits the distance for probes scanning over the welds. Therefore, even if two inspections may be performed from both sides (left and right) of the weld, the scanning displacement may be limited to 80 mm from the weld axis.
Apart from their improved flexibility and adaptability to perform different UT techniques, phased arrays here again provide a way to overcome such limited access thanks to beam-steering. It also has to be recalled that the weld type, as well as the final geometry of the component and limits quotations are not known yet, so that the suggested techniques presented in this report should still be modified in case of new requirement from the weld or assembly design.
DESCRIPTION OF NON DESTRUCTIVE TESTING METHODS Further experimental trials have been carried out on both mock-ups to ensure the respect of the maximal available area of 80 mm from the weld centre axis. Electron-Beam Weld inspection Description of the inspection technique The inspection technique consists in an angular scan associated with a focusing along the weld axis. A 5 MHz linear phased array is used in pulse echo mode to generate ultrasonic beams from 40° to 80° respectively focused at 60 and 5 mm depth. This technique offers the possibility to cover a large depth of inspection with only one transducer and without any mechanical displacement. For that case, the geometrical requirement related to the maximal available area is respected, that is to say 80 mm from the weld center axis. Following sketch illustrates the configuration of inspection.
Figure 1 : Illustration of the EB weld inspection Experimental results Acquisitions were carried out on a mock-up including an EB weld. This mock-up contains inner surface breaking and embedded notches.
605
40°
80°
L
EB weld
55 focal points along the weld axis
5 MHz phased array transducer
605
40°
80°
L
EB weld
55 focal points along the weld axis
605
40°
80°
L
EB weld
55 focal points along the weld axis
5 MHz phased array transducer
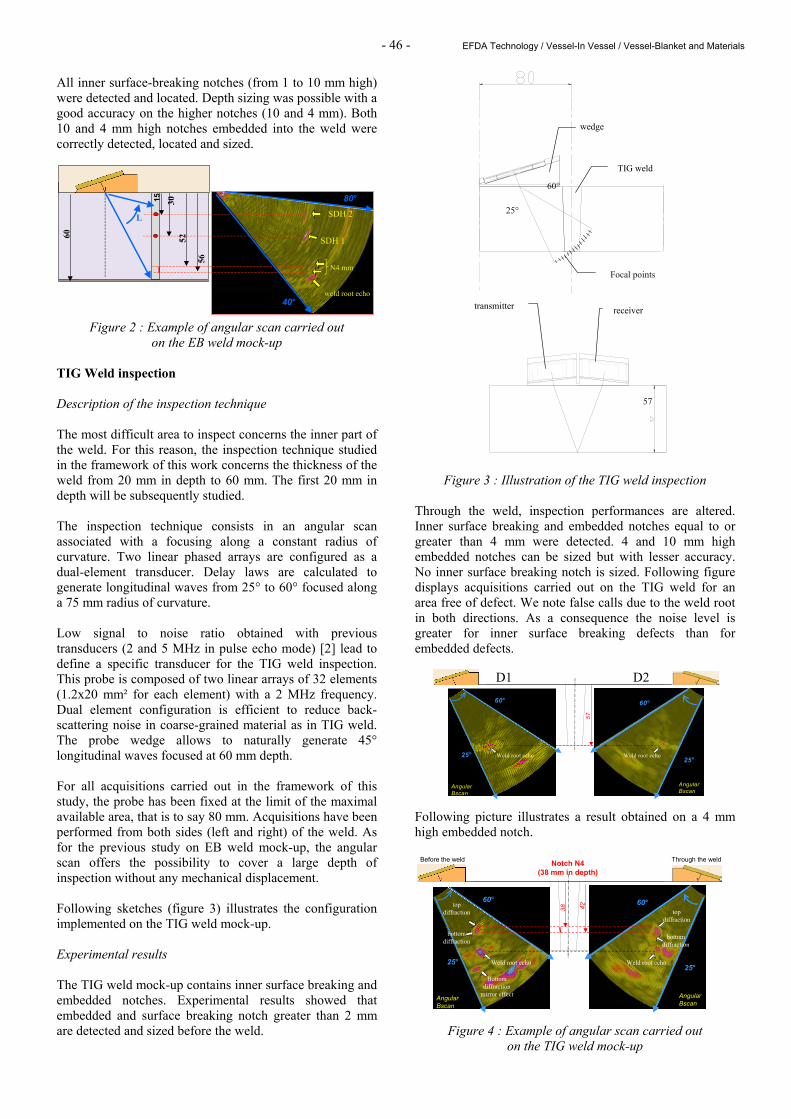
- 46 - EFDA Technology / Vessel-In Vessel / Vessel-Blanket and Materials
All inner surface-breaking notches (from 1 to 10 mm high) were detected and located. Depth sizing was possible with a good accuracy on the higher notches (10 and 4 mm). Both 10 and 4 mm high notches embedded into the weld were correctly detected, located and sized.
Figure 2 : Example of angular scan carried out on the EB weld mock-up
TIG Weld inspection Description of the inspection technique The most difficult area to inspect concerns the inner part of the weld. For this reason, the inspection technique studied in the framework of this work concerns the thickness of the weld from 20 mm in depth to 60 mm. The first 20 mm in depth will be subsequently studied. The inspection technique consists in an angular scan associated with a focusing along a constant radius of curvature. Two linear phased arrays are configured as a dual-element transducer. Delay laws are calculated to generate longitudinal waves from 25° to 60° focused along a 75 mm radius of curvature. Low signal to noise ratio obtained with previous transducers (2 and 5 MHz in pulse echo mode) [2] lead to define a specific transducer for the TIG weld inspection. This probe is composed of two linear arrays of 32 elements (1.2x20 mm² for each element) with a 2 MHz frequency. Dual element configuration is efficient to reduce back-scattering noise in coarse-grained material as in TIG weld. The probe wedge allows to naturally generate 45° longitudinal waves focused at 60 mm depth. For all acquisitions carried out in the framework of this study, the probe has been fixed at the limit of the maximal available area, that is to say 80 mm. Acquisitions have been performed from both sides (left and right) of the weld. As for the previous study on EB weld mock-up, the angular scan offers the possibility to cover a large depth of inspection without any mechanical displacement. Following sketches (figure 3) illustrates the configuration implemented on the TIG weld mock-up. Experimental results The TIG weld mock-up contains inner surface breaking and embedded notches. Experimental results showed that embedded and surface breaking notch greater than 2 mm are detected and sized before the weld.
Figure 3 : Illustration of the TIG weld inspection
Through the weld, inspection performances are altered. Inner surface breaking and embedded notches equal to or greater than 4 mm were detected. 4 and 10 mm high embedded notches can be sized but with lesser accuracy. No inner surface breaking notch is sized. Following figure displays acquisitions carried out on the TIG weld for an area free of defect. We note false calls due to the weld root in both directions. As a consequence the noise level is greater for inner surface breaking defects than for embedded defects.
Following picture illustrates a result obtained on a 4 mm high embedded notch.
Figure 4 : Example of angular scan carried out on the TIG weld mock-up
25°
60°
Focal points
wedge
TIG weld
57
transmitter receiver
Angular Bscan
Angular Bscan
25°
60°
25°
60°
bottomdiffraction
42top diffraction
Bottom diffraction
mirror effect
38
Weld root echo
Notch N4 (38 mm in depth)
Before the weld Through the weld
Weld root echo
bottomdiffraction
top diffraction
SDH 2
SDH 1
N4 mm
40°
60
3052
56
15
weld root echo
80°
L
Angular Bscan
Angular Bscan
25°
60°
25°
60°
57
Weld root echo Weld root echo
D1 D2
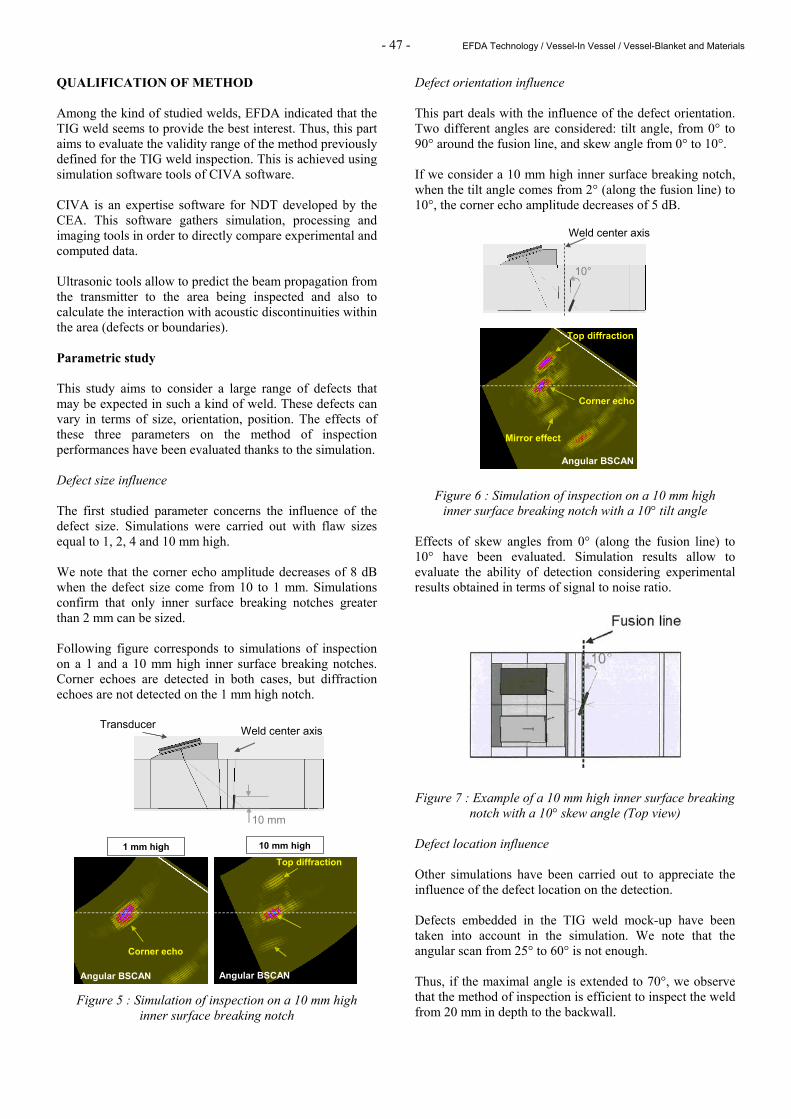
- 47 - EFDA Technology / Vessel-In Vessel / Vessel-Blanket and Materials
QUALIFICATION OF METHOD Among the kind of studied welds, EFDA indicated that the TIG weld seems to provide the best interest. Thus, this part aims to evaluate the validity range of the method previously defined for the TIG weld inspection. This is achieved using simulation software tools of CIVA software. CIVA is an expertise software for NDT developed by the CEA. This software gathers simulation, processing and imaging tools in order to directly compare experimental and computed data. Ultrasonic tools allow to predict the beam propagation from the transmitter to the area being inspected and also to calculate the interaction with acoustic discontinuities within the area (defects or boundaries). Parametric study This study aims to consider a large range of defects that may be expected in such a kind of weld. These defects can vary in terms of size, orientation, position. The effects of these three parameters on the method of inspection performances have been evaluated thanks to the simulation. Defect size influence The first studied parameter concerns the influence of the defect size. Simulations were carried out with flaw sizes equal to 1, 2, 4 and 10 mm high. We note that the corner echo amplitude decreases of 8 dB when the defect size come from 10 to 1 mm. Simulations confirm that only inner surface breaking notches greater than 2 mm can be sized. Following figure corresponds to simulations of inspection on a 1 and a 10 mm high inner surface breaking notches. Corner echoes are detected in both cases, but diffraction echoes are not detected on the 1 mm high notch.
Figure 5 : Simulation of inspection on a 10 mm high inner surface breaking notch
Defect orientation influence This part deals with the influence of the defect orientation. Two different angles are considered: tilt angle, from 0° to 90° around the fusion line, and skew angle from 0° to 10°. If we consider a 10 mm high inner surface breaking notch, when the tilt angle comes from 2° (along the fusion line) to 10°, the corner echo amplitude decreases of 5 dB.
Figure 6 : Simulation of inspection on a 10 mm high inner surface breaking notch with a 10° tilt angle
Effects of skew angles from 0° (along the fusion line) to 10° have been evaluated. Simulation results allow to evaluate the ability of detection considering experimental results obtained in terms of signal to noise ratio.
Figure 7 : Example of a 10 mm high inner surface breaking
notch with a 10° skew angle (Top view) Defect location influence Other simulations have been carried out to appreciate the influence of the defect location on the detection. Defects embedded in the TIG weld mock-up have been taken into account in the simulation. We note that the angular scan from 25° to 60° is not enough. Thus, if the maximal angle is extended to 70°, we observe that the method of inspection is efficient to inspect the weld from 20 mm in depth to the backwall.
Weld center axis
10°
10 mm
Transducer Weld center axis
Corner echo
Top diffraction
Angular BSCAN
Mirror effect
Top diffraction
Corner echo
Angular BSCANAngular BSCAN
1 mm high 10 mm high
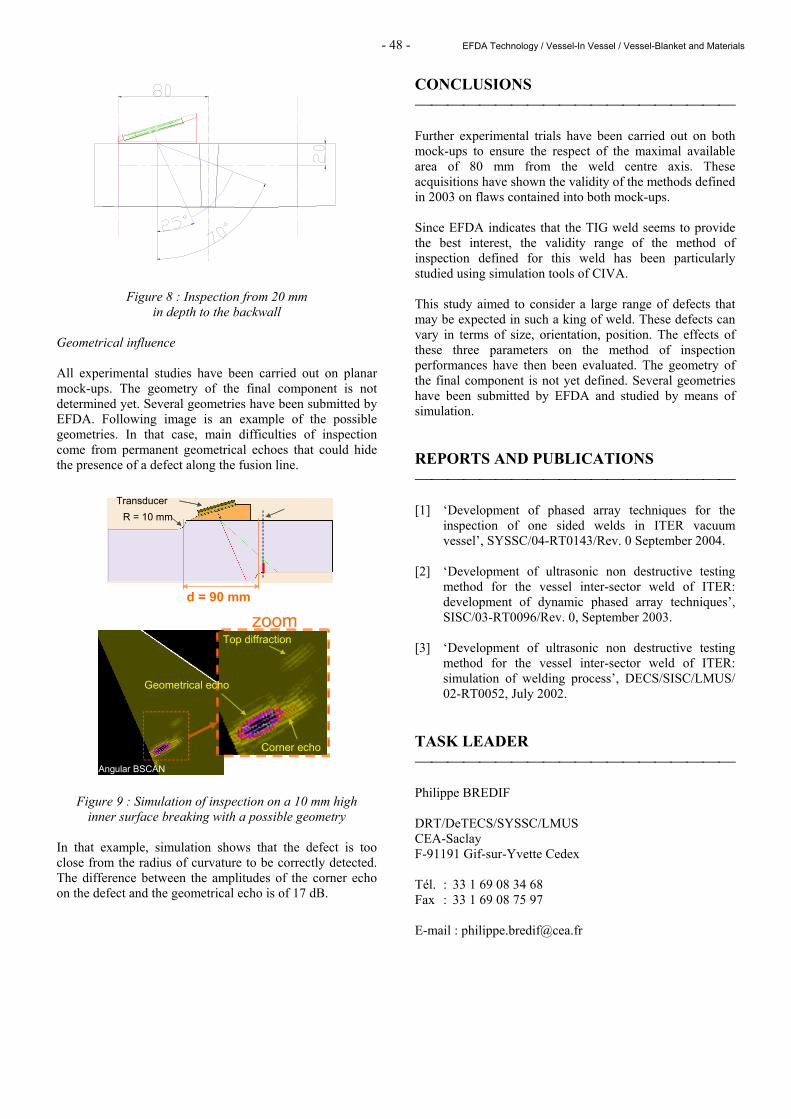
- 48 - EFDA Technology / Vessel-In Vessel / Vessel-Blanket and Materials
Figure 8 : Inspection from 20 mm in depth to the backwall
Geometrical influence All experimental studies have been carried out on planar mock-ups. The geometry of the final component is not determined yet. Several geometries have been submitted by EFDA. Following image is an example of the possible geometries. In that case, main difficulties of inspection come from permanent geometrical echoes that could hide the presence of a defect along the fusion line.
Figure 9 : Simulation of inspection on a 10 mm high inner surface breaking with a possible geometry
In that example, simulation shows that the defect is too close from the radius of curvature to be correctly detected. The difference between the amplitudes of the corner echo on the defect and the geometrical echo is of 17 dB.
CONCLUSIONS Further experimental trials have been carried out on both mock-ups to ensure the respect of the maximal available area of 80 mm from the weld centre axis. These acquisitions have shown the validity of the methods defined in 2003 on flaws contained into both mock-ups. Since EFDA indicates that the TIG weld seems to provide the best interest, the validity range of the method of inspection defined for this weld has been particularly studied using simulation tools of CIVA. This study aimed to consider a large range of defects that may be expected in such a king of weld. These defects can vary in terms of size, orientation, position. The effects of these three parameters on the method of inspection performances have then been evaluated. The geometry of the final component is not yet defined. Several geometries have been submitted by EFDA and studied by means of simulation. REPORTS AND PUBLICATIONS [1] ‘Development of phased array techniques for the
inspection of one sided welds in ITER vacuum vessel’, SYSSC/04-RT0143/Rev. 0 September 2004.
[2] ‘Development of ultrasonic non destructive testing
method for the vessel inter-sector weld of ITER: development of dynamic phased array techniques’, SISC/03-RT0096/Rev. 0, September 2003.
[3] ‘Development of ultrasonic non destructive testing
method for the vessel inter-sector weld of ITER: simulation of welding process’, DECS/SISC/LMUS/ 02-RT0052, July 2002.
TASK LEADER Philippe BREDIF DRT/DeTECS/SYSSC/LMUS CEA-Saclay F-91191 Gif-sur-Yvette Cedex Tél. : 33 1 69 08 34 68 Fax : 33 1 69 08 75 97 E-mail : [email protected]
Transducer
d = 90 mm
R = 10 mm
Geometrical echo
Top diffractionzoom
Corner echo
Angular BSCAN
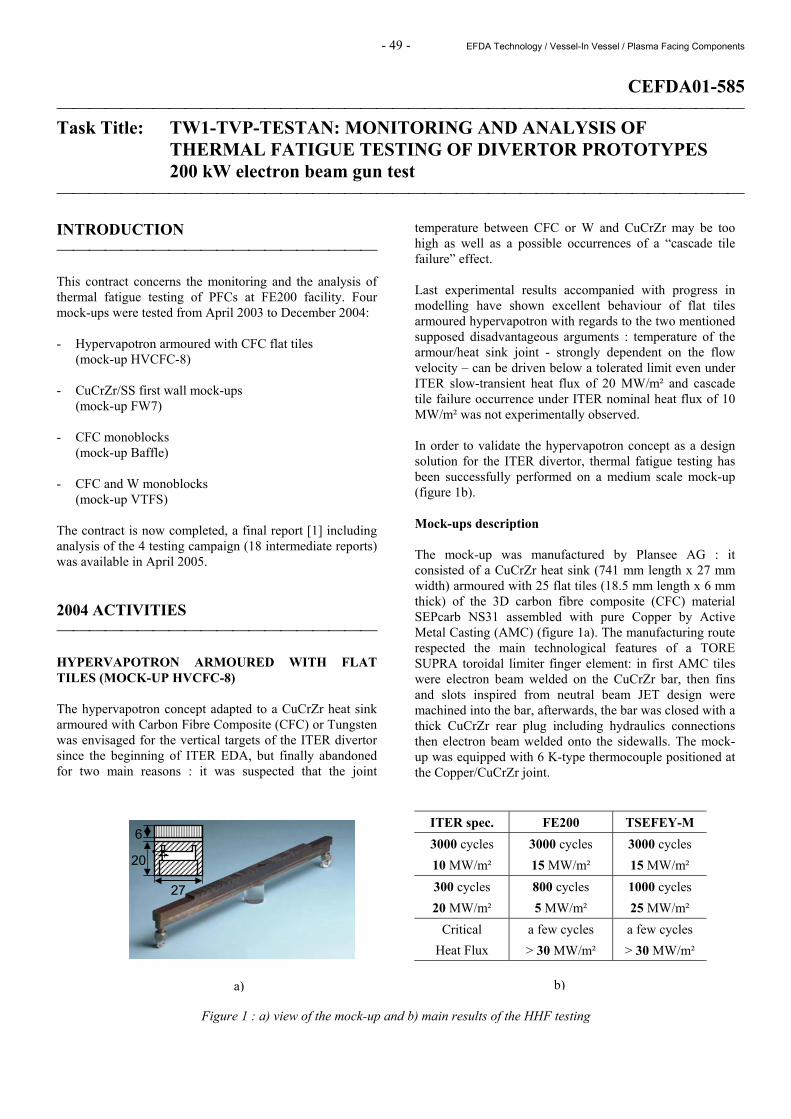
- 49 - EFDA Technology / Vessel-In Vessel / Plasma Facing Components
CEFDA01-585 Task Title: TW1-TVP-TESTAN: MONITORING AND ANALYSIS OF
THERMAL FATIGUE TESTING OF DIVERTOR PROTOTYPES 200 kW electron beam gun test INTRODUCTION This contract concerns the monitoring and the analysis of thermal fatigue testing of PFCs at FE200 facility. Four mock-ups were tested from April 2003 to December 2004: - Hypervapotron armoured with CFC flat tiles (mock-up HVCFC-8) - CuCrZr/SS first wall mock-ups (mock-up FW7) - CFC monoblocks (mock-up Baffle) - CFC and W monoblocks
(mock-up VTFS) The contract is now completed, a final report [1] including analysis of the 4 testing campaign (18 intermediate reports) was available in April 2005. 2004 ACTIVITIES HYPERVAPOTRON ARMOURED WITH FLAT TILES (MOCK-UP HVCFC-8) The hypervapotron concept adapted to a CuCrZr heat sink armoured with Carbon Fibre Composite (CFC) or Tungsten was envisaged for the vertical targets of the ITER divertor since the beginning of ITER EDA, but finally abandoned for two main reasons : it was suspected that the joint
temperature between CFC or W and CuCrZr may be too high as well as a possible occurrences of a “cascade tile failure” effect. Last experimental results accompanied with progress in modelling have shown excellent behaviour of flat tiles armoured hypervapotron with regards to the two mentioned supposed disadvantageous arguments : temperature of the armour/heat sink joint - strongly dependent on the flow velocity – can be driven below a tolerated limit even under ITER slow-transient heat flux of 20 MW/m² and cascade tile failure occurrence under ITER nominal heat flux of 10 MW/m² was not experimentally observed. In order to validate the hypervapotron concept as a design solution for the ITER divertor, thermal fatigue testing has been successfully performed on a medium scale mock-up (figure 1b). Mock-ups description The mock-up was manufactured by Plansee AG : it consisted of a CuCrZr heat sink (741 mm length x 27 mm width) armoured with 25 flat tiles (18.5 mm length x 6 mm thick) of the 3D carbon fibre composite (CFC) material SEPcarb NS31 assembled with pure Copper by Active Metal Casting (AMC) (figure 1a). The manufacturing route respected the main technological features of a TORE SUPRA toroidal limiter finger element: in first AMC tiles were electron beam welded on the CuCrZr bar, then fins and slots inspired from neutral beam JET design were machined into the bar, afterwards, the bar was closed with a thick CuCrZr rear plug including hydraulics connections then electron beam welded onto the sidewalls. The mock-up was equipped with 6 K-type thermocouple positioned at the Copper/CuCrZr joint.
ITER spec. FE200 TSEFEY-M 3000 cycles 10 MW/m²
3000 cycles 15 MW/m²
3000 cycles 15 MW/m²
300 cycles 20 MW/m²
800 cycles 5 MW/m²
1000 cycles 25 MW/m²
Critical Heat Flux
a few cycles > 30 MW/m²
a few cycles > 30 MW/m²
Figure 1 : a) view of the mock-up and b) main results of the HHF testing
27
20
6
a) b)
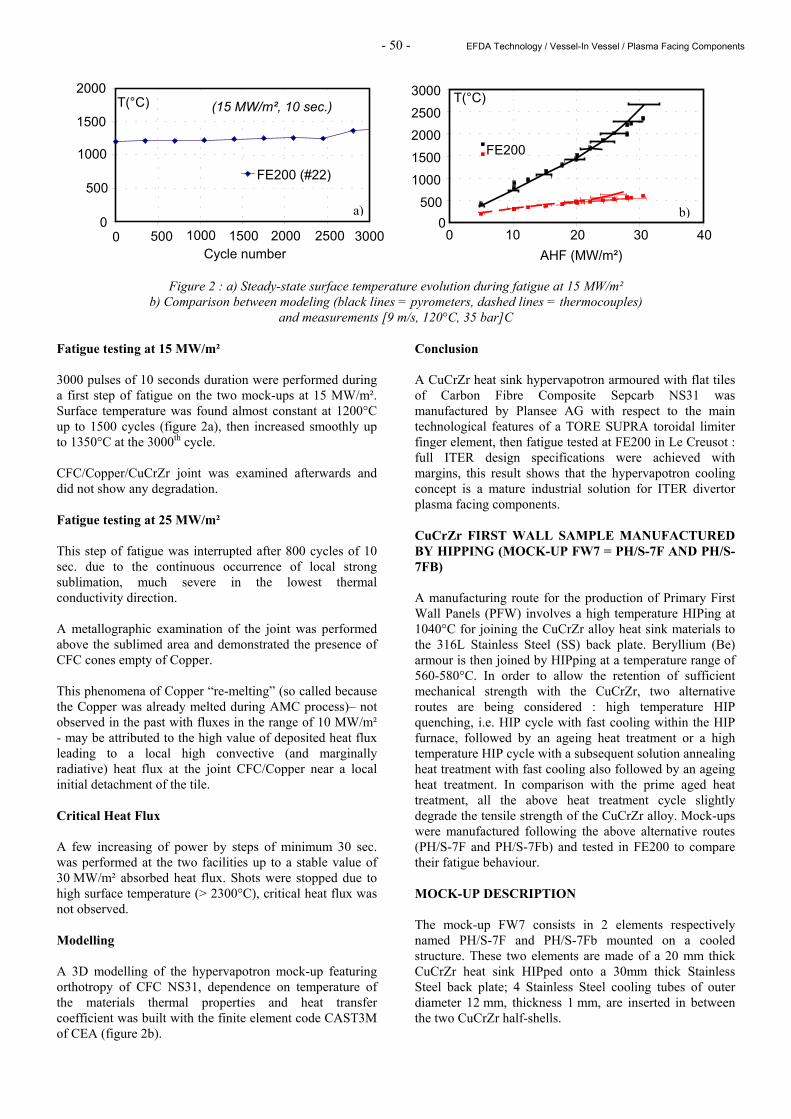
- 50 - EFDA Technology / Vessel-In Vessel / Plasma Facing Components
Figure 2 : a) Steady-state surface temperature evolution during fatigue at 15 MW/m² b) Comparison between modeling (black lines = pyrometers, dashed lines = thermocouples)
and measurements [9 m/s, 120°C, 35 bar]C Fatigue testing at 15 MW/m² 3000 pulses of 10 seconds duration were performed during a first step of fatigue on the two mock-ups at 15 MW/m². Surface temperature was found almost constant at 1200°C up to 1500 cycles (figure 2a), then increased smoothly up to 1350°C at the 3000th cycle. CFC/Copper/CuCrZr joint was examined afterwards and did not show any degradation. Fatigue testing at 25 MW/m² This step of fatigue was interrupted after 800 cycles of 10 sec. due to the continuous occurrence of local strong sublimation, much severe in the lowest thermal conductivity direction. A metallographic examination of the joint was performed above the sublimed area and demonstrated the presence of CFC cones empty of Copper. This phenomena of Copper “re-melting” (so called because the Copper was already melted during AMC process)– not observed in the past with fluxes in the range of 10 MW/m² - may be attributed to the high value of deposited heat flux leading to a local high convective (and marginally radiative) heat flux at the joint CFC/Copper near a local initial detachment of the tile. Critical Heat Flux A few increasing of power by steps of minimum 30 sec. was performed at the two facilities up to a stable value of 30 MW/m² absorbed heat flux. Shots were stopped due to high surface temperature (> 2300°C), critical heat flux was not observed. Modelling A 3D modelling of the hypervapotron mock-up featuring orthotropy of CFC NS31, dependence on temperature of the materials thermal properties and heat transfer coefficient was built with the finite element code CAST3M of CEA (figure 2b).
Conclusion A CuCrZr heat sink hypervapotron armoured with flat tiles of Carbon Fibre Composite Sepcarb NS31 was manufactured by Plansee AG with respect to the main technological features of a TORE SUPRA toroidal limiter finger element, then fatigue tested at FE200 in Le Creusot : full ITER design specifications were achieved with margins, this result shows that the hypervapotron cooling concept is a mature industrial solution for ITER divertor plasma facing components. CuCrZr FIRST WALL SAMPLE MANUFACTURED BY HIPPING (MOCK-UP FW7 = PH/S-7F AND PH/S-7FB) A manufacturing route for the production of Primary First Wall Panels (PFW) involves a high temperature HIPing at 1040°C for joining the CuCrZr alloy heat sink materials to the 316L Stainless Steel (SS) back plate. Beryllium (Be) armour is then joined by HIPping at a temperature range of 560-580°C. In order to allow the retention of sufficient mechanical strength with the CuCrZr, two alternative routes are being considered : high temperature HIP quenching, i.e. HIP cycle with fast cooling within the HIP furnace, followed by an ageing heat treatment or a high temperature HIP cycle with a subsequent solution annealing heat treatment with fast cooling also followed by an ageing heat treatment. In comparison with the prime aged heat treatment, all the above heat treatment cycle slightly degrade the tensile strength of the CuCrZr alloy. Mock-ups were manufactured following the above alternative routes (PH/S-7F and PH/S-7Fb) and tested in FE200 to compare their fatigue behaviour. MOCK-UP DESCRIPTION The mock-up FW7 consists in 2 elements respectively named PH/S-7F and PH/S-7Fb mounted on a cooled structure. These two elements are made of a 20 mm thick CuCrZr heat sink HIPped onto a 30mm thick Stainless Steel back plate; 4 Stainless Steel cooling tubes of outer diameter 12 mm, thickness 1 mm, are inserted in between the two CuCrZr half-shells.
0 500
1000
1500
2000
2500
3000
0 10 20 30 40 AHF (MW/m²)
T(°C)
FE200
b) 0
500
1000
1500
2000
0 500 1000 1500 2000 2500 3000 Cycle number
T(°C)
FE200 (#22)
(15 MW/m², 10 sec.)
a)
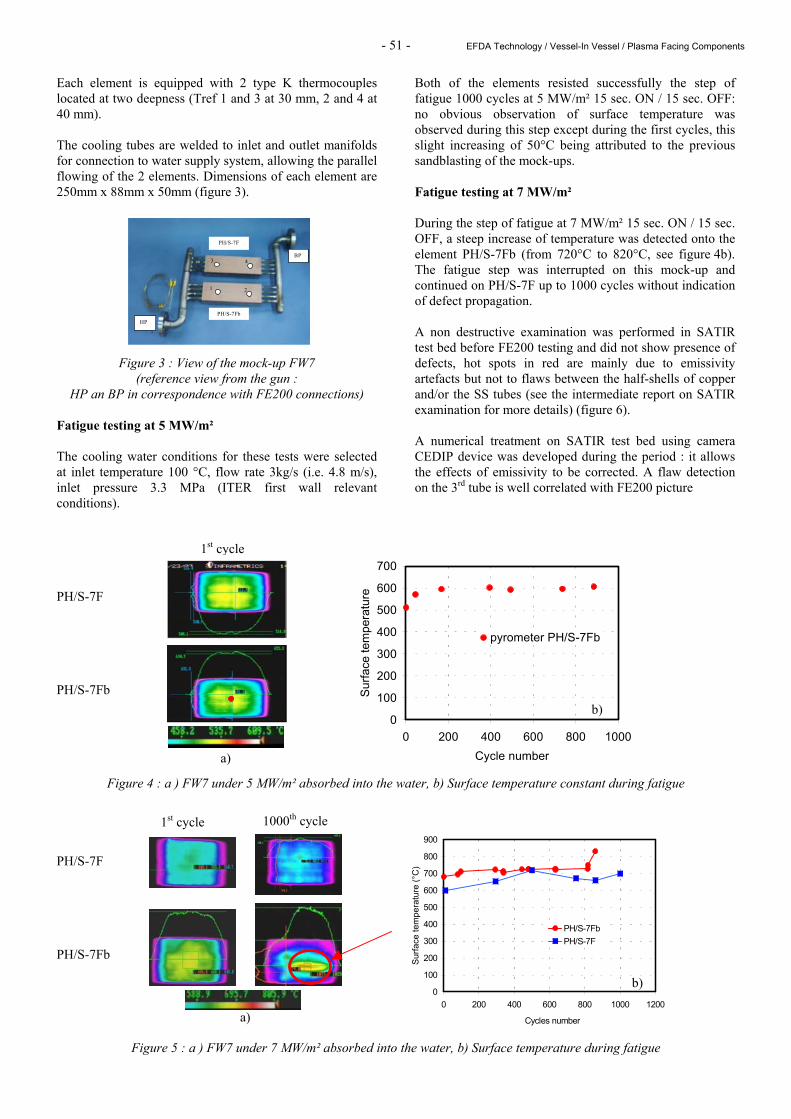
- 51 - EFDA Technology / Vessel-In Vessel / Plasma Facing Components
Each element is equipped with 2 type K thermocouples located at two deepness (Tref 1 and 3 at 30 mm, 2 and 4 at 40 mm). The cooling tubes are welded to inlet and outlet manifolds for connection to water supply system, allowing the parallel flowing of the 2 elements. Dimensions of each element are 250mm x 88mm x 50mm (figure 3).
Figure 3 : View of the mock-up FW7 (reference view from the gun :
HP an BP in correspondence with FE200 connections) Fatigue testing at 5 MW/m² The cooling water conditions for these tests were selected at inlet temperature 100 °C, flow rate 3kg/s (i.e. 4.8 m/s), inlet pressure 3.3 MPa (ITER first wall relevant conditions).
Both of the elements resisted successfully the step of fatigue 1000 cycles at 5 MW/m² 15 sec. ON / 15 sec. OFF: no obvious observation of surface temperature was observed during this step except during the first cycles, this slight increasing of 50°C being attributed to the previous sandblasting of the mock-ups. Fatigue testing at 7 MW/m² During the step of fatigue at 7 MW/m² 15 sec. ON / 15 sec. OFF, a steep increase of temperature was detected onto the element PH/S-7Fb (from 720°C to 820°C, see figure 4b). The fatigue step was interrupted on this mock-up and continued on PH/S-7F up to 1000 cycles without indication of defect propagation. A non destructive examination was performed in SATIR test bed before FE200 testing and did not show presence of defects, hot spots in red are mainly due to emissivity artefacts but not to flaws between the half-shells of copper and/or the SS tubes (see the intermediate report on SATIR examination for more details) (figure 6). A numerical treatment on SATIR test bed using camera CEDIP device was developed during the period : it allows the effects of emissivity to be corrected. A flaw detection on the 3rd tube is well correlated with FE200 picture
PH/S-7F PH/S-7Fb
Figure 4 : a ) FW7 under 5 MW/m² absorbed into the water, b) Surface temperature constant during fatigue PH/S-7F PH/S-7Fb
Figure 5 : a ) FW7 under 7 MW/m² absorbed into the water, b) Surface temperature during fatigue
PH/S-7F
PH/S-7Fb
4
1 2
3
HP
BP
0
100
200
300
400
500
600
700
0 200 400 600 800 1000Cycle number
Surfa
ce te
mpe
ratu
re
pyrometer PH/S-7Fb
1st cycle
a)
b)
0
100
200
300
400
500
600
700
800
900
0 200 400 600 800 1000 1200
Cycles number
Surfa
ce te
mpe
ratu
re (°
C)
PH/S-7FbPH/S-7F
1st cycle 1000th cycle
a)
b)
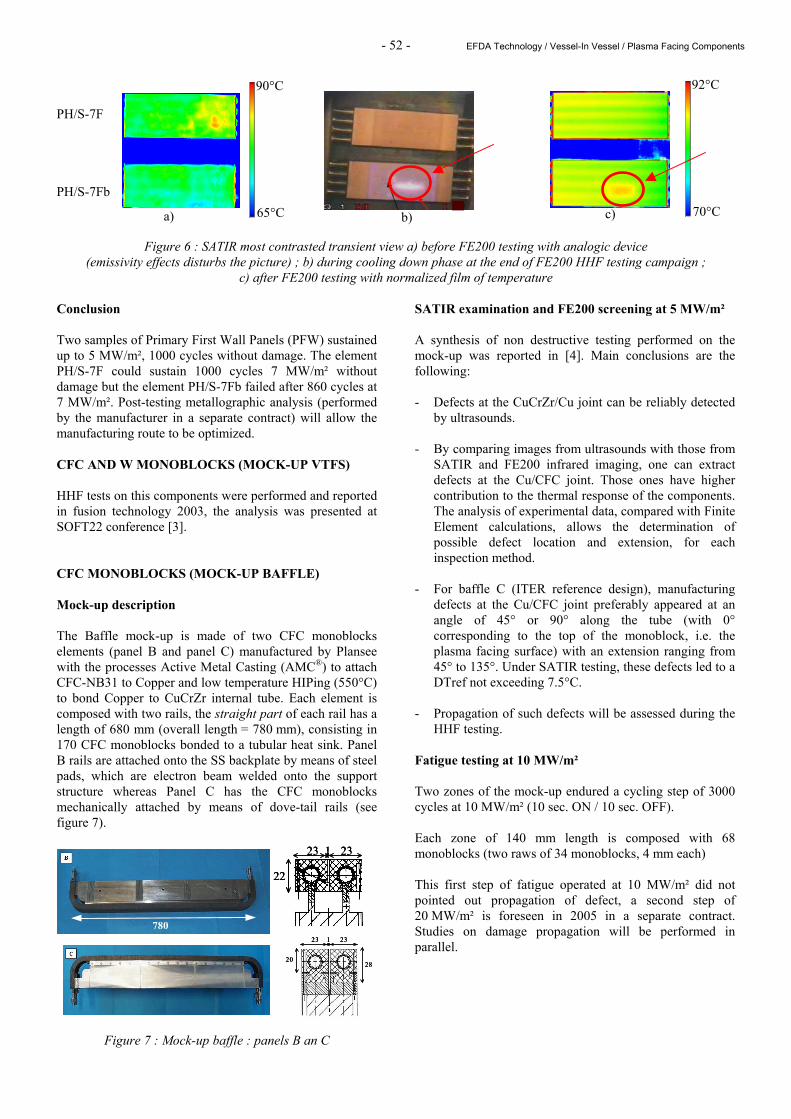
- 52 - EFDA Technology / Vessel-In Vessel / Plasma Facing Components
PH/S-7F PH/S-7Fb
Figure 6 : SATIR most contrasted transient view a) before FE200 testing with analogic device (emissivity effects disturbs the picture) ; b) during cooling down phase at the end of FE200 HHF testing campaign ;
c) after FE200 testing with normalized film of temperature Conclusion Two samples of Primary First Wall Panels (PFW) sustained up to 5 MW/m², 1000 cycles without damage. The element PH/S-7F could sustain 1000 cycles 7 MW/m² without damage but the element PH/S-7Fb failed after 860 cycles at 7 MW/m². Post-testing metallographic analysis (performed by the manufacturer in a separate contract) will allow the manufacturing route to be optimized. CFC AND W MONOBLOCKS (MOCK-UP VTFS) HHF tests on this components were performed and reported in fusion technology 2003, the analysis was presented at SOFT22 conference [3]. CFC MONOBLOCKS (MOCK-UP BAFFLE) Mock-up description The Baffle mock-up is made of two CFC monoblocks elements (panel B and panel C) manufactured by Plansee with the processes Active Metal Casting (AMC®) to attach CFC-NB31 to Copper and low temperature HIPing (550°C) to bond Copper to CuCrZr internal tube. Each element is composed with two rails, the straight part of each rail has a length of 680 mm (overall length = 780 mm), consisting in 170 CFC monoblocks bonded to a tubular heat sink. Panel B rails are attached onto the SS backplate by means of steel pads, which are electron beam welded onto the support structure whereas Panel C has the CFC monoblocks mechanically attached by means of dove-tail rails (see figure 7).
Figure 7 : Mock-up baffle : panels B an C
SATIR examination and FE200 screening at 5 MW/m² A synthesis of non destructive testing performed on the mock-up was reported in [4]. Main conclusions are the following: - Defects at the CuCrZr/Cu joint can be reliably detected
by ultrasounds. - By comparing images from ultrasounds with those from
SATIR and FE200 infrared imaging, one can extract defects at the Cu/CFC joint. Those ones have higher contribution to the thermal response of the components. The analysis of experimental data, compared with Finite Element calculations, allows the determination of possible defect location and extension, for each inspection method.
- For baffle C (ITER reference design), manufacturing
defects at the Cu/CFC joint preferably appeared at an angle of 45° or 90° along the tube (with 0° corresponding to the top of the monoblock, i.e. the plasma facing surface) with an extension ranging from 45° to 135°. Under SATIR testing, these defects led to a DTref not exceeding 7.5°C.
- Propagation of such defects will be assessed during the
HHF testing. Fatigue testing at 10 MW/m² Two zones of the mock-up endured a cycling step of 3000 cycles at 10 MW/m² (10 sec. ON / 10 sec. OFF). Each zone of 140 mm length is composed with 68 monoblocks (two raws of 34 monoblocks, 4 mm each) This first step of fatigue operated at 10 MW/m² did not pointed out propagation of defect, a second step of 20 MW/m² is foreseen in 2005 in a separate contract. Studies on damage propagation will be performed in parallel.
22
23 23 1
22 22
23 23 1 23 23 1
23 231
2028
23 23123 231
20202828
780
70°C
92°C
c) a) 65°C
90°C
b)
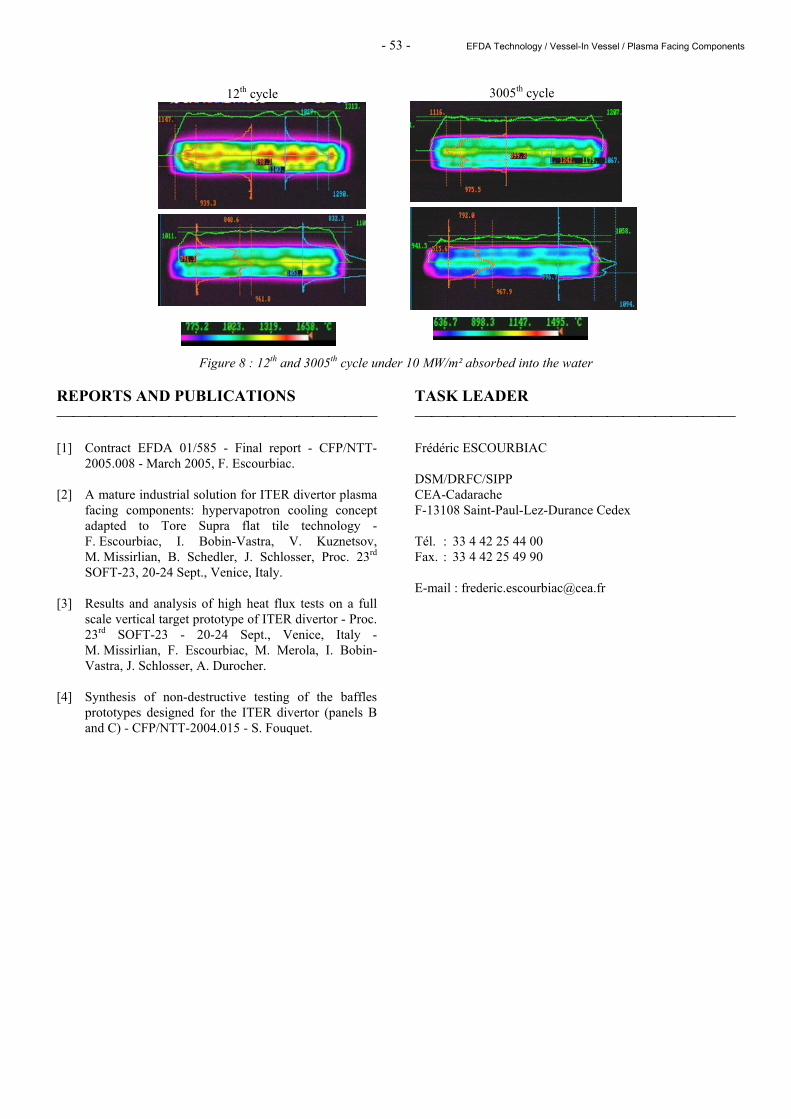
- 53 - EFDA Technology / Vessel-In Vessel / Plasma Facing Components
Figure 8 : 12th and 3005th cycle under 10 MW/m² absorbed into the water REPORTS AND PUBLICATIONS [1] Contract EFDA 01/585 - Final report - CFP/NTT-
2005.008 - March 2005, F. Escourbiac. [2] A mature industrial solution for ITER divertor plasma
facing components: hypervapotron cooling concept adapted to Tore Supra flat tile technology - F. Escourbiac, I. Bobin-Vastra, V. Kuznetsov, M. Missirlian, B. Schedler, J. Schlosser, Proc. 23rd SOFT-23, 20-24 Sept., Venice, Italy.
[3] Results and analysis of high heat flux tests on a full
scale vertical target prototype of ITER divertor - Proc. 23rd SOFT-23 - 20-24 Sept., Venice, Italy - M. Missirlian, F. Escourbiac, M. Merola, I. Bobin-Vastra, J. Schlosser, A. Durocher.
[4] Synthesis of non-destructive testing of the baffles
prototypes designed for the ITER divertor (panels B and C) - CFP/NTT-2004.015 - S. Fouquet.
TASK LEADER Frédéric ESCOURBIAC DSM/DRFC/SIPP CEA-Cadarache F-13108 Saint-Paul-Lez-Durance Cedex Tél. : 33 4 42 25 44 00 Fax. : 33 4 42 25 49 90 E-mail : [email protected]
12th cycle 3005th cycle

- 54 - EFDA Technology / Vessel-In Vessel / Plasma Facing Components
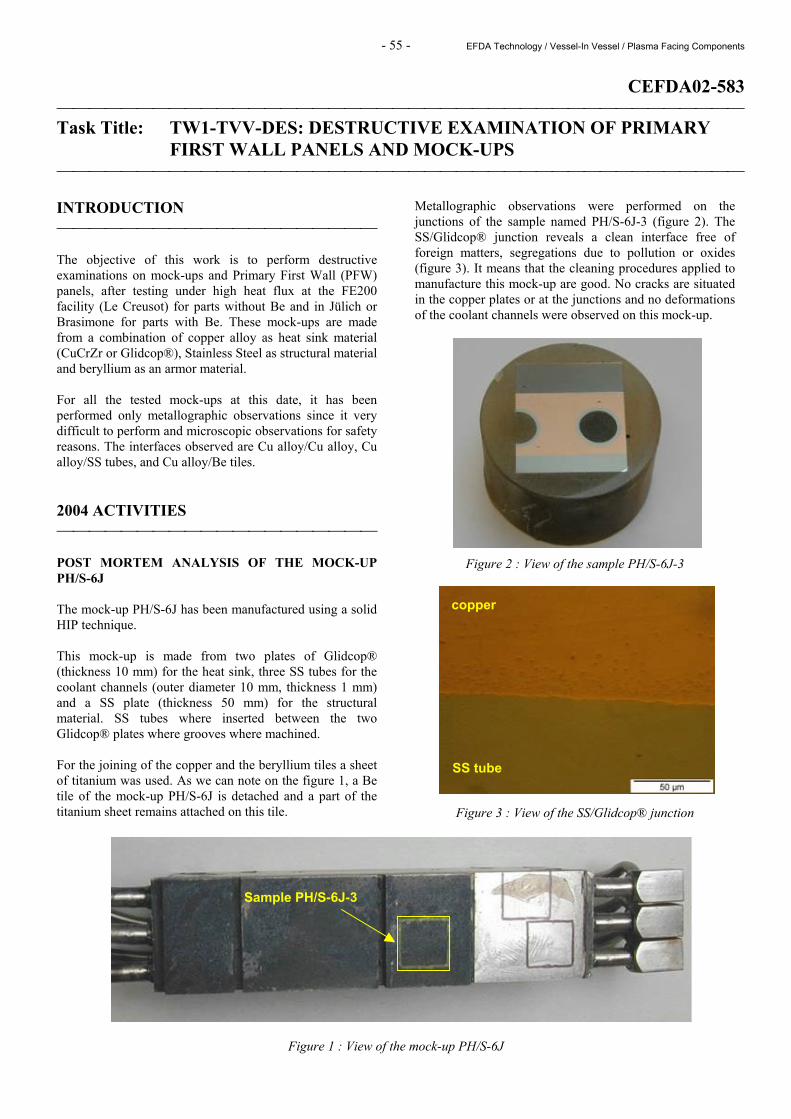
- 55 - EFDA Technology / Vessel-In Vessel / Plasma Facing Components
CEFDA02-583 Task Title: TW1-TVV-DES: DESTRUCTIVE EXAMINATION OF PRIMARY
FIRST WALL PANELS AND MOCK-UPS INTRODUCTION The objective of this work is to perform destructive examinations on mock-ups and Primary First Wall (PFW) panels, after testing under high heat flux at the FE200 facility (Le Creusot) for parts without Be and in Jülich or Brasimone for parts with Be. These mock-ups are made from a combination of copper alloy as heat sink material (CuCrZr or Glidcop®), Stainless Steel as structural material and beryllium as an armor material. For all the tested mock-ups at this date, it has been performed only metallographic observations since it very difficult to perform and microscopic observations for safety reasons. The interfaces observed are Cu alloy/Cu alloy, Cu alloy/SS tubes, and Cu alloy/Be tiles. 2004 ACTIVITIES POST MORTEM ANALYSIS OF THE MOCK-UP PH/S-6J The mock-up PH/S-6J has been manufactured using a solid HIP technique. This mock-up is made from two plates of Glidcop® (thickness 10 mm) for the heat sink, three SS tubes for the coolant channels (outer diameter 10 mm, thickness 1 mm) and a SS plate (thickness 50 mm) for the structural material. SS tubes where inserted between the two Glidcop® plates where grooves where machined. For the joining of the copper and the beryllium tiles a sheet of titanium was used. As we can note on the figure 1, a Be tile of the mock-up PH/S-6J is detached and a part of the titanium sheet remains attached on this tile.
Metallographic observations were performed on the junctions of the sample named PH/S-6J-3 (figure 2). The SS/Glidcop® junction reveals a clean interface free of foreign matters, segregations due to pollution or oxides (figure 3). It means that the cleaning procedures applied to manufacture this mock-up are good. No cracks are situated in the copper plates or at the junctions and no deformations of the coolant channels were observed on this mock-up.
Figure 2 : View of the sample PH/S-6J-3
Figure 3 : View of the SS/Glidcop® junction
Figure 1 : View of the mock-up PH/S-6J
Sample PH/S-6J-3
copper
SS tube
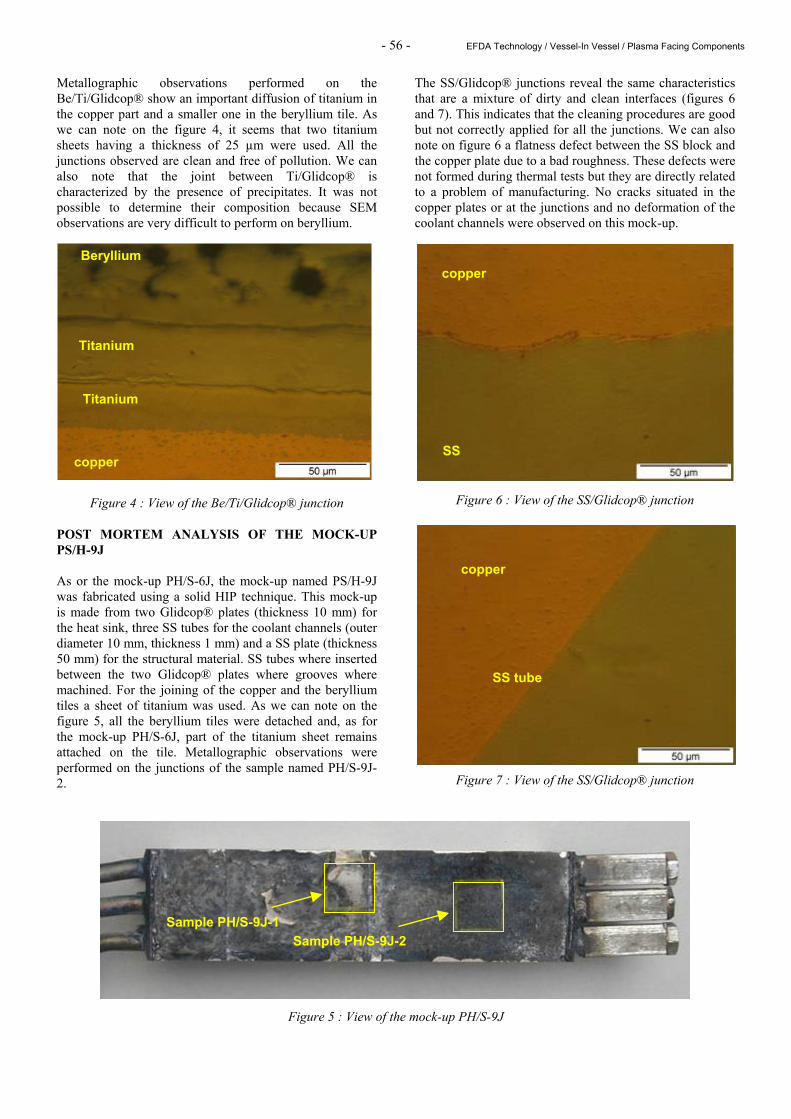
- 56 - EFDA Technology / Vessel-In Vessel / Plasma Facing Components
Metallographic observations performed on the Be/Ti/Glidcop® show an important diffusion of titanium in the copper part and a smaller one in the beryllium tile. As we can note on the figure 4, it seems that two titanium sheets having a thickness of 25 µm were used. All the junctions observed are clean and free of pollution. We can also note that the joint between Ti/Glidcop® is characterized by the presence of precipitates. It was not possible to determine their composition because SEM observations are very difficult to perform on beryllium.
Figure 4 : View of the Be/Ti/Glidcop® junction
POST MORTEM ANALYSIS OF THE MOCK-UP PS/H-9J As or the mock-up PH/S-6J, the mock-up named PS/H-9J was fabricated using a solid HIP technique. This mock-up is made from two Glidcop® plates (thickness 10 mm) for the heat sink, three SS tubes for the coolant channels (outer diameter 10 mm, thickness 1 mm) and a SS plate (thickness 50 mm) for the structural material. SS tubes where inserted between the two Glidcop® plates where grooves where machined. For the joining of the copper and the beryllium tiles a sheet of titanium was used. As we can note on the figure 5, all the beryllium tiles were detached and, as for the mock-up PH/S-6J, part of the titanium sheet remains attached on the tile. Metallographic observations were performed on the junctions of the sample named PH/S-9J-2.
The SS/Glidcop® junctions reveal the same characteristics that are a mixture of dirty and clean interfaces (figures 6 and 7). This indicates that the cleaning procedures are good but not correctly applied for all the junctions. We can also note on figure 6 a flatness defect between the SS block and the copper plate due to a bad roughness. These defects were not formed during thermal tests but they are directly related to a problem of manufacturing. No cracks situated in the copper plates or at the junctions and no deformation of the coolant channels were observed on this mock-up.
Figure 6 : View of the SS/Glidcop® junction
Figure 7 : View of the SS/Glidcop® junction
Figure 5 : View of the mock-up PH/S-9J
copper
Beryllium
Titanium
Titanium
copper
SS
copper
SS tube
Sample PH/S-9J-2 Sample PH/S-9J-1
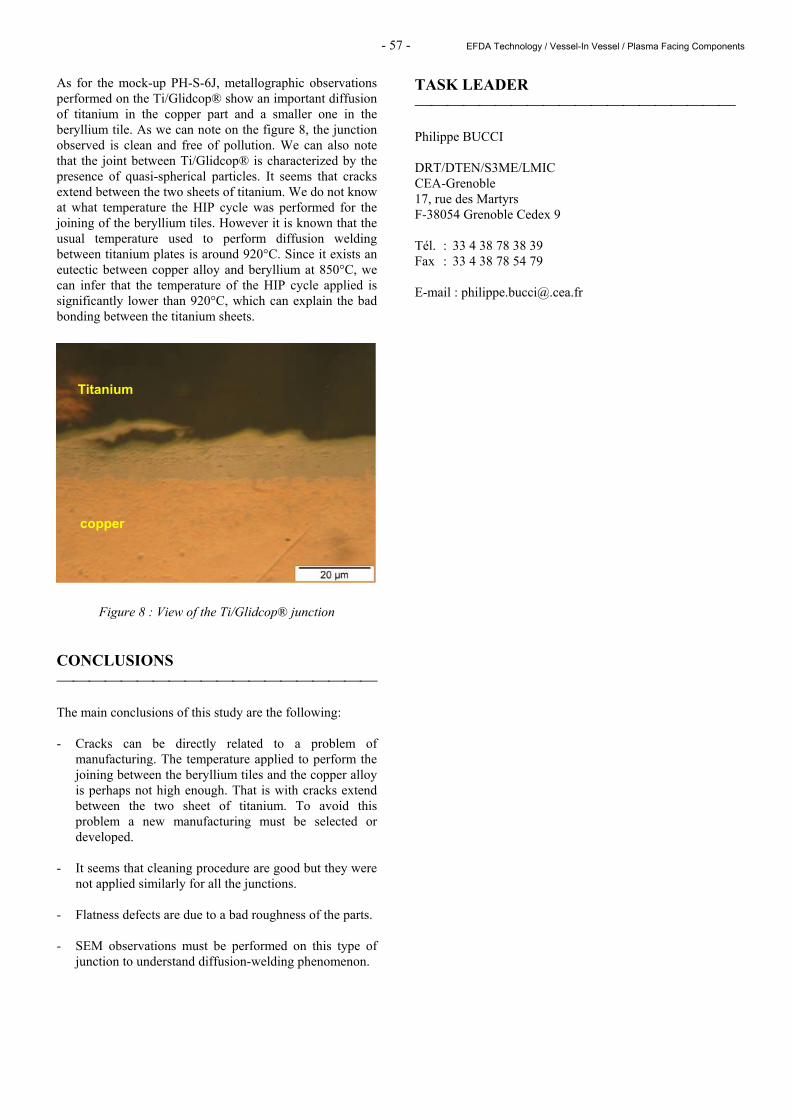
- 57 - EFDA Technology / Vessel-In Vessel / Plasma Facing Components
As for the mock-up PH-S-6J, metallographic observations performed on the Ti/Glidcop® show an important diffusion of titanium in the copper part and a smaller one in the beryllium tile. As we can note on the figure 8, the junction observed is clean and free of pollution. We can also note that the joint between Ti/Glidcop® is characterized by the presence of quasi-spherical particles. It seems that cracks extend between the two sheets of titanium. We do not know at what temperature the HIP cycle was performed for the joining of the beryllium tiles. However it is known that the usual temperature used to perform diffusion welding between titanium plates is around 920°C. Since it exists an eutectic between copper alloy and beryllium at 850°C, we can infer that the temperature of the HIP cycle applied is significantly lower than 920°C, which can explain the bad bonding between the titanium sheets.
Figure 8 : View of the Ti/Glidcop® junction
CONCLUSIONS The main conclusions of this study are the following: - Cracks can be directly related to a problem of
manufacturing. The temperature applied to perform the joining between the beryllium tiles and the copper alloy is perhaps not high enough. That is with cracks extend between the two sheet of titanium. To avoid this problem a new manufacturing must be selected or developed.
- It seems that cleaning procedure are good but they were
not applied similarly for all the junctions. - Flatness defects are due to a bad roughness of the parts. - SEM observations must be performed on this type of
junction to understand diffusion-welding phenomenon.
TASK LEADER Philippe BUCCI DRT/DTEN/S3ME/LMIC CEA-Grenoble 17, rue des Martyrs F-38054 Grenoble Cedex 9 Tél. : 33 4 38 78 38 39 Fax : 33 4 38 78 54 79 E-mail : [email protected]
copper
Titanium

- 58 - EFDA Technology / Vessel-In Vessel / Plasma Facing Components
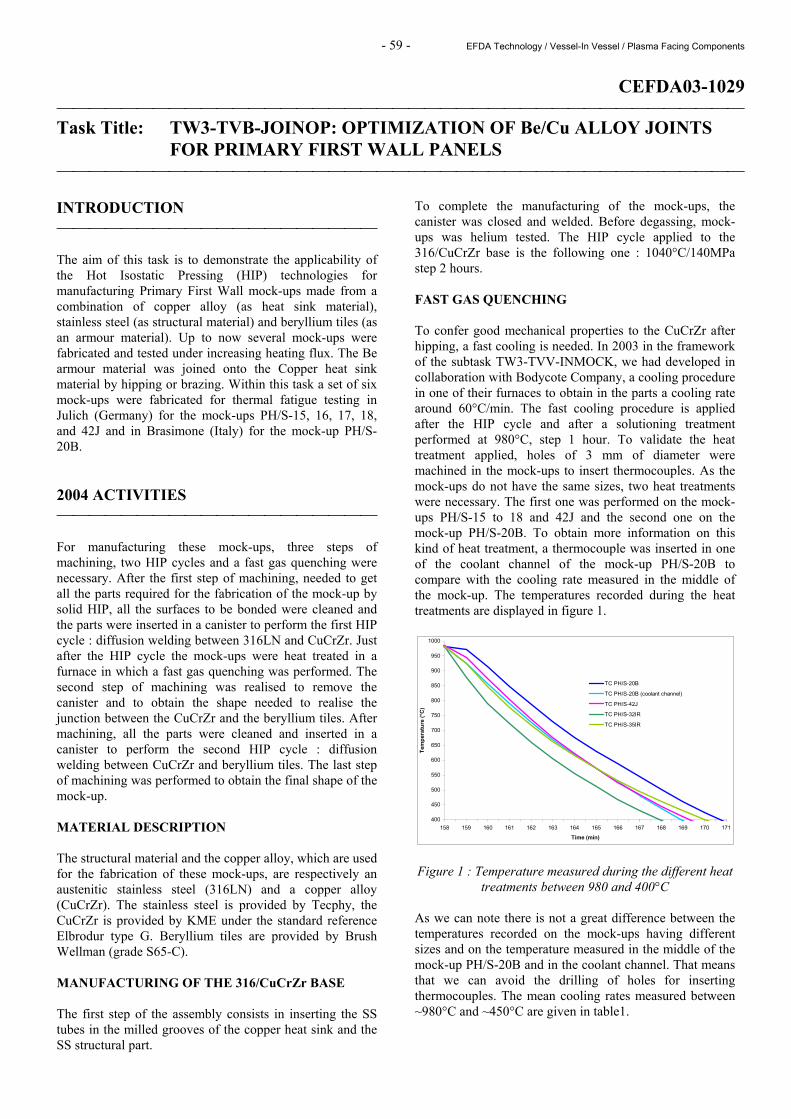
- 59 - EFDA Technology / Vessel-In Vessel / Plasma Facing Components
CEFDA03-1029 Task Title: TW3-TVB-JOINOP: OPTIMIZATION OF Be/Cu ALLOY JOINTS
FOR PRIMARY FIRST WALL PANELS INTRODUCTION The aim of this task is to demonstrate the applicability of the Hot Isostatic Pressing (HIP) technologies for manufacturing Primary First Wall mock-ups made from a combination of copper alloy (as heat sink material), stainless steel (as structural material) and beryllium tiles (as an armour material). Up to now several mock-ups were fabricated and tested under increasing heating flux. The Be armour material was joined onto the Copper heat sink material by hipping or brazing. Within this task a set of six mock-ups were fabricated for thermal fatigue testing in Julich (Germany) for the mock-ups PH/S-15, 16, 17, 18, and 42J and in Brasimone (Italy) for the mock-up PH/S-20B. 2004 ACTIVITIES For manufacturing these mock-ups, three steps of machining, two HIP cycles and a fast gas quenching were necessary. After the first step of machining, needed to get all the parts required for the fabrication of the mock-up by solid HIP, all the surfaces to be bonded were cleaned and the parts were inserted in a canister to perform the first HIP cycle : diffusion welding between 316LN and CuCrZr. Just after the HIP cycle the mock-ups were heat treated in a furnace in which a fast gas quenching was performed. The second step of machining was realised to remove the canister and to obtain the shape needed to realise the junction between the CuCrZr and the beryllium tiles. After machining, all the parts were cleaned and inserted in a canister to perform the second HIP cycle : diffusion welding between CuCrZr and beryllium tiles. The last step of machining was performed to obtain the final shape of the mock-up. MATERIAL DESCRIPTION The structural material and the copper alloy, which are used for the fabrication of these mock-ups, are respectively an austenitic stainless steel (316LN) and a copper alloy (CuCrZr). The stainless steel is provided by Tecphy, the CuCrZr is provided by KME under the standard reference Elbrodur type G. Beryllium tiles are provided by Brush Wellman (grade S65-C). MANUFACTURING OF THE 316/CuCrZr BASE The first step of the assembly consists in inserting the SS tubes in the milled grooves of the copper heat sink and the SS structural part.
To complete the manufacturing of the mock-ups, the canister was closed and welded. Before degassing, mock-ups was helium tested. The HIP cycle applied to the 316/CuCrZr base is the following one : 1040°C/140MPa step 2 hours. FAST GAS QUENCHING To confer good mechanical properties to the CuCrZr after hipping, a fast cooling is needed. In 2003 in the framework of the subtask TW3-TVV-INMOCK, we had developed in collaboration with Bodycote Company, a cooling procedure in one of their furnaces to obtain in the parts a cooling rate around 60°C/min. The fast cooling procedure is applied after the HIP cycle and after a solutioning treatment performed at 980°C, step 1 hour. To validate the heat treatment applied, holes of 3 mm of diameter were machined in the mock-ups to insert thermocouples. As the mock-ups do not have the same sizes, two heat treatments were necessary. The first one was performed on the mock-ups PH/S-15 to 18 and 42J and the second one on the mock-up PH/S-20B. To obtain more information on this kind of heat treatment, a thermocouple was inserted in one of the coolant channel of the mock-up PH/S-20B to compare with the cooling rate measured in the middle of the mock-up. The temperatures recorded during the heat treatments are displayed in figure 1.
400
450
500
550
600
650
700
750
800
850
900
950
1000
158 159 160 161 162 163 164 165 166 167 168 169 170 171
Time (min)
Tem
pera
ture
(°C
)
TC PH/S-20B
TC PH/S-20B (coolant channel)
TC PH/S-42J
TC PH/S-32IR
TC PH/S-35IR
Figure 1 : Temperature measured during the different heat
treatments between 980 and 400°C As we can note there is not a great difference between the temperatures recorded on the mock-ups having different sizes and on the temperature measured in the middle of the mock-up PH/S-20B and in the coolant channel. That means that we can avoid the drilling of holes for inserting thermocouples. The mean cooling rates measured between ~980°C and ~450°C are given in table1.
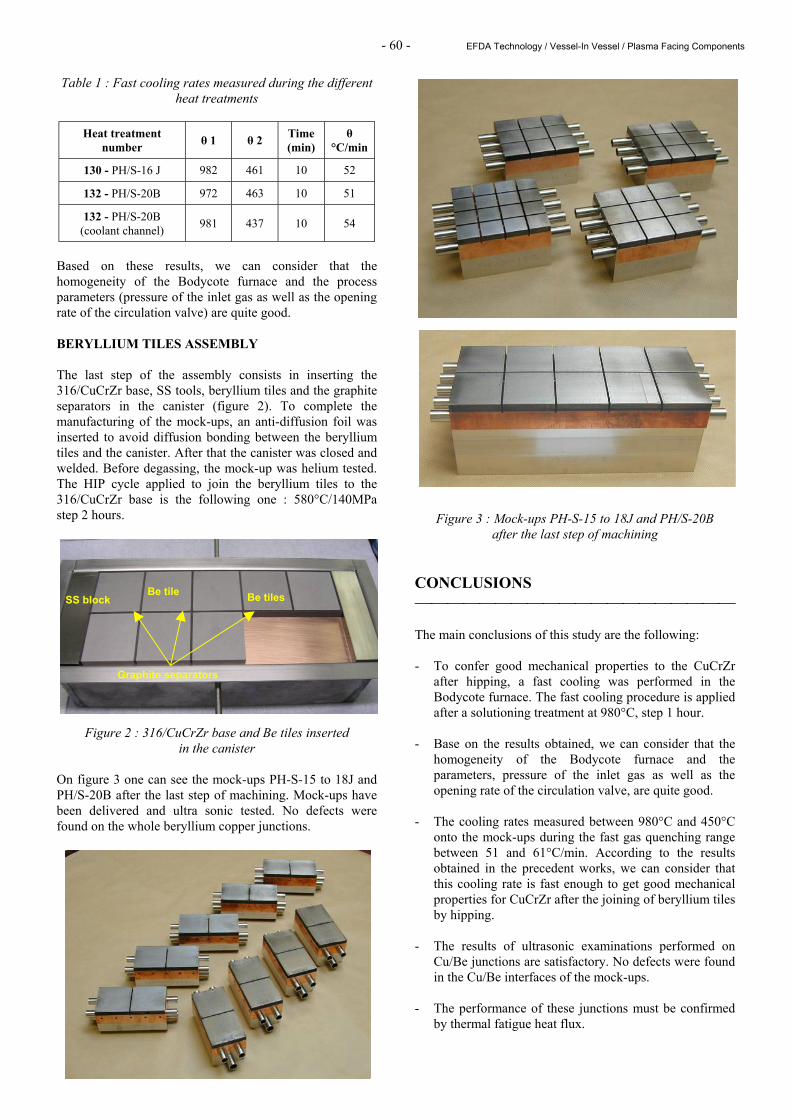
- 60 - EFDA Technology / Vessel-In Vessel / Plasma Facing Components
Table 1 : Fast cooling rates measured during the different heat treatments
Heat treatment
number θ 1 θ 2 Time (min)
θ °C/min
130 - PH/S-16 J 982 461 10 52
132 - PH/S-20B 972 463 10 51
132 - PH/S-20B (coolant channel) 981 437 10 54
Based on these results, we can consider that the homogeneity of the Bodycote furnace and the process parameters (pressure of the inlet gas as well as the opening rate of the circulation valve) are quite good. BERYLLIUM TILES ASSEMBLY The last step of the assembly consists in inserting the 316/CuCrZr base, SS tools, beryllium tiles and the graphite separators in the canister (figure 2). To complete the manufacturing of the mock-ups, an anti-diffusion foil was inserted to avoid diffusion bonding between the beryllium tiles and the canister. After that the canister was closed and welded. Before degassing, the mock-up was helium tested. The HIP cycle applied to join the beryllium tiles to the 316/CuCrZr base is the following one : 580°C/140MPa step 2 hours.
Figure 2 : 316/CuCrZr base and Be tiles inserted
in the canister On figure 3 one can see the mock-ups PH-S-15 to 18J and PH/S-20B after the last step of machining. Mock-ups have been delivered and ultra sonic tested. No defects were found on the whole beryllium copper junctions.
Figure 3 : Mock-ups PH-S-15 to 18J and PH/S-20B after the last step of machining
CONCLUSIONS The main conclusions of this study are the following: - To confer good mechanical properties to the CuCrZr
after hipping, a fast cooling was performed in the Bodycote furnace. The fast cooling procedure is applied after a solutioning treatment at 980°C, step 1 hour.
- Base on the results obtained, we can consider that the
homogeneity of the Bodycote furnace and the parameters, pressure of the inlet gas as well as the opening rate of the circulation valve, are quite good.
- The cooling rates measured between 980°C and 450°C
onto the mock-ups during the fast gas quenching range between 51 and 61°C/min. According to the results obtained in the precedent works, we can consider that this cooling rate is fast enough to get good mechanical properties for CuCrZr after the joining of beryllium tiles by hipping.
- The results of ultrasonic examinations performed on
Cu/Be junctions are satisfactory. No defects were found in the Cu/Be interfaces of the mock-ups.
- The performance of these junctions must be confirmed
by thermal fatigue heat flux.
SS block Be tile Be tiles
Graphite separators

- 61 - EFDA Technology / Vessel-In Vessel / Plasma Facing Components
TASK LEADER Philippe BUCCI DRT/DTEN/S3ME/LMIC CEA-Grenoble 17, rue des Martyrs F-38054 Grenoble Cedex 9 Tél. : 33 4 38 78 38 39 Fax : 33 4 38 78 54 79 E-mail : [email protected]

- 62 - EFDA Technology / Vessel-In Vessel / Plasma Facing Components
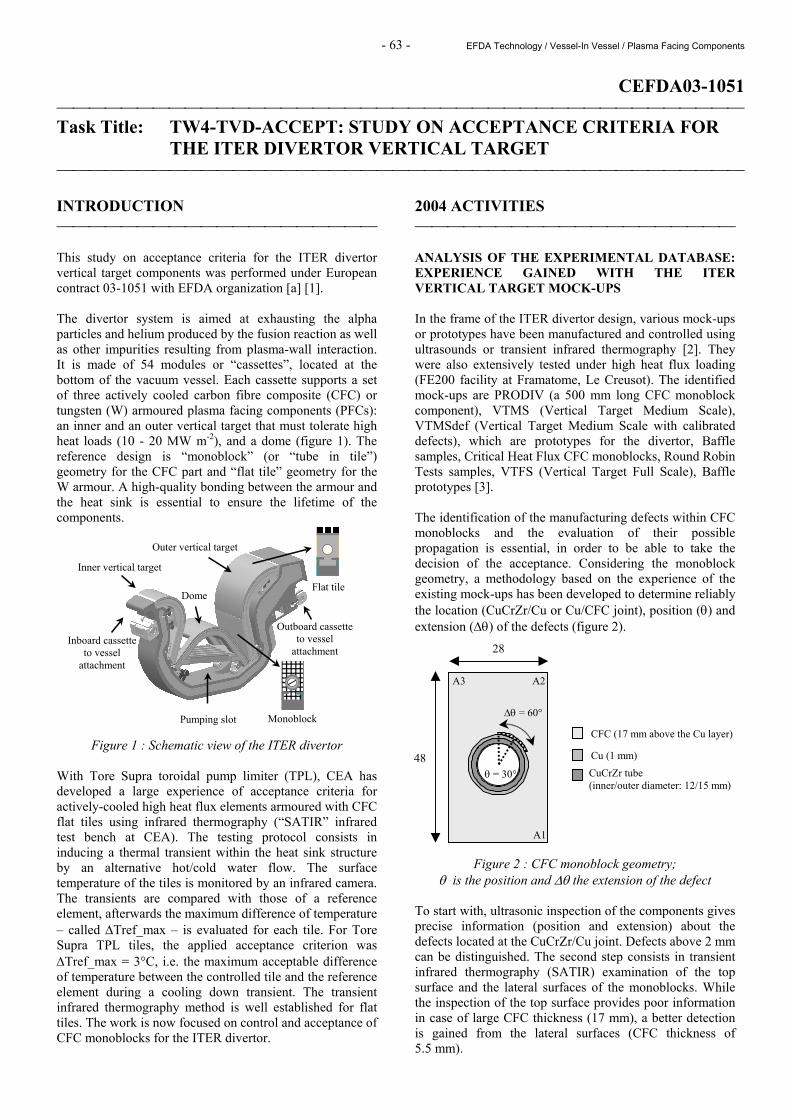
- 63 - EFDA Technology / Vessel-In Vessel / Plasma Facing Components
CEFDA03-1051 Task Title: TW4-TVD-ACCEPT: STUDY ON ACCEPTANCE CRITERIA FOR
THE ITER DIVERTOR VERTICAL TARGET INTRODUCTION This study on acceptance criteria for the ITER divertor vertical target components was performed under European contract 03-1051 with EFDA organization [a] [1]. The divertor system is aimed at exhausting the alpha particles and helium produced by the fusion reaction as well as other impurities resulting from plasma-wall interaction. It is made of 54 modules or “cassettes”, located at the bottom of the vacuum vessel. Each cassette supports a set of three actively cooled carbon fibre composite (CFC) or tungsten (W) armoured plasma facing components (PFCs): an inner and an outer vertical target that must tolerate high heat loads (10 - 20 MW m-2), and a dome (figure 1). The reference design is “monoblock” (or “tube in tile”) geometry for the CFC part and “flat tile” geometry for the W armour. A high-quality bonding between the armour and the heat sink is essential to ensure the lifetime of the components.
Figure 1 : Schematic view of the ITER divertor With Tore Supra toroidal pump limiter (TPL), CEA has developed a large experience of acceptance criteria for actively-cooled high heat flux elements armoured with CFC flat tiles using infrared thermography (“SATIR” infrared test bench at CEA). The testing protocol consists in inducing a thermal transient within the heat sink structure by an alternative hot/cold water flow. The surface temperature of the tiles is monitored by an infrared camera. The transients are compared with those of a reference element, afterwards the maximum difference of temperature – called ∆Tref_max – is evaluated for each tile. For Tore Supra TPL tiles, the applied acceptance criterion was ∆Tref_max = 3°C, i.e. the maximum acceptable difference of temperature between the controlled tile and the reference element during a cooling down transient. The transient infrared thermography method is well established for flat tiles. The work is now focused on control and acceptance of CFC monoblocks for the ITER divertor.
2004 ACTIVITIES ANALYSIS OF THE EXPERIMENTAL DATABASE: EXPERIENCE GAINED WITH THE ITER VERTICAL TARGET MOCK-UPS In the frame of the ITER divertor design, various mock-ups or prototypes have been manufactured and controlled using ultrasounds or transient infrared thermography [2]. They were also extensively tested under high heat flux loading (FE200 facility at Framatome, Le Creusot). The identified mock-ups are PRODIV (a 500 mm long CFC monoblock component), VTMS (Vertical Target Medium Scale), VTMSdef (Vertical Target Medium Scale with calibrated defects), which are prototypes for the divertor, Baffle samples, Critical Heat Flux CFC monoblocks, Round Robin Tests samples, VTFS (Vertical Target Full Scale), Baffle prototypes [3]. The identification of the manufacturing defects within CFC monoblocks and the evaluation of their possible propagation is essential, in order to be able to take the decision of the acceptance. Considering the monoblock geometry, a methodology based on the experience of the existing mock-ups has been developed to determine reliably the location (CuCrZr/Cu or Cu/CFC joint), position (θ) and extension (∆θ) of the defects (figure 2).
Figure 2 : CFC monoblock geometry; θ is the position and ∆θ the extension of the defect
To start with, ultrasonic inspection of the components gives precise information (position and extension) about the defects located at the CuCrZr/Cu joint. Defects above 2 mm can be distinguished. The second step consists in transient infrared thermography (SATIR) examination of the top surface and the lateral surfaces of the monoblocks. While the inspection of the top surface provides poor information in case of large CFC thickness (17 mm), a better detection is gained from the lateral surfaces (CFC thickness of 5.5 mm).
Inner vertical target
Outer vertical target
Inboard cassette to vessel
attachment
Dome
Outboard cassette to vessel
attachment
Pumping slot
Monoblock
Flat tile
CuCrZr tube (inner/outer diameter: 12/15 mm)
48
CFC (17 mm above the Cu layer) Cu (1 mm)
θ = 30°
∆θ = 60°
28
A1
A2 A3
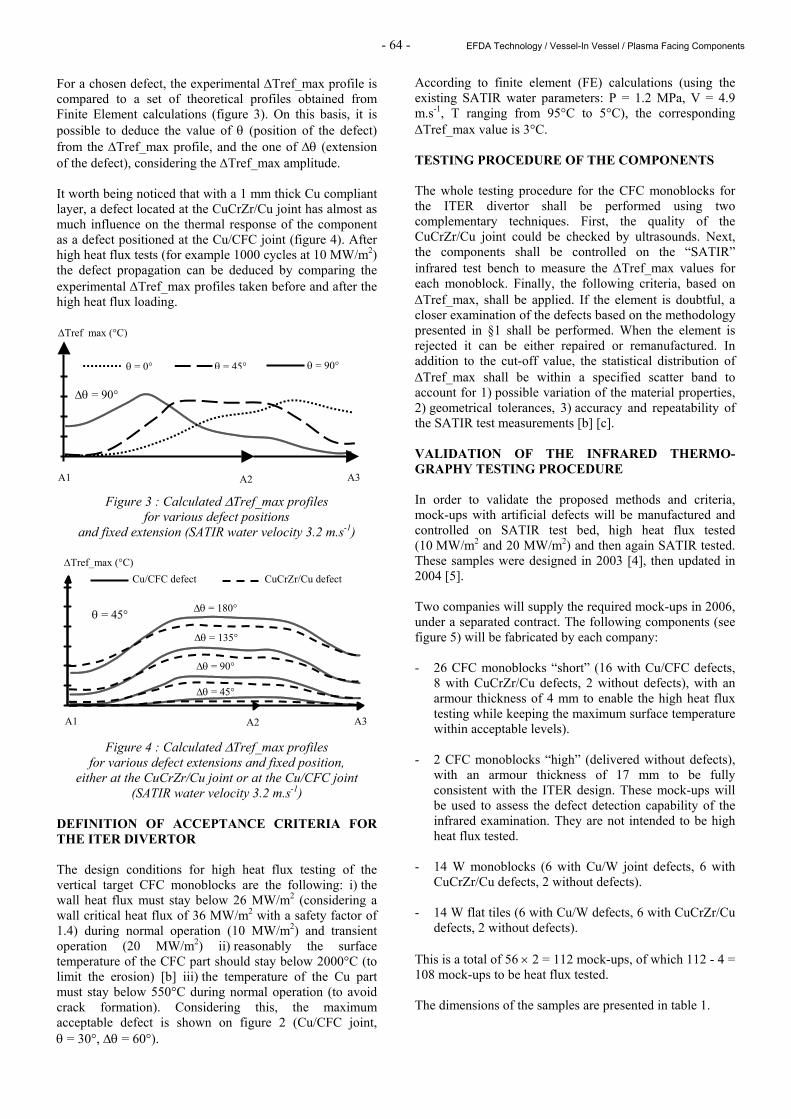
- 64 - EFDA Technology / Vessel-In Vessel / Plasma Facing Components
For a chosen defect, the experimental ∆Tref_max profile is compared to a set of theoretical profiles obtained from Finite Element calculations (figure 3). On this basis, it is possible to deduce the value of θ (position of the defect) from the ∆Tref_max profile, and the one of ∆θ (extension of the defect), considering the ∆Tref_max amplitude. It worth being noticed that with a 1 mm thick Cu compliant layer, a defect located at the CuCrZr/Cu joint has almost as much influence on the thermal response of the component as a defect positioned at the Cu/CFC joint (figure 4). After high heat flux tests (for example 1000 cycles at 10 MW/m2) the defect propagation can be deduced by comparing the experimental ∆Tref_max profiles taken before and after the high heat flux loading.
Figure 3 : Calculated ∆Tref_max profiles for various defect positions
and fixed extension (SATIR water velocity 3.2 m.s-1)
Figure 4 : Calculated ∆Tref_max profiles for various defect extensions and fixed position,
either at the CuCrZr/Cu joint or at the Cu/CFC joint (SATIR water velocity 3.2 m.s-1)
DEFINITION OF ACCEPTANCE CRITERIA FOR THE ITER DIVERTOR The design conditions for high heat flux testing of the vertical target CFC monoblocks are the following: i) the wall heat flux must stay below 26 MW/m2 (considering a wall critical heat flux of 36 MW/m2 with a safety factor of 1.4) during normal operation (10 MW/m2) and transient operation (20 MW/m2) ii) reasonably the surface temperature of the CFC part should stay below 2000°C (to limit the erosion) [b] iii) the temperature of the Cu part must stay below 550°C during normal operation (to avoid crack formation). Considering this, the maximum acceptable defect is shown on figure 2 (Cu/CFC joint, θ = 30°, ∆θ = 60°).
According to finite element (FE) calculations (using the existing SATIR water parameters: P = 1.2 MPa, V = 4.9 m.s-1, T ranging from 95°C to 5°C), the corresponding ∆Tref_max value is 3°C. TESTING PROCEDURE OF THE COMPONENTS The whole testing procedure for the CFC monoblocks for the ITER divertor shall be performed using two complementary techniques. First, the quality of the CuCrZr/Cu joint could be checked by ultrasounds. Next, the components shall be controlled on the “SATIR” infrared test bench to measure the ∆Tref_max values for each monoblock. Finally, the following criteria, based on ∆Tref_max, shall be applied. If the element is doubtful, a closer examination of the defects based on the methodology presented in §1 shall be performed. When the element is rejected it can be either repaired or remanufactured. In addition to the cut-off value, the statistical distribution of ∆Tref_max shall be within a specified scatter band to account for 1) possible variation of the material properties, 2) geometrical tolerances, 3) accuracy and repeatability of the SATIR test measurements [b] [c]. VALIDATION OF THE INFRARED THERMO-GRAPHY TESTING PROCEDURE In order to validate the proposed methods and criteria, mock-ups with artificial defects will be manufactured and controlled on SATIR test bed, high heat flux tested (10 MW/m2 and 20 MW/m2) and then again SATIR tested. These samples were designed in 2003 [4], then updated in 2004 [5]. Two companies will supply the required mock-ups in 2006, under a separated contract. The following components (see figure 5) will be fabricated by each company: - 26 CFC monoblocks “short” (16 with Cu/CFC defects,
8 with CuCrZr/Cu defects, 2 without defects), with an armour thickness of 4 mm to enable the high heat flux testing while keeping the maximum surface temperature within acceptable levels).
- 2 CFC monoblocks “high” (delivered without defects),
with an armour thickness of 17 mm to be fully consistent with the ITER design. These mock-ups will be used to assess the defect detection capability of the infrared examination. They are not intended to be high heat flux tested.
- 14 W monoblocks (6 with Cu/W joint defects, 6 with
CuCrZr/Cu defects, 2 without defects). - 14 W flat tiles (6 with Cu/W defects, 6 with CuCrZr/Cu
defects, 2 without defects). This is a total of 56 × 2 = 112 mock-ups, of which 112 - 4 = 108 mock-ups to be heat flux tested. The dimensions of the samples are presented in table 1.
CuCrZr/Cu defect Cu/CFC defect
∆θ = 180°
∆θ = 135°
∆θ = 90°
∆θ = 45°
∆Tref_max (°C)
A1 A2 A3
θ = 45°
∆Tref_max (°C)
θ = 0° θ = 45° θ = 90°
A1 A2 A3
∆θ = 90°
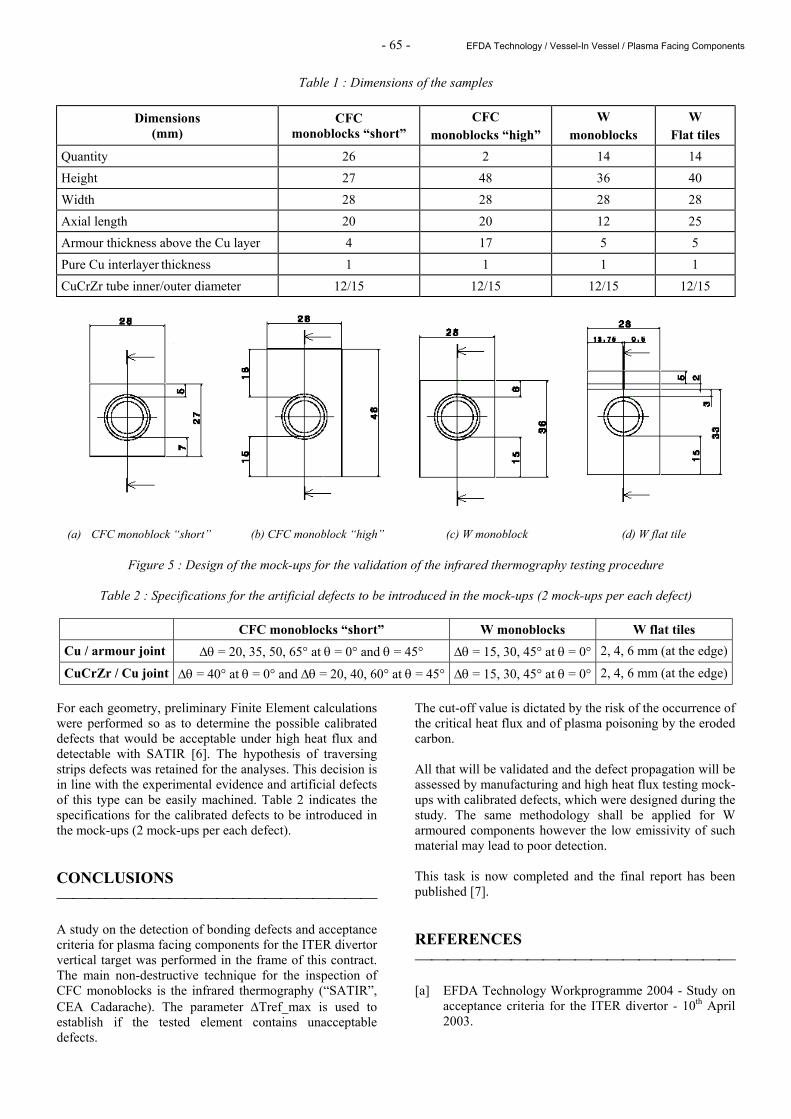
- 65 - EFDA Technology / Vessel-In Vessel / Plasma Facing Components
Table 1 : Dimensions of the samples
Dimensions (mm)
CFC monoblocks “short”
CFC monoblocks “high”
W monoblocks
W Flat tiles
Quantity 26 2 14 14 Height 27 48 36 40 Width 28 28 28 28 Axial length 20 20 12 25 Armour thickness above the Cu layer 4 17 5 5 Pure Cu interlayer thickness 1 1 1 1 CuCrZr tube inner/outer diameter 12/15 12/15 12/15 12/15
Figure 5 : Design of the mock-ups for the validation of the infrared thermography testing procedure
Table 2 : Specifications for the artificial defects to be introduced in the mock-ups (2 mock-ups per each defect)
CFC monoblocks “short” W monoblocks W flat tiles Cu / armour joint ∆θ = 20, 35, 50, 65° at θ = 0° and θ = 45° ∆θ = 15, 30, 45° at θ = 0° 2, 4, 6 mm (at the edge)
CuCrZr / Cu joint ∆θ = 40° at θ = 0° and ∆θ = 20, 40, 60° at θ = 45° ∆θ = 15, 30, 45° at θ = 0° 2, 4, 6 mm (at the edge) For each geometry, preliminary Finite Element calculations were performed so as to determine the possible calibrated defects that would be acceptable under high heat flux and detectable with SATIR [6]. The hypothesis of traversing strips defects was retained for the analyses. This decision is in line with the experimental evidence and artificial defects of this type can be easily machined. Table 2 indicates the specifications for the calibrated defects to be introduced in the mock-ups (2 mock-ups per each defect). CONCLUSIONS A study on the detection of bonding defects and acceptance criteria for plasma facing components for the ITER divertor vertical target was performed in the frame of this contract. The main non-destructive technique for the inspection of CFC monoblocks is the infrared thermography (“SATIR”, CEA Cadarache). The parameter ∆Tref_max is used to establish if the tested element contains unacceptable defects.
The cut-off value is dictated by the risk of the occurrence of the critical heat flux and of plasma poisoning by the eroded carbon. All that will be validated and the defect propagation will be assessed by manufacturing and high heat flux testing mock-ups with calibrated defects, which were designed during the study. The same methodology shall be applied for W armoured components however the low emissivity of such material may lead to poor detection. This task is now completed and the final report has been published [7]. REFERENCES [a] EFDA Technology Workprogramme 2004 - Study on
acceptance criteria for the ITER divertor - 10th April 2003.
(a) CFC monoblock “short” (b) CFC monoblock “high” (c) W monoblock (d) W flat tile
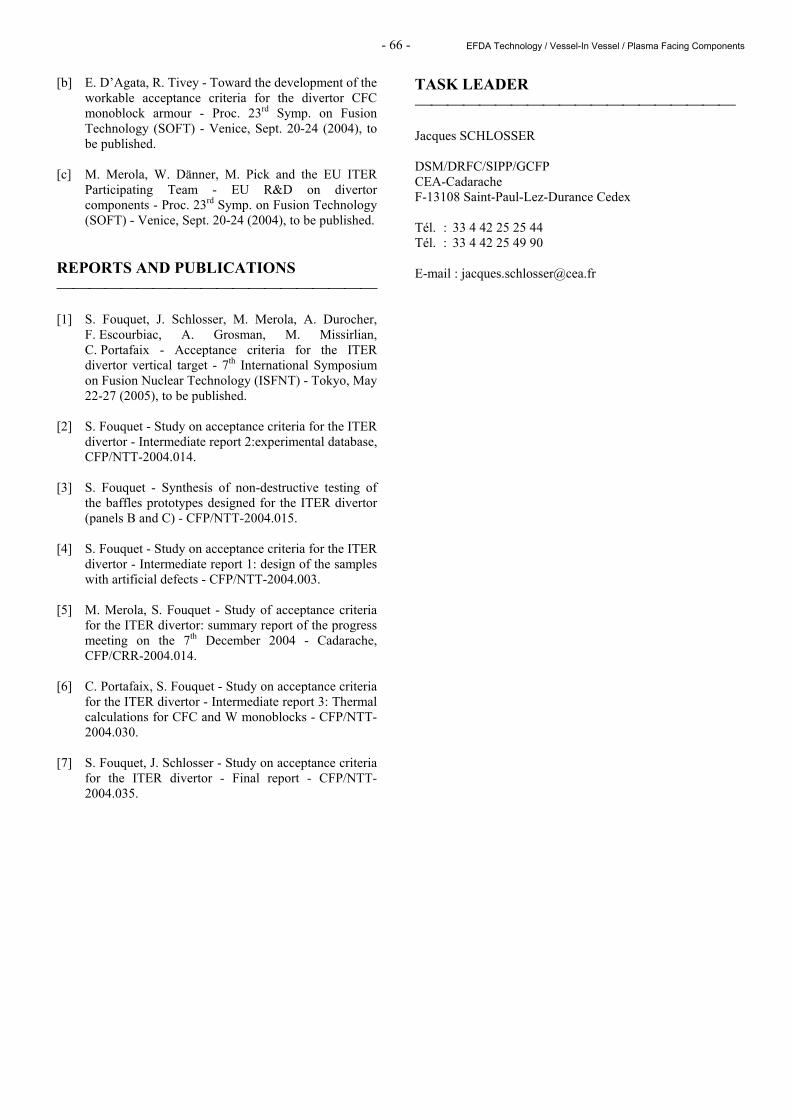
- 66 - EFDA Technology / Vessel-In Vessel / Plasma Facing Components
[b] E. D’Agata, R. Tivey - Toward the development of the workable acceptance criteria for the divertor CFC monoblock armour - Proc. 23rd Symp. on Fusion Technology (SOFT) - Venice, Sept. 20-24 (2004), to be published.
[c] M. Merola, W. Dänner, M. Pick and the EU ITER
Participating Team - EU R&D on divertor components - Proc. 23rd Symp. on Fusion Technology (SOFT) - Venice, Sept. 20-24 (2004), to be published.
REPORTS AND PUBLICATIONS [1] S. Fouquet, J. Schlosser, M. Merola, A. Durocher,
F. Escourbiac, A. Grosman, M. Missirlian, C. Portafaix - Acceptance criteria for the ITER divertor vertical target - 7th International Symposium on Fusion Nuclear Technology (ISFNT) - Tokyo, May 22-27 (2005), to be published.
[2] S. Fouquet - Study on acceptance criteria for the ITER
divertor - Intermediate report 2:experimental database, CFP/NTT-2004.014.
[3] S. Fouquet - Synthesis of non-destructive testing of
the baffles prototypes designed for the ITER divertor (panels B and C) - CFP/NTT-2004.015.
[4] S. Fouquet - Study on acceptance criteria for the ITER
divertor - Intermediate report 1: design of the samples with artificial defects - CFP/NTT-2004.003.
[5] M. Merola, S. Fouquet - Study of acceptance criteria
for the ITER divertor: summary report of the progress meeting on the 7th December 2004 - Cadarache, CFP/CRR-2004.014.
[6] C. Portafaix, S. Fouquet - Study on acceptance criteria
for the ITER divertor - Intermediate report 3: Thermal calculations for CFC and W monoblocks - CFP/NTT-2004.030.
[7] S. Fouquet, J. Schlosser - Study on acceptance criteria
for the ITER divertor - Final report - CFP/NTT-2004.035.
TASK LEADER Jacques SCHLOSSER DSM/DRFC/SIPP/GCFP CEA-Cadarache F-13108 Saint-Paul-Lez-Durance Cedex Tél. : 33 4 42 25 25 44 Tél. : 33 4 42 25 49 90 E-mail : [email protected]
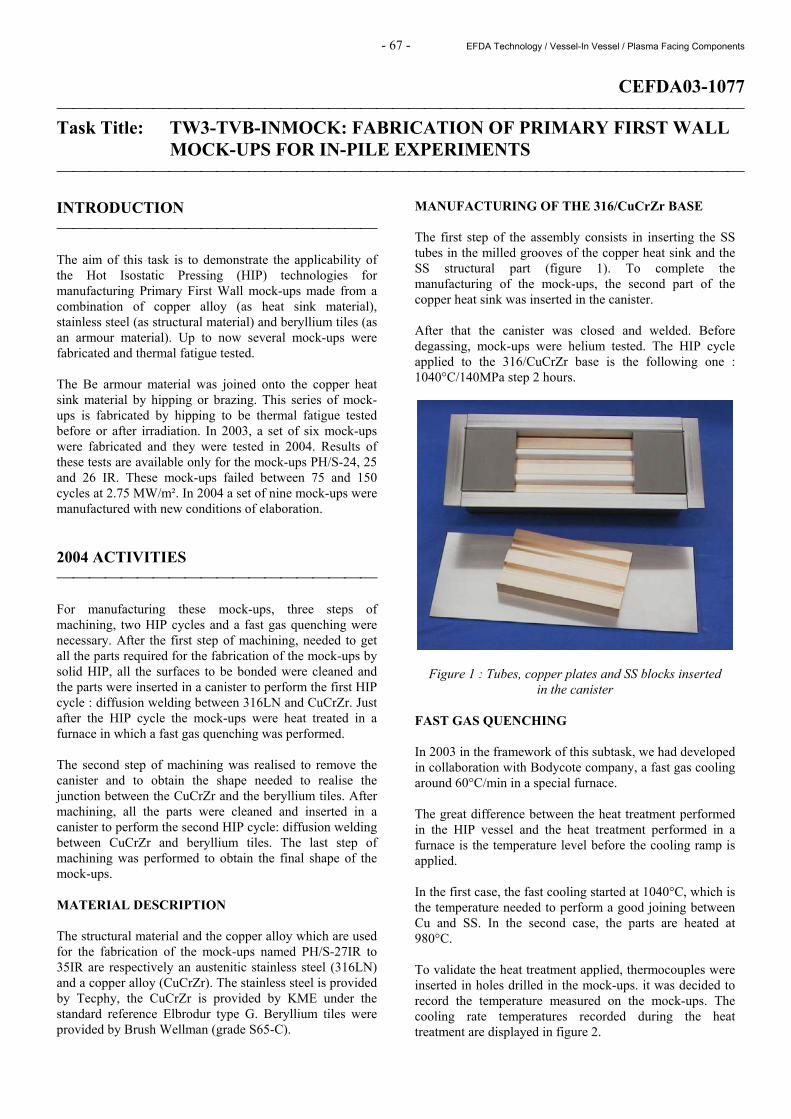
- 67 - EFDA Technology / Vessel-In Vessel / Plasma Facing Components
CEFDA03-1077 Task Title: TW3-TVB-INMOCK: FABRICATION OF PRIMARY FIRST WALL
MOCK-UPS FOR IN-PILE EXPERIMENTS INTRODUCTION The aim of this task is to demonstrate the applicability of the Hot Isostatic Pressing (HIP) technologies for manufacturing Primary First Wall mock-ups made from a combination of copper alloy (as heat sink material), stainless steel (as structural material) and beryllium tiles (as an armour material). Up to now several mock-ups were fabricated and thermal fatigue tested. The Be armour material was joined onto the copper heat sink material by hipping or brazing. This series of mock-ups is fabricated by hipping to be thermal fatigue tested before or after irradiation. In 2003, a set of six mock-ups were fabricated and they were tested in 2004. Results of these tests are available only for the mock-ups PH/S-24, 25 and 26 IR. These mock-ups failed between 75 and 150 cycles at 2.75 MW/m². In 2004 a set of nine mock-ups were manufactured with new conditions of elaboration. 2004 ACTIVITIES For manufacturing these mock-ups, three steps of machining, two HIP cycles and a fast gas quenching were necessary. After the first step of machining, needed to get all the parts required for the fabrication of the mock-ups by solid HIP, all the surfaces to be bonded were cleaned and the parts were inserted in a canister to perform the first HIP cycle : diffusion welding between 316LN and CuCrZr. Just after the HIP cycle the mock-ups were heat treated in a furnace in which a fast gas quenching was performed. The second step of machining was realised to remove the canister and to obtain the shape needed to realise the junction between the CuCrZr and the beryllium tiles. After machining, all the parts were cleaned and inserted in a canister to perform the second HIP cycle: diffusion welding between CuCrZr and beryllium tiles. The last step of machining was performed to obtain the final shape of the mock-ups. MATERIAL DESCRIPTION The structural material and the copper alloy which are used for the fabrication of the mock-ups named PH/S-27IR to 35IR are respectively an austenitic stainless steel (316LN) and a copper alloy (CuCrZr). The stainless steel is provided by Tecphy, the CuCrZr is provided by KME under the standard reference Elbrodur type G. Beryllium tiles were provided by Brush Wellman (grade S65-C).
MANUFACTURING OF THE 316/CuCrZr BASE The first step of the assembly consists in inserting the SS tubes in the milled grooves of the copper heat sink and the SS structural part (figure 1). To complete the manufacturing of the mock-ups, the second part of the copper heat sink was inserted in the canister. After that the canister was closed and welded. Before degassing, mock-ups were helium tested. The HIP cycle applied to the 316/CuCrZr base is the following one : 1040°C/140MPa step 2 hours.
Figure 1 : Tubes, copper plates and SS blocks inserted in the canister
FAST GAS QUENCHING In 2003 in the framework of this subtask, we had developed in collaboration with Bodycote company, a fast gas cooling around 60°C/min in a special furnace. The great difference between the heat treatment performed in the HIP vessel and the heat treatment performed in a furnace is the temperature level before the cooling ramp is applied. In the first case, the fast cooling started at 1040°C, which is the temperature needed to perform a good joining between Cu and SS. In the second case, the parts are heated at 980°C. To validate the heat treatment applied, thermocouples were inserted in holes drilled in the mock-ups. it was decided to record the temperature measured on the mock-ups. The cooling rate temperatures recorded during the heat treatment are displayed in figure 2.
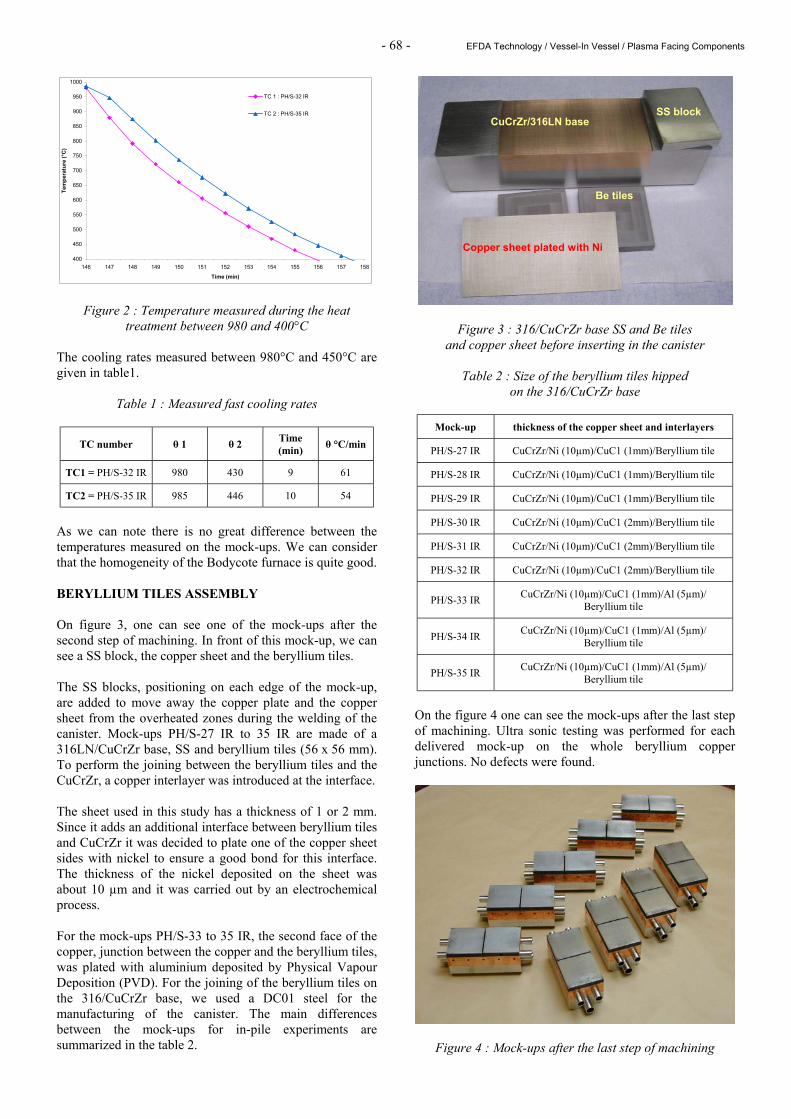
- 68 - EFDA Technology / Vessel-In Vessel / Plasma Facing Components
400
450
500
550
600
650
700
750
800
850
900
950
1000
146 147 148 149 150 151 152 153 154 155 156 157 158
Time (min)
Tem
pera
ture
(°C
)
TC 1 : PH/S-32 IR
TC 2 : PH/S-35 IR
Figure 2 : Temperature measured during the heat treatment between 980 and 400°C
The cooling rates measured between 980°C and 450°C are given in table1.
Table 1 : Measured fast cooling rates
TC number θ 1 θ 2 Time (min) θ °C/min
TC1 = PH/S-32 IR 980 430 9 61
TC2 = PH/S-35 IR 985 446 10 54
As we can note there is no great difference between the temperatures measured on the mock-ups. We can consider that the homogeneity of the Bodycote furnace is quite good. BERYLLIUM TILES ASSEMBLY On figure 3, one can see one of the mock-ups after the second step of machining. In front of this mock-up, we can see a SS block, the copper sheet and the beryllium tiles. The SS blocks, positioning on each edge of the mock-up, are added to move away the copper plate and the copper sheet from the overheated zones during the welding of the canister. Mock-ups PH/S-27 IR to 35 IR are made of a 316LN/CuCrZr base, SS and beryllium tiles (56 x 56 mm). To perform the joining between the beryllium tiles and the CuCrZr, a copper interlayer was introduced at the interface. The sheet used in this study has a thickness of 1 or 2 mm. Since it adds an additional interface between beryllium tiles and CuCrZr it was decided to plate one of the copper sheet sides with nickel to ensure a good bond for this interface. The thickness of the nickel deposited on the sheet was about 10 µm and it was carried out by an electrochemical process. For the mock-ups PH/S-33 to 35 IR, the second face of the copper, junction between the copper and the beryllium tiles, was plated with aluminium deposited by Physical Vapour Deposition (PVD). For the joining of the beryllium tiles on the 316/CuCrZr base, we used a DC01 steel for the manufacturing of the canister. The main differences between the mock-ups for in-pile experiments are summarized in the table 2.
Figure 3 : 316/CuCrZr base SS and Be tiles and copper sheet before inserting in the canister
Table 2 : Size of the beryllium tiles hipped
on the 316/CuCrZr base
Mock-up thickness of the copper sheet and interlayers
PH/S-27 IR CuCrZr/Ni (10µm)/CuC1 (1mm)/Beryllium tile
PH/S-28 IR CuCrZr/Ni (10µm)/CuC1 (1mm)/Beryllium tile
PH/S-29 IR CuCrZr/Ni (10µm)/CuC1 (1mm)/Beryllium tile
PH/S-30 IR CuCrZr/Ni (10µm)/CuC1 (2mm)/Beryllium tile
PH/S-31 IR CuCrZr/Ni (10µm)/CuC1 (2mm)/Beryllium tile
PH/S-32 IR CuCrZr/Ni (10µm)/CuC1 (2mm)/Beryllium tile
PH/S-33 IR CuCrZr/Ni (10µm)/CuC1 (1mm)/Al (5µm)/ Beryllium tile
PH/S-34 IR CuCrZr/Ni (10µm)/CuC1 (1mm)/Al (5µm)/ Beryllium tile
PH/S-35 IR CuCrZr/Ni (10µm)/CuC1 (1mm)/Al (5µm)/ Beryllium tile
On the figure 4 one can see the mock-ups after the last step of machining. Ultra sonic testing was performed for each delivered mock-up on the whole beryllium copper junctions. No defects were found.
Figure 4 : Mock-ups after the last step of machining
Copper sheet plated with Ni
CuCrZr/316LN base
Be tiles
SS block
- 69 - EFDA Technology / Vessel-In Vessel / Plasma Facing Components
CONCLUSIONS The main conclusions of this study are the following: - To confer good mechanical properties to the CuCrZr
after hipping, a fast cooling was performed in the Bodycote furnace. The fast cooling procedure is applied after a solutioning treatment at 980°C, step 1 hour.
- Base on the results obtained, we can consider that the
homogeneity of the Bodycote furnace and the parameters, pressure of the inlet gaz as well as the opening rate of the circulation valve, are quite good.
- The cooling rates measured between 980°C and 450°C
onto the mock-ups during the fast gas quenching ranges between 54 and 61°C/min. According to the results obtained in the precedent works, we can consider that this cooling rate is fast enough to get good mechanical properties for CuCrZr after the joining of beryllium tiles by hipping.
- This achievement demonstrates the manufacturing
feasibility of joining beryllium tiles using Aluminium deposited by CVD.
- The results of ultrasonic examinations performed on
Cu/Be junctions are satisfactory. No defects were found in the Cu/Be interfaces of the mock-ups number PH/S-27 IR to 35 IR.
- The performance of these junctions must be confirmed
by thermal fatigue heat flux. REPORTS AND PUBLICATIONS Ph. Bucci et al. - Fabrication of primary first wall mock-ups for in-pile experiments, task TW3-TVB-INMOCK - Rapport technique DTEN/DL/2005/016, march 2005.
TASK LEADER Philippe BUCCI DRT/DTEN/S3ME/LMIC CEA-Grenoble 17, rue des Martyrs F-38054 Grenoble Cedex 9 Tél. : 33 4 38 78 38 39 Fax : 33 4 38 78 54 79 E-mail : [email protected]

- 70 - EFDA Technology / Vessel-In Vessel / Plasma Facing Components
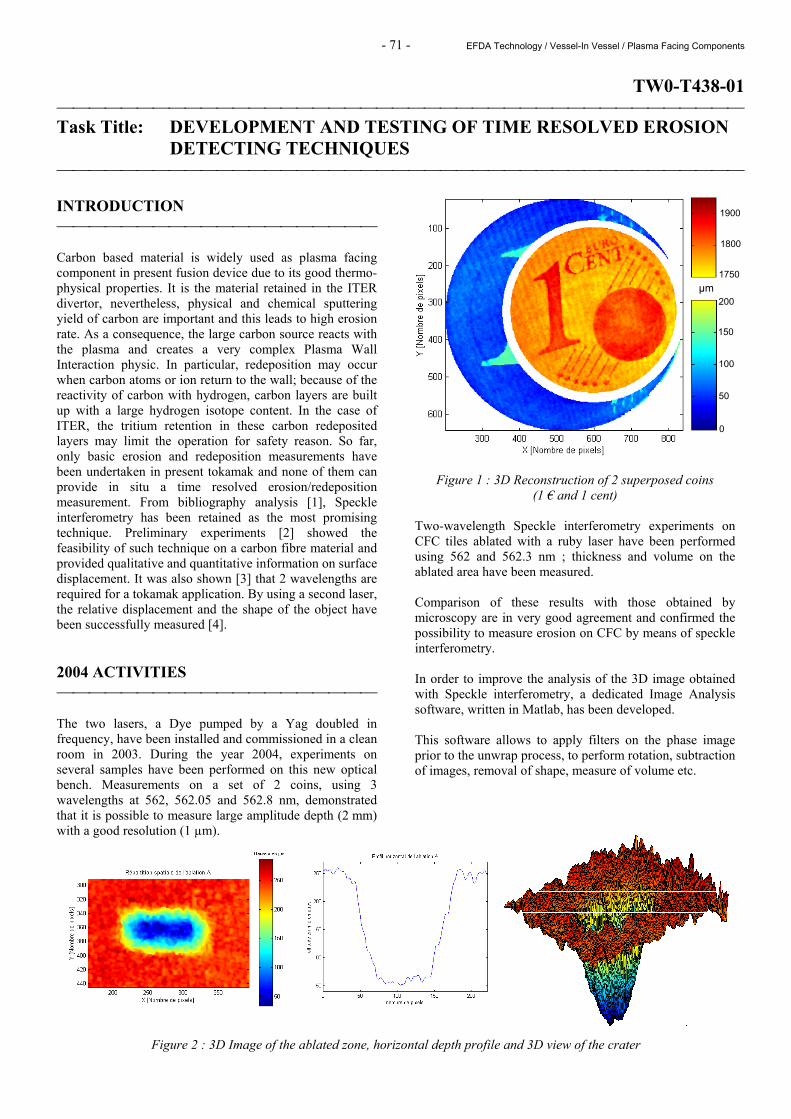
- 71 - EFDA Technology / Vessel-In Vessel / Plasma Facing Components
TW0-T438-01 Task Title: DEVELOPMENT AND TESTING OF TIME RESOLVED EROSION
DETECTING TECHNIQUES INTRODUCTION Carbon based material is widely used as plasma facing component in present fusion device due to its good thermo-physical properties. It is the material retained in the ITER divertor, nevertheless, physical and chemical sputtering yield of carbon are important and this leads to high erosion rate. As a consequence, the large carbon source reacts with the plasma and creates a very complex Plasma Wall Interaction physic. In particular, redeposition may occur when carbon atoms or ion return to the wall; because of the reactivity of carbon with hydrogen, carbon layers are built up with a large hydrogen isotope content. In the case of ITER, the tritium retention in these carbon redeposited layers may limit the operation for safety reason. So far, only basic erosion and redeposition measurements have been undertaken in present tokamak and none of them can provide in situ a time resolved erosion/redeposition measurement. From bibliography analysis [1], Speckle interferometry has been retained as the most promising technique. Preliminary experiments [2] showed the feasibility of such technique on a carbon fibre material and provided qualitative and quantitative information on surface displacement. It was also shown [3] that 2 wavelengths are required for a tokamak application. By using a second laser, the relative displacement and the shape of the object have been successfully measured [4]. 2004 ACTIVITIES The two lasers, a Dye pumped by a Yag doubled in frequency, have been installed and commissioned in a clean room in 2003. During the year 2004, experiments on several samples have been performed on this new optical bench. Measurements on a set of 2 coins, using 3 wavelengths at 562, 562.05 and 562.8 nm, demonstrated that it is possible to measure large amplitude depth (2 mm) with a good resolution (1 µm).
Figure 1 : 3D Reconstruction of 2 superposed coins (1 € and 1 cent)
Two-wavelength Speckle interferometry experiments on CFC tiles ablated with a ruby laser have been performed using 562 and 562.3 nm ; thickness and volume on the ablated area have been measured. Comparison of these results with those obtained by microscopy are in very good agreement and confirmed the possibility to measure erosion on CFC by means of speckle interferometry. In order to improve the analysis of the 3D image obtained with Speckle interferometry, a dedicated Image Analysis software, written in Matlab, has been developed. This software allows to apply filters on the phase image prior to the unwrap process, to perform rotation, subtraction of images, removal of shape, measure of volume etc.
Figure 2 : 3D Image of the ablated zone, horizontal depth profile and 3D view of the crater
µm
0
50
100
150
200
1750
1900
1800
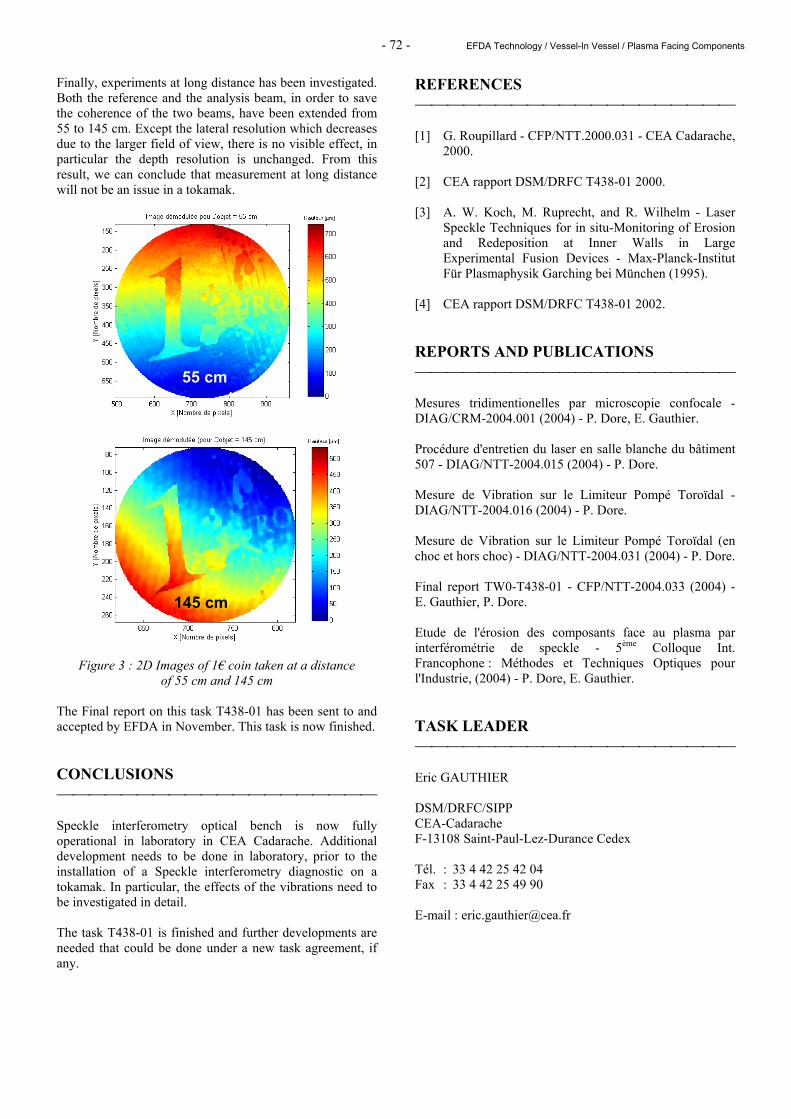
- 72 - EFDA Technology / Vessel-In Vessel / Plasma Facing Components
Finally, experiments at long distance has been investigated. Both the reference and the analysis beam, in order to save the coherence of the two beams, have been extended from 55 to 145 cm. Except the lateral resolution which decreases due to the larger field of view, there is no visible effect, in particular the depth resolution is unchanged. From this result, we can conclude that measurement at long distance will not be an issue in a tokamak.
Figure 3 : 2D Images of 1€ coin taken at a distance of 55 cm and 145 cm
The Final report on this task T438-01 has been sent to and accepted by EFDA in November. This task is now finished. CONCLUSIONS Speckle interferometry optical bench is now fully operational in laboratory in CEA Cadarache. Additional development needs to be done in laboratory, prior to the installation of a Speckle interferometry diagnostic on a tokamak. In particular, the effects of the vibrations need to be investigated in detail. The task T438-01 is finished and further developments are needed that could be done under a new task agreement, if any.
REFERENCES [1] G. Roupillard - CFP/NTT.2000.031 - CEA Cadarache,
2000. [2] CEA rapport DSM/DRFC T438-01 2000. [3] A. W. Koch, M. Ruprecht, and R. Wilhelm - Laser
Speckle Techniques for in situ-Monitoring of Erosion and Redeposition at Inner Walls in Large Experimental Fusion Devices - Max-Planck-Institut Für Plasmaphysik Garching bei München (1995).
[4] CEA rapport DSM/DRFC T438-01 2002. REPORTS AND PUBLICATIONS Mesures tridimentionelles par microscopie confocale -DIAG/CRM-2004.001 (2004) - P. Dore, E. Gauthier. Procédure d'entretien du laser en salle blanche du bâtiment 507 - DIAG/NTT-2004.015 (2004) - P. Dore. Mesure de Vibration sur le Limiteur Pompé Toroïdal - DIAG/NTT-2004.016 (2004) - P. Dore. Mesure de Vibration sur le Limiteur Pompé Toroïdal (en choc et hors choc) - DIAG/NTT-2004.031 (2004) - P. Dore. Final report TW0-T438-01 - CFP/NTT-2004.033 (2004) - E. Gauthier, P. Dore. Etude de l'érosion des composants face au plasma par interférométrie de speckle - 5ème Colloque Int. Francophone : Méthodes et Techniques Optiques pour l'Industrie, (2004) - P. Dore, E. Gauthier. TASK LEADER Eric GAUTHIER DSM/DRFC/SIPP CEA-Cadarache F-13108 Saint-Paul-Lez-Durance Cedex Tél. : 33 4 42 25 42 04 Fax : 33 4 42 25 49 90 E-mail : [email protected]
55 cm
145 cm
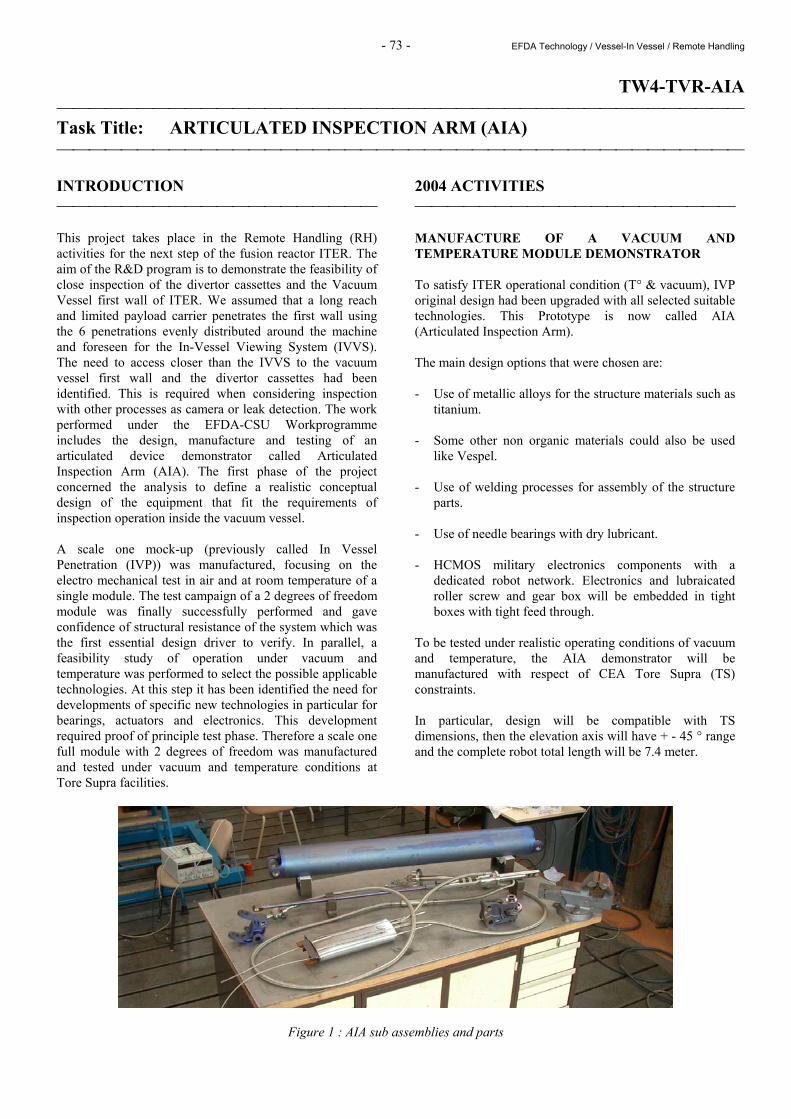
- 73 - EFDA Technology / Vessel-In Vessel / Remote Handling
TW4-TVR-AIA Task Title: ARTICULATED INSPECTION ARM (AIA) INTRODUCTION This project takes place in the Remote Handling (RH) activities for the next step of the fusion reactor ITER. The aim of the R&D program is to demonstrate the feasibility of close inspection of the divertor cassettes and the Vacuum Vessel first wall of ITER. We assumed that a long reach and limited payload carrier penetrates the first wall using the 6 penetrations evenly distributed around the machine and foreseen for the In-Vessel Viewing System (IVVS). The need to access closer than the IVVS to the vacuum vessel first wall and the divertor cassettes had been identified. This is required when considering inspection with other processes as camera or leak detection. The work performed under the EFDA-CSU Workprogramme includes the design, manufacture and testing of an articulated device demonstrator called Articulated Inspection Arm (AIA). The first phase of the project concerned the analysis to define a realistic conceptual design of the equipment that fit the requirements of inspection operation inside the vacuum vessel. A scale one mock-up (previously called In Vessel Penetration (IVP)) was manufactured, focusing on the electro mechanical test in air and at room temperature of a single module. The test campaign of a 2 degrees of freedom module was finally successfully performed and gave confidence of structural resistance of the system which was the first essential design driver to verify. In parallel, a feasibility study of operation under vacuum and temperature was performed to select the possible applicable technologies. At this step it has been identified the need for developments of specific new technologies in particular for bearings, actuators and electronics. This development required proof of principle test phase. Therefore a scale one full module with 2 degrees of freedom was manufactured and tested under vacuum and temperature conditions at Tore Supra facilities.
2004 ACTIVITIES MANUFACTURE OF A VACUUM AND TEMPERATURE MODULE DEMONSTRATOR To satisfy ITER operational condition (T° & vacuum), IVP original design had been upgraded with all selected suitable technologies. This Prototype is now called AIA (Articulated Inspection Arm). The main design options that were chosen are: - Use of metallic alloys for the structure materials such as
titanium. - Some other non organic materials could also be used
like Vespel. - Use of welding processes for assembly of the structure
parts. - Use of needle bearings with dry lubricant. - HCMOS military electronics components with a
dedicated robot network. Electronics and lubraicated roller screw and gear box will be embedded in tight boxes with tight feed through.
To be tested under realistic operating conditions of vacuum and temperature, the AIA demonstrator will be manufactured with respect of CEA Tore Supra (TS) constraints. In particular, design will be compatible with TS dimensions, then the elevation axis will have + - 45 ° range and the complete robot total length will be 7.4 meter.
Figure 1 : AIA sub assemblies and parts
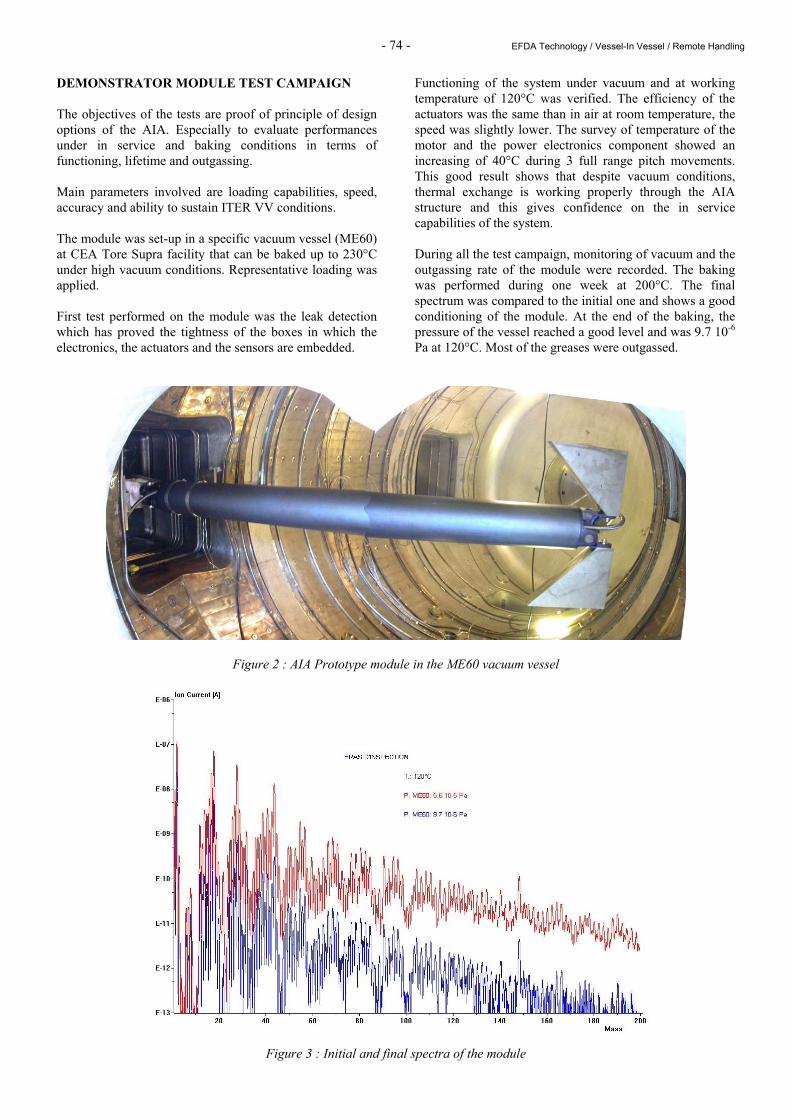
- 74 - EFDA Technology / Vessel-In Vessel / Remote Handling
DEMONSTRATOR MODULE TEST CAMPAIGN The objectives of the tests are proof of principle of design options of the AIA. Especially to evaluate performances under in service and baking conditions in terms of functioning, lifetime and outgassing. Main parameters involved are loading capabilities, speed, accuracy and ability to sustain ITER VV conditions. The module was set-up in a specific vacuum vessel (ME60) at CEA Tore Supra facility that can be baked up to 230°C under high vacuum conditions. Representative loading was applied. First test performed on the module was the leak detection which has proved the tightness of the boxes in which the electronics, the actuators and the sensors are embedded.
Functioning of the system under vacuum and at working temperature of 120°C was verified. The efficiency of the actuators was the same than in air at room temperature, the speed was slightly lower. The survey of temperature of the motor and the power electronics component showed an increasing of 40°C during 3 full range pitch movements. This good result shows that despite vacuum conditions, thermal exchange is working properly through the AIA structure and this gives confidence on the in service capabilities of the system. During all the test campaign, monitoring of vacuum and the outgassing rate of the module were recorded. The baking was performed during one week at 200°C. The final spectrum was compared to the initial one and shows a good conditioning of the module. At the end of the baking, the pressure of the vessel reached a good level and was 9.7 10-6 Pa at 120°C. Most of the greases were outgassed.
Figure 2 : AIA Prototype module in the ME60 vacuum vessel
Figure 3 : Initial and final spectra of the module
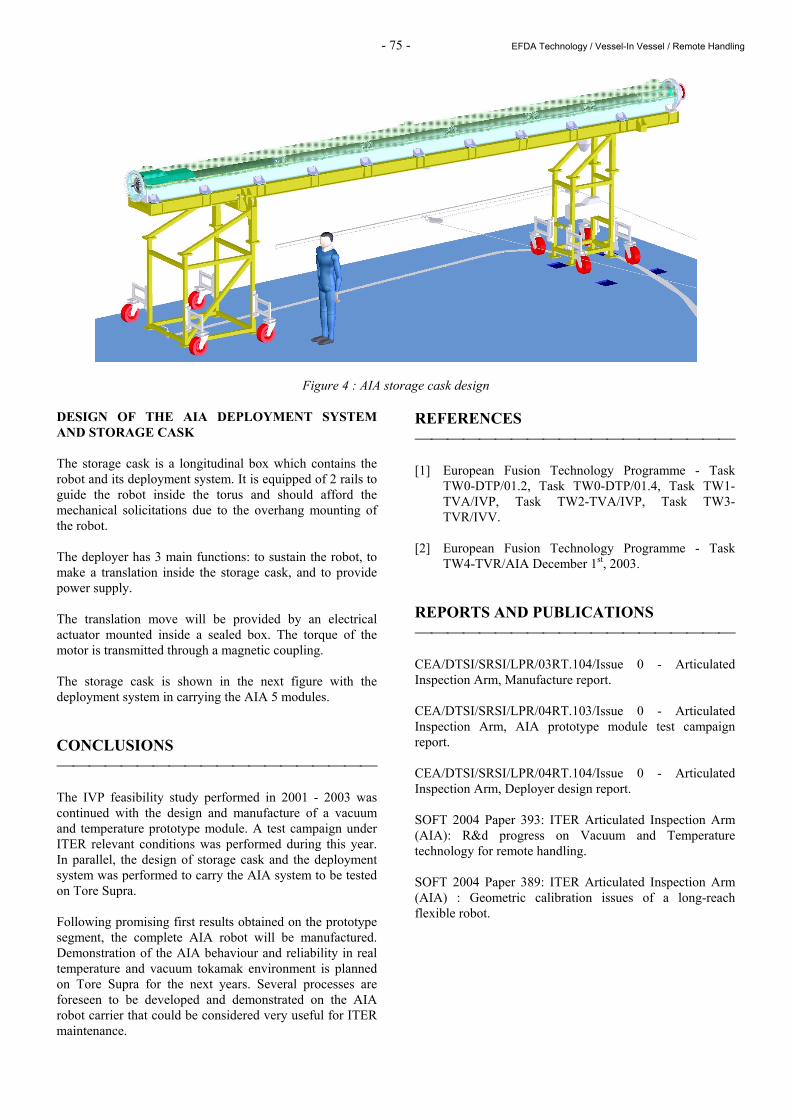
- 75 - EFDA Technology / Vessel-In Vessel / Remote Handling
Figure 4 : AIA storage cask design DESIGN OF THE AIA DEPLOYMENT SYSTEM AND STORAGE CASK The storage cask is a longitudinal box which contains the robot and its deployment system. It is equipped of 2 rails to guide the robot inside the torus and should afford the mechanical solicitations due to the overhang mounting of the robot. The deployer has 3 main functions: to sustain the robot, to make a translation inside the storage cask, and to provide power supply. The translation move will be provided by an electrical actuator mounted inside a sealed box. The torque of the motor is transmitted through a magnetic coupling. The storage cask is shown in the next figure with the deployment system in carrying the AIA 5 modules. CONCLUSIONS The IVP feasibility study performed in 2001 - 2003 was continued with the design and manufacture of a vacuum and temperature prototype module. A test campaign under ITER relevant conditions was performed during this year. In parallel, the design of storage cask and the deployment system was performed to carry the AIA system to be tested on Tore Supra. Following promising first results obtained on the prototype segment, the complete AIA robot will be manufactured. Demonstration of the AIA behaviour and reliability in real temperature and vacuum tokamak environment is planned on Tore Supra for the next years. Several processes are foreseen to be developed and demonstrated on the AIA robot carrier that could be considered very useful for ITER maintenance.
REFERENCES [1] European Fusion Technology Programme - Task
TW0-DTP/01.2, Task TW0-DTP/01.4, Task TW1-TVA/IVP, Task TW2-TVA/IVP, Task TW3-TVR/IVV.
[2] European Fusion Technology Programme - Task
TW4-TVR/AIA December 1st, 2003. REPORTS AND PUBLICATIONS CEA/DTSI/SRSI/LPR/03RT.104/Issue 0 - Articulated Inspection Arm, Manufacture report. CEA/DTSI/SRSI/LPR/04RT.103/Issue 0 - Articulated Inspection Arm, AIA prototype module test campaign report. CEA/DTSI/SRSI/LPR/04RT.104/Issue 0 - Articulated Inspection Arm, Deployer design report. SOFT 2004 Paper 393: ITER Articulated Inspection Arm (AIA): R&d progress on Vacuum and Temperature technology for remote handling. SOFT 2004 Paper 389: ITER Articulated Inspection Arm (AIA) : Geometric calibration issues of a long-reach flexible robot.

- 76 - EFDA Technology / Vessel-In Vessel / Remote Handling
TASK LEADER Jean-Pierre FRICONNEAU DRT/LIST/DTSI/SRSI CEA-Fontenay aux Roses Boîte Postale 6 F-92265 Fontenay aux Roses Cedex Tél. : 33 1 46 54 89 66 Fax : 33 1 46 54 75 80 E-mail : [email protected]
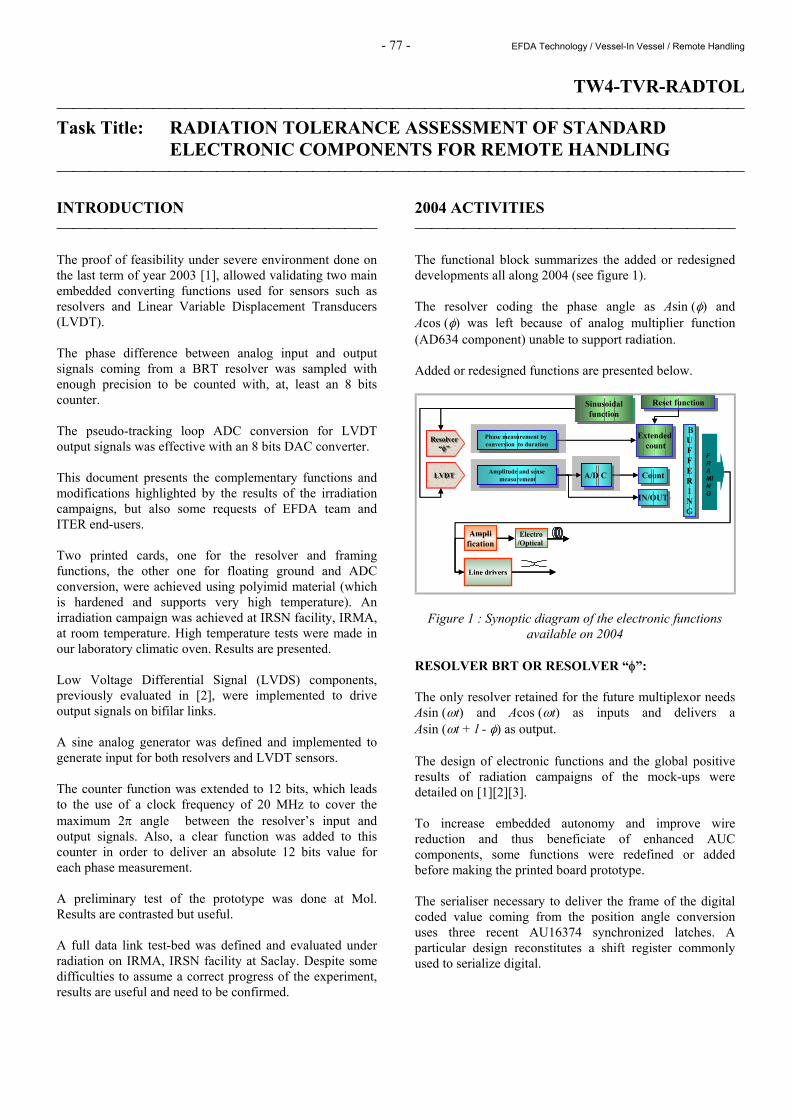
- 77 - EFDA Technology / Vessel-In Vessel / Remote Handling
TW4-TVR-RADTOL Task Title: RADIATION TOLERANCE ASSESSMENT OF STANDARD
ELECTRONIC COMPONENTS FOR REMOTE HANDLING INTRODUCTION The proof of feasibility under severe environment done on the last term of year 2003 [1], allowed validating two main embedded converting functions used for sensors such as resolvers and Linear Variable Displacement Transducers (LVDT). The phase difference between analog input and output signals coming from a BRT resolver was sampled with enough precision to be counted with, at, least an 8 bits counter. The pseudo-tracking loop ADC conversion for LVDT output signals was effective with an 8 bits DAC converter. This document presents the complementary functions and modifications highlighted by the results of the irradiation campaigns, but also some requests of EFDA team and ITER end-users. Two printed cards, one for the resolver and framing functions, the other one for floating ground and ADC conversion, were achieved using polyimid material (which is hardened and supports very high temperature). An irradiation campaign was achieved at IRSN facility, IRMA, at room temperature. High temperature tests were made in our laboratory climatic oven. Results are presented. Low Voltage Differential Signal (LVDS) components, previously evaluated in [2], were implemented to drive output signals on bifilar links. A sine analog generator was defined and implemented to generate input for both resolvers and LVDT sensors. The counter function was extended to 12 bits, which leads to the use of a clock frequency of 20 MHz to cover the maximum 2π angle between the resolver’s input and output signals. Also, a clear function was added to this counter in order to deliver an absolute 12 bits value for each phase measurement. A preliminary test of the prototype was done at Mol. Results are contrasted but useful. A full data link test-bed was defined and evaluated under radiation on IRMA, IRSN facility at Saclay. Despite some difficulties to assume a correct progress of the experiment, results are useful and need to be confirmed.
2004 ACTIVITIES The functional block summarizes the added or redesigned developments all along 2004 (see figure 1). The resolver coding the phase angle as Asin (φ) and Acos (φ) was left because of analog multiplier function (AD634 component) unable to support radiation. Added or redesigned functions are presented below.
IN/OUTIN/OUT
BUFFERING
BUFFERING
FRAMING
LVDTLVDT
Resolver“φ”
Resolver“φ”
Amplitude and sensemeasurement
Amplitude and sensemeasurement A/D C A/D C CountCount
Electro/Optical
Amplification
Line drivers
Sinusoidalfunction
Sinusoidalfunction
Phase measurement by conversion to duration
Phase measurement by conversion to duration
Extendedcount
Extendedcount
Reset functionReset function
IN/OUTIN/OUT
BUFFERING
BUFFERING
FRAMING
LVDTLVDTLVDTLVDT
Resolver“φ”
Resolver“φ”
Resolver“φ”
Resolver“φ”
Amplitude and sensemeasurement
Amplitude and sensemeasurement A/D C A/D C CountCount
Electro/Optical
Amplification
Line drivers
Sinusoidalfunction
Sinusoidalfunction
Phase measurement by conversion to duration
Phase measurement by conversion to duration
Extendedcount
Extendedcount
Reset functionReset function
Figure 1 : Synoptic diagram of the electronic functions available on 2004
RESOLVER BRT OR RESOLVER “φ”: The only resolver retained for the future multiplexor needs Asin (ωt) and Acos (ωt) as inputs and delivers a Asin (ωt + l - φ) as output. The design of electronic functions and the global positive results of radiation campaigns of the mock-ups were detailed on [1][2][3]. To increase embedded autonomy and improve wire reduction and thus beneficiate of enhanced AUC components, some functions were redefined or added before making the printed board prototype. The serialiser necessary to deliver the frame of the digital coded value coming from the position angle conversion uses three recent AU16374 synchronized latches. A particular design reconstitutes a shift register commonly used to serialize digital.
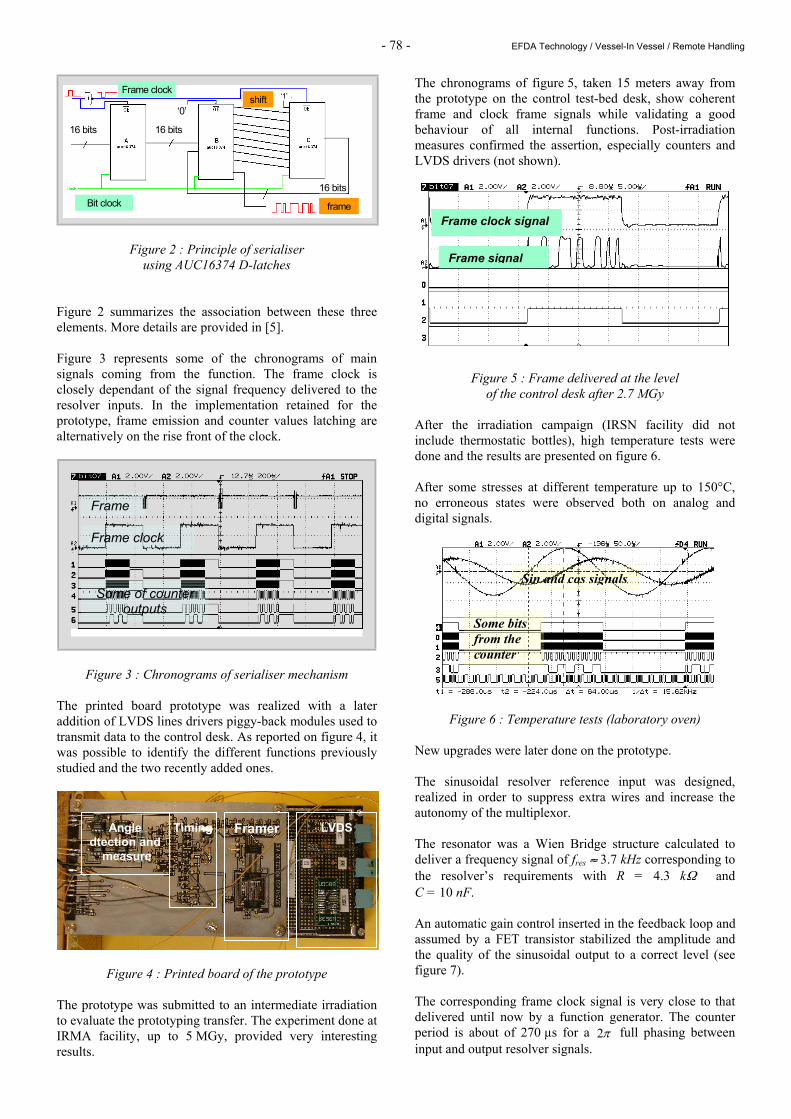
- 78 - EFDA Technology / Vessel-In Vessel / Remote Handling
shift
frame
16 bits 16 bits
Bit clock
Frame clock
‘0’
16 bits
‘1’shift
frame
16 bits 16 bits
Bit clock
Frame clock
‘0’
16 bits
‘1’
Figure 2 : Principle of serialiser using AUC16374 D-latches
Figure 2 summarizes the association between these three elements. More details are provided in [5]. Figure 3 represents some of the chronograms of main signals coming from the function. The frame clock is closely dependant of the signal frequency delivered to the resolver inputs. In the implementation retained for the prototype, frame emission and counter values latching are alternatively on the rise front of the clock.
Figure 3 : Chronograms of serialiser mechanism The printed board prototype was realized with a later addition of LVDS lines drivers piggy-back modules used to transmit data to the control desk. As reported on figure 4, it was possible to identify the different functions previously studied and the two recently added ones.
Figure 4 : Printed board of the prototype The prototype was submitted to an intermediate irradiation to evaluate the prototyping transfer. The experiment done at IRMA facility, up to 5 MGy, provided very interesting results.
The chronograms of figure 5, taken 15 meters away from the prototype on the control test-bed desk, show coherent frame and clock frame signals while validating a good behaviour of all internal functions. Post-irradiation measures confirmed the assertion, especially counters and LVDS drivers (not shown).
Figure 5 : Frame delivered at the level of the control desk after 2.7 MGy
After the irradiation campaign (IRSN facility did not include thermostatic bottles), high temperature tests were done and the results are presented on figure 6. After some stresses at different temperature up to 150°C, no erroneous states were observed both on analog and digital signals.
Figure 6 : Temperature tests (laboratory oven) New upgrades were later done on the prototype. The sinusoidal resolver reference input was designed, realized in order to suppress extra wires and increase the autonomy of the multiplexor. The resonator was a Wien Bridge structure calculated to deliver a frequency signal of fres ≈ 3.7 kHz corresponding to the resolver’s requirements with R = 4.3 kΩ and C = 10 nF. An automatic gain control inserted in the feedback loop and assumed by a FET transistor stabilized the amplitude and the quality of the sinusoidal output to a correct level (see figure 7). The corresponding frame clock signal is very close to that delivered until now by a function generator. The counter period is about of 270 µs for a π2 full phasing between input and output resolver signals.
Frame
Frame clock
Some of counter outputs
Frame clock signal
Frame signal
Angle dtection and
measure
Timing Framer LVDS
Sin and cos signals
Some bits from the counter
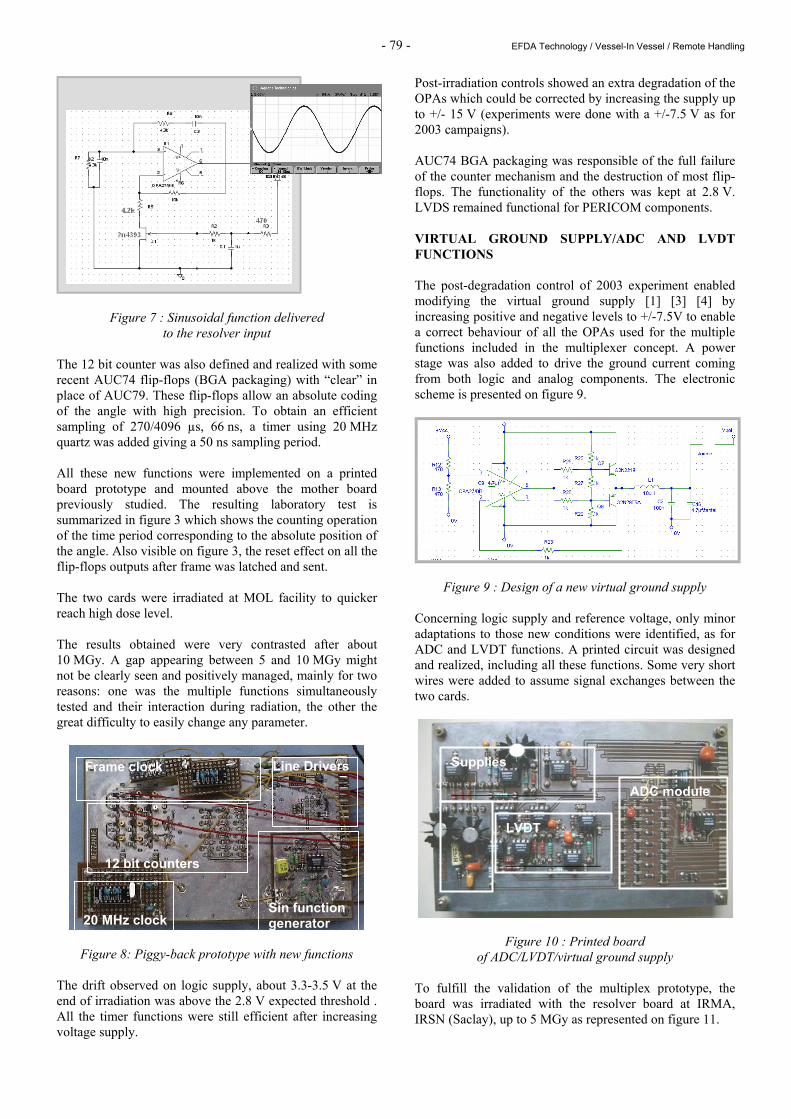
- 79 - EFDA Technology / Vessel-In Vessel / Remote Handling
Figure 7 : Sinusoidal function delivered to the resolver input
The 12 bit counter was also defined and realized with some recent AUC74 flip-flops (BGA packaging) with “clear” in place of AUC79. These flip-flops allow an absolute coding of the angle with high precision. To obtain an efficient sampling of 270/4096 µs, 66 ns, a timer using 20 MHz quartz was added giving a 50 ns sampling period. All these new functions were implemented on a printed board prototype and mounted above the mother board previously studied. The resulting laboratory test is summarized in figure 3 which shows the counting operation of the time period corresponding to the absolute position of the angle. Also visible on figure 3, the reset effect on all the flip-flops outputs after frame was latched and sent. The two cards were irradiated at MOL facility to quicker reach high dose level. The results obtained were very contrasted after about 10 MGy. A gap appearing between 5 and 10 MGy might not be clearly seen and positively managed, mainly for two reasons: one was the multiple functions simultaneously tested and their interaction during radiation, the other the great difficulty to easily change any parameter.
Figure 8: Piggy-back prototype with new functions The drift observed on logic supply, about 3.3-3.5 V at the end of irradiation was above the 2.8 V expected threshold . All the timer functions were still efficient after increasing voltage supply.
Post-irradiation controls showed an extra degradation of the OPAs which could be corrected by increasing the supply up to +/- 15 V (experiments were done with a +/-7.5 V as for 2003 campaigns). AUC74 BGA packaging was responsible of the full failure of the counter mechanism and the destruction of most flip-flops. The functionality of the others was kept at 2.8 V. LVDS remained functional for PERICOM components. VIRTUAL GROUND SUPPLY/ADC AND LVDT FUNCTIONS The post-degradation control of 2003 experiment enabled modifying the virtual ground supply [1] [3] [4] by increasing positive and negative levels to +/-7.5V to enable a correct behaviour of all the OPAs used for the multiple functions included in the multiplexer concept. A power stage was also added to drive the ground current coming from both logic and analog components. The electronic scheme is presented on figure 9.
Figure 9 : Design of a new virtual ground supply Concerning logic supply and reference voltage, only minor adaptations to those new conditions were identified, as for ADC and LVDT functions. A printed circuit was designed and realized, including all these functions. Some very short wires were added to assume signal exchanges between the two cards.
Figure 10 : Printed board of ADC/LVDT/virtual ground supply
To fulfill the validation of the multiplex prototype, the board was irradiated with the resolver board at IRMA, IRSN (Saclay), up to 5 MGy as represented on figure 11.
20 MHz clock
12 bit counters
Frame clock Line Drivers
Sin function generator
ADC module
Supplies
LVDT
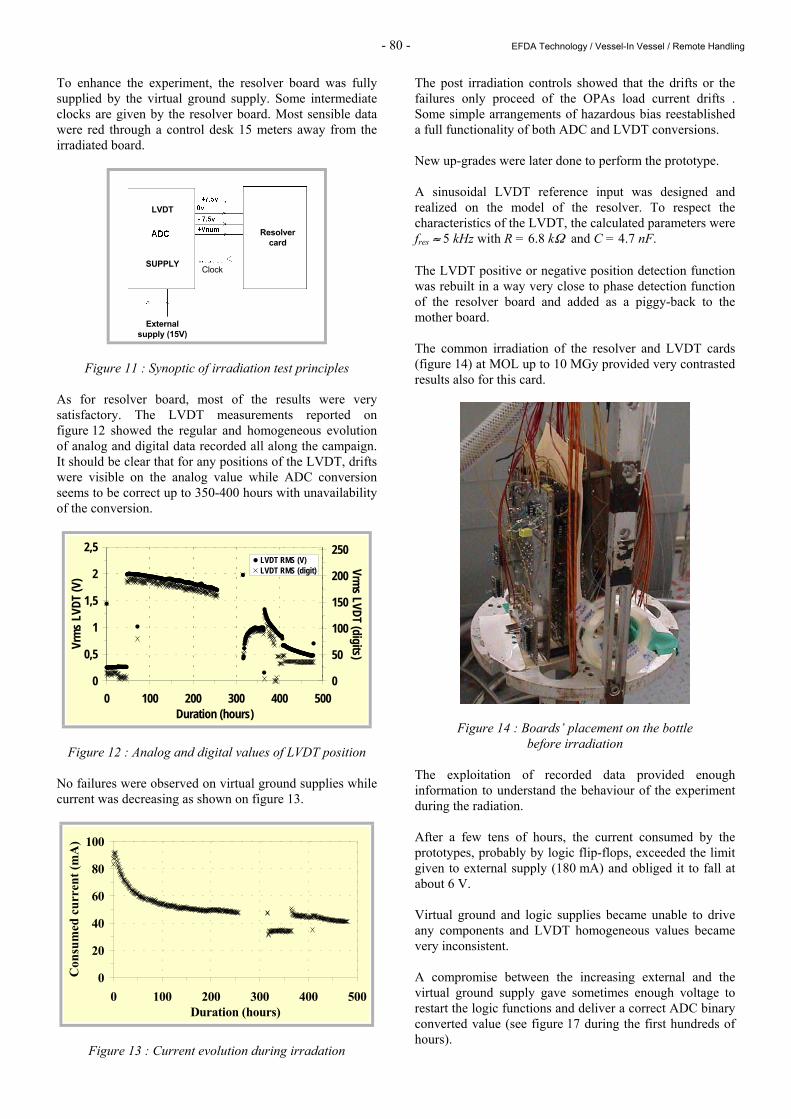
- 80 - EFDA Technology / Vessel-In Vessel / Remote Handling
To enhance the experiment, the resolver board was fully supplied by the virtual ground supply. Some intermediate clocks are given by the resolver board. Most sensible data were red through a control desk 15 meters away from the irradiated board.
SUPPLY
LVDT
Resolver card
External supply (15V)
ClockSUPPLY
LVDT
Resolver card
External supply (15V)
Clock
Figure 11 : Synoptic of irradiation test principles As for resolver board, most of the results were very satisfactory. The LVDT measurements reported on figure 12 showed the regular and homogeneous evolution of analog and digital data recorded all along the campaign. It should be clear that for any positions of the LVDT, drifts were visible on the analog value while ADC conversion seems to be correct up to 350-400 hours with unavailability of the conversion.
0
0,5
1
1,5
2
2,5
0 100 200 300 400 500Duration (hours)
Vrm
s LVD
T (V
)
0
50
100
150
200
250
Vrms LVDT (digits)
LVDT RMS (V)LVDT RMS (digit)
Figure 12 : Analog and digital values of LVDT position No failures were observed on virtual ground supplies while current was decreasing as shown on figure 13.
0
20
40
60
80
100
0 100 200 300 400 500Duration (hours)
Con
sum
ed c
urre
nt (m
A)
Figure 13 : Current evolution during irradation
The post irradiation controls showed that the drifts or the failures only proceed of the OPAs load current drifts . Some simple arrangements of hazardous bias reestablished a full functionality of both ADC and LVDT conversions. New up-grades were later done to perform the prototype. A sinusoidal LVDT reference input was designed and realized on the model of the resolver. To respect the characteristics of the LVDT, the calculated parameters were fres ≈ 5 kHz with R = 6.8 kΩ and C = 4.7 nF. The LVDT positive or negative position detection function was rebuilt in a way very close to phase detection function of the resolver board and added as a piggy-back to the mother board. The common irradiation of the resolver and LVDT cards (figure 14) at MOL up to 10 MGy provided very contrasted results also for this card.
Figure 14 : Boards’ placement on the bottle before irradiation
The exploitation of recorded data provided enough information to understand the behaviour of the experiment during the radiation. After a few tens of hours, the current consumed by the prototypes, probably by logic flip-flops, exceeded the limit given to external supply (180 mA) and obliged it to fall at about 6 V. Virtual ground and logic supplies became unable to drive any components and LVDT homogeneous values became very inconsistent. A compromise between the increasing external and the virtual ground supply gave sometimes enough voltage to restart the logic functions and deliver a correct ADC binary converted value (see figure 17 during the first hundreds of hours).
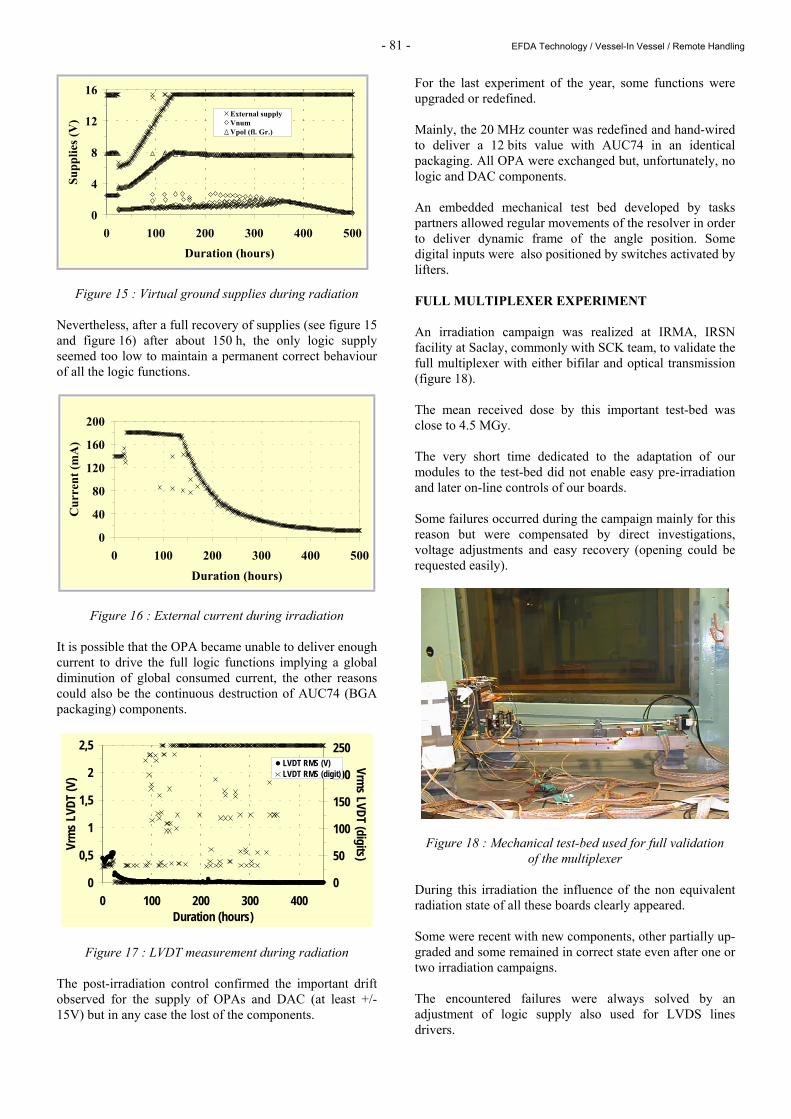
- 81 - EFDA Technology / Vessel-In Vessel / Remote Handling
0
4
8
12
16
0 100 200 300 400 500Duration (hours)
Supp
lies (
V) External supply
VnumVpol (fl. Gr.)
Figure 15 : Virtual ground supplies during radiation Nevertheless, after a full recovery of supplies (see figure 15 and figure 16) after about 150 h, the only logic supply seemed too low to maintain a permanent correct behaviour of all the logic functions.
0
40
80
120
160
200
0 100 200 300 400 500Duration (hours)
Cur
rent
(mA
)
Figure 16 : External current during irradiation It is possible that the OPA became unable to deliver enough current to drive the full logic functions implying a global diminution of global consumed current, the other reasons could also be the continuous destruction of AUC74 (BGA packaging) components.
0
0,5
1
1,5
2
2,5
0 100 200 300 400Duration (hours)
Vrm
s LVD
T (V
)
0
50
100
150
200
250
Vrms LVDT (digits)
LVDT RMS (V)LVDT RMS (digit)
Figure 17 : LVDT measurement during radiation The post-irradiation control confirmed the important drift observed for the supply of OPAs and DAC (at least +/-15V) but in any case the lost of the components.
For the last experiment of the year, some functions were upgraded or redefined. Mainly, the 20 MHz counter was redefined and hand-wired to deliver a 12 bits value with AUC74 in an identical packaging. All OPA were exchanged but, unfortunately, no logic and DAC components. An embedded mechanical test bed developed by tasks partners allowed regular movements of the resolver in order to deliver dynamic frame of the angle position. Some digital inputs were also positioned by switches activated by lifters. FULL MULTIPLEXER EXPERIMENT An irradiation campaign was realized at IRMA, IRSN facility at Saclay, commonly with SCK team, to validate the full multiplexer with either bifilar and optical transmission (figure 18). The mean received dose by this important test-bed was close to 4.5 MGy. The very short time dedicated to the adaptation of our modules to the test-bed did not enable easy pre-irradiation and later on-line controls of our boards. Some failures occurred during the campaign mainly for this reason but were compensated by direct investigations, voltage adjustments and easy recovery (opening could be requested easily).
Figure 18 : Mechanical test-bed used for full validation of the multiplexer
During this irradiation the influence of the non equivalent radiation state of all these boards clearly appeared. Some were recent with new components, other partially up-graded and some remained in correct state even after one or two irradiation campaigns. The encountered failures were always solved by an adjustment of logic supply also used for LVDS lines drivers.
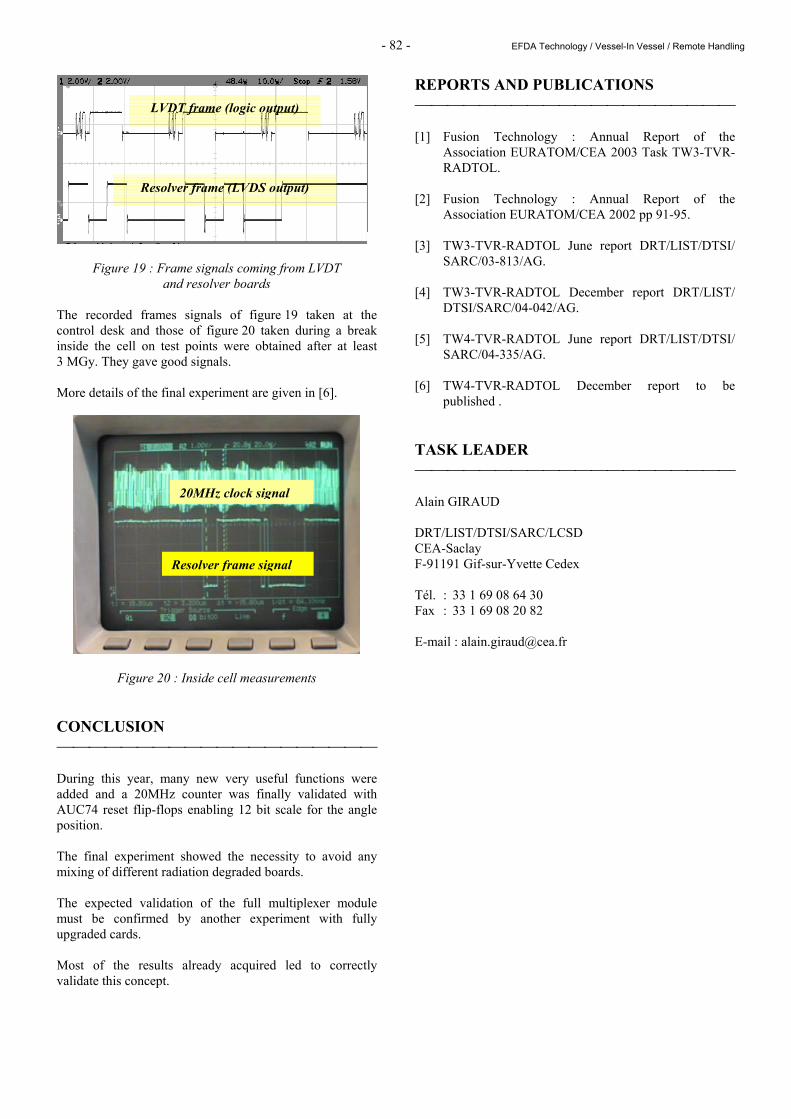
- 82 - EFDA Technology / Vessel-In Vessel / Remote Handling
Figure 19 : Frame signals coming from LVDT and resolver boards
The recorded frames signals of figure 19 taken at the control desk and those of figure 20 taken during a break inside the cell on test points were obtained after at least 3 MGy. They gave good signals. More details of the final experiment are given in [6].
Figure 20 : Inside cell measurements CONCLUSION During this year, many new very useful functions were added and a 20MHz counter was finally validated with AUC74 reset flip-flops enabling 12 bit scale for the angle position. The final experiment showed the necessity to avoid any mixing of different radiation degraded boards. The expected validation of the full multiplexer module must be confirmed by another experiment with fully upgraded cards. Most of the results already acquired led to correctly validate this concept.
REPORTS AND PUBLICATIONS [1] Fusion Technology : Annual Report of the
Association EURATOM/CEA 2003 Task TW3-TVR-RADTOL.
[2] Fusion Technology : Annual Report of the
Association EURATOM/CEA 2002 pp 91-95. [3] TW3-TVR-RADTOL June report DRT/LIST/DTSI/
SARC/03-813/AG. [4] TW3-TVR-RADTOL December report DRT/LIST/
DTSI/SARC/04-042/AG. [5] TW4-TVR-RADTOL June report DRT/LIST/DTSI/
SARC/04-335/AG. [6] TW4-TVR-RADTOL December report to be
published . TASK LEADER Alain GIRAUD DRT/LIST/DTSI/SARC/LCSD CEA-Saclay F-91191 Gif-sur-Yvette Cedex Tél. : 33 1 69 08 64 30 Fax : 33 1 69 08 20 82 E-mail : [email protected]
LVDT frame (logic output)
Resolver frame (LVDS output)
20MHz clock signal
Resolver frame signal
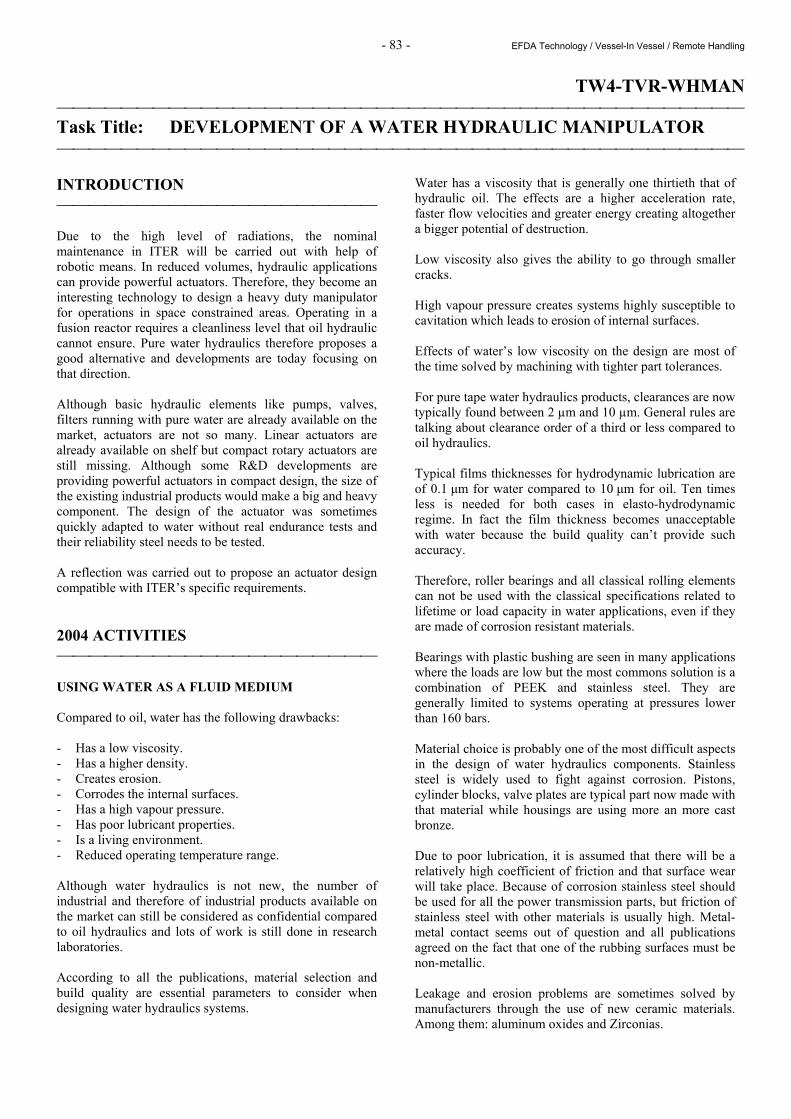
- 83 - EFDA Technology / Vessel-In Vessel / Remote Handling
TW4-TVR-WHMAN Task Title: DEVELOPMENT OF A WATER HYDRAULIC MANIPULATOR INTRODUCTION Due to the high level of radiations, the nominal maintenance in ITER will be carried out with help of robotic means. In reduced volumes, hydraulic applications can provide powerful actuators. Therefore, they become an interesting technology to design a heavy duty manipulator for operations in space constrained areas. Operating in a fusion reactor requires a cleanliness level that oil hydraulic cannot ensure. Pure water hydraulics therefore proposes a good alternative and developments are today focusing on that direction. Although basic hydraulic elements like pumps, valves, filters running with pure water are already available on the market, actuators are not so many. Linear actuators are already available on shelf but compact rotary actuators are still missing. Although some R&D developments are providing powerful actuators in compact design, the size of the existing industrial products would make a big and heavy component. The design of the actuator was sometimes quickly adapted to water without real endurance tests and their reliability steel needs to be tested. A reflection was carried out to propose an actuator design compatible with ITER’s specific requirements. 2004 ACTIVITIES USING WATER AS A FLUID MEDIUM Compared to oil, water has the following drawbacks: - Has a low viscosity. - Has a higher density. - Creates erosion. - Corrodes the internal surfaces. - Has a high vapour pressure. - Has poor lubricant properties. - Is a living environment. - Reduced operating temperature range. Although water hydraulics is not new, the number of industrial and therefore of industrial products available on the market can still be considered as confidential compared to oil hydraulics and lots of work is still done in research laboratories. According to all the publications, material selection and build quality are essential parameters to consider when designing water hydraulics systems.
Water has a viscosity that is generally one thirtieth that of hydraulic oil. The effects are a higher acceleration rate, faster flow velocities and greater energy creating altogether a bigger potential of destruction. Low viscosity also gives the ability to go through smaller cracks. High vapour pressure creates systems highly susceptible to cavitation which leads to erosion of internal surfaces. Effects of water’s low viscosity on the design are most of the time solved by machining with tighter part tolerances. For pure tape water hydraulics products, clearances are now typically found between 2 µm and 10 µm. General rules are talking about clearance order of a third or less compared to oil hydraulics. Typical films thicknesses for hydrodynamic lubrication are of 0.1 µm for water compared to 10 µm for oil. Ten times less is needed for both cases in elasto-hydrodynamic regime. In fact the film thickness becomes unacceptable with water because the build quality can’t provide such accuracy. Therefore, roller bearings and all classical rolling elements can not be used with the classical specifications related to lifetime or load capacity in water applications, even if they are made of corrosion resistant materials. Bearings with plastic bushing are seen in many applications where the loads are low but the most commons solution is a combination of PEEK and stainless steel. They are generally limited to systems operating at pressures lower than 160 bars. Material choice is probably one of the most difficult aspects in the design of water hydraulics components. Stainless steel is widely used to fight against corrosion. Pistons, cylinder blocks, valve plates are typical part now made with that material while housings are using more an more cast bronze. Due to poor lubrication, it is assumed that there will be a relatively high coefficient of friction and that surface wear will take place. Because of corrosion stainless steel should be used for all the power transmission parts, but friction of stainless steel with other materials is usually high. Metal-metal contact seems out of question and all publications agreed on the fact that one of the rubbing surfaces must be non-metallic. Leakage and erosion problems are sometimes solved by manufacturers through the use of new ceramic materials. Among them: aluminum oxides and Zirconias.
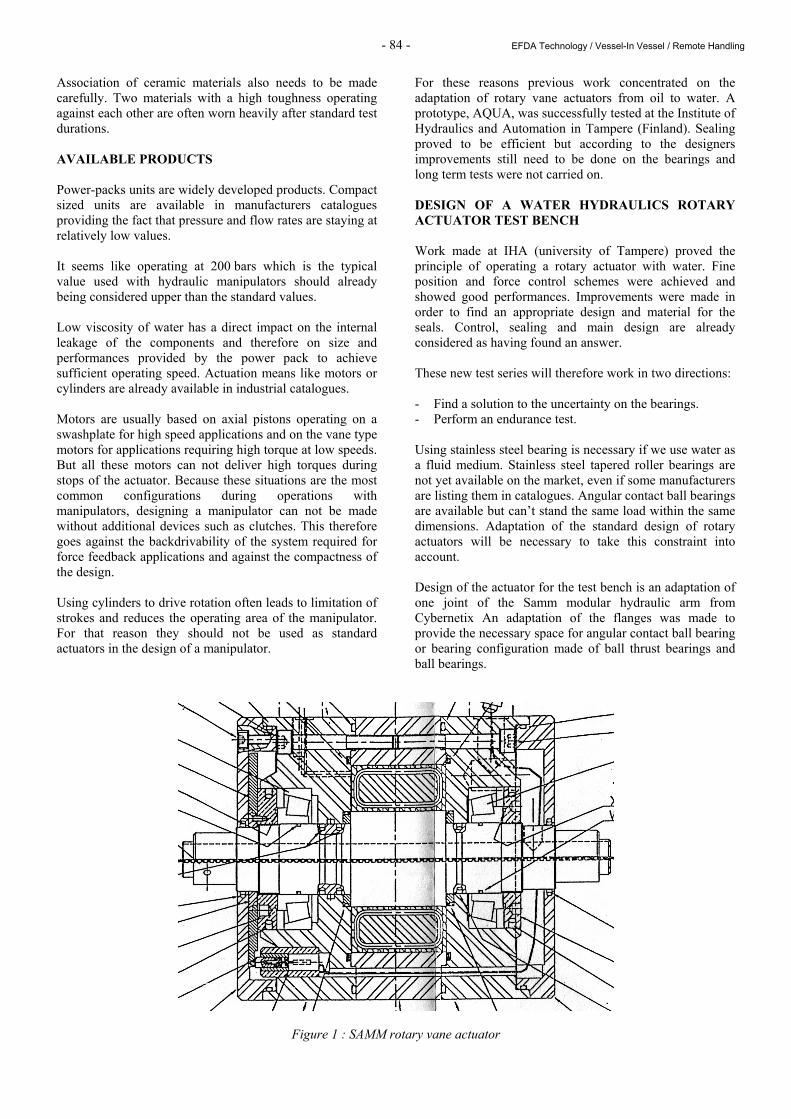
- 84 - EFDA Technology / Vessel-In Vessel / Remote Handling
Association of ceramic materials also needs to be made carefully. Two materials with a high toughness operating against each other are often worn heavily after standard test durations. AVAILABLE PRODUCTS Power-packs units are widely developed products. Compact sized units are available in manufacturers catalogues providing the fact that pressure and flow rates are staying at relatively low values. It seems like operating at 200 bars which is the typical value used with hydraulic manipulators should already being considered upper than the standard values. Low viscosity of water has a direct impact on the internal leakage of the components and therefore on size and performances provided by the power pack to achieve sufficient operating speed. Actuation means like motors or cylinders are already available in industrial catalogues. Motors are usually based on axial pistons operating on a swashplate for high speed applications and on the vane type motors for applications requiring high torque at low speeds. But all these motors can not deliver high torques during stops of the actuator. Because these situations are the most common configurations during operations with manipulators, designing a manipulator can not be made without additional devices such as clutches. This therefore goes against the backdrivability of the system required for force feedback applications and against the compactness of the design. Using cylinders to drive rotation often leads to limitation of strokes and reduces the operating area of the manipulator. For that reason they should not be used as standard actuators in the design of a manipulator.
For these reasons previous work concentrated on the adaptation of rotary vane actuators from oil to water. A prototype, AQUA, was successfully tested at the Institute of Hydraulics and Automation in Tampere (Finland). Sealing proved to be efficient but according to the designers improvements still need to be done on the bearings and long term tests were not carried on. DESIGN OF A WATER HYDRAULICS ROTARY ACTUATOR TEST BENCH Work made at IHA (university of Tampere) proved the principle of operating a rotary actuator with water. Fine position and force control schemes were achieved and showed good performances. Improvements were made in order to find an appropriate design and material for the seals. Control, sealing and main design are already considered as having found an answer. These new test series will therefore work in two directions: - Find a solution to the uncertainty on the bearings. - Perform an endurance test. Using stainless steel bearing is necessary if we use water as a fluid medium. Stainless steel tapered roller bearings are not yet available on the market, even if some manufacturers are listing them in catalogues. Angular contact ball bearings are available but can’t stand the same load within the same dimensions. Adaptation of the standard design of rotary actuators will be necessary to take this constraint into account. Design of the actuator for the test bench is an adaptation of one joint of the Samm modular hydraulic arm from Cybernetix An adaptation of the flanges was made to provide the necessary space for angular contact ball bearing or bearing configuration made of ball thrust bearings and ball bearings.
Figure 1 : SAMM rotary vane actuator

- 85 - EFDA Technology / Vessel-In Vessel / Remote Handling
Figure 2 : Test bench The most interesting bearing technology suitable for water is probably hybrid ball bearings. In those bearings, balls are usually made of Silicon Nitride and rings of martensitic stainless steel. Friction between ceramic and stainless steel is lower than stainless steel against itself thus limiting heating of the bearing. Hardness is also very different between balls and raceways and that gives a significant advantage to this design. The bearing manufacturer ISO proposes both stainless steel and hybrid bearings angular contact ball bearings suitable for our applications. Test series will be performed with both components to find the best product. The test bench is composed of the elements of the figure 2. Position measurements will be made with help of a resolver. Water will be provided to the actuator through a Moog D633 Direct Drive Valve. This product is not directly designed for water but is used in glycol water applications. Its performances should be enough for long term tests. Two pressure sensors will measure the pressure in the two chambers of the actuator. Load adjustment will be made at the end of the arm. CONCLUSIONS After an analysis of the consequences of using water as a fluid medium a brief overview of technological solutions found by industrial companies or research labs to address the problem were listed. The industrial products offer is today centered on components like: pumps, filters, on-off valves.
In fact, components that one can consider being provided with relatively simple technological functions. In terms of advanced components like motors and proportional valves or servo-valves, designs or performances limitations are precluding their use in for robotic manipulators. Starting from the design of one oil hydraulic actuator this task designed a mock-up to study both the influence of different kind of bearings and long term issues during endurance tests. Commissioning of the components of the mock –up is now finished and the test phase will start soon. REPORTS AND PUBLICATIONS DTSI/SCRI/LPR/05RT006 TW4-TVR-WHMAN - Water hydraulic manipulator - Definition of a single axis water hydraulic mock-up. TASK LEADER Jean-Pierre FRICONNEAU DTSI/SCRI/LPR CEA-Fontenay aux Roses Boîte Postale 6 F-92265 Fontenay aux Roses Cedex Tél. : 33 1 46 54 89 66 Fax : 33 1 46 54 75 80 E-mail : [email protected]

- 86 - EFDA Technology / Vessel-In Vessel / Remote Handling
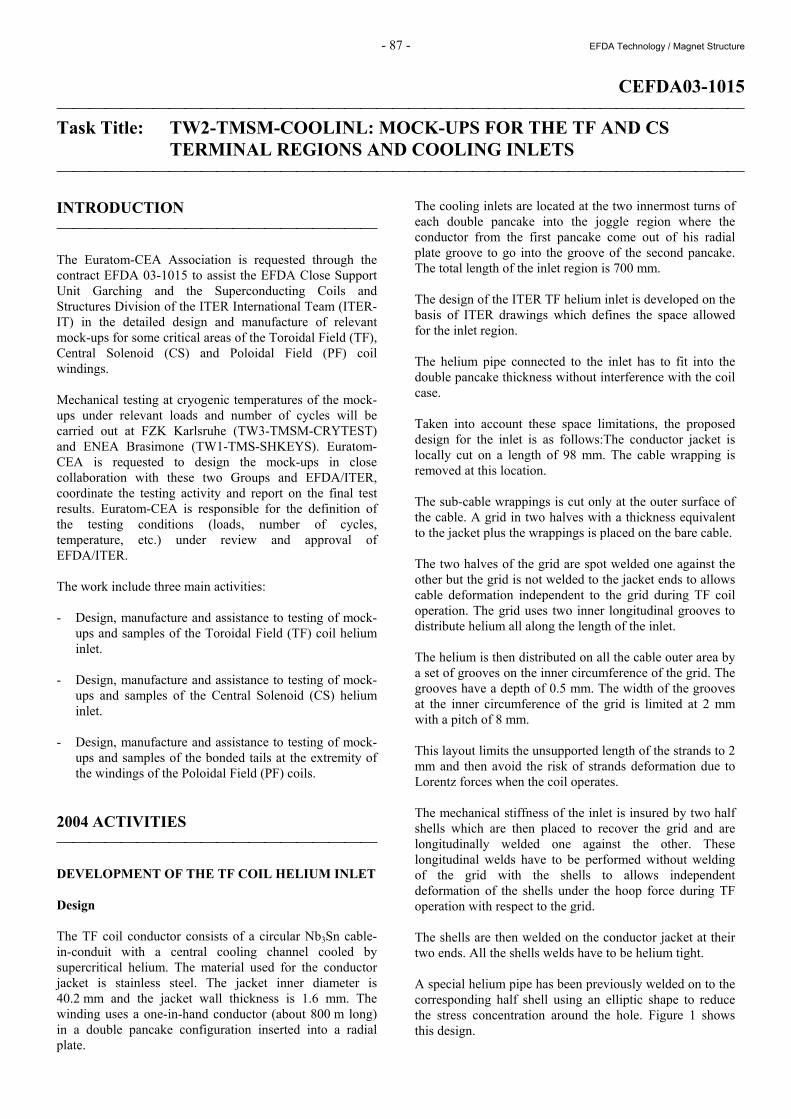
- 87 - EFDA Technology / Magnet Structure
CEFDA03-1015 Task Title: TW2-TMSM-COOLINL: MOCK-UPS FOR THE TF AND CS
TERMINAL REGIONS AND COOLING INLETS INTRODUCTION The Euratom-CEA Association is requested through the contract EFDA 03-1015 to assist the EFDA Close Support Unit Garching and the Superconducting Coils and Structures Division of the ITER International Team (ITER-IT) in the detailed design and manufacture of relevant mock-ups for some critical areas of the Toroidal Field (TF), Central Solenoid (CS) and Poloidal Field (PF) coil windings. Mechanical testing at cryogenic temperatures of the mock-ups under relevant loads and number of cycles will be carried out at FZK Karlsruhe (TW3-TMSM-CRYTEST) and ENEA Brasimone (TW1-TMS-SHKEYS). Euratom-CEA is requested to design the mock-ups in close collaboration with these two Groups and EFDA/ITER, coordinate the testing activity and report on the final test results. Euratom-CEA is responsible for the definition of the testing conditions (loads, number of cycles, temperature, etc.) under review and approval of EFDA/ITER. The work include three main activities: - Design, manufacture and assistance to testing of mock-
ups and samples of the Toroidal Field (TF) coil helium inlet.
- Design, manufacture and assistance to testing of mock-
ups and samples of the Central Solenoid (CS) helium inlet.
- Design, manufacture and assistance to testing of mock-
ups and samples of the bonded tails at the extremity of the windings of the Poloidal Field (PF) coils.
2004 ACTIVITIES DEVELOPMENT OF THE TF COIL HELIUM INLET Design The TF coil conductor consists of a circular Nb3Sn cable-in-conduit with a central cooling channel cooled by supercritical helium. The material used for the conductor jacket is stainless steel. The jacket inner diameter is 40.2 mm and the jacket wall thickness is 1.6 mm. The winding uses a one-in-hand conductor (about 800 m long) in a double pancake configuration inserted into a radial plate.
The cooling inlets are located at the two innermost turns of each double pancake into the joggle region where the conductor from the first pancake come out of his radial plate groove to go into the groove of the second pancake. The total length of the inlet region is 700 mm. The design of the ITER TF helium inlet is developed on the basis of ITER drawings which defines the space allowed for the inlet region. The helium pipe connected to the inlet has to fit into the double pancake thickness without interference with the coil case. Taken into account these space limitations, the proposed design for the inlet is as follows:The conductor jacket is locally cut on a length of 98 mm. The cable wrapping is removed at this location. The sub-cable wrappings is cut only at the outer surface of the cable. A grid in two halves with a thickness equivalent to the jacket plus the wrappings is placed on the bare cable. The two halves of the grid are spot welded one against the other but the grid is not welded to the jacket ends to allows cable deformation independent to the grid during TF coil operation. The grid uses two inner longitudinal grooves to distribute helium all along the length of the inlet. The helium is then distributed on all the cable outer area by a set of grooves on the inner circumference of the grid. The grooves have a depth of 0.5 mm. The width of the grooves at the inner circumference of the grid is limited at 2 mm with a pitch of 8 mm. This layout limits the unsupported length of the strands to 2 mm and then avoid the risk of strands deformation due to Lorentz forces when the coil operates. The mechanical stiffness of the inlet is insured by two half shells which are then placed to recover the grid and are longitudinally welded one against the other. These longitudinal welds have to be performed without welding of the grid with the shells to allows independent deformation of the shells under the hoop force during TF operation with respect to the grid. The shells are then welded on the conductor jacket at their two ends. All the shells welds have to be helium tight. A special helium pipe has been previously welded on to the corresponding half shell using an elliptic shape to reduce the stress concentration around the hole. Figure 1 shows this design.
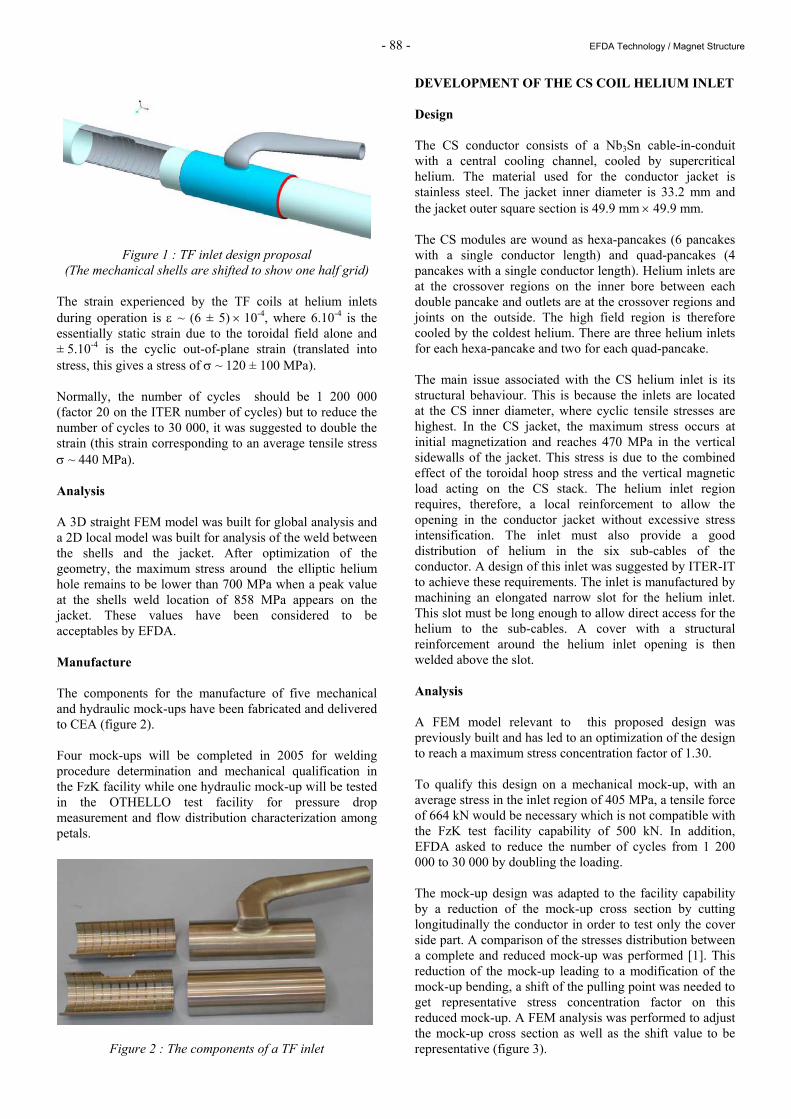
- 88 - EFDA Technology / Magnet Structure
Figure 1 : TF inlet design proposal
(The mechanical shells are shifted to show one half grid) The strain experienced by the TF coils at helium inlets during operation is ε ~ (6 ± 5) × 10-4, where 6.10-4 is the essentially static strain due to the toroidal field alone and ± 5.10-4 is the cyclic out-of-plane strain (translated into stress, this gives a stress of σ ~ 120 ± 100 MPa). Normally, the number of cycles should be 1 200 000 (factor 20 on the ITER number of cycles) but to reduce the number of cycles to 30 000, it was suggested to double the strain (this strain corresponding to an average tensile stress σ ~ 440 MPa). Analysis A 3D straight FEM model was built for global analysis and a 2D local model was built for analysis of the weld between the shells and the jacket. After optimization of the geometry, the maximum stress around the elliptic helium hole remains to be lower than 700 MPa when a peak value at the shells weld location of 858 MPa appears on the jacket. These values have been considered to be acceptables by EFDA. Manufacture The components for the manufacture of five mechanical and hydraulic mock-ups have been fabricated and delivered to CEA (figure 2). Four mock-ups will be completed in 2005 for welding procedure determination and mechanical qualification in the FzK facility while one hydraulic mock-up will be tested in the OTHELLO test facility for pressure drop measurement and flow distribution characterization among petals.
Figure 2 : The components of a TF inlet
DEVELOPMENT OF THE CS COIL HELIUM INLET Design The CS conductor consists of a Nb3Sn cable-in-conduit with a central cooling channel, cooled by supercritical helium. The material used for the conductor jacket is stainless steel. The jacket inner diameter is 33.2 mm and the jacket outer square section is 49.9 mm × 49.9 mm. The CS modules are wound as hexa-pancakes (6 pancakes with a single conductor length) and quad-pancakes (4 pancakes with a single conductor length). Helium inlets are at the crossover regions on the inner bore between each double pancake and outlets are at the crossover regions and joints on the outside. The high field region is therefore cooled by the coldest helium. There are three helium inlets for each hexa-pancake and two for each quad-pancake. The main issue associated with the CS helium inlet is its structural behaviour. This is because the inlets are located at the CS inner diameter, where cyclic tensile stresses are highest. In the CS jacket, the maximum stress occurs at initial magnetization and reaches 470 MPa in the vertical sidewalls of the jacket. This stress is due to the combined effect of the toroidal hoop stress and the vertical magnetic load acting on the CS stack. The helium inlet region requires, therefore, a local reinforcement to allow the opening in the conductor jacket without excessive stress intensification. The inlet must also provide a good distribution of helium in the six sub-cables of the conductor. A design of this inlet was suggested by ITER-IT to achieve these requirements. The inlet is manufactured by machining an elongated narrow slot for the helium inlet. This slot must be long enough to allow direct access for the helium to the sub-cables. A cover with a structural reinforcement around the helium inlet opening is then welded above the slot. Analysis A FEM model relevant to this proposed design was previously built and has led to an optimization of the design to reach a maximum stress concentration factor of 1.30. To qualify this design on a mechanical mock-up, with an average stress in the inlet region of 405 MPa, a tensile force of 664 kN would be necessary which is not compatible with the FzK test facility capability of 500 kN. In addition, EFDA asked to reduce the number of cycles from 1 200 000 to 30 000 by doubling the loading. The mock-up design was adapted to the facility capability by a reduction of the mock-up cross section by cutting longitudinally the conductor in order to test only the cover side part. A comparison of the stresses distribution between a complete and reduced mock-up was performed [1]. This reduction of the mock-up leading to a modification of the mock-up bending, a shift of the pulling point was needed to get representative stress concentration factor on this reduced mock-up. A FEM analysis was performed to adjust the mock-up cross section as well as the shift value to be representative (figure 3).
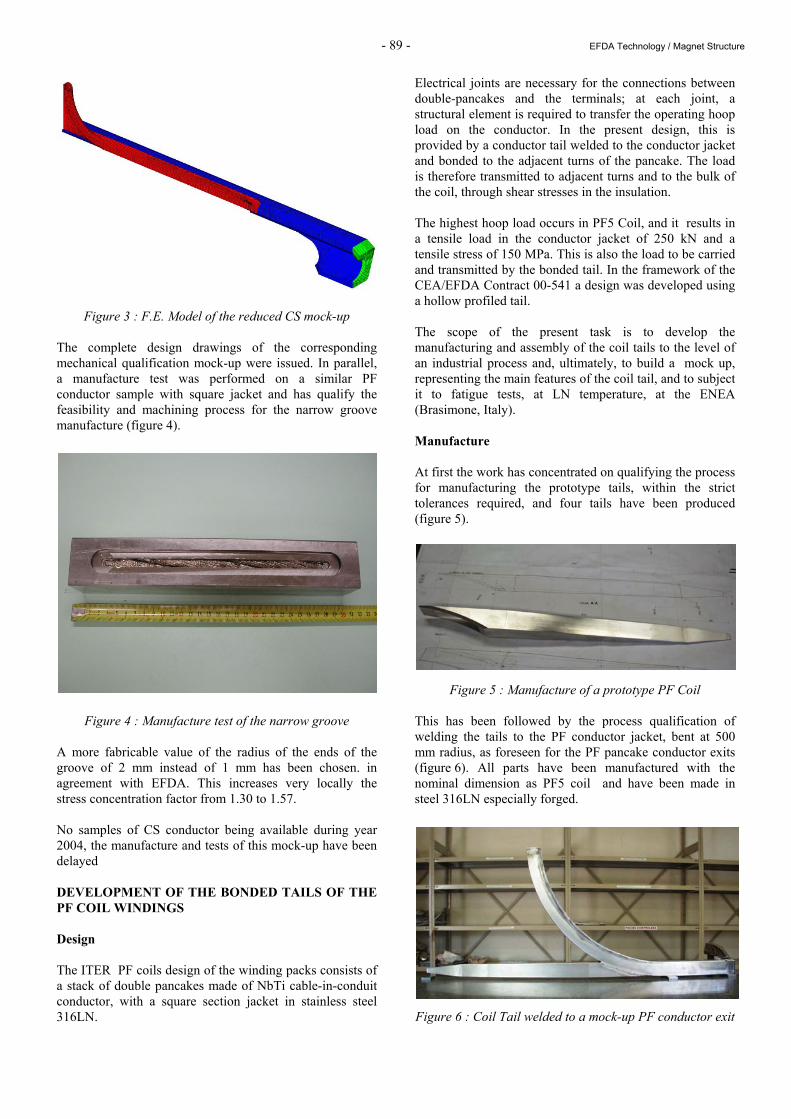
- 89 - EFDA Technology / Magnet Structure
Figure 3 : F.E. Model of the reduced CS mock-up The complete design drawings of the corresponding mechanical qualification mock-up were issued. In parallel, a manufacture test was performed on a similar PF conductor sample with square jacket and has qualify the feasibility and machining process for the narrow groove manufacture (figure 4).
Figure 4 : Manufacture test of the narrow groove A more fabricable value of the radius of the ends of the groove of 2 mm instead of 1 mm has been chosen. in agreement with EFDA. This increases very locally the stress concentration factor from 1.30 to 1.57. No samples of CS conductor being available during year 2004, the manufacture and tests of this mock-up have been delayed DEVELOPMENT OF THE BONDED TAILS OF THE PF COIL WINDINGS Design The ITER PF coils design of the winding packs consists of a stack of double pancakes made of NbTi cable-in-conduit conductor, with a square section jacket in stainless steel 316LN.
Electrical joints are necessary for the connections between double-pancakes and the terminals; at each joint, a structural element is required to transfer the operating hoop load on the conductor. In the present design, this is provided by a conductor tail welded to the conductor jacket and bonded to the adjacent turns of the pancake. The load is therefore transmitted to adjacent turns and to the bulk of the coil, through shear stresses in the insulation. The highest hoop load occurs in PF5 Coil, and it results in a tensile load in the conductor jacket of 250 kN and a tensile stress of 150 MPa. This is also the load to be carried and transmitted by the bonded tail. In the framework of the CEA/EFDA Contract 00-541 a design was developed using a hollow profiled tail. The scope of the present task is to develop the manufacturing and assembly of the coil tails to the level of an industrial process and, ultimately, to build a mock up, representing the main features of the coil tail, and to subject it to fatigue tests, at LN temperature, at the ENEA (Brasimone, Italy). Manufacture At first the work has concentrated on qualifying the process for manufacturing the prototype tails, within the strict tolerances required, and four tails have been produced (figure 5).
Figure 5 : Manufacture of a prototype PF Coil This has been followed by the process qualification of welding the tails to the PF conductor jacket, bent at 500 mm radius, as foreseen for the PF pancake conductor exits (figure 6). All parts have been manufactured with the nominal dimension as PF5 coil and have been made in steel 316LN especially forged.
Figure 6 : Coil Tail welded to a mock-up PF conductor exit
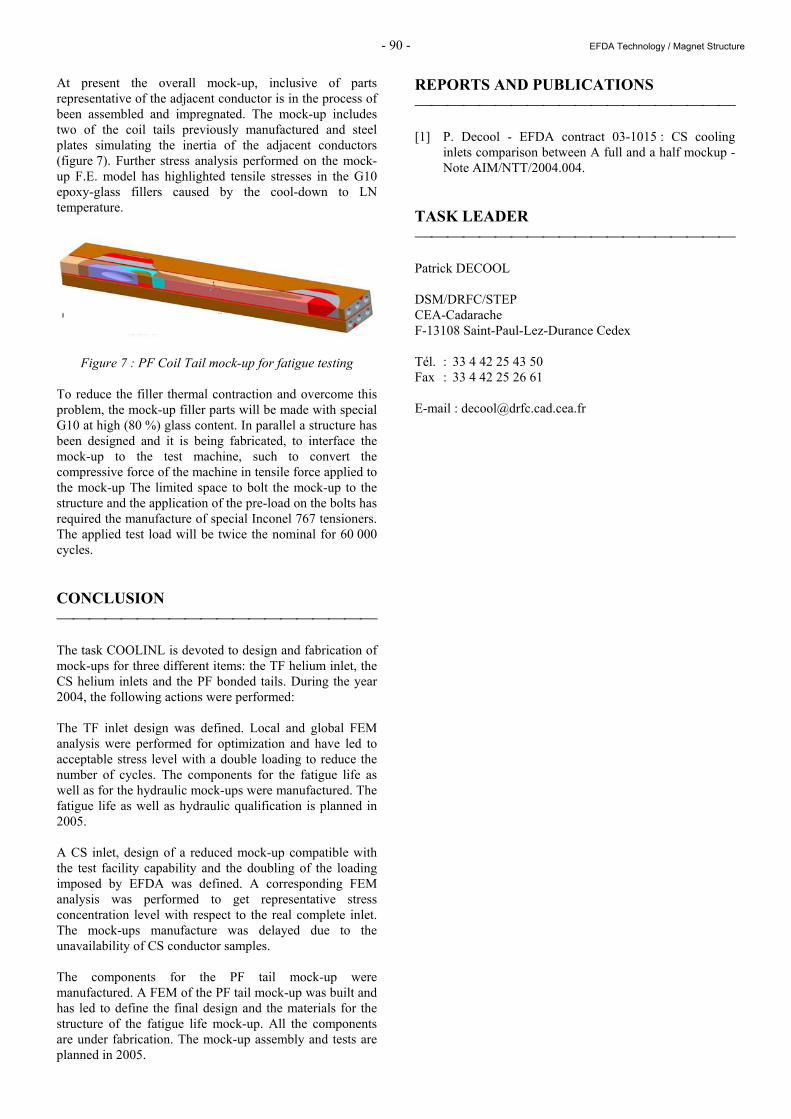
- 90 - EFDA Technology / Magnet Structure
At present the overall mock-up, inclusive of parts representative of the adjacent conductor is in the process of been assembled and impregnated. The mock-up includes two of the coil tails previously manufactured and steel plates simulating the inertia of the adjacent conductors (figure 7). Further stress analysis performed on the mock-up F.E. model has highlighted tensile stresses in the G10 epoxy-glass fillers caused by the cool-down to LN temperature.
Figure 7 : PF Coil Tail mock-up for fatigue testing To reduce the filler thermal contraction and overcome this problem, the mock-up filler parts will be made with special G10 at high (80 %) glass content. In parallel a structure has been designed and it is being fabricated, to interface the mock-up to the test machine, such to convert the compressive force of the machine in tensile force applied to the mock-up The limited space to bolt the mock-up to the structure and the application of the pre-load on the bolts has required the manufacture of special Inconel 767 tensioners. The applied test load will be twice the nominal for 60 000 cycles. CONCLUSION The task COOLINL is devoted to design and fabrication of mock-ups for three different items: the TF helium inlet, the CS helium inlets and the PF bonded tails. During the year 2004, the following actions were performed: The TF inlet design was defined. Local and global FEM analysis were performed for optimization and have led to acceptable stress level with a double loading to reduce the number of cycles. The components for the fatigue life as well as for the hydraulic mock-ups were manufactured. The fatigue life as well as hydraulic qualification is planned in 2005. A CS inlet, design of a reduced mock-up compatible with the test facility capability and the doubling of the loading imposed by EFDA was defined. A corresponding FEM analysis was performed to get representative stress concentration level with respect to the real complete inlet. The mock-ups manufacture was delayed due to the unavailability of CS conductor samples. The components for the PF tail mock-up were manufactured. A FEM of the PF tail mock-up was built and has led to define the final design and the materials for the structure of the fatigue life mock-up. All the components are under fabrication. The mock-up assembly and tests are planned in 2005.
REPORTS AND PUBLICATIONS [1] P. Decool - EFDA contract 03-1015 : CS cooling
inlets comparison between A full and a half mockup - Note AIM/NTT/2004.004.
TASK LEADER Patrick DECOOL DSM/DRFC/STEP CEA-Cadarache F-13108 Saint-Paul-Lez-Durance Cedex Tél. : 33 4 42 25 43 50 Fax : 33 4 42 25 26 61 E-mail : [email protected]
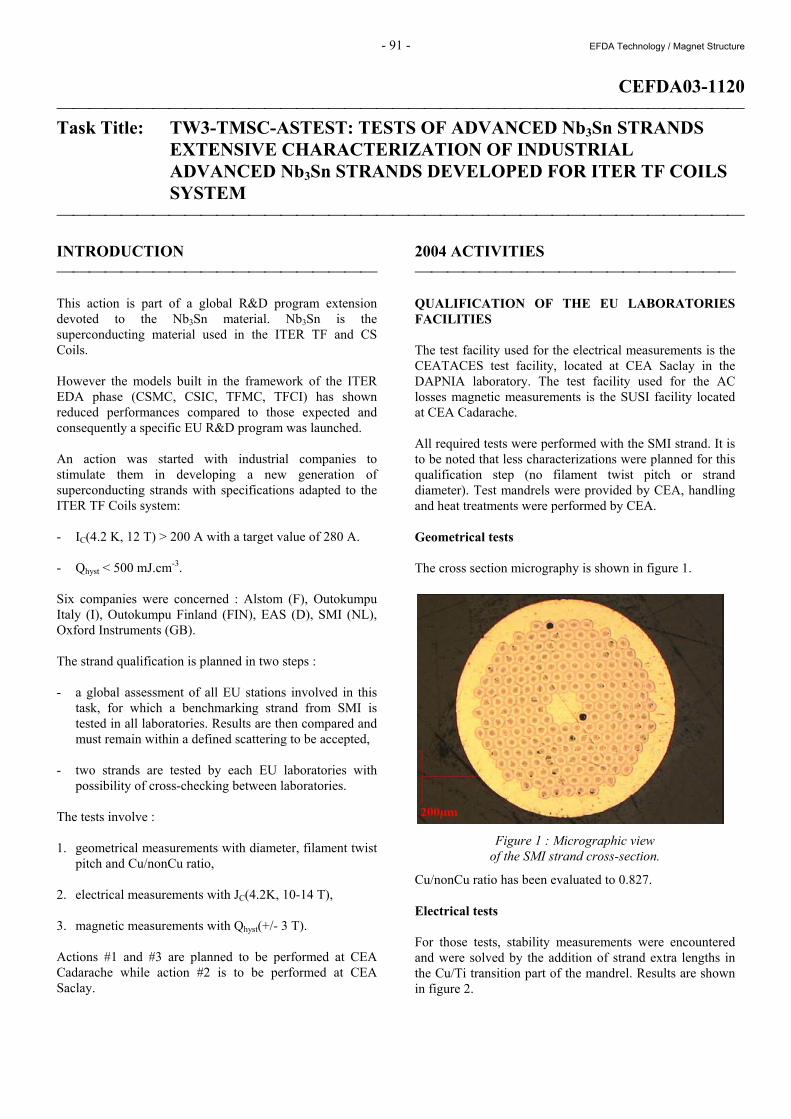
- 91 - EFDA Technology / Magnet Structure
CEFDA03-1120 Task Title: TW3-TMSC-ASTEST: TESTS OF ADVANCED Nb3Sn STRANDS
EXTENSIVE CHARACTERIZATION OF INDUSTRIAL ADVANCED Nb3Sn STRANDS DEVELOPED FOR ITER TF COILS SYSTEM
INTRODUCTION This action is part of a global R&D program extension devoted to the Nb3Sn material. Nb3Sn is the superconducting material used in the ITER TF and CS Coils. However the models built in the framework of the ITER EDA phase (CSMC, CSIC, TFMC, TFCI) has shown reduced performances compared to those expected and consequently a specific EU R&D program was launched. An action was started with industrial companies to stimulate them in developing a new generation of superconducting strands with specifications adapted to the ITER TF Coils system: - IC(4.2 K, 12 T) > 200 A with a target value of 280 A. - Qhyst < 500 mJ.cm-3. Six companies were concerned : Alstom (F), Outokumpu Italy (I), Outokumpu Finland (FIN), EAS (D), SMI (NL), Oxford Instruments (GB). The strand qualification is planned in two steps : - a global assessment of all EU stations involved in this
task, for which a benchmarking strand from SMI is tested in all laboratories. Results are then compared and must remain within a defined scattering to be accepted,
- two strands are tested by each EU laboratories with
possibility of cross-checking between laboratories. The tests involve : 1. geometrical measurements with diameter, filament twist
pitch and Cu/nonCu ratio, 2. electrical measurements with JC(4.2K, 10-14 T), 3. magnetic measurements with Qhyst(+/- 3 T). Actions #1 and #3 are planned to be performed at CEA Cadarache while action #2 is to be performed at CEA Saclay.
2004 ACTIVITIES QUALIFICATION OF THE EU LABORATORIES FACILITIES The test facility used for the electrical measurements is the CEATACES test facility, located at CEA Saclay in the DAPNIA laboratory. The test facility used for the AC losses magnetic measurements is the SUSI facility located at CEA Cadarache. All required tests were performed with the SMI strand. It is to be noted that less characterizations were planned for this qualification step (no filament twist pitch or strand diameter). Test mandrels were provided by CEA, handling and heat treatments were performed by CEA. Geometrical tests The cross section micrography is shown in figure 1.
Figure 1 : Micrographic view of the SMI strand cross-section.
Cu/nonCu ratio has been evaluated to 0.827. Electrical tests For those tests, stability measurements were encountered and were solved by the addition of strand extra lengths in the Cu/Ti transition part of the mandrel. Results are shown in figure 2.
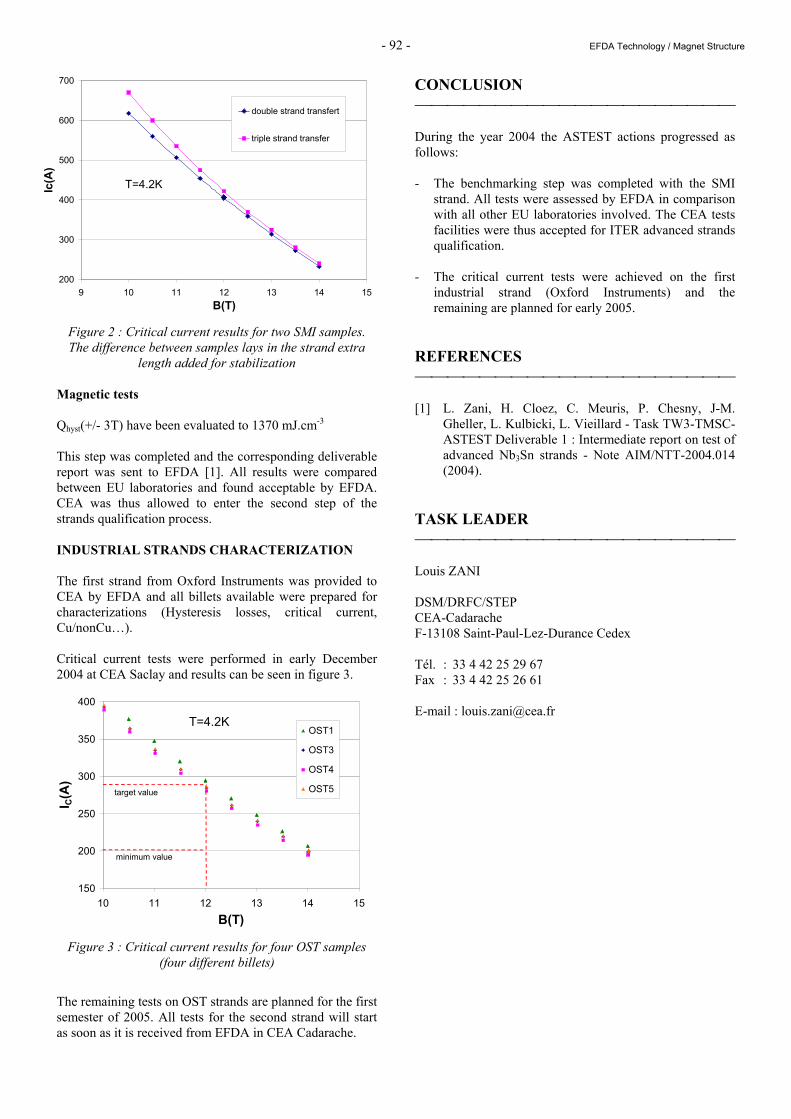
- 92 - EFDA Technology / Magnet Structure
Figure 2 : Critical current results for two SMI samples. The difference between samples lays in the strand extra
length added for stabilization Magnetic tests Qhyst(+/- 3T) have been evaluated to 1370 mJ.cm-3 This step was completed and the corresponding deliverable report was sent to EFDA [1]. All results were compared between EU laboratories and found acceptable by EFDA. CEA was thus allowed to enter the second step of the strands qualification process. INDUSTRIAL STRANDS CHARACTERIZATION The first strand from Oxford Instruments was provided to CEA by EFDA and all billets available were prepared for characterizations (Hysteresis losses, critical current, Cu/nonCu…). Critical current tests were performed in early December 2004 at CEA Saclay and results can be seen in figure 3.
Figure 3 : Critical current results for four OST samples (four different billets)
The remaining tests on OST strands are planned for the first semester of 2005. All tests for the second strand will start as soon as it is received from EFDA in CEA Cadarache.
CONCLUSION During the year 2004 the ASTEST actions progressed as follows: - The benchmarking step was completed with the SMI
strand. All tests were assessed by EFDA in comparison with all other EU laboratories involved. The CEA tests facilities were thus accepted for ITER advanced strands qualification.
- The critical current tests were achieved on the first
industrial strand (Oxford Instruments) and the remaining are planned for early 2005.
REFERENCES [1] L. Zani, H. Cloez, C. Meuris, P. Chesny, J-M.
Gheller, L. Kulbicki, L. Vieillard - Task TW3-TMSC-ASTEST Deliverable 1 : Intermediate report on test of advanced Nb3Sn strands - Note AIM/NTT-2004.014 (2004).
TASK LEADER Louis ZANI DSM/DRFC/STEP CEA-Cadarache F-13108 Saint-Paul-Lez-Durance Cedex Tél. : 33 4 42 25 29 67 Fax : 33 4 42 25 26 61 E-mail : [email protected]
200
300
400
500
600
700
9 10 11 12 13 14 15B(T)
Ic(A)
double strand transfert
triple strand transfer
T=4.2K
150
200
250
300
350
400
10 11 12 13 14 15B(T)
I C(A)
OST1
OST3
OST4
OST5 target value
minimum value
T=4.2K
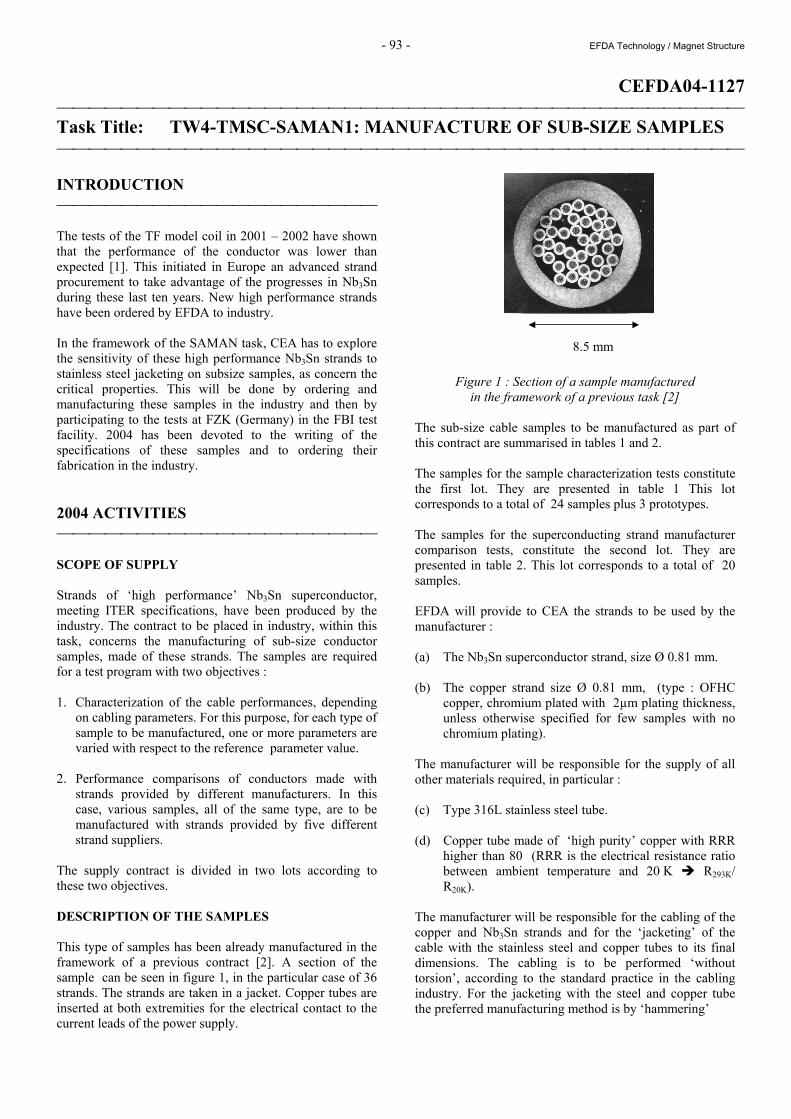
- 93 - EFDA Technology / Magnet Structure
CEFDA04-1127 Task Title: TW4-TMSC-SAMAN1: MANUFACTURE OF SUB-SIZE SAMPLES INTRODUCTION The tests of the TF model coil in 2001 – 2002 have shown that the performance of the conductor was lower than expected [1]. This initiated in Europe an advanced strand procurement to take advantage of the progresses in Nb3Sn during these last ten years. New high performance strands have been ordered by EFDA to industry. In the framework of the SAMAN task, CEA has to explore the sensitivity of these high performance Nb3Sn strands to stainless steel jacketing on subsize samples, as concern the critical properties. This will be done by ordering and manufacturing these samples in the industry and then by participating to the tests at FZK (Germany) in the FBI test facility. 2004 has been devoted to the writing of the specifications of these samples and to ordering their fabrication in the industry. 2004 ACTIVITIES SCOPE OF SUPPLY Strands of ‘high performance’ Nb3Sn superconductor, meeting ITER specifications, have been produced by the industry. The contract to be placed in industry, within this task, concerns the manufacturing of sub-size conductor samples, made of these strands. The samples are required for a test program with two objectives : 1. Characterization of the cable performances, depending
on cabling parameters. For this purpose, for each type of sample to be manufactured, one or more parameters are varied with respect to the reference parameter value.
2. Performance comparisons of conductors made with
strands provided by different manufacturers. In this case, various samples, all of the same type, are to be manufactured with strands provided by five different strand suppliers.
The supply contract is divided in two lots according to these two objectives. DESCRIPTION OF THE SAMPLES This type of samples has been already manufactured in the framework of a previous contract [2]. A section of the sample can be seen in figure 1, in the particular case of 36 strands. The strands are taken in a jacket. Copper tubes are inserted at both extremities for the electrical contact to the current leads of the power supply.
Figure 1 : Section of a sample manufactured in the framework of a previous task [2]
The sub-size cable samples to be manufactured as part of this contract are summarised in tables 1 and 2. The samples for the sample characterization tests constitute the first lot. They are presented in table 1 This lot corresponds to a total of 24 samples plus 3 prototypes. The samples for the superconducting strand manufacturer comparison tests, constitute the second lot. They are presented in table 2. This lot corresponds to a total of 20 samples. EFDA will provide to CEA the strands to be used by the manufacturer : (a) The Nb3Sn superconductor strand, size Ø 0.81 mm. (b) The copper strand size Ø 0.81 mm, (type : OFHC
copper, chromium plated with 2µm plating thickness, unless otherwise specified for few samples with no chromium plating).
The manufacturer will be responsible for the supply of all other materials required, in particular : (c) Type 316L stainless steel tube. (d) Copper tube made of ‘high purity’ copper with RRR
higher than 80 (RRR is the electrical resistance ratio between ambient temperature and 20 K R293K/ R20K).
The manufacturer will be responsible for the cabling of the copper and Nb3Sn strands and for the ‘jacketing’ of the cable with the stainless steel and copper tubes to its final dimensions. The cabling is to be performed ‘without torsion’, according to the standard practice in the cabling industry. For the jacketing with the steel and copper tube the preferred manufacturing method is by ‘hammering’
8.5 mm
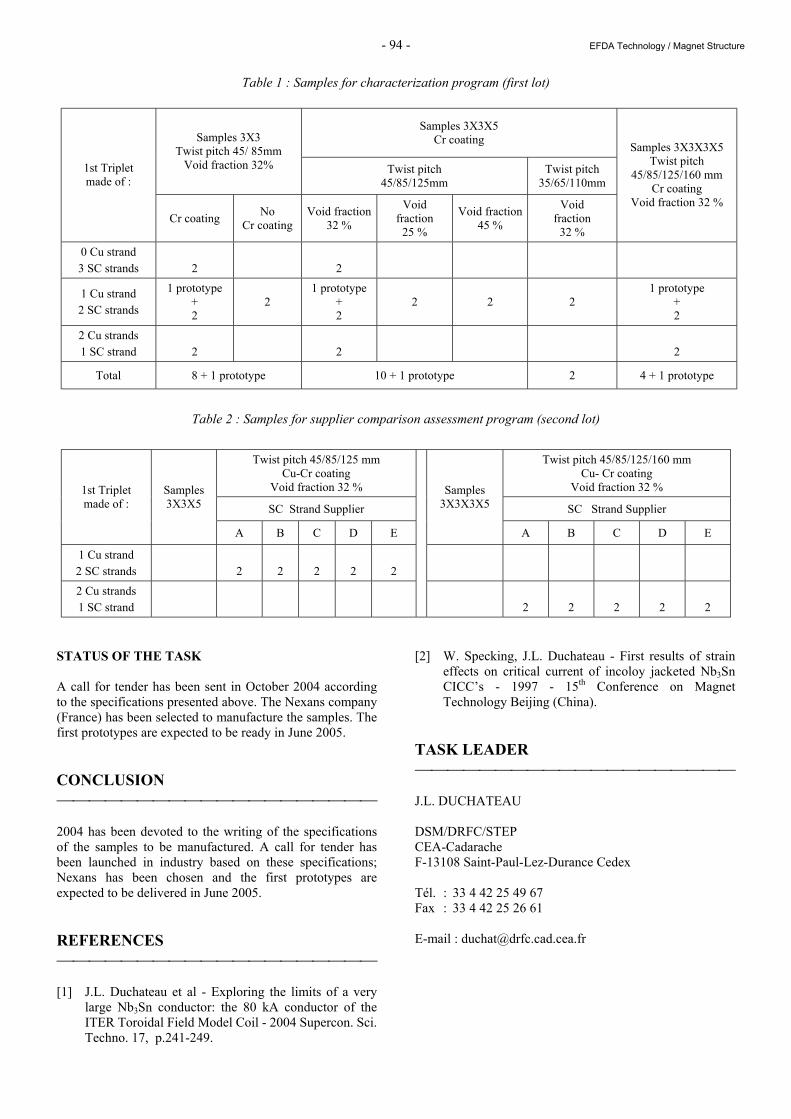
- 94 - EFDA Technology / Magnet Structure
Table 1 : Samples for characterization program (first lot)
Table 2 : Samples for supplier comparison assessment program (second lot)
STATUS OF THE TASK A call for tender has been sent in October 2004 according to the specifications presented above. The Nexans company (France) has been selected to manufacture the samples. The first prototypes are expected to be ready in June 2005. CONCLUSION 2004 has been devoted to the writing of the specifications of the samples to be manufactured. A call for tender has been launched in industry based on these specifications; Nexans has been chosen and the first prototypes are expected to be delivered in June 2005. REFERENCES [1] J.L. Duchateau et al - Exploring the limits of a very
large Nb3Sn conductor: the 80 kA conductor of the ITER Toroidal Field Model Coil - 2004 Supercon. Sci. Techno. 17, p.241-249.
[2] W. Specking, J.L. Duchateau - First results of strain effects on critical current of incoloy jacketed Nb3Sn CICC’s - 1997 - 15th Conference on Magnet Technology Beijing (China).
TASK LEADER J.L. DUCHATEAU DSM/DRFC/STEP CEA-Cadarache F-13108 Saint-Paul-Lez-Durance Cedex Tél. : 33 4 42 25 49 67 Fax : 33 4 42 25 26 61 E-mail : [email protected]
Twist pitch 45/85/125 mm Cu-Cr coating
Void fraction 32 %
Twist pitch 45/85/125/160 mm Cu- Cr coating
Void fraction 32 %
SC Strand Supplier SC Strand Supplier 1st Triplet made of :
Samples 3X3X5
A B C D E
Samples 3X3X3X5
A B C D E
1 Cu strand 2 SC strands
2 2
2
2
2
2 Cu strands 1 SC strand
2 2
2
2
2
Samples 3X3X5 Cr coating Samples 3X3
Twist pitch 45/ 85mm Void fraction 32% Twist pitch
45/85/125mm Twist pitch
35/65/110mm 1st Triplet made of :
Cr coating No Cr coating
Void fraction 32 %
Void fraction
25 %
Void fraction 45 %
Void fraction
32 %
Samples 3X3X3X5 Twist pitch
45/85/125/160 mm Cr coating
Void fraction 32 %
0 Cu strand 3 SC strands
2
2
1 Cu strand 2 SC strands
1 prototype + 2
2 1 prototype
+ 2
2 2 2 1 prototype
+ 2
2 Cu strands 1 SC strand
2
2
2
Total 8 + 1 prototype 10 + 1 prototype 2 4 + 1 prototype
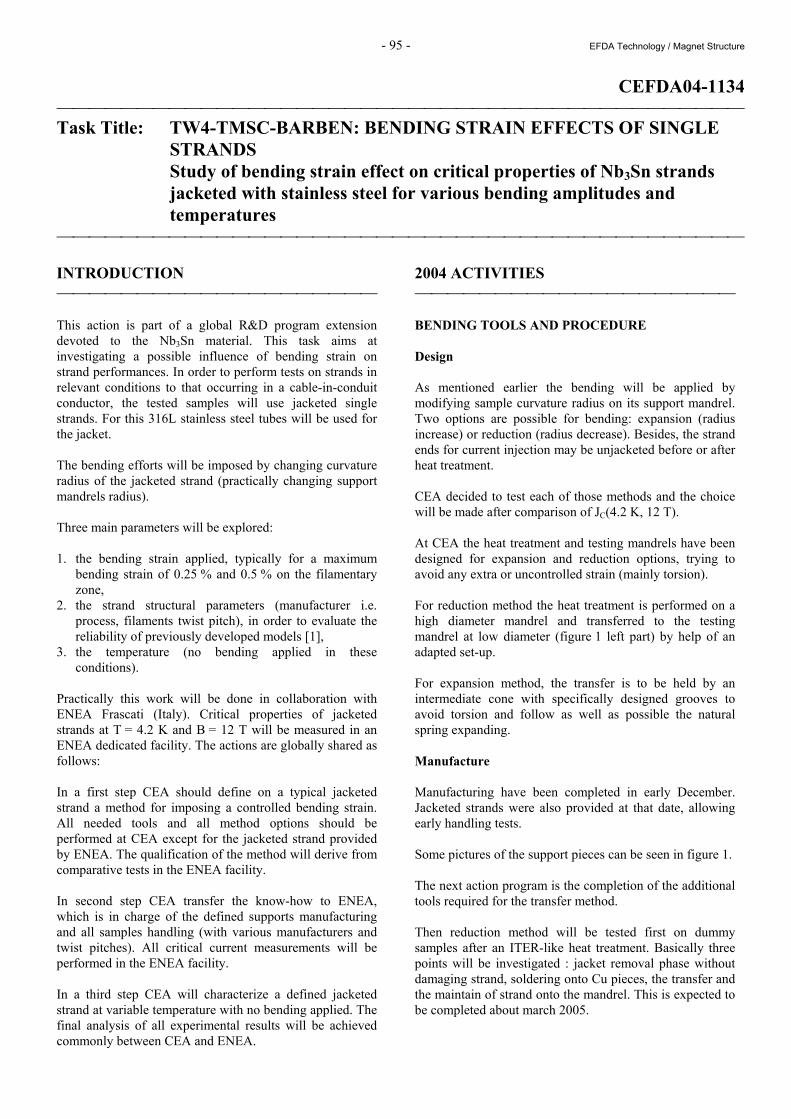
- 95 - EFDA Technology / Magnet Structure
CEFDA04-1134 Task Title: TW4-TMSC-BARBEN: BENDING STRAIN EFFECTS OF SINGLE
STRANDS Study of bending strain effect on critical properties of Nb3Sn strands
jacketed with stainless steel for various bending amplitudes and temperatures
INTRODUCTION This action is part of a global R&D program extension devoted to the Nb3Sn material. This task aims at investigating a possible influence of bending strain on strand performances. In order to perform tests on strands in relevant conditions to that occurring in a cable-in-conduit conductor, the tested samples will use jacketed single strands. For this 316L stainless steel tubes will be used for the jacket. The bending efforts will be imposed by changing curvature radius of the jacketed strand (practically changing support mandrels radius). Three main parameters will be explored: 1. the bending strain applied, typically for a maximum
bending strain of 0.25 % and 0.5 % on the filamentary zone,
2. the strand structural parameters (manufacturer i.e. process, filaments twist pitch), in order to evaluate the reliability of previously developed models [1],
3. the temperature (no bending applied in these conditions).
Practically this work will be done in collaboration with ENEA Frascati (Italy). Critical properties of jacketed strands at T = 4.2 K and B = 12 T will be measured in an ENEA dedicated facility. The actions are globally shared as follows: In a first step CEA should define on a typical jacketed strand a method for imposing a controlled bending strain. All needed tools and all method options should be performed at CEA except for the jacketed strand provided by ENEA. The qualification of the method will derive from comparative tests in the ENEA facility. In second step CEA transfer the know-how to ENEA, which is in charge of the defined supports manufacturing and all samples handling (with various manufacturers and twist pitches). All critical current measurements will be performed in the ENEA facility. In a third step CEA will characterize a defined jacketed strand at variable temperature with no bending applied. The final analysis of all experimental results will be achieved commonly between CEA and ENEA.
2004 ACTIVITIES BENDING TOOLS AND PROCEDURE Design As mentioned earlier the bending will be applied by modifying sample curvature radius on its support mandrel. Two options are possible for bending: expansion (radius increase) or reduction (radius decrease). Besides, the strand ends for current injection may be unjacketed before or after heat treatment. CEA decided to test each of those methods and the choice will be made after comparison of JC(4.2 K, 12 T). At CEA the heat treatment and testing mandrels have been designed for expansion and reduction options, trying to avoid any extra or uncontrolled strain (mainly torsion). For reduction method the heat treatment is performed on a high diameter mandrel and transferred to the testing mandrel at low diameter (figure 1 left part) by help of an adapted set-up. For expansion method, the transfer is to be held by an intermediate cone with specifically designed grooves to avoid torsion and follow as well as possible the natural spring expanding. Manufacture Manufacturing have been completed in early December. Jacketed strands were also provided at that date, allowing early handling tests. Some pictures of the support pieces can be seen in figure 1. The next action program is the completion of the additional tools required for the transfer method. Then reduction method will be tested first on dummy samples after an ITER-like heat treatment. Basically three points will be investigated : jacket removal phase without damaging strand, soldering onto Cu pieces, the transfer and the maintain of strand onto the mandrel. This is expected to be completed about march 2005.
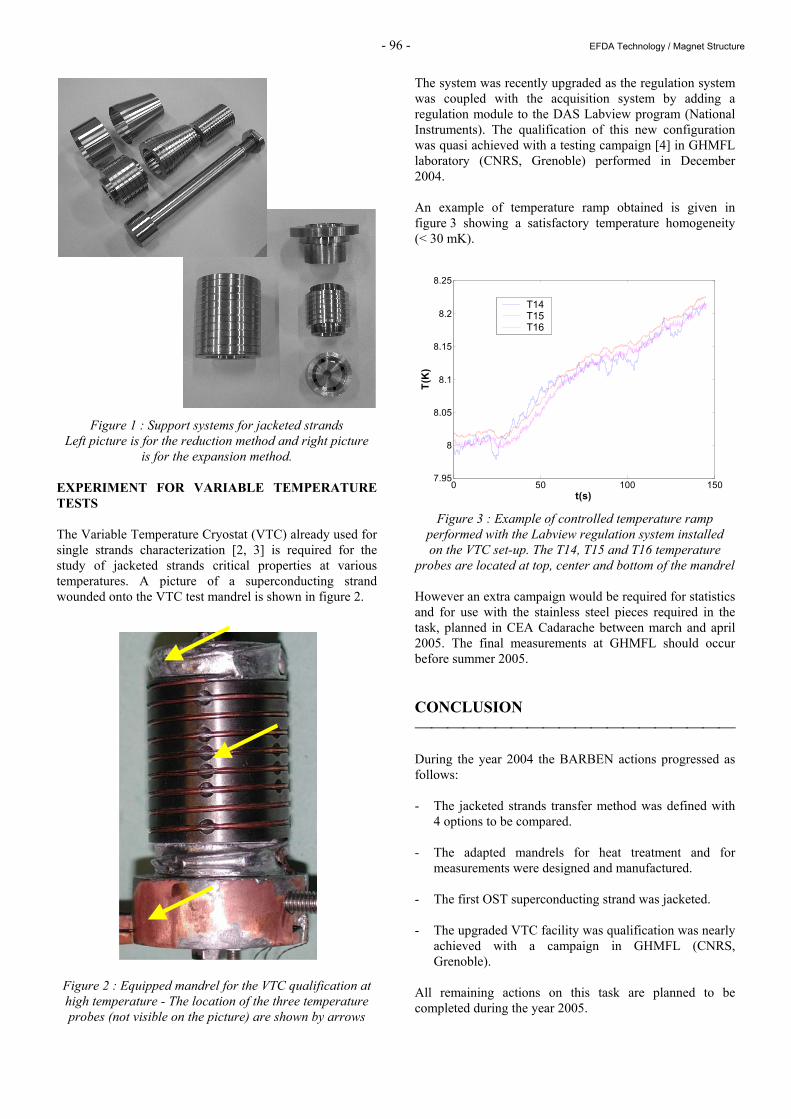
- 96 - EFDA Technology / Magnet Structure
Figure 1 : Support systems for jacketed strands Left picture is for the reduction method and right picture
is for the expansion method. EXPERIMENT FOR VARIABLE TEMPERATURE TESTS The Variable Temperature Cryostat (VTC) already used for single strands characterization [2, 3] is required for the study of jacketed strands critical properties at various temperatures. A picture of a superconducting strand wounded onto the VTC test mandrel is shown in figure 2.
Figure 2 : Equipped mandrel for the VTC qualification at high temperature - The location of the three temperature probes (not visible on the picture) are shown by arrows
The system was recently upgraded as the regulation system was coupled with the acquisition system by adding a regulation module to the DAS Labview program (National Instruments). The qualification of this new configuration was quasi achieved with a testing campaign [4] in GHMFL laboratory (CNRS, Grenoble) performed in December 2004. An example of temperature ramp obtained is given in figure 3 showing a satisfactory temperature homogeneity (< 30 mK).
Figure 3 : Example of controlled temperature ramp performed with the Labview regulation system installed on the VTC set-up. The T14, T15 and T16 temperature
probes are located at top, center and bottom of the mandrel However an extra campaign would be required for statistics and for use with the stainless steel pieces required in the task, planned in CEA Cadarache between march and april 2005. The final measurements at GHMFL should occur before summer 2005. CONCLUSION During the year 2004 the BARBEN actions progressed as follows: - The jacketed strands transfer method was defined with
4 options to be compared. - The adapted mandrels for heat treatment and for
measurements were designed and manufactured. - The first OST superconducting strand was jacketed. - The upgraded VTC facility was qualification was nearly
achieved with a campaign in GHMFL (CNRS, Grenoble).
All remaining actions on this task are planned to be completed during the year 2005.
0 50 100 1507.95
8
8.05
8.1
8.15
8.2
8.25
t(s)
T(K)
T14T15T16
- 97 - EFDA Technology / Magnet Structure
REFERENCES [1] J.W. Ekin - Current transfer in multifilamentary
superconductors. I. Theory, J. Appl. Phys. Vol. 49 n°6, pp.3406-3409 (1978).
[2] L. Zani, JP. Serries, H. Cloez, Z. Bej and E. Mossang
- Characterization of transport properties variations with magnetic field and temperature of ITER-candidate NbTi strands, Physica C 372-376 pp. 1311-1314 (2002).
[3] L. Zani, E. Mossang, M. Tena, J-P. Serries and H.
Cloez - JC(B,T) characterization of NbTi strands used in ITER PF-relevant Insert and Full-scale sample, presented at ASC2004 (2004).
REPORTS AND PUBLICATIONS [4] L. Zani, M. Tena, H. Cloez, J-P. Serries, S. Girard -
Tâche BARBEN : qualification du système de régulation du Cryostat à température Variable en configuration Nb3Sn, Note AIM/NTT-2005.003, (2005).
TASK LEADER Louis ZANI DSM/DRFC/STEP CEA-Cadarache F-13108 Saint-Paul-Lez-Durance Cedex Tél. : 33 4 42 25 29 67 Fax : 33 4 42 25 26 61 E-mail : [email protected]

- 98 - EFDA Technology / Magnet Structure
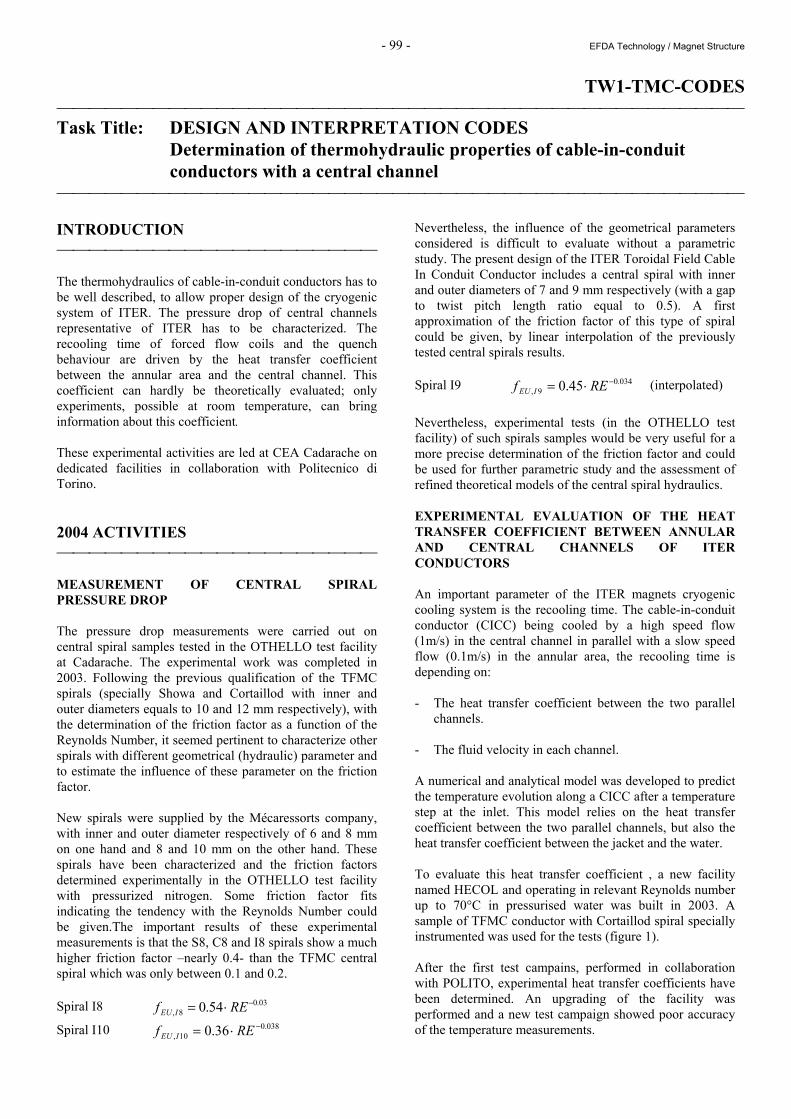
- 99 - EFDA Technology / Magnet Structure
TW1-TMC-CODES Task Title: DESIGN AND INTERPRETATION CODES Determination of thermohydraulic properties of cable-in-conduit
conductors with a central channel INTRODUCTION The thermohydraulics of cable-in-conduit conductors has to be well described, to allow proper design of the cryogenic system of ITER. The pressure drop of central channels representative of ITER has to be characterized. The recooling time of forced flow coils and the quench behaviour are driven by the heat transfer coefficient between the annular area and the central channel. This coefficient can hardly be theoretically evaluated; only experiments, possible at room temperature, can bring information about this coefficient. These experimental activities are led at CEA Cadarache on dedicated facilities in collaboration with Politecnico di Torino. 2004 ACTIVITIES MEASUREMENT OF CENTRAL SPIRAL PRESSURE DROP The pressure drop measurements were carried out on central spiral samples tested in the OTHELLO test facility at Cadarache. The experimental work was completed in 2003. Following the previous qualification of the TFMC spirals (specially Showa and Cortaillod with inner and outer diameters equals to 10 and 12 mm respectively), with the determination of the friction factor as a function of the Reynolds Number, it seemed pertinent to characterize other spirals with different geometrical (hydraulic) parameter and to estimate the influence of these parameter on the friction factor. New spirals were supplied by the Mécaressorts company, with inner and outer diameter respectively of 6 and 8 mm on one hand and 8 and 10 mm on the other hand. These spirals have been characterized and the friction factors determined experimentally in the OTHELLO test facility with pressurized nitrogen. Some friction factor fits indicating the tendency with the Reynolds Number could be given.The important results of these experimental measurements is that the S8, C8 and I8 spirals show a much higher friction factor –nearly 0.4- than the TFMC central spiral which was only between 0.1 and 0.2. Spiral I8 03.0
8, 54.0 −⋅= REf IEU
Spiral I10 038.010, 36.0 −⋅= REf IEU
Nevertheless, the influence of the geometrical parameters considered is difficult to evaluate without a parametric study. The present design of the ITER Toroidal Field Cable In Conduit Conductor includes a central spiral with inner and outer diameters of 7 and 9 mm respectively (with a gap to twist pitch length ratio equal to 0.5). A first approximation of the friction factor of this type of spiral could be given, by linear interpolation of the previously tested central spirals results. Spiral I9 034.0
9, 45.0 −⋅= REf IEU (interpolated)
Nevertheless, experimental tests (in the OTHELLO test facility) of such spirals samples would be very useful for a more precise determination of the friction factor and could be used for further parametric study and the assessment of refined theoretical models of the central spiral hydraulics. EXPERIMENTAL EVALUATION OF THE HEAT TRANSFER COEFFICIENT BETWEEN ANNULAR AND CENTRAL CHANNELS OF ITER CONDUCTORS An important parameter of the ITER magnets cryogenic cooling system is the recooling time. The cable-in-conduit conductor (CICC) being cooled by a high speed flow (1m/s) in the central channel in parallel with a slow speed flow (0.1m/s) in the annular area, the recooling time is depending on: - The heat transfer coefficient between the two parallel
channels. - The fluid velocity in each channel. A numerical and analytical model was developed to predict the temperature evolution along a CICC after a temperature step at the inlet. This model relies on the heat transfer coefficient between the two parallel channels, but also the heat transfer coefficient between the jacket and the water. To evaluate this heat transfer coefficient , a new facility named HECOL and operating in relevant Reynolds number up to 70°C in pressurised water was built in 2003. A sample of TFMC conductor with Cortaillod spiral specially instrumented was used for the tests (figure 1). After the first test campains, performed in collaboration with POLITO, experimental heat transfer coefficients have been determined. An upgrading of the facility was performed and a new test campaign showed poor accuracy of the temperature measurements.
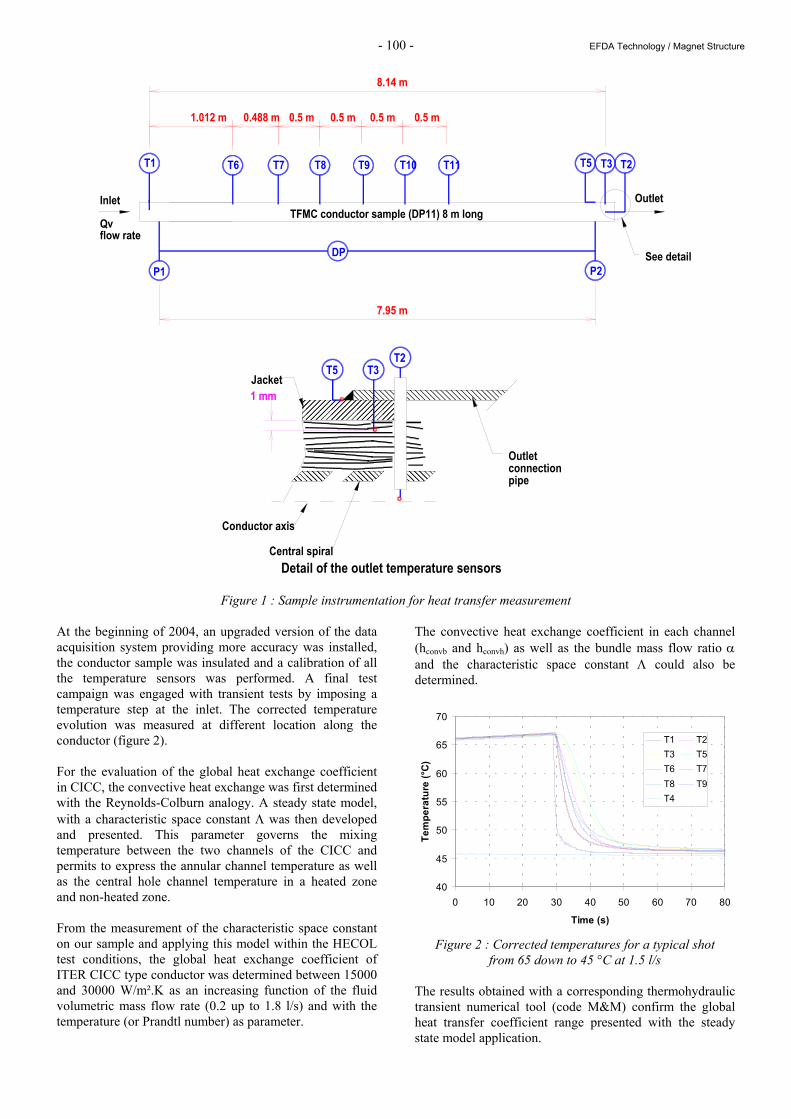
- 100 - EFDA Technology / Magnet Structure
8.14 m
7.95 m
TFMC conductor sample (DP11) 8 m long
0.5 m
Inlet
P1
Qvflow rate
DP
1.012 m
T1
0.5 m0.488 m
T6 T7 T8
P2
0.5 m0.5 m
T9 T10 T11 T3T5
Outlet
See detail
T2
Outlet connection pipe
Conductor axis
Jacket
Central spiralDetail of the outlet temperature sensors
1 mm
T2
T5
T3
Figure 1 : Sample instrumentation for heat transfer measurement At the beginning of 2004, an upgraded version of the data acquisition system providing more accuracy was installed, the conductor sample was insulated and a calibration of all the temperature sensors was performed. A final test campaign was engaged with transient tests by imposing a temperature step at the inlet. The corrected temperature evolution was measured at different location along the conductor (figure 2). For the evaluation of the global heat exchange coefficient in CICC, the convective heat exchange was first determined with the Reynolds-Colburn analogy. A steady state model, with a characteristic space constant Λ was then developed and presented. This parameter governs the mixing temperature between the two channels of the CICC and permits to express the annular channel temperature as well as the central hole channel temperature in a heated zone and non-heated zone. From the measurement of the characteristic space constant on our sample and applying this model within the HECOL test conditions, the global heat exchange coefficient of ITER CICC type conductor was determined between 15000 and 30000 W/m².K as an increasing function of the fluid volumetric mass flow rate (0.2 up to 1.8 l/s) and with the temperature (or Prandtl number) as parameter.
The convective heat exchange coefficient in each channel (hconvb and hconvh) as well as the bundle mass flow ratio α and the characteristic space constant Λ could also be determined.
Figure 2 : Corrected temperatures for a typical shot from 65 down to 45 °C at 1.5 l/s
The results obtained with a corresponding thermohydraulic transient numerical tool (code M&M) confirm the global heat transfer coefficient range presented with the steady state model application.
40
45
50
55
60
65
70
0 10 20 30 40 50 60 70 80
Time (s)
Tem
pera
ture
(°C)
T1 T2T3 T5T6 T7T8 T9T4
- 101 - EFDA Technology / Magnet Structure
Furthermore, the steady state characteristic space constant model, with the corresponding heat transfer correlation were applied to cold tests, specially the PF-FSJS. A good agreement of the calculated analytical value of the space constant on one hand and the experiments on the other hand was observed.. Typically, the global heat transfer coefficient h_perfor for the PF-FSJS is between 300 and 450 W/m².K. For the TFMC tests, in the TOSKA test facility, the global heat transfer coefficient h_perfor is comprised between 400 and 600 W/m².K. As for the PF-FSJS experiment, it would be interesting to perform some steady state tests in the HECOL test facility in order to verify the characteristic space constant predicted by the model with experimental results by measurements of the temperature profile along the conductor. These steady state tests would be worthwhile by varying the mass flow rate (Reynolds number), the water temperature (Prandtl number) and the sensor locations (radial direction); with heating on a determined length, they also are representative of what happens on the CICC during nuclear heating of the TF Coils. CONCLUSION During the year 2004, an analysis of the tests of seven central spirals relevant to ITER type conductors tested in GN2 at room temperature in the OTHELLO test facility during the year 2003 was carried out. This analysis led to conclude that the smaller diameter spirals (8 mm) presents friction factor about twice higher than the old larger ITER spirals (12 mm). An interpolation led to predict the friction factor of the new ITER spirals design. However, a set of spirals much closer to the new ITER spiral design would be very useful for a more precise determination of the friction factor and could be used for further parametric study and the assessment of refined theoretical models of the central spiral hydraulics. For the evaluation of the heat transfer coefficient between annular area and central channel of ITER cable-in-conduit conductors, the dedicated experimental facility HECOL which operates in pressurized water at 70°C was upgraded and the accuracy of the last results was satisfactory. A steady state model, with a characteristic space constant Λ was then developed and has confirm the results obtained with a corresponding thermohydraulic transient numerical tool (code M&M) on the global heat transfer coefficient range. The steady state characteristic space constant model, with the corresponding heat transfer correlation were applied to cold tests. A good agreement of the calculated analytical value of the space constant on one hand and the experiments on the other hand was observed. It was suggested to perform some steady state tests in HECOL to verify the characteristic space constant predicted by the model. A final report on all these task activities was issued [1].
REPORTS AND PUBLICATIONS [1] Task CODES: Deliverable 4, Experimental
investigation to determine the heat transfer coefficient between annular area and the central channel of ITER-FEAT conductors as an input to codes development, S. Nicollet, H. Cloez, P. Decool, J.L. Duchateau, A. Martinez, M. Tena, B. Renard, J.P. Serries.
TASK LEADER Patrick DECOOL DSM/DRFC/STEP CEA-Cadarache F-13108 Saint-Paul-Lez-Durance Cedex Tél. : 33 4 42 25 43 50 Fax : 33 4 42 25 26 61 E-mail : [email protected]

- 102 - EFDA Technology / Magnet Structure
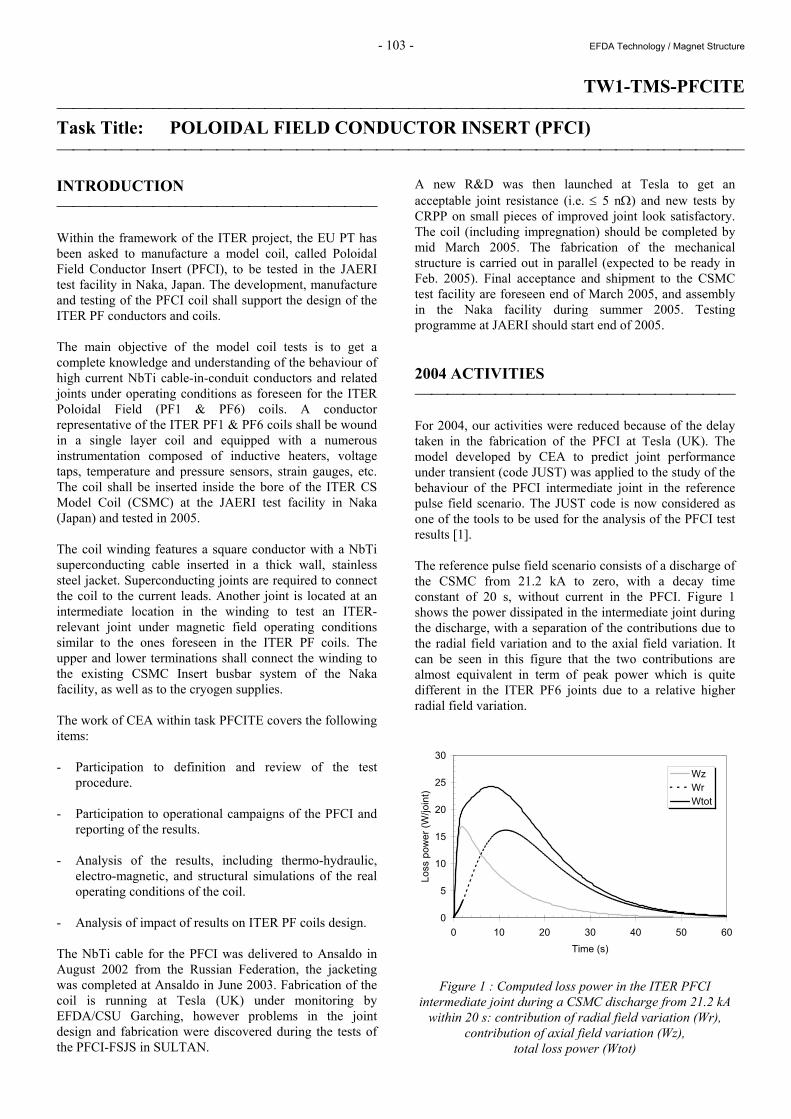
- 103 - EFDA Technology / Magnet Structure
TW1-TMS-PFCITE Task Title: POLOIDAL FIELD CONDUCTOR INSERT (PFCI) INTRODUCTION Within the framework of the ITER project, the EU PT has been asked to manufacture a model coil, called Poloidal Field Conductor Insert (PFCI), to be tested in the JAERI test facility in Naka, Japan. The development, manufacture and testing of the PFCI coil shall support the design of the ITER PF conductors and coils. The main objective of the model coil tests is to get a complete knowledge and understanding of the behaviour of high current NbTi cable-in-conduit conductors and related joints under operating conditions as foreseen for the ITER Poloidal Field (PF1 & PF6) coils. A conductor representative of the ITER PF1 & PF6 coils shall be wound in a single layer coil and equipped with a numerous instrumentation composed of inductive heaters, voltage taps, temperature and pressure sensors, strain gauges, etc. The coil shall be inserted inside the bore of the ITER CS Model Coil (CSMC) at the JAERI test facility in Naka (Japan) and tested in 2005. The coil winding features a square conductor with a NbTi superconducting cable inserted in a thick wall, stainless steel jacket. Superconducting joints are required to connect the coil to the current leads. Another joint is located at an intermediate location in the winding to test an ITER-relevant joint under magnetic field operating conditions similar to the ones foreseen in the ITER PF coils. The upper and lower terminations shall connect the winding to the existing CSMC Insert busbar system of the Naka facility, as well as to the cryogen supplies. The work of CEA within task PFCITE covers the following items: - Participation to definition and review of the test
procedure. - Participation to operational campaigns of the PFCI and
reporting of the results. - Analysis of the results, including thermo-hydraulic,
electro-magnetic, and structural simulations of the real operating conditions of the coil.
- Analysis of impact of results on ITER PF coils design. The NbTi cable for the PFCI was delivered to Ansaldo in August 2002 from the Russian Federation, the jacketing was completed at Ansaldo in June 2003. Fabrication of the coil is running at Tesla (UK) under monitoring by EFDA/CSU Garching, however problems in the joint design and fabrication were discovered during the tests of the PFCI-FSJS in SULTAN.
A new R&D was then launched at Tesla to get an acceptable joint resistance (i.e. ≤ 5 nΩ) and new tests by CRPP on small pieces of improved joint look satisfactory. The coil (including impregnation) should be completed by mid March 2005. The fabrication of the mechanical structure is carried out in parallel (expected to be ready in Feb. 2005). Final acceptance and shipment to the CSMC test facility are foreseen end of March 2005, and assembly in the Naka facility during summer 2005. Testing programme at JAERI should start end of 2005. 2004 ACTIVITIES For 2004, our activities were reduced because of the delay taken in the fabrication of the PFCI at Tesla (UK). The model developed by CEA to predict joint performance under transient (code JUST) was applied to the study of the behaviour of the PFCI intermediate joint in the reference pulse field scenario. The JUST code is now considered as one of the tools to be used for the analysis of the PFCI test results [1]. The reference pulse field scenario consists of a discharge of the CSMC from 21.2 kA to zero, with a decay time constant of 20 s, without current in the PFCI. Figure 1 shows the power dissipated in the intermediate joint during the discharge, with a separation of the contributions due to the radial field variation and to the axial field variation. It can be seen in this figure that the two contributions are almost equivalent in term of peak power which is quite different in the ITER PF6 joints due to a relative higher radial field variation.
0
5
10
15
20
25
30
0 10 20 30 40 50 60Time (s)
Loss
pow
er (W
/join
t)
WzWrWtot
Figure 1 : Computed loss power in the ITER PFCI intermediate joint during a CSMC discharge from 21.2 kA
within 20 s: contribution of radial field variation (Wr), contribution of axial field variation (Wz),
total loss power (Wtot)
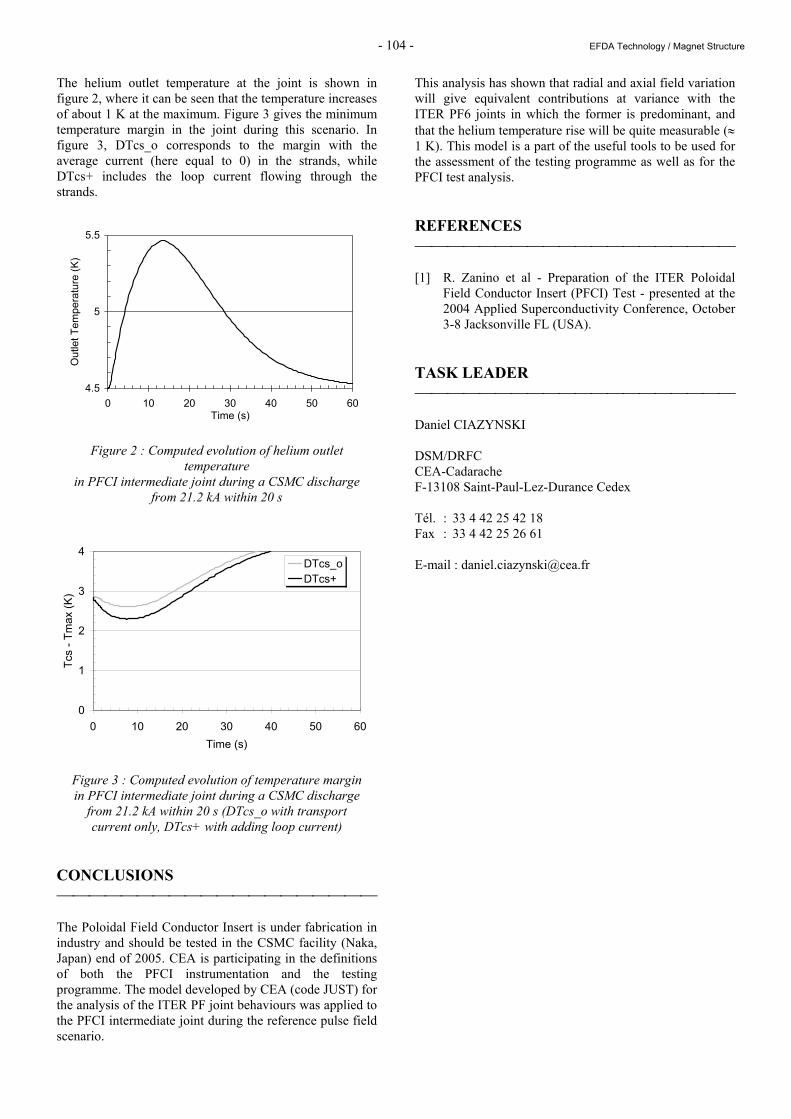
- 104 - EFDA Technology / Magnet Structure
The helium outlet temperature at the joint is shown in figure 2, where it can be seen that the temperature increases of about 1 K at the maximum. Figure 3 gives the minimum temperature margin in the joint during this scenario. In figure 3, DTcs_o corresponds to the margin with the average current (here equal to 0) in the strands, while DTcs+ includes the loop current flowing through the strands.
4.5
5
5.5
0 10 20 30 40 50 60Time (s)
Out
let T
empe
ratu
re (K
)
Figure 2 : Computed evolution of helium outlet temperature
in PFCI intermediate joint during a CSMC discharge from 21.2 kA within 20 s
0
1
2
3
4
0 10 20 30 40 50 60Time (s)
Tcs
- Tm
ax (K
)
DTcs_oDTcs+
Figure 3 : Computed evolution of temperature margin in PFCI intermediate joint during a CSMC discharge
from 21.2 kA within 20 s (DTcs_o with transport current only, DTcs+ with adding loop current)
CONCLUSIONS The Poloidal Field Conductor Insert is under fabrication in industry and should be tested in the CSMC facility (Naka, Japan) end of 2005. CEA is participating in the definitions of both the PFCI instrumentation and the testing programme. The model developed by CEA (code JUST) for the analysis of the ITER PF joint behaviours was applied to the PFCI intermediate joint during the reference pulse field scenario.
This analysis has shown that radial and axial field variation will give equivalent contributions at variance with the ITER PF6 joints in which the former is predominant, and that the helium temperature rise will be quite measurable (≈ 1 K). This model is a part of the useful tools to be used for the assessment of the testing programme as well as for the PFCI test analysis. REFERENCES [1] R. Zanino et al - Preparation of the ITER Poloidal
Field Conductor Insert (PFCI) Test - presented at the 2004 Applied Superconductivity Conference, October 3-8 Jacksonville FL (USA).
TASK LEADER Daniel CIAZYNSKI DSM/DRFC CEA-Cadarache F-13108 Saint-Paul-Lez-Durance Cedex Tél. : 33 4 42 25 42 18 Fax : 33 4 42 25 26 61 E-mail : [email protected]
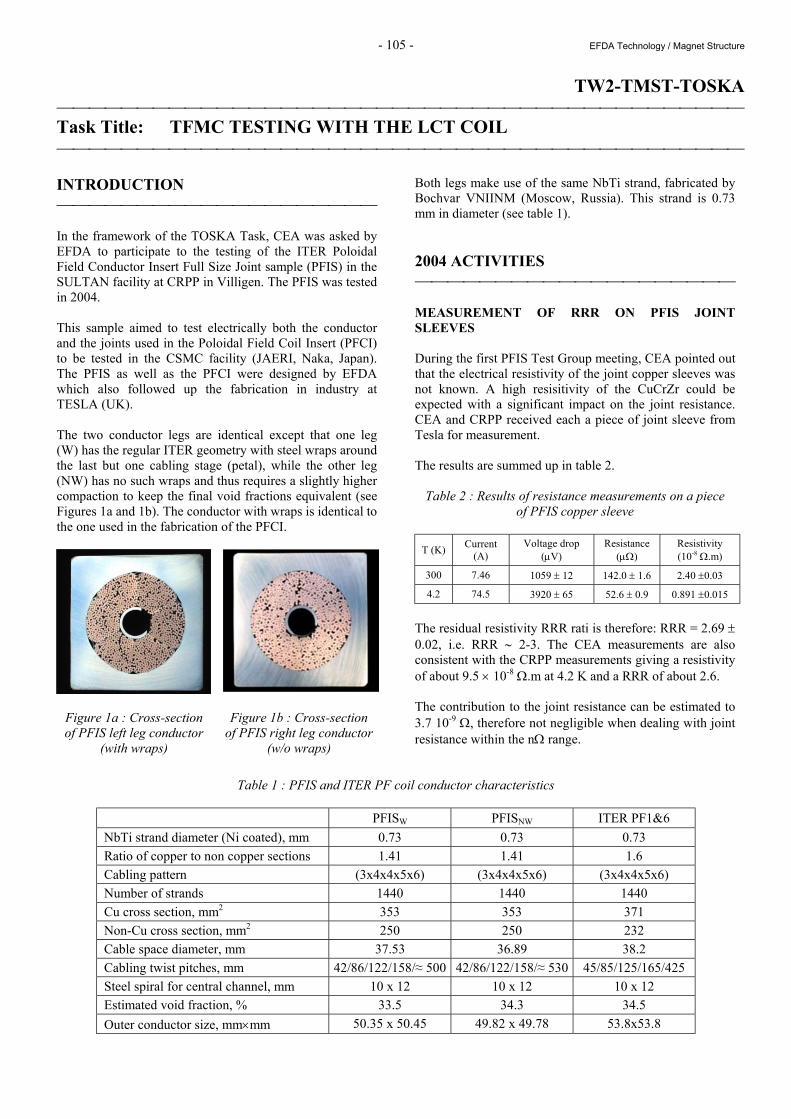
- 105 - EFDA Technology / Magnet Structure
TW2-TMST-TOSKA Task Title: TFMC TESTING WITH THE LCT COIL INTRODUCTION In the framework of the TOSKA Task, CEA was asked by EFDA to participate to the testing of the ITER Poloidal Field Conductor Insert Full Size Joint sample (PFIS) in the SULTAN facility at CRPP in Villigen. The PFIS was tested in 2004. This sample aimed to test electrically both the conductor and the joints used in the Poloidal Field Coil Insert (PFCI) to be tested in the CSMC facility (JAERI, Naka, Japan). The PFIS as well as the PFCI were designed by EFDA which also followed up the fabrication in industry at TESLA (UK). The two conductor legs are identical except that one leg (W) has the regular ITER geometry with steel wraps around the last but one cabling stage (petal), while the other leg (NW) has no such wraps and thus requires a slightly higher compaction to keep the final void fractions equivalent (see Figures 1a and 1b). The conductor with wraps is identical to the one used in the fabrication of the PFCI.
Figure 1a : Cross-section of PFIS left leg conductor
(with wraps)
Figure 1b : Cross-section of PFIS right leg conductor
(w/o wraps)
Both legs make use of the same NbTi strand, fabricated by Bochvar VNIINM (Moscow, Russia). This strand is 0.73 mm in diameter (see table 1). 2004 ACTIVITIES MEASUREMENT OF RRR ON PFIS JOINT SLEEVES During the first PFIS Test Group meeting, CEA pointed out that the electrical resistivity of the joint copper sleeves was not known. A high resisitivity of the CuCrZr could be expected with a significant impact on the joint resistance. CEA and CRPP received each a piece of joint sleeve from Tesla for measurement. The results are summed up in table 2.
Table 2 : Results of resistance measurements on a piece of PFIS copper sleeve
T (K) Current (A)
Voltage drop (µV)
Resistance (µΩ)
Resistivity (10-8 Ω.m)
300 7.46 1059 ± 12 142.0 ± 1.6 2.40 ±0.03
4.2 74.5 3920 ± 65 52.6 ± 0.9 0.891 ±0.015
The residual resistivity RRR rati is therefore: RRR = 2.69 ± 0.02, i.e. RRR ∼ 2-3. The CEA measurements are also consistent with the CRPP measurements giving a resistivity of about 9.5 × 10⁻⁸ Ω.m at 4.2 K and a RRR of about 2.6. The contribution to the joint resistance can be estimated to 3.7 10-9 Ω, therefore not negligible when dealing with joint resistance within the nΩ range.
Table 1 : PFIS and ITER PF coil conductor characteristics
PFISW PFISNW ITER PF1&6
NbTi strand diameter (Ni coated), mm 0.73 0.73 0.73 Ratio of copper to non copper sections 1.41 1.41 1.6 Cabling pattern (3x4x4x5x6) (3x4x4x5x6) (3x4x4x5x6) Number of strands 1440 1440 1440 Cu cross section, mm2 353 353 371 Non-Cu cross section, mm2 250 250 232 Cable space diameter, mm 37.53 36.89 38.2 Cabling twist pitches, mm 42/86/122/158/≈ 500 42/86/122/158/≈ 530 45/85/125/165/425 Steel spiral for central channel, mm 10 x 12 10 x 12 10 x 12 Estimated void fraction, % 33.5 34.3 34.5 Outer conductor size, mm×mm 50.35 x 50.45 49.82 x 49.78 53.8x53.8
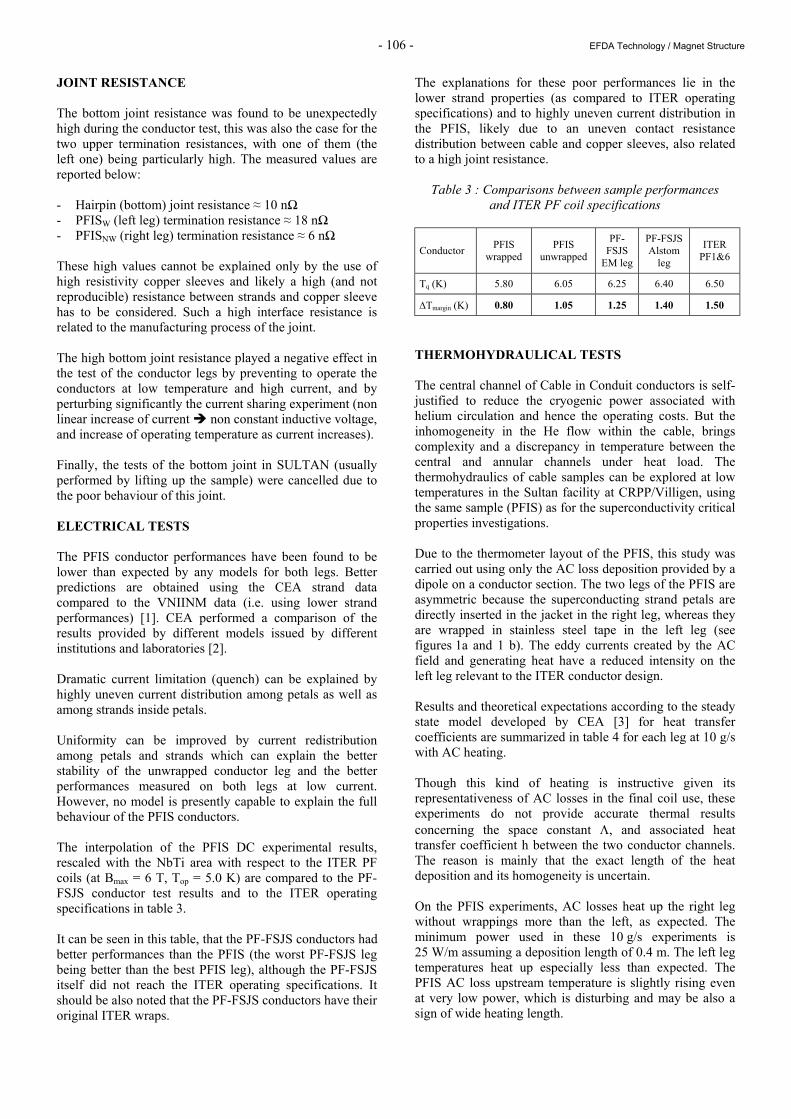
- 106 - EFDA Technology / Magnet Structure
JOINT RESISTANCE The bottom joint resistance was found to be unexpectedly high during the conductor test, this was also the case for the two upper termination resistances, with one of them (the left one) being particularly high. The measured values are reported below: - Hairpin (bottom) joint resistance ≈ 10 nΩ - PFISW (left leg) termination resistance ≈ 18 nΩ - PFISNW (right leg) termination resistance ≈ 6 nΩ These high values cannot be explained only by the use of high resistivity copper sleeves and likely a high (and not reproducible) resistance between strands and copper sleeve has to be considered. Such a high interface resistance is related to the manufacturing process of the joint. The high bottom joint resistance played a negative effect in the test of the conductor legs by preventing to operate the conductors at low temperature and high current, and by perturbing significantly the current sharing experiment (non linear increase of current non constant inductive voltage, and increase of operating temperature as current increases). Finally, the tests of the bottom joint in SULTAN (usually performed by lifting up the sample) were cancelled due to the poor behaviour of this joint. ELECTRICAL TESTS The PFIS conductor performances have been found to be lower than expected by any models for both legs. Better predictions are obtained using the CEA strand data compared to the VNIINM data (i.e. using lower strand performances) [1]. CEA performed a comparison of the results provided by different models issued by different institutions and laboratories [2]. Dramatic current limitation (quench) can be explained by highly uneven current distribution among petals as well as among strands inside petals. Uniformity can be improved by current redistribution among petals and strands which can explain the better stability of the unwrapped conductor leg and the better performances measured on both legs at low current. However, no model is presently capable to explain the full behaviour of the PFIS conductors. The interpolation of the PFIS DC experimental results, rescaled with the NbTi area with respect to the ITER PF coils (at Bmax = 6 T, Top = 5.0 K) are compared to the PF-FSJS conductor test results and to the ITER operating specifications in table 3. It can be seen in this table, that the PF-FSJS conductors had better performances than the PFIS (the worst PF-FSJS leg being better than the best PFIS leg), although the PF-FSJS itself did not reach the ITER operating specifications. It should be also noted that the PF-FSJS conductors have their original ITER wraps.
The explanations for these poor performances lie in the lower strand properties (as compared to ITER operating specifications) and to highly uneven current distribution in the PFIS, likely due to an uneven contact resistance distribution between cable and copper sleeves, also related to a high joint resistance.
Table 3 : Comparisons between sample performances and ITER PF coil specifications
Conductor PFIS wrapped
PFIS unwrapped
PF-FSJS
EM leg
PF-FSJS Alstom
leg
ITER PF1&6
Tq (K) 5.80 6.05 6.25 6.40 6.50
∆Tmargin (K) 0.80 1.05 1.25 1.40 1.50
THERMOHYDRAULICAL TESTS The central channel of Cable in Conduit conductors is self-justified to reduce the cryogenic power associated with helium circulation and hence the operating costs. But the inhomogeneity in the He flow within the cable, brings complexity and a discrepancy in temperature between the central and annular channels under heat load. The thermohydraulics of cable samples can be explored at low temperatures in the Sultan facility at CRPP/Villigen, using the same sample (PFIS) as for the superconductivity critical properties investigations. Due to the thermometer layout of the PFIS, this study was carried out using only the AC loss deposition provided by a dipole on a conductor section. The two legs of the PFIS are asymmetric because the superconducting strand petals are directly inserted in the jacket in the right leg, whereas they are wrapped in stainless steel tape in the left leg (see figures 1a and 1 b). The eddy currents created by the AC field and generating heat have a reduced intensity on the left leg relevant to the ITER conductor design. Results and theoretical expectations according to the steady state model developed by CEA [3] for heat transfer coefficients are summarized in table 4 for each leg at 10 g/s with AC heating. Though this kind of heating is instructive given its representativeness of AC losses in the final coil use, these experiments do not provide accurate thermal results concerning the space constant Λ, and associated heat transfer coefficient h between the two conductor channels. The reason is mainly that the exact length of the heat deposition and its homogeneity is uncertain. On the PFIS experiments, AC losses heat up the right leg without wrappings more than the left, as expected. The minimum power used in these 10 g/s experiments is 25 W/m assuming a deposition length of 0.4 m. The left leg temperatures heat up especially less than expected. The PFIS AC loss upstream temperature is slightly rising even at very low power, which is disturbing and may be also a sign of wide heating length.
- 107 - EFDA Technology / Magnet Structure
Table 4 : PFIS AC power, characteristic length Λ and resulting heat transfers at 10g/s
Expected values
Λ=0.48 m h=418 W/m2K hp=13.1 W/mK
AC frequency 4 Hz 3 Hz 2 Hz 1 Hz
Left leg W= (wraps) Λ= h=
37 W 0.7 m
285 W/m2K
25 W 0.75 m
265 W/m2K
15 W 0.8 m
250 W/m2K
10 W 1 m
200 W/m2K
Right leg W= (no wraps)Λ= h=
54 W 0.35 m
570 W/m2K
36 W 0.35 m
570 W/m2K
21 W 0.4 m
500 W/m2K
14 W 0.4 m
500 W/m2K
It is not possible to experimentally evaluate the respective channel mass flow rates. We can evaluate channel mass flow balance, but there remains some uncertainty in the empirical law used. Similarly, it is not possible to evaluate mass exchange between annular and central channels. Of course the respective mass flows strongly influence physical phenomena and experimental evaluation of heat transfer rates. The next conductor tests in Sultan will be instrumented with an annular heater on the conductor and thermometers in an appropriate way similar to the PF-FSJS configuration in order to have enough close downstream data and derive thermal parameters in a more accurate way. CONCLUSION In the framework of the TW2-TMST-TOSKA task, CEA has participated to the tests and the analysis of the PF Insert Sample (PFIS). Final report has been delivered to EFDA [4]. Two campaigns have been devoted to these tests: one for electrical tests and the other for thermohydraulical tests. The first conclusion of these tests is that the measured joint electrical resistance exhibits a very high value (10 nΩ), which is far above that measured for the PF-FSJS (1.6 nΩ), previous NbTi joint sample developed in Europe in the framework of Task M50. Consequently, the ITER specification (< 2 nΩ) is not met and the PFIS joint design is not qualified. The poor electrical performances in comparison with expectation were found partly due to the lower strand properties and partly due to highly uneven current distribution induced at the level of the joint. As for the thermohydraulical tests, a simple method for estimation of the heat exchange between central channel and annular region has been defined by CEA. This method is based on the observation of the temperature distribution downstream during steady state heating of a piece of conductor. This study delivered heat exchange coefficients which are acceptable for ITER conductors but with insufficient accuracy. This has to be improved by testing further samples with extended instrumentation.
REFERENCES [1] L. Zani et al. - Jc(B,T) characterization of NbTi
strands used in ITER PF-relevant insert and full-scale sample - to be published in IEEE Trans. Appl. Supercond., June 2005.
[2] D. Ciazynski et al. - DC Performances of ITER NbTi
Conductors: Models vs. Measurements - to be published in IEEE Trans. Appl. Supercond., June 2005.
[3] S. Nicollet et al. - Evaluation of the ITER cable-in-
conduit conductor heat transfer - presented at 20th Int. Cryo. Eng. Conf. Beijing, 2004.
[4] J.L Duchateau et al. - Task TW2-TMST-TOSKA :
Deliverable 4 Final report on the testing of a full size joint sample - February 2005 Internal CEA Note AIM/NTT- 2005.002.
TASK LEADER J.L. DUCHATEAU DSM/DRFC/STEP CEA-Cadarache F-13108 Saint-Paul-Lez-Durance Cedex Tél. : 33 4 42 25 49 67 Fax : 33 4 42 25 26 61 E-mail : [email protected]

- 108 - EFDA Technology / Magnet Structure
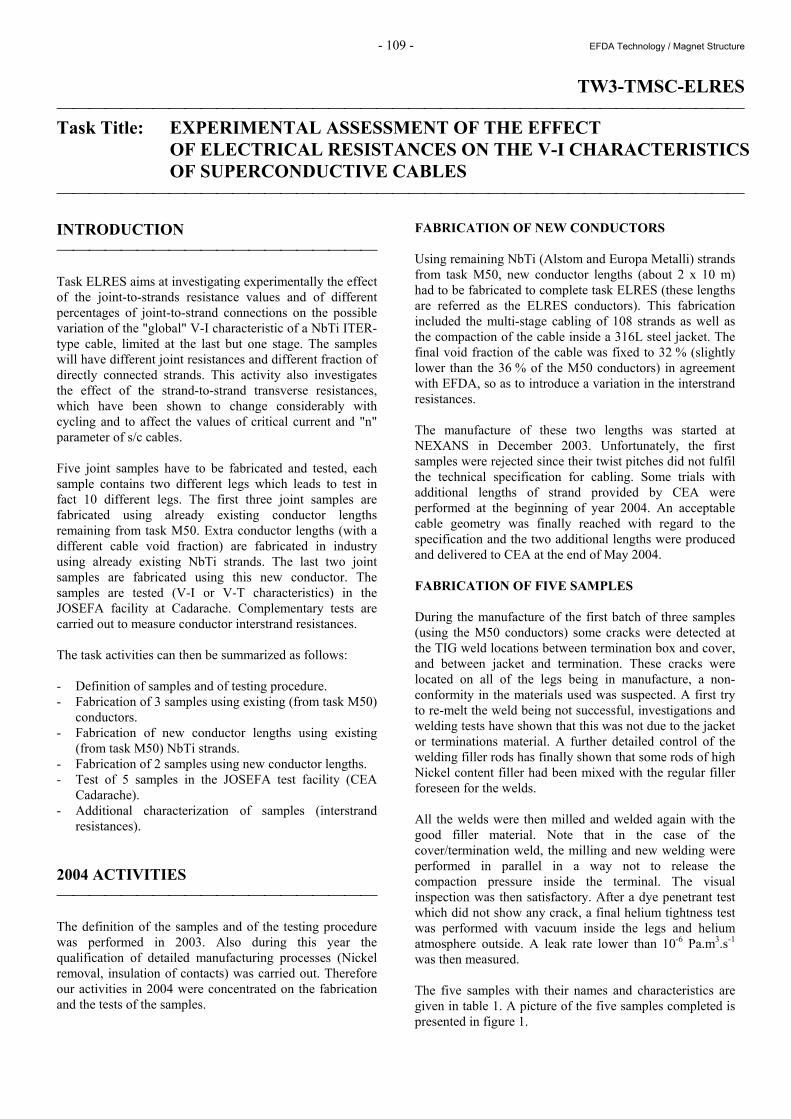
- 109 - EFDA Technology / Magnet Structure
TW3-TMSC-ELRES Task Title: EXPERIMENTAL ASSESSMENT OF THE EFFECT
OF ELECTRICAL RESISTANCES ON THE V-I CHARACTERISTICS OF SUPERCONDUCTIVE CABLES
INTRODUCTION Task ELRES aims at investigating experimentally the effect of the joint-to-strands resistance values and of different percentages of joint-to-strand connections on the possible variation of the "global" V-I characteristic of a NbTi ITER-type cable, limited at the last but one stage. The samples will have different joint resistances and different fraction of directly connected strands. This activity also investigates the effect of the strand-to-strand transverse resistances, which have been shown to change considerably with cycling and to affect the values of critical current and "n" parameter of s/c cables. Five joint samples have to be fabricated and tested, each sample contains two different legs which leads to test in fact 10 different legs. The first three joint samples are fabricated using already existing conductor lengths remaining from task M50. Extra conductor lengths (with a different cable void fraction) are fabricated in industry using already existing NbTi strands. The last two joint samples are fabricated using this new conductor. The samples are tested (V-I or V-T characteristics) in the JOSEFA facility at Cadarache. Complementary tests are carried out to measure conductor interstrand resistances. The task activities can then be summarized as follows: - Definition of samples and of testing procedure. - Fabrication of 3 samples using existing (from task M50)
conductors. - Fabrication of new conductor lengths using existing
(from task M50) NbTi strands. - Fabrication of 2 samples using new conductor lengths. - Test of 5 samples in the JOSEFA test facility (CEA
Cadarache). - Additional characterization of samples (interstrand
resistances). 2004 ACTIVITIES The definition of the samples and of the testing procedure was performed in 2003. Also during this year the qualification of detailed manufacturing processes (Nickel removal, insulation of contacts) was carried out. Therefore our activities in 2004 were concentrated on the fabrication and the tests of the samples.
FABRICATION OF NEW CONDUCTORS Using remaining NbTi (Alstom and Europa Metalli) strands from task M50, new conductor lengths (about 2 x 10 m) had to be fabricated to complete task ELRES (these lengths are referred as the ELRES conductors). This fabrication included the multi-stage cabling of 108 strands as well as the compaction of the cable inside a 316L steel jacket. The final void fraction of the cable was fixed to 32 % (slightly lower than the 36 % of the M50 conductors) in agreement with EFDA, so as to introduce a variation in the interstrand resistances. The manufacture of these two lengths was started at NEXANS in December 2003. Unfortunately, the first samples were rejected since their twist pitches did not fulfil the technical specification for cabling. Some trials with additional lengths of strand provided by CEA were performed at the beginning of year 2004. An acceptable cable geometry was finally reached with regard to the specification and the two additional lengths were produced and delivered to CEA at the end of May 2004. FABRICATION OF FIVE SAMPLES During the manufacture of the first batch of three samples (using the M50 conductors) some cracks were detected at the TIG weld locations between termination box and cover, and between jacket and termination. These cracks were located on all of the legs being in manufacture, a non-conformity in the materials used was suspected. A first try to re-melt the weld being not successful, investigations and welding tests have shown that this was not due to the jacket or terminations material. A further detailed control of the welding filler rods has finally shown that some rods of high Nickel content filler had been mixed with the regular filler foreseen for the welds. All the welds were then milled and welded again with the good filler material. Note that in the case of the cover/termination weld, the milling and new welding were performed in parallel in a way not to release the compaction pressure inside the terminal. The visual inspection was then satisfactory. After a dye penetrant test which did not show any crack, a final helium tightness test was performed with vacuum inside the legs and helium atmosphere outside. A leak rate lower than 10-6 Pa.m3.s-1 was then measured. The five samples with their names and characteristics are given in table 1. A picture of the five samples completed is presented in figure 1.
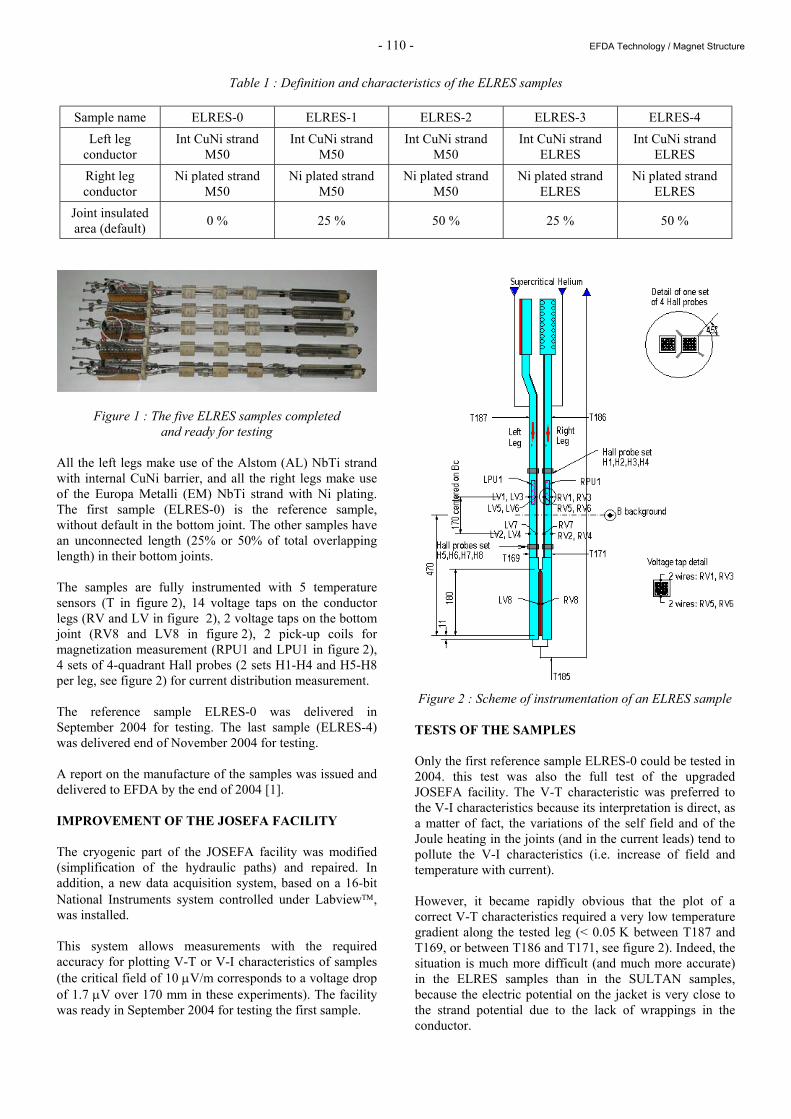
- 110 - EFDA Technology / Magnet Structure
Table 1 : Definition and characteristics of the ELRES samples
Sample name ELRES-0 ELRES-1 ELRES-2 ELRES-3 ELRES-4 Left leg
conductor Int CuNi strand
M50 Int CuNi strand
M50 Int CuNi strand
M50 Int CuNi strand
ELRES Int CuNi strand
ELRES Right leg conductor
Ni plated strand M50
Ni plated strand M50
Ni plated strand M50
Ni plated strand ELRES
Ni plated strand ELRES
Joint insulated area (default) 0 % 25 % 50 % 25 % 50 %
Figure 1 : The five ELRES samples completed and ready for testing
All the left legs make use of the Alstom (AL) NbTi strand with internal CuNi barrier, and all the right legs make use of the Europa Metalli (EM) NbTi strand with Ni plating. The first sample (ELRES-0) is the reference sample, without default in the bottom joint. The other samples have an unconnected length (25% or 50% of total overlapping length) in their bottom joints. The samples are fully instrumented with 5 temperature sensors (T in figure 2), 14 voltage taps on the conductor legs (RV and LV in figure 2), 2 voltage taps on the bottom joint (RV8 and LV8 in figure 2), 2 pick-up coils for magnetization measurement (RPU1 and LPU1 in figure 2), 4 sets of 4-quadrant Hall probes (2 sets H1-H4 and H5-H8 per leg, see figure 2) for current distribution measurement. The reference sample ELRES-0 was delivered in September 2004 for testing. The last sample (ELRES-4) was delivered end of November 2004 for testing. A report on the manufacture of the samples was issued and delivered to EFDA by the end of 2004 [1]. IMPROVEMENT OF THE JOSEFA FACILITY The cryogenic part of the JOSEFA facility was modified (simplification of the hydraulic paths) and repaired. In addition, a new data acquisition system, based on a 16-bit National Instruments system controlled under Labview, was installed. This system allows measurements with the required accuracy for plotting V-T or V-I characteristics of samples (the critical field of 10 µV/m corresponds to a voltage drop of 1.7 µV over 170 mm in these experiments). The facility was ready in September 2004 for testing the first sample.
Figure 2 : Scheme of instrumentation of an ELRES sample
TESTS OF THE SAMPLES Only the first reference sample ELRES-0 could be tested in 2004. this test was also the full test of the upgraded JOSEFA facility. The V-T characteristic was preferred to the V-I characteristics because its interpretation is direct, as a matter of fact, the variations of the self field and of the Joule heating in the joints (and in the current leads) tend to pollute the V-I characteristics (i.e. increase of field and temperature with current). However, it became rapidly obvious that the plot of a correct V-T characteristics required a very low temperature gradient along the tested leg (< 0.05 K between T187 and T169, or between T186 and T171, see figure 2). Indeed, the situation is much more difficult (and much more accurate) in the ELRES samples than in the SULTAN samples, because the electric potential on the jacket is very close to the strand potential due to the lack of wrappings in the conductor.
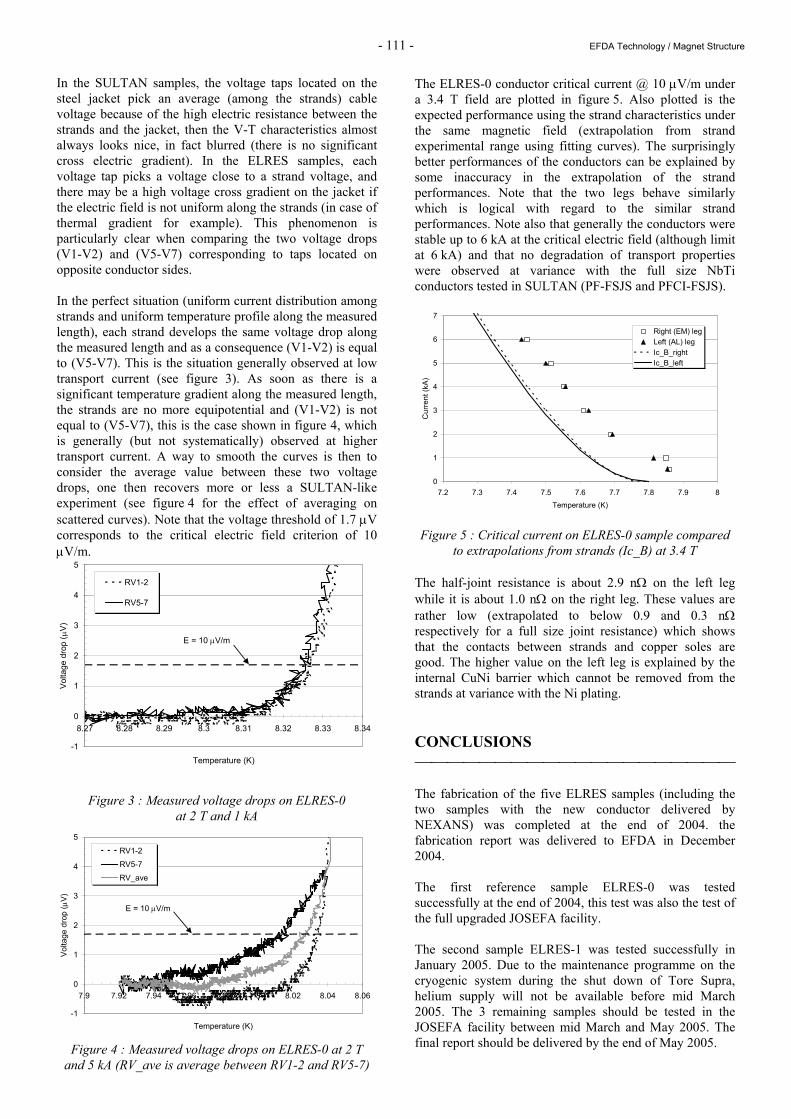
- 111 - EFDA Technology / Magnet Structure
In the SULTAN samples, the voltage taps located on the steel jacket pick an average (among the strands) cable voltage because of the high electric resistance between the strands and the jacket, then the V-T characteristics almost always looks nice, in fact blurred (there is no significant cross electric gradient). In the ELRES samples, each voltage tap picks a voltage close to a strand voltage, and there may be a high voltage cross gradient on the jacket if the electric field is not uniform along the strands (in case of thermal gradient for example). This phenomenon is particularly clear when comparing the two voltage drops (V1-V2) and (V5-V7) corresponding to taps located on opposite conductor sides. In the perfect situation (uniform current distribution among strands and uniform temperature profile along the measured length), each strand develops the same voltage drop along the measured length and as a consequence (V1-V2) is equal to (V5-V7). This is the situation generally observed at low transport current (see figure 3). As soon as there is a significant temperature gradient along the measured length, the strands are no more equipotential and (V1-V2) is not equal to (V5-V7), this is the case shown in figure 4, which is generally (but not systematically) observed at higher transport current. A way to smooth the curves is then to consider the average value between these two voltage drops, one then recovers more or less a SULTAN-like experiment (see figure 4 for the effect of averaging on scattered curves). Note that the voltage threshold of 1.7 µV corresponds to the critical electric field criterion of 10 µV/m.
Figure 3 : Measured voltage drops on ELRES-0 at 2 T and 1 kA
Figure 4 : Measured voltage drops on ELRES-0 at 2 T and 5 kA (RV_ave is average between RV1-2 and RV5-7)
The ELRES-0 conductor critical current @ 10 µV/m under a 3.4 T field are plotted in figure 5. Also plotted is the expected performance using the strand characteristics under the same magnetic field (extrapolation from strand experimental range using fitting curves). The surprisingly better performances of the conductors can be explained by some inaccuracy in the extrapolation of the strand performances. Note that the two legs behave similarly which is logical with regard to the similar strand performances. Note also that generally the conductors were stable up to 6 kA at the critical electric field (although limit at 6 kA) and that no degradation of transport properties were observed at variance with the full size NbTi conductors tested in SULTAN (PF-FSJS and PFCI-FSJS). Figure 5 : Critical current on ELRES-0 sample compared
to extrapolations from strands (Ic_B) at 3.4 T The half-joint resistance is about 2.9 nΩ on the left leg while it is about 1.0 nΩ on the right leg. These values are rather low (extrapolated to below 0.9 and 0.3 nΩ respectively for a full size joint resistance) which shows that the contacts between strands and copper soles are good. The higher value on the left leg is explained by the internal CuNi barrier which cannot be removed from the strands at variance with the Ni plating. CONCLUSIONS The fabrication of the five ELRES samples (including the two samples with the new conductor delivered by NEXANS) was completed at the end of 2004. the fabrication report was delivered to EFDA in December 2004. The first reference sample ELRES-0 was tested successfully at the end of 2004, this test was also the test of the full upgraded JOSEFA facility. The second sample ELRES-1 was tested successfully in January 2005. Due to the maintenance programme on the cryogenic system during the shut down of Tore Supra, helium supply will not be available before mid March 2005. The 3 remaining samples should be tested in the JOSEFA facility between mid March and May 2005. The final report should be delivered by the end of May 2005.
0
1
2
3
4
5
6
7
7.2 7.3 7.4 7.5 7.6 7.7 7.8 7.9 8Temperature (K)
Cur
rent
(kA)
Right (EM) legLeft (AL) legIc_B_rightIc_B_left
-1
0
1
2
3
4
5
8.27 8.28 8.29 8.3 8.31 8.32 8.33 8.34
Temperature (K)
Volta
ge d
rop
( µV)
RV1-2
RV5-7
E = 10 µV/m
-1
0
1
2
3
4
5
7.9 7.92 7.94 7.96 7.98 8 8.02 8.04 8.06
Temperature (K)
Volta
ge d
rop
( µV)
RV1-2RV5-7RV_ave
E = 10 µV/m
- 112 - EFDA Technology / Magnet Structure
REPORTS AND PUBLICATIONS [1] P. DECOOL and H. CLOEZ - Task TW3-TMSC-
ELRES : Milestone #2 Manufacturing of Samples (Cable and Joints) - CEA Note DRFC (STEP/GCRY), AIM/NTT-2004.029, December 15, 2004.
TASK LEADER Daniel CIAZYNSKI DSM/DRFC CEA-Cadarache F-13108 Saint-Paul-Lez-Durance Cedex Tél. : 33 4 42 25 42 18 Fax : 33 4 42 25 26 61 E-mail : [email protected]
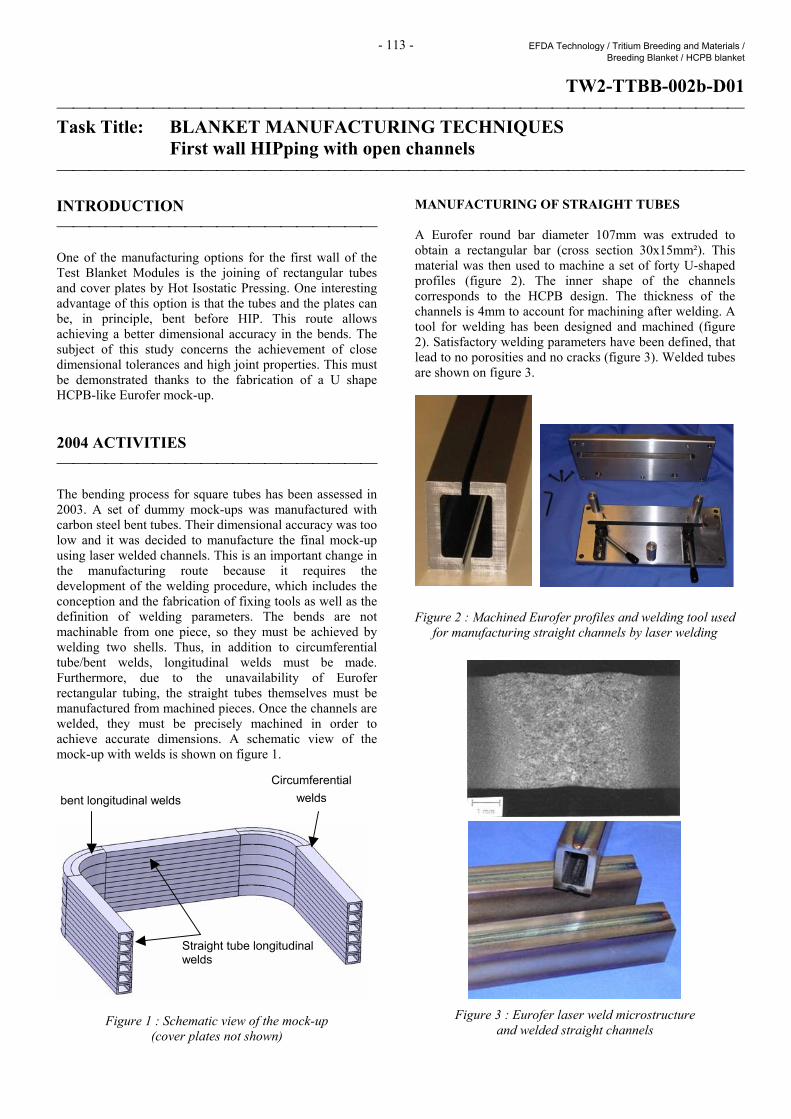
- 113 - EFDA Technology / Tritium Breeding and Materials / Breeding Blanket / HCPB blanket
TW2-TTBB-002b-D01 Task Title: BLANKET MANUFACTURING TECHNIQUES First wall HIPping with open channels INTRODUCTION One of the manufacturing options for the first wall of the Test Blanket Modules is the joining of rectangular tubes and cover plates by Hot Isostatic Pressing. One interesting advantage of this option is that the tubes and the plates can be, in principle, bent before HIP. This route allows achieving a better dimensional accuracy in the bends. The subject of this study concerns the achievement of close dimensional tolerances and high joint properties. This must be demonstrated thanks to the fabrication of a U shape HCPB-like Eurofer mock-up. 2004 ACTIVITIES The bending process for square tubes has been assessed in 2003. A set of dummy mock-ups was manufactured with carbon steel bent tubes. Their dimensional accuracy was too low and it was decided to manufacture the final mock-up using laser welded channels. This is an important change in the manufacturing route because it requires the development of the welding procedure, which includes the conception and the fabrication of fixing tools as well as the definition of welding parameters. The bends are not machinable from one piece, so they must be achieved by welding two shells. Thus, in addition to circumferential tube/bent welds, longitudinal welds must be made. Furthermore, due to the unavailability of Eurofer rectangular tubing, the straight tubes themselves must be manufactured from machined pieces. Once the channels are welded, they must be precisely machined in order to achieve accurate dimensions. A schematic view of the mock-up with welds is shown on figure 1.
Figure 1 : Schematic view of the mock-up (cover plates not shown)
MANUFACTURING OF STRAIGHT TUBES A Eurofer round bar diameter 107mm was extruded to obtain a rectangular bar (cross section 30x15mm²). This material was then used to machine a set of forty U-shaped profiles (figure 2). The inner shape of the channels corresponds to the HCPB design. The thickness of the channels is 4mm to account for machining after welding. A tool for welding has been designed and machined (figure 2). Satisfactory welding parameters have been defined, that lead to no porosities and no cracks (figure 3). Welded tubes are shown on figure 3. Figure 2 : Machined Eurofer profiles and welding tool used
for manufacturing straight channels by laser welding
Figure 3 : Eurofer laser weld microstructure and welded straight channels
Straight tube longitudinal welds
bent longitudinal welds Circumferential
welds
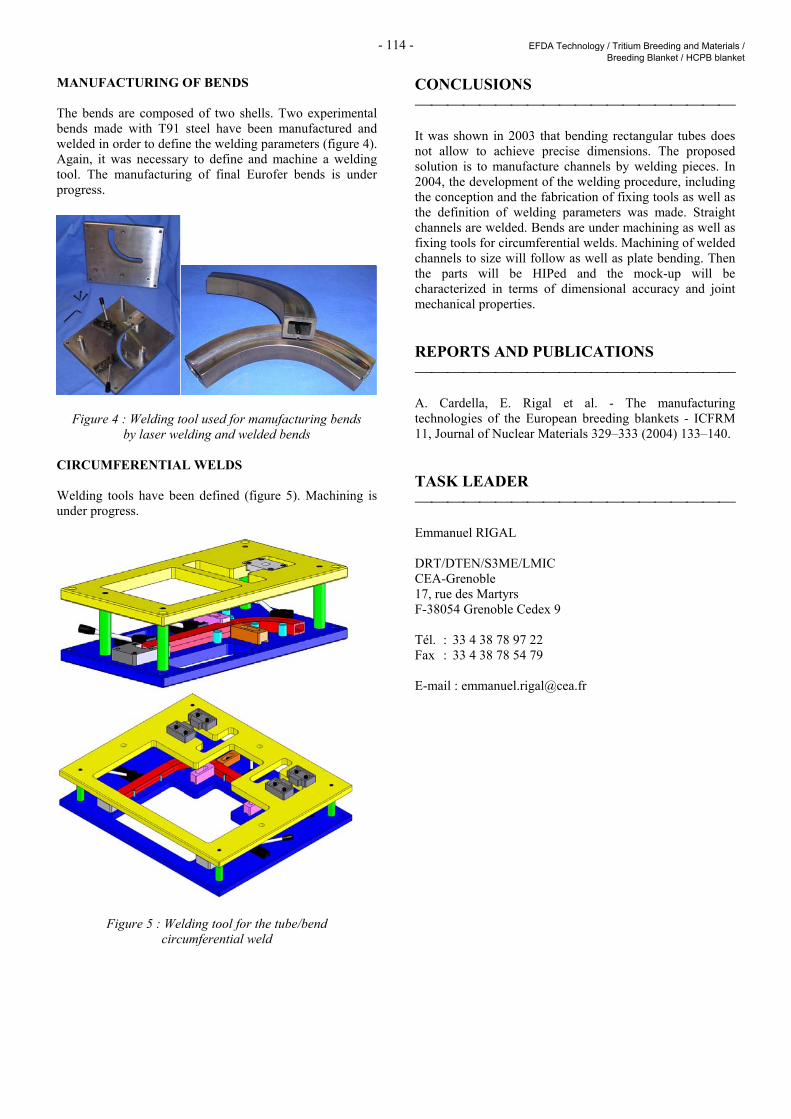
- 114 - EFDA Technology / Tritium Breeding and Materials / Breeding Blanket / HCPB blanket
MANUFACTURING OF BENDS The bends are composed of two shells. Two experimental bends made with T91 steel have been manufactured and welded in order to define the welding parameters (figure 4). Again, it was necessary to define and machine a welding tool. The manufacturing of final Eurofer bends is under progress.
Figure 4 : Welding tool used for manufacturing bends by laser welding and welded bends
CIRCUMFERENTIAL WELDS Welding tools have been defined (figure 5). Machining is under progress.
Figure 5 : Welding tool for the tube/bend circumferential weld
CONCLUSIONS It was shown in 2003 that bending rectangular tubes does not allow to achieve precise dimensions. The proposed solution is to manufacture channels by welding pieces. In 2004, the development of the welding procedure, including the conception and the fabrication of fixing tools as well as the definition of welding parameters was made. Straight channels are welded. Bends are under machining as well as fixing tools for circumferential welds. Machining of welded channels to size will follow as well as plate bending. Then the parts will be HIPed and the mock-up will be characterized in terms of dimensional accuracy and joint mechanical properties. REPORTS AND PUBLICATIONS A. Cardella, E. Rigal et al. - The manufacturing technologies of the European breeding blankets - ICFRM 11, Journal of Nuclear Materials 329–333 (2004) 133–140. TASK LEADER Emmanuel RIGAL DRT/DTEN/S3ME/LMIC CEA-Grenoble 17, rue des Martyrs F-38054 Grenoble Cedex 9 Tél. : 33 4 38 78 97 22 Fax : 33 4 38 78 54 79 E-mail : [email protected]
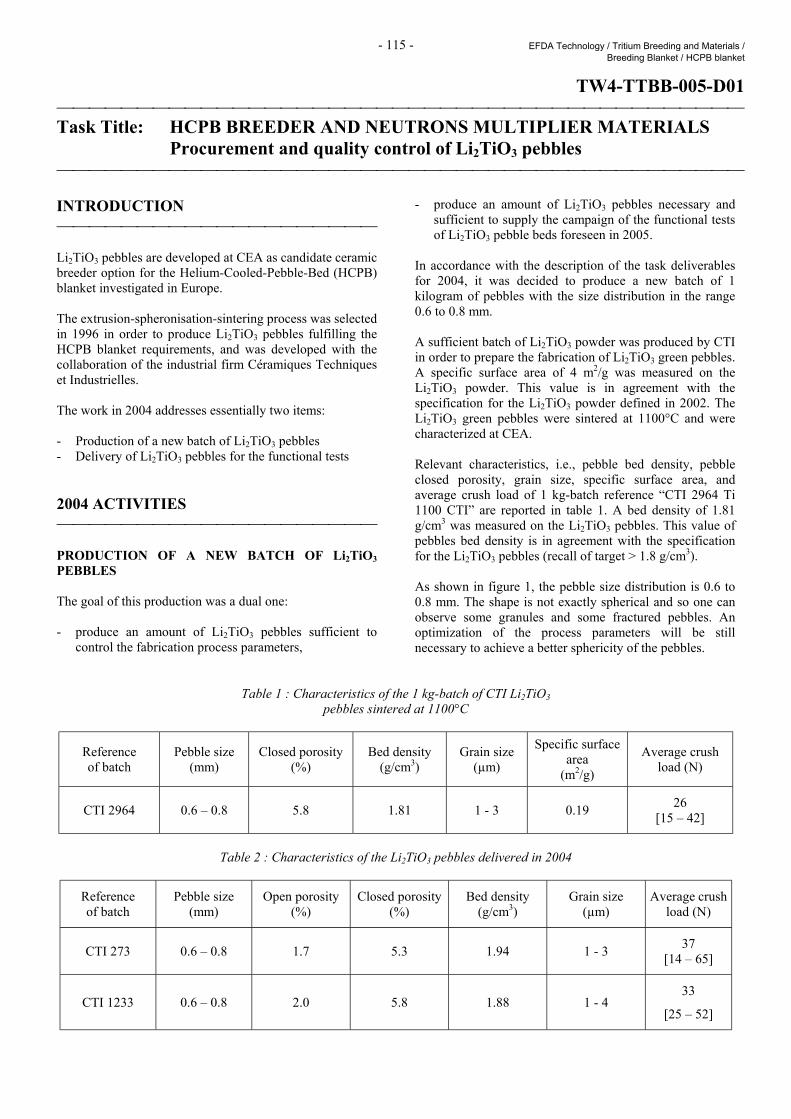
- 115 - EFDA Technology / Tritium Breeding and Materials / Breeding Blanket / HCPB blanket
TW4-TTBB-005-D01 Task Title: HCPB BREEDER AND NEUTRONS MULTIPLIER MATERIALS Procurement and quality control of Li2TiO3 pebbles INTRODUCTION Li2TiO3 pebbles are developed at CEA as candidate ceramic breeder option for the Helium-Cooled-Pebble-Bed (HCPB) blanket investigated in Europe. The extrusion-spheronisation-sintering process was selected in 1996 in order to produce Li2TiO3 pebbles fulfilling the HCPB blanket requirements, and was developed with the collaboration of the industrial firm Céramiques Techniques et Industrielles. The work in 2004 addresses essentially two items: - Production of a new batch of Li2TiO3 pebbles - Delivery of Li2TiO3 pebbles for the functional tests 2004 ACTIVITIES PRODUCTION OF A NEW BATCH OF Li2TiO3 PEBBLES The goal of this production was a dual one: - produce an amount of Li2TiO3 pebbles sufficient to
control the fabrication process parameters,
- produce an amount of Li2TiO3 pebbles necessary and sufficient to supply the campaign of the functional tests of Li2TiO3 pebble beds foreseen in 2005.
In accordance with the description of the task deliverables for 2004, it was decided to produce a new batch of 1 kilogram of pebbles with the size distribution in the range 0.6 to 0.8 mm. A sufficient batch of Li2TiO3 powder was produced by CTI in order to prepare the fabrication of Li2TiO3 green pebbles. A specific surface area of 4 m2/g was measured on the Li2TiO3 powder. This value is in agreement with the specification for the Li2TiO3 powder defined in 2002. The Li2TiO3 green pebbles were sintered at 1100°C and were characterized at CEA. Relevant characteristics, i.e., pebble bed density, pebble closed porosity, grain size, specific surface area, and average crush load of 1 kg-batch reference “CTI 2964 Ti 1100 CTI” are reported in table 1. A bed density of 1.81 g/cm3 was measured on the Li2TiO3 pebbles. This value of pebbles bed density is in agreement with the specification for the Li2TiO3 pebbles (recall of target > 1.8 g/cm3). As shown in figure 1, the pebble size distribution is 0.6 to 0.8 mm. The shape is not exactly spherical and so one can observe some granules and some fractured pebbles. An optimization of the process parameters will be still necessary to achieve a better sphericity of the pebbles.
Table 1 : Characteristics of the 1 kg-batch of CTI Li2TiO3
pebbles sintered at 1100°C
Reference of batch
Pebble size (mm)
Closed porosity (%)
Bed density (g/cm3)
Grain size (µm)
Specific surface area
(m2/g)
Average crush load (N)
CTI 2964 0.6 – 0.8 5.8 1.81 1 - 3 0.19 26 [15 – 42]
Table 2 : Characteristics of the Li2TiO3 pebbles delivered in 2004
Reference of batch
Pebble size (mm)
Open porosity (%)
Closed porosity (%)
Bed density (g/cm3)
Grain size (µm)
Average crush load (N)
CTI 273 0.6 – 0.8 1.7 5.3 1.94 1 - 3 37 [14 – 65]
CTI 1233 0.6 – 0.8 2.0 5.8 1.88 1 - 4 33
[25 – 52]
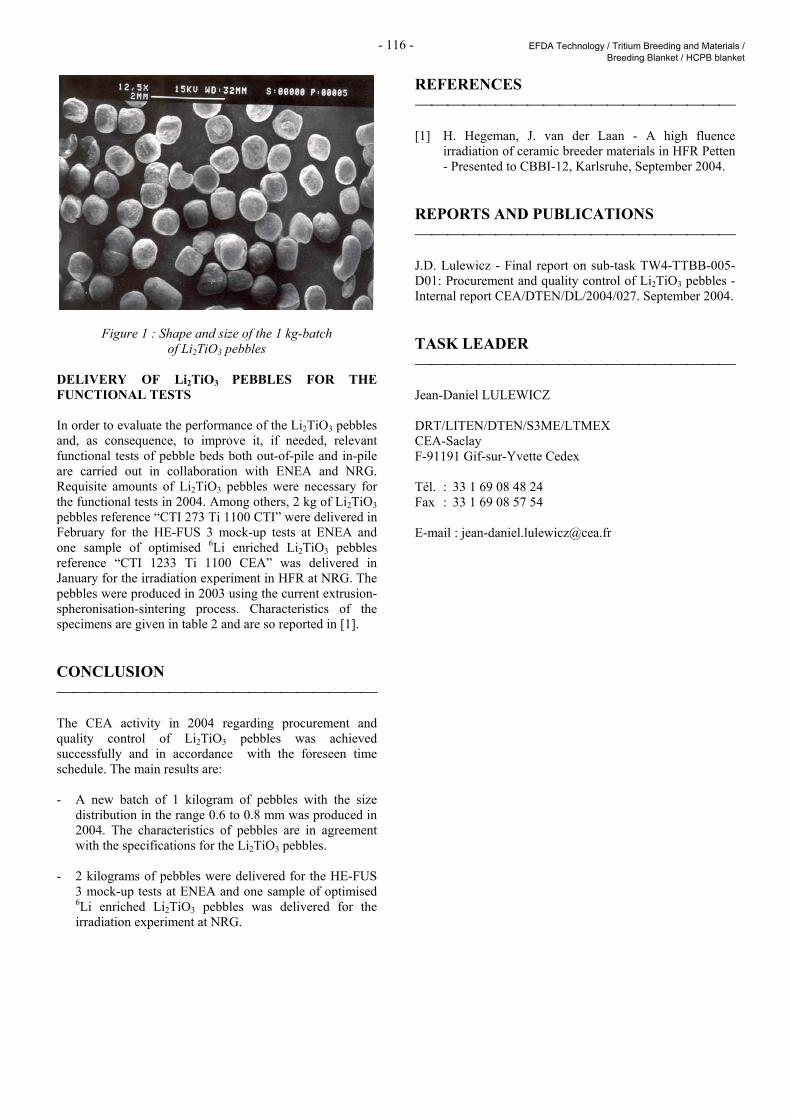
- 116 - EFDA Technology / Tritium Breeding and Materials / Breeding Blanket / HCPB blanket
Figure 1 : Shape and size of the 1 kg-batch of Li2TiO3 pebbles
DELIVERY OF Li2TiO3 PEBBLES FOR THE FUNCTIONAL TESTS In order to evaluate the performance of the Li2TiO3 pebbles and, as consequence, to improve it, if needed, relevant functional tests of pebble beds both out-of-pile and in-pile are carried out in collaboration with ENEA and NRG. Requisite amounts of Li2TiO3 pebbles were necessary for the functional tests in 2004. Among others, 2 kg of Li2TiO3 pebbles reference “CTI 273 Ti 1100 CTI” were delivered in February for the HE-FUS 3 mock-up tests at ENEA and one sample of optimised 6Li enriched Li2TiO3 pebbles reference “CTI 1233 Ti 1100 CEA” was delivered in January for the irradiation experiment in HFR at NRG. The pebbles were produced in 2003 using the current extrusion-spheronisation-sintering process. Characteristics of the specimens are given in table 2 and are so reported in [1]. CONCLUSION The CEA activity in 2004 regarding procurement and quality control of Li2TiO3 pebbles was achieved successfully and in accordance with the foreseen time schedule. The main results are: - A new batch of 1 kilogram of pebbles with the size
distribution in the range 0.6 to 0.8 mm was produced in 2004. The characteristics of pebbles are in agreement with the specifications for the Li2TiO3 pebbles.
- 2 kilograms of pebbles were delivered for the HE-FUS
3 mock-up tests at ENEA and one sample of optimised 6Li enriched Li2TiO3 pebbles was delivered for the irradiation experiment at NRG.
REFERENCES [1] H. Hegeman, J. van der Laan - A high fluence
irradiation of ceramic breeder materials in HFR Petten - Presented to CBBI-12, Karlsruhe, September 2004.
REPORTS AND PUBLICATIONS J.D. Lulewicz - Final report on sub-task TW4-TTBB-005-D01: Procurement and quality control of Li2TiO3 pebbles - Internal report CEA/DTEN/DL/2004/027. September 2004. TASK LEADER Jean-Daniel LULEWICZ DRT/LITEN/DTEN/S3ME/LTMEX CEA-Saclay F-91191 Gif-sur-Yvette Cedex Tél. : 33 1 69 08 48 24 Fax : 33 1 69 08 57 54 E-mail : [email protected]
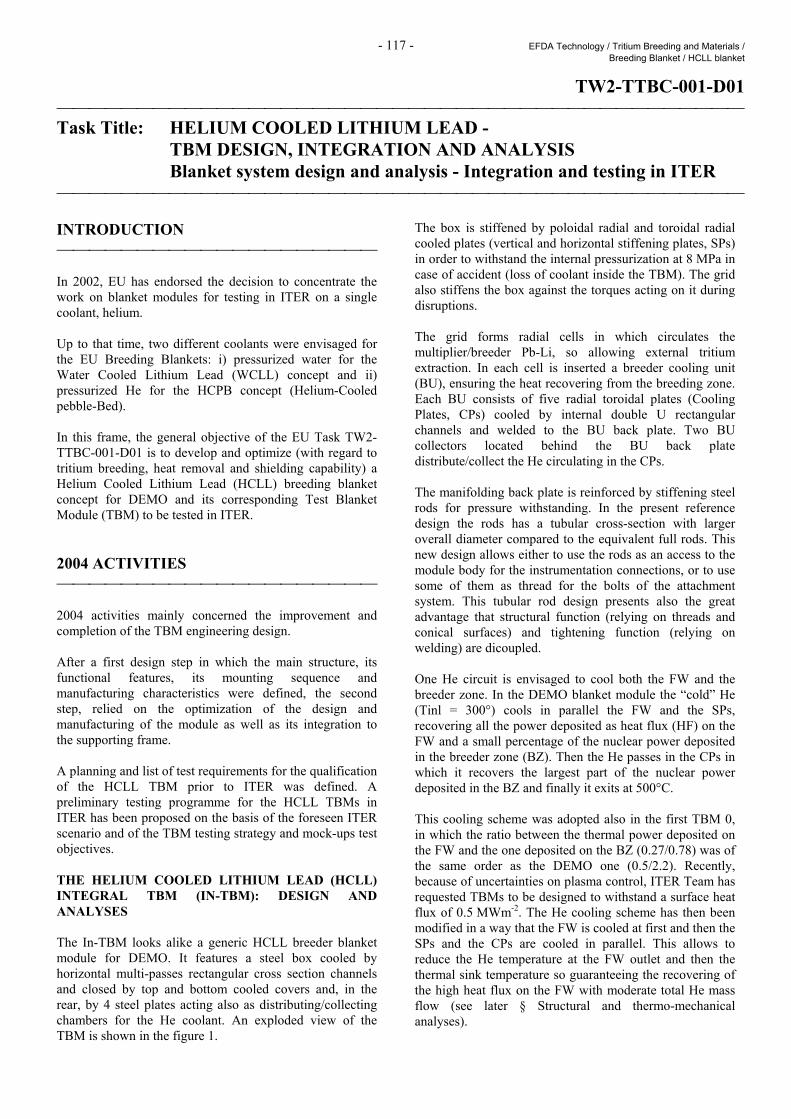
- 117 - EFDA Technology / Tritium Breeding and Materials / Breeding Blanket / HCLL blanket
TW2-TTBC-001-D01 Task Title: HELIUM COOLED LITHIUM LEAD -
TBM DESIGN, INTEGRATION AND ANALYSIS Blanket system design and analysis - Integration and testing in ITER INTRODUCTION In 2002, EU has endorsed the decision to concentrate the work on blanket modules for testing in ITER on a single coolant, helium. Up to that time, two different coolants were envisaged for the EU Breeding Blankets: i) pressurized water for the Water Cooled Lithium Lead (WCLL) concept and ii) pressurized He for the HCPB concept (Helium-Cooled pebble-Bed). In this frame, the general objective of the EU Task TW2-TTBC-001-D01 is to develop and optimize (with regard to tritium breeding, heat removal and shielding capability) a Helium Cooled Lithium Lead (HCLL) breeding blanket concept for DEMO and its corresponding Test Blanket Module (TBM) to be tested in ITER. 2004 ACTIVITIES 2004 activities mainly concerned the improvement and completion of the TBM engineering design. After a first design step in which the main structure, its functional features, its mounting sequence and manufacturing characteristics were defined, the second step, relied on the optimization of the design and manufacturing of the module as well as its integration to the supporting frame. A planning and list of test requirements for the qualification of the HCLL TBM prior to ITER was defined. A preliminary testing programme for the HCLL TBMs in ITER has been proposed on the basis of the foreseen ITER scenario and of the TBM testing strategy and mock-ups test objectives. THE HELIUM COOLED LITHIUM LEAD (HCLL) INTEGRAL TBM (IN-TBM): DESIGN AND ANALYSES The In-TBM looks alike a generic HCLL breeder blanket module for DEMO. It features a steel box cooled by horizontal multi-passes rectangular cross section channels and closed by top and bottom cooled covers and, in the rear, by 4 steel plates acting also as distributing/collecting chambers for the He coolant. An exploded view of the TBM is shown in the figure 1.
The box is stiffened by poloidal radial and toroidal radial cooled plates (vertical and horizontal stiffening plates, SPs) in order to withstand the internal pressurization at 8 MPa in case of accident (loss of coolant inside the TBM). The grid also stiffens the box against the torques acting on it during disruptions. The grid forms radial cells in which circulates the multiplier/breeder Pb-Li, so allowing external tritium extraction. In each cell is inserted a breeder cooling unit (BU), ensuring the heat recovering from the breeding zone. Each BU consists of five radial toroidal plates (Cooling Plates, CPs) cooled by internal double U rectangular channels and welded to the BU back plate. Two BU collectors located behind the BU back plate distribute/collect the He circulating in the CPs. The manifolding back plate is reinforced by stiffening steel rods for pressure withstanding. In the present reference design the rods has a tubular cross-section with larger overall diameter compared to the equivalent full rods. This new design allows either to use the rods as an access to the module body for the instrumentation connections, or to use some of them as thread for the bolts of the attachment system. This tubular rod design presents also the great advantage that structural function (relying on threads and conical surfaces) and tightening function (relying on welding) are dicoupled. One He circuit is envisaged to cool both the FW and the breeder zone. In the DEMO blanket module the “cold” He (Tinl = 300°) cools in parallel the FW and the SPs, recovering all the power deposited as heat flux (HF) on the FW and a small percentage of the nuclear power deposited in the breeder zone (BZ). Then the He passes in the CPs in which it recovers the largest part of the nuclear power deposited in the BZ and finally it exits at 500°C. This cooling scheme was adopted also in the first TBM 0, in which the ratio between the thermal power deposited on the FW and the one deposited on the BZ (0.27/0.78) was of the same order as the DEMO one (0.5/2.2). Recently, because of uncertainties on plasma control, ITER Team has requested TBMs to be designed to withstand a surface heat flux of 0.5 MWm-2. The He cooling scheme has then been modified in a way that the FW is cooled at first and then the SPs and the CPs are cooled in parallel. This allows to reduce the He temperature at the FW outlet and then the thermal sink temperature so guaranteeing the recovering of the high heat flux on the FW with moderate total He mass flow (see later § Structural and thermo-mechanical analyses).
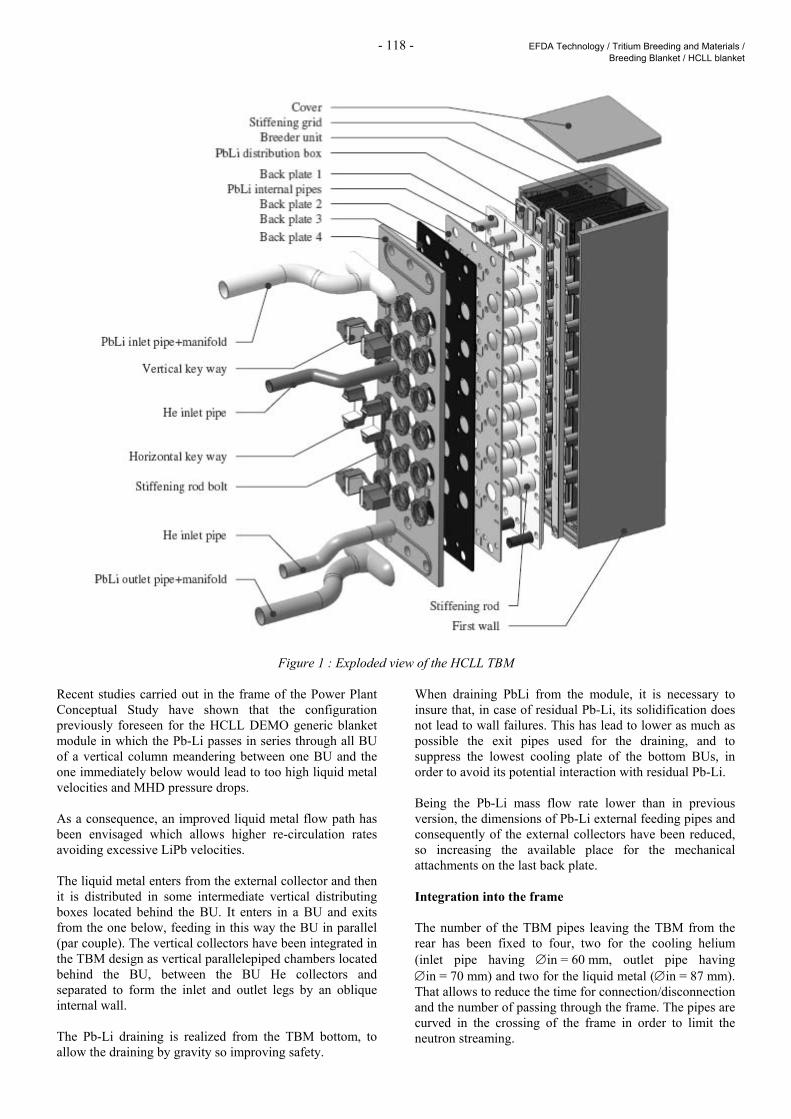
- 118 - EFDA Technology / Tritium Breeding and Materials / Breeding Blanket / HCLL blanket
Figure 1 : Exploded view of the HCLL TBM Recent studies carried out in the frame of the Power Plant Conceptual Study have shown that the configuration previously foreseen for the HCLL DEMO generic blanket module in which the Pb-Li passes in series through all BU of a vertical column meandering between one BU and the one immediately below would lead to too high liquid metal velocities and MHD pressure drops. As a consequence, an improved liquid metal flow path has been envisaged which allows higher re-circulation rates avoiding excessive LiPb velocities. The liquid metal enters from the external collector and then it is distributed in some intermediate vertical distributing boxes located behind the BU. It enters in a BU and exits from the one below, feeding in this way the BU in parallel (par couple). The vertical collectors have been integrated in the TBM design as vertical parallelepiped chambers located behind the BU, between the BU He collectors and separated to form the inlet and outlet legs by an oblique internal wall. The Pb-Li draining is realized from the TBM bottom, to allow the draining by gravity so improving safety.
When draining PbLi from the module, it is necessary to insure that, in case of residual Pb-Li, its solidification does not lead to wall failures. This has lead to lower as much as possible the exit pipes used for the draining, and to suppress the lowest cooling plate of the bottom BUs, in order to avoid its potential interaction with residual Pb-Li. Being the Pb-Li mass flow rate lower than in previous version, the dimensions of Pb-Li external feeding pipes and consequently of the external collectors have been reduced, so increasing the available place for the mechanical attachments on the last back plate. Integration into the frame The number of the TBM pipes leaving the TBM from the rear has been fixed to four, two for the cooling helium (inlet pipe having ∅in = 60 mm, outlet pipe having ∅in = 70 mm) and two for the liquid metal (∅in = 87 mm). That allows to reduce the time for connection/disconnection and the number of passing through the frame. The pipes are curved in the crossing of the frame in order to limit the neutron streaming.
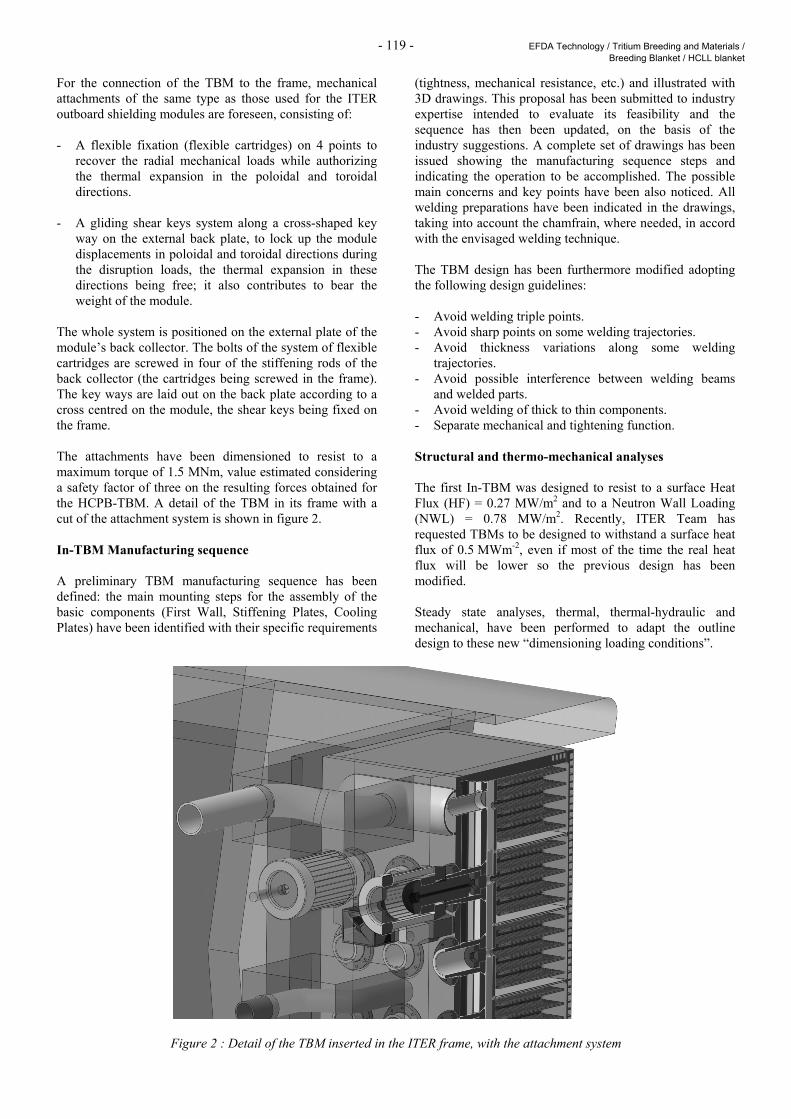
- 119 - EFDA Technology / Tritium Breeding and Materials / Breeding Blanket / HCLL blanket
For the connection of the TBM to the frame, mechanical attachments of the same type as those used for the ITER outboard shielding modules are foreseen, consisting of: - A flexible fixation (flexible cartridges) on 4 points to
recover the radial mechanical loads while authorizing the thermal expansion in the poloidal and toroidal directions.
- A gliding shear keys system along a cross-shaped key
way on the external back plate, to lock up the module displacements in poloidal and toroidal directions during the disruption loads, the thermal expansion in these directions being free; it also contributes to bear the weight of the module.
The whole system is positioned on the external plate of the module’s back collector. The bolts of the system of flexible cartridges are screwed in four of the stiffening rods of the back collector (the cartridges being screwed in the frame). The key ways are laid out on the back plate according to a cross centred on the module, the shear keys being fixed on the frame. The attachments have been dimensioned to resist to a maximum torque of 1.5 MNm, value estimated considering a safety factor of three on the resulting forces obtained for the HCPB-TBM. A detail of the TBM in its frame with a cut of the attachment system is shown in figure 2. In-TBM Manufacturing sequence A preliminary TBM manufacturing sequence has been defined: the main mounting steps for the assembly of the basic components (First Wall, Stiffening Plates, Cooling Plates) have been identified with their specific requirements
(tightness, mechanical resistance, etc.) and illustrated with 3D drawings. This proposal has been submitted to industry expertise intended to evaluate its feasibility and the sequence has then been updated, on the basis of the industry suggestions. A complete set of drawings has been issued showing the manufacturing sequence steps and indicating the operation to be accomplished. The possible main concerns and key points have been also noticed. All welding preparations have been indicated in the drawings, taking into account the chamfrain, where needed, in accord with the envisaged welding technique. The TBM design has been furthermore modified adopting the following design guidelines: - Avoid welding triple points. - Avoid sharp points on some welding trajectories. - Avoid thickness variations along some welding
trajectories. - Avoid possible interference between welding beams
and welded parts. - Avoid welding of thick to thin components. - Separate mechanical and tightening function. Structural and thermo-mechanical analyses The first In-TBM was designed to resist to a surface Heat Flux (HF) = 0.27 MW/m2 and to a Neutron Wall Loading (NWL) = 0.78 MW/m2. Recently, ITER Team has requested TBMs to be designed to withstand a surface heat flux of 0.5 MWm-2, even if most of the time the real heat flux will be lower so the previous design has been modified. Steady state analyses, thermal, thermal-hydraulic and mechanical, have been performed to adapt the outline design to these new “dimensioning loading conditions”.
Figure 2 : Detail of the TBM inserted in the ITER frame, with the attachment system
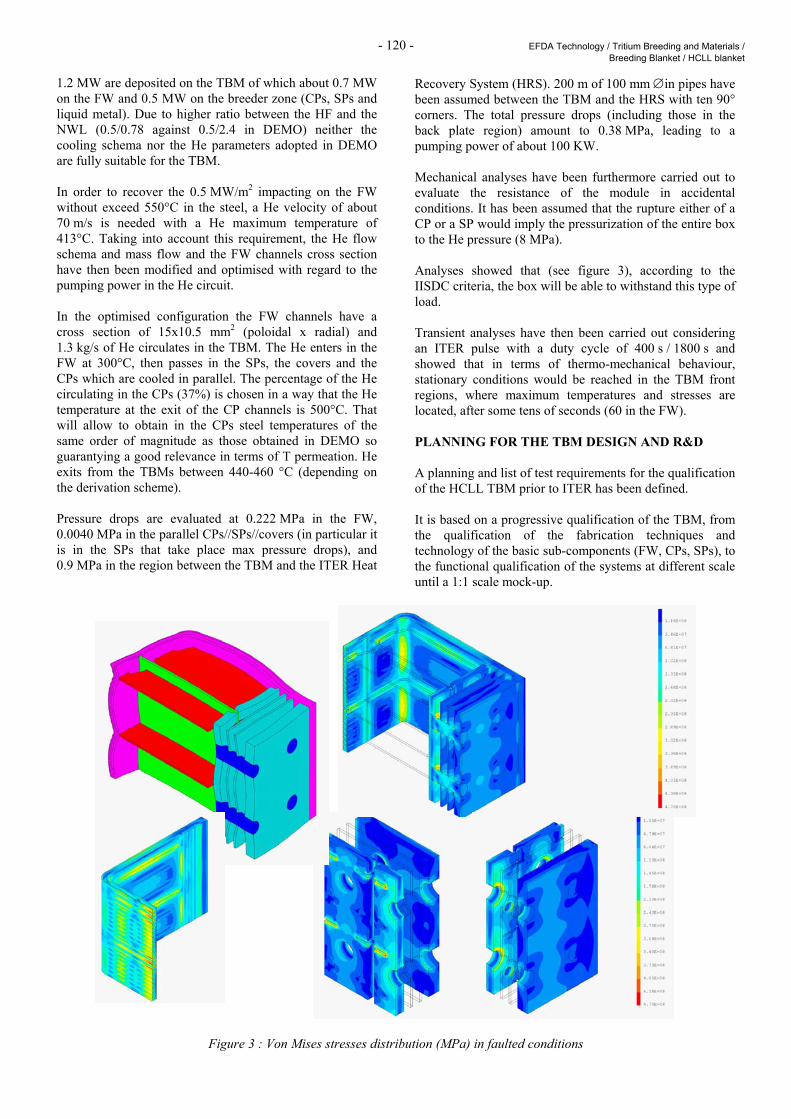
- 120 - EFDA Technology / Tritium Breeding and Materials / Breeding Blanket / HCLL blanket
1.2 MW are deposited on the TBM of which about 0.7 MW on the FW and 0.5 MW on the breeder zone (CPs, SPs and liquid metal). Due to higher ratio between the HF and the NWL (0.5/0.78 against 0.5/2.4 in DEMO) neither the cooling schema nor the He parameters adopted in DEMO are fully suitable for the TBM. In order to recover the 0.5 MW/m2 impacting on the FW without exceed 550°C in the steel, a He velocity of about 70 m/s is needed with a He maximum temperature of 413°C. Taking into account this requirement, the He flow schema and mass flow and the FW channels cross section have then been modified and optimised with regard to the pumping power in the He circuit. In the optimised configuration the FW channels have a cross section of 15x10.5 mm2 (poloidal x radial) and 1.3 kg/s of He circulates in the TBM. The He enters in the FW at 300°C, then passes in the SPs, the covers and the CPs which are cooled in parallel. The percentage of the He circulating in the CPs (37%) is chosen in a way that the He temperature at the exit of the CP channels is 500°C. That will allow to obtain in the CPs steel temperatures of the same order of magnitude as those obtained in DEMO so guarantying a good relevance in terms of T permeation. He exits from the TBMs between 440-460 °C (depending on the derivation scheme). Pressure drops are evaluated at 0.222 MPa in the FW, 0.0040 MPa in the parallel CPs//SPs//covers (in particular it is in the SPs that take place max pressure drops), and 0.9 MPa in the region between the TBM and the ITER Heat
Recovery System (HRS). 200 m of 100 mm ∅in pipes have been assumed between the TBM and the HRS with ten 90° corners. The total pressure drops (including those in the back plate region) amount to 0.38 MPa, leading to a pumping power of about 100 KW. Mechanical analyses have been furthermore carried out to evaluate the resistance of the module in accidental conditions. It has been assumed that the rupture either of a CP or a SP would imply the pressurization of the entire box to the He pressure (8 MPa). Analyses showed that (see figure 3), according to the IISDC criteria, the box will be able to withstand this type of load. Transient analyses have then been carried out considering an ITER pulse with a duty cycle of 400 s / 1800 s and showed that in terms of thermo-mechanical behaviour, stationary conditions would be reached in the TBM front regions, where maximum temperatures and stresses are located, after some tens of seconds (60 in the FW). PLANNING FOR THE TBM DESIGN AND R&D A planning and list of test requirements for the qualification of the HCLL TBM prior to ITER has been defined. It is based on a progressive qualification of the TBM, from the qualification of the fabrication techniques and technology of the basic sub-components (FW, CPs, SPs), to the functional qualification of the systems at different scale until a 1:1 scale mock-up.
Figure 3 : Von Mises stresses distribution (MPa) in faulted conditions
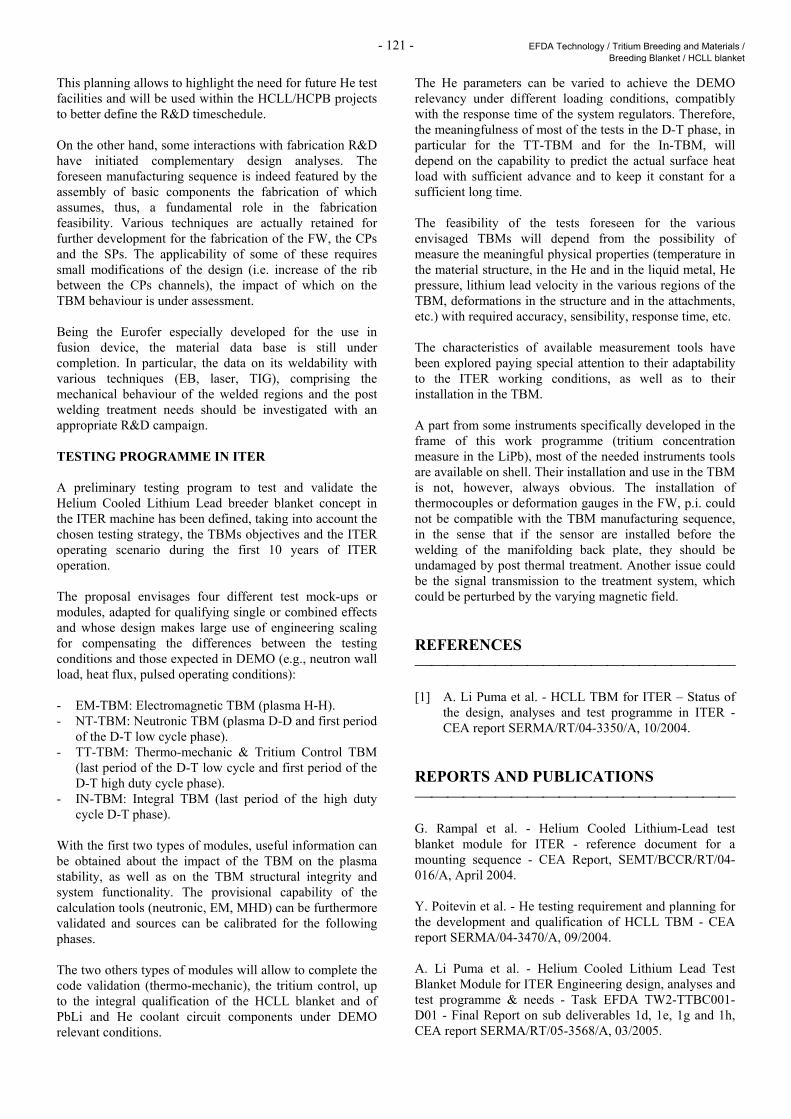
- 121 - EFDA Technology / Tritium Breeding and Materials / Breeding Blanket / HCLL blanket
This planning allows to highlight the need for future He test facilities and will be used within the HCLL/HCPB projects to better define the R&D timeschedule. On the other hand, some interactions with fabrication R&D have initiated complementary design analyses. The foreseen manufacturing sequence is indeed featured by the assembly of basic components the fabrication of which assumes, thus, a fundamental role in the fabrication feasibility. Various techniques are actually retained for further development for the fabrication of the FW, the CPs and the SPs. The applicability of some of these requires small modifications of the design (i.e. increase of the rib between the CPs channels), the impact of which on the TBM behaviour is under assessment. Being the Eurofer especially developed for the use in fusion device, the material data base is still under completion. In particular, the data on its weldability with various techniques (EB, laser, TIG), comprising the mechanical behaviour of the welded regions and the post welding treatment needs should be investigated with an appropriate R&D campaign. TESTING PROGRAMME IN ITER A preliminary testing program to test and validate the Helium Cooled Lithium Lead breeder blanket concept in the ITER machine has been defined, taking into account the chosen testing strategy, the TBMs objectives and the ITER operating scenario during the first 10 years of ITER operation. The proposal envisages four different test mock-ups or modules, adapted for qualifying single or combined effects and whose design makes large use of engineering scaling for compensating the differences between the testing conditions and those expected in DEMO (e.g., neutron wall load, heat flux, pulsed operating conditions): - EM-TBM: Electromagnetic TBM (plasma H-H). - NT-TBM: Neutronic TBM (plasma D-D and first period
of the D-T low cycle phase). - TT-TBM: Thermo-mechanic & Tritium Control TBM
(last period of the D-T low cycle and first period of the D-T high duty cycle phase).
- IN-TBM: Integral TBM (last period of the high duty cycle D-T phase).
With the first two types of modules, useful information can be obtained about the impact of the TBM on the plasma stability, as well as on the TBM structural integrity and system functionality. The provisional capability of the calculation tools (neutronic, EM, MHD) can be furthermore validated and sources can be calibrated for the following phases. The two others types of modules will allow to complete the code validation (thermo-mechanic), the tritium control, up to the integral qualification of the HCLL blanket and of PbLi and He coolant circuit components under DEMO relevant conditions.
The He parameters can be varied to achieve the DEMO relevancy under different loading conditions, compatibly with the response time of the system regulators. Therefore, the meaningfulness of most of the tests in the D-T phase, in particular for the TT-TBM and for the In-TBM, will depend on the capability to predict the actual surface heat load with sufficient advance and to keep it constant for a sufficient long time. The feasibility of the tests foreseen for the various envisaged TBMs will depend from the possibility of measure the meaningful physical properties (temperature in the material structure, in the He and in the liquid metal, He pressure, lithium lead velocity in the various regions of the TBM, deformations in the structure and in the attachments, etc.) with required accuracy, sensibility, response time, etc. The characteristics of available measurement tools have been explored paying special attention to their adaptability to the ITER working conditions, as well as to their installation in the TBM. A part from some instruments specifically developed in the frame of this work programme (tritium concentration measure in the LiPb), most of the needed instruments tools are available on shell. Their installation and use in the TBM is not, however, always obvious. The installation of thermocouples or deformation gauges in the FW, p.i. could not be compatible with the TBM manufacturing sequence, in the sense that if the sensor are installed before the welding of the manifolding back plate, they should be undamaged by post thermal treatment. Another issue could be the signal transmission to the treatment system, which could be perturbed by the varying magnetic field. REFERENCES [1] A. Li Puma et al. - HCLL TBM for ITER – Status of
the design, analyses and test programme in ITER - CEA report SERMA/RT/04-3350/A, 10/2004.
REPORTS AND PUBLICATIONS G. Rampal et al. - Helium Cooled Lithium-Lead test blanket module for ITER - reference document for a mounting sequence - CEA Report, SEMT/BCCR/RT/04-016/A, April 2004. Y. Poitevin et al. - He testing requirement and planning for the development and qualification of HCLL TBM - CEA report SERMA/04-3470/A, 09/2004. A. Li Puma et al. - Helium Cooled Lithium Lead Test Blanket Module for ITER Engineering design, analyses and test programme & needs - Task EFDA TW2-TTBC001-D01 - Final Report on sub deliverables 1d, 1e, 1g and 1h, CEA report SERMA/RT/05-3568/A, 03/2005.
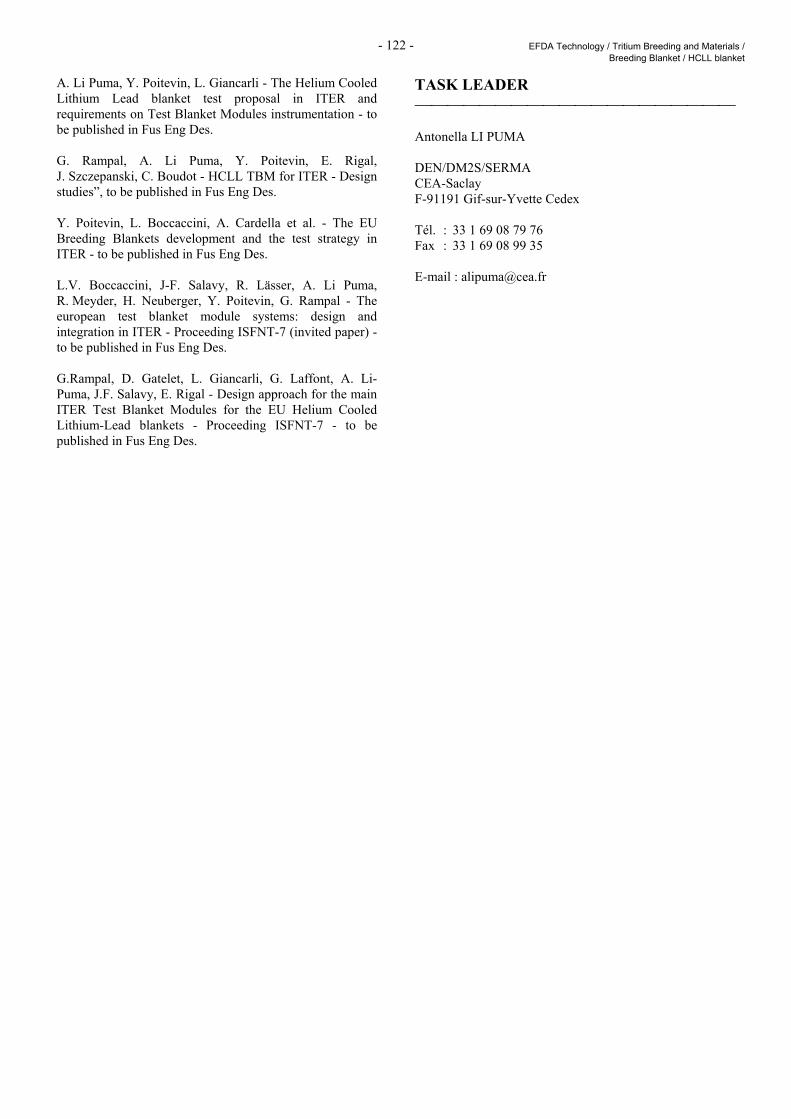
- 122 - EFDA Technology / Tritium Breeding and Materials / Breeding Blanket / HCLL blanket
A. Li Puma, Y. Poitevin, L. Giancarli - The Helium Cooled Lithium Lead blanket test proposal in ITER and requirements on Test Blanket Modules instrumentation - to be published in Fus Eng Des. G. Rampal, A. Li Puma, Y. Poitevin, E. Rigal, J. Szczepanski, C. Boudot - HCLL TBM for ITER - Design studies”, to be published in Fus Eng Des. Y. Poitevin, L. Boccaccini, A. Cardella et al. - The EU Breeding Blankets development and the test strategy in ITER - to be published in Fus Eng Des. L.V. Boccaccini, J-F. Salavy, R. Lässer, A. Li Puma, R. Meyder, H. Neuberger, Y. Poitevin, G. Rampal - The european test blanket module systems: design and integration in ITER - Proceeding ISFNT-7 (invited paper) - to be published in Fus Eng Des. G.Rampal, D. Gatelet, L. Giancarli, G. Laffont, A. Li-Puma, J.F. Salavy, E. Rigal - Design approach for the main ITER Test Blanket Modules for the EU Helium Cooled Lithium-Lead blankets - Proceeding ISFNT-7 - to be published in Fus Eng Des.
TASK LEADER Antonella LI PUMA DEN/DM2S/SERMA CEA-Saclay F-91191 Gif-sur-Yvette Cedex Tél. : 33 1 69 08 79 76 Fax : 33 1 69 08 99 35 E-mail : [email protected]
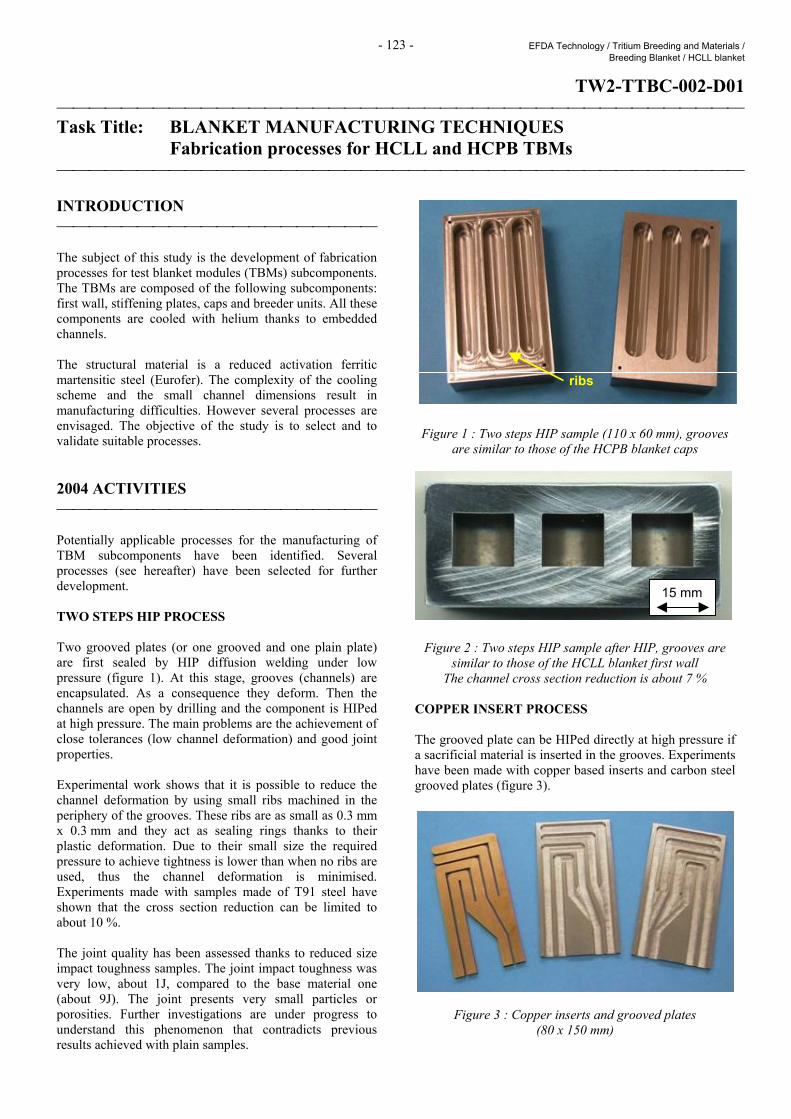
- 123 - EFDA Technology / Tritium Breeding and Materials / Breeding Blanket / HCLL blanket
TW2-TTBC-002-D01 Task Title: BLANKET MANUFACTURING TECHNIQUES Fabrication processes for HCLL and HCPB TBMs INTRODUCTION The subject of this study is the development of fabrication processes for test blanket modules (TBMs) subcomponents. The TBMs are composed of the following subcomponents: first wall, stiffening plates, caps and breeder units. All these components are cooled with helium thanks to embedded channels. The structural material is a reduced activation ferritic martensitic steel (Eurofer). The complexity of the cooling scheme and the small channel dimensions result in manufacturing difficulties. However several processes are envisaged. The objective of the study is to select and to validate suitable processes. 2004 ACTIVITIES Potentially applicable processes for the manufacturing of TBM subcomponents have been identified. Several processes (see hereafter) have been selected for further development. TWO STEPS HIP PROCESS Two grooved plates (or one grooved and one plain plate) are first sealed by HIP diffusion welding under low pressure (figure 1). At this stage, grooves (channels) are encapsulated. As a consequence they deform. Then the channels are open by drilling and the component is HIPed at high pressure. The main problems are the achievement of close tolerances (low channel deformation) and good joint properties. Experimental work shows that it is possible to reduce the channel deformation by using small ribs machined in the periphery of the grooves. These ribs are as small as 0.3 mm x 0.3 mm and they act as sealing rings thanks to their plastic deformation. Due to their small size the required pressure to achieve tightness is lower than when no ribs are used, thus the channel deformation is minimised. Experiments made with samples made of T91 steel have shown that the cross section reduction can be limited to about 10 %. The joint quality has been assessed thanks to reduced size impact toughness samples. The joint impact toughness was very low, about 1J, compared to the base material one (about 9J). The joint presents very small particles or porosities. Further investigations are under progress to understand this phenomenon that contradicts previous results achieved with plain samples.
Figure 1 : Two steps HIP sample (110 x 60 mm), grooves
are similar to those of the HCPB blanket caps
Figure 2 : Two steps HIP sample after HIP, grooves are similar to those of the HCLL blanket first wall
The channel cross section reduction is about 7 % COPPER INSERT PROCESS The grooved plate can be HIPed directly at high pressure if a sacrificial material is inserted in the grooves. Experiments have been made with copper based inserts and carbon steel grooved plates (figure 3).
Figure 3 : Copper inserts and grooved plates (80 x 150 mm)
15 mm
ribs
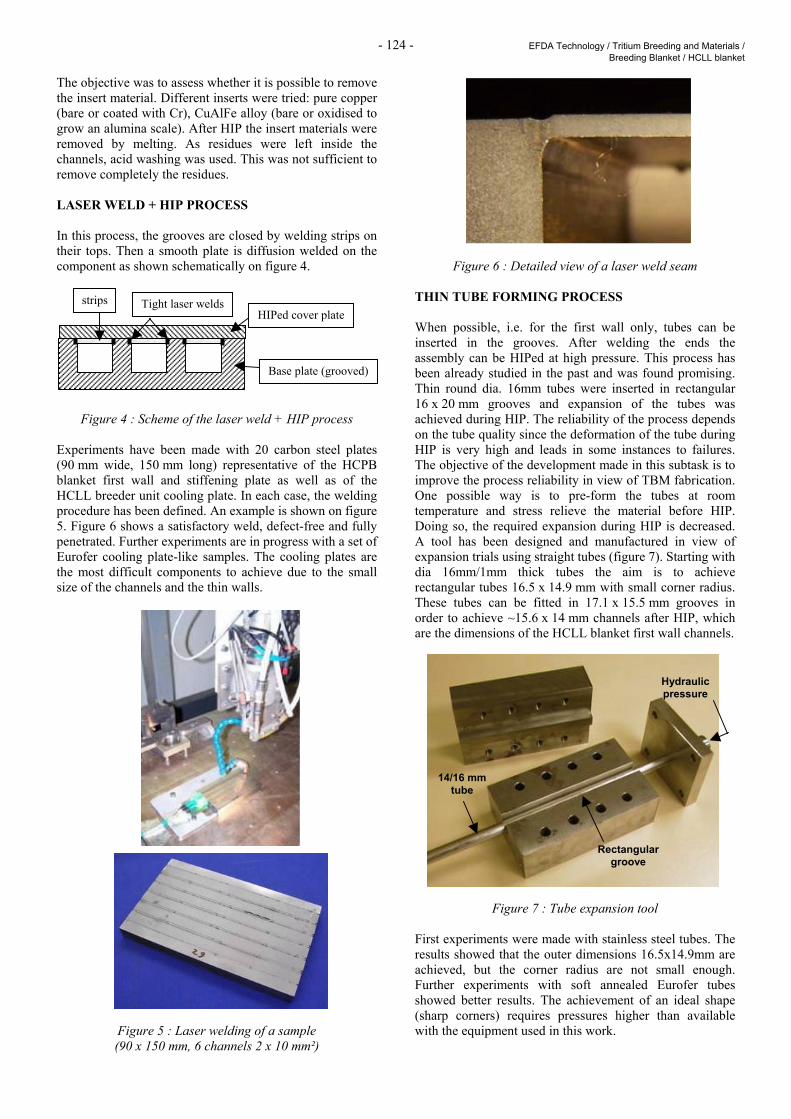
- 124 - EFDA Technology / Tritium Breeding and Materials / Breeding Blanket / HCLL blanket
The objective was to assess whether it is possible to remove the insert material. Different inserts were tried: pure copper (bare or coated with Cr), CuAlFe alloy (bare or oxidised to grow an alumina scale). After HIP the insert materials were removed by melting. As residues were left inside the channels, acid washing was used. This was not sufficient to remove completely the residues. LASER WELD + HIP PROCESS In this process, the grooves are closed by welding strips on their tops. Then a smooth plate is diffusion welded on the component as shown schematically on figure 4.
Figure 4 : Scheme of the laser weld + HIP process Experiments have been made with 20 carbon steel plates (90 mm wide, 150 mm long) representative of the HCPB blanket first wall and stiffening plate as well as of the HCLL breeder unit cooling plate. In each case, the welding procedure has been defined. An example is shown on figure 5. Figure 6 shows a satisfactory weld, defect-free and fully penetrated. Further experiments are in progress with a set of Eurofer cooling plate-like samples. The cooling plates are the most difficult components to achieve due to the small size of the channels and the thin walls.
Figure 5 : Laser welding of a sample (90 x 150 mm, 6 channels 2 x 10 mm²)
Figure 6 : Detailed view of a laser weld seam THIN TUBE FORMING PROCESS When possible, i.e. for the first wall only, tubes can be inserted in the grooves. After welding the ends the assembly can be HIPed at high pressure. This process has been already studied in the past and was found promising. Thin round dia. 16mm tubes were inserted in rectangular 16 x 20 mm grooves and expansion of the tubes was achieved during HIP. The reliability of the process depends on the tube quality since the deformation of the tube during HIP is very high and leads in some instances to failures. The objective of the development made in this subtask is to improve the process reliability in view of TBM fabrication. One possible way is to pre-form the tubes at room temperature and stress relieve the material before HIP. Doing so, the required expansion during HIP is decreased. A tool has been designed and manufactured in view of expansion trials using straight tubes (figure 7). Starting with dia 16mm/1mm thick tubes the aim is to achieve rectangular tubes 16.5 x 14.9 mm with small corner radius. These tubes can be fitted in 17.1 x 15.5 mm grooves in order to achieve ~15.6 x 14 mm channels after HIP, which are the dimensions of the HCLL blanket first wall channels.
Figure 7 : Tube expansion tool First experiments were made with stainless steel tubes. The results showed that the outer dimensions 16.5x14.9mm are achieved, but the corner radius are not small enough. Further experiments with soft annealed Eurofer tubes showed better results. The achievement of an ideal shape (sharp corners) requires pressures higher than available with the equipment used in this work.
strips
Base plate (grooved)
Tight laser welds HIPed cover plate
14/16 mm tube
Rectangular groove
Hydraulic pressure
- 125 - EFDA Technology / Tritium Breeding and Materials / Breeding Blanket / HCLL blanket
CONCLUSIONS The subcomponents of helium cooled European blankets are difficult to manufacture due to the small size of the cooling channels and the complexity of the coolant path. For the stiffening plates, the cooling plates and the caps the most promising process is a combination of laser welding and HIP diffusion welding. Acceptable dimensional accuracy but poor joint properties are obtained with the two steps HIP process. For the first wall, the laser weld + HIP process is in principle also applicable, however two other processes are under development: the first one involves the insertion of cold-formed thin tubes between two grooved plates, the second one involves the use of rectangular tubes (subtask TW2-TTBB002d D01). REPORTS AND PUBLICATIONS A. Cardella, E. Rigal et al. - The manufacturing technologies of the European breeding blankets - ICFRM 11 - Journal of Nuclear Materials 329–333 (2004) 133–140. E Rigal et al. - Fabrication processes for HCLL and HCPB TBMs; EFDA task TW2-TTBC002-deliverable 1 - second interim report - Rapport technique DTEN/DL/2005/006, 28/02/2005.
TASK LEADER Emmanuel RIGAL DRT/DTEN/S3ME/LMIC CEA-Grenoble 17, rue des Martyrs F-38054 Grenoble Cedex 9 Tél. : 33 4 38 78 97 22 Fax : 33 4 38 78 54 79 E-mail : [email protected]

- 126 - EFDA Technology / Tritium Breeding and Materials / Breeding Blanket / HCLL blanket
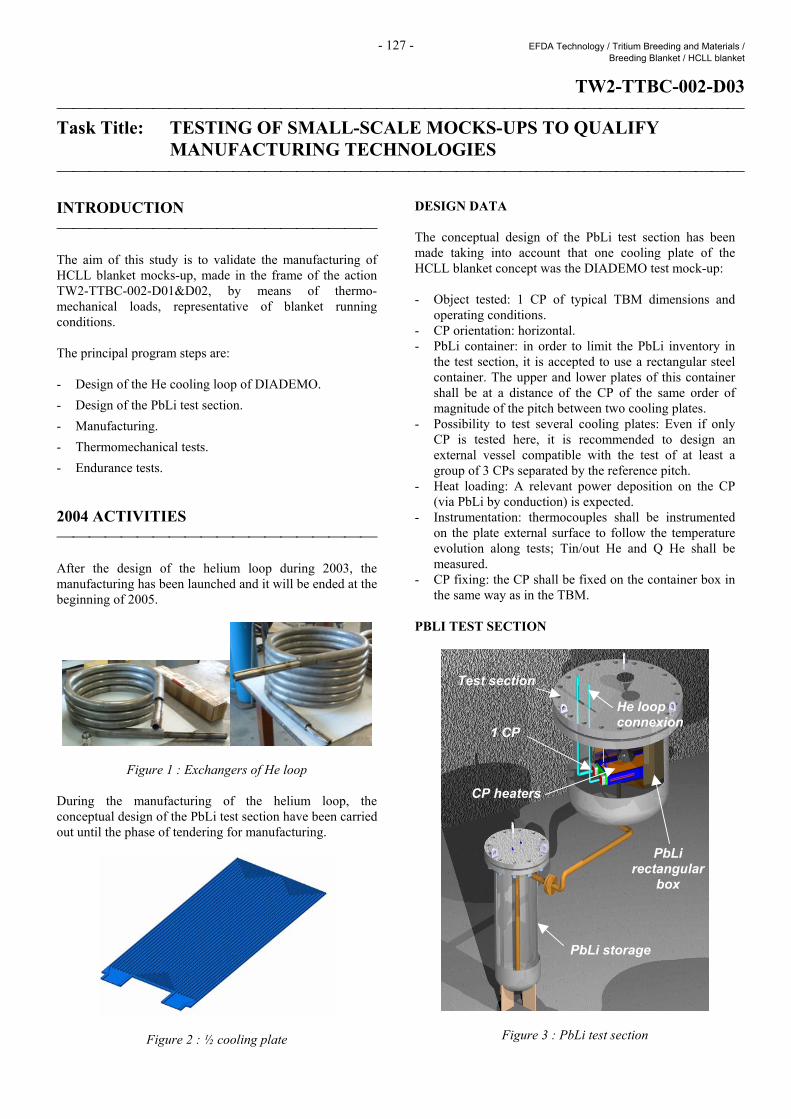
- 127 - EFDA Technology / Tritium Breeding and Materials / Breeding Blanket / HCLL blanket
TW2-TTBC-002-D03 Task Title: TESTING OF SMALL-SCALE MOCKS-UPS TO QUALIFY
MANUFACTURING TECHNOLOGIES INTRODUCTION The aim of this study is to validate the manufacturing of HCLL blanket mocks-up, made in the frame of the action TW2-TTBC-002-D01&D02, by means of thermo-mechanical loads, representative of blanket running conditions. The principal program steps are: - Design of the He cooling loop of DIADEMO. - Design of the PbLi test section. - Manufacturing. - Thermomechanical tests. - Endurance tests. 2004 ACTIVITIES After the design of the helium loop during 2003, the manufacturing has been launched and it will be ended at the beginning of 2005.
Figure 1 : Exchangers of He loop During the manufacturing of the helium loop, the conceptual design of the PbLi test section have been carried out until the phase of tendering for manufacturing.
Figure 2 : ½ cooling plate
DESIGN DATA The conceptual design of the PbLi test section has been made taking into account that one cooling plate of the HCLL blanket concept was the DIADEMO test mock-up: - Object tested: 1 CP of typical TBM dimensions and
operating conditions. - CP orientation: horizontal. - PbLi container: in order to limit the PbLi inventory in
the test section, it is accepted to use a rectangular steel container. The upper and lower plates of this container shall be at a distance of the CP of the same order of magnitude of the pitch between two cooling plates.
- Possibility to test several cooling plates: Even if only CP is tested here, it is recommended to design an external vessel compatible with the test of at least a group of 3 CPs separated by the reference pitch.
- Heat loading: A relevant power deposition on the CP (via PbLi by conduction) is expected.
- Instrumentation: thermocouples shall be instrumented on the plate external surface to follow the temperature evolution along tests; Tin/out He and Q He shall be measured.
- CP fixing: the CP shall be fixed on the container box in the same way as in the TBM.
PBLI TEST SECTION
Figure 3 : PbLi test section
Test section
PbLi storage
1 CP
PbLi rectangular
box
CP heaters
He loop connexion
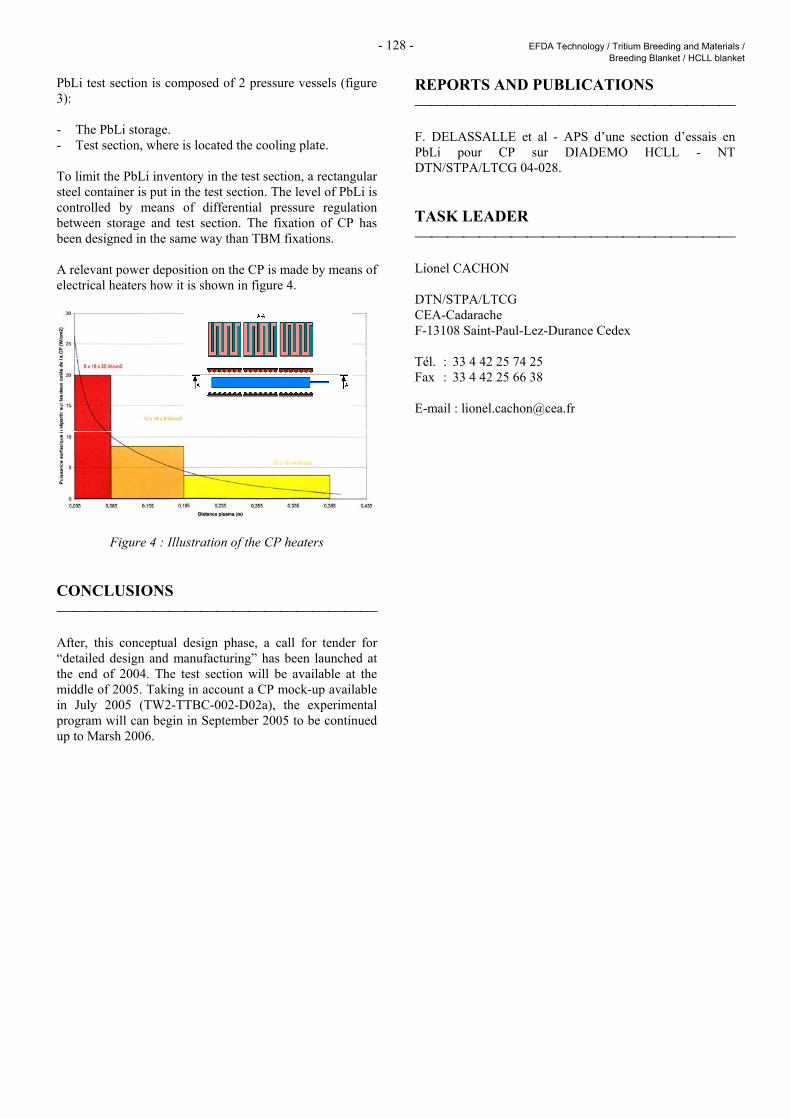
- 128 - EFDA Technology / Tritium Breeding and Materials / Breeding Blanket / HCLL blanket
PbLi test section is composed of 2 pressure vessels (figure 3): - The PbLi storage. - Test section, where is located the cooling plate. To limit the PbLi inventory in the test section, a rectangular steel container is put in the test section. The level of PbLi is controlled by means of differential pressure regulation between storage and test section. The fixation of CP has been designed in the same way than TBM fixations. A relevant power deposition on the CP is made by means of electrical heaters how it is shown in figure 4.
Figure 4 : Illustration of the CP heaters CONCLUSIONS After, this conceptual design phase, a call for tender for “detailed design and manufacturing” has been launched at the end of 2004. The test section will be available at the middle of 2005. Taking in account a CP mock-up available in July 2005 (TW2-TTBC-002-D02a), the experimental program will can begin in September 2005 to be continued up to Marsh 2006.
REPORTS AND PUBLICATIONS F. DELASSALLE et al - APS d’une section d’essais en PbLi pour CP sur DIADEMO HCLL - NT DTN/STPA/LTCG 04-028. TASK LEADER Lionel CACHON DTN/STPA/LTCG CEA-Cadarache F-13108 Saint-Paul-Lez-Durance Cedex Tél. : 33 4 42 25 74 25 Fax : 33 4 42 25 66 38 E-mail : [email protected]
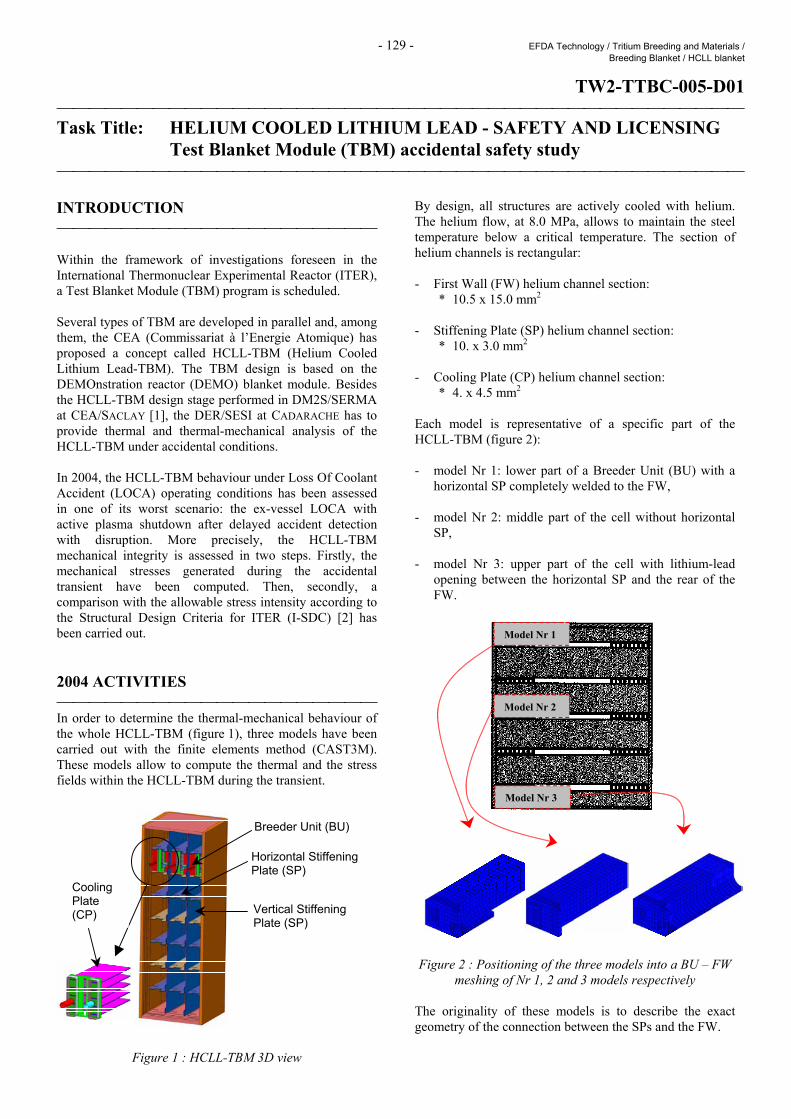
- 129 - EFDA Technology / Tritium Breeding and Materials / Breeding Blanket / HCLL blanket
TW2-TTBC-005-D01 Task Title: HELIUM COOLED LITHIUM LEAD - SAFETY AND LICENSING Test Blanket Module (TBM) accidental safety study INTRODUCTION Within the framework of investigations foreseen in the International Thermonuclear Experimental Reactor (ITER), a Test Blanket Module (TBM) program is scheduled. Several types of TBM are developed in parallel and, among them, the CEA (Commissariat à l’Energie Atomique) has proposed a concept called HCLL-TBM (Helium Cooled Lithium Lead-TBM). The TBM design is based on the DEMOnstration reactor (DEMO) blanket module. Besides the HCLL-TBM design stage performed in DM2S/SERMA at CEA/SACLAY [1], the DER/SESI at CADARACHE has to provide thermal and thermal-mechanical analysis of the HCLL-TBM under accidental conditions. In 2004, the HCLL-TBM behaviour under Loss Of Coolant Accident (LOCA) operating conditions has been assessed in one of its worst scenario: the ex-vessel LOCA with active plasma shutdown after delayed accident detection with disruption. More precisely, the HCLL-TBM mechanical integrity is assessed in two steps. Firstly, the mechanical stresses generated during the accidental transient have been computed. Then, secondly, a comparison with the allowable stress intensity according to the Structural Design Criteria for ITER (I-SDC) [2] has been carried out. 2004 ACTIVITIES In order to determine the thermal-mechanical behaviour of the whole HCLL-TBM (figure 1), three models have been carried out with the finite elements method (CAST3M). These models allow to compute the thermal and the stress fields within the HCLL-TBM during the transient.
Figure 1 : HCLL-TBM 3D view
By design, all structures are actively cooled with helium. The helium flow, at 8.0 MPa, allows to maintain the steel temperature below a critical temperature. The section of helium channels is rectangular: - First Wall (FW) helium channel section:
* 10.5 x 15.0 mm2 - Stiffening Plate (SP) helium channel section:
* 10. x 3.0 mm2 - Cooling Plate (CP) helium channel section:
* 4. x 4.5 mm2 Each model is representative of a specific part of the HCLL-TBM (figure 2): - model Nr 1: lower part of a Breeder Unit (BU) with a
horizontal SP completely welded to the FW, - model Nr 2: middle part of the cell without horizontal
SP, - model Nr 3: upper part of the cell with lithium-lead
opening between the horizontal SP and the rear of the FW.
Figure 2 : Positioning of the three models into a BU – FW
meshing of Nr 1, 2 and 3 models respectively The originality of these models is to describe the exact geometry of the connection between the SPs and the FW.
Breeder Unit (BU)
Horizontal Stiffening Plate (SP)
Cooling Plate (CP) Vertical Stiffening
Plate (SP)
Model Nr 3
Model Nr 1
Model Nr 2
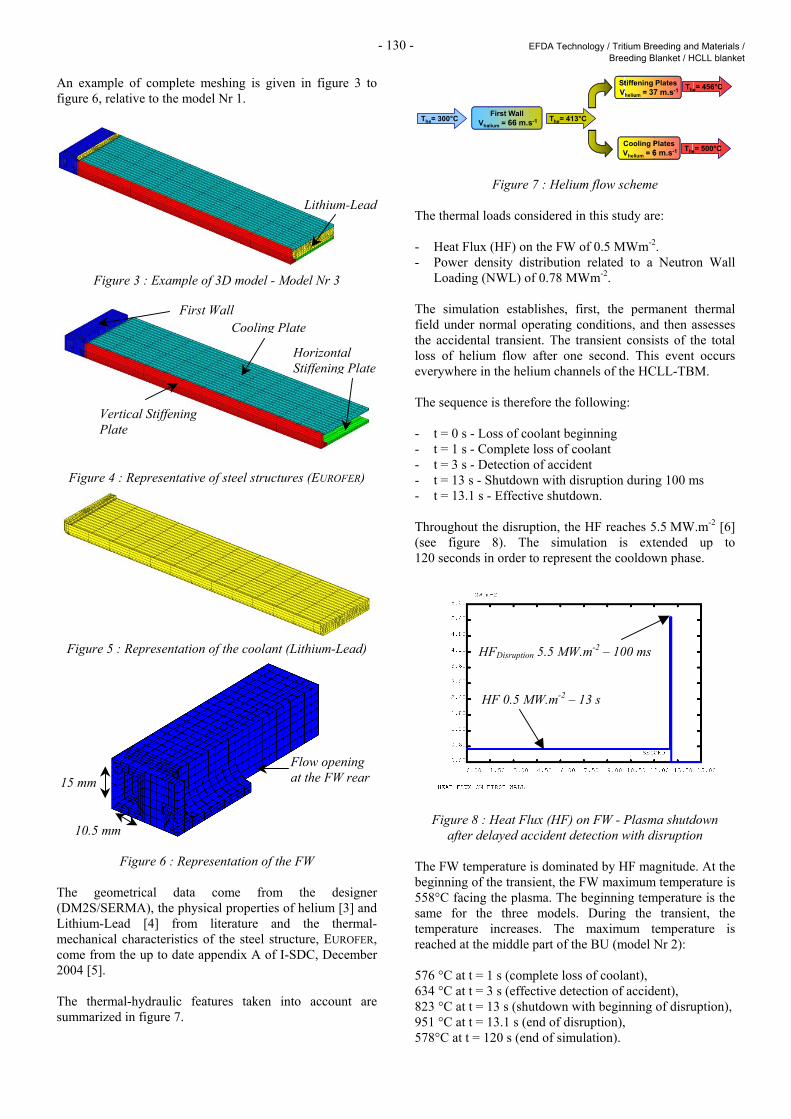
- 130 - EFDA Technology / Tritium Breeding and Materials / Breeding Blanket / HCLL blanket
An example of complete meshing is given in figure 3 to figure 6, relative to the model Nr 1.
Figure 3 : Example of 3D model - Model Nr 3
Figure 4 : Representative of steel structures (EUROFER)
Figure 5 : Representation of the coolant (Lithium-Lead)
Figure 6 : Representation of the FW The geometrical data come from the designer (DM2S/SERMA), the physical properties of helium [3] and Lithium-Lead [4] from literature and the thermal-mechanical characteristics of the steel structure, EUROFER, come from the up to date appendix A of I-SDC, December 2004 [5]. The thermal-hydraulic features taken into account are summarized in figure 7.
The= 300°C First WallVhelium = 66 m.s-1 The= 413°C
Stiffening PlatesVhelium = 37 m.s-1
Cooling PlatesVhelium = 6 m.s-1 The= 500°C
The= 456°C
The= 300°C First WallVhelium = 66 m.s-1 The= 413°C
Stiffening PlatesVhelium = 37 m.s-1
Cooling PlatesVhelium = 6 m.s-1 The= 500°C
The= 456°C
Figure 7 : Helium flow scheme The thermal loads considered in this study are: - Heat Flux (HF) on the FW of 0.5 MWm-2. - Power density distribution related to a Neutron Wall
Loading (NWL) of 0.78 MWm-2. The simulation establishes, first, the permanent thermal field under normal operating conditions, and then assesses the accidental transient. The transient consists of the total loss of helium flow after one second. This event occurs everywhere in the helium channels of the HCLL-TBM. The sequence is therefore the following: - t = 0 s - Loss of coolant beginning - t = 1 s - Complete loss of coolant - t = 3 s - Detection of accident - t = 13 s - Shutdown with disruption during 100 ms - t = 13.1 s - Effective shutdown. Throughout the disruption, the HF reaches 5.5 MW.m-2 [6] (see figure 8). The simulation is extended up to 120 seconds in order to represent the cooldown phase.
Figure 8 : Heat Flux (HF) on FW - Plasma shutdown after delayed accident detection with disruption
The FW temperature is dominated by HF magnitude. At the beginning of the transient, the FW maximum temperature is 558°C facing the plasma. The beginning temperature is the same for the three models. During the transient, the temperature increases. The maximum temperature is reached at the middle part of the BU (model Nr 2): 576 °C at t = 1 s (complete loss of coolant), 634 °C at t = 3 s (effective detection of accident), 823 °C at t = 13 s (shutdown with beginning of disruption), 951 °C at t = 13.1 s (end of disruption), 578°C at t = 120 s (end of simulation).
Lithium-Lead
First Wall Cooling Plate
Vertical Stiffening Plate
Horizontal Stiffening Plate
Flow opening at the FW rear
10.5 mm
15 mm
HF 0.5 MW.m-2 – 13 s
HFDisruption 5.5 MW.m-2 – 100 ms
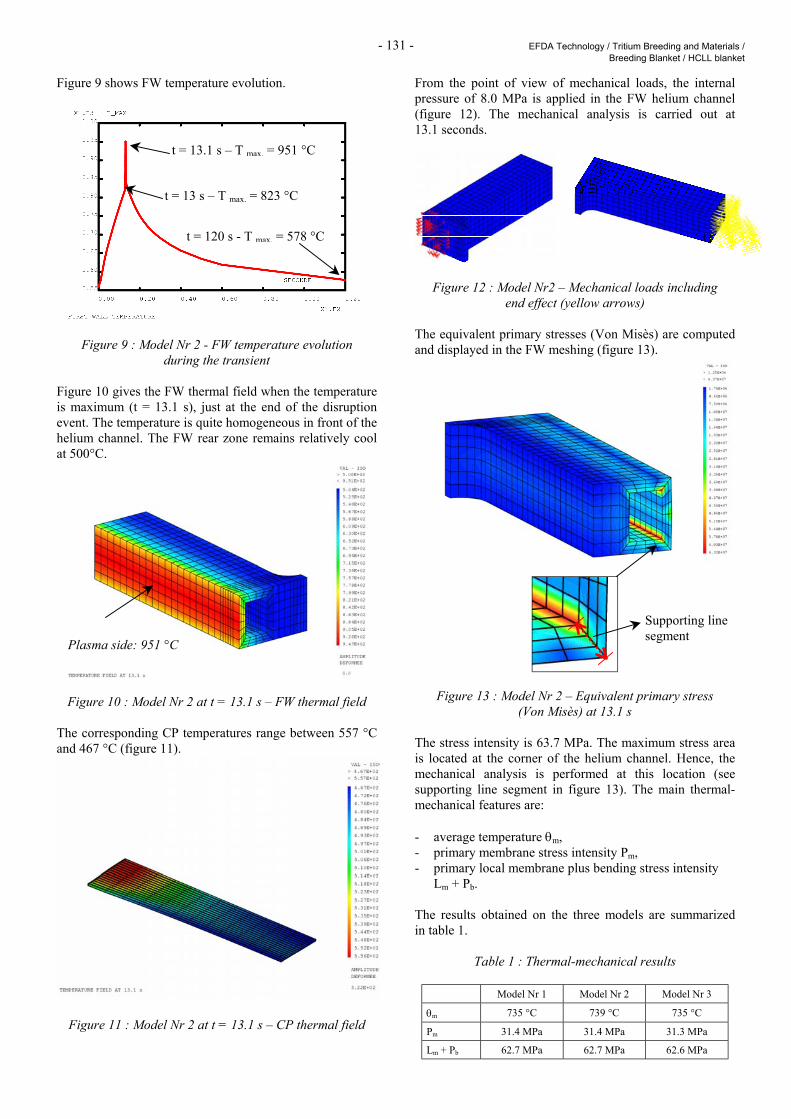
- 131 - EFDA Technology / Tritium Breeding and Materials / Breeding Blanket / HCLL blanket
Figure 9 shows FW temperature evolution.
Figure 9 : Model Nr 2 - FW temperature evolution during the transient
Figure 10 gives the FW thermal field when the temperature is maximum (t = 13.1 s), just at the end of the disruption event. The temperature is quite homogeneous in front of the helium channel. The FW rear zone remains relatively cool at 500°C.
Figure 10 : Model Nr 2 at t = 13.1 s – FW thermal field The corresponding CP temperatures range between 557 °C and 467 °C (figure 11).
Figure 11 : Model Nr 2 at t = 13.1 s – CP thermal field
From the point of view of mechanical loads, the internal pressure of 8.0 MPa is applied in the FW helium channel (figure 12). The mechanical analysis is carried out at 13.1 seconds.
Figure 12 : Model Nr2 – Mechanical loads including end effect (yellow arrows)
The equivalent primary stresses (Von Misès) are computed and displayed in the FW meshing (figure 13).
Figure 13 : Model Nr 2 – Equivalent primary stress (Von Misès) at 13.1 s
The stress intensity is 63.7 MPa. The maximum stress area is located at the corner of the helium channel. Hence, the mechanical analysis is performed at this location (see supporting line segment in figure 13). The main thermal-mechanical features are: - average temperature θm, - primary membrane stress intensity Pm, - primary local membrane plus bending stress intensity
Lm + Pb. The results obtained on the three models are summarized in table 1.
Table 1 : Thermal-mechanical results
Model Nr 1 Model Nr 2 Model Nr 3
θm 735 °C 739 °C 735 °C
Pm 31.4 MPa 31.4 MPa 31.3 MPa
Lm + Pb 62.7 MPa 62.7 MPa 62.6 MPa
Plasma side: 951 °C
t = 120 s - T max. = 578 °C
t = 13 s – T max. = 823 °C
t = 13.1 s – T max. = 951 °C
Supporting line segment
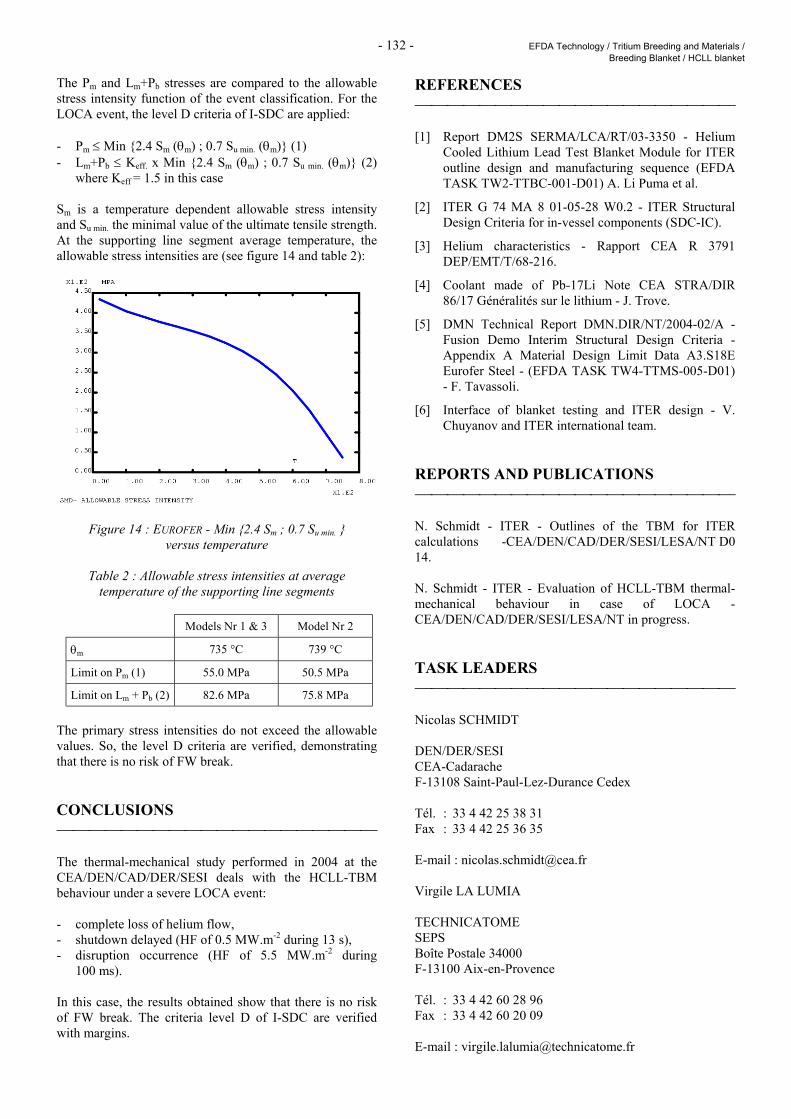
- 132 - EFDA Technology / Tritium Breeding and Materials / Breeding Blanket / HCLL blanket
The Pm and Lm+Pb stresses are compared to the allowable stress intensity function of the event classification. For the LOCA event, the level D criteria of I-SDC are applied: - Pm ≤ Min 2.4 Sm (θm) ; 0.7 Su min. (θm) (1) - Lm+Pb ≤ Keff. x Min 2.4 Sm (θm) ; 0.7 Su min. (θm) (2)
where Keff = 1.5 in this case Sm is a temperature dependent allowable stress intensity and Su min. the minimal value of the ultimate tensile strength. At the supporting line segment average temperature, the allowable stress intensities are (see figure 14 and table 2):
Figure 14 : EUROFER - Min 2.4 Sm ; 0.7 Su min. versus temperature
Table 2 : Allowable stress intensities at average
temperature of the supporting line segments
Models Nr 1 & 3 Model Nr 2
θm 735 °C 739 °C
Limit on Pm (1) 55.0 MPa 50.5 MPa
Limit on Lm + Pb (2) 82.6 MPa 75.8 MPa
The primary stress intensities do not exceed the allowable values. So, the level D criteria are verified, demonstrating that there is no risk of FW break. CONCLUSIONS The thermal-mechanical study performed in 2004 at the CEA/DEN/CAD/DER/SESI deals with the HCLL-TBM behaviour under a severe LOCA event: - complete loss of helium flow, - shutdown delayed (HF of 0.5 MW.m-2 during 13 s), - disruption occurrence (HF of 5.5 MW.m-2 during
100 ms). In this case, the results obtained show that there is no risk of FW break. The criteria level D of I-SDC are verified with margins.
REFERENCES [1] Report DM2S SERMA/LCA/RT/03-3350 - Helium
Cooled Lithium Lead Test Blanket Module for ITER outline design and manufacturing sequence (EFDA TASK TW2-TTBC-001-D01) A. Li Puma et al.
[2] ITER G 74 MA 8 01-05-28 W0.2 - ITER Structural Design Criteria for in-vessel components (SDC-IC).
[3] Helium characteristics - Rapport CEA R 3791 DEP/EMT/T/68-216.
[4] Coolant made of Pb-17Li Note CEA STRA/DIR 86/17 Généralités sur le lithium - J. Trove.
[5] DMN Technical Report DMN.DIR/NT/2004-02/A - Fusion Demo Interim Structural Design Criteria - Appendix A Material Design Limit Data A3.S18E Eurofer Steel - (EFDA TASK TW4-TTMS-005-D01) - F. Tavassoli.
[6] Interface of blanket testing and ITER design - V. Chuyanov and ITER international team.
REPORTS AND PUBLICATIONS N. Schmidt - ITER - Outlines of the TBM for ITER calculations -CEA/DEN/CAD/DER/SESI/LESA/NT D0 14. N. Schmidt - ITER - Evaluation of HCLL-TBM thermal-mechanical behaviour in case of LOCA - CEA/DEN/CAD/DER/SESI/LESA/NT in progress. TASK LEADERS Nicolas SCHMIDT DEN/DER/SESI CEA-Cadarache F-13108 Saint-Paul-Lez-Durance Cedex Tél. : 33 4 42 25 38 31 Fax : 33 4 42 25 36 35 E-mail : [email protected] Virgile LA LUMIA TECHNICATOME SEPS Boîte Postale 34000 F-13100 Aix-en-Provence Tél. : 33 4 42 60 28 96 Fax : 33 4 42 60 20 09 E-mail : [email protected]
- 133 - EFDA Technology / Tritium Breeding and Materials / Breeding Blanket / HCLL blanket
TW4-TTBC-001-D01 Task Title: TBM DESIGN, INTEGRATION AND ANALYSIS Testing programme and engineering design of the first HCLL TBM for
ITER H-H phase INTRODUCTION The objective of this activity is the development of the design and testing programme of the first TBM (Test Blanket Module) to be inserted in ITER during the H-H plasma phase. Is it focused on the TBM itself and therefore the design of the associated systems and components is only very preliminary. In fact, the main part of the TBM design activities have been performed under another subtask [1] and are oriented towards the definition of a TBM design directly derived from the corresponding DEMO modules. These activities will permit to define the design of the TBM required for a fully integrated test program under D-T plasma after several years of operation (the so-called Integral TBM”, IN-TBM). In parallel to this activity, it is essential to define the design and the testing program of the first TBM to be inserted in ITER during H-H plasma (from the first day of ITER operation). The objective of the present subtask is to define a testing program and to develop a design, including instrumentation, for the first TBM able to take advantage of the ITER H-H phase to progressively qualify and optimise the TBM behaviour before D-D and D-T plasma operations. This TBM is often called “Electro-Magnetic TBM” (EM-TBM). 2004 ACTIVITIES The activities for this subtask efficiently start only after having made some progress on the design of the IN-TBM and after the first definition of a relevant instrumentation. Therefore, the 2004 work on the EM-TBM has addressed only the test objectives during the H-H phase and the assessment of the main expected differences between the IN-TBM and the EM-TBM. The finalisation of the subtask is expected in 2005. PROPOSAL FOR A TESTING PROGRAMME DURING H-H PLASMA; KEY POINTS FOR CODE AND TECHNOLOGY QUALIFICATION From the preliminary global list of test objectives to be achieved during ITER program, some fields of test activities have been identified as relevant to be started during the HH phase, on the bases of the following criteria:
- to gain earlier confidence in the TBM before DT phase (ex: structural robustness, compatibility of the module with ITER operations),
- to develop experimental skills on sensitive activities in
real ITER environment (ex: T management using safe D equivalent),
- opportunity to use the specific ITER environmental
conditions not easily available out of this facility (ex: high magnetic fields, stress induced by plasma disruptions),
- interest to host extensive or intrusive instrumentation
before encountering more stressing conditions due to neutron load (validation of MHD codes for LiPb circulation with numerous flow-meters).
Based on these criteria, the main objectives of test during the H-H phase can be summarized as follows: - Verify the need of Be coating on the First Wall (FW)
due to the compatibility with ITER plasma operation. - Assess the impact of RAFM (Reduced Activation Ferro
Magnetic) steel on plasma stability. Ferromagnetic materials cause a deformation of magnetic fields also in static conditions; in ITER the magnetized structures (e.g. of the TBM’s) produce a non-axisymmetrical magnetic field in the plasma region which can affect plasma stability and lead to disruption.
- Develop and validate computational tools suitable for
design calculation of reactors components based on RAFM structures.
- Validate the structural integrity of the box and of the
attachment system (especially during disruption and Vertical Displacement Event). This validation is of extreme importance for the safety dossier for the acceptability of similar TBMs in the D-T phase.
- Measure the Magneto-Hydro-Dynamic (MHD) pressure
drops as a function of PbLi flow-rate. - Assess the tritium diffusion in the PbLi and permeation
into the cooling He and qualify the tritium extraction system and the He purification system. The tritium will be simulated using H/D diluted in the PbLi circuit which has to be tested up to relevant DEMO temperatures. Tests should be performed for different DEMO-relevant H/D-partial pressures such as 100 Pa, 500 Pa, and 1000 Pa.
- 134 - EFDA Technology / Tritium Breeding and Materials / Breeding Blanket / HCLL blanket
- Evaluate the H/D inventory in the TBM and external circuits for different DEMO-relevant D-partial pressures such as 100 Pa, 500 Pa, and 1000 Pa.
- Assess the overall functionality of the HCLL System,
both in the TBM (e.g., heaters if needed, measurement devices such as thermo-couples, sensors, etc.) and in the ancillary equipment for He-circuits (pumps, heat exchanger, flow-meters, thermocouples, etc.) and PbLi circuit (pumps, valves, tritium extractor, etc.).
- Verify the safety-relevant functions (e.g., required time
for valves opening and closing, etc.) implemented in the TBM system.
- Confirm the heat losses, kinetics for heating and cooling
of the circuits, draining of the PbLi. - Validate the capability of heat extraction from the First
Wall (FW), taking into account the deposited surface heat and thermocouples measurements in structures and FW cooling circuit.
During commissioning, the tightness of the various HCLL system components (including external circuits) will be tested with gas (cold and hot) leak tests. The validity of the remote repair procedure will be checked. The PbLi filling procedure, requiring the previous structure heating with circulating He and eventually with appropriate heaters (in order to avoid PbLi freezing) will be moreover validated. TBM DESIGN PROPOSAL AND ANALYSES New concepts allowing easily insertion of the instrumentation have been designed (ex: annular columns between BPs and gloves finger penetration inside BUs), which will be used also in the following TBMs until the IN-TBM. Innovative sensors offering high potential in term of installation facility and insensitivity to nuclear fusion environment could be tested (ex: optic fibre engraved with Bragg grazes for temperature measurement or even for other physical data). Analytical and FEM computations have been performed to assess the possibility to use externally D-saturated LiPb in order to evaluate T-permeation and T-control in the absence of T bulk production by neutron. The expected very low concentration of D in He coolant has led to design a dedicated purge gas circuit in the EM-TBM. Another driving factor for the EM-TBM design is the fabrication constraints that could beneficiate of some relief during H-H phase due to the lower heat load (ex: thicker CPs), according to the recommendations of the manufacturer. These considerations will be integrated in the EM-TBM drawings at the beginning of 2005.
TASK LEADER Wilfrid FARABOLINI DEN/DM2S/SERMA CEA-Saclay F-91191 Gif-sur-Yvette Cedex Tél. : 33 1 69 08 78 79 Fax : 33 1 69 08 99 35 E-mail : [email protected]
- 135 - EFDA Technology / Tritium Breeding and Materials / Structural materials development / RAFM steels
TW2-TTMS-001b-D02 Task Title: IRRADIATION PERFORMANCE Neutron irradiation to 70 dpa at 325°C and PIE INTRODUCTION The main objective of this experiment is to study the irradiation behaviour of Reduced Activation Martensitic steels at high doses and for irradiation temperatures lower than 400°C, where materials are susceptible to reach a high level of hardening and embrittlement. For this purpose, irradiations experiments are conducted in the BOR60 reactor of the Research Institute of Atomic Reactors (RIAR, Dimitrovgrad, Russia) at 325°C. This task includes two items: a) The Post Irradiation Examinations (PIE) corresponding
to specimens irradiated in the first experiment (1st phase, ALTAIR experiment) in BOR60 that finished in 2002 for a dose of 42 dpa max.
b) A 2nd phase of irradiation (ARBOR 2 experiment) in the
same reactor for 40 dpa at the same temperature that will allow to reach a dose of 70-80 dpa in specimens already irradiated in the 1st phase.
The European reference Eurofer 97 (9Cr-1WTaV) RAFM steel, experimental heats type 9Cr-2WTaV and ODS Fe-Cr alloys are included in both irradiations. 2004 ACTIVITIES Specimens included in ALTAIR irradiation experiment have reached a dose ranging from 32 dpa up to 42 dpa. PIE started in 2003 and are conducted in hot cells of RIAR. In the first half of 2004, tensile tests and the measurements of reduction in area values of broken tensile specimens were completed. Also, the profilometry of pressurised tubes re-irradiated in ARBOR 2 experiment and that reached 63 dpa, was performed in June 04. The installation of the impact machine in RIAR’s hot cells was carried out in the first half of 2004. Charpy tests of ALTAIR specimens started in the last quarter 2004. Charpy data completion and other activities such as fractographic examinations and treatment of rough data to determine the energy transition curve for each material are planned in the first half of 2005. Three progress meetings CEA - RIAR to exchange and discuss PIE progression were held in june, september and october 2004.
On the other hand, ARBOR 2 experiment, started in january 2003, goes on according to the initial schedule. The end of this irradiation is foreseen in the second quarter 2005. MATERIALS / SPECIMENS Materials irradiated in BOR60 are: Eurofer 97 (9Cr1WTaV), 9Cr2WTaV, 9Cr2WTaVB and ODS alloys. Chemical compositions and details of metallurgical conditions are given in [1]. RAFM steels, that is, Eurofer97, 9Cr-2WTaV and 9Cr-2WTaVB were produced as plates in the Normalized and Tempered (N&T) conditions. ODS-MA957 ferritic alloy (Fe-14Cr-1Ti-0.3Mo) was produced as rod bars (8mm in diameter) with two different microstructures constituted by: a) Fine Grains (FG, 0.5 microns size) obtained after a stress-relieved treatment; b) recrystallised (R) grain structure (20-50 microns size) obtained with a recrystallisation treatment at 1100°C for 45 minutes. Materials are irradiated as samples destined to mechanical tests. Three types of specimens are included: 1. Tensile specimens of 2 mm in diameter and 12 mm of
gauge length obtained in the transverse direction in the case of RAFM plates, along the axial direction for ODS alloys.
2. Charpy subsize (KLST type) of 3 mm thick, 4mm wide
and 27 mm long machined with TL orientation for RAFM steels, LT for ODS.
3. Pressurized tubes of Eurofer 97 and 9Cr2WTaV steels,
for determination of in-pile creep. The dimensions of tubes are 6.55 mm and 5.65 mm respectively for the external and internal diameter and a total length of 55 mm. Tubes were machined in the transverse direction of plates. The junctions plug-tube were made by EB welding.
ALTAIR IRRADIATION EXPERIMENT (1ST PHASE) This CEA irradiation experiment was shared with other material project. Specimens for the Fusion programme occupied 30% of the rig volume. The rig of Altair was constituted of 7 levels or stages. The environment in the capsule was liquid sodium. The irradiation experiment was conducted over 12 irradiation cycles.
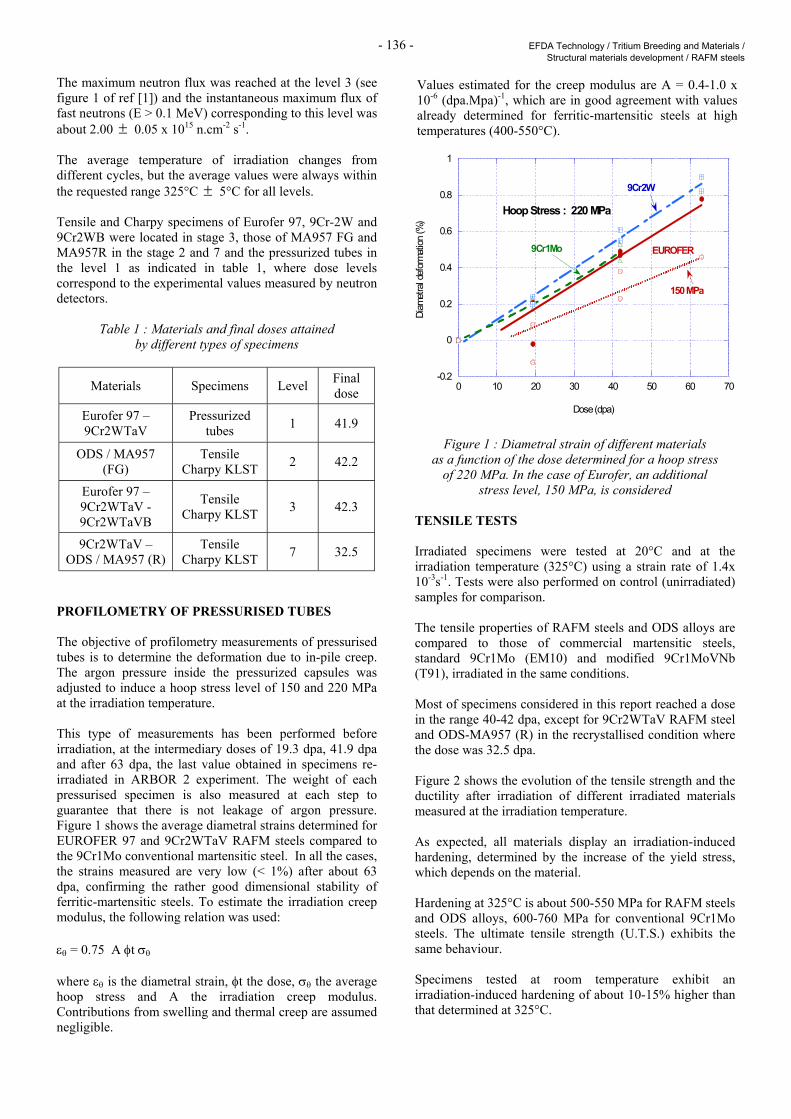
- 136 - EFDA Technology / Tritium Breeding and Materials / Structural materials development / RAFM steels
The maximum neutron flux was reached at the level 3 (see figure 1 of ref [1]) and the instantaneous maximum flux of fast neutrons (E > 0.1 MeV) corresponding to this level was about 2.00 ± 0.05 x 10¹⁵ n.cm-2 s-1. The average temperature of irradiation changes from different cycles, but the average values were always within the requested range 325°C ± 5°C for all levels. Tensile and Charpy specimens of Eurofer 97, 9Cr-2W and 9Cr2WB were located in stage 3, those of MA957 FG and MA957R in the stage 2 and 7 and the pressurized tubes in the level 1 as indicated in table 1, where dose levels correspond to the experimental values measured by neutron detectors.
Table 1 : Materials and final doses attained by different types of specimens
Materials Specimens Level Final dose
Eurofer 97 – 9Cr2WTaV
Pressurized tubes 1 41.9
ODS / MA957 (FG)
Tensile Charpy KLST 2 42.2
Eurofer 97 – 9Cr2WTaV - 9Cr2WTaVB
Tensile Charpy KLST 3 42.3
9Cr2WTaV – ODS / MA957 (R)
Tensile Charpy KLST 7 32.5
PROFILOMETRY OF PRESSURISED TUBES The objective of profilometry measurements of pressurised tubes is to determine the deformation due to in-pile creep. The argon pressure inside the pressurized capsules was adjusted to induce a hoop stress level of 150 and 220 MPa at the irradiation temperature. This type of measurements has been performed before irradiation, at the intermediary doses of 19.3 dpa, 41.9 dpa and after 63 dpa, the last value obtained in specimens re-irradiated in ARBOR 2 experiment. The weight of each pressurised specimen is also measured at each step to guarantee that there is not leakage of argon pressure. Figure 1 shows the average diametral strains determined for EUROFER 97 and 9Cr2WTaV RAFM steels compared to the 9Cr1Mo conventional martensitic steel. In all the cases, the strains measured are very low (< 1%) after about 63 dpa, confirming the rather good dimensional stability of ferritic-martensitic steels. To estimate the irradiation creep modulus, the following relation was used: εθ = 0.75 A φt σθ where εθ is the diametral strain, φt the dose, σθ the average hoop stress and A the irradiation creep modulus. Contributions from swelling and thermal creep are assumed negligible.
-0.2
0
0.2
0.4
0.6
0.8
1
0 10 20 30 40 50 60 70
Diam
etra
l def
orma
tion
(%)
Dose (dpa)
Hoop Stress : 220 MPa
EUROFER
150 MPa
9Cr2W
9Cr1Mo
Figure 1 : Diametral strain of different materials
as a function of the dose determined for a hoop stress of 220 MPa. In the case of Eurofer, an additional
stress level, 150 MPa, is considered TENSILE TESTS Irradiated specimens were tested at 20°C and at the irradiation temperature (325°C) using a strain rate of 1.4x 10⁻³s-1. Tests were also performed on control (unirradiated) samples for comparison. The tensile properties of RAFM steels and ODS alloys are compared to those of commercial martensitic steels, standard 9Cr1Mo (EM10) and modified 9Cr1MoVNb (T91), irradiated in the same conditions. Most of specimens considered in this report reached a dose in the range 40-42 dpa, except for 9Cr2WTaV RAFM steel and ODS-MA957 (R) in the recrystallised condition where the dose was 32.5 dpa. Figure 2 shows the evolution of the tensile strength and the ductility after irradiation of different irradiated materials measured at the irradiation temperature. As expected, all materials display an irradiation-induced hardening, determined by the increase of the yield stress, which depends on the material. Hardening at 325°C is about 500-550 MPa for RAFM steels and ODS alloys, 600-760 MPa for conventional 9Cr1Mo steels. The ultimate tensile strength (U.T.S.) exhibits the same behaviour. Specimens tested at room temperature exhibit an irradiation-induced hardening of about 10-15% higher than that determined at 325°C.
Values estimated for the creep modulus are A = 0.4-1.0 x10⁻⁶ (dpa.Mpa)-1, which are in good agreement with valuesalready determined for ferritic-martensitic steels at hightemperatures (400-550°C).
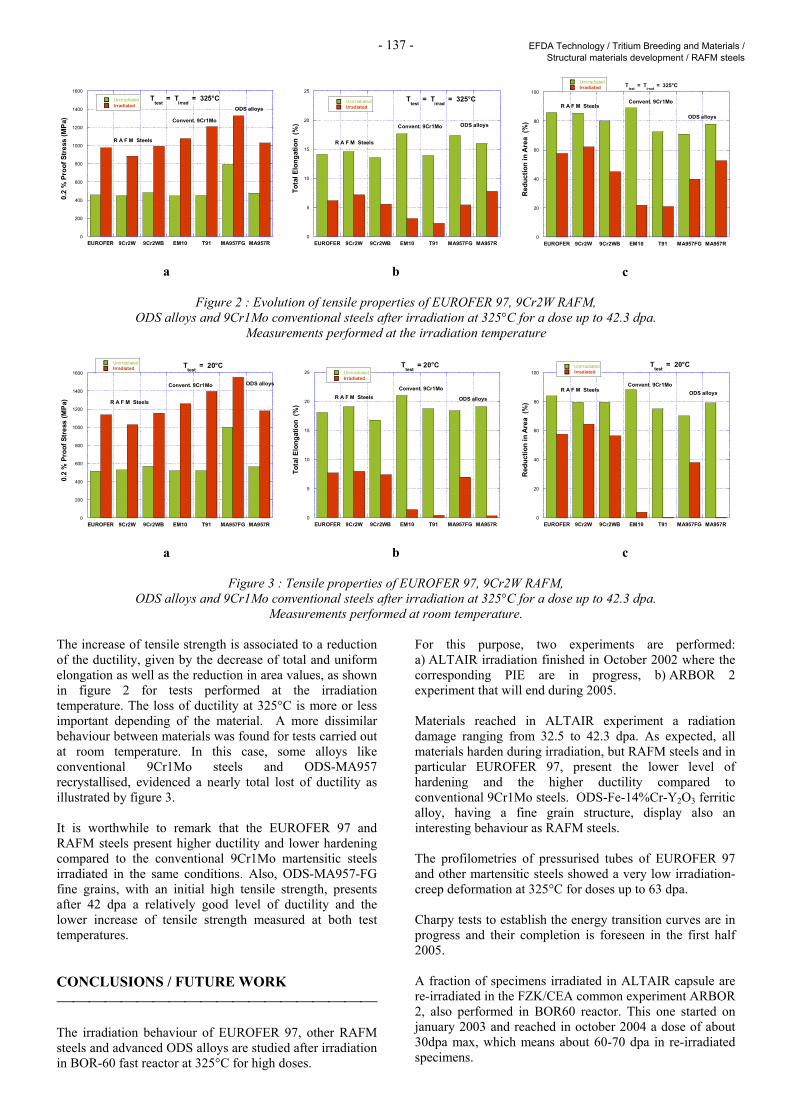
- 137 - EFDA Technology / Tritium Breeding and Materials / Structural materials development / RAFM steels
0
200
400
600
800
1000
1200
1400
1600
EUROFER 9Cr2W 9Cr2WB EM10 T91 MA957FG MA957R
Ttest
= Tirrad
= 325°CUnirradiatedIrradiated
0.2
% P
roof
Str
ess
(MPa
)
R A F M Steels
Convent. 9Cr1Mo
ODS alloys
a
0
5
10
15
20
25
EUROFER 9Cr2W 9Cr2WB EM10 T91 MA957FG MA957R
Ttest
= Tirrad
= 325°CUnirradiatedIrradiated
Tota
l Elo
ngat
ion
(%)
R A F M Steels
Convent. 9Cr1Mo ODS alloys
b
0
20
40
60
80
100
EUROFER 9Cr2W 9Cr2WB EM10 T91 MA957FG MA957R
Ttest
= Tirrad
= 325°CUnirradiatedIrradiated
Red
uctio
n in
Are
a (%
)
R A F M SteelsConvent. 9Cr1Mo
ODS alloys
c
Figure 2 : Evolution of tensile properties of EUROFER 97, 9Cr2W RAFM, ODS alloys and 9Cr1Mo conventional steels after irradiation at 325°C for a dose up to 42.3 dpa.
Measurements performed at the irradiation temperature
0
200
400
600
800
1000
1200
1400
1600
EUROFER 9Cr2W 9Cr2WB EM10 T91 MA957FG MA957R
Ttest
= 20°C UnirradiatedIrradiated
0.2
% P
roof
Str
ess
(MPa
) R A F M Steels
Convent. 9Cr1Mo ODS alloys
a
0
5
10
15
20
25
EUROFER 9Cr2W 9Cr2WB EM10 T91 MA957FG MA957R
Ttest
= 20°C UnirradiatedIrradiated
Tota
l Elo
ngat
ion
(%)
R A F M SteelsConvent. 9Cr1Mo
ODS alloys
b
0
20
40
60
80
100
EUROFER 9Cr2W 9Cr2WB EM10 T91 MA957FG MA957R
Ttest
= 20°C UnirradiatedIrradiated
Red
uctio
n in
Are
a (%
)
R A F M SteelsConvent. 9Cr1Mo
ODS alloys
c
Figure 3 : Tensile properties of EUROFER 97, 9Cr2W RAFM,
ODS alloys and 9Cr1Mo conventional steels after irradiation at 325°C for a dose up to 42.3 dpa. Measurements performed at room temperature.
The increase of tensile strength is associated to a reduction of the ductility, given by the decrease of total and uniform elongation as well as the reduction in area values, as shown in figure 2 for tests performed at the irradiation temperature. The loss of ductility at 325°C is more or less important depending of the material. A more dissimilar behaviour between materials was found for tests carried out at room temperature. In this case, some alloys like conventional 9Cr1Mo steels and ODS-MA957 recrystallised, evidenced a nearly total lost of ductility as illustrated by figure 3. It is worthwhile to remark that the EUROFER 97 and RAFM steels present higher ductility and lower hardening compared to the conventional 9Cr1Mo martensitic steels irradiated in the same conditions. Also, ODS-MA957-FG fine grains, with an initial high tensile strength, presents after 42 dpa a relatively good level of ductility and the lower increase of tensile strength measured at both test temperatures. CONCLUSIONS / FUTURE WORK The irradiation behaviour of EUROFER 97, other RAFM steels and advanced ODS alloys are studied after irradiation in BOR-60 fast reactor at 325°C for high doses.
For this purpose, two experiments are performed: a) ALTAIR irradiation finished in October 2002 where the corresponding PIE are in progress, b) ARBOR 2 experiment that will end during 2005. Materials reached in ALTAIR experiment a radiation damage ranging from 32.5 to 42.3 dpa. As expected, all materials harden during irradiation, but RAFM steels and in particular EUROFER 97, present the lower level of hardening and the higher ductility compared to conventional 9Cr1Mo steels. ODS-Fe-14%Cr-Y2O3 ferritic alloy, having a fine grain structure, display also an interesting behaviour as RAFM steels. The profilometries of pressurised tubes of EUROFER 97 and other martensitic steels showed a very low irradiation-creep deformation at 325°C for doses up to 63 dpa. Charpy tests to establish the energy transition curves are in progress and their completion is foreseen in the first half 2005. A fraction of specimens irradiated in ALTAIR capsule are re-irradiated in the FZK/CEA common experiment ARBOR 2, also performed in BOR60 reactor. This one started on january 2003 and reached in october 2004 a dose of about 30dpa max, which means about 60-70 dpa in re-irradiated specimens.
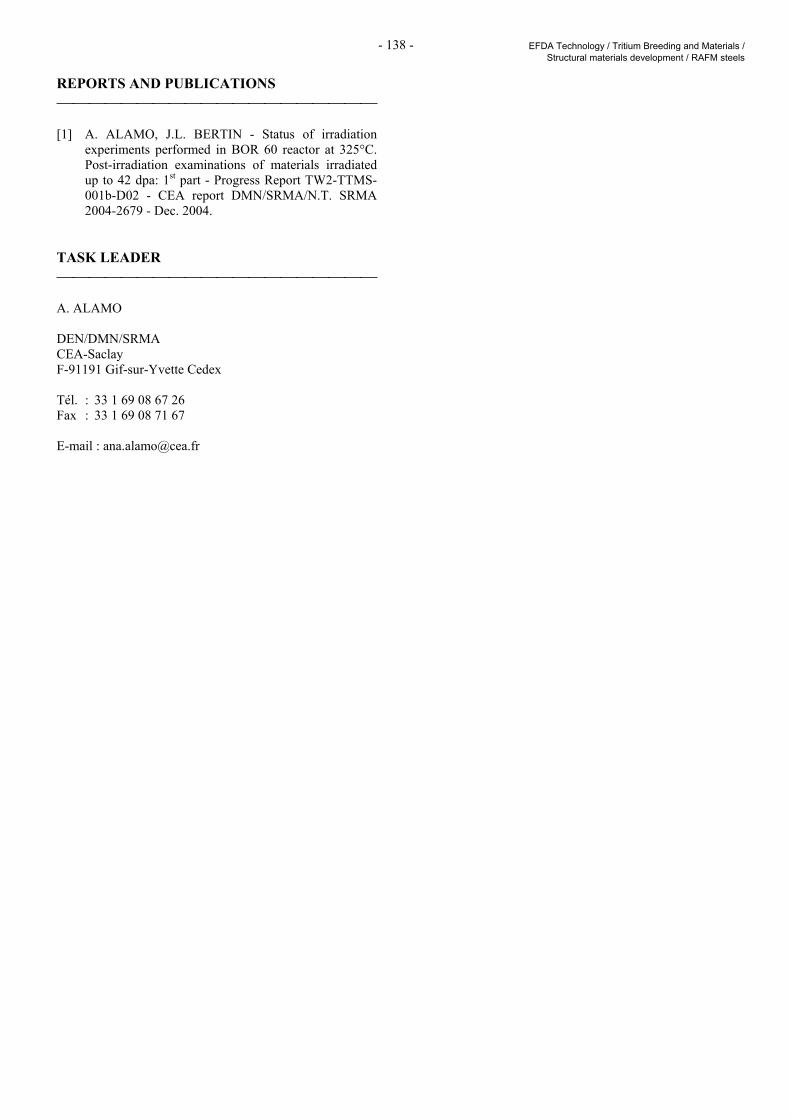
- 138 - EFDA Technology / Tritium Breeding and Materials / Structural materials development / RAFM steels
REPORTS AND PUBLICATIONS [1] A. ALAMO, J.L. BERTIN - Status of irradiation
experiments performed in BOR 60 reactor at 325°C. Post-irradiation examinations of materials irradiated up to 42 dpa: 1st part - Progress Report TW2-TTMS-001b-D02 - CEA report DMN/SRMA/N.T. SRMA 2004-2679 - Dec. 2004.
TASK LEADER A. ALAMO DEN/DMN/SRMA CEA-Saclay F-91191 Gif-sur-Yvette Cedex Tél. : 33 1 69 08 67 26 Fax : 33 1 69 08 71 67 E-mail : [email protected]
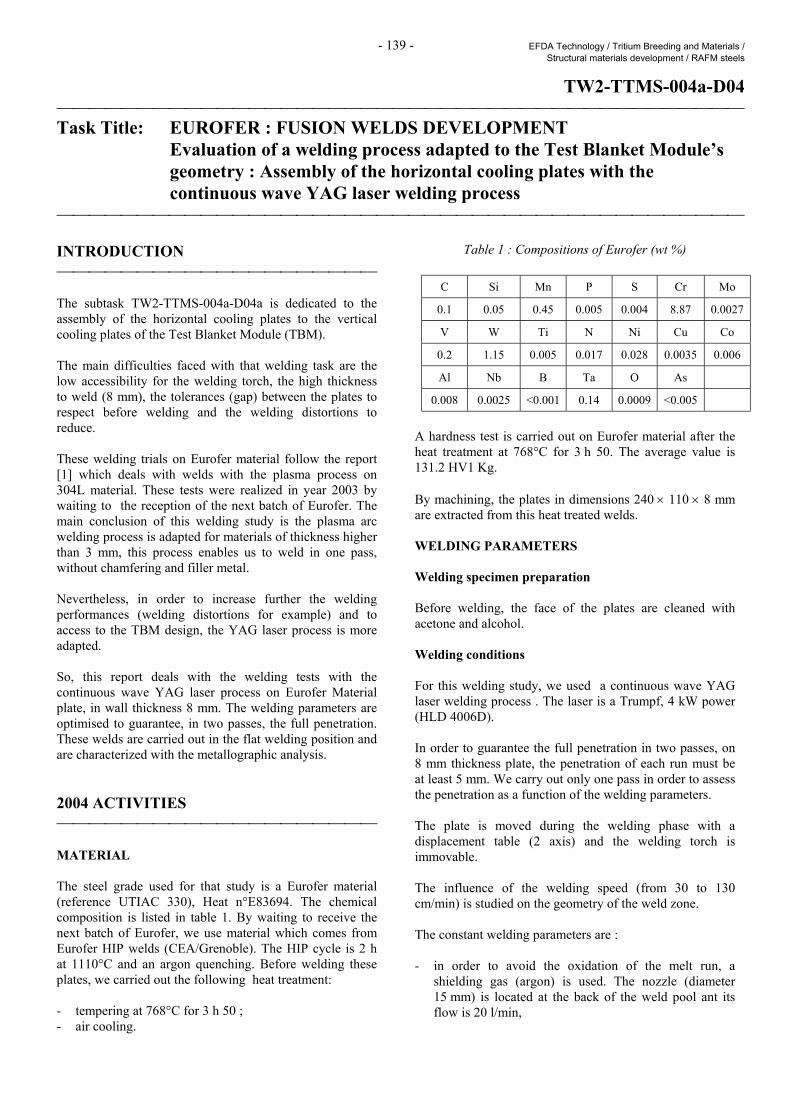
- 139 - EFDA Technology / Tritium Breeding and Materials / Structural materials development / RAFM steels
TW2-TTMS-004a-D04 Task Title: EUROFER : FUSION WELDS DEVELOPMENT Evaluation of a welding process adapted to the Test Blanket Module’s
geometry : Assembly of the horizontal cooling plates with the continuous wave YAG laser welding process
INTRODUCTION The subtask TW2-TTMS-004a-D04a is dedicated to the assembly of the horizontal cooling plates to the vertical cooling plates of the Test Blanket Module (TBM). The main difficulties faced with that welding task are the low accessibility for the welding torch, the high thickness to weld (8 mm), the tolerances (gap) between the plates to respect before welding and the welding distortions to reduce. These welding trials on Eurofer material follow the report [1] which deals with welds with the plasma process on 304L material. These tests were realized in year 2003 by waiting to the reception of the next batch of Eurofer. The main conclusion of this welding study is the plasma arc welding process is adapted for materials of thickness higher than 3 mm, this process enables us to weld in one pass, without chamfering and filler metal. Nevertheless, in order to increase further the welding performances (welding distortions for example) and to access to the TBM design, the YAG laser process is more adapted. So, this report deals with the welding tests with the continuous wave YAG laser process on Eurofer Material plate, in wall thickness 8 mm. The welding parameters are optimised to guarantee, in two passes, the full penetration. These welds are carried out in the flat welding position and are characterized with the metallographic analysis. 2004 ACTIVITIES MATERIAL The steel grade used for that study is a Eurofer material (reference UTIAC 330), Heat n°E83694. The chemical composition is listed in table 1. By waiting to receive the next batch of Eurofer, we use material which comes from Eurofer HIP welds (CEA/Grenoble). The HIP cycle is 2 h at 1110°C and an argon quenching. Before welding these plates, we carried out the following heat treatment: - tempering at 768°C for 3 h 50 ; - air cooling.
Table 1 : Compositions of Eurofer (wt %) A hardness test is carried out on Eurofer material after the heat treatment at 768°C for 3 h 50. The average value is 131.2 HV1 Kg. By machining, the plates in dimensions 240 × 110 × 8 mm are extracted from this heat treated welds. WELDING PARAMETERS Welding specimen preparation Before welding, the face of the plates are cleaned with acetone and alcohol. Welding conditions For this welding study, we used a continuous wave YAG laser welding process . The laser is a Trumpf, 4 kW power (HLD 4006D). In order to guarantee the full penetration in two passes, on 8 mm thickness plate, the penetration of each run must be at least 5 mm. We carry out only one pass in order to assess the penetration as a function of the welding parameters. The plate is moved during the welding phase with a displacement table (2 axis) and the welding torch is immovable. The influence of the welding speed (from 30 to 130 cm/min) is studied on the geometry of the weld zone. The constant welding parameters are : - in order to avoid the oxidation of the melt run, a
shielding gas (argon) is used. The nozzle (diameter 15 mm) is located at the back of the weld pool ant its flow is 20 l/min,
C Si Mn P S Cr Mo
0.1 0.05 0.45 0.005 0.004 8.87 0.0027
V W Ti N Ni Cu Co
0.2 1.15 0.005 0.017 0.028 0.0035 0.006
Al Nb B Ta O As
0.008 0.0025 <0.001 0.14 0.0009 <0.005
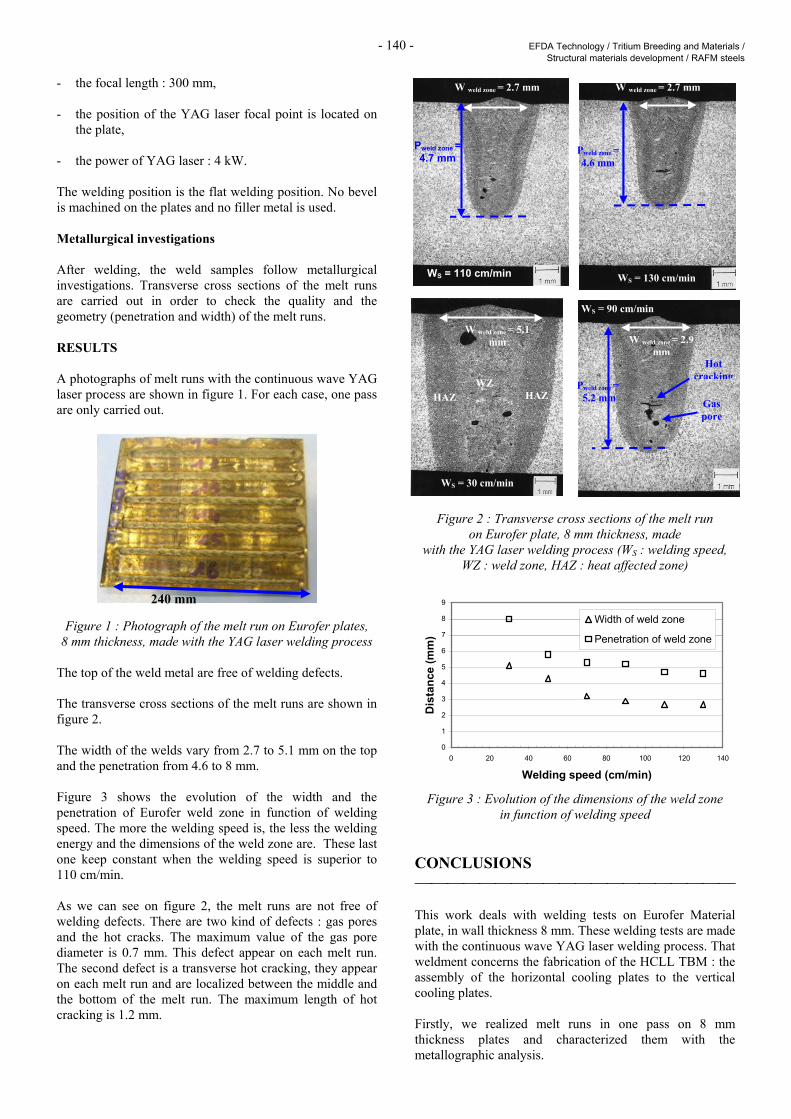
- 140 - EFDA Technology / Tritium Breeding and Materials / Structural materials development / RAFM steels
- the focal length : 300 mm, - the position of the YAG laser focal point is located on
the plate, - the power of YAG laser : 4 kW. The welding position is the flat welding position. No bevel is machined on the plates and no filler metal is used. Metallurgical investigations After welding, the weld samples follow metallurgical investigations. Transverse cross sections of the melt runs are carried out in order to check the quality and the geometry (penetration and width) of the melt runs. RESULTS A photographs of melt runs with the continuous wave YAG laser process are shown in figure 1. For each case, one pass are only carried out.
Figure 1 : Photograph of the melt run on Eurofer plates, 8 mm thickness, made with the YAG laser welding process
The top of the weld metal are free of welding defects. The transverse cross sections of the melt runs are shown in figure 2. The width of the welds vary from 2.7 to 5.1 mm on the top and the penetration from 4.6 to 8 mm. Figure 3 shows the evolution of the width and the penetration of Eurofer weld zone in function of welding speed. The more the welding speed is, the less the welding energy and the dimensions of the weld zone are. These last one keep constant when the welding speed is superior to 110 cm/min. As we can see on figure 2, the melt runs are not free of welding defects. There are two kind of defects : gas pores and the hot cracks. The maximum value of the gas pore diameter is 0.7 mm. This defect appear on each melt run. The second defect is a transverse hot cracking, they appear on each melt run and are localized between the middle and the bottom of the melt run. The maximum length of hot cracking is 1.2 mm.
Figure 2 : Transverse cross sections of the melt run on Eurofer plate, 8 mm thickness, made
with the YAG laser welding process (WS : welding speed, WZ : weld zone, HAZ : heat affected zone)
0
1
2
3
4
5
6
7
8
9
0 20 40 60 80 100 120 140
Welding speed (cm/min)
Dis
tanc
e (m
m)
Width of weld zone
Penetration of weld zone
Figure 3 : Evolution of the dimensions of the weld zone
in function of welding speed CONCLUSIONS This work deals with welding tests on Eurofer Material plate, in wall thickness 8 mm. These welding tests are made with the continuous wave YAG laser welding process. That weldment concerns the fabrication of the HCLL TBM : the assembly of the horizontal cooling plates to the vertical cooling plates. Firstly, we realized melt runs in one pass on 8 mm thickness plates and characterized them with the metallographic analysis.
WS = 30 cm/min
W weld zone = 5.1 mm
WZ HAZ HAZ
WS = 90 cm/min
W weld zone = 2.9 mm
Gas pore
Pweld zone = 5.2 mm
Hot cracking
WS = 110 cm/min
W weld zone = 2.7 mm
Pweld zone = 4.7 mm
WS = 130 cm/min
W weld zone = 2.7 mm
Pweld zone = 4.6 mm
240 mm
- 141 - EFDA Technology / Tritium Breeding and Materials / Structural materials development / RAFM steels
The penetration of the weld zone ranges from 4.6 to 8 mm. The penetration of 8 mm is obtained for a low welding speed (30 cm/min). The metallurgical analysis of the Eurofer welds shows the existence of two kinds of welding defects : gas pores and hot cracks. As it was thought [2], the Eurofer material is sensitive to the hot cracking phenomenon with the YAG laser welding process. That first result confirms that it is necessary to go further in the weldability studies for the TBM configurations : to work further on the welding process to find out right welding parameters or/and a welding process able to weld with no defects in reducing the welding deformations. REPORTS AND PUBLICATIONS [1] Fusion welds development test blanket module’s
welding procedures : assembly of the horizontal cooling plates to the vertical plates with the plasma arc welding process - L. Forest - UTA/04-RT-43, 9 January 2004.
[2] CEA weldability developments on RAFM steels in the
period 1994-2003 - G. De Dinechin, C. Chagnot, P. Aubert - UTIAC/04-RT-16, 24 June 2004.
TASK LEADER Laurent FOREST DRT/DTEN/UTIAC CEA-Saclay F-91191 Gif-sur-Yvette Cedex Tél. : 33 1 69 08 23 51 Fax : 33 1 69 08 90 23 E-mail : [email protected]

- 142 - EFDA Technology / Tritium Breeding and Materials / Structural materials development / RAFM steels
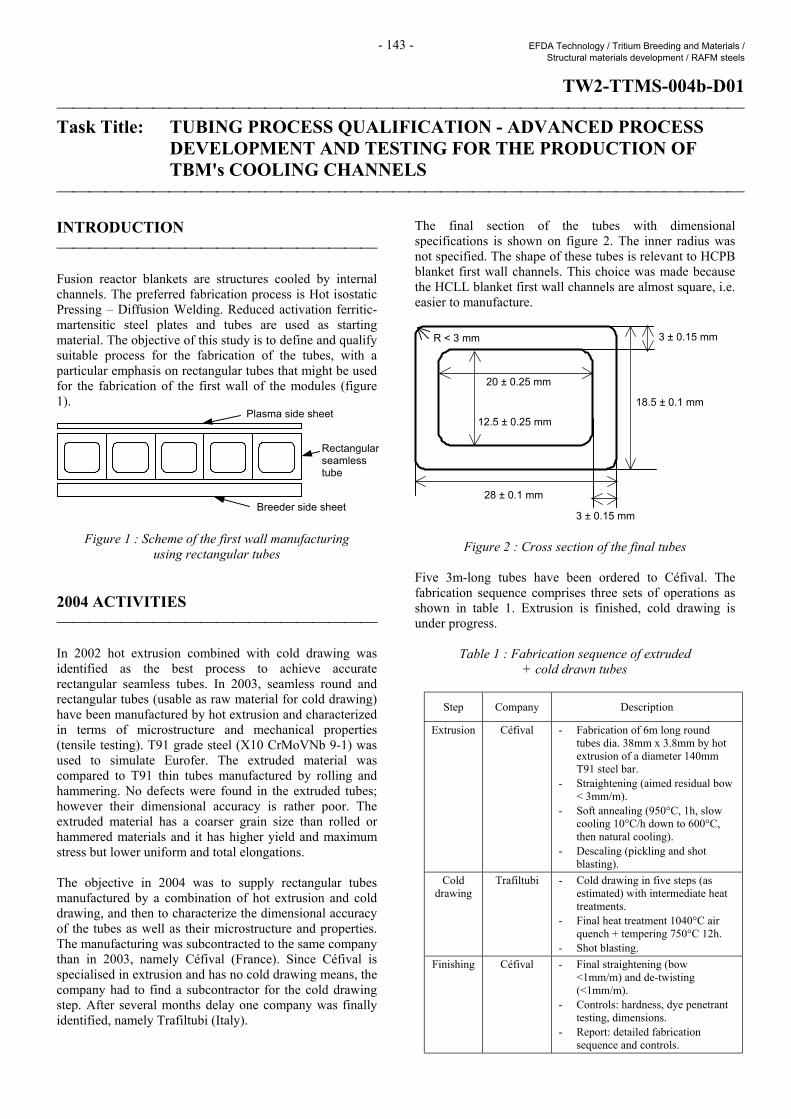
- 143 - EFDA Technology / Tritium Breeding and Materials / Structural materials development / RAFM steels
TW2-TTMS-004b-D01 Task Title: TUBING PROCESS QUALIFICATION - ADVANCED PROCESS
DEVELOPMENT AND TESTING FOR THE PRODUCTION OF TBM's COOLING CHANNELS
INTRODUCTION Fusion reactor blankets are structures cooled by internal channels. The preferred fabrication process is Hot isostatic Pressing – Diffusion Welding. Reduced activation ferritic-martensitic steel plates and tubes are used as starting material. The objective of this study is to define and qualify suitable process for the fabrication of the tubes, with a particular emphasis on rectangular tubes that might be used for the fabrication of the first wall of the modules (figure 1).
Figure 1 : Scheme of the first wall manufacturing using rectangular tubes
2004 ACTIVITIES In 2002 hot extrusion combined with cold drawing was identified as the best process to achieve accurate rectangular seamless tubes. In 2003, seamless round and rectangular tubes (usable as raw material for cold drawing) have been manufactured by hot extrusion and characterized in terms of microstructure and mechanical properties (tensile testing). T91 grade steel (X10 CrMoVNb 9-1) was used to simulate Eurofer. The extruded material was compared to T91 thin tubes manufactured by rolling and hammering. No defects were found in the extruded tubes; however their dimensional accuracy is rather poor. The extruded material has a coarser grain size than rolled or hammered materials and it has higher yield and maximum stress but lower uniform and total elongations. The objective in 2004 was to supply rectangular tubes manufactured by a combination of hot extrusion and cold drawing, and then to characterize the dimensional accuracy of the tubes as well as their microstructure and properties. The manufacturing was subcontracted to the same company than in 2003, namely Céfival (France). Since Céfival is specialised in extrusion and has no cold drawing means, the company had to find a subcontractor for the cold drawing step. After several months delay one company was finally identified, namely Trafiltubi (Italy).
The final section of the tubes with dimensional specifications is shown on figure 2. The inner radius was not specified. The shape of these tubes is relevant to HCPB blanket first wall channels. This choice was made because the HCLL blanket first wall channels are almost square, i.e. easier to manufacture.
Figure 2 : Cross section of the final tubes Five 3m-long tubes have been ordered to Céfival. The fabrication sequence comprises three sets of operations as shown in table 1. Extrusion is finished, cold drawing is under progress.
Table 1 : Fabrication sequence of extruded + cold drawn tubes
Step Company Description
Extrusion Céfival - Fabrication of 6m long round tubes dia. 38mm x 3.8mm by hot extrusion of a diameter 140mm T91 steel bar.
- Straightening (aimed residual bow < 3mm/m).
- Soft annealing (950°C, 1h, slow cooling 10°C/h down to 600°C, then natural cooling).
- Descaling (pickling and shot blasting).
Cold drawing
Trafiltubi - Cold drawing in five steps (as estimated) with intermediate heat treatments.
- Final heat treatment 1040°C air quench + tempering 750°C 12h.
- Shot blasting. Finishing Céfival - Final straightening (bow
<1mm/m) and de-twisting (<1mm/m).
- Controls: hardness, dye penetrant testing, dimensions.
- Report: detailed fabrication sequence and controls.
12.5 ± 0.25 mm
R < 3 mm 3 ± 0.15 mm
20 ± 0.25 mm
18.5 ± 0.1 mm
28 ± 0.1 mm
3 ± 0.15 mm
Plasma side sheet
Breeder side sheet
Rectangular seamless tube
- 144 - EFDA Technology / Tritium Breeding and Materials / Structural materials development / RAFM steels
CONCLUSIONS Following year 2002 and 2003 work, a fabrication of extruded + cold drawn T91 steel tubes is under way. These tubes look like HCPB blanket first wall channels. Dimensional control, microstructural investigations and tensile testing will be made to assess the quality of the material in view of using such fabrication process for the manufacturing of breeding blanket first wall. TASK LEADER Emmanuel RIGAL DRT/DTEN/S3ME/LMIC CEA-Grenoble 17, rue des Martyrs F-38054 Grenoble Cedex 9 Tél. : 33 4 38 78 97 22 Fax : 33 4 38 78 54 79 E-mail : [email protected]
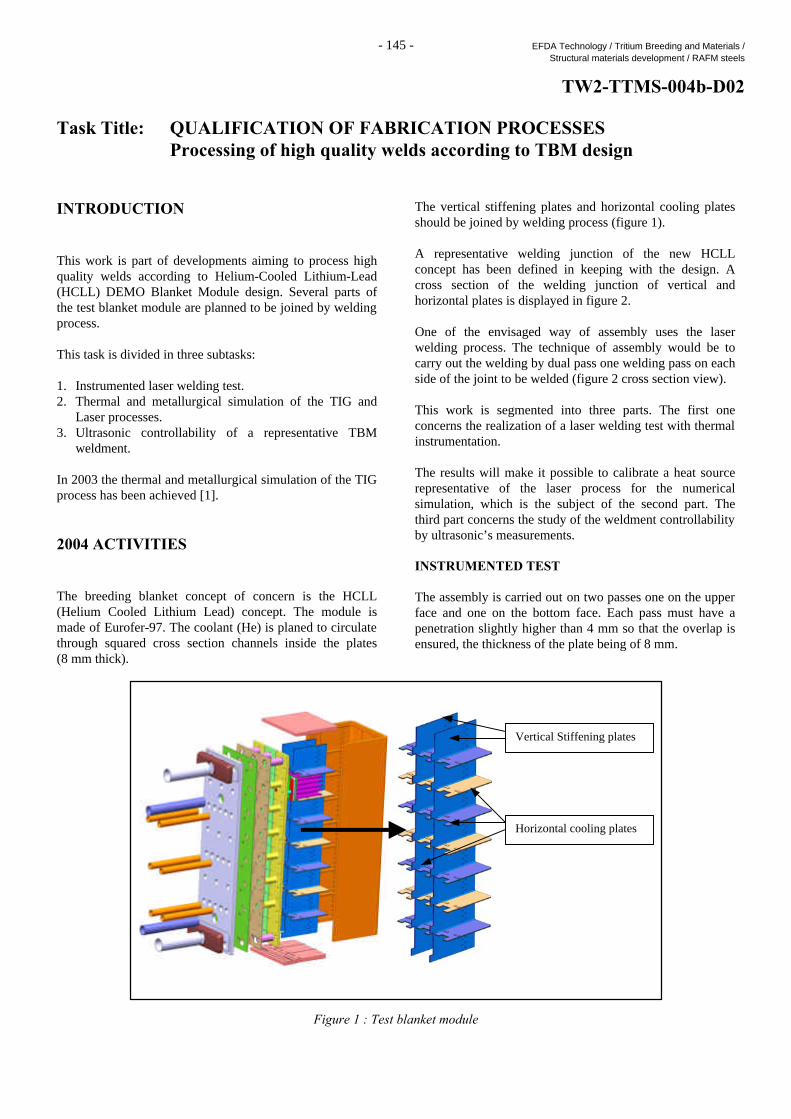
- 145 - EFDA Technology / Tritium Breeding and Materials / Structural materials development / RAFM steels
TW2-TTMS-004b-D02 Task Title: QUALIFICATION OF FABRICATION PROCESSES Processing of high quality welds according to TBM design INTRODUCTION This work is part of developments aiming to process high quality welds according to Helium-Cooled Lithium-Lead (HCLL) DEMO Blanket Module design. Several parts of the test blanket module are planned to be joined by welding process. This task is divided in three subtasks: 1. Instrumented laser welding test. 2. Thermal and metallurgical simulation of the TIG and
Laser processes. 3. Ultrasonic controllability of a representative TBM
weldment. In 2003 the thermal and metallurgical simulation of the TIG process has been achieved [1]. 2004 ACTIVITIES The breeding blanket concept of concern is the HCLL (Helium Cooled Lithium Lead) concept. The module is made of Eurofer-97. The coolant (He) is planed to circulate through squared cross section channels inside the plates (8 mm thick).
The vertical stiffening plates and horizontal cooling plates should be joined by welding process (figure 1). A representative welding junction of the new HCLL concept has been defined in keeping with the design. A cross section of the welding junction of vertical and horizontal plates is displayed in figure 2. One of the envisaged way of assembly uses the laser welding process. The technique of assembly would be to carry out the welding by dual pass one welding pass on each side of the joint to be welded (figure 2 cross section view). This work is segmented into three parts. The first one concerns the realization of a laser welding test with thermal instrumentation. The results will make it possible to calibrate a heat source representative of the laser process for the numerical simulation, which is the subject of the second part. The third part concerns the study of the weldment controllability by ultrasonic’s measurements. INSTRUMENTED TEST The assembly is carried out on two passes one on the upper face and one on the bottom face. Each pass must have a penetration slightly higher than 4 mm so that the overlap is ensured, the thickness of the plate being of 8 mm.
Figure 1 : Test blanket module
Horizontal cooling plates
Vertical Stiffening plates
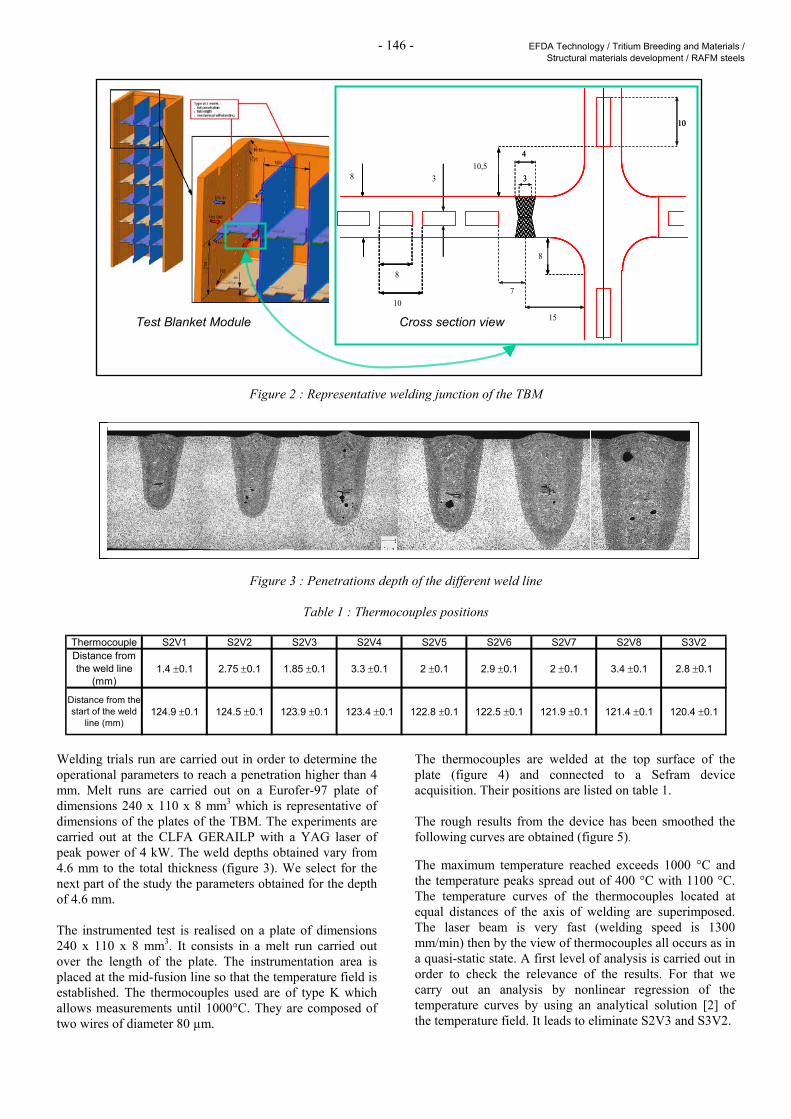
- 146 - EFDA Technology / Tritium Breeding and Materials / Structural materials development / RAFM steels
Figure 2 : Representative welding junction of the TBM
Figure 3 : Penetrations depth of the different weld line
Table 1 : Thermocouples positions
Thermocouple S2V1 S2V2 S2V3 S2V4 S2V5 S2V6 S2V7 S2V8 S3V2Distance from the weld line
(mm)1.4 ±0.1 2.75 ±0.1 1.85 ±0.1 3.3 ±0.1 2 ±0.1 2.9 ±0.1 2 ±0.1 3.4 ±0.1 2.8 ±0.1
Distance from the start of the weld
line (mm)124.9 ±0.1 124.5 ±0.1 123.9 ±0.1 123.4 ±0.1 122.8 ±0.1 122.5 ±0.1 121.9 ±0.1 121.4 ±0.1 120.4 ±0.1
Welding trials run are carried out in order to determine the operational parameters to reach a penetration higher than 4 mm. Melt runs are carried out on a Eurofer-97 plate of dimensions 240 x 110 x 8 mm3 which is representative of dimensions of the plates of the TBM. The experiments are carried out at the CLFA GERAILP with a YAG laser of peak power of 4 kW. The weld depths obtained vary from 4.6 mm to the total thickness (figure 3). We select for the next part of the study the parameters obtained for the depth of 4.6 mm. The instrumented test is realised on a plate of dimensions 240 x 110 x 8 mm3. It consists in a melt run carried out over the length of the plate. The instrumentation area is placed at the mid-fusion line so that the temperature field is established. The thermocouples used are of type K which allows measurements until 1000°C. They are composed of two wires of diameter 80 µm.
The thermocouples are welded at the top surface of the plate (figure 4) and connected to a Sefram device acquisition. Their positions are listed on table 1. The rough results from the device has been smoothed the following curves are obtained (figure 5). The maximum temperature reached exceeds 1000 °C and the temperature peaks spread out of 400 °C with 1100 °C. The temperature curves of the thermocouples located at equal distances of the axis of welding are superimposed. The laser beam is very fast (welding speed is 1300 mm/min) then by the view of thermocouples all occurs as in a quasi-static state. A first level of analysis is carried out in order to check the relevance of the results. For that we carry out an analysis by nonlinear regression of the temperature curves by using an analytical solution [2] of the temperature field. It leads to eliminate S2V3 and S3V2.
10
3
7
15
3
410,5
8
8
10
8
10
3
7
15
3
410,5
8
8
10
8
10,58
8
10
8
10,58
8
10
8
Cross section view Test Blanket Module
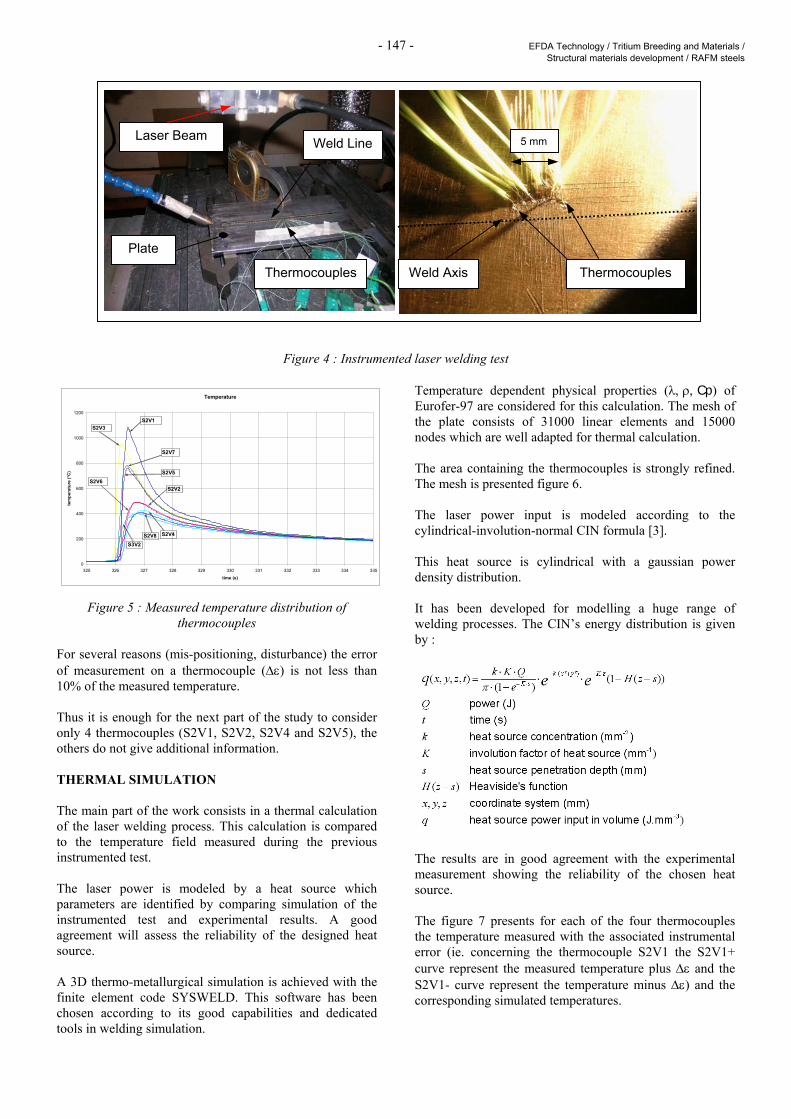
- 147 - EFDA Technology / Tritium Breeding and Materials / Structural materials development / RAFM steels
Figure 4 : Instrumented laser welding test
Figure 5 : Measured temperature distribution of thermocouples
For several reasons (mis-positioning, disturbance) the error of measurement on a thermocouple (∆ε) is not less than 10% of the measured temperature. Thus it is enough for the next part of the study to consider only 4 thermocouples (S2V1, S2V2, S2V4 and S2V5), the others do not give additional information. THERMAL SIMULATION The main part of the work consists in a thermal calculation of the laser welding process. This calculation is compared to the temperature field measured during the previous instrumented test. The laser power is modeled by a heat source which parameters are identified by comparing simulation of the instrumented test and experimental results. A good agreement will assess the reliability of the designed heat source. A 3D thermo-metallurgical simulation is achieved with the finite element code SYSWELD. This software has been chosen according to its good capabilities and dedicated tools in welding simulation.
Temperature dependent physical properties (λ, ρ, Cp) of Eurofer-97 are considered for this calculation. The mesh of the plate consists of 31000 linear elements and 15000 nodes which are well adapted for thermal calculation. The area containing the thermocouples is strongly refined. The mesh is presented figure 6. The laser power input is modeled according to the cylindrical-involution-normal CIN formula [3]. This heat source is cylindrical with a gaussian power density distribution. It has been developed for modelling a huge range of welding processes. The CIN’s energy distribution is given by :
The results are in good agreement with the experimental measurement showing the reliability of the chosen heat source. The figure 7 presents for each of the four thermocouples the temperature measured with the associated instrumental error (ie. concerning the thermocouple S2V1 the S2V1+ curve represent the measured temperature plus ∆ε and the S2V1- curve represent the temperature minus ∆ε) and the corresponding simulated temperatures.
5 mm
Thermocouples Weld Axis
Plate
Laser Beam Weld Line
Thermocouples
Temperature
0
200
400
600
800
1000
1200
325 326 327 328 329 330 331 332 333 334 335time (s)
tem
pera
ture
(°C
)
S2V1
S2V7
S2V6S2V5
S2V4
S2V3
S2V2
S2V8S3V2
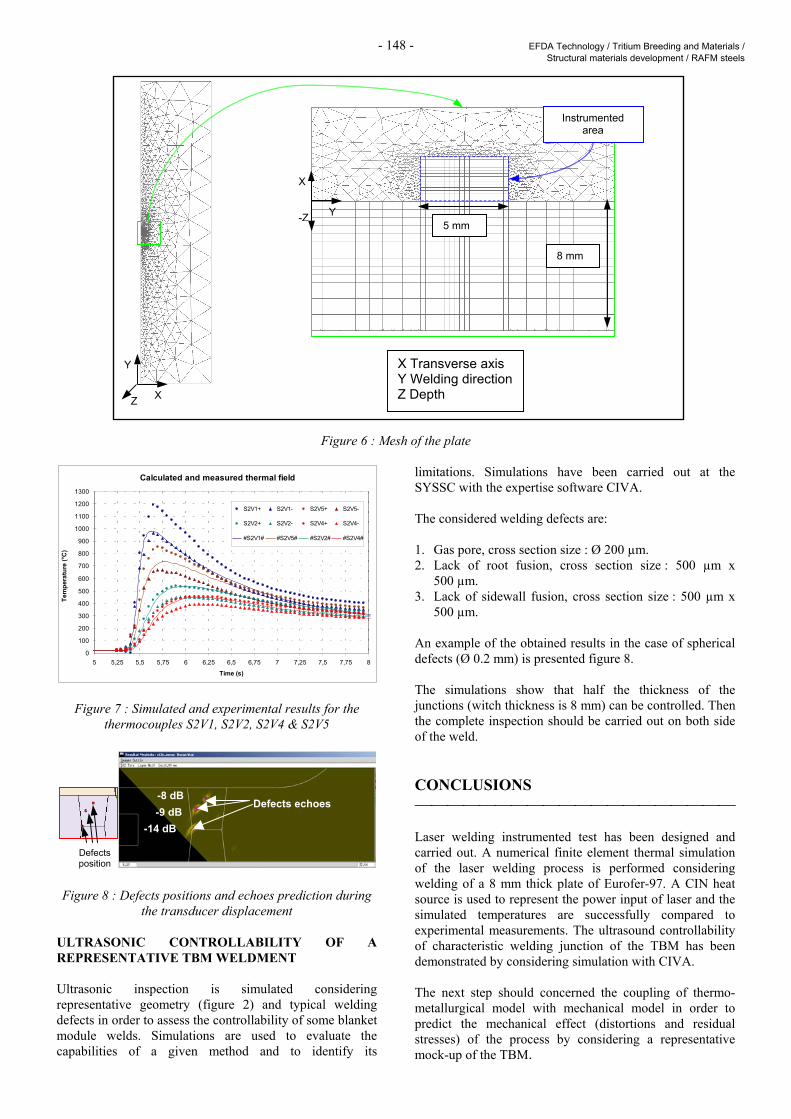
- 148 - EFDA Technology / Tritium Breeding and Materials / Structural materials development / RAFM steels
Figure 6 : Mesh of the plate
Calculated and measured thermal field
0
100
200
300
400
500
600
700
800
900
1000
1100
1200
1300
5 5,25 5,5 5,75 6 6,25 6,5 6,75 7 7,25 7,5 7,75 8
Time (s)
Tem
pera
ture
(°C
)
S2V1+ S2V1- S2V5+ S2V5-
S2V2+ S2V2- S2V4+ S2V4-
#S2V1# #S2V5# #S2V2# #S2V4#
Figure 7 : Simulated and experimental results for the thermocouples S2V1, S2V2, S2V4 & S2V5
Figure 8 : Defects positions and echoes prediction during
the transducer displacement ULTRASONIC CONTROLLABILITY OF A REPRESENTATIVE TBM WELDMENT Ultrasonic inspection is simulated considering representative geometry (figure 2) and typical welding defects in order to assess the controllability of some blanket module welds. Simulations are used to evaluate the capabilities of a given method and to identify its
limitations. Simulations have been carried out at the SYSSC with the expertise software CIVA. The considered welding defects are: 1. Gas pore, cross section size : Ø 200 µm. 2. Lack of root fusion, cross section size : 500 µm x
500 µm. 3. Lack of sidewall fusion, cross section size : 500 µm x
500 µm. An example of the obtained results in the case of spherical defects (Ø 0.2 mm) is presented figure 8. The simulations show that half the thickness of the junctions (witch thickness is 8 mm) can be controlled. Then the complete inspection should be carried out on both side of the weld. CONCLUSIONS Laser welding instrumented test has been designed and carried out. A numerical finite element thermal simulation of the laser welding process is performed considering welding of a 8 mm thick plate of Eurofer-97. A CIN heat source is used to represent the power input of laser and the simulated temperatures are successfully compared to experimental measurements. The ultrasound controllability of characteristic welding junction of the TBM has been demonstrated by considering simulation with CIVA. The next step should concerned the coupling of thermo-metallurgical model with mechanical model in order to predict the mechanical effect (distortions and residual stresses) of the process by considering a representative mock-up of the TBM.
Defects echoes -8 dB -9 dB
-14 dB
Defects position
X Transverse axis Y Welding direction Z Depth
Y
X
-Z5 mm
8 mm
Instrumented area
X
Y
Z
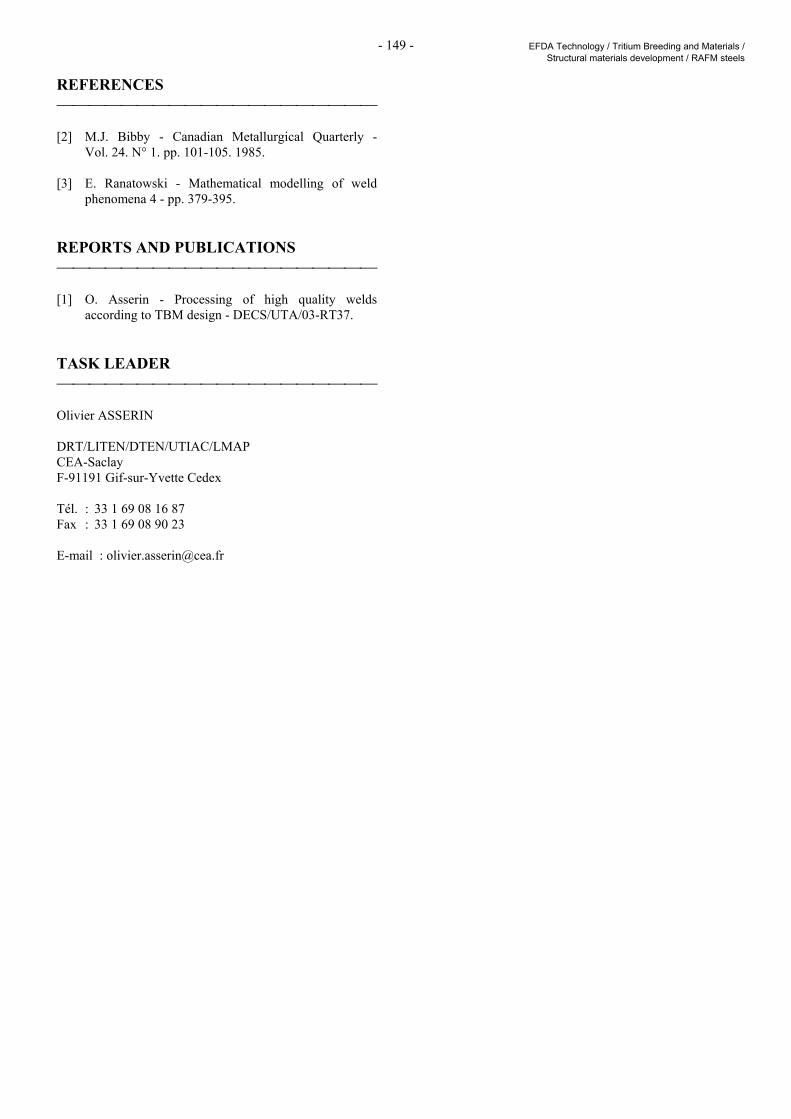
- 149 - EFDA Technology / Tritium Breeding and Materials / Structural materials development / RAFM steels
REFERENCES [2] M.J. Bibby - Canadian Metallurgical Quarterly -
Vol. 24. N° 1. pp. 101-105. 1985. [3] E. Ranatowski - Mathematical modelling of weld
phenomena 4 - pp. 379-395. REPORTS AND PUBLICATIONS [1] O. Asserin - Processing of high quality welds
according to TBM design - DECS/UTA/03-RT37. TASK LEADER Olivier ASSERIN DRT/LITEN/DTEN/UTIAC/LMAP CEA-Saclay F-91191 Gif-sur-Yvette Cedex Tél. : 33 1 69 08 16 87 Fax : 33 1 69 08 90 23 E-mail : [email protected]

- 150 - EFDA Technology / Tritium Breeding and Materials / Structural materials development / RAFM steels
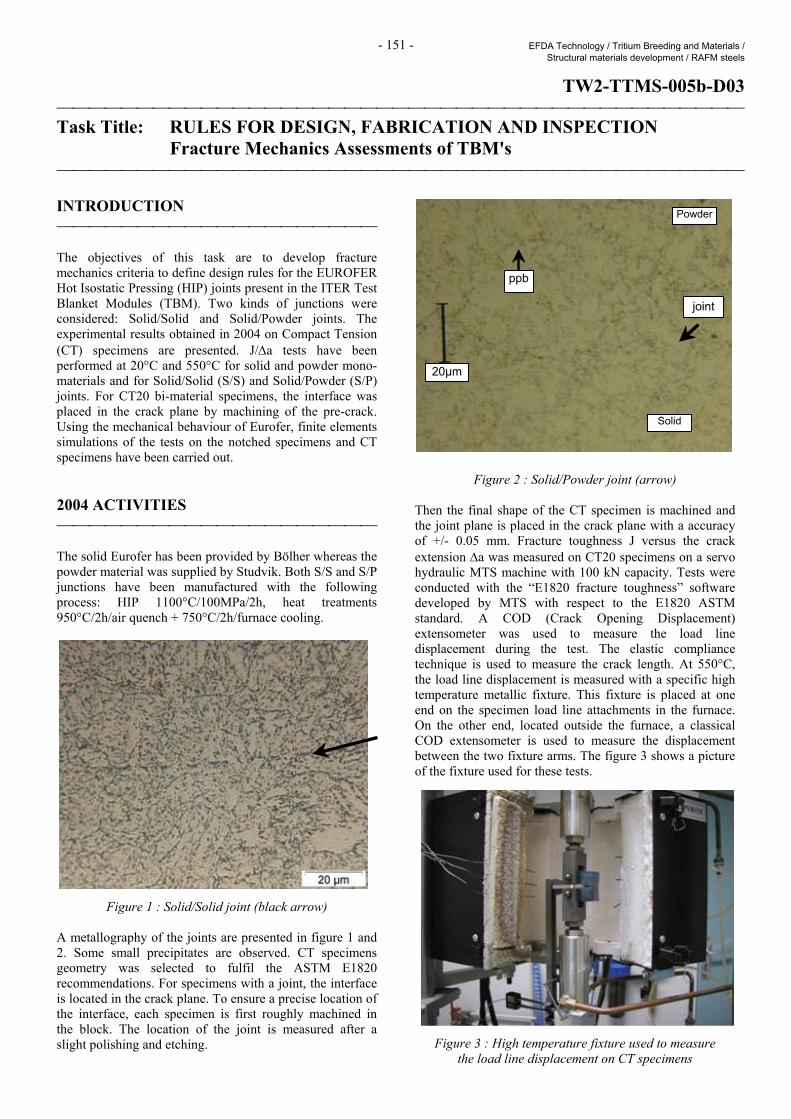
- 151 - EFDA Technology / Tritium Breeding and Materials / Structural materials development / RAFM steels
TW2-TTMS-005b-D03 Task Title: RULES FOR DESIGN, FABRICATION AND INSPECTION Fracture Mechanics Assessments of TBM's INTRODUCTION The objectives of this task are to develop fracture mechanics criteria to define design rules for the EUROFER Hot Isostatic Pressing (HIP) joints present in the ITER Test Blanket Modules (TBM). Two kinds of junctions were considered: Solid/Solid and Solid/Powder joints. The experimental results obtained in 2004 on Compact Tension (CT) specimens are presented. J/∆a tests have been performed at 20°C and 550°C for solid and powder mono-materials and for Solid/Solid (S/S) and Solid/Powder (S/P) joints. For CT20 bi-material specimens, the interface was placed in the crack plane by machining of the pre-crack. Using the mechanical behaviour of Eurofer, finite elements simulations of the tests on the notched specimens and CT specimens have been carried out. 2004 ACTIVITIES The solid Eurofer has been provided by Bölher whereas the powder material was supplied by Studvik. Both S/S and S/P junctions have been manufactured with the following process: HIP 1100°C/100MPa/2h, heat treatments 950°C/2h/air quench + 750°C/2h/furnace cooling.
Figure 1 : Solid/Solid joint (black arrow) A metallography of the joints are presented in figure 1 and 2. Some small precipitates are observed. CT specimens geometry was selected to fulfil the ASTM E1820 recommendations. For specimens with a joint, the interface is located in the crack plane. To ensure a precise location of the interface, each specimen is first roughly machined in the block. The location of the joint is measured after a slight polishing and etching.
Figure 2 : Solid/Powder joint (arrow) Then the final shape of the CT specimen is machined and the joint plane is placed in the crack plane with a accuracy of +/- 0.05 mm. Fracture toughness J versus the crack extension ∆a was measured on CT20 specimens on a servo hydraulic MTS machine with 100 kN capacity. Tests were conducted with the “E1820 fracture toughness” software developed by MTS with respect to the E1820 ASTM standard. A COD (Crack Opening Displacement) extensometer was used to measure the load line displacement during the test. The elastic compliance technique is used to measure the crack length. At 550°C, the load line displacement is measured with a specific high temperature metallic fixture. This fixture is placed at one end on the specimen load line attachments in the furnace. On the other end, located outside the furnace, a classical COD extensometer is used to measure the displacement between the two fixture arms. The figure 3 shows a picture of the fixture used for these tests.
Figure 3 : High temperature fixture used to measure the load line displacement on CT specimens
Solid
Powder
20µm
ppb
joint
- 152 - EFDA Technology / Tritium Breeding and Materials / Structural materials development / RAFM steels
A standard test procedure was used to perform the tests. The main parameters of this procedure are the following: - Precracking in fatigue is performed at 30 Hz with
R = 0.1. The final Kmax is fixed at 25 MPa.m1/2. - Side grooves are machined after pre-cracking along the
crack plane. - During J/∆a test, the sample is loaded with a
displacement (actuator) rate of 0.15 mm/min. A “load-unload” sequence is performed each 0.1 mm of displacement. The load is decreased at 30 % of the current load after a stabilisation step of 15 seconds. The test is stopped after reaching the desired crack extension (from 1 to 5 mm).
ROOM TEMPERATURE J/∆A RESULTS The figure 4 presents the J versus ∆a curves obtained for powder material at room temperature. The blunting line, denoted “Construction line (C-line)” in ASTM E1820, is also plotted on figure 4. This line has a slope of σy as proposed in the standard. For the data points that are parallel to this construction line, the crack extension only occurs by blunting of the crack tip, without stable crack growth. The slope of the blunting line varies for each material with the corresponding σy values. The powder Eurofer material exhibits a very ductile behaviour without any stable crack growth. The geometrical effect, considered by specimens tested with different initial crack lengths a0 ranging from 22 mm to 28 mm, is not strong in this case.
0
200
400
600
800
0 0.5 1 1.5delta a (mm)
J (N
/mm
)
P1/a0=28
P2/a0=24
P3/a0=22
P4/a0=22
C-Line
Figure 4 : J versus ∆a curve measured at 20°C on Powder
CT20 specimens with various initial crack lengths a0. The same behaviour is observed for solid specimens, with a crack extension only occurring by blunting of the crack tip. On the contrary, bi-material CT specimens showed a possible crack propagation at the joint. S/P specimens always show a large crack extension at relatively low J values as shown in figure 5. The S/S results are very scattered. One specimen shows a curve similar to that of S/P material. The three other specimens tested show a behaviour similar to that of monomaterials. After testing, the crack front is oxidised by a short heat treatment of the sample (10 min) at 700°C in air. Then the specimens are broken in 2 parts for rupture analysis.
0
200
400
600
800
0 0.5 1 1.5delta a (mm)
J (N
/mm
)
SP1/a0=22
SP3/a0=28
SP4/a0=24
SP5/a0=28
SP2/a0=22
C-Line
Figure 5 : J versus ∆a curve measured at 20°C on Solid/Powder CT20 specimens
with various initial crack lengths a0. For solid and S/S specimens showing a limited crack extension by blunting, the rupture is ductile with large dimples around oxides or sulfides (MnS). For all the S/P specimens, rupture occurs at the interface, and the shape of the powder particles is clearly visible. Locally, the rupture mechanism remains ductile, as observed at high magnification (figure 6).
Figure 6 : SEM views of Solid/Powder SP4 specimen
fracture surface (powder side) 550°C J/∆A RESULTS For monomaterial specimens, the data points we obtained are scattered but remain close to the blunting line. Like for the tests performed at room temperature, no stable crack extension is detected. The result is similar for S/S specimens tested at 550°C. The four specimens tested show a J/∆a curve corresponding to a crack extension by blunting. On the other hand, the S/P specimen show a stable crack extension for relatively low J values. This strong effect of S/P joint on J/∆a behaviour at 550°C confirms the results found at room temperature. The interface between Solid and Powder materials introduces a weak point in Eurofer material with regard to crack propagation. For S/S interface, a joint effect was detected at room temperature for one specimen, but this effect was not confirmed at 550°C.
20 µm
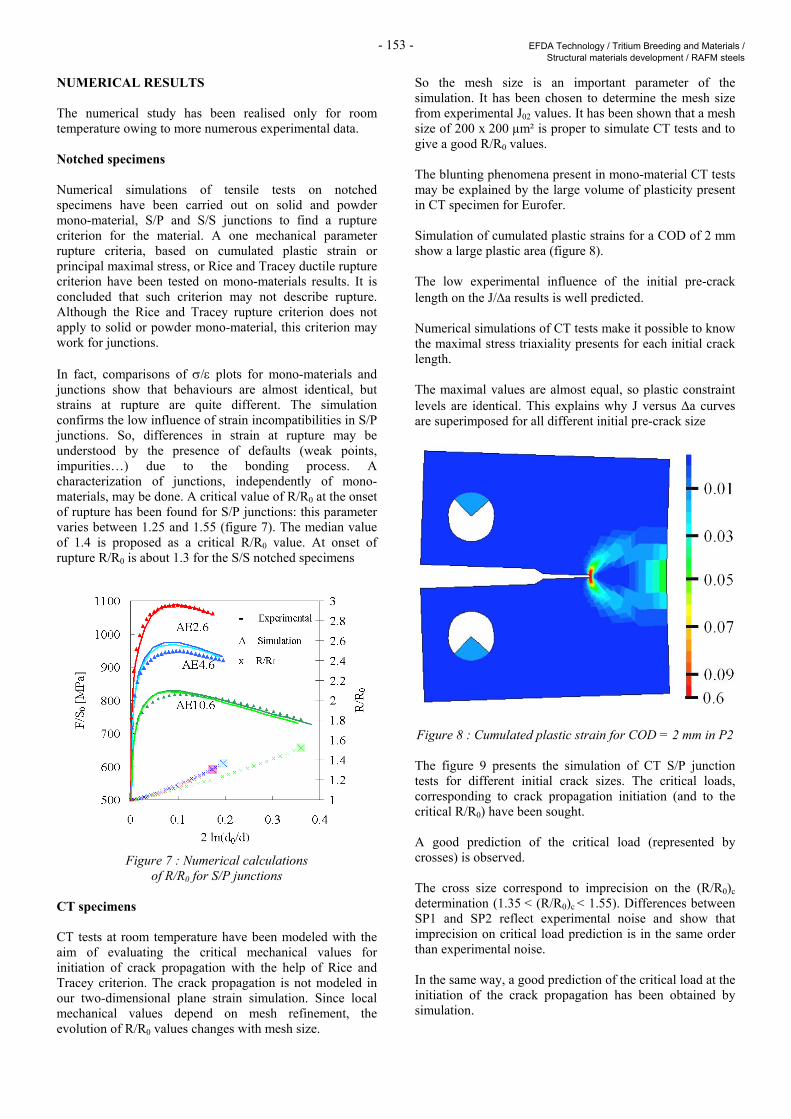
- 153 - EFDA Technology / Tritium Breeding and Materials / Structural materials development / RAFM steels
NUMERICAL RESULTS The numerical study has been realised only for room temperature owing to more numerous experimental data. Notched specimens Numerical simulations of tensile tests on notched specimens have been carried out on solid and powder mono-material, S/P and S/S junctions to find a rupture criterion for the material. A one mechanical parameter rupture criteria, based on cumulated plastic strain or principal maximal stress, or Rice and Tracey ductile rupture criterion have been tested on mono-materials results. It is concluded that such criterion may not describe rupture. Although the Rice and Tracey rupture criterion does not apply to solid or powder mono-material, this criterion may work for junctions. In fact, comparisons of σ/ε plots for mono-materials and junctions show that behaviours are almost identical, but strains at rupture are quite different. The simulation confirms the low influence of strain incompatibilities in S/P junctions. So, differences in strain at rupture may be understood by the presence of defaults (weak points, impurities…) due to the bonding process. A characterization of junctions, independently of mono-materials, may be done. A critical value of R/R0 at the onset of rupture has been found for S/P junctions: this parameter varies between 1.25 and 1.55 (figure 7). The median value of 1.4 is proposed as a critical R/R0 value. At onset of rupture R/R0 is about 1.3 for the S/S notched specimens
Figure 7 : Numerical calculations
of R/R0 for S/P junctions CT specimens CT tests at room temperature have been modeled with the aim of evaluating the critical mechanical values for initiation of crack propagation with the help of Rice and Tracey criterion. The crack propagation is not modeled in our two-dimensional plane strain simulation. Since local mechanical values depend on mesh refinement, the evolution of R/R0 values changes with mesh size.
So the mesh size is an important parameter of the simulation. It has been chosen to determine the mesh size from experimental J02 values. It has been shown that a mesh size of 200 x 200 µm² is proper to simulate CT tests and to give a good R/R0 values. The blunting phenomena present in mono-material CT tests may be explained by the large volume of plasticity present in CT specimen for Eurofer. Simulation of cumulated plastic strains for a COD of 2 mm show a large plastic area (figure 8). The low experimental influence of the initial pre-crack length on the J/∆a results is well predicted. Numerical simulations of CT tests make it possible to know the maximal stress triaxiality presents for each initial crack length. The maximal values are almost equal, so plastic constraint levels are identical. This explains why J versus ∆a curves are superimposed for all different initial pre-crack size
Figure 8 : Cumulated plastic strain for COD = 2 mm in P2 The figure 9 presents the simulation of CT S/P junction tests for different initial crack sizes. The critical loads, corresponding to crack propagation initiation (and to the critical R/R0) have been sought. A good prediction of the critical load (represented by crosses) is observed. The cross size correspond to imprecision on the (R/R0)c determination (1.35 < (R/R0)c < 1.55). Differences between SP1 and SP2 reflect experimental noise and show that imprecision on critical load prediction is in the same order than experimental noise. In the same way, a good prediction of the critical load at the initiation of the crack propagation has been obtained by simulation.
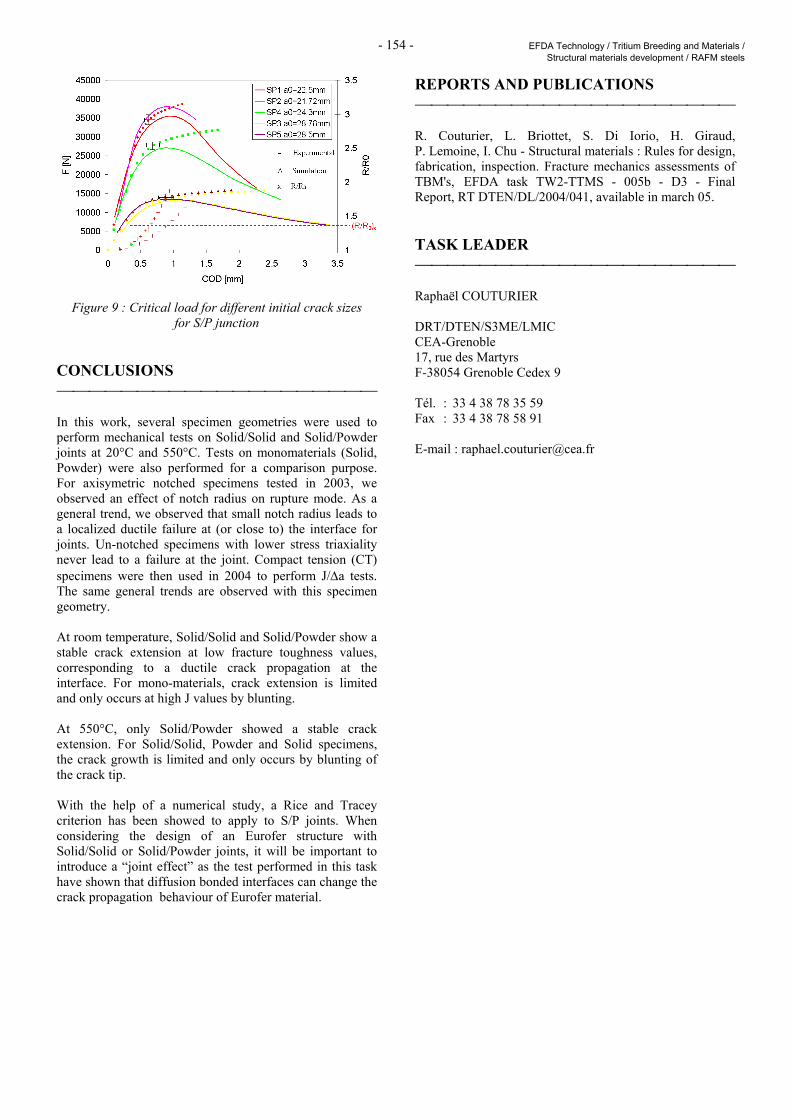
- 154 - EFDA Technology / Tritium Breeding and Materials / Structural materials development / RAFM steels
Figure 9 : Critical load for different initial crack sizes for S/P junction
CONCLUSIONS In this work, several specimen geometries were used to perform mechanical tests on Solid/Solid and Solid/Powder joints at 20°C and 550°C. Tests on monomaterials (Solid, Powder) were also performed for a comparison purpose. For axisymetric notched specimens tested in 2003, we observed an effect of notch radius on rupture mode. As a general trend, we observed that small notch radius leads to a localized ductile failure at (or close to) the interface for joints. Un-notched specimens with lower stress triaxiality never lead to a failure at the joint. Compact tension (CT) specimens were then used in 2004 to perform J/∆a tests. The same general trends are observed with this specimen geometry. At room temperature, Solid/Solid and Solid/Powder show a stable crack extension at low fracture toughness values, corresponding to a ductile crack propagation at the interface. For mono-materials, crack extension is limited and only occurs at high J values by blunting. At 550°C, only Solid/Powder showed a stable crack extension. For Solid/Solid, Powder and Solid specimens, the crack growth is limited and only occurs by blunting of the crack tip. With the help of a numerical study, a Rice and Tracey criterion has been showed to apply to S/P joints. When considering the design of an Eurofer structure with Solid/Solid or Solid/Powder joints, it will be important to introduce a “joint effect” as the test performed in this task have shown that diffusion bonded interfaces can change the crack propagation behaviour of Eurofer material.
REPORTS AND PUBLICATIONS R. Couturier, L. Briottet, S. Di Iorio, H. Giraud, P. Lemoine, I. Chu - Structural materials : Rules for design, fabrication, inspection. Fracture mechanics assessments of TBM's, EFDA task TW2-TTMS - 005b - D3 - Final Report, RT DTEN/DL/2004/041, available in march 05. TASK LEADER Raphaël COUTURIER DRT/DTEN/S3ME/LMIC CEA-Grenoble 17, rue des Martyrs F-38054 Grenoble Cedex 9 Tél. : 33 4 38 78 35 59 Fax : 33 4 38 78 58 91 E-mail : [email protected]

- 155 - EFDA Technology / Tritium Breeding and Materials / Structural materials development / RAFM steels
TW4-TTMS-005-D01 Task Title: RULES FOR DESIGN, FABRICATION AND INSPECTION Update Data Base and Appendix A of DEMO-SDC INTRODUCTION Eurofer is a reduced activation ferritic / martensitic steel that has been selected as the European reference structural material for ITER Test Blanket Modules and DEMO reactor. Several industrial heats of this steel have been produced and tested within the framework of EFDA programme. The ultimate goal of these tasks is to propose materials properties allowables for design and licensing of components fabricated with the Eurofer steel. TW4-TTMS-005 is one of the EFDA tasks that specifically targets structural materials rules, design and inspection. Its scope is extended since the year 2003 to include metallurgical and mechanical properties characterization actions that were previously carried out. This report presents a summary of the work done during the year 2004 at CEA for the TW4-TTMS-005-D01. The work done is also part of an international collaboration, coordinated under the fusion materials implementing agreement of the International Energy Agency (IEA). The main objective of the TW4-TTMS 005-D01 is to collect, validate and harmonize the results of Eurofer steel, in continuation of the earlier work done on the conventional 9Cr-1Mo steel and the RAFM steel grade produced in Japan (F82H), and propose materials properties allowables through an Eurofer steel specific Appendix A. 2004 ACTIVITIES All actions and deliverables foreseen under the terms of TW4-TTMS-005-D01 have been fulfilled in time. In 2004, the database of Eurofer steel was updated, particularly with the RAFM data and analysis resulting from the work done at FZK / Germany. With the addition of the new Eurofer steel data in 2004, the collection of relational databases for RAFM steels contains: - Products database: 571 records including 118 on
Eurofer. - Compositions database: 475 records including 26 on
Eurofer. - Tensile database: 1018 records including 258 on
Eurofer.
- Impact database: 1520 records including 467 on Eurofer.
- Impact plots: 161 records including 45 on Eurofer. - Creep database: 205 records including 81 on Eurofer. - Fatigue database: 181 records including 70 on Eurofer. - Fracture toughness database: 78 records, including 48
records on Eurofer steel. 8 files are generated for a group of tests and 3 Master curves are plotted.
- Summary database of all above databases that allows
sorting of all available test results for a given heat, product or sub-product.
Notice that each record contains many fields. For instance, a single record of one tension test contains fields with inputs from specimen origin and geometry, its heat treatment and irradiation back ground, testing conditions and all the usual materials properties derived from such tests. The updated database was then used to revise the Appendix A for Eurofer steel. Some missing design criteria were added. The full package sent to EFDA at the end of 2004 work contained: - An updated Appendix A of the Eurofer steel referenced
CEA-DMN/Dir TN 2004-02. - A CD-Rom containing the Runtime Solution version 3.0
of the RAFM databases and related documents. - A Getting Started note explaining how to use the
Solution. CONCLUSIONS All deliverables foreseen in this action have been met. The revised Appendix A and its accompanying CD-Rom Runtime solution have been sent to EFDA and are now available to ITER and reactor design teams. In 2005 updating of the databases will continue, particularly with the post-irradiation test results, and data from ODS steels.
- 156 - EFDA Technology / Tritium Breeding and Materials / Structural materials development / RAFM steels
REPORTS AND PUBLICATIONS F. Tavassoli - Fusion Demo Interim Structural Design Criteria (DISDC): Appendix A Material Design Limit Data - A3.S18E Eurofer Steel, EFDA Task TW4-TTMS-005-D01, CEA DMN/Dir TN 2004-02/A, Dec. 2004. F. Tavassoli - Getting started with the RAFM Database Runtime Solution V. 3.0, EFDA Task TW4-TTMS-005-D01, CEA/Saclay, DMN/Dir, Oct. 14, 2004. CD-Rom containing the Runtime Solution version 3.0 of the RAFM databases and related documents. TASK LEADER Farhad TAVASSOLI DEN/DMN CEA-Saclay F-91191 Gif-sur-Yvette Cedex Tél. : 33 1 69 08 60 21 Fax : 33 1 69 08 80 70 E-mail : [email protected]
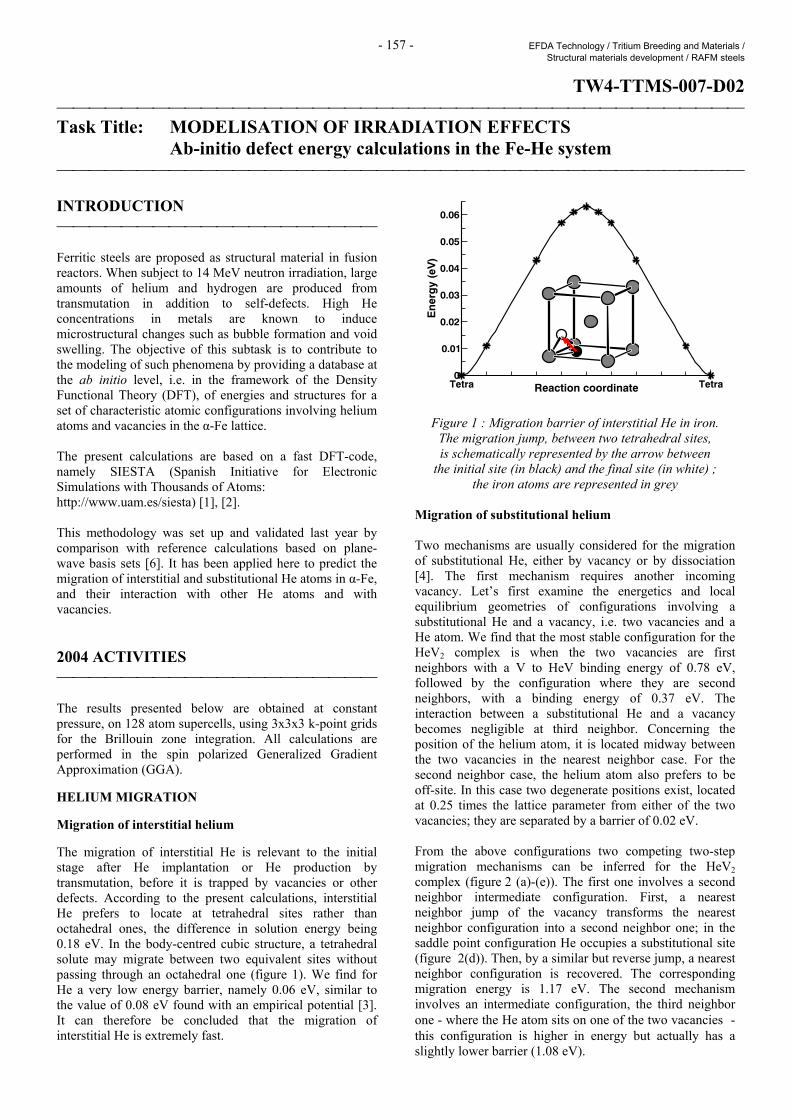
- 157 - EFDA Technology / Tritium Breeding and Materials / Structural materials development / RAFM steels
TW4-TTMS-007-D02 Task Title: MODELISATION OF IRRADIATION EFFECTS Ab-initio defect energy calculations in the Fe-He system INTRODUCTION Ferritic steels are proposed as structural material in fusion reactors. When subject to 14 MeV neutron irradiation, large amounts of helium and hydrogen are produced from transmutation in addition to self-defects. High He concentrations in metals are known to induce microstructural changes such as bubble formation and void swelling. The objective of this subtask is to contribute to the modeling of such phenomena by providing a database at the ab initio level, i.e. in the framework of the Density Functional Theory (DFT), of energies and structures for a set of characteristic atomic configurations involving helium atoms and vacancies in the α-Fe lattice. The present calculations are based on a fast DFT-code, namely SIESTA (Spanish Initiative for Electronic Simulations with Thousands of Atoms: http://www.uam.es/siesta) [1], [2]. This methodology was set up and validated last year by comparison with reference calculations based on plane-wave basis sets [6]. It has been applied here to predict the migration of interstitial and substitutional He atoms in α-Fe, and their interaction with other He atoms and with vacancies. 2004 ACTIVITIES The results presented below are obtained at constant pressure, on 128 atom supercells, using 3x3x3 k-point grids for the Brillouin zone integration. All calculations are performed in the spin polarized Generalized Gradient Approximation (GGA). HELIUM MIGRATION Migration of interstitial helium The migration of interstitial He is relevant to the initial stage after He implantation or He production by transmutation, before it is trapped by vacancies or other defects. According to the present calculations, interstitial He prefers to locate at tetrahedral sites rather than octahedral ones, the difference in solution energy being 0.18 eV. In the body-centred cubic structure, a tetrahedral solute may migrate between two equivalent sites without passing through an octahedral one (figure 1). We find for He a very low energy barrier, namely 0.06 eV, similar to the value of 0.08 eV found with an empirical potential [3]. It can therefore be concluded that the migration of interstitial He is extremely fast.
Tetra TetraReaction coordinate0
0.01
0.02
0.03
0.04
0.05
0.06
En
erg
y (e
V)
Figure 1 : Migration barrier of interstitial He in iron. The migration jump, between two tetrahedral sites, is schematically represented by the arrow between
the initial site (in black) and the final site (in white) ; the iron atoms are represented in grey
Migration of substitutional helium Two mechanisms are usually considered for the migration of substitutional He, either by vacancy or by dissociation [4]. The first mechanism requires another incoming vacancy. Let’s first examine the energetics and local equilibrium geometries of configurations involving a substitutional He and a vacancy, i.e. two vacancies and a He atom. We find that the most stable configuration for the HeV2 complex is when the two vacancies are first neighbors with a V to HeV binding energy of 0.78 eV, followed by the configuration where they are second neighbors, with a binding energy of 0.37 eV. The interaction between a substitutional He and a vacancy becomes negligible at third neighbor. Concerning the position of the helium atom, it is located midway between the two vacancies in the nearest neighbor case. For the second neighbor case, the helium atom also prefers to be off-site. In this case two degenerate positions exist, located at 0.25 times the lattice parameter from either of the two vacancies; they are separated by a barrier of 0.02 eV. From the above configurations two competing two-step migration mechanisms can be inferred for the HeV2 complex (figure 2 (a)-(e)). The first one involves a second neighbor intermediate configuration. First, a nearest neighbor jump of the vacancy transforms the nearest neighbor configuration into a second neighbor one; in the saddle point configuration He occupies a substitutional site (figure 2(d)). Then, by a similar but reverse jump, a nearest neighbor configuration is recovered. The corresponding migration energy is 1.17 eV. The second mechanism involves an intermediate configuration, the third neighbor one - where the He atom sits on one of the two vacancies - this configuration is higher in energy but actually has a slightly lower barrier (1.08 eV).
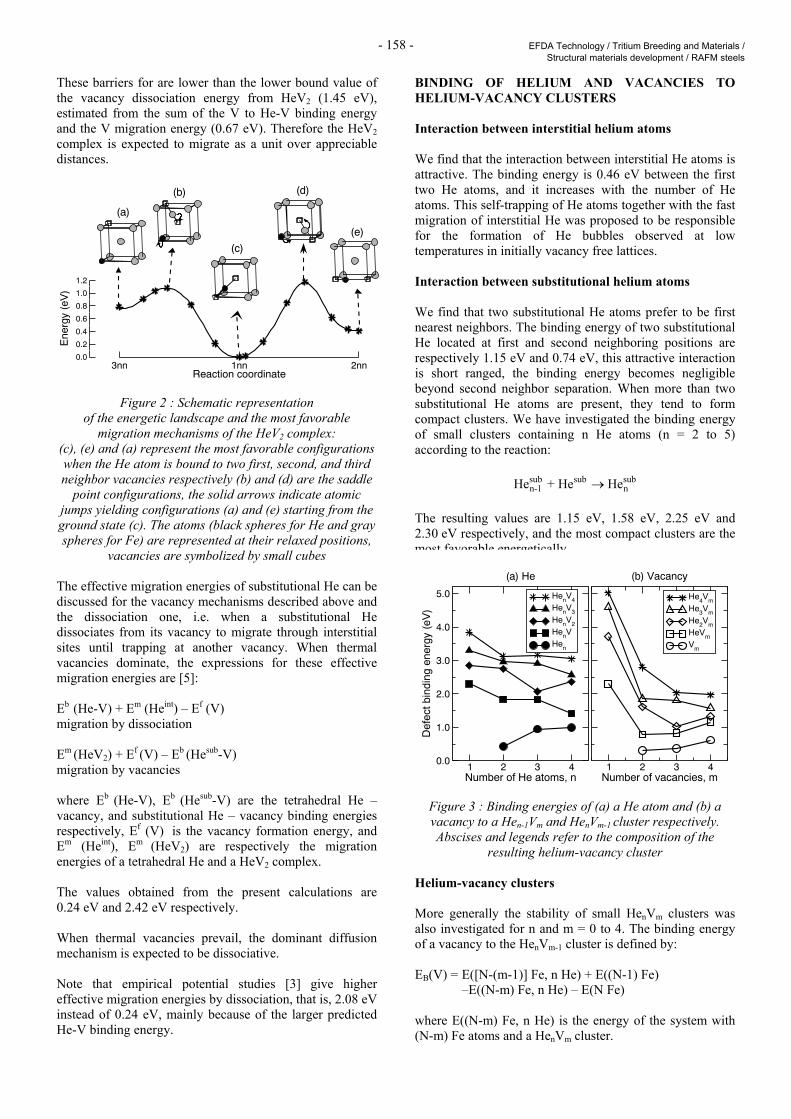
- 158 - EFDA Technology / Tritium Breeding and Materials / Structural materials development / RAFM steels
These barriers for are lower than the lower bound value of the vacancy dissociation energy from HeV2 (1.45 eV), estimated from the sum of the V to He-V binding energy and the V migration energy (0.67 eV). Therefore the HeV2 complex is expected to migrate as a unit over appreciable distances.
3nn 1nn 2nnReaction coordinate
0.0
0.2
0.4
0.6
0.8
1.0
1.2
Ene
rgy
(eV
)
(b) (d)
(a)
(e)
(c)
Figure 2 : Schematic representation of the energetic landscape and the most favorable
migration mechanisms of the HeV2 complex: (c), (e) and (a) represent the most favorable configurations when the He atom is bound to two first, second, and third neighbor vacancies respectively (b) and (d) are the saddle
point configurations, the solid arrows indicate atomic jumps yielding configurations (a) and (e) starting from the ground state (c). The atoms (black spheres for He and gray spheres for Fe) are represented at their relaxed positions,
vacancies are symbolized by small cubes The effective migration energies of substitutional He can be discussed for the vacancy mechanisms described above and the dissociation one, i.e. when a substitutional He dissociates from its vacancy to migrate through interstitial sites until trapping at another vacancy. When thermal vacancies dominate, the expressions for these effective migration energies are [5]: Eb (He-V) + Em (Heint) – Ef (V) migration by dissociation Em (HeV2) + Ef (V) – Eb (Hesub-V) migration by vacancies where Eb (He-V), Eb (Hesub-V) are the tetrahedral He – vacancy, and substitutional He – vacancy binding energies respectively, Ef (V) is the vacancy formation energy, and Em (Heint), Em (HeV2) are respectively the migration energies of a tetrahedral He and a HeV2 complex. The values obtained from the present calculations are 0.24 eV and 2.42 eV respectively. When thermal vacancies prevail, the dominant diffusion mechanism is expected to be dissociative. Note that empirical potential studies [3] give higher effective migration energies by dissociation, that is, 2.08 eV instead of 0.24 eV, mainly because of the larger predicted He-V binding energy.
BINDING OF HELIUM AND VACANCIES TO HELIUM-VACANCY CLUSTERS Interaction between interstitial helium atoms We find that the interaction between interstitial He atoms is attractive. The binding energy is 0.46 eV between the first two He atoms, and it increases with the number of He atoms. This self-trapping of He atoms together with the fast migration of interstitial He was proposed to be responsible for the formation of He bubbles observed at low temperatures in initially vacancy free lattices. Interaction between substitutional helium atoms We find that two substitutional He atoms prefer to be first nearest neighbors. The binding energy of two substitutional He located at first and second neighboring positions are respectively 1.15 eV and 0.74 eV, this attractive interaction is short ranged, the binding energy becomes negligible beyond second neighbor separation. When more than two substitutional He atoms are present, they tend to form compact clusters. We have investigated the binding energy of small clusters containing n He atoms (n = 2 to 5) according to the reaction:
sub sub subn-1 nHe + He He→
The resulting values are 1.15 eV, 1.58 eV, 2.25 eV and 2.30 eV respectively, and the most compact clusters are the most favorable energetically.
1 2 3 4Number of He atoms, n
0.0
1.0
2.0
3.0
4.0
5.0
Def
ect b
indi
ng e
nerg
y (e
V)
HenV4
HenV3
HenV2
HenVHen
(a) He
1 2 3 4Number of vacancies, m
He4Vm
He3Vm
He2Vm
HeVm
Vm
(b) Vacancy
Figure 3 : Binding energies of (a) a He atom and (b) a vacancy to a Hen-1Vm and HenVm-1 cluster respectively. Abscises and legends refer to the composition of the
resulting helium-vacancy cluster Helium-vacancy clusters More generally the stability of small HenVm clusters was also investigated for n and m = 0 to 4. The binding energy of a vacancy to the HenVm-1 cluster is defined by: EB(V) = E([N-(m-1)] Fe, n He) + E((N-1) Fe)
–E((N-m) Fe, n He) – E(N Fe) where E((N-m) Fe, n He) is the energy of the system with (N-m) Fe atoms and a HenVm cluster.
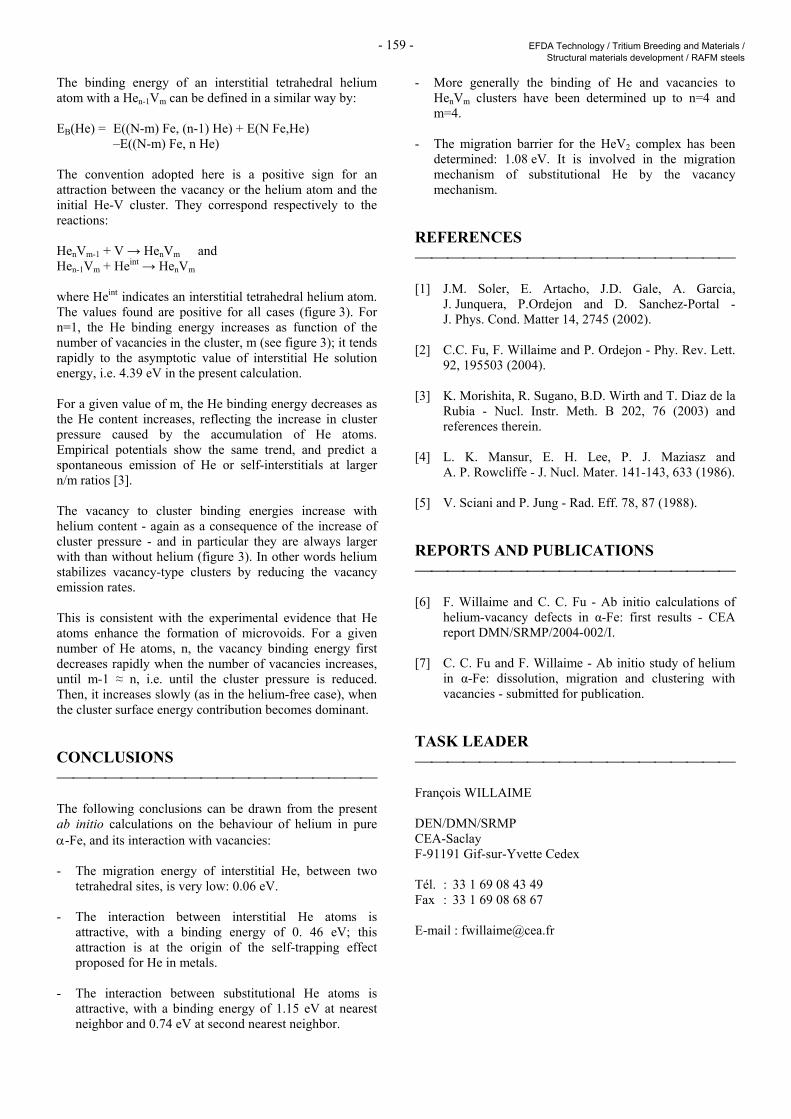
- 159 - EFDA Technology / Tritium Breeding and Materials / Structural materials development / RAFM steels
The binding energy of an interstitial tetrahedral helium atom with a Hen-1Vm can be defined in a similar way by: EB(He) = E((N-m) Fe, (n-1) He) + E(N Fe,He)
–E((N-m) Fe, n He) The convention adopted here is a positive sign for an attraction between the vacancy or the helium atom and the initial He-V cluster. They correspond respectively to the reactions: HenVm-1 + V → HenVm and Hen-1Vm + Heint → HenVm where Heint indicates an interstitial tetrahedral helium atom. The values found are positive for all cases (figure 3). For n=1, the He binding energy increases as function of the number of vacancies in the cluster, m (see figure 3); it tends rapidly to the asymptotic value of interstitial He solution energy, i.e. 4.39 eV in the present calculation. For a given value of m, the He binding energy decreases as the He content increases, reflecting the increase in cluster pressure caused by the accumulation of He atoms. Empirical potentials show the same trend, and predict a spontaneous emission of He or self-interstitials at larger n/m ratios [3]. The vacancy to cluster binding energies increase with helium content - again as a consequence of the increase of cluster pressure - and in particular they are always larger with than without helium (figure 3). In other words helium stabilizes vacancy-type clusters by reducing the vacancy emission rates. This is consistent with the experimental evidence that He atoms enhance the formation of microvoids. For a given number of He atoms, n, the vacancy binding energy first decreases rapidly when the number of vacancies increases, until m-1 ≈ n, i.e. until the cluster pressure is reduced. Then, it increases slowly (as in the helium-free case), when the cluster surface energy contribution becomes dominant. CONCLUSIONS The following conclusions can be drawn from the present ab initio calculations on the behaviour of helium in pure α-Fe, and its interaction with vacancies: - The migration energy of interstitial He, between two
tetrahedral sites, is very low: 0.06 eV. - The interaction between interstitial He atoms is
attractive, with a binding energy of 0. 46 eV; this attraction is at the origin of the self-trapping effect proposed for He in metals.
- The interaction between substitutional He atoms is
attractive, with a binding energy of 1.15 eV at nearest neighbor and 0.74 eV at second nearest neighbor.
- More generally the binding of He and vacancies to HenVm clusters have been determined up to n=4 and m=4.
- The migration barrier for the HeV2 complex has been
determined: 1.08 eV. It is involved in the migration mechanism of substitutional He by the vacancy mechanism.
REFERENCES [1] J.M. Soler, E. Artacho, J.D. Gale, A. Garcia,
J. Junquera, P.Ordejon and D. Sanchez-Portal - J. Phys. Cond. Matter 14, 2745 (2002).
[2] C.C. Fu, F. Willaime and P. Ordejon - Phy. Rev. Lett.
92, 195503 (2004). [3] K. Morishita, R. Sugano, B.D. Wirth and T. Diaz de la
Rubia - Nucl. Instr. Meth. B 202, 76 (2003) and references therein.
[4] L. K. Mansur, E. H. Lee, P. J. Maziasz and
A. P. Rowcliffe - J. Nucl. Mater. 141-143, 633 (1986). [5] V. Sciani and P. Jung - Rad. Eff. 78, 87 (1988). REPORTS AND PUBLICATIONS [6] F. Willaime and C. C. Fu - Ab initio calculations of
helium-vacancy defects in α-Fe: first results - CEA report DMN/SRMP/2004-002/I.
[7] C. C. Fu and F. Willaime - Ab initio study of helium
in α-Fe: dissolution, migration and clustering with vacancies - submitted for publication.
TASK LEADER François WILLAIME DEN/DMN/SRMP CEA-Saclay F-91191 Gif-sur-Yvette Cedex Tél. : 33 1 69 08 43 49 Fax : 33 1 69 08 68 67 E-mail : [email protected]

- 160 - EFDA Technology / Tritium Breeding and Materials / Structural materials development / RAFM steels
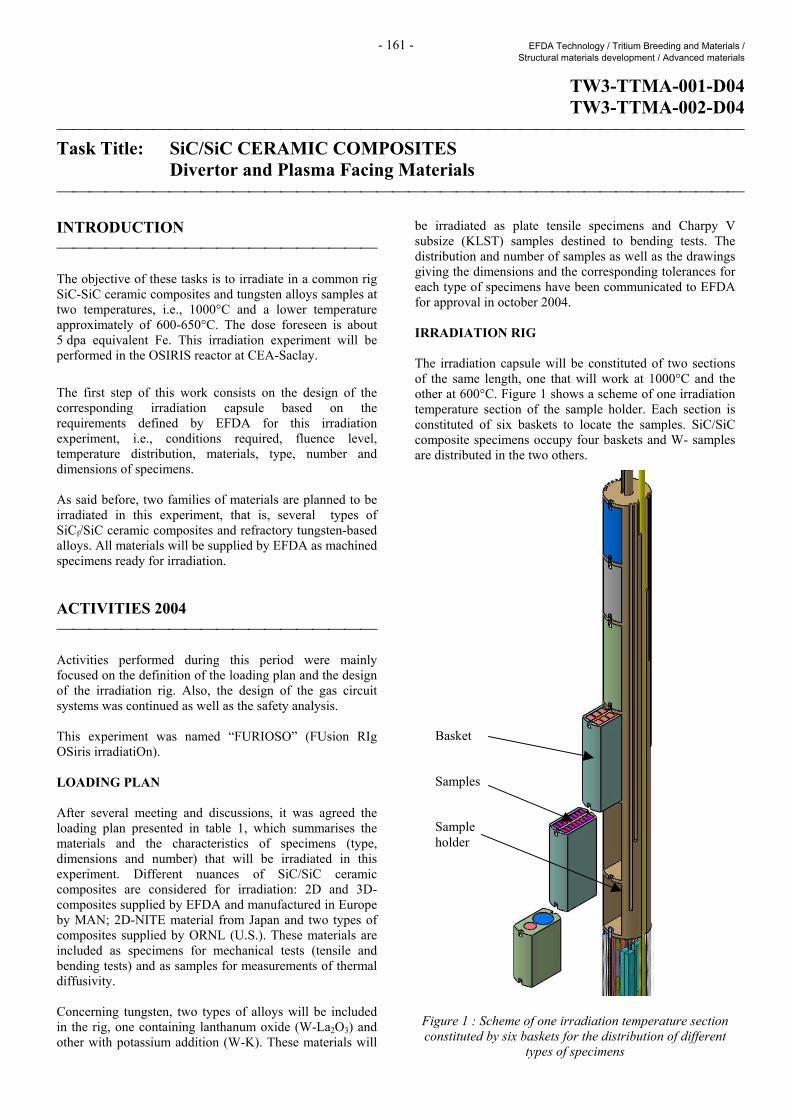
- 161 - EFDA Technology / Tritium Breeding and Materials / Structural materials development / Advanced materials
TW3-TTMA-001-D04 TW3-TTMA-002-D04
Task Title: SiC/SiC CERAMIC COMPOSITES Divertor and Plasma Facing Materials INTRODUCTION The objective of these tasks is to irradiate in a common rig SiC-SiC ceramic composites and tungsten alloys samples at two temperatures, i.e., 1000°C and a lower temperature approximately of 600-650°C. The dose foreseen is about 5 dpa equivalent Fe. This irradiation experiment will be performed in the OSIRIS reactor at CEA-Saclay. The first step of this work consists on the design of the corresponding irradiation capsule based on the requirements defined by EFDA for this irradiation experiment, i.e., conditions required, fluence level, temperature distribution, materials, type, number and dimensions of specimens. As said before, two families of materials are planned to be irradiated in this experiment, that is, several types of SiCf/SiC ceramic composites and refractory tungsten-based alloys. All materials will be supplied by EFDA as machined specimens ready for irradiation. ACTIVITIES 2004 Activities performed during this period were mainly focused on the definition of the loading plan and the design of the irradiation rig. Also, the design of the gas circuit systems was continued as well as the safety analysis. This experiment was named “FURIOSO” (FUsion RIg OSiris irradiatiOn). LOADING PLAN After several meeting and discussions, it was agreed the loading plan presented in table 1, which summarises the materials and the characteristics of specimens (type, dimensions and number) that will be irradiated in this experiment. Different nuances of SiC/SiC ceramic composites are considered for irradiation: 2D and 3D-composites supplied by EFDA and manufactured in Europe by MAN; 2D-NITE material from Japan and two types of composites supplied by ORNL (U.S.). These materials are included as specimens for mechanical tests (tensile and bending tests) and as samples for measurements of thermal diffusivity. Concerning tungsten, two types of alloys will be included in the rig, one containing lanthanum oxide (W-La2O3) and other with potassium addition (W-K). These materials will
be irradiated as plate tensile specimens and Charpy V subsize (KLST) samples destined to bending tests. The distribution and number of samples as well as the drawings giving the dimensions and the corresponding tolerances for each type of specimens have been communicated to EFDA for approval in october 2004. IRRADIATION RIG The irradiation capsule will be constituted of two sections of the same length, one that will work at 1000°C and the other at 600°C. Figure 1 shows a scheme of one irradiation temperature section of the sample holder. Each section is constituted of six baskets to locate the samples. SiC/SiC composite specimens occupy four baskets and W- samples are distributed in the two others.
Figure 1 : Scheme of one irradiation temperature section constituted by six baskets for the distribution of different
types of specimens
Basket
Samples
Sample holder
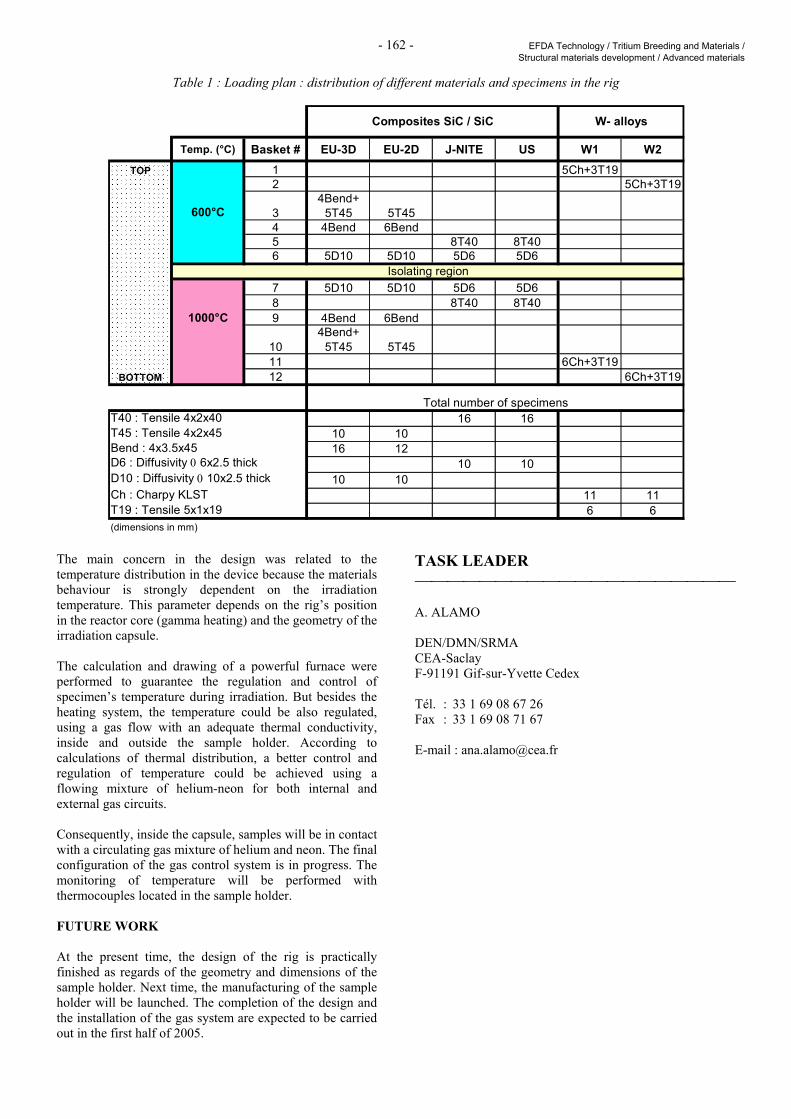
- 162 - EFDA Technology / Tritium Breeding and Materials / Structural materials development / Advanced materials
Table 1 : Loading plan : distribution of different materials and specimens in the rig
Temp. (°C) Basket # EU-3D EU-2D J-NITE US W1 W2TOP 1 5Ch+3T19
2 5Ch+3T19
34Bend+
5T45 5T454 4Bend 6Bend5 8T40 8T406 5D10 5D10 5D6 5D6
7 5D10 5D10 5D6 5D68 8T40 8T40
1000°C 9 4Bend 6Bend
104Bend+
5T45 5T4511 6Ch+3T19
BOTTOM 12 6Ch+3T19
T40 : Tensile 4x2x40 16 16T45 : Tensile 4x2x45 10 10Bend : 4x3.5x45 16 12D6 : Diffusivity 0 6x2.5 thick 10 10D10 : Diffusivity 0 10x2.5 thick 10 10Ch : Charpy KLST 11 11T19 : Tensile 5x1x19 6 6(dimensions in mm)
Isolating region
Total number of specimens
Composites SiC / SiC W- alloys
600°C
The main concern in the design was related to the temperature distribution in the device because the materials behaviour is strongly dependent on the irradiation temperature. This parameter depends on the rig’s position in the reactor core (gamma heating) and the geometry of the irradiation capsule. The calculation and drawing of a powerful furnace were performed to guarantee the regulation and control of specimen’s temperature during irradiation. But besides the heating system, the temperature could be also regulated, using a gas flow with an adequate thermal conductivity, inside and outside the sample holder. According to calculations of thermal distribution, a better control and regulation of temperature could be achieved using a flowing mixture of helium-neon for both internal and external gas circuits. Consequently, inside the capsule, samples will be in contact with a circulating gas mixture of helium and neon. The final configuration of the gas control system is in progress. The monitoring of temperature will be performed with thermocouples located in the sample holder. FUTURE WORK At the present time, the design of the rig is practically finished as regards of the geometry and dimensions of the sample holder. Next time, the manufacturing of the sample holder will be launched. The completion of the design and the installation of the gas system are expected to be carried out in the first half of 2005.
TASK LEADER A. ALAMO DEN/DMN/SRMA CEA-Saclay F-91191 Gif-sur-Yvette Cedex Tél. : 33 1 69 08 67 26 Fax : 33 1 69 08 71 67 E-mail : [email protected]
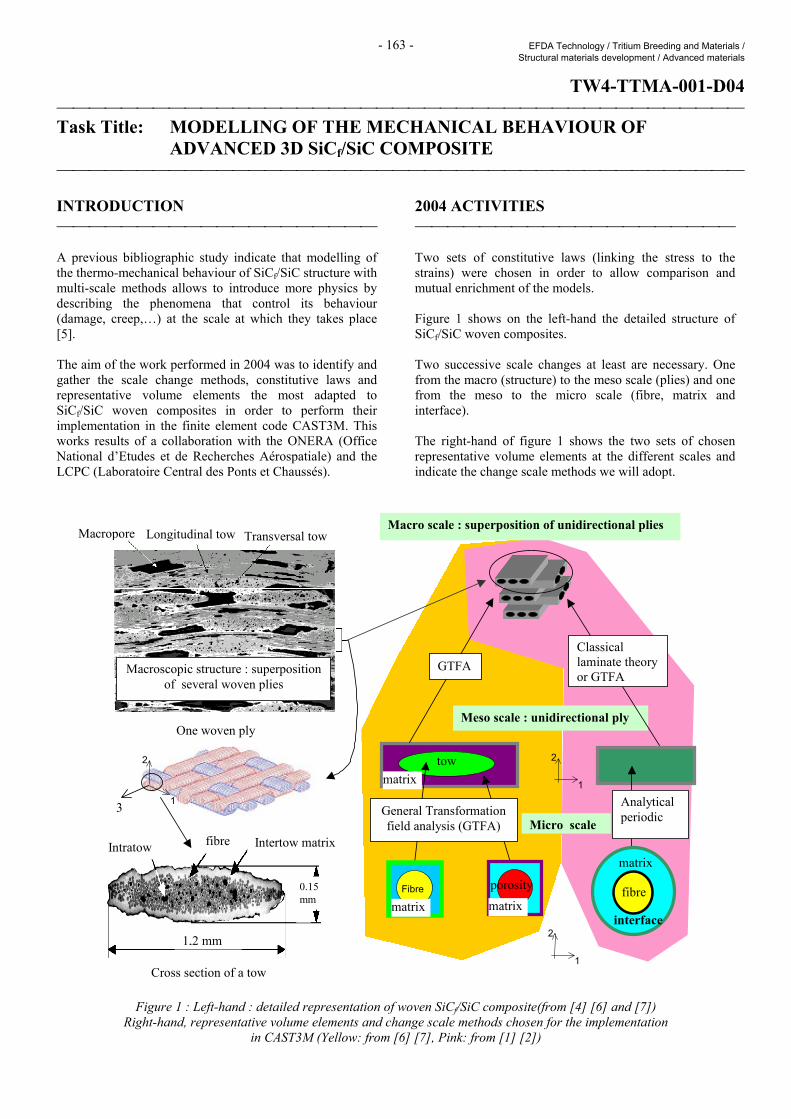
- 163 - EFDA Technology / Tritium Breeding and Materials / Structural materials development / Advanced materials
TW4-TTMA-001-D04 Task Title: MODELLING OF THE MECHANICAL BEHAVIOUR OF
ADVANCED 3D SiCf/SiC COMPOSITE INTRODUCTION A previous bibliographic study indicate that modelling of the thermo-mechanical behaviour of SiCf/SiC structure with multi-scale methods allows to introduce more physics by describing the phenomena that control its behaviour (damage, creep,…) at the scale at which they takes place [5]. The aim of the work performed in 2004 was to identify and gather the scale change methods, constitutive laws and representative volume elements the most adapted to SiCf/SiC woven composites in order to perform their implementation in the finite element code CAST3M. This works results of a collaboration with the ONERA (Office National d’Etudes et de Recherches Aérospatiale) and the LCPC (Laboratoire Central des Ponts et Chaussés).
2004 ACTIVITIES Two sets of constitutive laws (linking the stress to the strains) were chosen in order to allow comparison and mutual enrichment of the models. Figure 1 shows on the left-hand the detailed structure of SiCf/SiC woven composites. Two successive scale changes at least are necessary. One from the macro (structure) to the meso scale (plies) and one from the meso to the micro scale (fibre, matrix and interface). The right-hand of figure 1 shows the two sets of chosen representative volume elements at the different scales and indicate the change scale methods we will adopt.
Figure 1 : Left-hand : detailed representation of woven SiCf/SiC composite(from [4] [6] and [7]) Right-hand, representative volume elements and change scale methods chosen for the implementation
in CAST3M (Yellow: from [6] [7], Pink: from [1] [2])
Macropore
Matrice
One woven ply
1 3
2
Longitudinal tow Transversal tow
Macroscopic structure : superposition of several woven plies
Cross section of a tow
Intertow matrix fibreIntratow
0.15 mm
1,2 mm
Macro scale : superposition of unidirectional plies
Meso scale : unidirectional ply
1
2 tow matrix
Analytical periodic
GTFA Classical laminate theory or GTFA
General Transformation field analysis (GTFA)
matrix
fibre
interface
Micro scale
porosity matrix matrix
Fibre
1
2
- 164 - EFDA Technology / Tritium Breeding and Materials / Structural materials development / Advanced materials
The first chosen constitutive laws set was reported by C. Rospars et al [1] [2]. These laws take into account the effect of damage at the level of the fibres, interface and matrix. Their parameters have already been determined by C. Rospars for different SiCf/SiC and C/SiC composites. These constitutive laws were moreover successfully applied to modelling of SiCf/SiC structures via two scale changes. The other constitutive laws we wish to use were determined by ONERA [6]. They allow to take into account various phenomena observed during ceramic matrix composite testing such as the initial and damage-induced anisotropy (with the eventual lost of orthotropy), damage kinetics for the different cracking modes (different crack families defined by their orientations), damage deactivation, progressive cracks closure and residual strains induced by damage and residual fabrication stresses. These constitutive laws and their parameters are adapted and known for the macroscopic scale. At lower scale, their parameters could be identified by inverse methods. It can also be envisaged to determine first the thermo-mechanical properties of the tows and the matrix with porosity using a multi-scale approach. This allows to predict the influence of parameters such as fibres swelling or porosity concentration. Damage is then introduced at the meso-scale corresponding to the ply (sequenced method). The change scale methods for the localisation step (calculation of the local strains, and corresponding stress, from the global strains) that will be used are the general transformation field analysis (GTFA) [7] and an analytical method for periodic fibre composites from C. Pideri [3] which is adapted to the micro to meso scale change. GTFA allows to perform all the envisaged scale changes. Constitutive laws as well as the change scale methods and the integrations methods are described in [8]. A UMAT procedure (procedure integrating the constitutive law that can be used in CAST3M or ABAQUS finite element code), based on the work of C. Rospars, has already been adapted to CAST3M and allows to calculate a unidirectional plane of SiCf/SiC, corresponding to the meso scale. The work which will be undertaken in the next years consists in the following points: - Implementation of the GTFA method in CAST3M,
including the calculation of the localisation and influence tensors for change scale ( meso ↔ macro) and (micro ↔ meso).
- Implementation of the constitutive laws of ONERA for
the scalar and pseudo-tensorial models. - Tests calculations for the ONERA constitutive laws at
the macro-scale.
- Following a sequenced integration method: determination of the thermo-elastic properties of the bundle and the matrix using multi-scale approach, introduction of damage at the meso-scale from the ONERA constitutive laws. Test calculations with scale change from meso to macro-scale
- The GTFA method for the meso to macro scale change
(which allow to take into account out-of-plane 3D components) will also be used for test calculation of a realistic woven SiCf/SiC composite with the micro to meso scale change and component constitutive laws of C. Rospars.
REFERENCES [1] C. Rospars, E. Le Dantec and F. Lecuyer - CMC
damage prediction by micro-macro modelling, twelfth international conference on composite materials - Paris, France, 5th-9th (july 1999) - ICCM-12.
[2] C. Rospars, E. Le Dantec and F. Lecuyer -
Composites Science and Technology - 60 (2000) 1095-1102.
[3] C. Pideri - Matériaux composites élastiques - Thèse de
l’université de Pierre et Marie Curie - Paris 6 - soutenue le 10 novembre 1987.
[4] V. Clard - Approches statistiques-probabilistes du
comportement mécanique des composites à matrice céramique - Thesis n° 1948 - University of Bordeaux I - France, (1998).
REPORTS AND PUBLICATIONS [5] C. Guerin - Multi-scale modelling for SiCf/SiC
composites - Preliminary considerations to an implementation in CAST3M - CEA report DRN/DMT SEMT/LM2S/RT/04-001/A - January 2004.
[6] J. F. Maire and N. Carrere - Modélisation multi-
échelles des composites SiCf/SiC - Définition des potentiels thermodynamiques et de dissipation pour les différents constituants du composites SiCf/SiC (to be published).
[7] N. Carrere and J. F. Maire - Modélisation multi-
échelles des composites SiCf/SiC. Fourniture des éléments nécessaires à l’implémentation d’une méthode de changement d’échelle pour les passages micro-méso et méso-macro adaptée au SiCf/SiC (to be published).
[8] C. Guerin - Multi-scale modelling of the thermo-
mechanical behaviour of SiCf/SiC advanced composite - 2004 Activity report - Definition of the constitutive laws and gathering of the data necessary for the implementation in CAST3M (to be published).

- 165 - EFDA Technology / Tritium Breeding and Materials / Structural materials development / Advanced materials
TASK LEADER Caroline GUERIN DRN/DMT/SEMT/LM2S CEA-Saclay F-91191 Gif-sur-Yvette Cedex Tél. : 33 1 69 08 53 52 Fax : 33 1 69 08 86 84 E-mail : [email protected]

- 166 - EFDA Technology / Tritium Breeding and Materials / Structural materials development / Advanced materials
- 167 - EFDA Technology / Tritium Breeding and Materials / Neutron source
TW4-TTMI-001-D01 Task Title: IFMIF ACCELERATOR FACILITIES Accelerator system design INTRODUCTION The mission of IFMIF is to provide an accelerator-based, D-Li neutron source to produce high energy neutrons at sufficient intensity and irradiation volume to test samples of candidate materials up to about a full lifetime of anticipated use in fusion energy reactors. IFMIF would also provide calibration and validation of data from fission reactor and other accelerator-based irradiation tests. It would generate an engineering base of material-specific activation and radiological properties data, and support the analysis of materials for use in safety, maintenance, recycling, decommissioning, and waste disposal systems. The basic approach is to provide two linacs modules, each delivering 125 mA at 40 MeV to a common target. This approach presents availability and operational flexibility advantages. The Transition year(s) were initiated in 2003 with the objective of continuing the “Key Element Technology Phase” (KEP). The activities defined here concentrate on a follow up of the previous work, delivery to the other team of the previous works, transition meetings, reflection on the present design and it’s possible evolution. The IFMIF work is carried out at the CEA in the framework of a considerably larger activity presently undergoing in the field of high-intensity linear accelerators [1], [2], [3]. 2004 ACTIVITIES THE REFERENCE DESIGN The ion source generates a Continuous Wave (CW) 140-mA deuteron beam at 95 keV. A Low Energy Beam Transport (LEBT) guides the deuteron beam from the operating source to a Radio Frequency Quadrupole (RFQ). The RFQ bunches the beam and accelerates 125 mA to 5 MeV. The 5 MeV RFQ beam is injected directly into a Room Temperature (RT), Drift-Tube-Linac (DTL) of the conventional Alvarez type with post couplers, where it is accelerated to 40 MeV. The rf power system for the IFMIF accelerator is based on a diacrode amplifier operated at a power level of 1.0 MW and a frequency of 175 MHz. Operation of both the RFQ and the DTL at the same relatively low frequency is a conservative approach for delivering the high current deuteron beam with low beam loss in the accelerator. The use of only one rf frequency also provides some operational simplification.
Beam loss in the accelerator is to be limited so that maintenance can be “hands-on”, i.e., not requiring remote manipulators. However, the accelerator facility will be designed in such a way that remote maintenance is not precluded. As shown later, the DTL output beam is carried to the target by a High Energy Beam-Transport (HEBT) that also provides the desired target spot distribution tailoring and energy dispersion. This HEBT must perform a variety of functions, complicated by the presence of strong space-charge forces within the beam. The design improved since the referenced CDA in 1996. Several options were evaluated, and the work lead to the selection of a single reference for each subcomponent. There is no showstopper in the present reference design, but it does not mean that this 10 MW accelerator will be easy to build. Each subsystem will have to be carefully built and assembled. The project remains one of the most powerful in the word. The reference design is based on a conservative basis for this reason, most of the subcomponents having been fully tested or used. The design did not significantly change during the year 2004. The most interesting points are a confirmation on some choices. Even if the reference design exists, the delays observed in the process of decision can be profitably used in exploring new possibilities, which will have to prove there ability to replace the present choices. The ECR Source The ECR source was selected as a result of the IFMIF KEP development program. This choice has been validated after extensive parallel development in Europe (CEA-Saclay and Frankfurt) and in Japan (JAERI). It has been selected mostly because of its intrinsic availability compared to other source types, and its efficiency. No further development on the D+ source is required. We need to use H2
+ particles instead of D+ during the commissioning of the accelerator in order to minimise the activation during the tuning. Therefore work was provided on this basis in CEA-Saclay and IAP-Frankfurt. In both places, the results are not in accordance with the objectives. The source is optimized for atomic ions production and extraction; it remains extremely difficult to tune it for molecular ions production. Around 30 mA can be extracted at the cost of a big amount of other species. Opinion was received that H+ could be used by running the accelerator at half voltage, thus avoiding the need for H2
+ injector which requires development. The Accelerator Team does not fully agree with this position as it ignores the most important aspect of reliability. At half-voltage, the accelerator is not at its operating condition.
- 168 - EFDA Technology / Tritium Breeding and Materials / Neutron source
Extensive experience at LEDA showed that the most difficult conditioning and tuning problems occurred within 10% of the design conditions. The main (only ?) advantages of running H+ is to check the obvious errors like quadrupoles misplugged or badly misaligned. The requirement for an H2
+ injector for commissioning and tuning will remain on the requirements list. This supposes the development of a new source, which has to start very soon in order to meet the requirement on time for the commissioning. As this new source will be used only during commissioning, it has to be easily plugged. Also one has to understand that the beam parameters (like emittance) will be different from the final source. A complete study will have to be made during EVEDA to assess the gain of such source. If no solution could be found, the commissioning will have to be made in pulsed mode to minimize the activation. The acceptable losses vs beam duty factor will have to be calculated by the safety group during EVEDA. The whole accelerator has to be able to work also in pulsed mode, and this includes the source, the RF system and diagnostics. Beam diagnostics The development of diagnostics continues but is clearly not sufficient. The IFMIF program may profit from other project like SPIRAL2 [3], IPHI [1] or SNS [4], J-Park [5] and GSI [6] in order to develop non interceptive diagnostics. Some techniques are promising like the Doppler shifted line analyses or the backscattered particles detection that will be use during the IPHI tests in Saclay, or the profiler based on residual gas ionization in use in GANIL. Nevertheless the specificity of the IFMIF accelerators (very high beam power, low energy) makes the development crucial. They are also difficulties in finding good diagnostics for the longitudinal plane (transition RFQ-DTL and DTL tanks). It appears that the beam footprint monitoring instrumentation is not needed any more. This is a good point that needs to be clarified, as it is a crucial point at the intersection of 2 groups : target and accelerator. Beam diagnostics specific to IFMIF have to be developed during EVEDA. RFQ RFQ are expensive components. They are also crucial to bunch and accelerate the beam. The output beam energy has been part of an optimization of the whole design, and decreased from 8 to 5 MeV in 1999. There are 2 designs available, with similar performances. They were compared with different codes. It is important to know that only one of the 2 (the Saclay design) was used in the end-to-end error study performed by the Saclay group, including the HEBT. Also the Saclay team has performed SUPERFISH calculations and 2D shape optimizations which provided good RF power consumption.
The tuning knowledge of 4-vanes RFQ was a result of a strong CEA effort. It might be exported. Two types of cavity were evaluated for the IFMIF accelerator: 4-vanes and 4-rods types. One can quote that: - Four vanes structures are the less consuming structures. - Four rods RFQs show a very high peak power loss. The
value cannot be easily managed and induces engineering difficulties and possible deformations in CW mode.
The Frankfurt team looked seriously in the 4-rod options and recommends, as us, using 4-vane RFQ. Taking these results into account, we reinforce our recommendation using the 4-vane RFQ type. The 2-D transverse section is completely defined. The optimization leads to an RF consumption estimated to ≈ 1600 kW, “everything” included. One RF source has been saved. The work that needs to be done concerns the RF coupling in the cavity (engineering), the optimization of the 3D extremities, detailed design and integration. A high power RFQ cavity load must be build. It will help the design and will be useful as a load for the RF system and coupling loop tests. Tests using beam injection should also be included. Obviously, if the budget profile allows a fully-constructed RFQ, time and money will be saved. DTL A good and conservative design exists. It was included in the multiparticle end-to-end beam simulations performed in 2003. A hot model had good success in proving the feasibility. This hot model was developed at 352 MHz with similar or stricter parameters. Detailed design and integration have to be performed. Engineering prototypes at the right frequency for manufacture of the DTL is now required. The RF coupling to the cavity has also to be studied. The IFMIF High Energy Beam Transport line The HEBT was studied based on the reference concept (multipole expanders). It reaches performances close to the requirements. Nevertheless the differences need to be validated by the target group. The detailed design and integration of the line needs to be done. This will include the magnet specifications. The HEBT scrapers must be studied, and may have an impact on the line length (shielding). We already know that the magnetic elements of the end part of the line will have to be aligned with concepts coming from the 4th generation electron light machine. Their placement and displacement will have to be monitored with an active system (2 µm).
- 169 - EFDA Technology / Tritium Breeding and Materials / Neutron source
A cheaper solution may exist with a raster scanner technique. A safe and rigorous system may be built with a good benefit for the project. RF system We now have at least one manufacturer able to deliver a 1MW CW tube at 175MHz. The tube was tested for more than 1000 hours on a dummy load with success. The RF system remains the most expensive part of the accelerator. Therefore it is necessary to have a good control of the costing of these elements. We recommend to quickly developed, buy and test a full RF system. An experienced team is already working on this topics, it is a good point to maintain. The test can be made on the RFQ hot cavity, with beam coming in (test of the RF low level, RF high level, and beam injection capability). This supposes the availability of a test stand, as always stated by the accelerator group. Miscellaneous - The first point concerns the test stand. As stated by R.
Jameson: “Probably the largest “hole” in the EVDA definition is that the costs for the engineering validation tests assume the existence and underwriting of a powerful test facility, capable of installing and operating the D+ and H2
+ injectors, RFQ load cavity, complete RF system with one coupler, and beam diagnostics instrumentation (…/…) as a test stand”.
- The safety analysis should start as soon as possible. It
has a big impact on the accelerator and building designs. Experience with other projects showed that it may also lead to huge planning delays if not started on time. A call for work package was tendered by EFDA.
- The main beam parameters are defined at low energy.
So, if one wants to qualify the accelerator, it is necessary to build and test a source, LEBT, full RFQ and the first tank of the DTL. This will have to be followed by a diagnostic line. Doing so, each sub-component is fully tested (the first DTL tanks is the most difficult one), as well as the transitions which are crucial in a high-intensity/high-power accelerator (space charge regime).
Other development The project is a 2×5 MW beam power project. This is one of the most powerful projects in the world (with ILC- International Linear Collider). Therefore it was always based on conservative specifications. As the project is delayed, it might be interesting to support new developments like design based on superconducting cavities. This supposes that the new options MUST be compared at the same level than the reference design, to be able to prove their advantages. The technical baseline will be frozen with the construction decision phase.
Other During the year 2004, reviews were made on the present design, next R&D, schedule and costing with the Ad-Hoc committee and some of the accelerator team members. One of the point explained by the Ad-Hoc Committee in the “technical assessment report” is that “In an aggressive realisation scenario it should be possible to shorten significantly the total time planned for the EVEDA, construction and commissioning phases (currently 15 years to full exploitation), which would be in the best interest of the Project’s mission.”. It is necessary to keep in mind that the EVEDA phase was proposed to allow a spreading of the investment over the years. It was also pointed out at the time of the suggestion that it could lead to a global cost increase. CONCLUSIONS We have a reference design. This design has to enter in a detailed study phase, with prototypes or final parts. Integration, RF system, engineering models have to be made. This supposes a major investment and a decision on ITER/IFMIF has to be pronounced. Such an “announce effect” might be crucial for the project. The team needs to be reinforced, once the construction decision is made. The CEA-Saclay team is on a “waiting position”. Even if the CEA-Saclay team is not directly involved in the near future development, they can answer questions that may arise on the linac design. The main contact persons are: Pascal DEBU: [email protected]
Head of the SACM laboratory
Pierre-Yves BEAUVAIS: [email protected] IPHI project leader
Pierre-Emmanuel BERNAUDIN: [email protected] DTL hot model
Aline CURTONI: [email protected] 2D RFQ optimization
Michel DESMONS: [email protected] RF
Romuald DUPERRIER: [email protected]
Beam dynamics – end-to-end
Robin FERDINAND: [email protected] former task leader
Alain FRANCE: [email protected] RFQ tuning
Raphael GOBIN: [email protected] ECR source
Jacques PAYET: [email protected] HEBT
Didier URIOT: [email protected]
Beam dynamics – end-to-end
- 170 - EFDA Technology / Tritium Breeding and Materials / Neutron source
REFERENCES [1] P-Y. Beauvais - Status report on the construction of
the French high intensity proton injector (IPHI) - proceeding of EPAC 2002, Paris, page 539-541.
[2] R. Gobin et al. - High intensity ECR ion source (H+,
D+, H-) developments at CEA Saclay - ISIS2001 conference, RSI, Vol.73, n°2, February 2002 (922).
[3] SPIRAL 2 white book - To be published in May. [4] SNS Beam commissioning status - S. Henderson et al.
- Proc. EPAC 2004, p. 1524. [5] Beam Dynamics and Commissioning of the J-PARC
Linac - Y. Yamazaki et al. - Proc. EPAC 2004, p. 1351.
[6] The GSI synchrotron facility proposal for acceleration
of high intensity ion and proton beams - P. Spiller et al. Proc. PAC 2003, p. 589.
TASK LEADER Robin FERDINAND DSM/DAPNIA/SACM CEA-Saclay F-91191 Gif-sur-Yvette Cedex Tél. : 33 1 69 08 96 91 Fax : 33 1 69 08 14 30 E-mail : [email protected]
- 171 - EFDA Technology / Safety and Environment
SEA5-1 Task Title: VALIDATION OF COMPUTER CODES AND MODELS INTRODUCTION The Activated Corrosion Products (ACP) in the ITER Primary Heat Transfer Systems (PHTS) or Tokamak Water Cooling Systems (TCWS) can be of major concern as contributor to the source term of potential released activity to the environment in case of accident (LOCA for instance) and to the ORE (Occupational Radiological Exposure) during the normal operation of ITER. The PACTITER code, an adaptation of the PACTOLE code developed for Pressurized Water Reactor, has been used for predicting the ACP activities in the various PHTS or TCWS since 1995 [1]. On the other hand CORELE experiments have been performed in 2001 to test the capability of PACTITER V2 to reproduce measured release rates [2]. However some experimental artifacts have appeared during this tests campaign and shed a doubt on the relevance of the obtained results. An important effort has then been produced to qualify the functioning of this loop [3] [4] and the objective of the new 2004 tests campaign was thus to definitely determine release rates in order to validate the PACTITER V2.1 version.
2004 ACTIVITIES STAINLESS STEEL RELEASE RATE EVALUATION IN THE CORELE LOOP Experimental For TCWS operating conditions wall temperatures range between 100°C and 150°C and the coolant velocity from 0.04 m/s to 11 m/s. From a chemical point of view ITER operates under temperature at a pH equivalent to a neutral pH25°C. The 2004 CORELE test matrix proposed three tests devoted to the study of the influence of both temperature and flow rate in the same operating conditions of the 2001 tests campaign and corresponding to the ITER TCWS specifications (see table1). The tube sections are made of stainless steel SS316L(N)IG manufactured using industrial processes. They are activated in the OSIRIS reactor and then connected to the main circuit of the CORELE loop. Having circulated in the irradiated tubes, the coolant is purified by passing through mixed beds of ion-exchange resins. As far as no release can exist in the loop (cold part in polypropylene, hot part in zircaloy) except in the test sections the activity trapped in the resins is solely due the released radioactive ions. Due to the composition of the tested alloy, the main radio nuclides created by neutron irradiation in OSIRIS reactor and detected by gamma spectrometry in the beds of resins are 60Co, 58Co, 51Cr and 54Mn.
Table 1 : 2004 test matrix
ITER 2004- 01 ITER 2004-02 ITER 2004-03
SE1 SE2 SE1 SE2 SE3 SE4
insert No insert insert No insert insert No insert
Operating conditions 150°C / 150 bar 100°C / 150 bar 100°C / 120 bar
Velocity V (m/s) 4.12 1.02 3.96 0.95 3.82 1.01
Duration (hours) 353 332 335
O2 concentration (ppb) 4.15 <O2< 22.5 9<O2<24 3 <O2< 4
H2 concentration (cc/kg) 23.7<H2<26 23.5<H2<25.5 23.5<H2<25
Li (ppm) 0.21 0.195 0.23
pH25°C measured 6.6 6.85 6.6
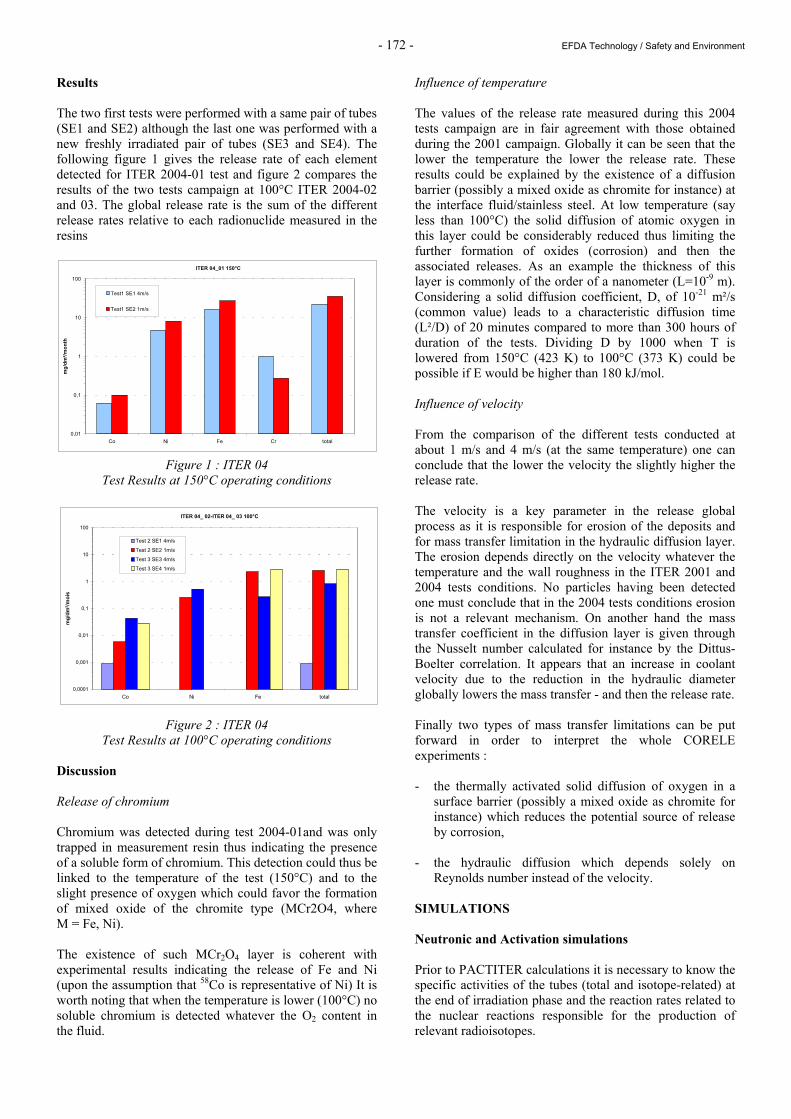
- 172 - EFDA Technology / Safety and Environment
Results The two first tests were performed with a same pair of tubes (SE1 and SE2) although the last one was performed with a new freshly irradiated pair of tubes (SE3 and SE4). The following figure 1 gives the release rate of each element detected for ITER 2004-01 test and figure 2 compares the results of the two tests campaign at 100°C ITER 2004-02 and 03. The global release rate is the sum of the different release rates relative to each radionuclide measured in the resins
Figure 1 : ITER 04 Test Results at 150°C operating conditions
Figure 2 : ITER 04 Test Results at 100°C operating conditions
Discussion Release of chromium Chromium was detected during test 2004-01and was only trapped in measurement resin thus indicating the presence of a soluble form of chromium. This detection could thus be linked to the temperature of the test (150°C) and to the slight presence of oxygen which could favor the formation of mixed oxide of the chromite type (MCr2O4, where M = Fe, Ni). The existence of such MCr2O4 layer is coherent with experimental results indicating the release of Fe and Ni (upon the assumption that 58Co is representative of Ni) It is worth noting that when the temperature is lower (100°C) no soluble chromium is detected whatever the O2 content in the fluid.
Influence of temperature The values of the release rate measured during this 2004 tests campaign are in fair agreement with those obtained during the 2001 campaign. Globally it can be seen that the lower the temperature the lower the release rate. These results could be explained by the existence of a diffusion barrier (possibly a mixed oxide as chromite for instance) at the interface fluid/stainless steel. At low temperature (say less than 100°C) the solid diffusion of atomic oxygen in this layer could be considerably reduced thus limiting the further formation of oxides (corrosion) and then the associated releases. As an example the thickness of this layer is commonly of the order of a nanometer (L=10-9 m). Considering a solid diffusion coefficient, D, of 10-21 m²/s (common value) leads to a characteristic diffusion time (L²/D) of 20 minutes compared to more than 300 hours of duration of the tests. Dividing D by 1000 when T is lowered from 150°C (423 K) to 100°C (373 K) could be possible if E would be higher than 180 kJ/mol. Influence of velocity From the comparison of the different tests conducted at about 1 m/s and 4 m/s (at the same temperature) one can conclude that the lower the velocity the slightly higher the release rate. The velocity is a key parameter in the release global process as it is responsible for erosion of the deposits and for mass transfer limitation in the hydraulic diffusion layer. The erosion depends directly on the velocity whatever the temperature and the wall roughness in the ITER 2001 and 2004 tests conditions. No particles having been detected one must conclude that in the 2004 tests conditions erosion is not a relevant mechanism. On another hand the mass transfer coefficient in the diffusion layer is given through the Nusselt number calculated for instance by the Dittus-Boelter correlation. It appears that an increase in coolant velocity due to the reduction in the hydraulic diameter globally lowers the mass transfer - and then the release rate. Finally two types of mass transfer limitations can be put forward in order to interpret the whole CORELE experiments : - the thermally activated solid diffusion of oxygen in a
surface barrier (possibly a mixed oxide as chromite for instance) which reduces the potential source of release by corrosion,
- the hydraulic diffusion which depends solely on
Reynolds number instead of the velocity. SIMULATIONS Neutronic and Activation simulations Prior to PACTITER calculations it is necessary to know the specific activities of the tubes (total and isotope-related) at the end of irradiation phase and the reaction rates related to the nuclear reactions responsible for the production of relevant radioisotopes.
ITER 04_ 02-ITER 04_ 03 100°C
0,0001
0,001
0,01
0,1
1
10
100
Co Ni Fe total
mg/
dm²/m
ois
Test 2 SE1 4m/s
Test 2 SE2 1m/s
Test 3 SE3 4m/s
Test 3 SE4 1m/s
ITER 04_01 150°C
0,01
0,1
1
10
100
Co Ni Fe Cr total
mg/
dm²/m
onth
Test1 SE1 4m/s
Test1 SE2 1m/s
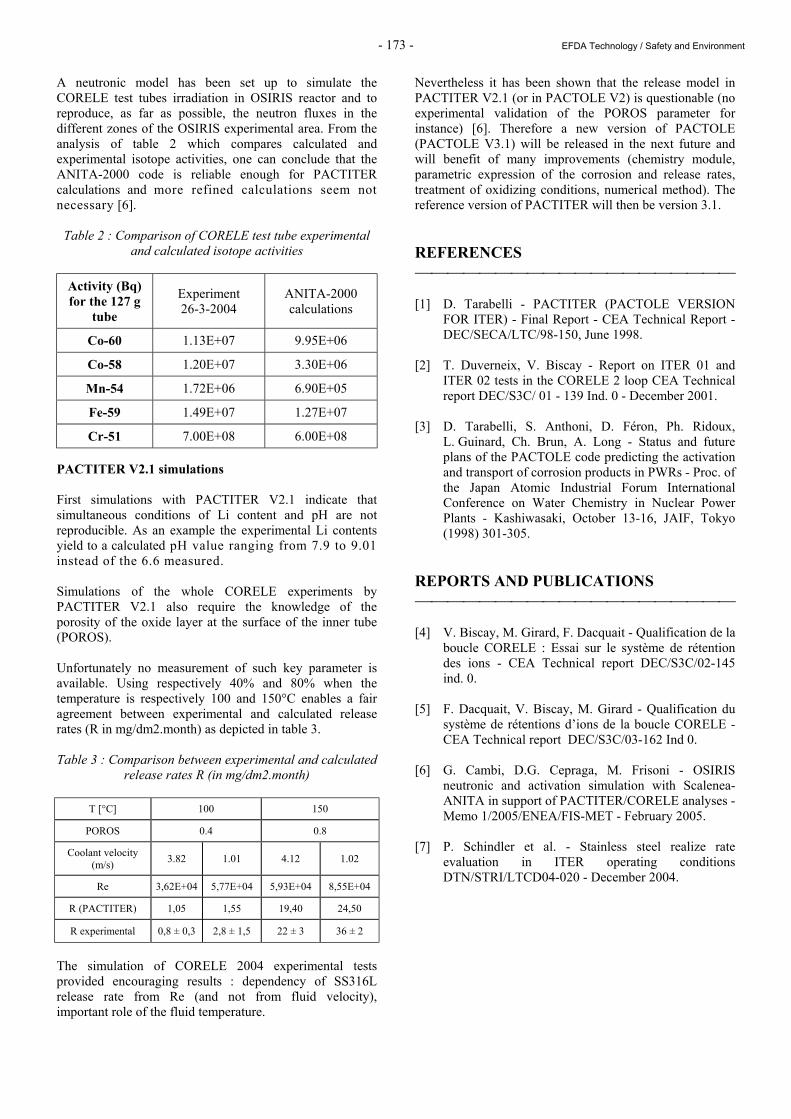
- 173 - EFDA Technology / Safety and Environment
A neutronic model has been set up to simulate the CORELE test tubes irradiation in OSIRIS reactor and to reproduce, as far as possible, the neutron fluxes in the different zones of the OSIRIS experimental area. From the analysis of table 2 which compares calculated and experimental isotope activities, one can conclude that the ANITA-2000 code is reliable enough for PACTITER calculations and more refined calculations seem not necessary [6].
Table 2 : Comparison of CORELE test tube experimental and calculated isotope activities
Activity (Bq) for the 127 g
tube
Experiment 26-3-2004
ANITA-2000 calculations
Co-60 1.13E+07 9.95E+06
Co-58 1.20E+07 3.30E+06
Mn-54 1.72E+06 6.90E+05
Fe-59 1.49E+07 1.27E+07
Cr-51 7.00E+08 6.00E+08 PACTITER V2.1 simulations First simulations with PACTITER V2.1 indicate that simultaneous conditions of Li content and pH are not reproducible. As an example the experimental Li contents yield to a calculated pH value ranging from 7.9 to 9.01 instead of the 6.6 measured. Simulations of the whole CORELE experiments by PACTITER V2.1 also require the knowledge of the porosity of the oxide layer at the surface of the inner tube (POROS). Unfortunately no measurement of such key parameter is available. Using respectively 40% and 80% when the temperature is respectively 100 and 150°C enables a fair agreement between experimental and calculated release rates (R in mg/dm2.month) as depicted in table 3. Table 3 : Comparison between experimental and calculated
release rates R (in mg/dm2.month)
T [°C] 100 150
POROS 0.4 0.8
Coolant velocity (m/s) 3.82 1.01 4.12 1.02
Re 3,62E+04 5,77E+04 5,93E+04 8,55E+04
R (PACTITER) 1,05 1,55 19,40 24,50
R experimental 0,8 ± 0,3 2,8 ± 1,5 22 ± 3 36 ± 2
The simulation of CORELE 2004 experimental tests provided encouraging results : dependency of SS316L release rate from Re (and not from fluid velocity), important role of the fluid temperature.
Nevertheless it has been shown that the release model in PACTITER V2.1 (or in PACTOLE V2) is questionable (no experimental validation of the POROS parameter for instance) [6]. Therefore a new version of PACTOLE (PACTOLE V3.1) will be released in the next future and will benefit of many improvements (chemistry module, parametric expression of the corrosion and release rates, treatment of oxidizing conditions, numerical method). The reference version of PACTITER will then be version 3.1. REFERENCES [1] D. Tarabelli - PACTITER (PACTOLE VERSION
FOR ITER) - Final Report - CEA Technical Report - DEC/SECA/LTC/98-150, June 1998.
[2] T. Duverneix, V. Biscay - Report on ITER 01 and
ITER 02 tests in the CORELE 2 loop CEA Technical report DEC/S3C/ 01 - 139 Ind. 0 - December 2001.
[3] D. Tarabelli, S. Anthoni, D. Féron, Ph. Ridoux,
L. Guinard, Ch. Brun, A. Long - Status and future plans of the PACTOLE code predicting the activation and transport of corrosion products in PWRs - Proc. of the Japan Atomic Industrial Forum International Conference on Water Chemistry in Nuclear Power Plants - Kashiwasaki, October 13-16, JAIF, Tokyo (1998) 301-305.
REPORTS AND PUBLICATIONS [4] V. Biscay, M. Girard, F. Dacquait - Qualification de la
boucle CORELE : Essai sur le système de rétention des ions - CEA Technical report DEC/S3C/02-145 ind. 0.
[5] F. Dacquait, V. Biscay, M. Girard - Qualification du
système de rétentions d’ions de la boucle CORELE - CEA Technical report DEC/S3C/03-162 Ind 0.
[6] G. Cambi, D.G. Cepraga, M. Frisoni - OSIRIS
neutronic and activation simulation with Scalenea-ANITA in support of PACTITER/CORELE analyses - Memo 1/2005/ENEA/FIS-MET - February 2005.
[7] P. Schindler et al. - Stainless steel realize rate
evaluation in ITER operating conditions DTN/STRI/LTCD04-020 - December 2004.

- 174 - EFDA Technology / Safety and Environment
TASK LEADER Patricia SCHINDLER DTN/STRI/LTCD CEA-Cadarache F-13108 Saint-Paul-Lez-Durance Cedex Tél. : 33 4 42 25 73 62 Fax : 33 4 42 25 47 77 E-mail : [email protected]
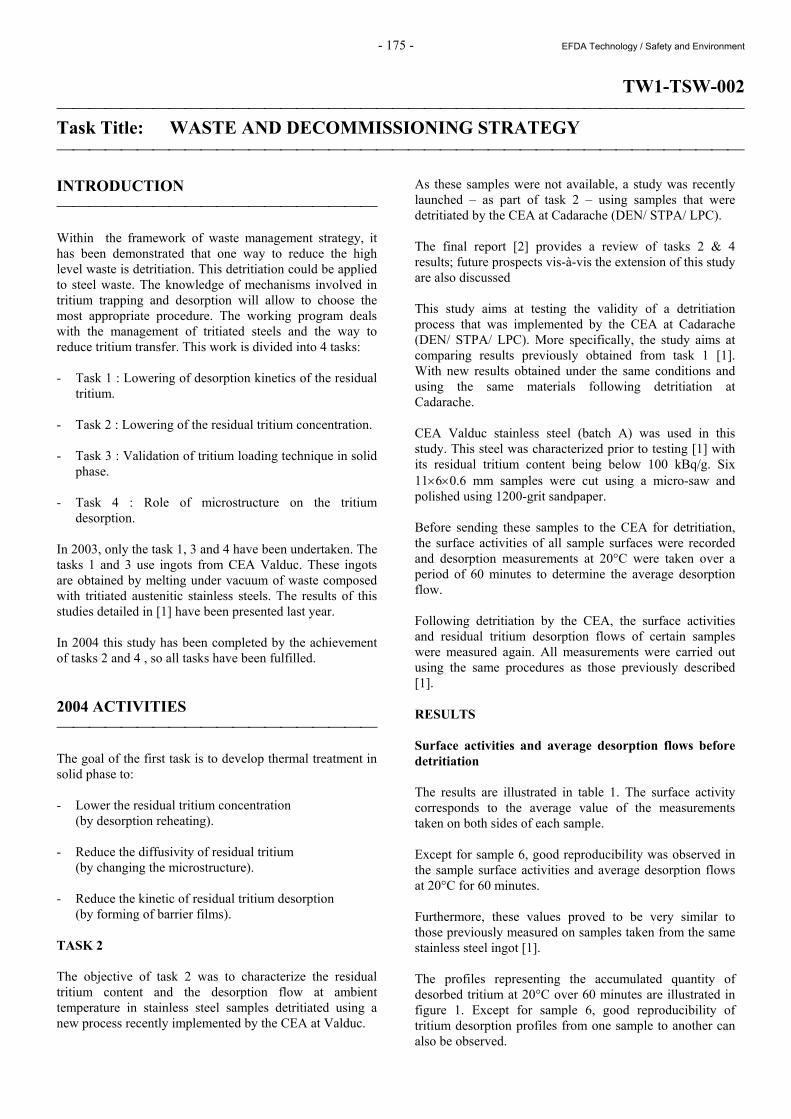
- 175 - EFDA Technology / Safety and Environment
TW1-TSW-002 Task Title: WASTE AND DECOMMISSIONING STRATEGY INTRODUCTION Within the framework of waste management strategy, it has been demonstrated that one way to reduce the high level waste is detritiation. This detritiation could be applied to steel waste. The knowledge of mechanisms involved in tritium trapping and desorption will allow to choose the most appropriate procedure. The working program deals with the management of tritiated steels and the way to reduce tritium transfer. This work is divided into 4 tasks: - Task 1 : Lowering of desorption kinetics of the residual
tritium. - Task 2 : Lowering of the residual tritium concentration. - Task 3 : Validation of tritium loading technique in solid
phase. - Task 4 : Role of microstructure on the tritium
desorption. In 2003, only the task 1, 3 and 4 have been undertaken. The tasks 1 and 3 use ingots from CEA Valduc. These ingots are obtained by melting under vacuum of waste composed with tritiated austenitic stainless steels. The results of this studies detailed in [1] have been presented last year. In 2004 this study has been completed by the achievement of tasks 2 and 4 , so all tasks have been fulfilled. 2004 ACTIVITIES The goal of the first task is to develop thermal treatment in solid phase to: - Lower the residual tritium concentration
(by desorption reheating). - Reduce the diffusivity of residual tritium
(by changing the microstructure). - Reduce the kinetic of residual tritium desorption
(by forming of barrier films). TASK 2 The objective of task 2 was to characterize the residual tritium content and the desorption flow at ambient temperature in stainless steel samples detritiated using a new process recently implemented by the CEA at Valduc.
As these samples were not available, a study was recently launched – as part of task 2 – using samples that were detritiated by the CEA at Cadarache (DEN/ STPA/ LPC). The final report [2] provides a review of tasks 2 & 4 results; future prospects vis-à-vis the extension of this study are also discussed This study aims at testing the validity of a detritiation process that was implemented by the CEA at Cadarache (DEN/ STPA/ LPC). More specifically, the study aims at comparing results previously obtained from task 1 [1]. With new results obtained under the same conditions and using the same materials following detritiation at Cadarache. CEA Valduc stainless steel (batch A) was used in this study. This steel was characterized prior to testing [1] with its residual tritium content being below 100 kBq/g. Six 11×6×0.6 mm samples were cut using a micro-saw and polished using 1200-grit sandpaper. Before sending these samples to the CEA for detritiation, the surface activities of all sample surfaces were recorded and desorption measurements at 20°C were taken over a period of 60 minutes to determine the average desorption flow. Following detritiation by the CEA, the surface activities and residual tritium desorption flows of certain samples were measured again. All measurements were carried out using the same procedures as those previously described [1]. RESULTS Surface activities and average desorption flows before detritiation The results are illustrated in table 1. The surface activity corresponds to the average value of the measurements taken on both sides of each sample. Except for sample 6, good reproducibility was observed in the sample surface activities and average desorption flows at 20°C for 60 minutes. Furthermore, these values proved to be very similar to those previously measured on samples taken from the same stainless steel ingot [1]. The profiles representing the accumulated quantity of desorbed tritium at 20°C over 60 minutes are illustrated in figure 1. Except for sample 6, good reproducibility of tritium desorption profiles from one sample to another can also be observed.
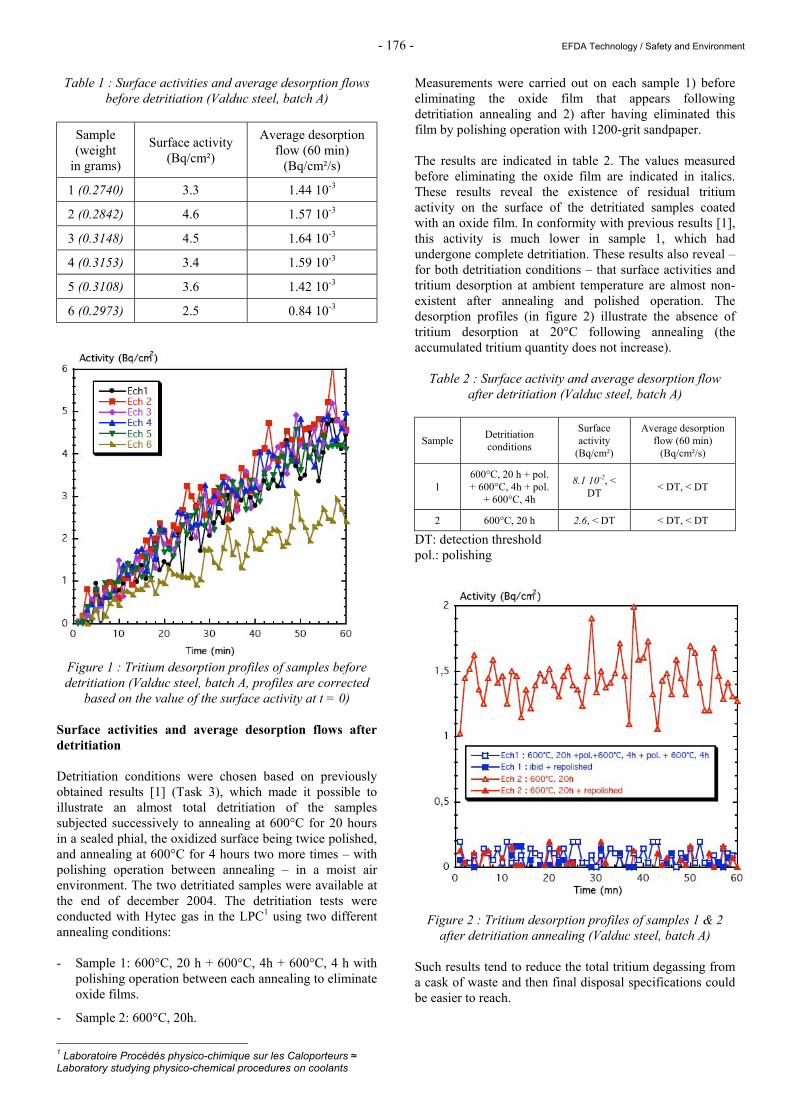
- 176 - EFDA Technology / Safety and Environment
Table 1 : Surface activities and average desorption flows before detritiation (Valduc steel, batch A)
Sample (weight
in grams)
Surface activity (Bq/cm²)
Average desorption flow (60 min)
(Bq/cm²/s)
1 (0.2740) 3.3 1.44 10-3
2 (0.2842) 4.6 1.57 10-3
3 (0.3148) 4.5 1.64 10-3
4 (0.3153) 3.4 1.59 10-3
5 (0.3108) 3.6 1.42 10-3
6 (0.2973) 2.5 0.84 10-3
Figure 1 : Tritium desorption profiles of samples before detritiation (Valduc steel, batch A, profiles are corrected
based on the value of the surface activity at t = 0) Surface activities and average desorption flows after detritiation Detritiation conditions were chosen based on previously obtained results [1] (Task 3), which made it possible to illustrate an almost total detritiation of the samples subjected successively to annealing at 600°C for 20 hours in a sealed phial, the oxidized surface being twice polished, and annealing at 600°C for 4 hours two more times – with polishing operation between annealing – in a moist air environment. The two detritiated samples were available at the end of december 2004. The detritiation tests were conducted with Hytec gas in the LPC1 using two different annealing conditions: - Sample 1: 600°C, 20 h + 600°C, 4h + 600°C, 4 h with
polishing operation between each annealing to eliminate oxide films.
- Sample 2: 600°C, 20h.
1 Laboratoire Procédés physico-chimique sur les Caloporteurs ≈ Laboratory studying physico-chemical procedures on coolants
Measurements were carried out on each sample 1) before eliminating the oxide film that appears following detritiation annealing and 2) after having eliminated this film by polishing operation with 1200-grit sandpaper. The results are indicated in table 2. The values measured before eliminating the oxide film are indicated in italics. These results reveal the existence of residual tritium activity on the surface of the detritiated samples coated with an oxide film. In conformity with previous results [1], this activity is much lower in sample 1, which had undergone complete detritiation. These results also reveal – for both detritiation conditions – that surface activities and tritium desorption at ambient temperature are almost non-existent after annealing and polished operation. The desorption profiles (in figure 2) illustrate the absence of tritium desorption at 20°C following annealing (the accumulated tritium quantity does not increase).
Table 2 : Surface activity and average desorption flow after detritiation (Valduc steel, batch A)
Sample Detritiation conditions
Surface activity
(Bq/cm²)
Average desorption flow (60 min)
(Bq/cm²/s)
1 600°C, 20 h + pol. + 600°C, 4h + pol.
+ 600°C, 4h
8.1 10-2, < DT < DT, < DT
2 600°C, 20 h 2.6, < DT < DT, < DT
DT: detection threshold pol.: polishing
Figure 2 : Tritium desorption profiles of samples 1 & 2 after detritiation annealing (Valduc steel, batch A)
Such results tend to reduce the total tritium degassing from a cask of waste and then final disposal specifications could be easier to reach.
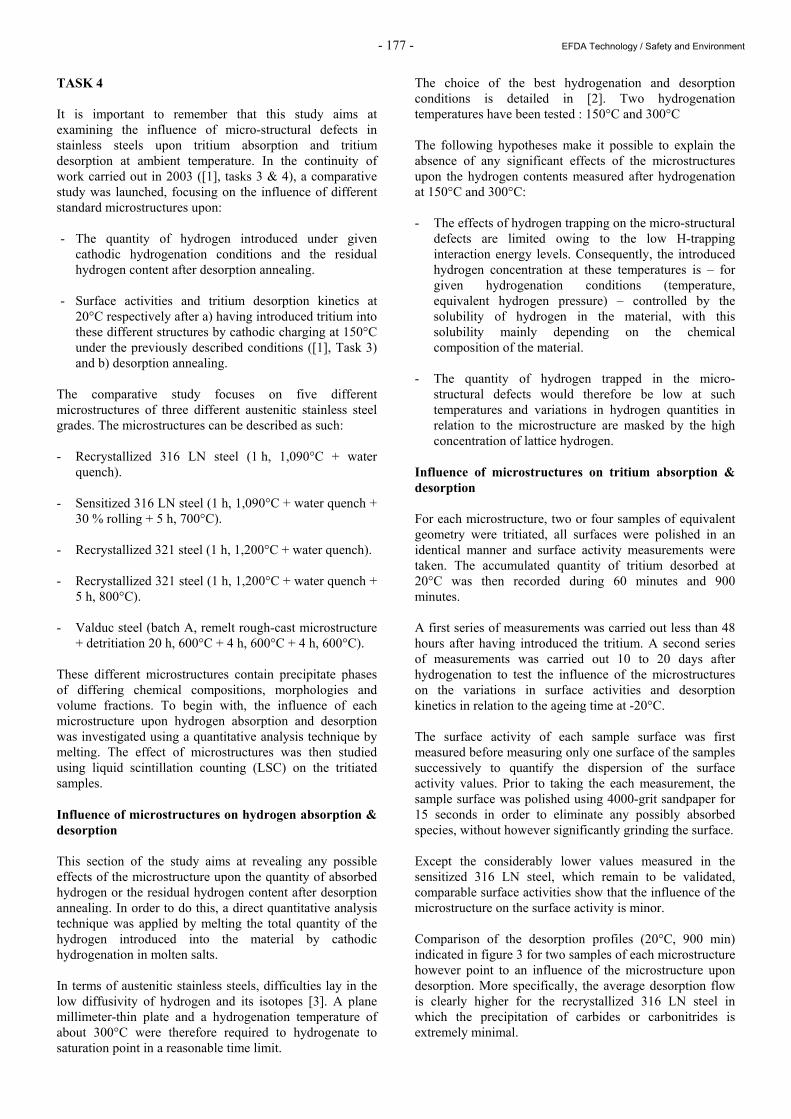
- 177 - EFDA Technology / Safety and Environment
TASK 4 It is important to remember that this study aims at examining the influence of micro-structural defects in stainless steels upon tritium absorption and tritium desorption at ambient temperature. In the continuity of work carried out in 2003 ([1], tasks 3 & 4), a comparative study was launched, focusing on the influence of different standard microstructures upon: - The quantity of hydrogen introduced under given
cathodic hydrogenation conditions and the residual hydrogen content after desorption annealing.
- Surface activities and tritium desorption kinetics at
20°C respectively after a) having introduced tritium into these different structures by cathodic charging at 150°C under the previously described conditions ([1], Task 3) and b) desorption annealing.
The comparative study focuses on five different microstructures of three different austenitic stainless steel grades. The microstructures can be described as such: - Recrystallized 316 LN steel (1 h, 1,090°C + water
quench). - Sensitized 316 LN steel (1 h, 1,090°C + water quench +
30 % rolling + 5 h, 700°C). - Recrystallized 321 steel (1 h, 1,200°C + water quench). - Recrystallized 321 steel (1 h, 1,200°C + water quench +
5 h, 800°C). - Valduc steel (batch A, remelt rough-cast microstructure
+ detritiation 20 h, 600°C + 4 h, 600°C + 4 h, 600°C). These different microstructures contain precipitate phases of differing chemical compositions, morphologies and volume fractions. To begin with, the influence of each microstructure upon hydrogen absorption and desorption was investigated using a quantitative analysis technique by melting. The effect of microstructures was then studied using liquid scintillation counting (LSC) on the tritiated samples. Influence of microstructures on hydrogen absorption & desorption This section of the study aims at revealing any possible effects of the microstructure upon the quantity of absorbed hydrogen or the residual hydrogen content after desorption annealing. In order to do this, a direct quantitative analysis technique was applied by melting the total quantity of the hydrogen introduced into the material by cathodic hydrogenation in molten salts. In terms of austenitic stainless steels, difficulties lay in the low diffusivity of hydrogen and its isotopes [3]. A plane millimeter-thin plate and a hydrogenation temperature of about 300°C were therefore required to hydrogenate to saturation point in a reasonable time limit.
The choice of the best hydrogenation and desorption conditions is detailed in [2]. Two hydrogenation temperatures have been tested : 150°C and 300°C The following hypotheses make it possible to explain the absence of any significant effects of the microstructures upon the hydrogen contents measured after hydrogenation at 150°C and 300°C: - The effects of hydrogen trapping on the micro-structural
defects are limited owing to the low H-trapping interaction energy levels. Consequently, the introduced hydrogen concentration at these temperatures is – for given hydrogenation conditions (temperature, equivalent hydrogen pressure) – controlled by the solubility of hydrogen in the material, with this solubility mainly depending on the chemical composition of the material.
- The quantity of hydrogen trapped in the micro-
structural defects would therefore be low at such temperatures and variations in hydrogen quantities in relation to the microstructure are masked by the high concentration of lattice hydrogen.
Influence of microstructures on tritium absorption & desorption For each microstructure, two or four samples of equivalent geometry were tritiated, all surfaces were polished in an identical manner and surface activity measurements were taken. The accumulated quantity of tritium desorbed at 20°C was then recorded during 60 minutes and 900 minutes. A first series of measurements was carried out less than 48 hours after having introduced the tritium. A second series of measurements was carried out 10 to 20 days after hydrogenation to test the influence of the microstructures on the variations in surface activities and desorption kinetics in relation to the ageing time at -20°C. The surface activity of each sample surface was first measured before measuring only one surface of the samples successively to quantify the dispersion of the surface activity values. Prior to taking the each measurement, the sample surface was polished using 4000-grit sandpaper for 15 seconds in order to eliminate any possibly absorbed species, without however significantly grinding the surface. Except the considerably lower values measured in the sensitized 316 LN steel, which remain to be validated, comparable surface activities show that the influence of the microstructure on the surface activity is minor. Comparison of the desorption profiles (20°C, 900 min) indicated in figure 3 for two samples of each microstructure however point to an influence of the microstructure upon desorption. More specifically, the average desorption flow is clearly higher for the recrystallized 316 LN steel in which the precipitation of carbides or carbonitrides is extremely minimal.
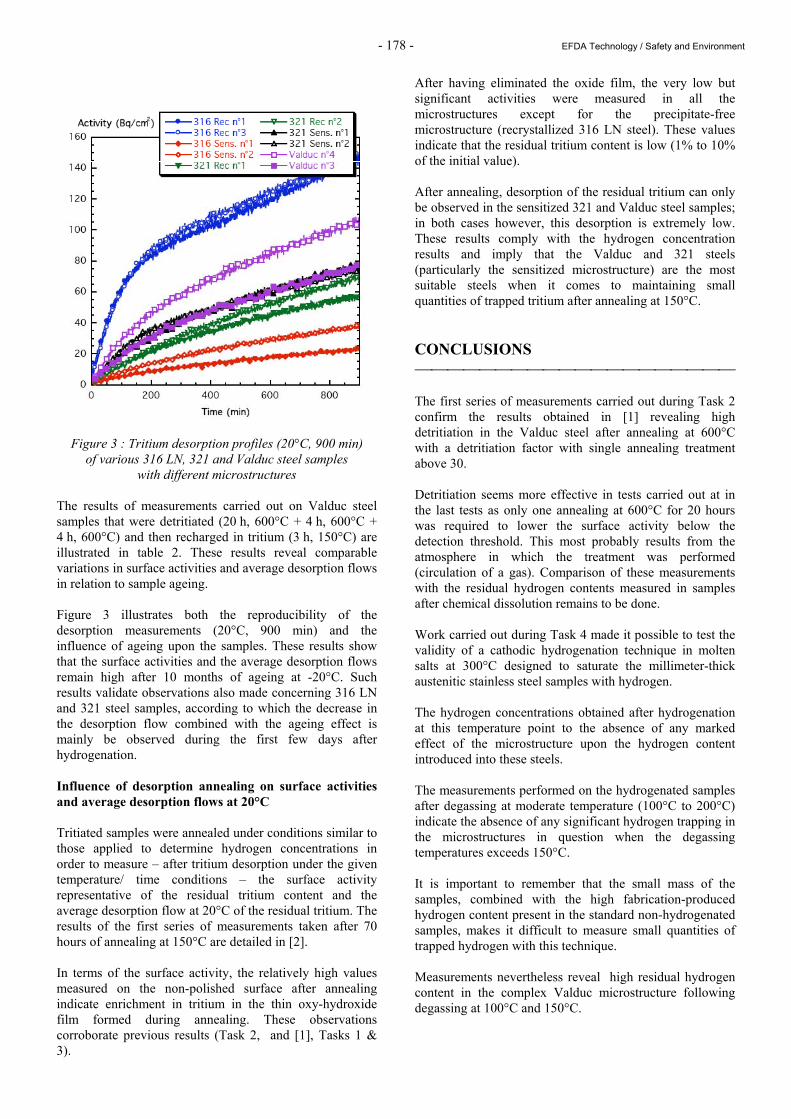
- 178 - EFDA Technology / Safety and Environment
Figure 3 : Tritium desorption profiles (20°C, 900 min)
of various 316 LN, 321 and Valduc steel samples with different microstructures
The results of measurements carried out on Valduc steel samples that were detritiated (20 h, 600°C + 4 h, 600°C + 4 h, 600°C) and then recharged in tritium (3 h, 150°C) are illustrated in table 2. These results reveal comparable variations in surface activities and average desorption flows in relation to sample ageing. Figure 3 illustrates both the reproducibility of the desorption measurements (20°C, 900 min) and the influence of ageing upon the samples. These results show that the surface activities and the average desorption flows remain high after 10 months of ageing at -20°C. Such results validate observations also made concerning 316 LN and 321 steel samples, according to which the decrease in the desorption flow combined with the ageing effect is mainly be observed during the first few days after hydrogenation. Influence of desorption annealing on surface activities and average desorption flows at 20°C Tritiated samples were annealed under conditions similar to those applied to determine hydrogen concentrations in order to measure – after tritium desorption under the given temperature/ time conditions – the surface activity representative of the residual tritium content and the average desorption flow at 20°C of the residual tritium. The results of the first series of measurements taken after 70 hours of annealing at 150°C are detailed in [2]. In terms of the surface activity, the relatively high values measured on the non-polished surface after annealing indicate enrichment in tritium in the thin oxy-hydroxide film formed during annealing. These observations corroborate previous results (Task 2, and [1], Tasks 1 & 3).
After having eliminated the oxide film, the very low but significant activities were measured in all the microstructures except for the precipitate-free microstructure (recrystallized 316 LN steel). These values indicate that the residual tritium content is low (1% to 10% of the initial value). After annealing, desorption of the residual tritium can only be observed in the sensitized 321 and Valduc steel samples; in both cases however, this desorption is extremely low. These results comply with the hydrogen concentration results and imply that the Valduc and 321 steels (particularly the sensitized microstructure) are the most suitable steels when it comes to maintaining small quantities of trapped tritium after annealing at 150°C. CONCLUSIONS The first series of measurements carried out during Task 2 confirm the results obtained in [1] revealing high detritiation in the Valduc steel after annealing at 600°C with a detritiation factor with single annealing treatment above 30. Detritiation seems more effective in tests carried out at in the last tests as only one annealing at 600°C for 20 hours was required to lower the surface activity below the detection threshold. This most probably results from the atmosphere in which the treatment was performed (circulation of a gas). Comparison of these measurements with the residual hydrogen contents measured in samples after chemical dissolution remains to be done. Work carried out during Task 4 made it possible to test the validity of a cathodic hydrogenation technique in molten salts at 300°C designed to saturate the millimeter-thick austenitic stainless steel samples with hydrogen. The hydrogen concentrations obtained after hydrogenation at this temperature point to the absence of any marked effect of the microstructure upon the hydrogen content introduced into these steels. The measurements performed on the hydrogenated samples after degassing at moderate temperature (100°C to 200°C) indicate the absence of any significant hydrogen trapping in the microstructures in question when the degassing temperatures exceeds 150°C. It is important to remember that the small mass of the samples, combined with the high fabrication-produced hydrogen content present in the standard non-hydrogenated samples, makes it difficult to measure small quantities of trapped hydrogen with this technique. Measurements nevertheless reveal high residual hydrogen content in the complex Valduc microstructure following degassing at 100°C and 150°C.
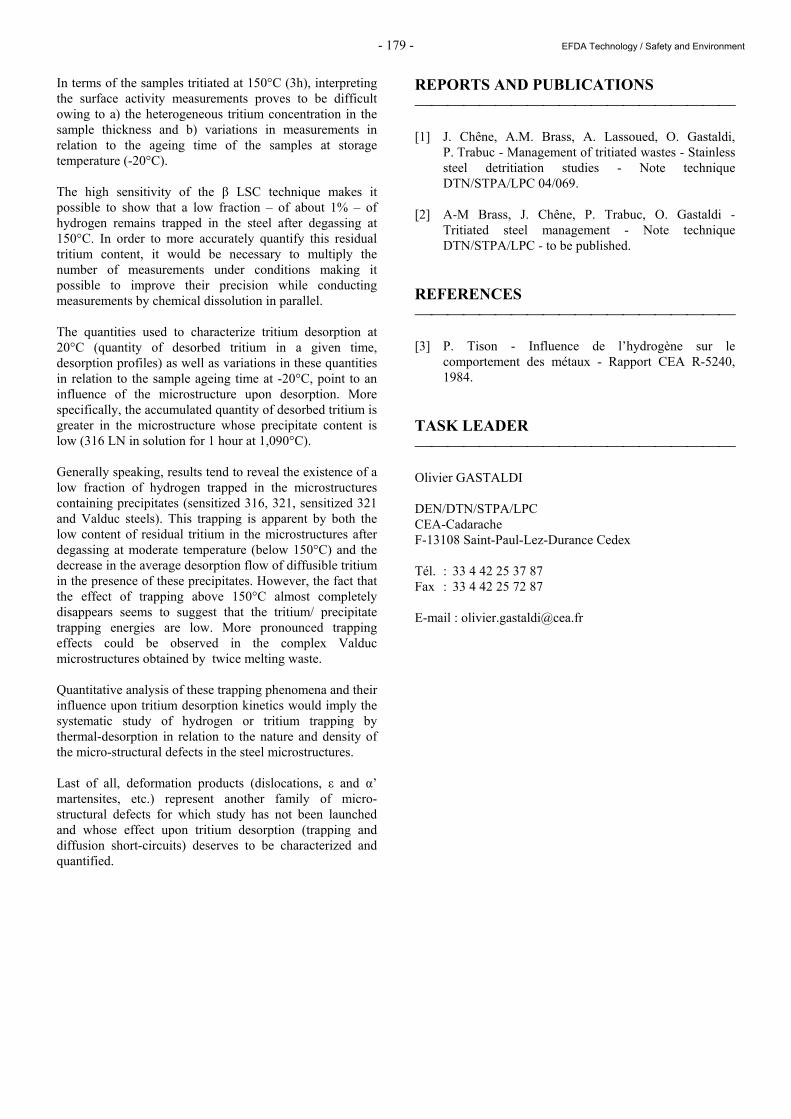
- 179 - EFDA Technology / Safety and Environment
In terms of the samples tritiated at 150°C (3h), interpreting the surface activity measurements proves to be difficult owing to a) the heterogeneous tritium concentration in the sample thickness and b) variations in measurements in relation to the ageing time of the samples at storage temperature (-20°C). The high sensitivity of the β LSC technique makes it possible to show that a low fraction – of about 1% – of hydrogen remains trapped in the steel after degassing at 150°C. In order to more accurately quantify this residual tritium content, it would be necessary to multiply the number of measurements under conditions making it possible to improve their precision while conducting measurements by chemical dissolution in parallel. The quantities used to characterize tritium desorption at 20°C (quantity of desorbed tritium in a given time, desorption profiles) as well as variations in these quantities in relation to the sample ageing time at -20°C, point to an influence of the microstructure upon desorption. More specifically, the accumulated quantity of desorbed tritium is greater in the microstructure whose precipitate content is low (316 LN in solution for 1 hour at 1,090°C). Generally speaking, results tend to reveal the existence of a low fraction of hydrogen trapped in the microstructures containing precipitates (sensitized 316, 321, sensitized 321 and Valduc steels). This trapping is apparent by both the low content of residual tritium in the microstructures after degassing at moderate temperature (below 150°C) and the decrease in the average desorption flow of diffusible tritium in the presence of these precipitates. However, the fact that the effect of trapping above 150°C almost completely disappears seems to suggest that the tritium/ precipitate trapping energies are low. More pronounced trapping effects could be observed in the complex Valduc microstructures obtained by twice melting waste. Quantitative analysis of these trapping phenomena and their influence upon tritium desorption kinetics would imply the systematic study of hydrogen or tritium trapping by thermal-desorption in relation to the nature and density of the micro-structural defects in the steel microstructures. Last of all, deformation products (dislocations, ε and α’ martensites, etc.) represent another family of micro-structural defects for which study has not been launched and whose effect upon tritium desorption (trapping and diffusion short-circuits) deserves to be characterized and quantified.
REPORTS AND PUBLICATIONS [1] J. Chêne, A.M. Brass, A. Lassoued, O. Gastaldi,
P. Trabuc - Management of tritiated wastes - Stainless steel detritiation studies - Note technique DTN/STPA/LPC 04/069.
[2] A-M Brass, J. Chêne, P. Trabuc, O. Gastaldi -
Tritiated steel management - Note technique DTN/STPA/LPC - to be published.
REFERENCES [3] P. Tison - Influence de l’hydrogène sur le
comportement des métaux - Rapport CEA R-5240, 1984.
TASK LEADER Olivier GASTALDI DEN/DTN/STPA/LPC CEA-Cadarache F-13108 Saint-Paul-Lez-Durance Cedex Tél. : 33 4 42 25 37 87 Fax : 33 4 42 25 72 87 E-mail : [email protected]

- 180 - EFDA Technology / Safety and Environment
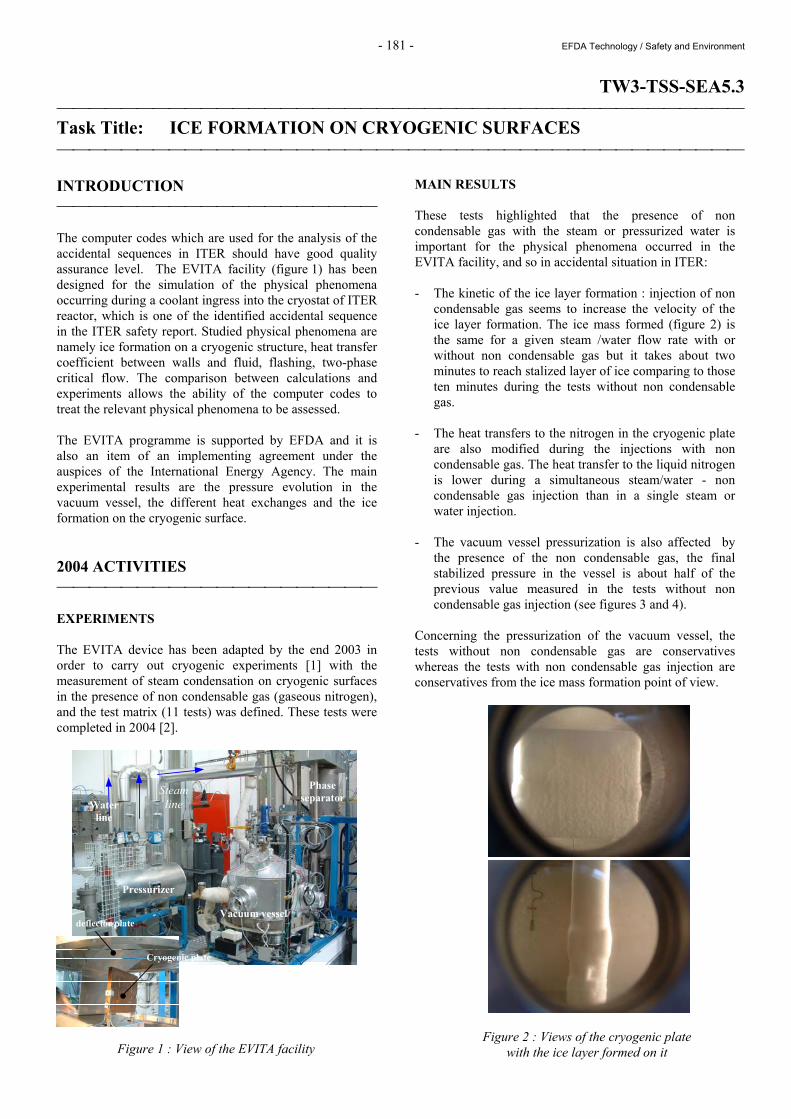
- 181 - EFDA Technology / Safety and Environment
TW3-TSS-SEA5.3 Task Title: ICE FORMATION ON CRYOGENIC SURFACES INTRODUCTION The computer codes which are used for the analysis of the accidental sequences in ITER should have good quality assurance level. The EVITA facility (figure 1) has been designed for the simulation of the physical phenomena occurring during a coolant ingress into the cryostat of ITER reactor, which is one of the identified accidental sequence in the ITER safety report. Studied physical phenomena are namely ice formation on a cryogenic structure, heat transfer coefficient between walls and fluid, flashing, two-phase critical flow. The comparison between calculations and experiments allows the ability of the computer codes to treat the relevant physical phenomena to be assessed. The EVITA programme is supported by EFDA and it is also an item of an implementing agreement under the auspices of the International Energy Agency. The main experimental results are the pressure evolution in the vacuum vessel, the different heat exchanges and the ice formation on the cryogenic surface. 2004 ACTIVITIES EXPERIMENTS The EVITA device has been adapted by the end 2003 in order to carry out cryogenic experiments [1] with the measurement of steam condensation on cryogenic surfaces in the presence of non condensable gas (gaseous nitrogen), and the test matrix (11 tests) was defined. These tests were completed in 2004 [2].
Figure 1 : View of the EVITA facility
Pressurizer
Vacuum vessel
Phase separator
Water line
Steam line
deflector plate
Cryogenic plate
MAIN RESULTS These tests highlighted that the presence of non condensable gas with the steam or pressurized water is important for the physical phenomena occurred in the EVITA facility, and so in accidental situation in ITER: - The kinetic of the ice layer formation : injection of non
condensable gas seems to increase the velocity of the ice layer formation. The ice mass formed (figure 2) is the same for a given steam /water flow rate with or without non condensable gas but it takes about two minutes to reach stalized layer of ice comparing to those ten minutes during the tests without non condensable gas.
- The heat transfers to the nitrogen in the cryogenic plate
are also modified during the injections with non condensable gas. The heat transfer to the liquid nitrogen is lower during a simultaneous steam/water - non condensable gas injection than in a single steam or water injection.
- The vacuum vessel pressurization is also affected by
the presence of the non condensable gas, the final stabilized pressure in the vessel is about half of the previous value measured in the tests without non condensable gas injection (see figures 3 and 4).
Concerning the pressurization of the vacuum vessel, the tests without non condensable gas are conservatives whereas the tests with non condensable gas injection are conservatives from the ice mass formation point of view.
Figure 2 : Views of the cryogenic plate with the ice layer formed on it Figure 1 : View of the EVITA facility
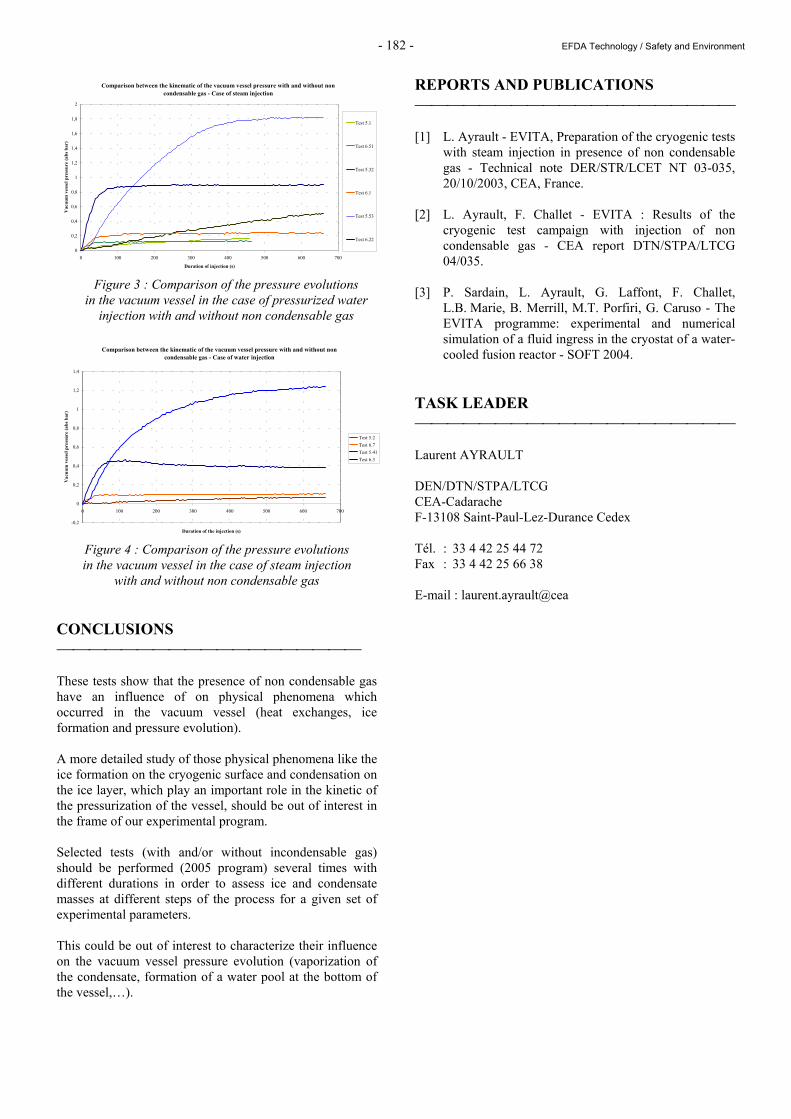
- 182 - EFDA Technology / Safety and Environment
Comparison between the kinematic of the vacuum vessel pressure with and without non condensable gas - Case of steam injection
0
0,2
0,4
0,6
0,8
1
1,2
1,4
1,6
1,8
2
0 100 200 300 400 500 600 700
Duration of injection (s)
Vac
uum
ves
sel p
ress
ure
(abs
bar
)
Test 5.1
Test 6.51
Test 5.32
Test 6.1
Test 5.53
Test 6.22
Figure 3 : Comparison of the pressure evolutions
in the vacuum vessel in the case of pressurized water injection with and without non condensable gas
Comparison between the kinematic of the vacuum vessel pressure with and without non
condensable gas - Case of water injection
-0,2
0
0,2
0,4
0,6
0,8
1
1,2
1,4
0 100 200 300 400 500 600 700
Duration of the injection (s)
Vac
uum
ves
sel p
ress
ure
(abs
bar
)
Test 5.2Test 6.7Test 5.41Test 6.3
Figure 4 : Comparison of the pressure evolutions in the vacuum vessel in the case of steam injection
with and without non condensable gas CONCLUSIONS These tests show that the presence of non condensable gas have an influence of on physical phenomena which occurred in the vacuum vessel (heat exchanges, ice formation and pressure evolution). A more detailed study of those physical phenomena like the ice formation on the cryogenic surface and condensation on the ice layer, which play an important role in the kinetic of the pressurization of the vessel, should be out of interest in the frame of our experimental program. Selected tests (with and/or without incondensable gas) should be performed (2005 program) several times with different durations in order to assess ice and condensate masses at different steps of the process for a given set of experimental parameters. This could be out of interest to characterize their influence on the vacuum vessel pressure evolution (vaporization of the condensate, formation of a water pool at the bottom of the vessel,…).
REPORTS AND PUBLICATIONS [1] L. Ayrault - EVITA, Preparation of the cryogenic tests
with steam injection in presence of non condensable gas - Technical note DER/STR/LCET NT 03-035, 20/10/2003, CEA, France.
[2] L. Ayrault, F. Challet - EVITA : Results of the
cryogenic test campaign with injection of non condensable gas - CEA report DTN/STPA/LTCG 04/035.
[3] P. Sardain, L. Ayrault, G. Laffont, F. Challet,
L.B. Marie, B. Merrill, M.T. Porfiri, G. Caruso - The EVITA programme: experimental and numerical simulation of a fluid ingress in the cryostat of a water-cooled fusion reactor - SOFT 2004.
TASK LEADER Laurent AYRAULT DEN/DTN/STPA/LTCG CEA-Cadarache F-13108 Saint-Paul-Lez-Durance Cedex Tél. : 33 4 42 25 44 72 Fax : 33 4 42 25 66 38 E-mail : laurent.ayrault@cea
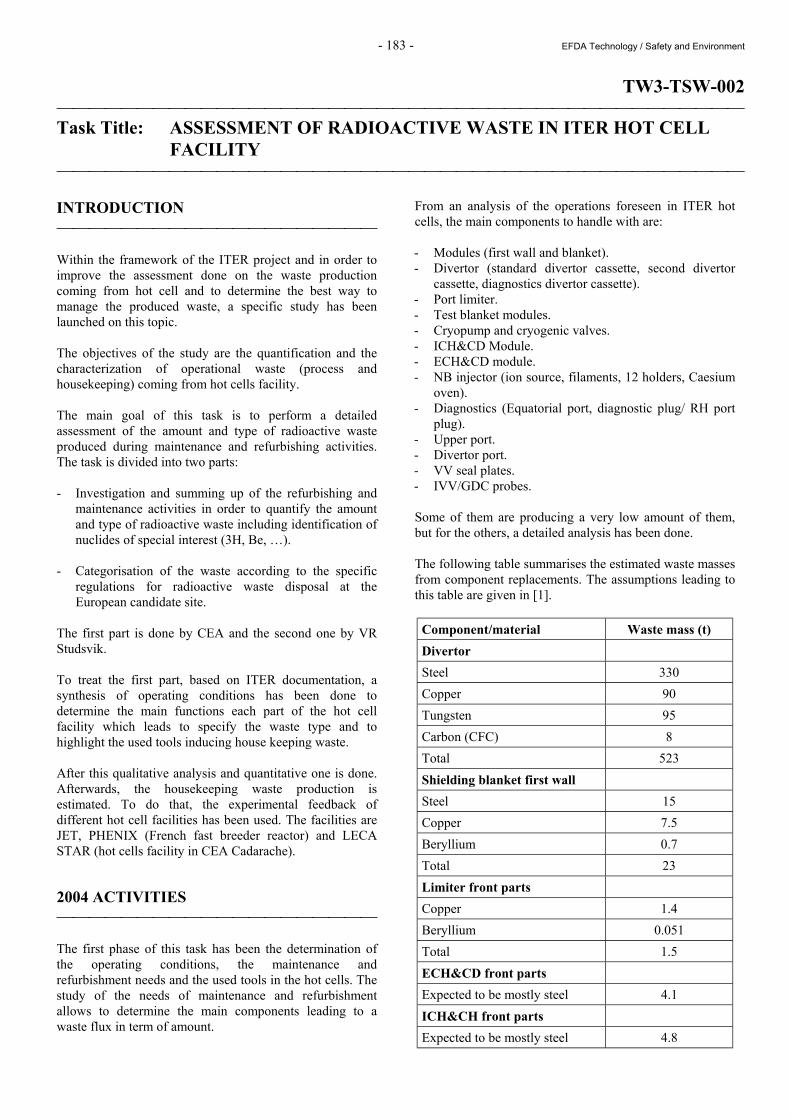
- 183 - EFDA Technology / Safety and Environment
TW3-TSW-002 Task Title: ASSESSMENT OF RADIOACTIVE WASTE IN ITER HOT CELL
FACILITY INTRODUCTION Within the framework of the ITER project and in order to improve the assessment done on the waste production coming from hot cell and to determine the best way to manage the produced waste, a specific study has been launched on this topic. The objectives of the study are the quantification and the characterization of operational waste (process and housekeeping) coming from hot cells facility. The main goal of this task is to perform a detailed assessment of the amount and type of radioactive waste produced during maintenance and refurbishing activities. The task is divided into two parts: - Investigation and summing up of the refurbishing and
maintenance activities in order to quantify the amount and type of radioactive waste including identification of nuclides of special interest (3H, Be, …).
- Categorisation of the waste according to the specific
regulations for radioactive waste disposal at the European candidate site.
The first part is done by CEA and the second one by VR Studsvik. To treat the first part, based on ITER documentation, a synthesis of operating conditions has been done to determine the main functions each part of the hot cell facility which leads to specify the waste type and to highlight the used tools inducing house keeping waste. After this qualitative analysis and quantitative one is done. Afterwards, the housekeeping waste production is estimated. To do that, the experimental feedback of different hot cell facilities has been used. The facilities are JET, PHENIX (French fast breeder reactor) and LECA STAR (hot cells facility in CEA Cadarache). 2004 ACTIVITIES The first phase of this task has been the determination of the operating conditions, the maintenance and refurbishment needs and the used tools in the hot cells. The study of the needs of maintenance and refurbishment allows to determine the main components leading to a waste flux in term of amount.
From an analysis of the operations foreseen in ITER hot cells, the main components to handle with are: - Modules (first wall and blanket). - Divertor (standard divertor cassette, second divertor
cassette, diagnostics divertor cassette). - Port limiter. - Test blanket modules. - Cryopump and cryogenic valves. - ICH&CD Module. - ECH&CD module. - NB injector (ion source, filaments, 12 holders, Caesium
oven). - Diagnostics (Equatorial port, diagnostic plug/ RH port
plug). - Upper port. - Divertor port. - VV seal plates. - IVV/GDC probes. Some of them are producing a very low amount of them, but for the others, a detailed analysis has been done. The following table summarises the estimated waste masses from component replacements. The assumptions leading to this table are given in [1].
Component/material Waste mass (t) Divertor Steel 330 Copper 90 Tungsten 95 Carbon (CFC) 8 Total 523 Shielding blanket first wall Steel 15 Copper 7.5 Beryllium 0.7 Total 23 Limiter front parts Copper 1.4 Beryllium 0.051 Total 1.5 ECH&CD front parts Expected to be mostly steel 4.1 ICH&CH front parts Expected to be mostly steel 4.8
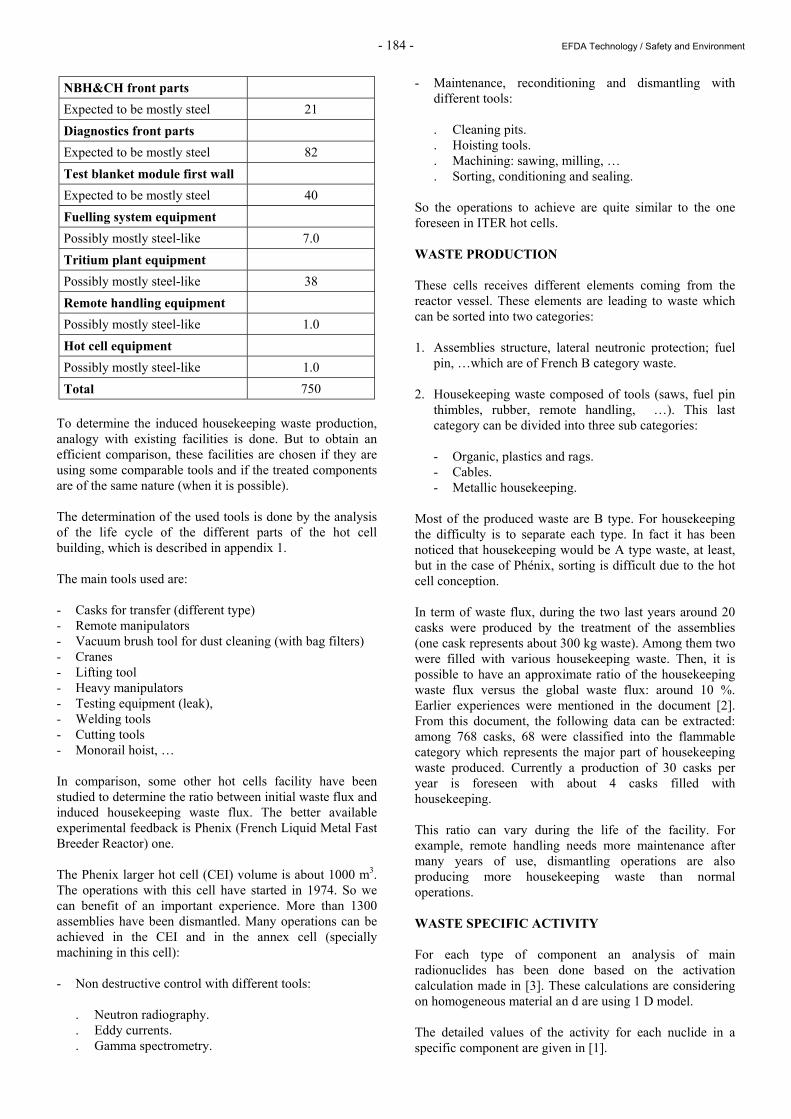
- 184 - EFDA Technology / Safety and Environment
NBH&CH front parts Expected to be mostly steel 21 Diagnostics front parts Expected to be mostly steel 82 Test blanket module first wall Expected to be mostly steel 40 Fuelling system equipment Possibly mostly steel-like 7.0 Tritium plant equipment Possibly mostly steel-like 38 Remote handling equipment Possibly mostly steel-like 1.0 Hot cell equipment Possibly mostly steel-like 1.0 Total 750
To determine the induced housekeeping waste production, analogy with existing facilities is done. But to obtain an efficient comparison, these facilities are chosen if they are using some comparable tools and if the treated components are of the same nature (when it is possible). The determination of the used tools is done by the analysis of the life cycle of the different parts of the hot cell building, which is described in appendix 1. The main tools used are: - Casks for transfer (different type) - Remote manipulators - Vacuum brush tool for dust cleaning (with bag filters) - Cranes - Lifting tool - Heavy manipulators - Testing equipment (leak), - Welding tools - Cutting tools - Monorail hoist, … In comparison, some other hot cells facility have been studied to determine the ratio between initial waste flux and induced housekeeping waste flux. The better available experimental feedback is Phenix (French Liquid Metal Fast Breeder Reactor) one. The Phenix larger hot cell (CEI) volume is about 1000 m3. The operations with this cell have started in 1974. So we can benefit of an important experience. More than 1300 assemblies have been dismantled. Many operations can be achieved in the CEI and in the annex cell (specially machining in this cell): - Non destructive control with different tools:
. Neutron radiography. . Eddy currents. . Gamma spectrometry.
- Maintenance, reconditioning and dismantling with different tools:
. Cleaning pits. . Hoisting tools. . Machining: sawing, milling, … . Sorting, conditioning and sealing.
So the operations to achieve are quite similar to the one foreseen in ITER hot cells. WASTE PRODUCTION These cells receives different elements coming from the reactor vessel. These elements are leading to waste which can be sorted into two categories: 1. Assemblies structure, lateral neutronic protection; fuel
pin, …which are of French B category waste. 2. Housekeeping waste composed of tools (saws, fuel pin
thimbles, rubber, remote handling, …). This last category can be divided into three sub categories:
- Organic, plastics and rags. - Cables. - Metallic housekeeping.
Most of the produced waste are B type. For housekeeping the difficulty is to separate each type. In fact it has been noticed that housekeeping would be A type waste, at least, but in the case of Phénix, sorting is difficult due to the hot cell conception. In term of waste flux, during the two last years around 20 casks were produced by the treatment of the assemblies (one cask represents about 300 kg waste). Among them two were filled with various housekeeping waste. Then, it is possible to have an approximate ratio of the housekeeping waste flux versus the global waste flux: around 10 %. Earlier experiences were mentioned in the document [2]. From this document, the following data can be extracted: among 768 casks, 68 were classified into the flammable category which represents the major part of housekeeping waste produced. Currently a production of 30 casks per year is foreseen with about 4 casks filled with housekeeping. This ratio can vary during the life of the facility. For example, remote handling needs more maintenance after many years of use, dismantling operations are also producing more housekeeping waste than normal operations. WASTE SPECIFIC ACTIVITY For each type of component an analysis of main radionuclides has been done based on the activation calculation made in [3]. These calculations are considering on homogeneous material an d are using 1 D model. The detailed values of the activity for each nuclide in a specific component are given in [1].
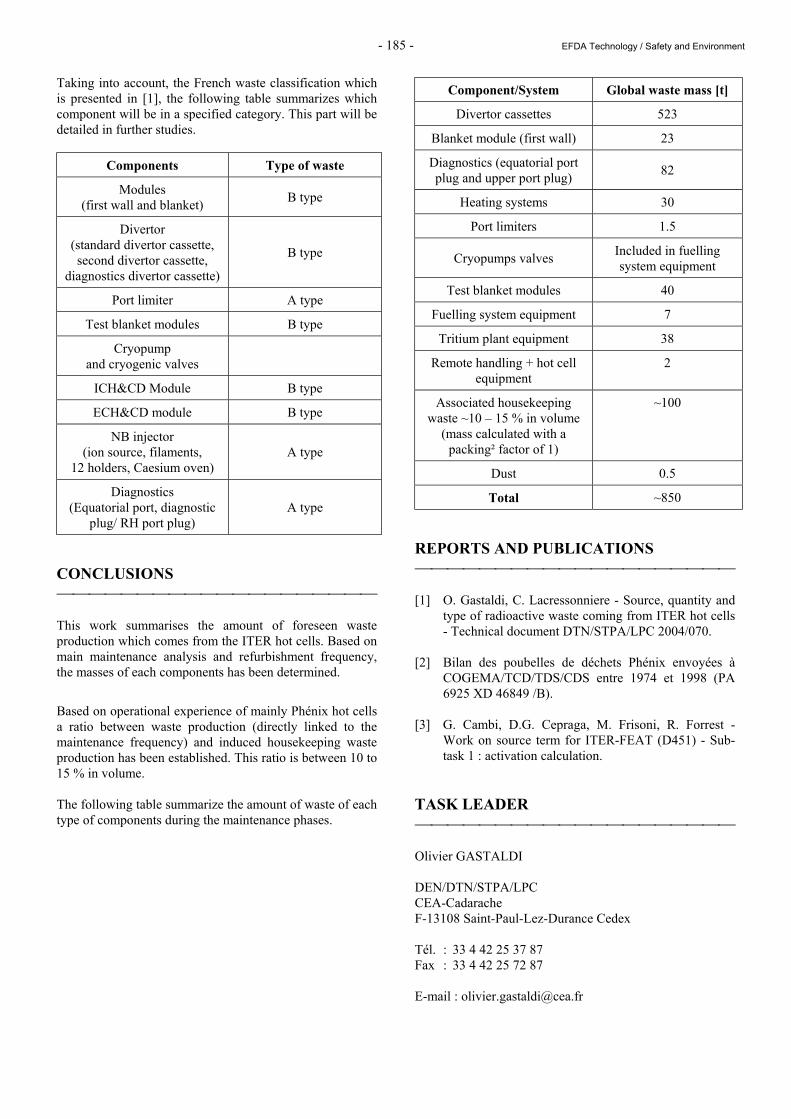
- 185 - EFDA Technology / Safety and Environment
Taking into account, the French waste classification which is presented in [1], the following table summarizes which component will be in a specified category. This part will be detailed in further studies.
Components Type of waste
Modules (first wall and blanket) B type
Divertor (standard divertor cassette, second divertor cassette,
diagnostics divertor cassette)
B type
Port limiter A type
Test blanket modules B type
Cryopump and cryogenic valves
ICH&CD Module B type
ECH&CD module B type
NB injector (ion source, filaments,
12 holders, Caesium oven) A type
Diagnostics (Equatorial port, diagnostic
plug/ RH port plug) A type
CONCLUSIONS This work summarises the amount of foreseen waste production which comes from the ITER hot cells. Based on main maintenance analysis and refurbishment frequency, the masses of each components has been determined.
Based on operational experience of mainly Phénix hot cells a ratio between waste production (directly linked to the maintenance frequency) and induced housekeeping waste production has been established. This ratio is between 10 to 15 % in volume. The following table summarize the amount of waste of each type of components during the maintenance phases.
Component/System Global waste mass [t]
Divertor cassettes 523
Blanket module (first wall) 23
Diagnostics (equatorial port plug and upper port plug) 82
Heating systems 30
Port limiters 1.5
Cryopumps valves Included in fuelling system equipment
Test blanket modules 40
Fuelling system equipment 7
Tritium plant equipment 38
Remote handling + hot cell equipment
2
Associated housekeeping waste ~10 – 15 % in volume
(mass calculated with a packing² factor of 1)
~100
Dust 0.5
Total ~850 REPORTS AND PUBLICATIONS [1] O. Gastaldi, C. Lacressonniere - Source, quantity and
type of radioactive waste coming from ITER hot cells - Technical document DTN/STPA/LPC 2004/070.
[2] Bilan des poubelles de déchets Phénix envoyées à
COGEMA/TCD/TDS/CDS entre 1974 et 1998 (PA 6925 XD 46849 /B).
[3] G. Cambi, D.G. Cepraga, M. Frisoni, R. Forrest -
Work on source term for ITER-FEAT (D451) - Sub-task 1 : activation calculation.
TASK LEADER Olivier GASTALDI DEN/DTN/STPA/LPC CEA-Cadarache F-13108 Saint-Paul-Lez-Durance Cedex Tél. : 33 4 42 25 37 87 Fax : 33 4 42 25 72 87 E-mail : [email protected]

- 186 - EFDA Technology / Safety and Environment
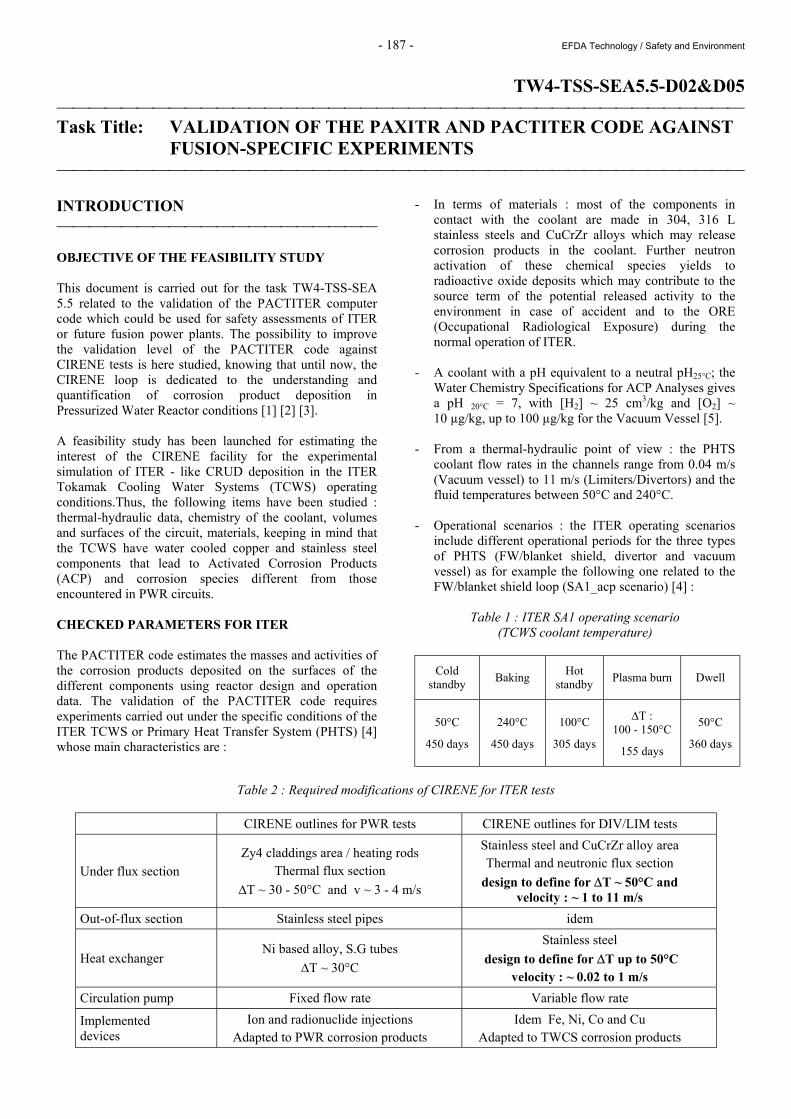
- 187 - EFDA Technology / Safety and Environment
TW4-TSS-SEA5.5-D02&D05 Task Title: VALIDATION OF THE PAXITR AND PACTITER CODE AGAINST
FUSION-SPECIFIC EXPERIMENTS INTRODUCTION OBJECTIVE OF THE FEASIBILITY STUDY This document is carried out for the task TW4-TSS-SEA 5.5 related to the validation of the PACTITER computer code which could be used for safety assessments of ITER or future fusion power plants. The possibility to improve the validation level of the PACTITER code against CIRENE tests is here studied, knowing that until now, the CIRENE loop is dedicated to the understanding and quantification of corrosion product deposition in Pressurized Water Reactor conditions [1] [2] [3]. A feasibility study has been launched for estimating the interest of the CIRENE facility for the experimental simulation of ITER - like CRUD deposition in the ITER Tokamak Cooling Water Systems (TCWS) operating conditions.Thus, the following items have been studied : thermal-hydraulic data, chemistry of the coolant, volumes and surfaces of the circuit, materials, keeping in mind that the TCWS have water cooled copper and stainless steel components that lead to Activated Corrosion Products (ACP) and corrosion species different from those encountered in PWR circuits. CHECKED PARAMETERS FOR ITER The PACTITER code estimates the masses and activities of the corrosion products deposited on the surfaces of the different components using reactor design and operation data. The validation of the PACTITER code requires experiments carried out under the specific conditions of the ITER TCWS or Primary Heat Transfer System (PHTS) [4] whose main characteristics are :
- In terms of materials : most of the components in contact with the coolant are made in 304, 316 L stainless steels and CuCrZr alloys which may release corrosion products in the coolant. Further neutron activation of these chemical species yields to radioactive oxide deposits which may contribute to the source term of the potential released activity to the environment in case of accident and to the ORE (Occupational Radiological Exposure) during the normal operation of ITER.
- A coolant with a pH equivalent to a neutral pH25°C; the
Water Chemistry Specifications for ACP Analyses gives a pH 20°C = 7, with [H2] ~ 25 cm3/kg and [O2] ~ 10 µg/kg, up to 100 µg/kg for the Vacuum Vessel [5].
- From a thermal-hydraulic point of view : the PHTS
coolant flow rates in the channels range from 0.04 m/s (Vacuum vessel) to 11 m/s (Limiters/Divertors) and the fluid temperatures between 50°C and 240°C.
- Operational scenarios : the ITER operating scenarios
include different operational periods for the three types of PHTS (FW/blanket shield, divertor and vacuum vessel) as for example the following one related to the FW/blanket shield loop (SA1_acp scenario) [4] :
Table 1 : ITER SA1 operating scenario
(TCWS coolant temperature)
Cold standby Baking Hot
standby Plasma burn Dwell
50°C
450 days
240°C
450 days
100°C
305 days
∆T : 100 - 150°C
155 days
50°C
360 days
Table 2 : Required modifications of CIRENE for ITER tests
CIRENE outlines for PWR tests CIRENE outlines for DIV/LIM tests
Under flux section Zy4 claddings area / heating rods
Thermal flux section ∆T ~ 30 - 50°C and v ~ 3 - 4 m/s
Stainless steel and CuCrZr alloy area Thermal and neutronic flux section
design to define for ∆T ~ 50°C and velocity : ~ 1 to 11 m/s
Out-of-flux section Stainless steel pipes idem
Heat exchanger Ni based alloy, S.G tubes
∆T ~ 30°C
Stainless steel design to define for ∆T up to 50°C
velocity : ~ 0.02 to 1 m/s Circulation pump Fixed flow rate Variable flow rate
Implemented devices
Ion and radionuclide injections Adapted to PWR corrosion products
Idem Fe, Ni, Co and Cu Adapted to TWCS corrosion products
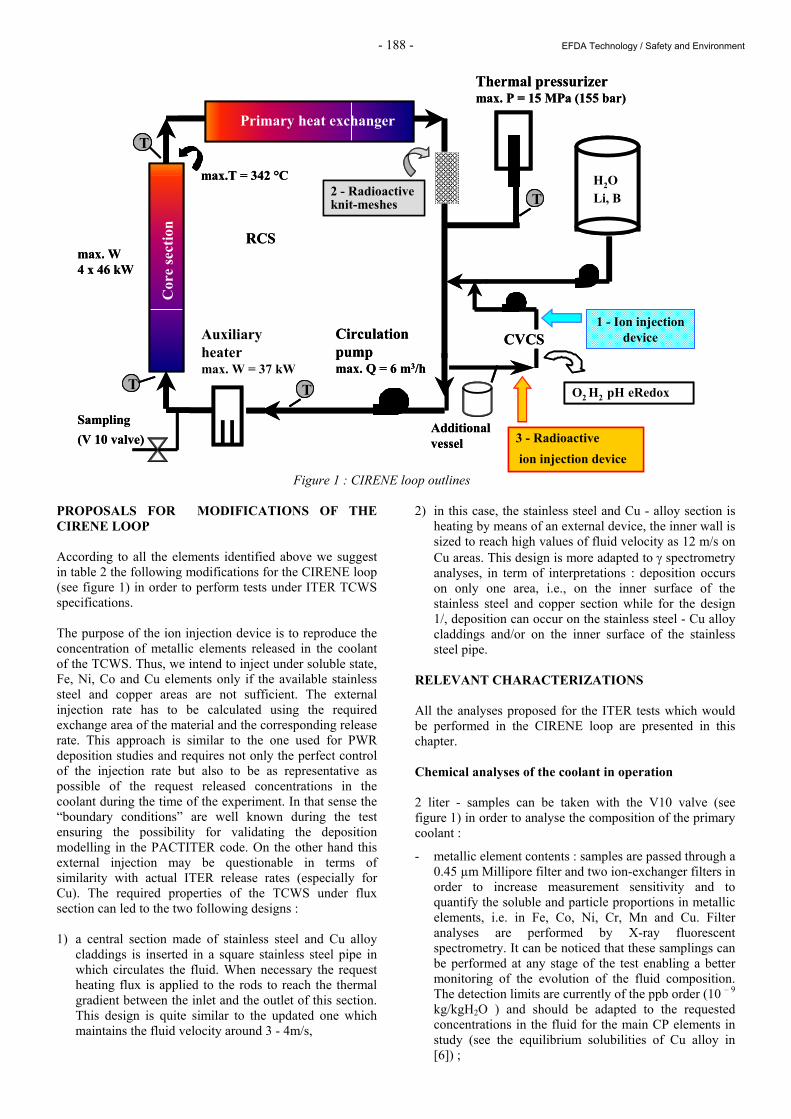
- 188 - EFDA Technology / Safety and Environment
Figure 1 : CIRENE loop outlines PROPOSALS FOR MODIFICATIONS OF THE CIRENE LOOP According to all the elements identified above we suggest in table 2 the following modifications for the CIRENE loop (see figure 1) in order to perform tests under ITER TCWS specifications. The purpose of the ion injection device is to reproduce the concentration of metallic elements released in the coolant of the TCWS. Thus, we intend to inject under soluble state, Fe, Ni, Co and Cu elements only if the available stainless steel and copper areas are not sufficient. The external injection rate has to be calculated using the required exchange area of the material and the corresponding release rate. This approach is similar to the one used for PWR deposition studies and requires not only the perfect control of the injection rate but also to be as representative as possible of the request released concentrations in the coolant during the time of the experiment. In that sense the “boundary conditions” are well known during the test ensuring the possibility for validating the deposition modelling in the PACTITER code. On the other hand this external injection may be questionable in terms of similarity with actual ITER release rates (especially for Cu). The required properties of the TCWS under flux section can led to the two following designs : 1) a central section made of stainless steel and Cu alloy
claddings is inserted in a square stainless steel pipe in which circulates the fluid. When necessary the request heating flux is applied to the rods to reach the thermal gradient between the inlet and the outlet of this section. This design is quite similar to the updated one which maintains the fluid velocity around 3 - 4m/s,
2) in this case, the stainless steel and Cu - alloy section is heating by means of an external device, the inner wall is sized to reach high values of fluid velocity as 12 m/s on Cu areas. This design is more adapted to γ spectrometry analyses, in term of interpretations : deposition occurs on only one area, i.e., on the inner surface of the stainless steel and copper section while for the design 1/, deposition can occur on the stainless steel - Cu alloy claddings and/or on the inner surface of the stainless steel pipe.
RELEVANT CHARACTERIZATIONS All the analyses proposed for the ITER tests which would be performed in the CIRENE loop are presented in this chapter. Chemical analyses of the coolant in operation 2 liter - samples can be taken with the V10 valve (see figure 1) in order to analyse the composition of the primary coolant :
- metallic element contents : samples are passed through a 0.45 µm Millipore filter and two ion-exchanger filters in order to increase measurement sensitivity and to quantify the soluble and particle proportions in metallic elements, i.e. in Fe, Co, Ni, Cr, Mn and Cu. Filter analyses are performed by X-ray fluorescent spectrometry. It can be noticed that these samplings can be performed at any stage of the test enabling a better monitoring of the evolution of the fluid composition. The detection limits are currently of the ppb order (10 – 9 kg/kgH2O ) and should be adapted to the requested concentrations in the fluid for the main CP elements in study (see the equilibrium solubilities of Cu alloy in [6]) ;
Thermal pressurizermax. P = 15 MPa (155 bar)
Circulationpump max. Q = 6 m3/h
CVCSAuxiliary heater max. W = 37 kW
H2O Li, B
1 - Ion injectiondevice
RCS
Primary heat exchanger
Cor
ese
ctio
nmax.T = 342 °C
max. W 4 x 46 kW
O2 H2 pH eRedoxT
T
T
T
2 - Radioactive
knit-meshes
3 - Radioactiveion injection device
Additional vessel
Sampling(V 10 valve)
Thermal pressurizermax. P = 15 MPa (155 bar)
Circulationpump max. Q = 6 m3/h
CVCSAuxiliary heater max. W = 37 kW
H2O Li, B
1 - Ion injectiondevice
RCS
Primary heat exchanger
Cor
ese
ctio
nmax.T = 342 °C
max. W 4 x 46 kW
O2 H2 pH eRedoxTTT
TT
TT
TTT
2 - Radioactive
knit-meshes
3 - Radioactiveion injection device
Additional vessel
Sampling(V 10 valve)
- 189 - EFDA Technology / Safety and Environment
- impurities : impurities analyses involved coupling-plasma emission spectrometry, atomic absorption spectrometry and ion chromatography. This type of analyses is only performed at the beginning and at the end of the test, the relevant impurities being Al, Ca, Cl, F, SO4, Na and Mg.
Nuclear measurements in operation The possible ITER radionuclides are 58Co, 59Fe, 64Cu, 60Co and 54Mn : - The use of 60Co and 54Mn radionuclides which have a
long radioactive half-time (respectively 5.3 years and 312 days), will lead to a global contamination of the RCS main pipes, that represents a major inconvenience with regard to the next tests undertaken in the loop.
- The possibly interesting gamma isotopes of Cu (62Cu,
64Cu and 66Cu) have very short radioactive half-time periods [7] that prevent them to be prepared in advance and injected through the ion injection device. Then further investigations are required to evaluate if in-situ measurements of copper through local neutron bombardment and γ spectrometry analysis [8] could be performed to measure the deposition of this corrosion product. Among the different nuclear reactions, the (n, γ) reactions on 63Cu (which gives 64Cu) or on 65Cu (which gives 66Cu) are the lone whose activation cross sections (expressed in barns) may be sufficient. Nevertheless the gamma emission percentages range from very low (0.6% for 64Cu) to low (7.6% for 66Cu) that requiring a more complete study for this potentiality. Another way to perform such characterization could be to identify a transfer correlation between a well-known gamma emitter and Cu : for instance theoretical considerations could allow one to identify a co-released or co-deposited element. However experimental validation of such correlation should be required. For that purpose the CORELE loop could be used by inserting an irradiated copper based alloy in its test section and measuring both the released Cu content by chemical means and the released gamma emitter activities. Further study should be undertaken to better estimate that potentiality and particularly the relevance of the correspondence between co-release and co-deposit.
Thus, considering their radioactive half-times and the relevant in-line gamma spectrometry application, three radionuclides - 58Co, 59Fe and 51Cr - can be selected for ACP study with the current measurement methodology of the CIRENE loop : radionuclide injection device, and in-line γ spectrometry measurements [9]. The measured areas could be the under flux section with stainless steel and Cu materials and an out-of-flux section with stainless steel material. The materials and design of these sections must be completely adapted to γ spectrometry investigations. Radiochemical measurements after shutdown Radioactivity of the deposits on the RCS can be measured through gamma-ray spectrometry at the end of the ITER test, at ambient temperature.
The relevant studied areas could be the same that those in operation. Scrapings after the shutdown The relative composition of the remained deposits, i.e. the composition in metallic elements as Fe, Co, Ni, Cr, Mn, Cu and in Ca mineral impurity can be obtained by means of X-ray fluorescent spectrometry analyses of CRUD scrapings. The weighing of the samples can give an indication of the residual CRUD density. Besides, CRUD scrapings could also be subjected to radiochemical measurements. Additional analyses can be proposed if the remained CRUD densities turn out to be sufficient (oxide analysis, crystallography…). Remark : the CRUD scraping areas must be determined on sections which do not need any disassembly. CONCLUDING REMARKS Validation of the tcws corrosion product deposition modelling of pactiter At present time the CORELE loop is devoted to release rate measurements but presents some particular features. The most interesting concerns the fact that all the components of this loop, excepted the test section, are made of inert materials (polypropylene in the cold parts, zircalloy in the hot ones) that ensuring no release of these components in the circuits of the loop. Thus as far as the “radioactive” injection device of the CIRENE loop could be easily adapted to CORELE, the boundary conditions (in terms of concentrations, flow rates, temperature, pressure…) would be perfectly controlled (and known). This could be of great interest for the validation of the deposition modelling of PACTITER. Obviously the possibility of measuring deposition of ACP in CORELE requires some adaptations of the loop which are to be quantified as for instance the bypass of the resin beds or the in-line nuclear measurements mentioned above. Global Validation of the Pactiter code As previously mentioned, the external injection of ACP can be justified for the validation of the particular deposition modelling of the PACTITER code but is not relevant when dealing with a global validation of the code. Effectively the actual release rates in ITER conditions should vary during operations essentially due to the fact that the corrosion rates vary with time in more or less high proportions. Thus a global validation which aims to be representative of the whole ITER scenarios requires the measurement of all the mechanisms of ACP migration from the formation/release to the deposition. This can exclusively be performed in a dedicated loop in which all these phenomena can be reproduced in closest as possible ITER TCWS conditions. This feasibility study brings some answers regarding the possibility of using the CIRENE loop for that purpose, but the design of a new facility should be considered in order for example to take into account the electromagnetic field which could possibly influence the ACP migration.
- 190 - EFDA Technology / Safety and Environment
REFERENCES [1] M. Girard - Report of the 2000/02-03 CIRENE test -
Note technique DEC/S3C/01 - 012. [2] Th. Duverneix, M. Girard, M. Sabatier - Définition et
simulation d'essais de qualification du code PACTOLE dans la boucle CIRENE - Note technique DEC/S3C/02 – 125.
[3] M. Sabatier, F. Nguyen, H. Marteau - Simulation par
le code PACTOLE V3.0 des Essais 2000/03 et 2001/02 de la boucle CIRENE - Note Technique DEC/S3C/03 - 084.
[4] L. Di Pace - ACP evaluation for the ITER TCWS
DIV/LIM loop using PACTITER V2.1 - Final report - FUS-TN-SA-SE-R079 - October 2003.
[5] H.W. Bartels - Specifications for Activated Corrosion
Product Assessment for ITER-FEAT (Version 1.0) - Safety, Environmental and Health Group ITER - Garching JWS, November 24th, 1999.
[6] L. Di Pace, D. Tarabelli, You D. - Development of the
PACTITER code and its application to the assessment of the ITER Divertor cooling loop corrosion products - Fusion Technology Vol.34, No.3 part 2, pp733 - 737, 1998.
[7] A.I. Aliev, U.I. Drynkin, D.I. Leipunskaya, V.A.
Kasatkin - Handbook of nuclear data for neutron activation analysis, 1970.
[8] M. Girard - Mesure du bore par interrogation
neutronique active (INA) - Adaptation d’un montage sur la boucle CIRENE - Dossier de faisabilité - Note Technique DEC/S3C/02 – 055.
[9] M. Girard, F. Dacquait, R. Chatelet - Injection d'ions
actifs dans le circuit primaire de la boucle CIRENE - Dossier de faisabilité - Note Technique DEC/S3C/03-104.
TASK LEADER Marianne GIRARD DEN/DTN/STRI CEA-Cadarache F-13108 Saint-Paul-Lez-Durance Cedex Tél. : 33 4 42 25 45 54 Fax : 33 4 42 25 47 77 E-mail : [email protected]
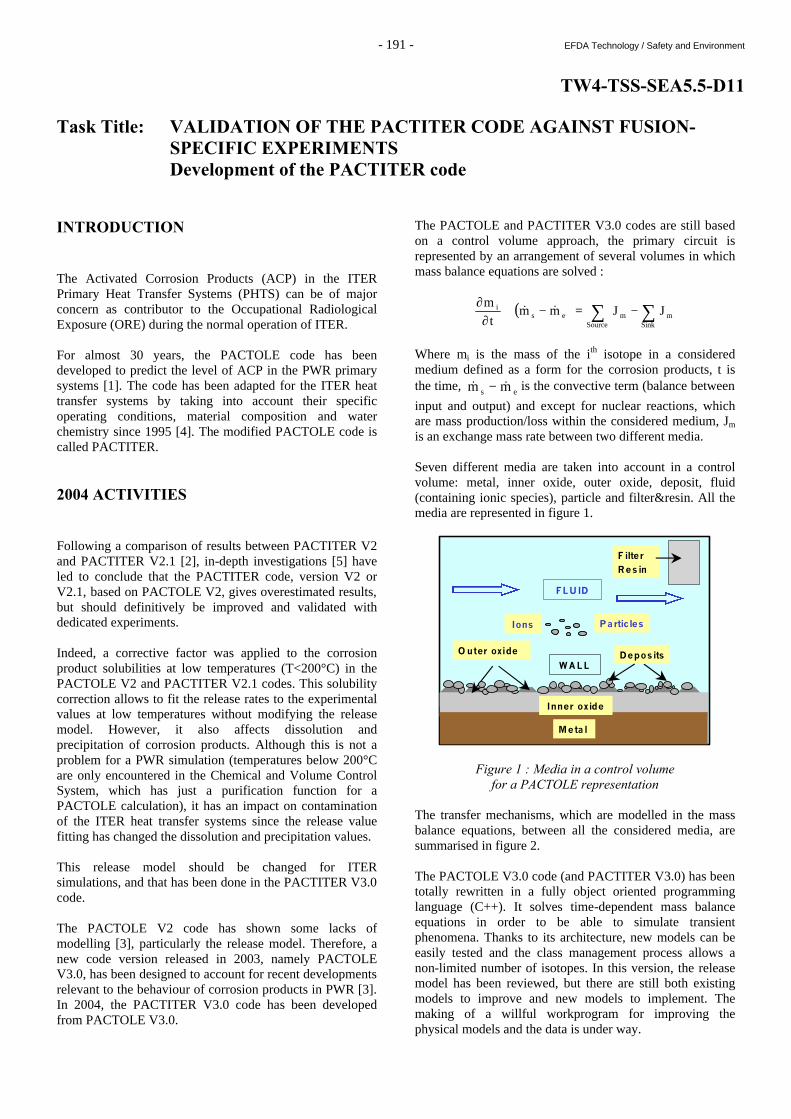
- 191 - EFDA Technology / Safety and Environment
TW4-TSS-SEA5.5-D11 Task Title: VALIDATION OF THE PACTITER CODE AGAINST FUSION-
SPECIFIC EXPERIMENTS Development of the PACTITER code INTRODUCTION The Activated Corrosion Products (ACP) in the ITER Primary Heat Transfer Systems (PHTS) can be of major concern as contributor to the Occupational Radiological Exposure (ORE) during the normal operation of ITER. For almost 30 years, the PACTOLE code has been developed to predict the level of ACP in the PWR primary systems [1]. The code has been adapted for the ITER heat transfer systems by taking into account their specific operating conditions, material composition and water chemistry since 1995 [4]. The modified PACTOLE code is called PACTITER. 2004 ACTIVITIES Following a comparison of results between PACTITER V2 and PACTITER V2.1 [2], in-depth investigations [5] have led to conclude that the PACTITER code, version V2 or V2.1, based on PACTOLE V2, gives overestimated results, but should definitively be improved and validated with dedicated experiments. Indeed, a corrective factor was applied to the corrosion product solubilities at low temperatures (T<200°C) in the PACTOLE V2 and PACTITER V2.1 codes. This solubility correction allows to fit the release rates to the experimental values at low temperatures without modifying the release model. However, it also affects dissolution and precipitation of corrosion products. Although this is not a problem for a PWR simulation (temperatures below 200°C are only encountered in the Chemical and Volume Control System, which has just a purification function for a PACTOLE calculation), it has an impact on contamination of the ITER heat transfer systems since the release value fitting has changed the dissolution and precipitation values. This release model should be changed for ITER simulations, and that has been done in the PACTITER V3.0 code. The PACTOLE V2 code has shown some lacks of modelling [3], particularly the release model. Therefore, a new code version released in 2003, namely PACTOLE V3.0, has been designed to account for recent developments relevant to the behaviour of corrosion products in PWR [3]. In 2004, the PACTITER V3.0 code has been developed from PACTOLE V3.0.
The PACTOLE and PACTITER V3.0 codes are still based on a control volume approach, the primary circuit is represented by an arrangement of several volumes in which mass balance equations are solved :
( ) ∑ ∑−=−+∂
∂
Source Sinkmmes
i JJmmt
m&&
Where mi is the mass of the ith isotope in a considered medium defined as a form for the corrosion products, t is the time, es mm && − is the convective term (balance between
input and output) and except for nuclear reactions, which are mass production/loss within the considered medium, Jm is an exchange mass rate between two different media. Seven different media are taken into account in a control volume: metal, inner oxide, outer oxide, deposit, fluid (containing ionic species), particle and filter&resin. All the media are represented in figure 1.
Particles
FLUID
Ions
O uter oxide Deposits
Inner oxide
W A L L
Metal
F ilter Res in
Figure 1 : Media in a control volume for a PACTOLE representation
The transfer mechanisms, which are modelled in the mass balance equations, between all the considered media, are summarised in figure 2. The PACTOLE V3.0 code (and PACTITER V3.0) has been totally rewritten in a fully object oriented programming language (C++). It solves time-dependent mass balance equations in order to be able to simulate transient phenomena. Thanks to its architecture, new models can be easily tested and the class management process allows a non-limited number of isotopes. In this version, the release model has been reviewed, but there are still both existing models to improve and new models to implement. The making of a willful workprogram for improving the physical models and the data is under way.
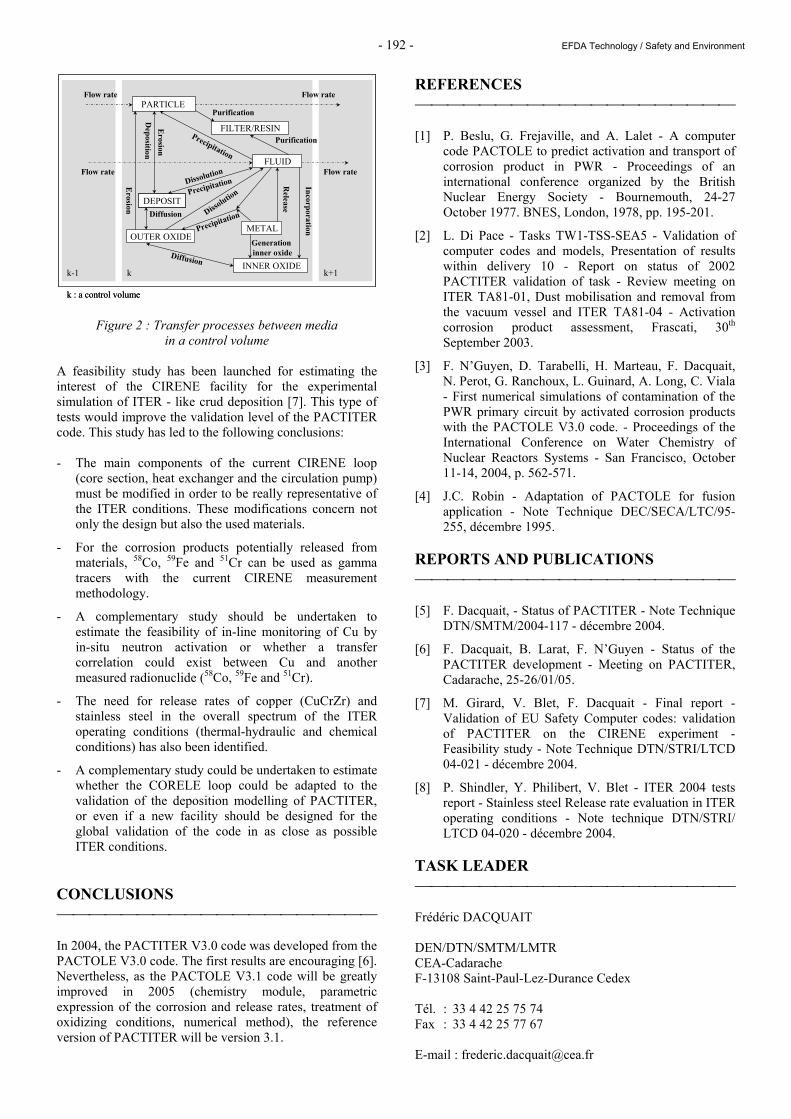
- 192 - EFDA Technology / Safety and Environment
kk-1 k+1
METAL
INNER OXIDE
OUTER OXIDE
DEPOSIT
PARTICLEFlow rate Flow rate
FLUIDFlow rate Flow rate
Purification
PurificationPrecipitation
DepositionE
rosion
PrecipitationDissolution
Release
Generation inner oxide
Precipitation
Incorporation
Diffusion
Dissolution
Erosion
Diffusion
FILTER/RESIN
k : a control volume
kk-1 k+1
METAL
INNER OXIDE
OUTER OXIDE
DEPOSITDEPOSIT
PARTICLEFlow rate Flow rate
FLUIDFlow rate Flow rate
Purification
PurificationPrecipitation
DepositionE
rosion
PrecipitationDissolution
Release
Generation inner oxide
Precipitation
Incorporation
Diffusion
Dissolution
Erosion
Diffusion
FILTER/RESIN
k : a control volume
Figure 2 : Transfer processes between media in a control volume
A feasibility study has been launched for estimating the interest of the CIRENE facility for the experimental simulation of ITER - like crud deposition [7]. This type of tests would improve the validation level of the PACTITER code. This study has led to the following conclusions: - The main components of the current CIRENE loop
(core section, heat exchanger and the circulation pump) must be modified in order to be really representative of the ITER conditions. These modifications concern not only the design but also the used materials.
- For the corrosion products potentially released from materials, 58Co, 59Fe and 51Cr can be used as gamma tracers with the current CIRENE measurement methodology.
- A complementary study should be undertaken to estimate the feasibility of in-line monitoring of Cu by in-situ neutron activation or whether a transfer correlation could exist between Cu and another measured radionuclide (58Co, 59Fe and 51Cr).
- The need for release rates of copper (CuCrZr) and stainless steel in the overall spectrum of the ITER operating conditions (thermal-hydraulic and chemical conditions) has also been identified.
- A complementary study could be undertaken to estimate whether the CORELE loop could be adapted to the validation of the deposition modelling of PACTITER, or even if a new facility should be designed for the global validation of the code in as close as possible ITER conditions.
CONCLUSIONS In 2004, the PACTITER V3.0 code was developed from the PACTOLE V3.0 code. The first results are encouraging [6]. Nevertheless, as the PACTOLE V3.1 code will be greatly improved in 2005 (chemistry module, parametric expression of the corrosion and release rates, treatment of oxidizing conditions, numerical method), the reference version of PACTITER will be version 3.1.
REFERENCES [1] P. Beslu, G. Frejaville, and A. Lalet - A computer
code PACTOLE to predict activation and transport of corrosion product in PWR - Proceedings of an international conference organized by the British Nuclear Energy Society - Bournemouth, 24-27 October 1977. BNES, London, 1978, pp. 195-201.
[2] L. Di Pace - Tasks TW1-TSS-SEA5 - Validation of computer codes and models, Presentation of results within delivery 10 - Report on status of 2002 PACTITER validation of task - Review meeting on ITER TA81-01, Dust mobilisation and removal from the vacuum vessel and ITER TA81-04 - Activation corrosion product assessment, Frascati, 30th September 2003.
[3] F. N’Guyen, D. Tarabelli, H. Marteau, F. Dacquait, N. Perot, G. Ranchoux, L. Guinard, A. Long, C. Viala - First numerical simulations of contamination of the PWR primary circuit by activated corrosion products with the PACTOLE V3.0 code. - Proceedings of the International Conference on Water Chemistry of Nuclear Reactors Systems - San Francisco, October 11-14, 2004, p. 562-571.
[4] J.C. Robin - Adaptation of PACTOLE for fusion application - Note Technique DEC/SECA/LTC/95-255, décembre 1995.
REPORTS AND PUBLICATIONS [5] F. Dacquait, - Status of PACTITER - Note Technique
DTN/SMTM/2004-117 - décembre 2004.
[6] F. Dacquait, B. Larat, F. N’Guyen - Status of the PACTITER development - Meeting on PACTITER, Cadarache, 25-26/01/05.
[7] M. Girard, V. Blet, F. Dacquait - Final report - Validation of EU Safety Computer codes: validation of PACTITER on the CIRENE experiment - Feasibility study - Note Technique DTN/STRI/LTCD 04-021 - décembre 2004.
[8] P. Shindler, Y. Philibert, V. Blet - ITER 2004 tests report - Stainless steel Release rate evaluation in ITER operating conditions - Note technique DTN/STRI/ LTCD 04-020 - décembre 2004.
TASK LEADER Frédéric DACQUAIT DEN/DTN/SMTM/LMTR CEA-Cadarache F-13108 Saint-Paul-Lez-Durance Cedex Tél. : 33 4 42 25 75 74 Fax : 33 4 42 25 77 67 E-mail : [email protected]
- 193 - EFDA Technology / System Studies / Power Plant Conceptual Studies
TW2-TRP-PPCS15-D03 Task Title: WASTE MANAGEMENT STRATEGY ON MODE A AND B INTRODUCTION In order to reduce the quantity of wastes from PPCS (Power Plant Conceptual Study) reactors and optimize the final disposal, the waste management strategy is based on a selective segmenting as well as on the application of specific treatments aimed at reducing the volume and activity (fusion, incineration, detritiation, deconta-mination…). The main objective of the CEA contribution to this task is to suggest a waste management strategy for PPCS fusion reactor. This task is in continuation of the previous work performed in the framework of TW1-TRP-PPCS5-D03. 2004 ACTIVITIES Based on the different classifications obtained in 2002, a strategy of waste management is proposed for each component. The different classifications show that it is interesting to increase the duration of an interim storage of the waste. Then they can the waste category can change, namely because of the tritium decay. For each components an analysis has been done. TF COILS PPCS A –PPCS B This large component is made of steel of superconducting coil type (steel alloy, chromium, nickel). Its mass represents about 70 % of the total reactor mass. After 50 years, the waste from this component are classified for the outboard part, into Non-Active Waste (NAW) and for the inboard part, into Simple Recycled Material (SRM). After 100 years, the classification of waste from the inboard part is identical to that after 50 years (wastes classified as SRM). The very low activity of TF coils allows this component to be fully recycled after 50 years. It does not seem necessary to wait for a longer period of time for the inboard part, as there is no possible declassification. The clearance being lower than 1, the outboard part can thus be cleaned in the public domain. And the inboard part can be recycled using Remote Handling Recycling (RHR). This component is thus easy to manage.
VACUUM VESSEL PPCS A –PPCS B This large component is made of steel 316 S and boron. Its mass represents about 10% of the total reactor mass. After 50 years, the waste from this component can be classified for the outboard part into SRM and for the inboard part into Complex Recycled Material (CRM) wastes. They have thus to be dismantled by using remote handling. After 100 years, the component (inboard or outboard parts) is classified SRM and only the outboard part of PPCS A can benefit from simplified dismantling procedures. The activity of this component is due to nickel 63 (beta emitter), to decay heat, to dose rate and to cobalt 60. The cobalt content in steel 316 S is of 0.09 % (mass) i.e. 900 ppm. Cobalt 60 comes from the activation of cobalt. In order to reduce the dose rate of cobalt 60, the contents of the cobalt element in steel 316 S could be reduced. VV being only slightly active, it seems preferable to treat this component as soon as possible using RHR. SHIELD This component is made of eurofer (steel, chromium, manganese). The behaviours of PPCS A and PPCS B are different. For PPCS A After 50 years, the waste from this component are classified for the outboard part, into SRM wastes and for the inboard part into CRM wastes. After 100 years, the component (both parts) is classified SRM. The activity, the decay heat and the dose rate of this component are due to cobalt 60. The cobalt present in this Eurofer is in an impure state, its content is of 0.005 % i.e. 50 ppm. It therefore does not seem feasible to reduce this content further. The waste from the outboard part can be completely recycled, after 50 years using Remote Handling Recycling (RHR). A longer time (100 years) provides for an easier recycling (Hands On Recycling (HOR) type). For the inboard part, the activity being significant, no recycling is considered. A longer time would be necessary (100 years) to be able to recycle them in the same way. For PPCS B, the shield is divided into two parts : the Low Temperature (LT) shield and the High Temperature (HT) shield.
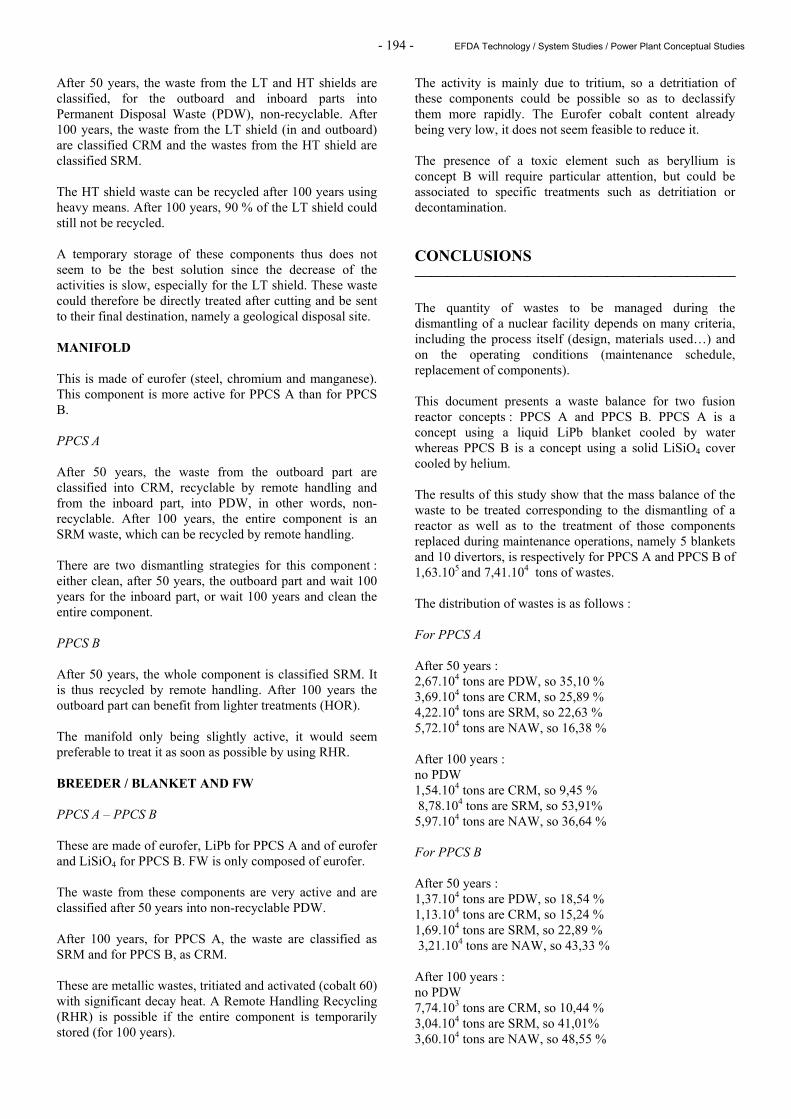
- 194 - EFDA Technology / System Studies / Power Plant Conceptual Studies
After 50 years, the waste from the LT and HT shields are classified, for the outboard and inboard parts into Permanent Disposal Waste (PDW), non-recyclable. After 100 years, the waste from the LT shield (in and outboard) are classified CRM and the wastes from the HT shield are classified SRM. The HT shield waste can be recycled after 100 years using heavy means. After 100 years, 90 % of the LT shield could still not be recycled. A temporary storage of these components thus does not seem to be the best solution since the decrease of the activities is slow, especially for the LT shield. These waste could therefore be directly treated after cutting and be sent to their final destination, namely a geological disposal site. MANIFOLD This is made of eurofer (steel, chromium and manganese). This component is more active for PPCS A than for PPCS B. PPCS A After 50 years, the waste from the outboard part are classified into CRM, recyclable by remote handling and from the inboard part, into PDW, in other words, non-recyclable. After 100 years, the entire component is an SRM waste, which can be recycled by remote handling. There are two dismantling strategies for this component : either clean, after 50 years, the outboard part and wait 100 years for the inboard part, or wait 100 years and clean the entire component. PPCS B After 50 years, the whole component is classified SRM. It is thus recycled by remote handling. After 100 years the outboard part can benefit from lighter treatments (HOR). The manifold only being slightly active, it would seem preferable to treat it as soon as possible by using RHR. BREEDER / BLANKET AND FW PPCS A – PPCS B These are made of eurofer, LiPb for PPCS A and of eurofer and LiSiO4 for PPCS B. FW is only composed of eurofer. The waste from these components are very active and are classified after 50 years into non-recyclable PDW. After 100 years, for PPCS A, the waste are classified as SRM and for PPCS B, as CRM. These are metallic wastes, tritiated and activated (cobalt 60) with significant decay heat. A Remote Handling Recycling (RHR) is possible if the entire component is temporarily stored (for 100 years).
The activity is mainly due to tritium, so a detritiation of these components could be possible so as to declassify them more rapidly. The Eurofer cobalt content already being very low, it does not seem feasible to reduce it. The presence of a toxic element such as beryllium is concept B will require particular attention, but could be associated to specific treatments such as detritiation or decontamination. CONCLUSIONS The quantity of wastes to be managed during the dismantling of a nuclear facility depends on many criteria, including the process itself (design, materials used…) and on the operating conditions (maintenance schedule, replacement of components). This document presents a waste balance for two fusion reactor concepts : PPCS A and PPCS B. PPCS A is a concept using a liquid LiPb blanket cooled by water whereas PPCS B is a concept using a solid LiSiO4 cover cooled by helium. The results of this study show that the mass balance of the waste to be treated corresponding to the dismantling of a reactor as well as to the treatment of those components replaced during maintenance operations, namely 5 blankets and 10 divertors, is respectively for PPCS A and PPCS B of 1,63.105 and 7,41.104 tons of wastes. The distribution of wastes is as follows : For PPCS A After 50 years : 2,67.104 tons are PDW, so 35,10 % 3,69.104 tons are CRM, so 25,89 % 4,22.104 tons are SRM, so 22,63 % 5,72.104 tons are NAW, so 16,38 % After 100 years : no PDW 1,54.104 tons are CRM, so 9,45 % 8,78.104 tons are SRM, so 53,91% 5,97.104 tons are NAW, so 36,64 % For PPCS B After 50 years : 1,37.104 tons are PDW, so 18,54 % 1,13.104 tons are CRM, so 15,24 % 1,69.104 tons are SRM, so 22,89 % 3,21.104 tons are NAW, so 43,33 % After 100 years : no PDW 7,74.103 tons are CRM, so 10,44 % 3,04.104 tons are SRM, so 41,01% 3,60.104 tons are NAW, so 48,55 %
- 195 - EFDA Technology / System Studies / Power Plant Conceptual Studies
Based on these results, if the management of PDW has to be eliminated, it will be necessary for some components to wait 100 years. The low activity of TF coils and of the Vacuum Vessel allows these two components to be recycled after 50 years and in their entirety (inboard and outboard parts). The validation of the clearance index will be required to be able to place in the domain (which domain?) the TF coil component. The wastes coming from the breeder, blanket and first wall are only recyclable after 100 years using Remote Handling. Lastly, the wastes from the outboard part of these shield components can be recycled after 50 years whereas for the inboard part these require waiting for 100 years. Only the LT shield component cannot be recycled even after 100 years. The main radionuclides involved in the activation of materials (breeder, blanket, first wall plus shield pour PPCS B) and penalizing for dismantling are tritium and cobalt 60. The use of eurofer, a material with very low cobalt content as a structural material in both concepts does not allow to consider a reduction of cobalt 60 in the wastes. Only a temporary storage and a detritiation process could allow for a faster and easier recycling of these wastes, when tritium is the most penalizing isotope. REFERENCES [1] C. Lacressonniere - Waste management in a future
fusion power plant TW1-TRP-PPCS5-D03 - Technical report CEA/DER/STR/LCEP NT 02/050.
REPORTS AND PUBLICATIONS [2] C. Lacressonniere - Waste management in fusion
power plant PPCS (task TW2-TRP-PPCS15-D3) - Technical report CEA/DTN/STPA/LPC NT 04/065.
TASK LEADER Christelle LACRESSONNIERE DEN/DTN/STPA/LPC CEA-Cadarache F-13108 Saint-Paul-Lez-Durance Cedex Tél. : 33 4 42 25 35 50 Fax : 33 4 42 25 72 87 E-mail : [email protected]

- 196 - EFDA Technology / System Studies / Power Plant Conceptual Studies
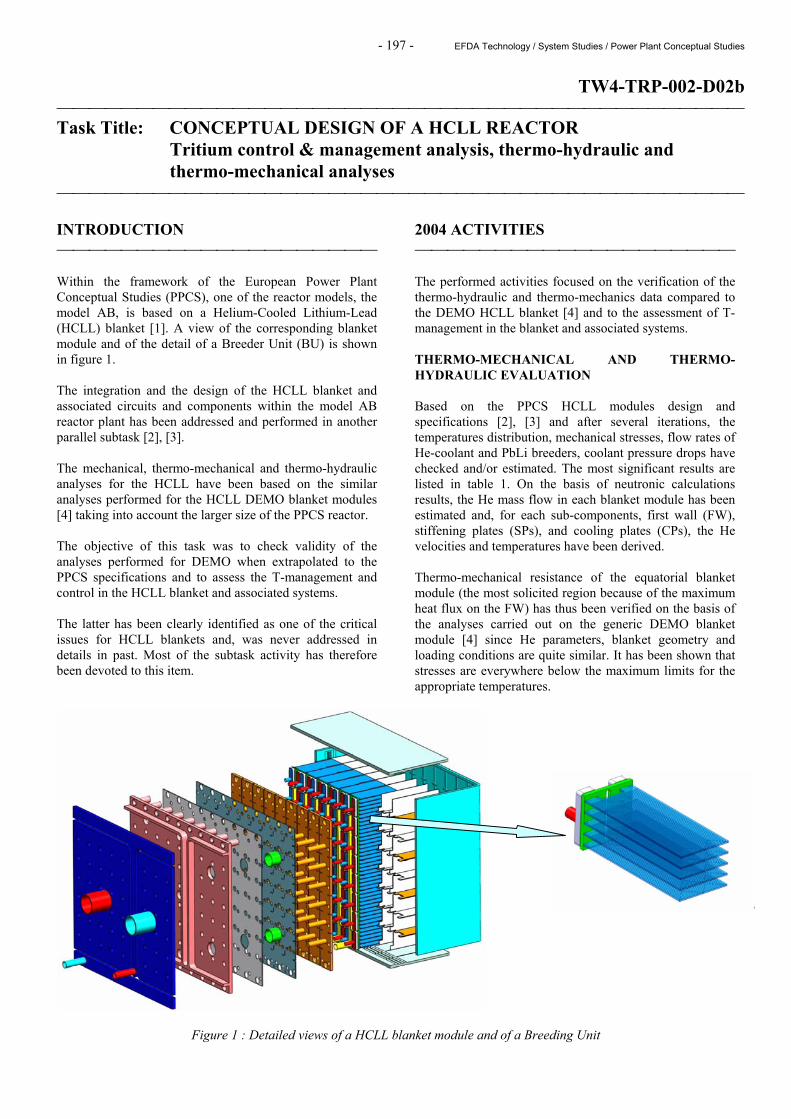
- 197 - EFDA Technology / System Studies / Power Plant Conceptual Studies
TW4-TRP-002-D02b Task Title: CONCEPTUAL DESIGN OF A HCLL REACTOR Tritium control & management analysis, thermo-hydraulic and
thermo-mechanical analyses INTRODUCTION Within the framework of the European Power Plant Conceptual Studies (PPCS), one of the reactor models, the model AB, is based on a Helium-Cooled Lithium-Lead (HCLL) blanket [1]. A view of the corresponding blanket module and of the detail of a Breeder Unit (BU) is shown in figure 1. The integration and the design of the HCLL blanket and associated circuits and components within the model AB reactor plant has been addressed and performed in another parallel subtask [2], [3]. The mechanical, thermo-mechanical and thermo-hydraulic analyses for the HCLL have been based on the similar analyses performed for the HCLL DEMO blanket modules [4] taking into account the larger size of the PPCS reactor. The objective of this task was to check validity of the analyses performed for DEMO when extrapolated to the PPCS specifications and to assess the T-management and control in the HCLL blanket and associated systems. The latter has been clearly identified as one of the critical issues for HCLL blankets and, was never addressed in details in past. Most of the subtask activity has therefore been devoted to this item.
2004 ACTIVITIES The performed activities focused on the verification of the thermo-hydraulic and thermo-mechanics data compared to the DEMO HCLL blanket [4] and to the assessment of T-management in the blanket and associated systems. THERMO-MECHANICAL AND THERMO-HYDRAULIC EVALUATION Based on the PPCS HCLL modules design and specifications [2], [3] and after several iterations, the temperatures distribution, mechanical stresses, flow rates of He-coolant and PbLi breeders, coolant pressure drops have checked and/or estimated. The most significant results are listed in table 1. On the basis of neutronic calculations results, the He mass flow in each blanket module has been estimated and, for each sub-components, first wall (FW), stiffening plates (SPs), and cooling plates (CPs), the He velocities and temperatures have been derived. Thermo-mechanical resistance of the equatorial blanket module (the most solicited region because of the maximum heat flux on the FW) has thus been verified on the basis of the analyses carried out on the generic DEMO blanket module [4] since He parameters, blanket geometry and loading conditions are quite similar. It has been shown that stresses are everywhere below the maximum limits for the appropriate temperatures.
Figure 1 : Detailed views of a HCLL blanket module and of a Breeding Unit
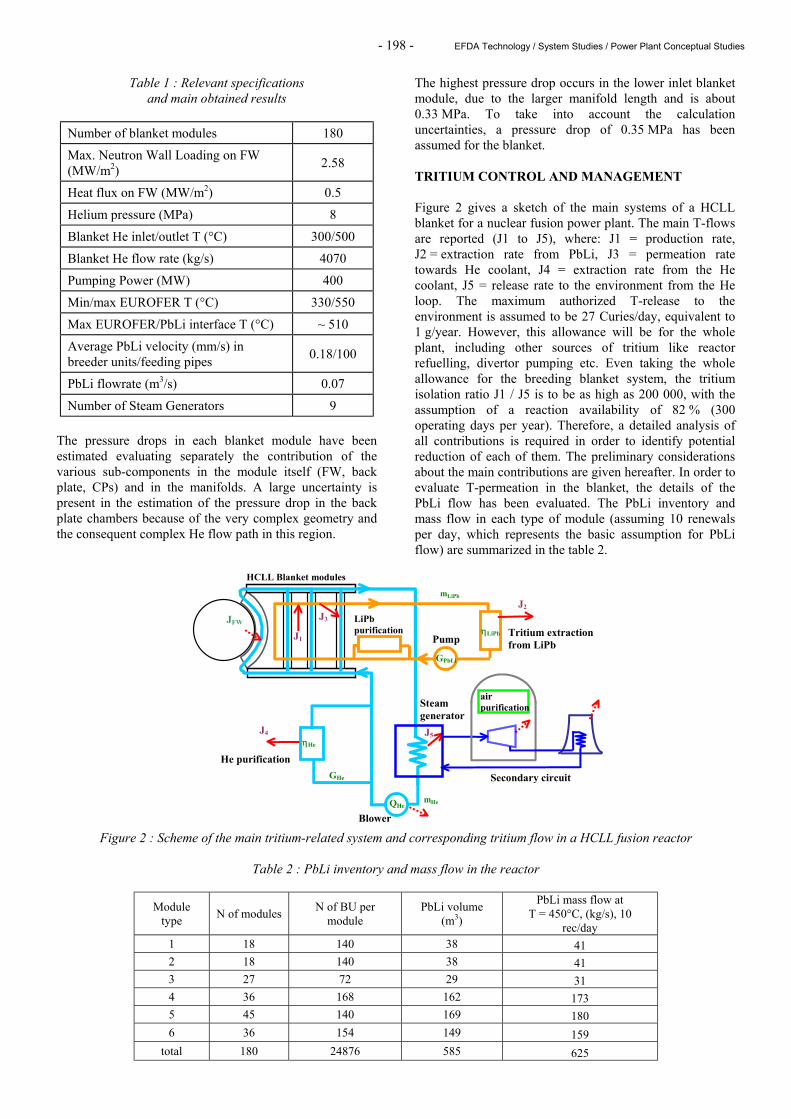
- 198 - EFDA Technology / System Studies / Power Plant Conceptual Studies
Table 1 : Relevant specifications and main obtained results
Number of blanket modules 180
Max. Neutron Wall Loading on FW (MW/m2) 2.58
Heat flux on FW (MW/m2) 0.5
Helium pressure (MPa) 8
Blanket He inlet/outlet T (°C) 300/500
Blanket He flow rate (kg/s) 4070
Pumping Power (MW) 400
Min/max EUROFER T (°C) 330/550
Max EUROFER/PbLi interface T (°C) ~ 510
Average PbLi velocity (mm/s) in breeder units/feeding pipes 0.18/100
PbLi flowrate (m3/s) 0.07
Number of Steam Generators 9 The pressure drops in each blanket module have been estimated evaluating separately the contribution of the various sub-components in the module itself (FW, back plate, CPs) and in the manifolds. A large uncertainty is present in the estimation of the pressure drop in the back plate chambers because of the very complex geometry and the consequent complex He flow path in this region.
The highest pressure drop occurs in the lower inlet blanket module, due to the larger manifold length and is about 0.33 MPa. To take into account the calculation uncertainties, a pressure drop of 0.35 MPa has been assumed for the blanket. TRITIUM CONTROL AND MANAGEMENT Figure 2 gives a sketch of the main systems of a HCLL blanket for a nuclear fusion power plant. The main T-flows are reported (J1 to J5), where: J1 = production rate, J2 = extraction rate from PbLi, J3 = permeation rate towards He coolant, J4 = extraction rate from the He coolant, J5 = release rate to the environment from the He loop. The maximum authorized T-release to the environment is assumed to be 27 Curies/day, equivalent to 1 g/year. However, this allowance will be for the whole plant, including other sources of tritium like reactor refuelling, divertor pumping etc. Even taking the whole allowance for the breeding blanket system, the tritium isolation ratio J1 / J5 is to be as high as 200 000, with the assumption of a reaction availability of 82 % (300 operating days per year). Therefore, a detailed analysis of all contributions is required in order to identify potential reduction of each of them. The preliminary considerations about the main contributions are given hereafter. In order to evaluate T-permeation in the blanket, the details of the PbLi flow has been evaluated. The PbLi inventory and mass flow in each type of module (assuming 10 renewals per day, which represents the basic assumption for PbLi flow) are summarized in the table 2.
Figure 2 : Scheme of the main tritium-related system and corresponding tritium flow in a HCLL fusion reactor
Table 2 : PbLi inventory and mass flow in the reactor
Module type N of modules N of BU per
module PbLi volume
(m3)
PbLi mass flow at T = 450°C, (kg/s), 10
rec/day 1 18 140 38 41 2 18 140 38 41 3 27 72 29 31 4 36 168 162 173 5 45 140 169 180 6 36 154 149 159
total 180 24876 585 625
Tritium extraction from LiPb
JFW J3
J5
He purification GHe
ηLiPb
ηHe
mHe
GPbLi
J1
J2
J4
Blower
Steam generator
Secondary circuit
HCLL Blanket modules
LiPb purification
Pump
air purification
QHe
mLiPb
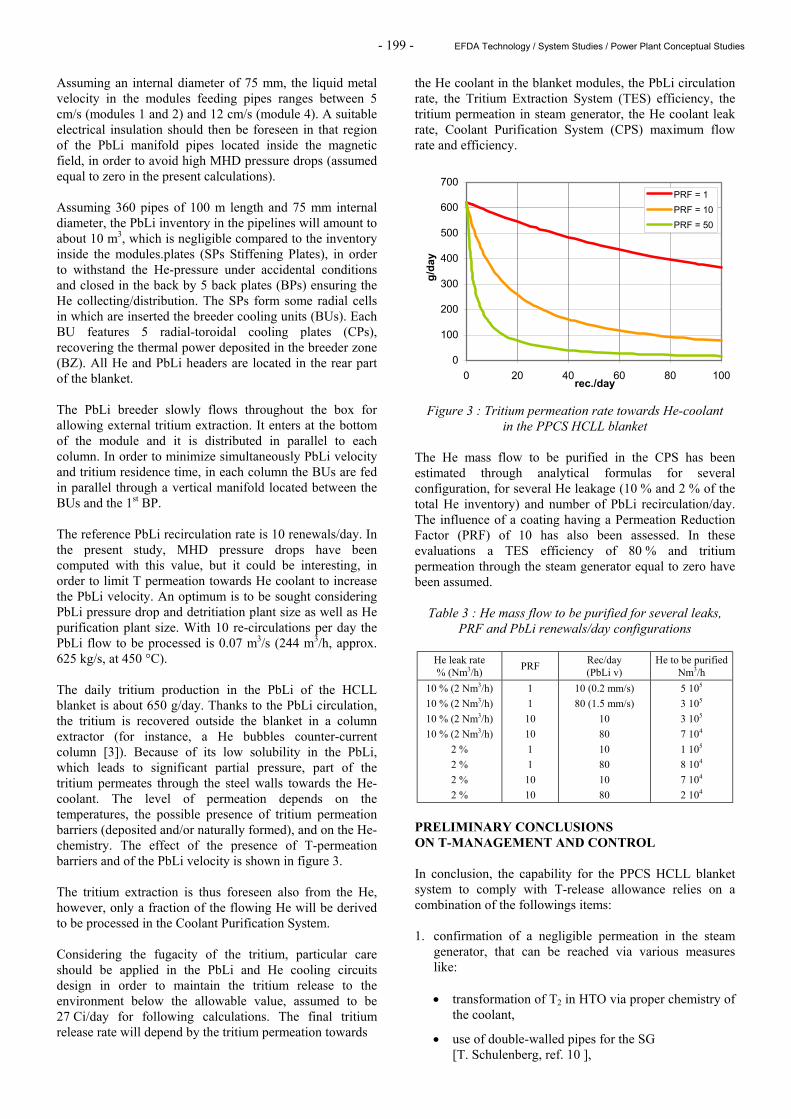
- 199 - EFDA Technology / System Studies / Power Plant Conceptual Studies
Assuming an internal diameter of 75 mm, the liquid metal velocity in the modules feeding pipes ranges between 5 cm/s (modules 1 and 2) and 12 cm/s (module 4). A suitable electrical insulation should then be foreseen in that region of the PbLi manifold pipes located inside the magnetic field, in order to avoid high MHD pressure drops (assumed equal to zero in the present calculations). Assuming 360 pipes of 100 m length and 75 mm internal diameter, the PbLi inventory in the pipelines will amount to about 10 m3, which is negligible compared to the inventory inside the modules.plates (SPs Stiffening Plates), in order to withstand the He-pressure under accidental conditions and closed in the back by 5 back plates (BPs) ensuring the He collecting/distribution. The SPs form some radial cells in which are inserted the breeder cooling units (BUs). Each BU features 5 radial-toroidal cooling plates (CPs), recovering the thermal power deposited in the breeder zone (BZ). All He and PbLi headers are located in the rear part of the blanket. The PbLi breeder slowly flows throughout the box for allowing external tritium extraction. It enters at the bottom of the module and it is distributed in parallel to each column. In order to minimize simultaneously PbLi velocity and tritium residence time, in each column the BUs are fed in parallel through a vertical manifold located between the BUs and the 1st BP. The reference PbLi recirculation rate is 10 renewals/day. In the present study, MHD pressure drops have been computed with this value, but it could be interesting, in order to limit T permeation towards He coolant to increase the PbLi velocity. An optimum is to be sought considering PbLi pressure drop and detritiation plant size as well as He purification plant size. With 10 re-circulations per day the PbLi flow to be processed is 0.07 m3/s (244 m3/h, approx. 625 kg/s, at 450 °C). The daily tritium production in the PbLi of the HCLL blanket is about 650 g/day. Thanks to the PbLi circulation, the tritium is recovered outside the blanket in a column extractor (for instance, a He bubbles counter-current column [3]). Because of its low solubility in the PbLi, which leads to significant partial pressure, part of the tritium permeates through the steel walls towards the He-coolant. The level of permeation depends on the temperatures, the possible presence of tritium permeation barriers (deposited and/or naturally formed), and on the He-chemistry. The effect of the presence of T-permeation barriers and of the PbLi velocity is shown in figure 3. The tritium extraction is thus foreseen also from the He, however, only a fraction of the flowing He will be derived to be processed in the Coolant Purification System. Considering the fugacity of the tritium, particular care should be applied in the PbLi and He cooling circuits design in order to maintain the tritium release to the environment below the allowable value, assumed to be 27 Ci/day for following calculations. The final tritium release rate will depend by the tritium permeation towards
the He coolant in the blanket modules, the PbLi circulation rate, the Tritium Extraction System (TES) efficiency, the tritium permeation in steam generator, the He coolant leak rate, Coolant Purification System (CPS) maximum flow rate and efficiency.
0
100
200
300
400
500
600
700
0 20 40 60 80 100rec./day
g/day
PRF = 1PRF = 10PRF = 50
Figure 3 : Tritium permeation rate towards He-coolant in the PPCS HCLL blanket
The He mass flow to be purified in the CPS has been estimated through analytical formulas for several configuration, for several He leakage (10 % and 2 % of the total He inventory) and number of PbLi recirculation/day. The influence of a coating having a Permeation Reduction Factor (PRF) of 10 has also been assessed. In these evaluations a TES efficiency of 80 % and tritium permeation through the steam generator equal to zero have been assumed.
Table 3 : He mass flow to be purified for several leaks, PRF and PbLi renewals/day configurations
He leak rate % (Nm3/h) PRF Rec/day
(PbLi v) He to be purified
Nm3/h 10 % (2 Nm3/h) 10 % (2 Nm3/h) 10 % (2 Nm3/h) 10 % (2 Nm3/h)
2 % 2 % 2 % 2 %
1 1 10 10 1 1 10 10
10 (0.2 mm/s) 80 (1.5 mm/s)
10 80 10 80 10 80
5 105
3 105
3 105
7 104
1 105
8 104
7 104
2 104
PRELIMINARY CONCLUSIONS ON T-MANAGEMENT AND CONTROL In conclusion, the capability for the PPCS HCLL blanket system to comply with T-release allowance relies on a combination of the followings items: 1. confirmation of a negligible permeation in the steam
generator, that can be reached via various measures like:
• transformation of T2 in HTO via proper chemistry of
the coolant,
• use of double-walled pipes for the SG [T. Schulenberg, ref. 10 ],
- 200 - EFDA Technology / System Studies / Power Plant Conceptual Studies
• development of permeation barrier for the SG with a PRF larger than the present considered value of 400, and reliable in time,
2. confirmation of favourable recent measurements for the
Tritium Sievert constant, 3. very efficient blanket permeation reduction factor (PRF
at least around 50) to be used in the blanket analytical computation of the permeation (using performing permeation barriers and/or taking into consideration tritium diffusion in the PbLi via finite element modelling),
4. significant increase of a the PbLi recycling rate (above
the present admitted value of 10 recirculations/day) 5. possibility that the driving factor for permeation in the
steam generator becomes a linear function of pressure at low tritium partial pressure (recombination limited permeation) and be no longer proportional to the square root of the partial pressure (diffusion limited permeation). Presently, no data are available about this physical transition threshold, that would tolerate higher tritium partial pressure in He coolant,
6. possibility to consider a secondary water purification
plant and/or have reduced steam leakage in the turbines, 7. confirmation of the presently assumed low level of T-
reach Helium leakages from the circuit components. A reasonable compromise among the various, often controversial requirements, could be found, if the assumption of successful R&D applied to all the different above items fields will be confirmed. In principle, under PPCS specifications, T-control for HCLL blankets can be managed provided the required improvement can be smoothly distributed over most of the different items listed above, leading in particular to technologically achievable requirements for tritium permeation barriers, tritium extraction systems both from PbLi and He, permeation through the steam generator and leak rates from the He cooling system. REFERENCES [1] A. Li Puma et al. - Breeding Blanket Design and
Systems Integration for a Helium-Cooled Lithium-Lead Fusion Power Plant, accepted as oral paper at the ISFNT-7 - to be published in Fus. Eng. & Design.
[2] Progress Report 2004 for the subtask TW4-TRP-002-
D04. [3] A. Li Puma, L. Giancarli - Helium-Cooled Lithium-
Lead Fusion Power Plant (PPCS model AB) Design and integration of in-vessel components and associated systems Task EFDA TW4-TRP-002-D04 - CEA Report, SERMA/LCA/RT/04-3543/A - February 2005.
[4] A. Li Puma, Y. Poitevin, L. Giancarli, W. Farabolini, G. Rampal, JF. Salavy, J. Szczepanski, U. Fischer, P. Pereslavtsev - Helium Cooled Lithium Lead blanket module for DEMO: designs and analyses - CEA Report, DM2S/SERMA, September 2003.
PUBLICATIONS AND REPORTS W. Farabolini et al. - Tritium Control Modeling in a Helium-Cooled Lithium-Lead Blanket for a Fusion Power Reactor, accepted as oral paper at the ISFNT-7 - to be published in Fus. Eng. & Design. W. Farabolini et al. - Tritium control & management analysis, thermo-hydraulic and thermo-mechanical analyses for the PPCS HCLL Blankets - CEA Report, SERMA/LCA/RT/05-xx - June 2005. TASK LEADER Wilfrid FARABOLINI DEN/DM2S/SERMA CEA-Saclay F-91191 Gif-sur-Yvette Cedex Tél. : 33 1 69 08 78 79 Fax : 33 1 69 08 99 35 E-mail : [email protected]
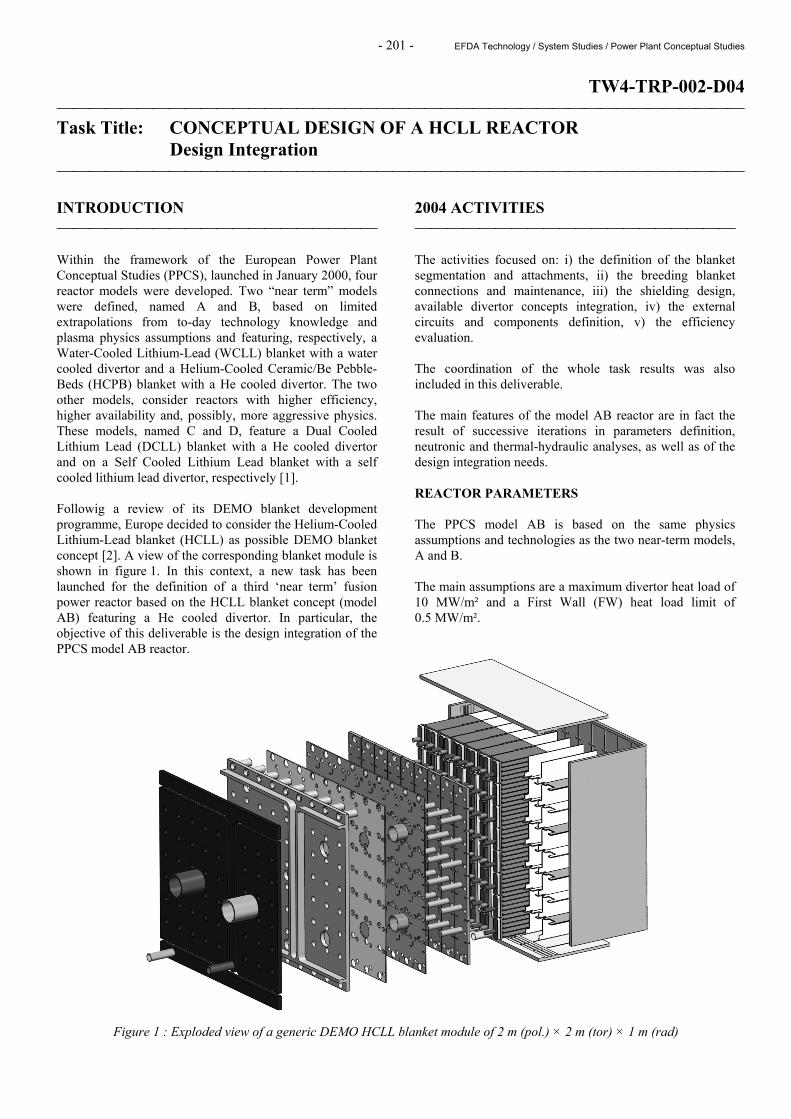
- 201 - EFDA Technology / System Studies / Power Plant Conceptual Studies
TW4-TRP-002-D04 Task Title: CONCEPTUAL DESIGN OF A HCLL REACTOR Design Integration INTRODUCTION Within the framework of the European Power Plant Conceptual Studies (PPCS), launched in January 2000, four reactor models were developed. Two “near term” models were defined, named A and B, based on limited extrapolations from to-day technology knowledge and plasma physics assumptions and featuring, respectively, a Water-Cooled Lithium-Lead (WCLL) blanket with a water cooled divertor and a Helium-Cooled Ceramic/Be Pebble-Beds (HCPB) blanket with a He cooled divertor. The two other models, consider reactors with higher efficiency, higher availability and, possibly, more aggressive physics. These models, named C and D, feature a Dual Cooled Lithium Lead (DCLL) blanket with a He cooled divertor and on a Self Cooled Lithium Lead blanket with a self cooled lithium lead divertor, respectively [1]. Followig a review of its DEMO blanket development programme, Europe decided to consider the Helium-Cooled Lithium-Lead blanket (HCLL) as possible DEMO blanket concept [2]. A view of the corresponding blanket module is shown in figure 1. In this context, a new task has been launched for the definition of a third ‘near term’ fusion power reactor based on the HCLL blanket concept (model AB) featuring a He cooled divertor. In particular, the objective of this deliverable is the design integration of the PPCS model AB reactor.
2004 ACTIVITIES The activities focused on: i) the definition of the blanket segmentation and attachments, ii) the breeding blanket connections and maintenance, iii) the shielding design, available divertor concepts integration, iv) the external circuits and components definition, v) the efficiency evaluation. The coordination of the whole task results was also included in this deliverable. The main features of the model AB reactor are in fact the result of successive iterations in parameters definition, neutronic and thermal-hydraulic analyses, as well as of the design integration needs. REACTOR PARAMETERS The PPCS model AB is based on the same physics assumptions and technologies as the two near-term models, A and B. The main assumptions are a maximum divertor heat load of 10 MW/m² and a First Wall (FW) heat load limit of 0.5 MW/m².
Figure 1 : Exploded view of a generic DEMO HCLL blanket module of 2 m (pol.) × 2 m (tor) × 1 m (rad)
- 202 - EFDA Technology / System Studies / Power Plant Conceptual Studies
In order to establish the main reactor parameters the other main initial assumptions are: i) an electrical net output of 1500 MW, ii) a blanket energy multiplication factor of 1.18, iii) a conversion efficiency of 43.7 % (not taking into account pumping power), and, iv) a pumping power of 400 MW. These assumptions have been used to define a set of parameters using the PROCESS code [3]. The last iteration results are summarized in table 1.
Table 1 : Parameters of the PPCS AB model reactor
Unit Size (GWe) 1.5
Blanket Gain 1.18
Conversion efficiency 0.437 (gross)
Pumping Power (MW) 400
Fusion Power (GW) 4.24
Aspect Ratio 3.0
Elongation (95% flux) 1.7
Triangularity (95% flux) 0.27
Major Radius (m) 9.56
TF on axis (T) 6.7
TF on the TF coil conductor (T) 13.1
Plasma Current (MA) 30.0
βN(thermal, total) 2.7, 3.5
Average Temperature (keV) 21.5
Temperature peaking factor 1.5
Average Density (1020m-3) 1.05
Density peaking factor 0.3
HH (IPB98y2) 1.2
Bootstrap Fraction 0.43
Padd (MW) 257
n/nG 1.2
Q 16.5
Recirculating power fraction 0.38 (pump. included)
Average neutron wall load 1.84
Divertor Peak load (MW/m-2) 10
Zeff 2.6 DESIGN: MAIN RATIONAL AND DESCRIPTION A poloidal cut of the PPCS AB reactor is shown in figure 2. The following basic guidelines have been considered for the design of this reactor: - The breeding blanket main parameters and architecture
are based on the corresponding DEMO HCLL blanket [2].
- Use of the “large modules maintenance” based on
previous EFET evaluation derived from the ITER experience; a possible alternative proposal could be to have small modules 2mx2m installed on a banana-shaped back-plate and vertical maintenance.
- Use of modules vertical orientation (4 m high x 2 m width) in order to keep the same He flow path length in the FW as in DEMO (thermal hydraulics limitations); as a consequence, the modules are assumed to follow the plasma shape in the poloidal direction and to be straight in the toroidal direction.
- Module attachments are located on the side wall (SW),
in order to avoid penetrations through FW and breeder zone and to avoid complex design and fabrication of modules internals.
- The shield is divided in two regions: high temperature
shield (HTS) called also “manifold zone”, and low temperature shield (LTS). The presence of HTS allows the lateral attachment of the module to be rigid (minimal differential thermal expansion); flexible connections are therefore assumed between HTS and LTS.
- Pb-Li pipes are located at the bottom of the modules to
allow the liquid metal draining by gravity to improve safety.
- Connection/disconnection of the He-pipes (two per
module, one inlet at 300°C, one outlet at 500°C) is realized with an internal cutting/welding device which is inserted from the collector feeding pipes (in order to locate the connection in a region protected against neutron irradiation by the module itself); a possible alternative proposal would be an access from the front through a hole drilled at the bottom of the rear collector.
- Use of mechanical joints (threaded flange) for the Pb-Li
collectors to avoid remote welding of pipes with residual Pb-Li on the surface.
- He and Pb-Li collectors are integrated in the HTS, in
order to cool HTS through the He-collector; HTS has therefore to be poloidally continuous; LTS is also poloidally continuous so the attachments between HTS and LTS have an independent location from the module segmentation.
Blanket design The HCLL blanket is based on the use of EUROFER as structural material, of Pb-Li (Li at 90% in 6Li) as breeder, neutron multiplier and tritium carrier, and of He as coolant with inlet/outlet temperature of 300/500°C and 8 MPa pressure. It consists (see figure 1) of a steel box directly cooled by He flowing in internal channels. The box is reinforced by a stiffening grid of radial-toroidal and radial-poloidal He-cooled plates (SPs Stiffening Plates), in order to withstand the He-pressure under accidental conditions and closed in the back by 5 back plates (BPs) ensuring the He collecting/distribution. The SPs form some radial cells in which are inserted the breeder cooling units (BUs). Each BU features 5 radial-toroidal cooling plates (CPs), recovering the thermal power deposited in the breeder zone (BZ). All He and Pb-Li headers are located in the rear part of the blanket.
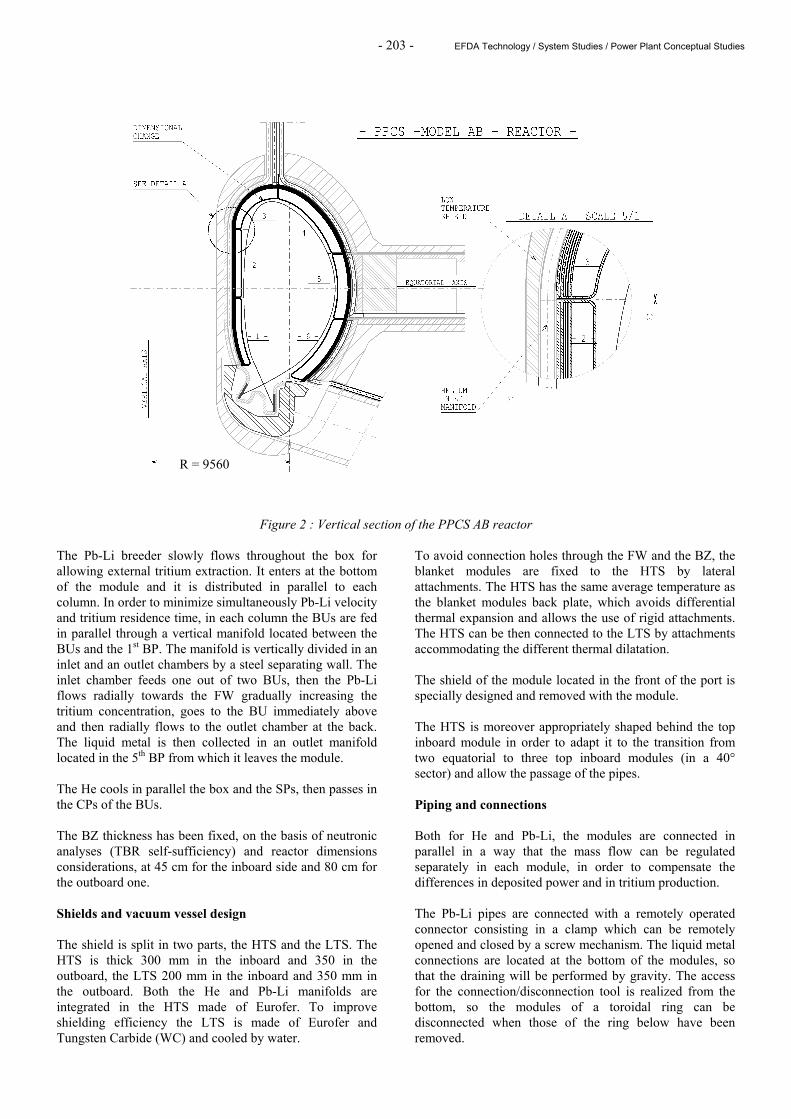
- 203 - EFDA Technology / System Studies / Power Plant Conceptual Studies
Figure 2 : Vertical section of the PPCS AB reactor
The Pb-Li breeder slowly flows throughout the box for allowing external tritium extraction. It enters at the bottom of the module and it is distributed in parallel to each column. In order to minimize simultaneously Pb-Li velocity and tritium residence time, in each column the BUs are fed in parallel through a vertical manifold located between the BUs and the 1st BP. The manifold is vertically divided in an inlet and an outlet chambers by a steel separating wall. The inlet chamber feeds one out of two BUs, then the Pb-Li flows radially towards the FW gradually increasing the tritium concentration, goes to the BU immediately above and then radially flows to the outlet chamber at the back. The liquid metal is then collected in an outlet manifold located in the 5th BP from which it leaves the module. The He cools in parallel the box and the SPs, then passes in the CPs of the BUs. The BZ thickness has been fixed, on the basis of neutronic analyses (TBR self-sufficiency) and reactor dimensions considerations, at 45 cm for the inboard side and 80 cm for the outboard one. Shields and vacuum vessel design The shield is split in two parts, the HTS and the LTS. The HTS is thick 300 mm in the inboard and 350 in the outboard, the LTS 200 mm in the inboard and 350 mm in the outboard. Both the He and Pb-Li manifolds are integrated in the HTS made of Eurofer. To improve shielding efficiency the LTS is made of Eurofer and Tungsten Carbide (WC) and cooled by water.
To avoid connection holes through the FW and the BZ, the blanket modules are fixed to the HTS by lateral attachments. The HTS has the same average temperature as the blanket modules back plate, which avoids differential thermal expansion and allows the use of rigid attachments. The HTS can be then connected to the LTS by attachments accommodating the different thermal dilatation. The shield of the module located in the front of the port is specially designed and removed with the module. The HTS is moreover appropriately shaped behind the top inboard module in order to adapt it to the transition from two equatorial to three top inboard modules (in a 40° sector) and allow the passage of the pipes. Piping and connections Both for He and Pb-Li, the modules are connected in parallel in a way that the mass flow can be regulated separately in each module, in order to compensate the differences in deposited power and in tritium production. The Pb-Li pipes are connected with a remotely operated connector consisting in a clamp which can be remotely opened and closed by a screw mechanism. The liquid metal connections are located at the bottom of the modules, so that the draining will be performed by gravity. The access for the connection/disconnection tool is realized from the bottom, so the modules of a toroidal ring can be disconnected when those of the ring below have been removed.
R = 9560
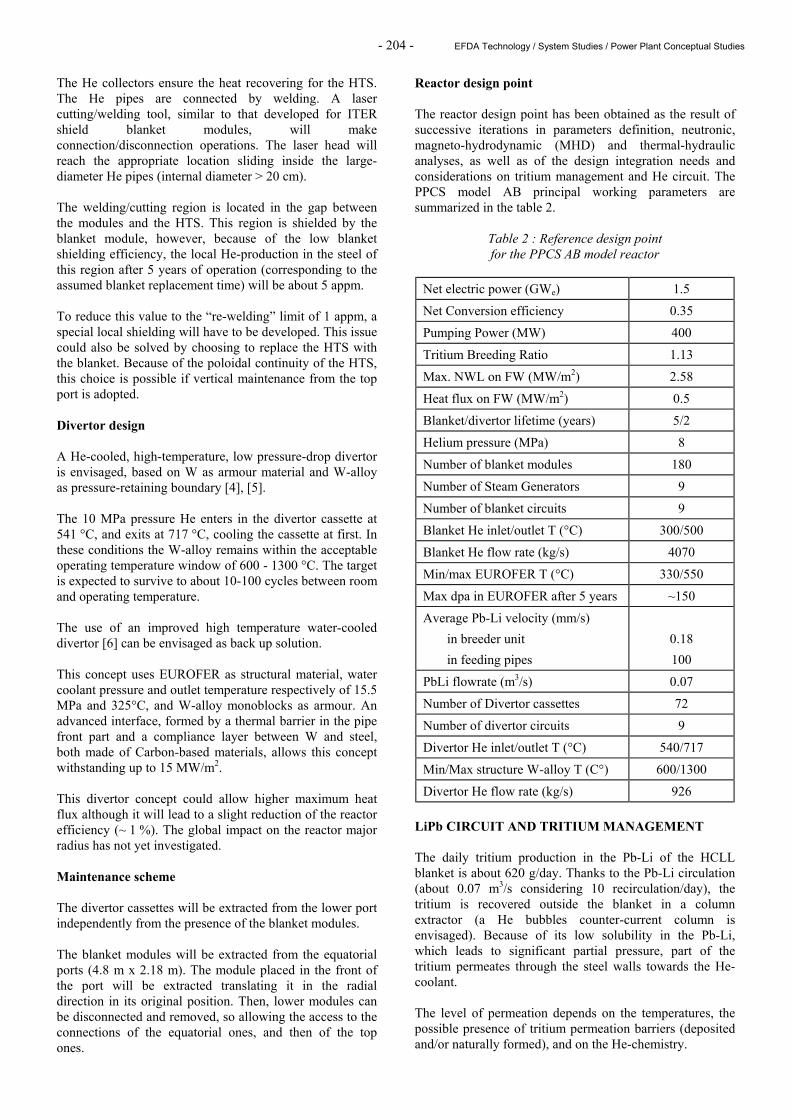
- 204 - EFDA Technology / System Studies / Power Plant Conceptual Studies
The He collectors ensure the heat recovering for the HTS. The He pipes are connected by welding. A laser cutting/welding tool, similar to that developed for ITER shield blanket modules, will make connection/disconnection operations. The laser head will reach the appropriate location sliding inside the large-diameter He pipes (internal diameter > 20 cm). The welding/cutting region is located in the gap between the modules and the HTS. This region is shielded by the blanket module, however, because of the low blanket shielding efficiency, the local He-production in the steel of this region after 5 years of operation (corresponding to the assumed blanket replacement time) will be about 5 appm. To reduce this value to the “re-welding” limit of 1 appm, a special local shielding will have to be developed. This issue could also be solved by choosing to replace the HTS with the blanket. Because of the poloidal continuity of the HTS, this choice is possible if vertical maintenance from the top port is adopted. Divertor design A He-cooled, high-temperature, low pressure-drop divertor is envisaged, based on W as armour material and W-alloy as pressure-retaining boundary [4], [5]. The 10 MPa pressure He enters in the divertor cassette at 541 °C, and exits at 717 °C, cooling the cassette at first. In these conditions the W-alloy remains within the acceptable operating temperature window of 600 - 1300 °C. The target is expected to survive to about 10-100 cycles between room and operating temperature. The use of an improved high temperature water-cooled divertor [6] can be envisaged as back up solution. This concept uses EUROFER as structural material, water coolant pressure and outlet temperature respectively of 15.5 MPa and 325°C, and W-alloy monoblocks as armour. An advanced interface, formed by a thermal barrier in the pipe front part and a compliance layer between W and steel, both made of Carbon-based materials, allows this concept withstanding up to 15 MW/m2. This divertor concept could allow higher maximum heat flux although it will lead to a slight reduction of the reactor efficiency (~ 1 %). The global impact on the reactor major radius has not yet investigated. Maintenance scheme The divertor cassettes will be extracted from the lower port independently from the presence of the blanket modules. The blanket modules will be extracted from the equatorial ports (4.8 m x 2.18 m). The module placed in the front of the port will be extracted translating it in the radial direction in its original position. Then, lower modules can be disconnected and removed, so allowing the access to the connections of the equatorial ones, and then of the top ones.
Reactor design point The reactor design point has been obtained as the result of successive iterations in parameters definition, neutronic, magneto-hydrodynamic (MHD) and thermal-hydraulic analyses, as well as of the design integration needs and considerations on tritium management and He circuit. The PPCS model AB principal working parameters are summarized in the table 2.
Table 2 : Reference design point for the PPCS AB model reactor
Net electric power (GWe) 1.5
Net Conversion efficiency 0.35
Pumping Power (MW) 400
Tritium Breeding Ratio 1.13
Max. NWL on FW (MW/m2) 2.58
Heat flux on FW (MW/m2) 0.5
Blanket/divertor lifetime (years) 5/2
Helium pressure (MPa) 8
Number of blanket modules 180
Number of Steam Generators 9
Number of blanket circuits 9
Blanket He inlet/outlet T (°C) 300/500
Blanket He flow rate (kg/s) 4070
Min/max EUROFER T (°C) 330/550
Max dpa in EUROFER after 5 years ~150
Average Pb-Li velocity (mm/s) in breeder unit in feeding pipes
0.18 100
PbLi flowrate (m3/s) 0.07
Number of Divertor cassettes 72
Number of divertor circuits 9
Divertor He inlet/outlet T (°C) 540/717
Min/Max structure W-alloy T (C°) 600/1300
Divertor He flow rate (kg/s) 926 LiPb CIRCUIT AND TRITIUM MANAGEMENT The daily tritium production in the Pb-Li of the HCLL blanket is about 620 g/day. Thanks to the Pb-Li circulation (about 0.07 m3/s considering 10 recirculation/day), the tritium is recovered outside the blanket in a column extractor (a He bubbles counter-current column is envisaged). Because of its low solubility in the Pb-Li, which leads to significant partial pressure, part of the tritium permeates through the steel walls towards the He-coolant. The level of permeation depends on the temperatures, the possible presence of tritium permeation barriers (deposited and/or naturally formed), and on the He-chemistry.
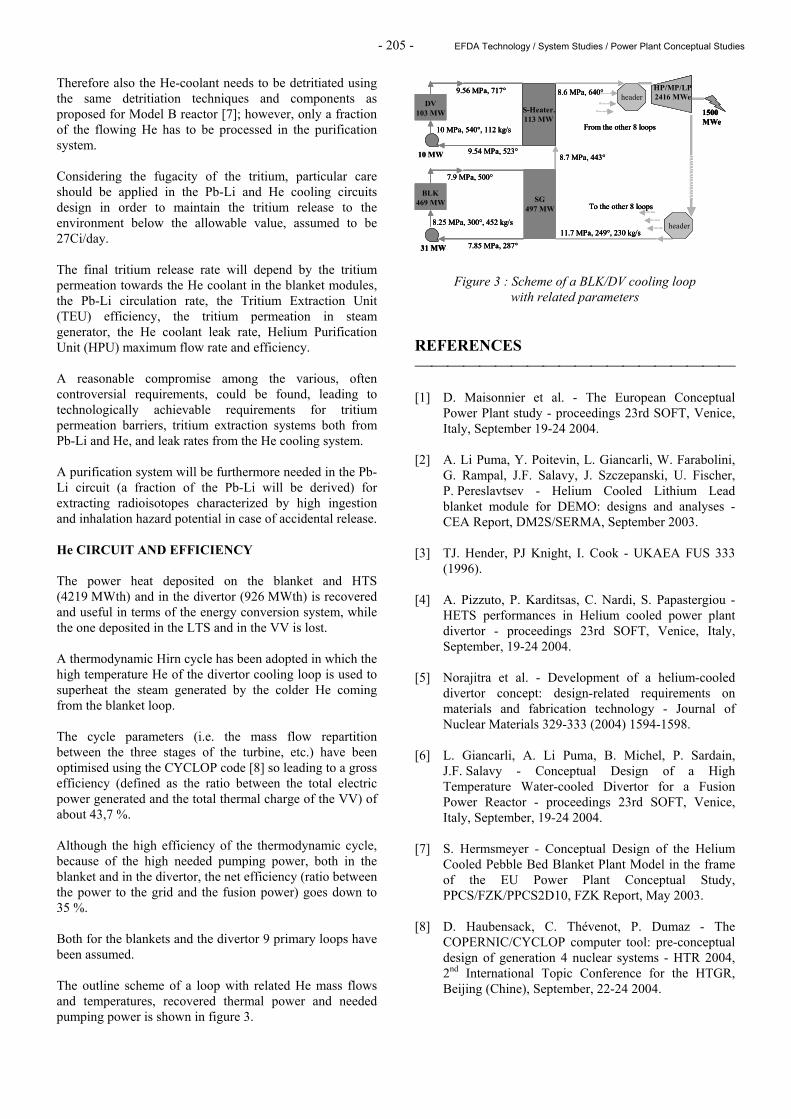
- 205 - EFDA Technology / System Studies / Power Plant Conceptual Studies
Therefore also the He-coolant needs to be detritiated using the same detritiation techniques and components as proposed for Model B reactor [7]; however, only a fraction of the flowing He has to be processed in the purification system. Considering the fugacity of the tritium, particular care should be applied in the Pb-Li and He cooling circuits design in order to maintain the tritium release to the environment below the allowable value, assumed to be 27Ci/day. The final tritium release rate will depend by the tritium permeation towards the He coolant in the blanket modules, the Pb-Li circulation rate, the Tritium Extraction Unit (TEU) efficiency, the tritium permeation in steam generator, the He coolant leak rate, Helium Purification Unit (HPU) maximum flow rate and efficiency. A reasonable compromise among the various, often controversial requirements, could be found, leading to technologically achievable requirements for tritium permeation barriers, tritium extraction systems both from Pb-Li and He, and leak rates from the He cooling system. A purification system will be furthermore needed in the Pb-Li circuit (a fraction of the Pb-Li will be derived) for extracting radioisotopes characterized by high ingestion and inhalation hazard potential in case of accidental release. He CIRCUIT AND EFFICIENCY The power heat deposited on the blanket and HTS (4219 MWth) and in the divertor (926 MWth) is recovered and useful in terms of the energy conversion system, while the one deposited in the LTS and in the VV is lost. A thermodynamic Hirn cycle has been adopted in which the high temperature He of the divertor cooling loop is used to superheat the steam generated by the colder He coming from the blanket loop. The cycle parameters (i.e. the mass flow repartition between the three stages of the turbine, etc.) have been optimised using the CYCLOP code [8] so leading to a gross efficiency (defined as the ratio between the total electric power generated and the total thermal charge of the VV) of about 43,7 %. Although the high efficiency of the thermodynamic cycle, because of the high needed pumping power, both in the blanket and in the divertor, the net efficiency (ratio between the power to the grid and the fusion power) goes down to 35 %. Both for the blankets and the divertor 9 primary loops have been assumed. The outline scheme of a loop with related He mass flows and temperatures, recovered thermal power and needed pumping power is shown in figure 3.
10 MW
DV 103 MW
BLK 469 MW
S-Heater.113 MW
SG497 MW
11.7 MPa, 249°, 230 kg/s
8.7 MPa, 443°
8.6 MPa, 640°9.56 MPa, 717°
9.54 MPa, 523°
7.9 MPa, 500°
7.85 MPa, 287°
header
header
31 MW
HP/MP/LP2416 MWe
To the other 8 loops
From the other 8 loops
1500 MWe
8.25 MPa, 300°, 452 kg/s
10 MPa, 540°, 112 kg/s
10 MW
DV 103 MW
DV 103 MW
BLK 469 MW
BLK 469 MW
S-Heater.113 MW
SG497 MW
11.7 MPa, 249°, 230 kg/s
8.7 MPa, 443°
8.6 MPa, 640°9.56 MPa, 717°
9.54 MPa, 523°
7.9 MPa, 500°
7.85 MPa, 287°
header
header
31 MW
HP/MP/LP2416 MWe
To the other 8 loops
From the other 8 loops
1500 MWe
8.25 MPa, 300°, 452 kg/s
10 MPa, 540°, 112 kg/s
S-Heater.113 MW
SG497 MW
11.7 MPa, 249°, 230 kg/s
8.7 MPa, 443°
8.6 MPa, 640°9.56 MPa, 717°
9.54 MPa, 523°
7.9 MPa, 500°
7.85 MPa, 287°
header
header
31 MW
HP/MP/LP2416 MWeHP/MP/LP2416 MWe
To the other 8 loops
From the other 8 loops
1500 MWe
8.25 MPa, 300°, 452 kg/s
10 MPa, 540°, 112 kg/s
Figure 3 : Scheme of a BLK/DV cooling loop with related parameters
REFERENCES [1] D. Maisonnier et al. - The European Conceptual
Power Plant study - proceedings 23rd SOFT, Venice, Italy, September 19-24 2004.
[2] A. Li Puma, Y. Poitevin, L. Giancarli, W. Farabolini,
G. Rampal, J.F. Salavy, J. Szczepanski, U. Fischer, P. Pereslavtsev - Helium Cooled Lithium Lead blanket module for DEMO: designs and analyses - CEA Report, DM2S/SERMA, September 2003.
[3] TJ. Hender, PJ Knight, I. Cook - UKAEA FUS 333
(1996). [4] A. Pizzuto, P. Karditsas, C. Nardi, S. Papastergiou -
HETS performances in Helium cooled power plant divertor - proceedings 23rd SOFT, Venice, Italy, September, 19-24 2004.
[5] Norajitra et al. - Development of a helium-cooled
divertor concept: design-related requirements on materials and fabrication technology - Journal of Nuclear Materials 329-333 (2004) 1594-1598.
[6] L. Giancarli, A. Li Puma, B. Michel, P. Sardain,
J.F. Salavy - Conceptual Design of a High Temperature Water-cooled Divertor for a Fusion Power Reactor - proceedings 23rd SOFT, Venice, Italy, September, 19-24 2004.
[7] S. Hermsmeyer - Conceptual Design of the Helium
Cooled Pebble Bed Blanket Plant Model in the frame of the EU Power Plant Conceptual Study, PPCS/FZK/PPCS2D10, FZK Report, May 2003.
[8] D. Haubensack, C. Thévenot, P. Dumaz - The
COPERNIC/CYCLOP computer tool: pre-conceptual design of generation 4 nuclear systems - HTR 2004, 2nd International Topic Conference for the HTGR, Beijing (Chine), September, 22-24 2004.
- 206 - EFDA Technology / System Studies / Power Plant Conceptual Studies
PUBLICATIONS AND REPORTS A. Li Puma et al. - Breeding Blanket Design and Systems Integration for a Helium-Cooled Lithium-Lead Fusion Power Plant, accepted as oral paper at the ISFNT-7 - to be published in Fus. Eng. Des. A. Li Puma, L. Giancarli - Helium-Cooled Lithium-Lead Fusion Power Plant (PPCS model AB) Design and integration of in-vessel components and associated systems Task EFDA TW4-TRP-002-D04 - CEA report, SERMA/LCA/RT/04-3543/A, February 2005. TASK LEADER Antonella LI PUMA DEN/DM2S/SERMA CEA-Saclay F-91191 Gif-sur-Yvette Cedex Tél. : 33 1 69 08 79 76 Fax : 33 1 69 08 99 35 E-mail : [email protected]
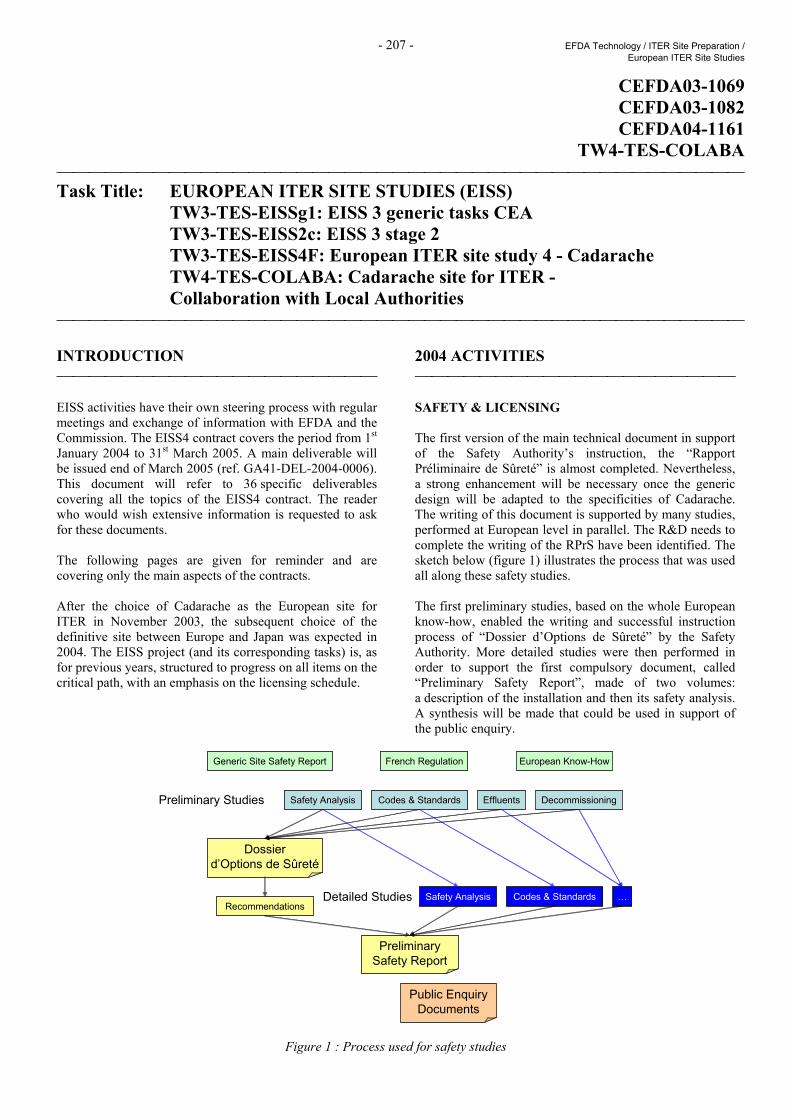
- 207 - EFDA Technology / ITER Site Preparation / European ITER Site Studies
CEFDA03-1069 CEFDA03-1082 CEFDA04-1161
TW4-TES-COLABA Task Title: EUROPEAN ITER SITE STUDIES (EISS) TW3-TES-EISSg1: EISS 3 generic tasks CEA TW3-TES-EISS2c: EISS 3 stage 2 TW3-TES-EISS4F: European ITER site study 4 - Cadarache TW4-TES-COLABA: Cadarache site for ITER -
Collaboration with Local Authorities INTRODUCTION EISS activities have their own steering process with regular meetings and exchange of information with EFDA and the Commission. The EISS4 contract covers the period from 1st January 2004 to 31st March 2005. A main deliverable will be issued end of March 2005 (ref. GA41-DEL-2004-0006). This document will refer to 36 specific deliverables covering all the topics of the EISS4 contract. The reader who would wish extensive information is requested to ask for these documents. The following pages are given for reminder and are covering only the main aspects of the contracts. After the choice of Cadarache as the European site for ITER in November 2003, the subsequent choice of the definitive site between Europe and Japan was expected in 2004. The EISS project (and its corresponding tasks) is, as for previous years, structured to progress on all items on the critical path, with an emphasis on the licensing schedule.
2004 ACTIVITIES SAFETY & LICENSING The first version of the main technical document in support of the Safety Authority’s instruction, the “Rapport Préliminaire de Sûreté” is almost completed. Nevertheless, a strong enhancement will be necessary once the generic design will be adapted to the specificities of Cadarache. The writing of this document is supported by many studies, performed at European level in parallel. The R&D needs to complete the writing of the RPrS have been identified. The sketch below (figure 1) illustrates the process that was used all along these safety studies. The first preliminary studies, based on the whole European know-how, enabled the writing and successful instruction process of “Dossier d’Options de Sûreté” by the Safety Authority. More detailed studies were then performed in order to support the first compulsory document, called “Preliminary Safety Report”, made of two volumes: a description of the installation and then its safety analysis. A synthesis will be made that could be used in support of the public enquiry.
Safety Analysis DecommissioningEffluentsCodes & Standards
Dossierd’Options de Sûreté
Preliminary Studies
Safety Analysis Codes & Standards …Detailed StudiesRecommendations
PreliminarySafety Report
Public EnquiryDocuments
Generic Site Safety Report French Regulation European Know-How
Figure 1 : Process used for safety studies
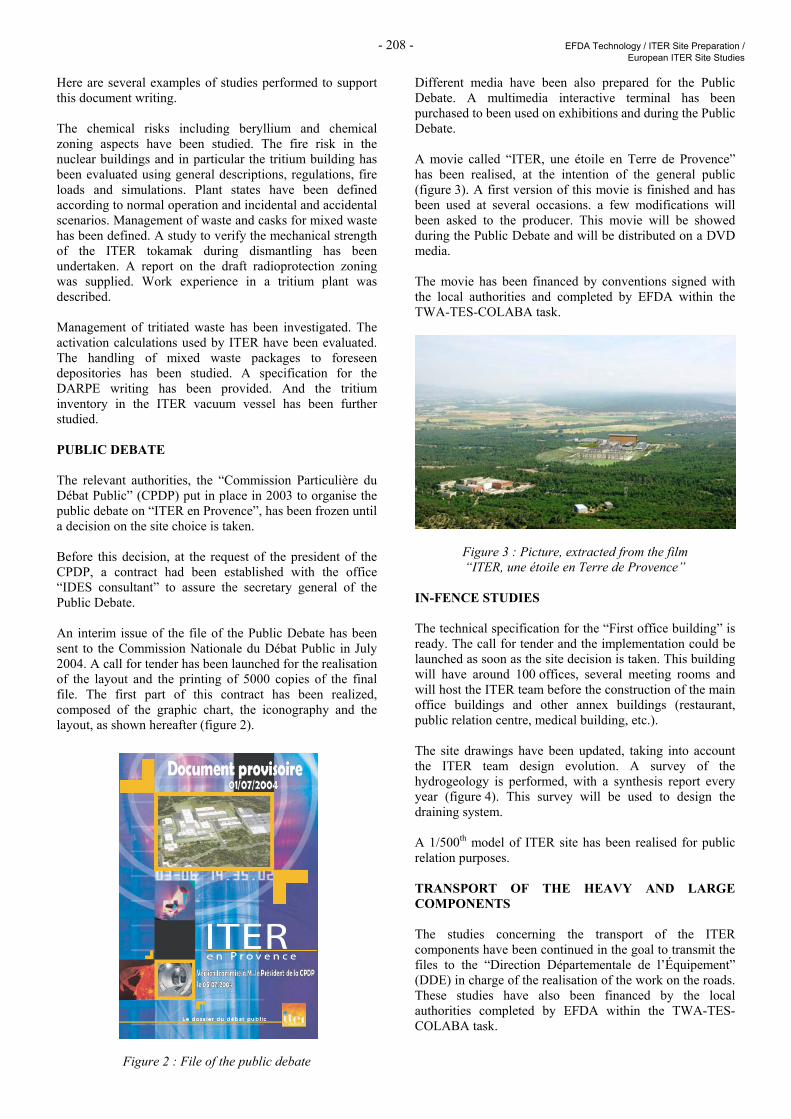
- 208 - EFDA Technology / ITER Site Preparation / European ITER Site Studies
Here are several examples of studies performed to support this document writing. The chemical risks including beryllium and chemical zoning aspects have been studied. The fire risk in the nuclear buildings and in particular the tritium building has been evaluated using general descriptions, regulations, fire loads and simulations. Plant states have been defined according to normal operation and incidental and accidental scenarios. Management of waste and casks for mixed waste has been defined. A study to verify the mechanical strength of the ITER tokamak during dismantling has been undertaken. A report on the draft radioprotection zoning was supplied. Work experience in a tritium plant was described. Management of tritiated waste has been investigated. The activation calculations used by ITER have been evaluated. The handling of mixed waste packages to foreseen depositories has been studied. A specification for the DARPE writing has been provided. And the tritium inventory in the ITER vacuum vessel has been further studied. PUBLIC DEBATE The relevant authorities, the “Commission Particulière du Débat Public” (CPDP) put in place in 2003 to organise the public debate on “ITER en Provence”, has been frozen until a decision on the site choice is taken. Before this decision, at the request of the president of the CPDP, a contract had been established with the office “IDES consultant” to assure the secretary general of the Public Debate. An interim issue of the file of the Public Debate has been sent to the Commission Nationale du Débat Public in July 2004. A call for tender has been launched for the realisation of the layout and the printing of 5000 copies of the final file. The first part of this contract has been realized, composed of the graphic chart, the iconography and the layout, as shown hereafter (figure 2).
Figure 2 : File of the public debate
Different media have been also prepared for the Public Debate. A multimedia interactive terminal has been purchased to been used on exhibitions and during the Public Debate. A movie called “ITER, une étoile en Terre de Provence” has been realised, at the intention of the general public (figure 3). A first version of this movie is finished and has been used at several occasions. a few modifications will been asked to the producer. This movie will be showed during the Public Debate and will be distributed on a DVD media. The movie has been financed by conventions signed with the local authorities and completed by EFDA within the TWA-TES-COLABA task.
Figure 3 : Picture, extracted from the film “ITER, une étoile en Terre de Provence”
IN-FENCE STUDIES The technical specification for the “First office building” is ready. The call for tender and the implementation could be launched as soon as the site decision is taken. This building will have around 100 offices, several meeting rooms and will host the ITER team before the construction of the main office buildings and other annex buildings (restaurant, public relation centre, medical building, etc.). The site drawings have been updated, taking into account the ITER team design evolution. A survey of the hydrogeology is performed, with a synthesis report every year (figure 4). This survey will be used to design the draining system. A 1/500th model of ITER site has been realised for public relation purposes. TRANSPORT OF THE HEAVY AND LARGE COMPONENTS The studies concerning the transport of the ITER components have been continued in the goal to transmit the files to the “Direction Départementale de l’Équipement” (DDE) in charge of the realisation of the work on the roads. These studies have also been financed by the local authorities completed by EFDA within the TWA-TES-COLABA task.
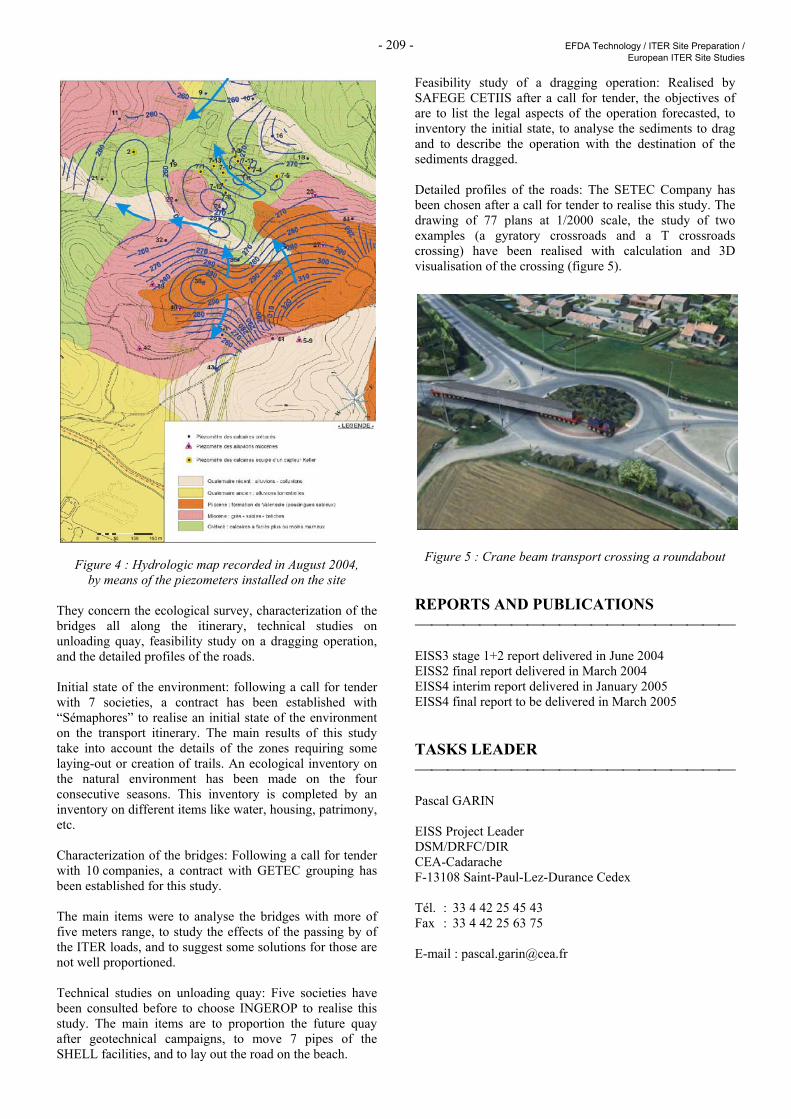
- 209 - EFDA Technology / ITER Site Preparation / European ITER Site Studies
Figure 4 : Hydrologic map recorded in August 2004, by means of the piezometers installed on the site
They concern the ecological survey, characterization of the bridges all along the itinerary, technical studies on unloading quay, feasibility study on a dragging operation, and the detailed profiles of the roads. Initial state of the environment: following a call for tender with 7 societies, a contract has been established with “Sémaphores” to realise an initial state of the environment on the transport itinerary. The main results of this study take into account the details of the zones requiring some laying-out or creation of trails. An ecological inventory on the natural environment has been made on the four consecutive seasons. This inventory is completed by an inventory on different items like water, housing, patrimony, etc. Characterization of the bridges: Following a call for tender with 10 companies, a contract with GETEC grouping has been established for this study. The main items were to analyse the bridges with more of five meters range, to study the effects of the passing by of the ITER loads, and to suggest some solutions for those are not well proportioned. Technical studies on unloading quay: Five societies have been consulted before to choose INGEROP to realise this study. The main items are to proportion the future quay after geotechnical campaigns, to move 7 pipes of the SHELL facilities, and to lay out the road on the beach.
Feasibility study of a dragging operation: Realised by SAFEGE CETIIS after a call for tender, the objectives of are to list the legal aspects of the operation forecasted, to inventory the initial state, to analyse the sediments to drag and to describe the operation with the destination of the sediments dragged. Detailed profiles of the roads: The SETEC Company has been chosen after a call for tender to realise this study. The drawing of 77 plans at 1/2000 scale, the study of two examples (a gyratory crossroads and a T crossroads crossing) have been realised with calculation and 3D visualisation of the crossing (figure 5).
Figure 5 : Crane beam transport crossing a roundabout REPORTS AND PUBLICATIONS EISS3 stage 1+2 report delivered in June 2004 EISS2 final report delivered in March 2004 EISS4 interim report delivered in January 2005 EISS4 final report to be delivered in March 2005 TASKS LEADER Pascal GARIN EISS Project Leader DSM/DRFC/DIR CEA-Cadarache F-13108 Saint-Paul-Lez-Durance Cedex Tél. : 33 4 42 25 45 43 Fax : 33 4 42 25 63 75 E-mail : [email protected]

- 210 - EFDA Technology / ITER Site Preparation / European ITER Site Studies
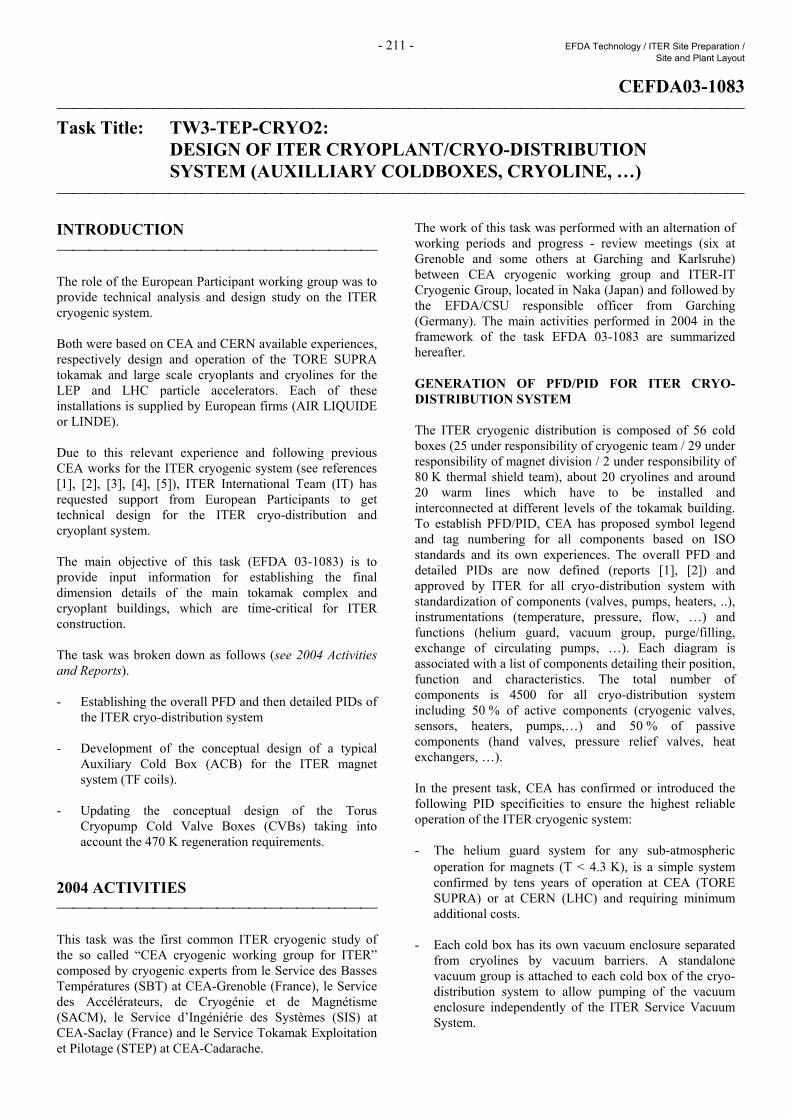
- 211 - EFDA Technology / ITER Site Preparation / Site and Plant Layout
CEFDA03-1083 Task Title: TW3-TEP-CRYO2:
DESIGN OF ITER CRYOPLANT/CRYO-DISTRIBUTION SYSTEM (AUXILLIARY COLDBOXES, CRYOLINE, …)
INTRODUCTION The role of the European Participant working group was to provide technical analysis and design study on the ITER cryogenic system. Both were based on CEA and CERN available experiences, respectively design and operation of the TORE SUPRA tokamak and large scale cryoplants and cryolines for the LEP and LHC particle accelerators. Each of these installations is supplied by European firms (AIR LIQUIDE or LINDE). Due to this relevant experience and following previous CEA works for the ITER cryogenic system (see references [1], [2], [3], [4], [5]), ITER International Team (IT) has requested support from European Participants to get technical design for the ITER cryo-distribution and cryoplant system. The main objective of this task (EFDA 03-1083) is to provide input information for establishing the final dimension details of the main tokamak complex and cryoplant buildings, which are time-critical for ITER construction. The task was broken down as follows (see 2004 Activities and Reports). - Establishing the overall PFD and then detailed PIDs of
the ITER cryo-distribution system - Development of the conceptual design of a typical
Auxiliary Cold Box (ACB) for the ITER magnet system (TF coils).
- Updating the conceptual design of the Torus
Cryopump Cold Valve Boxes (CVBs) taking into account the 470 K regeneration requirements.
2004 ACTIVITIES This task was the first common ITER cryogenic study of the so called “CEA cryogenic working group for ITER” composed by cryogenic experts from le Service des Basses Températures (SBT) at CEA-Grenoble (France), le Service des Accélérateurs, de Cryogénie et de Magnétisme (SACM), le Service d’Ingéniérie des Systèmes (SIS) at CEA-Saclay (France) and le Service Tokamak Exploitation et Pilotage (STEP) at CEA-Cadarache.
The work of this task was performed with an alternation of working periods and progress - review meetings (six at Grenoble and some others at Garching and Karlsruhe) between CEA cryogenic working group and ITER-IT Cryogenic Group, located in Naka (Japan) and followed by the EFDA/CSU responsible officer from Garching (Germany). The main activities performed in 2004 in the framework of the task EFDA 03-1083 are summarized hereafter. GENERATION OF PFD/PID FOR ITER CRYO-DISTRIBUTION SYSTEM The ITER cryogenic distribution is composed of 56 cold boxes (25 under responsibility of cryogenic team / 29 under responsibility of magnet division / 2 under responsibility of 80 K thermal shield team), about 20 cryolines and around 20 warm lines which have to be installed and interconnected at different levels of the tokamak building. To establish PFD/PID, CEA has proposed symbol legend and tag numbering for all components based on ISO standards and its own experiences. The overall PFD and detailed PIDs are now defined (reports [1], [2]) and approved by ITER for all cryo-distribution system with standardization of components (valves, pumps, heaters, ..), instrumentations (temperature, pressure, flow, …) and functions (helium guard, vacuum group, purge/filling, exchange of circulating pumps, …). Each diagram is associated with a list of components detailing their position, function and characteristics. The total number of components is 4500 for all cryo-distribution system including 50 % of active components (cryogenic valves, sensors, heaters, pumps,…) and 50 % of passive components (hand valves, pressure relief valves, heat exchangers, …). In the present task, CEA has confirmed or introduced the following PID specificities to ensure the highest reliable operation of the ITER cryogenic system: - The helium guard system for any sub-atmospheric
operation for magnets (T < 4.3 K), is a simple system confirmed by tens years of operation at CEA (TORE SUPRA) or at CERN (LHC) and requiring minimum additional costs.
- Each cold box has its own vacuum enclosure separated
from cryolines by vacuum barriers. A standalone vacuum group is attached to each cold box of the cryo-distribution system to allow pumping of the vacuum enclosure independently of the ITER Service Vacuum System.
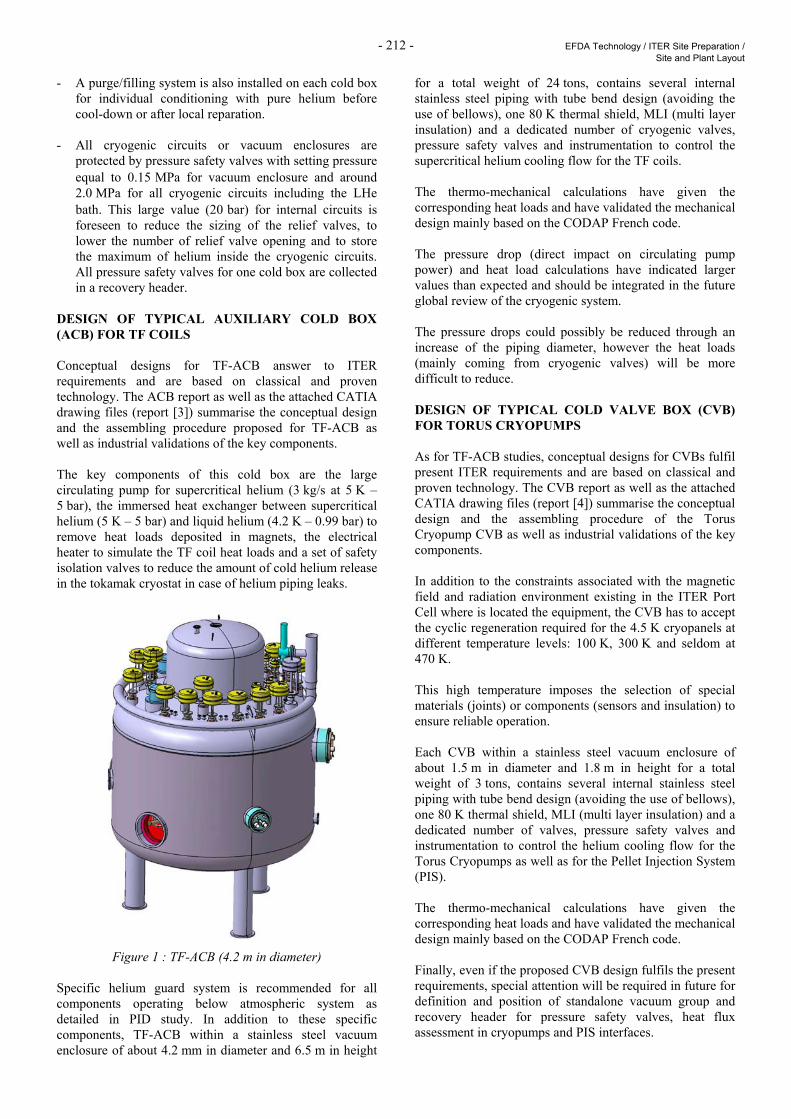
- 212 - EFDA Technology / ITER Site Preparation / Site and Plant Layout
- A purge/filling system is also installed on each cold box for individual conditioning with pure helium before cool-down or after local reparation.
- All cryogenic circuits or vacuum enclosures are
protected by pressure safety valves with setting pressure equal to 0.15 MPa for vacuum enclosure and around 2.0 MPa for all cryogenic circuits including the LHe bath. This large value (20 bar) for internal circuits is foreseen to reduce the sizing of the relief valves, to lower the number of relief valve opening and to store the maximum of helium inside the cryogenic circuits. All pressure safety valves for one cold box are collected in a recovery header.
DESIGN OF TYPICAL AUXILIARY COLD BOX (ACB) FOR TF COILS Conceptual designs for TF-ACB answer to ITER requirements and are based on classical and proven technology. The ACB report as well as the attached CATIA drawing files (report [3]) summarise the conceptual design and the assembling procedure proposed for TF-ACB as well as industrial validations of the key components. The key components of this cold box are the large circulating pump for supercritical helium (3 kg/s at 5 K – 5 bar), the immersed heat exchanger between supercritical helium (5 K – 5 bar) and liquid helium (4.2 K – 0.99 bar) to remove heat loads deposited in magnets, the electrical heater to simulate the TF coil heat loads and a set of safety isolation valves to reduce the amount of cold helium release in the tokamak cryostat in case of helium piping leaks.
Figure 1 : TF-ACB (4.2 m in diameter) Specific helium guard system is recommended for all components operating below atmospheric system as detailed in PID study. In addition to these specific components, TF-ACB within a stainless steel vacuum enclosure of about 4.2 mm in diameter and 6.5 m in height
for a total weight of 24 tons, contains several internal stainless steel piping with tube bend design (avoiding the use of bellows), one 80 K thermal shield, MLI (multi layer insulation) and a dedicated number of cryogenic valves, pressure safety valves and instrumentation to control the supercritical helium cooling flow for the TF coils. The thermo-mechanical calculations have given the corresponding heat loads and have validated the mechanical design mainly based on the CODAP French code. The pressure drop (direct impact on circulating pump power) and heat load calculations have indicated larger values than expected and should be integrated in the future global review of the cryogenic system. The pressure drops could possibly be reduced through an increase of the piping diameter, however the heat loads (mainly coming from cryogenic valves) will be more difficult to reduce. DESIGN OF TYPICAL COLD VALVE BOX (CVB) FOR TORUS CRYOPUMPS As for TF-ACB studies, conceptual designs for CVBs fulfil present ITER requirements and are based on classical and proven technology. The CVB report as well as the attached CATIA drawing files (report [4]) summarise the conceptual design and the assembling procedure of the Torus Cryopump CVB as well as industrial validations of the key components. In addition to the constraints associated with the magnetic field and radiation environment existing in the ITER Port Cell where is located the equipment, the CVB has to accept the cyclic regeneration required for the 4.5 K cryopanels at different temperature levels: 100 K, 300 K and seldom at 470 K. This high temperature imposes the selection of special materials (joints) or components (sensors and insulation) to ensure reliable operation. Each CVB within a stainless steel vacuum enclosure of about 1.5 m in diameter and 1.8 m in height for a total weight of 3 tons, contains several internal stainless steel piping with tube bend design (avoiding the use of bellows), one 80 K thermal shield, MLI (multi layer insulation) and a dedicated number of valves, pressure safety valves and instrumentation to control the helium cooling flow for the Torus Cryopumps as well as for the Pellet Injection System (PIS). The thermo-mechanical calculations have given the corresponding heat loads and have validated the mechanical design mainly based on the CODAP French code. Finally, even if the proposed CVB design fulfils the present requirements, special attention will be required in future for definition and position of standalone vacuum group and recovery header for pressure safety valves, heat flux assessment in cryopumps and PIS interfaces.
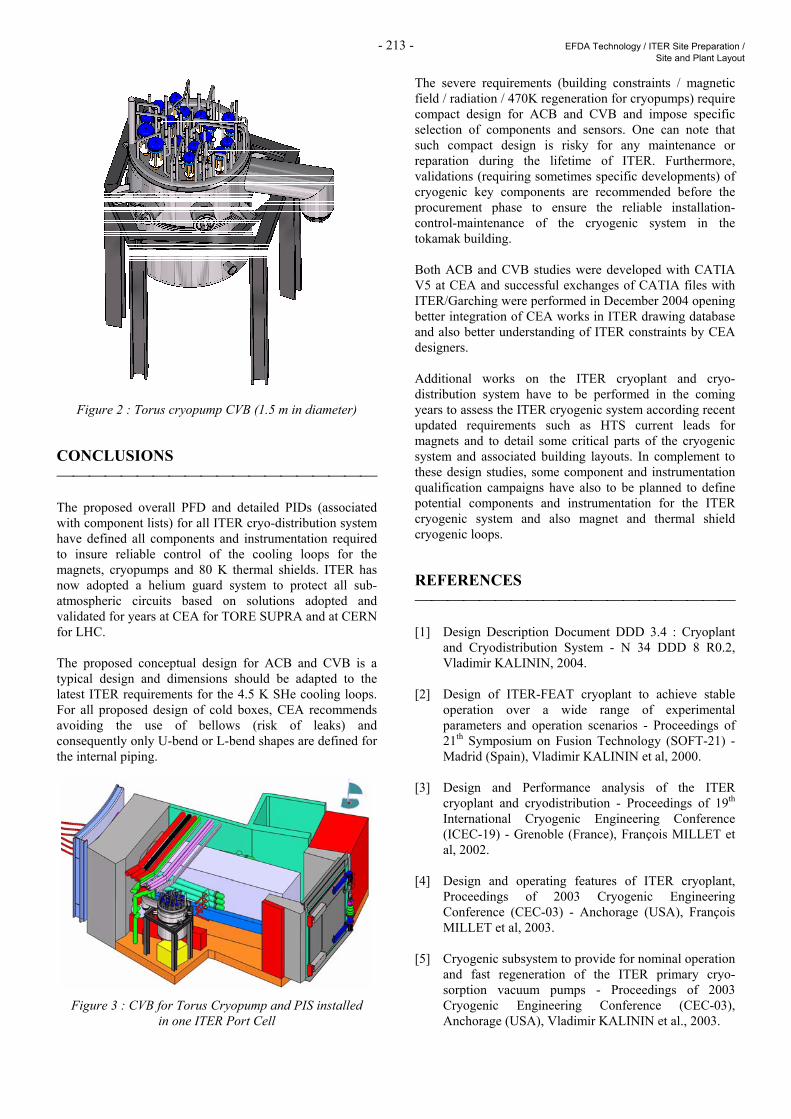
- 213 - EFDA Technology / ITER Site Preparation / Site and Plant Layout
Figure 2 : Torus cryopump CVB (1.5 m in diameter) CONCLUSIONS The proposed overall PFD and detailed PIDs (associated with component lists) for all ITER cryo-distribution system have defined all components and instrumentation required to insure reliable control of the cooling loops for the magnets, cryopumps and 80 K thermal shields. ITER has now adopted a helium guard system to protect all sub-atmospheric circuits based on solutions adopted and validated for years at CEA for TORE SUPRA and at CERN for LHC. The proposed conceptual design for ACB and CVB is a typical design and dimensions should be adapted to the latest ITER requirements for the 4.5 K SHe cooling loops. For all proposed design of cold boxes, CEA recommends avoiding the use of bellows (risk of leaks) and consequently only U-bend or L-bend shapes are defined for the internal piping.
Figure 3 : CVB for Torus Cryopump and PIS installed in one ITER Port Cell
The severe requirements (building constraints / magnetic field / radiation / 470K regeneration for cryopumps) require compact design for ACB and CVB and impose specific selection of components and sensors. One can note that such compact design is risky for any maintenance or reparation during the lifetime of ITER. Furthermore, validations (requiring sometimes specific developments) of cryogenic key components are recommended before the procurement phase to ensure the reliable installation-control-maintenance of the cryogenic system in the tokamak building. Both ACB and CVB studies were developed with CATIA V5 at CEA and successful exchanges of CATIA files with ITER/Garching were performed in December 2004 opening better integration of CEA works in ITER drawing database and also better understanding of ITER constraints by CEA designers. Additional works on the ITER cryoplant and cryo-distribution system have to be performed in the coming years to assess the ITER cryogenic system according recent updated requirements such as HTS current leads for magnets and to detail some critical parts of the cryogenic system and associated building layouts. In complement to these design studies, some component and instrumentation qualification campaigns have also to be planned to define potential components and instrumentation for the ITER cryogenic system and also magnet and thermal shield cryogenic loops. REFERENCES [1] Design Description Document DDD 3.4 : Cryoplant
and Cryodistribution System - N 34 DDD 8 R0.2, Vladimir KALININ, 2004.
[2] Design of ITER-FEAT cryoplant to achieve stable
operation over a wide range of experimental parameters and operation scenarios - Proceedings of 21th Symposium on Fusion Technology (SOFT-21) - Madrid (Spain), Vladimir KALININ et al, 2000.
[3] Design and Performance analysis of the ITER
cryoplant and cryodistribution - Proceedings of 19th International Cryogenic Engineering Conference (ICEC-19) - Grenoble (France), François MILLET et al, 2002.
[4] Design and operating features of ITER cryoplant,
Proceedings of 2003 Cryogenic Engineering Conference (CEC-03) - Anchorage (USA), François MILLET et al, 2003.
[5] Cryogenic subsystem to provide for nominal operation
and fast regeneration of the ITER primary cryo-sorption vacuum pumps - Proceedings of 2003 Cryogenic Engineering Conference (CEC-03), Anchorage (USA), Vladimir KALININ et al., 2003.
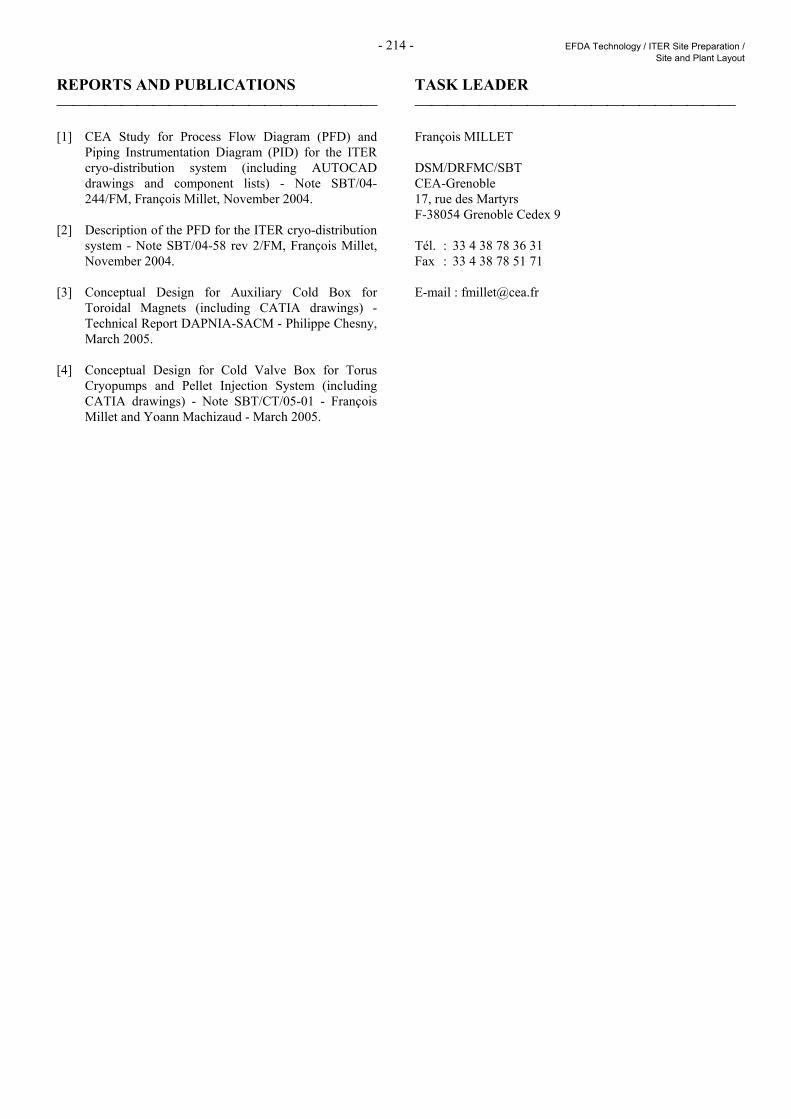
- 214 - EFDA Technology / ITER Site Preparation / Site and Plant Layout
REPORTS AND PUBLICATIONS [1] CEA Study for Process Flow Diagram (PFD) and
Piping Instrumentation Diagram (PID) for the ITER cryo-distribution system (including AUTOCAD drawings and component lists) - Note SBT/04-244/FM, François Millet, November 2004.
[2] Description of the PFD for the ITER cryo-distribution
system - Note SBT/04-58 rev 2/FM, François Millet, November 2004.
[3] Conceptual Design for Auxiliary Cold Box for
Toroidal Magnets (including CATIA drawings) - Technical Report DAPNIA-SACM - Philippe Chesny, March 2005.
[4] Conceptual Design for Cold Valve Box for Torus
Cryopumps and Pellet Injection System (including CATIA drawings) - Note SBT/CT/05-01 - François Millet and Yoann Machizaud - March 2005.
TASK LEADER François MILLET DSM/DRFMC/SBT CEA-Grenoble 17, rue des Martyrs F-38054 Grenoble Cedex 9 Tél. : 33 4 38 78 36 31 Fax : 33 4 38 78 51 71 E-mail : [email protected]
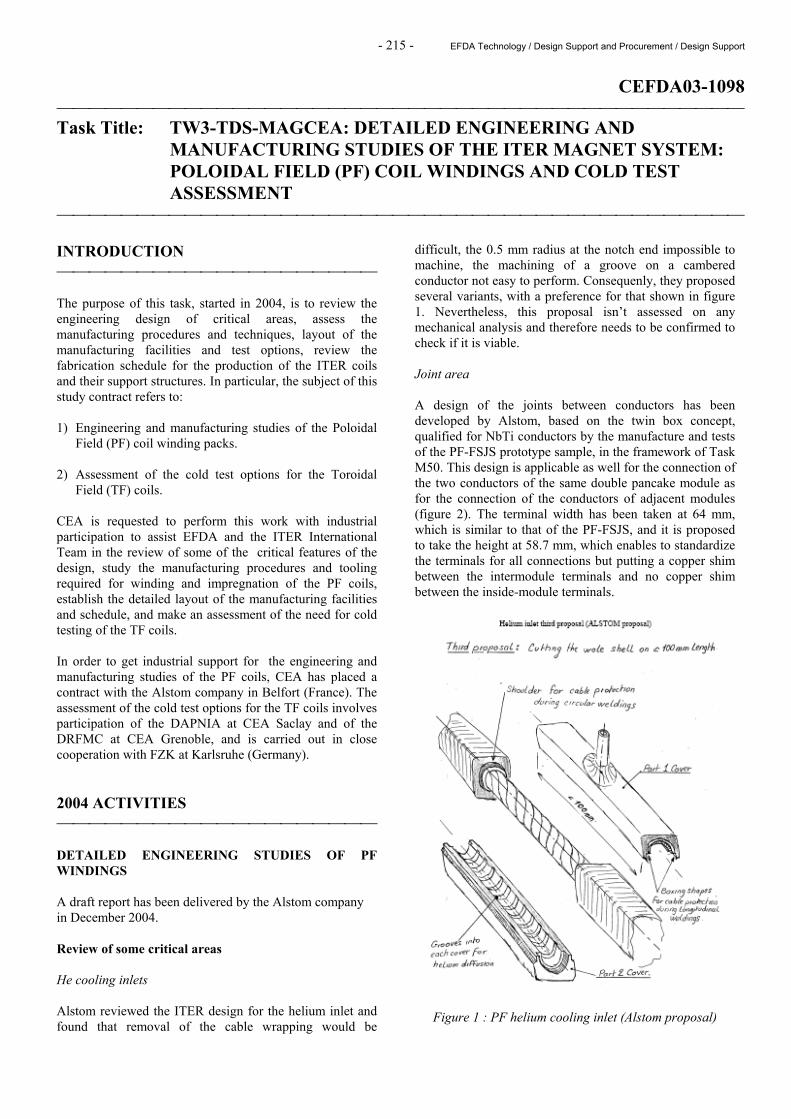
- 215 - EFDA Technology / Design Support and Procurement / Design Support
CEFDA03-1098 Task Title: TW3-TDS-MAGCEA: DETAILED ENGINEERING AND
MANUFACTURING STUDIES OF THE ITER MAGNET SYSTEM: POLOIDAL FIELD (PF) COIL WINDINGS AND COLD TEST ASSESSMENT
INTRODUCTION The purpose of this task, started in 2004, is to review the engineering design of critical areas, assess the manufacturing procedures and techniques, layout of the manufacturing facilities and test options, review the fabrication schedule for the production of the ITER coils and their support structures. In particular, the subject of this study contract refers to: 1) Engineering and manufacturing studies of the Poloidal
Field (PF) coil winding packs. 2) Assessment of the cold test options for the Toroidal
Field (TF) coils. CEA is requested to perform this work with industrial participation to assist EFDA and the ITER International Team in the review of some of the critical features of the design, study the manufacturing procedures and tooling required for winding and impregnation of the PF coils, establish the detailed layout of the manufacturing facilities and schedule, and make an assessment of the need for cold testing of the TF coils. In order to get industrial support for the engineering and manufacturing studies of the PF coils, CEA has placed a contract with the Alstom company in Belfort (France). The assessment of the cold test options for the TF coils involves participation of the DAPNIA at CEA Saclay and of the DRFMC at CEA Grenoble, and is carried out in close cooperation with FZK at Karlsruhe (Germany). 2004 ACTIVITIES DETAILED ENGINEERING STUDIES OF PF WINDINGS A draft report has been delivered by the Alstom company in December 2004. Review of some critical areas He cooling inlets Alstom reviewed the ITER design for the helium inlet and found that removal of the cable wrapping would be
difficult, the 0.5 mm radius at the notch end impossible to machine, the machining of a groove on a cambered conductor not easy to perform. Consequenly, they proposed several variants, with a preference for that shown in figure 1. Nevertheless, this proposal isn’t assessed on any mechanical analysis and therefore needs to be confirmed to check if it is viable. Joint area A design of the joints between conductors has been developed by Alstom, based on the twin box concept, qualified for NbTi conductors by the manufacture and tests of the PF-FSJS prototype sample, in the framework of Task M50. This design is applicable as well for the connection of the two conductors of the same double pancake module as for the connection of the conductors of adjacent modules (figure 2). The terminal width has been taken at 64 mm, which is similar to that of the PF-FSJS, and it is proposed to take the height at 58.7 mm, which enables to standardize the terminals for all connections but putting a copper shim between the intermodule terminals and no copper shim between the inside-module terminals.
Figure 1 : PF helium cooling inlet (Alstom proposal)
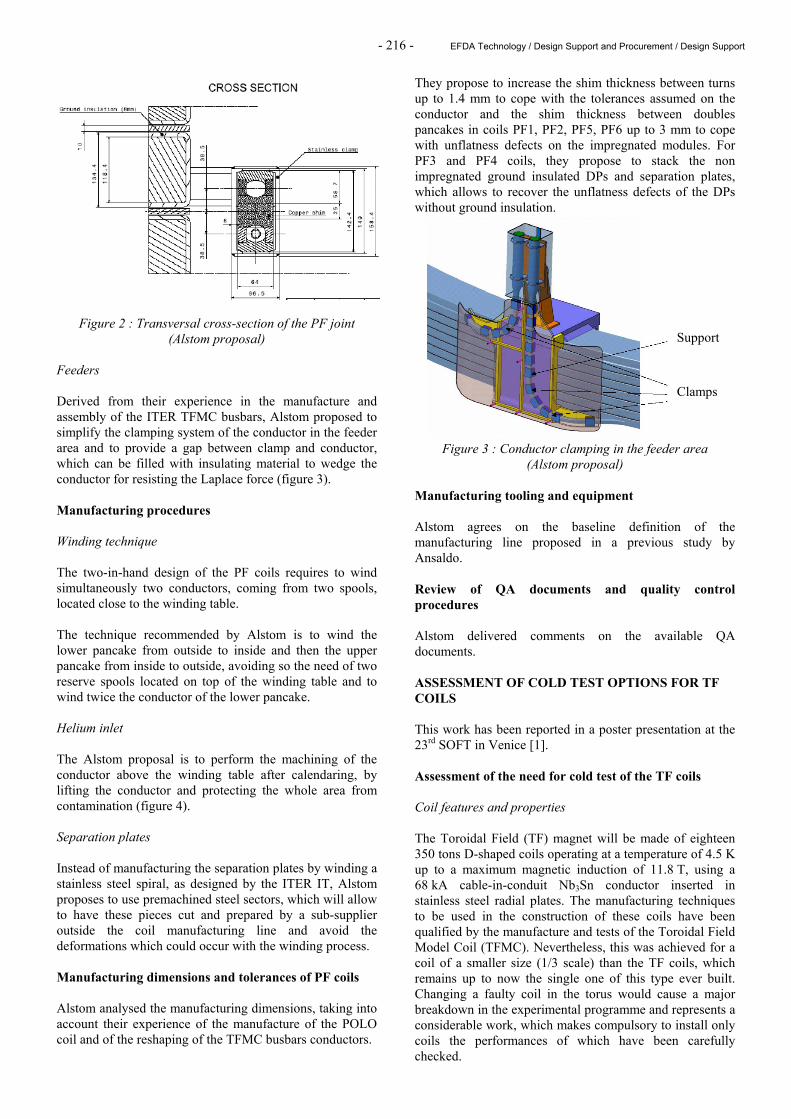
- 216 - EFDA Technology / Design Support and Procurement / Design Support
Figure 2 : Transversal cross-section of the PF joint (Alstom proposal)
Feeders Derived from their experience in the manufacture and assembly of the ITER TFMC busbars, Alstom proposed to simplify the clamping system of the conductor in the feeder area and to provide a gap between clamp and conductor, which can be filled with insulating material to wedge the conductor for resisting the Laplace force (figure 3). Manufacturing procedures Winding technique The two-in-hand design of the PF coils requires to wind simultaneously two conductors, coming from two spools, located close to the winding table. The technique recommended by Alstom is to wind the lower pancake from outside to inside and then the upper pancake from inside to outside, avoiding so the need of two reserve spools located on top of the winding table and to wind twice the conductor of the lower pancake. Helium inlet The Alstom proposal is to perform the machining of the conductor above the winding table after calendaring, by lifting the conductor and protecting the whole area from contamination (figure 4). Separation plates Instead of manufacturing the separation plates by winding a stainless steel spiral, as designed by the ITER IT, Alstom proposes to use premachined steel sectors, which will allow to have these pieces cut and prepared by a sub-supplier outside the coil manufacturing line and avoid the deformations which could occur with the winding process. Manufacturing dimensions and tolerances of PF coils Alstom analysed the manufacturing dimensions, taking into account their experience of the manufacture of the POLO coil and of the reshaping of the TFMC busbars conductors.
They propose to increase the shim thickness between turns up to 1.4 mm to cope with the tolerances assumed on the conductor and the shim thickness between doubles pancakes in coils PF1, PF2, PF5, PF6 up to 3 mm to cope with unflatness defects on the impregnated modules. For PF3 and PF4 coils, they propose to stack the non impregnated ground insulated DPs and separation plates, which allows to recover the unflatness defects of the DPs without ground insulation.
Figure 3 : Conductor clamping in the feeder area (Alstom proposal)
Manufacturing tooling and equipment Alstom agrees on the baseline definition of the manufacturing line proposed in a previous study by Ansaldo. Review of QA documents and quality control procedures Alstom delivered comments on the available QA documents. ASSESSMENT OF COLD TEST OPTIONS FOR TF COILS This work has been reported in a poster presentation at the 23rd SOFT in Venice [1]. Assessment of the need for cold test of the TF coils Coil features and properties The Toroidal Field (TF) magnet will be made of eighteen 350 tons D-shaped coils operating at a temperature of 4.5 K up to a maximum magnetic induction of 11.8 T, using a 68 kA cable-in-conduit Nb3Sn conductor inserted in stainless steel radial plates. The manufacturing techniques to be used in the construction of these coils have been qualified by the manufacture and tests of the Toroidal Field Model Coil (TFMC). Nevertheless, this was achieved for a coil of a smaller size (1/3 scale) than the TF coils, which remains up to now the single one of this type ever built. Changing a faulty coil in the torus would cause a major breakdown in the experimental programme and represents a considerable work, which makes compulsory to install only coils the performances of which have been carefully checked.
Clamps
Support
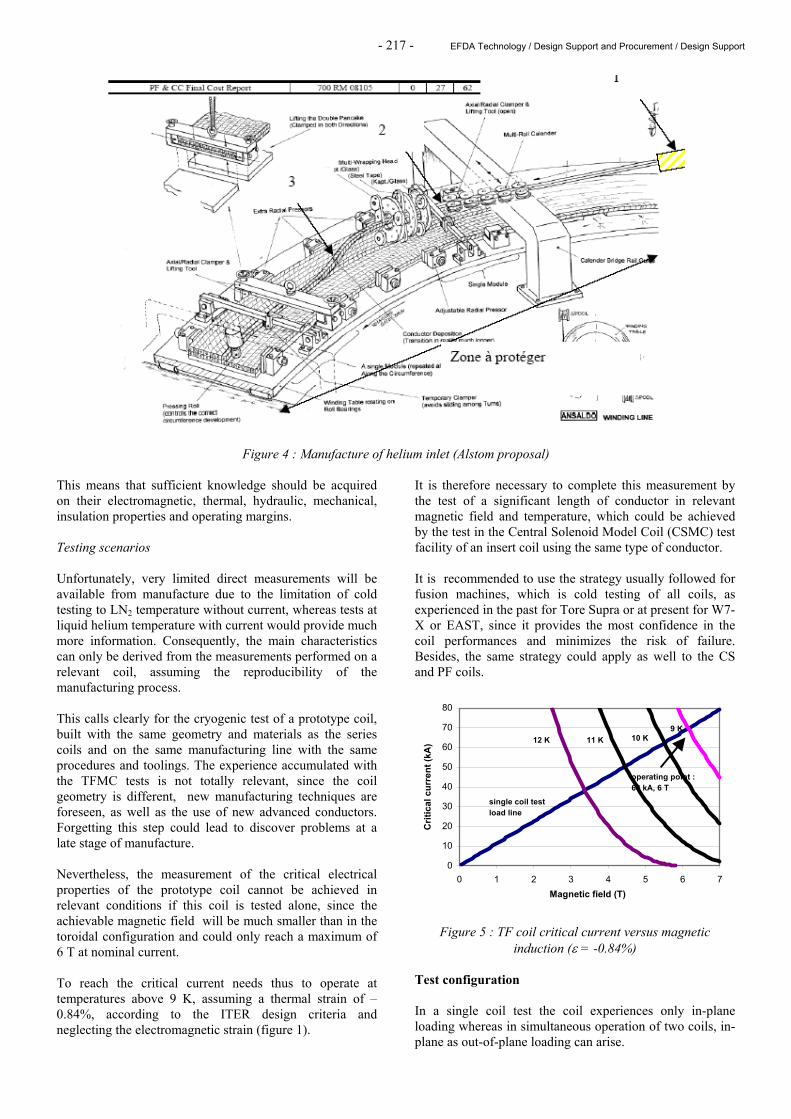
- 217 - EFDA Technology / Design Support and Procurement / Design Support
Figure 4 : Manufacture of helium inlet (Alstom proposal) This means that sufficient knowledge should be acquired on their electromagnetic, thermal, hydraulic, mechanical, insulation properties and operating margins. Testing scenarios Unfortunately, very limited direct measurements will be available from manufacture due to the limitation of cold testing to LN2 temperature without current, whereas tests at liquid helium temperature with current would provide much more information. Consequently, the main characteristics can only be derived from the measurements performed on a relevant coil, assuming the reproducibility of the manufacturing process. This calls clearly for the cryogenic test of a prototype coil, built with the same geometry and materials as the series coils and on the same manufacturing line with the same procedures and toolings. The experience accumulated with the TFMC tests is not totally relevant, since the coil geometry is different, new manufacturing techniques are foreseen, as well as the use of new advanced conductors. Forgetting this step could lead to discover problems at a late stage of manufacture. Nevertheless, the measurement of the critical electrical properties of the prototype coil cannot be achieved in relevant conditions if this coil is tested alone, since the achievable magnetic field will be much smaller than in the toroidal configuration and could only reach a maximum of 6 T at nominal current. To reach the critical current needs thus to operate at temperatures above 9 K, assuming a thermal strain of –0.84%, according to the ITER design criteria and neglecting the electromagnetic strain (figure 1).
It is therefore necessary to complete this measurement by the test of a significant length of conductor in relevant magnetic field and temperature, which could be achieved by the test in the Central Solenoid Model Coil (CSMC) test facility of an insert coil using the same type of conductor. It is recommended to use the strategy usually followed for fusion machines, which is cold testing of all coils, as experienced in the past for Tore Supra or at present for W7-X or EAST, since it provides the most confidence in the coil performances and minimizes the risk of failure. Besides, the same strategy could apply as well to the CS and PF coils.
0
10
20
30
40
50
60
70
80
0 1 2 3 4 5 6 7Magnetic field (T)
Crit
ical
cur
rent
(kA
) 12 K 11 K 10 K9 K
single coil test load line
operating point :68 kA, 6 T
Figure 5 : TF coil critical current versus magnetic
induction (ε = -0.84%) Test configuration In a single coil test the coil experiences only in-plane loading whereas in simultaneous operation of two coils, in-plane as out-of-plane loading can arise.
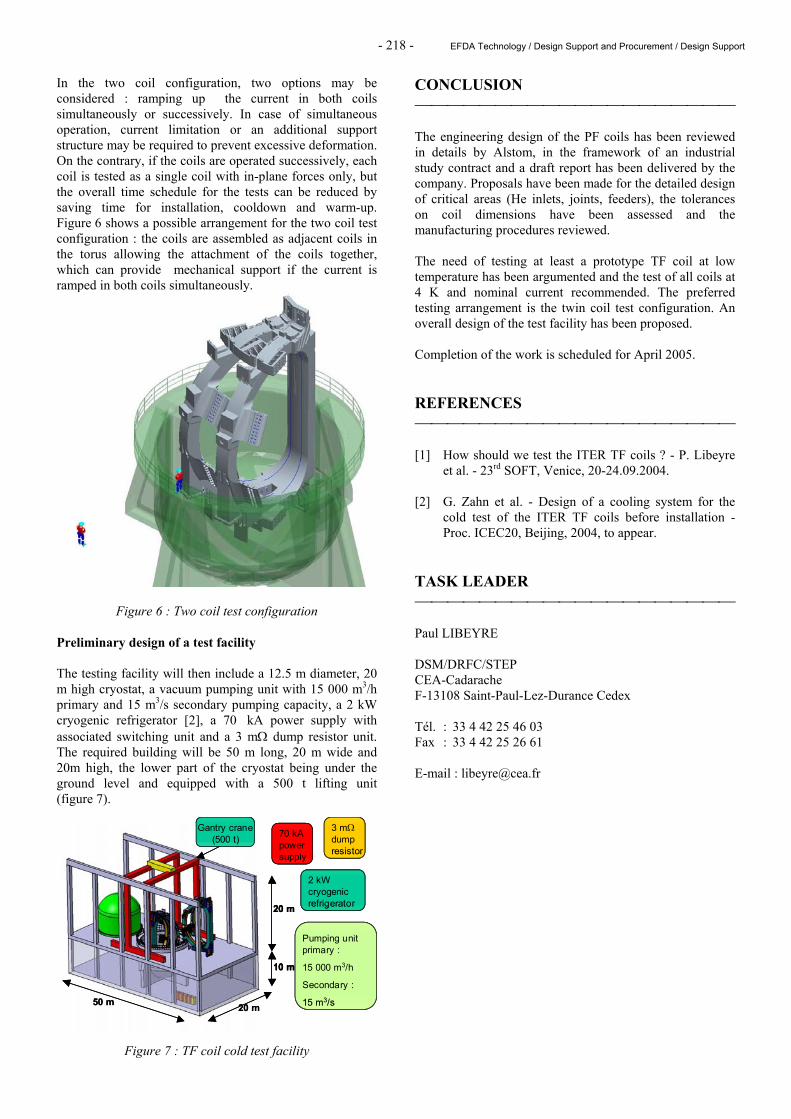
- 218 - EFDA Technology / Design Support and Procurement / Design Support
In the two coil configuration, two options may be considered : ramping up the current in both coils simultaneously or successively. In case of simultaneous operation, current limitation or an additional support structure may be required to prevent excessive deformation. On the contrary, if the coils are operated successively, each coil is tested as a single coil with in-plane forces only, but the overall time schedule for the tests can be reduced by saving time for installation, cooldown and warm-up. Figure 6 shows a possible arrangement for the two coil test configuration : the coils are assembled as adjacent coils in the torus allowing the attachment of the coils together, which can provide mechanical support if the current is ramped in both coils simultaneously.
Figure 6 : Two coil test configuration Preliminary design of a test facility The testing facility will then include a 12.5 m diameter, 20 m high cryostat, a vacuum pumping unit with 15 000 m3/h primary and 15 m3/s secondary pumping capacity, a 2 kW cryogenic refrigerator [2], a 70 kA power supply with associated switching unit and a 3 mΩ dump resistor unit. The required building will be 50 m long, 20 m wide and 20m high, the lower part of the cryostat being under the ground level and equipped with a 500 t lifting unit (figure 7).
Figure 7 : TF coil cold test facility
CONCLUSION The engineering design of the PF coils has been reviewed in details by Alstom, in the framework of an industrial study contract and a draft report has been delivered by the company. Proposals have been made for the detailed design of critical areas (He inlets, joints, feeders), the tolerances on coil dimensions have been assessed and the manufacturing procedures reviewed. The need of testing at least a prototype TF coil at low temperature has been argumented and the test of all coils at 4 K and nominal current recommended. The preferred testing arrangement is the twin coil test configuration. An overall design of the test facility has been proposed. Completion of the work is scheduled for April 2005. REFERENCES [1] How should we test the ITER TF coils ? - P. Libeyre
et al. - 23rd SOFT, Venice, 20-24.09.2004. [2] G. Zahn et al. - Design of a cooling system for the
cold test of the ITER TF coils before installation - Proc. ICEC20, Beijing, 2004, to appear.
TASK LEADER Paul LIBEYRE DSM/DRFC/STEP CEA-Cadarache F-13108 Saint-Paul-Lez-Durance Cedex Tél. : 33 4 42 25 46 03 Fax : 33 4 42 25 26 61 E-mail : [email protected] 20 m
10 m
20 m50 m
Gantry crane (500 t) 70 kA
power supply
3 mΩdump resistor
Pumping unit primary :
15 000 m3/h
Secondary :
15 m3/s
2 kW cryogenic refrigerator20 m
10 m
20 m50 m
Gantry crane (500 t) 70 kA
power supply
3 mΩdump resistor
Pumping unit primary :
15 000 m3/h
Secondary :
15 m3/s
2 kW cryogenic refrigerator20 m
10 m
20 m50 m
Gantry crane (500 t) 70 kA
power supply
3 mΩdump resistor
Pumping unit primary :
15 000 m3/h
Secondary :
15 m3/s
2 kW cryogenic refrigerator
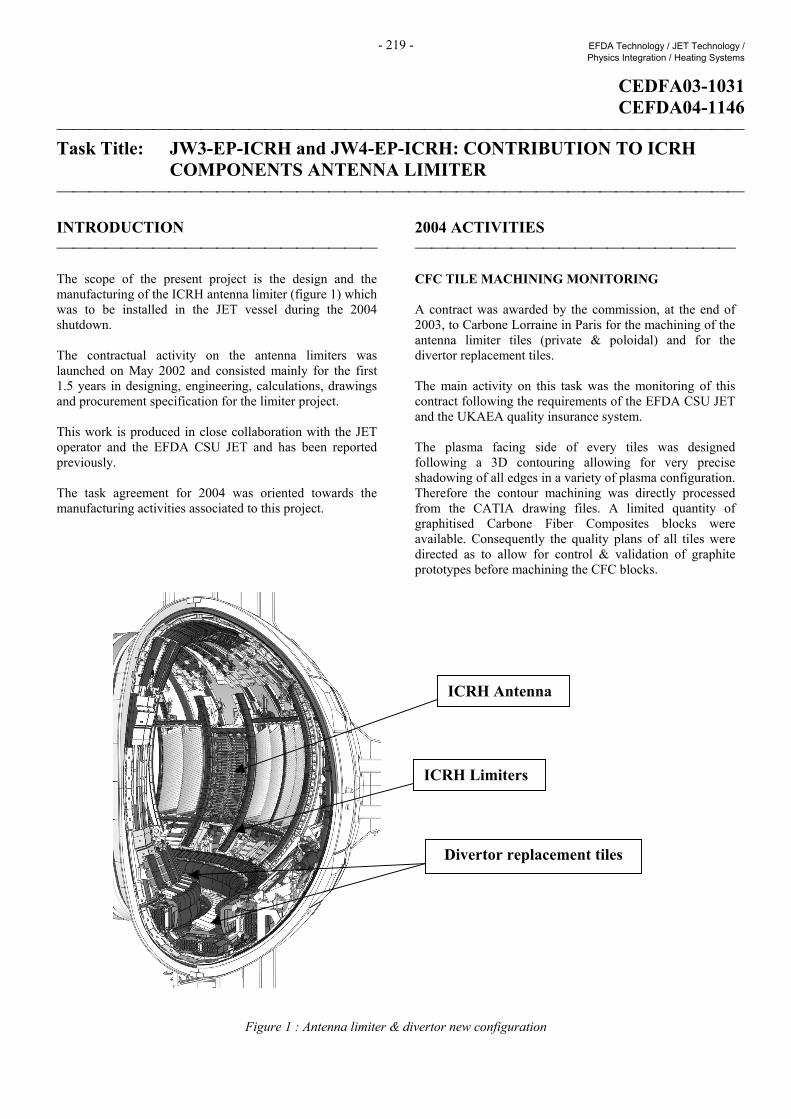
- 219 - EFDA Technology / JET Technology / Physics Integration / Heating Systems
CEDFA03-1031 CEFDA04-1146
Task Title: JW3-EP-ICRH and JW4-EP-ICRH: CONTRIBUTION TO ICRH
COMPONENTS ANTENNA LIMITER INTRODUCTION The scope of the present project is the design and the manufacturing of the ICRH antenna limiter (figure 1) which was to be installed in the JET vessel during the 2004 shutdown. The contractual activity on the antenna limiters was launched on May 2002 and consisted mainly for the first 1.5 years in designing, engineering, calculations, drawings and procurement specification for the limiter project. This work is produced in close collaboration with the JET operator and the EFDA CSU JET and has been reported previously. The task agreement for 2004 was oriented towards the manufacturing activities associated to this project.
2004 ACTIVITIES CFC TILE MACHINING MONITORING A contract was awarded by the commission, at the end of 2003, to Carbone Lorraine in Paris for the machining of the antenna limiter tiles (private & poloidal) and for the divertor replacement tiles. The main activity on this task was the monitoring of this contract following the requirements of the EFDA CSU JET and the UKAEA quality insurance system. The plasma facing side of every tiles was designed following a 3D contouring allowing for very precise shadowing of all edges in a variety of plasma configuration. Therefore the contour machining was directly processed from the CATIA drawing files. A limited quantity of graphitised Carbone Fiber Composites blocks were available. Consequently the quality plans of all tiles were directed as to allow for control & validation of graphite prototypes before machining the CFC blocks.
Figure 1 : Antenna limiter & divertor new configuration
ICRH Antenna
ICRH Limiters
Divertor replacement tiles
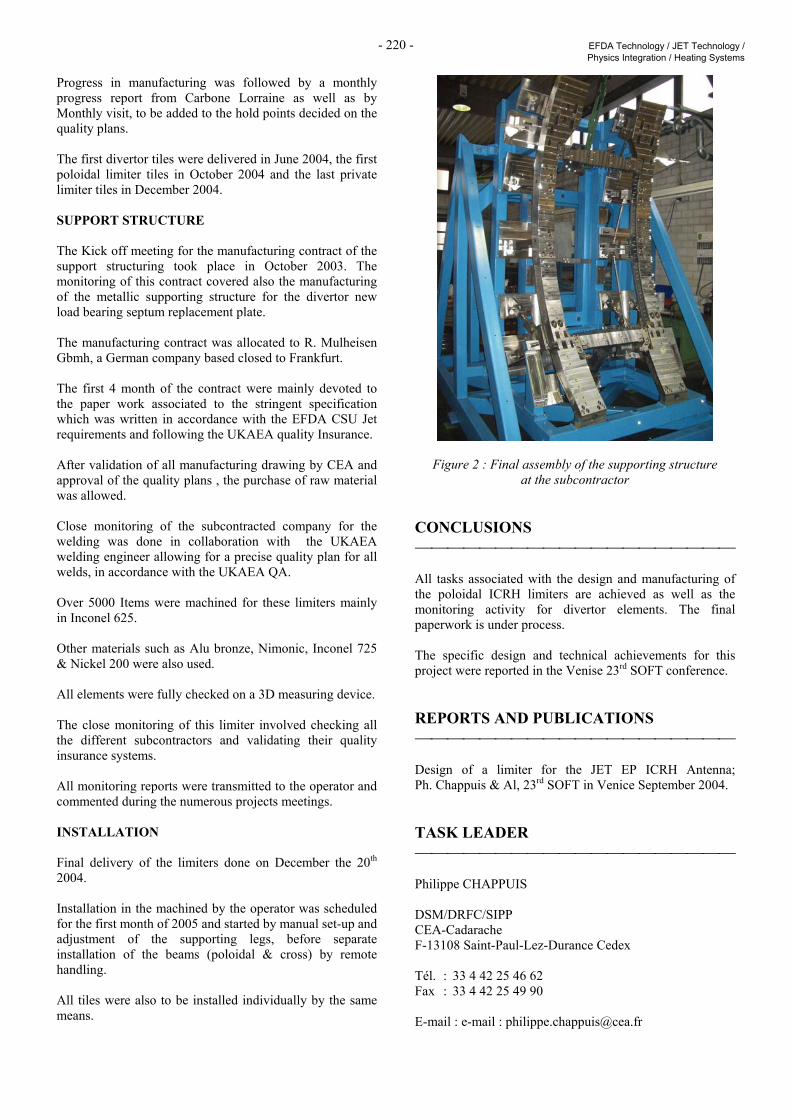
- 220 - EFDA Technology / JET Technology / Physics Integration / Heating Systems
Progress in manufacturing was followed by a monthly progress report from Carbone Lorraine as well as by Monthly visit, to be added to the hold points decided on the quality plans. The first divertor tiles were delivered in June 2004, the first poloidal limiter tiles in October 2004 and the last private limiter tiles in December 2004. SUPPORT STRUCTURE The Kick off meeting for the manufacturing contract of the support structuring took place in October 2003. The monitoring of this contract covered also the manufacturing of the metallic supporting structure for the divertor new load bearing septum replacement plate. The manufacturing contract was allocated to R. Mulheisen Gbmh, a German company based closed to Frankfurt. The first 4 month of the contract were mainly devoted to the paper work associated to the stringent specification which was written in accordance with the EFDA CSU Jet requirements and following the UKAEA quality Insurance. After validation of all manufacturing drawing by CEA and approval of the quality plans , the purchase of raw material was allowed. Close monitoring of the subcontracted company for the welding was done in collaboration with the UKAEA welding engineer allowing for a precise quality plan for all welds, in accordance with the UKAEA QA. Over 5000 Items were machined for these limiters mainly in Inconel 625. Other materials such as Alu bronze, Nimonic, Inconel 725 & Nickel 200 were also used. All elements were fully checked on a 3D measuring device. The close monitoring of this limiter involved checking all the different subcontractors and validating their quality insurance systems. All monitoring reports were transmitted to the operator and commented during the numerous projects meetings. INSTALLATION Final delivery of the limiters done on December the 20th 2004. Installation in the machined by the operator was scheduled for the first month of 2005 and started by manual set-up and adjustment of the supporting legs, before separate installation of the beams (poloidal & cross) by remote handling. All tiles were also to be installed individually by the same means.
Figure 2 : Final assembly of the supporting structure at the subcontractor
CONCLUSIONS All tasks associated with the design and manufacturing of the poloidal ICRH limiters are achieved as well as the monitoring activity for divertor elements. The final paperwork is under process. The specific design and technical achievements for this project were reported in the Venise 23rd SOFT conference. REPORTS AND PUBLICATIONS Design of a limiter for the JET EP ICRH Antenna; Ph. Chappuis & Al, 23rd SOFT in Venice September 2004. TASK LEADER Philippe CHAPPUIS DSM/DRFC/SIPP CEA-Cadarache F-13108 Saint-Paul-Lez-Durance Cedex Tél. : 33 4 42 25 46 62 Fax : 33 4 42 25 49 90 E-mail : e-mail : [email protected]
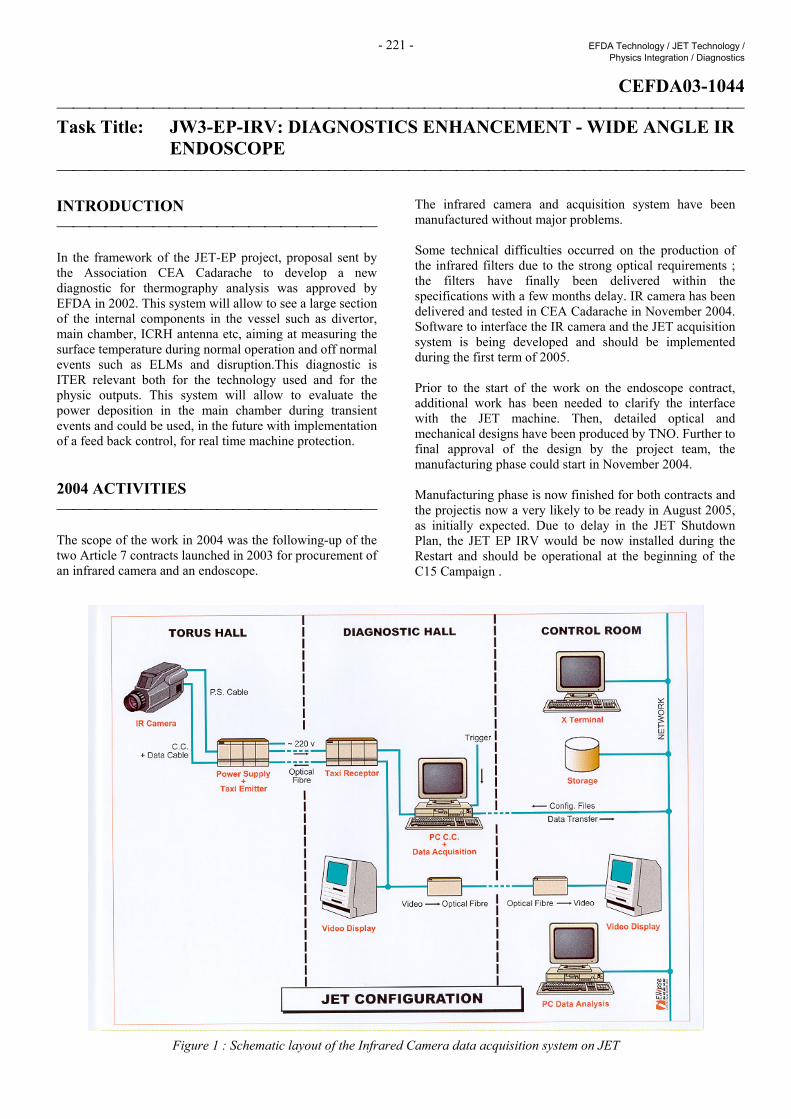
- 221 - EFDA Technology / JET Technology / Physics Integration / Diagnostics
CEFDA03-1044 Task Title: JW3-EP-IRV: DIAGNOSTICS ENHANCEMENT - WIDE ANGLE IR
ENDOSCOPE INTRODUCTION In the framework of the JET-EP project, proposal sent by the Association CEA Cadarache to develop a new diagnostic for thermography analysis was approved by EFDA in 2002. This system will allow to see a large section of the internal components in the vessel such as divertor, main chamber, ICRH antenna etc, aiming at measuring the surface temperature during normal operation and off normal events such as ELMs and disruption.This diagnostic is ITER relevant both for the technology used and for the physic outputs. This system will allow to evaluate the power deposition in the main chamber during transient events and could be used, in the future with implementation of a feed back control, for real time machine protection. 2004 ACTIVITIES The scope of the work in 2004 was the following-up of the two Article 7 contracts launched in 2003 for procurement of an infrared camera and an endoscope.
The infrared camera and acquisition system have been manufactured without major problems. Some technical difficulties occurred on the production of the infrared filters due to the strong optical requirements ; the filters have finally been delivered within the specifications with a few months delay. IR camera has been delivered and tested in CEA Cadarache in November 2004. Software to interface the IR camera and the JET acquisition system is being developed and should be implemented during the first term of 2005. Prior to the start of the work on the endoscope contract, additional work has been needed to clarify the interface with the JET machine. Then, detailed optical and mechanical designs have been produced by TNO. Further to final approval of the design by the project team, the manufacturing phase could start in November 2004. Manufacturing phase is now finished for both contracts and the projectis now a very likely to be ready in August 2005, as initially expected. Due to delay in the JET Shutdown Plan, the JET EP IRV would be now installed during the Restart and should be operational at the beginning of the C15 Campaign .
Figure 1 : Schematic layout of the Infrared Camera data acquisition system on JET
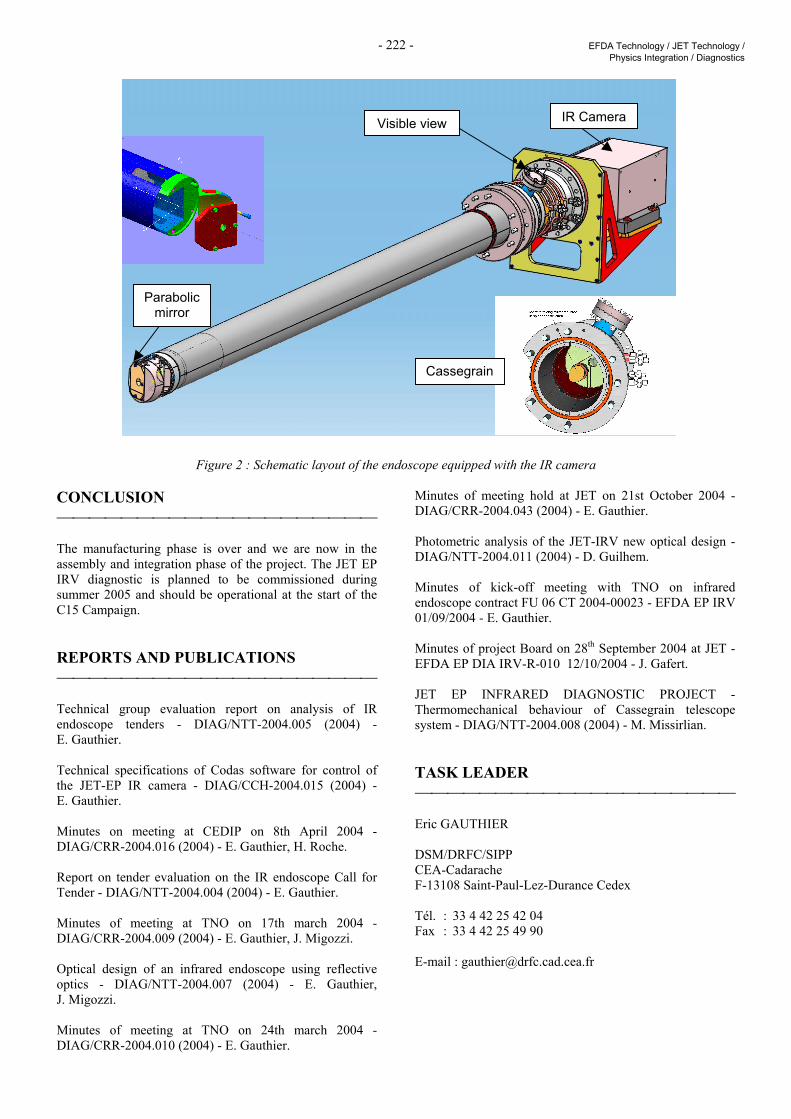
- 222 - EFDA Technology / JET Technology / Physics Integration / Diagnostics
Figure 2 : Schematic layout of the endoscope equipped with the IR camera CONCLUSION The manufacturing phase is over and we are now in the assembly and integration phase of the project. The JET EP IRV diagnostic is planned to be commissioned during summer 2005 and should be operational at the start of the C15 Campaign. REPORTS AND PUBLICATIONS Technical group evaluation report on analysis of IR endoscope tenders - DIAG/NTT-2004.005 (2004) - E. Gauthier. Technical specifications of Codas software for control of the JET-EP IR camera - DIAG/CCH-2004.015 (2004) - E. Gauthier. Minutes on meeting at CEDIP on 8th April 2004 - DIAG/CRR-2004.016 (2004) - E. Gauthier, H. Roche. Report on tender evaluation on the IR endoscope Call for Tender - DIAG/NTT-2004.004 (2004) - E. Gauthier. Minutes of meeting at TNO on 17th march 2004 - DIAG/CRR-2004.009 (2004) - E. Gauthier, J. Migozzi. Optical design of an infrared endoscope using reflective optics - DIAG/NTT-2004.007 (2004) - E. Gauthier, J. Migozzi. Minutes of meeting at TNO on 24th march 2004 - DIAG/CRR-2004.010 (2004) - E. Gauthier.
Minutes of meeting hold at JET on 21st October 2004 - DIAG/CRR-2004.043 (2004) - E. Gauthier. Photometric analysis of the JET-IRV new optical design - DIAG/NTT-2004.011 (2004) - D. Guilhem. Minutes of kick-off meeting with TNO on infrared endoscope contract FU 06 CT 2004-00023 - EFDA EP IRV 01/09/2004 - E. Gauthier. Minutes of project Board on 28th September 2004 at JET - EFDA EP DIA IRV-R-010 12/10/2004 - J. Gafert. JET EP INFRARED DIAGNOSTIC PROJECT - Thermomechanical behaviour of Cassegrain telescope system - DIAG/NTT-2004.008 (2004) - M. Missirlian. TASK LEADER Eric GAUTHIER DSM/DRFC/SIPP CEA-Cadarache F-13108 Saint-Paul-Lez-Durance Cedex Tél. : 33 4 42 25 42 04 Fax : 33 4 42 25 49 90 E-mail : [email protected]
Visible view
Cassegrain
IR Camera
Parabolic mirror
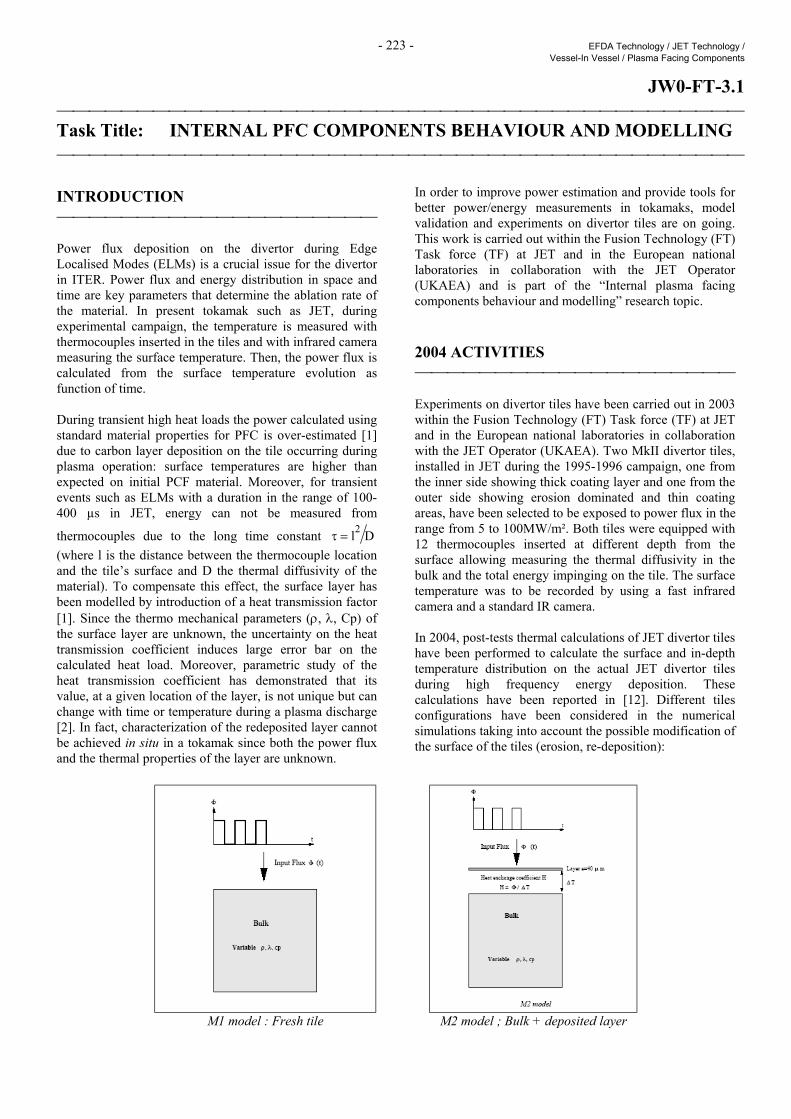
- 223 - EFDA Technology / JET Technology / Vessel-In Vessel / Plasma Facing Components
JW0-FT-3.1 Task Title: INTERNAL PFC COMPONENTS BEHAVIOUR AND MODELLING INTRODUCTION Power flux deposition on the divertor during Edge Localised Modes (ELMs) is a crucial issue for the divertor in ITER. Power flux and energy distribution in space and time are key parameters that determine the ablation rate of the material. In present tokamak such as JET, during experimental campaign, the temperature is measured with thermocouples inserted in the tiles and with infrared camera measuring the surface temperature. Then, the power flux is calculated from the surface temperature evolution as function of time. During transient high heat loads the power calculated using standard material properties for PFC is over-estimated [1] due to carbon layer deposition on the tile occurring during plasma operation: surface temperatures are higher than expected on initial PCF material. Moreover, for transient events such as ELMs with a duration in the range of 100-400 µs in JET, energy can not be measured from
thermocouples due to the long time constant Dl2=τ (where l is the distance between the thermocouple location and the tile’s surface and D the thermal diffusivity of the material). To compensate this effect, the surface layer has been modelled by introduction of a heat transmission factor [1]. Since the thermo mechanical parameters (ρ, λ, Cp) of the surface layer are unknown, the uncertainty on the heat transmission coefficient induces large error bar on the calculated heat load. Moreover, parametric study of the heat transmission coefficient has demonstrated that its value, at a given location of the layer, is not unique but can change with time or temperature during a plasma discharge [2]. In fact, characterization of the redeposited layer cannot be achieved in situ in a tokamak since both the power flux and the thermal properties of the layer are unknown.
In order to improve power estimation and provide tools for better power/energy measurements in tokamaks, model validation and experiments on divertor tiles are on going. This work is carried out within the Fusion Technology (FT) Task force (TF) at JET and in the European national laboratories in collaboration with the JET Operator (UKAEA) and is part of the “Internal plasma facing components behaviour and modelling” research topic. 2004 ACTIVITIES Experiments on divertor tiles have been carried out in 2003 within the Fusion Technology (FT) Task force (TF) at JET and in the European national laboratories in collaboration with the JET Operator (UKAEA). Two MkII divertor tiles, installed in JET during the 1995-1996 campaign, one from the inner side showing thick coating layer and one from the outer side showing erosion dominated and thin coating areas, have been selected to be exposed to power flux in the range from 5 to 100MW/m². Both tiles were equipped with 12 thermocouples inserted at different depth from the surface allowing measuring the thermal diffusivity in the bulk and the total energy impinging on the tile. The surface temperature was to be recorded by using a fast infrared camera and a standard IR camera. In 2004, post-tests thermal calculations of JET divertor tiles have been performed to calculate the surface and in-depth temperature distribution on the actual JET divertor tiles during high frequency energy deposition. These calculations have been reported in [12]. Different tiles configurations have been considered in the numerical simulations taking into account the possible modification of the surface of the tiles (erosion, re-deposition):
M1 model : Fresh tile M2 model ; Bulk + deposited layer
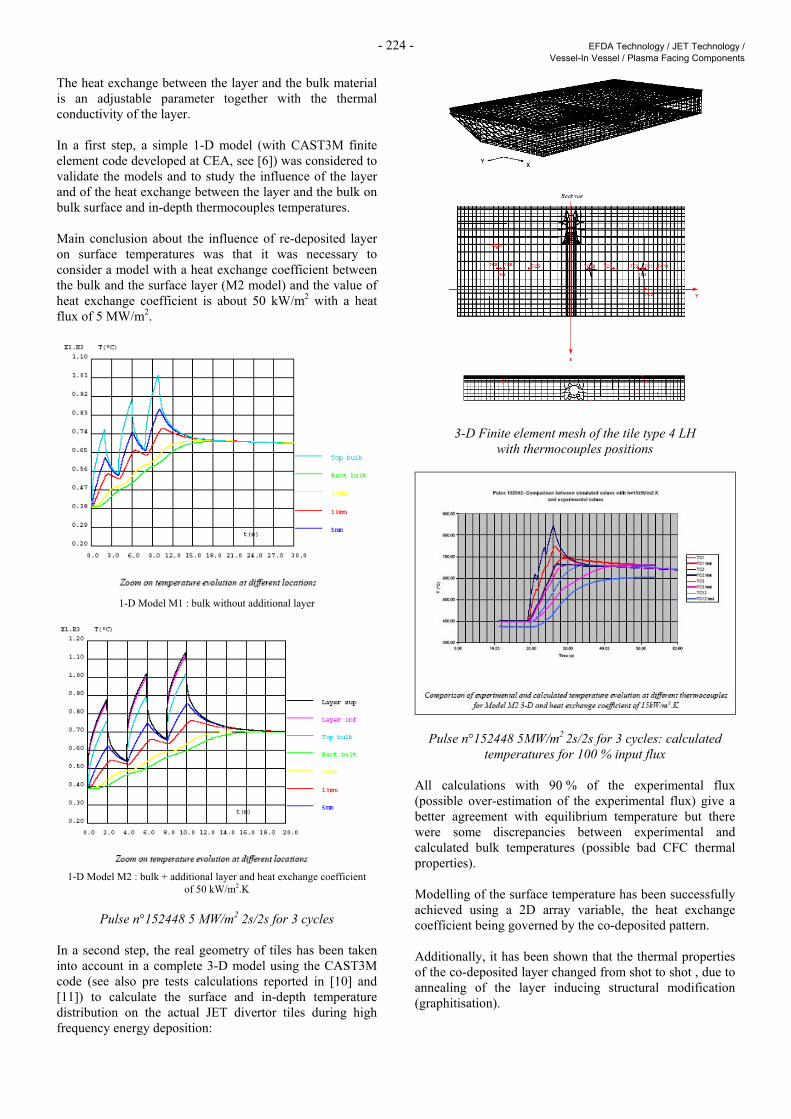
- 224 - EFDA Technology / JET Technology / Vessel-In Vessel / Plasma Facing Components
The heat exchange between the layer and the bulk material is an adjustable parameter together with the thermal conductivity of the layer. In a first step, a simple 1-D model (with CAST3M finite element code developed at CEA, see [6]) was considered to validate the models and to study the influence of the layer and of the heat exchange between the layer and the bulk on bulk surface and in-depth thermocouples temperatures. Main conclusion about the influence of re-deposited layer on surface temperatures was that it was necessary to consider a model with a heat exchange coefficient between the bulk and the surface layer (M2 model) and the value of heat exchange coefficient is about 50 kW/m2 with a heat flux of 5 MW/m2.
1-D Model M1 : bulk without additional layer
1-D Model M2 : bulk + additional layer and heat exchange coefficient
of 50 kW/m2.K
Pulse n°152448 5 MW/m2 2s/2s for 3 cycles In a second step, the real geometry of tiles has been taken into account in a complete 3-D model using the CAST3M code (see also pre tests calculations reported in [10] and [11]) to calculate the surface and in-depth temperature distribution on the actual JET divertor tiles during high frequency energy deposition:
3-D Finite element mesh of the tile type 4 LH with thermocouples positions
Pulse n°152448 5MW/m2 2s/2s for 3 cycles: calculated temperatures for 100 % input flux
All calculations with 90 % of the experimental flux (possible over-estimation of the experimental flux) give a better agreement with equilibrium temperature but there were some discrepancies between experimental and calculated bulk temperatures (possible bad CFC thermal properties). Modelling of the surface temperature has been successfully achieved using a 2D array variable, the heat exchange coefficient being governed by the co-deposited pattern. Additionally, it has been shown that the thermal properties of the co-deposited layer changed from shot to shot , due to annealing of the layer inducing structural modification (graphitisation).
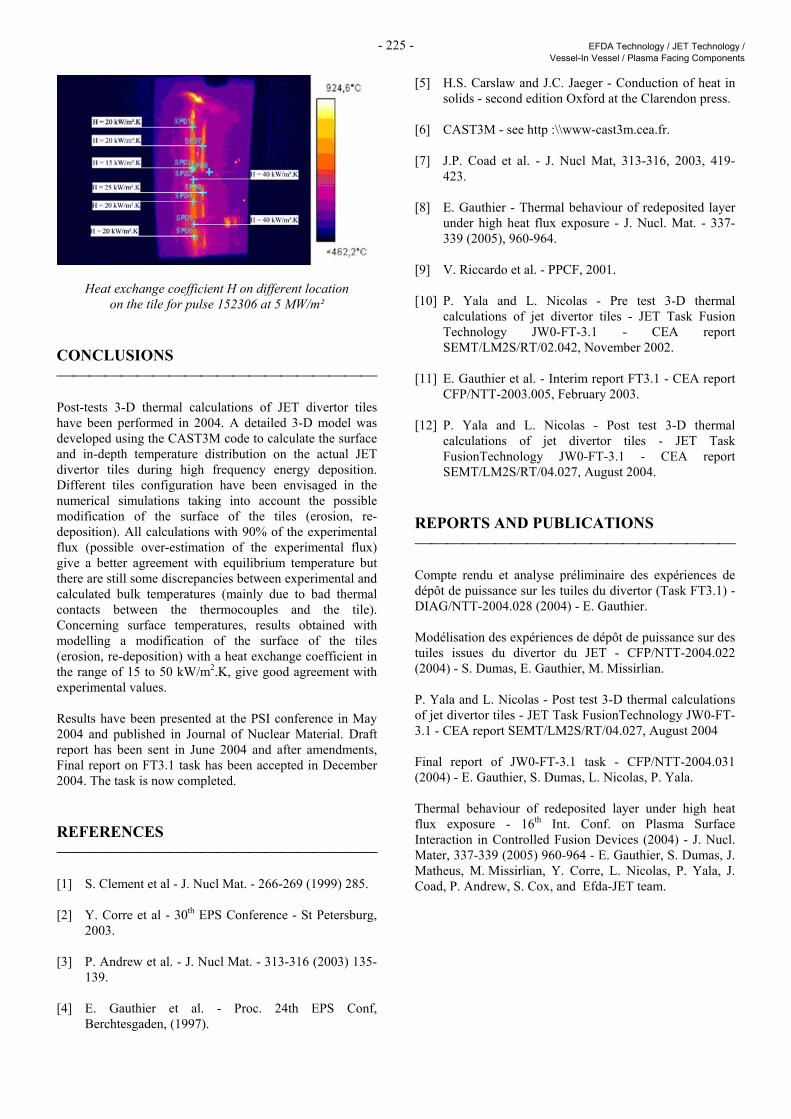
- 225 - EFDA Technology / JET Technology / Vessel-In Vessel / Plasma Facing Components
Heat exchange coefficient H on different location on the tile for pulse 152306 at 5 MW/m²
CONCLUSIONS Post-tests 3-D thermal calculations of JET divertor tiles have been performed in 2004. A detailed 3-D model was developed using the CAST3M code to calculate the surface and in-depth temperature distribution on the actual JET divertor tiles during high frequency energy deposition. Different tiles configuration have been envisaged in the numerical simulations taking into account the possible modification of the surface of the tiles (erosion, re-deposition). All calculations with 90% of the experimental flux (possible over-estimation of the experimental flux) give a better agreement with equilibrium temperature but there are still some discrepancies between experimental and calculated bulk temperatures (mainly due to bad thermal contacts between the thermocouples and the tile). Concerning surface temperatures, results obtained with modelling a modification of the surface of the tiles (erosion, re-deposition) with a heat exchange coefficient in the range of 15 to 50 kW/m2.K, give good agreement with experimental values. Results have been presented at the PSI conference in May 2004 and published in Journal of Nuclear Material. Draft report has been sent in June 2004 and after amendments, Final report on FT3.1 task has been accepted in December 2004. The task is now completed. REFERENCES [1] S. Clement et al - J. Nucl Mat. - 266-269 (1999) 285. [2] Y. Corre et al - 30th EPS Conference - St Petersburg,
2003. [3] P. Andrew et al. - J. Nucl Mat. - 313-316 (2003) 135-
139. [4] E. Gauthier et al. - Proc. 24th EPS Conf,
Berchtesgaden, (1997).
[5] H.S. Carslaw and J.C. Jaeger - Conduction of heat in solids - second edition Oxford at the Clarendon press.
[6] CAST3M - see http :\\www-cast3m.cea.fr. [7] J.P. Coad et al. - J. Nucl Mat, 313-316, 2003, 419-
423. [8] E. Gauthier - Thermal behaviour of redeposited layer
under high heat flux exposure - J. Nucl. Mat. - 337- 339 (2005), 960-964.
[9] V. Riccardo et al. - PPCF, 2001. [10] P. Yala and L. Nicolas - Pre test 3-D thermal
calculations of jet divertor tiles - JET Task Fusion Technology JW0-FT-3.1 - CEA report SEMT/LM2S/RT/02.042, November 2002.
[11] E. Gauthier et al. - Interim report FT3.1 - CEA report
CFP/NTT-2003.005, February 2003. [12] P. Yala and L. Nicolas - Post test 3-D thermal
calculations of jet divertor tiles - JET Task FusionTechnology JW0-FT-3.1 - CEA report SEMT/LM2S/RT/04.027, August 2004.
REPORTS AND PUBLICATIONS Compte rendu et analyse préliminaire des expériences de dépôt de puissance sur les tuiles du divertor (Task FT3.1) - DIAG/NTT-2004.028 (2004) - E. Gauthier. Modélisation des expériences de dépôt de puissance sur des tuiles issues du divertor du JET - CFP/NTT-2004.022 (2004) - S. Dumas, E. Gauthier, M. Missirlian. P. Yala and L. Nicolas - Post test 3-D thermal calculations of jet divertor tiles - JET Task FusionTechnology JW0-FT-3.1 - CEA report SEMT/LM2S/RT/04.027, August 2004 Final report of JW0-FT-3.1 task - CFP/NTT-2004.031 (2004) - E. Gauthier, S. Dumas, L. Nicolas, P. Yala. Thermal behaviour of redeposited layer under high heat flux exposure - 16th Int. Conf. on Plasma Surface Interaction in Controlled Fusion Devices (2004) - J. Nucl. Mater, 337-339 (2005) 960-964 - E. Gauthier, S. Dumas, J. Matheus, M. Missirlian, Y. Corre, L. Nicolas, P. Yala, J. Coad, P. Andrew, S. Cox, and Efda-JET team.
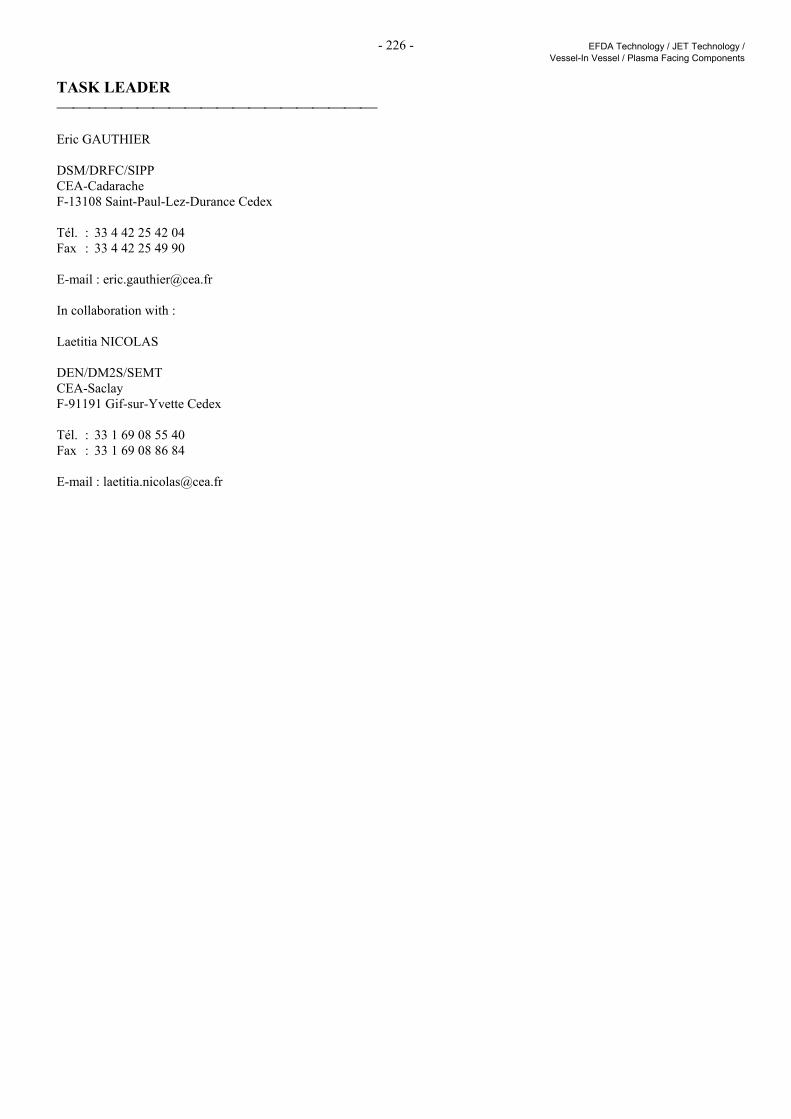
- 226 - EFDA Technology / JET Technology / Vessel-In Vessel / Plasma Facing Components
TASK LEADER Eric GAUTHIER DSM/DRFC/SIPP CEA-Cadarache F-13108 Saint-Paul-Lez-Durance Cedex Tél. : 33 4 42 25 42 04 Fax : 33 4 42 25 49 90 E-mail : [email protected] In collaboration with : Laetitia NICOLAS DEN/DM2S/SEMT CEA-Saclay F-91191 Gif-sur-Yvette Cedex Tél. : 33 1 69 08 55 40 Fax : 33 1 69 08 86 84 E-mail : [email protected]
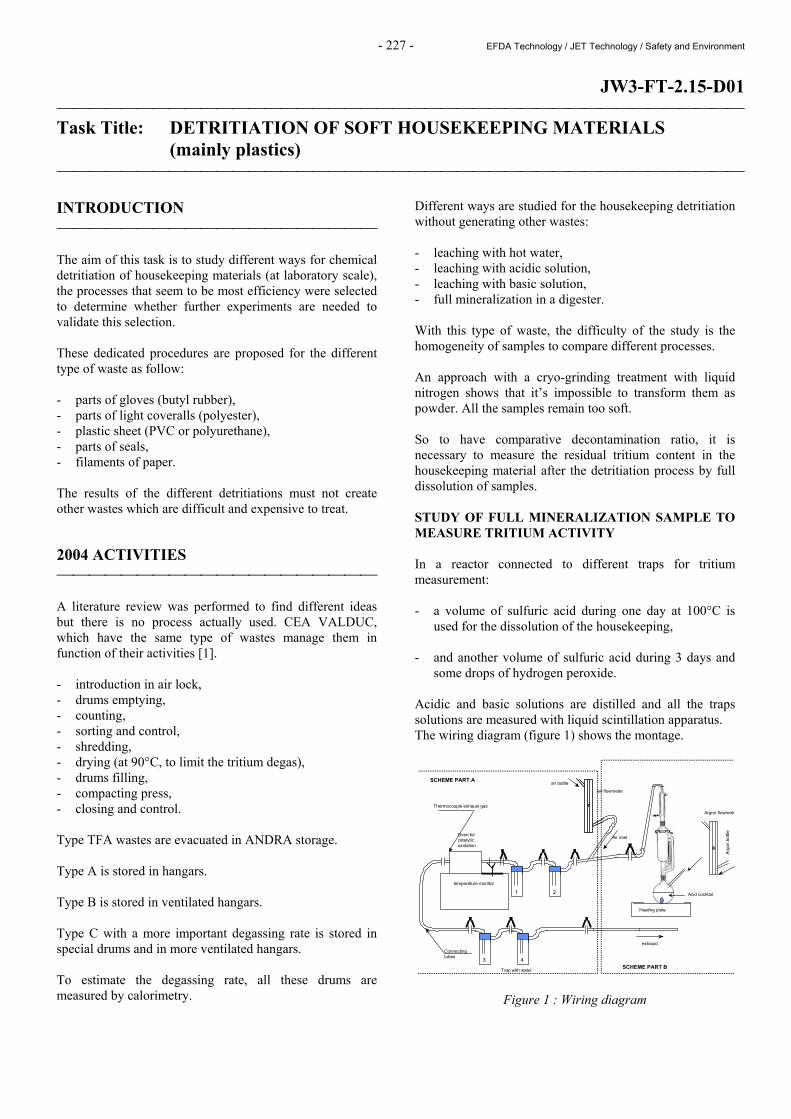
- 227 - EFDA Technology / JET Technology / Safety and Environment
JW3-FT-2.15-D01 Task Title: DETRITIATION OF SOFT HOUSEKEEPING MATERIALS (mainly plastics) INTRODUCTION The aim of this task is to study different ways for chemical detritiation of housekeeping materials (at laboratory scale), the processes that seem to be most efficiency were selected to determine whether further experiments are needed to validate this selection. These dedicated procedures are proposed for the different type of waste as follow: - parts of gloves (butyl rubber), - parts of light coveralls (polyester), - plastic sheet (PVC or polyurethane), - parts of seals, - filaments of paper. The results of the different detritiations must not create other wastes which are difficult and expensive to treat. 2004 ACTIVITIES A literature review was performed to find different ideas but there is no process actually used. CEA VALDUC, which have the same type of wastes manage them in function of their activities [1]. - introduction in air lock, - drums emptying, - counting, - sorting and control, - shredding, - drying (at 90°C, to limit the tritium degas), - drums filling, - compacting press, - closing and control. Type TFA wastes are evacuated in ANDRA storage. Type A is stored in hangars. Type B is stored in ventilated hangars. Type C with a more important degassing rate is stored in special drums and in more ventilated hangars. To estimate the degassing rate, all these drums are measured by calorimetry.
Different ways are studied for the housekeeping detritiation without generating other wastes: - leaching with hot water, - leaching with acidic solution, - leaching with basic solution, - full mineralization in a digester. With this type of waste, the difficulty of the study is the homogeneity of samples to compare different processes. An approach with a cryo-grinding treatment with liquid nitrogen shows that it’s impossible to transform them as powder. All the samples remain too soft. So to have comparative decontamination ratio, it is necessary to measure the residual tritium content in the housekeeping material after the detritiation process by full dissolution of samples. STUDY OF FULL MINERALIZATION SAMPLE TO MEASURE TRITIUM ACTIVITY In a reactor connected to different traps for tritium measurement: - a volume of sulfuric acid during one day at 100°C is
used for the dissolution of the housekeeping, - and another volume of sulfuric acid during 3 days and
some drops of hydrogen peroxide. Acidic and basic solutions are distilled and all the traps solutions are measured with liquid scintillation apparatus. The wiring diagram (figure 1) shows the montage.
Figure 1 : Wiring diagram
exhaust
air bottle
Argo
n bo
ttle
Oven for catalytic oxidation
temperature monitor
Heating plate
Thermocouple exhaust gas
air flowmeter
Argon flowmete
3 4SCHEME PART B
SCHEME PART A
Connecting tubes
Trap with water
Acid cocktail1 2
Air inlet
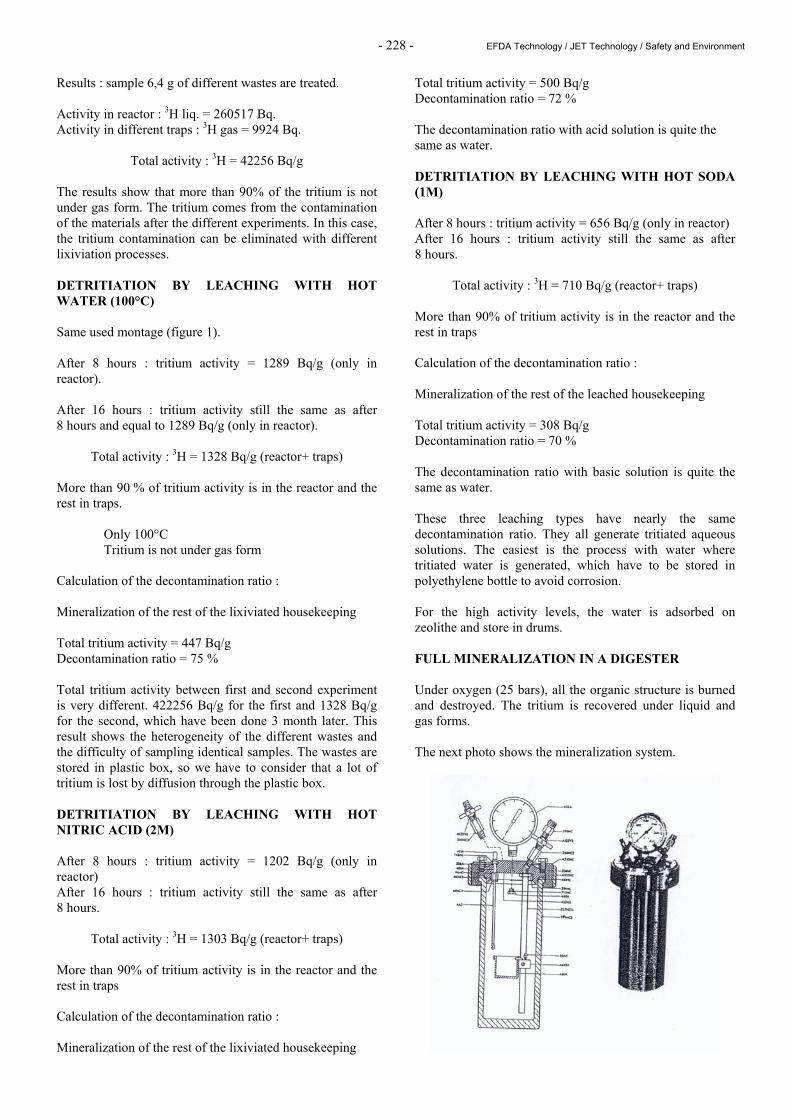
- 228 - EFDA Technology / JET Technology / Safety and Environment
Results : sample 6,4 g of different wastes are treated. Activity in reactor : 3H liq. = 260517 Bq. Activity in different traps : 3H gas = 9924 Bq.
Total activity : 3H = 42256 Bq/g The results show that more than 90% of the tritium is not under gas form. The tritium comes from the contamination of the materials after the different experiments. In this case, the tritium contamination can be eliminated with different lixiviation processes. DETRITIATION BY LEACHING WITH HOT WATER (100°C) Same used montage (figure 1). After 8 hours : tritium activity = 1289 Bq/g (only in reactor). After 16 hours : tritium activity still the same as after 8 hours and equal to 1289 Bq/g (only in reactor).
Total activity : 3H = 1328 Bq/g (reactor+ traps) More than 90 % of tritium activity is in the reactor and the rest in traps. Only 100°C Tritium is not under gas form Calculation of the decontamination ratio : Mineralization of the rest of the lixiviated housekeeping Total tritium activity = 447 Bq/g Decontamination ratio = 75 % Total tritium activity between first and second experiment is very different. 422256 Bq/g for the first and 1328 Bq/g for the second, which have been done 3 month later. This result shows the heterogeneity of the different wastes and the difficulty of sampling identical samples. The wastes are stored in plastic box, so we have to consider that a lot of tritium is lost by diffusion through the plastic box. DETRITIATION BY LEACHING WITH HOT NITRIC ACID (2M) After 8 hours : tritium activity = 1202 Bq/g (only in reactor) After 16 hours : tritium activity still the same as after 8 hours.
Total activity : 3H = 1303 Bq/g (reactor+ traps) More than 90% of tritium activity is in the reactor and the rest in traps Calculation of the decontamination ratio : Mineralization of the rest of the lixiviated housekeeping
Total tritium activity = 500 Bq/g Decontamination ratio = 72 % The decontamination ratio with acid solution is quite the same as water. DETRITIATION BY LEACHING WITH HOT SODA (1M) After 8 hours : tritium activity = 656 Bq/g (only in reactor) After 16 hours : tritium activity still the same as after 8 hours.
Total activity : 3H = 710 Bq/g (reactor+ traps) More than 90% of tritium activity is in the reactor and the rest in traps Calculation of the decontamination ratio : Mineralization of the rest of the leached housekeeping Total tritium activity = 308 Bq/g Decontamination ratio = 70 % The decontamination ratio with basic solution is quite the same as water. These three leaching types have nearly the same decontamination ratio. They all generate tritiated aqueous solutions. The easiest is the process with water where tritiated water is generated, which have to be stored in polyethylene bottle to avoid corrosion. For the high activity levels, the water is adsorbed on zeolithe and store in drums. FULL MINERALIZATION IN A DIGESTER Under oxygen (25 bars), all the organic structure is burned and destroyed. The tritium is recovered under liquid and gas forms. The next photo shows the mineralization system.
- 229 - EFDA Technology / JET Technology / Safety and Environment
In this case, all the housekeeping materials are burned and 100 % of the tritium is trapped in the bubbles and rinsed water of the mineralization system as tritiated water. The total tritium activity measured is 1973 Bq/g. The decontamination ratio is 100 %. More than 95 % of the tritium is in the rinsed water phase. Only tritiated water is created. CONCLUSIONS Even the chemical tests would have been done, the extraction rate is around 70 %. The easiest is the process with water where tritiated water is generated which have to be stored in polyethylene bottle for having no corrosion. For the high activity levels, the water is adsorbed on zeolithe and store in drums. In a digester, 100 % of the tritium is transformed with oxygen as HTO form and trapped in bubbles. Only tritiated water is created. In both cases tritiated water is easy to manage. It must be stored in polyethylene bottle to avoid corrosion. For the high activity levels, the water is adsorbed on zeolithes and stored in drums. CEA VALDUC, which has the same problems doesn’t detritiate their housekeeping materials. They manage the storage of the wastes pertaining to their activities. They are stored in different hangars with adapted ventilation levels. The degassing rate is controlled by calorimetry measurement on the drums.
REFERENCE [1] Compte rendu de réunion : UKAEA/CEA co-
operation on fusion decommissioning - S. Rosanvallon DER/STR/LCEP 2001/309.
TASK LEADER Pierre TRABUC DEN/DTN/STPA/LPC CEA-Cadarache F-13108 Saint-Paul-Lez-Durance Cedex Tél. : 33 4 42 25 43 05 Fax : 33 4 42 25 72 87 E-mail : [email protected]

- 230 - EFDA Technology / JET Technology / Safety and Environment
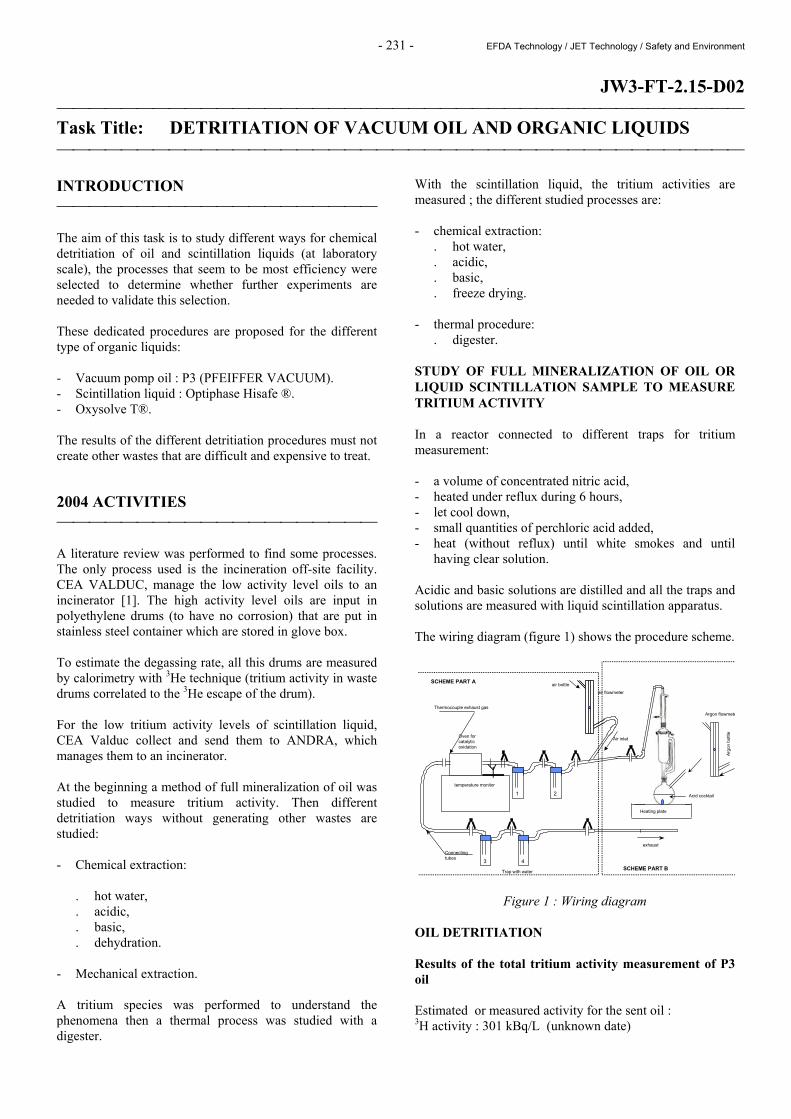
- 231 - EFDA Technology / JET Technology / Safety and Environment
JW3-FT-2.15-D02 Task Title: DETRITIATION OF VACUUM OIL AND ORGANIC LIQUIDS INTRODUCTION The aim of this task is to study different ways for chemical detritiation of oil and scintillation liquids (at laboratory scale), the processes that seem to be most efficiency were selected to determine whether further experiments are needed to validate this selection. These dedicated procedures are proposed for the different type of organic liquids: - Vacuum pomp oil : P3 (PFEIFFER VACUUM). - Scintillation liquid : Optiphase Hisafe ®. - Oxysolve T®. The results of the different detritiation procedures must not create other wastes that are difficult and expensive to treat. 2004 ACTIVITIES A literature review was performed to find some processes. The only process used is the incineration off-site facility. CEA VALDUC, manage the low activity level oils to an incinerator [1]. The high activity level oils are input in polyethylene drums (to have no corrosion) that are put in stainless steel container which are stored in glove box. To estimate the degassing rate, all this drums are measured by calorimetry with 3He technique (tritium activity in waste drums correlated to the 3He escape of the drum). For the low tritium activity levels of scintillation liquid, CEA Valduc collect and send them to ANDRA, which manages them to an incinerator. At the beginning a method of full mineralization of oil was studied to measure tritium activity. Then different detritiation ways without generating other wastes are studied: - Chemical extraction:
. hot water,
. acidic,
. basic,
. dehydration. - Mechanical extraction. A tritium species was performed to understand the phenomena then a thermal process was studied with a digester.
With the scintillation liquid, the tritium activities are measured ; the different studied processes are: - chemical extraction:
. hot water,
. acidic,
. basic,
. freeze drying. - thermal procedure:
. digester. STUDY OF FULL MINERALIZATION OF OIL OR LIQUID SCINTILLATION SAMPLE TO MEASURE TRITIUM ACTIVITY In a reactor connected to different traps for tritium measurement: - a volume of concentrated nitric acid, - heated under reflux during 6 hours, - let cool down, - small quantities of perchloric acid added, - heat (without reflux) until white smokes and until
having clear solution. Acidic and basic solutions are distilled and all the traps and solutions are measured with liquid scintillation apparatus. The wiring diagram (figure 1) shows the procedure scheme.
Figure 1 : Wiring diagram OIL DETRITIATION Results of the total tritium activity measurement of P3 oil Estimated or measured activity for the sent oil : 3H activity : 301 kBq/L (unknown date)
exhaust
air bottle
Argo
n bo
ttle
Oven for catalytic oxidation
temperature monitor
Heating plate
Thermocouple exhaust gas
air flowmeter
Argon flowmete
3 4SCHEME PART B
SCHEME PART A
Connecting tubes
Trap with water
Acid cocktail1 2
Air inlet
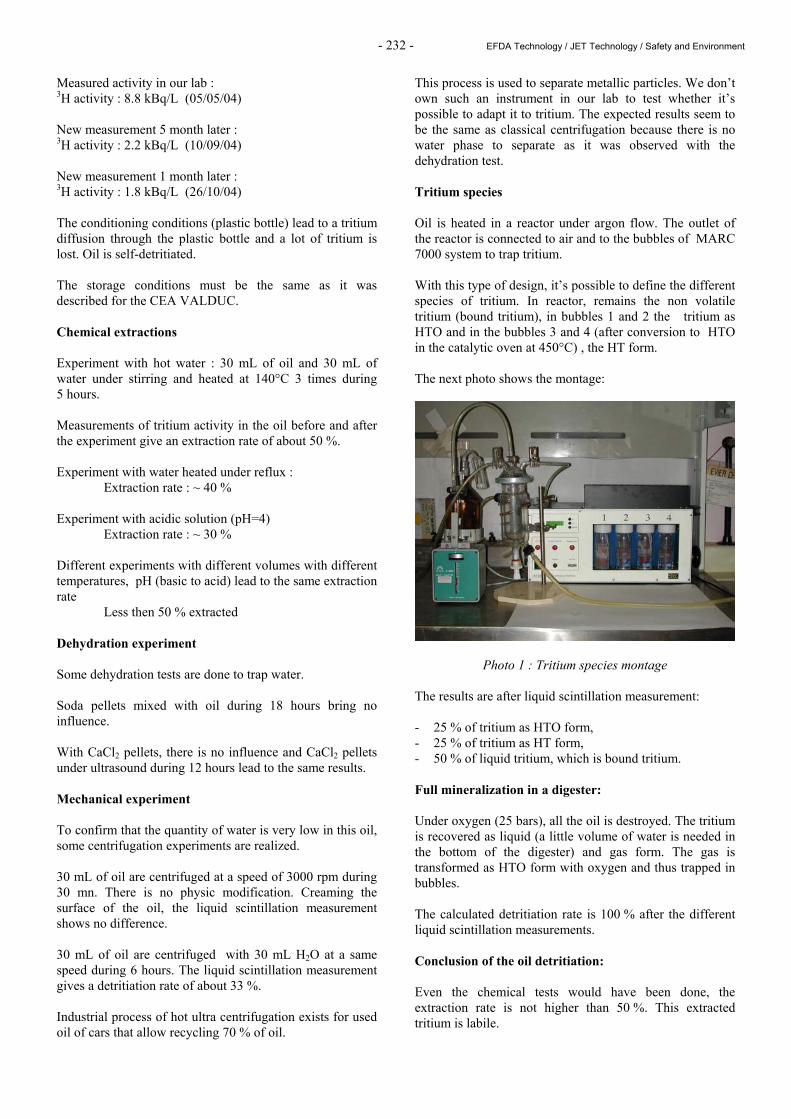
- 232 - EFDA Technology / JET Technology / Safety and Environment
Measured activity in our lab : 3H activity : 8.8 kBq/L (05/05/04) New measurement 5 month later : 3H activity : 2.2 kBq/L (10/09/04) New measurement 1 month later : 3H activity : 1.8 kBq/L (26/10/04) The conditioning conditions (plastic bottle) lead to a tritium diffusion through the plastic bottle and a lot of tritium is lost. Oil is self-detritiated. The storage conditions must be the same as it was described for the CEA VALDUC. Chemical extractions Experiment with hot water : 30 mL of oil and 30 mL of water under stirring and heated at 140°C 3 times during 5 hours. Measurements of tritium activity in the oil before and after the experiment give an extraction rate of about 50 %. Experiment with water heated under reflux : Extraction rate : ~ 40 % Experiment with acidic solution (pH=4) Extraction rate : ~ 30 % Different experiments with different volumes with different temperatures, pH (basic to acid) lead to the same extraction rate
Less then 50 % extracted
Dehydration experiment Some dehydration tests are done to trap water. Soda pellets mixed with oil during 18 hours bring no influence. With CaCl2 pellets, there is no influence and CaCl2 pellets under ultrasound during 12 hours lead to the same results. Mechanical experiment To confirm that the quantity of water is very low in this oil, some centrifugation experiments are realized. 30 mL of oil are centrifuged at a speed of 3000 rpm during 30 mn. There is no physic modification. Creaming the surface of the oil, the liquid scintillation measurement shows no difference. 30 mL of oil are centrifuged with 30 mL H2O at a same speed during 6 hours. The liquid scintillation measurement gives a detritiation rate of about 33 %. Industrial process of hot ultra centrifugation exists for used oil of cars that allow recycling 70 % of oil.
This process is used to separate metallic particles. We don’t own such an instrument in our lab to test whether it’s possible to adapt it to tritium. The expected results seem to be the same as classical centrifugation because there is no water phase to separate as it was observed with the dehydration test. Tritium species Oil is heated in a reactor under argon flow. The outlet of the reactor is connected to air and to the bubbles of MARC 7000 system to trap tritium. With this type of design, it’s possible to define the different species of tritium. In reactor, remains the non volatile tritium (bound tritium), in bubbles 1 and 2 the tritium as HTO and in the bubbles 3 and 4 (after conversion to HTO in the catalytic oven at 450°C) , the HT form. The next photo shows the montage:
Photo 1 : Tritium species montage The results are after liquid scintillation measurement: - 25 % of tritium as HTO form, - 25 % of tritium as HT form, - 50 % of liquid tritium, which is bound tritium. Full mineralization in a digester: Under oxygen (25 bars), all the oil is destroyed. The tritium is recovered as liquid (a little volume of water is needed in the bottom of the digester) and gas form. The gas is transformed as HTO form with oxygen and thus trapped in bubbles. The calculated detritiation rate is 100 % after the different liquid scintillation measurements. Conclusion of the oil detritiation: Even the chemical tests would have been done, the extraction rate is not higher than 50 %. This extracted tritium is labile.
- 233 - EFDA Technology / JET Technology / Safety and Environment
The tritium, which remains in oil, is considered as to be bound tritium. In a digester, 100 % of the tritium is transformed with oxygen as HTO form and trapped in bubbles. Only tritiated water is created. CEA VALDUC, which has the same problem, doesn’t detritiate oil. They manage the low activity level oils to an incinerator. The high activity level oils are input in polyethylene drums (to have no corrosion) which are put in stainless steel container which are store in glove box. SCINTILLATION LIQUID DETRITIATION Results of the total tritium activity measurement of HISAFE and OXYSOLVE T Optiphase Hisafe : 4.59 kBq/mL (May 15-2004) Oxysolve : 2.4 kBq/mL (May 25-2004) Chemical extractions Experiment with hot water : 20 mL of Hisafe and 30 mL of water under 15 mn stirring then addition of 30mL ultra-pure water for distillation. Resulting tritium activity of the distillation: 0.05 kBq/mL and a tritium rate of about 1 %. Same procedure with hot water (close to boiling) leads to an extraction rate of 5 % Tritium remains in the boiler and a try to continue the distillation is dangerous. A pressure increase has been observed. Experiment in a vessel with 5 mL of oxysolve plus 5 mL of fresh oxysolve plus 10 mL o water. Heating under air flow with a MARC 7000 downstream. Tritium is mainly recovered as HTO form, but only 30 % of the tritium is extracted. Experiment with acidic solution or basic solution. 10 mL of Optiphase Hisafe with HCl 6N then a distillation leads to 73 % of tritium extracted. The same operation with soda leads to an extraction rate of 80 %. Same operation at pH 2 with 10 mL of oxysolve T with 40 mL of acid solution and 48 h of stirring then addition of 100 mL of water and distillation lead to a 96 % rate. However the waste volume increased. One solution for decreasing the waste volume could be the use of freeze-drying procedure. Mechanical experiment The same procedure with water, has been done by heating until 80°C under ultrasound stirring and the obtained extraction rate is only 15.8 %.
Full mineralization in a digester: Full mineralization in a digester leads to the total destruction of the organic structure and 100 % of the tritium is recovered as HTO form. In this case, only tritiated water is created. CONCLUSIONS Oil detritiation Even the chemical tests would have been done, the extraction rate is not higher than 50 %. This extracted tritium is labile. The tritium, which remains in oil seems to be bound tritium. In a digester, 100 % of the tritium is transformed with oxygen as HTO form and trapped in bubbles. The advantage is that only tritiated water is created. This waste is clearly identified and easy to store. CEA VALDUC, which has the same problem, doesn’t detritiate oil. They manage the low activity level oils to an incinerator. The high activity level oils are put in polyethylene drums (to have no corrosion), which are put in stainless steel container, stored in glove box. Scintillation liquid A long time stirring with acid or base addition improves extraction. Distillation with concentrated scintillation liquid seems explosive. In a digester, 100 % of the tritium is transformed (with oxygen) as HTO form and trapped in bubbles. The same advantage as oil is the generation of tritiated water only. At CEA Valduc the low level activity samples are collected and sent to ANDRA that manages them to an incinerator. REFERENCE [1] Compte rendu de réunion : UKAEA/CEA co-
operation on fusion decommissioning - S. Rosanvallon DER/STR/LCEP 2001/309.

- 234 - EFDA Technology / JET Technology / Safety and Environment
TASK LEADER Pierre TRABUC Christian POLETIKO DEN/DTN/STPA/LPC CEA-Cadarache F-13108 Saint-Paul-Lez-Durance Cedex Tél. : 33 4 42 25 43 05 Tél. : 33 4 42 25 64 93 Fax : 33 4 42 25 72 87 E-mail : [email protected] [email protected]
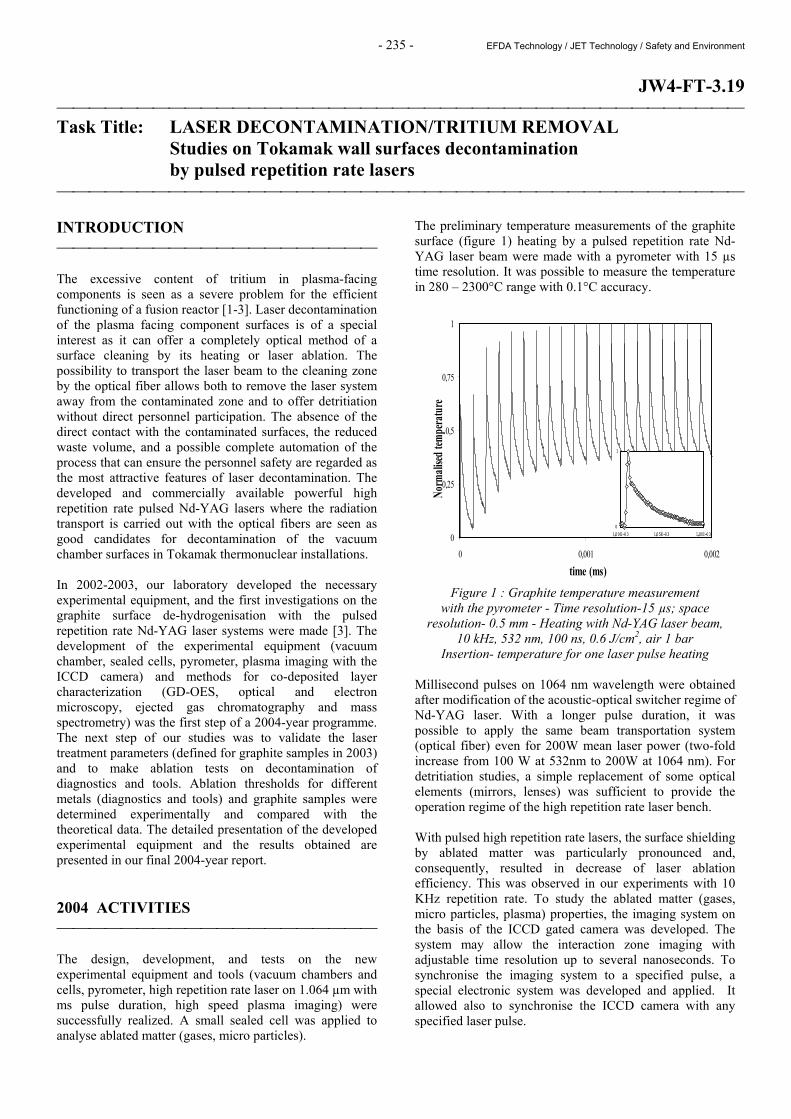
- 235 - EFDA Technology / JET Technology / Safety and Environment
JW4-FT-3.19 Task Title: LASER DECONTAMINATION/TRITIUM REMOVAL Studies on Tokamak wall surfaces decontamination
by pulsed repetition rate lasers INTRODUCTION The excessive content of tritium in plasma-facing components is seen as a severe problem for the efficient functioning of a fusion reactor [1-3]. Laser decontamination of the plasma facing component surfaces is of a special interest as it can offer a completely optical method of a surface cleaning by its heating or laser ablation. The possibility to transport the laser beam to the cleaning zone by the optical fiber allows both to remove the laser system away from the contaminated zone and to offer detritiation without direct personnel participation. The absence of the direct contact with the contaminated surfaces, the reduced waste volume, and a possible complete automation of the process that can ensure the personnel safety are regarded as the most attractive features of laser decontamination. The developed and commercially available powerful high repetition rate pulsed Nd-YAG lasers where the radiation transport is carried out with the optical fibers are seen as good candidates for decontamination of the vacuum chamber surfaces in Tokamak thermonuclear installations. In 2002-2003, our laboratory developed the necessary experimental equipment, and the first investigations on the graphite surface de-hydrogenisation with the pulsed repetition rate Nd-YAG laser systems were made [3]. The development of the experimental equipment (vacuum chamber, sealed cells, pyrometer, plasma imaging with the ICCD camera) and methods for co-deposited layer characterization (GD-OES, optical and electron microscopy, ejected gas chromatography and mass spectrometry) was the first step of a 2004-year programme. The next step of our studies was to validate the laser treatment parameters (defined for graphite samples in 2003) and to make ablation tests on decontamination of diagnostics and tools. Ablation thresholds for different metals (diagnostics and tools) and graphite samples were determined experimentally and compared with the theoretical data. The detailed presentation of the developed experimental equipment and the results obtained are presented in our final 2004-year report. 2004 ACTIVITIES The design, development, and tests on the new experimental equipment and tools (vacuum chambers and cells, pyrometer, high repetition rate laser on 1.064 µm with ms pulse duration, high speed plasma imaging) were successfully realized. A small sealed cell was applied to analyse ablated matter (gases, micro particles).
The preliminary temperature measurements of the graphite surface (figure 1) heating by a pulsed repetition rate Nd-YAG laser beam were made with a pyrometer with 15 µs time resolution. It was possible to measure the temperature in 280 – 2300°C range with 0.1°C accuracy.
Figure 1 : Graphite temperature measurement with the pyrometer - Time resolution-15 µs; space
resolution- 0.5 mm - Heating with Nd-YAG laser beam, 10 kHz, 532 nm, 100 ns, 0.6 J/cm2, air 1 bar
Insertion- temperature for one laser pulse heating Millisecond pulses on 1064 nm wavelength were obtained after modification of the acoustic-optical switcher regime of Nd-YAG laser. With a longer pulse duration, it was possible to apply the same beam transportation system (optical fiber) even for 200W mean laser power (two-fold increase from 100 W at 532nm to 200W at 1064 nm). For detritiation studies, a simple replacement of some optical elements (mirrors, lenses) was sufficient to provide the operation regime of the high repetition rate laser bench. With pulsed high repetition rate lasers, the surface shielding by ablated matter was particularly pronounced and, consequently, resulted in decrease of laser ablation efficiency. This was observed in our experiments with 10 KHz repetition rate. To study the ablated matter (gases, micro particles, plasma) properties, the imaging system on the basis of the ICCD gated camera was developed. The system may allow the interaction zone imaging with adjustable time resolution up to several nanoseconds. To synchronise the imaging system to a specified pulse, a special electronic system was developed and applied. It allowed also to synchronise the ICCD camera with any specified laser pulse.
0
0,25
0,5
0,75
1
0 0,001 0,002
time (ms)
Norm
alised
temp
eratur
e
0
1
1,00E-03 1,05E-03 1,10E-03
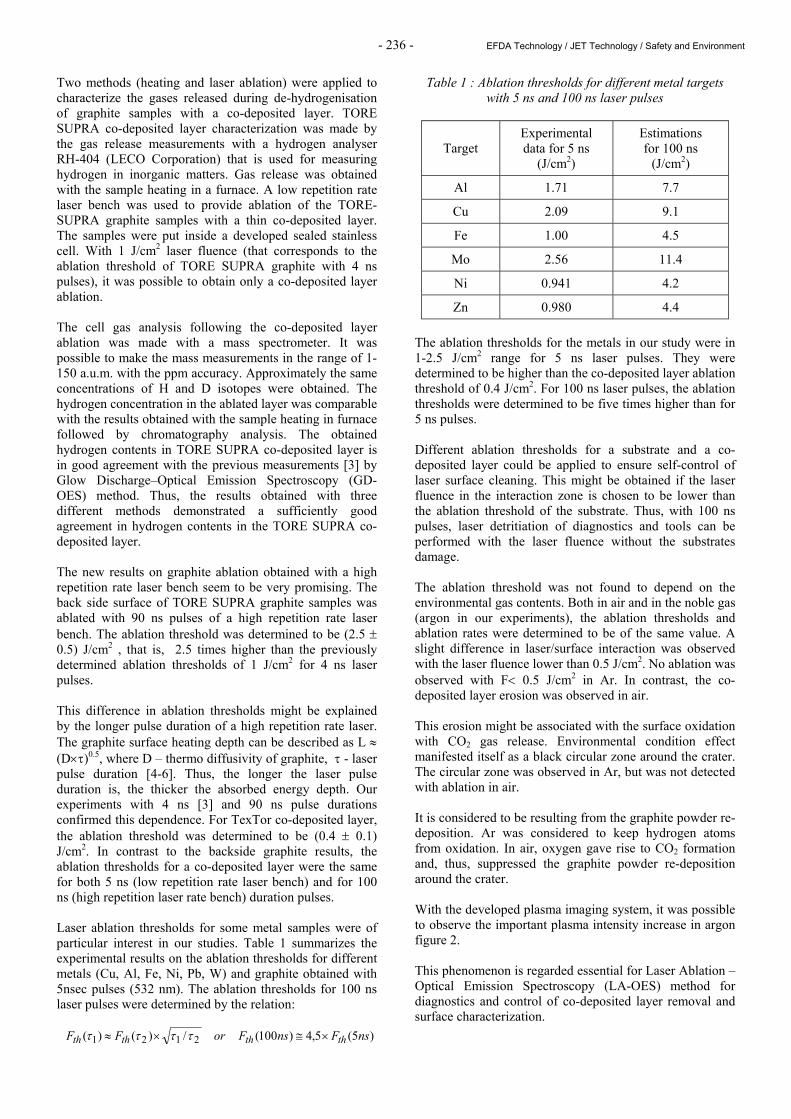
- 236 - EFDA Technology / JET Technology / Safety and Environment
Two methods (heating and laser ablation) were applied to characterize the gases released during de-hydrogenisation of graphite samples with a co-deposited layer. TORE SUPRA co-deposited layer characterization was made by the gas release measurements with a hydrogen analyser RH-404 (LECO Corporation) that is used for measuring hydrogen in inorganic matters. Gas release was obtained with the sample heating in a furnace. A low repetition rate laser bench was used to provide ablation of the TORE-SUPRA graphite samples with a thin co-deposited layer. The samples were put inside a developed sealed stainless cell. With 1 J/cm2 laser fluence (that corresponds to the ablation threshold of TORE SUPRA graphite with 4 ns pulses), it was possible to obtain only a co-deposited layer ablation. The cell gas analysis following the co-deposited layer ablation was made with a mass spectrometer. It was possible to make the mass measurements in the range of 1-150 a.u.m. with the ppm accuracy. Approximately the same concentrations of H and D isotopes were obtained. The hydrogen concentration in the ablated layer was comparable with the results obtained with the sample heating in furnace followed by chromatography analysis. The obtained hydrogen contents in TORE SUPRA co-deposited layer is in good agreement with the previous measurements [3] by Glow Discharge–Optical Emission Spectroscopy (GD-OES) method. Thus, the results obtained with three different methods demonstrated a sufficiently good agreement in hydrogen contents in the TORE SUPRA co-deposited layer. The new results on graphite ablation obtained with a high repetition rate laser bench seem to be very promising. The back side surface of TORE SUPRA graphite samples was ablated with 90 ns pulses of a high repetition rate laser bench. The ablation threshold was determined to be (2.5 ± 0.5) J/cm2 , that is, 2.5 times higher than the previously determined ablation thresholds of 1 J/cm2 for 4 ns laser pulses. This difference in ablation thresholds might be explained by the longer pulse duration of a high repetition rate laser. The graphite surface heating depth can be described as L ≈ (D×τ)0.5, where D – thermo diffusivity of graphite, τ - laser pulse duration [4-6]. Thus, the longer the laser pulse duration is, the thicker the absorbed energy depth. Our experiments with 4 ns [3] and 90 ns pulse durations confirmed this dependence. For TexTor co-deposited layer, the ablation threshold was determined to be (0.4 ± 0.1) J/cm2. In contrast to the backside graphite results, the ablation thresholds for a co-deposited layer were the same for both 5 ns (low repetition rate laser bench) and for 100 ns (high repetition laser rate bench) duration pulses. Laser ablation thresholds for some metal samples were of particular interest in our studies. Table 1 summarizes the experimental results on the ablation thresholds for different metals (Cu, Al, Fe, Ni, Pb, W) and graphite obtained with 5nsec pulses (532 nm). The ablation thresholds for 100 ns laser pulses were determined by the relation:
Table 1 : Ablation thresholds for different metal targets with 5 ns and 100 ns laser pulses
Target Experimental data for 5 ns
(J/cm2)
Estimations for 100 ns
(J/cm2)
Al 1.71 7.7
Cu 2.09 9.1
Fe 1.00 4.5
Mo 2.56 11.4
Ni 0.941 4.2
Zn 0.980 4.4 The ablation thresholds for the metals in our study were in 1-2.5 J/cm2 range for 5 ns laser pulses. They were determined to be higher than the co-deposited layer ablation threshold of 0.4 J/cm2. For 100 ns laser pulses, the ablation thresholds were determined to be five times higher than for 5 ns pulses. Different ablation thresholds for a substrate and a co-deposited layer could be applied to ensure self-control of laser surface cleaning. This might be obtained if the laser fluence in the interaction zone is chosen to be lower than the ablation threshold of the substrate. Thus, with 100 ns pulses, laser detritiation of diagnostics and tools can be performed with the laser fluence without the substrates damage. The ablation threshold was not found to depend on the environmental gas contents. Both in air and in the noble gas (argon in our experiments), the ablation thresholds and ablation rates were determined to be of the same value. A slight difference in laser/surface interaction was observed with the laser fluence lower than 0.5 J/cm2. No ablation was observed with F< 0.5 J/cm2 in Ar. In contrast, the co-deposited layer erosion was observed in air. This erosion might be associated with the surface oxidation with CO2 gas release. Environmental condition effect manifested itself as a black circular zone around the crater. The circular zone was observed in Ar, but was not detected with ablation in air. It is considered to be resulting from the graphite powder re-deposition. Ar was considered to keep hydrogen atoms from oxidation. In air, oxygen gave rise to CO2 formation and, thus, suppressed the graphite powder re-deposition around the crater. With the developed plasma imaging system, it was possible to observe the important plasma intensity increase in argon figure 2. This phenomenon is regarded essential for Laser Ablation – Optical Emission Spectroscopy (LA-OES) method for diagnostics and control of co-deposited layer removal and surface characterization. )5(5,4)100(/)()( 2121 nsFnsForFF thththth ×≅×≈ ττττ
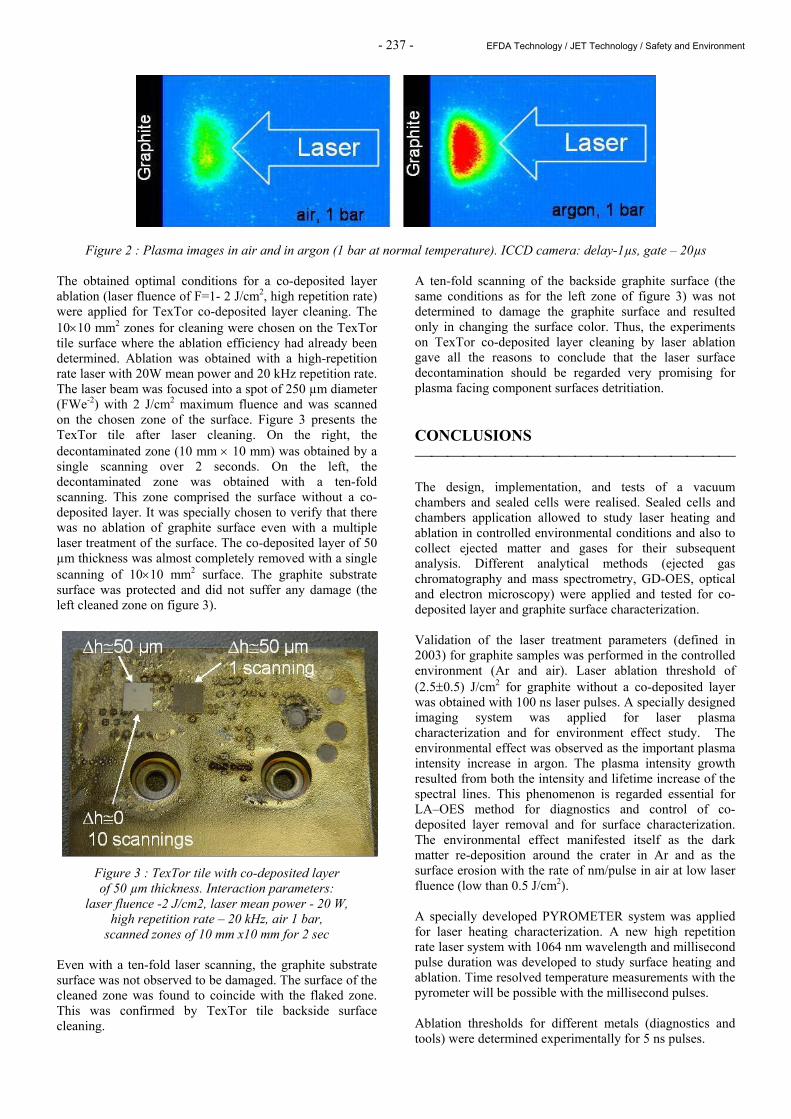
- 237 - EFDA Technology / JET Technology / Safety and Environment
Figure 2 : Plasma images in air and in argon (1 bar at normal temperature). ICCD camera: delay-1µs, gate – 20µs The obtained optimal conditions for a co-deposited layer ablation (laser fluence of F=1- 2 J/cm2, high repetition rate) were applied for TexTor co-deposited layer cleaning. The 10×10 mm2 zones for cleaning were chosen on the TexTor tile surface where the ablation efficiency had already been determined. Ablation was obtained with a high-repetition rate laser with 20W mean power and 20 kHz repetition rate. The laser beam was focused into a spot of 250 µm diameter (FWe-2) with 2 J/cm2 maximum fluence and was scanned on the chosen zone of the surface. Figure 3 presents the TexTor tile after laser cleaning. On the right, the decontaminated zone (10 mm × 10 mm) was obtained by a single scanning over 2 seconds. On the left, the decontaminated zone was obtained with a ten-fold scanning. This zone comprised the surface without a co-deposited layer. It was specially chosen to verify that there was no ablation of graphite surface even with a multiple laser treatment of the surface. The co-deposited layer of 50 µm thickness was almost completely removed with a single scanning of 10×10 mm2 surface. The graphite substrate surface was protected and did not suffer any damage (the left cleaned zone on figure 3).
Figure 3 : TexTor tile with co-deposited layer of 50 µm thickness. Interaction parameters:
laser fluence -2 J/cm2, laser mean power - 20 W, high repetition rate – 20 kHz, air 1 bar,
scanned zones of 10 mm x10 mm for 2 sec Even with a ten-fold laser scanning, the graphite substrate surface was not observed to be damaged. The surface of the cleaned zone was found to coincide with the flaked zone. This was confirmed by TexTor tile backside surface cleaning.
A ten-fold scanning of the backside graphite surface (the same conditions as for the left zone of figure 3) was not determined to damage the graphite surface and resulted only in changing the surface color. Thus, the experiments on TexTor co-deposited layer cleaning by laser ablation gave all the reasons to conclude that the laser surface decontamination should be regarded very promising for plasma facing component surfaces detritiation. CONCLUSIONS The design, implementation, and tests of a vacuum chambers and sealed cells were realised. Sealed cells and chambers application allowed to study laser heating and ablation in controlled environmental conditions and also to collect ejected matter and gases for their subsequent analysis. Different analytical methods (ejected gas chromatography and mass spectrometry, GD-OES, optical and electron microscopy) were applied and tested for co-deposited layer and graphite surface characterization. Validation of the laser treatment parameters (defined in 2003) for graphite samples was performed in the controlled environment (Ar and air). Laser ablation threshold of (2.5±0.5) J/cm2 for graphite without a co-deposited layer was obtained with 100 ns laser pulses. A specially designed imaging system was applied for laser plasma characterization and for environment effect study. The environmental effect was observed as the important plasma intensity increase in argon. The plasma intensity growth resulted from both the intensity and lifetime increase of the spectral lines. This phenomenon is regarded essential for LA–OES method for diagnostics and control of co-deposited layer removal and for surface characterization. The environmental effect manifested itself as the dark matter re-deposition around the crater in Ar and as the surface erosion with the rate of nm/pulse in air at low laser fluence (low than 0.5 J/cm2). A specially developed PYROMETER system was applied for laser heating characterization. A new high repetition rate laser system with 1064 nm wavelength and millisecond pulse duration was developed to study surface heating and ablation. Time resolved temperature measurements with the pyrometer will be possible with the millisecond pulses. Ablation thresholds for different metals (diagnostics and tools) were determined experimentally for 5 ns pulses.
- 238 - EFDA Technology / JET Technology / Safety and Environment
For the samples under study and applied nanosecond pulses, the ablation thresholds were higher than 1 J/cm2. Theoretical model of high repetition laser heating of a complex surface (graphite or metal with a co-deposited layer) was developed to explain the experimental results and to obtain laser detritiation optimization [6]. The obtained optimal conditions (high pulse repetition regime, 2 J/cm2, ablation rate) were applied for laser cleaning of 1cm2 co-deposited layer on TexTor graphite tile without any damage of the graphite substrate. The co-deposited layer of 50 µm thickness was almost completely removed with a single scanning of 10×10 cm2 surface during two seconds. Thus, with a laser of 20W mean power, it was possible to clean 0.2 m2 co-deposited layer of 50 µm thickness during one hour. With 100 W mean power, it will be possible to clean 1 m2 co-deposited layer during the same time (one hour). The comparison of the obtained laser cleaning rate with the data presented in our previous report [3] (1 m2 per hour of 20 µm thickness co-deposited layer cleaning with 250 W Nd-YAG laser mean power) demonstrates an approximately six-fold increase in the cleaning rate. Further experimental and theoretical studies to explain the cleaning rate increase and to obtain the subsequent optimization of the laser detritiation performances should be made. REFERENCES [1] R. A. Causey - J. Nucl. Mater. - 300 (2002) 91-117. [2] M. Friedrich et al. - Nucl. Instr. Meth. in Phys. Res. B,
B161 – 163 (2000) 216-220. [3] A. Semerok et al, - Studies on graphite surfaces
detritiation by pulsed repetition rate nanosecond lasers - CEA report NT DPC/SCP/04-076-A, 2004, pp. 31.
[4] S. Fomichev and A. Semerok - Etude des Processus
Thermiques Survenant Lors de la Microanalyse des Surfaces par la Méthode Raman - Report CEA, DPC/SCPA/NT02-053, 2002, 27 pages.
[5] A. Semerok and J.-M. Weulersse - Bibliography Study
on Theoretical Models of Laser Detritiation Processes - Report CEA, NT DPC/SCP 03-069-A, 2003, 28 pages.
[6] S. Fomichev, A. Semerok, JM. Weulersse, F. Brygo -
Report CEA - NT DPC/SCP 11-069-A, 2004, 77 pages.
REPORTS AND PUBLICATIONS A. Semerok, JM. Weulersse, F. Brygo, D. Farcage, C. Hubert, C. Lascoutouna, M. Géléoc, P. Wodling, H. Long, F. Champonnois, G. Brunel, G. Vimond, E. Lizon, V.Dauvois, V. Delanne, C. Grisolia, S. Fomichev, M. Hashida - Studies on TOKAMAK wall surfaces decontamination by pulsed repetition rate lasers - CEA report NT DPC/SCP/05-111-A, January 2005, 50 pages. A. Semerok, F. Le Guern, F. Brygo, C. Grisolia, D. Farcage, C. Hubert, C. Lascoutouna, M. Tabarant, J.M. Weulersse - Studies on graphite surfaces detritiation by pulsed repetition rate nanosecond lasers - presentation on SOFT’2004 conference, 20-24 September 2004, Venice, Italy. TASK LEADER Alexandre SEMEROK DEN/DPC/SCP/LILM CEA-Saclay F-91191 Gif-sur-Yvette Cedex Tél. : 33 1 69 08 65 57 Fax : 33 1 69 08 78 84 E-mail : [email protected]
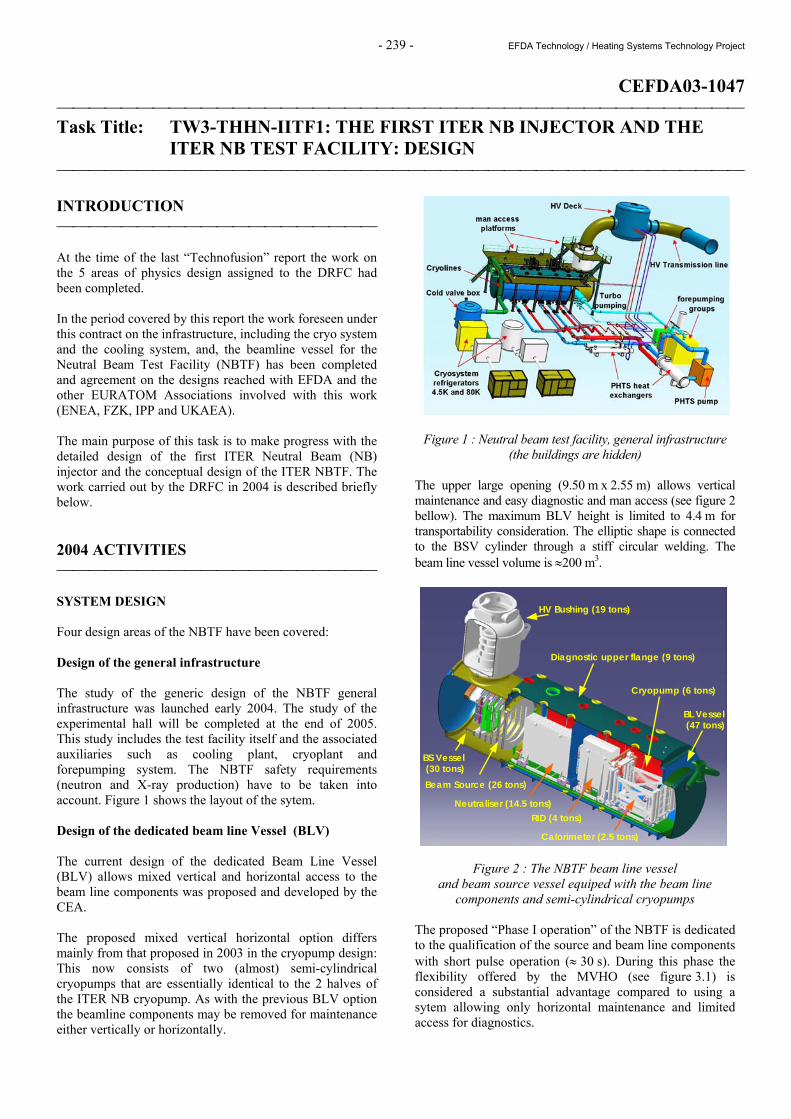
- 239 - EFDA Technology / Heating Systems Technology Project
CEFDA03-1047 Task Title: TW3-THHN-IITF1: THE FIRST ITER NB INJECTOR AND THE
ITER NB TEST FACILITY: DESIGN INTRODUCTION At the time of the last “Technofusion” report the work on the 5 areas of physics design assigned to the DRFC had been completed. In the period covered by this report the work foreseen under this contract on the infrastructure, including the cryo system and the cooling system, and, the beamline vessel for the Neutral Beam Test Facility (NBTF) has been completed and agreement on the designs reached with EFDA and the other EURATOM Associations involved with this work (ENEA, FZK, IPP and UKAEA). The main purpose of this task is to make progress with the detailed design of the first ITER Neutral Beam (NB) injector and the conceptual design of the ITER NBTF. The work carried out by the DRFC in 2004 is described briefly below. 2004 ACTIVITIES SYSTEM DESIGN Four design areas of the NBTF have been covered: Design of the general infrastructure The study of the generic design of the NBTF general infrastructure was launched early 2004. The study of the experimental hall will be completed at the end of 2005. This study includes the test facility itself and the associated auxiliaries such as cooling plant, cryoplant and forepumping system. The NBTF safety requirements (neutron and X-ray production) have to be taken into account. Figure 1 shows the layout of the sytem. Design of the dedicated beam line Vessel (BLV) The current design of the dedicated Beam Line Vessel (BLV) allows mixed vertical and horizontal access to the beam line components was proposed and developed by the CEA. The proposed mixed vertical horizontal option differs mainly from that proposed in 2003 in the cryopump design: This now consists of two (almost) semi-cylindrical cryopumps that are essentially identical to the 2 halves of the ITER NB cryopump. As with the previous BLV option the beamline components may be removed for maintenance either vertically or horizontally.
Figure 1 : Neutral beam test facility, general infrastructure (the buildings are hidden)
The upper large opening (9.50 m x 2.55 m) allows vertical maintenance and easy diagnostic and man access (see figure 2 bellow). The maximum BLV height is limited to 4.4 m for transportability consideration. The elliptic shape is connected to the BSV cylinder through a stiff circular welding. The beam line vessel volume is ≈200 m3.
Figure 2 : The NBTF beam line vessel
and beam source vessel equiped with the beam line components and semi-cylindrical cryopumps
The proposed “Phase I operation” of the NBTF is dedicated to the qualification of the source and beam line components with short pulse operation (≈ 30 s). During this phase the flexibility offered by the MVHO (see figure 3.1) is considered a substantial advantage compared to using a sytem allowing only horizontal maintenance and limited access for diagnostics.
Diagnostic upper flange (9 tons)
Cryopump (6 tons)
BL Vessel (47 tons)
Calorimeter (2.5 tons)
HV Bushing (19 tons)
RID (4 tons) Neutraliser (14.5 tons)
Beam Source (26 tons)
BS Vessel (30 tons)
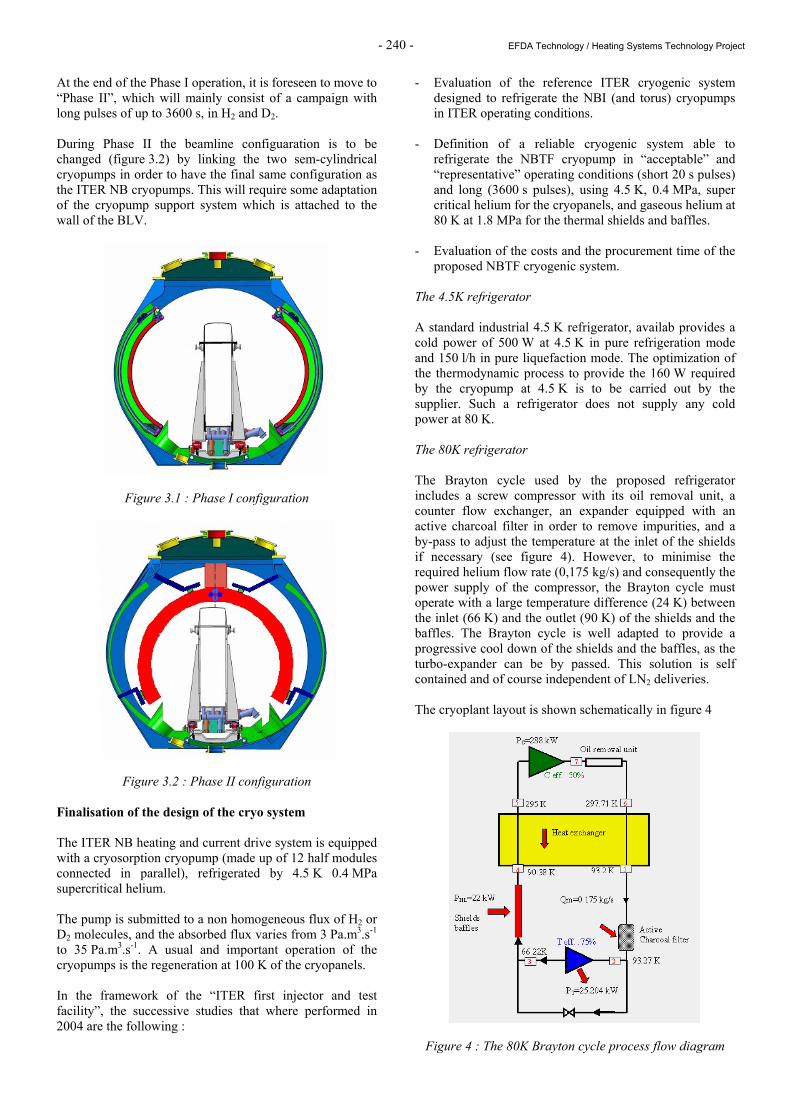
- 240 - EFDA Technology / Heating Systems Technology Project
At the end of the Phase I operation, it is foreseen to move to “Phase II”, which will mainly consist of a campaign with long pulses of up to 3600 s, in H2 and D2. During Phase II the beamline configuaration is to be changed (figure 3.2) by linking the two sem-cylindrical cryopumps in order to have the final same configuration as the ITER NB cryopumps. This will require some adaptation of the cryopump support system which is attached to the wall of the BLV.
Figure 3.1 : Phase I configuration
Figure 3.2 : Phase II configuration Finalisation of the design of the cryo system The ITER NB heating and current drive system is equipped with a cryosorption cryopump (made up of 12 half modules connected in parallel), refrigerated by 4.5 K 0.4 MPa supercritical helium. The pump is submitted to a non homogeneous flux of H2 or D2 molecules, and the absorbed flux varies from 3 Pa.m3.s-1 to 35 Pa.m3.s-1. A usual and important operation of the cryopumps is the regeneration at 100 K of the cryopanels. In the framework of the “ITER first injector and test facility”, the successive studies that where performed in 2004 are the following :
- Evaluation of the reference ITER cryogenic system designed to refrigerate the NBI (and torus) cryopumps in ITER operating conditions.
- Definition of a reliable cryogenic system able to
refrigerate the NBTF cryopump in “acceptable” and “representative” operating conditions (short 20 s pulses) and long (3600 s pulses), using 4.5 K, 0.4 MPa, super critical helium for the cryopanels, and gaseous helium at 80 K at 1.8 MPa for the thermal shields and baffles.
- Evaluation of the costs and the procurement time of the
proposed NBTF cryogenic system. The 4.5K refrigerator A standard industrial 4.5 K refrigerator, availab provides a cold power of 500 W at 4.5 K in pure refrigeration mode and 150 l/h in pure liquefaction mode. The optimization of the thermodynamic process to provide the 160 W required by the cryopump at 4.5 K is to be carried out by the supplier. Such a refrigerator does not supply any cold power at 80 K. The 80K refrigerator The Brayton cycle used by the proposed refrigerator includes a screw compressor with its oil removal unit, a counter flow exchanger, an expander equipped with an active charcoal filter in order to remove impurities, and a by-pass to adjust the temperature at the inlet of the shields if necessary (see figure 4). However, to minimise the required helium flow rate (0,175 kg/s) and consequently the power supply of the compressor, the Brayton cycle must operate with a large temperature difference (24 K) between the inlet (66 K) and the outlet (90 K) of the shields and the baffles. The Brayton cycle is well adapted to provide a progressive cool down of the shields and the baffles, as the turbo-expander can be by passed. This solution is self contained and of course independent of LN2 deliveries. The cryoplant layout is shown schematically in figure 4
Figure 4 : The 80K Brayton cycle process flow diagram
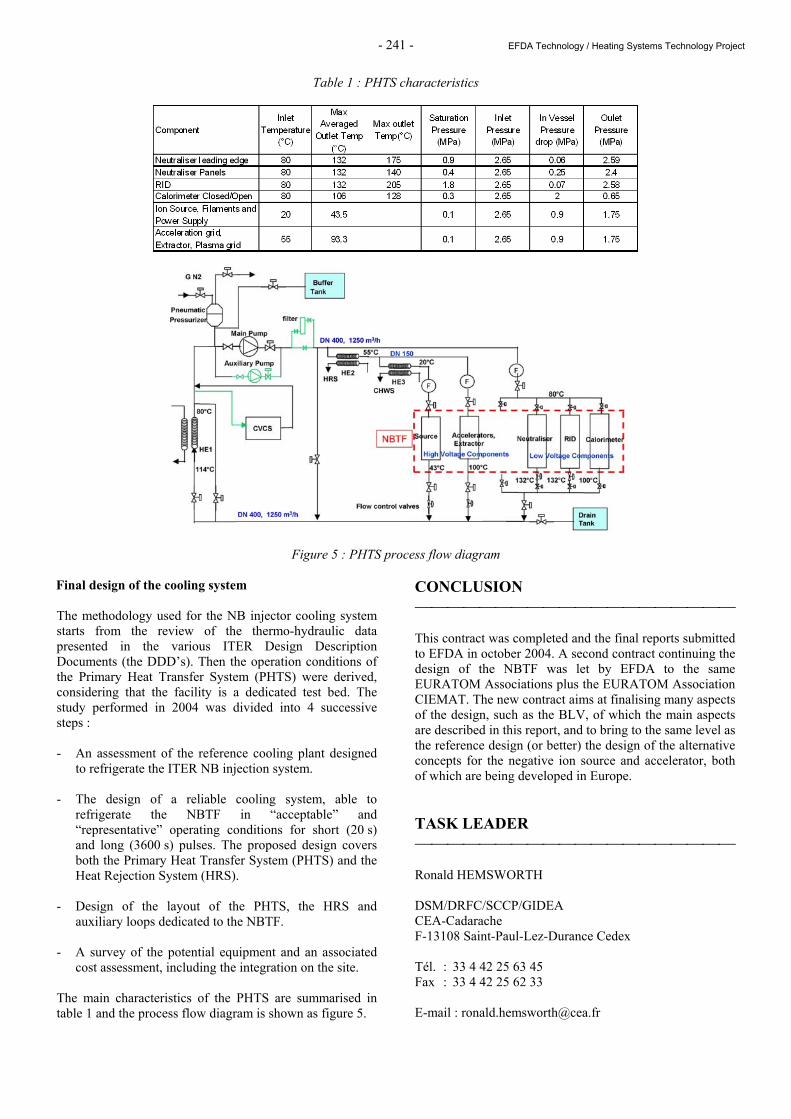
- 241 - EFDA Technology / Heating Systems Technology Project
Table 1 : PHTS characteristics
Figure 5 : PHTS process flow diagram Final design of the cooling system The methodology used for the NB injector cooling system starts from the review of the thermo-hydraulic data presented in the various ITER Design Description Documents (the DDD’s). Then the operation conditions of the Primary Heat Transfer System (PHTS) were derived, considering that the facility is a dedicated test bed. The study performed in 2004 was divided into 4 successive steps : - An assessment of the reference cooling plant designed
to refrigerate the ITER NB injection system. - The design of a reliable cooling system, able to
refrigerate the NBTF in “acceptable” and “representative” operating conditions for short (20 s) and long (3600 s) pulses. The proposed design covers both the Primary Heat Transfer System (PHTS) and the Heat Rejection System (HRS).
- Design of the layout of the PHTS, the HRS and
auxiliary loops dedicated to the NBTF. - A survey of the potential equipment and an associated
cost assessment, including the integration on the site. The main characteristics of the PHTS are summarised in table 1 and the process flow diagram is shown as figure 5.
CONCLUSION This contract was completed and the final reports submitted to EFDA in october 2004. A second contract continuing the design of the NBTF was let by EFDA to the same EURATOM Associations plus the EURATOM Association CIEMAT. The new contract aims at finalising many aspects of the design, such as the BLV, of which the main aspects are described in this report, and to bring to the same level as the reference design (or better) the design of the alternative concepts for the negative ion source and accelerator, both of which are being developed in Europe. TASK LEADER Ronald HEMSWORTH DSM/DRFC/SCCP/GIDEA CEA-Cadarache F-13108 Saint-Paul-Lez-Durance Cedex Tél. : 33 4 42 25 63 45 Fax : 33 4 42 25 62 33 E-mail : [email protected]

- 242 - EFDA Technology / Heating Systems Technology Project
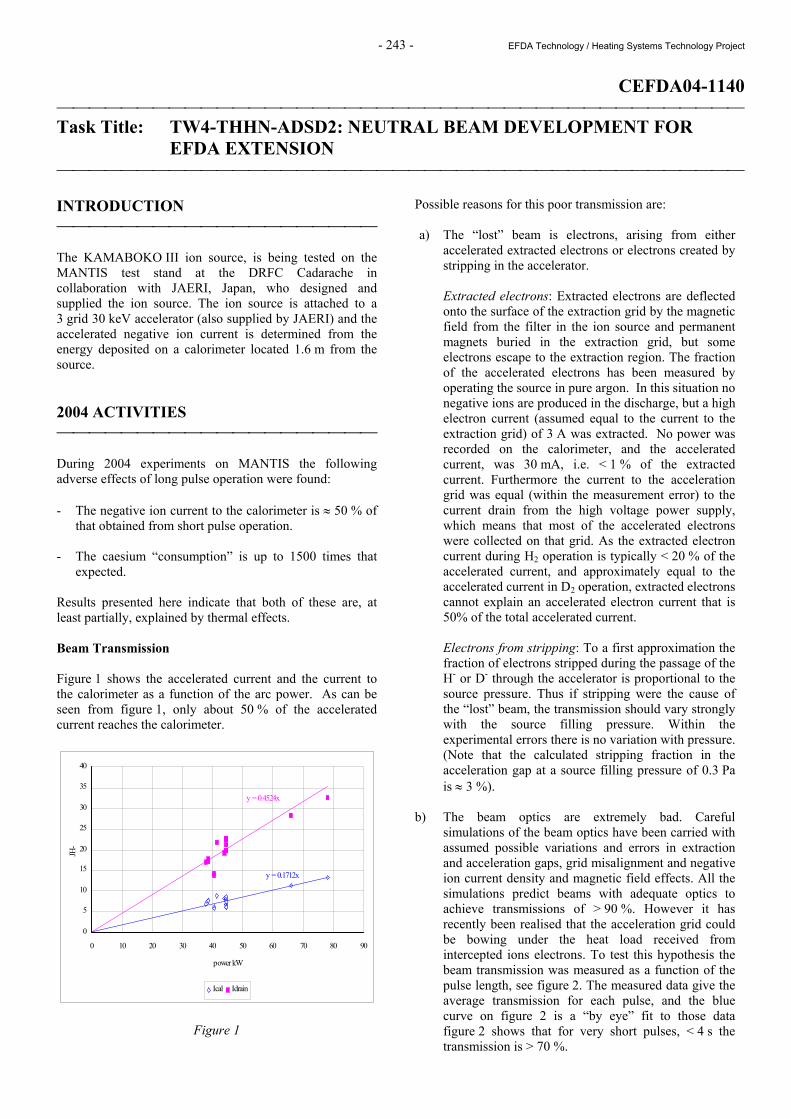
- 243 - EFDA Technology / Heating Systems Technology Project
CEFDA04-1140 Task Title: TW4-THHN-ADSD2: NEUTRAL BEAM DEVELOPMENT FOR
EFDA EXTENSION INTRODUCTION The KAMABOKO III ion source, is being tested on the MANTIS test stand at the DRFC Cadarache in collaboration with JAERI, Japan, who designed and supplied the ion source. The ion source is attached to a 3 grid 30 keV accelerator (also supplied by JAERI) and the accelerated negative ion current is determined from the energy deposited on a calorimeter located 1.6 m from the source. 2004 ACTIVITIES During 2004 experiments on MANTIS the following adverse effects of long pulse operation were found: - The negative ion current to the calorimeter is ≈ 50 % of
that obtained from short pulse operation. - The caesium “consumption” is up to 1500 times that
expected. Results presented here indicate that both of these are, at least partially, explained by thermal effects. Beam Transmission Figure 1 shows the accelerated current and the current to the calorimeter as a function of the arc power. As can be seen from figure 1, only about 50 % of the accelerated current reaches the calorimeter.
y = 0.1712x
y = 0.4524x
0
5
10
15
20
25
30
35
40
0 10 20 30 40 50 60 70 80 90
power kW
JH-
Ical Idrain
Figure 1
Possible reasons for this poor transmission are: a) The “lost” beam is electrons, arising from either
accelerated extracted electrons or electrons created by stripping in the accelerator. Extracted electrons: Extracted electrons are deflected onto the surface of the extraction grid by the magnetic field from the filter in the ion source and permanent magnets buried in the extraction grid, but some electrons escape to the extraction region. The fraction of the accelerated electrons has been measured by operating the source in pure argon. In this situation no negative ions are produced in the discharge, but a high electron current (assumed equal to the current to the extraction grid) of 3 A was extracted. No power was recorded on the calorimeter, and the accelerated current, was 30 mA, i.e. < 1 % of the extracted current. Furthermore the current to the acceleration grid was equal (within the measurement error) to the current drain from the high voltage power supply, which means that most of the accelerated electrons were collected on that grid. As the extracted electron current during H2 operation is typically < 20 % of the accelerated current, and approximately equal to the accelerated current in D2 operation, extracted electrons cannot explain an accelerated electron current that is 50% of the total accelerated current. Electrons from stripping: To a first approximation the fraction of electrons stripped during the passage of the H- or D- through the accelerator is proportional to the source pressure. Thus if stripping were the cause of the “lost” beam, the transmission should vary strongly with the source filling pressure. Within the experimental errors there is no variation with pressure. (Note that the calculated stripping fraction in the acceleration gap at a source filling pressure of 0.3 Pa is ≈ 3 %).
b) The beam optics are extremely bad. Careful simulations of the beam optics have been carried with assumed possible variations and errors in extraction and acceleration gaps, grid misalignment and negative ion current density and magnetic field effects. All the simulations predict beams with adequate optics to achieve transmissions of > 90 %. However it has recently been realised that the acceleration grid could be bowing under the heat load received from intercepted ions electrons. To test this hypothesis the beam transmission was measured as a function of the pulse length, see figure 2. The measured data give the average transmission for each pulse, and the blue curve on figure 2 is a “by eye” fit to those data figure 2 shows that for very short pulses, < 4 s the transmission is > 70 %.
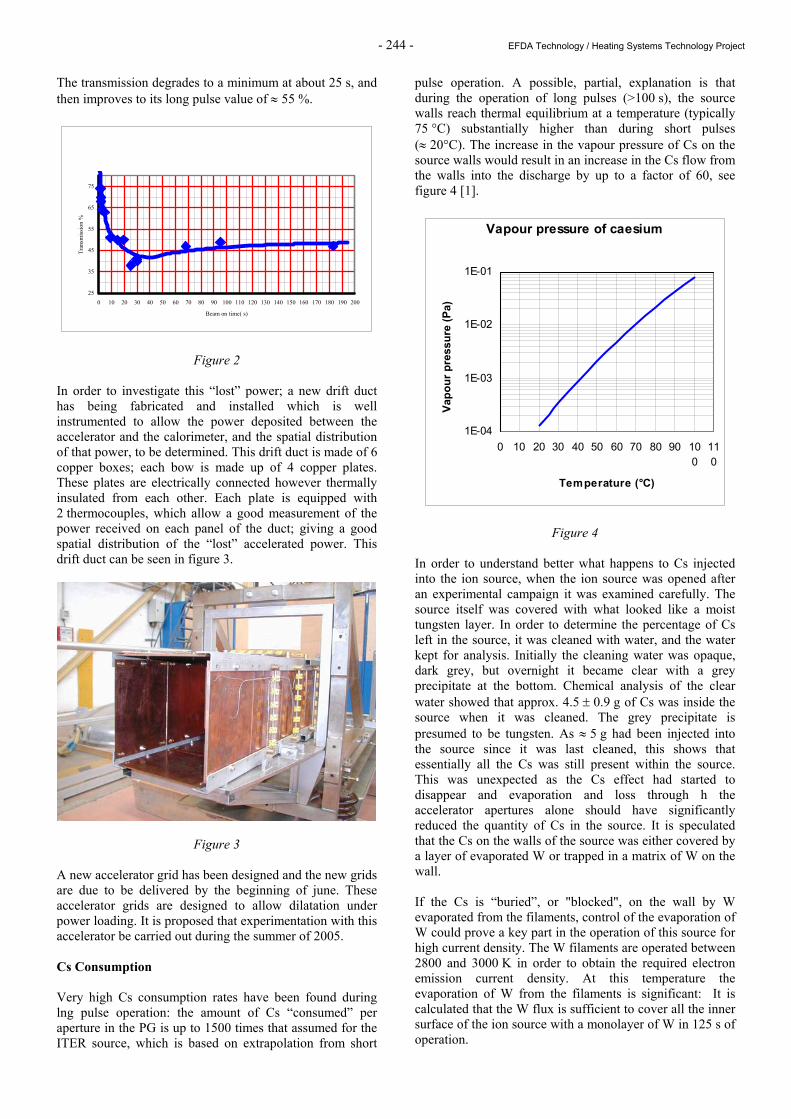
- 244 - EFDA Technology / Heating Systems Technology Project
The transmission degrades to a minimum at about 25 s, and then improves to its long pulse value of ≈ 55 %.
25
35
45
55
65
75
0 10 20 30 40 50 60 70 80 90 100 110 120 130 140 150 160 170 180 190 200
Beam on time( s)
Tran
smis
sion
%
Figure 2 In order to investigate this “lost” power; a new drift duct has being fabricated and installed which is well instrumented to allow the power deposited between the accelerator and the calorimeter, and the spatial distribution of that power, to be determined. This drift duct is made of 6 copper boxes; each bow is made up of 4 copper plates. These plates are electrically connected however thermally insulated from each other. Each plate is equipped with 2 thermocouples, which allow a good measurement of the power received on each panel of the duct; giving a good spatial distribution of the “lost” accelerated power. This drift duct can be seen in figure 3.
Figure 3 A new accelerator grid has been designed and the new grids are due to be delivered by the beginning of june. These accelerator grids are designed to allow dilatation under power loading. It is proposed that experimentation with this accelerator be carried out during the summer of 2005. Cs Consumption Very high Cs consumption rates have been found during lng pulse operation: the amount of Cs “consumed” per aperture in the PG is up to 1500 times that assumed for the ITER source, which is based on extrapolation from short
pulse operation. A possible, partial, explanation is that during the operation of long pulses (>100 s), the source walls reach thermal equilibrium at a temperature (typically 75 °C) substantially higher than during short pulses (≈ 20°C). The increase in the vapour pressure of Cs on the source walls would result in an increase in the Cs flow from the walls into the discharge by up to a factor of 60, see figure 4 [1].
Vapour pressure of caesium
1E-04
1E-03
1E-02
1E-01
0 10 20 30 40 50 60 70 80 90 100
110
Temperature (°C)
Vapo
ur p
ress
ure
(Pa)
Figure 4 In order to understand better what happens to Cs injected into the ion source, when the ion source was opened after an experimental campaign it was examined carefully. The source itself was covered with what looked like a moist tungsten layer. In order to determine the percentage of Cs left in the source, it was cleaned with water, and the water kept for analysis. Initially the cleaning water was opaque, dark grey, but overnight it became clear with a grey precipitate at the bottom. Chemical analysis of the clear water showed that approx. 4.5 ± 0.9 g of Cs was inside the source when it was cleaned. The grey precipitate is presumed to be tungsten. As ≈ 5 g had been injected into the source since it was last cleaned, this shows that essentially all the Cs was still present within the source. This was unexpected as the Cs effect had started to disappear and evaporation and loss through h the accelerator apertures alone should have significantly reduced the quantity of Cs in the source. It is speculated that the Cs on the walls of the source was either covered by a layer of evaporated W or trapped in a matrix of W on the wall. If the Cs is “buried”, or "blocked", on the wall by W evaporated from the filaments, control of the evaporation of W could prove a key part in the operation of this source for high current density. The W filaments are operated between 2800 and 3000 K in order to obtain the required electron emission current density. At this temperature the evaporation of W from the filaments is significant: It is calculated that the W flux is sufficient to cover all the inner surface of the ion source with a monolayer of W in 125 s of operation.
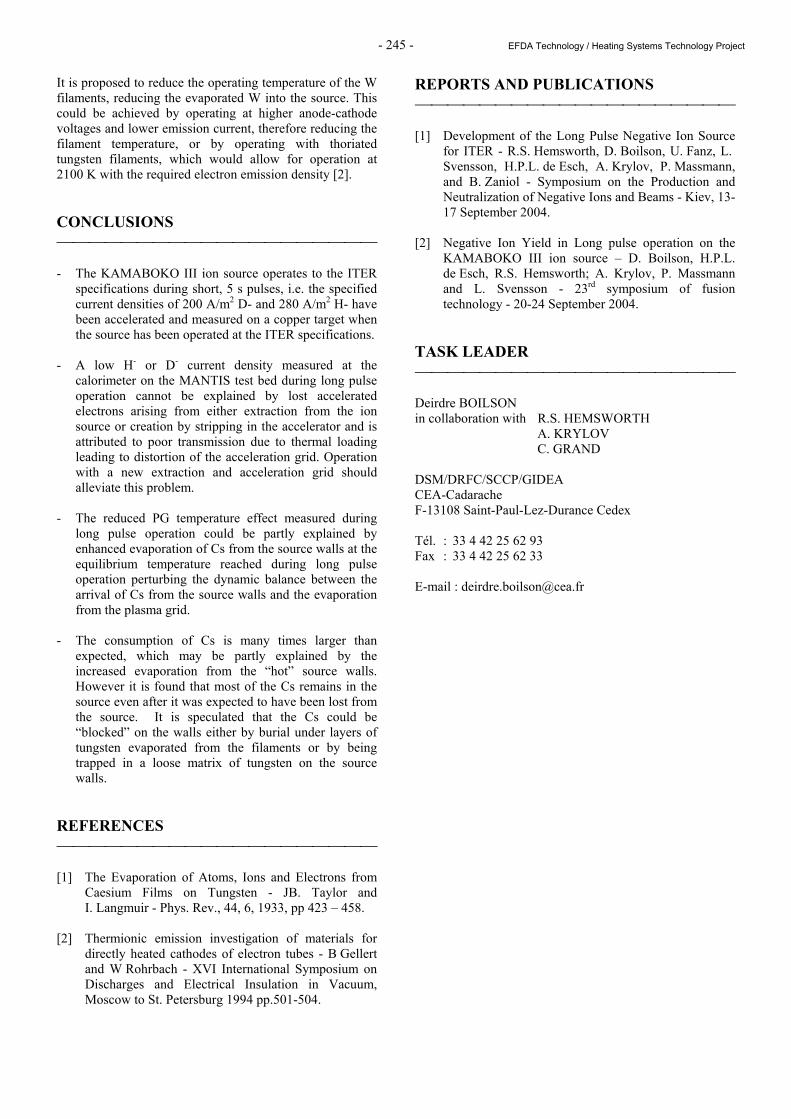
- 245 - EFDA Technology / Heating Systems Technology Project
It is proposed to reduce the operating temperature of the W filaments, reducing the evaporated W into the source. This could be achieved by operating at higher anode-cathode voltages and lower emission current, therefore reducing the filament temperature, or by operating with thoriated tungsten filaments, which would allow for operation at 2100 K with the required electron emission density [2]. CONCLUSIONS - The KAMABOKO III ion source operates to the ITER
specifications during short, 5 s pulses, i.e. the specified current densities of 200 A/m2 D- and 280 A/m2 H- have been accelerated and measured on a copper target when the source has been operated at the ITER specifications.
- A low H- or D- current density measured at the
calorimeter on the MANTIS test bed during long pulse operation cannot be explained by lost accelerated electrons arising from either extraction from the ion source or creation by stripping in the accelerator and is attributed to poor transmission due to thermal loading leading to distortion of the acceleration grid. Operation with a new extraction and acceleration grid should alleviate this problem.
- The reduced PG temperature effect measured during
long pulse operation could be partly explained by enhanced evaporation of Cs from the source walls at the equilibrium temperature reached during long pulse operation perturbing the dynamic balance between the arrival of Cs from the source walls and the evaporation from the plasma grid.
- The consumption of Cs is many times larger than
expected, which may be partly explained by the increased evaporation from the “hot” source walls. However it is found that most of the Cs remains in the source even after it was expected to have been lost from the source. It is speculated that the Cs could be “blocked” on the walls either by burial under layers of tungsten evaporated from the filaments or by being trapped in a loose matrix of tungsten on the source walls.
REFERENCES [1] The Evaporation of Atoms, Ions and Electrons from
Caesium Films on Tungsten - JB. Taylor and I. Langmuir - Phys. Rev., 44, 6, 1933, pp 423 – 458.
[2] Thermionic emission investigation of materials for
directly heated cathodes of electron tubes - B Gellert and W Rohrbach - XVI International Symposium on Discharges and Electrical Insulation in Vacuum, Moscow to St. Petersburg 1994 pp.501-504.
REPORTS AND PUBLICATIONS [1] Development of the Long Pulse Negative Ion Source
for ITER - R.S. Hemsworth, D. Boilson, U. Fanz, L. Svensson, H.P.L. de Esch, A. Krylov, P. Massmann, and B. Zaniol - Symposium on the Production and Neutralization of Negative Ions and Beams - Kiev, 13-17 September 2004.
[2] Negative Ion Yield in Long pulse operation on the
KAMABOKO III ion source – D. Boilson, H.P.L. de Esch, R.S. Hemsworth; A. Krylov, P. Massmann and L. Svensson - 23rd symposium of fusion technology - 20-24 September 2004.
TASK LEADER Deirdre BOILSON in collaboration with R.S. HEMSWORTH A. KRYLOV C. GRAND DSM/DRFC/SCCP/GIDEA CEA-Cadarache F-13108 Saint-Paul-Lez-Durance Cedex Tél. : 33 4 42 25 62 93 Fax : 33 4 42 25 62 33 E-mail : [email protected]

- 246 - EFDA Technology / Heating Systems Technology Project
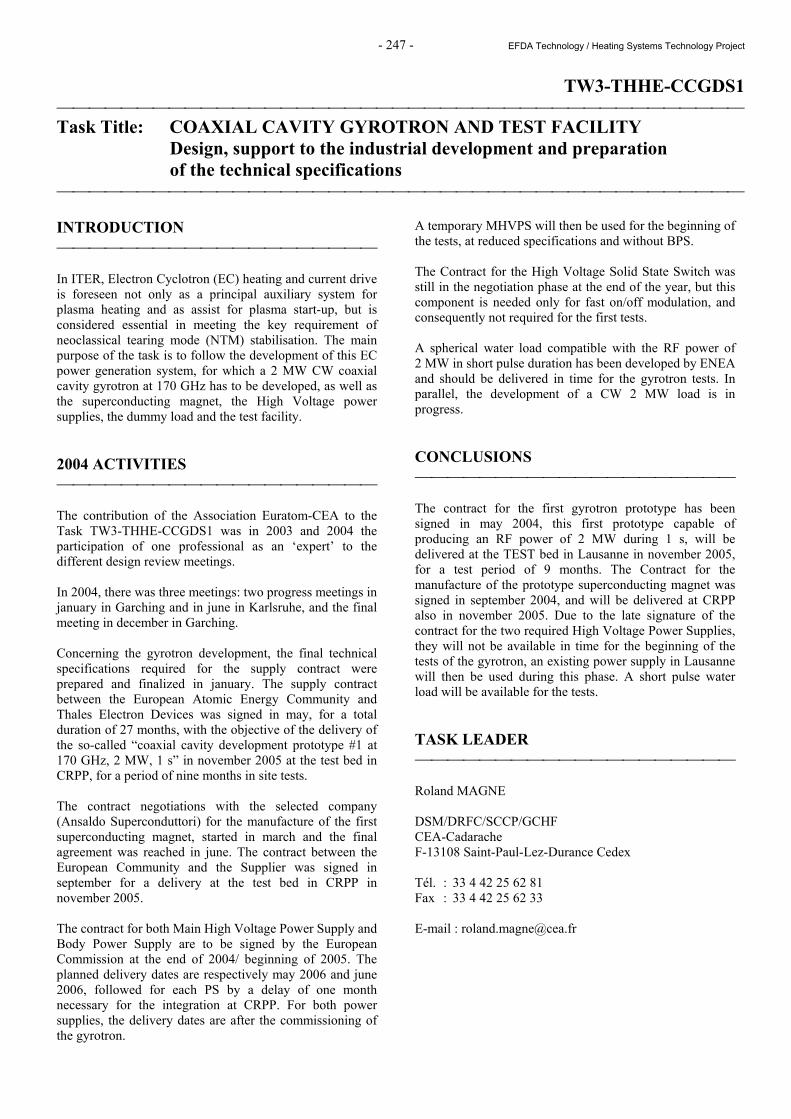
- 247 - EFDA Technology / Heating Systems Technology Project
TW3-THHE-CCGDS1 Task Title: COAXIAL CAVITY GYROTRON AND TEST FACILITY Design, support to the industrial development and preparation
of the technical specifications INTRODUCTION In ITER, Electron Cyclotron (EC) heating and current drive is foreseen not only as a principal auxiliary system for plasma heating and as assist for plasma start-up, but is considered essential in meeting the key requirement of neoclassical tearing mode (NTM) stabilisation. The main purpose of the task is to follow the development of this EC power generation system, for which a 2 MW CW coaxial cavity gyrotron at 170 GHz has to be developed, as well as the superconducting magnet, the High Voltage power supplies, the dummy load and the test facility. 2004 ACTIVITIES The contribution of the Association Euratom-CEA to the Task TW3-THHE-CCGDS1 was in 2003 and 2004 the participation of one professional as an ‘expert’ to the different design review meetings. In 2004, there was three meetings: two progress meetings in january in Garching and in june in Karlsruhe, and the final meeting in december in Garching. Concerning the gyrotron development, the final technical specifications required for the supply contract were prepared and finalized in january. The supply contract between the European Atomic Energy Community and Thales Electron Devices was signed in may, for a total duration of 27 months, with the objective of the delivery of the so-called “coaxial cavity development prototype #1 at 170 GHz, 2 MW, 1 s” in november 2005 at the test bed in CRPP, for a period of nine months in site tests. The contract negotiations with the selected company (Ansaldo Superconduttori) for the manufacture of the first superconducting magnet, started in march and the final agreement was reached in june. The contract between the European Community and the Supplier was signed in september for a delivery at the test bed in CRPP in november 2005. The contract for both Main High Voltage Power Supply and Body Power Supply are to be signed by the European Commission at the end of 2004/ beginning of 2005. The planned delivery dates are respectively may 2006 and june 2006, followed for each PS by a delay of one month necessary for the integration at CRPP. For both power supplies, the delivery dates are after the commissioning of the gyrotron.
A temporary MHVPS will then be used for the beginning of the tests, at reduced specifications and without BPS. The Contract for the High Voltage Solid State Switch was still in the negotiation phase at the end of the year, but this component is needed only for fast on/off modulation, and consequently not required for the first tests. A spherical water load compatible with the RF power of 2 MW in short pulse duration has been developed by ENEA and should be delivered in time for the gyrotron tests. In parallel, the development of a CW 2 MW load is in progress. CONCLUSIONS The contract for the first gyrotron prototype has been signed in may 2004, this first prototype capable of producing an RF power of 2 MW during 1 s, will be delivered at the TEST bed in Lausanne in november 2005, for a test period of 9 months. The Contract for the manufacture of the prototype superconducting magnet was signed in september 2004, and will be delivered at CRPP also in november 2005. Due to the late signature of the contract for the two required High Voltage Power Supplies, they will not be available in time for the beginning of the tests of the gyrotron, an existing power supply in Lausanne will then be used during this phase. A short pulse water load will be available for the tests. TASK LEADER Roland MAGNE DSM/DRFC/SCCP/GCHF CEA-Cadarache F-13108 Saint-Paul-Lez-Durance Cedex Tél. : 33 4 42 25 62 81 Fax : 33 4 42 25 62 33 E-mail : [email protected]

- 248 - EFDA Technology / Heating Systems Technology Project
- 249 - EFDA Technology / Heating Systems Technology Project
TW3-THHI-GTFDS1 Task Title: FUSION DIACRODE, IC RF GENERATOR, IC POWER SUPPLY
AN IC TEST FACILITY Design, support to the industrial development and preparation
of the technical specifications INTRODUCTION Ion Cyclotron heating and current drive auxiliary heating method requires a Radio Frequency (RF) power source capable of an efficient continuous operation on a highly variable load, for future experiments in existing European fusion laboratories and for ITER operation. High Standing Wave Ratio (VSWR) and RF power level are required for auxiliary heating operation in high confinement plasmas such as ITER-relevant high β plasma scenarios. The RF power source consists of a three stages electronic tubes amplifier driven by a solid-state RF source. Although there is no problem to build low power amplification stages, no existing end stage is yet capable of the required performance. Therefore, the development of a new-generation of RF power sources is needed; it would be both a technical and a financial advantage if one single source could be developed in European Union (EU). Fusion laboratories and ITER could take benefit from it. The aim of this project is the construction by industry of a RF power source capable of the required performance. In response to a European Fusion Development Agreement (EFDA) call of expression of interest, CEA offers to provide technical assistance to the EFDA development of the RF power source within the more general framework of a coordinated effort among European Associations, with CEA acting as the leading Association. In particular, CEA offers technical assistance as required for the industrial development and testing and full responsibility for construction and operation of a high power steady state test facility at Tore Supra (TS) Cadarache site. A CCFW subgroup, including all interested Fusion Associations representatives has defined and agreed detailed technical specifications for a high power RF source. Everybody agreed that a technological step is required to meet the specifications of high power RF sources, which will be used on future fusion experiments as ITER, W7X, JET-EP or Tore Supra CIMES project. The alternative using of a high power diacrode leads to a simpler generator with less components for which maintenance and reliability appear more attractive. A call for tender has been done and EFDA is now ready to place an order for a prototype of RF high power source. The first step of the task is now completed, however, the task has been suspended as long as ITER negotiations haven’t been completed.
CONCLUSIONS Today, many parts of the task are completed. Technical specification have been written, a call for tender have been done and EFDA received an offer from the industry on july 2003. The Technical Evaluation Group meeting took place on july 2003 and EFDA is now ready to place an order for the IC RF generator. At the same time the ICRF system is a matter of negotiations for ITER. So EFDA decided on september 2003 to put on standby the ICRF generator R&D, pending the ITER decision, and to extend task TW3-THHI-GTFDS1 of one year till the end of 2005. REFERENCES - ITER Design - Task EU-D350 (DEC 1999) and
associated NET Task. - New power gridded tube in fusion applications -
Thomson Tubes Electroniques - Second Europhisics Topical Conference on RF Heating and Current Drive of Fusion Devices - Brussels - 20-23 january 1998.
- A new generation of gridded tubes for cw operation on
new fusion magnetic machines applications - Thomson Tubes Electroniques - 1997 Symposium on fusion Engineering - San Diego, California - october 6-10, 1997.
- Joint USDOE/General Atomics and Varian Power Grid
and & X-RAY Tube products Development Project for X2242/X2274 Anode Cooling Upgrade and Improved Grid RF performance - december 1990.
- EIMAC 4CM2500KG tetrode data sheet. - Thales Electron Devices TH525 and TH526 tetrodes
data sheets.
- 250 - EFDA Technology / Heating Systems Technology Project
REPORTS AND PUBLICATIONS - Note CH/CCH 2003/015 - Tâche EFDA TW3.THHI.
GTFDS1 - Cahier des charges du Fusion Diacrode Assembly - 28 may 2003.
- Note CH/CRM 2003/001 - Tâche EFDA TW3.THHI.
GTFDS1 - First intermediate report and review meeting - EFDA GARCHING (Germany) - 31 january 2003.
- Note CH/CRM 2003/003 - Tâche EFDA TW3.THHI.
GTFDS1 - Intermediate report and review meeting. Technical Evaluation Group - EFDA GARCHING (Germany) - 24 july 2003.
- Note CH/CCH 2003/016 - Spécifications techniques
d’une charge HF 3 MW pour le test d’un prototype de générateur FCI pour ITER. - 16 june 2003.
- Note CH/CRM 2003/002 - Tâche EFDA TW3.THHI.
GTFDS1 - Compte rendu de réunion dans les locaux de la société Thales Electron Devices - Thonon les bains - 03 april 2003.
TASK LEADER Patrick MOLLARD DSM/DRFC/SCCP CEA-Cadarache F-13108 Saint-Paul-Lez-Durance Cedex Tél. : 33 4 42 25 32 54 Fax : 33 4 42 25 62 33 E-mail : [email protected]
- 251 -
UNDERLYING TECHNOLOGY PROGRAMME
EFDA Technology
1- Vessel/In Vessel - Plasma Facing Components - Assembly and Maintenance2 - Tritium Breeding
and Materials - Breeding blankets - Materials development
3 - Safety & Environment

- 252 -
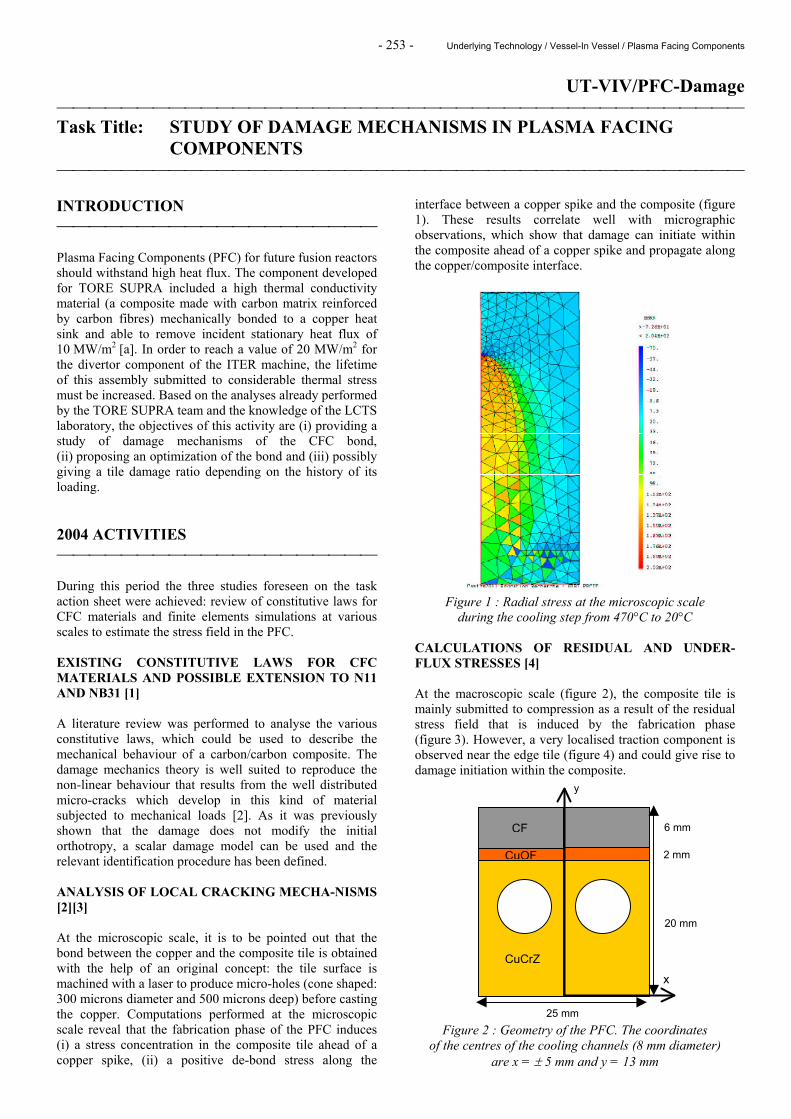
- 253 - Underlying Technology / Vessel-In Vessel / Plasma Facing Components
UT-VIV/PFC-Damage Task Title: STUDY OF DAMAGE MECHANISMS IN PLASMA FACING
COMPONENTS INTRODUCTION Plasma Facing Components (PFC) for future fusion reactors should withstand high heat flux. The component developed for TORE SUPRA included a high thermal conductivity material (a composite made with carbon matrix reinforced by carbon fibres) mechanically bonded to a copper heat sink and able to remove incident stationary heat flux of 10 MW/m2 [a]. In order to reach a value of 20 MW/m2 for the divertor component of the ITER machine, the lifetime of this assembly submitted to considerable thermal stress must be increased. Based on the analyses already performed by the TORE SUPRA team and the knowledge of the LCTS laboratory, the objectives of this activity are (i) providing a study of damage mechanisms of the CFC bond, (ii) proposing an optimization of the bond and (iii) possibly giving a tile damage ratio depending on the history of its loading. 2004 ACTIVITIES During this period the three studies foreseen on the task action sheet were achieved: review of constitutive laws for CFC materials and finite elements simulations at various scales to estimate the stress field in the PFC. EXISTING CONSTITUTIVE LAWS FOR CFC MATERIALS AND POSSIBLE EXTENSION TO N11 AND NB31 [1] A literature review was performed to analyse the various constitutive laws, which could be used to describe the mechanical behaviour of a carbon/carbon composite. The damage mechanics theory is well suited to reproduce the non-linear behaviour that results from the well distributed micro-cracks which develop in this kind of material subjected to mechanical loads [2]. As it was previously shown that the damage does not modify the initial orthotropy, a scalar damage model can be used and the relevant identification procedure has been defined. ANALYSIS OF LOCAL CRACKING MECHA-NISMS [2][3] At the microscopic scale, it is to be pointed out that the bond between the copper and the composite tile is obtained with the help of an original concept: the tile surface is machined with a laser to produce micro-holes (cone shaped: 300 microns diameter and 500 microns deep) before casting the copper. Computations performed at the microscopic scale reveal that the fabrication phase of the PFC induces (i) a stress concentration in the composite tile ahead of a copper spike, (ii) a positive de-bond stress along the
interface between a copper spike and the composite (figure 1). These results correlate well with micrographic observations, which show that damage can initiate within the composite ahead of a copper spike and propagate along the copper/composite interface.
Figure 1 : Radial stress at the microscopic scale during the cooling step from 470°C to 20°C
CALCULATIONS OF RESIDUAL AND UNDER-FLUX STRESSES [4] At the macroscopic scale (figure 2), the composite tile is mainly submitted to compression as a result of the residual stress field that is induced by the fabrication phase (figure 3). However, a very localised traction component is observed near the edge tile (figure 4) and could give rise to damage initiation within the composite.
Figure 2 : Geometry of the PFC. The coordinates of the centres of the cooling channels (8 mm diameter)
are x = ± 5 mm and y = 13 mm
25 mm
y
x
CF
CuOF
CuCrZ
2 mm
6 mm
20 mm
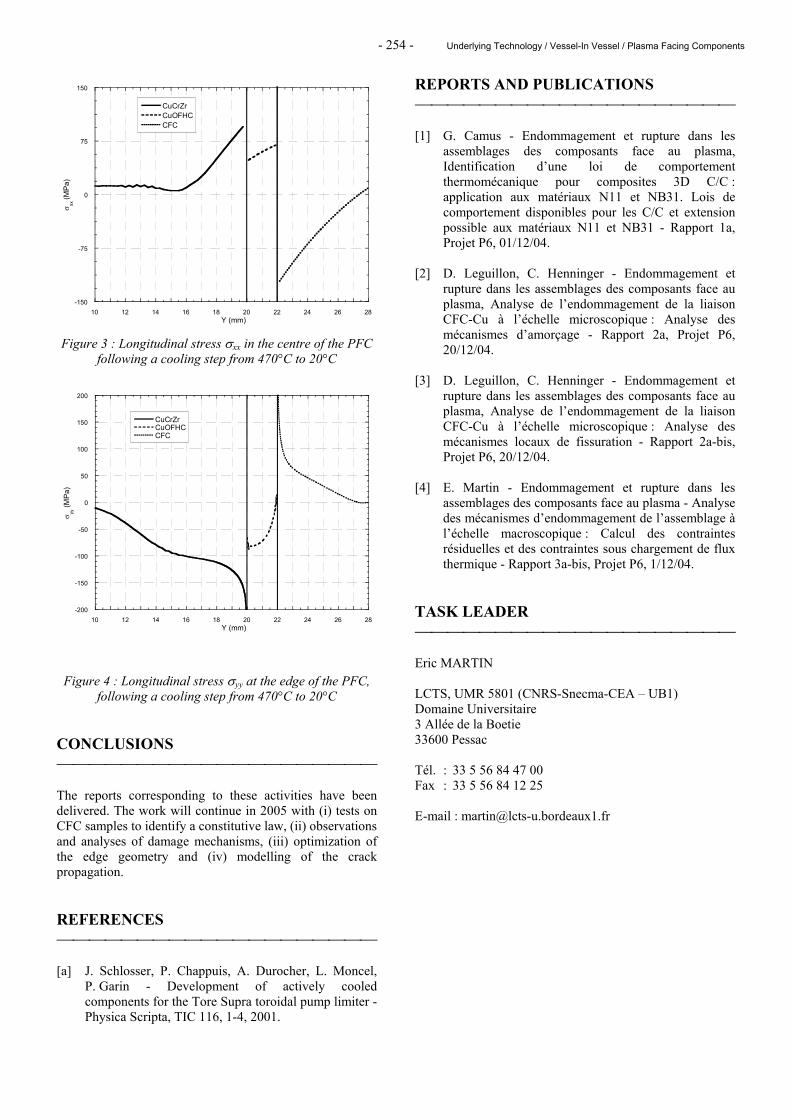
- 254 - Underlying Technology / Vessel-In Vessel / Plasma Facing Components
Figure 3 : Longitudinal stress σxx in the centre of the PFC
following a cooling step from 470°C to 20°C
Figure 4 : Longitudinal stress σyy at the edge of the PFC, following a cooling step from 470°C to 20°C
CONCLUSIONS The reports corresponding to these activities have been delivered. The work will continue in 2005 with (i) tests on CFC samples to identify a constitutive law, (ii) observations and analyses of damage mechanisms, (iii) optimization of the edge geometry and (iv) modelling of the crack propagation. REFERENCES [a] J. Schlosser, P. Chappuis, A. Durocher, L. Moncel,
P. Garin - Development of actively cooled components for the Tore Supra toroidal pump limiter - Physica Scripta, TIC 116, 1-4, 2001.
REPORTS AND PUBLICATIONS [1] G. Camus - Endommagement et rupture dans les
assemblages des composants face au plasma, Identification d’une loi de comportement thermomécanique pour composites 3D C/C : application aux matériaux N11 et NB31. Lois de comportement disponibles pour les C/C et extension possible aux matériaux N11 et NB31 - Rapport 1a, Projet P6, 01/12/04.
[2] D. Leguillon, C. Henninger - Endommagement et
rupture dans les assemblages des composants face au plasma, Analyse de l’endommagement de la liaison CFC-Cu à l’échelle microscopique : Analyse des mécanismes d’amorçage - Rapport 2a, Projet P6, 20/12/04.
[3] D. Leguillon, C. Henninger - Endommagement et
rupture dans les assemblages des composants face au plasma, Analyse de l’endommagement de la liaison CFC-Cu à l’échelle microscopique : Analyse des mécanismes locaux de fissuration - Rapport 2a-bis, Projet P6, 20/12/04.
[4] E. Martin - Endommagement et rupture dans les
assemblages des composants face au plasma - Analyse des mécanismes d’endommagement de l’assemblage à l’échelle macroscopique : Calcul des contraintes résiduelles et des contraintes sous chargement de flux thermique - Rapport 3a-bis, Projet P6, 1/12/04.
TASK LEADER Eric MARTIN LCTS, UMR 5801 (CNRS-Snecma-CEA – UB1) Domaine Universitaire 3 Allée de la Boetie 33600 Pessac Tél. : 33 5 56 84 47 00 Fax : 33 5 56 84 12 25 E-mail : [email protected]
-150
-75
0
75
150
10 12 14 16 18 20 22 24 26 28
CuCrZrCuOFHCCFC
σ xx (M
Pa)
Y (mm)
-200
-150
-100
-50
0
50
100
150
200
10 12 14 16 18 20 22 24 26 28
CuCrZrCuOFHCCFC
σ yy (M
Pa)
Y (mm)
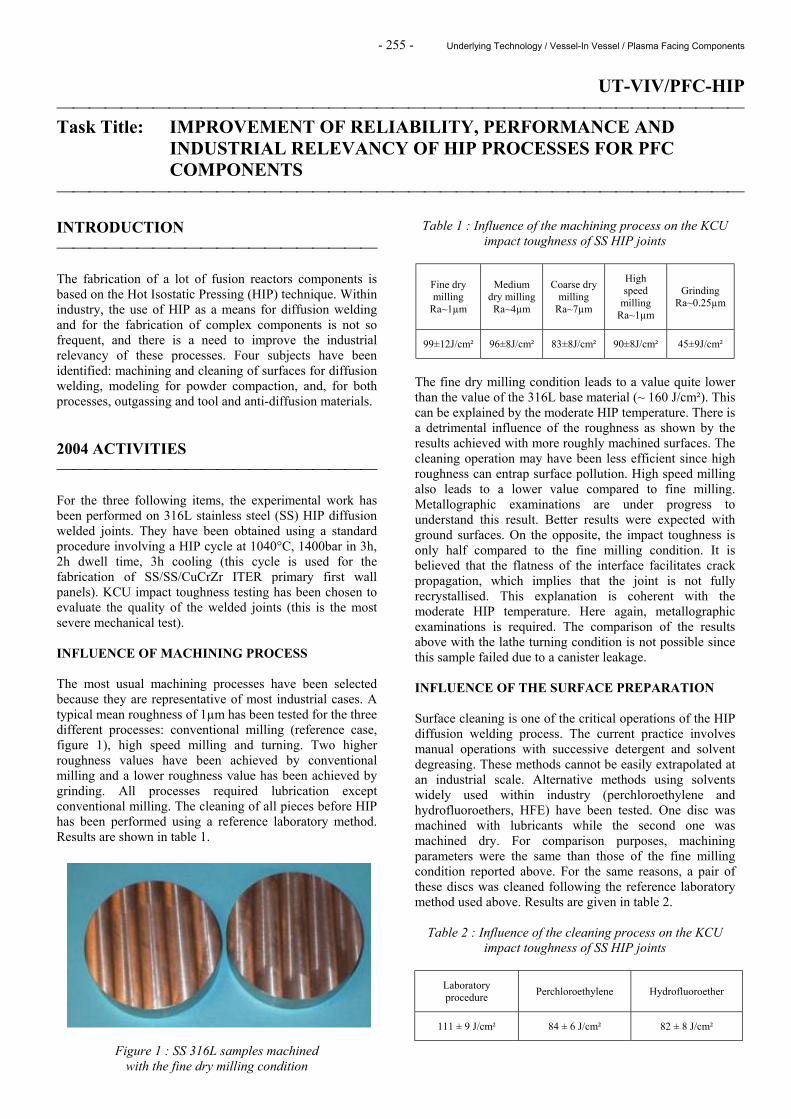
- 255 - Underlying Technology / Vessel-In Vessel / Plasma Facing Components
UT-VIV/PFC-HIP Task Title: IMPROVEMENT OF RELIABILITY, PERFORMANCE AND
INDUSTRIAL RELEVANCY OF HIP PROCESSES FOR PFC COMPONENTS
INTRODUCTION The fabrication of a lot of fusion reactors components is based on the Hot Isostatic Pressing (HIP) technique. Within industry, the use of HIP as a means for diffusion welding and for the fabrication of complex components is not so frequent, and there is a need to improve the industrial relevancy of these processes. Four subjects have been identified: machining and cleaning of surfaces for diffusion welding, modeling for powder compaction, and, for both processes, outgassing and tool and anti-diffusion materials. 2004 ACTIVITIES For the three following items, the experimental work has been performed on 316L stainless steel (SS) HIP diffusion welded joints. They have been obtained using a standard procedure involving a HIP cycle at 1040°C, 1400bar in 3h, 2h dwell time, 3h cooling (this cycle is used for the fabrication of SS/SS/CuCrZr ITER primary first wall panels). KCU impact toughness testing has been chosen to evaluate the quality of the welded joints (this is the most severe mechanical test). INFLUENCE OF MACHINING PROCESS The most usual machining processes have been selected because they are representative of most industrial cases. A typical mean roughness of 1µm has been tested for the three different processes: conventional milling (reference case, figure 1), high speed milling and turning. Two higher roughness values have been achieved by conventional milling and a lower roughness value has been achieved by grinding. All processes required lubrication except conventional milling. The cleaning of all pieces before HIP has been performed using a reference laboratory method. Results are shown in table 1.
Figure 1 : SS 316L samples machined with the fine dry milling condition
Table 1 : Influence of the machining process on the KCU impact toughness of SS HIP joints
Fine dry milling
Ra~1µm
Medium dry milling Ra~4µm
Coarse dry milling
Ra~7µm
High speed
milling Ra~1µm
Grinding Ra~0.25µm
99±12J/cm² 96±8J/cm² 83±8J/cm² 90±8J/cm² 45±9J/cm²
The fine dry milling condition leads to a value quite lower than the value of the 316L base material (~ 160 J/cm²). This can be explained by the moderate HIP temperature. There is a detrimental influence of the roughness as shown by the results achieved with more roughly machined surfaces. The cleaning operation may have been less efficient since high roughness can entrap surface pollution. High speed milling also leads to a lower value compared to fine milling. Metallographic examinations are under progress to understand this result. Better results were expected with ground surfaces. On the opposite, the impact toughness is only half compared to the fine milling condition. It is believed that the flatness of the interface facilitates crack propagation, which implies that the joint is not fully recrystallised. This explanation is coherent with the moderate HIP temperature. Here again, metallographic examinations is required. The comparison of the results above with the lathe turning condition is not possible since this sample failed due to a canister leakage. INFLUENCE OF THE SURFACE PREPARATION Surface cleaning is one of the critical operations of the HIP diffusion welding process. The current practice involves manual operations with successive detergent and solvent degreasing. These methods cannot be easily extrapolated at an industrial scale. Alternative methods using solvents widely used within industry (perchloroethylene and hydrofluoroethers, HFE) have been tested. One disc was machined with lubricants while the second one was machined dry. For comparison purposes, machining parameters were the same than those of the fine milling condition reported above. For the same reasons, a pair of these discs was cleaned following the reference laboratory method used above. Results are given in table 2.
Table 2 : Influence of the cleaning process on the KCU impact toughness of SS HIP joints
Laboratory procedure Perchloroethylene Hydrofluoroether
111 ± 9 J/cm² 84 ± 6 J/cm² 82 ± 8 J/cm²
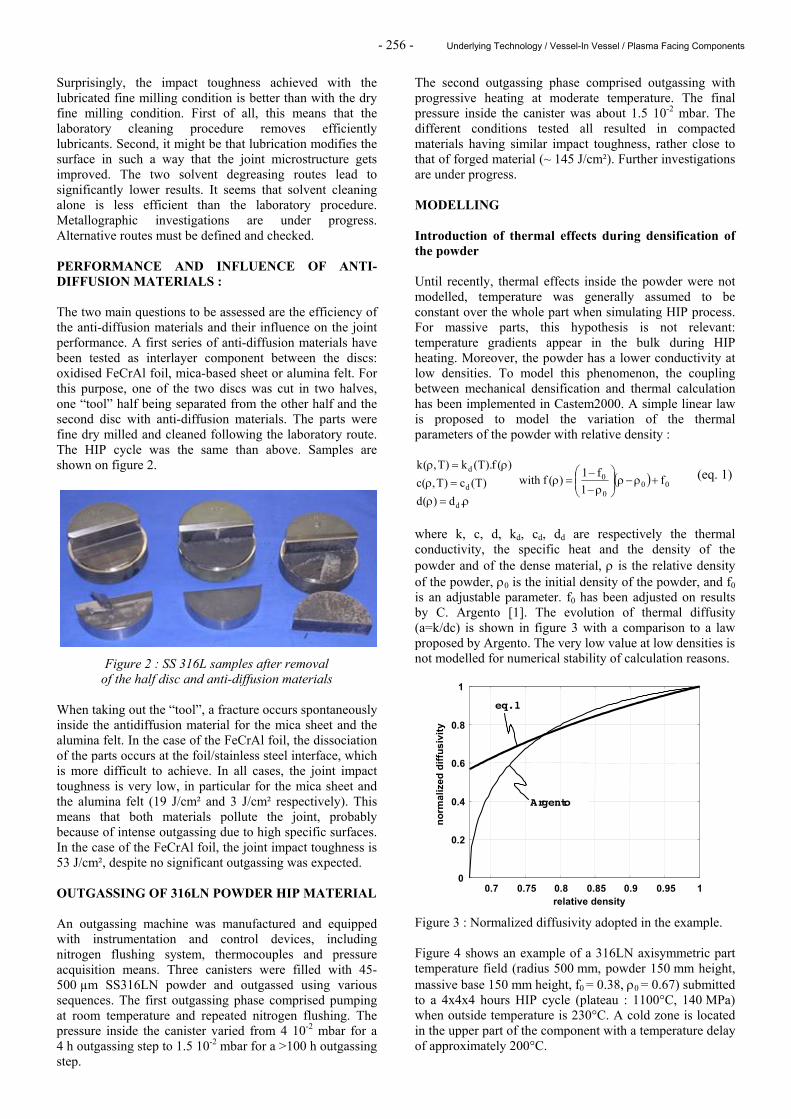
- 256 - Underlying Technology / Vessel-In Vessel / Plasma Facing Components
Surprisingly, the impact toughness achieved with the lubricated fine milling condition is better than with the dry fine milling condition. First of all, this means that the laboratory cleaning procedure removes efficiently lubricants. Second, it might be that lubrication modifies the surface in such a way that the joint microstructure gets improved. The two solvent degreasing routes lead to significantly lower results. It seems that solvent cleaning alone is less efficient than the laboratory procedure. Metallographic investigations are under progress. Alternative routes must be defined and checked. PERFORMANCE AND INFLUENCE OF ANTI-DIFFUSION MATERIALS : The two main questions to be assessed are the efficiency of the anti-diffusion materials and their influence on the joint performance. A first series of anti-diffusion materials have been tested as interlayer component between the discs: oxidised FeCrAl foil, mica-based sheet or alumina felt. For this purpose, one of the two discs was cut in two halves, one “tool” half being separated from the other half and the second disc with anti-diffusion materials. The parts were fine dry milled and cleaned following the laboratory route. The HIP cycle was the same than above. Samples are shown on figure 2.
Figure 2 : SS 316L samples after removal of the half disc and anti-diffusion materials
When taking out the “tool”, a fracture occurs spontaneously inside the antidiffusion material for the mica sheet and the alumina felt. In the case of the FeCrAl foil, the dissociation of the parts occurs at the foil/stainless steel interface, which is more difficult to achieve. In all cases, the joint impact toughness is very low, in particular for the mica sheet and the alumina felt (19 J/cm² and 3 J/cm² respectively). This means that both materials pollute the joint, probably because of intense outgassing due to high specific surfaces. In the case of the FeCrAl foil, the joint impact toughness is 53 J/cm², despite no significant outgassing was expected. OUTGASSING OF 316LN POWDER HIP MATERIAL An outgassing machine was manufactured and equipped with instrumentation and control devices, including nitrogen flushing system, thermocouples and pressure acquisition means. Three canisters were filled with 45-500 µm SS316LN powder and outgassed using various sequences. The first outgassing phase comprised pumping at room temperature and repeated nitrogen flushing. The pressure inside the canister varied from 4 10-2 mbar for a 4 h outgassing step to 1.5 10-2 mbar for a >100 h outgassing step.
The second outgassing phase comprised outgassing with progressive heating at moderate temperature. The final pressure inside the canister was about 1.5 10-2 mbar. The different conditions tested all resulted in compacted materials having similar impact toughness, rather close to that of forged material (~ 145 J/cm²). Further investigations are under progress. MODELLING Introduction of thermal effects during densification of the powder Until recently, thermal effects inside the powder were not modelled, temperature was generally assumed to be constant over the whole part when simulating HIP process. For massive parts, this hypothesis is not relevant: temperature gradients appear in the bulk during HIP heating. Moreover, the powder has a lower conductivity at low densities. To model this phenomenon, the coupling between mechanical densification and thermal calculation has been implemented in Castem2000. A simple linear law is proposed to model the variation of the thermal parameters of the powder with relative density :
ρ=ρ=ρ
ρ=ρ
.d)(d)T(c)T,(c
)(f).T(k)T,(k
d
d
d( ) 00
0
0 f1
f1)(fwith +ρ−ρ
ρ−
−=ρ (eq. 1)
where k, c, d, kd, cd, dd are respectively the thermal conductivity, the specific heat and the density of the powder and of the dense material, ρ is the relative density of the powder, ρ0 is the initial density of the powder, and f0 is an adjustable parameter. f0 has been adjusted on results by C. Argento [1]. The evolution of thermal diffusity (a=k/dc) is shown in figure 3 with a comparison to a law proposed by Argento. The very low value at low densities is not modelled for numerical stability of calculation reasons.
0
0.2
0.4
0.6
0.8
1
0.7 0.75 0.8 0.85 0.9 0.95 1
norm
aliz
ed d
iffus
ivity
relative density
Argento [2]
eq. 1
Figure 3 : Normalized diffusivity adopted in the example. Figure 4 shows an example of a 316LN axisymmetric part temperature field (radius 500 mm, powder 150 mm height, massive base 150 mm height, f0 = 0.38, ρ0 = 0.67) submitted to a 4x4x4 hours HIP cycle (plateau : 1100°C, 140 MPa) when outside temperature is 230°C. A cold zone is located in the upper part of the component with a temperature delay of approximately 200°C.
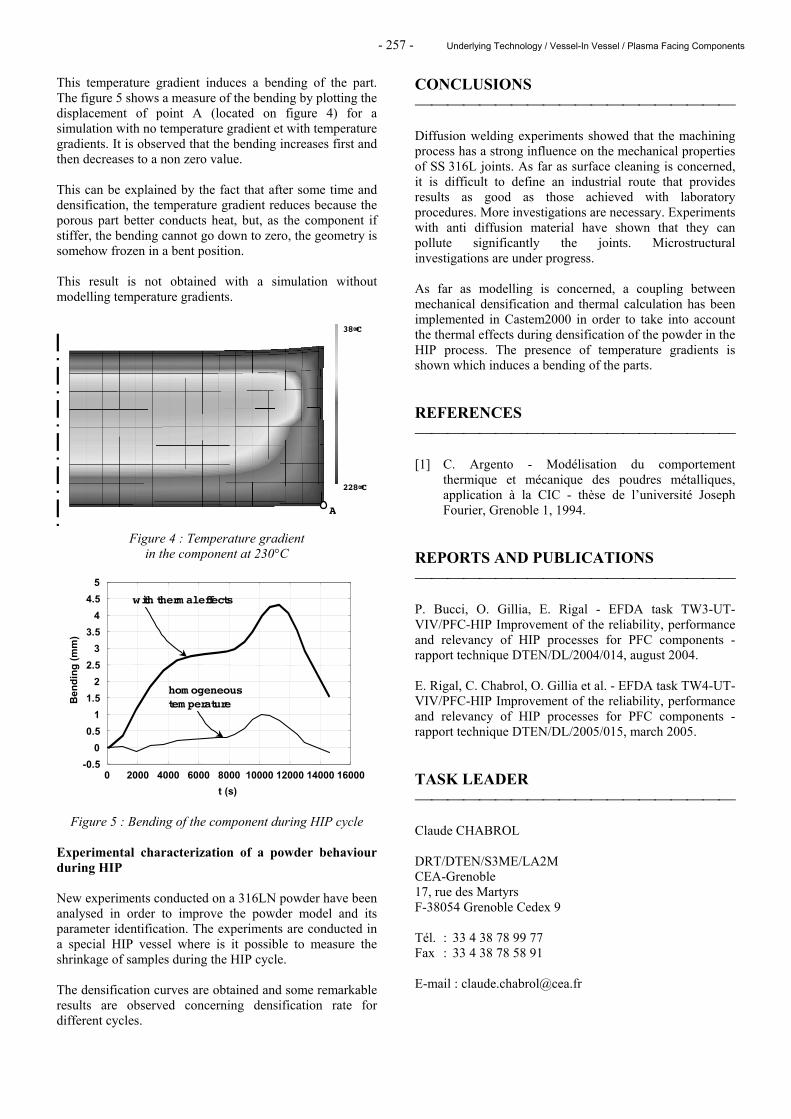
- 257 - Underlying Technology / Vessel-In Vessel / Plasma Facing Components
This temperature gradient induces a bending of the part. The figure 5 shows a measure of the bending by plotting the displacement of point A (located on figure 4) for a simulation with no temperature gradient et with temperature gradients. It is observed that the bending increases first and then decreases to a non zero value. This can be explained by the fact that after some time and densification, the temperature gradient reduces because the porous part better conducts heat, but, as the component if stiffer, the bending cannot go down to zero, the geometry is somehow frozen in a bent position. This result is not obtained with a simulation without modelling temperature gradients.
A
228∞C
38∞C
Figure 4 : Temperature gradient
in the component at 230°C
-0.50
0.51
1.52
2.53
3.54
4.55
0 2000 4000 6000 8000 10000 12000 14000 16000
Ben
ding
(mm
)
t (s)
with therm al effects
hom ogeneous tem perature
Figure 5 : Bending of the component during HIP cycle Experimental characterization of a powder behaviour during HIP New experiments conducted on a 316LN powder have been analysed in order to improve the powder model and its parameter identification. The experiments are conducted in a special HIP vessel where is it possible to measure the shrinkage of samples during the HIP cycle. The densification curves are obtained and some remarkable results are observed concerning densification rate for different cycles.
CONCLUSIONS Diffusion welding experiments showed that the machining process has a strong influence on the mechanical properties of SS 316L joints. As far as surface cleaning is concerned, it is difficult to define an industrial route that provides results as good as those achieved with laboratory procedures. More investigations are necessary. Experiments with anti diffusion material have shown that they can pollute significantly the joints. Microstructural investigations are under progress. As far as modelling is concerned, a coupling between mechanical densification and thermal calculation has been implemented in Castem2000 in order to take into account the thermal effects during densification of the powder in the HIP process. The presence of temperature gradients is shown which induces a bending of the parts. REFERENCES [1] C. Argento - Modélisation du comportement
thermique et mécanique des poudres métalliques, application à la CIC - thèse de l’université Joseph Fourier, Grenoble 1, 1994.
REPORTS AND PUBLICATIONS P. Bucci, O. Gillia, E. Rigal - EFDA task TW3-UT-VIV/PFC-HIP Improvement of the reliability, performance and relevancy of HIP processes for PFC components - rapport technique DTEN/DL/2004/014, august 2004. E. Rigal, C. Chabrol, O. Gillia et al. - EFDA task TW4-UT-VIV/PFC-HIP Improvement of the reliability, performance and relevancy of HIP processes for PFC components - rapport technique DTEN/DL/2005/015, march 2005. TASK LEADER Claude CHABROL DRT/DTEN/S3ME/LA2M CEA-Grenoble 17, rue des Martyrs F-38054 Grenoble Cedex 9 Tél. : 33 4 38 78 99 77 Fax : 33 4 38 78 58 91 E-mail : [email protected]

- 258 - Underlying Technology / Vessel-In Vessel / Plasma Facing Components
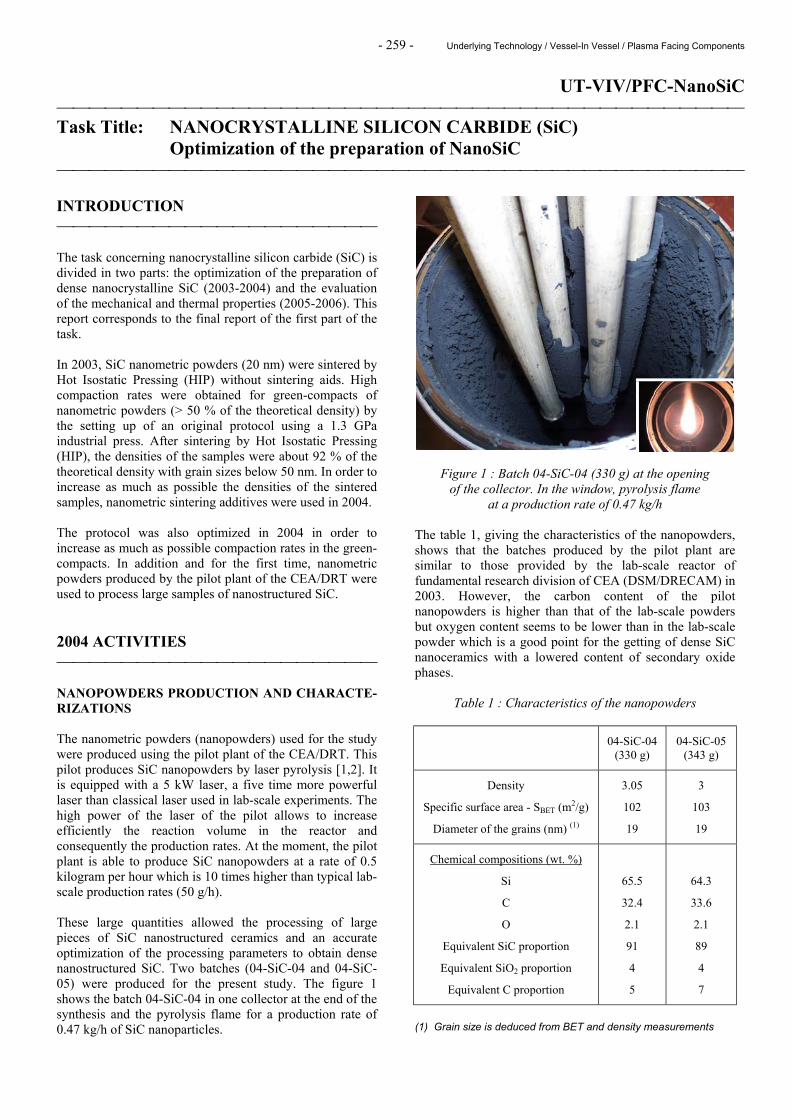
- 259 - Underlying Technology / Vessel-In Vessel / Plasma Facing Components
UT-VIV/PFC-NanoSiC Task Title: NANOCRYSTALLINE SILICON CARBIDE (SiC) Optimization of the preparation of NanoSiC INTRODUCTION The task concerning nanocrystalline silicon carbide (SiC) is divided in two parts: the optimization of the preparation of dense nanocrystalline SiC (2003-2004) and the evaluation of the mechanical and thermal properties (2005-2006). This report corresponds to the final report of the first part of the task. In 2003, SiC nanometric powders (20 nm) were sintered by Hot Isostatic Pressing (HIP) without sintering aids. High compaction rates were obtained for green-compacts of nanometric powders (> 50 % of the theoretical density) by the setting up of an original protocol using a 1.3 GPa industrial press. After sintering by Hot Isostatic Pressing (HIP), the densities of the samples were about 92 % of the theoretical density with grain sizes below 50 nm. In order to increase as much as possible the densities of the sintered samples, nanometric sintering additives were used in 2004. The protocol was also optimized in 2004 in order to increase as much as possible compaction rates in the green-compacts. In addition and for the first time, nanometric powders produced by the pilot plant of the CEA/DRT were used to process large samples of nanostructured SiC. 2004 ACTIVITIES NANOPOWDERS PRODUCTION AND CHARACTE-RIZATIONS The nanometric powders (nanopowders) used for the study were produced using the pilot plant of the CEA/DRT. This pilot produces SiC nanopowders by laser pyrolysis [1,2]. It is equipped with a 5 kW laser, a five time more powerful laser than classical laser used in lab-scale experiments. The high power of the laser of the pilot allows to increase efficiently the reaction volume in the reactor and consequently the production rates. At the moment, the pilot plant is able to produce SiC nanopowders at a rate of 0.5 kilogram per hour which is 10 times higher than typical lab-scale production rates (50 g/h). These large quantities allowed the processing of large pieces of SiC nanostructured ceramics and an accurate optimization of the processing parameters to obtain dense nanostructured SiC. Two batches (04-SiC-04 and 04-SiC-05) were produced for the present study. The figure 1 shows the batch 04-SiC-04 in one collector at the end of the synthesis and the pyrolysis flame for a production rate of 0.47 kg/h of SiC nanoparticles.
Figure 1 : Batch 04-SiC-04 (330 g) at the opening of the collector. In the window, pyrolysis flame
at a production rate of 0.47 kg/h The table 1, giving the characteristics of the nanopowders, shows that the batches produced by the pilot plant are similar to those provided by the lab-scale reactor of fundamental research division of CEA (DSM/DRECAM) in 2003. However, the carbon content of the pilot nanopowders is higher than that of the lab-scale powders but oxygen content seems to be lower than in the lab-scale powder which is a good point for the getting of dense SiC nanoceramics with a lowered content of secondary oxide phases.
Table 1 : Characteristics of the nanopowders
04-SiC-04 (330 g)
04-SiC-05 (343 g)
Density
Specific surface area - SBET (m2/g)
Diameter of the grains (nm) (1)
3.05
102
19
3
103
19
Chemical compositions (wt. %)
Si
C
O
Equivalent SiC proportion
Equivalent SiO2 proportion
Equivalent C proportion
65.5
32.4
2.1
91
4
5
64.3
33.6
2.1
89
4
7
(1) Grain size is deduced from BET and density measurements
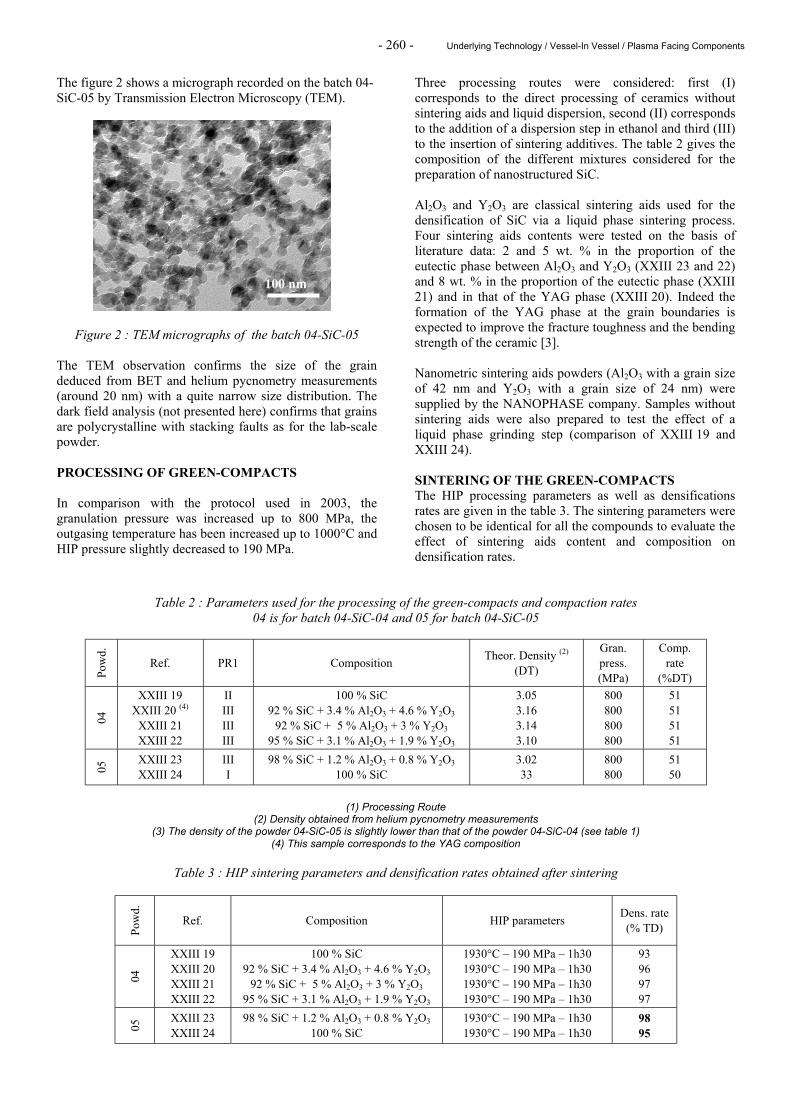
- 260 - Underlying Technology / Vessel-In Vessel / Plasma Facing Components
The figure 2 shows a micrograph recorded on the batch 04-SiC-05 by Transmission Electron Microscopy (TEM).
Figure 2 : TEM micrographs of the batch 04-SiC-05 The TEM observation confirms the size of the grain deduced from BET and helium pycnometry measurements (around 20 nm) with a quite narrow size distribution. The dark field analysis (not presented here) confirms that grains are polycrystalline with stacking faults as for the lab-scale powder. PROCESSING OF GREEN-COMPACTS In comparison with the protocol used in 2003, the granulation pressure was increased up to 800 MPa, the outgasing temperature has been increased up to 1000°C and HIP pressure slightly decreased to 190 MPa.
Three processing routes were considered: first (I) corresponds to the direct processing of ceramics without sintering aids and liquid dispersion, second (II) corresponds to the addition of a dispersion step in ethanol and third (III) to the insertion of sintering additives. The table 2 gives the composition of the different mixtures considered for the preparation of nanostructured SiC. Al2O3 and Y2O3 are classical sintering aids used for the densification of SiC via a liquid phase sintering process. Four sintering aids contents were tested on the basis of literature data: 2 and 5 wt. % in the proportion of the eutectic phase between Al2O3 and Y2O3 (XXIII 23 and 22) and 8 wt. % in the proportion of the eutectic phase (XXIII 21) and in that of the YAG phase (XXIII 20). Indeed the formation of the YAG phase at the grain boundaries is expected to improve the fracture toughness and the bending strength of the ceramic [3]. Nanometric sintering aids powders (Al2O3 with a grain size of 42 nm and Y2O3 with a grain size of 24 nm) were supplied by the NANOPHASE company. Samples without sintering aids were also prepared to test the effect of a liquid phase grinding step (comparison of XXIII 19 and XXIII 24). SINTERING OF THE GREEN-COMPACTS The HIP processing parameters as well as densifications rates are given in the table 3. The sintering parameters were chosen to be identical for all the compounds to evaluate the effect of sintering aids content and composition on densification rates.
Table 2 : Parameters used for the processing of the green-compacts and compaction rates 04 is for batch 04-SiC-04 and 05 for batch 04-SiC-05
Pow
d.
Ref. PR1 Composition Theor. Density (2) (DT)
Gran. press. (MPa)
Comp. rate
(%DT)
04
XXIII 19 XXIII 20 (4)
XXIII 21 XXIII 22
II III III III
100 % SiC 92 % SiC + 3.4 % Al2O3 + 4.6 % Y2O3
92 % SiC + 5 % Al2O3 + 3 % Y2O3 95 % SiC + 3.1 % Al2O3 + 1.9 % Y2O3
3.05 3.16 3.14 3.10
800 800 800 800
51 51 51 51
05 XXIII 23
XXIII 24 III I
98 % SiC + 1.2 % Al2O3 + 0.8 % Y2O3 100 % SiC
3.02 33
800 800
51 50
(1) Processing Route
(2) Density obtained from helium pycnometry measurements (3) The density of the powder 04-SiC-05 is slightly lower than that of the powder 04-SiC-04 (see table 1)
(4) This sample corresponds to the YAG composition
Table 3 : HIP sintering parameters and densification rates obtained after sintering
Pow
d.
Ref. Composition HIP parameters Dens. rate (% TD)
04
XXIII 19 XXIII 20 XXIII 21 XXIII 22
100 % SiC 92 % SiC + 3.4 % Al2O3 + 4.6 % Y2O3
92 % SiC + 5 % Al2O3 + 3 % Y2O3 95 % SiC + 3.1 % Al2O3 + 1.9 % Y2O3
1930°C – 190 MPa – 1h30 1930°C – 190 MPa – 1h30 1930°C – 190 MPa – 1h30 1930°C – 190 MPa – 1h30
93 96 97 97
05 XXIII 23
XXIII 24 98 % SiC + 1.2 % Al2O3 + 0.8 % Y2O3
100 % SiC 1930°C – 190 MPa – 1h30 1930°C – 190 MPa – 1h30
98 95
100 nm
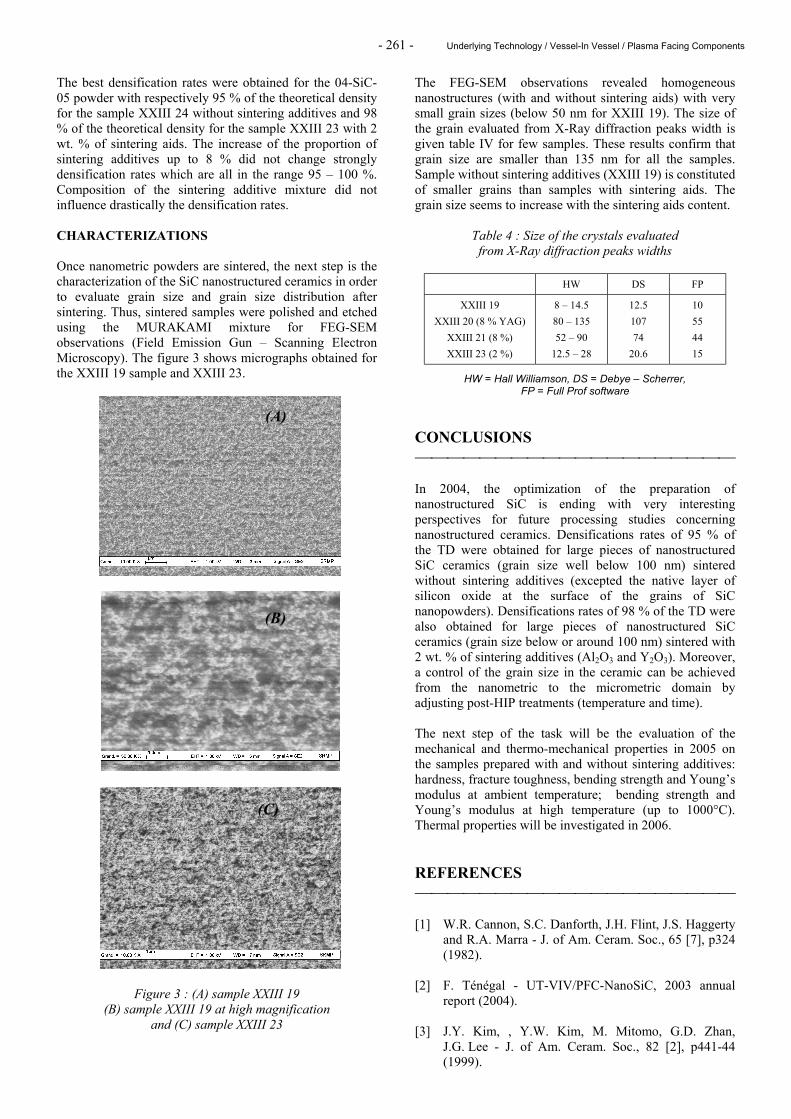
- 261 - Underlying Technology / Vessel-In Vessel / Plasma Facing Components
The best densification rates were obtained for the 04-SiC-05 powder with respectively 95 % of the theoretical density for the sample XXIII 24 without sintering additives and 98 % of the theoretical density for the sample XXIII 23 with 2 wt. % of sintering aids. The increase of the proportion of sintering additives up to 8 % did not change strongly densification rates which are all in the range 95 – 100 %. Composition of the sintering additive mixture did not influence drastically the densification rates. CHARACTERIZATIONS Once nanometric powders are sintered, the next step is the characterization of the SiC nanostructured ceramics in order to evaluate grain size and grain size distribution after sintering. Thus, sintered samples were polished and etched using the MURAKAMI mixture for FEG-SEM observations (Field Emission Gun – Scanning Electron Microscopy). The figure 3 shows micrographs obtained for the XXIII 19 sample and XXIII 23.
Figure 3 : (A) sample XXIII 19 (B) sample XXIII 19 at high magnification
and (C) sample XXIII 23
The FEG-SEM observations revealed homogeneous nanostructures (with and without sintering aids) with very small grain sizes (below 50 nm for XXIII 19). The size of the grain evaluated from X-Ray diffraction peaks width is given table IV for few samples. These results confirm that grain size are smaller than 135 nm for all the samples. Sample without sintering additives (XXIII 19) is constituted of smaller grains than samples with sintering aids. The grain size seems to increase with the sintering aids content.
Table 4 : Size of the crystals evaluated from X-Ray diffraction peaks widths
HW DS FP
XXIII 19 XXIII 20 (8 % YAG)
XXIII 21 (8 %) XXIII 23 (2 %)
8 – 14.5 80 – 135 52 – 90
12.5 – 28
12.5 107 74
20.6
10 55 44 15
HW = Hall Williamson, DS = Debye – Scherrer, FP = Full Prof software
CONCLUSIONS In 2004, the optimization of the preparation of nanostructured SiC is ending with very interesting perspectives for future processing studies concerning nanostructured ceramics. Densifications rates of 95 % of the TD were obtained for large pieces of nanostructured SiC ceramics (grain size well below 100 nm) sintered without sintering additives (excepted the native layer of silicon oxide at the surface of the grains of SiC nanopowders). Densifications rates of 98 % of the TD were also obtained for large pieces of nanostructured SiC ceramics (grain size below or around 100 nm) sintered with 2 wt. % of sintering additives (Al2O3 and Y2O3). Moreover, a control of the grain size in the ceramic can be achieved from the nanometric to the micrometric domain by adjusting post-HIP treatments (temperature and time). The next step of the task will be the evaluation of the mechanical and thermo-mechanical properties in 2005 on the samples prepared with and without sintering additives: hardness, fracture toughness, bending strength and Young’s modulus at ambient temperature; bending strength and Young’s modulus at high temperature (up to 1000°C). Thermal properties will be investigated in 2006. REFERENCES [1] W.R. Cannon, S.C. Danforth, J.H. Flint, J.S. Haggerty
and R.A. Marra - J. of Am. Ceram. Soc., 65 [7], p324 (1982).
[2] F. Ténégal - UT-VIV/PFC-NanoSiC, 2003 annual
report (2004). [3] J.Y. Kim, , Y.W. Kim, M. Mitomo, G.D. Zhan,
J.G. Lee - J. of Am. Ceram. Soc., 82 [2], p441-44 (1999).
(A)
(B)
(C)
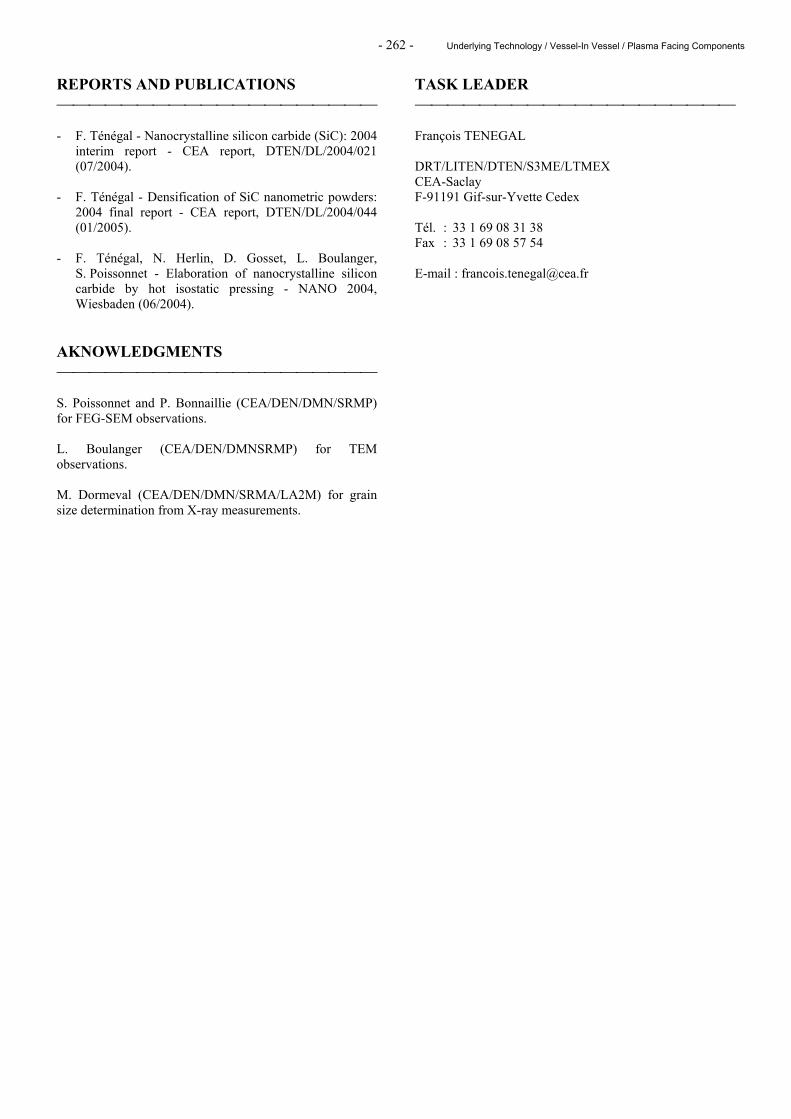
- 262 - Underlying Technology / Vessel-In Vessel / Plasma Facing Components
REPORTS AND PUBLICATIONS - F. Ténégal - Nanocrystalline silicon carbide (SiC): 2004
interim report - CEA report, DTEN/DL/2004/021 (07/2004).
- F. Ténégal - Densification of SiC nanometric powders:
2004 final report - CEA report, DTEN/DL/2004/044 (01/2005).
- F. Ténégal, N. Herlin, D. Gosset, L. Boulanger,
S. Poissonnet - Elaboration of nanocrystalline silicon carbide by hot isostatic pressing - NANO 2004, Wiesbaden (06/2004).
AKNOWLEDGMENTS S. Poissonnet and P. Bonnaillie (CEA/DEN/DMN/SRMP) for FEG-SEM observations. L. Boulanger (CEA/DEN/DMNSRMP) for TEM observations. M. Dormeval (CEA/DEN/DMN/SRMA/LA2M) for grain size determination from X-ray measurements.
TASK LEADER François TENEGAL DRT/LITEN/DTEN/S3ME/LTMEX CEA-Saclay F-91191 Gif-sur-Yvette Cedex Tél. : 33 1 69 08 31 38 Fax : 33 1 69 08 57 54 E-mail : [email protected]
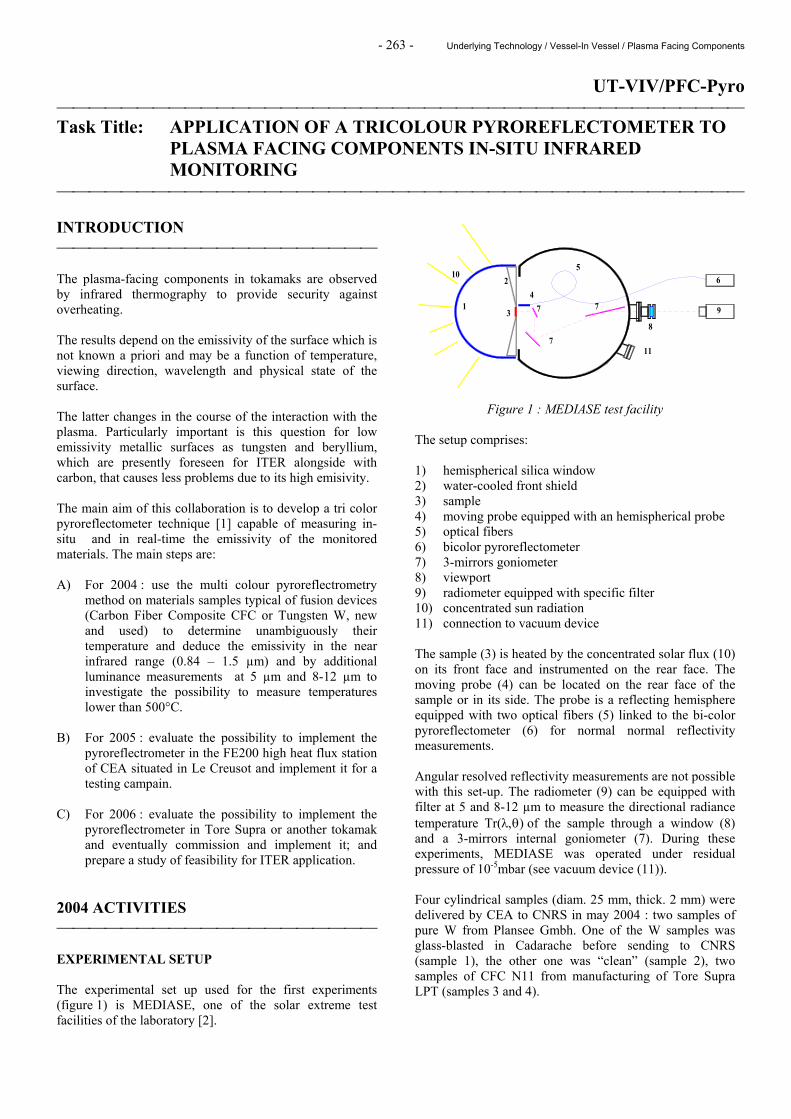
- 263 - Underlying Technology / Vessel-In Vessel / Plasma Facing Components
UT-VIV/PFC-Pyro Task Title: APPLICATION OF A TRICOLOUR PYROREFLECTOMETER TO
PLASMA FACING COMPONENTS IN-SITU INFRARED MONITORING
INTRODUCTION The plasma-facing components in tokamaks are observed by infrared thermography to provide security against overheating. The results depend on the emissivity of the surface which is not known a priori and may be a function of temperature, viewing direction, wavelength and physical state of the surface. The latter changes in the course of the interaction with the plasma. Particularly important is this question for low emissivity metallic surfaces as tungsten and beryllium, which are presently foreseen for ITER alongside with carbon, that causes less problems due to its high emisivity. The main aim of this collaboration is to develop a tri color pyroreflectometer technique [1] capable of measuring in-situ and in real-time the emissivity of the monitored materials. The main steps are: A) For 2004 : use the multi colour pyroreflectrometry
method on materials samples typical of fusion devices (Carbon Fiber Composite CFC or Tungsten W, new and used) to determine unambiguously their temperature and deduce the emissivity in the near infrared range (0.84 – 1.5 µm) and by additional luminance measurements at 5 µm and 8-12 µm to investigate the possibility to measure temperatures lower than 500°C.
B) For 2005 : evaluate the possibility to implement the
pyroreflectrometer in the FE200 high heat flux station of CEA situated in Le Creusot and implement it for a testing campain.
C) For 2006 : evaluate the possibility to implement the
pyroreflectrometer in Tore Supra or another tokamak and eventually commission and implement it; and prepare a study of feasibility for ITER application.
2004 ACTIVITIES EXPERIMENTAL SETUP The experimental set up used for the first experiments (figure 1) is MEDIASE, one of the solar extreme test facilities of the laboratory [2].
Figure 1 : MEDIASE test facility The setup comprises: 1) hemispherical silica window 2) water-cooled front shield 3) sample 4) moving probe equipped with an hemispherical probe 5) optical fibers 6) bicolor pyroreflectometer 7) 3-mirrors goniometer 8) viewport 9) radiometer equipped with specific filter 10) concentrated sun radiation 11) connection to vacuum device The sample (3) is heated by the concentrated solar flux (10) on its front face and instrumented on the rear face. The moving probe (4) can be located on the rear face of the sample or in its side. The probe is a reflecting hemisphere equipped with two optical fibers (5) linked to the bi-color pyroreflectometer (6) for normal normal reflectivity measurements. Angular resolved reflectivity measurements are not possible with this set-up. The radiometer (9) can be equipped with filter at 5 and 8-12 µm to measure the directional radiance temperature Tr(λ,θ) of the sample through a window (8) and a 3-mirrors internal goniometer (7). During these experiments, MEDIASE was operated under residual pressure of 10-5mbar (see vacuum device (11)). Four cylindrical samples (diam. 25 mm, thick. 2 mm) were delivered by CEA to CNRS in may 2004 : two samples of pure W from Plansee Gmbh. One of the W samples was glass-blasted in Cadarache before sending to CNRS (sample 1), the other one was “clean” (sample 2), two samples of CFC N11 from manufacturing of Tore Supra LPT (samples 3 and 4).
13
7
7
11
7
8
4
102
5
9
6

- 264 - Underlying Technology / Vessel-In Vessel / Plasma Facing Components
METHOD The bi [3] or tri [1] color pyroreflectomety is a new concept developed at the CNRS Odeillo to determine the true temperature for opaque material. The main principle is to measure simultaneously and for two or three working wavelengths the radiance temperature Tr(λ) and the bi-directional reflectivities on the normal position. The main hypothesis is to consider that the instrumented sample has the same B.R.D.F. (bi-directional reflectivity distribution function) at the working wavelengths. Taking into account these two points the true temperature is obtained solving a system of two or three equations based on a relation: )),()(1ln(/)(/1/1 0,0
2 TTCTrT λρηλλ −+= (1) where η is the diffusivity factor which is the ratio of hemispherical reflectivity ),(,0 Tλρ ∩ to normal normal reflectivity: ),(/),()( 0,0,0 TTT λρλρη ∩= (2) Consequently ),(,0 Tλρ ∩ and ),(0 Tλε can also be determined. The figure 2 presents an example of a graphical determination of solution the true temperature for a W sample heated at the solar furnace. Tca, Trra, Trba are the measured apparent (colour and radiance) temperatures and ρra and ρba the measured apparent normal normal reflectivities (r indicate 1.55µm et b 1.3µm). The resulting convergence temperature T* is assumed to be equal to the true temperature T at a corresponding apparent value η*a and the apparent emissivities εra and εba. This method worked well for the tungsten targets. For the carbon targets the reflectivity was too low. Hence we assumed identical emissivity at the two wavelengths (1.3 and 1.55 µm) and determined the ‘true’ temperature via bi color pyrometry. After the true temperature of the samples had been determined further passive measurement were performed to determine the directional emissivity ε(T,λ,θ) at 5 and 8-12µm. In this case the method is a direct method: ε(T,λ,θ) = L°(Tr(λ,θ))/ L°(T,λ) (3)
Figure 2 : Example of analysis of bi-color pyro reflectometry measurements
RESULTS Figures 3 and 4 show the results obtained with the pyro-reflectometry method on the tungsten samples. In the case of the glass-blasted tungsten (figure 3) εra , εba , η∗α values were different during the first and the following heating cycles. Such differences may be attributed to a modification of the state of the surface (outgassing of impurities, cleaning of surface) during the first temperature rise. The values for clean tungsten did not change from one cycle to another.
Figure 3 : Glass blasted tungsten: Curves and cross: first
increasing cycle – Squares: a further increasing cycle
Figure 4 : Clean tungsten during a later increasing cycle The angular resolved emissivity measurements at 5 and 8-12 µm are shown in the figures 5-12.
Figure 5 : Glass blasted tungsten at 5µm: first temperature rise
700 800 900 1000 1100 1200 1300 1400 15000,4
0,5
0,6
0,7
0,8
0,9
1,0
1,1
W glass-blasted (Sample n°1)
ε , η , ρr/ρb
T (°C)
εra
εba
ηa
ρra/ρba
800 1000 1200 1400 1600
0,7
0,8
0,9
1,0
1,1
1,2
T (°C)
εra
εba
ηa
ρra/ρba
W clean (Sample n°2)ε , η , ρr/ρb
0 10 20 30 40 50 60 70 80 900,00
0,05
0,10
0,15
0,20
0,25
0,30
0,35
0,40
0,45
Angle (°)
ε(θ)
T719 T823 T903 T1010 T1119 T1186 T1243 T1320 T1429
0,0 0,2 0,4 0,6 0,8 1,0 1,2 1,41000
1100
1200
1300
1400
1500
1600
1700
1800
η*a=0.52T*=T= 1256εra=0.64 εba=0.71
Tca=1434 Trra=1150 Trba=1187 ρra=0,69 ρba=0,56
Tc(1,3µm,1,55µm,ηa)
Tr(1,55µm,ηa)
Tr(1,3µm,ηa)
ηa
T°C
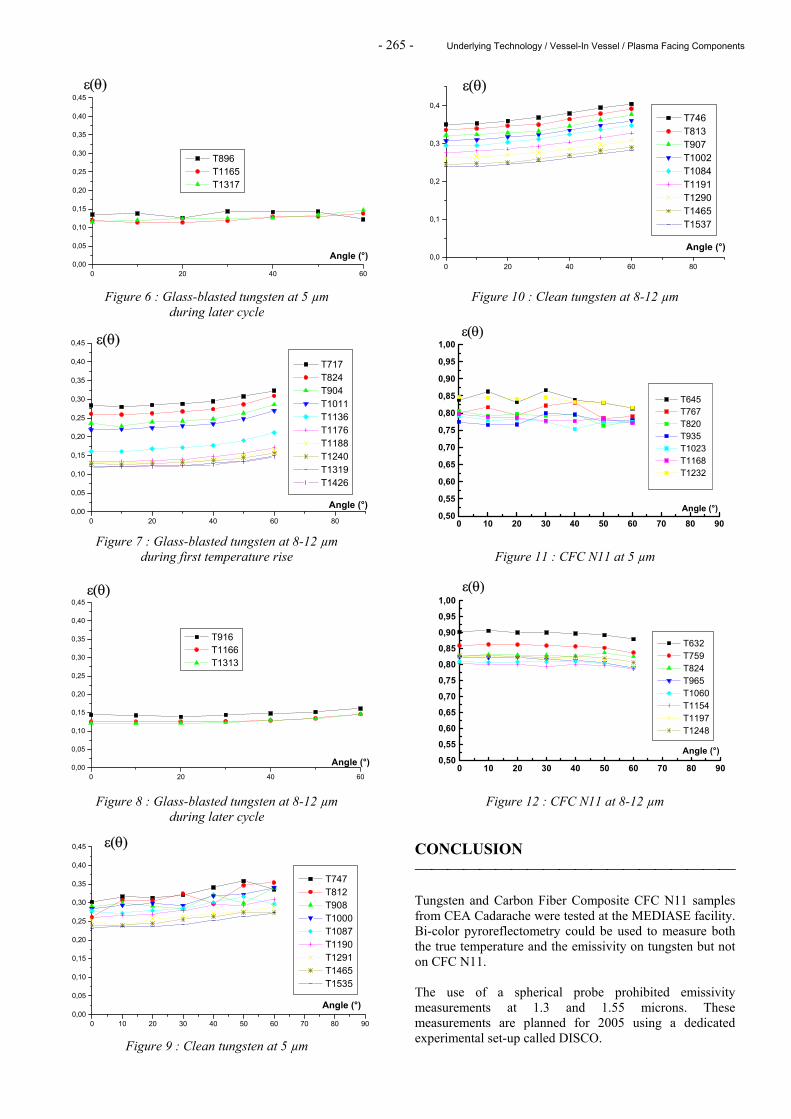
- 265 - Underlying Technology / Vessel-In Vessel / Plasma Facing Components
Figure 6 : Glass-blasted tungsten at 5 µm during later cycle
Figure 7 : Glass-blasted tungsten at 8-12 µm during first temperature rise
Figure 8 : Glass-blasted tungsten at 8-12 µm during later cycle
Figure 9 : Clean tungsten at 5 µm
Figure 10 : Clean tungsten at 8-12 µm
Figure 11 : CFC N11 at 5 µm
Figure 12 : CFC N11 at 8-12 µm CONCLUSION Tungsten and Carbon Fiber Composite CFC N11 samples from CEA Cadarache were tested at the MEDIASE facility. Bi-color pyroreflectometry could be used to measure both the true temperature and the emissivity on tungsten but not on CFC N11. The use of a spherical probe prohibited emissivity measurements at 1.3 and 1.55 microns. These measurements are planned for 2005 using a dedicated experimental set-up called DISCO.
0 20 40 600,00
0,05
0,10
0,15
0,20
0,25
0,30
0,35
0,40
0,45ε(θ)
Angle (°)
T896 T1165 T1317
0 20 40 60 800,00
0,05
0,10
0,15
0,20
0,25
0,30
0,35
0,40
0,45
Angle (°)
ε(θ)
T717 T824 T904 T1011 T1136 T1176 T1188 T1240 T1319 T1426
0 20 40 600,00
0,05
0,10
0,15
0,20
0,25
0,30
0,35
0,40
0,45
Angle (°)
ε(θ)
T916 T1166 T1313
0 10 20 30 40 50 60 70 80 900,50
0,55
0,60
0,65
0,70
0,75
0,80
0,85
0,90
0,95
1,00
Angle (°)
ε(θ)
T632 T759 T824 T965 T1060 T1154 T1197 T1248
0 10 20 30 40 50 60 70 80 900,50
0,55
0,60
0,65
0,70
0,75
0,80
0,85
0,90
0,95
1,00ε(θ)
Angle (°)
T645 T767 T820 T935 T1023 T1168 T1232
0 10 20 30 40 50 60 70 80 900,00
0,05
0,10
0,15
0,20
0,25
0,30
0,35
0,40
0,45
Angle (°)
ε(θ)
T747 T812 T908 T1000 T1087 T1190 T1291 T1465 T1535
0 20 40 60 800,0
0,1
0,2
0,3
0,4
Angle (°)
ε(θ)
T746 T813 T907 T1002 T1084 T1191 T1290 T1465 T1537
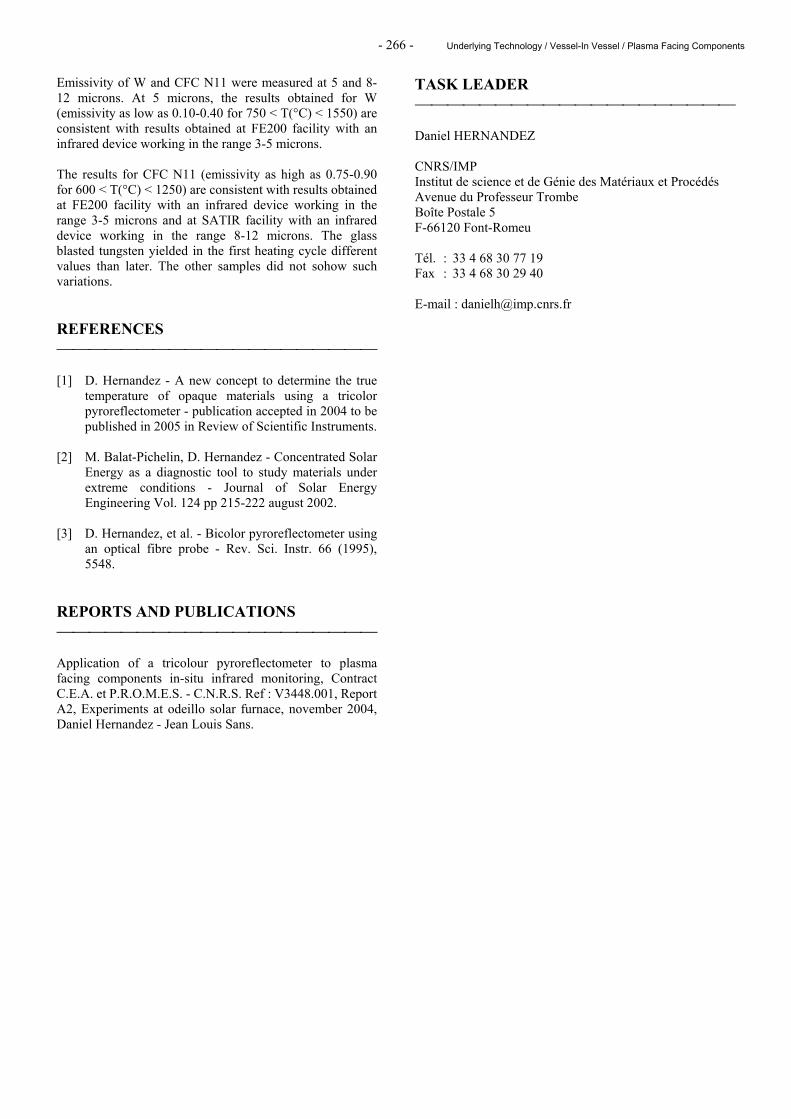
- 266 - Underlying Technology / Vessel-In Vessel / Plasma Facing Components
Emissivity of W and CFC N11 were measured at 5 and 8-12 microns. At 5 microns, the results obtained for W (emissivity as low as 0.10-0.40 for 750 < T(°C) < 1550) are consistent with results obtained at FE200 facility with an infrared device working in the range 3-5 microns. The results for CFC N11 (emissivity as high as 0.75-0.90 for 600 < T(°C) < 1250) are consistent with results obtained at FE200 facility with an infrared device working in the range 3-5 microns and at SATIR facility with an infrared device working in the range 8-12 microns. The glass blasted tungsten yielded in the first heating cycle different values than later. The other samples did not sohow such variations. REFERENCES [1] D. Hernandez - A new concept to determine the true
temperature of opaque materials using a tricolor pyroreflectometer - publication accepted in 2004 to be published in 2005 in Review of Scientific Instruments.
[2] M. Balat-Pichelin, D. Hernandez - Concentrated Solar
Energy as a diagnostic tool to study materials under extreme conditions - Journal of Solar Energy Engineering Vol. 124 pp 215-222 august 2002.
[3] D. Hernandez, et al. - Bicolor pyroreflectometer using
an optical fibre probe - Rev. Sci. Instr. 66 (1995), 5548.
REPORTS AND PUBLICATIONS Application of a tricolour pyroreflectometer to plasma facing components in-situ infrared monitoring, Contract C.E.A. et P.R.O.M.E.S. - C.N.R.S. Ref : V3448.001, Report A2, Experiments at odeillo solar furnace, november 2004, Daniel Hernandez - Jean Louis Sans.
TASK LEADER Daniel HERNANDEZ CNRS/IMP Institut de science et de Génie des Matériaux et Procédés Avenue du Professeur Trombe Boîte Postale 5 F-66120 Font-Romeu Tél. : 33 4 68 30 77 19 Fax : 33 4 68 30 29 40 E-mail : [email protected]
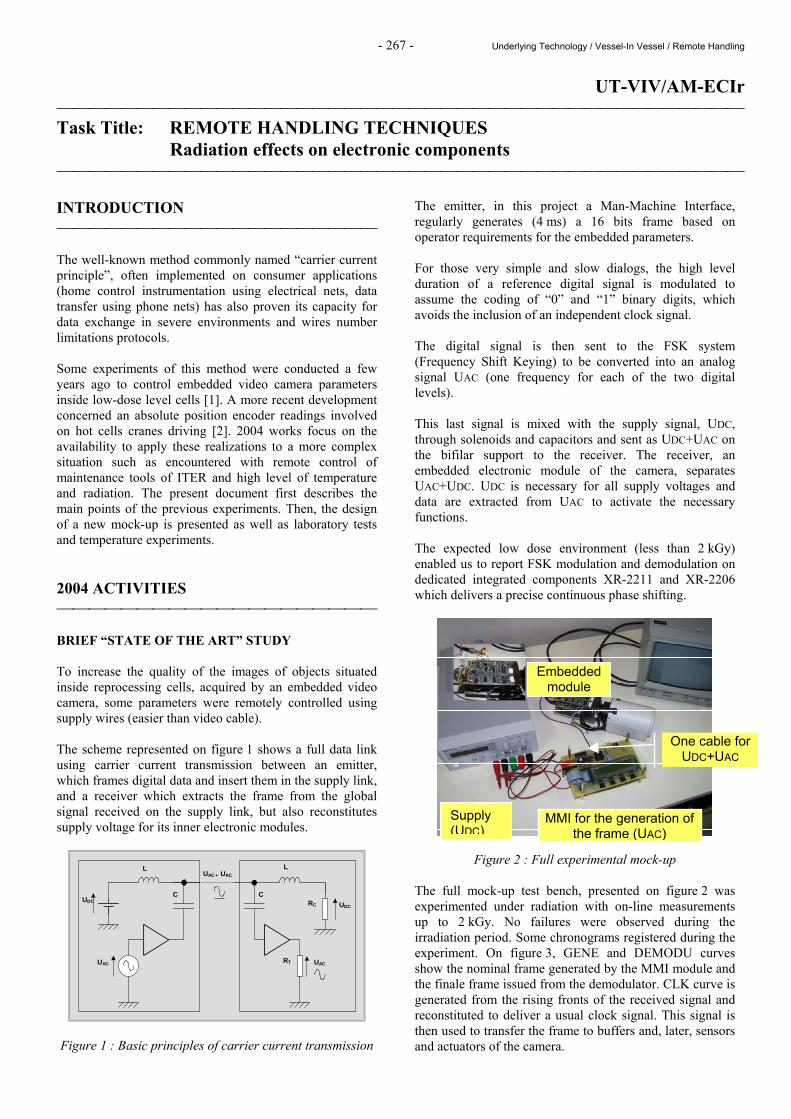
- 267 - Underlying Technology / Vessel-In Vessel / Remote Handling
UT-VIV/AM-ECIr Task Title: REMOTE HANDLING TECHNIQUES Radiation effects on electronic components INTRODUCTION The well-known method commonly named “carrier current principle”, often implemented on consumer applications (home control instrumentation using electrical nets, data transfer using phone nets) has also proven its capacity for data exchange in severe environments and wires number limitations protocols. Some experiments of this method were conducted a few years ago to control embedded video camera parameters inside low-dose level cells [1]. A more recent development concerned an absolute position encoder readings involved on hot cells cranes driving [2]. 2004 works focus on the availability to apply these realizations to a more complex situation such as encountered with remote control of maintenance tools of ITER and high level of temperature and radiation. The present document first describes the main points of the previous experiments. Then, the design of a new mock-up is presented as well as laboratory tests and temperature experiments. 2004 ACTIVITIES BRIEF “STATE OF THE ART” STUDY To increase the quality of the images of objects situated inside reprocessing cells, acquired by an embedded video camera, some parameters were remotely controlled using supply wires (easier than video cable). The scheme represented on figure 1 shows a full data link using carrier current transmission between an emitter, which frames digital data and insert them in the supply link, and a receiver which extracts the frame from the global signal received on the supply link, but also reconstitutes supply voltage for its inner electronic modules.
C C
L L
UDC UDC
UAC UAC
UAC + UAC
RC
RT
Figure 1 : Basic principles of carrier current transmission
The emitter, in this project a Man-Machine Interface, regularly generates (4 ms) a 16 bits frame based on operator requirements for the embedded parameters. For those very simple and slow dialogs, the high level duration of a reference digital signal is modulated to assume the coding of “0” and “1” binary digits, which avoids the inclusion of an independent clock signal. The digital signal is then sent to the FSK system (Frequency Shift Keying) to be converted into an analog signal UAC (one frequency for each of the two digital levels). This last signal is mixed with the supply signal, UDC, through solenoids and capacitors and sent as UDC+UAC on the bifilar support to the receiver. The receiver, an embedded electronic module of the camera, separates UAC+UDC. UDC is necessary for all supply voltages and data are extracted from UAC to activate the necessary functions. The expected low dose environment (less than 2 kGy) enabled us to report FSK modulation and demodulation on dedicated integrated components XR-2211 and XR-2206 which delivers a precise continuous phase shifting.
Figure 2 : Full experimental mock-up The full mock-up test bench, presented on figure 2 was experimented under radiation with on-line measurements up to 2 kGy. No failures were observed during the irradiation period. Some chronograms registered during the experiment. On figure 3, GENE and DEMODU curves show the nominal frame generated by the MMI module and the finale frame issued from the demodulator. CLK curve is generated from the rising fronts of the received signal and reconstituted to deliver a usual clock signal. This signal is then used to transfer the frame to buffers and, later, sensors and actuators of the camera.
MMI for the generation of the frame (UAC)
Supply (UDC)
Embedded module
One cable for UDC+UAC
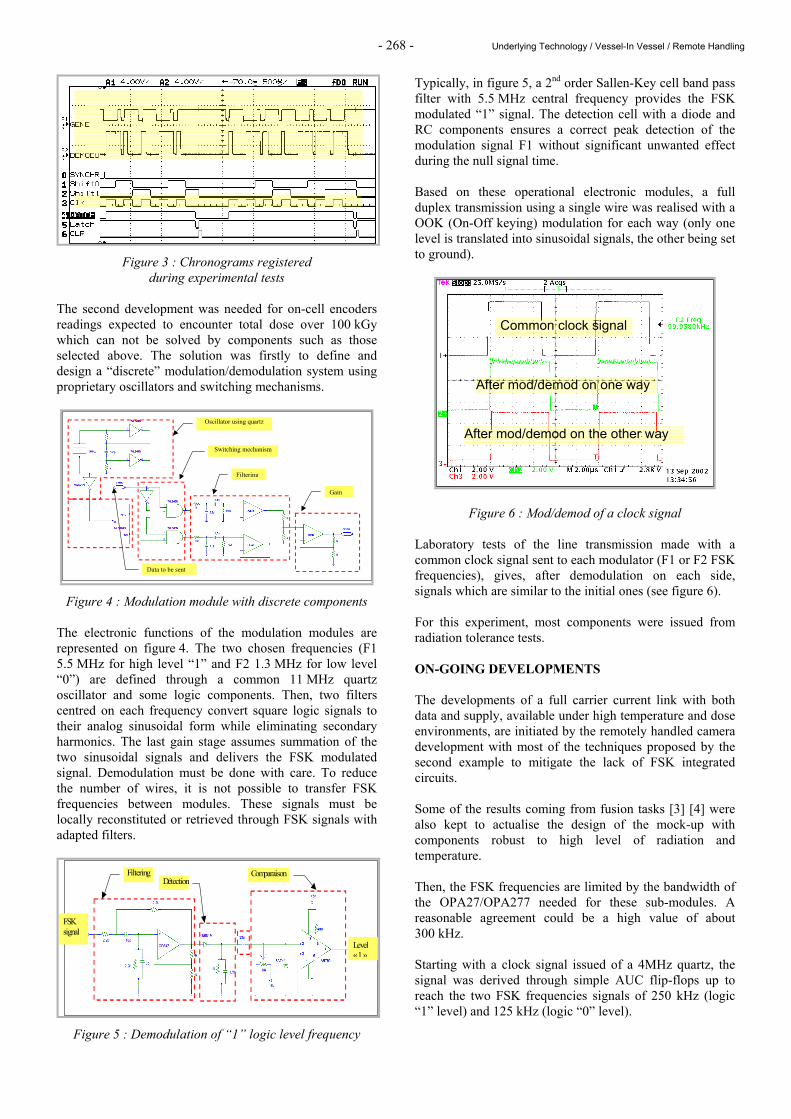
- 268 - Underlying Technology / Vessel-In Vessel / Remote Handling
Figure 3 : Chronograms registered
during experimental tests The second development was needed for on-cell encoders readings expected to encounter total dose over 100 kGy which can not be solved by components such as those selected above. The solution was firstly to define and design a “discrete” modulation/demodulation system using proprietary oscillators and switching mechanisms.
Oscillator using quartz
Switching mechanism
Filtering
Gain
Data to be sent
Figure 4 : Modulation module with discrete components
The electronic functions of the modulation modules are represented on figure 4. The two chosen frequencies (F1 5.5 MHz for high level “1” and F2 1.3 MHz for low level “0”) are defined through a common 11 MHz quartz oscillator and some logic components. Then, two filters centred on each frequency convert square logic signals to their analog sinusoidal form while eliminating secondary harmonics. The last gain stage assumes summation of the two sinusoidal signals and delivers the FSK modulated signal. Demodulation must be done with care. To reduce the number of wires, it is not possible to transfer FSK frequencies between modules. These signals must be locally reconstituted or retrieved through FSK signals with adapted filters.
Filtering Détection
Comparaison
FSK signal
Level «1»
Figure 5 : Demodulation of “1” logic level frequency
Typically, in figure 5, a 2nd order Sallen-Key cell band pass filter with 5.5 MHz central frequency provides the FSK modulated “1” signal. The detection cell with a diode and RC components ensures a correct peak detection of the modulation signal F1 without significant unwanted effect during the null signal time. Based on these operational electronic modules, a full duplex transmission using a single wire was realised with a OOK (On-Off keying) modulation for each way (only one level is translated into sinusoidal signals, the other being set to ground).
Figure 6 : Mod/demod of a clock signal Laboratory tests of the line transmission made with a common clock signal sent to each modulator (F1 or F2 FSK frequencies), gives, after demodulation on each side, signals which are similar to the initial ones (see figure 6). For this experiment, most components were issued from radiation tolerance tests. ON-GOING DEVELOPMENTS The developments of a full carrier current link with both data and supply, available under high temperature and dose environments, are initiated by the remotely handled camera development with most of the techniques proposed by the second example to mitigate the lack of FSK integrated circuits. Some of the results coming from fusion tasks [3] [4] were also kept to actualise the design of the mock-up with components robust to high level of radiation and temperature. Then, the FSK frequencies are limited by the bandwidth of the OPA27/OPA277 needed for these sub-modules. A reasonable agreement could be a high value of about 300 kHz. Starting with a clock signal issued of a 4MHz quartz, the signal was derived through simple AUC flip-flops up to reach the two FSK frequencies signals of 250 kHz (logic “1” level) and 125 kHz (logic “0” level).
Common clock signal
After mod/demod on one way
After mod/demod on the other way
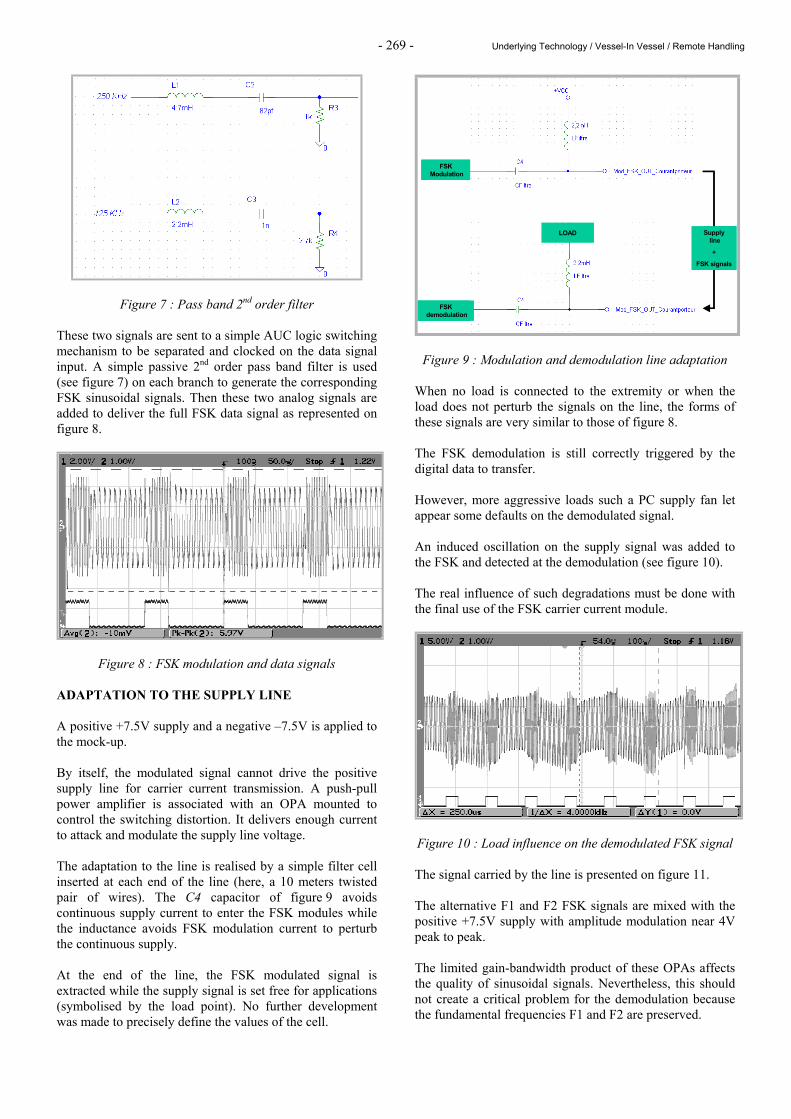
- 269 - Underlying Technology / Vessel-In Vessel / Remote Handling
Figure 7 : Pass band 2nd order filter These two signals are sent to a simple AUC logic switching mechanism to be separated and clocked on the data signal input. A simple passive 2nd order pass band filter is used (see figure 7) on each branch to generate the corresponding FSK sinusoidal signals. Then these two analog signals are added to deliver the full FSK data signal as represented on figure 8.
Figure 8 : FSK modulation and data signals ADAPTATION TO THE SUPPLY LINE A positive +7.5V supply and a negative –7.5V is applied to the mock-up. By itself, the modulated signal cannot drive the positive supply line for carrier current transmission. A push-pull power amplifier is associated with an OPA mounted to control the switching distortion. It delivers enough current to attack and modulate the supply line voltage. The adaptation to the line is realised by a simple filter cell inserted at each end of the line (here, a 10 meters twisted pair of wires). The C4 capacitor of figure 9 avoids continuous supply current to enter the FSK modules while the inductance avoids FSK modulation current to perturb the continuous supply. At the end of the line, the FSK modulated signal is extracted while the supply signal is set free for applications (symbolised by the load point). No further development was made to precisely define the values of the cell.
FSKModulation
FSKdemodulation
LOAD Supplyline
+
FSK signals
FSKModulation
FSKModulation
FSKdemodulation
LOAD Supplyline
+
FSK signals
Figure 9 : Modulation and demodulation line adaptation When no load is connected to the extremity or when the load does not perturb the signals on the line, the forms of these signals are very similar to those of figure 8. The FSK demodulation is still correctly triggered by the digital data to transfer. However, more aggressive loads such a PC supply fan let appear some defaults on the demodulated signal. An induced oscillation on the supply signal was added to the FSK and detected at the demodulation (see figure 10). The real influence of such degradations must be done with the final use of the FSK carrier current module.
Figure 10 : Load influence on the demodulated FSK signal The signal carried by the line is presented on figure 11. The alternative F1 and F2 FSK signals are mixed with the positive +7.5V supply with amplitude modulation near 4V peak to peak. The limited gain-bandwidth product of these OPAs affects the quality of sinusoidal signals. Nevertheless, this should not create a critical problem for the demodulation because the fundamental frequencies F1 and F2 are preserved.
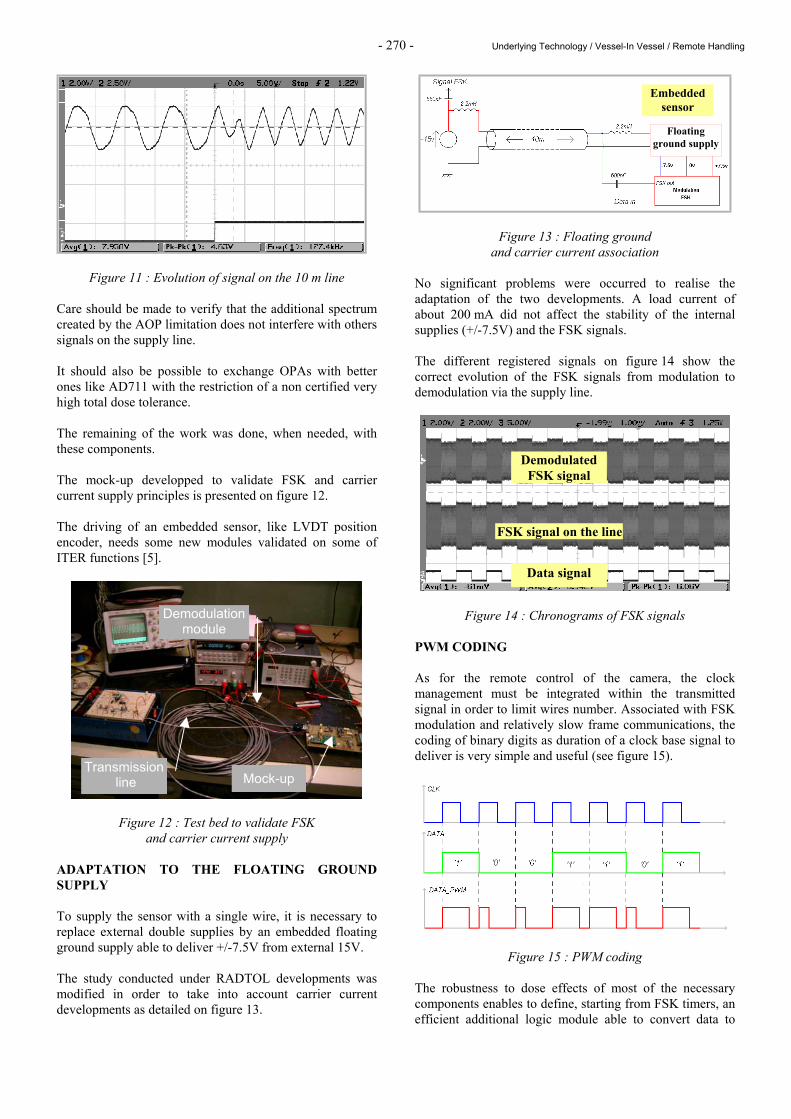
- 270 - Underlying Technology / Vessel-In Vessel / Remote Handling
Figure 11 : Evolution of signal on the 10 m line Care should be made to verify that the additional spectrum created by the AOP limitation does not interfere with others signals on the supply line. It should also be possible to exchange OPAs with better ones like AD711 with the restriction of a non certified very high total dose tolerance. The remaining of the work was done, when needed, with these components. The mock-up developped to validate FSK and carrier current supply principles is presented on figure 12. The driving of an embedded sensor, like LVDT position encoder, needs some new modules validated on some of ITER functions [5].
Figure 12 : Test bed to validate FSK and carrier current supply
ADAPTATION TO THE FLOATING GROUND SUPPLY To supply the sensor with a single wire, it is necessary to replace external double supplies by an embedded floating ground supply able to deliver +/-7.5V from external 15V. The study conducted under RADTOL developments was modified in order to take into account carrier current developments as detailed on figure 13.
Figure 13 : Floating ground and carrier current association
No significant problems were occurred to realise the adaptation of the two developments. A load current of about 200 mA did not affect the stability of the internal supplies (+/-7.5V) and the FSK signals. The different registered signals on figure 14 show the correct evolution of the FSK signals from modulation to demodulation via the supply line.
Figure 14 : Chronograms of FSK signals PWM CODING As for the remote control of the camera, the clock management must be integrated within the transmitted signal in order to limit wires number. Associated with FSK modulation and relatively slow frame communications, the coding of binary digits as duration of a clock base signal to deliver is very simple and useful (see figure 15).
Figure 15 : PWM coding The robustness to dose effects of most of the necessary components enables to define, starting from FSK timers, an efficient additional logic module able to convert data to
Floating ground supply
Embedded sensor
Demodulated FSK signal
FSK signal on the line
Data signal
Mock-up Transmission
line
Demodulation module
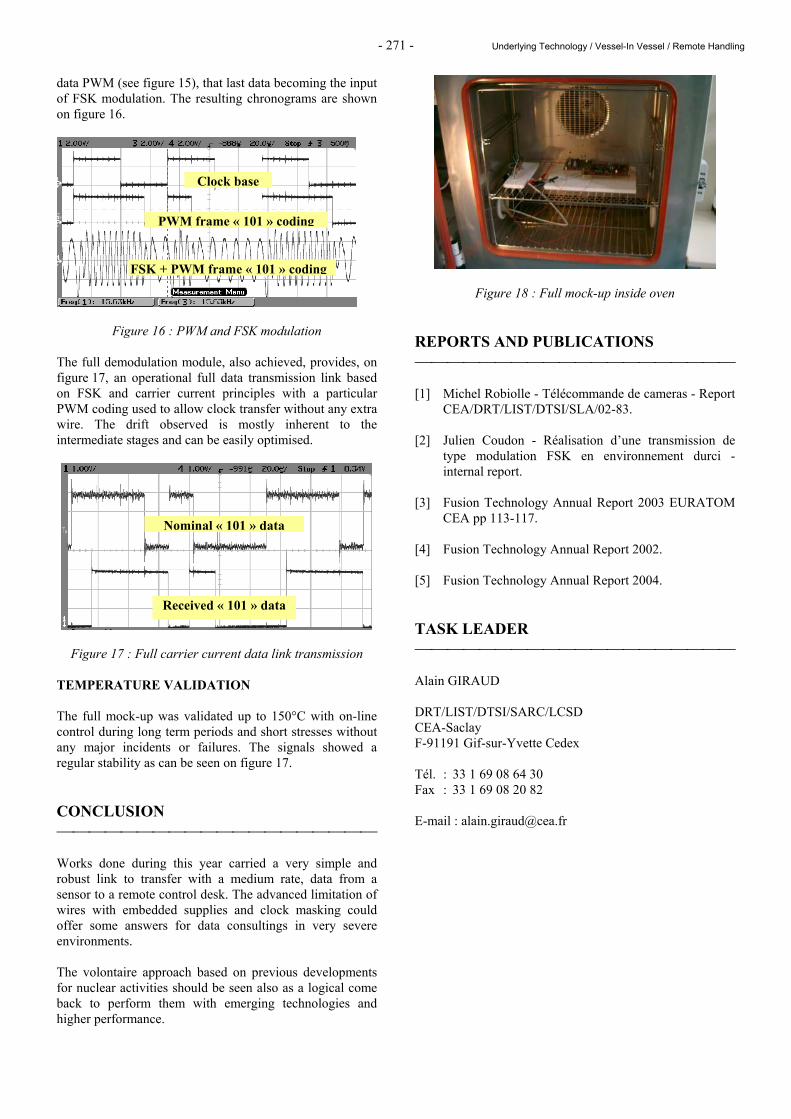
- 271 - Underlying Technology / Vessel-In Vessel / Remote Handling
data PWM (see figure 15), that last data becoming the input of FSK modulation. The resulting chronograms are shown on figure 16.
Figure 16 : PWM and FSK modulation The full demodulation module, also achieved, provides, on figure 17, an operational full data transmission link based on FSK and carrier current principles with a particular PWM coding used to allow clock transfer without any extra wire. The drift observed is mostly inherent to the intermediate stages and can be easily optimised.
Figure 17 : Full carrier current data link transmission TEMPERATURE VALIDATION The full mock-up was validated up to 150°C with on-line control during long term periods and short stresses without any major incidents or failures. The signals showed a regular stability as can be seen on figure 17. CONCLUSION Works done during this year carried a very simple and robust link to transfer with a medium rate, data from a sensor to a remote control desk. The advanced limitation of wires with embedded supplies and clock masking could offer some answers for data consultings in very severe environments. The volontaire approach based on previous developments for nuclear activities should be seen also as a logical come back to perform them with emerging technologies and higher performance.
Figure 18 : Full mock-up inside oven REPORTS AND PUBLICATIONS [1] Michel Robiolle - Télécommande de cameras - Report
CEA/DRT/LIST/DTSI/SLA/02-83. [2] Julien Coudon - Réalisation d’une transmission de
type modulation FSK en environnement durci - internal report.
[3] Fusion Technology Annual Report 2003 EURATOM
CEA pp 113-117. [4] Fusion Technology Annual Report 2002. [5] Fusion Technology Annual Report 2004. TASK LEADER Alain GIRAUD DRT/LIST/DTSI/SARC/LCSD CEA-Saclay F-91191 Gif-sur-Yvette Cedex Tél. : 33 1 69 08 64 30 Fax : 33 1 69 08 20 82 E-mail : [email protected]
Clock base
PWM frame « 101 » coding
FSK + PWM frame « 101 » coding
Nominal « 101 » data
Received « 101 » data

- 272 - Underlying Technology / Vessel-In Vessel / Remote Handling
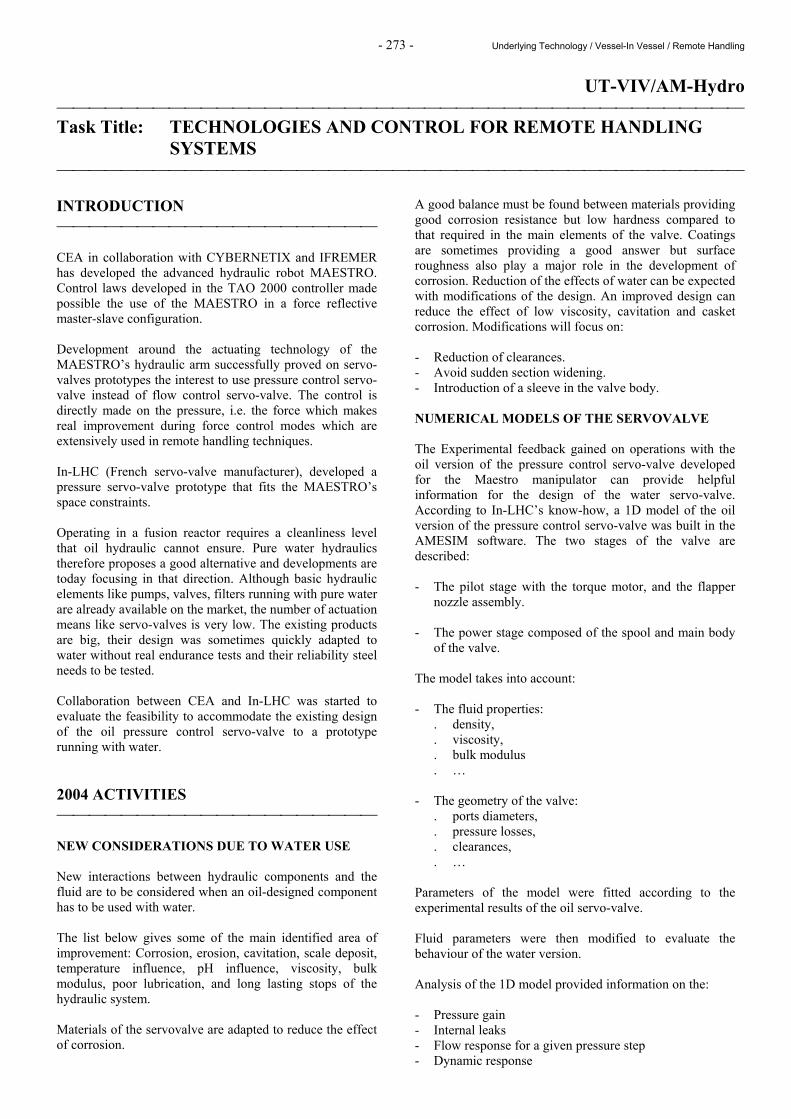
- 273 - Underlying Technology / Vessel-In Vessel / Remote Handling
UT-VIV/AM-Hydro Task Title: TECHNOLOGIES AND CONTROL FOR REMOTE HANDLING
SYSTEMS INTRODUCTION CEA in collaboration with CYBERNETIX and IFREMER has developed the advanced hydraulic robot MAESTRO. Control laws developed in the TAO 2000 controller made possible the use of the MAESTRO in a force reflective master-slave configuration. Development around the actuating technology of the MAESTRO’s hydraulic arm successfully proved on servo-valves prototypes the interest to use pressure control servo-valve instead of flow control servo-valve. The control is directly made on the pressure, i.e. the force which makes real improvement during force control modes which are extensively used in remote handling techniques. In-LHC (French servo-valve manufacturer), developed a pressure servo-valve prototype that fits the MAESTRO’s space constraints. Operating in a fusion reactor requires a cleanliness level that oil hydraulic cannot ensure. Pure water hydraulics therefore proposes a good alternative and developments are today focusing in that direction. Although basic hydraulic elements like pumps, valves, filters running with pure water are already available on the market, the number of actuation means like servo-valves is very low. The existing products are big, their design was sometimes quickly adapted to water without real endurance tests and their reliability steel needs to be tested. Collaboration between CEA and In-LHC was started to evaluate the feasibility to accommodate the existing design of the oil pressure control servo-valve to a prototype running with water. 2004 ACTIVITIES NEW CONSIDERATIONS DUE TO WATER USE New interactions between hydraulic components and the fluid are to be considered when an oil-designed component has to be used with water. The list below gives some of the main identified area of improvement: Corrosion, erosion, cavitation, scale deposit, temperature influence, pH influence, viscosity, bulk modulus, poor lubrication, and long lasting stops of the hydraulic system. Materials of the servovalve are adapted to reduce the effect of corrosion.
A good balance must be found between materials providing good corrosion resistance but low hardness compared to that required in the main elements of the valve. Coatings are sometimes providing a good answer but surface roughness also play a major role in the development of corrosion. Reduction of the effects of water can be expected with modifications of the design. An improved design can reduce the effect of low viscosity, cavitation and casket corrosion. Modifications will focus on: - Reduction of clearances. - Avoid sudden section widening. - Introduction of a sleeve in the valve body. NUMERICAL MODELS OF THE SERVOVALVE The Experimental feedback gained on operations with the oil version of the pressure control servo-valve developed for the Maestro manipulator can provide helpful information for the design of the water servo-valve. According to In-LHC’s know-how, a 1D model of the oil version of the pressure control servo-valve was built in the AMESIM software. The two stages of the valve are described: - The pilot stage with the torque motor, and the flapper
nozzle assembly. - The power stage composed of the spool and main body
of the valve. The model takes into account: - The fluid properties:
. density,
. viscosity,
. bulk modulus
. … - The geometry of the valve:
. ports diameters,
. pressure losses,
. clearances,
. … Parameters of the model were fitted according to the experimental results of the oil servo-valve. Fluid parameters were then modified to evaluate the behaviour of the water version. Analysis of the 1D model provided information on the: - Pressure gain - Internal leaks - Flow response for a given pressure step - Dynamic response
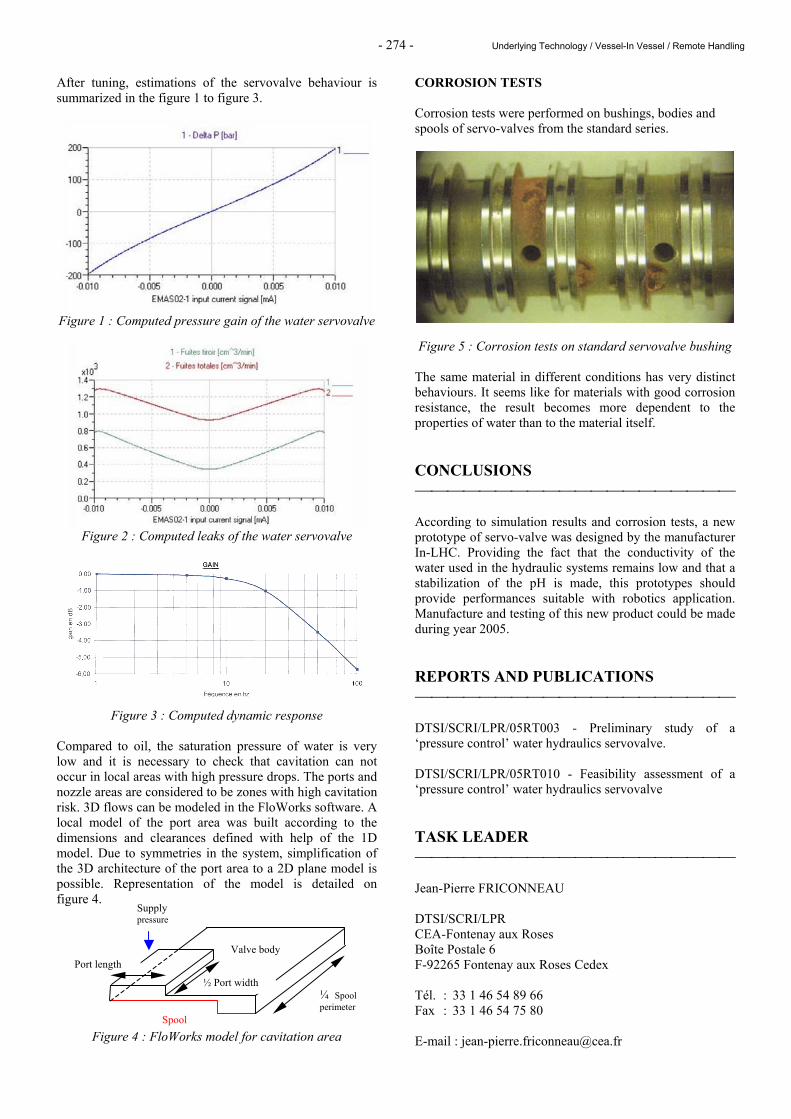
- 274 - Underlying Technology / Vessel-In Vessel / Remote Handling
After tuning, estimations of the servovalve behaviour is summarized in the figure 1 to figure 3.
Figure 1 : Computed pressure gain of the water servovalve
Figure 2 : Computed leaks of the water servovalve
Figure 3 : Computed dynamic response
Compared to oil, the saturation pressure of water is very low and it is necessary to check that cavitation can not occur in local areas with high pressure drops. The ports and nozzle areas are considered to be zones with high cavitation risk. 3D flows can be modeled in the FloWorks software. A local model of the port area was built according to the dimensions and clearances defined with help of the 1D model. Due to symmetries in the system, simplification of the 3D architecture of the port area to a 2D plane model is possible. Representation of the model is detailed on figure 4.
Figure 4 : FloWorks model for cavitation area
CORROSION TESTS Corrosion tests were performed on bushings, bodies and spools of servo-valves from the standard series.
Figure 5 : Corrosion tests on standard servovalve bushing
The same material in different conditions has very distinct behaviours. It seems like for materials with good corrosion resistance, the result becomes more dependent to the properties of water than to the material itself. CONCLUSIONS According to simulation results and corrosion tests, a new prototype of servo-valve was designed by the manufacturer In-LHC. Providing the fact that the conductivity of the water used in the hydraulic systems remains low and that a stabilization of the pH is made, this prototypes should provide performances suitable with robotics application. Manufacture and testing of this new product could be made during year 2005. REPORTS AND PUBLICATIONS DTSI/SCRI/LPR/05RT003 - Preliminary study of a ‘pressure control’ water hydraulics servovalve. DTSI/SCRI/LPR/05RT010 - Feasibility assessment of a ‘pressure control’ water hydraulics servovalve TASK LEADER Jean-Pierre FRICONNEAU DTSI/SCRI/LPR CEA-Fontenay aux Roses Boîte Postale 6 F-92265 Fontenay aux Roses Cedex Tél. : 33 1 46 54 89 66 Fax : 33 1 46 54 75 80 E-mail : [email protected]
Port length
½ Port width ¼ Spool perimeter
Supply pressure
Spool
Valve body
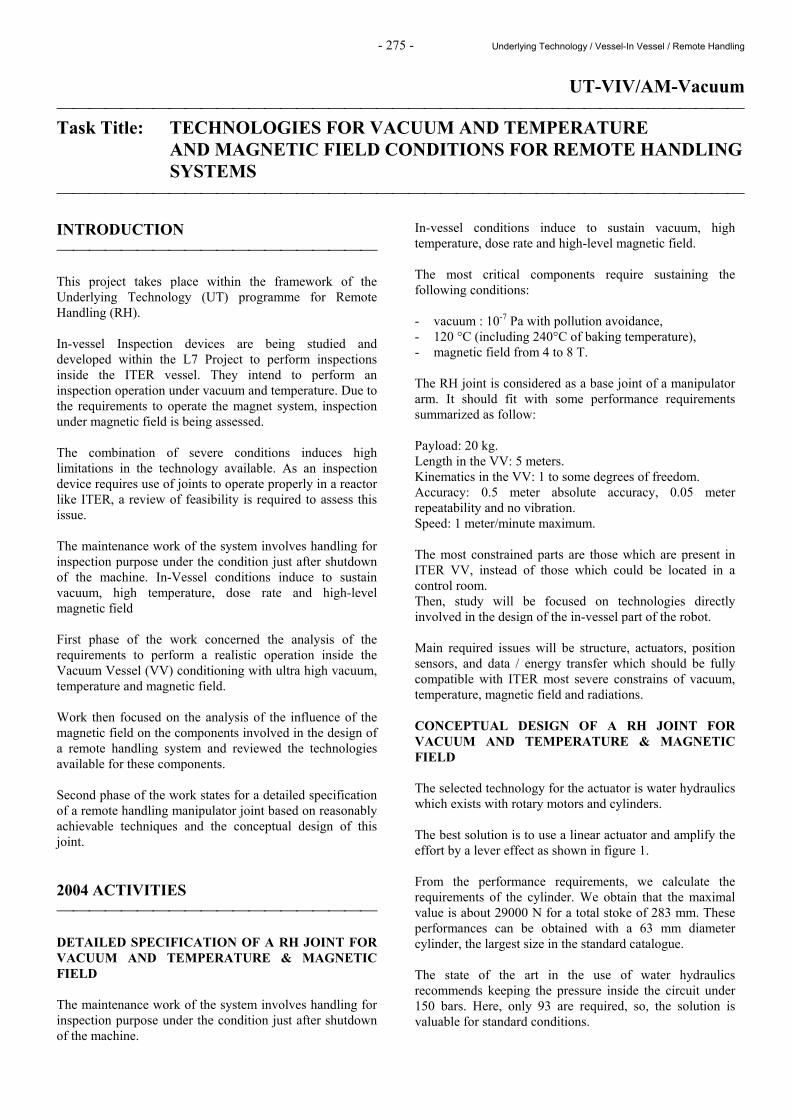
- 275 - Underlying Technology / Vessel-In Vessel / Remote Handling
UT-VIV/AM-Vacuum Task Title: TECHNOLOGIES FOR VACUUM AND TEMPERATURE
AND MAGNETIC FIELD CONDITIONS FOR REMOTE HANDLING SYSTEMS
INTRODUCTION This project takes place within the framework of the Underlying Technology (UT) programme for Remote Handling (RH). In-vessel Inspection devices are being studied and developed within the L7 Project to perform inspections inside the ITER vessel. They intend to perform an inspection operation under vacuum and temperature. Due to the requirements to operate the magnet system, inspection under magnetic field is being assessed. The combination of severe conditions induces high limitations in the technology available. As an inspection device requires use of joints to operate properly in a reactor like ITER, a review of feasibility is required to assess this issue. The maintenance work of the system involves handling for inspection purpose under the condition just after shutdown of the machine. In-Vessel conditions induce to sustain vacuum, high temperature, dose rate and high-level magnetic field First phase of the work concerned the analysis of the requirements to perform a realistic operation inside the Vacuum Vessel (VV) conditioning with ultra high vacuum, temperature and magnetic field. Work then focused on the analysis of the influence of the magnetic field on the components involved in the design of a remote handling system and reviewed the technologies available for these components. Second phase of the work states for a detailed specification of a remote handling manipulator joint based on reasonably achievable techniques and the conceptual design of this joint. 2004 ACTIVITIES DETAILED SPECIFICATION OF A RH JOINT FOR VACUUM AND TEMPERATURE & MAGNETIC FIELD The maintenance work of the system involves handling for inspection purpose under the condition just after shutdown of the machine.
In-vessel conditions induce to sustain vacuum, high temperature, dose rate and high-level magnetic field. The most critical components require sustaining the following conditions: - vacuum : 10-7 Pa with pollution avoidance, - 120 °C (including 240°C of baking temperature), - magnetic field from 4 to 8 T. The RH joint is considered as a base joint of a manipulator arm. It should fit with some performance requirements summarized as follow: Payload: 20 kg. Length in the VV: 5 meters. Kinematics in the VV: 1 to some degrees of freedom. Accuracy: 0.5 meter absolute accuracy, 0.05 meter repeatability and no vibration. Speed: 1 meter/minute maximum. The most constrained parts are those which are present in ITER VV, instead of those which could be located in a control room. Then, study will be focused on technologies directly involved in the design of the in-vessel part of the robot. Main required issues will be structure, actuators, position sensors, and data / energy transfer which should be fully compatible with ITER most severe constrains of vacuum, temperature, magnetic field and radiations. CONCEPTUAL DESIGN OF A RH JOINT FOR VACUUM AND TEMPERATURE & MAGNETIC FIELD The selected technology for the actuator is water hydraulics which exists with rotary motors and cylinders. The best solution is to use a linear actuator and amplify the effort by a lever effect as shown in figure 1. From the performance requirements, we calculate the requirements of the cylinder. We obtain that the maximal value is about 29000 N for a total stoke of 283 mm. These performances can be obtained with a 63 mm diameter cylinder, the largest size in the standard catalogue. The state of the art in the use of water hydraulics recommends keeping the pressure inside the circuit under 150 bars. Here, only 93 are required, so, the solution is valuable for standard conditions.

- 276 - Underlying Technology / Vessel-In Vessel / Remote Handling
Figure 1 : Design of a RH joint with cylinder With the precedent work, it has been demonstrated that the magnetic field have a very low incidence on the water hydraulic systems. However, the existing technology cannot be used directly, it will be necessary to adapt a standard jack to the tokamak conditions. This upgrade mainly concerns material for the seals and the low pressure to avoid steam and cavitation in the circuit. In normal conditions, at 120°C the water is at a vapour state. But it is possible to maintain it liquid if we increase sufficiently the pressure inside the water circuit. Indeed, it is impossible to control a hydraulic circuit if the fluid is in two phases at the same time and especially if the liquid water turns in steam. We can estimate the minimal pressure with the phase diagram of water. With a pressure greater than 2 bars for the temperature of 120°C, and 16 bars for 200°C, the storage temperature, water is liquid. Then it is possible to use a water circuit with an offset of pressure in the output circuit.
An other way to avoid the temperature constrain could be to cool the body of the jack in order to keep a reasonable pressure in the hydraulic circuit. It could be possible with a secondary water hydraulic circuit dedicated to the control of temperature. The usable materials for the design have been identified in the first phase of the studies with the associated consequences due to the magnetic field. For the design of the seals, we could also add the PEEK and the Vespel to the list because they have been validated for temperature and vacuum. So, with quite standards seals, it could be possible to work under the thermal solicitation. One other problem is that the stem of the jack must always be lubricated, but it implies that the sealing of the jack’s body will not be efficient to answer to the need of low degasification in vacuum atmosphere. So it will be necessary to close this part inside bellows as shown on figure 2. This kind of design could be a solution of a water hydraulic cylinder for supporting the constraints of high vacuum, temperature and magnetic field. At least, there is no standard solution for the need. It will be necessary to joint different elements of the water hydraulic industry and joint them into a suitable proposition. For now, there is no significant and blocking point in the study, but it will be necessary to test and validate some sub-assemblies to ensure a secure answer.
Figure 2 : Design of an adapted water hydraulic cylinder
Bellows to seal the cylinder
Serpentine to cool the body of the jack
Seals for high temperatures
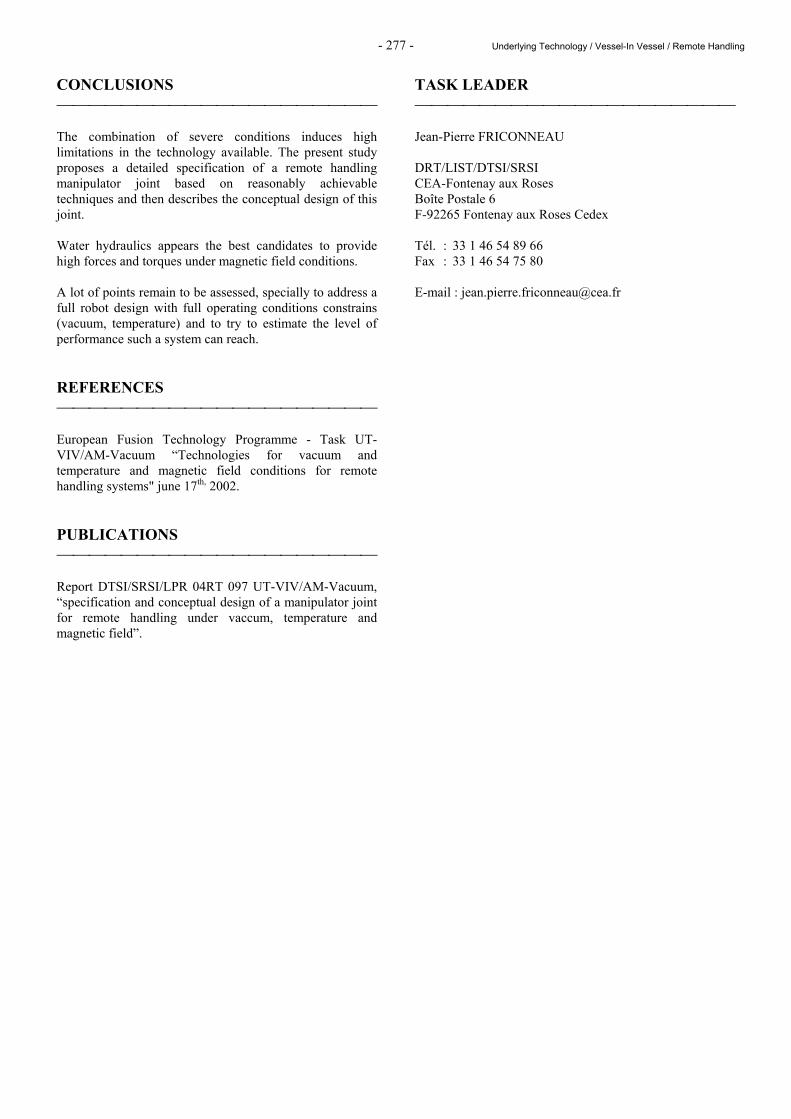
- 277 - Underlying Technology / Vessel-In Vessel / Remote Handling
CONCLUSIONS The combination of severe conditions induces high limitations in the technology available. The present study proposes a detailed specification of a remote handling manipulator joint based on reasonably achievable techniques and then describes the conceptual design of this joint. Water hydraulics appears the best candidates to provide high forces and torques under magnetic field conditions. A lot of points remain to be assessed, specially to address a full robot design with full operating conditions constrains (vacuum, temperature) and to try to estimate the level of performance such a system can reach. REFERENCES European Fusion Technology Programme - Task UT-VIV/AM-Vacuum “Technologies for vacuum and temperature and magnetic field conditions for remote handling systems" june 17th, 2002. PUBLICATIONS Report DTSI/SRSI/LPR 04RT 097 UT-VIV/AM-Vacuum, “specification and conceptual design of a manipulator joint for remote handling under vaccum, temperature and magnetic field”.
TASK LEADER Jean-Pierre FRICONNEAU DRT/LIST/DTSI/SRSI CEA-Fontenay aux Roses Boîte Postale 6 F-92265 Fontenay aux Roses Cedex Tél. : 33 1 46 54 89 66 Fax : 33 1 46 54 75 80 E-mail : [email protected]

- 278 - Underlying Technology / Vessel-In Vessel / Remote Handling

- 279 - Underlying Technology / Tritium Breeding and Materials / Breeding Blanket
UT-TBM/BB-He Task Title: HELIUM COMPONENTS TECHNOLOGY
PROBLEMS AND OUTLINE OF SOLUTIONS INTRODUCTION A review of problems related to helium technology, and a proposal of studies and experiments had been done in the previous year (2003). Four subjects have been addressed in 2004. First, the leaks of helium and of tritium have to be evaluated, for a typical design, in order to know which points must be improved, and/or which mitigation systems must be designed, in order to reduce tritium release to admissible values. The task was, in 2004, to evaluate leaks other than by permeation, this aspect being dealt with by CEA/DEN/DM2S, in 2004. Second, tribological materials must be identified, and tested. In 2004, experiments on several of them have been done. Third, the leak tightness of commercial or prototype static seals must be tested. A bench called HETIQ (figures 1 and 2) has been built, for this. It has been commissioned in 2004. Fourth, the pipe containing helium from the divertor will convey a gas at about 740°C, 9.65 MPa. A technological solution deduced from helium cooled fission reactors might consist in protecting the pressure vessel by an Inner Thermal Barrier (ITB). A mock-up called HETHIMO (figures 3 and 4) has been commissioned in 2004, in order to test several designs of ITBs.
Heater
Test sectionTested seal
Figure 1 : HETIQ / principle 2004 ACTIVITIES The helium leak flow of blanket cooling circuits of a 1500 MWe PPCS has been evaluated, for all leaks but those by permeation. Since rotating seals lead either to high leak flows, or to complicated circuit designs, it was assumed that these seals will be eliminated by using immersed electric motors. For other elementary leak sources, elementary data from fission reactors were extrapolated. The following table gives the detail of the leak flows. It leads to a global leak of 0.4 Nm3 per hour, which is equivalent to a loss of 2% of the total inventory per year.
Recapitulation of helium losses of PPCS BKT and DV cooling circuits, other than by permeation
Total leaks in m3/h at Normal conditions Comments Possibility of reduction
Static seals 9.72 x 10⁻⁶ Yes (welding)
Rotating seals 0 Electric motors immersed in helium
Steam generator ε Depends on the detection capability of
measurements in the water side
Maintenance operations 0.24 Yes (lower the pressure to a fraction of patm)
Isolating components 0.19
Purification & inventory management 0 Cost of 0 leak to be evaluated No : can only increase
Total 0.4 Nm3/h 2 x 10⁻² inv./y
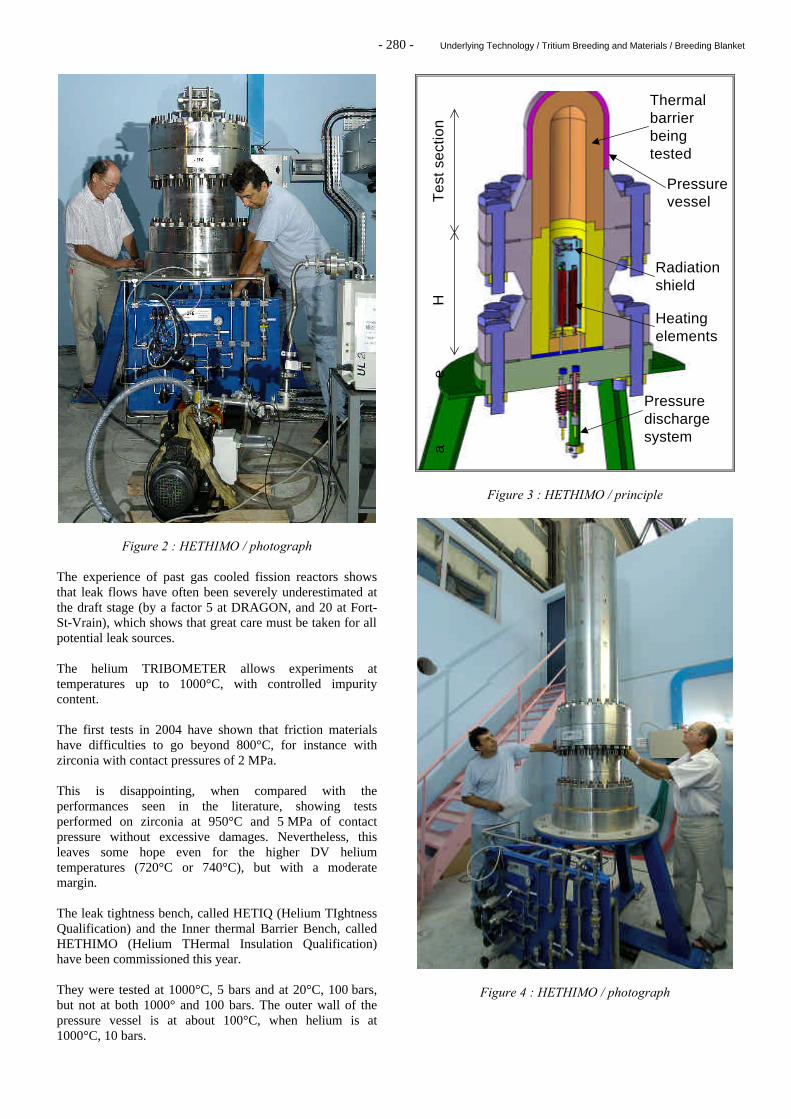
- 280 - Underlying Technology / Tritium Breeding and Materials / Breeding Blanket
Figure 2 : HETHIMO / photograph The experience of past gas cooled fission reactors shows that leak flows have often been severely underestimated at the draft stage (by a factor 5 at DRAGON, and 20 at Fort-St-Vrain), which shows that great care must be taken for all potential leak sources. The helium TRIBOMETER allows experiments at temperatures up to 1000°C, with controlled impurity content. The first tests in 2004 have shown that friction materials have difficulties to go beyond 800°C, for instance with zirconia with contact pressures of 2 MPa. This is disappointing, when compared with the performances seen in the literature, showing tests performed on zirconia at 950°C and 5 MPa of contact pressure without excessive damages. Nevertheless, this leaves some hope even for the higher DV helium temperatures (720°C or 740°C), but with a moderate margin. The leak tightness bench, called HETIQ (Helium TIghtness Qualification) and the Inner thermal Barrier Bench, called HETHIMO (Helium THermal Insulation Qualification) have been commissioned this year. They were tested at 1000°C, 5 bars and at 20°C, 100 bars, but not at both 1000° and 100 bars. The outer wall of the pressure vessel is at about 100°C, when helium is at 1000°C, 10 bars.
He
at
er
Heatingelements
Radiationshield
Thermalbarrierbeingtested
Pressurevessel
Pressuredischargesystem
Te
st s
ect
ion
Figure 3 : HETHIMO / principle
Figure 4 : HETHIMO / photograph
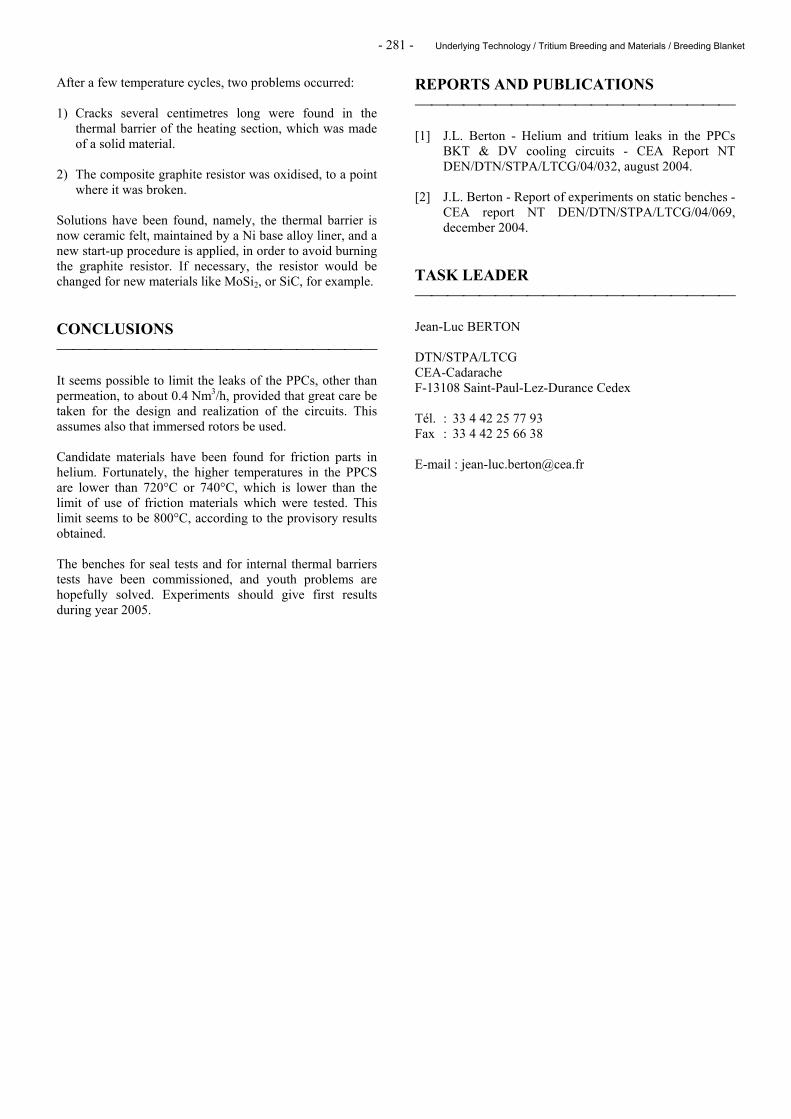
- 281 - Underlying Technology / Tritium Breeding and Materials / Breeding Blanket
After a few temperature cycles, two problems occurred: 1) Cracks several centimetres long were found in the
thermal barrier of the heating section, which was made of a solid material.
2) The composite graphite resistor was oxidised, to a point
where it was broken. Solutions have been found, namely, the thermal barrier is now ceramic felt, maintained by a Ni base alloy liner, and a new start-up procedure is applied, in order to avoid burning the graphite resistor. If necessary, the resistor would be changed for new materials like MoSi2, or SiC, for example. CONCLUSIONS It seems possible to limit the leaks of the PPCs, other than permeation, to about 0.4 Nm3/h, provided that great care be taken for the design and realization of the circuits. This assumes also that immersed rotors be used. Candidate materials have been found for friction parts in helium. Fortunately, the higher temperatures in the PPCS are lower than 720°C or 740°C, which is lower than the limit of use of friction materials which were tested. This limit seems to be 800°C, according to the provisory results obtained. The benches for seal tests and for internal thermal barriers tests have been commissioned, and youth problems are hopefully solved. Experiments should give first results during year 2005.
REPORTS AND PUBLICATIONS [1] J.L. Berton - Helium and tritium leaks in the PPCs
BKT & DV cooling circuits - CEA Report NT DEN/DTN/STPA/LTCG/04/032, august 2004.
[2] J.L. Berton - Report of experiments on static benches -
CEA report NT DEN/DTN/STPA/LTCG/04/069, december 2004.
TASK LEADER Jean-Luc BERTON DTN/STPA/LTCG CEA-Cadarache F-13108 Saint-Paul-Lez-Durance Cedex Tél. : 33 4 42 25 77 93 Fax : 33 4 42 25 66 38 E-mail : [email protected]

- 282 - Underlying Technology / Tritium Breeding and Materials / Breeding Blanket
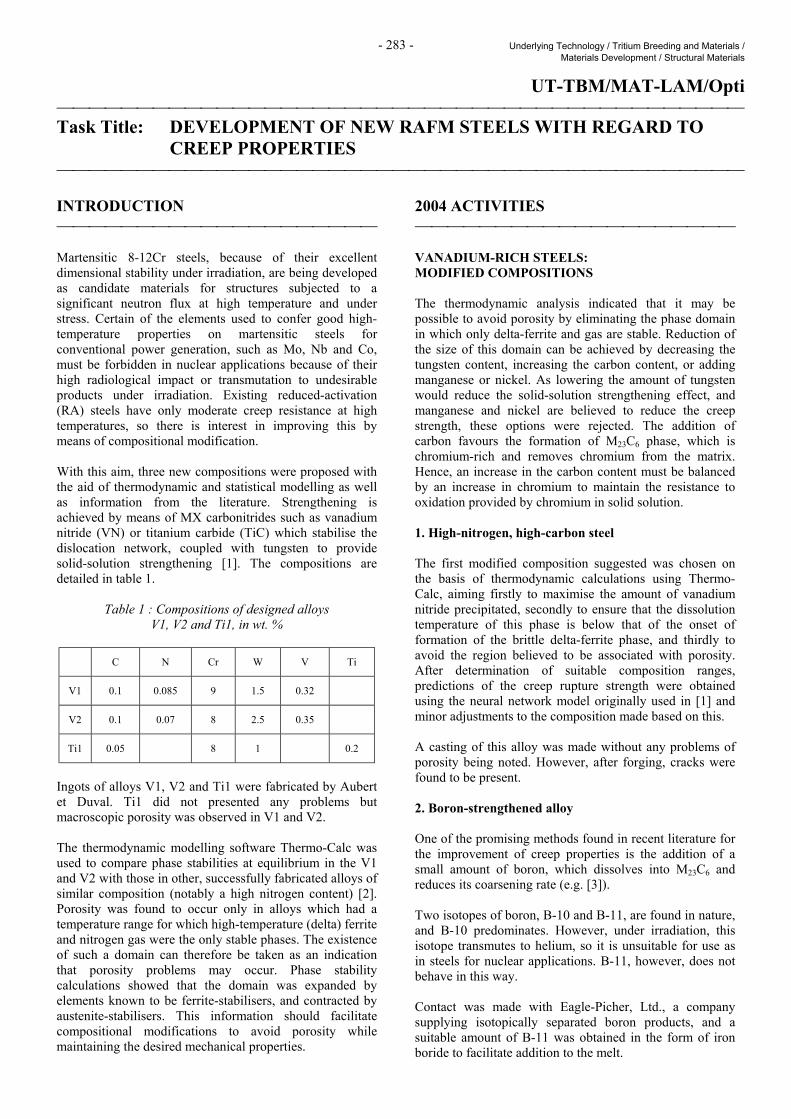
- 283 - Underlying Technology / Tritium Breeding and Materials / Materials Development / Structural Materials
UT-TBM/MAT-LAM/Opti Task Title: DEVELOPMENT OF NEW RAFM STEELS WITH REGARD TO
CREEP PROPERTIES INTRODUCTION Martensitic 8-12Cr steels, because of their excellent dimensional stability under irradiation, are being developed as candidate materials for structures subjected to a significant neutron flux at high temperature and under stress. Certain of the elements used to confer good high-temperature properties on martensitic steels for conventional power generation, such as Mo, Nb and Co, must be forbidden in nuclear applications because of their high radiological impact or transmutation to undesirable products under irradiation. Existing reduced-activation (RA) steels have only moderate creep resistance at high temperatures, so there is interest in improving this by means of compositional modification. With this aim, three new compositions were proposed with the aid of thermodynamic and statistical modelling as well as information from the literature. Strengthening is achieved by means of MX carbonitrides such as vanadium nitride (VN) or titanium carbide (TiC) which stabilise the dislocation network, coupled with tungsten to provide solid-solution strengthening [1]. The compositions are detailed in table 1.
Table 1 : Compositions of designed alloys V1, V2 and Ti1, in wt. %
C N Cr W V Ti
V1 0.1 0.085 9 1.5 0.32
V2 0.1 0.07 8 2.5 0.35
Ti1 0.05 8 1 0.2
Ingots of alloys V1, V2 and Ti1 were fabricated by Aubert et Duval. Ti1 did not presented any problems but macroscopic porosity was observed in V1 and V2. The thermodynamic modelling software Thermo-Calc was used to compare phase stabilities at equilibrium in the V1 and V2 with those in other, successfully fabricated alloys of similar composition (notably a high nitrogen content) [2]. Porosity was found to occur only in alloys which had a temperature range for which high-temperature (delta) ferrite and nitrogen gas were the only stable phases. The existence of such a domain can therefore be taken as an indication that porosity problems may occur. Phase stability calculations showed that the domain was expanded by elements known to be ferrite-stabilisers, and contracted by austenite-stabilisers. This information should facilitate compositional modifications to avoid porosity while maintaining the desired mechanical properties.
2004 ACTIVITIES VANADIUM-RICH STEELS: MODIFIED COMPOSITIONS The thermodynamic analysis indicated that it may be possible to avoid porosity by eliminating the phase domain in which only delta-ferrite and gas are stable. Reduction of the size of this domain can be achieved by decreasing the tungsten content, increasing the carbon content, or adding manganese or nickel. As lowering the amount of tungsten would reduce the solid-solution strengthening effect, and manganese and nickel are believed to reduce the creep strength, these options were rejected. The addition of carbon favours the formation of M23C6 phase, which is chromium-rich and removes chromium from the matrix. Hence, an increase in the carbon content must be balanced by an increase in chromium to maintain the resistance to oxidation provided by chromium in solid solution. 1. High-nitrogen, high-carbon steel The first modified composition suggested was chosen on the basis of thermodynamic calculations using Thermo-Calc, aiming firstly to maximise the amount of vanadium nitride precipitated, secondly to ensure that the dissolution temperature of this phase is below that of the onset of formation of the brittle delta-ferrite phase, and thirdly to avoid the region believed to be associated with porosity. After determination of suitable composition ranges, predictions of the creep rupture strength were obtained using the neural network model originally used in [1] and minor adjustments to the composition made based on this. A casting of this alloy was made without any problems of porosity being noted. However, after forging, cracks were found to be present. 2. Boron-strengthened alloy One of the promising methods found in recent literature for the improvement of creep properties is the addition of a small amount of boron, which dissolves into M23C6 and reduces its coarsening rate (e.g. [3]). Two isotopes of boron, B-10 and B-11, are found in nature, and B-10 predominates. However, under irradiation, this isotope transmutes to helium, so it is unsuitable for use as in steels for nuclear applications. B-11, however, does not behave in this way. Contact was made with Eagle-Picher, Ltd., a company supplying isotopically separated boron products, and a suitable amount of B-11 was obtained in the form of iron boride to facilitate addition to the melt.
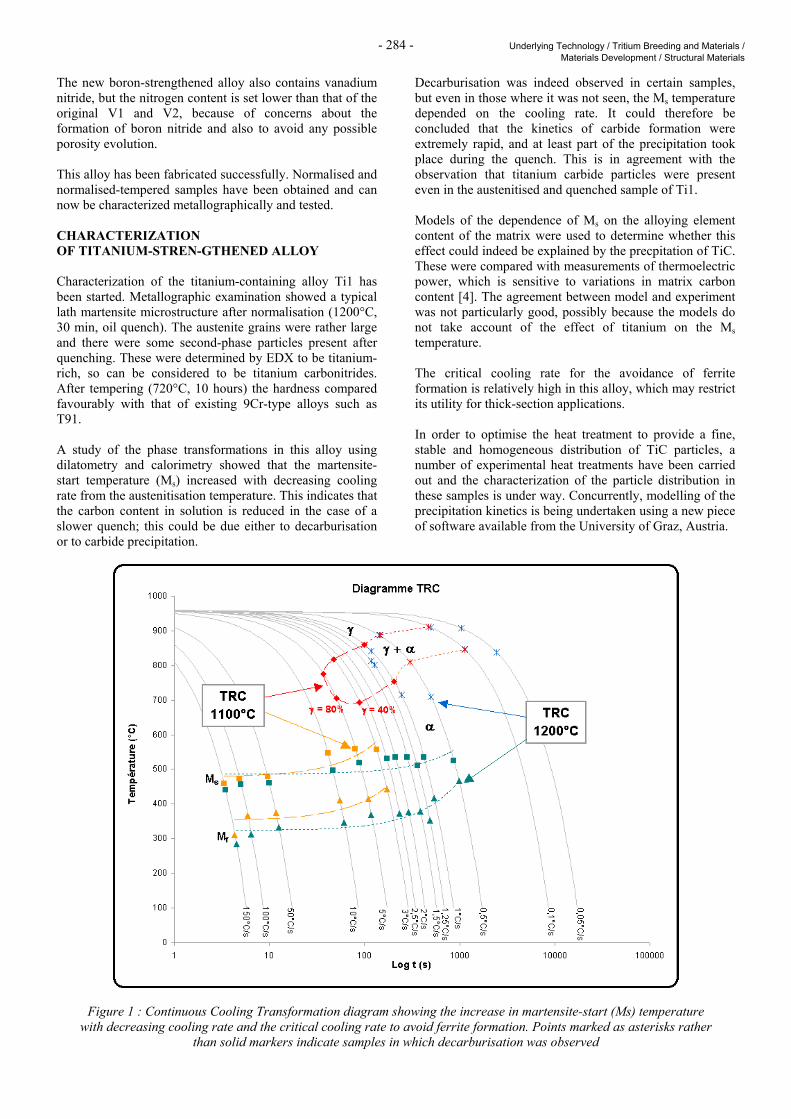
- 284 - Underlying Technology / Tritium Breeding and Materials / Materials Development / Structural Materials
The new boron-strengthened alloy also contains vanadium nitride, but the nitrogen content is set lower than that of the original V1 and V2, because of concerns about the formation of boron nitride and also to avoid any possible porosity evolution. This alloy has been fabricated successfully. Normalised and normalised-tempered samples have been obtained and can now be characterized metallographically and tested. CHARACTERIZATION OF TITANIUM-STREN-GTHENED ALLOY Characterization of the titanium-containing alloy Ti1 has been started. Metallographic examination showed a typical lath martensite microstructure after normalisation (1200°C, 30 min, oil quench). The austenite grains were rather large and there were some second-phase particles present after quenching. These were determined by EDX to be titanium-rich, so can be considered to be titanium carbonitrides. After tempering (720°C, 10 hours) the hardness compared favourably with that of existing 9Cr-type alloys such as T91. A study of the phase transformations in this alloy using dilatometry and calorimetry showed that the martensite-start temperature (Ms) increased with decreasing cooling rate from the austenitisation temperature. This indicates that the carbon content in solution is reduced in the case of a slower quench; this could be due either to decarburisation or to carbide precipitation.
Decarburisation was indeed observed in certain samples, but even in those where it was not seen, the Ms temperature depended on the cooling rate. It could therefore be concluded that the kinetics of carbide formation were extremely rapid, and at least part of the precipitation took place during the quench. This is in agreement with the observation that titanium carbide particles were present even in the austenitised and quenched sample of Ti1. Models of the dependence of Ms on the alloying element content of the matrix were used to determine whether this effect could indeed be explained by the precpitation of TiC. These were compared with measurements of thermoelectric power, which is sensitive to variations in matrix carbon content [4]. The agreement between model and experiment was not particularly good, possibly because the models do not take account of the effect of titanium on the Ms temperature. The critical cooling rate for the avoidance of ferrite formation is relatively high in this alloy, which may restrict its utility for thick-section applications. In order to optimise the heat treatment to provide a fine, stable and homogeneous distribution of TiC particles, a number of experimental heat treatments have been carried out and the characterization of the particle distribution in these samples is under way. Concurrently, modelling of the precipitation kinetics is being undertaken using a new piece of software available from the University of Graz, Austria.
Figure 1 : Continuous Cooling Transformation diagram showing the increase in martensite-start (Ms) temperature with decreasing cooling rate and the critical cooling rate to avoid ferrite formation. Points marked as asterisks rather
than solid markers indicate samples in which decarburisation was observed
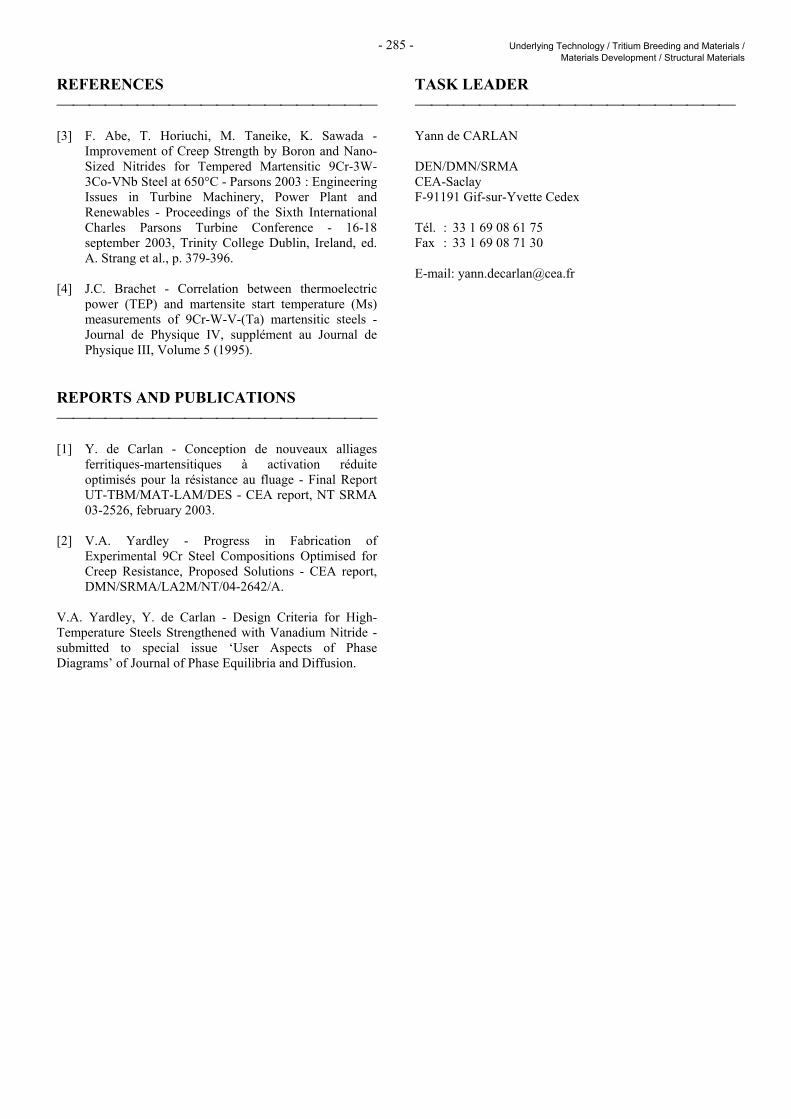
- 285 - Underlying Technology / Tritium Breeding and Materials / Materials Development / Structural Materials
REFERENCES [3] F. Abe, T. Horiuchi, M. Taneike, K. Sawada -
Improvement of Creep Strength by Boron and Nano-Sized Nitrides for Tempered Martensitic 9Cr-3W-3Co-VNb Steel at 650°C - Parsons 2003 : Engineering Issues in Turbine Machinery, Power Plant and Renewables - Proceedings of the Sixth International Charles Parsons Turbine Conference - 16-18 september 2003, Trinity College Dublin, Ireland, ed. A. Strang et al., p. 379-396.
[4] J.C. Brachet - Correlation between thermoelectric
power (TEP) and martensite start temperature (Ms) measurements of 9Cr-W-V-(Ta) martensitic steels - Journal de Physique IV, supplément au Journal de Physique III, Volume 5 (1995).
REPORTS AND PUBLICATIONS [1] Y. de Carlan - Conception de nouveaux alliages
ferritiques-martensitiques à activation réduite optimisés pour la résistance au fluage - Final Report UT-TBM/MAT-LAM/DES - CEA report, NT SRMA 03-2526, february 2003.
[2] V.A. Yardley - Progress in Fabrication of
Experimental 9Cr Steel Compositions Optimised for Creep Resistance, Proposed Solutions - CEA report, DMN/SRMA/LA2M/NT/04-2642/A.
V.A. Yardley, Y. de Carlan - Design Criteria for High-Temperature Steels Strengthened with Vanadium Nitride - submitted to special issue ‘User Aspects of Phase Diagrams’ of Journal of Phase Equilibria and Diffusion.
TASK LEADER Yann de CARLAN DEN/DMN/SRMA CEA-Saclay F-91191 Gif-sur-Yvette Cedex Tél. : 33 1 69 08 61 75 Fax : 33 1 69 08 71 30 E-mail: [email protected]

- 286 - Underlying Technology / Tritium Breeding and Materials / Materials Development / Structural Materials
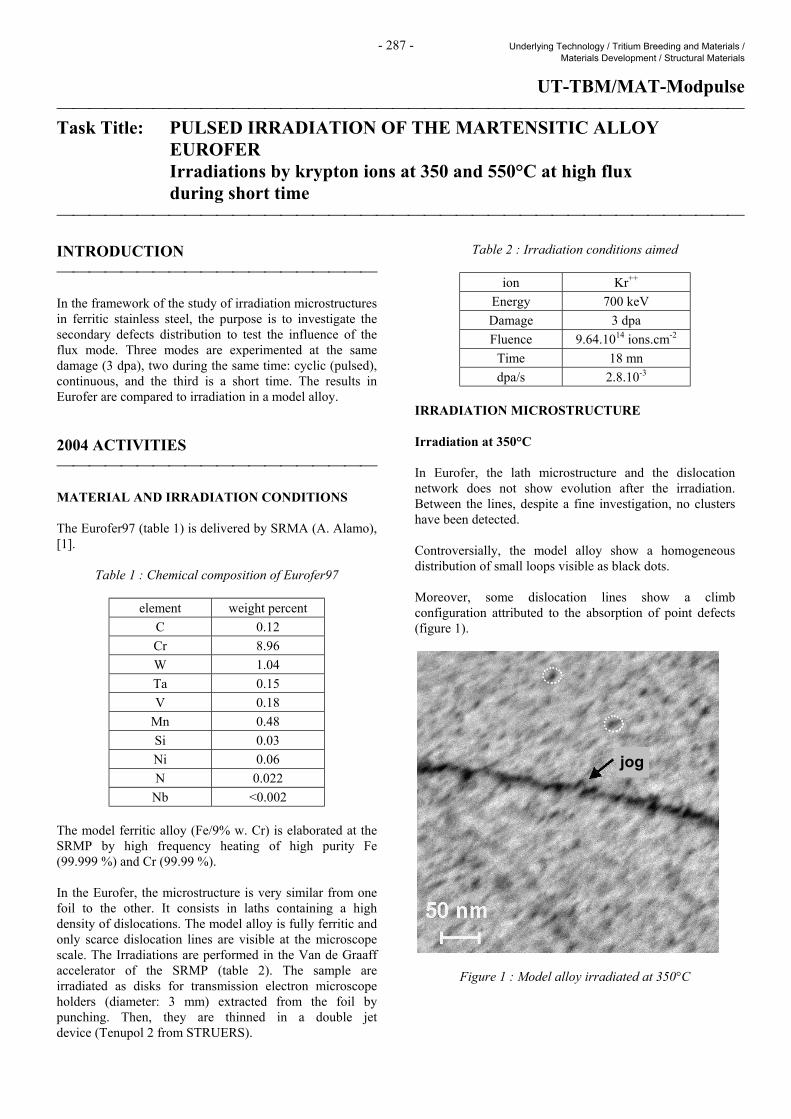
- 287 - Underlying Technology / Tritium Breeding and Materials / Materials Development / Structural Materials
UT-TBM/MAT-Modpulse Task Title: PULSED IRRADIATION OF THE MARTENSITIC ALLOY
EUROFER Irradiations by krypton ions at 350 and 550°C at high flux
during short time INTRODUCTION In the framework of the study of irradiation microstructures in ferritic stainless steel, the purpose is to investigate the secondary defects distribution to test the influence of the flux mode. Three modes are experimented at the same damage (3 dpa), two during the same time: cyclic (pulsed), continuous, and the third is a short time. The results in Eurofer are compared to irradiation in a model alloy. 2004 ACTIVITIES MATERIAL AND IRRADIATION CONDITIONS The Eurofer97 (table 1) is delivered by SRMA (A. Alamo), [1].
Table 1 : Chemical composition of Eurofer97
element weight percent C 0.12 Cr 8.96 W 1.04 Ta 0.15 V 0.18
Mn 0.48 Si 0.03 Ni 0.06 N 0.022
Nb <0.002 The model ferritic alloy (Fe/9% w. Cr) is elaborated at the SRMP by high frequency heating of high purity Fe (99.999 %) and Cr (99.99 %). In the Eurofer, the microstructure is very similar from one foil to the other. It consists in laths containing a high density of dislocations. The model alloy is fully ferritic and only scarce dislocation lines are visible at the microscope scale. The Irradiations are performed in the Van de Graaff accelerator of the SRMP (table 2). The sample are irradiated as disks for transmission electron microscope holders (diameter: 3 mm) extracted from the foil by punching. Then, they are thinned in a double jet device (Tenupol 2 from STRUERS).
Table 2 : Irradiation conditions aimed
ion Kr++ Energy 700 keV Damage 3 dpa Fluence 9.64.1014 ions.cm-2
Time 18 mn dpa/s 2.8.10-3
IRRADIATION MICROSTRUCTURE Irradiation at 350°C In Eurofer, the lath microstructure and the dislocation network does not show evolution after the irradiation. Between the lines, despite a fine investigation, no clusters have been detected. Controversially, the model alloy show a homogeneous distribution of small loops visible as black dots. Moreover, some dislocation lines show a climb configuration attributed to the absorption of point defects (figure 1).
Figure 1 : Model alloy irradiated at 350°C
jog
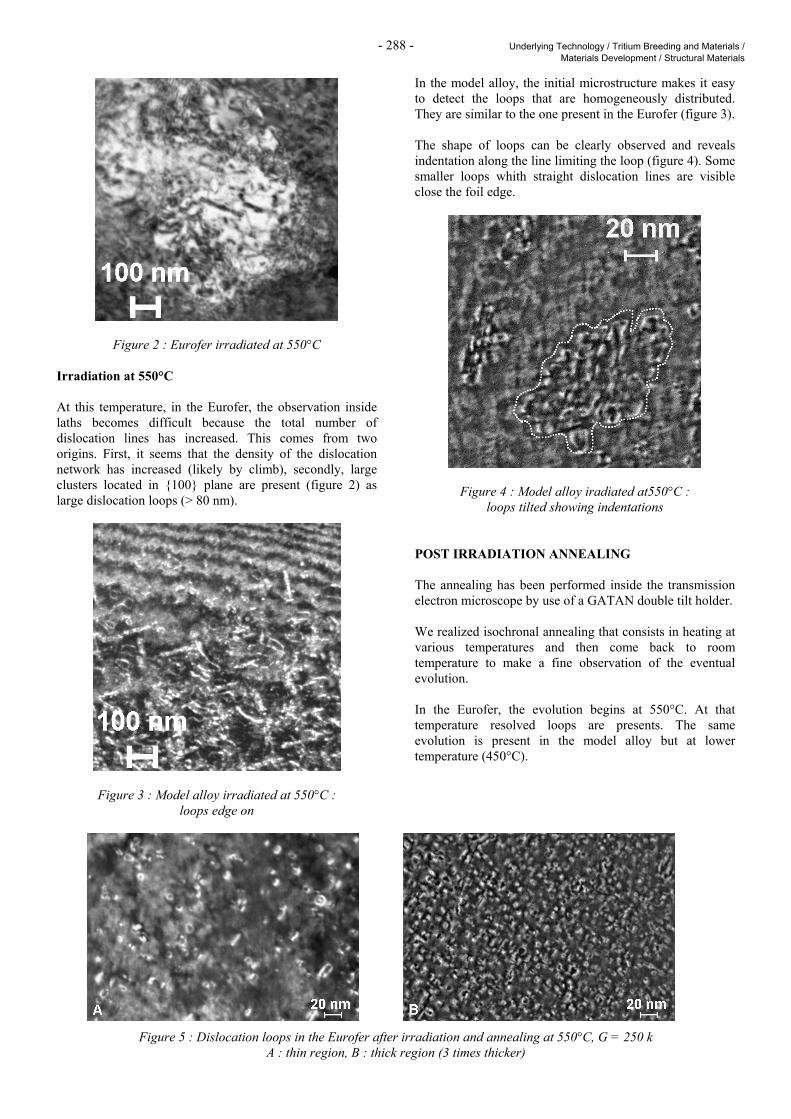
- 288 - Underlying Technology / Tritium Breeding and Materials / Materials Development / Structural Materials
Figure 2 : Eurofer irradiated at 550°C Irradiation at 550°C At this temperature, in the Eurofer, the observation inside laths becomes difficult because the total number of dislocation lines has increased. This comes from two origins. First, it seems that the density of the dislocation network has increased (likely by climb), secondly, large clusters located in 100 plane are present (figure 2) as large dislocation loops (> 80 nm).
Figure 3 : Model alloy irradiated at 550°C : loops edge on
In the model alloy, the initial microstructure makes it easy to detect the loops that are homogeneously distributed. They are similar to the one present in the Eurofer (figure 3). The shape of loops can be clearly observed and reveals indentation along the line limiting the loop (figure 4). Some smaller loops whith straight dislocation lines are visible close the foil edge.
Figure 4 : Model alloy iradiated at550°C : loops tilted showing indentations
POST IRRADIATION ANNEALING The annealing has been performed inside the transmission electron microscope by use of a GATAN double tilt holder. We realized isochronal annealing that consists in heating at various temperatures and then come back to room temperature to make a fine observation of the eventual evolution. In the Eurofer, the evolution begins at 550°C. At that temperature resolved loops are presents. The same evolution is present in the model alloy but at lower temperature (450°C).
Figure 5 : Dislocation loops in the Eurofer after irradiation and annealing at 550°C, G = 250 k
A : thin region, B : thick region (3 times thicker)
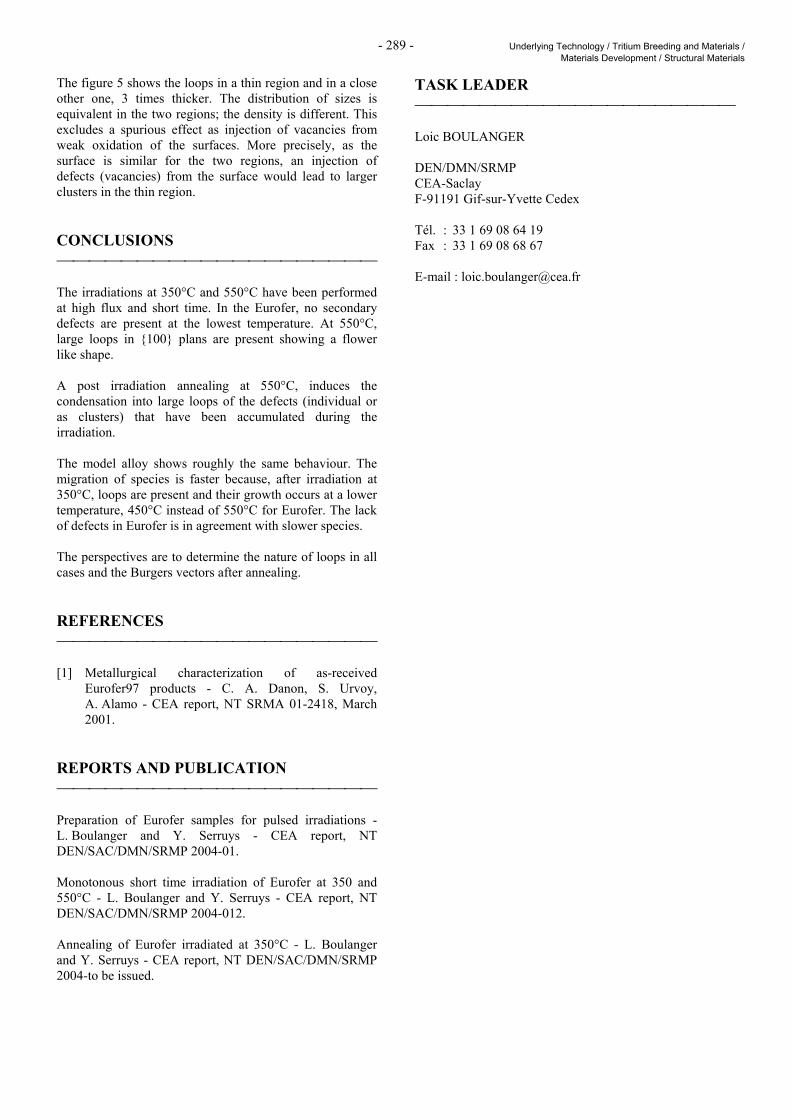
- 289 - Underlying Technology / Tritium Breeding and Materials / Materials Development / Structural Materials
The figure 5 shows the loops in a thin region and in a close other one, 3 times thicker. The distribution of sizes is equivalent in the two regions; the density is different. This excludes a spurious effect as injection of vacancies from weak oxidation of the surfaces. More precisely, as the surface is similar for the two regions, an injection of defects (vacancies) from the surface would lead to larger clusters in the thin region. CONCLUSIONS The irradiations at 350°C and 550°C have been performed at high flux and short time. In the Eurofer, no secondary defects are present at the lowest temperature. At 550°C, large loops in 100 plans are present showing a flower like shape. A post irradiation annealing at 550°C, induces the condensation into large loops of the defects (individual or as clusters) that have been accumulated during the irradiation. The model alloy shows roughly the same behaviour. The migration of species is faster because, after irradiation at 350°C, loops are present and their growth occurs at a lower temperature, 450°C instead of 550°C for Eurofer. The lack of defects in Eurofer is in agreement with slower species. The perspectives are to determine the nature of loops in all cases and the Burgers vectors after annealing. REFERENCES [1] Metallurgical characterization of as-received
Eurofer97 products - C. A. Danon, S. Urvoy, A. Alamo - CEA report, NT SRMA 01-2418, March 2001.
REPORTS AND PUBLICATION Preparation of Eurofer samples for pulsed irradiations - L. Boulanger and Y. Serruys - CEA report, NT DEN/SAC/DMN/SRMP 2004-01. Monotonous short time irradiation of Eurofer at 350 and 550°C - L. Boulanger and Y. Serruys - CEA report, NT DEN/SAC/DMN/SRMP 2004-012. Annealing of Eurofer irradiated at 350°C - L. Boulanger and Y. Serruys - CEA report, NT DEN/SAC/DMN/SRMP 2004-to be issued.
TASK LEADER Loic BOULANGER DEN/DMN/SRMP CEA-Saclay F-91191 Gif-sur-Yvette Cedex Tél. : 33 1 69 08 64 19 Fax : 33 1 69 08 68 67 E-mail : [email protected]

- 290 - Underlying Technology / Tritium Breeding and Materials / Materials Development / Structural Materials
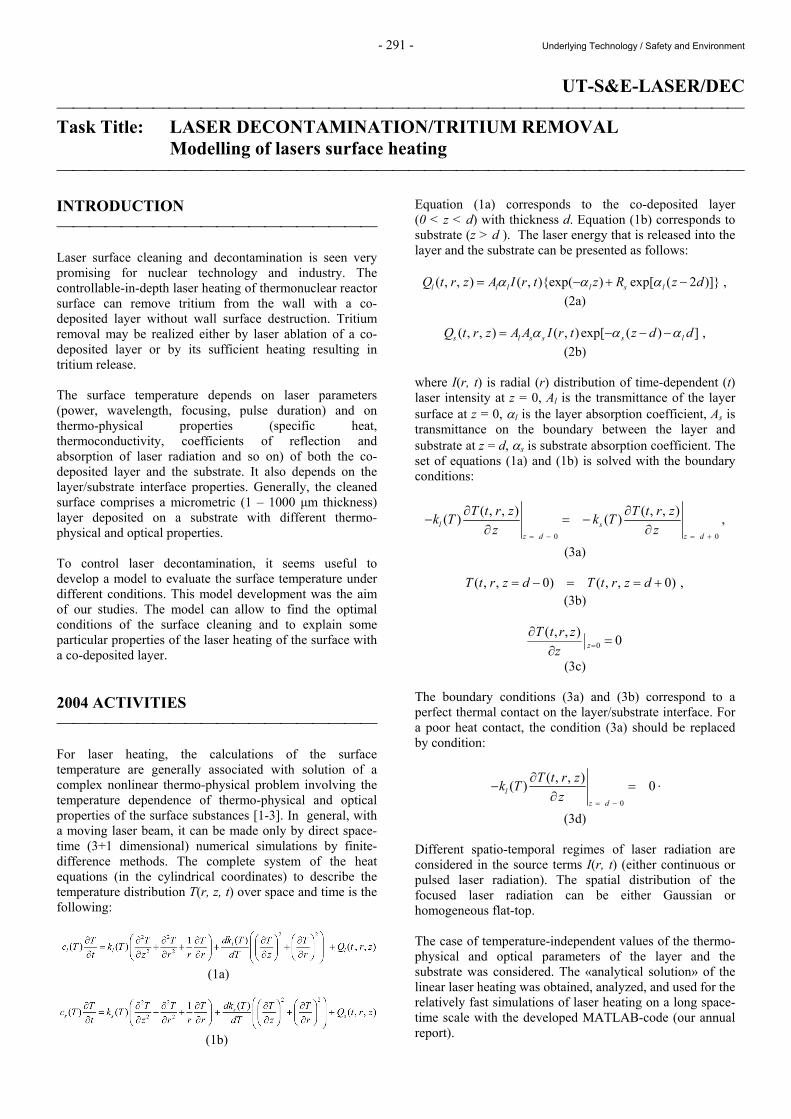
- 291 - Underlying Technology / Safety and Environment
UT-S&E-LASER/DEC Task Title: LASER DECONTAMINATION/TRITIUM REMOVAL Modelling of lasers surface heating INTRODUCTION Laser surface cleaning and decontamination is seen very promising for nuclear technology and industry. The controllable-in-depth laser heating of thermonuclear reactor surface can remove tritium from the wall with a co-deposited layer without wall surface destruction. Tritium removal may be realized either by laser ablation of a co-deposited layer or by its sufficient heating resulting in tritium release. The surface temperature depends on laser parameters (power, wavelength, focusing, pulse duration) and on thermo-physical properties (specific heat, thermoconductivity, coefficients of reflection and absorption of laser radiation and so on) of both the co-deposited layer and the substrate. It also depends on the layer/substrate interface properties. Generally, the cleaned surface comprises a micrometric (1 – 1000 µm thickness) layer deposited on a substrate with different thermo-physical and optical properties. To control laser decontamination, it seems useful to develop a model to evaluate the surface temperature under different conditions. This model development was the aim of our studies. The model can allow to find the optimal conditions of the surface cleaning and to explain some particular properties of the laser heating of the surface with a co-deposited layer. 2004 ACTIVITIES For laser heating, the calculations of the surface temperature are generally associated with solution of a complex nonlinear thermo-physical problem involving the temperature dependence of thermo-physical and optical properties of the surface substances [1-3]. In general, with a moving laser beam, it can be made only by direct space-time (3+1 dimensional) numerical simulations by finite-difference methods. The complete system of the heat equations (in the cylindrical coordinates) to describe the temperature distribution T(r, z, t) over space and time is the following:
(1a)
(1b)
Equation (1a) corresponds to the co-deposited layer (0 < z < d) with thickness d. Equation (1b) corresponds to substrate (z > d ). The laser energy that is released into the layer and the substrate can be presented as follows:
( , , ) ( , )exp( ) exp[ ( 2 )] ,l l l l s lQ t r z A I r t z R z dα α α= − + − (2a)
( , , ) ( , ) exp[ ( ) ] ,s l s s s lQ t r z A A I r t z d dα α α= − − −
(2b) where I(r, t) is radial (r) distribution of time-dependent (t) laser intensity at z = 0, Al is the transmittance of the layer surface at z = 0, αl is the layer absorption coefficient, As is transmittance on the boundary between the layer and substrate at z = d, αs is substrate absorption coefficient. The set of equations (1a) and (1b) is solved with the boundary conditions:
0 0
( , , ) ( , , )( ) ( ) ,l sz d z d
T t r z T t r zk T k Tz z= − = +
∂ ∂− = −
∂ ∂
(3a)
( , , 0) ( , , 0) ,T t r z d T t r z d= − = = + (3b)
0),,(0 =
∂∂
=zzzrtT
(3c) The boundary conditions (3a) and (3b) correspond to a perfect thermal contact on the layer/substrate interface. For a poor heat contact, the condition (3a) should be replaced by condition:
0
( , , )( ) 0lz d
T t r zk Tz
= −
∂− =
∂.
(3d) Different spatio-temporal regimes of laser radiation are considered in the source terms I(r, t) (either continuous or pulsed laser radiation). The spatial distribution of the focused laser radiation can be either Gaussian or homogeneous flat-top. The case of temperature-independent values of the thermo-physical and optical parameters of the layer and the substrate was considered. The «analytical solution» of the linear laser heating was obtained, analyzed, and used for the relatively fast simulations of laser heating on a long space-time scale with the developed MATLAB-code (our annual report).
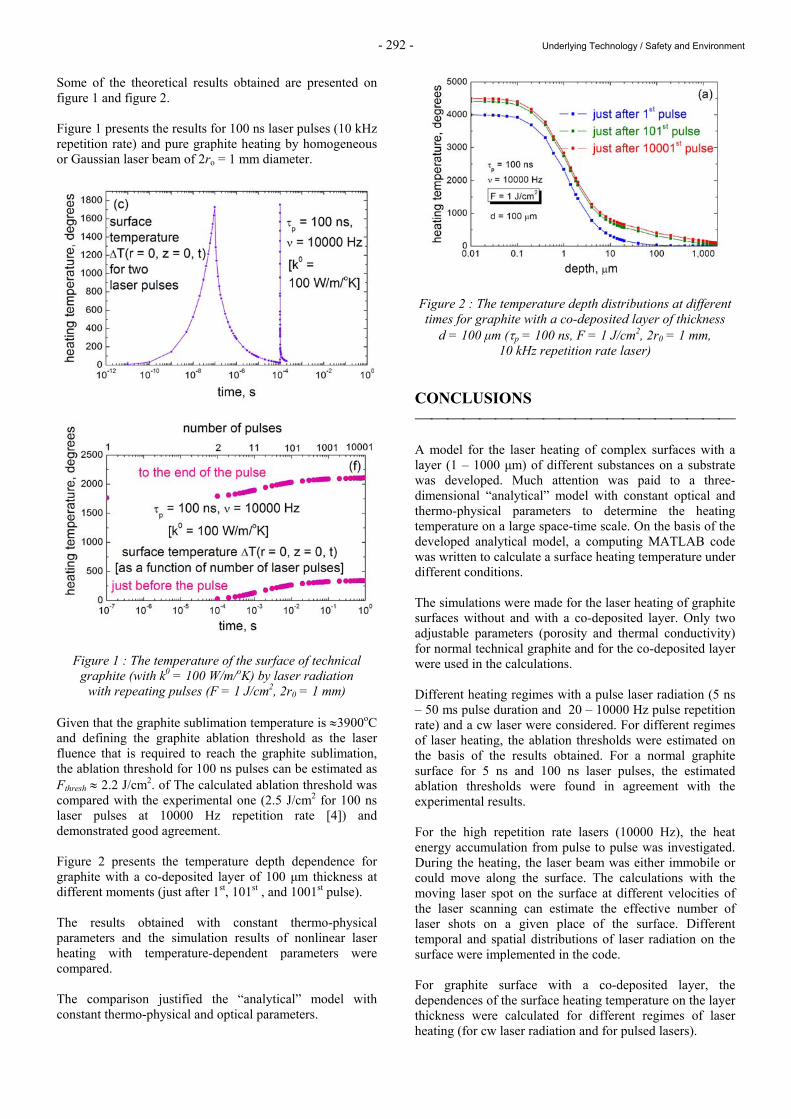
- 292 - Underlying Technology / Safety and Environment
Some of the theoretical results obtained are presented on figure 1 and figure 2. Figure 1 presents the results for 100 ns laser pulses (10 kHz repetition rate) and pure graphite heating by homogeneous or Gaussian laser beam of 2ro = 1 mm diameter.
Figure 1 : The temperature of the surface of technical graphite (with k0 = 100 W/m/oK) by laser radiation
with repeating pulses (F = 1 J/cm2, 2r0 = 1 mm) Given that the graphite sublimation temperature is ≈3900oC and defining the graphite ablation threshold as the laser fluence that is required to reach the graphite sublimation, the ablation threshold for 100 ns pulses can be estimated as Fthresh ≈ 2.2 J/cm2. of The calculated ablation threshold was compared with the experimental one (2.5 J/cm2 for 100 ns laser pulses at 10000 Hz repetition rate [4]) and demonstrated good agreement. Figure 2 presents the temperature depth dependence for graphite with a co-deposited layer of 100 µm thickness at different moments (just after 1st, 101st , and 1001st pulse). The results obtained with constant thermo-physical parameters and the simulation results of nonlinear laser heating with temperature-dependent parameters were compared. The comparison justified the “analytical” model with constant thermo-physical and optical parameters.
Figure 2 : The temperature depth distributions at different times for graphite with a co-deposited layer of thickness
d = 100 µm (τp = 100 ns, F = 1 J/cm2, 2r0 = 1 mm, 10 kHz repetition rate laser)
CONCLUSIONS A model for the laser heating of complex surfaces with a layer (1 – 1000 µm) of different substances on a substrate was developed. Much attention was paid to a three-dimensional “analytical” model with constant optical and thermo-physical parameters to determine the heating temperature on a large space-time scale. On the basis of the developed analytical model, a computing MATLAB code was written to calculate a surface heating temperature under different conditions. The simulations were made for the laser heating of graphite surfaces without and with a co-deposited layer. Only two adjustable parameters (porosity and thermal conductivity) for normal technical graphite and for the co-deposited layer were used in the calculations. Different heating regimes with a pulse laser radiation (5 ns – 50 ms pulse duration and 20 – 10000 Hz pulse repetition rate) and a cw laser were considered. For different regimes of laser heating, the ablation thresholds were estimated on the basis of the results obtained. For a normal graphite surface for 5 ns and 100 ns laser pulses, the estimated ablation thresholds were found in agreement with the experimental results. For the high repetition rate lasers (10000 Hz), the heat energy accumulation from pulse to pulse was investigated. During the heating, the laser beam was either immobile or could move along the surface. The calculations with the moving laser spot on the surface at different velocities of the laser scanning can estimate the effective number of laser shots on a given place of the surface. Different temporal and spatial distributions of laser radiation on the surface were implemented in the code. For graphite surface with a co-deposited layer, the dependences of the surface heating temperature on the layer thickness were calculated for different regimes of laser heating (for cw laser radiation and for pulsed lasers).
- 293 - Underlying Technology / Safety and Environment
Two limiting cases of the heat contact between the friable co-deposited layer and the graphite substrate were considered. For the perfect heat contact between the layer and the substrate, the ablation threshold for the layer thickness > 10 µm can be evaluated as two times lower than for the normal technical graphite surface. With the decrease in a layer thickness, the heating temperature decreases and tends to be the same as for the normal graphite surface. For a poor heat contact between the layer and the substrate, the ablation threshold will be very low. In this case, the heating temperature increases considerably with the decrease in a layer thickness. To validate the calculations based on the mean constant temperature-independent graphite properties, the known temperature dependences of the thermo-physical parameters of graphite are considered in the direct numerical solution of heat equations. The corresponding calculation code was written on Dufort-Frankel algorithm [5]. The test simulations of nonlinear laser heating were compared with the results obtained with constant mean thermo-physical parameters. The results justify the “analytical” model of laser heating with the mean constant thermo-physical and optical parameters. It can be applied for both qualitative and quantitative estimations of the surface temperature during the laser heating of complex surfaces. Thus, the developed code allows to simulate the laser heating of the graphite surface without and with a co-deposited layer. It may also be applied to study the laser heating of any other surface with different properties. The code can be easily generalized by involving the diffusive scattering of the laser light in turbid media, for example. In this case, it would be required to change just some parameters in the laser heating source terms. The developed model will be applied to choose the relevant validation experiments. The experiments are planned to be made with the Pyrometer method that is under development in our Laboratory (CEA Saclay, DEN/DPC/SCP/LILM). REFERENCES [1] H. S. Carslaw and J. C. Jaeger - Conduction of Heat in
Solids - 2nd edition (Oxford, Oxford University Press, 1959).
[2] S. V. Fomichev and A. Semerok - Etude des Processus
Thermiques Survenant Lors de la Microanalyse des Surfaces par la Méthode Raman - Report CEA, DPC/SCPA/NT02-053, 2002, 27 pages.
[3] A. Semerok and J.-M. Weulersse - Bibliography Study
on Theoretical Models of Laser Detritiation Processes - Report CEA, NT DPC/SCP 03-069-A, 2003, 28 pages.
[4] A. Semerok, J.M. Weulersse, F. Brygo, D. Farcage, C. Hubert, C. Lascoutouna, M. Géléoc, P. Wodling, H. Long, F. Champonnois, G. Brunel, G. Vimond, E. Lizon, V.Dauvois, V. Delanne, C. Grisolia, S. Fomichev, M. Hashida - Studies on TOKAMAK wall surfaces decontamination by pulsed repetition rate lasers - CEA report NT DPC/SCP/05-111-A - january 2005, 50 pages.
[5] D. Potter - Computational Physics (Wiley, NY, 1973). REPORTS AND PUBLICATIONS S. Fomichev, A. Semerok, J.M. Weulersse, F. Brygo - Report CEA, NT DPC/SCP 11-069-A, 2004, 77 pages. TASK LEADER Alexandre SEMEROK DEN/DPC/SCP/LILM CEA-Saclay F-91191 Gif-sur-Yvette Cedex Tél. : 33 1 69 08 65 57 Fax : 33 1 69 08 78 84 E-mail : [email protected]

- 294 - Underlying Technology / Safety and Environment
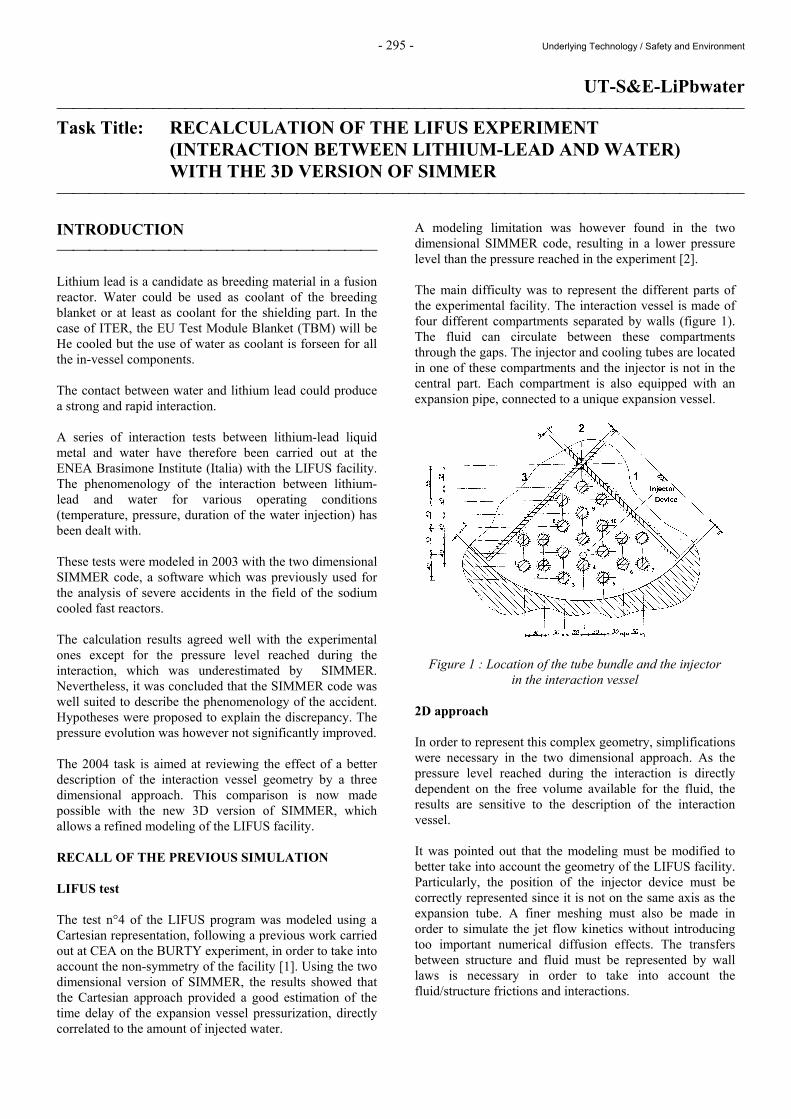
- 295 - Underlying Technology / Safety and Environment
UT-S&E-LiPbwater Task Title: RECALCULATION OF THE LIFUS EXPERIMENT
(INTERACTION BETWEEN LITHIUM-LEAD AND WATER) WITH THE 3D VERSION OF SIMMER
INTRODUCTION Lithium lead is a candidate as breeding material in a fusion reactor. Water could be used as coolant of the breeding blanket or at least as coolant for the shielding part. In the case of ITER, the EU Test Module Blanket (TBM) will be He cooled but the use of water as coolant is forseen for all the in-vessel components. The contact between water and lithium lead could produce a strong and rapid interaction. A series of interaction tests between lithium-lead liquid metal and water have therefore been carried out at the ENEA Brasimone Institute (Italia) with the LIFUS facility. The phenomenology of the interaction between lithium-lead and water for various operating conditions (temperature, pressure, duration of the water injection) has been dealt with. These tests were modeled in 2003 with the two dimensional SIMMER code, a software which was previously used for the analysis of severe accidents in the field of the sodium cooled fast reactors. The calculation results agreed well with the experimental ones except for the pressure level reached during the interaction, which was underestimated by SIMMER. Nevertheless, it was concluded that the SIMMER code was well suited to describe the phenomenology of the accident. Hypotheses were proposed to explain the discrepancy. The pressure evolution was however not significantly improved. The 2004 task is aimed at reviewing the effect of a better description of the interaction vessel geometry by a three dimensional approach. This comparison is now made possible with the new 3D version of SIMMER, which allows a refined modeling of the LIFUS facility. RECALL OF THE PREVIOUS SIMULATION LIFUS test The test n°4 of the LIFUS program was modeled using a Cartesian representation, following a previous work carried out at CEA on the BURTY experiment, in order to take into account the non-symmetry of the facility [1]. Using the two dimensional version of SIMMER, the results showed that the Cartesian approach provided a good estimation of the time delay of the expansion vessel pressurization, directly correlated to the amount of injected water.
A modeling limitation was however found in the two dimensional SIMMER code, resulting in a lower pressure level than the pressure reached in the experiment [2]. The main difficulty was to represent the different parts of the experimental facility. The interaction vessel is made of four different compartments separated by walls (figure 1). The fluid can circulate between these compartments through the gaps. The injector and cooling tubes are located in one of these compartments and the injector is not in the central part. Each compartment is also equipped with an expansion pipe, connected to a unique expansion vessel.
Figure 1 : Location of the tube bundle and the injector in the interaction vessel
2D approach In order to represent this complex geometry, simplifications were necessary in the two dimensional approach. As the pressure level reached during the interaction is directly dependent on the free volume available for the fluid, the results are sensitive to the description of the interaction vessel. It was pointed out that the modeling must be modified to better take into account the geometry of the LIFUS facility. Particularly, the position of the injector device must be correctly represented since it is not on the same axis as the expansion tube. A finer meshing must also be made in order to simulate the jet flow kinetics without introducing too important numerical diffusion effects. The transfers between structure and fluid must be represented by wall laws is necessary in order to take into account the fluid/structure frictions and interactions.
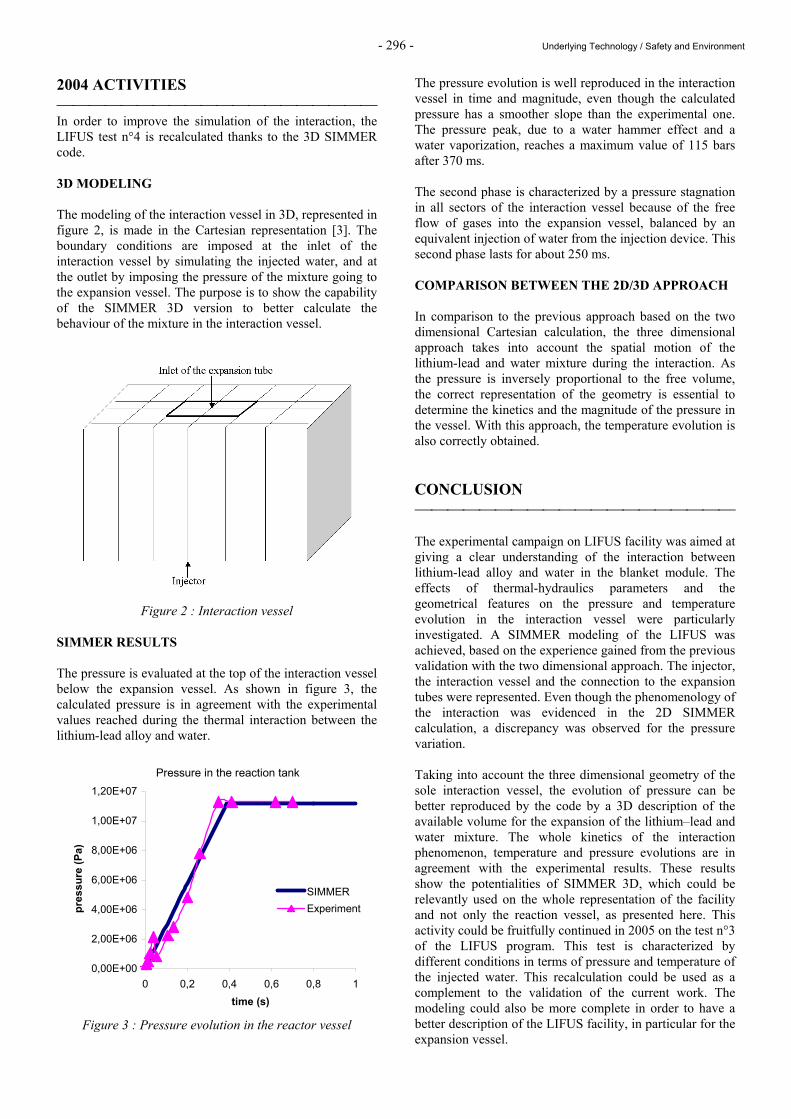
- 296 - Underlying Technology / Safety and Environment
2004 ACTIVITIES In order to improve the simulation of the interaction, the LIFUS test n°4 is recalculated thanks to the 3D SIMMER code. 3D MODELING The modeling of the interaction vessel in 3D, represented in figure 2, is made in the Cartesian representation [3]. The boundary conditions are imposed at the inlet of the interaction vessel by simulating the injected water, and at the outlet by imposing the pressure of the mixture going to the expansion vessel. The purpose is to show the capability of the SIMMER 3D version to better calculate the behaviour of the mixture in the interaction vessel.
Figure 2 : Interaction vessel SIMMER RESULTS The pressure is evaluated at the top of the interaction vessel below the expansion vessel. As shown in figure 3, the calculated pressure is in agreement with the experimental values reached during the thermal interaction between the lithium-lead alloy and water.
Pressure in the reaction tank
0,00E+00
2,00E+06
4,00E+06
6,00E+06
8,00E+06
1,00E+07
1,20E+07
0 0,2 0,4 0,6 0,8 1time (s)
pres
sure
(Pa)
SIMMERExperiment
Figure 3 : Pressure evolution in the reactor vessel
The pressure evolution is well reproduced in the interaction vessel in time and magnitude, even though the calculated pressure has a smoother slope than the experimental one. The pressure peak, due to a water hammer effect and a water vaporization, reaches a maximum value of 115 bars after 370 ms. The second phase is characterized by a pressure stagnation in all sectors of the interaction vessel because of the free flow of gases into the expansion vessel, balanced by an equivalent injection of water from the injection device. This second phase lasts for about 250 ms. COMPARISON BETWEEN THE 2D/3D APPROACH In comparison to the previous approach based on the two dimensional Cartesian calculation, the three dimensional approach takes into account the spatial motion of the lithium-lead and water mixture during the interaction. As the pressure is inversely proportional to the free volume, the correct representation of the geometry is essential to determine the kinetics and the magnitude of the pressure in the vessel. With this approach, the temperature evolution is also correctly obtained. CONCLUSION The experimental campaign on LIFUS facility was aimed at giving a clear understanding of the interaction between lithium-lead alloy and water in the blanket module. The effects of thermal-hydraulics parameters and the geometrical features on the pressure and temperature evolution in the interaction vessel were particularly investigated. A SIMMER modeling of the LIFUS was achieved, based on the experience gained from the previous validation with the two dimensional approach. The injector, the interaction vessel and the connection to the expansion tubes were represented. Even though the phenomenology of the interaction was evidenced in the 2D SIMMER calculation, a discrepancy was observed for the pressure variation. Taking into account the three dimensional geometry of the sole interaction vessel, the evolution of pressure can be better reproduced by the code by a 3D description of the available volume for the expansion of the lithium–lead and water mixture. The whole kinetics of the interaction phenomenon, temperature and pressure evolutions are in agreement with the experimental results. These results show the potentialities of SIMMER 3D, which could be relevantly used on the whole representation of the facility and not only the reaction vessel, as presented here. This activity could be fruitfully continued in 2005 on the test n°3 of the LIFUS program. This test is characterized by different conditions in terms of pressure and temperature of the injected water. This recalculation could be used as a complement to the validation of the current work. The modeling could also be more complete in order to have a better description of the LIFUS facility, in particular for the expansion vessel.
- 297 - Underlying Technology / Safety and Environment
REPORTS AND PUBLICATIONS [1] Phase 2 code assessment of SIMMER-III, a computer
program for LMFR core disruptive accident analysis - Japan Nuclear Cycle Development Institute - O-Arai Engineering Center - JNC TN9400 2000-105 september 2000.
[2] Modeling of the interaction between lithium-lead and
water using the SIMMER-III code - january 2004 - CEA report by Thierry Cadiou - NT DER/SESI/LCSI 03/403.
[3] Recalculation of the LIFUS experiment (interaction
between lithium-lead and water) with the 3D version of SIMMER - february 2005 - CEA report by Thierry CADIOU - CEA/DEN/CAD/DER/SESI/LCSI/NT DO1 14/01/05.
TASK LEADER Thierry CADIOU DEN/DER/SESI/LCSI CEA-Cadarache F-13108 Saint-Paul-Lez-Durance Cedex Tél. : 33 1 42 25 66 17 Fax : 33 1 42 25 71 87 E-mail : [email protected]

- 298 - Underlying Technology / Safety and Environment
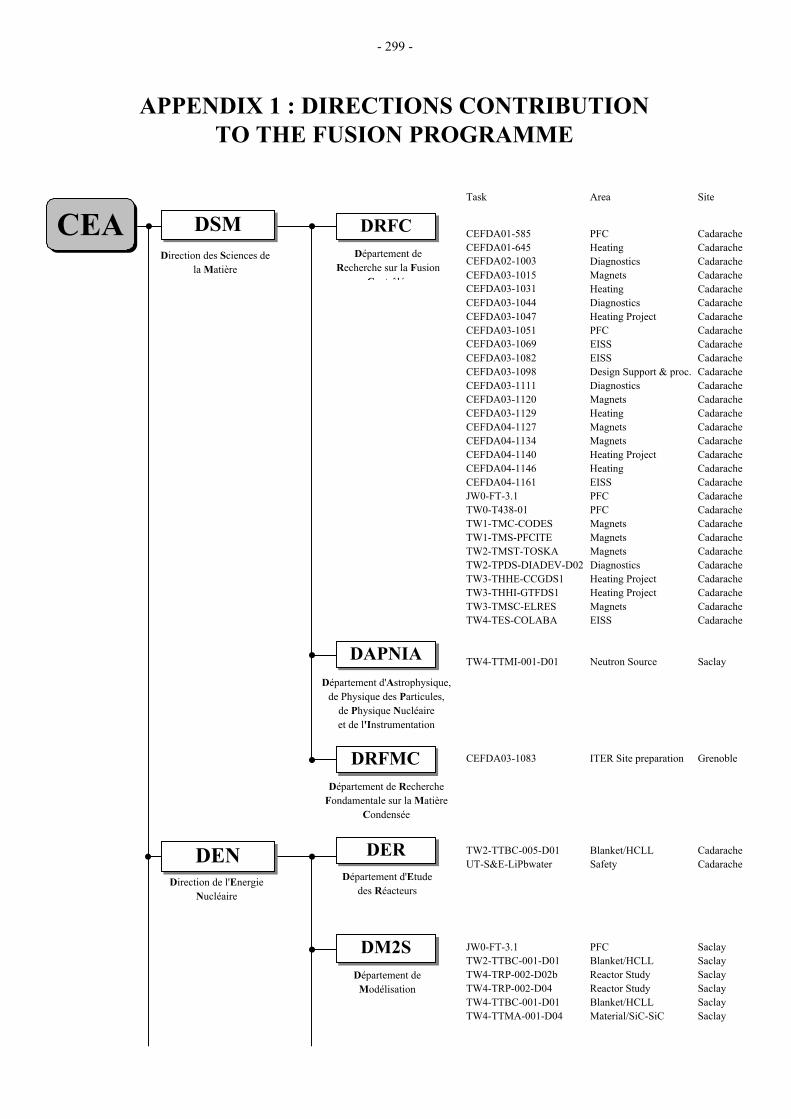
- 299 -
Task Area Site
CEFDA01-585 PFC CadaracheCEFDA01-645 Heating CadaracheCEFDA02-1003 Diagnostics CadaracheCEFDA03-1015 Magnets CadaracheCEFDA03-1031 Heating CadaracheCEFDA03-1044 Diagnostics CadaracheCEFDA03-1047 Heating Project CadaracheCEFDA03-1051 PFC CadaracheCEFDA03-1069 EISS CadaracheCEFDA03-1082 EISS CadaracheCEFDA03-1098 Design Support & proc. CadaracheCEFDA03-1111 Diagnostics CadaracheCEFDA03-1120 Magnets CadaracheCEFDA03-1129 Heating CadaracheCEFDA04-1127 Magnets CadaracheCEFDA04-1134 Magnets CadaracheCEFDA04-1140 Heating Project CadaracheCEFDA04-1146 Heating CadaracheCEFDA04-1161 EISS CadaracheJW0-FT-3.1 PFC CadaracheTW0-T438-01 PFC CadaracheTW1-TMC-CODES Magnets CadaracheTW1-TMS-PFCITE Magnets CadaracheTW2-TMST-TOSKA Magnets CadaracheTW2-TPDS-DIADEV-D02 Diagnostics CadaracheTW3-THHE-CCGDS1 Heating Project CadaracheTW3-THHI-GTFDS1 Heating Project CadaracheTW3-TMSC-ELRES Magnets CadaracheTW4-TES-COLABA EISS Cadarache
TW4-TTMI-001-D01 Neutron Source Saclay
CEFDA03-1083 ITER Site preparation Grenoble
TW2-TTBC-005-D01 Blanket/HCLL CadaracheUT-S&E-LiPbwater Safety Cadarache
JW0-FT-3.1 PFC SaclayTW2-TTBC-001-D01 Blanket/HCLL SaclayTW4-TRP-002-D02b Reactor Study SaclayTW4-TRP-002-D04 Reactor Study SaclayTW4-TTBC-001-D01 Blanket/HCLL SaclayTW4-TTMA-001-D04 Material/SiC-SiC Saclay
CEADirection des Sciences de
la MatièreDépartement de
Recherche sur la Fusion C t ôlé
Direction de l'Energie Nucléaire
Département de Modélisation
Département d'Etude des Réacteurs
APPENDIX 1 : DIRECTIONS CONTRIBUTIONTO THE FUSION PROGRAMME
DRFCDSM
Département d'Astrophysique,de Physique des Particules,
de Physique Nucléaireet de l'Instrumentation
DAPNIA
DEN
DM2S
DER
DRFMCDépartement de Recherche
Fondamentale sur la Matière Condensée
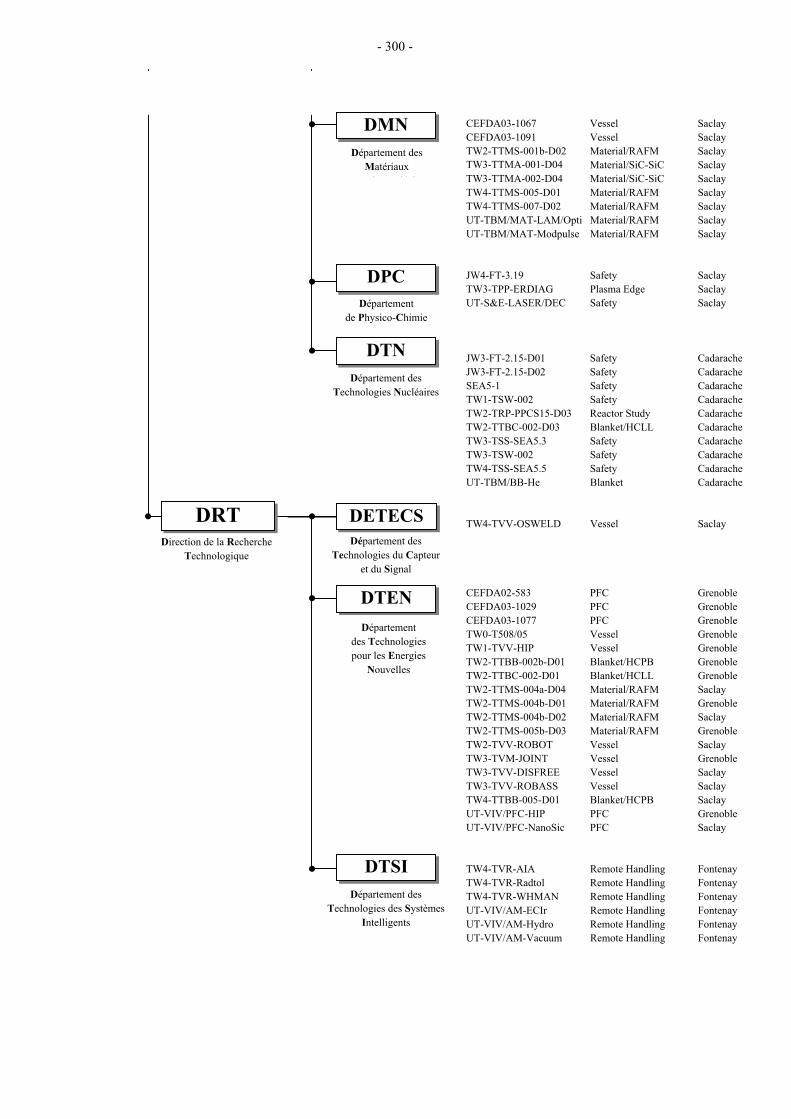
- 300 -
CEFDA03-1067 Vessel SaclayCEFDA03-1091 Vessel SaclayTW2-TTMS-001b-D02 Material/RAFM SaclayTW3-TTMA-001-D04 Material/SiC-SiC SaclayTW3-TTMA-002-D04 Material/SiC-SiC SaclayTW4-TTMS-005-D01 Material/RAFM SaclayTW4-TTMS-007-D02 Material/RAFM SaclayUT-TBM/MAT-LAM/Opti Material/RAFM SaclayUT-TBM/MAT-Modpulse Material/RAFM Saclay
JW4-FT-3.19 Safety SaclayTW3-TPP-ERDIAG Plasma Edge SaclayUT-S&E-LASER/DEC Safety Saclay
JW3-FT-2.15-D01 Safety CadaracheJW3-FT-2.15-D02 Safety CadaracheSEA5-1 Safety CadaracheTW1-TSW-002 Safety CadaracheTW2-TRP-PPCS15-D03 Reactor Study CadaracheTW2-TTBC-002-D03 Blanket/HCLL CadaracheTW3-TSS-SEA5.3 Safety CadaracheTW3-TSW-002 Safety CadaracheTW4-TSS-SEA5.5 Safety CadaracheUT-TBM/BB-He Blanket Cadarache
TW4-TVV-OSWELD Vessel Saclay
CEFDA02-583 PFC GrenobleCEFDA03-1029 PFC GrenobleCEFDA03-1077 PFC GrenobleTW0-T508/05 Vessel GrenobleTW1-TVV-HIP Vessel GrenobleTW2-TTBB-002b-D01 Blanket/HCPB GrenobleTW2-TTBC-002-D01 Blanket/HCLL GrenobleTW2-TTMS-004a-D04 Material/RAFM SaclayTW2-TTMS-004b-D01 Material/RAFM GrenobleTW2-TTMS-004b-D02 Material/RAFM SaclayTW2-TTMS-005b-D03 Material/RAFM GrenobleTW2-TVV-ROBOT Vessel SaclayTW3-TVM-JOINT Vessel GrenobleTW3-TVV-DISFREE Vessel SaclayTW3-TVV-ROBASS Vessel SaclayTW4-TTBB-005-D01 Blanket/HCPB SaclayUT-VIV/PFC-HIP PFC GrenobleUT-VIV/PFC-NanoSic PFC Saclay
TW4-TVR-AIA Remote Handling FontenayTW4-TVR-Radtol Remote Handling FontenayTW4-TVR-WHMAN Remote Handling FontenayUT-VIV/AM-ECIr Remote Handling FontenayUT-VIV/AM-Hydro Remote Handling FontenayUT-VIV/AM-Vacuum Remote Handling Fontenay
Direction de la Recherche Technologique
Départementdes Technologiespour les Energies
Nouvelles
DTA
Département des Matériaux
l N lé i
Départementde Physico-Chimie
DMN
DPC
DRT DETECSDépartement des
Technologies du Capteuret du Signal
DTEN
DTSIDépartement des
Technologies des Systèmes Intelligents
Département des Technologies Nucléaires
DTN

- 301 -
UT-VIV/PFC-Damage PFC PessacUT-VIV/PFC-Pyro PFC Font Romeu
TW2-TTBC-005-D01 Blanket/HCLL Aix en Pce
EXTERNAL COLLABORATIONS
CNRS (French National Centre for Scientific Research)
Technicatome(Collaboration with CEA)

- 302 -
- 303 -
Unit Site Investigator
Physics Integration
Plasma Edge
TW3-TPP-ERDIAG Evaluation of Laser Ablation Optical Emission Spectroscopy (LA-OES) Method for graphite co-deposited layer characterization
DPC Saclay Semerok A.
Heating and Current Drive
CEFDA01-645 TW2-TPHN-NBDES1 : Support to neutral beam physics and testing 1 DRFC Cadarache Svensson L.
CEFDA03-1129 TW3-TPHI-ICRDES1 : ITER ICRF Antenna and Matching System DRFC Cadarache Bosia G.
Diagnostics
CEFDA02-1003CEFDA03-1111
TW2-TPDS-DIASUP4 and TW3-TPDS-DIASUP1 : Support to the ITER diagnostic design
DRFC Cadarache Stott P.
TW2-TPDS-DIADEV-D02 Development of diagnostic components : First mirrors study DRFC Cadarache Lipa M.
Vessel-In Vessel
Vessel-Blanket and Materials
CEFDA03-1067 TW3-TVM-MDB : Rules for design, fabrication and inspectionEstablisment and maintenance of a material data for licensing TBM's design rules
DMN Saclay Tavassoli F.
CEFDA03-1091 TW2-TVM-LIP : Rules for design, fabrication and inspectionModification of ITER material documents and assessment of materials data for licensing
DMN Saclay Tavassoli F.
TW0-T508/05 Development of Be/CuCrCz brazing techniques DTEN Grenoble Bucci P.
TW1-TVV-HIP Improvements of HIP Fabrication Techniques DTEN Grenoble Bucci P.
TW2-TVV-ROBOT Dynamic test rig for Intersector Welding Robot (IWR) for VV sector field joining
DTEN Saclay Aubert P.
TW3-TVM-JOINT Characterization of the CuCrZr/SS junction strength for different blanket manufacturing conditions
DTEN Grenoble Gillia O.
TW3-TVV-DISFREE Further development of the hybrid MIG/Laser welding technique for VV sector field joining
DTEN Saclay De Dinechin G.
TW3-TVV-ROBASS Long Detection Range Seam Tracker DTEN Saclay Aubert P.
TW4-TVV-OSWELD Qualification of multiple phased array UT for one sided welds during VV manufacture
DETECS Saclay Bredif Ph.
Plasma Facing Components
CEFDA01-585 TW1-TVP-TESTAN : Monitoring and analysis of the thermal fatigue testing of divertor prototypes - 200 kW electron beam gun test
DRFC Cadarache Escourbiac F.
CEFDA02-583 TW1-TVV-DES : Destructive examination of primary first wall panels and mock-ups
DTEN Grenoble Bucci P.
EFDA TECHNOLOGY PROGRAMME
APPENDIX 2 : ALLOCATIONS OF TASKS
- 304 -
CEFDA03-1029 TW3-TVB-JOINOP : Optimization of Be/Cu alloy joints for primary first wall panels
DTEN Grenoble Bucci P.
CEFDA03-1051 TW4-TVD-ACCEPT : Study on acceptance criteria for the ITER divertor vertical target
DRFC Cadarache Schlosser J.
CEFDA03-1077 TW3-TVB-INMOCK : fabrication of primary first wall mock-ups for in-pile experiments
DTEN Grenoble Bucci P.
TW0-T438-01 Development and testing of time resolved erosion detecting techniques DRFC Cadarache Gauthier E.
Remote Handling
TW4-TVR-AIA Articulated inspection arm (AIA) DTSI Fontenay Friconneau J.P.
TW4-TVR-Radtol Radiation tolerance assessment of standard electronic components for Remote Handling
DTSI Fontenay Giraud A.
TW4-TVR-WHMAN Development of a water hydraulic manipulator DTSI Fontenay Friconneau J.P.
Magnet Structure & Integration
Magnet Structure
CEFDA03-1015 TW2-TMSM-COOLIN : Mock-ups for the TF and CS Terminal regions and Cooling Inlets
DRFC Cadarache Decool P.
CEFDA03-1120 TW3-TMSC-ASTEST : Tests of advanced Nb3Sn strands - Extensive characterization of industrial advanced Nb3Sn strands developed for ITER TF Coils system
DRFC Cadarache Zani L.
CEFDA04-1127 TW4-TMSC-SAMAN1 : manufacture of sub-size samples DRFC Cadarache Duchateau JL.
CEFDA04-1134 TW4-TMSC-BARBEN : Bending strain effects of single strands - Study of bending strain effect on critical properties of Nb3Sn strands jacketed with stainless steel for various bending amplitudes and temperatures
DRFC Cadarache Zani L.
TW1-TMC-CODES Design and Interpretation Codes DRFC Cadarache Decool P.
TW1-TMS-PFCITE Poloidal Field Conductor Insert (PFCI) DRFC Cadarache Ciazynski D.
TW2-TMST-TOSKA TFMC testing with the LCT coil DRFC Cadarache Duchateau J.L.
TW3-TMSC-ELRES Experimental assessment of the effect of electrical resistances on the V-I characteristics of superconductive cables
DRFC Cadarache Ciazynski D.
Tritium Breeding and Materials
Breeding Blanket
Helium Cooled Pebble Bed (HCPB) Blanket
TW2-TTBB-002b-D01 Blanket manufacturing techniques - First wall HIPping with open channels DTEN Grenoble Rigal E.
TW4-TTBB-005-D01 HCPB breeder and neutron multiplier materialsProcurement and quality control of Li2TiO3 pebbles
DTEN Saclay Lulewicz J.D.
Helium Cooled Lithium Lead (HCLL) Blanket
TW2-TTBC-001-D01 Helium Cooled Lithium Lead - TBM design, integration and analysis - Blanket system design and analysis - Integration and testing in ITER
DM2S Saclay Li Puma A.
TW2-TTBC-002-D01 Blanket manufacturing techniques - Fabrication processes for HCLL and HCPB TBMs
DTEN Grenoble Rigal E.
TW2-TTBC-002-D03 Testing of small-scale mocks-ups to qualify manufacturing technologies DTN Cadarache Cachon L.
- 305 -
TW2-TTBC-005-D01 Helium Cooled Lithium Lead - Safety and Licensing - Test Blanket Module (TBM) accidental safety study
DER + TA Cadarache + Aix en Pce
Schmidt N.,La Lumia V.
TW4-TTBC-001-D01 TBM design, integration and analysis - Testing programme and engineering design of the first HCLL TBM for ITER H-H phase
DM2S Saclay Farabolini W.
Structural Materials Development
Reduced Activation Ferritic Martensitic (RAFM) Steels
TW2-TTMS-001b-D02 Irradiation performance - Neutron irradiation to 70 dpa at 325°C and PIE DMN Saclay Alamo A.
TW2-TTMS-004a-D04 Eurofer : Fusion welds development - Evaluation of a welding process adapted to the Test Blanket Module’s geometry : Assembly of the horizontal cooling plates with the continuous wave YAG laser welding process
DTEN Saclay Forest L.
TW2-TTMS-004b-D01 Tubing process qualification - Advanced process development and testing for the production of TBM's cooling channels
DTEN Grenoble Rigal E.
TW2-TTMS-004b-D02 Qualification of fabrication processes - Processing of high quality welds according to TBM design
DTEN Saclay Asserin O.
TW2-TTMS-005b-D03 Rules for design, Fabrication, Inspection - Fracture mechanics assessments of TBM's
DTEN Grenoble Couturier R.
TW4-TTMS-005-D01 Rules for design, fabrication and inspectionUpdate Data Base and Appendix A of DEMO-SDC
DMN Saclay Tavassoli F.
TW4-TTMS-007-D02 Modelisation of irradiation effect - Ab initio defect energy calculations in the Fe-He system
DMN Saclay Willaime F.
Advanced Materials
TW3-TTMA-001-D04TW3-TTMA-002-D04
SiC/SiC ceramic composites - Divertor and plasma facing materials DMN Saclay Alamo A.
TW4-TTMA-001-D04 Modelling of the mechanical behaviour of advanced 3D SiCf/SiC composite
DM2S Saclay Guérin C.
Neutron Source
TW4-TTMI-001-D01 IFMIF accelerator facilities : accelerator system design DAPNIA Saclay Ferdinand R.
Safety and Environment
SEA5-1 Validation of computer codes and models DTN Cadarache Schindler P.
TW1-TSW-002 Waste and decommissioning strategy DTN Cadarache Gastaldi O.
TW3-TSS-SEA5.3 Ice formation on cryogenics surfaces DTN Cadarache Ayrault L.
TW3-TSW-002 Assessment of radioactive waste in ITER hot cell facility DTN Cadarache Gastaldi O.
TW4-TSS-SEA5.5-D02&D05
Validation of the PAXITR and PACITR code against fusion-specific experiments (ICE, EVITA, CORELE, CIRENE)
DTN Cadarache Girard M.
TW4-TSS-SEA5.5-D11 Validation of the PACTITER code against fusion-specific experiments - Development of the PACTITER code
DTN Cadarache Dacquait F.
System studies
Power Plant Conceptual Studies (PPCS)
TW2-TRP-PPCS15-D03 Waste management strategy on model A and B DTN Cadarache Lacressonnière C.
TW4-TRP-002-D02b Conceptual design of a HCLL reactor - Tritium control and management analysis, thermo-hydraulic and thermo-mechanical analyses
DM2S Saclay Farabolini W.
- 306 -
TW4-TRP-002-D04 Conceptual design of a HCLL reactor - Design integration DM2S Saclay Li Puma A.
ITER Site Preparation
European ITER Site Studies
CEFDA03-1069CEFDA03-1082CEFDA04-1161TW4-TES-COLABA
TW3-TES-EISSg1 : EISS 3 : generic tasks CEATW3-TES-EISS2c : EISS 3, stage 2TW4-TES-EISS4F : European ITER site study 4 - CadaracheCadarache site for ITER, collaboration with local authorities
DRFC Cadarache Garin P.
Site and Plant Layout
CEFDA03-1083 TW3-TEP-CRYO2 : Design of ITER cryoplant/cryodistribution system (auxilliary cold boxes, cryoline…)
DRFMC Grenoble Millet F.
Design Support and Procurement
CEFDA03-1098 TW3-TDS-MAG : Detailed engineering and manufacturing studies of the ITER magnet system : Poloidal Field (PF) coil windings and cold test assessment
DRFC Cadarache Libeyre P.
JET
Physics Integration
Heating Systems
CEFDA03-1031CEFDA04-1146
JW3-EP-ICRH and JW4-EP-ICRH : contribution to ICRH components antenna limiter
DRFC Cadarache Chapuis P.
Diagnostics
CEFDA03-1044 JW3-EP-IRV : Diagnostics enhancement - Wide angle IR Endoscope DRFC Cadarache Gauthier E.
Vessel/In-Vessel
Plasma Facing Components
JW0-FT-3.1 Internal PFC components behaviour and modeling DRFC + Cadarache + Gauthier E.,
Safety and Environment
JW3-FT-2.15-D01 Detritiation of soft housekeeping materials (mainly plastics) DTN Cadarache Trabuc P.
JW3-FT-2.15-D02 Detritiation of vacuum oil and organic liquids DTN Cadarache Trabuc P. & Poletiko C.
JW4-FT-3.19 Laser decontamination/Tritium removal - Studies on tokamak wall surfaces decontamination by pulsed repetition rate lasers
DPC Saclay Semerok A.
Heating Systems Technology Project
CEFDA03-1047 TW3-THHN-IITF1 : The first ITER NB Injector and the ITER NB Test Facility : design
DRFC Cadarache Hemsworth R.
CEFDA04-1140 TW4-THHN-ADSD2 : Neutral beam development for EFDA Extension DRFC Cadarache Boilson
TW3-THHE-CCGDS1 Coaxial cavity gyrotron and test facility - Design, support to the industrial development and preparation of the technical specifications
DRFC Cadarache Magne R.
TW3-THHI-GTFDS1 Fusion diacrode, ICRF generator, IC power supply and IC test facility : design, support to industrial development and preparation of the technical specifications
DRFC Cadarache Mollard P.
- 307 -
Vessel/In-Vessel
Plasma Facing Components
UT-VIV/PFC-Damage Study of damage mechanisms in Plasma Facing Components CNRS-LCTS
Pessac Martin E.
UT-VIV/PFC-HIP Improvement of the reliability, performance and industrial relevancy of HIP processes for PFC components
DTEN Grenoble Chabrol C.
UT-VIV/PFC-NanoSic Nano crystalline silicon carbide (SiC) - Optimization of the preparation of Nano-SiC
DTEN Saclay Ténégal F.
UT-VIV/PFC-Pyro Application of a tricolour pyroreflectometer to plasma facing components in-situ infrared monitoring
CNRS-IMP Font Romeu Hernandez D.
Remote Handling
UT-VIV/AM-ECIr Remote Handling techniques - Radiation effects on electronic components DTSI Fontenay Giraud A.
UT-VIV/AM-Hydro Technologies and control for remote handling systems DTSI Fontenay Friconneau J.P.
UT-VIV/AM-Vacuum Technologies for vacuum, temperature and magnetic field conditions for remote handling systems
DTSI Fontenay Friconneau J.P.
Tritium Breeding and Materials
Breeding Blanket
UT-TBM/BB-He Helium components technology - problems and outline of solutions DTN Cadarache Berton J.L.
Materials Development
Structural Materials
UT-TBM/MAT-LAM/Opti Development of new RAFM steels with regard to creep properties DMN Saclay De Carlan Y.
UT-TBM/MAT-Modpulse Pulsed irradiation of the martensitic alloy Eurofer - Irradiations by krypton ions at 350 and 550°C at high flux during short time
DMN Saclay Boulanger L.
Safety and Environment
UT-S&E-LASER/DEC Laser decontamination : Tritium removal DPC Saclay Semerok A.
UT-S&E-LiPbwater Recalculation of the LIFUS experiment (interaction between lithium-lead and water) with the 3D version of SIMMER
DER Cadarache Cadiou T.
UNDERLYING TECHNOLOGY PROGRAMME

- 308 -
- 309 -
EFDA TECHNOLOGY PROGRAMME
Physics IntegrationHeating and Current Drive
CEFDA01-645 Experimental results with the new ITER-like 1 MV SINGAP accelerator10th International Symposium on the Production and Neutralization of Negative Ions and Beams, Kiev, 13-17 September 2004
L. Svensson, D. Boilson, H.P.L. de Esch, R.S. Hemsworth and P. Massmann
CEFDA03-1129 Proposals for upgrades to the ITER Reference designCEA CNN/NTT (2004)
G. Bosia
DiagnosticsTW2-TPDS-DIADEV-D02 First mirror study in Tore Supra
TW2-TPDS-DIADEV-D02 Final report, January 2005M. Lipa, B. Schunke, Ch. Gil et al.
Vessel/In-VesselVessel-Blanket and Materials
CEFDA03-1067CEFDA03-1091
EU contributions to the ITER Materials Properties Data AssessmentSOFT, Venice, 20-24 September 2004
A.T. Peacock, V. Barabash,F. Gillemot, P. Karditsas,G. Lloyd, J.W. Rensman,A.A. F. Tavassoli andM. Walters
CEFDA03-1067CEFDA03-1091
EU Materials properties Database / Data analysis meetingEFDA Garching, 24-25 June 2004
TW0-T508/05 Development of Be/CuCrZr/SS brazing techniquesRapport technique DTEN/DL/2004/089
Ph. Bucci, J.M. Leibold, F. Vidotto
TW1-TVV-HIP Improvement of HIP Fabrication TechniqueRapport technique DTEN/DR/2004/094
P. Bucci, J.M. Leibold, F. Vidotto
TW3-TVV-DISFREE Assessment of the hybrid process to weld the ITER vacuum vessel DTEN/DL/2005/008
G. de Dinechin, F. Janin,S. Moran
TW3-TVV-ROBASS Long range tracking systemTechnical report CEA/DTEN/DL/2005/005, 20 january 2005
D. Sabourin
TW4-TVV-OSWELD Development of phased array techniques for the inspectionof one sided welds in ITER vacuum vesselSYSSC/04-RT0143/Rev. 0, September 2004
Plasma Facing ComponentsCEFDA01-585 A mature industrial solution for ITER divertor plasma facing
components: hypervapotron cooling concept adapted to Tore Supra flat tile technologyProc. 23rd SOFT-23, 20-24 Sept., Venice, Italy
F. Escourbiac, I. Bobin-Vastra,V. Kuznetsov, M. Missirlian,B. Schedler, J. Schlosser
CEFDA01-585 Contract EFDA 01/585 - Final reportCFP/NTT-2005.008, March 2005
F. Escourbiac
CEFDA01-585 Results and analysis of high heat flux tests on a full scale vertical target prototype of ITER divertorProc. SOFT-23, 20-24 Sept., Venice, Italy
M. Missirlian, F. Escourbiac,M. Merola, I. Bobin-Vastra,J. Schlosser, A. Durocher
CEFDA03-1051 Study of acceptance criteria for the ITER divertor: summary report of the progress meeting on the 7th December 2004, CadaracheCFP/CRR-2004.014
M. Merola, S. Fouquet
CEFDA03-1051 Study on acceptance criteria for the ITER divertor, Final reportCFP/NTT-2004.035
S. Fouquet, J. Schlosser
CEFDA03-1051 Study on acceptance criteria for the ITER divertor,Intermediate report 2:experimental databaseCFP/NTT-2004.014
S. Fouquet
APPENDIX 3 : REPORTS AND PUBLICATIONS
- 310 -
CEFDA03-1051 Study on acceptance criteria for the ITER divertor, Intermediatereport 3: Thermal calculations for CFC and W monoblocksCFP/NTT-2004.030
C. Portafaix, S. Fouquet
CEFDA03-1051 Synthesis of non-destructive testing of the baffles prototypes designed for the ITER divertor (panels B and C)CFP/NTT-2004.015
S. Fouquet
CEFDA03-1077 Fabrication of primary first wall mock-ups for in-pile experimentsTask TW3-TVB-INMOCK, Rapport technique DTEN/DL/2005/016, march 2005
Ph. Bucci et al.
TW0-T438-01 Procédure d'entretien du laser en salle blanche du bâtiment 507DIAG/NTT-2004.015 (2004)
P. Dore
TW0-T438-01 Mesure de Vibration sur le Limiteur Pompé ToroïdalDIAG/NTT-2004.016 (2004)
P. Dore
TW0-T438-01 Mesure de Vibration sur le Limiteur Pompé Toroïdal(en choc et hors choc)DIAG/NTT-2004.031 (2004)
P. Dore
TW0-T438-01 Final report TW0-T438-01CFP/NTT-2004.033 (2004)
E. Gauthier, P. Dore
TW0-T438-01 Etude de l'érosion des composants face au plasma par interférométrie de speckle5ème Colloque Int. Francophone : Méthodes et Techniques Optiques pour l'Industrie, (2004)
P. Dore, E. Gauthier
Remote HandlingTW4-TVR-AIA Articulated Inspection Arm, AIA prototype module test campaign report
CEA/DTSI/SRSI/LPR/04RT.103/ Issue 0
TW4-TVR-AIA Articulated Inspection Arm, Deployer design reportCEA/DTSI/SRSI/LPR/04RT.104/ Issue 0
TW4-TVR-AIA Articulated Inspection Arm, Manufacture reportCEA/DTSI/SRSI/LPR/03RT.104/ Issue 0
TW4-TVR-AIA ITER Articulated Inspection Arm (AIA) : Geometric calibration issues of a long-reach flexible robotSOFT 2004 Paper 389
TW4-TVR-AIA ITER Articulated Inspection Arm (AIA): R&d progress on Vacuumand Temperature technology for remote handlingSOFT 2004 Paper 393
TW4-TVR-RADTOL December report DRT/LIST/DTSI/SARC/04-042/AG
TW4-TVR-RADTOL June report DRT/LIST/DTSI/SARC/04-335/AG
TW4-TVR-WHMAN Water hydraulic manipulator. Definition of a single axis water hydraulic mock-upDTSI/SCRI/LPR/05RT006
Magnet StructureCEFDA03-1015 CS cooling inlets comparison between a full and a half mock-up
Note AIM/NTT/2004.004P. Decool
CEFDA03-1120 TW3-TMSC-ASTEST Deliverable 1 : Intermediate report on test of advanced Nb3Sn strandsNote AIM/NTT-2004.014 (2004)
L. Zani, H. Cloez, C. Meuris,P. Chesny, J.M. Gheller,L. Kulbicki, L. Vieillard
CEFDA04-1134 Tâche BARBEN : qualification du système de régulation du cryostat à température variable en configuration Nb3SnNote AIM/NTT-2005.003, 2005
L. Zani, M. Tena, H. Cloez,J.P. Serries, S. Girard
TW1-TMC-CODES Experimental investigation to determine the heat transfer coefficient between annular area and the central channel of ITER-FEAT conductors as an input to codes developmentTask CODES Deliverable 4 : AIM/NTT-2004.017, August 2004
S. Nicollet, H. Cloez, P. Decool, J.L. Duchateau, A. Martinez, M. Tena, B. Renard, J.P. Serries
TW2-TMST-TOSKA Evaluation of the ITER cable-in-conduit conductor heat transferpresented at 20th Int. Cryo. Eng. Conf. Beijing, 2004
S. Nicollet et al.
- 311 -
TW2-TMST-TOSKA Final report on the testing of a full size joint sample (Deliverable 4)February 2005 Internal CEA Note AIM/NTT- 2005.002
J.L Duchateau et al.
TW3-TMSC-ELRES TW3-TMSC-ELRES : Milestone #2 Manufacturing of Samples(Cable and Joints)CEA Note DRFC (STEP/GCRY), AIM/NTT-2004.029,December 15, 2004
P. Decool and H. Cloez
Tritium Breeding and MaterialsBreeding Blanket
Helium Cooled Pebble Bed (HCPB) Blanket
TW4-TTBB-005-D01 Final report : Procurement and quality control of Li2TiO3 pebblesInternal report CEA/DTEN/DL/2004/027, September 2004
J.D. Lulewicz
TW2-TTBB-002b-D01 The manufacturing technologies of the European breeding blanketsICFRM-11, Journal of Nuclear Materials 329–333 (2004) 133–140
A. Cardella, E. Rigal et al.
Helium Cooled Lithium Lead (HCLL) BlanketTW2-TTBC-001-D01 He testing requirement and planning for the development and
qualification of HCLL TBMCEA report SERMA/04-3470/A, 09/2004
Y. Poitevin et al.
TW2-TTBC-001-D01 Helium Cooled Lithium Lead Test Blanket Module for ITER Engineering design, analyses and test programme & needsFinal Report on sub-deliverables 1d, 1e, 1g and 1h, CEA report SERMA/RT/05-3568/A, 03/2005
A. Li Puma et al.
TW2-TTBC-001-D01 Helium Cooled Lithium-Lead test blanket module for ITER - reference document for a mounting sequenceCEA Report, SEMT/BCCR/RT/04-016/A, April 2004
G. Rampal et al.
TW2-TTBC-002-D01 Fabrication processes for HCLL and HCPB TBMsSecond interim report, Rapport technique DTEN/DL/2005/006, 28/02/2005
E. Rigal et al.
TW2-TTBC-002-D01 The manufacturing technologies of the European breeding blanketsICFRM-11, Journal of Nuclear Materials 329–333 (2004) 133–140
A. Cardella, E. Rigal et al.
TW2-TTBC-002-D03 APS d’une section d’essais en PbLi pour CP sur DIADEMO HCLLNT DTN/STPA/LTCG 04-028
F. Delasalle et al.
TW2-TTBC-005-D01 ITER – Outlines of the TBM for ITER calculationsCEA/DEN/CAD/DER/SESI/LESA/NT D0 14
N. Schmidt
Structural Materials development
Reduced Activation Ferritic Martensitic (RAFM) Steels
TW2-TTMS-001b-D02 Status of irradiation experiments performed in BOR 60 reactor at 325°C. Post-irradiation examinations of materials irradiated upto 42 dpa: 1st partCEA Progress Report DMN/SRMA/N.T. SRMA 2004-2679, Dec. 2004
A. Alamo, J.L. Bertin
TW2-TTMS-004a-D04 CEA weldability developments on RAFM steels in the period1994-2003UTIAC/04-RT-16, 24 June 2004
G. De Dinechin, C. Chagnot,P. Aubert
TW2-TTMS-004a-D04 Fusion welds development test blanket module’s welding procedures : assembly of the horizontal cooling plates to the vertical plates with the plasma arc welding processUTA/04-RT-43, 9 January 2004
L. Forest
TW2-TTMS-005b-D03 Structural materials : Rules for design, fabrication, inspection. Fracture mechanics assessments of TBM'sFinal Report, RT DTEN/DL/2004/041, march 2005
R. Couturier, L. Briottet,S. Di Iorio, H. Giraud,P. Lemoine, I. Chu
- 312 -
TW4-TTMS-005-D01 Fusion Demo Interim Structural Design Criteria (DISDC): Appendix A Material Design Limit Data - A3.S18E Eurofer SteelCEA/DMN/Dir TN 2004-02/A, Dec. 2004
F. Tavassoli
TW4-TTMS-005-D01 Getting started with the RAFM Database Runtime Solution V. 3.0EFDA Task TW4-TTMS-005-D01, CEA/Saclay, DMN/Dir, Oct. 14, 2004
F. Tavassoli
Safety and EnvironmentSEA5-1 Stainless steel realease rate evaluation in ITER operating conditions
DTN/STRI/LTCD04-020, December 2004P. Schindler et al.
TW1-TSW-002 Management of tritiated wastes – Stainless steel detritiation studiesNote technique DTN/STPA/LPC 04/069
J. Chêne, A.M. Brass,A. Lassoued, O.Gastaldi,
TW3-TSS-SEA5.3 EVITA : Results of the cryogenic test campaign with injection of non condensable gasCEA report DTN/STPA/LTCG 04/035
L. Ayrault, F.Challet
TW3-TSS-SEA5.3 The EVITA programme: experimental and numerical simulation of a fluid ingress in the cryostat of a water-cooled fusion reactorSOFT 2004
P. Sardain, L. Ayrault, G. Laffont, F. Challet, L.B. Marie, B. Merrill, M.T. Porfiri, G. Caruso
TW3-TSW-002 Bilan des poubelles de déchets Phénix envoyées à COGEMA/TCD/TDS/CDS entre 1974 et 1998 (PA 6925 XD 46849 /B)
TW3-TSW-002 Source, quantity and type of radioactive waste coming from ITER hot cellsTechnical document DTN/STPA/LPC 2004/070
O. Gastaldi, C. Lacressonnière
TW4-TSS-SEA5.5-D11 Status of PACTITERNote Technique DTN/SMTM/2004-117, décembre 2004
F. Dacquait
TW4-TSS-SEA5.5-D11 Status of the PACTITER developmentMeeting on PACTITER, Cadarache, 25-26/01/05.
F. Dacquait, B. Larat, F. Nguyen
TW4-TSS-SEA5.5-D11 Final report - Validation of EU Safety Computer codes: validation of PACTITER on the CIRENE experiment - Feasibility studyNote Technique DTN/STRI/LTCD 04-021, décembre 2004
M. Girard, V. Blet, F. Dacquait
TW4-TSS-SEA5.5-D11 ITER 2004 tests report – Stainless steel Release rate evaluation in ITER operating conditionsNote technique DTN/STRI/LTCD 04-020, décembre 2004
P. Shindler, Y. Philibert, V. Blet
System StudiesPower Plant Conceptual Studies (PPCS)
TW2-TRP-PPCS15-D03 Waste management in fusion power plant PPCSTechnical report CEA/DTN/STPA/LPC NT 04/065
C. Lacressonnière
TW4-TRP-002-D04 Helium-Cooled Lithium-Lead Fusion Power Plant (PPCS model Aand B) Design and integration of in-vessel componentsand associated systemsCEA report, SERMA/LCA/RT/04-3543/A, February 2005
A. Li Puma, L. Giancarli
ITER Site PreparationEuropean ITER Site Studies
EISS3 stage 1+2 report delivered in June 2004
EISS2 final report delivered in March 2004
EISS4 interim report delivered in January 2005
EISS4 final report to be delivered in March 2005
CEFDA03-1069CEFDA03-1082CEFDA04-1161TW4-TES-COLABA
- 313 -
Site and Plant LayoutCEFDA03-1083 CEA Study for Process Flow Diagram (PFD) and Piping
Instrumentation Diagram (PID) for the ITER cryo-distribution system (including AUTOCAD drawings and component lists)Note SBT/04-244/FM, November 2004
F. Millet
CEFDA03-1083 Conceptual Design for Auxiliary Cold Box for Toroidal Magnets (including CATIA drawings)Technical Report DAPNIA-SACM, March 2005
P. Chesny
CEFDA03-1083 Conceptual design for cold valve box for torus cryopumps and pellet injection system (including CATIA drawings)Note SBT/CT/05-01, March 2005
F. Millet and Y. Machizaud
CEFDA03-1083 Description of the PFD for the ITER cryo-distribution systemNote SBT/04-58 rev 2/FMNovember 2004
F. Millet
JET TechnologyPhysics Integration
Heating Systems
CEFDA03-1031 Design of a limiter for the JET-EP-ICRH Antenna23rd SOFT in Venice September 2004.
Ph. Chappuis et al.
Diagnostics
CEFDA03-1044 Technical group evaluation report on analysis of IR endoscope tendersDIAG/NTT-2004.005 (2004)
E. Gauthier
CEFDA03-1044 Technical specifications of Codas software for control of the JET-EP IR cameraDIAG/CCH-2004.015 (2004)
E. Gauthier
CEFDA03-1044 Minutes on meeting at CEDIP on 8th April 2004DIAG/CRR-2004.016 (2004)
E. Gauthier, H. Roche
CEFDA03-1044 Report on tender evaluation on the IR endoscope Call for TenderDIAG/NTT-2004.004 (2004)
E. Gauthier
CEFDA03-1044 Minutes of meeting at TNO on 17th march 2004DIAG/CRR-2004.009 (2004)
E. Gauthier, J. Migozzi
CEFDA03-1044 Optical design of an infrared endoscope using reflective opticsDIAG/NTT-2004.007 (2004)
E. Gauthier, J. Migozzi
CEFDA03-1044 Minutes of meeting at TNO on 24th march 2004DIAG/CRR-2004.010 (2004)
E. Gauthier
CEFDA03-1044 Minutes of meeting hold at JET on 21st October 2004DIAG/CRR-2004.043 (2004)
E. Gauthier
CEFDA03-1044 Photometric analysis of the JET-IRV new optical designDIAG/NTT-2004.011 (2004)
D. Guilhem
CEFDA03-1044 Minutes of kick-off meeting with TNO on infrared endoscope contract FU 06 CT 2004-00023EFDA EP IRV 01/09/2004
E. Gauthier
CEFDA03-1044 Minutes of project Board on 28th September 2004 at JETEFDA EP DIA IRV-R-010 12/10/2004
J. Gafert
CEFDA03-1044 JET EP INFRARED DIAGNOSTIC PROJECT - Thermomechanical behaviour of Cassegrain telescope system -DIAG/NTT-2004.008 (2004)
M. Missirlian
- 314 -
Vessel/In-Vessel
Plasma Facing Components
JW0-FT-3.1 Post test 3-D thermal calculations of jet divertor tilesCEA report SEMT/LM2S/RT/04.027, August 2004
P. Yala and L. Nicolas
JW0-FT-3.1 Compte rendu et analyse préliminaire des expériences de dépôt de puissance sur les tuiles du divertorDIAG/NTT-2004.028 (2004)
E. Gauthier
JW0-FT-3.1 Modélisation des expériences de dépôt de puissance sur des tuiles issues du divertor du JETCFP/NTT-2004.022 (2004)
S. Dumas, E. Gauthier,M. Missirlian
JW0-FT-3.1 Final report of JW0-FT-FT3.1 taskCFP/NTT-2004.031 (2004)
E. Gauthier, S. Dumas,L. Nicolas, P. Yala
JW0-FT-3.1 Thermal behaviour of redeposited layer under high heat flux exposure16th Int. Conf. on Plasma Surface Interaction in Controlled Fusion Devices (2004), J. Nucl. Mater, 337-339 (2005) 960-964
E. Gauthier, S. Dumas,J. Matheus, M. Missirlian,Y. Corre, L. Nicolas, P. Yala,J. Coad, P. Andrew, S. Cox,and Efda-JET team
Safety and EnvironmentJW4-FT-3.19 Studies on graphite surfaces detritiation by pulsed repetition rate
nanosecond lasersPresentation on SOFT’2004 conference, 20-24 September 2004, Venice, Italy
A. Semerok, F. Le Guern,F. Brygo, C. Grisolia, D. Farcage,C. Hubert, C. Lascoutouna,M. Tabarant, J.M. Weulersse
JW4-FT-3.19 Studies on tokamak wall surfaces decontamination by pulsed repetition rate lasersCEA report NT DPC/SCP/05-111-A, January 2005, 50 pages
A. Semerok, J.M. Weulersse,F. Brygo, D. Farcage, C. Hubert,C. Lascoutouna, M. Géléoc,P. Wodling, H. Long,F. Champonnois, G. Brunel,G. Vimond, E. Lizon, V. Dauvois, V. Delanne, C. Grisolia,S. Fomichev, M. Hashida
Heating Systems Technology ProjectCEFDA04-1140 Design and Fabrication of the “ITER-like” SINGAP D- Acceleration
System23rd symposium of fusion technology 20-24 September 2004
P. Massmann, L. Svensson,H.P.L. de Esch and R.S. Hemsworth
CEFDA04-1140 Development of the Long Pulse Negative Ion Source for ITERSymposium on the Production and Neutralization of Negative Ionsand Beams, Kiev, 13-17 September 2004
R.S. Hemsworth, D. Boilson,U. Fanz, L. Svensson,H.P.L. de Esch, A. Krylov,P. Massmann and B. Zaniol
CEFDA04-1140 Negative Ion Yield in Long pulse operation on theKAMABOKO III ion source23rd symposium of fusion technology 20-24 September 2004
D. Boilson, H.P.L. de Esch,R.S. Hemsworth, A. Krylov,P. Massmann and L. Svensson
UNDERLYING TECHNOLOGY PROGRAMME
Vessel/In VesselPlasma Facing Components
UT-VIV/PFC-Damage Endommagement et rupture dans les assemblages des composants face au plasma, Analyse de l’endommagement de la liaison CFC-Cuà l’échelle microscopique : Analyse des mécanismes d’amorçageRapport 2a, Projet P6, 20/12/04
D. Leguillon, C. Henninger
- 315 -
UT-VIV/PFC-Damage Endommagement et rupture dans les assemblages des composants face au plasma, Analyse de l’endommagement de la liaison CFC-Cu à l’échelle microscopique : Analyse des mécanismes locaux de fissurationRapport 2a-bis, Projet P6, 20/12/04
D. Leguillon, C. Henninger
UT-VIV/PFC-Damage Endommagement et rupture dans les assemblages des composants face au plasma, Analyse des mécanismes d’endommagement de l’assemblage à l’échelle macroscopique : Calcul des contraintes résiduelles et des contraintes sous chargement de flux thermiqueRapport 3a-bis, Projet P6, 1/12/04
E. Martin
UT-VIV/PFC-Damage Endommagement et rupture dans les assemblages des composants face au plasma, Identification d’une loi de comportement thermomécanique pour composites 3D C/C : application aux matériaux N11 et NB31. Lois de comportement disponibles pour les C/C et extension possible aux matériaux N11 et NB31Rapport 1a, Projet P6, 01/12/04
G. Camus
UT-VIV/PFC-HIP Improvement of the reliability, performance and relevancy of HIP processes for PFC componentsrapport technique DTEN/DL/2005/015, march 2005
E. Rigal, C. Chabrol,O. Gillia et al.
UT-VIV/PFC-NanoSic Densification of SiC nanometric powders: 2004 final reportCEA report, DTEN/DL/2004/044 (01/2005)
F. Ténégal
UT-VIV/PFC-NanoSic Elaboration of nanocrystalline silicon carbide by hot isostatic pressing (HIP)NANO 2004, Wiesbaden (06/2004)
F. Ténégal, N. Herlin, D. Gosset, L. Boulanger, S. Poissonnet
UT-VIV/PFC-NanoSic Nanocrystalline silicon carbide (SiC): 2004 interim reportCEA report, DTEN/DL/2004/021 (07/2004)
F. Ténégal
UT-VIV/PFC-Pyro Application of a tricolour pyroreflectometer to plasma facing components in-situ infrared monitoringContract CEA et PROMES-CNRS Ref : V3448.001, REPORT A2, Experiments at Odeillo solar furnace, Nov. 2004
D. Hernandez, J.L. Sans
Remote HandlingUT-VIV/AM-ECIr Réalisation d’une transmission de type modulation FSK en
environnement durciinternal report
J. Coudon
UT-VIV/AM-Hydro Feasibility assessment of a ‘pressure control’ water hydraulics servovalveDTSI/SCRI/LPR/05RT010
UT-VIV/AM-Hydro Preliminary study of a ‘pressure control’ water hydraulics servovalveDTSI/SCRI/LPR/05RT003
UT-VIV/AM-Vacuum Specification and conceptual design of a manipulator joint for remote handling under vaccum, temperature and magnetic fieldReport DTSI/SRSI/LPR 04RT 097
Tritium Breeding and MaterialsBreeding Blanket
UT-TBM/BB-He Helium and tritium leaks in the PPCS BKT & DV cooling circuitsCEA Report NT DEN/DTN/STPA/LTCG/04/032, August 2004
J.L. Berton
UT-TBM/BB-He Report of experiments on static benchesCEA report NT DEN/DTN/STPA/LTCG/04/069, December 2004
J.L. Berton
Materials Development
Structural Materials
UT-TBM/MAT-Modpulse Monotonous short time irradiation of Eurofer at 350 and 550°CCEA report, NT DEN/SAC/DMN/SRMP 2004-012
L. Boulanger and Y.Serruys

- 316 -
Safety and EnvironmentUT-S&E-LiPbwater Recalculation of the LIFUS experiment (interaction between lithium-
lead and water) with the 3D version of SIMMERFebruary 2005, CEA report CEA/DEN/CAD/DER/SESI/LCSI/NT DO1 14/01/05
T. Cadiou
- 317 -
Task Title Prog. Field Area Unit Site Task Leader Page
CEFDA01-585 TW1-TVP-TESTAN: Monitoring and analysis of the thermal fatigue testing of divertor prototypes - 200 kW electron beam gun test
EFDA VIV PFC DRFC Cadarache Escourbiac F. 49
CEFDA01-645 TW2-TPHN-NBDES1: Support to neutral beam physics and testing 1 EFDA PI Hea DRFC Cadarache Svensson L. 9
CEFDA02-1003CEFDA03-1111
TW2-TPDS-DIASUP4 and TW3-TPDS-DIASUP1: Support to the ITER diagnostic design
EFDA PI Diag DRFC Cadarache Stott P. 17
CEFDA02-583 TW1-TVV-DES: Destructive examination of primary first wall panelsand mock-ups
EFDA VIV PFC DTEN Grenoble Bucci P. 55
CEFDA03-1015 TW2-TMSM-COOLINL: Mock-ups for the TF and CS Terminal regions and Cooling Inlets
EFDA MAG MAG DRFC Cadarache Decool P. 87
CEFDA03-1029 TW3-TVB-JOINOP: Optimization of Be/Cu alloy joints for primary first wall panels
EFDA VIV PFC DTEN Grenoble Bucci P. 59
CEFDA03-1031CEFDA04-1146
JW3-EP-ICRH and JW4-EP-ICRH: Contribution to ICRH components antenna limiter
EFDA PI Hea DRFC Cadarache Chapuis P. 219
CEFDA03-1044 JW3-EP-IRV: Diagnostics enhancement - Wide angle IR endoscope EFDA PI Diag DRFC Cadarache Gauthier E. 221
CEFDA03-1047 TW3-THHN-IITF1: The first ITER NB injector and the ITER NB test facility: design
EFDA HSTP HSTP DRFC Cadarache Hemsworth R. 239
CEFDA03-1051 TW4-TVD-ACCEPT: Study on acceptance criteria for the ITER divertor vertical target
EFDA VIV PFC DRFC Cadarache Schlosser J. 63
CEFDA03-1067 TW3-TVM-MDB: Rules for design, fabrication and inspectionEstablishment and Operation of a Material Database
EFDA VIV V/B DMN Saclay Tavassoli F. 23
CEFDA03-1069CEFDA03-1082CEFDA04-1161TW4-TES-COLABA
European ITER Site Studies (EISS)TW3-TES-EISSg1: EISS 3 generic tasks CEATW3-TES-EISS2c: EISS 3 stage 2TW4-TES-EISS4F: European ITER site study 4 - CadaracheTW4-TES-COLABA: Cadarache site for ITER -Collaboration with Local Authorities
EFDA ISP EISS DRFC Cadarache Garin P. 207
CEFDA03-1077 TW3-TVB-INMOCK: Fabrication of primary first wall mock-ups for in-pile experiments
EFDA VIV PFC DTEN Grenoble Bucci P. 67
CEFDA03-1083 TW3-TEP-CRYO2: Design of ITER cryoplant/cryo-distribution system (auxilliary coldboxes, cryoline…)
EFDA ISP SPL DRFMC Grenoble Millet F. 211
CEFDA03-1091TW4-TVM-LIP: Rules for design, fabrication and inspectionModification of ITER materials documents and assessment of material data for licensing TBM's design rules
EFDA VIV V/B DMN Saclay Tavassoli F. 25
CEFDA03-1098TW3-TDS-MAGCEA: Detailed engineering and manufacturing studiesof the ITER magnet system: Poloidal Field (PF) coil windingsand cold test assessment
EFDA DSP DSP DRFC Cadarache Libeyre P. 215
CEFDA03-1120TW3-TMSC-ASTEST: Tests of advanced Nb3Sn strands - Extensivecharacterization of industrial advanced Nb3Sn strands developedfor ITER TF coils system
EFDA MAG MAG DRFC Cadarache Zani L. 91
CEFDA03-1129 TW3-TPHI-ICRDES1: ITER ICRF Antenna and matching system design
EFDA PI Hea DRFC Cadarache Bosia G. 13
CEFDA04-1127 TW4-TMSC-SAMAN1: Manufacture of sub-size samples EFDA MAG MAG DRFC Cadarache Duchateau JL. 93
CEFDA04-1134TW4-TMSC-BARBEN: Bending strain effects of single strands - Studyof bending strain effect on critical properties of Nb3Sn strands jacketedwith stainless steel for various bending amplitudes and temperatures
EFDA MAG MAG DRFC Cadarache Zani L. 95
CEFDA04-1140 TW4-THHN-ADSD2: Neutral beam development for EFDA extension EFDA HSTP HSTP DRFC Cadarache Boilson 243
JW0-FT-3.1 Internal PFC components behaviour and modelling EFDA VIV PFC DRFC + DM2S
Cadarache + Saclay
Gauthier E., Nicolas L.
223
JW3-FT-2.15-D01 Detritiation of soft housekeeping materials (mainly plastics) EFDA S&E Safety DTN Cadarache Trabuc P. 227
APPENDIX 4 : CEA TASKS IN ALPHABETICAL ORDER
- 318 -
Task Title Prog. Field Area Unit Site Task Leader Page
JW3-FT-2.15-D02 Detritiation of vacuum oil and organic liquids EFDA S&E Safety DTN Cadarache Trabuc P. & Poletiko C.
231
JW4-FT-3.19 Laser decontamination/Tritium removal - Studies on Tokamak wall surfaces decontamination by pulsed repetition rate lasers
EFDA S&E Safety DPC Saclay Semerok A. 235
SEA5-1 Validation of computer codes and models EFDA S&E Safety DTN Cadarache Schindler P. 171
TW0-T438-01 Development and testing of time resolved erosion detecting techniques EFDA VIV PFC DRFC Cadarache Gauthier E. 71
TW0-T508/05 Development of Be/CuCrZr brazing techniques EFDA VIV V/B DTEN Grenoble Bucci P. 27
TW1-TMC-CODES Design and Interpretation Codes - Determination of thermohydraulic properties of cable-in-conduit conductors with a central channel
EFDA MAG MAG DRFC Cadarache Decool P. 99
TW1-TMS-PFCITE Poloidal Field Conductor Insert (PFCI) EFDA MAG MAG DRFC Cadarache Ciazynski D. 103
TW1-TSW-002 Waste and decommissioning strategy EFDA S&E Safety DTN Cadarache Gastaldi O. 175
TW1-TVV-HIP Improvement of HIP Fabrication techniques EFDA VIV V/B DTEN Grenoble Bucci P. 31
TW2-TMST-TOSKA TFMC testing with the LCT coil EFDA MAG MAG DRFC Cadarache Duchateau J.L. 105
TW2-TPDS-DIADEV-D02
Development of diagnostic components - First mirror study EFDA PI Diag DRFC Cadarache Lipa M. 19
TW2-TRP-PPCS15-D03 Waste management strategy on model A and B EFDA SS PPCS DTN Cadarache Lacressonnière C.
193
TW2-TTBB-002b-D01 Blanket manufacturing techniques - First wall HIPping with open channels
EFDA TBM HCPB DTEN Grenoble Rigal E. 113
TW2-TTBC-001-D01 Helium Cooled Lithium Lead - TBM design, integration and analysis - Blanket system design and analysis - Integration and testing in ITER
EFDA TBM HCLL DM2S Saclay Li Puma A. 117
TW2-TTBC-002-D01 Blanket manufacturing techniques - Fabrication processes for HCLL and HCPB TBMs
EFDA TBM HCLL DTEN Grenoble Rigal E. 123
TW2-TTBC-002-D03 Testing of small-scale mocks-ups to qualify manufacturing technologies EFDA TBM HCLL DTN Cadarache Cachon L. 127
TW2-TTBC-005-D01 Helium Cooled Lithium Lead - Safety and Licensing - Test Blanket Module (TBM) accidental safety study
EFDA TBM HCLL DER + TA Cadarache + Aix en Pce
Schmidt N., La Lumia
129
TW2-TTMS-001b-D02 Irradiation performance - Neutron irradiation to 70 dpa at 325°C and PIE
EFDA TBM RAFM DMN Saclay Alamo A. 135
TW2-TTMS-004a-D04
Eurofer : Fusion welds development - Evaluation of a welding process adapted to the Test Blanket Module’s geometry : Assembly of the horizontal cooling plates with the continuous wave YAG laser welding process
EFDA TBM RAFM DTEN Saclay Forest L. 139
TW2-TTMS-004b-D01 Tubing process qualification - Advanced process developmentand testing for the production of TBM's cooling channels
EFDA TBM RAFM DTEN Grenoble Rigal E. 143
TW2-TTMS-004b-D02 Qualification of fabrication processes - Processing of high quality welds according to TBM design
EFDA TBM RAFM DTEN Saclay Asserin O. 145
TW2-TTMS-005b-D03 Rules for design, fabrication, inspectionFracture Mechanics Assessments of TBM's
EFDA TBM RAFM DTEN Grenoble Couturier R. 151
TW2-TVV-ROBOT Dynamic test rig for Intersector Welding Robot (IWR) for VV sector field joining
EFDA VIV V/B DTEN Saclay Aubert P. 33
TW3-THHE-CCGDS1 Coaxial cavity gyrotron and test facility - Design, support to the industrial development and preparation of the technical specifications
EFDA HSTP HSTP DRFC Cadarache Magne R. 247
TW3-THHI-GTFDS1Fusion diacrode, IC RF generator, IC power supply and IC test facility -Design, support to industrial development and preparationof the technical specifications
EFDA HSTP HSTP DRFC Cadarache Mollard P. 249
TW3-TMSC-ELRES Experimental assessment of the effect of electrical resistances on the V-I characteristics of superconductive cables
EFDA MAG MAG DRFC Cadarache Ciazynski D. 109
TW3-TPP-ERDIAG Evaluation of Laser Ablation Optical Emission Spectroscopy (LA-OES) method for graphite co-deposited layer characterization
EFDA PI Edge DPC Saclay Semerok A. 5
- 319 -
Task Title Prog. Field Area Unit Site Task Leader Page
TW3-TSS-SEA5.3 Ice formation on cryogenic surfaces EFDA S&E Safety DTN Cadarache Ayrault L. 181
TW3-TSW-002 Assessment of radioactive waste in ITER hot cell facility EFDA S&E Safety DTN Cadarache Gastaldi O. 183
TW3-TTMA-001-D04TW3-TTMA-002-D04
SiC/SiC ceramic composites - Divertor and Plasma Facing Materials EFDA TBM ADV DMN Saclay Alamo A. 161
TW3-TVM-JOINT Characterization of the CuCrZr/SS junction strength for different blanket manufacturing conditions
EFDA VIV V/B DTEN Grenoble Gillia O. 35
TW3-TVV-DISFREE Further development of the hybrid MIG/Laser welding technique for VV sector field joining
EFDA VIV V/B DTEN Saclay De Dinechin G. 39
TW3-TVV-ROBASS Long detection range seam tracker EFDA VIV V/B DTEN Saclay Aubert P. 43
TW4-TRP-002-D02b Conceptual design of a HCLL reactor - Tritium control & management analysis, thermo-hydraulic and thermo-mechanical analyses
EFDA SS PPCS DM2S Saclay Farabolini W. 197
TW4-TRP-002-D04 Conceptual design of a HCLL reactor - Design Integration EFDA SS PPCS DM2S Saclay Li Puma A. 201
TW4-TSS-SEA5.5-D02&D05
Validation of the PAXITR and PACTITER code against fusion-specific experiments
EFDA S&E Safety DTN Cadarache Girard M. 187
TW4-TSS-SEA5.5-D11 Validation of the PACTITER code against fusion-specific experiments - Development of the PACTITER code
EFDA S&E Safety DTN Cadarache Dacquait F. 191
TW4-TTBB-005-D01HCPB breeder and neutrons multiplier materialsProcurement and quality control of Li2TiO3 pebbles EFDA TBM HCPB DTEN Saclay Lulewicz J.D. 115
TW4-TTBC-001-D01 TBM design, integration and analysis - Testing programme and engineering design of the first HCLL TBM for ITER H-H phase
EFDA TBM HCLL DM2S Saclay Farabolini W. 133
TW4-TTMA-001-D04Modelling of the mechanical behaviour of advanced 3D SiCf/SiC composite
EFDA TBM ADV DM2S Saclay Guérin C. 163
TW4-TTMI-001-D01 IFMIF accelerator facilities - Accelerator system design EFDA TBM NS DAPNIA Saclay Ferdinand R. 167
TW4-TTMS-005-D01 Rules for design, fabrication and inspectionUpdate Data Base and Appendix A of DEMO-SDC
EFDA TBM RAFM DMN Saclay Tavassoli F. 155
TW4-TTMS-007-D02 Modelisation of irradiation effectAb-initio defect energy calculations in the Fe-He system
EFDA TBM RAFM DMN Saclay Willaime F. 157
TW4-TVR-AIA Articulated Inspection Arm (AIA) EFDA VIV RH DTSI Fontenay Friconneau J.P. 73
TW4-TVR-Radtol Radiation tolerance assessment of standard electronic components for remote handling
EFDA VIV RH DTSI Fontenay Giraud A. 77
TW4-TVR-WHMAN Development of a water hydraulic manipulator EFDA VIV RH DTSI Fontenay Friconneau J.P. 83
TW4-TVV-OSWELD Qualification of multiple phased array UT for one sided welds during VV manufacture
EFDA VIV V/B DETECS Saclay Bredif Ph. 45
UT-S&E-LASER/DEC Laser decontamination/Tritium removal - Modelling of lasers surface heating
UT S&E Safety DPC Saclay Semerok A. 291
UT-S&E-LiPbwater Recalculation of the LIFUS experiment (interaction between lithium-lead and water) with the 3D version of SIMMER
UT S&E Safety DER Cadarache Cadiou T. 295
UT-TBM/BB-He Helium components technology - Problems and outline of solutions UT TBM BLK DTN Cadarache Berton J.L. 279
UT-TBM/MAT-LAM/Opti
Development of new RAFM steels with regard to creep properties UT TBM MAT DMN Saclay De Carlan Y. 283
UT-TBM/MAT-Modpulse Pulsed irradiation of the martensitic alloy Eurofer - Irradiationsby krypton ions at 350 and 550°C at high flux during short time
UT TBM MAT DMN Saclay Boulanger L. 287
UT-VIV/AM-ECIr Remote handling techniques - Radiation effects on electronic components
UT VIV RH DTSI Fontenay Giraud A. 267
UT-VIV/AM-Hydro Technologies and control for remote handling systems UT VIV RH DTSI Fontenay Friconneau J.P. 273
UT-VIV/AM-Vacuum Technologies for vacuum and temperature and magnetic field conditions for remote handling systems
UT VIV RH DTSI Fontenay Friconneau J.P. 275
- 320 -
Task Title Prog. Field Area Unit Site Task Leader Page
UT-VIV/PFC-Damage Study of damage mechanisms in plasma facing components UT VIV PFC CNRS-LCTS
Pessac Martin E. 253
UT-VIV/PFC-HIP Improvement of reliability, performance and industrial relevancy of HIP processes for PFC components
UT VIV PFC DTEN Grenoble Chabrol C. 255
UT-VIV/PFC-NanoSic Nanocrystalline silicon carbide (SiC) - Optimization of the preparationof NanoSiC
UT VIV PFC DTEN Saclay Ténégal F. 259
UT-VIV/PFC-Pyro Application of a tricolour pyroreflectometer to plasma facing components in-situ infrared monitoring
UT VIV PFC CNRS-IMP Font Romeu Hernandez D. 263
Programme AreaEFDA = EFDA Technology Programme Edge = Plasma EdgeUT = Underlying Technology Programme Hea = Heating and Current Drive
Diag = DiagnosticsV/B = Vessel/Blanket and Materials
Field PFC = Plasma Facing ComponentsPI = Physic Integration RH = Remote HandlingVIV = Vessel - In Vessel MAG = MagnetsMAG = Magnets BLK = BlanketTBM = Tritium Breeding & Materials HCPB = Helium Cooled Pebble Bed BlanketS&E = Safety & Environment HCLL = Helium Cooled Lithium Lead BlanketSS = System Studies MAT = MaterialsISP = ITER Site Preparation RAFM = Reduced Activation Ferritic Martensitic steelsDSP = Design Support and Procurement ADV = Advanced MaterialsHSTP = Heating Systems Technology Project NS = Neutron Source
Safety = Safety and environmentPPCS = Power Plant Conceptual StudiesEISS = European ITER Site StudiesSPL = Site and Plant LayoutDSP = Design Support and ProcurementHSTP = Heating Systems Technology Project
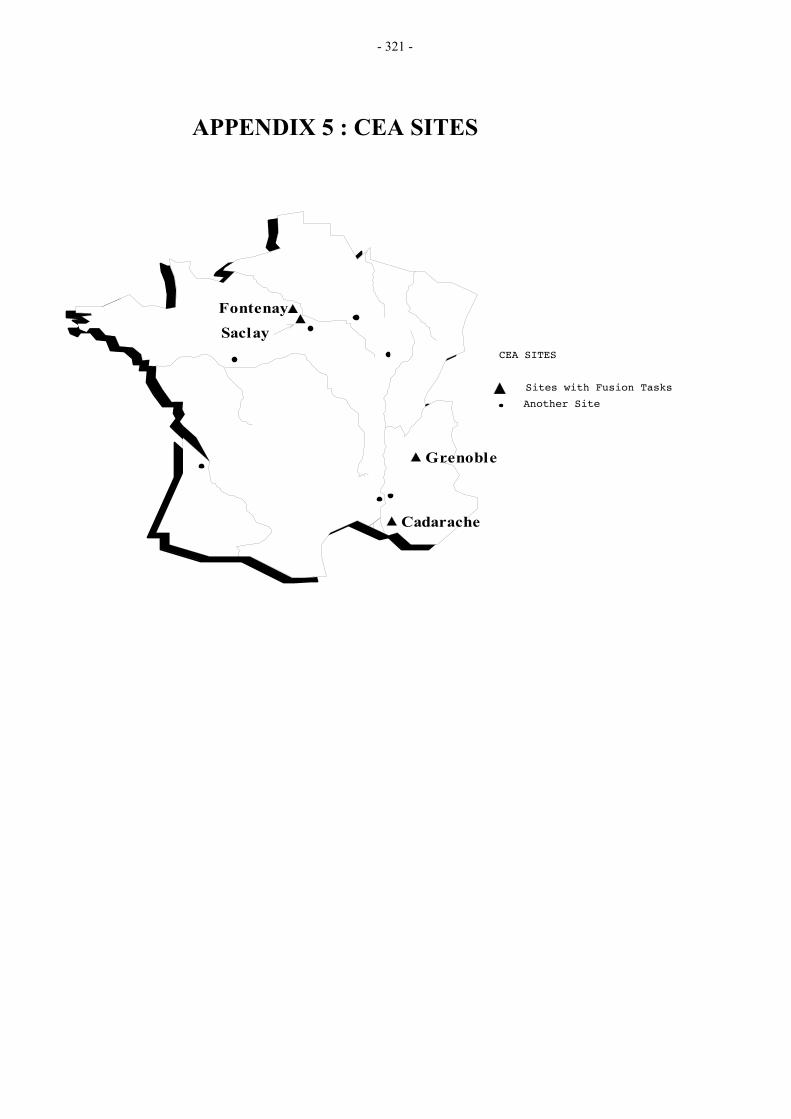
- 321 -
APPENDIX 5 : CEA SITES
Cadarache
Grenoble
Fontenay
SaclayCEA SITES
Sites with Fusion Tasks
Another Site

- 322 -
Related Documents


