ANNUAL REPORT November 30, 2016 Loomis Sayles Dividend Income Fund Loomis Sayles Global Growth Fund Vaughan Nelson Select Fund TABLE OF CONTENTS Portfolio Review .........................page 1 Portfolio of Investments ........... page 18 Financial Statements ................ page 28 Notes to Financial Statements ...... page 42

Welcome message from author
This document is posted to help you gain knowledge. Please leave a comment to let me know what you think about it! Share it to your friends and learn new things together.
Transcript

ANNUAL REPORT
November 30, 2016
Loomis Sayles Dividend Income Fund
Loomis Sayles Global Growth Fund
Vaughan Nelson Select Fund
TABLE OF CONTENTS
Portfolio Review .........................page 1
Portfolio of Investments ...........page 18
Financial Statements ................page 28
Notes to Financial Statements ......page 42
About us
Natixis Global Asset Management servesthoughtful investment professionals andtheir clients worldwide with more in-sightful ways to understand and managerisk. Through our Durable PortfolioConstruction® approach, we focus on riskto help them construct more strategic port-folios that seek to produce better outcomesin today’s unpredictable markets. We drawfrom deep investor and industry insightsand partner closely with our clients to putobjective data behind the discussion.
Natixis is ranked among the world’s largestasset management firms.1 Uniting over 20specialized investment managers globally($897 billion in assets undermanagement2), we bring a diverse range ofsolutions to every strategic opportunity.
The Natixis Funds Family
AlternativesASG Global Alternatives FundASG Managed Futures Strategy FundLoomis Sayles Strategic Alpha Fund
Equity IncomeLoomis Sayles Dividend Income Fund
Hedged EquityGateway FundGateway Equity Call Premium Fund
Multi-AssetASG Dynamic Allocation FundLoomis Sayles Global Equity and Income FundLoomis Sayles Multi-Asset Income Fund
Municipal Fixed-IncomeMcDonnell Intermediate Municipal Bond Fund
Non-U.S. EquityNatixis Oakmark International Fund
Taxable Fixed-IncomeLoomis Sayles Core Plus Bond FundLoomis Sayles High Income FundLoomis Sayles Intermediate Duration Bond FundLoomis Sayles Investment Grade Bond FundLoomis Sayles Limited Term Government and Agency FundLoomis Sayles Senior Floating Rate and Fixed Income FundLoomis Sayles Strategic Income Fund
U.S. EquityAEW Real Estate FundASG Tactical U.S. Market FundLoomis Sayles Growth FundLoomis Sayles Value FundNatixis Oakmark FundNatixis U.S. Equity Opportunities FundVaughan Nelson Select FundVaughan Nelson Small Cap Value Fund3
Vaughan Nelson Value Opportunity Fund
Global EquityLoomis Sayles Global Growth FundMirova Global Sustainable Equity Fund
1 Cerulli Quantitative Update: Global Markets 2016 ranked Natixis Global Asset Management, S.A. as the 16th largestasset manager in the world based on assets under management as of December 31, 2015. 2 Net asset value as ofSeptember 30, 2016. Assets under management (AUM) may include assets for which non-regulatory AUM services areprovided. Non-regulatory AUM includes assets which do not fall within the SEC’s definition of ‘regulatory AUM’ inForm ADV, Part 1. 3 The Vaughan Nelson Small Cap Value Fund was closed to new investors on July 31, 2009.NGAM Distribution, L.P. is a limited purpose broker-dealer and the distributor of various registered investmentcompanies for which advisory services are provided by affiliates of Natixis Global Asset Management, S.A.NGAM Distribution, L.P. is located at 399 Boylston St., Boston, MA 02116.This page not part of shareholder report

Letter from the President
Dear Shareholder:
The stock and bond markets both generated positive returns for the 12-month period end-ing November 30, 2016, although it didn’t necessarily feel that way for investors. In theequity markets, three sharp rallies, a major selloff early in January/February and some flatperiods, resulted in a year characterized more by uncertainty than confidence. In fixed-income, the Federal Open Market Committee finally raised the federal funds rate to0.50% — 0.25% in mid-December 2015, and again by another 0.25% in December 2016(after the close of the funds’ reporting period). Longer-term U.S. interest rates declined formost of the year, boosting bond prices, then rose sharply at the end of the period, bringingbond prices down.
In contrast, the European Central Bank continued its program of purchasing governmentsecurities to help revitalize the euro-zone economy. At the same time, growth in Chinacontinued to slow, causing turbulence in Chinese equity and currency markets. By year-end2015, China’s dwindling demand for raw materials destabilized currency and commoditymarkets, triggering a global resurgence of volatility that sent those markets tumbling in thefirst six weeks of 2016.
After hitting bottom in mid-February, however, markets recovered as quickly as they fell,largely recouping their losses by early April. Then, on June 23, Britain voted to leave theEuropean Union. The unexpected “Brexit” result caught financial markets off guard ini-tially, but again, the recovery was swift. After the U.S. election, bond prices fell andstocks rallied, ending the period at new highs.
Recovery still under wayThe U.S. economy continued its slow but steady recovery during the year, with strong andfairly consistent job growth. The monthly unemployment rate began the period at 5% andended at 4.6% in November. U.S. inflation is still running below the 2% level targeted bythe Federal Reserve, due in large part to low oil prices and the strong U.S. dollar makingimports cheaper. However, as the past 12 months have shown, bouts of volatility can occurat any time, and may become more pronounced as the new Republican administration set-tles in. We encourage you to work closely with your financial advisor to keep your invest-ment allocations aligned with your long-term goals and tolerance for risk.
Monitoring fund performanceThe enclosed report presents your fund’s financial results for the 12 months endedNovember 30, 2016. For more current information, including daily fund prices andmonthly return figures, please visit our newly redesigned website, ngam.natixis.com/performance. You’ll find fund-specific information under the Products tab in the mainnavigation. You may also want to explore the Insights section to learn more about mar-ket trends and new investment ideas.
Sincerely,
David L. GiuntaPresident
This page not part of shareholder report

LOOMIS SAYLES DIVIDEND INCOME FUND
Managers: Symbols:Arthur J. Barry, CFA® Class A LSCAXAdam C. Liebhoff Class C LSCCXLoomis, Sayles & Company, L.P. Class Y LSCYX
Investment GoalThe Fund’s investment goal is high total return through a combination of current incomeand capital appreciation.
Market ConditionsThroughout the 12-month period, volatility (as measured by the VIX Index) pervaded mostareas of the market. In particular, volatility was most pronounced during the first quarter of2016, following the UK’s late-June Brexit vote and prior to the November elections in theU.S. Additionally, interest rates recovered from post-Brexit lows to reach 52-week highsafter the election of Donald Trump. Similarly, oil prices recovered, approaching 52-weekhighs toward the end of November on OPEC’s announcement of production cuts.
By traditional measures, the market’s valuation expanded toward the upper end of long-termranges. However, adjusting for lack of earnings in the energy sector and the strong U.S.dollar, we believe U.S. equities seem reasonably valued given a broad lack of alternatives.
Performance ResultsFor the 12-month period ended November 30, 2016, Class A shares of the Loomis SaylesDividend Income Fund returned 9.26% at net asset value. The fund outperformed itsprimary benchmark, the all-equity S&P 500® Index, which returned 8.06% for the period.The fund underperformed its secondary benchmark, the Russell 1000® Value Index, whichreturned 12.02%.
Explanation of Fund PerformanceThe fund’s outperformance was broad-based, as stock selection led to positive results in thereal estate, information technology, consumer discretionary, consumer staples and materialssectors. Among individual holdings, Qualcomm, Chevron and International Paper were thelargest contributors to performance.
Qualcomm, a wireless communications company, benefited from several factors, includingbetter underlying performance in its licensing and chipset businesses and improvingsmartphone growth expectations. In addition, investors had a favorable view of thecompany’s offer for NXP Semiconductor, which would diversify Qualcomm away fromsmartphone chips and give it deeper reach into the emerging Internet of Things space.
Shares of Chevron have rallied with the rebound in oil prices. Additionally, the company isnearing the end of large capital investments and is beginning to harvest the free cash flowgenerated from these projects. As a result, investors have become more comfortable that
1 |

the dividend payment is not only stable but also has a good probability of growing over thenext few years.
International Paper, a container and packaging company, benefited from a reversal insentiment toward containerboard volumes and from stabilization in pricing. The companyalso announced its acquisition of Weyerhaeuser’s Fluff Pulp business, which should drivesolid earnings accretion.
Stock selection in the telecommunication services and energy sectors and an overweight inthe healthcare sector weighed on relative performance. In terms of individual holdings,PBF Energy, Allergan and Vodafone were among the largest detractors.
PBF Energy, an independent refiner, was weak due to a confluence of refining headwindsand company-specific execution issues. On refining, elevated product inventories depressedcrack spreads (the differential between the price of crude oil and the petroleum productsderived from it) compared with 2015, particularly on the East Coast, where overflowproduct from Europe found its way to New York Harbor. Furthermore, in addition tohaving outsized exposure to the product-saturated East Coast, the company had troublegetting its newly acquired Torrance, California refinery up and running, which was a drainon cash and earnings.
Shares of Allergan, a specialty pharmaceutical company, declined due to the failed mergerwith Pfizer and a reset of earnings and cash flow expectations to more achievable stand-alone levels. The stock also struggled due to investor concerns surrounding pharmaceuticalpricing and the U.S. presidential election.
Adverse foreign currency fluctuations hurt the shares of mobile company Vodafone Group.In particular, the substantial devaluation of the British pound following the U.K.’s Brexitvote was a main factor. For example, the U.S. shares underperformed the local U.K. sharesby approximately 16%. Furthermore, the company announced higher capital spendingplans than it previously communicated, causing its free cash flow outlook to decline.
The fixed-income portion of the Dividend Income Fund put forth positive returns duringthe course of the trailing year, primarily due to solid security selection.
OutlookWe believe stocks remain close to fairly valued and offer attractive longer-term returnpotential including dividends. Equities performed well even as interest rates increasedsignificantly late in the period. We believe credit spreads (the difference in yield betweenTreasury and non-Treasury securities of similar maturity) remain fairly tight, and thepresident-elect’s tax platform seems likely to be implemented to a significant degree,making the earnings outlook better than we previously expected. Regardless of thedirection of the markets, we continue to take a long-term, security-specific approach and,as always, view opportunities as defined by our reward-to-risk profiles.
| 2

LOOMIS SAYLES DIVIDEND INCOME FUND
Hypothetical Growth of $10,000 Investment in Class A Shares4,5
March 30, 2012 (inception) through November 30, 2016
$5,000
$10,000
$20,000
$15,000
NAV With 5.75% Maximum Sales Charge
$16,196$15,265
$17,262$17,506
11/1603/12 11/12 11/13 11/14 11/15
S&P 500® Index2 Russell 1000® Value Index3
Top ten holdings (as of 11/30/2016)
Security name% of
net assets
1. Wells Fargo & Co. 3.35%
2. Microsoft Corp. 2.97%
3. Pfizer, Inc. 2.86%
4. QUALCOMM, Inc. 2.85%
5. JPMorgan Chase & Co. 2.84%
6. Philip Morris International, Inc. 2.80%
7. GlaxoSmithKline PLC 2.73%
8. AbbVie, Inc. 2.69%
9. Dow Chemical Co. (The) 2.65%
10. BB&T Corp. 2.61%
The portfolio is actively managed and holdings are subject to change. There is no guarantee the Fundcontinues to invest in the securities referenced. The holdings listed exclude any temporary cashinvestments.
3 |

Average Annual Total Returns — November 30, 20164,5
Expense Ratios6
1 Year Life of Fund Gross Net
Class A (Inception 3/30/2012)NAV 9.26% 10.88% 1.60% 1.10%With 5.75% Maximum Sales Charge 2.99 9.48
Class C (Inception 3/30/2012)NAV 8.48 10.05 2.35 1.85With CDSC1 7.54 10.05
Class Y (Inception 3/30/2012)NAV 9.53 11.15 1.32 0.85
Comparative PerformanceS&P 500® Index2 8.06 12.41Russell 1000® Value Index3 12.02 12.75
Performance data shown represents past performance and is no guarantee of, and notnecessarily indicative of, future results. Total return and value will vary, and you may have again or loss when shares are sold. Current performance may be lower or higher than quoted.For most recent month-end performance, visit ngam.natixis.com/performance. Performance forother share classes will be greater or less than shown based on differences in fees and sales charges. Youmay not invest directly in an index. Performance for periods less than one year is cumulative, notannualized. Returns reflect changes in share price and reinvestment of dividends and capital gains, if any.The table(s) do not reflect taxes shareholders might owe on any fund distributions or when they redeemtheir shares.
1 Performance for Class C shares assumes a 1% contingent deferred sales charge (“CDSC”) applied when you sellshares within one year of purchase.
2 S&P 500® Index is a widely recognized measure of U.S. stock market performance. It is an unmanaged index of 500common stocks chosen for market size, liquidity, and industry group representation, among other factors.
3 Russell 1000® Value Index is an unmanaged index that measures the performance of the large-cap value segment ofthe U.S. equity universe. It includes those Russell 1000® companies with lower price-to-book ratios and lowerexpected growth values.
4 Fund performance has been increased by fee waivers and/or expense reimbursements, if any, without whichperformance would have been lower.
5 The Fund revised its investment strategy on October 15, 2014 and July 18, 2016; performance may have beendifferent had the current investment strategy been in place for all periods shown.
6 As of the most recent prospectus, the investment advisor has contractually agreed to waive fees and/or reimburseexpenses (with certain exceptions) once the expense cap of the Fund has been exceeded. This arrangement is set toexpire on 3/31/17. When an expense cap has not been exceeded, the fund may have similar expense ratios.
| 4

LOOMIS SAYLES GLOBAL GROWTH FUND
Manager: Symbols:Aziz V. Hamzaogullari, CFA® Class A LSAGXLoomis, Sayles & Company, L.P. Class C LSCGX
Class Y LSGGX
Investment GoalThe Fund’s investment goal is long-term growth of capital.
Market ConditionsAgainst a volatile backdrop, global equities advanced for the 12-month period, led by solidgains in the U.S. and emerging markets. Europe declined for the period, as economicgrowth and inflation remained weak. Japan advanced but underperformed the global equitymarket, as the nation continued to battle slow growth and threats of deflation.
Global stock markets struggled early in the period on fears of a U.S. recession, FederalReserve (Fed) rate hikes, U.S. dollar strength, a currency devaluation in China, and fallingoil and commodity prices. However, a rebound in oil and commodity prices inmid-February and an easing of Fed rate hike expectations helped restore investoroptimism, and stocks generally advanced until the Brexit vote in late June rattled thefinancial markets worldwide. The selloff was short-lived, though, as the prospect ofadditional central bank stimulus lured investors back into stocks. Emerging market stocksrallied sharply following the Brexit vote, as investors expected developing markets toremain relatively immune from any Brexit-related weakness.
Volatility resurfaced late in the period, primarily due to anxiety ahead of the U.S.presidential election, continued economic weakness outside the U.S., and Fed rate hikeuncertainty. However, U.S. stocks ended the period on an upbeat note, as Donald Trump’ssurprising presidential election victory sparked a market rally. Expectations for the Trumpadministration to implement a pro-growth agenda drove U.S. stocks and the U.S. dollarhigher.
Performance ResultsFor the period from March 31, 2016 (the fund’s inception date) through November 30,2016 (the fund’s fiscal year-end), Class A shares of Loomis Sayles Global Growth Fundreturned 5.30% at net asset value. The fund was in line with its benchmark, the MSCIACWI (Net), which returned 5.33%.
Explanation of Fund PerformanceThe fund’s positions in ARM Holdings, Adidas and Qualcomm contributed toperformance. Stock selection in the consumer discretionary, information technology,industrials and financials sectors, along with our weightings in information technology,contributed to relative performance. Among individual holdings, shares of UK-based ARMHoldings, the world’s leading semiconductor intellectual property (IP) supplier, were up
5 |

approximately 40% in July on news of the all-cash acquisition by Softbank Group. Similarto our long-term thesis, Softbank recognized the fundamental drivers for ARM remainrobust as it benefits from increased chip connectivity, complexity and chip architectureoutsourcing. Softbank also highlighted ARM’s rich ecosystem and innovative culture,which have allowed ARM to take market share and become dominant in the markets itenters. Softbank’s willingness to pay a greater-than-40% premium to a share price alreadynear an all-time high supported our assessment of ARM’s significant remaining upsidepotential. ARM Holdings became a privately held company when Softbank’s purchasebecame final on September 1, 2016, so the shares were effectively sold from the portfolio.
Germany-based Adidas, a leader in global sportswear, reported strong performance.Realignment of channel and brand management globally, along with new consumer-centricinnovation and marketing, spurred strong demand across categories, and Adidas reported itsbest first and second fiscal quarters in more than a decade during the period. Representingmore than 80% of sales, the Adidas brand posted double-digit revenue growth in strategicmarkets of Western Europe, North America, Greater China and Latin America. In theNorth America market, we believe Adidas took market share from Nike. The companyrecently decided to sell its golf hardware brands, including TaylorMade, with proceedsearmarked to strengthen the core business of sports footwear and apparel, which we believeis the right long-term strategy. Operating profit margins expanded, reflecting strongoperating leverage. On October 1, 2016, new CEO Kasper Rorsted succeeded long-timeCEO Herbert Hainer. One of two truly global sports footwear and apparel brands, webelieve Adidas has sustainable competitive advantages, such as brand, scale and distribution.
Qualcomm, a U.S.-based chip designer and manufacturer, consistently reported better-than-expected results in its technology licensing (QTL) and chip manufacturing (QCT)businesses. Broad progress in obtaining new technology licensing agreements and catch-uppayments from mobile device manufacturers in China powered revenue growth for the QTLbusiness. However, Qualcomm initiated legal proceedings against Meizu, the only top-tendevice maker yet to sign a licensing agreement. QTL margins were consistently 85% orbetter and generated approximately 80% of profits. The QCT business experienced strongperformance and market share gains in China as it pushed new technologies to all price tiersand generated strong growth in non-mobile chips. Delivering on a priority for the year,QCT margins rose to 17% from more recent single-digit levels. We believe embeddedmarket expectations for Qualcomm’s growth rate are below our estimates.
On the down side, positions in Novo Nordisk, Danone and Roche Holding were amongthe largest detractors. Stock selection in the healthcare, consumer staples and energysectors, along with our weightings in the financials, consumer staples, energy, healthcare,industrials and consumer discretionary sectors, detracted from relative performance. Interms of individual holdings, Novo Nordisk, a Denmark-based diabetes-focusedpharmaceutical company, reported fundamentally solid growth. Strong performance camefrom new-generation insulin therapy Tresiba and non-insulin anti-diabetic therapyVictoza. However, management issued lower-than-expected near-term guidance andmeaningfully lowered longer-term operating profit growth to 5% from 10%, citing near-term pricing pressure in the U.S., which accounts for approximately 50% of the company’s
| 6

LOOMIS SAYLES GLOBAL GROWTH FUND
sales. We continue to believe Novo’s competitive advantages of deep experience in diabetescare and therapeutic proteins, a robust infrastructure that took decades to build, efficientmanufacturing techniques, a robust pipeline and economies of scale would be very difficultto replicate. As a result, we believe Novo Nordisk has an unmatched ability to engineer,formulate, develop and deliver value-added treatments for unmet patient needs.
Danone, a global manufacturer and distributor of fresh dairy and healthy nutritionproducts, reported solid growth and margin expansion early in the period. However,weakness in the France-based company’s water and early life nutrition in China led torecent softer results. Danone saw success in its U.S. fresh dairy division where it hasbecome the leader across all segments of the yogurt market. Steps to restructure andsimplify the company’s cost base and reintroduce blockbuster products led to progress inthe European fresh dairy division, which had been affected by recession. In China, aneconomic-driven slowdown in the beverage industry led to near-term weak sales ofDanone’s Mizone product, and we believe a distribution channel shift in China’s infantmilk formula industry is also causing near-term disruptions. Danone announced theacquisition of WhiteWave Foods Company, a leader in plant-based drinking milk andorganic milk. We believe WhiteWave will benefit from Danone’s advisory relationshipswith retailers and its global scale and distribution. Overall, we believe the companycontinues to execute well in difficult times and that market expectations for key variables,such as revenue and profit growth, are well below our estimates.
Roche, a Switzerland-based biopharmaceutical and diagnostics company, reportedfundamentally sound performance, including steady growth from its leading cancertherapies Herceptin, Rituxan and Avastin, each of which grew sales in the mid-single digitsand accounted for slightly more than half of pharmaceutical revenues. However, Lucentis, atreatment for eye diseases, has been ceding share to Regeneron’s Eylea. Roche’s pipeline,which is among the broadest in the industry, includes new submissions, approvals andpotentially significant late-stage clinical products. The company remains solidly profitable,with operating margins holding relatively steady in the high 30% range. Earnings per shareslightly exceeded expectations. We believe Roche continues to execute well operationally,redeploying the cash flows from its still growing but mature core franchise to supportproduct extensions and innovation. We also believe the current market price embedsexpectations for key revenue and cash flow growth drivers that are well below our long-term assumptions.
OutlookOur investment process is characterized by bottom-up, fundamental research and a long-term investment time horizon. The nature of the process leads to a lower-turnoverportfolio in which sector positioning is the result of stock selection. The fund ended thequarter with overweight positions in the information technology, consumer staples,consumer discretionary and healthcare sectors and underweight positions in the financials,energy and industrials sectors. We did not own positions in the materials, real estate,telecommunication services and utilities sectors.
7 |

Hypothetical Growth of $10,000 Investment in Class A Shares3
March 31, 2016 (inception) through November 30, 2016
$5,000
$10,000
$15,000NAV With 5.75% Maximum Sales Charge
$10,531$9,926
$10,533
11/1603/16 04/16 05/16 06/16 07/16 08/16 09/16 10/16
MSCI ACWI (Net)2
Top ten holdings (as of 11/30/2016)
Security name% of
net assets
1. Alibaba Group Holding Ltd. 5.50%
2. Oracle Corp. 4.73%
3. Baidu, Inc. 4.18%
4. Amazon.com, Inc. 4.02%
5. Deere & Co. 3.96%
6. QUALCOMM, Inc. 3.87%
7. Novo Nordisk AS 3.76%
8. Yum China Holdings, Inc. 3.72%
9. Alphabet, Inc. 3.70%
10. Facebook, Inc. 3.66%
The portfolio is actively managed and holdings are subject to change. There is no guarantee the Fundcontinues to invest in the securities referenced. The holdings listed exclude any temporary cashinvestments.
See notes to chart on page 9.
| 8

LOOMIS SAYLES GLOBAL GROWTH FUND
Total Returns — November 30, 20163
Expense Ratios4
Life of Fund Gross Net
Class A (Inception 3/31/2016)NAV 5.30% 2.67% 1.30%With 5.75% Maximum Sales Charge -0.75
Class C (Inception 3/31/2016)NAV 4.70 3.42 2.05With CDSC1 3.70
Class Y (Inception 3/31/2016)NAV 5.50 2.42 1.05
Comparative PerformanceMSCI ACWI (Net)2 5.33
Performance data shown represents past performance and is no guarantee of, and notnecessarily indicative of, future results. Total return and value will vary, and you may have again or loss when shares are sold. Current performance may be lower or higher than quoted.For most recent month-end performance, visit ngam.natixis.com/performance. Performance forother share classes will be greater or less than shown based on differences in fees and sales charges. Youmay not invest directly in an index. Performance for periods less than one year is cumulative, notannualized. Returns reflect changes in share price and reinvestment of dividends and capital gains, if any.The table(s) do not reflect taxes shareholders might owe on any fund distributions or when they redeemtheir shares.
1 Performance for Class C shares assumes a 1% contingent deferred sales charge (“CDSC”) applied when you sellshares within one year of purchase.
2 The MSCI ACWI (Net) is a free float-adjusted market capitalization weighted index that is designed to measure theequity market performance of developed and emerging markets.
3 Fund performance has been increased by fee waivers and/or expense reimbursements, if any, without whichperformance would have been lower.
4 As of the most recent prospectus, the investment advisor has contractually agreed to waive fees and/or reimburseexpenses (with certain exceptions) once the expense cap of the Fund has been exceeded. This arrangement is set toexpire on 3/31/17. When an expense cap has not been exceeded, the fund may have similar expense ratios.
9 |

VAUGHAN NELSON SELECT FUND
Managers: Symbols:Dennis G. Alff, CFA® Class A VNSAXChad D. Fargason, PhD Class C VNSCXChris D. Wallis, CFA® Class Y VNSYXScott J. Weber, CFA®
Vaughan Nelson Investment Management, L.P.
Investment GoalThe Fund seeks long-term capital appreciation.
Market ConditionsDuring the year, volatility remained elevated as the market digested the United Kingdom’svote to leave the European Union (“Brexit”), Donald Trump’s successful campaign forPresident of the United States, and the Federal Reserve’s ability to raise interest rates.However, equity markets appreciated despite declining earnings expectations anddeteriorating international economic conditions. We believe the incremental multipleexpansion was driven by easy monetary conditions globally, by modest improvement ineconomic growth expectations throughout the year, and by foreign investors increasingportfolio allocations to U.S. equities post-Brexit.
Despite attractive gains in 2016, we believe equity markets might be in a state of unstableequilibrium given the significant structural changes that are occurring with central banks’monetary policies and U.S. government deficits in addition to an escalating number ofearnings headwinds. These include higher interest rates, a stronger U.S. dollar, risinghealthcare costs, and wage inflation pressures. In fact, corporate earnings expectationsdeclined for the fourth quarter of 2016 and for the full-year 2017, resulting in even richervaluation multiples as equity markets set new highs.
Performance ResultsFor the twelve months ended November 30, 2016, Class A shares of Vaughan NelsonSelect Fund returned 5.91% at net asset value. The fund underperformed its benchmark,the S&P 500® Index, which returned 8.06%.
Explanation of Fund PerformanceStock selection was a positive contributor, but sector allocation weighed on returns versusthe benchmark. Information technology and healthcare contributed the most to both thefund’s absolute and relative performance while cash, financials, and energy were the biggestdetractors.
Financials was the sector that detracted the most from performance. American Express andAmerican International Group (AIG) were the largest detractors in financials but wereoffset somewhat by the positive contribution from Citigroup. American Expressunderperformed largely due to the loss of its Costco portfolio, and the fund exited theposition due to the increasingly competitive nature of the end market. AIG
| 10

VAUGHAN NELSON SELECT FUND
underperformed due to softening fundamentals in the insurance market, and the fundexited the position as our confidence in management’s ability to execute their turnaroundplan declined.
Marathon Petroleum was the largest detractor in energy and from the portfolio overall in2016, other than cash. Marathon underperformed due to a weak refining environment thatreduced its capital advantage and ability to invest in its midstream assets. The fund exitedthe position due to concerns surrounding the timing of the company’s investment inhigher-value cash flow streams.
Michaels Companies was the primary detractor from other sectors amid a highlypromotional and generally weaker end market that has weighed on same-store sales.
Stock selection stood out as a positive driver in the information technology sector.Broadcom Limited and Texas Instruments were the largest contributors. Broadcomcontinued its strong fundamental performance on the back of solid execution in itsenterprise businesses and effective capital deployment through mergers and acquisitions.Texas Instruments was a strong contributor in 2016 as it continued to benefit from thelong-term secular tailwind of increasing amounts of semiconductor content throughout theeconomy, particularly in industrial and automotive.
Stock selection drove the positive performance in the healthcare sector, primarily due to thefund’s position in UnitedHealth. UnitedHealth has benefited from its scale within theindustry and the growth of its high-margin software and consultancy services. Thehealthcare sector’s performance was positive, despite Centene which was a detractor overall.This security was sold in November following the election, since changing or repealing theAffordable Care Act would likely have a negative impact on enrollment growth.
Individual stocks that were meaningful positive contributors to performance from othersectors include General Dynamics and Charter Communications.
The largest increase in weightings by sector was in consumer discretionary, driven primarilyby the purchases of Michaels Companies and Charter Communications.
The largest reduction in weightings by sector was in information technology. The declinewas due primarily to the sales of eBay and PayPal as well as profit taking in Microsoft.
OutlookThe U.S. presidential election has not caused us to change our view regarding portfoliopositioning or the opportunity set. We still believe that there is little room for profitmargins to improve and that interest rates cannot move materially higher without negativeconsequences. While we welcome a business-friendly administration, corporate tax reform,and more fiscal spending, we think that these conditions are necessary to hit next year’searnings estimates anyway. From here, the biggest fundamental impact to the economy andto asset prices is likely a renewal of animal spirits.
With corporate margins near all-time highs, labor markets tight, and benefit costs on therise, we do not believe top line growth will be sufficient to prevent further margin pressure.
11 |
With monetary stimulus nearly exhausted, we believe fiscal stimulus will be necessary notonly in the United States but internationally so that the macro imbalances can continue toadjust without creating excessive volatility. Our outlook has become more balanced, stock-specific, and not reflective of opportunities in specific industries, regions of the world, orbroader market indices.
As it relates to the intermediate to long-term outlook, we believe we are entering the finalstages of rebalancing the monetary bubble that has been accumulating in our financialmarkets for several decades. While the financial crisis was effective at eliminating excesseswithin our regulated banking systems, it pushed imbalances into the unregulated financialsystem and accentuated the imbalances that exist in international markets.
We continue to seek investments in companies that have better pricing power, lowerearnings variability, higher profitability, and stronger balance sheets than the broaderinvestment universe. We still do not favor any single industry or sector, and continue tolook for companies with the characteristics noted above that trade at attractive valuations.
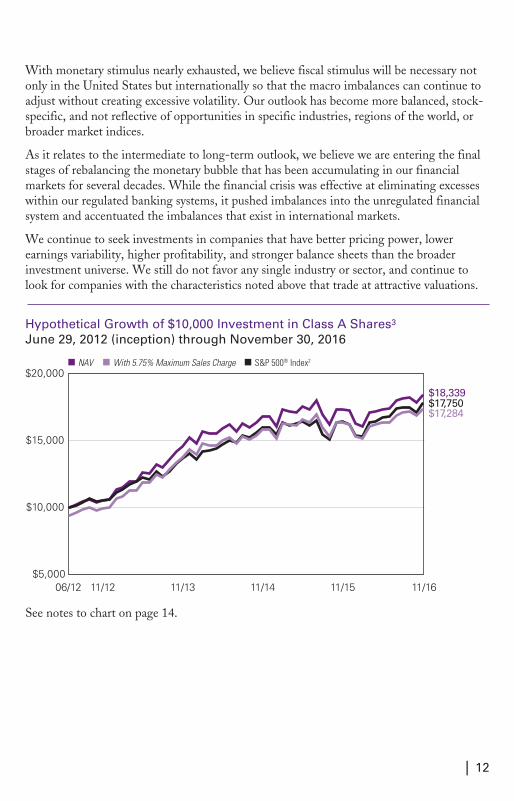
Hypothetical Growth of $10,000 Investment in Class A Shares3
June 29, 2012 (inception) through November 30, 2016
11/12 11/13 11/14 11/15 11/16$5,000
$10,000
$20,000NAV With 5.75% Maximum Sales Charge
$18,339
$17,284$17,750
06/12
S&P 500® Index2
$15,000
See notes to chart on page 14.
| 12

VAUGHAN NELSON SELECT FUND
Top ten holdings (as of 11/30/2016)
Security name% of
net assets
1. Alphabet, Inc. 5.78%
2. Walgreens Boots Alliance, Inc. 5.62%
3. General Dynamics Corp. 5.19%
4. UnitedHealth Group, Inc. 5.15%
5. Apple, Inc. 4.95%
6. Priceline Group, Inc. (The) 4.83%
7. Amsurg Corp. 4.77%
8. Citigroup, Inc. 4.55%
9. Charter Communications, Inc. 4.54%
10. Medtronic PLC 4.40%
The portfolio is actively managed and holdings are subject to change. There is no guarantee the Fundcontinues to invest in the securities referenced. The holdings listed exclude any temporary cashinvestments.
13 |
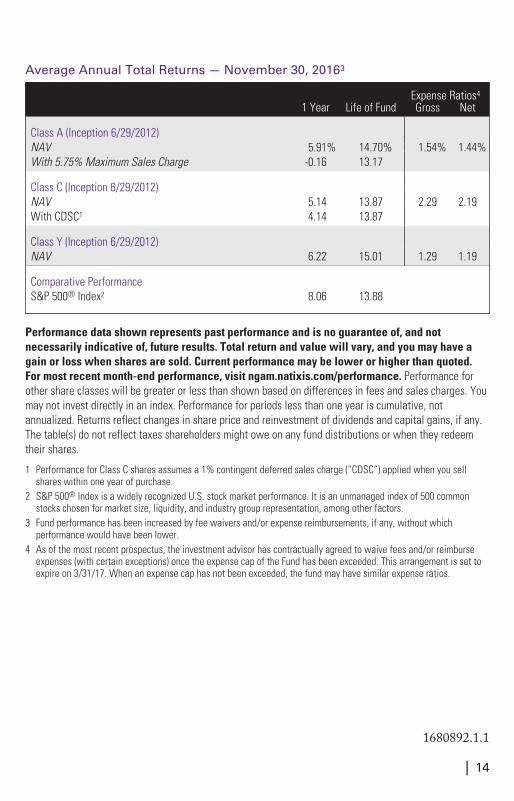
Average Annual Total Returns — November 30, 20163
Expense Ratios4
1 Year Life of Fund Gross Net
Class A (Inception 6/29/2012)NAV 5.91% 14.70% 1.54% 1.44%With 5.75% Maximum Sales Charge -0.16 13.17
Class C (Inception 6/29/2012)NAV 5.14 13.87 2.29 2.19With CDSC1 4.14 13.87
Class Y (Inception 6/29/2012)NAV 6.22 15.01 1.29 1.19
Comparative PerformanceS&P 500® Index2 8.06 13.88
Performance data shown represents past performance and is no guarantee of, and notnecessarily indicative of, future results. Total return and value will vary, and you may have again or loss when shares are sold. Current performance may be lower or higher than quoted.For most recent month-end performance, visit ngam.natixis.com/performance. Performance forother share classes will be greater or less than shown based on differences in fees and sales charges. Youmay not invest directly in an index. Performance for periods less than one year is cumulative, notannualized. Returns reflect changes in share price and reinvestment of dividends and capital gains, if any.The table(s) do not reflect taxes shareholders might owe on any fund distributions or when they redeemtheir shares.
1 Performance for Class C shares assumes a 1% contingent deferred sales charge (“CDSC”) applied when you sellshares within one year of purchase.
2 S&P 500® Index is a widely recognized U.S. stock market performance. It is an unmanaged index of 500 commonstocks chosen for market size, liquidity, and industry group representation, among other factors.
3 Fund performance has been increased by fee waivers and/or expense reimbursements, if any, without whichperformance would have been lower.
4 As of the most recent prospectus, the investment advisor has contractually agreed to waive fees and/or reimburseexpenses (with certain exceptions) once the expense cap of the Fund has been exceeded. This arrangement is set toexpire on 3/31/17. When an expense cap has not been exceeded, the fund may have similar expense ratios.
1680892.1.1
| 14

ADDITIONAL INFORMATION
The views expressed in this report reflect those of the portfolio managers as of the datesindicated. The managers’ views are subject to change at any time without notice based onchanges in market or other conditions. References to specific securities or industries shouldnot be regarded as investment advice. Because the Funds are actively managed, there is noassurance that they will continue to invest in the securities or industries mentioned.
All investing involves risk, including the risk of loss. There is no assurance that anyinvestment will meet its performance objectives or that losses will be avoided.
ADDITIONAL INDEX INFORMATIONThis document may contain references to third party copyrights, indexes, and trademarks,each of which is the property of its respective owner. Such owner is not affiliated withNatixis Global Asset Management or any of its related or affiliated companies (collectively“NGAM”) and does not sponsor, endorse or participate in the provision of any NGAMservices, funds or other financial products.
The index information contained herein is derived from third parties and is provided on an“as is” basis. The user of this information assumes the entire risk of use of this information.Each of the third party entities involved in compiling, computing or creating indexinformation, disclaims all warranties (including, without limitation, any warranties oforiginality, accuracy, completeness, timeliness, non-infringement, merchantability andfitness for a particular purpose) with respect to such information.
PROXY VOTING INFORMATIONA description of the Natixis Funds’ proxy voting policies and procedures is availablewithout charge, upon request, by calling Natixis Funds at 800-225-5478; on Natixis Funds’website at ngam.natixis.com; and on the Securities and Exchange Commission’s (SEC)website at www.sec.gov. Information regarding how Natixis Funds voted proxies relating toportfolio securities during the most recent 12-month period ended June 30 is availablefrom Natixis Funds’ website and the SEC’s website.
QUARTERLY PORTFOLIO SCHEDULESNatixis Funds file a complete schedule of portfolio holdings with the SEC for the first andthird quarters of each fiscal year on Form N-Q. The Funds’ Forms N-Q are available onthe SEC’s website at www.sec.gov and may be reviewed and copied at the SEC’s PublicReference Room in Washington, DC. Information on the operation of the PublicReference Room may be obtained by calling 800-SEC-0330.
15 |

UNDERSTANDING FUND EXPENSES
As a mutual fund shareholder, you incur different costs: transaction costs, including salescharges (loads) on purchases and contingent deferred sales charges on redemptions andongoing costs, including management fees, distribution and/or service fees (12b-1 fees),and other fund expenses. Certain exemptions may apply. These costs are described in moredetail in the Funds’ prospectus. The following examples are intended to help youunderstand the ongoing costs of investing in the Funds and help you compare these withthe ongoing costs of investing in other mutual funds.
The first line in the table of each class of Fund shares shows the actual account values andactual Fund expenses you would have paid on a $1,000 investment in the Fund fromJune 1, 2016 through November 30, 2016. To estimate the expenses you paid over theperiod, simply divide your account value by $1,000 (for example $8,600 account valuedivided by $1,000 = 8.60) and multiply the result by the number in the Expenses PaidDuring Period column as shown below for your class.
The second line in the table for each class of Fund shares provides information abouthypothetical account values and hypothetical expenses based on the Fund’s actual expenseratios and an assumed rate of return of 5% per year before expenses, which is not theFund’s actual return. The hypothetical account values and expenses may not be used toestimate the actual ending account balance or expenses you paid on your investment for theperiod. You may use this information to compare the ongoing costs of investing in eachFund and other funds. To do so, compare this 5% hypothetical example with the 5%hypothetical examples that appear in the shareholder reports of the other funds.
Please note that the expenses shown reflect ongoing costs only, and do not include anytransaction costs, such as sales charges. Therefore, the second line in the table of each Fundis useful in comparing ongoing costs only, and will not help you determine the relativecosts of owning different funds. If transaction costs were included, total costs would behigher.
LOOMIS SAYLES DIVIDEND INCOME FUND
BEGINNINGACCOUNT VALUE
6/1/2016
ENDINGACCOUNT VALUE
11/30/2016
EXPENSES PAIDDURING PERIOD*
6/1/2016 – 11/30/2016
Class A
Actual $1,000.00 $1,059.40 $5.77
Hypothetical (5% return before expenses) $1,000.00 $1,019.40 $5.65
Class C
Actual $1,000.00 $1,055.90 $9.61
Hypothetical (5% return before expenses) $1,000.00 $1,015.65 $9.42
Class Y
Actual $1,000.00 $1,061.70 $4.43
Hypothetical (5% return before expenses) $1,000.00 $1,020.70 $4.34
* Expenses are equal to the Fund’s annualized expense ratio (after waiver/reimbursement): 1.12%, 1.87% and0.86% for Class A, C and Y, respectively, multiplied by the average account value over the period, multiplied bythe number of days in the most recent fiscal half-year (183), divided by 366 (to reflect the half-year period).
| 16

LOOMIS SAYLES GLOBAL GROWTH FUND
BEGINNINGACCOUNT VALUE
6/1/2016
ENDINGACCOUNT VALUE
11/30/2016
EXPENSES PAIDDURING PERIOD*
6/1/2016 – 11/30/2016
Class A
Actual $1,000.00 $1,022.30 $6.57
Hypothetical (5% return before expenses) $1,000.00 $1,018.50 $6.56
Class C
Actual $1,000.00 $1,017.50 $10.34
Hypothetical (5% return before expenses) $1,000.00 $1,014.75 $10.33
Class Y
Actual $1,000.00 $1,023.30 $5.31
Hypothetical (5% return before expenses) $1,000.00 $1,019.75 $5.30
* Expenses are equal to the Fund’s annualized expense ratio (after waiver/reimbursement): 1.30%, 2.05% and1.05% for Class A, C and Y, respectively, multiplied by the average account value over the period, multiplied bythe number of days in the most recent fiscal half-year (183), divided by 366 (to reflect the half-year period).
VAUGHAN NELSON SELECT FUND
BEGINNINGACCOUNT VALUE
6/1/2016
ENDINGACCOUNT VALUE
11/30/2016
EXPENSES PAIDDURING PERIOD*
6/1/2016 – 11/30/2016
Class A
Actual $1,000.00 $1,059.20 $6.74
Hypothetical (5% return before expenses) $1,000.00 $1,018.45 $6.61
Class C
Actual $1,000.00 $1,055.40 $10.59
Hypothetical (5% return before expenses) $1,000.00 $1,014.70 $10.38
Class Y
Actual $1,000.00 $1,061.00 $5.46
Hypothetical (5% return before expenses) $1,000.00 $1,019.70 $5.35
* Expenses are equal to the Fund’s annualized expense ratio (after waiver/reimbursement): 1.31%, 2.06% and1.06% for Class A, C and Y, respectively, multiplied by the average account value over the period, multiplied bythe number of days in the most recent fiscal half-year (183), divided by 366 (to reflect the half-year period).
17 |
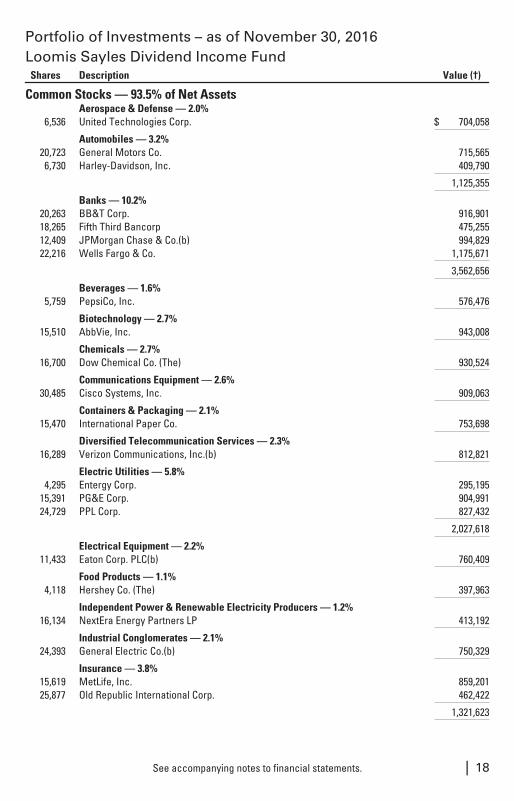
Portfolio of Investments – as of November 30, 2016Loomis Sayles Dividend Income Fund
Shares Description Value (†)
Common Stocks — 93.5% of Net AssetsAerospace & Defense — 2.0%
6,536 United Technologies Corp. $ 704,058
Automobiles — 3.2%20,723 General Motors Co. 715,5656,730 Harley-Davidson, Inc. 409,790
1,125,355
Banks — 10.2%20,263 BB&T Corp. 916,90118,265 Fifth Third Bancorp 475,25512,409 JPMorgan Chase & Co.(b) 994,82922,216 Wells Fargo & Co. 1,175,671
3,562,656
Beverages — 1.6%5,759 PepsiCo, Inc. 576,476
Biotechnology — 2.7%15,510 AbbVie, Inc. 943,008
Chemicals — 2.7%16,700 Dow Chemical Co. (The) 930,524
Communications Equipment — 2.6%30,485 Cisco Systems, Inc. 909,063
Containers & Packaging — 2.1%15,470 International Paper Co. 753,698
Diversified Telecommunication Services — 2.3%16,289 Verizon Communications, Inc.(b) 812,821
Electric Utilities — 5.8%4,295 Entergy Corp. 295,195
15,391 PG&E Corp. 904,99124,729 PPL Corp. 827,432
2,027,618
Electrical Equipment — 2.2%11,433 Eaton Corp. PLC(b) 760,409
Food Products — 1.1%4,118 Hershey Co. (The) 397,963
Independent Power & Renewable Electricity Producers — 1.2%16,134 NextEra Energy Partners LP 413,192
Industrial Conglomerates — 2.1%24,393 General Electric Co.(b) 750,329
Insurance — 3.8%15,619 MetLife, Inc. 859,20125,877 Old Republic International Corp. 462,422
1,321,623
See accompanying notes to financial statements. | 18

Portfolio of Investments – as of November 30, 2016Loomis Sayles Dividend Income Fund – (continued)
Shares Description Value (†)
Leisure Products — 1.1%12,635 Mattel, Inc. $ 398,887
Media — 0.9%3,704 Omnicom Group, Inc. 322,026
Multiline Retail — 1.4%9,295 Kohl’s Corp. 500,350
Oil, Gas & Consumable Fuels — 8.8%7,861 Chevron Corp.(b) 876,973
10,420 Energy Transfer Partners LP 365,95111,985 MPLX LP 393,70721,701 PBF Energy, Inc., Class A 520,60716,899 Royal Dutch Shell PLC, B Shares, Sponsored ADR 915,419
3,072,657
Pharmaceuticals — 9.2%25,365 GlaxoSmithKline PLC, Sponsored ADR 958,54312,179 Merck & Co., Inc. 745,23331,199 Pfizer, Inc.(b) 1,002,73612,930 Sanofi, Sponsored ADR 519,786
3,226,298
REITs – Diversified — 3.8%28,098 Outfront Media, Inc. 708,35120,387 Weyerhaeuser Co. 628,531
1,336,882
REITs – Hotels — 4.4%42,267 Host Hotels & Resorts, Inc. 754,04313,135 Ryman Hospitality Properties, Inc. 773,652
1,527,695
Road & Rail — 2.2%7,100 Norfolk Southern Corp. 755,866
Semiconductors & Semiconductor Equipment — 2.8%14,673 QUALCOMM, Inc. 999,671
Software — 3.0%17,320 Microsoft Corp. 1,043,703
Technology Hardware, Storage & Peripherals — 1.7%5,432 Apple, Inc. 600,345
Tobacco — 4.9%6,909 British American Tobacco PLC, Sponsored ADR 753,357
11,121 Philip Morris International, Inc.(b) 981,762
1,735,119
Transportation Infrastructure — 2.0%8,662 Macquarie Infrastructure Corp. 709,764
Wireless Telecommunication Services — 1.7%23,997 Vodafone Group PLC, Sponsored ADR 586,487
Total Common Stocks(Identified Cost $30,533,464) 32,804,543
See accompanying notes to financial statements.19 |
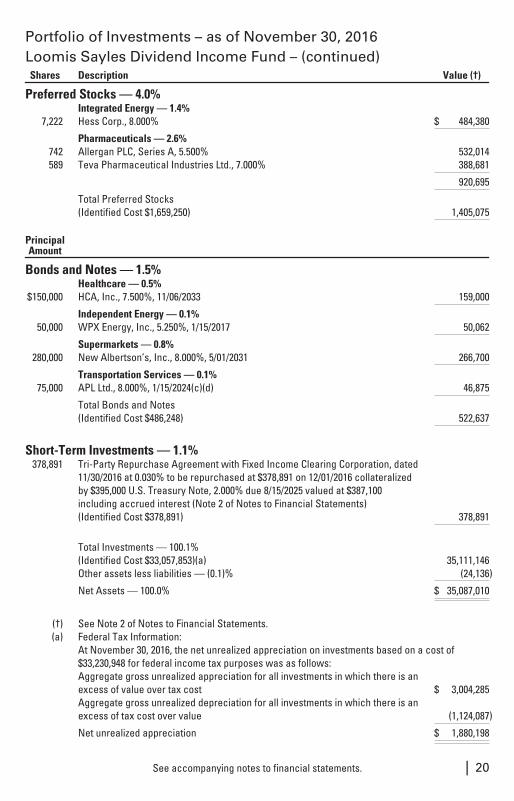
Portfolio of Investments – as of November 30, 2016Loomis Sayles Dividend Income Fund – (continued)Shares Description Value (†)
Preferred Stocks — 4.0%Integrated Energy — 1.4%
7,222 Hess Corp., 8.000% $ 484,380
Pharmaceuticals — 2.6%742 Allergan PLC, Series A, 5.500% 532,014589 Teva Pharmaceutical Industries Ltd., 7.000% 388,681
920,695
Total Preferred Stocks(Identified Cost $1,659,250) 1,405,075
PrincipalAmount
Bonds and Notes — 1.5%Healthcare — 0.5%
$150,000 HCA, Inc., 7.500%, 11/06/2033 159,000
Independent Energy — 0.1%50,000 WPX Energy, Inc., 5.250%, 1/15/2017 50,062
Supermarkets — 0.8%280,000 New Albertson’s, Inc., 8.000%, 5/01/2031 266,700
Transportation Services — 0.1%75,000 APL Ltd., 8.000%, 1/15/2024(c)(d) 46,875
Total Bonds and Notes(Identified Cost $486,248) 522,637
Short-Term Investments — 1.1%378,891 Tri-Party Repurchase Agreement with Fixed Income Clearing Corporation, dated
11/30/2016 at 0.030% to be repurchased at $378,891 on 12/01/2016 collateralizedby $395,000 U.S. Treasury Note, 2.000% due 8/15/2025 valued at $387,100including accrued interest (Note 2 of Notes to Financial Statements)(Identified Cost $378,891) 378,891
Total Investments — 100.1%(Identified Cost $33,057,853)(a) 35,111,146Other assets less liabilities — (0.1)% (24,136)
Net Assets — 100.0% $ 35,087,010
(†) See Note 2 of Notes to Financial Statements.(a) Federal Tax Information:
At November 30, 2016, the net unrealized appreciation on investments based on a cost of$33,230,948 for federal income tax purposes was as follows:Aggregate gross unrealized appreciation for all investments in which there is anexcess of value over tax cost $ 3,004,285Aggregate gross unrealized depreciation for all investments in which there is anexcess of tax cost over value (1,124,087)
Net unrealized appreciation $ 1,880,198
See accompanying notes to financial statements. | 20

Portfolio of Investments – as of November 30, 2016Loomis Sayles Dividend Income Fund – (continued)
(b) Security (or a portion thereof) has been pledged as collateral for potentialderivative contracts.
(c) Illiquid security. (Unaudited)(d) Securities classified as fair valued pursuant to the Fund’s pricing policies and
procedures. At November 30, 2016, the value of this security amounted to $46,875 or0.1% of net assets. See Note 2 of Notes to Financial Statements.
ADR An American Depositary Receipt is a certificate issued by a custodian bankrepresenting the right to receive securities of the foreign issuer described. Thevalues of ADRs may be significantly influenced by trading on exchanges notlocated in the United States.
REITs Real Estate Investment Trusts
Industry Summary at November 30, 2016
Pharmaceuticals 11.8%Banks 10.2Oil, Gas & Consumable Fuels 8.8Electric Utilities 5.8Tobacco 4.9REITs - Hotels 4.4REITs - Diversified 3.8Insurance 3.8Automobiles 3.2Software 3.0Semiconductors & Semiconductor
Equipment 2.8Biotechnology 2.7Chemicals 2.7Communications Equipment 2.6Diversified Telecommunication Services 2.3Electrical Equipment 2.2Road & Rail 2.2Containers & Packaging 2.1Industrial Conglomerates 2.1Transportation Infrastructure 2.0Aerospace & Defense 2.0Other Investments, less than 2% each 13.6Short-Term Investments 1.1
Total Investments 100.1Other assets less liabilities (0.1)
Net Assets 100.0%
See accompanying notes to financial statements.21 |

Portfolio of Investments – as of November 30, 2016Loomis Sayles Global Growth Fund
Shares Description Value (†)
Common Stocks — 100.1% of Net AssetsArgentina — 2.9%
1,839 MercadoLibre, Inc. $ 290,231
Brazil — 1.8%21,180 Companhia Brasileira de Meios de Pagamento 185,759
China — 9.7%5,855 Alibaba Group Holding Ltd., Sponsored ADR(b) 550,4872,505 Baidu, Inc., Sponsored ADR(b) 418,210
968,697
Denmark — 3.8%11,165 Novo Nordisk AS, Class B 376,038
France — 5.9%5,378 Danone 336,8512,354 Sodexo S.A. 257,105
593,956
Germany — 2.3%1,569 Adidas AG 231,166
Ireland — 2.9%15,168 Experian PLC 285,903
Italy — 1.4%38,800 Prada SpA 137,257
Sweden — 1.4%17,102 Elekta AB, Class B 141,156
Switzerland — 7.7%3,098 Nestle S.A., (Registered) 208,4913,746 Novartis AG, (Registered) 258,1811,383 Roche Holding AG 307,816
774,488
United Kingdom — 3.2%6,352 Diageo PLC 158,8174,114 Unilever NV 164,024
322,841
United States — 57.1%477 Alphabet, Inc., Class A(b) 370,095536 Amazon.com, Inc.(b) 402,306
3,382 American Express Co. 243,6396,447 Coca-Cola Co. (The) 260,1363,498 Colgate-Palmolive Co. 228,175
755 Core Laboratories NV 84,3793,954 Deere & Co. 396,1913,297 Expeditors International of Washington, Inc. 173,8843,091 Facebook, Inc., Class A(b) 366,0364,331 Microsoft Corp. 260,986
11,795 Oracle Corp. 474,0413,681 Procter & Gamble Co. (The) 303,535
See accompanying notes to financial statements. | 22
Portfolio of Investments – as of November 30, 2016Loomis Sayles Global Growth Fund – (continued)
Shares Description Value (†)
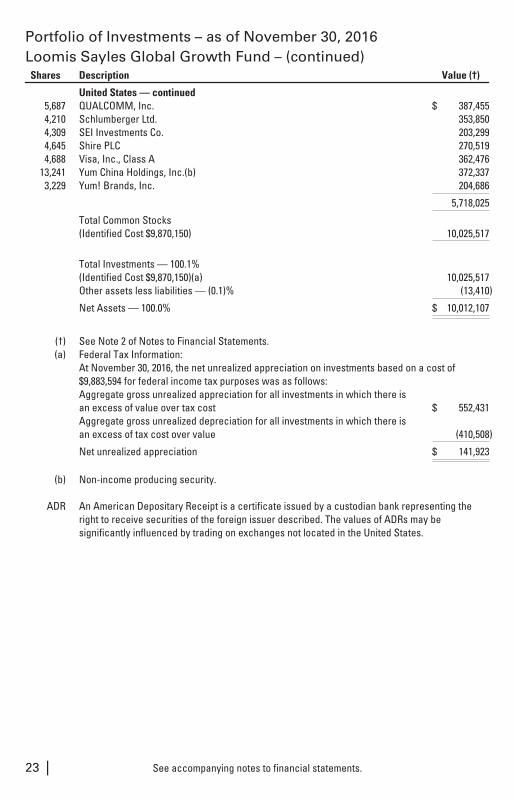
United States — continued5,687 QUALCOMM, Inc. $ 387,4554,210 Schlumberger Ltd. 353,8504,309 SEI Investments Co. 203,2994,645 Shire PLC 270,5194,688 Visa, Inc., Class A 362,476
13,241 Yum China Holdings, Inc.(b) 372,3373,229 Yum! Brands, Inc. 204,686
5,718,025
Total Common Stocks(Identified Cost $9,870,150) 10,025,517
Total Investments — 100.1%(Identified Cost $9,870,150)(a) 10,025,517Other assets less liabilities — (0.1)% (13,410)
Net Assets — 100.0% $ 10,012,107
(†) See Note 2 of Notes to Financial Statements.(a) Federal Tax Information:
At November 30, 2016, the net unrealized appreciation on investments based on a cost of$9,883,594 for federal income tax purposes was as follows:Aggregate gross unrealized appreciation for all investments in which there isan excess of value over tax cost $ 552,431Aggregate gross unrealized depreciation for all investments in which there isan excess of tax cost over value (410,508)
Net unrealized appreciation $ 141,923
(b) Non-income producing security.
ADR An American Depositary Receipt is a certificate issued by a custodian bank representing theright to receive securities of the foreign issuer described. The values of ADRs may besignificantly influenced by trading on exchanges not located in the United States.
See accompanying notes to financial statements.23 |

Portfolio of Investments – as of November 30, 2016Loomis Sayles Global Growth Fund – (continued)
Industry Summary at November 30, 2016
Internet Software & Services 20.0%Pharmaceuticals 9.4Hotels, Restaurants & Leisure 8.4Software 7.3IT Services 5.4Food Products 5.4Household Products 5.3Energy Equipment & Services 4.4Beverages 4.2Internet & Direct Marketing Retail 4.0Machinery 4.0Semiconductors & Semiconductor
Equipment 3.9Textiles, Apparel & Luxury Goods 3.7Professional Services 2.9Biotechnology 2.7Consumer Finance 2.4Capital Markets 2.0Other Investments, less than 2% each 4.7
Total Investments 100.1Other assets less liabilities (0.1)
Net Assets 100.0%
Currency Exposure Summary at November 30, 2016
United States Dollar 67.0%Euro 9.8Swiss Franc 7.7British Pound 7.2Danish Krone 3.8Other, less than 2% each 4.6
Total Investments 100.1Other assets less liabilities (0.1)
Net Assets 100.0%
See accompanying notes to financial statements. | 24

Portfolio of Investments – as of November 30, 2016Vaughan Nelson Select Fund
Shares Description Value (†)
Common Stocks — 90.4% of Net AssetsAerospace & Defense — 5.2%
39,225 General Dynamics Corp. $ 6,878,104
Auto Components — 2.8%57,725 Delphi Automotive PLC 3,694,400
Banks — 7.1%106,925 Citigroup, Inc. 6,029,50163,500 Wells Fargo & Co. 3,360,420
9,389,921
Capital Markets — 1.8%23,025 Moody’s Corp. 2,314,013
Diversified Financial Services — 2.4%20,375 Berkshire Hathaway, Inc., Class B(b) 3,207,840
Food & Staples Retailing — 5.6%87,925 Walgreens Boots Alliance, Inc. 7,449,885
Health Care Equipment & Supplies — 4.4%79,900 Medtronic PLC 5,833,499
Health Care Providers & Services — 10.9%92,825 Amsurg Corp.(b) 6,323,23918,900 HCA Holdings, Inc.(b) 1,339,82143,125 UnitedHealth Group, Inc. 6,827,550
14,490,610
Industrial Conglomerates — 3.8%44,675 Honeywell International, Inc. 5,090,269
Insurance — 1.9%50,800 Arthur J. Gallagher & Co. 2,557,780
Internet & Direct Marketing Retail — 4.8%4,260 Priceline Group, Inc. (The)(b) 6,405,677
Internet Software & Services — 6.6%1,400 Alphabet, Inc., Class A(b) 1,086,232
10,110 Alphabet, Inc., Class C(b) 7,663,784
8,750,016
IT Services — 3.4%49,400 Broadridge Financial Solutions, Inc. 3,198,15612,700 MasterCard, Inc., Class A 1,297,940
4,496,096
Life Sciences Tools & Services — 2.6%24,700 Thermo Fisher Scientific, Inc. 3,460,717
Media — 4.5%21,868 Charter Communications, Inc., Class A(b) 6,020,479
Oil, Gas & Consumable Fuels — 2.6%131,775 Enterprise Products Partners LP 3,416,926
See accompanying notes to financial statements.25 |

Portfolio of Investments – as of November 30, 2016Vaughan Nelson Select Fund – (continued)
Shares Description Value (†)
Semiconductors & Semiconductor Equipment — 6.2%21,525 Broadcom Ltd. $ 3,669,79761,975 Texas Instruments, Inc. 4,581,812
8,251,609
Software — 4.4%95,750 Microsoft Corp. 5,769,895
Specialty Retail — 4.4%238,800 Michaels Cos., Inc. (The)(b) 5,821,944
Technology Hardware, Storage & Peripherals — 5.0%59,325 Apple, Inc. 6,556,599
Total Common Stocks(Identified Cost $105,232,945) 119,856,279
PrincipalAmount
Short-Term Investments — 10.6%$14,033,310 Tri-Party Repurchase Agreement with Fixed Income Clearing Corporation,
dated 11/30/2016 at 0.030% to be repurchased at $14,033,322 on 12/01/2016collateralized by $14,555,000 U.S. Treasury Note, 2.000% due 2/15/2025 valuedat $14,318,481 including accrued interest (Note 2 of Notes to FinancialStatements) (Identified Cost $14,033,310) 14,033,310
Total Investments — 101.0%(Identified Cost $119,266,255)(a) 133,889,589Other assets less liabilities — (1.0)% (1,371,575)
Net Assets — 100.0% $ 132,518,014
(†) See Note 2 of Notes to Financial Statements.(a) Federal Tax Information:
At November 30, 2016, the net unrealized appreciation on investments based on a cost of$119,372,454 for federal income tax purposes was as follows:Aggregate gross unrealized appreciation for all investments in which there isan excess of value over tax cost $ 15,682,099Aggregate gross unrealized depreciation for all investments in which there isan excess of tax cost over value (1,164,964)
Net unrealized appreciation $ 14,517,135
(b) Non-income producing security.
See accompanying notes to financial statements. | 26

Portfolio of Investments – as of November 30, 2016Vaughan Nelson Select Fund – (continued)
Industry Summary at November 30, 2016
Health Care Providers & Services 10.9%Banks 7.1Internet Software & Services 6.6Semiconductors & Semiconductor
Equipment 6.2Food & Staples Retailing 5.6Aerospace & Defense 5.2Technology Hardware, Storage &
Peripherals 5.0Internet & Direct Marketing Retail 4.8Media 4.5Health Care Equipment & Supplies 4.4Specialty Retail 4.4Software 4.4Industrial Conglomerates 3.8IT Services 3.4Auto Components 2.8Life Sciences Tools & Services 2.6Oil, Gas & Consumable Fuels 2.6Diversified Financial Services 2.4Other Investments, less than 2% each 3.7Short-Term Investments 10.6
Total Investments 101.0Other assets less liabilities (1.0)
Net Assets 100.0%
See accompanying notes to financial statements.27 |
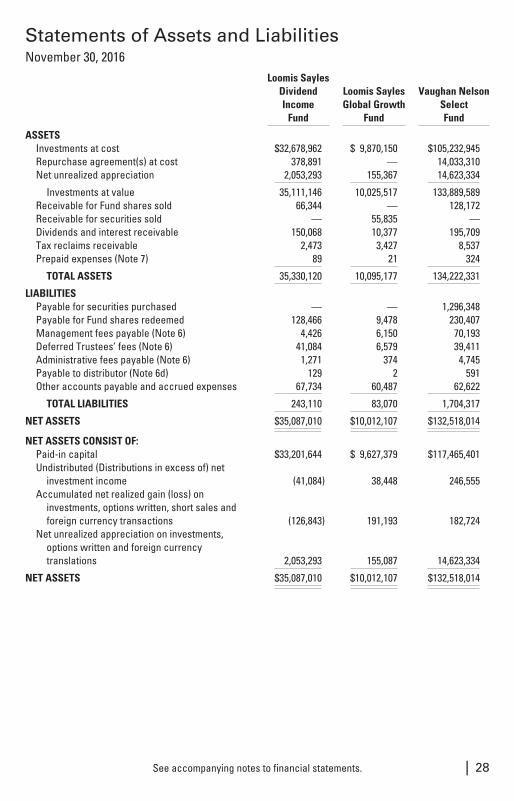
Statements of Assets and LiabilitiesNovember 30, 2016
Loomis SaylesDividendIncome
Fund
Loomis SaylesGlobal Growth
Fund
Vaughan NelsonSelectFund
ASSETSInvestments at cost $32,678,962 $ 9,870,150 $105,232,945Repurchase agreement(s) at cost 378,891 — 14,033,310Net unrealized appreciation 2,053,293 155,367 14,623,334
Investments at value 35,111,146 10,025,517 133,889,589Receivable for Fund shares sold 66,344 — 128,172Receivable for securities sold — 55,835 —Dividends and interest receivable 150,068 10,377 195,709Tax reclaims receivable 2,473 3,427 8,537Prepaid expenses (Note 7) 89 21 324
TOTAL ASSETS 35,330,120 10,095,177 134,222,331
LIABILITIESPayable for securities purchased — — 1,296,348Payable for Fund shares redeemed 128,466 9,478 230,407Management fees payable (Note 6) 4,426 6,150 70,193Deferred Trustees’ fees (Note 6) 41,084 6,579 39,411Administrative fees payable (Note 6) 1,271 374 4,745Payable to distributor (Note 6d) 129 2 591Other accounts payable and accrued expenses 67,734 60,487 62,622
TOTAL LIABILITIES 243,110 83,070 1,704,317
NET ASSETS $35,087,010 $10,012,107 $132,518,014
NET ASSETS CONSIST OF:Paid-in capital $33,201,644 $ 9,627,379 $117,465,401Undistributed (Distributions in excess of) net
investment income (41,084) 38,448 246,555Accumulated net realized gain (loss) on
investments, options written, short sales andforeign currency transactions (126,843) 191,193 182,724
Net unrealized appreciation on investments,options written and foreign currencytranslations 2,053,293 155,087 14,623,334
NET ASSETS $35,087,010 $10,012,107 $132,518,014
See accompanying notes to financial statements. | 28

Statements of Assets and Liabilities (continued)November 30, 2016
Loomis SaylesDividendIncome
Fund
Loomis SaylesGlobal Growth
Fund
Vaughan NelsonSelectFund
COMPUTATION OF NET ASSET VALUE ANDOFFERING PRICE:Class A shares:
Net assets $14,236,351 $ 194,668 $ 20,501,841
Shares of beneficial interest 1,330,073 18,482 1,332,646
Net asset value and redemption price per share $ 10.70 $ 10.53 $ 15.38
Offering price per share (100/94.25 of net assetvalue) (Note 1) $ 11.35 $ 11.17 $ 16.32
Class C shares: (redemption price per share isequal to net asset value less any applicablecontingent deferred sales charge) (Note 1)Net assets $ 5,505,462 $ 24,611 $ 7,692,624
Shares of beneficial interest 516,947 2,350 517,336
Net asset value and offering price per share $ 10.65 $ 10.47 $ 14.87
Class Y shares:Net assets $15,345,197 $9,792,828 $104,323,549
Shares of beneficial interest 1,432,651 927,838 6,740,655
Net asset value, offering and redemption priceper share $ 10.71 $ 10.55 $ 15.48
See accompanying notes to financial statements.29 |

Statements of OperationsFor the Year Ended November 30, 2016
Loomis SaylesDividendIncome
Fund
Loomis SaylesGlobal Growth
Fund(a)
Vaughan NelsonSelectFund
INVESTMENT INCOMEInterest $ 123,746 $ 54 $ 11,516Dividends 1,299,125 92,882 1,712,571Less net foreign taxes withheld (9,495) (4,697) —
1,413,376 88,239 1,724,087
ExpensesManagement fees (Note 6) 185,564 47,321 965,843Service and distribution fees (Note 6) 79,498 331 122,492Administrative fees (Note 6) 13,702 2,624 50,337Trustees’ fees and expenses (Note 6) 20,174 12,948 21,965Transfer agent fees and expenses (Note 6) 25,016 2,323 68,559Audit and tax services fees 52,417 31,131 42,322Custodian fees and expenses 8,542 23,221 5,439Legal fees 480 88 1,826Registration fees 58,111 22,929 68,308Shareholder reporting expenses 14,568 778 30,558Dividend expenses on securities sold short (Note 2) — — 3,473Miscellaneous expenses (Note 7) 10,401 7,202 15,717
Total expenses 468,473 150,896 1,396,839Less waiver and/or expense reimbursement (Note 6) (109,507) (88,415) (34,582)
Net expenses 358,966 62,481 1,362,257
Net investment income 1,054,410 25,758 361,830
NET REALIZED AND UNREALIZED GAIN (LOSS) ONINVESTMENTS, OPTIONS WRITTEN, SHORT SALES ANDFOREIGN CURRENCY TRANSACTIONSNet realized gain (loss) on:
Investments (311,419) 191,193 2,408,742Options written 75,153 — 28,382Short sales — — (205,764)Foreign currency transactions (497) (2,928) —
Net change in unrealized appreciation (depreciation) on:Investments 2,091,920 155,367 4,866,123Options written 2,840 — —Foreign currency translations 75 (280) —
Net realized and unrealized gain on investments, optionswritten, short sales and foreign currency transactions 1,858,072 343,352 7,097,483
NET INCREASE IN NET ASSETS RESULTING FROMOPERATIONS $2,912,482 $369,110 $7,459,313
(a) From commencement of operations on March 31, 2016 through November 30, 2016.
See accompanying notes to financial statements. | 30

Statements of Changes in Net Assets
Loomis Sayles DividendIncome Fund
Year EndedNovember 30,
2016
Year EndedNovember 30,
2015
FROM OPERATIONS:Net investment income $ 1,054,410 $ 802,734Net realized gain (loss) on investments, options written, short sales and
foreign currency transactions (236,763) 2,575,880Net change in unrealized appreciation (depreciation) on investments,
options written and foreign currency translations 2,094,835 (3,560,452)
Net increase (decrease) in net assets resulting from operations 2,912,482 (181,838)
FROM DISTRIBUTIONS TO SHAREHOLDERS:Net investment income
Class A (407,643) (265,753)Class C (115,022) (60,988)Class Y (467,159) (476,800)
Net realized capital gainsClass A (1,185,173) (641,542)Class C (394,480) (149,568)Class Y (1,110,516) (1,904,100)
Total distributions (3,679,993) (3,498,751)
NET INCREASE (DECREASE) IN NET ASSETS FROM CAPITAL SHARETRANSACTIONS (NOTE 11) 10,194,133 (2,489,180)
Net increase (decrease) in net assets 9,426,622 (6,169,769)NET ASSETS
Beginning of the year 25,660,388 31,830,157
End of the year $35,087,010 $25,660,388
UNDISTRIBUTED (DISTRIBUTIONS IN EXCESS OF) NET INVESTMENTINCOME $ (41,084) $ 87,741
See accompanying notes to financial statements.31 |

Statements of Changes in Net Assets (continued)
Loomis Sayles GlobalGrowth Fund Vaughan Nelson Select Fund
Period EndedNovember 30,
2016(a)
Year EndedNovember 30,
2016
Year EndedNovember 30,
2015
$ 25,758 $ 361,830 $ 174,518
188,265 2,231,360 (15,601)
155,087 4,866,123 2,853,568
369,110 7,459,313 3,012,485
— (1,415) —— — —— (164,168) (32,110)
— (323,130) (332,805)— (128,464) (93,986)— (1,592,857) (1,659,885)
— (2,210,034) (2,118,786)
9,642,997 27,384,829 30,758,176
10,012,107 32,634,108 31,651,875
— 99,883,906 68,232,031
$10,012,107 $132,518,014 $99,883,906
$ 38,448 $ 246,555 $ 134,976
(a) From commencement of operations on March 31, 2016 through November 30, 2016.
See accompanying notes to financial statements. | 32

Financial HighlightsFor a share outstanding throughout each period.
Loomis Sayles Dividend Income Fund—Class A
Year EndedNovember 30,
2016
Year EndedNovember 30,
2015
Year EndedNovember 30,
2014
Year EndedNovember 30,
2013
Period EndedNovember 30,
2012*
Net asset value, beginning ofthe period $ 11.35 $ 13.02 $12.87 $10.43 $10.00
INCOME (LOSS) FROMINVESTMENT OPERATIONS:
Net investment income(a) 0.35 0.34 0.51(b) 0.32 0.25(c)Net realized and unrealized
gain (loss) 0.53 (0.58) 0.91 2.47 0.34
Total from InvestmentOperations 0.88 (0.24) 1.42 2.79 0.59
LESS DISTRIBUTIONS FROM:Net investment income (0.34) (0.33) (0.50) (0.33) (0.16)Net realized capital gains (1.19) (1.10) (0.77) (0.02) —
Total Distributions (1.53) (1.43) (1.27) (0.35) (0.16)
Net asset value, end of theperiod $ 10.70 $ 11.35 $13.02 $12.87 $10.43
Total return(d)(e) 9.26% (1.89)% 11.95%(b) 27.35% 6.01%(c)(f)RATIOS TO AVERAGE NET
ASSETS:Net assets, end of the period
(000’s) $14,236 $11,329 $7,569 $5,978 $2,691Net expenses(g) 1.16%(h) 1.20% 1.20% 1.20% 1.20%(i)Gross expenses 1.51% 1.60% 1.67% 1.55% 1.74%(i)Net investment income 3.46% 2.96% 4.03%(b) 2.70% 3.67%(c)(i)Portfolio turnover rate 35% 51% 65% 45% 14%
* From commencement of operations on March 30, 2012 through November 30, 2012.(a) Per share net investment income has been calculated using the average shares outstanding during the
period.(b) Includes non-recurring dividends. Without these dividends, net investment income per share would have
been $0.33, total return would have been 10.53% and the ratio of net investment income to average netassets would have been 2.63%.
(c) Includes a non-recurring dividend. Without this dividend, net investment income per share would havebeen $0.23, total return would have been 5.71% and the ratio of net investment income to average netassets would have been 3.31%.
(d) A sales charge for Class A shares is not reflected in total return calculations.(e) Had certain expenses not been waived/reimbursed during the period, total returns would have been
lower.(f) Periods less than one year are not annualized.(g) The investment adviser agreed to waive its fees and/or reimburse a portion of the Fund’s expenses
during the period. Without this waiver/reimbursement, expenses would have been higher.(h) Effective July 1, 2016, the expense limit decreased from 1.20% to 1.10%.(i) Computed on an annualized basis for periods less than one year.
See accompanying notes to financial statements.33 |

Financial Highlights (continued)For a share outstanding throughout each period.
Loomis Sayles Dividend Income Fund—Class C
Year EndedNovember 30,
2016
Year EndedNovember 30,
2015
Year EndedNovember 30,
2014
Year EndedNovember 30,
2013
Period EndedNovember 30,
2012*
Net asset value, beginning ofthe period $11.30 $12.98 $12.81 $10.42 $10.00
INCOME (LOSS) FROMINVESTMENT OPERATIONS:
Net investment income(a) 0.27 0.26 0.44(b) 0.25 0.20(c)Net realized and unrealized
gain (loss) 0.53 (0.58) 0.89 2.45 0.34
Total from InvestmentOperations 0.80 (0.32) 1.33 2.70 0.54
LESS DISTRIBUTIONS FROM:Net investment income (0.26) (0.26) (0.39) (0.29) (0.12)Net realized capital gains (1.19) (1.10) (0.77) (0.02) —
Total Distributions (1.45) (1.36) (1.16) (0.31) (0.12)
Net asset value, end of theperiod $10.65 $11.30 $12.98 $12.81 $10.42
Total return(d)(e) 8.48% (2.64)% 11.14%(b) 26.40% 5.44%(c)(f)RATIOS TO AVERAGE NET
ASSETS:Net assets, end of the period
(000’s) $5,505 $3,744 $1,716 $5,260 $ 61Net expenses(g) 1.90%(h) 1.95% 1.95% 1.95% 1.95%(i)Gross expenses 2.26% 2.35% 2.42% 2.21% 2.53%(i)Net investment income 2.68% 2.21% 3.54%(b) 2.03% 3.01%(c)(i)Portfolio turnover rate 35% 51% 65% 45% 14%
* From commencement of operations on March 30, 2012 through November 30, 2012.(a) Per share net investment income has been calculated using the average shares outstanding during the
period.(b) Includes non-recurring dividends. Without these dividends, net investment income per share would have
been $0.21, total return would have been 9.71% and the ratio of net investment income to average netassets would have been 1.70%.
(c) Includes a non-recurring dividend. Without this dividend, net investment income per share would havebeen $0.17, total return would have been 5.14% and the ratio of net investment income to average netassets would have been 2.53%.
(d) A contingent deferred sales charge for Class C shares is not reflected in total return calculations.(e) Had certain expenses not been waived/reimbursed during the period, total returns would have been
lower.(f) Periods less than one year are not annualized.(g) The investment adviser agreed to waive its fees and/or reimburse a portion of the Fund’s expenses
during the period. Without this waiver/reimbursement, expenses would have been higher.(h) Effective July 1, 2016, the expense limit decreased from 1.95% to 1.85%.(i) Computed on an annualized basis for periods less than one year.
See accompanying notes to financial statements. | 34
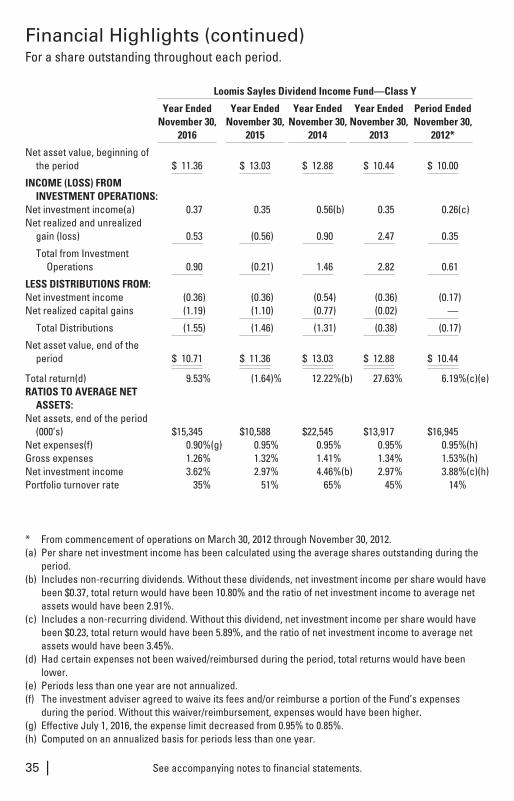
Financial Highlights (continued)For a share outstanding throughout each period.
Loomis Sayles Dividend Income Fund—Class Y
Year EndedNovember 30,
2016
Year EndedNovember 30,
2015
Year EndedNovember 30,
2014
Year EndedNovember 30,
2013
Period EndedNovember 30,
2012*
Net asset value, beginning ofthe period $ 11.36 $ 13.03 $ 12.88 $ 10.44 $ 10.00
INCOME (LOSS) FROMINVESTMENT OPERATIONS:
Net investment income(a) 0.37 0.35 0.56(b) 0.35 0.26(c)Net realized and unrealized
gain (loss) 0.53 (0.56) 0.90 2.47 0.35
Total from InvestmentOperations 0.90 (0.21) 1.46 2.82 0.61
LESS DISTRIBUTIONS FROM:Net investment income (0.36) (0.36) (0.54) (0.36) (0.17)Net realized capital gains (1.19) (1.10) (0.77) (0.02) —
Total Distributions (1.55) (1.46) (1.31) (0.38) (0.17)
Net asset value, end of theperiod $ 10.71 $ 11.36 $ 13.03 $ 12.88 $ 10.44
Total return(d) 9.53% (1.64)% 12.22%(b) 27.63% 6.19%(c)(e)RATIOS TO AVERAGE NET
ASSETS:Net assets, end of the period
(000’s) $15,345 $10,588 $22,545 $13,917 $16,945Net expenses(f) 0.90%(g) 0.95% 0.95% 0.95% 0.95%(h)Gross expenses 1.26% 1.32% 1.41% 1.34% 1.53%(h)Net investment income 3.62% 2.97% 4.46%(b) 2.97% 3.88%(c)(h)Portfolio turnover rate 35% 51% 65% 45% 14%
* From commencement of operations on March 30, 2012 through November 30, 2012.(a) Per share net investment income has been calculated using the average shares outstanding during the
period.(b) Includes non-recurring dividends. Without these dividends, net investment income per share would have
been $0.37, total return would have been 10.80% and the ratio of net investment income to average netassets would have been 2.91%.
(c) Includes a non-recurring dividend. Without this dividend, net investment income per share would havebeen $0.23, total return would have been 5.89%, and the ratio of net investment income to average netassets would have been 3.45%.
(d) Had certain expenses not been waived/reimbursed during the period, total returns would have beenlower.
(e) Periods less than one year are not annualized.(f) The investment adviser agreed to waive its fees and/or reimburse a portion of the Fund’s expenses
during the period. Without this waiver/reimbursement, expenses would have been higher.(g) Effective July 1, 2016, the expense limit decreased from 0.95% to 0.85%.(h) Computed on an annualized basis for periods less than one year.
See accompanying notes to financial statements.35 |

Financial Highlights (continued)For a share outstanding throughout each period.
Loomis Sayles GlobalGrowth Fund—Class A
Period EndedNovember 30,
2016*
Net asset value, beginning of the period $10.00
INCOME (LOSS) FROM INVESTMENT OPERATIONS:Net investment income(a) 0.00(b)Net realized and unrealized gain (loss) 0.53
Total from Investment Operations 0.53
LESS DISTRIBUTIONS FROM:Net investment income —Net realized capital gains —
Total Distributions —
Net asset value, end of the period $10.53
Total return(c) 5.30%(d)RATIOS TO AVERAGE NET ASSETS:Net assets, end of the period (000’s) $ 195Net expenses 1.30%(e)(f)Gross expenses 2.74%(f)Net investment income 0.00%(f)(g)Portfolio turnover rate 12%
* From commencement of operations on March 31, 2016 through November 30, 2016.(a) Per share net investment income has been calculated using the average shares outstanding during the
period.(b) Amount rounds to less than $0.01 per share.(c) A sales charge for Class A shares is not reflected in total return calculations.(d) Had certain expenses not been waived/reimbursed during the period, total returns would have been
lower. Periods less than one year are not annualized.(e) The investment adviser agreed to waive its fees and/or reimburse a portion of the Fund’s expenses
during the period. Without this waiver/reimbursement, expenses would have been higher.(f) Computed on an annualized basis for periods less than one year.(g) Amount rounds to less than 0.01%.
See accompanying notes to financial statements. | 36

Financial Highlights (continued)For a share outstanding throughout each period.
Loomis Sayles GlobalGrowth Fund—Class C
Period EndedNovember 30,
2016*
Net asset value, beginning of the period $10.00
INCOME (LOSS) FROM INVESTMENT OPERATIONS:Net investment loss(a) (0.08)Net realized and unrealized gain (loss) 0.55
Total from Investment Operations 0.47
LESS DISTRIBUTIONS FROM:Net investment income —Net realized capital gains —
Total Distributions —
Net asset value, end of the period $10.47
Total return(b) 4.70%(c)RATIOS TO AVERAGE NET ASSETS:Net assets, end of the period (000’s) $ 25Net expenses 2.05%(d)(e)Gross expenses 3.18%(e)Net investment loss (1.09)%(e)Portfolio turnover rate 12%
* From commencement of operations on March 31, 2016 through November 30, 2016.(a) Per share net investment loss has been calculated using the average shares outstanding during the
period.(b) A contingent deferred sales charge for Class C shares is not reflected in total return calculations.(c) Had certain expenses not been waived/reimbursed during the period, total returns would have been
lower. Periods less than one year are not annualized.(d) The investment adviser agreed to waive its fees and/or reimburse a portion of the Fund’s expenses
during the period. Without this waiver/reimbursement, expenses would have been higher.(e) Computed on an annualized basis for periods less than one year.
See accompanying notes to financial statements.37 |

Financial Highlights (continued)For a share outstanding throughout each period.
Loomis Sayles GlobalGrowth Fund—Class Y
Period EndedNovember 30,
2016*
Net asset value, beginning of the period $10.00
INCOME (LOSS) FROM INVESTMENT OPERATIONS:Net investment income(a) 0.03Net realized and unrealized gain (loss) 0.52
Total from Investment Operations 0.55
LESS DISTRIBUTIONS FROM:Net investment income —Net realized capital gains —
Total Distributions —
Net asset value, end of the period $10.55
Total return 5.50%(b)RATIOS TO AVERAGE NET ASSETS:Net assets, end of the period (000’s) $9,793Net expenses 1.05%(c)(d)Gross expenses 2.55%(d)Net investment income 0.45%(d)Portfolio turnover rate 12%
* From commencement of operations on March 31, 2016 through November 30, 2016.(a) Per share net investment income has been calculated using the average shares outstanding during the
period.(b) Had certain expenses not been waived/reimbursed during the period, total returns would have been
lower. Periods less than one year are not annualized.(c) The investment adviser agreed to waive its fees and/or reimburse a portion of the Fund’s expenses
during the period. Without this waiver/reimbursement, expenses would have been higher.(d) Computed on an annualized basis for periods less than one year.
See accompanying notes to financial statements. | 38

Financial Highlights (continued)For a share outstanding throughout each period.
Vaughan Nelson Select Fund—Class A
Year EndedNovember 30,
2016
Year EndedNovember 30,
2015
Year EndedNovember 30,
2014
Year EndedNovember 30,
2013
Period EndedNovember 30,
2012*
Net asset value, beginning ofthe period $ 14.82 $ 14.78 $ 14.22 $10.50 $10.00
INCOME (LOSS) FROMINVESTMENT OPERATIONS:
Net investment income (loss)(a) 0.03 0.01 (0.01) 0.01(b) (0.00)(c)Net realized and unrealized
gain (loss) 0.83 0.47 2.01 3.94 0.50
Total from InvestmentOperations 0.86 0.48 2.00 3.95 0.50
LESS DISTRIBUTIONS FROM:Net investment income (0.00)(c) — (0.01) — —Net realized capital gains (0.30) (0.44) (1.43) (0.23) —
Total Distributions (0.30) (0.44) (1.44) (0.23) —
Net asset value, end of theperiod $ 15.38 $ 14.82 $ 14.78 $14.22 $10.50
Total return(d) 5.91%(e) 3.31% 15.31%(e) 38.44%(b)(e) 5.00%(e)(f)RATIOS TO AVERAGE NET
ASSETS:Net assets, end of the period
(000’s) $20,502 $15,794 $11,182 $9,468 $ 777Net expenses 1.34%(g)(h) 1.40% 1.40%(g) 1.40%(g) 1.40%(g)(i)Gross expenses 1.37% 1.40% 1.62% 1.96% 3.36%(i)Net investment income (loss) 0.18% 0.05% (0.08)% 0.05%(b) (0.11)%(i)Portfolio turnover rate 64% 35% 64% 112% 72%
* From commencement of operations on June 29, 2012 through November 30, 2012.(a) Per share net investment income (loss) has been calculated using the average shares outstanding during
the period.(b) Includes a non-recurring dividend. Without this dividend, net investment loss per share would have been
$(0.01), total return would have been 38.24%, and the ratio of net investment loss to average net assetswould have been (0.07)%.
(c) Amount rounds to less than $0.01 per share.(d) A sales charge for Class A shares is not reflected in total return calculations.(e) Had certain expenses not been waived/reimbursed during the period, total returns would have been
lower.(f) Periods less than one year are not annualized.(g) The investment adviser agreed to waive its fees and/or reimburse a portion of the Fund’s expenses
during the period. Without this waiver/reimbursement, expenses would have been higher.(h) Effective July 1, 2016, the expense limit decreased from 1.40% to 1.30%.(i) Computed on an annualized basis for periods less than one year.
See accompanying notes to financial statements.39 |

Financial Highlights (continued)For a share outstanding throughout each period.
Vaughan Nelson Select Fund—Class C
Year EndedNovember 30,
2016
Year EndedNovember 30,
2015
Year EndedNovember 30,
2014
Year EndedNovember 30,
2013
Period EndedNovember 30,
2012*
Net asset value, beginning ofthe period $14.44 $14.52 $14.07 $10.47 $10.00
INCOME (LOSS) FROMINVESTMENT OPERATIONS:
Net investment loss(a) (0.08) (0.10) (0.11) (0.08)(b) (0.03)Net realized and unrealized
gain (loss) 0.81 0.46 1.99 3.91 0.50
Total from InvestmentOperations 0.73 0.36 1.88 3.83 0.47
LESS DISTRIBUTIONS FROM:Net investment income — — — — —Net realized capital gains (0.30) (0.44) (1.43) (0.23) —
Total Distributions (0.30) (0.44) (1.43) (0.23) —
Net asset value, end of theperiod $14.87 $14.44 $14.52 $14.07 $10.47
Total return(c) 5.14%(d) 2.52% 14.54%(d) 37.38%(b)(d) 4.70%(d)(e)RATIOS TO AVERAGE NET
ASSETS:Net assets, end of the period
(000’s) $7,693 $5,607 $2,955 $1,118 $ 159Net expenses 2.09%(f)(g) 2.15% 2.15%(f) 2.15%(f) 2.15%(f)(h)Gross expenses 2.12% 2.15% 2.35% 2.76% 4.48%(h)Net investment loss (0.58)% (0.69)% (0.84)% (0.62)%(b) (0.78)%(h)Portfolio turnover rate 64% 35% 64% 112% 72%
* From commencement of operations on June 29, 2012 through November 30, 2012.(a) Per share net investment loss has been calculated using the average shares outstanding during the
period.(b) Includes a non-recurring dividend. Without this dividend, net investment loss per share would have been
$(0.09), total return would have been 37.28%, and the ratio of net investment loss to average net assetswould have been (0.75)%.
(c) A contingent deferred sales charge for Class C shares is not reflected in total return calculations.(d) Had certain expenses not been waived/reimbursed during the period, total returns would have been
lower.(e) Periods less than one year are not annualized.(f) The investment adviser agreed to waive its fees and/or reimburse a portion of the Fund’s expenses
during the period. Without this waiver/reimbursement, expenses would have been higher.(g) Effective July 1, 2016, the expense limit decreased from 2.15% to 2.05%.(h) Computed on an annualized basis for periods less than one year.
See accompanying notes to financial statements. | 40

Financial Highlights (continued)For a share outstanding throughout each period.
Vaughan Nelson Select Fund—Class Y
Year EndedNovember 30,
2016
Year EndedNovember 30,
2015
Year EndedNovember 30,
2014
Year EndedNovember 30,
2013
Period EndedNovember 30,
2012*
Net asset value, beginning ofthe period $ 14.90 $ 14.83 $ 14.24 $ 10.51 $10.00
INCOME (LOSS) FROMINVESTMENT OPERATIONS:
Net investment income (loss)(a) 0.06 0.05 0.02 0.04(b) (0.00)(c)Net realized and unrealized
gain (loss) 0.85 0.47 2.03 3.94 0.51
Total from InvestmentOperations 0.91 0.52 2.05 3.98 0.51
LESS DISTRIBUTIONS FROM:Net investment income (0.03) (0.01) (0.03) (0.02) —Net realized capital gains (0.30) (0.44) (1.43) (0.23) —
Total Distributions (0.33) (0.45) (1.46) (0.25) —
Net asset value, end of theperiod $ 15.48 $ 14.90 $ 14.83 $ 14.24 $10.51
Total return 6.22%(d) 3.56% 15.66%(d) 38.80%(b)(d) 5.10%(d)(e)RATIOS TO AVERAGE NET
ASSETS:Net assets, end of the period
(000’s) $104,324 $78,483 $54,095 $14,211 $6,759Net expenses 1.09%(f)(g) 1.15% 1.15%(f) 1.15%(f) 1.15%(f)(h)Gross expenses 1.12% 1.15% 1.33% 1.80% 3.46%(h)Net investment income (loss) 0.43% 0.31% 0.16% 0.33%(b) (0.10)%(h)Portfolio turnover rate 64% 35% 64% 112% 72%
* From commencement of operations on June 29, 2012 through November 30, 2012.(a) Per share net investment income (loss) has been calculated using the average shares outstanding during
the period.(b) Includes a non-recurring dividend. Without this dividend, net investment income per share would have
been $0.02, total return would have been 38.61%, and the ratio of net investment income to average netassets would have been 0.15%.
(c) Amount rounds to less than $0.01 per share.(d) Had certain expenses not been waived/reimbursed during the period, total returns would have been
lower.(e) Periods less than one year are not annualized.(f) The investment adviser agreed to waive its fees and/or reimburse a portion of the Fund’s expenses
during the period. Without this waiver/reimbursement, expenses would have been higher.(g) Effective July 1, 2016, the expense limit decreased from 1.15% to 1.05%.(h) Computed on an annualized basis for periods less than one year.
See accompanying notes to financial statements.41 |

Notes to Financial StatementsNovember 30, 2016
1. Organization. Natixis Funds Trust II (the “Trust”) is organized as a Massachusettsbusiness trust. The Trust is registered under the Investment Company Act of 1940, asamended (the “1940 Act”), as an open-end management investment company. TheDeclaration of Trust permits the Board of Trustees to authorize the issuance of anunlimited number of shares of the Trust in multiple series. The financial statements forcertain funds of the Trust are presented in separate reports. The following funds(individually, a “Fund” and collectively, the “Funds”) are included in this report:
Loomis Sayles Dividend Income Fund (the “Dividend Income Fund”)Loomis Sayles Global Growth Fund (the “Global Growth Fund”)Vaughan Nelson Select Fund (the “Select Fund”)
The Global Growth Fund commenced operations on March 31, 2016 via contribution tothe Fund by Natixis Global Asset Management, L.P. (“Natixis US”) and affiliates of$5,002,000.
Each Fund is a diversified investment company, except for Select Fund, which is anon-diversified investment company.
Each Fund offers Class A, Class C and Class Y shares. Class A shares are sold with amaximum front-end sales charge of 5.75%. Class C shares do not pay a front-end salescharge, do not convert to any other class of shares, pay higher Rule 12b-1 fees thanClass A shares and may be subject to a contingent deferred sales charge (“CDSC”) of1.00% if those shares are redeemed within one year of acquisition, except forreinvested distributions. Class Y shares do not pay a front-end sales charge, a CDSC orRule 12b-1 fees. Class Y shares are generally intended for institutional investors with aminimum initial investment of $100,000, though some categories of investors areexempted from the minimum investment amount as outlined in the Funds’ prospectus.
Most expenses can be directly attributed to a Fund. Expenses which cannot be directlyattributed to a Fund are generally apportioned based on the relative net assets of eachof the funds in Natixis Funds Trust I, Natixis Funds Trust II, Natixis Funds Trust IV,Gateway Trust and Natixis ETF Trust (“Natixis Funds Trusts”), Loomis Sayles Funds Iand Loomis Sayles Funds II (“Loomis Sayles Funds Trusts”). Expenses of a Fund areborne pro rata by the holders of each class of shares, except that each class bearsexpenses unique to that class (such as the Rule 12b-1 fees applicable to Class A andClass C). In addition, each class votes as a class only with respect to its own Rule 12b-1Plan. Shares of each class would receive their pro rata share of the net assets of aFund if the Fund were liquidated. The Trustees approve separate distributions from netinvestment income on each class of shares.
2. Significant Accounting Policies. The following is a summary of significantaccounting policies consistently followed by each Fund in the preparation of itsfinancial statements. The Fund’s financial statements follow the accounting andreporting guidelines provided for investment companies and are prepared in
| 42

Notes to Financial Statements (continued)November 30, 2016
accordance with accounting principles generally accepted in the United States ofAmerica which require the use of management estimates that affect the reportedamounts and disclosures in the financial statements. Actual results could differ fromthose estimates. Management has evaluated the events and transactions subsequentto year-end through the date the financial statements were issued and has determinedthat there were no material events that would require disclosure in the Funds’ financialstatements.
a. Valuation. Fund securities and other investments are valued at market value basedon market quotations obtained or determined by independent pricing servicesrecommended by the adviser and subadviser and approved by the Board of Trustees.Fund securities and other investments for which market quotations are not readilyavailable are valued at fair value as determined in good faith by the adviser orsubadviser pursuant to procedures approved by the Board of Trustees, as describedbelow. Market value is determined as follows:
Listed equity securities (including shares of closed-end investment companies andexchange-traded funds) are valued at the last sale price quoted on the exchangewhere they are traded most extensively or, if there is no reported sale during the day,the closing bid quotation as reported by an independent pricing service. Securitiestraded on the NASDAQ Global Select Market, NASDAQ Global Market and NASDAQCapital Market are valued at the NASDAQ Official Closing Price (“NOCP”), or if lackingan NOCP, at the most recent bid quotations on the applicable NASDAQ Market.Unlisted equity securities (except unlisted preferred equity securities) are valued at thelast sale price quoted in the market where they are traded most extensively or, if thereis no reported sale during the day, the closing bid quotation as reported by anindependent pricing service. If there is no last sale price or closing bid quotationavailable, unlisted equity securities will be valued using evaluated bids furnished by anindependent pricing service, if available. In some foreign markets, an official closeprice and a last sale price may be available from the foreign exchange or market. Inthose cases, the official close price is used. Debt securities and unlisted preferredequity securities are valued based on evaluated bids furnished to the Fund by anindependent pricing service or bid prices obtained from broker-dealers. Senior loansare valued at bid prices supplied by an independent pricing service, if available.Broker-dealer bid prices may be used to value debt and unlisted equity securities andsenior loans where an independent pricing service is unable to price a security orwhere an independent pricing service does not provide a reliable price for the security.Domestic exchange-traded single name equity option contracts (including options onexchange-traded funds) are valued at the mean of the National Best Bid and Offerquotations.
Fund securities and other investments for which market quotations are not readilyavailable are valued at fair value as determined in good faith by the adviser or
43 |
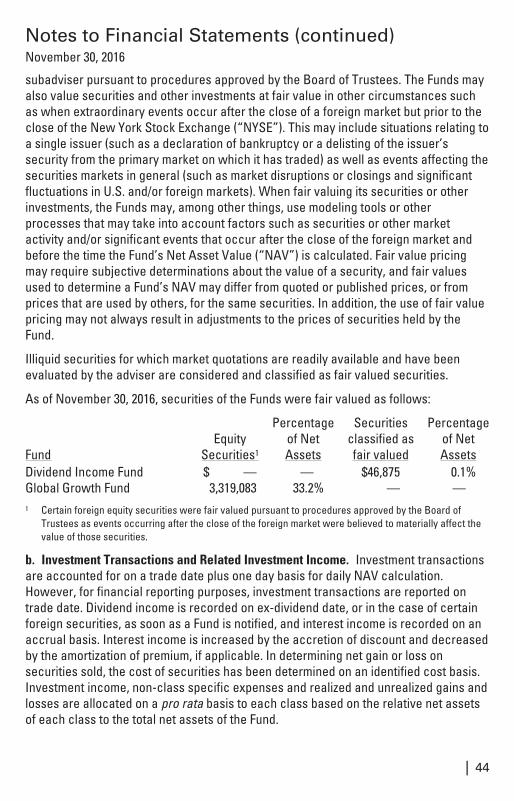
Notes to Financial Statements (continued)November 30, 2016
subadviser pursuant to procedures approved by the Board of Trustees. The Funds mayalso value securities and other investments at fair value in other circumstances suchas when extraordinary events occur after the close of a foreign market but prior to theclose of the New York Stock Exchange (“NYSE”). This may include situations relating toa single issuer (such as a declaration of bankruptcy or a delisting of the issuer’ssecurity from the primary market on which it has traded) as well as events affecting thesecurities markets in general (such as market disruptions or closings and significantfluctuations in U.S. and/or foreign markets). When fair valuing its securities or otherinvestments, the Funds may, among other things, use modeling tools or otherprocesses that may take into account factors such as securities or other marketactivity and/or significant events that occur after the close of the foreign market andbefore the time the Fund’s Net Asset Value (“NAV”) is calculated. Fair value pricingmay require subjective determinations about the value of a security, and fair valuesused to determine a Fund’s NAV may differ from quoted or published prices, or fromprices that are used by others, for the same securities. In addition, the use of fair valuepricing may not always result in adjustments to the prices of securities held by theFund.
Illiquid securities for which market quotations are readily available and have beenevaluated by the adviser are considered and classified as fair valued securities.
As of November 30, 2016, securities of the Funds were fair valued as follows:
FundEquity
Securities1
Percentageof NetAssets
Securitiesclassified asfair valued
Percentageof NetAssets
Dividend Income Fund $ — — $46,875 0.1%Global Growth Fund 3,319,083 33.2% — —1 Certain foreign equity securities were fair valued pursuant to procedures approved by the Board of
Trustees as events occurring after the close of the foreign market were believed to materially affect thevalue of those securities.
b. Investment Transactions and Related Investment Income. Investment transactionsare accounted for on a trade date plus one day basis for daily NAV calculation.However, for financial reporting purposes, investment transactions are reported ontrade date. Dividend income is recorded on ex-dividend date, or in the case of certainforeign securities, as soon as a Fund is notified, and interest income is recorded on anaccrual basis. Interest income is increased by the accretion of discount and decreasedby the amortization of premium, if applicable. In determining net gain or loss onsecurities sold, the cost of securities has been determined on an identified cost basis.Investment income, non-class specific expenses and realized and unrealized gains andlosses are allocated on a pro rata basis to each class based on the relative net assetsof each class to the total net assets of the Fund.
| 44

Notes to Financial Statements (continued)November 30, 2016
c. Short Sales. A short sale is a transaction in which a Fund sells a security it does notown, usually in anticipation of a decline in the fair market value of the security. To sell asecurity short, a Fund typically borrows that security from a prime broker and delivers itto the short sale counterparty. Short sale proceeds are held by the prime broker untilthe short position is closed out and would be reflected as due from broker in theStatements of Assets and Liabilities. When closing out a short position, a Fund willhave to purchase the security it originally sold short. The value of short sales isreflected as a liability in the Statements of Assets and Liabilities and ismarked-to-market daily. A Fund will realize a profit from closing out a short position ifthe price of the security sold short has declined since the short position was opened; aFund will realize a loss from closing out a short position if the value of the shortedsecurity has risen since the short position was opened. Because there is no upper limiton the price to which a security can rise, short selling exposes a Fund to potentiallyunlimited losses. Ordinarily, a Fund will pay interest to borrow securities and will haveto repay the lender any dividends that accrue on the security while the loan isoutstanding. The Funds intend to cover their short sale transactions by segregating orearmarking liquid assets, such that the segregated/earmarked amount, combined withassets pledged to the prime broker as collateral, equals the current market value of thesecurities underlying the short sale.
d. Foreign Currency Translation. The books and records of the Funds are maintainedin U.S. dollars. The values of securities, currencies and other assets and liabilitiesdenominated in currencies other than U.S. dollars are translated into U.S. dollars basedupon foreign exchange rates prevailing at the end of the period. Purchases and salesof investment securities, income and expenses are translated into U.S. dollars on therespective dates of such transactions.
Net realized foreign exchange gains or losses arise from sales of foreign currency,changes in exchange rates between the trade and settlement dates on securitiestransactions and the difference between the amounts of dividends, interest and foreignwithholding taxes recorded on the Funds’ books and the U.S. dollar equivalent of theamounts actually received or paid. Net unrealized foreign exchange gains or lossesarise from changes in the value of assets and liabilities, other than investmentsecurities, as of the end of the fiscal period, resulting from changes in exchange rates.Net realized foreign exchange gains or losses and the net change in unrealized foreignexchange gains or losses are disclosed in the Statements of Operations. For federalincome tax purposes, net realized foreign exchange gains or losses are characterizedas ordinary income, and may, if the Funds have net losses, reduce or eliminate theamount of income available to be distributed by the Funds.
The values of investment securities are presented at the foreign exchange ratesprevailing at the end of the period for financial reporting purposes. Net realized andunrealized gains or losses on investments reported in the Statements of Operations
45 |

Notes to Financial Statements (continued)November 30, 2016
reflect gains or losses resulting from changes in exchange rates and fluctuationswhich arise due to changes in market prices of investment securities. For federalincome tax purposes, a portion of the net realized gain or loss on investments arisingfrom changes in exchange rates, which is reflected in the Statements of Operations,may be characterized as ordinary income and may, if the Funds have net losses,reduce the amount of income available to be distributed by the Funds.
For the year ended November 30, 2016, the amount of income available to be distributedhas been reduced by the following amounts as a result of losses arising from changesin exchange rates:
Dividend Income Fund $54,202Global Growth Fund 2,929
The Funds may use foreign currency exchange contracts to facilitate transactions inforeign-denominated investments. Losses may arise from changes in the value of theforeign currency or if the counterparties do not perform under the contracts’ terms.
e. Option Contracts. Certain Funds may enter into option contracts. When a Fundpurchases an option, it pays a premium and the option is subsequentlymarked-to-market to reflect current value. Premiums paid for purchasing options whichexpire are treated as realized losses. Premiums paid for purchasing options which areexercised are added to the cost or deducted from the proceeds on the underlyinginstrument to determine the realized gain or loss. If the Fund enters into a closing saletransaction, the difference between the premium paid and the proceeds of the closingsale transaction is treated as a realized gain or loss. The risk associated withpurchasing options is limited to the premium paid.
When a Fund writes an option, an amount equal to the net premium received (thepremium less commission) is recorded as a liability and is subsequently adjusted to thecurrent value. Net premiums received for written options which expire are treated asrealized gains. Net premiums received for written options which are exercised arededucted from the cost or added to the proceeds on the underlying instrument todetermine the realized gain or loss. If the Fund enters into a closing purchasetransaction, the difference between the net premium received and any amount paid oneffecting a closing purchase transaction, including commissions, is treated as arealized gain or, if the net premium received is less than the amount paid, as a realizedloss. The Fund, as writer of a written option, bears the risk of an unfavorable change inthe market value of the instrument underlying the written option.
Exchange-traded options contracts are standardized and are settled through a clearinghouse with fulfillment supported by the credit of the exchange. Therefore, counterpartycredit risks to the Funds are reduced.
f. Federal and Foreign Income Taxes. The Trust treats each Fund as a separate entityfor federal income tax purposes. Each Fund intends to meet the requirements of the
| 46
Notes to Financial Statements (continued)November 30, 2016
Internal Revenue Code of 1986, as amended, applicable to regulated investmentcompanies, and to distribute to its shareholders substantially all of its net investmentincome and any net realized capital gains at least annually. Management hasperformed an analysis of each Fund’s tax positions for the open tax years as ofNovember 30, 2016 and has concluded that no provisions for income tax are required.The Funds’ federal tax returns for the prior three fiscal years, where applicable, remainsubject to examination by the Internal Revenue Service. Management is not aware ofany events that are reasonably possible to occur in the next twelve months that wouldresult in the amounts of any unrecognized tax benefits significantly increasing ordecreasing for the Funds. However, management’s conclusions regarding tax positionstaken may be subject to review and adjustment at a later date based on factorsincluding, but not limited to, new tax laws and accounting regulations andinterpretations thereof.
A Fund may be subject to foreign withholding taxes on investment income and taxes oncapital gains on investments that are accrued and paid based upon the Fund’sunderstanding of the tax rules and regulations that exist in the countries in which theFund invests. Foreign withholding taxes on dividend and interest income are reflectedon the Statements of Operations as a reduction of investment income, net of amountseligible to be reclaimed. Dividends and interest receivable on the Statements of Assetsand Liabilities are net of foreign withholding taxes. Foreign withholding taxes wherereclaims have been or will be filed are reflected on the Statements of Assets andLiabilities as tax reclaims receivable. Capital gains taxes paid are included in netrealized gain (loss) on investments in the Statements of Operations. Accrued butunpaid capital gains taxes are reflected as foreign taxes payable on the Statements ofAssets and Liabilities, if applicable, and reduce unrealized gains on investments. In theevent that realized gains on investments are subsequently offset by realized losses,taxes paid on realized gains may be returned to a Fund. Such amounts, if applicable,are reflected as foreign tax rebates receivable on the Statements of Assets andLiabilities and are recorded as a realized gain when received.
g. Dividends and Distributions to Shareholders. Dividends and distributions arerecorded on ex-dividend date. The timing and characterization of certain income andcapital gain distributions are determined in accordance with federal tax regulations,which may differ from accounting principles generally accepted in the United States ofAmerica. Permanent differences are primarily due to differing treatments for book andtax purposes of items such as foreign currency gains and losses, deferred Trustees’fees, non-deductible expenses, short sales, partnerships, paydown gains and losses,return of capital and capital gain distributions received, distribution re-designations,contingent payment debt instruments, convertible bonds and premium amortization.Permanent book and tax basis differences relating to shareholder distributions, netinvestment income, and net realized gains will result in reclassifications to capitalaccounts reported on the Statements of Assets and Liabilities. Temporary differences
47 |
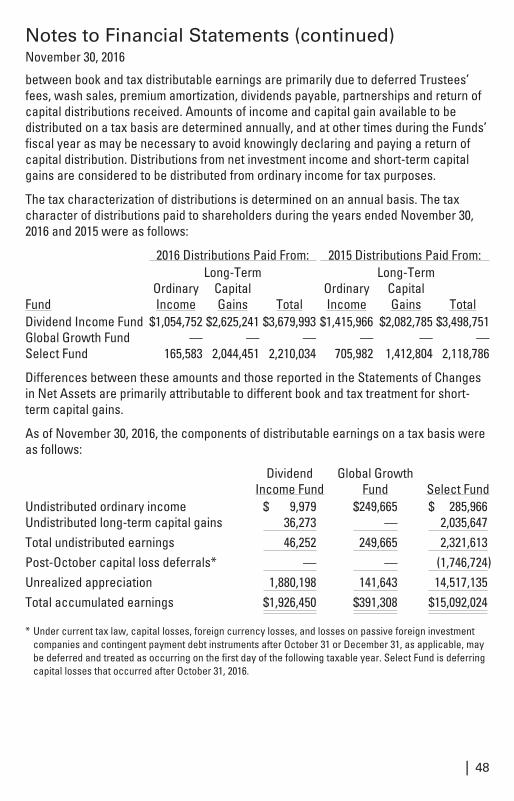
Notes to Financial Statements (continued)November 30, 2016
between book and tax distributable earnings are primarily due to deferred Trustees’fees, wash sales, premium amortization, dividends payable, partnerships and return ofcapital distributions received. Amounts of income and capital gain available to bedistributed on a tax basis are determined annually, and at other times during the Funds’fiscal year as may be necessary to avoid knowingly declaring and paying a return ofcapital distribution. Distributions from net investment income and short-term capitalgains are considered to be distributed from ordinary income for tax purposes.
The tax characterization of distributions is determined on an annual basis. The taxcharacter of distributions paid to shareholders during the years ended November 30,2016 and 2015 were as follows:
2016 Distributions Paid From: 2015 Distributions Paid From:
FundOrdinaryIncome
Long-TermCapitalGains Total
OrdinaryIncome
Long-TermCapitalGains Total
Dividend Income Fund $1,054,752 $2,625,241 $3,679,993 $1,415,966 $2,082,785 $3,498,751Global Growth Fund — — — — — —Select Fund 165,583 2,044,451 2,210,034 705,982 1,412,804 2,118,786
Differences between these amounts and those reported in the Statements of Changesin Net Assets are primarily attributable to different book and tax treatment for short-term capital gains.
As of November 30, 2016, the components of distributable earnings on a tax basis wereas follows:
DividendIncome Fund
Global GrowthFund Select Fund
Undistributed ordinary income $ 9,979 $249,665 $ 285,966Undistributed long-term capital gains 36,273 — 2,035,647Total undistributed earnings 46,252 249,665 2,321,613Post-October capital loss deferrals* — — (1,746,724)Unrealized appreciation 1,880,198 141,643 14,517,135Total accumulated earnings $1,926,450 $391,308 $15,092,024
* Under current tax law, capital losses, foreign currency losses, and losses on passive foreign investmentcompanies and contingent payment debt instruments after October 31 or December 31, as applicable, maybe deferred and treated as occurring on the first day of the following taxable year. Select Fund is deferringcapital losses that occurred after October 31, 2016.
| 48

Notes to Financial Statements (continued)November 30, 2016
As of November 30, 2016, unrealized appreciation (depreciation) on a tax basis was asfollows:
DividendIncome Fund
Global GrowthFund Select Fund
Unrealized appreciation (depreciation)Investments $1,880,198 $141,923 $14,517,135Foreign currency translations — (280) —
Total unrealized appreciation(depreciation) $1,880,198 $141,643 $14,517,135
h. Repurchase Agreements. Each Fund may enter into repurchase agreements, underthe terms of a Master Repurchase Agreement, under which each Fund acquiressecurities as collateral and agrees to resell the securities at an agreed upon time andat an agreed upon price. It is each Fund’s policy that the market value of the collateralfor repurchase agreements be at least equal to 102% of the repurchase price, includinginterest. Certain repurchase agreements are tri-party arrangements whereby thecollateral is held in a segregated account for the benefit of the Fund and on behalf ofthe counterparty. Repurchase agreements could involve certain risks in the event ofdefault or insolvency of the counterparty, including possible delays or restrictions upona Fund’s ability to dispose of the underlying securities. As of November 30, 2016, eachFund, as applicable, had investments in repurchase agreements for which the value ofthe related collateral exceeded the value of the repurchase agreement. The grossvalue of repurchase agreements is included in the Statements of Assets and Liabilitiesfor financial reporting purposes.
i. Indemnifications. Under the Trust’s organizational documents, its officers andTrustees are indemnified against certain liabilities arising out of the performance oftheir duties to the Funds. Additionally, in the normal course of business, the Funds enterinto contracts with service providers that contain general indemnification clauses. TheFunds’ maximum exposure under these arrangements is unknown as this would involvefuture claims that may be made against the Funds that have not yet occurred. However,based on experience, the Funds expect the risk of loss to be remote.
j. New Accounting Pronouncement. In October 2016, the SEC adopted amendments torules under the Investment Company Act of 1940 (“final rules”) intended to modernizethe reporting and disclosure of information by registered investment companies. Thefinal rules amend Regulation S-X and require funds to provide standardized, enhancedderivative disclosures in fund financial statements in a format designed for individualinvestors. The amendments to Regulation S-X also update the disclosures for otherinvestments, including investments in and advances to affiliates, and amend the rulesregarding the general form and content of fund financial statements. The compliancedate for the amendments to Regulation S-X is August 1, 2017. Management is currentlyevaluating the amendments and the impact, if any, on the Fund’s financial statements.
49 |

Notes to Financial Statements (continued)November 30, 2016
3. Fair Value Measurements. In accordance with accounting standards related to fairvalue measurements and disclosures, the Funds have categorized the inputs utilized indetermining the value of each Fund’s assets or liabilities. These inputs are summarizedin the three broad levels listed below:
• Level 1 – quoted prices in active markets for identical assets or liabilities;
• Level 2 – prices determined using other significant inputs that are observableeither directly, or indirectly through corroboration with observable market data(which could include quoted prices for similar assets or liabilities, interest rates,credit risk, etc.); and
• Level 3 – prices determined using significant unobservable inputs when quotedprices or observable inputs are unavailable such as when there is little or nomarket activity for an asset or liability (unobservable inputs reflect each Fund’sown assumptions in determining the fair value of assets or liabilities and wouldbe based on the best information available).
The inputs or methodology used for valuing securities are not necessarily an indicationof the risk associated with investing in those securities.
The following is a summary of the inputs used to value the Funds’ investments as ofNovember 30, 2016, at value:
Dividend Income Fund
Asset Valuation Inputs
Description Level 1 Level 2 Level 3 TotalCommon Stocks(a) $32,804,543 $ — $ — $32,804,543Preferred Stocks
Integrated Energy 484,380 — — 484,380Pharmaceuticals 532,014 388,681 — 920,695
Total Preferred Stocks 1,016,394 388,681 — 1,405,075Bonds and Notes(a) — 522,637 — 522,637Short-Term Investments — 378,891 — 378,891Total $33,820,937 $1,290,209 $ — $35,111,146
(a) Details of the major categories of the Fund’s investments are reflected within the Portfolio of Investments.
For the year ended November 30, 2016, there were no transfers among Levels 1, 2 and 3.
| 50

Notes to Financial Statements (continued)November 30, 2016
Global Growth Fund
Asset Valuation Inputs
Description Level 1 Level 2 Level 3 TotalCommon Stocks
Brazil $ — $ 185,759 $ — $ 185,759Denmark — 376,038 — 376,038France — 593,956 — 593,956Germany — 231,166 — 231,166Ireland — 285,903 — 285,903Italy — 137,257 — 137,257Sweden — 141,156 — 141,156Switzerland — 774,488 — 774,488United Kingdom — 322,841 — 322,841United States 5,447,506 270,519 — 5,718,025All Other Common Stocks(a) 1,258,928 — — 1,258,928
Total $6,706,434 $3,319,083 $ — $10,025,517
(a) Details of the major categories of the Fund’s investments are reflected within the Portfolio of Investments.
For the period ended November 30, 2016, there were no transfers among Levels 1, 2 and 3.
Select Fund
Asset Valuation Inputs
Description Level 1 Level 2 Level 3 TotalCommon Stocks(a) $119,856,279 $ — $ — $119,856,279Short-Term Investments — 14,033,310 — 14,033,310Total $119,856,279 $14,033,310 $ — $133,889,589
(a) Details of the major categories of the Fund’s investments are reflected within the Portfolio of Investments.
For the year ended November 30, 2016, there were no transfers among Levels 1, 2 and 3.
51 |
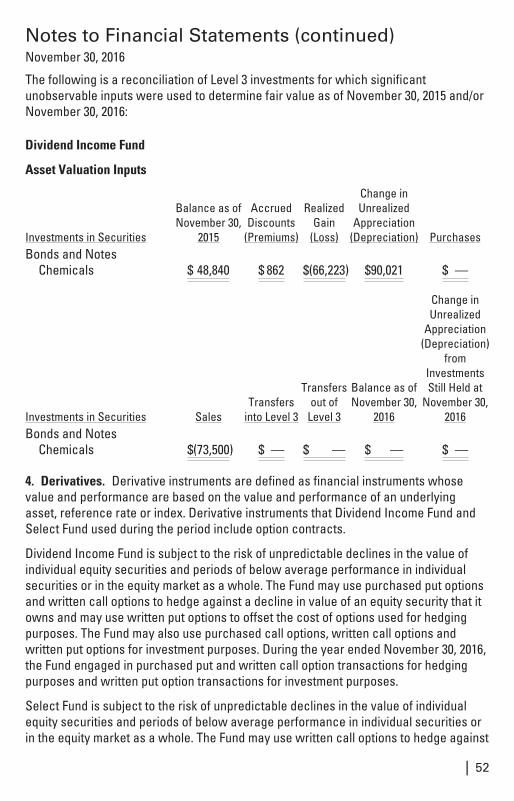
Notes to Financial Statements (continued)November 30, 2016
The following is a reconciliation of Level 3 investments for which significantunobservable inputs were used to determine fair value as of November 30, 2015 and/orNovember 30, 2016:
Dividend Income Fund
Asset Valuation Inputs
Investments in Securities
Balance as ofNovember 30,
2015
AccruedDiscounts
(Premiums)
RealizedGain
(Loss)
Change inUnrealized
Appreciation(Depreciation) Purchases
Bonds and NotesChemicals $ 48,840 $ 862 $(66,223) $90,021 $ —
Investments in Securities SalesTransfers
into Level 3
Transfersout of
Level 3
Balance as ofNovember 30,
2016
Change inUnrealized
Appreciation(Depreciation)
fromInvestmentsStill Held at
November 30,2016
Bonds and NotesChemicals $(73,500) $ — $ — $ — $ —
4. Derivatives. Derivative instruments are defined as financial instruments whosevalue and performance are based on the value and performance of an underlyingasset, reference rate or index. Derivative instruments that Dividend Income Fund andSelect Fund used during the period include option contracts.
Dividend Income Fund is subject to the risk of unpredictable declines in the value ofindividual equity securities and periods of below average performance in individualsecurities or in the equity market as a whole. The Fund may use purchased put optionsand written call options to hedge against a decline in value of an equity security that itowns and may use written put options to offset the cost of options used for hedgingpurposes. The Fund may also use purchased call options, written call options andwritten put options for investment purposes. During the year ended November 30, 2016,the Fund engaged in purchased put and written call option transactions for hedgingpurposes and written put option transactions for investment purposes.
Select Fund is subject to the risk of unpredictable declines in the value of individualequity securities and periods of below average performance in individual securities orin the equity market as a whole. The Fund may use written call options to hedge against
| 52

Notes to Financial Statements (continued)November 30, 2016
a decline in value of an equity security that it owns and may use written put options tooffset the cost of options used for hedging purposes. The Fund may also use writtencall options and written put options for investment purposes. During the year endedNovember 30, 2016, the Fund engaged in written call option transactions for investmentpurposes.
Transactions in derivative instruments for Dividend Income Fund during the year endedNovember 30, 2016, as reflected within the Statements of Operations, were as follows:
Net Realized Gain (Loss) on: Investments1 Options writtenEquity contracts $(3,527) $75,153
Net Change in Unrealized Appreciation(Depreciation) on: Investments1 Options writtenEquity contracts $ — $ 2,8401 Represents realized loss and change in unrealized appreciation (depreciation) for purchased options
during the period.
Transactions in derivative instruments for Select Fund during the year endedNovember 30, 2016, as reflected within the Statements of Operations, were as follows:
Net Realized Gain (Loss) on: Options writtenEquity contracts $28,382
Net Change in Unrealized Appreciation (Depreciation) on: Options writtenEquity contracts $ —
As the Funds value their derivatives at fair value and recognize changes in fair valuethrough the Statements of Operations, they do not qualify for hedge accounting underauthoritative guidance for derivative instruments. The Funds’ investments in derivativesmay represent an economic hedge; however, they are considered to be non-hedgetransactions for the purpose of these disclosures.
The volume of option contract activity, as a percentage of net assets, for DividendIncome Fund, based on month-end market values of underlying securities, at absolutevalue, was as follows for the year ended November 30, 2016:
Dividend Income Fund**Put OptionsPurchased
Call OptionsWritten
Put OptionsWritten
Average Market Value of UnderlyingSecurities 0.04% 1.80% 1.17%
Highest Market Value of UnderlyingSecurities 0.45% 3.05% 2.79%
Lowest Market Value of UnderlyingSecurities 0.00% 0.00% 0.00%
Market Value of Underlying Securities as ofNovember 30, 2016 0.00% 0.00% 0.00%
53 |

Notes to Financial Statements (continued)November 30, 2016
The volume of option contract activity, as a percentage of net assets, for Select Fund,based on month-end market values of underlying securities, at absolute value, was asfollows for the year ended November 30, 2016:
Select Fund**Call Options
WrittenAverage Market Value of Underlying Securities 0.20%Highest Market Value of Underlying Securities 2.93%Lowest Market Value of Underlying Securities 0.00%Market Value of Underlying Securities as of November 30, 2016 0.00%
** Market value of underlying instruments is determined as follows: for securities by multiplying optionshares by the price of the option’s underlying security, as determined by the Fund’s Pricing Policies andProcedures.
The following is a summary of Dividend Income Fund’s written option activity:
Dividend Income FundNumber ofContracts Premiums
Outstanding at November 30, 2015 55 $ 4,468Options written 1,354 123,095Options terminated in closing purchase transactions (575) (53,310)Options exercised (224) (19,712)Options expired (610) (54,541)Outstanding at November 30, 2016 — $ —
The following is a summary of Select Fund’s written option activity:
Select FundNumber ofContracts Premiums
Outstanding at November 30, 2015 — $ —Options written 305 33,096Options terminated in closing purchase transactions (105) (9,490)Options expired (200) (23,606)Outstanding at November 30, 2016 — $ —
5. Purchases and Sales of Securities. For the year ended November 30, 2016,purchases and sales of securities (excluding short-term investments, option contractsand U.S. Government/Agency securities and including paydowns) were as follows:
Fund Purchases SalesDividend Income Fund $19,414,554 $10,790,993Global Growth Fund 10,699,344 1,020,349Select Fund 86,615,225 69,366,105
| 54

Notes to Financial Statements (continued)November 30, 2016
For the year ended November 30, 2016, short sales and purchases to cover by Fundswere as follows:
Fund Purchases SalesSelect Fund $4,736,522 $4,530,758
6. Management Fees and Other Transactions with Affiliates.
a. Management Fees. Loomis Sayles & Company, L.P. (“Loomis Sayles”) serves asinvestment adviser to the Funds, except Select Fund. Under the terms of themanagement agreements, each Fund pays a management fee at the following annualrates, calculated daily and payable monthly, based on average daily net assets:
Fund
Percentage ofAverage
Daily Net AssetsDividend Income Fund 0.60%Global Growth Fund 0.80%
NGAM Advisors, L.P. (“NGAM Advisors”), serves as investment adviser to the SelectFund. NGAM Advisors is a wholly-owned subsidiary of Natixis US. Under the terms ofthe management agreement, the Fund pays a management fee at the annual rate of0.85%, calculated daily and payable monthly, based on the Fund’s average daily netassets.
NGAM Advisors has entered into a subadvisory agreement with Vaughan NelsonInvestment Management, L.P. (“Vaughan Nelson”). Under the terms of the subadvisoryagreement, the Fund pays a subadvisory fee at the annual rate of 0.53%, calculateddaily and payable monthly, based on the Fund’s average daily net assets. Payments toNGAM Advisors are reduced by the amount of payments to Vaughan Nelson.
Loomis Sayles and NGAM Advisors have given binding undertakings to the Funds towaive management fees and/or reimburse certain expenses to limit the Funds’operating expenses, exclusive of acquired fund fees and expenses, brokerageexpenses, interest expense, dividend expenses on securities sold short, taxes,organizational and extraordinary expenses such as litigation and indemnificationexpenses. These undertakings are in effect until March 31, 2018, except for GlobalGrowth Fund, which is in effect until March 31, 2017, may be terminated before thenonly with the consent of the Funds’ Board of Trustees, and are reevaluated on anannual basis. Management fees payable, as reflected on the Statements of Assets andLiabilities, is net of waivers and/or expense reimbursements, if any, pursuant to theseundertakings. Waivers/reimbursements that exceed management fees payable arereflected on the Statements of Assets and Liabilities as receivable from investmentadviser.
55 |

Notes to Financial Statements (continued)November 30, 2016
For the year ended November 30, 2016, the expense limits as a percentage of averagedaily net assets under the expense limitation agreements were as follows:
Expense Limit as a Percentage ofAverage Daily Net Assets
Fund Class A Class C Class YDividend Income Fund 1.10% 1.85% 0.85%Global Growth Fund 1.30% 2.05% 1.05%Select Fund 1.30% 2.05% 1.05%
Prior to July 1, 2016, the expense limits as a percentage of average daily net assetsunder the expense limitation agreements for Dividend Income Fund and Select Fundwere as follows:
Expense Limit as a Percentage ofAverage Daily Net Assets
Class A Class C Class YDividend Income Fund 1.20% 1.95% 0.95%Select Fund 1.40% 2.15% 1.15%
Loomis Sayles and NGAM Advisors shall be permitted to recover expenses they haveborne under the expense limitation agreements (whether through waiver of itsmanagement fees or otherwise) on a class by class basis in later periods to the extentthe annual operating expenses of a class fall below a class’ expense limits, provided,however, that a class is not obligated to pay such waived/reimbursed fees or expensesmore than one year after the end of the fiscal year in which the fees or expenses werewaived/reimbursed.
For the year ended November 30, 2016, the management fees and waivers ofmanagement fees for each Fund were as follows:
Fund
GrossManagement
Fees
ContractualWaivers of
ManagementFees1
NetManagement
Fees
Percentage ofAverage
Daily Net AssetsGross Net
Dividend IncomeFund $185,564 $109,507 $ 76,057 0.60% 0.25%
Global Growth Fund 47,321 47,321 — 0.80% —Select Fund 965,843 34,582 931,261 0.85% 0.82%1 Contractual management fee waivers are subject to possible recovery until November 30, 2017.
In addition, the investment adviser reimbursed non-class specific expenses of GlobalGrowth Fund in the amount of $41,094 for the year ended November 30, 2016.
Certain officers and employees of Loomis Sayles are also officers or Trustees of theTrust. Loomis Sayles’ general partner is indirectly owned by Natixis US.
| 56

Notes to Financial Statements (continued)November 30, 2016
b. Service and Distribution Fees. NGAM Distribution, L.P. (“NGAM Distribution”),which is a wholly-owned subsidiary of Natixis US, has entered into a distributionagreement with the Trust. Pursuant to this agreement, NGAM Distribution serves asprincipal underwriter of the Funds of the Trust.
Pursuant to Rule 12b-1 under the 1940 Act, the Trust has adopted a Service Planrelating to each Fund’s Class A shares (the “Class A Plans”) and a Distribution andService Plan relating to each Fund’s Class C shares (the “Class C Plans”).
Under the Class A Plans, each Fund pays NGAM Distribution a monthly service fee atan annual rate not to exceed 0.25% of the average daily net assets attributable to theFund’s Class A shares, as reimbursement for expenses incurred by NGAM Distributionin providing personal services to investors in Class A shares and/or the maintenance ofshareholder accounts.
Under the Class C Plans, each Fund pays NGAM Distribution a monthly service fee atan annual rate not to exceed 0.25% of the average daily net assets attributable to theFund’s Class C shares, as compensation for services provided by NGAM Distribution inproviding personal services to investors in Class C shares and/or the maintenance ofshareholder accounts.
Also under the Class C Plans, each Fund pays NGAM Distribution a monthly distributionfee at the annual rate of 0.75% of the average daily net assets attributable to the Fund’sClass C shares, as compensation for services provided by NGAM Distribution inconnection with the marketing or sale of Class C shares.
For the year ended November 30, 2016, the service and distribution fees for each Fundwere as follows:
Service Fees Distribution FeesFund Class A Class C Class CDividend Income Fund $32,035 $11,866 $35,597Global Growth Fund 249 21 61Select Fund 47,306 18,796 56,390
c. Administrative Fees. NGAM Advisors provides certain administrative services forthe Funds and contracts with State Street Bank and Trust Company (“State StreetBank”) to serve as sub-administrator. Pursuant to an agreement among Natixis FundsTrusts, Loomis Sayles Funds Trusts and NGAM Advisors, each Fund pays NGAMAdvisors monthly its pro rata portion of fees equal to an annual rate of 0.0575% of thefirst $15 billion of the average daily net assets of the Natixis Funds Trusts and LoomisSayles Funds Trusts, 0.0500% of the next $15 billion, 0.0400% of the next $30 billion,0.0350% of the next $30 billion and 0.0325% of such assets in excess of $90 billion,subject to an annual aggregate minimum fee for the Natixis Funds Trusts and LoomisSayles Funds Trusts of $10 million, which is reevaluated on an annual basis.
57 |

Notes to Financial Statements (continued)November 30, 2016
For the year ended November 30, 2016, the administrative fees for each Fund were asfollows:
FundAdministrative
FeesDividend Income Fund $13,702Global Growth Fund 2,624Select Fund 50,337
d. Sub-Transfer Agent Fees. NGAM Distribution has entered into agreements, whichinclude servicing agreements, with financial intermediaries that providerecordkeeping, processing, shareholder communications and other services tocustomers of the intermediaries that hold positions in the Funds and has agreed tocompensate the intermediaries for providing those services. Intermediaries transactwith the Funds primarily through the use of omnibus accounts on behalf of theircustomers who hold positions in the Funds. These services would have been providedby the Funds’ transfer agent and other service providers if the shareholders’ accountswere maintained directly at the Funds’ transfer agent. Accordingly, the Funds haveagreed to reimburse NGAM Distribution for all or a portion of the servicing fees paid tothese intermediaries. The reimbursement amounts (sub-transfer agent fees) paid toNGAM Distribution are subject to a current per-account equivalent fee limit approvedby the Funds’ Board of Trustees, which is based on fees for similar services paid to theFunds’ transfer agent and other service providers.
For the year ended November 30, 2016, the sub-transfer agent fees (which are reflectedin transfer agent fees and expenses in the Statements of Operations) for each Fundwere as follows:
FundSub-Transfer Agent
FeesDividend Income Fund $15,900Global Growth Fund 119Select Fund 56,892
As of November 30, 2016, the Funds owe NGAM Distribution the followingreimbursements for sub-transfer agent fees (which are reflected in the Statements ofAssets and Liabilities as payable to distributor):
Fund
Reimbursements ofSub-Transfer Agent
FeesDividend Income Fund $129Global Growth Fund 2Select Fund 591
| 58

Notes to Financial Statements (continued)November 30, 2016
Sub-transfer agent fees attributable to Class A, Class C and Class Y are allocated on apro rata basis to each class based on the relative net assets of each class to the totalnet assets of those classes.
e. Commissions. Commissions (including CDSCs) on Fund shares retained by NGAMDistribution during the year ended November 30, 2016 were as follows:
Fund CommissionsDividend Income Fund $ 4,689Select Fund 12,782
f. Trustees Fees and Expenses. The Trust does not pay any compensation directly toits officers or Trustees who are directors, officers or employees of NGAM Advisors,NGAM Distribution, Natixis US or their affiliates. The Chairperson of the Board ofTrustees receives a retainer fee at the annual rate of $325,000. The Chairperson doesnot receive any meeting attendance fees for Board of Trustees meetings or committeemeetings that she attends. Each Independent Trustee (other than the Chairperson)receives, in the aggregate, a retainer fee at the annual rate of $155,000. EachIndependent Trustee also receives a meeting attendance fee of $10,000 for eachmeeting of the Board of Trustees that he or she attends in person and $5,000 for eachmeeting of the Board of Trustees that he or she attends telephonically. In addition, thechairperson of the Contract Review Committee and the chairperson of the AuditCommittee each receive an additional retainer fee at the annual rate of $17,500. Thechairperson of the Governance Committee receives an additional retainer fee at theannual rate of $10,000. Each Contract Review Committee member is compensated$6,000 for each Committee meeting that he or she attends in person and $3,000 for eachmeeting that he or she attends telephonically. Each Audit Committee member iscompensated $6,000 for each Committee meeting that he or she attends in person and$3,000 for each meeting that he or she attends telephonically. These fees are allocatedamong the funds in the Natixis Funds Trusts and Loomis Sayles Funds Trusts based ona formula that takes into account, among other factors, the relative net assets of eachfund. Trustees are reimbursed for travel expenses in connection with attendance atmeetings.
Prior to January 1, 2016, the Chairperson of the Board received a retainer fee at theannual rate of $300,000 and each Independent Trustee (other than the Chairperson)received, in the aggregate, a retainer fee at the annual rate of $130,000. Thechairperson of the Governance Committee received an additional retainer fee at theannual rate of $5,000. All other Trustee fees remained unchanged.
A deferred compensation plan (the “Plan”) is available to the Trustees on a voluntarybasis. Deferred amounts remain in the Funds until distributed in accordance with theprovisions of the Plan. The value of a participating Trustee’s deferral account is basedon theoretical investments of deferred amounts, on the normal payment dates, incertain funds of the Natixis Funds Trusts and Loomis Sayles Funds Trusts as
59 |

Notes to Financial Statements (continued)November 30, 2016
designated by the participating Trustees. Changes in the value of participants’ deferralaccounts are allocated pro rata among the funds in the Natixis Funds Trusts andLoomis Sayles Funds Trusts, and are normally reflected as Trustees’ fees and expensesin the Statements of Operations. The portions of the accrued obligations allocated tothe Funds under the Plan are reflected as Deferred Trustees’ fees in the Statements ofAssets and Liabilities.
g. Affiliated Ownership. As of November 30, 2016, Loomis Sayles Employees’ ProfitSharing Retirement Plan (“Retirement Plan”) and Natixis US and affiliates held sharesof the Funds representing the following percentages of the Fund’s net assets:
Fund Retirement Plan Natixis US
TotalAffiliated
OwnershipDividend Income Fund 4.86% — 4.86%Global Growth Fund — 52.69% 52.69%
Investment activities of affiliated shareholders could have material impacts on theFunds.
h. Payment by Affiliates. During the year ended November 30, 2016, Loomis Saylesreimbursed Dividend Income Fund $740 in connection with a trading error.
7. Line of Credit. Effective April 14, 2016, the Fund, together with certain other funds ofNatixis Funds Trusts and Loomis Sayles Funds Trusts, entered into a 364-day,$400,000,000 syndicated, committed, unsecured line of credit with Citibank, N.A. to beused for temporary or emergency purposes only. Any one Fund may borrow up to thefull $400,000,000 under the line of credit (as long as all borrowings by all Funds in theaggregate do not exceed the $400,000,000 limit at any time) subject to each Fund’sinvestment restrictions. Interest is charged to the Funds at a rate equal to the greaterof the eurodollar or the federal funds rate plus 1.00%. In addition, a commitment fee of0.10% per annum, payable on the last business day of each month, is accrued andapportioned among the participating funds based on their average daily unused portionof the line of credit. The Funds paid an arrangement fee, an upfront fee, and other feesin connection with the new line of credit agreement, which are being amortized over aperiod of 364 days and are reflected as miscellaneous expenses on the Statements ofOperations. The unamortized balance is reflected as prepaid expenses on theStatements of Assets and Liabilities.
Prior to April 14, 2016 each Fund, together with certain other funds of Natixis FundsTrusts and Loomis Sayles Funds Trusts, participated in a $150,000,000 committedunsecured line of credit provided by State Street Bank. Any one Fund was able toborrow up to the full $150,000,000 under the line of credit (as long as all borrowings byall Funds in the aggregate do not exceed the $150,000,000 limit at any time). Interestwas charged to each participating Fund based on its borrowings at a rate per annumequal to the greater of the Federal Funds rate or overnight LIBOR, plus 1.25%. In
| 60
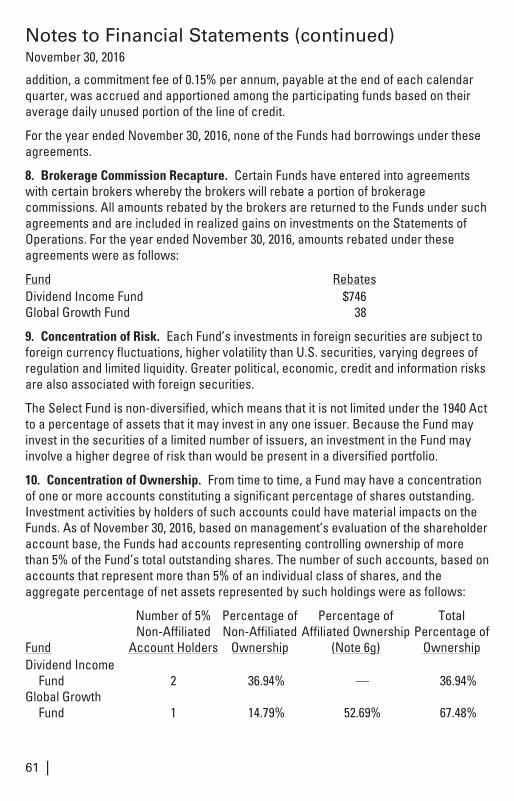
Notes to Financial Statements (continued)November 30, 2016
addition, a commitment fee of 0.15% per annum, payable at the end of each calendarquarter, was accrued and apportioned among the participating funds based on theiraverage daily unused portion of the line of credit.
For the year ended November 30, 2016, none of the Funds had borrowings under theseagreements.
8. Brokerage Commission Recapture. Certain Funds have entered into agreementswith certain brokers whereby the brokers will rebate a portion of brokeragecommissions. All amounts rebated by the brokers are returned to the Funds under suchagreements and are included in realized gains on investments on the Statements ofOperations. For the year ended November 30, 2016, amounts rebated under theseagreements were as follows:
Fund RebatesDividend Income Fund $746Global Growth Fund 38
9. Concentration of Risk. Each Fund’s investments in foreign securities are subject toforeign currency fluctuations, higher volatility than U.S. securities, varying degrees ofregulation and limited liquidity. Greater political, economic, credit and information risksare also associated with foreign securities.
The Select Fund is non-diversified, which means that it is not limited under the 1940 Actto a percentage of assets that it may invest in any one issuer. Because the Fund mayinvest in the securities of a limited number of issuers, an investment in the Fund mayinvolve a higher degree of risk than would be present in a diversified portfolio.
10. Concentration of Ownership. From time to time, a Fund may have a concentrationof one or more accounts constituting a significant percentage of shares outstanding.Investment activities by holders of such accounts could have material impacts on theFunds. As of November 30, 2016, based on management’s evaluation of the shareholderaccount base, the Funds had accounts representing controlling ownership of morethan 5% of the Fund’s total outstanding shares. The number of such accounts, based onaccounts that represent more than 5% of an individual class of shares, and theaggregate percentage of net assets represented by such holdings were as follows:
Fund
Number of 5%Non-Affiliated
Account Holders
Percentage ofNon-Affiliated
Ownership
Percentage ofAffiliated Ownership
(Note 6g)
TotalPercentage of
OwnershipDividend Income
Fund 2 36.94% — 36.94%Global Growth
Fund 1 14.79% 52.69% 67.48%
61 |

Notes to Financial Statements (continued)November 30, 2016
Omnibus shareholder accounts for which NGAM Advisors understands that theintermediary has discretion over the underlying shareholder accounts or investmentmodels where a shareholder account may be invested for a non-discretionarycustomer are included in the table above. For other omnibus accounts, the Funds donot have information on the individual shareholder accounts underlying the omnibusaccounts; therefore, there could be other 5% shareholders in addition to thosedisclosed in the table above.
11. Capital Shares. Each Fund may issue an unlimited number of shares of beneficialinterest, without par value. Transactions in capital shares were as follows:
Year EndedNovember 30, 2016
Year EndedNovember 30, 2015
Dividend Income Fund Shares Amount Shares AmountClass AIssued from the sale of shares 475,395 $ 4,758,020 512,006 $ 5,938,857Issued in connection with the reinvestment of
distributions 158,404 1,559,174 76,595 888,237Redeemed (301,504) (3,051,100) (172,200) (1,965,394)
Net change 332,295 $ 3,266,094 416,401 $ 4,861,700
Class CIssued from the sale of shares 264,338 $ 2,671,001 243,281 $ 2,850,657Issued in connection with the reinvestment of
distributions 43,940 431,029 17,190 199,012Redeemed (122,480) (1,238,735) (61,574) (693,371)
Net change 185,798 $ 1,863,295 198,897 $ 2,356,298
Class YIssued from the sale of shares 948,650 $ 9,537,161 147,899 $ 1,736,431Issued in connection with the reinvestment of
distributions 156,717 1,546,441 200,725 2,344,722Redeemed (604,665) (6,018,858) (1,147,070) (13,788,331)
Net change 500,702 $ 5,064,744 (798,446) $ (9,707,178)
Increase (decrease) from capital share transactions 1,018,795 $10,194,133 (183,148) $ (2,489,180)
| 62

Notes to Financial Statements (continued)November 30, 2016
11. Capital Shares (continued).
Period EndedNovember 30, 2016*
Global Growth Fund Shares AmountClass AIssued from the sale of shares 24,823 $ 256,235Redeemed (6,341) (68,887)
Net change 18,482 $ 187,348
Class CIssued from the sale of shares 7,327 $ 79,960Redeemed (4,977) (51,110)
Net change 2,350 $ 28,850
Class YIssued from the sale of shares 964,508 $9,810,284Redeemed (36,670) (383,485)
Net change 927,838 $9,426,799
Increase (decrease) from capital share transactions 948,670 $9,642,997
* From commencement of operations on March 31, 2016 through November 30, 2016.
Year EndedNovember 30, 2016
Year EndedNovember 30, 2015
Select Fund Shares Amount Shares AmountClass AIssued from the sale of shares 644,994 $ 9,217,244 494,417 $ 7,263,911Issued in connection with the reinvestment of
distributions 20,111 292,611 21,192 307,501Redeemed (398,309) (5,835,075) (206,222) (3,001,098)
Net change 266,796 $ 3,674,780 309,387 $ 4,570,314
Class CIssued from the sale of shares 255,593 $ 3,514,427 214,321 $ 3,070,814Issued in connection with the reinvestment of
distributions 8,415 119,241 6,567 93,508Redeemed (135,064) (1,903,161) (36,042) (521,715)
Net change 128,944 $ 1,730,507 184,846 $ 2,642,607
Class YIssued from the sale of shares 3,760,483 $ 54,524,967 3,122,510 $ 45,979,526Issued in connection with the reinvestment of
distributions 115,600 1,688,911 115,142 1,676,475Redeemed (2,403,148) (34,234,336) (1,616,997) (24,110,746)
Net change 1,472,935 $ 21,979,542 1,620,655 $ 23,545,255
Increase (decrease) from capital share transactions 1,868,675 $ 27,384,829 2,114,888 $ 30,758,176
63 |
Report of Independent Registered PublicAccounting FirmTo the Trustees of Natixis Funds Trust II and Shareholders of Loomis Sayles DividendIncome Fund, Loomis Sayles Global Growth Fund and Vaughan Nelson Select Fund:
In our opinion, the accompanying statements of assets and liabilities, including theportfolios of investments, and the related statements of operations and of changes innet assets and the financial highlights present fairly, in all material respects, thefinancial position of the Loomis Sayles Dividend Income Fund, Loomis Sayles GlobalGrowth Fund and Vaughan Nelson Select Fund, each a series of Natixis Funds Trust II(collectively, the “Funds”) as of November 30, 2016, and the results of each of theiroperations, the changes in each of their net assets and the financial highlights for eachof the periods indicated, in conformity with accounting principles generally accepted inthe United States of America. These financial statements and financial highlights(hereafter referred to as “financial statements”) are the responsibility of the Funds’management. Our responsibility is to express an opinion on these financial statementsbased on our audits. We conducted our audits of these financial statements inaccordance with the standards of the Public Company Accounting Oversight Board(United States). Those standards require that we plan and perform the audit to obtainreasonable assurance about whether the financial statements are free of materialmisstatement. An audit includes examining, on a test basis, evidence supporting theamounts and disclosures in the financial statements, assessing the accountingprinciples used and significant estimates made by management, and evaluating theoverall financial statement presentation. We believe that our audits, which includedconfirmation of securities as of November 30, 2016 by correspondence with thecustodian, agent banks and brokers, provide a reasonable basis for our opinion.
PricewaterhouseCoopers LLPBoston, MassachusettsJanuary 23, 2017
| 64

2016 U.S. Tax Distribution Information toShareholders (Unaudited)Corporate Dividends Received Deduction. For the fiscal year ended November 30,2016, a percentage of dividends distributed by the Funds listed below qualify for thedividends received deduction for corporate shareholders. These percentages are asfollows:
FundQualifying
PercentageDividend Income 85.83%Select 100.00%
Capital Gains Distributions. Pursuant to Internal Revenue Section 852(b), the followingFunds paid distributions, which have been designated as capital gains distributions forthe fiscal year ended November 30, 2016, unless subsequently determined to bedifferent.
Fund AmountDividend Income $2,625,241Select 2,044,451
Qualified Dividend Income. For the fiscal year ended November 30, 2016, the Fundsbelow will designate up to the maximum amount allowable pursuant to the InternalRevenue Code as qualified dividend income eligible for reduced tax rates. These lowerrates range from 0% to 20% depending on an individual’s tax bracket. If the Funds pay adistribution during calendar year 2016, complete information will be reported inconjunction with Form 1099-DIV.
FundDividend IncomeSelect
65 |

Trustee and Officer Information
The tables below provide certain information regarding the trustees and officers ofNatixis Funds Trust II (the “Trust”). Unless otherwise indicated, the address of allpersons below is 399 Boylston Street, Boston, MA 02116. The Funds’ Statements ofAdditional Information include additional information about the trustees of the Trustand are available by calling Natixis Funds at 800-225-5478.
Name and Year ofBirth
Position(s) Heldwith the Trust,Length of Time
Served and Termof Office1
PrincipalOccupation(s)
During Past5 Years
Number ofPortfolios in
Fund ComplexOverseen2
and OtherDirectorships Held
During Past5 Years
Experience,Qualifications,
Attributes, Skillsfor Board
Membership
INDEPENDENT TRUSTEES
Kenneth A. Drucker(1945)
Chairperson of theBoard of Trusteessince January 2017Trustee since 2008Ex Officio memberof the AuditCommittee, theContract ReviewCommittee and theGovernanceCommittee
Retired 42None
Significantexperience on theBoard and on theboards of otherbusinessorganizations(including atinvestmentcompanies);executiveexperience(including astreasurer of anaerospace,automotive, andmetalmanufacturingcorporation)
Edmond J. English(1953)
Trustee since 2013Audit CommitteeMember
Chief ExecutiveOfficer of Bob’sDiscount Furniture(retail)
42Director,Burlington Stores,Inc. (retail)
Experience on theBoard andsignificantexperience on theboards of otherbusinessorganizations(including retailcompanies and abank); executiveexperience(including at aretail company)
| 66

Trustee and Officer Information
Name and Year ofBirth
Position(s) Heldwith the Trust,Length of Time
Served and Termof Office1
PrincipalOccupation(s)
During Past5 Years
Number ofPortfolios in
Fund ComplexOverseen2
and OtherDirectorships Held
During Past5 Years
Experience,Qualifications,
Attributes, Skillsfor Board
Membership
INDEPENDENT TRUSTEEScontinued
Richard A. Goglia(1951)
Trustee since 2015Audit CommitteeMember
Retired; formerlyVice President andTreasurer ofRaytheonCompany (defense)
42None
Experience on theBoard andexecutiveexperience(including his roleas vice presidentand treasurer of adefense companyand experience at afinancial servicescompany)
Wendell J. Knox(1948)
Trustee since 2009Contract ReviewCommitteeMemberand GovernanceCommitteeMember
Director of AbtAssociates Inc.(research andconsulting)
42Director, EasternBank (bank);Director, TheHanover InsuranceGroup (propertyand casualtyinsurance)
Significantexperience on theBoard and on theboards of otherbusinessorganizations(including at abank and at aproperty andcasualty insurancefirm); executiveexperience(including roles aspresident and chiefexecutive officer ofa research andconsultingcompany)
67 |

Trustee and Officer Information
Name and Year ofBirth
Position(s) Heldwith the Trust,Length of Time
Served and Termof Office1
PrincipalOccupation(s)
During Past5 Years
Number ofPortfolios in
Fund ComplexOverseen2
and OtherDirectorships Held
During Past5 Years
Experience,Qualifications,
Attributes, Skillsfor Board
Membership
INDEPENDENT TRUSTEEScontinued
Martin T. Meehan(1956)
Trustee since 2012Contract ReviewCommitteeMember
President,University ofMassachusetts;formerly,Chancellor andfaculty member,University ofMassachusettsLowell
42None
Experience on theBoard and on theboards of otherbusinessorganizations;experience asPresident of theUniversity ofMassachusetts;governmentexperience(including as amember of the U.S.House ofRepresentatives);academicexperience
Sandra O. Moose(1942)
Trustee since 1993Audit CommitteeMember andGovernanceCommitteeMember
President, StrategicAdvisory Services(managementconsulting)
42Formerly, Director,AES Corporation(internationalpower company);formerly, Director,VerizonCommunications(telecommunicationscompany)
Significantexperience on theBoard and on theboards of otherbusinessorganizations(including at atelecommunicationscompany, aninternational powercompany and aspecialty chemicalscorporation);executiveexperience(including at amanagementconsultingcompany)
| 68

Trustee and Officer Information
Name and Year ofBirth
Position(s) Heldwith the Trust,Length of Time
Served and Termof Office1
PrincipalOccupation(s)
During Past5 Years
Number ofPortfolios in
Fund ComplexOverseen2
and OtherDirectorships Held
During Past5 Years
Experience,Qualifications,
Attributes, Skillsfor Board
Membership
INDEPENDENT TRUSTEEScontinued
James P. Palermo(1955)
Trustee since 2016Contract ReviewCommitteeMember
Founding Partner,Breton CapitalManagement, LLC(private equity);Partner, STEPPartners, LLC(private equity);formerly, ChiefExecutive Officerof Global ClientManagement ofThe Bank of NewYork MellonCorporation
42None
Experience on theBoard; financialservices industryand executiveexperience(including roles aschief executiveofficer of clientmanagement andasset servicing for abanking andfinancial servicescompany)
Erik R. Sirri(1958)
Trustee since 2009Chairperson of theAudit Committee
Professor ofFinance at BabsonCollege
42None
Significantexperience on theBoard; experienceas Director of theDivision ofTrading andMarkets at theSecurities andExchangeCommission;academicexperience; trainingas an economist
Peter J. Smail(1952)
Trustee since 2009Chairperson of theContract ReviewCommitteeand GovernanceCommitteeMember
Retired 42None
Significantexperience on theBoard; mutual fundindustry andexecutiveexperience(including roles aspresident and chiefexecutive officer foran investmentadviser)
69 |

Trustee and Officer Information
Name and Year ofBirth
Position(s) Heldwith the Trust,Length of Time
Served and Termof Office1
PrincipalOccupation(s)
During Past5 Years
Number ofPortfolios in
Fund ComplexOverseen2
and OtherDirectorships Held
During Past5 Years
Experience,Qualifications,
Attributes, Skillsfor Board
Membership
INDEPENDENT TRUSTEEScontinued
Cynthia L. Walker(1956)
Trustee since 2005Chairperson of theGovernanceCommittee andAudit CommitteeMember
Deputy Dean forFinance andAdministration,Yale UniversitySchool of Medicine
42None
Significantexperience on theBoard; executiveexperience in avariety of academicorganizations(including roles asdean for financeand administration)
INTERESTED TRUSTEES
Kevin P. Charleston3
(1965)One Financial CenterBoston, MA 02111
Trustee since 2015 President, ChiefExecutive Officerand Director;formerly, ChiefFinancial Officer,Loomis, Sayles &Company, L.P.
42None
Experience on theBoard; continuingservice asPresident, ChiefExecutive Officerand Director ofLoomis, Sayles &Company, L.P.
David L. Giunta4
(1965)Trustee since 2011President andChief ExecutiveOfficer since 2008
President andChief ExecutiveOfficer, NGAMDistributionCorporation,NGAM Advisors,L.P. and NGAMDistribution, L.P.
42None
Significantexperience on theBoard; continuingexperience asPresident andChief ExecutiveOfficer of NGAMAdvisors, L.P.
1 Each trustee serves until retirement, resignation or removal from the Board. The current retirement ageis 75. The position of Chairperson of the Board is appointed for a three-year term.
2 The trustees of the Trust serve as trustees of a fund complex that includes all series of the NatixisFunds Trust I, Natixis Funds Trust II, Natixis Funds Trust IV and Gateway Trust (collectively, the“Natixis Funds Trusts”), Loomis Sayles Funds I and Loomis Sayles Funds II (collectively, the “LoomisSayles Funds Trusts”) and Natixis ETF Trust (collectively, the “Fund Complex”).
3 Mr. Charleston is deemed an “interested person” of the Trust because he holds the following positionswith an affiliated person of the Trust: President and Chief Executive Officer of Loomis, Sayles &Company, L.P.
4 Mr. Giunta is deemed an “interested person” of the Trust because he holds the following positions withan affiliated person of the Trust: President and Chief Executive Officer of NGAM DistributionCorporation, NGAM Advisors, L.P. and NGAM Distribution, L.P.
| 70

Trustee and Officer Information
Name and Year of BirthPosition(s) Heldwith the Trust(s)
Term of Office1 andLength of Time Served
Principal Occupation(s)During Past 5 Years2
OFFICERS OF THE TRUST
Russell L. Kane(1969)
Secretary, Clerk and ChiefLegal Officer
Since July 2016 Executive VicePresident, GeneralCounsel, Secretary andClerk, NGAMDistributionCorporation, NGAMAdvisors, L.P. andNGAM Distribution,L.P.; formerly, ChiefCompliance Officer forMutual Funds, SeniorVice President, DeputyGeneral Counsel,Assistant Secretary andAssistant Clerk,NGAM DistributionCorporation, NGAMAdvisors, L.P. andNGAM Distribution,L.P.
Michael C. Kardok(1959)
Treasurer, PrincipalFinancial and AccountingOfficer
Since October 2004 Senior Vice President,NGAM Advisors, L.P.and NGAMDistribution, L.P.
Rosa Licea-Mailloux(1976)
Chief Compliance Officer,Assistant Secretary andAnti-Money LaunderingOfficer
Since July 2016 Senior Vice President,Deputy GeneralCounsel, AssistantSecretary and AssistantClerk, NGAMDistributionCorporation, NGAMAdvisors, L.P. andNGAM Distribution,L.P.; formerly,Associate GeneralCounsel, NGAMDistribution, L.P.
1 Each officer of the Trust serves for an indefinite term in accordance with the Trust’s current by-lawsuntil the date his or her successor is elected and qualified, or until he or she sooner dies, retires, isremoved or becomes disqualified.
2 Each person listed above, except as noted, holds the same position(s) with the Fund Complex. Previouspositions during the past five years with NGAM Distribution, L.P., NGAM Advisors, L.P. orLoomis, Sayles & Company, L.P. are omitted, if not materially different from a trustee’s or officer’scurrent position with such entity.
71 |

This Page Intentionally Left Blank
Contact us
To learn more about Natixis Funds products and services:
800-225-5478ngam.natixis.comBefore investing, consider the fund’s investment objectives, risks, charges, and expenses.
Visit ngam.natixis.com or call 800-225-5478 for a prospectus or summary prospectus
containing this and other information. Read it carefully.
�Contact us by mail:If you wish to communicate with thefunds’ Board of Trustees, you may do soby writing to:
Secretary of the FundsNGAM Advisors, L.P.399 Boylston Street Boston, MA 02116
The correspondence must (a) be signed by theshareholder; (b) include the shareholder’sname and address; and (c) identify the fund(s),account number, share class, and number ofshares held in that fund, as of a recent date.
�Or by e-mail:[email protected](Communications regarding recommen-dations for Trustee candidates may notbe submitted by e-mail.)
Please note: Unlike writtencorrespondence, e-mail is not secure.Please do NOT include your accountnumber, Social Security number, PIN, orany other non-public personal informationin an e-mail communication becausethis information may be viewed by others.
This page not part of shareholder report
Exp 11/30/20171654385.1.1
LSAR58A-1116
Related Documents